UNITED STATES
SECURITIES AND EXCHANGE COMMISSION
Washington, D.C. 20549
Form N-CSR
CERTIFIED SHAREHOLDER REPORT OF REGISTERED MANAGEMENT
INVESTMENT COMPANIES
Investment Company Act File Number 811-03833
MAINSTAY VP FUNDS TRUST
(Exact name of Registrant as specified in charter)
51 Madison Avenue, New York, NY 10010
(Address of principal executive offices) (Zip code)
J. Kevin Gao, Esq.
30 Hudson Street
Jersey City, New Jersey 07302
(Name and address of agent for service)
Registrant’s telephone number, including area code: (212) 576-7000
Date of fiscal year end: December 31
Date of reporting period: December 31, 2023
FORM N-CSR
Item 1. Reports to Stockholders.
MainStay VP Wellington U.S. Equity Portfolio
Message from the President and Annual Report
December 31, 2023
Special Notice:
Beginning in July 2024, new regulations issued by the Securities and Exchange Commission (SEC) will take effect requiring open-end mutual fund companies and ETFs to (1) overhaul the content of their shareholder reports and (2) mail paper copies of the new tailored shareholder reports to shareholders who have not opted to receive these documents electronically.
If you have not yet elected to receive your shareholder reports electronically, please contact your financial intermediary or visit our website.
| Not FDIC/NCUA Insured | Not a Deposit | May Lose Value | No Bank Guarantee | Not Insured by Any Government Agency |
This page intentionally left blank
Message from the President
Against a backdrop of easing inflationary pressures and continued economic growth, stocks and bonds generally gained ground during the 12-month period ended December 31, 2023, despite high levels of volatility and sharp disparities between the performance of the different market sectors.
Although the war in Ukraine, the outbreak of hostilities in the Middle East and several other notable events affected financial assets, inflation, interest rate, and economic growth trends stood at the forefront of market developments during most of the period. As the reporting period began, high levels of inflation already showed signs of easing in the face of aggressive rate hikes by U.S. Federal Reserve (the “Fed”). From a peak of 9.1% in June 2022, the annualized U.S. inflation rate dropped to 6.4% in January, and 3.4% in December 2023. At the same time, the Fed increased the benchmark federal funds rate from 4.25%–4.50% at the beginning of reporting period, to 5.25%–5.50% as of the end of 2023. Despite the increasing cost of capital and tighter lending environment that resulted from rising rates, economic growth remained surprisingly robust, bolstered by high levels of consumer spending, low levels of unemployment and better-than-expected corporate earnings. With the pace of rate increases slowing from the prior year, investors began hoping for an early shift to a looser monetary policy, with stock prices and bond yields reacting as economic data and statements from the Fed either reinforced or undercut those hopes. Following months of hawkish rhetoric, the Fed finally reversed its stance in December 2023, signaling a positive economic outlook with little chance of a recession and a likelihood of rate cuts in 2024.
The S&P 500® Index, a widely regarded benchmark of U.S. market performance, produced strong gains during the reporting period-– recovering all its losses from 2022 and approached new record territory. A preponderance of the Index’s gains were generated by a relatively small number of mega-cap stocks in the information technology, communication services and consumer discretionary sectors that stood to benefit from rapid developments in generative artificial intelligence (“AI”). Value-oriented, interest-rate sensitive and small-capitalization
shares lagged by significant margins, although market strength widened during the closing weeks of the reporting period. Most overseas equity markets trailed the U.S. market, as developed international economies experienced relatively low growth rates, and weak economic conditions in China undermined emerging markets.
Bonds produced generally positive returns, bolstered by attractive and relatively stable yields. The yield on the 10-year Treasury note hit a high of just under 5% in mid-October 2023, ranging between approximately 3.5% and 4.8% for most of the reporting period. The yield curve remained inverted throughout the year, with the 2-year Treasury yield modestly above the 10-year yield. Corporate bond prices trended moderately higher, generally outperforming government securities. After years of low yields and tight credit spreads, the corporate sector benefited from more attractive valuations and income opportunities. Among corporates, markets generally rewarded longer duration and lower credit quality, although an uptick in default rates posed added risks for high-yield corporate bonds. International bond markets produced mixed returns, with emerging-markets issues advancing over their developed-markets counterparts.
The market volatility of recent years reminds us of the constant need for experienced and steadfast portfolio management in the face of uncertainty. New York Life Investments remains dedicated to providing you, as a valued MainStay VP investor, with the guidance, resources and investment solutions you need to pursue your financial goals.
Thank you for trusting us to help meet your investment needs.
Sincerely,
Kirk C. Lehneis
President
The opinions expressed are as of the date of this report and are subject to change. There is no guarantee that any forecast made will come to pass. This material does not constitute investment advice and is not intended as an endorsement of any specific investment. Past performance is no guarantee of future results.
Not part of the Annual Report
Investors should refer to the Portfolio’s Summary Prospectus and/or Prospectus and consider the Portfolio’s investment objectives, strategies, risks, charges and expenses carefully before investing. The Summary Prospectus and/or Prospectus contain this and other information about the Portfolio. You may obtain copies of the Portfolio’s Summary Prospectus, Prospectus and Statement of Additional Information, which includes information about the MainStay VP Funds Trust's Trustees, free of charge, upon request, by calling toll-free 800-598-2019, by writing to New York Life Insurance and Annuity Corporation, 51 Madison Avenue, Room 251, New York, New York 10010 or by sending an email to MainStayShareholdersServices@nylim.com. These documents are also available at newyorklifeinvestments.com/investment-products/vp. Please read the Portfolio's Summary Prospectus and/or Prospectus carefully before investing. MainStay VP Funds Trust portfolios are separate account options which are purchased through a variable insurance or variable annuity contract.
Investment and Performance Comparison (Unaudited)
Performance data quoted represents past performance. Past performance is no guarantee of future results. Because of market volatility and other factors, current performance may be lower or higher than the figures shown. Investment return and principal value will fluctuate, and as a result, when shares are redeemed, they may be worth more or less than their original cost. The performance table and graph do not reflect any deduction of sales charges, mortality and expense charges, contract charges or administrative charges. Please refer to the Performance Summary appropriate for your policy. For performance information current to the most recent month-end, please call 800-598-2019 or visit www.newyorklife.com.
Performance figures may reflect certain fee waivers and/or expense limitations, without which total returns may have been different. For information on current fee waivers and/or expense limitations (if any), please refer to the Notes to Financial Statements.
| Average Annual Total Returns for the Year-Ended December 31, 2023 |
| Class | Inception
Date1, 2 | One
Year | Five
Years | Ten
Years | Gross
Expense
Ratio3 |
| Initial Class Shares | 1/23/1984 | 24.58% | 13.16% | 10.46% | 0.57% |
| Service Class Shares | 6/5/2003 | 24.27 | 12.88 | 10.19 | 0.82 |
| 1. | Effective January 1, 2018, due to an organizational restructuring, all investment personnel of Cornerstone Capital Management Holdings LLC, the former subadvisor, transitioned to MacKay Shields LLC. |
| 2. | Effective May 1, 2021, the Portfolio replaced its subadvisor, MacKay Shields LLC, and modified its principal investment strategies. The past performance in the graph and table prior to that date reflects the Portfolio's prior subadvisors and principal investment strategies. |
| 3. | The gross expense ratios presented reflect the Portfolio’s “Total Annual Portfolio Operating Expenses” from the most recent Prospectus, as supplemented, and may differ from other expense ratios disclosed in this report. |
| Benchmark Performance* | One
Year | Five
Years | Ten
Years |
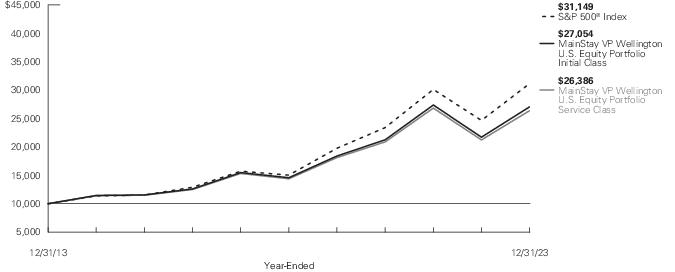
| S&P 500® Index1 | 26.29% | 15.69% | 12.03% |
| Morningstar Large Blend Category Average2 | 22.32 | 14.26 | 10.55 |
| * | Returns for indices reflect no deductions for fees, expenses or taxes, except for foreign withholding taxes where applicable. Results assume reinvestment of all dividends and capital gains. An investment cannot be made directly in an index. |
| 1. | The S&P 500® Index is the Portfolio's primary benchmark. S&P 500® is a trademark of The McGraw-Hill Companies, Inc. The S&P 500® Index is widely regarded as the standard index for measuring large-cap U.S. stock market performance. |
| 2. | The Morningstar Large Blend Category Average is representative of funds that represent the overall U.S. stock market in size, growth rates and price. Stocks in the top 70% of the capitalization of the U.S. equity market are defined as large cap. The blend style is assigned to funds where neither growth nor value characteristics predominate. These funds tend to invest across the spectrum of U.S. industries, and owing to their broad exposure, the funds' returns are often similar to those of the S&P 500® Index. Results are based on average total returns of similar funds with all dividends and capital gain distributions reinvested. |
Cost in Dollars of a $1,000 Investment in MainStay VP Wellington U.S. Equity Portfolio (Unaudited)
The example below is intended to describe the fees and expenses borne by shareholders during the six-month period from July 1, 2023 to December 31, 2023, and the impact of those costs on your investment.
Example
As a shareholder of the Portfolio you incur two types of costs: (1) transaction costs, including exchange fees and sales charges (loads) on purchases (as applicable), and (2) ongoing costs, including management fees, distribution and/or service (12b-1) fees and other Portfolio expenses (as applicable). This example is intended to help you understand your ongoing costs (in dollars) of investing in the Portfolio and to compare these costs with the ongoing costs of investing in other mutual funds. The example is based on an investment of $1,000 made at the beginning of the six-month period and held for the entire period from July 1, 2023 to December 31, 2023. Shares are only sold in connection with variable life and annuity contracts and the example does not reflect any contract level or transactional fees or expenses. If these costs had been included, your costs would have been higher.
This example illustrates your Portfolio’s ongoing costs in two ways:
Actual Expenses
The second and third data columns in the table below provide information about actual account values and actual expenses. You may use the information in these columns, together with the amount you invested, to estimate the expenses that you paid during the six months ended
December 31, 2023. Simply divide your account value by $1,000 (for example, an $8,600 account value divided by $1,000 = 8.6), then multiply the result by the number under the heading entitled “Expenses Paid During Period” to estimate the expenses you paid on your account during this period.
Hypothetical Example for Comparison Purposes
The fourth and fifth data columns in the table below provide information about hypothetical account values and hypothetical expenses based on the Portfolio’s actual expense ratio and an assumed rate of return of 5% per year before expenses, which is not the Portfolio’s actual return. The hypothetical account values and expenses may not be used to estimate the actual ending account balances or expenses you paid for the six-month period shown. You may use this information to compare the ongoing costs of investing in the Portfolio with the ongoing costs of investing in other mutual funds. To do so, compare this 5% hypothetical example with the 5% hypothetical examples that appear in the shareholder reports of the other mutual funds.
Please note that the expenses shown in the table are meant to highlight your ongoing costs only and do not reflect any transactional costs, such as exchange fees or sales charges (loads). Therefore, the fourth and fifth data columns of the table are useful in comparing ongoing costs only and will not help you determine the relative total costs of owning different funds. In addition, if these transactional costs were included, your costs would have been higher.
| Share Class | Beginning
Account
Value
7/1/23 | Ending Account
Value (Based
on Actual
Returns and
Expenses)
12/31/23 | Expenses
Paid
During
Period1 | Ending Account
Value (Based
on Hypothetical
5% Annualized
Return and
Actual Expenses)
12/31/23 | Expenses
Paid
During
Period1 | Net Expense
Ratio
During
Period2 |
| Initial Class Shares | $1,000.00 | $1,083.70 | $2.94 | $1,022.38 | $2.85 | 0.56% |
| Service Class Shares | $1,000.00 | $1,082.30 | $4.25 | $1,021.12 | $4.13 | 0.81% |
| 1. | Expenses are equal to the Portfolio’s annualized expense ratio of each class multiplied by the average account value over the period, divided by 365 and multiplied by 184 (to reflect the six-month period). The table above represents the actual expenses incurred during the six-month period. In addition to the fees and expenses which the Portfolio bears directly, it also indirectly bears a pro rata share of the fees and expenses of the underlying funds in which it invests. Such indirect expenses are not included in the above-reported expense figures. |
| 2. | Expenses are equal to the Portfolio's annualized expense ratio to reflect the six-month period. |
| 6 | MainStay VP Wellington U.S. Equity Portfolio |
Industry Composition as of December 31, 2023 (Unaudited)
| Software | 11.8% |
| Semiconductors & Semiconductor Equipment | 9.2 |
| Interactive Media & Services | 8.6 |
| Technology Hardware, Storage & Peripherals | 5.9 |
| Broadline Retail | 4.8 |
| Banks | 3.9 |
| Machinery | 3.7 |
| Pharmaceuticals | 3.5 |
| Insurance | 3.2 |
| Health Care Equipment & Supplies | 3.1 |
| Oil, Gas & Consumable Fuels | 3.1 |
| Electric Utilities | 2.6 |
| Health Care Providers & Services | 2.5 |
| Capital Markets | 2.5 |
| Hotels, Restaurants & Leisure | 2.4 |
| Beverages | 2.3 |
| Life Sciences Tools & Services | 2.2 |
| Chemicals | 2.0 |
| Financial Services | 2.0 |
| Specialty Retail | 2.0 |
| Household Products | 1.9% |
| Biotechnology | 1.9 |
| Building Products | 1.8 |
| Entertainment | 1.4 |
| Electrical Equipment | 1.3 |
| Textiles, Apparel & Luxury Goods | 1.3 |
| Industrial REITs | 1.2 |
| IT Services | 1.2 |
| Consumer Finance | 1.1 |
| Personal Care Products | 1.1 |
| Aerospace & Defense | 1.1 |
| Electronic Equipment, Instruments & Components | 1.0 |
| Residential REITs | 0.7 |
| Energy Equipment & Services | 0.7 |
| Automobiles | 0.7 |
| Short–Term Investment | 0.3 |
| Other Assets, Less Liabilities | –0.0‡ |
| | 100.0% |
| ‡ | Less than one–tenth of a percent. |
See Portfolio of Investments beginning on page 10 for specific holdings within these categories. The Portfolio's holdings are subject to change.
Top Ten Holdings and/or Issuers Held as of December 31, 2023 (excluding short-term investments) (Unaudited)
| 1. | Microsoft Corp. |
| 2. | Apple, Inc. |
| 3. | Alphabet, Inc. |
| 4. | Amazon.com, Inc. |
| 5. | NVIDIA Corp. |
| 6. | Meta Platforms, Inc., Class A |
| 7. | UnitedHealth Group, Inc. |
| 8. | JPMorgan Chase & Co. |
| 9. | Broadcom, Inc. |
| 10. | Eli Lilly & Co. |
Portfolio Management Discussion and Analysis (Unaudited)
Answers to the questions reflect the views of portfolio managers Mammen Chally, Douglas W. McLane and David A. Siegle, of Wellington Management Company LLP (“Wellington”), the Portfolio’s Subadvisor.
How did MainStay VP Wellington U.S. Equity Portfolio perform relative to its benchmark and peers during the 12 months ended June 30, 2023?
For the 12 months ended December 31, 2023, MainStay VP Wellington U.S. Equity Portfolio returned 24.58% for Initial Class shares and 24.27% for Service Class shares. Over the same period, both share classes underperformed the 26.29% return of the S&P 500® Index (the “Index”), which is the Portfolio’s benchmark, and outperformed the 22.32% return of the Morningstar Large Blend Category Average.1
What factors affected the Portfolio’s relative performance during the reporting period?
The Portfolio underperformed the Index primarily due to sector attribution, a result of Wellington's bottom-up stock selection process. Security selection also weighed on relative results.
Which sectors were the strongest positive contributors to the Portfolio’s relative performance, and which sectors were particularly weak?
From a sector allocation perspective, overweight exposure to health care weighed on relative returns, with the negative impact partialy offset by the positive effect of an underweight allocation to the lagging energy sector. Security selection in industrials, information technology and consumer discretionary detracted from relative results, while selection in health care, materials and financials made positive contributions. (Contributions take weightings and total returns into account.)
During the reporting period, which individual stocks made the strongest positive contributions to the Portfolio’s absolute performance and which stocks detracted the most?
The strongest contributors to absolute performance included holdings in enterprise software company Microsoft, online retailer Amazon.com and consumer electronics maker Apple. Microsoft shares rose on better-than-expected earnings and revenue results driven by the performance of the company’s cloud unit, Azure. Shares also benefited from the anticipated rollout of Microsoft’s artificial intelligence (“AI”) product, Copilot. In addition, the company finalized its $69 billion purchase of video game maker Activision Blizzard. Amazon.com shares gained ground after semiconductor maker NVIDIA reported strong results, driven by rapidly increasing demand for AI, sparking a market rally. We believe that developments in AI should benefit Amazon Web Services and increase demand for its cloud computing platforms. Amazon also reported first-quarter earnings that beat consensus estimates earlier in the reporting period. Apple shares climbed after the company made several AI announcements at its I/O developer conference, including "AI Snapshot,” which integrates
generative AI results directly on top of Google's search results, and the incorporation of generative AI capabilities across its product suite. The stock benefited further from news that Samsung would not replace Google with Bing as the default search engine on its smartphones.
The most significant detractors from the Portfolio’s absolute performance included holdings in pharmaceutical company Pfizer, financial management firm The Charles Schwab Corporation and prestige beauty products maker The Estée Lauder Companies. Pfizer shares fell when the company reported mixed results in a Phase 2b study of danuglipron for obesity. Danuglipron was effective in weight reduction, but tolerability was poor with a high rate of gastrointestinal side effects and discontinuation rates. Management also issued muted 2024 guidance that was below expectations, and announced a multi-year cost-cutting effort that will include layoffs. Charles Schwab shares fell after the collapse of Silicon Valley Bank sparked a massive selloff of financial sector stocks, and investors feared that firms like Schwab, which have large bond holdings with long maturities, might be forced to sell such assets at a loss to cover a rush of deposit withdrawals. Earlier in the reporting period, Schwab reported fourth quarter 2022 results that missed estimates on lower deposit account fees. Estée Lauder shares fell as weak sales in China weighed on investor sentiment. In addition, in delivering fourth quarter 2023 financial results, the company lowered guidance below consensus estimates.
Did the Portfolio make any significant purchases or sales during the reporting period?
The Portfolio’s largest purchases included an increased position in semiconductor maker NVIDIA and a reinstated position in social media company Meta Platforms. We became more positive on NVIDIA given the company’s near monopoly in AI datacenter graphics processing units and the rapid growth of NVIDIA’s CUDA software business segment. We believe this segment will continue to benefit from the AI-related market momentum. We reinstated a position in Meta after engaging with the company. We saw signs that the company’s fundamentals were playing out positively, as prior headwinds (including Apple’s changes to its privacy management policies and TikTok’s incremental competition) became more benign. Meta’s ramp-up of its Reels product progressed (offering a more direct answer to TikTok), with the monetization of Reels providing better visibility into the stability of Meta’s overall advertising business. Given these trends and our outlook, we believed the stock’s valuation was attractive.
The Portfolio’s largest full sale was of shares in Pioneer Natural Resources following the announcement that Exxon Mobil would acquire the company. We trimmed the Portfolio’s position in Alphabet on strength.
| 1. | See "Investment and Performance Comparison" for more information on benchmark and peer group returns. |
| 8 | MainStay VP Wellington U.S. Equity Portfolio |
How did the Portfolio’s sector weightings change during the reporting period?
During the reporting period, we increased the Portfolio’s exposure to communication services and decreased its exposure to health care.
How was the Portfolio positioned at the end of the reporting period?
As of December 31, 2023, the Portfolio’s largest overweight positions relative to the Index were in the communication services and health care sectors. As of the same date, the Portfolio held its most significantly underweight positions in industrials and consumer staples.
The opinions expressed are those of the portfolio managers as of the date of this report and are subject to change. There is no guarantee that any forecasts will come to pass. This material does not constitute investment advice and is not intended as an endorsement of any specific investment.
Not all MainStay VP Portfolios and/or share classes are available under all policies.
Portfolio of Investments December 31, 2023†^
| | Shares | Value |
| Common Stocks 99.7% |
| Aerospace & Defense 1.1% |
| RTX Corp. | 119,334 | $ 10,040,763 |
| Automobiles 0.7% |
| Tesla, Inc. (a) | 24,637 | 6,121,802 |
| Banks 3.9% |
| Bank of America Corp. | 390,808 | 13,158,505 |
| JPMorgan Chase & Co. | 132,710 | 22,573,971 |
| | | 35,732,476 |
| Beverages 2.3% |
| Constellation Brands, Inc., Class A | 43,433 | 10,499,928 |
| Monster Beverage Corp. (a) | 184,189 | 10,611,128 |
| | | 21,111,056 |
| Biotechnology 1.9% |
| Regeneron Pharmaceuticals, Inc. (a) | 8,335 | 7,320,547 |
| Vertex Pharmaceuticals, Inc. (a) | 24,876 | 10,121,796 |
| | | 17,442,343 |
| Broadline Retail 4.8% |
| Amazon.com, Inc. (a) | 290,659 | 44,162,728 |
| Building Products 1.8% |
| Builders FirstSource, Inc. (a) | 44,171 | 7,373,907 |
| Johnson Controls International plc | 161,967 | 9,335,778 |
| | | 16,709,685 |
| Capital Markets 2.5% |
| Charles Schwab Corp. (The) | 128,964 | 8,872,723 |
| Morgan Stanley | 146,683 | 13,678,190 |
| | | 22,550,913 |
| Chemicals 2.0% |
| PPG Industries, Inc. | 63,704 | 9,526,933 |
| Sherwin-Williams Co. (The) | 29,695 | 9,261,871 |
| | | 18,788,804 |
| Consumer Finance 1.1% |
| American Express Co. | 55,775 | 10,448,889 |
| Electric Utilities 2.6% |
| American Electric Power Co., Inc. | 78,760 | 6,396,887 |
| Duke Energy Corp. | 100,708 | 9,772,704 |
| Eversource Energy | 82,551 | 5,095,048 |
| PG&E Corp. | 157,232 | 2,834,893 |
| | | 24,099,532 |
| | Shares | Value |
| |
| Electrical Equipment 1.3% |
| AMETEK, Inc. | 70,392 | $ 11,606,937 |
| Electronic Equipment, Instruments & Components 1.0% |
| CDW Corp. | 38,846 | 8,830,473 |
| Energy Equipment & Services 0.7% |
| Schlumberger NV | 118,359 | 6,159,402 |
| Entertainment 1.4% |
| Netflix, Inc. (a) | 25,737 | 12,530,831 |
| Financial Services 2.0% |
| Mastercard, Inc., Class A | 43,489 | 18,548,493 |
| Health Care Equipment & Supplies 3.1% |
| Abbott Laboratories | 109,379 | 12,039,347 |
| Boston Scientific Corp. (a) | 221,013 | 12,776,761 |
| Hologic, Inc. (a) | 56,451 | 4,033,424 |
| | | 28,849,532 |
| Health Care Providers & Services 2.5% |
| UnitedHealth Group, Inc. | 44,166 | 23,252,074 |
| Hotels, Restaurants & Leisure 2.4% |
| Marriott International, Inc., Class A | 47,696 | 10,755,925 |
| McDonald's Corp. | 38,728 | 11,483,239 |
| | | 22,239,164 |
| Household Products 1.9% |
| Procter & Gamble Co. (The) | 121,045 | 17,737,934 |
| Industrial REITs 1.2% |
| Prologis, Inc. | 83,816 | 11,172,673 |
| Insurance 3.2% |
| Arch Capital Group Ltd. (a) | 85,606 | 6,357,957 |
| Chubb Ltd. | 49,816 | 11,258,416 |
| Progressive Corp. (The) | 72,249 | 11,507,821 |
| | | 29,124,194 |
| Interactive Media & Services 8.6% |
| Alphabet, Inc. (a) | | |
| Class A | 271,102 | 37,870,238 |
| Class C | 61,919 | 8,726,245 |
| |
| Meta Platforms, Inc., Class A (a) | 81,672 | 28,908,621 |
The notes to the financial statements are an integral part of, and should be read in conjunction with, the financial statements.
| 10 | MainStay VP Wellington U.S. Equity Portfolio |
| | Shares | Value |
| Common Stocks (continued) |
| Interactive Media & Services (continued) |
| |
| ZoomInfo Technologies, Inc. (a) | 175,178 | $ 3,239,041 |
| | | 78,744,145 |
| IT Services 1.2% |
| Accenture plc, Class A | 30,249 | 10,614,677 |
| Life Sciences Tools & Services 2.2% |
| Danaher Corp. | 42,526 | 9,837,965 |
| Thermo Fisher Scientific, Inc. | 19,867 | 10,545,205 |
| | | 20,383,170 |
| Machinery 3.7% |
| Deere & Co. | 32,568 | 13,022,966 |
| Illinois Tool Works, Inc. | 40,438 | 10,592,330 |
| Nordson Corp. | 39,961 | 10,556,098 |
| | | 34,171,394 |
| Oil, Gas & Consumable Fuels 3.1% |
| ConocoPhillips | 65,072 | 7,552,907 |
| Diamondback Energy, Inc. | 34,944 | 5,419,115 |
| EOG Resources, Inc. | 79,919 | 9,666,203 |
| Phillips 66 | 41,042 | 5,464,332 |
| | | 28,102,557 |
| Personal Care Products 1.1% |
| Estee Lauder Cos., Inc. (The), Class A | 70,817 | 10,356,986 |
| Pharmaceuticals 3.5% |
| Eli Lilly & Co. | 32,223 | 18,783,431 |
| Merck & Co., Inc. | 120,692 | 13,157,842 |
| | | 31,941,273 |
| Residential REITs 0.7% |
| AvalonBay Communities, Inc. | 36,313 | 6,798,520 |
| Semiconductors & Semiconductor Equipment 9.2% |
| Advanced Micro Devices, Inc. (a) | 63,596 | 9,374,686 |
| Broadcom, Inc. | 17,188 | 19,186,105 |
| KLA Corp. | 19,397 | 11,275,476 |
| NVIDIA Corp. | 69,293 | 34,315,280 |
| Texas Instruments, Inc. | 58,102 | 9,904,067 |
| | | 84,055,614 |
| | Shares | | Value |
| |
| Software 11.8% |
| Intuit, Inc. | 14,957 | | $ 9,348,574 |
| Microsoft Corp. | 184,511 | | 69,383,516 |
| Palo Alto Networks, Inc. (a) | 25,078 | | 7,395,001 |
| Salesforce, Inc. (a) | 46,257 | | 12,172,067 |
| Workday, Inc., Class A (a) | 34,132 | | 9,422,480 |
| | | | 107,721,638 |
| Specialty Retail 2.0% |
| AutoZone, Inc. (a) | 3,060 | | 7,911,966 |
| TJX Cos., Inc. (The) | 110,638 | | 10,378,951 |
| | | | 18,290,917 |
| Technology Hardware, Storage & Peripherals 5.9% |
| Apple, Inc. | 278,749 | | 53,667,545 |
| Textiles, Apparel & Luxury Goods 1.3% |
| NIKE, Inc., Class B | 106,120 | | 11,521,448 |
Total Common Stocks
(Cost $720,899,629) | | | 913,630,582 |
| Short-Term Investment 0.3% |
| Affiliated Investment Company 0.3% |
| MainStay U.S. Government Liquidity Fund, 5.235% (b) | 2,752,478 | | 2,752,478 |
Total Short-Term Investment
(Cost $2,752,478) | | | 2,752,478 |
Total Investments
(Cost $723,652,107) | 100.0% | | 916,383,060 |
| Other Assets, Less Liabilities | (0.0)‡ | | (435,738) |
| Net Assets | 100.0% | | $ 915,947,322 |
| † | Percentages indicated are based on Portfolio net assets. |
| ^ | Industry classifications may be different than those used for compliance monitoring purposes. |
| ‡ | Less than one-tenth of a percent. |
| (a) | Non-income producing security. |
| (b) | Current yield as of December 31, 2023. |
The notes to the financial statements are an integral part of, and should be read in conjunction with, the financial statements.
11
Portfolio of Investments December 31, 2023†^ (continued)
Investments in Affiliates (in 000's)
Investments in issuers considered to be affiliate(s) of the Portfolio during the year ended December 31, 2023 for purposes of Section 2(a)(3) of the Investment Company Act of 1940, as amended, were as follows:
| Affiliated Investment Companies | Value,
Beginning
of Year | Purchases
at Cost | Proceeds
from
Sales | Net
Realized
Gain/(Loss)
on Sales | Change in
Unrealized
Appreciation/
(Depreciation) | Value,
End of
Year | Dividend
Income | Other
Distributions | Shares
End of
Year |
| MainStay U.S. Government Liquidity Fund | $ 21,509 | $ 142,187 | $ (160,944) | $ — | $ — | $ 2,752 | $ 547 | $ — | 2,752 |
| Abbreviation(s): |
| REIT—Real Estate Investment Trust |
The following is a summary of the fair valuations according to the inputs used as of December 31, 2023, for valuing the Portfolio’s assets:
| Description | Quoted
Prices in
Active
Markets for
Identical
Assets
(Level 1) | | Significant
Other
Observable
Inputs
(Level 2) | | Significant
Unobservable
Inputs
(Level 3) | | Total |
| Asset Valuation Inputs | | | | | | | |
| Investments in Securities (a) | | | | | | | |
| Common Stocks | $ 913,630,582 | | $ — | | $ — | | $ 913,630,582 |
| Short-Term Investment | | | | | | | |
| Affiliated Investment Company | 2,752,478 | | — | | — | | 2,752,478 |
| Total Investments in Securities | $ 916,383,060 | | $ — | | $ — | | $ 916,383,060 |
| (a) | For a complete listing of investments and their industries, see the Portfolio of Investments. |
The notes to the financial statements are an integral part of, and should be read in conjunction with, the financial statements.
| 12 | MainStay VP Wellington U.S. Equity Portfolio |
Statement of Assets and Liabilities as of December 31, 2023
| Assets |
Investment in unaffiliated securities, at value
(identified cost $720,899,629) | $913,630,582 |
Investment in affiliated investment companies, at value
(identified cost $2,752,478) | 2,752,478 |
| Receivables: | |
| Investment securities sold | 2,565,988 |
| Dividends | 495,896 |
| Portfolio shares sold | 27,375 |
| Securities lending | 939 |
| Other assets | 4,356 |
| Total assets | 919,477,614 |
| Liabilities |
| Payables: | |
| Investment securities purchased | 2,662,663 |
| Manager (See Note 3) | 413,720 |
| Portfolio shares redeemed | 334,645 |
| NYLIFE Distributors (See Note 3) | 51,426 |
| Professional fees | 29,865 |
| Shareholder communication | 26,975 |
| Custodian | 10,169 |
| Accrued expenses | 829 |
| Total liabilities | 3,530,292 |
| Net assets | $915,947,322 |
| Composition of Net Assets |
| Shares of beneficial interest outstanding (par value of $.001 per share) unlimited number of shares authorized | $ 35,007 |
| Additional paid-in-capital | 727,977,810 |
| | 728,012,817 |
| Total distributable earnings (loss) | 187,934,505 |
| Net assets | $915,947,322 |
| Initial Class | |
| Net assets applicable to outstanding shares | $670,328,474 |
| Shares of beneficial interest outstanding | 25,485,811 |
| Net asset value per share outstanding | $ 26.30 |
| Service Class | |
| Net assets applicable to outstanding shares | $245,618,848 |
| Shares of beneficial interest outstanding | 9,520,899 |
| Net asset value per share outstanding | $ 25.80 |
The notes to the financial statements are an integral part of, and should be read in conjunction with, the financial statements.
13
Statement of Operations for the year ended December 31, 2023
| Investment Income (Loss) |
| Income | |
| Dividends-unaffiliated | $ 12,274,395 |
| Dividends-affiliated | 547,361 |
| Securities lending, net | 1,095 |
| Total income | 12,822,851 |
| Expenses | |
| Manager (See Note 3) | 4,719,504 |
| Distribution/Service—Service Class (See Note 3) | 590,777 |
| Professional fees | 105,819 |
| Custodian | 23,772 |
| Trustees | 22,304 |
| Miscellaneous | 30,897 |
| Total expenses | 5,493,073 |
| Net investment income (loss) | 7,329,778 |
| Realized and Unrealized Gain (Loss) |
| Net realized gain (loss) on unaffiliated investments | 12,794,409 |
| Net change in unrealized appreciation (depreciation) on unaffiliated investments | 172,050,018 |
| Net realized and unrealized gain (loss) | 184,844,427 |
| Net increase (decrease) in net assets resulting from operations | $192,174,205 |
The notes to the financial statements are an integral part of, and should be read in conjunction with, the financial statements.
| 14 | MainStay VP Wellington U.S. Equity Portfolio |
Statements of Changes in Net Assets
for the years ended December 31, 2023 and December 31, 2022
| | 2023 | 2022 |
| Increase (Decrease) in Net Assets |
| Operations: | | |
| Net investment income (loss) | $ 7,329,778 | $ 7,480,194 |
| Net realized gain (loss) | 12,794,409 | (24,077,250) |
| Net change in unrealized appreciation (depreciation) | 172,050,018 | (202,149,971) |
| Net increase (decrease) in net assets resulting from operations | 192,174,205 | (218,747,027) |
| Distributions to shareholders: | | |
| Initial Class | (6,075,145) | (127,232,665) |
| Service Class | (1,664,828) | (48,423,993) |
| Total distributions to shareholders | (7,739,973) | (175,656,658) |
| Capital share transactions: | | |
| Net proceeds from sales of shares | 42,700,997 | 139,698,289 |
| Net asset value of shares issued to shareholders in reinvestment of distributions | 7,739,973 | 175,656,658 |
| Cost of shares redeemed | (152,655,655) | (125,658,917) |
| Increase (decrease) in net assets derived from capital share transactions | (102,214,685) | 189,696,030 |
| Net increase (decrease) in net assets | 82,219,547 | (204,707,655) |
| Net Assets |
| Beginning of year | 833,727,775 | 1,038,435,430 |
| End of year | $ 915,947,322 | $ 833,727,775 |
The notes to the financial statements are an integral part of, and should be read in conjunction with, the financial statements.
15
Financial Highlights selected per share data and ratios
| | Year Ended December 31, |
| Initial Class | 2023 | | 2022 | | 2021 | | 2020 | | 2019 |
| Net asset value at beginning of year | $ 21.32 | | $ 34.39 | | $ 28.28 | | $ 26.83 | | $ 25.23 |
| Net investment income (loss) (a) | 0.21 | | 0.25 | | 0.21 | | 0.28 | | 0.38 |
| Net realized and unrealized gain (loss) | 5.00 | | (7.58) | | 7.77 | | 3.68 | | 5.74 |
| Total from investment operations | 5.21 | | (7.33) | | 7.98 | | 3.96 | | 6.12 |
| Less distributions: | | | | | | | | | |
| From net investment income | (0.23) | | (0.19) | | (0.29) | | (0.43) | | (0.43) |
| From net realized gain on investments | — | | (5.55) | | (1.58) | | (2.08) | | (4.09) |
| Total distributions | (0.23) | | (5.74) | | (1.87) | | (2.51) | | (4.52) |
| Net asset value at end of year | $ 26.30 | | $ 21.32 | | $ 34.39 | | $ 28.28 | | $ 26.83 |
| Total investment return (b) | 24.58% | | (20.68)% | | 28.78% | | 15.55% | | 26.21% |
| Ratios (to average net assets)/Supplemental Data: | | | | | | | | | |
| Net investment income (loss) | 0.90% | | 0.90% | | 0.65% | | 1.09% | | 1.37% |
| Net expenses (c) | 0.56% | | 0.57% | | 0.58% | | 0.58% | | 0.58% |
| Portfolio turnover rate | 28% | | 21% | | 26% | | 143% | | 119% |
| Net assets at end of year (in 000's) | $ 670,328 | | $ 607,323 | | $ 732,245 | | $ 497,644 | | $ 543,355 |
| (a) | Per share data based on average shares outstanding during the year. |
| (b) | Total return does not reflect any deduction of sales charges, mortality and expense charges, contract charges or administrative charges. For periods of less than one year, total return is not annualized. |
| (c) | In addition to the fees and expenses which the Portfolio bears directly, it also indirectly bears a pro-rata share of the fees and expenses of the underlying funds in which it invests. Such indirect expenses are not included in the above expense ratios. |
| | Year Ended December 31, |
| Service Class | 2023 | | 2022 | | 2021 | | 2020 | | 2019 |
| Net asset value at beginning of year | $ 20.91 | | $ 33.85 | | $ 27.87 | | $ 26.47 | | $ 24.94 |
| Net investment income (loss) (a) | 0.15 | | 0.18 | | 0.13 | | 0.21 | | 0.31 |
| Net realized and unrealized gain (loss) | 4.91 | | (7.46) | | 7.65 | | 3.62 | | 5.67 |
| Total from investment operations | 5.06 | | (7.28) | | 7.78 | | 3.83 | | 5.98 |
| Less distributions: | | | | | | | | | |
| From net investment income | (0.17) | | (0.11) | | (0.22) | | (0.35) | | (0.36) |
| From net realized gain on investments | — | | (5.55) | | (1.58) | | (2.08) | | (4.09) |
| Total distributions | (0.17) | | (5.66) | | (1.80) | | (2.43) | | (4.45) |
| Net asset value at end of year | $ 25.80 | | $ 20.91 | | $ 33.85 | | $ 27.87 | | $ 26.47 |
| Total investment return (b) | 24.27% | | (20.87)% | | 28.46% | | 15.26% | | 25.89% |
| Ratios (to average net assets)/Supplemental Data: | | | | | | | | | |
| Net investment income (loss) | 0.66% | | 0.65% | | 0.40% | | 0.83% | | 1.12% |
| Net expenses (c) | 0.81% | | 0.82% | | 0.83% | | 0.83% | | 0.83% |
| Portfolio turnover rate | 28% | | 21% | | 26% | | 143% | | 119% |
| Net assets at end of year (in 000's) | $ 245,619 | | $ 226,405 | | $ 306,191 | | $ 270,170 | | $ 268,992 |
| (a) | Per share data based on average shares outstanding during the year. |
| (b) | Total return does not reflect any deduction of sales charges, mortality and expense charges, contract charges or administrative charges. For periods of less than one year, total return is not annualized. |
| (c) | In addition to the fees and expenses which the Portfolio bears directly, it also indirectly bears a pro-rata share of the fees and expenses of the underlying funds in which it invests. Such indirect expenses are not included in the above expense ratios. |
The notes to the financial statements are an integral part of, and should be read in conjunction with, the financial statements.
| 16 | MainStay VP Wellington U.S. Equity Portfolio |
Notes to Financial Statements
Note 1–Organization and Business
MainStay VP Funds Trust (the “Fund”) was organized as a Delaware statutory trust on February 1, 2011. The Fund is registered under the Investment Company Act of 1940, as amended (the “1940 Act”), as an open-end management investment company. The Fund is comprised of thirty-one separate series (collectively referred to as the “Portfolios”). These financial statements and notes relate to the MainStay VP Wellington U.S. Equity Portfolio (the "Portfolio"), a "diversified” portfolio, as that term is defined in the 1940 Act, as interpreted or modified by regulatory authorities having jurisdiction, from time to time.
Shares of the Portfolio are currently offered to certain separate accounts to fund variable annuity policies and variable universal life insurance policies issued by New York Life Insurance and Annuity Corporation (“NYLIAC”), a wholly-owned subsidiary of New York Life Insurance Company (“New York Life”) and may also be offered to fund variable annuity policies and variable universal life insurance policies issued by other insurance companies. NYLIAC allocates shares of the Portfolio to, among others, certain NYLIAC separate accounts. Shares of the Portfolio are also offered to the MainStay VP Conservative Allocation Portfolio, MainStay VP Moderate Allocation Portfolio, MainStay VP Growth Allocation Portfolio and MainStay VP Equity Allocation Portfolio, which operate as “funds-of-funds," and other variable insurance funds.
The following table lists the Portfolio's share classes that have been registered and commenced operations:
| Class | Commenced Operations |
| Initial Class | January 23, 1984 |
| Service Class | June 5, 2003 |
Shares of the Portfolio are offered and are redeemed at a price equal to their respective net asset value (“NAV”) per share. No sales or redemption charge is applicable to the purchase or redemption of the Portfolio's shares. Under the terms of the Fund’s multiple class plan, adopted pursuant to Rule 18f-3 under the 1940 Act, the classes differ in that, among other things, Service Class shares of the Portfolio pay a combined distribution and service fee of 0.25% of average daily net assets attributable to Service Class shares of the Portfolio to the Distributor (as defined in Note 3(B)) pursuant to a plan adopted in accordance with Rule 12b-1 under the 1940 Act. Contract owners of variable annuity contracts purchased after June 2, 2003, are permitted to invest only in the Service Class shares.
The Portfolio's investment objective is to seek long-term growth of capital.
Note 2–Significant Accounting Policies
The Portfolio is an investment company and accordingly follows the investment company accounting and reporting guidance of the Financial Accounting Standards Board (“FASB”) Accounting Standards Codification Topic 946 Financial Services—Investment Companies. The Portfolio prepares its financial statements in accordance with generally accepted
accounting principles (“GAAP”) in the United States of America and follows the significant accounting policies described below.
(A) Securities Valuation. Investments are usually valued as of the close of regular trading on the New York Stock Exchange (the "Exchange") (usually 4:00 p.m. Eastern time) on each day the Portfolio is open for business ("valuation date").
Pursuant to Rule 2a-5 under the 1940 Act, the Board of Trustees of the Fund (the "Board") has designated New York Life Investment Management LLC (“New York Life Investments” or the "Manager") as its Valuation Designee (the "Valuation Designee"). The Valuation Designee is responsible for performing fair valuations relating to all investments in the Portfolio’s portfolio for which market quotations are not readily available; periodically assessing and managing material valuation risks; establishing and applying fair value methodologies; testing fair valuation methodologies; evaluating and overseeing pricing services; ensuring appropriate segregation of valuation and portfolio management functions; providing quarterly, annual and prompt reporting to the Board, as appropriate; identifying potential conflicts of interest; and maintaining appropriate records. The Valuation Designee has established a valuation committee ("Valuation Committee") to assist in carrying out the Valuation Designee’s responsibilities and establish prices of securities for which market quotations are not readily available. The Portfolio's and the Valuation Designee's policies and procedures ("Valuation Procedures") govern the Valuation Designee’s selection and application of methodologies for determining and calculating the fair value of Portfolio investments. The Valuation Designee may value the Portfolio's portfolio securities for which market quotations are not readily available and other Portfolio assets utilizing inputs from pricing services and other third-party sources. The Valuation Committee meets (in person, via electronic mail or via teleconference) on an ad-hoc basis to determine fair valuations and on a quarterly basis to review fair value events with respect to certain securities for which market quotations are not readily available, including valuation risks and back-testing results, and to preview reports to the Board.
The Valuation Committee establishes prices of securities for which market quotations are not readily available based on such methodologies and measurements on a regular basis after considering information that is reasonably available and deemed relevant by the Valuation Committee. The Board shall oversee the Valuation Designee and review fair valuation materials on a prompt, quarterly and annual basis and approve proposed revisions to the Valuation Procedures.
Investments for which market quotations are not readily available are valued at fair value as determined in good faith pursuant to the Valuation Procedures. A market quotation is readily available only when that quotation is a quoted price (unadjusted) in active markets for identical investments that the Portfolio can access at the measurement date, provided that a quotation will not be readily available if it is not reliable. "Fair value" is defined as the price the Portfolio would reasonably expect to receive upon selling an asset or liability in an orderly transaction to an independent buyer in the principal or most advantageous market for the
Notes to Financial Statements (continued)
asset or liability. Fair value measurements are determined within a framework that establishes a three-tier hierarchy that maximizes the use of observable market data and minimizes the use of unobservable inputs to establish a classification of fair value measurements for disclosure purposes. "Inputs" refer broadly to the assumptions that market participants would use in pricing the asset or liability, including assumptions about risk, such as the risk inherent in a particular valuation technique used to measure fair value using a pricing model and/or the risk inherent in the inputs for the valuation technique. Inputs may be observable or unobservable. Observable inputs reflect the assumptions market participants would use in pricing the asset or liability based on market data obtained from sources independent of the Portfolio. Unobservable inputs reflect the Portfolio’s own assumptions about the assumptions market participants would use in pricing the asset or liability based on the information available. The inputs or methodology used for valuing assets or liabilities may not be an indication of the risks associated with investing in those assets or liabilities. The three-tier hierarchy of inputs is summarized below.
| • | Level 1—quoted prices (unadjusted) in active markets for an identical asset or liability |
| • | Level 2—other significant observable inputs (including quoted prices for a similar asset or liability in active markets, interest rates and yield curves, prepayment speeds, credit risk, etc.) |
| • | Level 3—significant unobservable inputs (including the Portfolio's own assumptions about the assumptions that market participants would use in measuring fair value of an asset or liability) |
The level of an asset or liability within the fair value hierarchy is based on the lowest level of an input, both individually and in the aggregate, that is significant to the fair value measurement. The aggregate value by input level of the Portfolio’s assets and liabilities as of December 31, 2023, is included at the end of the Portfolio of Investments.
The Portfolio may use third-party vendor evaluations, whose prices may be derived from one or more of the following standard inputs, among others:
| • Broker/dealer quotes | • Benchmark securities |
| • Two-sided markets | • Reference data (corporate actions or material event notices) |
| • Bids/offers | • Monthly payment information |
| • Industry and economic events | • Reported trades |
An asset or liability for which a market quotation is not readily available is valued by methods deemed reasonable in good faith by the Valuation Committee, following the Valuation Procedures to represent fair value. Under these procedures, the Valuation Designee generally uses a market-based approach which may use related or comparable assets or liabilities, recent transactions, market multiples, book values and other relevant information. The Valuation Designee may also use an income-based valuation approach in which the anticipated future cash flows of the asset or liability are discounted to calculate fair value.
Discounts may also be applied due to the nature and/or duration of any restrictions on the disposition of the asset or liability. Fair value represents a good faith approximation of the value of a security. Fair value determinations involve the consideration of a number of subjective factors, an analysis of applicable facts and circumstances and the exercise of judgment. As a result, it is possible that the fair value for a security determined in good faith in accordance with the Valuation Procedures may differ from valuations for the same security determined for other funds using their own valuation procedures. Although the Valuation Procedures are designed to value a security at the price the Portfolio may reasonably expect to receive upon the security's sale in an orderly transaction, there can be no assurance that any fair value determination thereunder would, in fact, approximate the amount that the Portfolio would actually realize upon the sale of the security or the price at which the security would trade if a reliable market price were readily available. During the year ended December 31, 2023, there were no material changes to the fair value methodologies.
Securities which may be valued in this manner include, but are not limited to: (i) a security for which trading has been halted or suspended or otherwise does not have a readily available market quotation on a given day; (ii) a debt security that has recently gone into default and for which there is not a current market quotation; (iii) a security of an issuer that has entered into a restructuring; (iv) a security that has been delisted from a national exchange; (v) a security subject to trading collars for which no or limited trading takes place; and (vi) a security whose principal market has been temporarily closed at a time when, under normal conditions, it would be open. Securities valued in this manner are generally categorized as Level 2 or 3 in the hierarchy.
Equity securities, rights and warrants, if applicable, are valued at the last quoted sales prices as of the close of regular trading on the relevant exchange on each valuation date. Securities that are not traded on the valuation date are valued at the mean of the last quoted bid and ask prices. Prices are normally taken from the principal market in which each security trades. These securities are generally categorized as Level 1 in the hierarchy.
Investments in mutual funds, including money market funds, are valued at their respective NAVs at the close of business each day on the valuation date. These securities are generally categorized as Level 1 in the hierarchy.
Temporary cash investments acquired in excess of 60 days to maturity at the time of purchase are valued using the latest bid prices or using valuations based on a matrix system (which considers such factors as security prices, yields, maturities and ratings), both as furnished by independent pricing services. Temporary cash investments that mature in 60 days or less at the time of purchase ("Short-Term Investments") are valued using the amortized cost method of valuation, unless the use of such method would be inappropriate. The amortized cost method involves valuing a security at its cost on the date of purchase and thereafter assuming a constant amortization to maturity of the difference between such cost and the value on maturity date. Amortized cost approximates
| 18 | MainStay VP Wellington U.S. Equity Portfolio |
the current fair value of a security. Securities valued using the amortized cost method are not valued using quoted prices in an active market and are generally categorized as Level 2 in the hierarchy.
The information above is not intended to reflect an exhaustive list of the methodologies that may be used to value portfolio investments. The Valuation Procedures permit the use of a variety of valuation methodologies in connection with valuing portfolio investments. The methodology used for a specific type of investment may vary based on the market data available or other considerations. The methodologies summarized above may not represent the specific means by which portfolio investments are valued on any particular business day.
(B) Income Taxes. The Portfolio's policy is to comply with the requirements of the Internal Revenue Code of 1986, as amended (the “Internal Revenue Code”), applicable to regulated investment companies and to distribute all of its taxable income to the shareholders of the Portfolio within the allowable time limits.
The Manager evaluates the Portfolio’s tax positions to determine if the tax positions taken meet the minimum recognition threshold in connection with accounting for uncertainties in income tax positions taken or expected to be taken for the purposes of measuring and recognizing tax liabilities in the financial statements. Recognition of tax benefits of an uncertain tax position is permitted only to the extent the position is “more likely than not” to be sustained assuming examination by taxing authorities. The Manager analyzed the Portfolio's tax positions taken on federal, state and local income tax returns for all open tax years (for up to three tax years) and has concluded that no provisions for federal, state and local income tax are required in the Portfolio's financial statements. The Portfolio's federal, state and local income tax and federal excise tax returns for tax years for which the applicable statutes of limitations have not expired are subject to examination by the Internal Revenue Service and state and local departments of revenue.
(C) Dividends and Distributions to Shareholders. Dividends and distributions are recorded on the ex-dividend date. The Portfolio intends to declare and pay dividends from net investment income and distributions from net realized capital and currency gains, if any, at least annually. All dividends and distributions are reinvested at NAV in the same class of shares of the Portfolio. Dividends and distributions to shareholders are determined in accordance with federal income tax regulations and may differ from determinations using GAAP.
(D) Security Transactions and Investment Income. The Portfolio records security transactions on the trade date. Realized gains and losses on security transactions are determined using the identified cost method. Dividend income is recognized on the ex-dividend date, net of any foreign tax withheld at the source, and interest income is accrued as earned using the effective interest rate method. Distributions received from real estate investment trusts may be classified as dividends, capital gains and/or return of capital.
Investment income and realized and unrealized gains and losses on investments of the Portfolio are allocated pro rata to the separate classes
of shares based upon their relative net assets on the date the income is earned or realized and unrealized gains and losses are incurred.
(E) Expenses. Expenses of the Fund are allocated to the individual Portfolios in proportion to the net assets of the respective Portfolios when the expenses are incurred, except where direct allocations of expenses can be made. Expenses (other than fees incurred under the distribution and service plans, further discussed in Note 3(B), which are charged directly to the Service Class shares) are allocated to separate classes of shares pro rata based upon their relative net assets on the date the expenses are incurred. The expenses borne by the Portfolio, including those of related parties to the Portfolio, are shown in the Statement of Operations.
Additionally, the Portfolio may invest in exchange-traded funds ("ETFs") and mutual funds, which are subject to management fees and other fees that may cause the costs of investing in ETFs and mutual funds to be greater than the costs of owning the underlying securities directly. These indirect expenses of ETFs and mutual funds are not included in the amounts shown as expenses in the Statement of Operations or in the expense ratios included in the Financial Highlights.
(F) Use of Estimates. In preparing financial statements in conformity with GAAP, the Manager makes estimates and assumptions that affect the reported amounts and disclosures in the financial statements. Actual results could differ from those estimates and assumptions.
(G) Securities Lending. In order to realize additional income, the Portfolio may engage in securities lending, subject to the limitations set forth in the 1940 Act and relevant guidance by the staff of the Securities and Exchange Commission (“SEC”). If the Portfolio engages in securities lending, the Portfolio will lend through its custodian, JPMorgan Chase Bank, N.A., ("JPMorgan"), acting as securities lending agent on behalf of the Portfolio. Under the current arrangement, JPMorgan will manage the Portfolio's collateral in accordance with the securities lending agency agreement between the Portfolio and JPMorgan, and indemnify the Portfolio against counterparty risk. The loans will be collateralized by cash (which may be invested in a money market fund) and/or non-cash collateral (which may include U.S. Treasury securities and/or U.S. government agency securities issued or guaranteed by the United States government or its agencies or instrumentalities) at least equal at all times to the market value of the securities loaned. Non-cash collateral held at year end is segregated and cannot be transferred by the Portfolio. The Portfolio bears the risk of delay in recovery of, or loss of rights in, the securities loaned. The Portfolio may also record a realized gain or loss on securities deemed sold due to a borrower’s inability to return securities on loan. The Portfolio bears the risk of any loss on investment of cash collateral. The Portfolio will receive compensation for lending its securities in the form of fees or it will retain a portion of interest earned on the investment of any cash collateral. The Portfolio will also continue to receive interest and dividends on the securities loaned and any gain or loss in the market price of the securities loaned that may occur during the
Notes to Financial Statements (continued)
term of the loan will be for the account of the Portfolio. Income earned from securities lending activities, if any, is reflected in the Statement of Operations.
(H) Indemnifications. Under the Fund’s organizational documents, its officers and trustees are indemnified against certain liabilities that may arise out of performance of their duties to the Fund. Additionally, in the normal course of business, the Portfolio enters into contracts with third-party service providers that contain a variety of representations and warranties and that may provide general indemnifications. The Portfolio's maximum exposure under these arrangements is unknown, as this would involve future claims that may be made against the Portfolio that have not yet occurred. The Manager believes that the risk of loss in connection with these potential indemnification obligations is remote. However, there can be no assurance that material liabilities related to such obligations will not arise in the future, which could adversely impact the Portfolio.
Note 3–Fees and Related Party Transactions
(A) Manager and Subadvisor. New York Life Investments, a registered investment adviser and an indirect, wholly-owned subsidiary of New York Life, serves as the Portfolio's Manager, pursuant to an Amended and Restated Management Agreement ("Management Agreement"). The Manager provides offices, conducts clerical, recordkeeping and bookkeeping services and keeps most of the financial and accounting records required to be maintained by the Portfolio. Except for the portion of salaries and expenses that are the responsibility of the Portfolio, the Manager pays the salaries and expenses of all personnel affiliated with the Portfolio and certain operational expenses of the Portfolio. The Portfolio reimburses New York Life Investments in an amount equal to the portion of the compensation of the Chief Compliance Officer attributable to the Portfolio. Wellington Management Company LLP ("Wellington" or the "Subadvisor"), a registered investment adviser, serves as the Subadvisor to the Portfolio and is responsible for the day-to-day portfolio management of the Portfolio. Pursuant to the terms of a Subadvisory Agreement between New York Life Investments and Wellington, New York Life Investments pays for the services of the Subadvisor.
Effective May 1, 2023, pursuant to the Management Agreement, the Fund pays the Manager, on behalf of the Portfolio, a monthly fee for the services performed and the facilities furnished at an annual rate of the Portfolio's average daily net assets as follows: 0.55% up to $500 million; 0.525% from $500 million to $1 billion; 0.50% from $1 billion to $3 billion; and 0.49% in excess of $3 billion. During the year ended December 31, 2023, the effective management fee rate was 0.54% of the Portfolio's average daily net assets.
Prior to May 1, 2023, the Fund paid the Manager, on behalf of the Portfolio, a monthly fee for the services performed and the facilities furnished at an annual rate of the Portfolio's average daily net assets as follows: 0.55% up to $500 million; 0.525% from $500 million to $1 billion; and 0.50% in excess of $1 billion.
During the year ended December 31, 2023, New York Life Investments earned fees from the Portfolio in the amount of $4,719,504 and paid the Subadvisor fees in the amount of $2,053,452.
JPMorgan provides sub-administration and sub-accounting services to the Portfolio pursuant to an agreement with New York Life Investments. These services include calculating the daily NAVs of the Portfolio, maintaining the general ledger and sub-ledger accounts for the calculation of the Portfolio's NAVs, and assisting New York Life Investments in conducting various aspects of the Portfolio's administrative operations. For providing these services to the Portfolio, JPMorgan is compensated by New York Life Investments.
Pursuant to an agreement between the Fund and New York Life Investments, New York Life Investments is responsible for providing or procuring certain regulatory reporting services for the Portfolio. The Portfolio will reimburse New York Life Investments for the actual costs incurred by New York Life Investments in connection with providing or procuring these services for the Portfolio.
(B) Distribution and Service Fees. The Fund, on behalf of the Portfolio, has entered into a distribution agreement with NYLIFE Distributors LLC (the “Distributor”), an affiliate of New York Life Investments. The Portfolio has adopted a distribution plan (the “Plan”) in accordance with the provisions of Rule 12b-1 under the 1940 Act. Under the Plan, the Distributor has agreed to provide, through its affiliates or independent third parties, various distribution-related, shareholder and administrative support services to the Service Class shareholders. For its services, the Distributor is entitled to a combined distribution and service fee accrued daily and paid monthly at an annual rate of 0.25% of the average daily net assets attributable to the Service Class shares of the Portfolio.
Note 4-Federal Income Tax
As of December 31, 2023, the cost and unrealized appreciation (depreciation) of the Portfolio’s investment portfolio, including applicable derivative contracts and other financial instruments, as determined on a federal income tax basis, were as follows:
| | Federal Tax
Cost | Gross
Unrealized
Appreciation | Gross
Unrealized
(Depreciation) | Net
Unrealized
Appreciation/
(Depreciation) |
| Investments in Securities | $724,758,000 | $210,878,907 | $(19,253,847) | $191,625,060 |
As of December 31, 2023, the components of accumulated gain (loss) on a tax basis were as follows:
Ordinary
Income | Accumulated
Capital
and Other
Gain (Loss) | Other
Temporary
Differences | Unrealized
Appreciation
(Depreciation) | Total
Accumulated
Gain (Loss) |
| $7,318,375 | $(11,008,930) | $— | $191,625,060 | $187,934,505 |
| 20 | MainStay VP Wellington U.S. Equity Portfolio |
The difference between book-basis and tax-basis unrealized appreciation (depreciation) is primarily due to wash sale adjustments.
As of December 31, 2023, for federal income tax purposes, capital loss carryforwards of $11,008,930, as shown in the table below, were available to the extent provided by the regulations to offset future realized gains of the Portfolio. Accordingly, no capital gains distributions are expected to be paid to shareholders until net gains have been realized in excess of such amounts.
Capital Loss
Available Through | Short-Term
Capital Loss
Amounts (000’s) | Long-Term
Capital Loss
Amounts (000’s) |
| Unlimited | $11,009 | $— |
The Portfolio utilized $12,154,818 of capital loss carryforwards during the year ended December 31, 2023.
During the years ended December 31, 2023 and December 31, 2022, the tax character of distributions paid as reflected in the Statements of Changes in Net Assets was as follows:
| | 2023 | 2022 |
| Distributions paid from: | | |
| Ordinary Income | $7,739,973 | $100,243,996 |
| Long-Term Capital Gains | — | 75,412,662 |
| Total | $7,739,973 | $175,656,658 |
Note 5–Custodian
JPMorgan is the custodian of cash and securities held by the Portfolio. Custodial fees are charged to the Portfolio based on the Portfolio's net assets and/or the market value of securities held by the Portfolio and the number of certain transactions incurred by the Portfolio.
Note 6–Line of Credit
The Portfolio and certain other funds managed by New York Life Investments maintain a line of credit with a syndicate of banks in order to secure a source of funds for temporary purposes to meet unanticipated or excessive redemption requests.
Effective July 25, 2023, under the credit agreement (the “Credit Agreement”), the aggregate commitment amount is $600,000,000 with an additional uncommitted amount of $100,000,000. The commitment fee is an annual rate of 0.15% of the average commitment amount payable quarterly, regardless of usage, to JPMorgan, who serves as the agent to the syndicate. The commitment fee is allocated among the Portfolio and certain other funds managed by New York Life Investments based upon their respective net assets and other factors. Interest on any revolving credit loan is charged based upon the Federal Funds Rate, Daily Simple Secured Overnight Financing Rate ("SOFR") + 0.10%, or the Overnight Bank Funding Rate, whichever is higher. The Credit Agreement expires on July 23, 2024, although the Portfolio, certain other funds managed by New York Life Investments and the syndicate of banks may renew the Credit Agreement for an additional year on the same or
different terms or enter into a credit agreement with a different syndicate of banks. Prior to July 25, 2023, the aggregate commitment amount and the commitment fee were the same as those under the current Credit Agreement. During the year ended December 31, 2023, there were no borrowings made or outstanding with respect to the Portfolio under the Credit Agreement.
Note 7–Interfund Lending Program
Pursuant to an exemptive order issued by the SEC, the Portfolio, along with certain other funds managed by New York Life Investments, may participate in an interfund lending program. The interfund lending program provides an alternative credit facility that permits the Portfolio and certain other funds managed by New York Life Investments to lend or borrow money for temporary purposes directly to or from one another, subject to the conditions of the exemptive order. During the year ended December 31, 2023, there were no interfund loans made or outstanding with respect to the Portfolio.
Note 8–Purchases and Sales of Securities (in 000’s)
During the year ended December 31, 2023, purchases and sales of securities, other than short-term securities, were $238,497 and $330,933, respectively.
Note 9–Capital Share Transactions
Transactions in capital shares for the years ended December 31, 2023 and December 31, 2022, were as follows:
| Initial Class | Shares | Amount |
| Year ended December 31, 2023: | | |
| Shares sold | 1,098,980 | $ 25,462,776 |
| Shares issued to shareholders in reinvestment of distributions | 253,757 | 6,075,145 |
| Shares redeemed | (4,354,600) | (103,158,247) |
| Net increase (decrease) | (3,001,863) | $ (71,620,326) |
| Year ended December 31, 2022: | | |
| Shares sold | 4,126,421 | $ 120,131,397 |
| Shares issued to shareholders in reinvestment of distributions | 6,200,906 | 127,232,665 |
| Shares redeemed | (3,129,082) | (89,333,654) |
| Net increase (decrease) | 7,198,245 | $ 158,030,408 |
| |
Notes to Financial Statements (continued)
| Service Class | Shares | Amount |
| Year ended December 31, 2023: | | |
| Shares sold | 744,785 | $ 17,238,221 |
| Shares issued to shareholders in reinvestment of distributions | 70,860 | 1,664,828 |
| Shares redeemed | (2,122,516) | (49,497,408) |
| Net increase (decrease) | (1,306,871) | $ (30,594,359) |
| Year ended December 31, 2022: | | |
| Shares sold | 709,385 | $ 19,566,892 |
| Shares issued to shareholders in reinvestment of distributions | 2,404,906 | 48,423,993 |
| Shares redeemed | (1,332,405) | (36,325,263) |
| Net increase (decrease) | 1,781,886 | $ 31,665,622 |
Note 10–Other Matters
As of the date of this report, the Portfolio faces a heightened level of risk associated with current uncertainty, volatility and state of economies, financial markets, rising interest rates, and labor and health conditions around the world. Events such as war, acts of terrorism, recessions, rapid inflation, the imposition of international sanctions, earthquakes, hurricanes, epidemics and pandemics and other unforeseen natural or human disasters may have broad adverse social, political and economic effects on the global economy, which could negatively impact the value of the Portfolio's investments. Developments that disrupt global economies and financial markets may magnify factors that affect the Portfolio's performance.
Note 11–Subsequent Events
In connection with the preparation of the financial statements of the Portfolio as of and for the year ended December 31, 2023, events and transactions subsequent to December 31, 2023, through the date the financial statements were issued, have been evaluated by the Manager for possible adjustment and/or disclosure. No subsequent events requiring financial statement adjustment or disclosure have been identified.
| 22 | MainStay VP Wellington U.S. Equity Portfolio |
Report of Independent Registered Public Accounting Firm
To the Board of Trustees of MainStay VP Funds Trust and Shareholders of MainStay VP Wellington U.S. Equity Portfolio
Opinion on the Financial Statements
We have audited the accompanying statement of assets and liabilities, including the portfolio of investments, of MainStay VP Wellington U.S. Equity Portfolio (one of the portfolios constituting MainStay VP Funds Trust, referred to hereafter as the “Portfolio”) as of December 31, 2023, the related statement of operations for the year ended December 31, 2023, the statements of changes in net assets for each of the two years in the period ended December 31, 2023, including the related notes, and the financial highlights for each of the five years in the period ended December 31, 2023 (collectively referred to as the “financial statements”). In our opinion, the financial statements present fairly, in all material respects, the financial position of the Portfolio as of December 31, 2023, the results of its operations for the year then ended, the changes in its net assets for each of the two years in the period ended December 31, 2023 and the financial highlights for each of the five years in the period ended December 31, 2023 in conformity with accounting principles generally accepted in the United States of America.
Basis for Opinion
These financial statements are the responsibility of the Portfolio’s management. Our responsibility is to express an opinion on the Portfolio’s financial statements based on our audits. We are a public accounting firm registered with the Public Company Accounting Oversight Board (United States) (PCAOB) and are required to be independent with respect to the Portfolio in accordance with the U.S. federal securities laws and the applicable rules and regulations of the Securities and Exchange Commission and the PCAOB.
We conducted our audits of these financial statements in accordance with the standards of the PCAOB. Those standards require that we plan and perform the audit to obtain reasonable assurance about whether the financial statements are free of material misstatement, whether due to error or fraud.
Our audits included performing procedures to assess the risks of material misstatement of the financial statements, whether due to error or fraud, and performing procedures that respond to those risks. Such procedures included examining, on a test basis, evidence regarding the amounts and disclosures in the financial statements. Our audits also included evaluating the accounting principles used and significant estimates made by management, as well as evaluating the overall presentation of the financial statements. Our procedures included confirmation of securities owned as of December 31, 2023 by correspondence with the custodian, transfer agent, and brokers; when replies were not received from brokers, we performed other auditing procedures. We believe that our audits provide a reasonable basis for our opinion.
/s/PricewaterhouseCoopers LLP
New York, New York
February 26, 2024
We have served as the auditor of one or more investment companies in the MainStay group of funds since 1984.
Board Consideration and Approval of Management Agreement and Subadvisory Agreement (Unaudited)
The continuation of the Management Agreement with respect to the MainStay VP Wellington U.S. Equity Portfolio (“Portfolio”) and New York Life Investment Management LLC (“New York Life Investments”) and the Subadvisory Agreement between New York Life Investments and Wellington Management Company LLP (“WMC”) with respect to the Portfolio (together, “Advisory Agreements”) is subject to annual review and approval by the Board of Trustees of MainStay VP Funds Trust (“Board” of the “Trust”) in accordance with Section 15 of the Investment Company Act of 1940, as amended (“1940 Act”). At its December 6–7, 2023 meeting, the Board, including the Trustees who are not an “interested person” (as such term is defined in the 1940 Act) of the Trust (“Independent Trustees”) voting separately, unanimously approved the continuation of each of the Advisory Agreements for a one-year period.
In reaching the decision to approve the continuation of each of the Advisory Agreements, the Board considered information and materials furnished by New York Life Investments and WMC in connection with an annual contract review process undertaken by the Board that took place at meetings of the Board and its Contracts Committee from September 2023 through December 2023, including information and materials furnished by New York Life Investments and WMC in response to requests prepared on behalf of the Board, and in consultation with the Independent Trustees, by independent legal counsel to the Independent Trustees, which encompassed a variety of topics, including those summarized below. Information and materials requested by and furnished to the Board for consideration in connection with the contract review process included, among other items, reports on the Portfolio and “peer funds” prepared by Institutional Shareholder Services Inc. (“ISS”), an independent third-party service provider engaged by the Board to report objectively on the Portfolio’s investment performance, management fee and total expenses. The Board also considered information on the fees charged to other investment advisory clients of New York Life Investments and/or WMC that follow investment strategies similar to those of the Portfolio, if any, and, when applicable, the rationale for differences in the Portfolio’s management and subadvisory fees and the fees charged to those other investment advisory clients. In addition, the Board considered information regarding the legal standards and fiduciary obligations applicable to its consideration of the continuation of each of the Advisory Agreements. The contract review process, including the structure and format for information and materials provided to the Board, has been developed in consultation with the Board. The Independent Trustees also met in executive sessions with their independent legal counsel and, for portions thereof, with senior management of New York Life Investments.
The Board’s deliberations with respect to the continuation of each of the Advisory Agreements reflect a year-long process, and the Board also took into account information furnished to the Board and its Committees throughout the year, as deemed relevant and appropriate by the Trustees, including, among other items, reports on investment performance of the Portfolio and investment-related matters for the Portfolio as well as presentations from New York Life Investments and, generally annually, WMC personnel. In addition, the Board took into account other information provided by New York Life Investments throughout the year,
including, among other items, periodic reports on legal and compliance matters, risk management, portfolio turnover, brokerage commissions and non-advisory services provided to the Portfolio by New York Life Investments, as deemed relevant and appropriate by the Trustees.
In addition to information provided to the Board throughout the year, the Board received information in connection with its June 2023 meeting provided specifically in response to requests prepared on behalf of the Board, and in consultation with the Independent Trustees, by independent legal counsel to the Independent Trustees regarding the Portfolio’s distribution arrangements. In addition, the Board received information regarding the Portfolio’s asset levels, share purchase and redemption activity and the payment of Rule 12b-1 and/or certain other fees by applicable share classes of the Portfolio, among other information.
In considering the continuation of each of the Advisory Agreements, the Trustees reviewed and evaluated the information and factors they believed to reasonably be necessary and appropriate in light of legal advice furnished to them by independent legal counsel to the Independent Trustees and through the exercise of their own business judgment. Although individual Trustees may have weighed certain factors or information differently and the Board did not consider any single factor or information controlling in reaching its decision, the factors that figured prominently in the Board’s consideration of the continuation of each of the Advisory Agreements are summarized in more detail below and include, among other factors: (i) the nature, extent and quality of the services provided to the Portfolio by New York Life Investments and WMC; (ii) the qualifications of the portfolio managers of the Portfolio and the historical investment performance of the Portfolio, New York Life Investments and WMC; (iii) the costs of the services provided, and profits realized, by New York Life Investments and WMC with respect to their relationships with the Portfolio; (iv) the extent to which economies of scale have been realized or may be realized if the Portfolio grows and the extent to which any economies of scale have been shared, have benefited or may benefit the Portfolio’s shareholders; and (v) the reasonableness of the Portfolio’s management and subadvisory fees and total ordinary operating expenses. Although the Board recognized that comparisons between the Portfolio’s fees and expenses and those of other funds are imprecise given different terms of agreements, variations in fund strategies and other factors, the Board considered the reasonableness of the Portfolio’s management fee and total ordinary operating expenses as compared to the peer funds identified by ISS. Throughout their considerations, the Trustees acknowledged the commitment of New York Life Investments and its affiliates to serve the MainStay Group of Funds, as well as their capacity, experience, resources, financial stability and reputations. The Trustees also acknowledged the entrepreneurial and other risks assumed by New York Life Investments in sponsoring and managing the Portfolio. With respect to the Subadvisory Agreement, the Board took into account New York Life Investments’ recommendation to approve the continuation of the Subadvisory Agreement.
The Trustees noted that, throughout the year, the Trustees are afforded an opportunity to ask questions of, and request additional information or materials from, New York Life Investments and WMC. The Board’s
| 24 | MainStay VP Wellington U.S. Equity Portfolio |
decision with respect to each of the Advisory Agreements may have also been based, in part, on the Board’s knowledge of New York Life Investments and WMC resulting from, among other things, the Board’s consideration of each of the Advisory Agreements in prior years, the advisory agreements for other funds in the MainStay Group of Funds, the Board’s review throughout the year of the performance and operations of other funds in the MainStay Group of Funds and each Trustee’s business judgment and industry experience. In addition to considering the above-referenced factors, the Board observed that in the marketplace, notably under variable life insurance policies and variable annuity contracts for which the Portfolio serves as an investment option, there are a range of investment options available to investors and that the Portfolio’s shareholders, having had the opportunity to consider other investment options, have invested in the Portfolio.
The factors that figured prominently in the Board’s decision to approve the continuation of each of the Advisory Agreements during the Board’s December 6–7, 2023 meeting are summarized in more detail below.
Nature, Extent and Quality of Services Provided by New York Life Investments and WMC
The Board examined the nature, extent and quality of the services that New York Life Investments provides to the Portfolio. The Board evaluated New York Life Investments’ experience and capabilities in serving as manager of the Portfolio and considered that the Portfolio operates in a “manager-of-managers” structure. The Board also considered New York Life Investments’ responsibilities and services provided pursuant to this structure, including overseeing the services provided by WMC, evaluating the performance of WMC, making recommendations to the Board as to whether the Subadvisory Agreement should be renewed, modified or terminated and periodically reporting to the Board regarding the results of New York Life Investments’ evaluation and monitoring functions. The Board noted that New York Life Investments manages other mutual funds, serves a variety of other investment advisory clients, including other pooled investment vehicles, and has experience overseeing mutual fund service providers, including subadvisors. The Board considered the experience of senior personnel at New York Life Investments providing management and administrative and other non-advisory services to the Portfolio. The Board observed that New York Life Investments devotes significant resources and time to providing management and administrative and other non-advisory services to the Portfolio, including New York Life Investments’ oversight and due diligence reviews of WMC and ongoing analysis of, and interactions with, WMC with respect to, among other things, the Portfolio’s investment performance and risks as well as WMC’s investment capabilities and subadvisory services with respect to the Portfolio.
The Board also considered the range of services that New York Life Investments provides to the Portfolio under the terms of the Management Agreement, including: (i) fund accounting and ongoing supervisory services provided by New York Life Investments’ Fund Administration and Accounting Group; (ii) investment supervisory and analytical services provided by New York Life Investments’ Investment Consulting Group; (iii)
compliance services provided by the Trust’s Chief Compliance Officer as well as New York Life Investments’ compliance department, including supervision and implementation of the Portfolio’s compliance program; (iv) legal services provided by New York Life Investments’ Office of the General Counsel; and (v) risk management monitoring and analysis by compliance and investment personnel. In addition, the Board considered New York Life Investments’ willingness to invest in personnel and other resources, such as cyber security, information security and business continuity planning, that may benefit the Portfolio and noted that New York Life Investments is responsible for compensating the Trust’s officers, except for a portion of the salary of the Trust’s Chief Compliance Officer. The Board recognized that New York Life Investments provides certain other non-advisory services to the Portfolio and has over time provided an increasingly broad array of non-advisory services to the MainStay Group of Funds as a result of regulatory and other developments.
The Board also examined the range, and the nature, extent and quality, of the investment advisory services that WMC provides to the Portfolio and considered the terms of each of the Advisory Agreements. The Board evaluated WMC’s experience and performance in serving as subadvisor to the Portfolio and advising other portfolios and WMC’s track record and experience in providing investment advisory services as well as the experience of investment advisory, senior management and administrative personnel at WMC. The Board considered New York Life Investments’ and WMC’s overall resources, legal and compliance environment, capabilities, reputation, financial condition and history. In addition to information provided in connection with quarterly meetings with the Trust’s Chief Compliance Officer, the Board considered information regarding the compliance policies and procedures of New York Life Investments and WMC and acknowledged their commitment to further developing and strengthening compliance programs that may relate to the Portfolio. The Board also considered WMC’s ability to recruit and retain qualified investment professionals and willingness to invest in personnel and other resources that may benefit the Portfolio. In this regard, the Board considered the qualifications and experience of the Portfolio’s portfolio managers, the number of accounts managed by the portfolio managers and the method for compensating the portfolio managers.
In addition, the Board considered information provided by New York Life Investments and WMC regarding their respective business continuity and disaster recovery plans.
Based on these considerations, among others, the Board concluded that the Portfolio would likely continue to benefit from the nature, extent and quality of these services.
Investment Performance
In evaluating the Portfolio’s investment performance, the Board considered investment performance results over various periods in light of the Portfolio’s investment objective, strategies and risks. The Board considered investment reports on, and analysis of, the Portfolio’s performance provided to the Board throughout the year. These reports include, among other items, information on the Portfolio’s gross and net
Board Consideration and Approval of Management Agreement and Subadvisory Agreement (Unaudited) (continued)
returns, the Portfolio’s investment performance compared to a relevant investment category and the Portfolio’s benchmark, the Portfolio’s risk-adjusted investment performance and the Portfolio’s investment performance as compared to peer funds, as appropriate, as well as portfolio attribution information and commentary on the effect of market conditions. The Board also considered information provided by ISS showing the investment performance of the Portfolio as compared to peer funds. In addition, the Board reviewed the methodology used by ISS to construct the group of peer funds for comparative purposes.
The Board also took into account its discussions with senior management at New York Life Investments concerning the Portfolio’s investment performance over various periods as well as discussions between representatives of WMC and the members of the Board’s Investment Committee, which generally occur on an annual basis.
Based on these considerations, among others, the Board concluded that its review of the Portfolio’s investment performance and related information supported a determination to approve the continuation of each of the Advisory Agreements.
Costs of the Services Provided, and Profits and Other Benefits Realized, by New York Life Investments and WMC
The Board considered the costs of the services provided under each of the Advisory Agreements. The Board also considered the profitability of New York Life Investments and its affiliates and WMC due to their relationships with the Portfolio as well as by New York Life Investments and its affiliates due to their relationships with the MainStay Group of Funds. With respect to the profitability of WMC’s relationship with the Portfolio, the Board considered information from New York Life Investments that WMC’s subadvisory fee reflected an arm’s-length negotiation and that this fee is paid by New York Life Investments, not the Portfolio, and the relevance of WMC’s profitability was considered by the Trustees in that context. On this basis, the Board primarily considered the costs and profitability for New York Life Investments and its affiliates with respect to the Portfolio.
In addition, the Board acknowledged the difficulty in obtaining reliable comparative data about mutual fund managers’ profitability because such information generally is not publicly available and may be impacted by numerous factors, including the structure of a fund manager’s organization, the types of funds it manages, the methodology used to allocate certain fixed costs to specific funds and the manager’s capital structure and costs of capital.
In evaluating the costs of the services provided by New York Life Investments and WMC, and profitability of New York Life Investments and its affiliates and WMC due to their relationships with the Portfolio, the Board considered, among other factors, New York Life Investments’ and its affiliates’ and WMC’s continuing investments in, or willingness to invest in, personnel and other resources that may support and further enhance the management of the Portfolio, and that New York Life Investments is responsible for paying the subadvisory fee for the Portfolio. The Board also considered the financial resources of New York Life
Investments and WMC and acknowledged that New York Life Investments and WMC must be in a position to recruit and retain experienced professional personnel and to maintain a strong financial position for New York Life Investments and WMC to continue to provide high-quality services to the Portfolio. The Board recognized that the Portfolio benefits from the allocation of certain fixed costs among the funds in the MainStay Group of Funds, among other expected benefits resulting from its relationship with New York Life Investments.
The Board considered information regarding New York Life Investments’ methodology for calculating profitability and allocating costs provided by New York Life Investments in connection with the fund profitability analysis presented to the Board. The Board concluded that New York Life Investments’ methods for allocating costs and procedures for estimating overall profitability of the relationship with the funds in the MainStay Group of Funds were reasonable. The Board recognized the difficulty in calculating and evaluating a manager’s profitability with respect to the Portfolio and considered that other profitability methodologies may also be reasonable.
The Board also considered certain fall-out benefits that may be realized by New York Life Investments and its affiliates and WMC and its affiliates due to their relationships with the Portfolio, including reputational and other indirect benefits. The Board recognized, for example, the benefits to WMC from legally permitted “soft-dollar” arrangements by which brokers provide research and other services to WMC in exchange for commissions paid by the Portfolio with respect to trades in the Portfolio’s portfolio securities. In this regard, the Board also requested and considered information from New York Life Investments concerning other material business relationships between WMC and its affiliates and New York Life Investments and its affiliates and considered the existence of a strategic partnership between New York Life Investments and WMC that relates to certain current and future products and represents a potential conflict of interest associated with New York Life Investments’ recommendation to approve the Subadvisory Agreement. In addition, the Board considered its review of the management agreement for a money market fund advised by New York Life Investments and an affiliated subadvisor that serves as an investment option for the Portfolio, including the potential rationale for and costs associated with investments in this money market fund by the Portfolio, if any, and considered information from New York Life Investments that the nature and type of specific investment advisory services provided to this money market fund are distinct from, or in addition to, the investment advisory services provided to the Portfolio. In addition, the Board considered the potential dividend received tax deduction for insurance company affiliates of New York Life Investments from the Portfolio’s securities lending activity.
The Board noted that the Portfolio serves as an investment option primarily under variable contracts issued by affiliates of New York Life Investments that would receive fees under those contracts. The Board observed that, in addition to fees earned by New York Life Investments under the Management Agreement for managing the Portfolio, New York Life Investments’ affiliates also earn revenues from serving the Portfolio in various other capacities, including as the Portfolio’s distributor, and
| 26 | MainStay VP Wellington U.S. Equity Portfolio |
insurance companies affiliated with New York Life Investments would be entitled to receive fees from the Portfolio under a distribution and service plan adopted pursuant to Rule 12b-1 under the 1940 Act. The Board considered information about these other revenues and their impact on the profitability of the relationship with the Portfolio to New York Life Investments and its affiliates. The Board noted that, although it assessed the overall profitability of the relationship with the Portfolio to New York Life Investments and its affiliates as part of the contract review process, when considering the reasonableness of the fee paid to New York Life Investments under the Management Agreement, the Board considered the profitability of New York Life Investments’ relationship with the Portfolio on a pre-tax basis and without regard to distribution expenses incurred by New York Life Investments from its own resources.
After evaluating the information deemed relevant by the Trustees, the Board concluded that any profits realized by New York Life Investments and its affiliates due to their relationships with the Portfolio were not excessive, other expected benefits that may accrue to New York Life Investments and its affiliates are reasonable and other expected benefits that may accrue to WMC and its affiliates are consistent with those expected for a subadvisor to a mutual fund. With respect to WMC, the Board considered that any profits realized by WMC due to its relationship with the Portfolio are the result of arm’s-length negotiations between New York Life Investments and WMC, acknowledging that any such profits are based on the subadvisory fee paid to WMC by New York Life Investments, not the Portfolio.
Management and Subadvisory Fees and Total Ordinary Operating Expenses
The Board evaluated the reasonableness of the fee paid under each of the Advisory Agreements and the Portfolio’s total ordinary operating expenses. With respect to the management fee and subadvisory fee, the Board primarily considered the reasonableness of the management fee paid by the Portfolio to New York Life Investments because the subadvisory fee paid to WMC is paid by New York Life Investments, not the Portfolio. The Board also considered the reasonableness of the subadvisory fee paid by New York Life Investments and the amount of the management fee retained by New York Life Investments.
In assessing the reasonableness of the Portfolio’s fees and expenses, the Board primarily considered comparative data provided by ISS on the fees and expenses of similar mutual funds managed by other investment advisers. The Board reviewed the methodology used by ISS to construct the group of peer funds for comparative purposes. In addition, the Board considered information provided by New York Life Investments and WMC on fees charged to other investment advisory clients, including institutional separate accounts and/or other funds, that follow investment strategies similar to those of the Portfolio, if any. The Board considered the contractual management fee schedule for the Portfolio as compared to those for such other investment advisory clients, taking into account the rationale for differences in fee schedules. The Board also took into account information provided by New York Life Investments about the more extensive scope of services provided to registered investment
companies, such as the Portfolio, as compared with other investment advisory clients. Additionally, the Board considered the impact of contractual breakpoints and voluntary waivers on the Portfolio’s net management fee and expenses. The Board also considered that in proposing fees for the Portfolio, New York Life Investments considers the competitive marketplace for mutual funds.
Based on the factors outlined above, among other considerations, the Board concluded that the Portfolio’s management fee and total ordinary operating expenses are within a range that is competitive and support a conclusion that these fees and expenses are reasonable.
Economies of Scale
The Board considered information regarding economies of scale, including whether economies of scale may exist with respect to the Portfolio and whether the Portfolio’s management fee and expense structure permits any economies of scale to be appropriately shared with the Portfolio’s shareholders. The Board also considered a report from New York Life Investments, previously prepared at the request of the Board, that addressed economies of scale, including with respect to the mutual fund business generally, and the various ways in which the benefits of economies of scale may be shared with the funds in the MainStay Group of Funds. Although the Board recognized the difficulty of determining economies of scale with precision, the Board acknowledged that economies of scale may be shared with the Portfolio in a number of ways, including, for example, through the imposition of fee breakpoints, initially setting management fee rates at scale or making additional investments to enhance the services provided to the Portfolio. The Board reviewed information from New York Life Investments showing how the Portfolio’s management fee schedule compared to fee schedules of other funds and accounts managed by New York Life Investments. The Board also reviewed information from ISS showing how the Portfolio’s management fee schedule compared with fees paid for similar services by peer funds at varying asset levels.
Based on this information, the Board concluded that economies of scale are appropriately shared for the benefit of the Portfolio’s shareholders through the Portfolio’s management fee and expense structure and other methods to share benefits from economies of scale.
Conclusion
On the basis of the information and factors summarized above, among other information and factors deemed relevant by the Trustees, and the evaluation thereof, the Board, including the Independent Trustees voting separately, unanimously voted to approve the continuation of each of the Advisory Agreements.
Proxy Voting Policies and Procedures and Proxy Voting Record
The Portfolio is required to file with the SEC its proxy voting record for the 12-month period ending June 30 on Form N-PX. A description of the policies and procedures that are used to vote proxies relating to portfolio securities of the Portfolio is available free of charge upon request by calling 800-598-2019 or visiting the SEC's website at www.sec.gov. The most recent Form N-PX or proxy voting record is available free of charge upon request by calling 800-598-2019; visiting https://www.newyorklifeinvestments.com/investment-products/vp; or visiting the SEC’s website at www.sec.gov.
Shareholder Reports and Quarterly Portfolio Disclosure
The Portfolio is required to file its complete schedule of portfolio holdings with the SEC 60 days after its first and third fiscal quarter on Form N-PORT. The Portfolio's holdings report is available free of charge upon request by calling 800-598-2019 or by visiting the SEC’s website at www.sec.gov.
| 28 | MainStay VP Wellington U.S. Equity Portfolio |
Board of Trustees and Officers (Unaudited)
The Trustees and officers of the Portfolio are listed below. The Board oversees the MainStay Group of Funds (which consists of MainStay Funds and MainStay Funds Trust), MainStay VP Funds Trust, MainStay MacKay DefinedTerm Municipal Opportunities Fund, MainStay CBRE Global Infrastructure Megatrends Term Fund, the Manager and the Subadvisors, and elects the officers of the Portfolios who are responsible for the day-to-day operations of the Portfolio. Information pertaining to the Trustees and officers is set forth below. Each Trustee serves until his or her successor is elected and qualified or until his or her resignation,
death or removal. Under the Board’s retirement policy, unless an exception is made, a Trustee must tender his or her resignation by the end of the calendar year during which he or she reaches the age of 75. Officers are elected annually by the Board. The business address of each Trustee and officer listed below is 51 Madison Avenue, New York, New York 10010. A majority of the Trustees are not “interested persons” (as defined by the 1940 Act and rules adopted by the SEC thereunder) of the Portfolio (“Independent Trustees”).
| | Name and
Year of Birth | Term of Office,
Position(s) Held and
Length of Service | Principal Occupation(s)
During Past Five Years | Number of
Portfolios in
Fund Complex
Overseen by
Trustee | Other Directorships
Held by Trustee |
| | | | | | |
| | Naïm Abou-Jaoudé*
1966 | MainStay VP Funds Trust: Trustee since 2023 | Chief Executive Officer of New York Life Investment Management LLC (since 2023). Chief Executive Officer of Candriam (an affiliate of New York Life Investment Management LLC) (2007 to 2023). | 81 | MainStay Funds: Trustee since 2023 (11 Funds)
MainStay Funds Trust: Trustee since 2023 (37 Funds);
MainStay MacKay DefinedTerm Municipal Opportunities Fund: Trustee since 2023;
MainStay CBRE Global Infrastructure Megatrends Term Fund: Trustee since 2023; and
New York Life Investment Management International (Chair) since 2015 |
| * | This Trustee is considered to be an “interested person” of the MainStay Group of Funds, MainStay VP Funds Trust, MainStay CBRE Global Infrastructure Megatrends Term Fund and MainStay MacKay DefinedTerm Municipal Opportunities Fund, within the meaning of the 1940 Act because of his affiliation with New York Life Investment Management LLC and Candriam, as described in detail above in the column entitled “Principal Occupation(s) During Past Five Years.” |
| | |
Board of Trustees and Officers (Unaudited) (continued)
| | Name and
Year of Birth | Term of Office,
Position(s) Held and
Length of Service | Principal Occupation(s)
During Past Five Years | Number of
Portfolios in
Fund Complex
Overseen by
Trustee | Other Directorships
Held by Trustee |
| | | | | | |
| | David H. Chow
1957 | MainStay VP Funds Trust: Trustee since January 2016, Advisory Board Member (June 2015 to December 2015) | Founder and CEO, DanCourt Management, LLC since 1999 | 81 | MainStay Funds: Trustee since January 2016, Advisory Board Member (June 2015 to December 2015) (11 Funds);
MainStay Funds Trust: Trustee since January 2016, Advisory Board Member (June 2015 to December 2015) (37 Funds);
MainStay MacKay DefinedTerm Municipal Opportunities Fund: Trustee since January 2016, Advisory Board Member (June 2015 to December 2015);
MainStay CBRE Global Infrastructure Megatrends Term Fund: Trustee since 2021;
VanEck Vectors Group of Exchange-Traded Funds: Trustee since 2006 and Independent Chairman of the Board of Trustees from 2008 to 2022 (57 portfolios); and
Berea College of Kentucky: Trustee since 2009, Chair of the Investment Committee since 2018 |
| | Karen Hammond
1956 | MainStay VP Funds Trust: Trustee since December 2021, Advisory Board Member (June 2021 to December 2021)
| Retired, Managing Director, Devonshire Investors (2007 to 2013); Senior Vice President, Fidelity Management & Research Co. (2005 to 2007); Senior Vice President and Corporate Treasurer, FMR Corp. (2003 to 2005); Chief Operating Officer, Fidelity Investments Japan (2001 to 2003) | 81 | MainStay Funds: Trustee since December 2021, Advisory Board Member (June 2021 to December 2021) (11 Funds);
MainStay Funds Trust: Trustee since December 2021, Advisory Board Member (June 2021 to December 2021) (37 Funds);
MainStay MacKay DefinedTerm Municipal Opportunities Fund: Trustee since December 2021, Advisory Board Member (June 2021 to December 2021);
MainStay CBRE Global Infrastructure Megatrends Term Fund: Trustee since December 2021, Advisory Board Member (June 2021 to December 2021);
Two Harbors Investment Corp.: Director since 2018;
Rhode Island State Investment Commission: Member since 2017; and
Blue Cross Blue Shield of Rhode Island: Director since 2019 |
| | Susan B. Kerley
1951 | MainStay VP Funds Trust: Chair since 2017 and Trustee since 2007** | President, Strategic Management Advisors LLC since 1990 | 81 | MainStay Funds: Chair since January 2017 and Trustee since 2007 (11 Funds); MainStay Funds Trust: Chair since January 2017 and Trustee since 1990 (37 Funds)***;
MainStay MacKay DefinedTerm Municipal Opportunities Fund: Chair since January 2017 and Trustee since 2011;
MainStay CBRE Global Infrastructure Megatrends Term Fund: Trustee since June 2021; and
Legg Mason Partners Funds: Trustee since 1991 (45 portfolios) |
| 30 | MainStay VP Wellington U.S. Equity Portfolio |
| | Name and
Year of Birth | Term of Office,
Position(s) Held and
Length of Service | Principal Occupation(s)
During Past Five Years | Number of
Portfolios in
Fund Complex
Overseen by
Trustee | Other Directorships
Held by Trustee |
| | | | | | |
| | Alan R. Latshaw
1951 | MainStay VP Funds Trust: Trustee since 2007** | Retired; Partner, Ernst & Young LLP (2002 to 2003); Partner, Arthur Andersen LLP (1989 to 2002); Consultant to the MainStay Funds Audit and Compliance Committee (2004 to 2006) | 81 | MainStay Funds: Trustee since 2006 (11 Funds);
MainStay Funds Trust: Trustee since 2007 (37 Funds)***;
MainStay MacKay DefinedTerm Municipal Opportunities Fund: Trustee since 2011; and
MainStay CBRE Global Infrastructure Megatrends Term Fund: Trustee since June 2021 |
| | Jacques P. Perold
1958 | MainStay VP Funds Trust: Trustee since January 2016, Advisory Board Member (June 2015 to December 2015) | Founder and Chief Executive Officer, CapShift Advisors LLC (since 2018); President, Fidelity Management & Research Company (2009 to 2014); President and Chief Investment Officer, Geode Capital Management, LLC (2001 to 2009) | 81 | MainStay Funds: Trustee since January 2016, Advisory Board Member (June 2015 to December 2015) (11 Funds);
MainStay Funds Trust: Trustee since January 2016, Advisory Board Member (June 2015 to December 2015) (37 Funds);
MainStay MacKay DefinedTerm Municipal Opportunities Fund: Trustee since January 2016, Advisory Board Member (June 2015 to December 2015);
MainStay CBRE Global Infrastructure Megatrends Term Fund: Trustee since June 2021;
Allstate Corporation: Director since 2015;
Partners in Health: Trustee since 2019; and
MSCI Inc.: Director since 2017 |
| | Richard S. Trutanic
1952 | MainStay VP Funds Trust: Trustee since 2007** | Chairman and Chief Executive Officer, Somerset & Company (financial advisory firm) since 2004; Managing Director, The Carlyle Group (private investment firm) (2002 to 2004); Senior Managing Director, Partner and Board Member, Groupe Arnault S.A. (private investment firm) (1999 to 2002) | 81 | MainStay Funds: Trustee since 1994 (11 Funds);
MainStay Funds Trust: Trustee since 2007 (37 Funds)***;
MainStay MacKay DefinedTerm Municipal Opportunities Fund: Trustee since 2011; and
MainStay CBRE Global Infrastructure Megatrends Term Fund: Trustee since June 2021 |
| ** | Includes prior service as a Director of MainStay VP Series Fund, Inc., the predecessor to MainStay VP Funds Trust. |
| *** | Includes prior service as a Director/Trustee of certain predecessor entities to MainStay Funds Trust. |
Board of Trustees and Officers (Unaudited) (continued)
| | Name and
Year of Birth | Position(s) Held and
Length of Service | Principal Occupation(s)
During Past Five Years | |
| | | | | |
| | Kirk C. Lehneis
1974 | President, MainStay VP Funds Trust (since 2017) | Chief Operating Officer and Senior Managing Director (since 2016), New York Life Investment Management LLC and New York Life Investment Management Holdings LLC; Member of the Board of Managers (since 2017) and Senior Managing Director (since 2018), NYLIFE Distributors LLC; Chairman of the Board and Senior Managing Director, NYLIM Service Company LLC (since 2017); Trustee, President and Principal Executive Officer of IndexIQ Trust, IndexIQ ETF Trust and IndexIQ Active ETF Trust (since 2018); President, MainStay CBRE Global Infrastructure Megatrends Term Fund (since 2021), MainStay MacKay DefinedTerm Municipal Opportunities Fund, MainStay Funds and MainStay Funds Trust (since 2017); Senior Managing Director, Global Product Development (from 2015 to 2016); Managing Director, Product Development (from 2010 to 2015), New York Life Investment Management LLC | |
| | Jack R. Benintende
1964 | Treasurer and Principal Financial and Accounting Officer, MainStay VP Funds Trust (since 2007)** | Managing Director, New York Life Investment Management LLC (since 2007); Treasurer and Principal Financial and Accounting Officer, MainStay CBRE Global Infrastructure Megatrends Term Fund (since 2021), MainStay MacKay DefinedTerm Municipal Opportunities Fund (since 2011), MainStay Funds Trust (since 2009) and MainStay Funds (since 2007); and Assistant Treasurer, New York Life Investment Management Holdings LLC (2008 to 2012) | |
| | J. Kevin Gao
1967 | Secretary and Chief Legal Officer, MainStay VP Funds Trust (since 2010)** | Managing Director and Associate General Counsel, New York Life Investment Management LLC (since 2010); Secretary and Chief Legal Officer, MainStay CBRE Global Infrastructure Megatrends Term Fund (since 2021), MainStay MacKay DefinedTerm Municipal Opportunities Fund (since 2011), MainStay Funds and MainStay Funds Trust (since 2010) | |
| | Kevin M. Gleason
1967 | Vice President and Chief Compliance Officer, MainStay VP Funds Trust (since June 2022) | Vice President and Chief Compliance Officer, IndexIQ Trust, IndexIQ ETF Trust and IndexIQ Active ETF Trust (since June 2022); Vice President and Chief Compliance Officer, MainStay CBRE Global Infrastructure Megatrends Term Fund, MainStay MacKay DefinedTerm Municipal Opportunities Fund (since June 2022); MainStay Funds Trust and MainStay Funds (since June 2022); Senior Vice President, Voya Investment Management and Chief Compliance Officer, Voya Family of Funds (2012 to 2022) | |
| | Scott T. Harrington
1959 | Vice President— Administration, MainStay VP Funds Trust (since 2005)** | Managing Director, New York Life Investment Management LLC (including predecessor advisory organizations) (since 2000); Member of the Board of Directors, New York Life Trust Company (since 2009); Vice President—Administration, MainStay CBRE Global Infrastructure Megatrends Term Fund (since 2021), MainStay MacKay DefinedTerm Municipal Opportunities Fund (since 2011), MainStay Funds Trust and MainStay Funds (since 2009) | |
| * | The officers listed above are considered to be “interested persons” of the MainStay Group of Funds, MainStay VP Funds Trust, MainStay CBRE Global Infrastructure Megatrends Term Fund and MainStay MacKay DefinedTerm Municipal Opportunities Fund within the meaning of the 1940 Act because of their affiliation with the MainStay Group of Funds, New York Life Insurance Company and/or its affiliates, including New York Life Investment Management LLC, New York Life Insurance Company, NYLIM Service Company LLC, NYLIFE Securities LLC and/or NYLIFE Distributors LLC, as described in detail in the column captioned “Principal Occupation(s) During Past Five Years.” Officers are elected annually by the Board. |
| ** | Includes prior service as an Officer of MainStay VP Series Fund, Inc., the predecessor to MainStay VP Funds Trust. |
Officers of the Trust (Who are not Trustees)*
| 32 | MainStay VP Wellington U.S. Equity Portfolio |
This page intentionally left blank.
This page intentionally left blank.
MainStay VP Portfolios
MainStay VP offers a wide range of Portfolios. The full array of MainStay VP offerings is listed here, with information about the manager, subadvisors, legal counsel, and independent registered public accounting firm.
Equity
MainStay VP American Century Sustainable Equity Portfolio
MainStay VP Candriam Emerging Markets Equity Portfolio
MainStay VP Epoch U.S. Equity Yield Portfolio
MainStay VP Fidelity Institutional AM® Utilities Portfolio†
MainStay VP Natural Resources Portfolio
MainStay VP PineStone International Equity Portfolio1
MainStay VP S&P 500 Index Portfolio
MainStay VP Small Cap Growth Portfolio
MainStay VP Wellington Growth Portfolio
MainStay VP Wellington Mid Cap Portfolio
MainStay VP Wellington Small Cap Portfolio
MainStay VP Wellington U.S. Equity Portfolio
MainStay VP Winslow Large Cap Growth Portfolio
Mixed Asset
MainStay VP Balanced Portfolio
MainStay VP Income Builder Portfolio
MainStay VP Janus Henderson Balanced Portfolio
MainStay VP MacKay Convertible Portfolio
Income
MainStay VP Bond Portfolio
MainStay VP Floating Rate Portfolio
MainStay VP Indexed Bond Portfolio
MainStay VP MacKay Government Portfolio2
MainStay VP MacKay High Yield Corporate Bond Portfolio
MainStay VP MacKay Strategic Bond Portfolio
MainStay VP PIMCO Real Return Portfolio
Money Market
MainStay VP U.S. Government Money Market Portfolio
Alternative
MainStay VP CBRE Global Infrastructure Portfolio
MainStay VP IQ Hedge Multi-Strategy Portfolio
Asset Allocation
MainStay VP Conservative Allocation Portfolio
MainStay VP Equity Allocation Portfolio
MainStay VP Growth Allocation Portfolio
MainStay VP Moderate Allocation Portfolio
Manager
New York Life Investment Management LLC
New York, New York
Subadvisors
American Century Investment Management, Inc.
Kansas City, Missouri
Brown Advisory LLC
Baltimore, Maryland
Candriam*
Strassen, Luxembourg
CBRE Investment Management Listed Real Assets LLC
Radnor, Pennsylvania
Epoch Investment Partners, Inc.
New York, New York
FIAM LLC
Smithfield, Rhode Island
IndexIQ Advisors LLC*
New York, New York
Janus Henderson Investors US LLC
Denver, Colorado
MacKay Shields LLC*
New York, New York
Newton Investment Management North America, LLC
Boston, Massachusetts
NYL Investors LLC*
New York, New York
Pacific Investment Management Company LLC
Newport Beach, California
PineStone Asset Management Inc.
Montreal, Québec
Segall Bryant & Hamill, LLC
Chicago, Illinois
Wellington Management Company LLP
Boston, Massachusetts
Winslow Capital Management, LLC
Minneapolis, Minnesota
Legal Counsel
Dechert LLP
Washington, District of Columbia
Independent Registered Public Accounting Firm
PricewaterhouseCoopers LLP
New York, New York
Distributor
NYLIFE Distributors LLC*
Jersey City, New Jersey
Custodian
JPMorgan Chase Bank, N.A.
New York, New York
Some Portfolios may not be available in all products.
† Fidelity Institutional AM is a registered trade mark of FMR LLC. Used with permission.
* An affiliate of New York Life Investment Management LLC.
| 1. | Prior to August 28, 2023, the Portfolio's name was MainStay VP MacKay International Equity Portfolio. |
| 2. | Effective on or about May 1, 2024, the MainStay VP MacKay Government Portfolio will be renamed the MainStay VP U.S. Infrastructure Bond Portfolio. |
Not part of the Annual Report
2023 Annual Report
This report is for the general information of New York Life Variable Annuities and NYLIAC Variable Universal Life Insurance Products policyowners. It must be preceded or accompanied by the appropriate product(s) and funds prospectuses if it is given to anyone who is not an owner of a New York Life variable annuity policy or a NYLIAC Variable Universal Life Insurance Product. This report does not offer for sale or solicit orders to purchase securities.
The performance data quoted in this report represents past performance. Past performance is no guarantee of future results. Due to market volatility and other factors, current performance may be lower or higher than the figures shown. The most recent month-end performance summary for your variable annuity or variable life policy is available by calling 800-598-2019 and is updated periodically on newyorklife.com.
The New York Life Variable Annuities and NYLIAC Variable Universal Life Insurance Products are issued by New York Life Insurance and Annuity Corporation (a Delaware Corporation) and distributed by NYLIFE Distributors LLC (Member FINRA/SIPC).
New York Life Insurance Company
New York Life Insurance and Annuity
Corporation (NYLIAC) (A Delaware Corporation)
51 Madison Avenue, Room 551
New York, NY 10010
newyorklife.com
newyorklifeinvestments.com
NYLIFE Distributors LLC, 30 Hudson Street, Jersey City, NJ 07302
New York Life Investment Management LLC is the investment manager to the MainStay VP Funds Trust
©2024 by NYLIFE Distributors LLC. All rights reserved.
You may obtain copies of the Prospectus and the Statement of Additional Information free of charge, upon request, by calling toll-free 800-598-2019 or writing to New York Life Insurance and Annuity Corporation, 51 Madison Avenue, New York, NY 10010.
| Not FDIC Insured | No Bank Guarantee | May Lose Value |
(NYLIAC) NI511
MainStay VP Small Cap Growth Portfolio
Message from the President and Annual Report
December 31, 2023
Special Notice:
Beginning in July 2024, new regulations issued by the Securities and Exchange Commission (SEC) will take effect requiring open-end mutual fund companies and ETFs to (1) overhaul the content of their shareholder reports and (2) mail paper copies of the new tailored shareholder reports to shareholders who have not opted to receive these documents electronically.
If you have not yet elected to receive your shareholder reports electronically, please contact your financial intermediary or visit our website.
| Not FDIC/NCUA Insured | Not a Deposit | May Lose Value | No Bank Guarantee | Not Insured by Any Government Agency |
This page intentionally left blank
Message from the President
Against a backdrop of easing inflationary pressures and continued economic growth, stocks and bonds generally gained ground during the 12-month period ended December 31, 2023, despite high levels of volatility and sharp disparities between the performance of the different market sectors.
Although the war in Ukraine, the outbreak of hostilities in the Middle East and several other notable events affected financial assets, inflation, interest rate, and economic growth trends stood at the forefront of market developments during most of the period. As the reporting period began, high levels of inflation already showed signs of easing in the face of aggressive rate hikes by U.S. Federal Reserve (the “Fed”). From a peak of 9.1% in June 2022, the annualized U.S. inflation rate dropped to 6.4% in January, and 3.4% in December 2023. At the same time, the Fed increased the benchmark federal funds rate from 4.25%–4.50% at the beginning of reporting period, to 5.25%–5.50% as of the end of 2023. Despite the increasing cost of capital and tighter lending environment that resulted from rising rates, economic growth remained surprisingly robust, bolstered by high levels of consumer spending, low levels of unemployment and better-than-expected corporate earnings. With the pace of rate increases slowing from the prior year, investors began hoping for an early shift to a looser monetary policy, with stock prices and bond yields reacting as economic data and statements from the Fed either reinforced or undercut those hopes. Following months of hawkish rhetoric, the Fed finally reversed its stance in December 2023, signaling a positive economic outlook with little chance of a recession and a likelihood of rate cuts in 2024.
The S&P 500® Index, a widely regarded benchmark of U.S. market performance, produced strong gains during the reporting period-– recovering all its losses from 2022 and approached new record territory. A preponderance of the Index’s gains were generated by a relatively small number of mega-cap stocks in the information technology, communication services and consumer discretionary sectors that stood to benefit from rapid developments in generative artificial intelligence (“AI”). Value-oriented, interest-rate sensitive and small-capitalization
shares lagged by significant margins, although market strength widened during the closing weeks of the reporting period. Most overseas equity markets trailed the U.S. market, as developed international economies experienced relatively low growth rates, and weak economic conditions in China undermined emerging markets.
Bonds produced generally positive returns, bolstered by attractive and relatively stable yields. The yield on the 10-year Treasury note hit a high of just under 5% in mid-October 2023, ranging between approximately 3.5% and 4.8% for most of the reporting period. The yield curve remained inverted throughout the year, with the 2-year Treasury yield modestly above the 10-year yield. Corporate bond prices trended moderately higher, generally outperforming government securities. After years of low yields and tight credit spreads, the corporate sector benefited from more attractive valuations and income opportunities. Among corporates, markets generally rewarded longer duration and lower credit quality, although an uptick in default rates posed added risks for high-yield corporate bonds. International bond markets produced mixed returns, with emerging-markets issues advancing over their developed-markets counterparts.
The market volatility of recent years reminds us of the constant need for experienced and steadfast portfolio management in the face of uncertainty. New York Life Investments remains dedicated to providing you, as a valued MainStay VP investor, with the guidance, resources and investment solutions you need to pursue your financial goals.
Thank you for trusting us to help meet your investment needs.
Sincerely,
Kirk C. Lehneis
President
The opinions expressed are as of the date of this report and are subject to change. There is no guarantee that any forecast made will come to pass. This material does not constitute investment advice and is not intended as an endorsement of any specific investment. Past performance is no guarantee of future results.
Not part of the Annual Report
Investors should refer to the Portfolio’s Summary Prospectus and/or Prospectus and consider the Portfolio’s investment objectives, strategies, risks, charges and expenses carefully before investing. The Summary Prospectus and/or Prospectus contain this and other information about the Portfolio. You may obtain copies of the Portfolio’s Summary Prospectus, Prospectus and Statement of Additional Information, which includes information about the MainStay VP Funds Trust's Trustees, free of charge, upon request, by calling toll-free 800-598-2019, by writing to New York Life Insurance and Annuity Corporation, 51 Madison Avenue, Room 251, New York, New York 10010 or by sending an email to MainStayShareholdersServices@nylim.com. These documents are also available at newyorklifeinvestments.com/investment-products/vp. Please read the Portfolio's Summary Prospectus and/or Prospectus carefully before investing. MainStay VP Funds Trust portfolios are separate account options which are purchased through a variable insurance or variable annuity contract.
Investment and Performance Comparison (Unaudited)
Performance data quoted represents past performance. Past performance is no guarantee of future results. Because of market volatility and other factors, current performance may be lower or higher than the figures shown. Investment return and principal value will fluctuate, and as a result, when shares are redeemed, they may be worth more or less than their original cost. The performance table and graph do not reflect any deduction of sales charges, mortality and expense charges, contract charges or administrative charges. Please refer to the Performance Summary appropriate for your policy. For performance information current to the most recent month-end, please call 800-598-2019 or visit www.newyorklife.com.
Performance figures may reflect certain fee waivers and/or expense limitations, without which total returns may have been different. For information on current fee waivers and/or expense limitations (if any), please refer to the Notes to Financial Statements.
| Average Annual Total Returns for the Year-Ended December 31, 2023 |
| Class | Inception
Date1 | One
Year | Five
Years | Ten
Years | Gross
Expense
Ratio2 |
| Initial Class Shares | 2/17/2012 | 15.51% | 10.57% | 7.53% | 0.85% |
| Service Class Shares | 2/17/2012 | 15.22 | 10.29 | 7.26 | 1.10 |
| 1. | The Portfolio replaced its subadvisor and modified its principal investment strategies as of May 1, 2020. Therefore, the performance information shown in this report prior to May 1, 2020 reflects the Portfolio’s prior subadvisor and its principal investment strategies. |
| 2. | The gross expense ratios presented reflect the Portfolio’s “Total Annual Portfolio Operating Expenses” from the most recent Prospectus and may differ from other expense ratios disclosed in this report. |
| Benchmark Performance* | One
Year | Five
Years | Ten
Years |
| Russell 2000® Growth Index1 | 18.66% | 9.22% | 7.16% |
| Morningstar Small Growth Category Average2 | 16.68 | 10.99 | 8.09 |
| * | Returns for indices reflect no deductions for fees, expenses or taxes, except for foreign withholding taxes where applicable. Results assume reinvestment of all dividends and capital gains. An investment cannot be made directly in an index. |
| 1. | The Russell 2000® Growth Index is the Portfolio’s primary benchmark. The Russell 2000® Growth Index is a broad-based benchmark that measures the performance of the small-cap growth segment of the U.S. equity universe. It includes those Russell 2000® Index companies with higher price-to-book ratios and higher forecasted growth values. |
| 2. | The Morningstar Small Growth Category Average is representative of funds that focus on faster-growing companies whose shares are at the lower end of the market-capitalization range. These funds tend to favor companies in up-and-coming industries or young firms in their early growth stages. Results are based on average total returns of similar funds with all dividends and capital gain distributions reinvested. |
Cost in Dollars of a $1,000 Investment in MainStay VP Small Cap Growth Portfolio (Unaudited)
The example below is intended to describe the fees and expenses borne by shareholders during the six-month period from July 1, 2023 to December 31, 2023, and the impact of those costs on your investment.
Example
As a shareholder of the Portfolio you incur two types of costs: (1) transaction costs, including exchange fees and sales charges (loads) on purchases (as applicable), and (2) ongoing costs, including management fees, distribution and/or service (12b-1) fees and other Portfolio expenses (as applicable). This example is intended to help you understand your ongoing costs (in dollars) of investing in the Portfolio and to compare these costs with the ongoing costs of investing in other mutual funds. The example is based on an investment of $1,000 made at the beginning of the six-month period and held for the entire period from July 1, 2023 to December 31, 2023. Shares are only sold in connection with variable life and annuity contracts and the example does not reflect any contract level or transactional fees or expenses. If these costs had been included, your costs would have been higher.
This example illustrates your Portfolio’s ongoing costs in two ways:
Actual Expenses
The second and third data columns in the table below provide information about actual account values and actual expenses. You may use the information in these columns, together with the amount you invested, to estimate the expenses that you paid during the six months ended
December 31, 2023. Simply divide your account value by $1,000 (for example, an $8,600 account value divided by $1,000 = 8.6), then multiply the result by the number under the heading entitled “Expenses Paid During Period” to estimate the expenses you paid on your account during this period.
Hypothetical Example for Comparison Purposes
The fourth and fifth data columns in the table below provide information about hypothetical account values and hypothetical expenses based on the Portfolio’s actual expense ratio and an assumed rate of return of 5% per year before expenses, which is not the Portfolio’s actual return. The hypothetical account values and expenses may not be used to estimate the actual ending account balances or expenses you paid for the six-month period shown. You may use this information to compare the ongoing costs of investing in the Portfolio with the ongoing costs of investing in other mutual funds. To do so, compare this 5% hypothetical example with the 5% hypothetical examples that appear in the shareholder reports of the other mutual funds.
Please note that the expenses shown in the table are meant to highlight your ongoing costs only and do not reflect any transactional costs, such as exchange fees or sales charges (loads). Therefore, the fourth and fifth data columns of the table are useful in comparing ongoing costs only and will not help you determine the relative total costs of owning different funds. In addition, if these transactional costs were included, your costs would have been higher.
| Share Class | Beginning
Account
Value
7/1/23 | Ending Account
Value (Based
on Actual
Returns and
Expenses)
12/31/23 | Expenses
Paid
During
Period1 | Ending Account
Value (Based
on Hypothetical
5% Annualized
Return and
Actual Expenses)
12/31/23 | Expenses
Paid
During
Period1 | Net Expense
Ratio
During
Period2 |
| Initial Class Shares | $1,000.00 | $1,035.10 | $4.31 | $1,020.97 | $4.28 | 0.84% |
| Service Class Shares | $1,000.00 | $1,033.80 | $5.59 | $1,019.71 | $5.55 | 1.09% |
| 1. | Expenses are equal to the Portfolio’s annualized expense ratio of each class multiplied by the average account value over the period, divided by 365 and multiplied by 184 (to reflect the six-month period). The table above represents the actual expenses incurred during the six-month period. In addition to the fees and expenses which the Portfolio bears directly, it also indirectly bears a pro rata share of the fees and expenses of the underlying funds in which it invests. Such indirect expenses are not included in the above-reported expense figures. |
| 2. | Expenses are equal to the Portfolio's annualized expense ratio to reflect the six-month period. |
| 6 | MainStay VP Small Cap Growth Portfolio |
Industry Composition as of December 31, 2023 (Unaudited)
| Software | 10.4% |
| Health Care Providers & Services | 7.1 |
| Commercial Services & Supplies | 6.2 |
| Semiconductors & Semiconductor Equipment | 6.1 |
| Biotechnology | 5.9 |
| Health Care Equipment & Supplies | 5.8 |
| Capital Markets | 3.7 |
| Chemicals | 3.7 |
| Building Products | 3.6 |
| Energy Equipment & Services | 2.9 |
| Hotels, Restaurants & Leisure | 2.9 |
| Diversified Consumer Services | 2.8 |
| Life Sciences Tools & Services | 2.6 |
| Aerospace & Defense | 2.6 |
| Industrial REITs | 2.3 |
| Machinery | 2.3 |
| Electronic Equipment, Instruments & Components | 1.8 |
| Construction & Engineering | 1.7 |
| IT Services | 1.6 |
| Insurance | 1.6 |
| Professional Services | 1.5 |
| Trading Companies & Distributors | 1.4 |
| Oil, Gas & Consumable Fuels | 1.4 |
| Banks | 1.3 |
| Interactive Media & Services | 1.2% |
| Consumer Staples Distribution & Retail | 1.1 |
| Food Products | 1.0 |
| Exchange–Traded Fund | 1.0 |
| Health Care Technology | 0.9 |
| Ground Transportation | 0.9 |
| Household Durables | 0.8 |
| Media | 0.8 |
| Financial Services | 0.8 |
| Diversified Telecommunication Services | 0.7 |
| Personal Care Products | 0.7 |
| Electrical Equipment | 0.7 |
| Specialty Retail | 0.6 |
| Entertainment | 0.5 |
| Communications Equipment | 0.5 |
| Metals & Mining | 0.4 |
| Real Estate Management & Development | 0.3 |
| Leisure Products | 0.2 |
| Automobile Components | 0.1 |
| Pharmaceuticals | 0.1 |
| Short–Term Investments | 6.1 |
| Other Assets, Less Liabilities | –2.6 |
| | 100.0% |
See Portfolio of Investments beginning on page 11 for specific holdings within these categories. The Portfolio's holdings are subject to change.
Top Ten Holdings and/or Issuers Held as of December 31, 2023 (excluding short-term investments) (Unaudited)
| 1. | Bright Horizons Family Solutions, Inc. |
| 2. | Workiva, Inc. |
| 3. | Waste Connections, Inc. |
| 4. | Churchill Downs, Inc. |
| 5. | BlackLine, Inc. |
| 6. | Casella Waste Systems, Inc., Class A |
| 7. | Houlihan Lokey, Inc. |
| 8. | SiteOne Landscape Supply, Inc. |
| 9. | AZEK Co., Inc. (The) |
| 10. | Inari Medical, Inc. |
Portfolio Management Discussion and Analysis (Unaudited)
Answers to the questions reflect the views of Brian C. Fitzsimons, CFA, and Mitch S. Begun, CFA, of Segall Bryant & Hamill, LLC (“SBH”), one of the Portfolio’s Subadvisors, and Christopher A. Berrier and George Sakellaris, CFA, of Brown Advisory LLC (“Brown Advisory”), the Portfolio’s other Subadvisor.
How did MainStay VP Small Cap Growth Portfolio perform relative to its benchmark and peers during the 12 months ended December 31, 2023?
For the 12 months ended December 31, 2023, MainStay VP Small Cap Growth Portfolio returned 15.51% for Initial Class shares and 15.22% for Service Class shares. Over the same period, both share classes underperformed the 18.66% return of the Russell 2000® Growth Index (the “Index”), which is the Portfolio’s benchmark, and the 16.68% return of the Morningstar Small Growth Category Average.1
What factors affected the Portfolio’s relative performance during the reporting period?
SBH
The portion of the Portfolio subadvised by SBH outperformed the Index during the reporting period, primarily due to asset allocation, although this was partly offset by the negative impact of unfavorable stock selection. Given strong equity returns, the Portfolio’s cash allocation was a headwind to relative performance.
Brown Advisory
During the reporting period, the portion of the Portfolio subadvised by Brown Advisory underperformed the Index, with most of the underperformance occurring during the December market rally when strong asset inflows drove lower-capitalization and lower-quality stocks sharply higher. Our investment strategy has tended to lag during vigorous risk-on rallies, especially those driven by inflows and led by gains in lower quality stocks. However, these vertical rallies have tended to be short lived, and the returns of the Portfolio’s companies have tended to catch up over time.
Which sectors were the strongest positive contributors to the Portfolio’s relative performance, and which sectors were particularly weak?
SBH
Relative to the Index, the sectors that made the strongest positive contributions to the performance of the portion of the Portfolio subadvised by SBH included financials, industrials and energy. (Contributions take weightings and total returns into account.) Conversely, the health care, information technology and consumer staples sectors detracted most from relative performance. All sectors produced positive returns during the reporting period.
Brown Advisory
The sectors making the strongest contributions to the relative performance of the portion of the Portfolio subadvised by Brown Advisory were communication services, and materials, followed by real estate and utilities—which had equally positive contributions. Within each of these sectors, favorable stock selection generated most of the strong positive performance relative to the Index, with the exception of utilities, where lack of exposure proved beneficial.
The three weakest contributing sectors included industrials, information technology and financials. The equity buying binge prompted by anticipated rate cuts powered cyclical areas higher. The Portfolio’s underweight exposure to heavily cyclical (and/or higher beta2) issues across the industrials and information technology sectors was responsible for the weak relative performance.
During the reporting period, which individual stocks made the strongest positive contributions to the Portfolio’s absolute performance and which stocks detracted the most?
SBH
The three strongest performing holdings in the portion of the Portfolio subadvised by SBH included semiconductor equipment company Onto Innovation, trucking company Saia and construction component manufacturer Simpson Manufacturing. Onto Innovation’s financial results demonstrated continuing resilience versus the company’s peers, with strong cash flow generation. The stock also benefited from its inspection tool wins used in artificial intelligence (“AI”) chip manufacturing. Saia outperformed—despite a slowdown in overall industry volumes—executing well on its internal initiatives to drive sustained growth, including improved service pricing and further network expansion. Additionally, competitor Yellow announced it was filing for bankruptcy, which tightened supply/demand dynamics and provided incremental market share opportunities for Saia. Simpson continued to see margin expansion from strong volume growth, coupled with declining raw material (steel) costs. Despite the prevailing high-rate environment and concerns over a weaker residential construction market, Simpson continued to outgrow the market and execute on internal operating improvements. All three of these stocks remained in the Portfolio as of the end of 2023, although all three were also trimmed during the year following strong performance.
Other noteworthy positive contributors to absolute performance included private market investment solutions provider Hamilton Lane and mechanical and electrical contracting services company Comfort Systems USA. Hamilton Lane continued to gain market share with additional distribution partnerships for its private
| 1. | See "Investment and Performance Comparison" for more information on benchmark and peer group returns. |
| 2. | Beta is a measure of volatility in relation to the market as a whole. A beta higher than 1 indicates that a security or portfolio will tend to exhibit higher volatility than the market. A beta lower than 1 indicates that a security or portfolio will tend to exhibit lower volatility than the market. |
| 8 | MainStay VP Small Cap Growth Portfolio |
wealth platform, along with further strength in customized separate accounts and specialized funds. Comfort Systems continued to experience strong demand for its heating, ventilation, air conditioning and electrical services, leading to improved volumes and profitability. Expansion in the company’s backlog, highlighting broad-based strength in demand, provided improved visibility for 2024. Both positions remained in the Portfolio at year-end; however, we trimmed the Portfolio’s exposure to Comfort Systems in the fourth quarter.
The stocks that detracted most from absolute performance included neurovascular disease medical device manufacturer Silk Road Medical, biologics manufacturer Avid Bioservices, and energy services provider and renewables asset developer Ameresco. Silk Road Medical struggled from disruptions in its sales organization that negatively impacted growth. The company also faced increased competitive headwinds from alternative procedures, leading to a more uncertain demand outlook, and ultimately resulting in our decision to sell the Portfolio’s position. Avid Bioservices underperformed due to the more challenging financing environment and more conservative spending decisions by its biopharmaceutical customer base, and we exited the Portfolio’s position. Ameresco suffered from project-specific issues caused by supply-chain delays and permitting bottlenecks that were further exacerbated by unplanned downtime due to labor availability and unfavorable weather. Despite concerns that a higher interest rate environment could impact its development pipeline, we continued to maintain the Portfolio’s position, as Ameresco's backlog of both energy projects and energy assets continued to grow.
Other noteworthy detractors from total returns included diagnostic imaging and nuclear medicine products company Lantheus Holdings, and maker of premium suspensions for automobiles and bicycles Fox Factory Holding. Concerns over competitive pressures on Lantheus’ prostate cancer imaging products, combined with a disappointing outcome on its novel prostate cancer treatment study, led to the stock’s underperformance. The Portfolio continued to hold a position in Lantheus. Fox Factory reported disappointing third quarter 2023 results and issued underwhelming guidance regarding its core segments. In addition, the company’s sizeable acquisition of Marucci Sports, a leading provider of baseball-related products, raised concerns regarding management’s focus on the company’s core business and growth prospects. Accordingly, the Portfolio exited the position.
Brown Advisory
The three strongest performing holdings in the portion of the Portfolio subadvised by Brown Advisory included childcare and educational services provider Bright Horizons Family Solutions, genetic and molecular testing services provider NeoGenomics, and microelectronics materials manufacturer Entegris. Bright Horizons shares gained ground as the company overcame pandemic-related difficulties with staffing and inflation, leading to
improved results and a more positive outlook. NeoGenomics reported strong third quarter 2023 results, with better-than-expected revenue growth, and profitability driven by continued share gains and operating cost leverage. Furthermore, management spoke to accelerating margin expansion in 2024. Entegris shares rose based on improved financial results as the company shed non-core businesses to pay down debt.
The positions that detracted most from absolute performance included women’s health company Establishment Labs Holdings, business process management and outsourcing company Genpact and multi-line industrial company Valmont Industries. Establishment Labs experienced a product approval delay in China and a degradation in market demand, particularly in Europe, which forced channel inventory to correct. Our original investment thesis hinged on U.S. product approval, which we believe is a likely 2024 event. Genpact shares suffered as a result of fears that advancements in generative AI would harm the company’s long-term growth. While we had sold a significant portion of the Portfolio’s position at attractive prices, the subsequent share price decline proved to be a drag on overall results. Shares in Valmont Industries declined on faltering demand in agricultural markets and lack of uptake in certain new products.
Did the Portfolio make any significant purchases or sales during the reporting period?
SBH
Significant new purchases during the reporting period included positions in pharmaceutical company Alkermes and logistics software provider The Descartes Systems Group. We believe that Alkermes has an attractive growth opportunity with its oral treatment for adults with schizophrenia or bipolar disorder, along with a pipeline of other promising therapies in development. Descartes has a strong competitive moat with its global logistics network and highly recurring cash flow, and it is benefiting from the digitization and automation of supply chains globally.
Significant sales included positions in equipment marketplace RB Global and government outsourced services player Maximus. We sold the Portfolio’s position in RB Global over concerns regarding management turnover, increased leverage and integration risk related to the company’s large acquisition of IAA, a leading provider of salvage vehicle auctions. Maximus shares rebounded after many of its government services programs ramped up; however, we exited the position over concerns that growth may prove more challenging going forward.
Brown Advisory
Although turnover remained low, our opportunistic approach led to a high degree of productivity as we added 14 new positions to the portion of the Portfolio subadvised by Brown Advisory, largely related to several historical and 2023 merger-and-acquisition-driven exits. Although we strive to size all the Portfolio’s new
investments to within their targeted range as soon as possible, many of these 14 remain below our ultimate intended weight, primarily as a result of market gyrations.
Significant purchases during the reporting period included positions in travel identification services company Clear Secure, aerospace and defense equipment maker Curtiss-Wright, and financial software provider CCC Intelligent Solutions Holdings. Clear Secure provides identity, age verification and other services that remove friction in travel for customers and partners. We see a long runway for growth from low single-digit penetration of their core markets, along with other ancillary opportunities. Despite growing at elevated levels, the company manages to generate free cash flow, providing a constructive long-term valuation framework. We believe Curtiss-Wright’s expanded and expanding portfolio of products should drive premium growth and margins relative to peers, possibly leading to multiple expansion. CCC sells the leading suite of software used by auto insurers and repair shops to estimate claims costs. Over 80% of the company’s revenue comes from very sticky subscriptions, and increasingly management is monetizing its strategic position in the ecosystem by facilitating greater automation. In our opinion, this could lead to consistent 7–10% organic top-line growth from cross/up sales and power up to 50-100 basis points of margin expansion per year. (A basis point is one one-hundredth of a percentage point.)
Significant sales included positions in online travel company MakeMyTrip Limited, global payment processor EVO Payments and specialty retailer Leslie’s. MakeMyTrip shares performed well on a relative basis due to strong pent-up travel demand. We sold the Portfolio’s position based on concerns that recent positive trends may not persist in the face of ongoing competitive pressures. EVO Payments was eliminated from the Portfolio when the company was acquired. Leslie’s reported disappointing results, prompting us to question management’s execution and raising the possibility of a meaningful industry change. As a result, we sold the Portfolio’s position.
How did the Portfolio’s sector weightings change during the reporting period?
SBH
The portion of the Portfolio subadvised by SBH saw its largest sector increases relative to the Index in the energy and financials sectors. The most significant decreases relative to the Index occurred in information technology and consumer discretionary. Changes in relative weightings were a function of stock-specific considerations.
Brown Advisory
Relative to the Index, the portion of the Portfolio subadvised by Brown Advisory further increased the magnitude of its overweight exposure to the communication services sector, partly due to solid individual stock performance. The Portfolio’s financials sector weighting also increased, reducing the scale of its underweight relative to the Index. Conversely, the Portfolio’s weighting in the consumer discretionary sector decreased relative to the Index. We expect the Portfolio to maintain underweight exposure to the consumer discretionary sector for the foreseeable future, given our cautious view of the consumer’s ability to continue to spend at recent, historically high levels. Exposure to information technology also decreased relative to the Index, although the Portfolio’s absolute weight in the sector increased off its lows with the addition of new holdings.
How was the Portfolio positioned at the end of the reporting period?
SBH
As of December 31, 2023, the portion of the Portfolio subadvised by SBH held overweight exposure, relative to the Index, primarily in the financials and industrials sectors, and underweight exposure primarily in consumer discretionary and consumer staples.
Brown Advisory
As of December 31, 2023, the portion of the Portfolio subadvised by Brown Advisory held overweight positions relative to the Index in the health care, communication services and industrials sector. As of the same date, the Portfolio held underweight exposure to the consumer discretionary, information technology and utilities sectors. The Portfolio continues to have no exposure to the utilities sector.
The opinions expressed are those of the portfolio managers as of the date of this report and are subject to change. There is no guarantee that any forecasts will come to pass. This material does not constitute investment advice and is not intended as an endorsement of any specific investment.
Not all MainStay VP Portfolios and/or share classes are available under all policies.
| 10 | MainStay VP Small Cap Growth Portfolio |
Portfolio of Investments December 31, 2023†^
| | Shares | Value |
| Common Stocks 95.5% |
| Aerospace & Defense 2.6% |
| Curtiss-Wright Corp. | 10,970 | $ 2,444,006 |
| Hexcel Corp. | 56,917 | 4,197,629 |
| Kratos Defense & Security Solutions, Inc. (a) | 112,005 | 2,272,582 |
| Woodward, Inc. | 18,708 | 2,546,720 |
| | | 11,460,937 |
| Automobile Components 0.1% |
| XPEL, Inc. (a) | 8,922 | 480,450 |
| Banks 1.3% |
| Prosperity Bancshares, Inc. | 81,224 | 5,501,302 |
| Biotechnology 5.9% |
| Alkermes plc (a) | 124,066 | 3,441,591 |
| Ascendis Pharma A/S, ADR (a) | 14,341 | 1,806,249 |
| Blueprint Medicines Corp. (a) | 60,974 | 5,624,242 |
| Karuna Therapeutics, Inc. (a) | 10,609 | 3,357,854 |
| Natera, Inc. (a) | 45,819 | 2,870,102 |
| Neurocrine Biosciences, Inc. (a) | 34,464 | 4,540,977 |
| Vaxcyte, Inc. (a) | 51,262 | 3,219,254 |
| Xencor, Inc. (a) | 50,132 | 1,064,302 |
| | | 25,924,571 |
| Building Products 3.6% |
| AAON, Inc. | 31,066 | 2,294,845 |
| AZEK Co., Inc. (The) (a) | 151,206 | 5,783,629 |
| Simpson Manufacturing Co., Inc. | 15,617 | 3,091,854 |
| Trex Co., Inc. (a) | 26,377 | 2,183,752 |
| Zurn Elkay Water Solutions Corp. | 92,490 | 2,720,131 |
| | | 16,074,211 |
| Capital Markets 3.7% |
| Evercore, Inc., Class A | 11,857 | 2,028,140 |
| Hamilton Lane, Inc., Class A | 44,840 | 5,086,650 |
| Houlihan Lokey, Inc. | 52,538 | 6,299,832 |
| StepStone Group, Inc., Class A | 90,244 | 2,872,466 |
| | | 16,287,088 |
| Chemicals 3.7% |
| Avient Corp. | 57,520 | 2,391,106 |
| HB Fuller Co. | 52,851 | 4,302,600 |
| Innospec, Inc. | 27,766 | 3,421,882 |
| Livent Corp. (a)(b) | 114,616 | 2,060,796 |
| Quaker Chemical Corp. | 18,906 | 4,034,918 |
| | | 16,211,302 |
| | Shares | Value |
| |
| Commercial Services & Supplies 6.2% |
| Casella Waste Systems, Inc., Class A (a) | 73,749 | $ 6,302,590 |
| Montrose Environmental Group, Inc. (a) | 59,379 | 1,907,847 |
| MSA Safety, Inc. | 20,734 | 3,500,521 |
| Rentokil Initial plc, Sponsored ADR | 99,666 | 2,851,444 |
| Tetra Tech, Inc. | 33,876 | 5,654,921 |
| Waste Connections, Inc. | 48,759 | 7,278,256 |
| | | 27,495,579 |
| Communications Equipment 0.5% |
| Infinera Corp. (a)(b) | 435,476 | 2,068,511 |
| Construction & Engineering 1.7% |
| Ameresco, Inc., Class A (a)(b) | 50,047 | 1,584,988 |
| Comfort Systems USA, Inc. | 16,661 | 3,426,668 |
| Valmont Industries, Inc. | 10,762 | 2,513,035 |
| | | 7,524,691 |
| Consumer Staples Distribution & Retail 1.1% |
| Casey's General Stores, Inc. | 18,263 | 5,017,577 |
| Diversified Consumer Services 2.8% |
| Bright Horizons Family Solutions, Inc. (a) | 93,873 | 8,846,591 |
| Mister Car Wash, Inc. (a)(b) | 416,115 | 3,595,234 |
| | | 12,441,825 |
| Diversified Telecommunication Services 0.7% |
| Cogent Communications Holdings, Inc. | 42,328 | 3,219,468 |
| Electrical Equipment 0.7% |
| Atkore, Inc. (a) | 19,181 | 3,068,960 |
| Electronic Equipment, Instruments & Components 1.8% |
| Littelfuse, Inc. | 10,262 | 2,745,701 |
| Novanta, Inc. (a) | 31,564 | 5,315,693 |
| | | 8,061,394 |
| Energy Equipment & Services 2.9% |
| Cactus, Inc., Class A | 107,108 | 4,862,703 |
| ChampionX Corp. | 144,236 | 4,213,133 |
| TechnipFMC plc | 189,683 | 3,820,216 |
| | | 12,896,052 |
| Entertainment 0.5% |
| Take-Two Interactive Software, Inc. (a) | 14,357 | 2,310,759 |
| Financial Services 0.8% |
| WEX, Inc. (a) | 17,650 | 3,433,808 |
The notes to the financial statements are an integral part of, and should be read in conjunction with, the financial statements.
11
Portfolio of Investments December 31, 2023†^ (continued)
| | Shares | Value |
| Common Stocks (continued) |
| Food Products 1.0% |
| Simply Good Foods Co. (The) (a) | 115,429 | $ 4,570,988 |
| Ground Transportation 0.9% |
| Knight-Swift Transportation Holdings, Inc. | 16,955 | 977,456 |
| Saia, Inc. (a) | 6,834 | 2,994,795 |
| | | 3,972,251 |
| Health Care Equipment & Supplies 5.8% |
| CONMED Corp. | 24,868 | 2,723,295 |
| Establishment Labs Holdings, Inc. (a)(b) | 76,353 | 1,976,779 |
| Glaukos Corp. (a) | 28,207 | 2,242,174 |
| Globus Medical, Inc., Class A (a) | 35,338 | 1,883,162 |
| Inari Medical, Inc. (a) | 87,591 | 5,686,408 |
| Integra LifeSciences Holdings Corp. (a) | 40,337 | 1,756,676 |
| Lantheus Holdings, Inc. (a) | 41,252 | 2,557,624 |
| OrthoPediatrics Corp. (a) | 52,493 | 1,706,547 |
| SI-BONE, Inc. (a) | 131,917 | 2,768,938 |
| TransMedics Group, Inc. (a) | 29,963 | 2,364,980 |
| | | 25,666,583 |
| Health Care Providers & Services 7.1% |
| Accolade, Inc. (a) | 188,512 | 2,264,029 |
| Addus HomeCare Corp. (a) | 33,546 | 3,114,746 |
| agilon health, Inc. (a) | 134,770 | 1,691,363 |
| Alignment Healthcare, Inc. (a) | 116,860 | 1,006,165 |
| Encompass Health Corp. | 55,278 | 3,688,148 |
| Ensign Group, Inc. (The) | 42,025 | 4,715,625 |
| HealthEquity, Inc. (a) | 51,672 | 3,425,854 |
| LifeStance Health Group, Inc. (a)(b) | 147,974 | 1,158,636 |
| NeoGenomics, Inc. (a) | 290,298 | 4,697,022 |
| Option Care Health, Inc. (a) | 95,264 | 3,209,444 |
| Surgery Partners, Inc. (a)(b) | 81,544 | 2,608,593 |
| | | 31,579,625 |
| Health Care Technology 0.9% |
| Definitive Healthcare Corp. (a) | 122,760 | 1,220,234 |
| Phreesia, Inc. (a) | 123,979 | 2,870,114 |
| | | 4,090,348 |
| Hotels, Restaurants & Leisure 2.9% |
| Choice Hotels International, Inc. (b) | 5,047 | 571,825 |
| Churchill Downs, Inc. | 48,642 | 6,563,265 |
| First Watch Restaurant Group, Inc. (a) | 38,169 | 767,197 |
| Shake Shack, Inc., Class A (a) | 23,603 | 1,749,454 |
| Texas Roadhouse, Inc. | 24,646 | 3,012,481 |
| | | 12,664,222 |
| | Shares | Value |
| |
| Household Durables 0.8% |
| TopBuild Corp. (a) | 7,073 | $ 2,647,141 |
| Vizio Holding Corp., Class A (a) | 130,650 | 1,006,005 |
| | | 3,653,146 |
| Industrial REITs 2.3% |
| Americold Realty Trust, Inc. | 87,533 | 2,649,624 |
| EastGroup Properties, Inc. | 20,248 | 3,716,318 |
| Terreno Realty Corp. | 61,680 | 3,865,485 |
| | | 10,231,427 |
| Insurance 1.6% |
| Goosehead Insurance, Inc., Class A (a) | 26,831 | 2,033,790 |
| Kinsale Capital Group, Inc. | 7,810 | 2,615,647 |
| Selective Insurance Group, Inc. | 24,348 | 2,422,139 |
| | | 7,071,576 |
| Interactive Media & Services 1.2% |
| Pinterest, Inc., Class A (a) | 140,074 | 5,188,341 |
| IT Services 1.6% |
| Endava plc, Sponsored ADR (a) | 47,421 | 3,691,725 |
| Globant SA (a) | 14,682 | 3,494,022 |
| | | 7,185,747 |
| Leisure Products 0.2% |
| Clarus Corp. (b) | 151,928 | 1,047,544 |
| Life Sciences Tools & Services 2.6% |
| Azenta, Inc. (a) | 34,477 | 2,245,832 |
| Bio-Techne Corp. | 22,876 | 1,765,112 |
| Bruker Corp. | 52,583 | 3,863,799 |
| Medpace Holdings, Inc. (a) | 12,465 | 3,820,896 |
| | | 11,695,639 |
| Machinery 2.3% |
| Enpro, Inc. | 5,613 | 879,782 |
| IDEX Corp. | 5,529 | 1,200,401 |
| John Bean Technologies Corp. | 52,772 | 5,248,176 |
| Mueller Water Products, Inc., Class A | 106,813 | 1,538,107 |
| SPX Technologies, Inc. (a) | 10,912 | 1,102,221 |
| | | 9,968,687 |
| Media 0.8% |
| New York Times Co. (The), Class A | 74,352 | 3,642,504 |
| Metals & Mining 0.4% |
| Materion Corp. | 13,267 | 1,726,435 |
The notes to the financial statements are an integral part of, and should be read in conjunction with, the financial statements.
| 12 | MainStay VP Small Cap Growth Portfolio |
| | Shares | Value |
| Common Stocks (continued) |
| Oil, Gas & Consumable Fuels 1.4% |
| Matador Resources Co. | 63,057 | $ 3,585,421 |
| Range Resources Corp. | 77,550 | 2,360,622 |
| | | 5,946,043 |
| Personal Care Products 0.7% |
| BellRing Brands, Inc. (a) | 56,862 | 3,151,861 |
| Pharmaceuticals 0.1% |
| Arvinas, Inc. (a) | 8,788 | 361,714 |
| Professional Services 1.5% |
| CBIZ, Inc. (a) | 40,763 | 2,551,356 |
| FTI Consulting, Inc. (a) | 16,182 | 3,222,645 |
| Genpact Ltd. | 29,752 | 1,032,692 |
| | | 6,806,693 |
| Real Estate Management & Development 0.3% |
| DigitalBridge Group, Inc. | 76,031 | 1,333,584 |
| Semiconductors & Semiconductor Equipment 6.1% |
| Credo Technology Group Holding Ltd. (a) | 116,143 | 2,261,304 |
| Entegris, Inc. | 35,971 | 4,310,045 |
| Lattice Semiconductor Corp. (a) | 23,757 | 1,638,995 |
| MACOM Technology Solutions Holdings, Inc. (a) | 33,896 | 3,150,633 |
| Onto Innovation, Inc. (a) | 22,775 | 3,482,298 |
| PDF Solutions, Inc. (a) | 39,250 | 1,261,495 |
| Power Integrations, Inc. | 59,950 | 4,922,495 |
| Rambus, Inc. (a) | 42,904 | 2,928,198 |
| SiTime Corp. (a) | 24,090 | 2,940,907 |
| | | 26,896,370 |
| Software 10.4% |
| Bentley Systems, Inc., Class B | 33,728 | 1,759,927 |
| BlackLine, Inc. (a) | 101,570 | 6,342,031 |
| Box, Inc., Class A (a) | 124,733 | 3,194,412 |
| CCC Intelligent Solutions Holdings, Inc. (a) | 318,447 | 3,627,111 |
| Clear Secure, Inc., Class A | 100,983 | 2,085,299 |
| Clearwater Analytics Holdings, Inc., Class A (a) | 90,856 | 1,819,846 |
| Descartes Systems Group, Inc. (The) (a) | 42,637 | 3,584,066 |
| Dynatrace, Inc. (a) | 72,438 | 3,961,634 |
| Envestnet, Inc. (a) | 34,307 | 1,698,883 |
| Guidewire Software, Inc. (a) | 17,807 | 1,941,675 |
| Procore Technologies, Inc. (a) | 19,040 | 1,317,949 |
| PROS Holdings, Inc. (a) | 86,753 | 3,365,149 |
| | Shares | | Value |
| |
| Software (continued) |
| Sprout Social, Inc., Class A (a)(b) | 58,371 | | $ 3,586,314 |
| Workiva, Inc. (a) | 77,937 | | 7,912,944 |
| | | | 46,197,240 |
| Specialty Retail 0.6% |
| Boot Barn Holdings, Inc. (a) | 36,147 | | 2,774,644 |
| Trading Companies & Distributors 1.4% |
| SiteOne Landscape Supply, Inc. (a) | 37,243 | | 6,051,987 |
Total Common Stocks
(Cost $366,992,268) | | | 422,953,684 |
| Exchange-Traded Fund 1.0% |
| SPDR S&P Biotech ETF (b) | 51,897 | | 4,633,883 |
Total Exchange-Traded Fund
(Cost $4,186,124) | | | 4,633,883 |
| Short-Term Investments 6.1% |
| Affiliated Investment Company 3.8% |
| MainStay U.S. Government Liquidity Fund, 5.235% (c) | 16,935,730 | | 16,935,730 |
| Unaffiliated Investment Companies 2.3% |
| BlackRock Liquidity FedFund, 5.374% (c)(d) | 1,933,262 | | 1,933,262 |
| Dreyfus Treasury Obligations Cash Management Fund, 5.40% (c)(d) | 3,396,734 | | 3,396,734 |
| Fidelity Government Portfolio, 5.358% (c)(d) | 1,002,660 | | 1,002,660 |
| Invesco Government & Agency Portfolio, 5.361% (c)(d) | 3,545,371 | | 3,545,371 |
| | | | 9,878,027 |
Total Short-Term Investments
(Cost $26,813,757) | | | 26,813,757 |
Total Investments
(Cost $397,992,149) | 102.6% | | 454,401,324 |
| Other Assets, Less Liabilities | (2.6) | | (11,548,287) |
| Net Assets | 100.0% | | $ 442,853,037 |
| † | Percentages indicated are based on Portfolio net assets. |
| ^ | Industry classifications may be different than those used for compliance monitoring purposes. |
| (a) | Non-income producing security. |
The notes to the financial statements are an integral part of, and should be read in conjunction with, the financial statements.
13
Portfolio of Investments December 31, 2023†^ (continued)
| (b) | All or a portion of this security was held on loan. As of December 31, 2023, the aggregate market value of securities on loan was $15,814,638; the total market value of collateral held by the Portfolio was $16,689,470. The market value of the collateral held included non-cash collateral in the form of U.S. Treasury securities with a value of $6,811,443. The Portfolio received cash collateral with a value of $9,878,027. (See Note 2(G)) |
| (c) | Current yield as of December 31, 2023. |
| (d) | Represents a security purchased with cash collateral received for securities on loan. |
Investments in Affiliates (in 000's)
Investments in issuers considered to be affiliate(s) of the Portfolio during the year ended December 31, 2023 for purposes of Section 2(a)(3) of the Investment Company Act of 1940, as amended, were as follows:
| Affiliated Investment Companies | Value,
Beginning
of Year | Purchases
at Cost | Proceeds
from
Sales | Net
Realized
Gain/(Loss)
on Sales | Change in
Unrealized
Appreciation/
(Depreciation) | Value,
End of
Year | Dividend
Income | Other
Distributions | Shares
End of
Year |
| MainStay U.S. Government Liquidity Fund | $ 23,456 | $ 128,436 | $ (134,956) | $ — | $ — | $ 16,936 | $ 1,020 | $ — | 16,936 |
| Abbreviation(s): |
| ADR—American Depositary Receipt |
| ETF—Exchange-Traded Fund |
| REIT—Real Estate Investment Trust |
| SPDR—Standard & Poor’s Depositary Receipt |
The following is a summary of the fair valuations according to the inputs used as of December 31, 2023, for valuing the Portfolio’s assets:
| Description | Quoted
Prices in
Active
Markets for
Identical
Assets
(Level 1) | | Significant
Other
Observable
Inputs
(Level 2) | | Significant
Unobservable
Inputs
(Level 3) | | Total |
| Asset Valuation Inputs | | | | | | | |
| Investments in Securities (a) | | | | | | | |
| Common Stocks | $ 422,953,684 | | $ — | | $ — | | $ 422,953,684 |
| Exchange-Traded Fund | 4,633,883 | | — | | — | | 4,633,883 |
| Short-Term Investments | | | | | | | |
| Affiliated Investment Company | 16,935,730 | | — | | — | | 16,935,730 |
| Unaffiliated Investment Companies | 9,878,027 | | — | | — | | 9,878,027 |
| Total Short-Term Investments | 26,813,757 | | — | | — | | 26,813,757 |
| Total Investments in Securities | $ 454,401,324 | | $ — | | $ — | | $ 454,401,324 |
| (a) | For a complete listing of investments and their industries, see the Portfolio of Investments. |
The notes to the financial statements are an integral part of, and should be read in conjunction with, the financial statements.
| 14 | MainStay VP Small Cap Growth Portfolio |
Statement of Assets and Liabilities as of December 31, 2023
| Assets |
Investment in unaffiliated securities, at value
(identified cost $381,056,419) including securities on loan of $15,814,638 | $437,465,594 |
Investment in affiliated investment companies, at value
(identified cost $16,935,730) | 16,935,730 |
| Receivables: | |
| Dividends | 282,990 |
| Portfolio shares sold | 117,303 |
| Securities lending | 4,835 |
| Other assets | 2,625 |
| Total assets | 454,809,077 |
| Liabilities |
| Cash collateral received for securities on loan | 9,878,027 |
| Payables: | |
| Investment securities purchased | 1,491,274 |
| Manager (See Note 3) | 297,676 |
| Portfolio shares redeemed | 221,010 |
| Professional fees | 28,385 |
| NYLIFE Distributors (See Note 3) | 28,080 |
| Custodian | 10,194 |
| Shareholder communication | 986 |
| Accrued expenses | 408 |
| Total liabilities | 11,956,040 |
| Net assets | $442,853,037 |
| Composition of Net Assets |
| Shares of beneficial interest outstanding (par value of $.001 per share) unlimited number of shares authorized | $ 41,801 |
| Additional paid-in-capital | 389,495,226 |
| | 389,537,027 |
| Total distributable earnings (loss) | 53,316,010 |
| Net assets | $442,853,037 |
| Initial Class | |
| Net assets applicable to outstanding shares | $308,539,665 |
| Shares of beneficial interest outstanding | 28,625,221 |
| Net asset value per share outstanding | $ 10.78 |
| Service Class | |
| Net assets applicable to outstanding shares | $134,313,372 |
| Shares of beneficial interest outstanding | 13,175,395 |
| Net asset value per share outstanding | $ 10.19 |
The notes to the financial statements are an integral part of, and should be read in conjunction with, the financial statements.
15
Statement of Operations for the year ended December 31, 2023
| Investment Income (Loss) |
| Income | |
| Dividends-unaffiliated (net of foreign tax withholding of $29,091) | $ 2,015,071 |
| Dividends-affiliated | 1,020,361 |
| Securities lending, net | 113,681 |
| Total income | 3,149,113 |
| Expenses | |
| Manager (See Note 3) | 3,502,425 |
| Distribution/Service—Service Class (See Note 3) | 310,590 |
| Professional fees | 82,902 |
| Custodian | 24,479 |
| Trustees | 11,199 |
| Shareholder communication | 6,877 |
| Miscellaneous | 7,953 |
| Total expenses | 3,946,425 |
| Net investment income (loss) | (797,312) |
| Realized and Unrealized Gain (Loss) |
| Net realized gain (loss) on unaffiliated investments | (1,715,872) |
| Net change in unrealized appreciation (depreciation) on unaffiliated investments | 65,684,810 |
| Net realized and unrealized gain (loss) | 63,968,938 |
| Net increase (decrease) in net assets resulting from operations | $63,171,626 |
The notes to the financial statements are an integral part of, and should be read in conjunction with, the financial statements.
| 16 | MainStay VP Small Cap Growth Portfolio |
Statements of Changes in Net Assets
for the years ended December 31, 2023 and December 31, 2022
| | 2023 | 2022 |
| Increase (Decrease) in Net Assets |
| Operations: | | |
| Net investment income (loss) | $ (797,312) | $ (2,042,122) |
| Net realized gain (loss) | (1,715,872) | 964,390 |
| Net change in unrealized appreciation (depreciation) | 65,684,810 | (151,607,563) |
| Net increase (decrease) in net assets resulting from operations | 63,171,626 | (152,685,295) |
| Distributions to shareholders: | | |
| Initial Class | (1,034,891) | (82,864,939) |
| Service Class | (486,364) | (32,444,804) |
| Total distributions to shareholders | (1,521,255) | (115,309,743) |
| Capital share transactions: | | |
| Net proceeds from sales of shares | 43,230,420 | 85,439,744 |
| Net asset value of shares issued to shareholders in reinvestment of distributions | 1,521,255 | 115,309,743 |
| Cost of shares redeemed | (100,715,035) | (64,467,524) |
| Increase (decrease) in net assets derived from capital share transactions | (55,963,360) | 136,281,963 |
| Net increase (decrease) in net assets | 5,687,011 | (131,713,075) |
| Net Assets |
| Beginning of year | 437,166,026 | 568,879,101 |
| End of year | $ 442,853,037 | $ 437,166,026 |
The notes to the financial statements are an integral part of, and should be read in conjunction with, the financial statements.
17
Financial Highlights selected per share data and ratios
| | Year Ended December 31, |
| Initial Class | 2023 | | 2022 | | 2021 | | 2020 | | 2019 |
| Net asset value at beginning of year | $ 9.37 | | $ 17.53 | | $ 18.16 | | $ 13.31 | | $ 12.20 |
| Net investment income (loss) (a) | (0.01) | | (0.05) | | (0.11) | | (0.06) | | (0.06) |
| Net realized and unrealized gain (loss) | 1.46 | | (4.74) | | 1.98 | | 5.36 | | 2.96 |
| Total from investment operations | 1.45 | | (4.79) | | 1.87 | | 5.30 | | 2.90 |
| Less distributions: | | | | | | | | | |
| From net realized gain on investments | (0.04) | | (3.37) | | (2.50) | | (0.45) | | (1.79) |
| Net asset value at end of year | $ 10.78 | | $ 9.37 | | $ 17.53 | | $ 18.16 | | $ 13.31 |
| Total investment return (b) | 15.51% | | (26.49)% | | 10.31% | | 40.48% | | 25.59% |
| Ratios (to average net assets)/Supplemental Data: | | | | | | | | | |
| Net investment income (loss) | (0.11)% | | (0.37)% | | (0.56)% | | (0.41)% | | (0.41)% |
| Net expenses (c) | 0.84% | | 0.85% | | 0.84%(d) | | 0.85%(d) | | 0.85% |
| Portfolio turnover rate | 26% | | 39% | | 32% | | 101% | | 46% |
| Net assets at end of year (in 000's) | $ 308,540 | | $ 320,091 | | $ 395,321 | | $ 422,200 | | $ 332,474 |
| (a) | Per share data based on average shares outstanding during the year. |
| (b) | Total return does not reflect any deduction of sales charges, mortality and expense charges, contract charges or administrative charges. For periods of less than one year, total return is not annualized. |
| (c) | In addition to the fees and expenses which the Portfolio bears directly, it also indirectly bears a pro-rata share of the fees and expenses of the underlying funds in which it invests. Such indirect expenses are not included in the above expense ratios. |
| (d) | Expense waiver/reimbursement less than 0.01%. |
| | Year Ended December 31, |
| Service Class | 2023 | | 2022 | | 2021 | | 2020 | | 2019 |
| Net asset value at beginning of year | $ 8.88 | | $ 16.91 | | $ 17.64 | | $ 12.97 | | $ 11.96 |
| Net investment income (loss) (a) | (0.03) | | (0.08) | | (0.15) | | (0.09) | | (0.09) |
| Net realized and unrealized gain (loss) | 1.38 | | (4.58) | | 1.92 | | 5.21 | | 2.89 |
| Total from investment operations | 1.35 | | (4.66) | | 1.77 | | 5.12 | | 2.80 |
| Less distributions: | | | | | | | | | |
| From net realized gain on investments | (0.04) | | (3.37) | | (2.50) | | (0.45) | | (1.79) |
| Net asset value at end of year | $ 10.19 | | $ 8.88 | | $ 16.91 | | $ 17.64 | | $ 12.97 |
| Total investment return (b) | 15.22% | | (26.67)% | | 10.03% | | 40.13% | | 25.28% |
| Ratios (to average net assets)/Supplemental Data: | | | | | | | | | |
| Net investment income (loss) | (0.36)% | | (0.63)% | | (0.81)% | | (0.66)% | | (0.65)% |
| Net expenses (c) | 1.09% | | 1.10% | | 1.09%(d) | | 1.10%(d) | | 1.10% |
| Portfolio turnover rate | 26% | | 39% | | 32% | | 101% | | 46% |
| Net assets at end of year (in 000's) | $ 134,313 | | $ 117,075 | | $ 173,558 | | $ 154,543 | | $ 125,306 |
| (a) | Per share data based on average shares outstanding during the year. |
| (b) | Total return does not reflect any deduction of sales charges, mortality and expense charges, contract charges or administrative charges. For periods of less than one year, total return is not annualized. |
| (c) | In addition to the fees and expenses which the Portfolio bears directly, it also indirectly bears a pro-rata share of the fees and expenses of the underlying funds in which it invests. Such indirect expenses are not included in the above expense ratios. |
| (d) | Expense waiver/reimbursement less than 0.01%. |
The notes to the financial statements are an integral part of, and should be read in conjunction with, the financial statements.
| 18 | MainStay VP Small Cap Growth Portfolio |
Notes to Financial Statements
Note 1–Organization and Business
MainStay VP Funds Trust (the “Fund”) was organized as a Delaware statutory trust on February 1, 2011. The Fund is registered under the Investment Company Act of 1940, as amended (the “1940 Act”), as an open-end management investment company. The Fund is comprised of thirty-one separate series (collectively referred to as the “Portfolios”). These financial statements and notes relate to the MainStay VP Small Cap Growth Portfolio (the "Portfolio"), a "diversified” portfolio, as that term is defined in the 1940 Act, as interpreted or modified by regulatory authorities having jurisdiction, from time to time.
Shares of the Portfolio are currently offered to certain separate accounts to fund variable annuity policies and variable universal life insurance policies issued by New York Life Insurance and Annuity Corporation (“NYLIAC”), a wholly-owned subsidiary of New York Life Insurance Company (“New York Life”) and may also be offered to fund variable annuity policies and variable universal life insurance policies issued by other insurance companies. NYLIAC allocates shares of the Portfolio to, among others, certain NYLIAC separate accounts. Shares of the Portfolio are also offered to the MainStay VP Conservative Allocation Portfolio, MainStay VP Moderate Allocation Portfolio, MainStay VP Growth Allocation Portfolio and MainStay VP Equity Allocation Portfolio, which operate as “funds-of-funds," and other variable insurance funds.
The following table lists the Portfolio's share classes that have been registered and commenced operations:
| Class | Commenced Operations |
| Initial Class | February 17, 2012 |
| Service Class | February 17, 2012 |
Shares of the Portfolio are offered and are redeemed at a price equal to their respective net asset value (“NAV”) per share. No sales or redemption charge is applicable to the purchase or redemption of the Portfolio's shares. Under the terms of the Fund’s multiple class plan, adopted pursuant to Rule 18f-3 under the 1940 Act, the classes differ in that, among other things, Service Class shares of the Portfolio pay a combined distribution and service fee of 0.25% of average daily net assets attributable to Service Class shares of the Portfolio to the Distributor (as defined in Note 3(B)) pursuant to a plan adopted in accordance with Rule 12b-1 under the 1940 Act. Contract owners of variable annuity contracts purchased after June 2, 2003, are permitted to invest only in the Service Class shares.
The Portfolio's investment objective is to seek long-term capital appreciation.
Note 2–Significant Accounting Policies
The Portfolio is an investment company and accordingly follows the investment company accounting and reporting guidance of the Financial Accounting Standards Board (“FASB”) Accounting Standards Codification Topic 946 Financial Services—Investment Companies. The Portfolio prepares its financial statements in accordance with generally accepted
accounting principles (“GAAP”) in the United States of America and follows the significant accounting policies described below.
(A) Securities Valuation. Investments are usually valued as of the close of regular trading on the New York Stock Exchange (the "Exchange") (usually 4:00 p.m. Eastern time) on each day the Portfolio is open for business ("valuation date").
Pursuant to Rule 2a-5 under the 1940 Act, the Board of Trustees of the Fund (the "Board") has designated New York Life Investment Management LLC (“New York Life Investments” or the "Manager") as its Valuation Designee (the "Valuation Designee"). The Valuation Designee is responsible for performing fair valuations relating to all investments in the Portfolio’s portfolio for which market quotations are not readily available; periodically assessing and managing material valuation risks; establishing and applying fair value methodologies; testing fair valuation methodologies; evaluating and overseeing pricing services; ensuring appropriate segregation of valuation and portfolio management functions; providing quarterly, annual and prompt reporting to the Board, as appropriate; identifying potential conflicts of interest; and maintaining appropriate records. The Valuation Designee has established a valuation committee ("Valuation Committee") to assist in carrying out the Valuation Designee’s responsibilities and establish prices of securities for which market quotations are not readily available. The Portfolio's and the Valuation Designee's policies and procedures ("Valuation Procedures") govern the Valuation Designee’s selection and application of methodologies for determining and calculating the fair value of Portfolio investments. The Valuation Designee may value the Portfolio's portfolio securities for which market quotations are not readily available and other Portfolio assets utilizing inputs from pricing services and other third-party sources. The Valuation Committee meets (in person, via electronic mail or via teleconference) on an ad-hoc basis to determine fair valuations and on a quarterly basis to review fair value events with respect to certain securities for which market quotations are not readily available, including valuation risks and back-testing results, and to preview reports to the Board.
The Valuation Committee establishes prices of securities for which market quotations are not readily available based on such methodologies and measurements on a regular basis after considering information that is reasonably available and deemed relevant by the Valuation Committee. The Board shall oversee the Valuation Designee and review fair valuation materials on a prompt, quarterly and annual basis and approve proposed revisions to the Valuation Procedures.
Investments for which market quotations are not readily available are valued at fair value as determined in good faith pursuant to the Valuation Procedures. A market quotation is readily available only when that quotation is a quoted price (unadjusted) in active markets for identical investments that the Portfolio can access at the measurement date, provided that a quotation will not be readily available if it is not reliable. "Fair value" is defined as the price the Portfolio would reasonably expect to receive upon selling an asset or liability in an orderly transaction to an independent buyer in the principal or most advantageous market for the
Notes to Financial Statements (continued)
asset or liability. Fair value measurements are determined within a framework that establishes a three-tier hierarchy that maximizes the use of observable market data and minimizes the use of unobservable inputs to establish a classification of fair value measurements for disclosure purposes. "Inputs" refer broadly to the assumptions that market participants would use in pricing the asset or liability, including assumptions about risk, such as the risk inherent in a particular valuation technique used to measure fair value using a pricing model and/or the risk inherent in the inputs for the valuation technique. Inputs may be observable or unobservable. Observable inputs reflect the assumptions market participants would use in pricing the asset or liability based on market data obtained from sources independent of the Portfolio. Unobservable inputs reflect the Portfolio’s own assumptions about the assumptions market participants would use in pricing the asset or liability based on the information available. The inputs or methodology used for valuing assets or liabilities may not be an indication of the risks associated with investing in those assets or liabilities. The three-tier hierarchy of inputs is summarized below.
| • | Level 1—quoted prices (unadjusted) in active markets for an identical asset or liability |
| • | Level 2—other significant observable inputs (including quoted prices for a similar asset or liability in active markets, interest rates and yield curves, prepayment speeds, credit risk, etc.) |
| • | Level 3—significant unobservable inputs (including the Portfolio's own assumptions about the assumptions that market participants would use in measuring fair value of an asset or liability) |
The level of an asset or liability within the fair value hierarchy is based on the lowest level of an input, both individually and in the aggregate, that is significant to the fair value measurement. The aggregate value by input level of the Portfolio’s assets and liabilities as of December 31, 2023, is included at the end of the Portfolio of Investments.
The Portfolio may use third-party vendor evaluations, whose prices may be derived from one or more of the following standard inputs, among others:
| • Broker/dealer quotes | • Benchmark securities |
| • Two-sided markets | • Reference data (corporate actions or material event notices) |
| • Bids/offers | • Monthly payment information |
| • Industry and economic events | • Reported trades |
An asset or liability for which a market quotation is not readily available is valued by methods deemed reasonable in good faith by the Valuation Committee, following the Valuation Procedures to represent fair value. Under these procedures, the Valuation Designee generally uses a market-based approach which may use related or comparable assets or liabilities, recent transactions, market multiples, book values and other relevant information. The Valuation Designee may also use an income-based valuation approach in which the anticipated future cash flows of the asset or liability are discounted to calculate fair value.
Discounts may also be applied due to the nature and/or duration of any restrictions on the disposition of the asset or liability. Fair value represents a good faith approximation of the value of a security. Fair value determinations involve the consideration of a number of subjective factors, an analysis of applicable facts and circumstances and the exercise of judgment. As a result, it is possible that the fair value for a security determined in good faith in accordance with the Valuation Procedures may differ from valuations for the same security determined for other funds using their own valuation procedures. Although the Valuation Procedures are designed to value a security at the price the Portfolio may reasonably expect to receive upon the security's sale in an orderly transaction, there can be no assurance that any fair value determination thereunder would, in fact, approximate the amount that the Portfolio would actually realize upon the sale of the security or the price at which the security would trade if a reliable market price were readily available. During the year ended December 31, 2023, there were no material changes to the fair value methodologies.
Securities which may be valued in this manner include, but are not limited to: (i) a security for which trading has been halted or suspended or otherwise does not have a readily available market quotation on a given day; (ii) a debt security that has recently gone into default and for which there is not a current market quotation; (iii) a security of an issuer that has entered into a restructuring; (iv) a security that has been delisted from a national exchange; (v) a security subject to trading collars for which no or limited trading takes place; and (vi) a security whose principal market has been temporarily closed at a time when, under normal conditions, it would be open. Securities valued in this manner are generally categorized as Level 2 or 3 in the hierarchy.
Equity securities, rights and warrants, if applicable, are valued at the last quoted sales prices as of the close of regular trading on the relevant exchange on each valuation date. Securities that are not traded on the valuation date are valued at the mean of the last quoted bid and ask prices. Prices are normally taken from the principal market in which each security trades. These securities are generally categorized as Level 1 in the hierarchy.
Exchange-traded funds (“ETFs”) are valued at the last quoted sales prices as of the close of regular trading on the relevant exchange on each valuation date. Securities that are not traded on the valuation date are valued at the mean of the last quoted bid and ask prices. Prices are normally taken from the principal market in which each security trades. These securities are generally categorized as Level 1 in the hierarchy.
Investments in mutual funds, including money market funds, are valued at their respective NAVs at the close of business each day on the valuation date. These securities are generally categorized as Level 1 in the hierarchy.
Temporary cash investments acquired in excess of 60 days to maturity at the time of purchase are valued using the latest bid prices or using valuations based on a matrix system (which considers such factors as security prices, yields, maturities and ratings), both as furnished by independent pricing services. Temporary cash investments that mature in
| 20 | MainStay VP Small Cap Growth Portfolio |
60 days or less at the time of purchase ("Short-Term Investments") are valued using the amortized cost method of valuation, unless the use of such method would be inappropriate. The amortized cost method involves valuing a security at its cost on the date of purchase and thereafter assuming a constant amortization to maturity of the difference between such cost and the value on maturity date. Amortized cost approximates the current fair value of a security. Securities valued using the amortized cost method are not valued using quoted prices in an active market and are generally categorized as Level 2 in the hierarchy.
The information above is not intended to reflect an exhaustive list of the methodologies that may be used to value portfolio investments. The Valuation Procedures permit the use of a variety of valuation methodologies in connection with valuing portfolio investments. The methodology used for a specific type of investment may vary based on the market data available or other considerations. The methodologies summarized above may not represent the specific means by which portfolio investments are valued on any particular business day.
(B) Income Taxes. The Portfolio's policy is to comply with the requirements of the Internal Revenue Code of 1986, as amended (the “Internal Revenue Code”), applicable to regulated investment companies and to distribute all of its taxable income to the shareholders of the Portfolio within the allowable time limits.
The Manager evaluates the Portfolio’s tax positions to determine if the tax positions taken meet the minimum recognition threshold in connection with accounting for uncertainties in income tax positions taken or expected to be taken for the purposes of measuring and recognizing tax liabilities in the financial statements. Recognition of tax benefits of an uncertain tax position is permitted only to the extent the position is “more likely than not” to be sustained assuming examination by taxing authorities. The Manager analyzed the Portfolio's tax positions taken on federal, state and local income tax returns for all open tax years (for up to three tax years) and has concluded that no provisions for federal, state and local income tax are required in the Portfolio's financial statements. The Portfolio's federal, state and local income tax and federal excise tax returns for tax years for which the applicable statutes of limitations have not expired are subject to examination by the Internal Revenue Service and state and local departments of revenue.
(C) Dividends and Distributions to Shareholders. Dividends and distributions are recorded on the ex-dividend date. The Portfolio intends to declare and pay dividends from net investment income and distributions from net realized capital and currency gains, if any, at least annually. All dividends and distributions are reinvested at NAV in the same class of shares of the Portfolio. Dividends and distributions to shareholders are determined in accordance with federal income tax regulations and may differ from determinations using GAAP.
(D) Security Transactions and Investment Income. The Portfolio records security transactions on the trade date. Realized gains and losses on security transactions are determined using the identified cost method. Dividend income is recognized on the ex-dividend date, net of any foreign
tax withheld at the source, and interest income is accrued as earned using the effective interest rate method. Distributions received from real estate investment trusts may be classified as dividends, capital gains and/or return of capital.
Investment income and realized and unrealized gains and losses on investments of the Portfolio are allocated pro rata to the separate classes of shares based upon their relative net assets on the date the income is earned or realized and unrealized gains and losses are incurred.
(E) Expenses. Expenses of the Fund are allocated to the individual Portfolios in proportion to the net assets of the respective Portfolios when the expenses are incurred, except where direct allocations of expenses can be made. Expenses (other than fees incurred under the distribution and service plans, further discussed in Note 3(B), which are charged directly to the Service Class shares) are allocated to separate classes of shares pro rata based upon their relative net assets on the date the expenses are incurred. The expenses borne by the Portfolio, including those of related parties to the Portfolio, are shown in the Statement of Operations.
Additionally, the Portfolio may invest in ETFs and mutual funds, which are subject to management fees and other fees that may cause the costs of investing in ETFs and mutual funds to be greater than the costs of owning the underlying securities directly. These indirect expenses of ETFs and mutual funds are not included in the amounts shown as expenses in the Statement of Operations or in the expense ratios included in the Financial Highlights.
(F) Use of Estimates. In preparing financial statements in conformity with GAAP, the Manager makes estimates and assumptions that affect the reported amounts and disclosures in the financial statements. Actual results could differ from those estimates and assumptions.
(G) Securities Lending. In order to realize additional income, the Portfolio may engage in securities lending, subject to the limitations set forth in the 1940 Act and relevant guidance by the staff of the Securities and Exchange Commission (“SEC”). If the Portfolio engages in securities lending, the Portfolio will lend through its custodian, JPMorgan Chase Bank, N.A., ("JPMorgan"), acting as securities lending agent on behalf of the Portfolio. Under the current arrangement, JPMorgan will manage the Portfolio's collateral in accordance with the securities lending agency agreement between the Portfolio and JPMorgan, and indemnify the Portfolio against counterparty risk. The loans will be collateralized by cash (which may be invested in a money market fund) and/or non-cash collateral (which may include U.S. Treasury securities and/or U.S. government agency securities issued or guaranteed by the United States government or its agencies or instrumentalities) at least equal at all times to the market value of the securities loaned. Non-cash collateral held at year end is segregated and cannot be transferred by the Portfolio. The Portfolio bears the risk of delay in recovery of, or loss of rights in, the securities loaned. The Portfolio may also record a realized gain or loss on securities deemed sold due to a borrower’s inability to return securities on loan. The Portfolio bears the risk of any loss on investment of cash
Notes to Financial Statements (continued)
collateral. The Portfolio will receive compensation for lending its securities in the form of fees or it will retain a portion of interest earned on the investment of any cash collateral. The Portfolio will also continue to receive interest and dividends on the securities loaned and any gain or loss in the market price of the securities loaned that may occur during the term of the loan will be for the account of the Portfolio. Income earned from securities lending activities, if any, is reflected in the Statement of Operations.
(H) Indemnifications. Under the Fund’s organizational documents, its officers and trustees are indemnified against certain liabilities that may arise out of performance of their duties to the Fund. Additionally, in the normal course of business, the Portfolio enters into contracts with third-party service providers that contain a variety of representations and warranties and that may provide general indemnifications. The Portfolio's maximum exposure under these arrangements is unknown, as this would involve future claims that may be made against the Portfolio that have not yet occurred. The Manager believes that the risk of loss in connection with these potential indemnification obligations is remote. However, there can be no assurance that material liabilities related to such obligations will not arise in the future, which could adversely impact the Portfolio.
Note 3–Fees and Related Party Transactions
(A) Manager and Subadvisors. New York Life Investments, a registered investment adviser and an indirect, wholly-owned subsidiary of New York Life, serves as the Portfolio’s Manager pursuant to an Amended and Restated Management Agreement (“Management Agreement”). The Manager provides offices, conducts clerical, recordkeeping and bookkeeping services, and keeps most of the financial and accounting records required to be maintained by the Portfolio. Except for the portion of salaries and expenses that are the responsibility of the Portfolio, the Manager pays the salaries and expenses of all personnel affiliated with the Portfolio and certain operational expenses of the Portfolio. The Portfolio reimburses New York Life Investments in an amount equal to the portion of the compensation of the Chief Compliance Officer attributable to the Portfolio. The Portfolio's subadvisors are Segall Bryant & Hamill, LLC ("SBH" or a "Subadvisor") and Brown Advisory LLC ("Brown Advisory" or a "Subadvisor", and together, with SBH, the "subadvisors'), the Portfolio's subadvisors. SBH, a registered investment adviser, serves as a Subadvisor to the Portfolio, pursuant to the terms of a Subadvisory Agreement between New York Life Investments and SBH. Brown Advisory, a registered investment adviser, serves as a Subadvisor to the Portfolio, pursuant to the terms of a Subadvisory Agreement between New York Life Investments and Brown Advisory. Each Subadvisor is responsible for managing a portion of the Portfolio’s assets, as designated by the Manager from time to time. New York Life Investments pays for the services of the Subadvisors.
Pursuant to the Management Agreement, the Fund pays the Manager, on behalf of the Portfolio, a monthly fee for the services performed and the facilities furnished at an annual rate of the Portfolio's average daily net assets as follows: 0.81% up to $1 billion; and 0.785% in excess of
$1 billion. During the year ended December 31, 2023, the effective management fee rate was 0.81% of the Portfolio's average daily net assets.
During the year ended December 31, 2023, New York Life Investments earned fees from the Portfolio in the amount of $3,502,425 and paid SBH and Brown Advisory fees of $865,468 and $904,754, respectively.
JPMorgan provides sub-administration and sub-accounting services to the Portfolio pursuant to an agreement with New York Life Investments. These services include calculating the daily NAVs of the Portfolio, maintaining the general ledger and sub-ledger accounts for the calculation of the Portfolio's NAVs, and assisting New York Life Investments in conducting various aspects of the Portfolio's administrative operations. For providing these services to the Portfolio, JPMorgan is compensated by New York Life Investments.
Pursuant to an agreement between the Fund and New York Life Investments, New York Life Investments is responsible for providing or procuring certain regulatory reporting services for the Portfolio. The Portfolio will reimburse New York Life Investments for the actual costs incurred by New York Life Investments in connection with providing or procuring these services for the Portfolio.
(B) Distribution and Service Fees. The Fund, on behalf of the Portfolio, has entered into a distribution agreement with NYLIFE Distributors LLC (the “Distributor”), an affiliate of New York Life Investments. The Portfolio has adopted a distribution plan (the “Plan”) in accordance with the provisions of Rule 12b-1 under the 1940 Act. Under the Plan, the Distributor has agreed to provide, through its affiliates or independent third parties, various distribution-related, shareholder and administrative support services to the Service Class shareholders. For its services, the Distributor is entitled to a combined distribution and service fee accrued daily and paid monthly at an annual rate of 0.25% of the average daily net assets attributable to the Service Class shares of the Portfolio.
Note 4-Federal Income Tax
As of December 31, 2023, the cost and unrealized appreciation (depreciation) of the Portfolio’s investment portfolio, including applicable derivative contracts and other financial instruments, as determined on a federal income tax basis, were as follows:
| | Federal Tax
Cost | Gross
Unrealized
Appreciation | Gross
Unrealized
(Depreciation) | Net
Unrealized
Appreciation/
(Depreciation) |
| Investments in Securities | $398,972,262 | $76,770,005 | $(21,340,943) | $55,429,062 |
| 22 | MainStay VP Small Cap Growth Portfolio |
As of December 31, 2023, the components of accumulated gain (loss) on a tax basis were as follows:
Ordinary
Income | Accumulated
Capital
and Other
Gain (Loss) | Other
Temporary
Differences | Unrealized
Appreciation
(Depreciation) | Total
Accumulated
Gain (Loss) |
| $— | $(2,156,677) | $43,625 | $55,429,062 | $53,316,010 |
The difference between book-basis and tax-basis unrealized appreciation (depreciation) is primarily due to wash sale adjustments.
The following table discloses the current year reclassifications between total distributable earnings (loss) and additional paid-in capital arising from permanent differences; net assets as of December 31, 2023 were not affected.
| | Total
Distributable
Earnings (Loss) | Additional
Paid-In
Capital |
| | $667,078 | $(667,078) |
The reclassifications for the Portfolio are primarily due to net operating losses.
As of December 31, 2023, for federal income tax purposes, capital loss carryforwards of $2,156,677, as shown in the table below, were available to the extent provided by the regulations to offset future realized gains of the Portfolio. Accordingly, no capital gains distributions are expected to be paid to shareholders until net gains have been realized in excess of such amounts.
Capital Loss
Available Through | Short-Term
Capital Loss
Amounts (000’s) | Long-Term
Capital Loss
Amounts (000’s) |
| Unlimited | $1,849 | $307 |
During the years ended December 31, 2023 and December 31, 2022, the tax character of distributions paid as reflected in the Statements of Changes in Net Assets was as follows:
| | 2023 | 2022 |
| Distributions paid from: | | |
| Ordinary Income | $ — | $ 42,583,224 |
| Long-Term Capital Gains | 1,521,255 | 72,726,519 |
| Total | $1,521,255 | $115,309,743 |
Note 5–Custodian
JPMorgan is the custodian of cash and securities held by the Portfolio. Custodial fees are charged to the Portfolio based on the Portfolio's net assets and/or the market value of securities held by the Portfolio and the number of certain transactions incurred by the Portfolio.
Note 6–Line of Credit
The Portfolio and certain other funds managed by New York Life Investments maintain a line of credit with a syndicate of banks in order to secure a source of funds for temporary purposes to meet unanticipated or excessive redemption requests.
Effective July 25, 2023, under the credit agreement (the “Credit Agreement”), the aggregate commitment amount is $600,000,000 with an additional uncommitted amount of $100,000,000. The commitment fee is an annual rate of 0.15% of the average commitment amount payable quarterly, regardless of usage, to JPMorgan, who serves as the agent to the syndicate. The commitment fee is allocated among the Portfolio and certain other funds managed by New York Life Investments based upon their respective net assets and other factors. Interest on any revolving credit loan is charged based upon the Federal Funds Rate, Daily Simple Secured Overnight Financing Rate ("SOFR") + 0.10%, or the Overnight Bank Funding Rate, whichever is higher. The Credit Agreement expires on July 23, 2024, although the Portfolio, certain other funds managed by New York Life Investments and the syndicate of banks may renew the Credit Agreement for an additional year on the same or different terms or enter into a credit agreement with a different syndicate of banks. Prior to July 25, 2023, the aggregate commitment amount and the commitment fee were the same as those under the current Credit Agreement. During the year ended December 31, 2023, there were no borrowings made or outstanding with respect to the Portfolio under the Credit Agreement.
Note 7–Interfund Lending Program
Pursuant to an exemptive order issued by the SEC, the Portfolio, along with certain other funds managed by New York Life Investments, may participate in an interfund lending program. The interfund lending program provides an alternative credit facility that permits the Portfolio and certain other funds managed by New York Life Investments to lend or borrow money for temporary purposes directly to or from one another, subject to the conditions of the exemptive order. During the year ended December 31, 2023, there were no interfund loans made or outstanding with respect to the Portfolio.
Note 8–Purchases and Sales of Securities (in 000’s)
During the year ended December 31, 2023, purchases and sales of securities, other than short-term securities, were $105,415 and $153,381, respectively.
Note 9–Capital Share Transactions
Transactions in capital shares for the years ended December 31, 2023 and December 31, 2022, were as follows:
Notes to Financial Statements (continued)
| Initial Class | Shares | Amount |
| Year ended December 31, 2023: | | |
| Shares sold | 2,438,021 | $ 23,880,849 |
| Shares issued to shareholders in reinvestment of distributions | 108,664 | 1,034,891 |
| Shares redeemed | (8,091,566) | (80,734,142) |
| Net increase (decrease) | (5,544,881) | $ (55,818,402) |
| Year ended December 31, 2022: | | |
| Shares sold | 5,141,939 | $ 68,272,969 |
| Shares issued to shareholders in reinvestment of distributions | 9,244,708 | 82,864,939 |
| Shares redeemed | (2,767,030) | (36,485,974) |
| Net increase (decrease) | 11,619,617 | $114,651,934 |
| |
| Service Class | Shares | Amount |
| Year ended December 31, 2023: | | |
| Shares sold | 2,040,248 | $ 19,349,571 |
| Shares issued to shareholders in reinvestment of distributions | 53,966 | 486,364 |
| Shares redeemed | (2,097,356) | (19,980,893) |
| Net increase (decrease) | (3,142) | $ (144,958) |
| Year ended December 31, 2022: | | |
| Shares sold | 1,328,818 | $ 17,166,775 |
| Shares issued to shareholders in reinvestment of distributions | 3,814,702 | 32,444,804 |
| Shares redeemed | (2,227,095) | (27,981,550) |
| Net increase (decrease) | 2,916,425 | $ 21,630,029 |
Note 10–Other Matters
As of the date of this report, the Portfolio faces a heightened level of risk associated with current uncertainty, volatility and state of economies, financial markets, rising interest rates, and labor and health conditions around the world. Events such as war, acts of terrorism, recessions, rapid inflation, the imposition of international sanctions, earthquakes, hurricanes, epidemics and pandemics and other unforeseen natural or human disasters may have broad adverse social, political and economic effects on the global economy, which could negatively impact the value of the Portfolio's investments. Developments that disrupt global economies and financial markets may magnify factors that affect the Portfolio's performance.
Note 11–Subsequent Events
In connection with the preparation of the financial statements of the Portfolio as of and for the year ended December 31, 2023, events and transactions subsequent to December 31, 2023, through the date the financial statements were issued, have been evaluated by the Manager for possible adjustment and/or disclosure. No subsequent events requiring financial statement adjustment or disclosure have been identified.
| 24 | MainStay VP Small Cap Growth Portfolio |
Report of Independent Registered Public Accounting Firm
To the Board of Trustees of MainStay VP Funds Trust and Shareholders of MainStay VP Small Cap Growth Portfolio
Opinion on the Financial Statements
We have audited the accompanying statement of assets and liabilities, including the portfolio of investments, of MainStay VP Small Cap Growth Portfolio (one of the portfolios constituting MainStay VP Funds Trust, referred to hereafter as the “Portfolio”) as of December 31, 2023, the related statement of operations for the year ended December 31, 2023, the statements of changes in net assets for each of the two years in the period ended December 31, 2023, including the related notes, and the financial highlights for each of the five years in the period ended December 31, 2023 (collectively referred to as the “financial statements”). In our opinion, the financial statements present fairly, in all material respects, the financial position of the Portfolio as of December 31, 2023, the results of its operations for the year then ended, the changes in its net assets for each of the two years in the period ended December 31, 2023 and the financial highlights for each of the five years in the period ended December 31, 2023 in conformity with accounting principles generally accepted in the United States of America.
Basis for Opinion
These financial statements are the responsibility of the Portfolio’s management. Our responsibility is to express an opinion on the Portfolio’s financial statements based on our audits. We are a public accounting firm registered with the Public Company Accounting Oversight Board (United States) (PCAOB) and are required to be independent with respect to the Portfolio in accordance with the U.S. federal securities laws and the applicable rules and regulations of the Securities and Exchange Commission and the PCAOB.
We conducted our audits of these financial statements in accordance with the standards of the PCAOB. Those standards require that we plan and perform the audit to obtain reasonable assurance about whether the financial statements are free of material misstatement, whether due to error or fraud.
Our audits included performing procedures to assess the risks of material misstatement of the financial statements, whether due to error or fraud, and performing procedures that respond to those risks. Such procedures included examining, on a test basis, evidence regarding the amounts and disclosures in the financial statements. Our audits also included evaluating the accounting principles used and significant estimates made by management, as well as evaluating the overall presentation of the financial statements. Our procedures included confirmation of securities owned as of December 31, 2023 by correspondence with the custodian, transfer agents and brokers; when replies were not received from brokers, we performed other auditing procedures. We believe that our audits provide a reasonable basis for our opinion.
/s/PricewaterhouseCoopers LLP
New York, New York
February 26, 2024
We have served as the auditor of one or more investment companies in the MainStay group of funds since 1984.
Board Consideration and Approval of Management Agreement and Subadvisory Agreements (Unaudited)
The continuation of the Management Agreement with respect to the MainStay VP Small Cap Growth Portfolio (“Portfolio”) and New York Life Investment Management LLC (“New York Life Investments”) and the Subadvisory Agreements between New York Life Investments and each of Segall Bryant & Hamill, LLC (“Segall”) and Brown Advisory LLC (“Brown Advisory”) with respect to the Portfolio (together, “Advisory Agreements”) is subject to annual review and approval by the Board of Trustees of MainStay VP Funds Trust (“Board” of the “Trust”) in accordance with Section 15 of the Investment Company Act of 1940, as amended (“1940 Act”). At its December 6–7, 2023 meeting, the Board, including the Trustees who are not an “interested person” (as such term is defined in the 1940 Act) of the Trust (“Independent Trustees”) voting separately, unanimously approved the continuation of each of the Advisory Agreements for a one-year period.
In reaching the decision to approve the continuation of each of the Advisory Agreements, the Board considered information and materials furnished by New York Life Investments, Segall and Brown Advisory in connection with an annual contract review process undertaken by the Board that took place at meetings of the Board and its Contracts Committee from September 2023 through December 2023, including information and materials furnished by New York Life Investments, Segall and Brown Advisory in response to requests prepared on behalf of the Board, and in consultation with the Independent Trustees, by independent legal counsel to the Independent Trustees, which encompassed a variety of topics, including those summarized below. Information and materials requested by and furnished to the Board for consideration in connection with the contract review process included, among other items, reports on the Portfolio and “peer funds” prepared by Institutional Shareholder Services Inc. (“ISS”), an independent third-party service provider engaged by the Board to report objectively on the Portfolio’s investment performance, management fee and total expenses. The Board also considered information on the fees charged to other investment advisory clients of New York Life Investments, Segall and/or Brown Advisory that follow investment strategies similar to those of the Portfolio, if any, and, when applicable, the rationale for differences in the Portfolio’s management and subadvisory fees and the fees charged to those other investment advisory clients. In addition, the Board considered information regarding the legal standards and fiduciary obligations applicable to its consideration of the continuation of each of the Advisory Agreements. The contract review process, including the structure and format for information and materials provided to the Board, has been developed in consultation with the Board. The Independent Trustees also met in executive sessions with their independent legal counsel and, for portions thereof, with senior management of New York Life Investments.
The Board’s deliberations with respect to the continuation of each of the Advisory Agreements reflect a year-long process, and the Board also took into account information furnished to the Board and its Committees throughout the year, as deemed relevant and appropriate by the Trustees, including, among other items, reports on investment performance of the Portfolio and investment-related matters for the Portfolio as well as presentations from New York Life Investments and, generally annually,
Segall and Brown Advisory personnel. In addition, the Board took into account other information provided by New York Life Investments throughout the year, including, among other items, periodic reports on legal and compliance matters, risk management, portfolio turnover, brokerage commissions and non-advisory services provided to the Portfolio by New York Life Investments, as deemed relevant and appropriate by the Trustees.
In addition to information provided to the Board throughout the year, the Board received information in connection with its June 2023 meeting provided specifically in response to requests prepared on behalf of the Board, and in consultation with the Independent Trustees, by independent legal counsel to the Independent Trustees regarding the Portfolio’s distribution arrangements. In addition, the Board received information regarding the Portfolio’s asset levels, share purchase and redemption activity and the payment of Rule 12b-1 and/or certain other fees by applicable share classes of the Portfolio, among other information.
In considering the continuation of each of the Advisory Agreements, the Trustees reviewed and evaluated the information and factors they believed to reasonably be necessary and appropriate in light of legal advice furnished to them by independent legal counsel to the Independent Trustees and through the exercise of their own business judgment. Although individual Trustees may have weighed certain factors or information differently and the Board did not consider any single factor or information controlling in reaching its decision, the factors that figured prominently in the Board’s consideration of the continuation of each of the Advisory Agreements are summarized in more detail below and include, among other factors: (i) the nature, extent and quality of the services provided to the Portfolio by New York Life Investments, Segall and Brown Advisory; (ii) the qualifications of the portfolio managers of the Portfolio and the historical investment performance of the Portfolio, New York Life Investments, Segall and Brown Advisory; (iii) the costs of the services provided, and profits realized, by New York Life Investments, Segall and Brown Advisory with respect to their relationships with the Portfolio; (iv) the extent to which economies of scale have been realized or may be realized if the Portfolio grows and the extent to which any economies of scale have been shared, have benefited or may benefit the Portfolio’s shareholders; and (v) the reasonableness of the Portfolio’s management and subadvisory fees and total ordinary operating expenses. Although the Board recognized that comparisons between the Portfolio’s fees and expenses and those of other funds are imprecise given different terms of agreements, variations in fund strategies and other factors, the Board considered the reasonableness of the Portfolio’s management fee and total ordinary operating expenses as compared to the peer funds identified by ISS. Throughout their considerations, the Trustees acknowledged the commitment of New York Life Investments and its affiliates to serve the MainStay Group of Funds, as well as their capacity, experience, resources, financial stability and reputations. The Trustees also acknowledged the entrepreneurial and other risks assumed by New York Life Investments in sponsoring and managing the Portfolio. With
| 26 | MainStay VP Small Cap Growth Portfolio |
respect to the Subadvisory Agreements, the Board took into account New York Life Investments’ recommendation to approve the continuation of the Subadvisory Agreements.
The Trustees noted that, throughout the year, the Trustees are afforded an opportunity to ask questions of, and request additional information or materials from, New York Life Investments, Segall and Brown Advisory. The Board’s decision with respect to each of the Advisory Agreements may have also been based, in part, on the Board’s knowledge of New York Life Investments, Segall and Brown Advisory resulting from, among other things, the Board’s consideration of each of the Advisory Agreements in prior years, the advisory agreements for other funds in the MainStay Group of Funds, the Board’s review throughout the year of the performance and operations of other funds in the MainStay Group of Funds and each Trustee’s business judgment and industry experience. In addition to considering the above-referenced factors, the Board observed that in the marketplace, notably under variable life insurance policies and variable annuity contracts for which the Portfolio serves as an investment option, there are a range of investment options available to investors and that the Portfolio’s shareholders, having had the opportunity to consider other investment options, have invested in the Portfolio.
The factors that figured prominently in the Board’s decision to approve the continuation of each of the Advisory Agreements during the Board’s December 6–7, 2023 meeting are summarized in more detail below.
Nature, Extent and Quality of Services Provided by New York Life Investments, Segall and Brown Advisory
The Board examined the nature, extent and quality of the services that New York Life Investments provides to the Portfolio. The Board evaluated New York Life Investments’ experience and capabilities in serving as manager of the Portfolio and considered that the Portfolio operates in a “manager-of-managers” structure. The Board also considered New York Life Investments’ responsibilities and services provided pursuant to this structure, including overseeing the services provided by Segall and Brown Advisory, evaluating the performance of Segall and Brown Advisory, making recommendations to the Board as to whether the Subadvisory Agreements should be renewed, modified or terminated and periodically reporting to the Board regarding the results of New York Life Investments’ evaluation and monitoring functions. The Board noted that New York Life Investments manages other mutual funds, serves a variety of other investment advisory clients, including other pooled investment vehicles, and has experience overseeing mutual fund service providers, including subadvisors. The Board considered the experience of senior personnel at New York Life Investments providing management and administrative and other non-advisory services to the Portfolio. The Board observed that New York Life Investments devotes significant resources and time to providing management and administrative and other non-advisory services to the Portfolio, including New York Life Investments’ oversight and due diligence reviews of Segall and Brown Advisory and ongoing analysis of, and interactions with, Segall and Brown Advisory with respect to, among
other things, the Portfolio’s investment performance and risks as well as Segall’s and Brown Advisory’s investment capabilities and subadvisory services with respect to the Portfolio.
The Board also considered the range of services that New York Life Investments provides to the Portfolio under the terms of the Management Agreement, including: (i) fund accounting and ongoing supervisory services provided by New York Life Investments’ Fund Administration and Accounting Group; (ii) investment supervisory and analytical services provided by New York Life Investments’ Investment Consulting Group; (iii) compliance services provided by the Trust’s Chief Compliance Officer as well as New York Life Investments’ compliance department, including supervision and implementation of the Portfolio’s compliance program; (iv) legal services provided by New York Life Investments’ Office of the General Counsel; and (v) risk management monitoring and analysis by compliance and investment personnel. In addition, the Board considered New York Life Investments’ willingness to invest in personnel and other resources, such as cyber security, information security and business continuity planning, that may benefit the Portfolio and noted that New York Life Investments is responsible for compensating the Trust’s officers, except for a portion of the salary of the Trust’s Chief Compliance Officer. The Board recognized that New York Life Investments provides certain other non-advisory services to the Portfolio and has over time provided an increasingly broad array of non-advisory services to the MainStay Group of Funds as a result of regulatory and other developments.
The Board also examined the range, and the nature, extent and quality, of the investment advisory services that Segall and Brown Advisory provide to the Portfolio and considered the terms of each of the Advisory Agreements. The Board evaluated Segall’s and Brown Advisory’s experience and performance in serving as subadvisors to the Portfolio and advising other portfolios and Segall’s and Brown Advisory’s track record and experience in providing investment advisory services as well as the experience of investment advisory, senior management and administrative personnel at Segall and Brown Advisory. The Board considered New York Life Investments’, Segall’s and Brown Advisory’s overall resources, legal and compliance environment, capabilities, reputation, financial condition and history. In addition to information provided in connection with quarterly meetings with the Trust’s Chief Compliance Officer, the Board considered information regarding the compliance policies and procedures of New York Life Investments, Segall and Brown Advisory and acknowledged their commitment to further developing and strengthening compliance programs that may relate to the Portfolio. The Board also considered Segall’s and Brown Advisory’s ability to recruit and retain qualified investment professionals and willingness to invest in personnel and other resources that may benefit the Portfolio. In this regard, the Board considered the qualifications and experience of the Portfolio’s portfolio managers, the number of accounts managed by the portfolio managers and the method for compensating the portfolio managers.
In addition, the Board considered information provided by New York Life Investments, Segall and Brown Advisory regarding their respective business continuity and disaster recovery plans.
Board Consideration and Approval of Management Agreement and Subadvisory Agreements (Unaudited) (continued)
Based on these considerations, among others, the Board concluded that the Portfolio would likely continue to benefit from the nature, extent and quality of these services.
Investment Performance
In evaluating the Portfolio’s investment performance, the Board considered investment performance results over various periods in light of the Portfolio’s investment objective, strategies and risks. The Board considered investment reports on, and analysis of, the Portfolio’s performance provided to the Board throughout the year. These reports include, among other items, information on the Portfolio’s gross and net returns, the Portfolio’s investment performance compared to a relevant investment category and the Portfolio’s benchmark, the Portfolio’s risk-adjusted investment performance and the Portfolio’s investment performance as compared to peer funds, as appropriate, as well as portfolio attribution information and commentary on the effect of market conditions. The Board also considered information provided by ISS showing the investment performance of the Portfolio as compared to peer funds. In addition, the Board reviewed the methodology used by ISS to construct the group of peer funds for comparative purposes.
The Board also took into account its discussions with senior management at New York Life Investments concerning the Portfolio’s investment performance over various periods as well as discussions between representatives of Segall and Brown Advisory and the members of the Board’s Investment Committee, which generally occur on an annual basis.
Based on these considerations, among others, the Board concluded that its review of the Portfolio’s investment performance and related information supported a determination to approve the continuation of each of the Advisory Agreements.
Costs of the Services Provided, and Profits and Other Benefits Realized, by New York Life Investments, Segall and Brown Advisory
The Board considered the costs of the services provided under each of the Advisory Agreements. The Board also considered the profitability of New York Life Investments and its affiliates and Segall and Brown Advisory due to their relationships with the Portfolio as well as by New York Life Investments and its affiliates due to their relationships with the MainStay Group of Funds. With respect to the profitability of Segall’s and Brown Advisory’s relationships with the Portfolio, the Board considered information from New York Life Investments that Segall’s and Brown Advisory’s subadvisory fees reflected an arm’s-length negotiation and that these fees are paid by New York Life Investments, not the Portfolio, and the relevance of Segall’s and Brown Advisory’s profitability was considered by the Trustees in that context. On this basis, the Board primarily considered the costs and profitability for New York Life Investments and its affiliates with respect to the Portfolio.
In addition, the Board acknowledged the difficulty in obtaining reliable comparative data about mutual fund managers’ profitability because such information generally is not publicly available and may be impacted by
numerous factors, including the structure of a fund manager’s organization, the types of funds it manages, the methodology used to allocate certain fixed costs to specific funds and the manager’s capital structure and costs of capital.
In evaluating the costs of the services provided by New York Life Investments, Segall and Brown Advisory, and profitability of New York Life Investments and its affiliates, Segall and Brown Advisory due to their relationships with the Portfolio, the Board considered, among other factors, New York Life Investments’ and its affiliates’, Segall’s and Brown Advisory’s continuing investments in, or willingness to invest in, personnel and other resources that may support and further enhance the management of the Portfolio, and that New York Life Investments is responsible for paying the subadvisory fees for the Portfolio. The Board also considered the financial resources of New York Life Investments, Segall and Brown Advisory and acknowledged that New York Life Investments, Segall and Brown Advisory must be in a position to recruit and retain experienced professional personnel and to maintain a strong financial position for New York Life Investments, Segall and Brown Advisory to continue to provide high-quality services to the Portfolio. The Board recognized that the Portfolio benefits from the allocation of certain fixed costs among the funds in the MainStay Group of Funds, among other expected benefits resulting from its relationship with New York Life Investments.
The Board considered information regarding New York Life Investments’ methodology for calculating profitability and allocating costs provided by New York Life Investments in connection with the fund profitability analysis presented to the Board. The Board concluded that New York Life Investments’ methods for allocating costs and procedures for estimating overall profitability of the relationship with the funds in the MainStay Group of Funds were reasonable. The Board recognized the difficulty in calculating and evaluating a manager’s profitability with respect to the Portfolio and considered that other profitability methodologies may also be reasonable.
The Board also considered certain fall-out benefits that may be realized by New York Life Investments and its affiliates, Segall and Brown Advisory and their affiliates due to their relationships with the Portfolio, including reputational and other indirect benefits. The Board recognized, for example, the benefits to Segall and Brown Advisory from legally permitted “soft-dollar” arrangements by which brokers provide research and other services to Segall and Brown Advisory in exchange for commissions paid by the Portfolio with respect to trades in the Portfolio’s portfolio securities. In this regard, the Board also requested and considered information from New York Life Investments concerning other material business relationships between Segall and Brown Advisory and its affiliates and New York Life Investments and its affiliates that relates to certain current and future products and represents a potential conflict of interest associated with New York Life Investments’ recommendation to approve the Subadvisory Agreements. In addition, the Board considered its review of the management agreement for a money market fund advised by New York Life Investments and an affiliated subadvisor that serves as an investment option for the Portfolio, including the potential rationale for
| 28 | MainStay VP Small Cap Growth Portfolio |
and costs associated with investments in this money market fund by the Portfolio, if any, and considered information from New York Life Investments that the nature and type of specific investment advisory services provided to this money market fund are distinct from, or in addition to, the investment advisory services provided to the Portfolio. In addition, the Board considered the potential dividend received tax deduction for insurance company affiliates of New York Life Investments from the Portfolio’s securities lending activity.
The Board noted that the Portfolio serves as an investment option primarily under variable contracts issued by affiliates of New York Life Investments that would receive fees under those contracts. The Board observed that, in addition to fees earned by New York Life Investments under the Management Agreement for managing the Portfolio, New York Life Investments’ affiliates also earn revenues from serving the Portfolio in various other capacities, including as the Portfolio’s distributor, and insurance companies affiliated with New York Life Investments would be entitled to receive fees from the Portfolio under a distribution and service plan adopted pursuant to Rule 12b-1 under the 1940 Act. The Board considered information about these other revenues and their impact on the profitability of the relationship with the Portfolio to New York Life Investments and its affiliates. The Board noted that, although it assessed the overall profitability of the relationship with the Portfolio to New York Life Investments and its affiliates as part of the contract review process, when considering the reasonableness of the fee paid to New York Life Investments under the Management Agreement, the Board considered the profitability of New York Life Investments’ relationship with the Portfolio on a pre-tax basis and without regard to distribution expenses incurred by New York Life Investments from its own resources.
After evaluating the information deemed relevant by the Trustees, the Board concluded that any profits realized by New York Life Investments and its affiliates due to their relationships with the Portfolio were not excessive, other expected benefits that may accrue to New York Life Investments and its affiliates are reasonable and other expected benefits that may accrue to Segall and Brown Advisory and its affiliates are consistent with those expected for a subadvisor to a mutual fund. With respect to Segall and Brown Advisory, the Board considered that any profits realized by Segall and Brown Advisory due to their relationships with the Portfolio are the result of arm’s-length negotiations between New York Life Investments and each of Segall and Brown Advisory, acknowledging that any such profits are based on the subadvisory fees paid to Segall and Brown Advisory by New York Life Investments, not the Portfolio.
Management and Subadvisory Fees and Total Ordinary Operating Expenses
The Board evaluated the reasonableness of the fee paid under each of the Advisory Agreements and the Portfolio’s total ordinary operating expenses. With respect to the management fee and subadvisory fees, the Board primarily considered the reasonableness of the management fee paid by the Portfolio to New York Life Investments because the subadvisory fees paid to Segall and Brown Advisory are paid by New York
Life Investments, not the Portfolio. The Board also considered the reasonableness of the subadvisory fees paid by New York Life Investments and the amount of the management fee retained by New York Life Investments.
In assessing the reasonableness of the Portfolio’s fees and expenses, the Board primarily considered comparative data provided by ISS on the fees and expenses of similar mutual funds managed by other investment advisers. The Board reviewed the methodology used by ISS to construct the group of peer funds for comparative purposes. In addition, the Board considered information provided by New York Life Investments, Segall and Brown Advisory on fees charged to other investment advisory clients, including institutional separate accounts and/or other funds, that follow investment strategies similar to those of the Portfolio, if any. The Board considered the contractual management fee schedules for the Portfolio as compared to those for such other investment advisory clients, taking into account the rationale for differences in fee schedules. The Board also took into account information provided by New York Life Investments about the more extensive scope of services provided to registered investment companies, such as the Portfolio, as compared with other investment advisory clients. Additionally, the Board considered the impact of contractual breakpoints and voluntary waivers on the Portfolio’s net management fee and expenses. The Board also considered that in proposing fees for the Portfolio, New York Life Investments considers the competitive marketplace for mutual funds.
Based on the factors outlined above, among other considerations, the Board concluded that the Portfolio’s management fee and total ordinary operating expenses are within a range that is competitive and support a conclusion that these fees and expenses are reasonable.
Economies of Scale
The Board considered information regarding economies of scale, including whether economies of scale may exist with respect to the Portfolio and whether the Portfolio’s management fee and expense structure permits any economies of scale to be appropriately shared with the Portfolio’s shareholders. The Board also considered a report from New York Life Investments, previously prepared at the request of the Board, that addressed economies of scale, including with respect to the mutual fund business generally, and the various ways in which the benefits of economies of scale may be shared with the funds in the MainStay Group of Funds. Although the Board recognized the difficulty of determining economies of scale with precision, the Board acknowledged that economies of scale may be shared with the Portfolio in a number of ways, including, for example, through the imposition of fee breakpoints, initially setting management fee rates at scale or making additional investments to enhance the services provided to the Portfolio. The Board reviewed information from New York Life Investments showing how the Portfolio’s management fee schedule compared to fee schedules of other funds and accounts managed by New York Life Investments. The Board also reviewed information from ISS showing how the Portfolio’s management fee schedule compared with fees paid for similar services by peer funds at varying asset levels.
Board Consideration and Approval of Management Agreement and Subadvisory Agreements (Unaudited) (continued)
Based on this information, the Board concluded that economies of scale are appropriately shared for the benefit of the Portfolio’s shareholders through the Portfolio’s management fee and expense structure and other methods to share benefits from economies of scale.
Conclusion
On the basis of the information and factors summarized above, among other information and factors deemed relevant by the Trustees, and the evaluation thereof, the Board, including the Independent Trustees voting separately, unanimously voted to approve the continuation of each of the Advisory Agreements.
| 30 | MainStay VP Small Cap Growth Portfolio |
Proxy Voting Policies and Procedures and Proxy Voting Record
The Portfolio is required to file with the SEC its proxy voting record for the 12-month period ending June 30 on Form N-PX. A description of the policies and procedures that are used to vote proxies relating to portfolio securities of the Portfolio is available free of charge upon request by calling 800-598-2019 or visiting the SEC's website at www.sec.gov. The most recent Form N-PX or proxy voting record is available free of charge upon request by calling 800-598-2019; visiting https://www.newyorklifeinvestments.com/investment-products/vp; or visiting the SEC’s website at www.sec.gov.
Shareholder Reports and Quarterly Portfolio Disclosure
The Portfolio is required to file its complete schedule of portfolio holdings with the SEC 60 days after its first and third fiscal quarter on Form N-PORT. The Portfolio's holdings report is available free of charge upon request by calling 800-598-2019 or by visiting the SEC’s website at www.sec.gov.
Board of Trustees and Officers (Unaudited)
The Trustees and officers of the Portfolio are listed below. The Board oversees the MainStay Group of Funds (which consists of MainStay Funds and MainStay Funds Trust), MainStay VP Funds Trust, MainStay MacKay DefinedTerm Municipal Opportunities Fund, MainStay CBRE Global Infrastructure Megatrends Term Fund, the Manager and the Subadvisors, and elects the officers of the Portfolios who are responsible for the day-to-day operations of the Portfolio. Information pertaining to the Trustees and officers is set forth below. Each Trustee serves until his or her successor is elected and qualified or until his or her resignation,
death or removal. Under the Board’s retirement policy, unless an exception is made, a Trustee must tender his or her resignation by the end of the calendar year during which he or she reaches the age of 75. Officers are elected annually by the Board. The business address of each Trustee and officer listed below is 51 Madison Avenue, New York, New York 10010. A majority of the Trustees are not “interested persons” (as defined by the 1940 Act and rules adopted by the SEC thereunder) of the Portfolio (“Independent Trustees”).
| | Name and
Year of Birth | Term of Office,
Position(s) Held and
Length of Service | Principal Occupation(s)
During Past Five Years | Number of
Portfolios in
Fund Complex
Overseen by
Trustee | Other Directorships
Held by Trustee |
| | | | | | |
| | Naïm Abou-Jaoudé*
1966 | MainStay VP Funds Trust: Trustee since 2023 | Chief Executive Officer of New York Life Investment Management LLC (since 2023). Chief Executive Officer of Candriam (an affiliate of New York Life Investment Management LLC) (2007 to 2023). | 81 | MainStay Funds: Trustee since 2023 (11 Funds)
MainStay Funds Trust: Trustee since 2023 (37 Funds);
MainStay MacKay DefinedTerm Municipal Opportunities Fund: Trustee since 2023;
MainStay CBRE Global Infrastructure Megatrends Term Fund: Trustee since 2023; and
New York Life Investment Management International (Chair) since 2015 |
| * | This Trustee is considered to be an “interested person” of the MainStay Group of Funds, MainStay VP Funds Trust, MainStay CBRE Global Infrastructure Megatrends Term Fund and MainStay MacKay DefinedTerm Municipal Opportunities Fund, within the meaning of the 1940 Act because of his affiliation with New York Life Investment Management LLC and Candriam, as described in detail above in the column entitled “Principal Occupation(s) During Past Five Years.” |
| | |
| 32 | MainStay VP Small Cap Growth Portfolio |
| | Name and
Year of Birth | Term of Office,
Position(s) Held and
Length of Service | Principal Occupation(s)
During Past Five Years | Number of
Portfolios in
Fund Complex
Overseen by
Trustee | Other Directorships
Held by Trustee |
| | | | | | |
| | David H. Chow
1957 | MainStay VP Funds Trust: Trustee since January 2016, Advisory Board Member (June 2015 to December 2015) | Founder and CEO, DanCourt Management, LLC since 1999 | 81 | MainStay Funds: Trustee since January 2016, Advisory Board Member (June 2015 to December 2015) (11 Funds);
MainStay Funds Trust: Trustee since January 2016, Advisory Board Member (June 2015 to December 2015) (37 Funds);
MainStay MacKay DefinedTerm Municipal Opportunities Fund: Trustee since January 2016, Advisory Board Member (June 2015 to December 2015);
MainStay CBRE Global Infrastructure Megatrends Term Fund: Trustee since 2021;
VanEck Vectors Group of Exchange-Traded Funds: Trustee since 2006 and Independent Chairman of the Board of Trustees from 2008 to 2022 (57 portfolios); and
Berea College of Kentucky: Trustee since 2009, Chair of the Investment Committee since 2018 |
| | Karen Hammond
1956 | MainStay VP Funds Trust: Trustee since December 2021, Advisory Board Member (June 2021 to December 2021)
| Retired, Managing Director, Devonshire Investors (2007 to 2013); Senior Vice President, Fidelity Management & Research Co. (2005 to 2007); Senior Vice President and Corporate Treasurer, FMR Corp. (2003 to 2005); Chief Operating Officer, Fidelity Investments Japan (2001 to 2003) | 81 | MainStay Funds: Trustee since December 2021, Advisory Board Member (June 2021 to December 2021) (11 Funds);
MainStay Funds Trust: Trustee since December 2021, Advisory Board Member (June 2021 to December 2021) (37 Funds);
MainStay MacKay DefinedTerm Municipal Opportunities Fund: Trustee since December 2021, Advisory Board Member (June 2021 to December 2021);
MainStay CBRE Global Infrastructure Megatrends Term Fund: Trustee since December 2021, Advisory Board Member (June 2021 to December 2021);
Two Harbors Investment Corp.: Director since 2018;
Rhode Island State Investment Commission: Member since 2017; and
Blue Cross Blue Shield of Rhode Island: Director since 2019 |
| | Susan B. Kerley
1951 | MainStay VP Funds Trust: Chair since 2017 and Trustee since 2007** | President, Strategic Management Advisors LLC since 1990 | 81 | MainStay Funds: Chair since January 2017 and Trustee since 2007 (11 Funds); MainStay Funds Trust: Chair since January 2017 and Trustee since 1990 (37 Funds)***;
MainStay MacKay DefinedTerm Municipal Opportunities Fund: Chair since January 2017 and Trustee since 2011;
MainStay CBRE Global Infrastructure Megatrends Term Fund: Trustee since June 2021; and
Legg Mason Partners Funds: Trustee since 1991 (45 portfolios) |
Board of Trustees and Officers (Unaudited) (continued)
| | Name and
Year of Birth | Term of Office,
Position(s) Held and
Length of Service | Principal Occupation(s)
During Past Five Years | Number of
Portfolios in
Fund Complex
Overseen by
Trustee | Other Directorships
Held by Trustee |
| | | | | | |
| | Alan R. Latshaw
1951 | MainStay VP Funds Trust: Trustee since 2007** | Retired; Partner, Ernst & Young LLP (2002 to 2003); Partner, Arthur Andersen LLP (1989 to 2002); Consultant to the MainStay Funds Audit and Compliance Committee (2004 to 2006) | 81 | MainStay Funds: Trustee since 2006 (11 Funds);
MainStay Funds Trust: Trustee since 2007 (37 Funds)***;
MainStay MacKay DefinedTerm Municipal Opportunities Fund: Trustee since 2011; and
MainStay CBRE Global Infrastructure Megatrends Term Fund: Trustee since June 2021 |
| | Jacques P. Perold
1958 | MainStay VP Funds Trust: Trustee since January 2016, Advisory Board Member (June 2015 to December 2015) | Founder and Chief Executive Officer, CapShift Advisors LLC (since 2018); President, Fidelity Management & Research Company (2009 to 2014); President and Chief Investment Officer, Geode Capital Management, LLC (2001 to 2009) | 81 | MainStay Funds: Trustee since January 2016, Advisory Board Member (June 2015 to December 2015) (11 Funds);
MainStay Funds Trust: Trustee since January 2016, Advisory Board Member (June 2015 to December 2015) (37 Funds);
MainStay MacKay DefinedTerm Municipal Opportunities Fund: Trustee since January 2016, Advisory Board Member (June 2015 to December 2015);
MainStay CBRE Global Infrastructure Megatrends Term Fund: Trustee since June 2021;
Allstate Corporation: Director since 2015;
Partners in Health: Trustee since 2019; and
MSCI Inc.: Director since 2017 |
| | Richard S. Trutanic
1952 | MainStay VP Funds Trust: Trustee since 2007** | Chairman and Chief Executive Officer, Somerset & Company (financial advisory firm) since 2004; Managing Director, The Carlyle Group (private investment firm) (2002 to 2004); Senior Managing Director, Partner and Board Member, Groupe Arnault S.A. (private investment firm) (1999 to 2002) | 81 | MainStay Funds: Trustee since 1994 (11 Funds);
MainStay Funds Trust: Trustee since 2007 (37 Funds)***;
MainStay MacKay DefinedTerm Municipal Opportunities Fund: Trustee since 2011; and
MainStay CBRE Global Infrastructure Megatrends Term Fund: Trustee since June 2021 |
| ** | Includes prior service as a Director of MainStay VP Series Fund, Inc., the predecessor to MainStay VP Funds Trust. |
| *** | Includes prior service as a Director/Trustee of certain predecessor entities to MainStay Funds Trust. |
| 34 | MainStay VP Small Cap Growth Portfolio |
| | Name and
Year of Birth | Position(s) Held and
Length of Service | Principal Occupation(s)
During Past Five Years | |
| | | | | |
| | Kirk C. Lehneis
1974 | President, MainStay VP Funds Trust (since 2017) | Chief Operating Officer and Senior Managing Director (since 2016), New York Life Investment Management LLC and New York Life Investment Management Holdings LLC; Member of the Board of Managers (since 2017) and Senior Managing Director (since 2018), NYLIFE Distributors LLC; Chairman of the Board and Senior Managing Director, NYLIM Service Company LLC (since 2017); Trustee, President and Principal Executive Officer of IndexIQ Trust, IndexIQ ETF Trust and IndexIQ Active ETF Trust (since 2018); President, MainStay CBRE Global Infrastructure Megatrends Term Fund (since 2021), MainStay MacKay DefinedTerm Municipal Opportunities Fund, MainStay Funds and MainStay Funds Trust (since 2017); Senior Managing Director, Global Product Development (from 2015 to 2016); Managing Director, Product Development (from 2010 to 2015), New York Life Investment Management LLC | |
| | Jack R. Benintende
1964 | Treasurer and Principal Financial and Accounting Officer, MainStay VP Funds Trust (since 2007)** | Managing Director, New York Life Investment Management LLC (since 2007); Treasurer and Principal Financial and Accounting Officer, MainStay CBRE Global Infrastructure Megatrends Term Fund (since 2021), MainStay MacKay DefinedTerm Municipal Opportunities Fund (since 2011), MainStay Funds Trust (since 2009) and MainStay Funds (since 2007); and Assistant Treasurer, New York Life Investment Management Holdings LLC (2008 to 2012) | |
| | J. Kevin Gao
1967 | Secretary and Chief Legal Officer, MainStay VP Funds Trust (since 2010)** | Managing Director and Associate General Counsel, New York Life Investment Management LLC (since 2010); Secretary and Chief Legal Officer, MainStay CBRE Global Infrastructure Megatrends Term Fund (since 2021), MainStay MacKay DefinedTerm Municipal Opportunities Fund (since 2011), MainStay Funds and MainStay Funds Trust (since 2010) | |
| | Kevin M. Gleason
1967 | Vice President and Chief Compliance Officer, MainStay VP Funds Trust (since June 2022) | Vice President and Chief Compliance Officer, IndexIQ Trust, IndexIQ ETF Trust and IndexIQ Active ETF Trust (since June 2022); Vice President and Chief Compliance Officer, MainStay CBRE Global Infrastructure Megatrends Term Fund, MainStay MacKay DefinedTerm Municipal Opportunities Fund (since June 2022); MainStay Funds Trust and MainStay Funds (since June 2022); Senior Vice President, Voya Investment Management and Chief Compliance Officer, Voya Family of Funds (2012 to 2022) | |
| | Scott T. Harrington
1959 | Vice President— Administration, MainStay VP Funds Trust (since 2005)** | Managing Director, New York Life Investment Management LLC (including predecessor advisory organizations) (since 2000); Member of the Board of Directors, New York Life Trust Company (since 2009); Vice President—Administration, MainStay CBRE Global Infrastructure Megatrends Term Fund (since 2021), MainStay MacKay DefinedTerm Municipal Opportunities Fund (since 2011), MainStay Funds Trust and MainStay Funds (since 2009) | |
| * | The officers listed above are considered to be “interested persons” of the MainStay Group of Funds, MainStay VP Funds Trust, MainStay CBRE Global Infrastructure Megatrends Term Fund and MainStay MacKay DefinedTerm Municipal Opportunities Fund within the meaning of the 1940 Act because of their affiliation with the MainStay Group of Funds, New York Life Insurance Company and/or its affiliates, including New York Life Investment Management LLC, New York Life Insurance Company, NYLIM Service Company LLC, NYLIFE Securities LLC and/or NYLIFE Distributors LLC, as described in detail in the column captioned “Principal Occupation(s) During Past Five Years.” Officers are elected annually by the Board. |
| ** | Includes prior service as an Officer of MainStay VP Series Fund, Inc., the predecessor to MainStay VP Funds Trust. |
Officers of the Trust (Who are not Trustees)*
This page intentionally left blank.
This page intentionally left blank.
This page intentionally left blank.
MainStay VP Portfolios
MainStay VP offers a wide range of Portfolios. The full array of MainStay VP offerings is listed here, with information about the manager, subadvisors, legal counsel, and independent registered public accounting firm.
Equity
MainStay VP American Century Sustainable Equity Portfolio
MainStay VP Candriam Emerging Markets Equity Portfolio
MainStay VP Epoch U.S. Equity Yield Portfolio
MainStay VP Fidelity Institutional AM® Utilities Portfolio†
MainStay VP Natural Resources Portfolio
MainStay VP PineStone International Equity Portfolio1
MainStay VP S&P 500 Index Portfolio
MainStay VP Small Cap Growth Portfolio
MainStay VP Wellington Growth Portfolio
MainStay VP Wellington Mid Cap Portfolio
MainStay VP Wellington Small Cap Portfolio
MainStay VP Wellington U.S. Equity Portfolio
MainStay VP Winslow Large Cap Growth Portfolio
Mixed Asset
MainStay VP Balanced Portfolio
MainStay VP Income Builder Portfolio
MainStay VP Janus Henderson Balanced Portfolio
MainStay VP MacKay Convertible Portfolio
Income
MainStay VP Bond Portfolio
MainStay VP Floating Rate Portfolio
MainStay VP Indexed Bond Portfolio
MainStay VP MacKay Government Portfolio2
MainStay VP MacKay High Yield Corporate Bond Portfolio
MainStay VP MacKay Strategic Bond Portfolio
MainStay VP PIMCO Real Return Portfolio
Money Market
MainStay VP U.S. Government Money Market Portfolio
Alternative
MainStay VP CBRE Global Infrastructure Portfolio
MainStay VP IQ Hedge Multi-Strategy Portfolio
Asset Allocation
MainStay VP Conservative Allocation Portfolio
MainStay VP Equity Allocation Portfolio
MainStay VP Growth Allocation Portfolio
MainStay VP Moderate Allocation Portfolio
Manager
New York Life Investment Management LLC
New York, New York
Subadvisors
American Century Investment Management, Inc.
Kansas City, Missouri
Brown Advisory LLC
Baltimore, Maryland
Candriam*
Strassen, Luxembourg
CBRE Investment Management Listed Real Assets LLC
Radnor, Pennsylvania
Epoch Investment Partners, Inc.
New York, New York
FIAM LLC
Smithfield, Rhode Island
IndexIQ Advisors LLC*
New York, New York
Janus Henderson Investors US LLC
Denver, Colorado
MacKay Shields LLC*
New York, New York
Newton Investment Management North America, LLC
Boston, Massachusetts
NYL Investors LLC*
New York, New York
Pacific Investment Management Company LLC
Newport Beach, California
PineStone Asset Management Inc.
Montreal, Québec
Segall Bryant & Hamill, LLC
Chicago, Illinois
Wellington Management Company LLP
Boston, Massachusetts
Winslow Capital Management, LLC
Minneapolis, Minnesota
Legal Counsel
Dechert LLP
Washington, District of Columbia
Independent Registered Public Accounting Firm
PricewaterhouseCoopers LLP
New York, New York
Distributor
NYLIFE Distributors LLC*
Jersey City, New Jersey
Custodian
JPMorgan Chase Bank, N.A.
New York, New York
Some Portfolios may not be available in all products.
† Fidelity Institutional AM is a registered trade mark of FMR LLC. Used with permission.
* An affiliate of New York Life Investment Management LLC.
| 1. | Prior to August 28, 2023, the Portfolio's name was MainStay VP MacKay International Equity Portfolio. |
| 2. | Effective on or about May 1, 2024, the MainStay VP MacKay Government Portfolio will be renamed the MainStay VP U.S. Infrastructure Bond Portfolio. |
Not part of the Annual Report
2023 Annual Report
This report is for the general information of New York Life Variable Annuities and NYLIAC Variable Universal Life Insurance Products policyowners. It must be preceded or accompanied by the appropriate product(s) and funds prospectuses if it is given to anyone who is not an owner of a New York Life variable annuity policy or a NYLIAC Variable Universal Life Insurance Product. This report does not offer for sale or solicit orders to purchase securities.
The performance data quoted in this report represents past performance. Past performance is no guarantee of future results. Due to market volatility and other factors, current performance may be lower or higher than the figures shown. The most recent month-end performance summary for your variable annuity or variable life policy is available by calling 800-598-2019 and is updated periodically on newyorklife.com.
The New York Life Variable Annuities and NYLIAC Variable Universal Life Insurance Products are issued by New York Life Insurance and Annuity Corporation (a Delaware Corporation) and distributed by NYLIFE Distributors LLC (Member FINRA/SIPC).
New York Life Insurance Company
New York Life Insurance and Annuity
Corporation (NYLIAC) (A Delaware Corporation)
51 Madison Avenue, Room 551
New York, NY 10010
newyorklife.com
newyorklifeinvestments.com
NYLIFE Distributors LLC, 30 Hudson Street, Jersey City, NJ 07302
New York Life Investment Management LLC is the investment manager to the MainStay VP Funds Trust
©2024 by NYLIFE Distributors LLC. All rights reserved.
You may obtain copies of the Prospectus and the Statement of Additional Information free of charge, upon request, by calling toll-free 800-598-2019 or writing to New York Life Insurance and Annuity Corporation, 51 Madison Avenue, New York, NY 10010.
| Not FDIC Insured | No Bank Guarantee | May Lose Value |
(NYLIAC) NI515
MainStay VP PineStone International Equity Portfolio
(formerly known as MainStay VP MacKay International Equity Portfolio)
Message from the President and Annual Report
December 31, 2023
Special Notice:
Beginning in July 2024, new regulations issued by the Securities and Exchange Commission (SEC) will take effect requiring open-end mutual fund companies and ETFs to (1) overhaul the content of their shareholder reports and (2) mail paper copies of the new tailored shareholder reports to shareholders who have not opted to receive these documents electronically.
If you have not yet elected to receive your shareholder reports electronically, please contact your financial intermediary or visit our website.
| Not FDIC/NCUA Insured | Not a Deposit | May Lose Value | No Bank Guarantee | Not Insured by Any Government Agency |
This page intentionally left blank
Message from the President
Against a backdrop of easing inflationary pressures and continued economic growth, stocks and bonds generally gained ground during the 12-month period ended December 31, 2023, despite high levels of volatility and sharp disparities between the performance of the different market sectors.
Although the war in Ukraine, the outbreak of hostilities in the Middle East and several other notable events affected financial assets, inflation, interest rate, and economic growth trends stood at the forefront of market developments during most of the period. As the reporting period began, high levels of inflation already showed signs of easing in the face of aggressive rate hikes by U.S. Federal Reserve (the “Fed”). From a peak of 9.1% in June 2022, the annualized U.S. inflation rate dropped to 6.4% in January, and 3.4% in December 2023. At the same time, the Fed increased the benchmark federal funds rate from 4.25%–4.50% at the beginning of reporting period, to 5.25%–5.50% as of the end of 2023. Despite the increasing cost of capital and tighter lending environment that resulted from rising rates, economic growth remained surprisingly robust, bolstered by high levels of consumer spending, low levels of unemployment and better-than-expected corporate earnings. With the pace of rate increases slowing from the prior year, investors began hoping for an early shift to a looser monetary policy, with stock prices and bond yields reacting as economic data and statements from the Fed either reinforced or undercut those hopes. Following months of hawkish rhetoric, the Fed finally reversed its stance in December 2023, signaling a positive economic outlook with little chance of a recession and a likelihood of rate cuts in 2024.
The S&P 500® Index, a widely regarded benchmark of U.S. market performance, produced strong gains during the reporting period-– recovering all its losses from 2022 and approached new record territory. A preponderance of the Index’s gains were generated by a relatively small number of mega-cap stocks in the information technology, communication services and consumer discretionary sectors that stood to benefit from rapid developments in generative artificial intelligence (“AI”). Value-oriented, interest-rate sensitive and small-capitalization
shares lagged by significant margins, although market strength widened during the closing weeks of the reporting period. Most overseas equity markets trailed the U.S. market, as developed international economies experienced relatively low growth rates, and weak economic conditions in China undermined emerging markets.
Bonds produced generally positive returns, bolstered by attractive and relatively stable yields. The yield on the 10-year Treasury note hit a high of just under 5% in mid-October 2023, ranging between approximately 3.5% and 4.8% for most of the reporting period. The yield curve remained inverted throughout the year, with the 2-year Treasury yield modestly above the 10-year yield. Corporate bond prices trended moderately higher, generally outperforming government securities. After years of low yields and tight credit spreads, the corporate sector benefited from more attractive valuations and income opportunities. Among corporates, markets generally rewarded longer duration and lower credit quality, although an uptick in default rates posed added risks for high-yield corporate bonds. International bond markets produced mixed returns, with emerging-markets issues advancing over their developed-markets counterparts.
The market volatility of recent years reminds us of the constant need for experienced and steadfast portfolio management in the face of uncertainty. New York Life Investments remains dedicated to providing you, as a valued MainStay VP investor, with the guidance, resources and investment solutions you need to pursue your financial goals.
Thank you for trusting us to help meet your investment needs.
Sincerely,
Kirk C. Lehneis
President
The opinions expressed are as of the date of this report and are subject to change. There is no guarantee that any forecast made will come to pass. This material does not constitute investment advice and is not intended as an endorsement of any specific investment. Past performance is no guarantee of future results.
Not part of the Annual Report
Investors should refer to the Portfolio’s Summary Prospectus and/or Prospectus and consider the Portfolio’s investment objectives, strategies, risks, charges and expenses carefully before investing. The Summary Prospectus and/or Prospectus contain this and other information about the Portfolio. You may obtain copies of the Portfolio’s Summary Prospectus, Prospectus and Statement of Additional Information, which includes information about the MainStay VP Funds Trust's Trustees, free of charge, upon request, by calling toll-free 800-598-2019, by writing to New York Life Insurance and Annuity Corporation, 51 Madison Avenue, Room 251, New York, New York 10010 or by sending an email to MainStayShareholdersServices@nylim.com. These documents are also available at newyorklifeinvestments.com/investment-products/vp. Please read the Portfolio's Summary Prospectus and/or Prospectus carefully before investing. MainStay VP Funds Trust portfolios are separate account options which are purchased through a variable insurance or variable annuity contract.
Investment and Performance Comparison (Unaudited)
Performance data quoted represents past performance. Past performance is no guarantee of future results. Because of market volatility and other factors, current performance may be lower or higher than the figures shown. Investment return and principal value will fluctuate, and as a result, when shares are redeemed, they may be worth more or less than their original cost. The performance table and graph do not reflect any deduction of sales charges, mortality and expense charges, contract charges or administrative charges. Please refer to the Performance Summary appropriate for your policy. For performance information current to the most recent month-end, please call 800-598-2019 or visit www.newyorklife.com.
Performance figures may reflect certain fee waivers and/or expense limitations, without which total returns may have been different. For information on current fee waivers and/or expense limitations (if any), please refer to the Notes to Financial Statements.
| Average Annual Total Returns for the Year-Ended December 31, 2023 |
| Class | Inception
Date1 | One
Year | Five
Years | Ten
Years | Gross
Expense
Ratio2 |
| Initial Class Shares | 5/1/1995 | 4.27% | 5.36% | 4.11% | 0.86% |
| Service Class Shares | 6/5/2003 | 4.01 | 5.10 | 3.85 | 1.11 |
| 1. | Effective August 28, 2023, the Portfolio replaced its subadvisor, changed its investment objective and modified its principal investment strategies. The past performance in the graph and table prior to that date reflects the Portfolio's prior subadvisor and principal investment strategies. |
| 2. | The gross expense ratios presented reflect the Portfolio’s “Total Annual Portfolio Operating Expenses” from the most recent Prospectus and may differ from other expense ratios disclosed in this report. |
| Benchmark Performance* | One
Year | Five
Years | Ten
Years |
| MSCI EAFE® Index (Net)1 | 18.24% | 8.16% | 4.28% |
| MSCI ACWI® ex USA Index (Net)2 | 15.62 | 7.08 | 3.83 |
| Morningstar Foreign Large Growth Category Average3 | 16.18 | 8.42 | 5.02 |
| * | Returns for indices reflect no deductions for fees, expenses or taxes, except for foreign withholding taxes where applicable. Results assume reinvestment of all dividends and capital gains. An investment cannot be made directly in an index. |
| 1. | The Portfolio has selected the MSCI EAFE® Index (Net) as a replacement for the MSCI ACWI® (All Country World Index) ex USA Index (Net) because it believes that the MSCI EAFE® Index (Net) is more reflective of its principal investment strategies. The MSCI EAFE® Index (Net) is the Portfolio's primary benchmark. The MSCI EAFE® Index (Net) consists of international stocks representing the developed world outside of North America. |
| 2. | Prior to August 28, 2023, the MSCI ACWI® (All Country World Index) ex USA Index (Net) was the Portfolio's primary benchmark. The MSCI ACWI® ex USA Index (Net) is a free float-adjusted market capitalization weighted index that is designed to measure the equity market performance of developed and emerging markets, excluding the U.S. |
| 3. | The Morningstar Foreign Large Growth Category Average is representative of funds that focus on high-priced growth stocks, mainly outside of the United States. Most of these funds divide their assets among a dozen or more developed markets, including Japan, Britain, France, and Germany. These funds primarily invest in stocks that have market caps in the top 70% of each economically integrated market and will have less than 20% of assets invested in U.S. stocks. Results are based on average total returns of similar funds with all dividends and capital gain distributions reinvested. |
Cost in Dollars of a $1,000 Investment in MainStay VP PineStone International Equity Portfolio (Unaudited)
The example below is intended to describe the fees and expenses borne by shareholders during the six-month period from July 1, 2023 to December 31, 2023, and the impact of those costs on your investment.
Example
As a shareholder of the Portfolio you incur two types of costs: (1) transaction costs, including exchange fees and sales charges (loads) on purchases (as applicable), and (2) ongoing costs, including management fees, distribution and/or service (12b-1) fees and other Portfolio expenses (as applicable). This example is intended to help you understand your ongoing costs (in dollars) of investing in the Portfolio and to compare these costs with the ongoing costs of investing in other mutual funds. The example is based on an investment of $1,000 made at the beginning of the six-month period and held for the entire period from July 1, 2023 to December 31, 2023. Shares are only sold in connection with variable life and annuity contracts and the example does not reflect any contract level or transactional fees or expenses. If these costs had been included, your costs would have been higher.
This example illustrates your Portfolio’s ongoing costs in two ways:
Actual Expenses
The second and third data columns in the table below provide information about actual account values and actual expenses. You may use the information in these columns, together with the amount you invested, to estimate the expenses that you paid during the six months ended
December 31, 2023. Simply divide your account value by $1,000 (for example, an $8,600 account value divided by $1,000 = 8.6), then multiply the result by the number under the heading entitled “Expenses Paid During Period” to estimate the expenses you paid on your account during this period.
Hypothetical Example for Comparison Purposes
The fourth and fifth data columns in the table below provide information about hypothetical account values and hypothetical expenses based on the Portfolio’s actual expense ratio and an assumed rate of return of 5% per year before expenses, which is not the Portfolio’s actual return. The hypothetical account values and expenses may not be used to estimate the actual ending account balances or expenses you paid for the six-month period shown. You may use this information to compare the ongoing costs of investing in the Portfolio with the ongoing costs of investing in other mutual funds. To do so, compare this 5% hypothetical example with the 5% hypothetical examples that appear in the shareholder reports of the other mutual funds.
Please note that the expenses shown in the table are meant to highlight your ongoing costs only and do not reflect any transactional costs, such as exchange fees or sales charges (loads). Therefore, the fourth and fifth data columns of the table are useful in comparing ongoing costs only and will not help you determine the relative total costs of owning different funds. In addition, if these transactional costs were included, your costs would have been higher.
| Share Class | Beginning
Account
Value
7/1/23 | Ending Account
Value (Based
on Actual
Returns and
Expenses)
12/31/23 | Expenses
Paid
During
Period1 | Ending Account
Value (Based
on Hypothetical
5% Annualized
Return and
Actual Expenses)
12/31/23 | Expenses
Paid
During
Period1 | Net Expense
Ratio
During
Period2 |
| Initial Class Shares | $1,000.00 | $986.90 | $4.51 | $1,020.67 | $4.58 | 0.90% |
| Service Class Shares | $1,000.00 | $985.60 | $5.76 | $1,019.41 | $5.85 | 1.15% |
| 1. | Expenses are equal to the Portfolio’s annualized expense ratio of each class multiplied by the average account value over the period, divided by 365 and multiplied by 184 (to reflect the six-month period). The table above represents the actual expenses incurred during the six-month period. In addition to the fees and expenses which the Portfolio bears directly, it also indirectly bears a pro rata share of the fees and expenses of the underlying funds in which it invests. Such indirect expenses are not included in the above-reported expense figures. |
| 2. | Expenses are equal to the Portfolio's annualized expense ratio to reflect the six-month period. |
| 6 | MainStay VP PineStone International Equity Portfolio |
Country Composition as of December 31, 2023 (Unaudited)
| United Kingdom | 25.0% |
| France | 16.2 |
| United States | 12.7 |
| Switzerland | 10.9 |
| Japan | 7.2 |
| Denmark | 6.7 |
| Taiwan | 5.8 |
| Germany | 4.4 |
| Netherlands | 3.6% |
| Canada | 3.2 |
| India | 2.2 |
| Australia | 2.0 |
| Other Assets, Less Liabilities | 0.1 |
| | 100.0% |
See Portfolio of Investments beginning on page 11 for specific holdings within these categories. The Portfolio's holdings are subject to change.
Top Ten Holdings and/or Issuers Held as of December 31, 2023 (excluding short-term investments) (Unaudited)
| 1. | Novo Nordisk A/S, Class B |
| 2. | Taiwan Semiconductor Manufacturing Co. Ltd., Sponsored ADR |
| 3. | Nestle SA (Registered) |
| 4. | London Stock Exchange Group plc |
| 5. | LVMH Moet Hennessy Louis Vuitton SE |
| 6. | InterContinental Hotels Group plc |
| 7. | Air Liquide SA |
| 8. | EssilorLuxottica SA |
| 9. | L'Oreal SA |
| 10. | ASML Holding NV |
Portfolio Management Discussion and Analysis (Unaudited)
Answers to the questions reflect the views of Carlos Garcia-Tunon, CFA, Ian Murdoch, CFA, and Lawrence Rosenberg, CFA, of MacKay Shields LLC, the Portfolio’s former Subadvisor, and Nadim Rizk, CFA, and Andrew Chan of PineStone Asset Management Inc. (“PineStone”), the Portfolio’s current Subadvisor.
How did MainStay VP PineStone International Equity Portfolio perform relative to its benchmarks and peers during the 12 months ended December 31, 2023?
For the 12 months ended December 31, 2023, MainStay VP PineStone International Equity Portfolio returned 4.27% for Initial Class shares and 4.01% for Service Class shares. Over the same period, both share classes underperformed the 18.24% return of the MSCI EAFE® Index (Net), which is the Portfolio’s primary benchmark, and the 15.62% return of the MSCI® ACWI ex USA Index (Net), which is the Portfolio's former primary benchmark. For the 12 months ended December 31, 2023, both share classes also underperformed the 16.18% return of the Morningstar Foreign Large Growth Category Average.1
Were there any changes to the Portfolio during the reporting period?
At a meeting held on May 2, 2023, the Board of Trustees of MainStay VP Funds Trust considered and approved, among other related proposals: (i) appointing PineStone Asset Management Inc. as the Portfolio’s subadvisor, and the related subadvisory agreement; (ii) changing the Portfolio’s name and reducing its management fee; (iii) changing the Portfolio’s investment objective; (iv) changing the Portfolio’s primary benchmark; and (v) modifying the Portfolio's principal investment strategies and investment process. For more information on these and other changes refer to the supplement dated May 9, 2023.
Effective August 28, 2023, the MainStay VP MacKay International Equity Portfolio was renamed the MainStay VP PineStone International Equity Portfolio and the other changes relating to that change also took place.
In the process of implementing the new principal investment strategies and investment process, the Portfolio may have experienced a high level of portfolio turnover. Also, during this transition period, the Portfolio may not have been pursuing its investment objective or may not have been managed consistent with its investment strategies as stated in the Prospectus. This may have impacted the Portfolio’s performance.
During the reporting period, were there any market events that materially impacted the Portfolio’s performance or liquidity?
MacKay Shields
The market events that likely impacted the Portfolio’s performance most during the time MacKay Shields managed the Portfolio included the stickiness of inflationary pressures and the sharp rise in interest rates that followed. These trends put cost pressures on many companies, raised borrowing costs and impacted the
valuations of many securities—especially the type of long-duration growth equities in which the Portfolio invests.
PineStone
There were no market events impacting performance or liquidity during the period that PineStone managed the Portfolio.
What factors affected the Portfolio’s relative performance during the reporting period?
MacKay Shields
During the time MacKay Shields managed the Portfolio, observed through a multi-factor attribution lens, negative contributions from stock selection primarily drove the Portfolio’s underperformance relative to the MSCI ACWI® ex USA Index (Net)—which was the Portfolio’s primary benchmark during the time MacKay managed the Portfolio—followed by a negative effect from country allocation. (Contributions take weightings and total returns into account.) Positive contributions from industry and currency allocation partly offset these negative effects.
PineStone
During the time PineStone managed the Portfolio, security selection largely drove underperformance relative to the MSCI EAFE® Index (Net).
Which sectors were the strongest positive contributors to the Portfolio’s relative performance, and which sectors were particularly weak?
MacKay Shields
During the time MacKay Shields managed the Portfolio, the strongest positive contributions to performance relative to the MSCI ACWI® ex USA Index (Net) came from the health care and communication services sectors. During the same period, the industrials, materials and consumer discretionary sectors provided the weakest contributions to relative performance.
PineStone
During the time PineStone managed the Portfolio, the strongest positive contributions to performance relative to the MSCI EAFE® Index (Net) came from the industrials, health care and energy sectors. Not owning any positions in the lagging energy sector contributed positively as well. During the same period, the consumer staples, materials and financials sectors were the most significant detractors from relative performance.
During the reporting period, which individual stocks made the strongest positive contributions to the Portfolio’s absolute performance and which stocks detracted the most?
MacKay Shields
During the time MacKay Shields managed the Portfolio, the top
| 1. | See "Investment and Performance Comparison" for more information on benchmark and peer group returns. |
| 8 | MainStay VP PineStone International Equity Portfolio |
contributors to the Portfolio's absolute performance included positions in Irish clinical research outsourcer ICON, Swiss contract development and manufacturing organization Lonza, and Dutch payment solutions provider Adyen. Shares in ICON and Lonza benefited from both companies’ strong financial results, validating the relative resilience of their business models against a challenging economic backdrop. Adyen shares outperformed after investor sentiment regarding certain high-growth stocks appeared to trough, leading to a period of multiple expansion.
The most significant detractors from absolute performance during the same period were French customer relationship management services firm Teleperformance, French pharmaceutical and laboratory equipment supplier Sartorius Stedim Biotech, and Japanese outsourced corporate benefits provider Benefit One. Teleperformance shares suffered a loss of investor confidence following news of labor complaints in the company’s Colombia operation, as well as concerns about the potential impact of artificial intelligence (“AI”) on its business model. Sartorius Stedim Biotech and Benefit One shares underperformed due to the companies’ disappointing financial results or reductions to near-term financial guidance from management.
PineStone
During the time PineStone managed the Portfolio, the leading contributors to the Portfolio’s absolute performance included positions in the UK-based leading hospitality company InterContinental Hotels Group, Denmark-based pharmaceutical giant Novo Nordisk, and the UK-based financials and data business, London Stock Exchange Group (LSEG). Shares in InterContinental benefited from the company’s strong financial results and increased occupancy across its hotels globally. The company continues to focus on new builds, converting existing hotel brands and its loyalty program, among other items. Shares in Novo Nordisk benefited from mainstream adoption of the company’s obesity/weight-loss and diabetes drugs. Studies revealed that Novo Nordisk’s weight loss drugs may materially reduce patients’ risks of cardiovascular disease. London Stock Exchange shares benefited from increased market appreciation for the company’s integration of Refinitiv, a financial market data and infrastructure provider acquired by LSEG in 2021. Additionally, with what we believe are strong assets across data, trade execution and other areas, the business was seen as well positioned to offer increasingly more value-added services to clients.
The most significant detractors from absolute performance during the same period were UK-based alcohol manufacturer Diageo, Swiss multinational food and drink conglomerate Nestlé, and the French luxury goods giant LVMH. Diageo shares underperformed following concerns of North American companies destocking inventories and a negative revision to the outlook for the company’s Latin America segment. Nestlé shares underperformed after the company’s financial results fell short of fairly bullish
expectations set by management earlier in 2023. Additionally, IT integration challenges impacted the company’s North American health sciences business. LVMH shares underperformed slightly as the company’s financial results missed lofty expectations. Management cited a slight slowdown in U.S. spending, with aspirational customer demand lower than in prior reporting periods.
Did the Portfolio make any significant purchases or sales during the reporting period?
MacKay Shields
During the time MacKay Shields managed the Portfolio, the most notable purchases included a new position in Spanish travel transaction processor Amadeus IT Group, and additional exposure to French 3D product design software company Dassault Systèmes. The Portfolio’s largest sales during the same period included the full sale of a position in Dutch nutrition, health and beauty solutions provider DSM-Firmenich.
PineStone
During the time PineStone managed the Portfolio, we did not fully exit nor initiate any positions. We did, however, trim the Portfolio’s existing position in Novo Nordisk, described above.
How did the Portfolio’s sector weightings change during the reporting period?
MacKay Shields
During the time MacKay Shields managed the Portfolio, the largest increases in sector exposures relative to the MSCI ACWI® ex USA Index (Net) occurred in the financials and consumer discretionary sectors. Conversely, the most significant decreases in sector exposure were in materials and industrials. However, note that changes to the Global Industry Classification Standard (GICS®) sector structure in March 2023 meaningfully affected these sector weighting changes.
PineStone
During the time PineStone managed the Portfolio, the largest increases in sector exposures relative to the MSCI EAFE® Index (Net) occurred in the industrials and consumer discretionary sectors. Conversely, the most significant decreases in relative sector exposure were in the consumer staples and health care sectors. Sector allocations are residual of our bottom-up stock selection process.
How was the Portfolio positioned at the end of the reporting period?
As of December 31, 2023, the Portfolio held its largest overweight positions relative to the MSCI EAFE® Index (Net) in the information technology, consumer discretionary and industrials sectors. As of the same date, the Portfolio held its most significantly
underweight exposures to the financials, energy and consumer discretionary sectors.
The opinions expressed are those of the portfolio managers as of the date of this report and are subject to change. There is no guarantee that any forecasts will come to pass. This material does not constitute investment advice and is not intended as an endorsement of any specific investment.
Not all MainStay VP Portfolios and/or share classes are available under all policies.
| 10 | MainStay VP PineStone International Equity Portfolio |
Portfolio of Investments December 31, 2023†^
| | Shares | Value |
| Common Stocks 99.9% |
| Australia 2.0% |
| Commonwealth Bank of Australia (Banks) | 125,309 | $ 9,546,805 |
| Canada 3.2% |
| Canadian National Railway Co. (Ground Transportation) | 120,218 | 15,102,987 |
| Denmark 6.7% |
| Novo Nordisk A/S, Class B (Pharmaceuticals) | 303,530 | 31,379,196 |
| France 16.2% |
| Air Liquide SA (Chemicals) | 96,276 | 18,718,719 |
| EssilorLuxottica SA (Health Care Equipment & Supplies) | 91,153 | 18,274,109 |
| L'Oreal SA (Personal Care Products) | 36,367 | 18,092,403 |
| LVMH Moet Hennessy Louis Vuitton SE (Textiles, Apparel & Luxury Goods) | 26,341 | 21,332,462 |
| | | 76,417,693 |
| Germany 4.4% |
| Rational AG (Machinery) | 8,974 | 6,929,840 |
| SAP SE (Software) | 90,885 | 13,994,376 |
| | | 20,924,216 |
| India 2.2% |
| HDFC Bank Ltd., ADR (Banks) | 151,606 | 10,174,279 |
| Japan 7.2% |
| Keyence Corp. (Electronic Equipment, Instruments & Components) | 38,400 | 16,917,787 |
| Shimano, Inc. (Leisure Products) | 62,200 | 9,632,177 |
| Unicharm Corp. (Household Products) | 205,600 | 7,433,680 |
| | | 33,983,644 |
| Netherlands 3.6% |
| ASML Holding NV (Semiconductors & Semiconductor Equipment) | 22,601 | 17,008,670 |
| Switzerland 10.9% |
| Alcon, Inc. (Health Care Equipment & Supplies) | 155,838 | 12,162,423 |
| Cie Financiere Richemont SA (Registered) (Textiles, Apparel & Luxury Goods) | 107,443 | 14,786,906 |
| Geberit AG (Registered) (Building Products) | 18,541 | 11,882,289 |
| Schindler Holding AG (Machinery) | 50,442 | 12,612,749 |
| | | 51,444,367 |
| Taiwan 5.8% |
| Taiwan Semiconductor Manufacturing Co. Ltd., Sponsored ADR (Semiconductors & Semiconductor Equipment) | 264,833 | 27,542,632 |
| | Shares | | Value |
| |
| United Kingdom 25.0% |
| Ashtead Group plc (Trading Companies & Distributors) | 147,563 | | $ 10,273,540 |
| Bunzl plc (Trading Companies & Distributors) | 242,774 | | 9,871,515 |
| Diageo plc (Beverages) | 422,462 | | 15,379,308 |
| Howden Joinery Group plc (Trading Companies & Distributors) | 1,151,005 | | 11,936,558 |
| InterContinental Hotels Group plc (Hotels, Restaurants & Leisure) | 221,166 | | 19,987,365 |
| Intertek Group plc (Professional Services) | 164,116 | | 8,882,227 |
| London Stock Exchange Group plc (Capital Markets) | 200,637 | | 23,717,509 |
| Spirax-Sarco Engineering plc (Machinery) | 73,514 | | 9,843,670 |
| Unilever plc (Personal Care Products) | 161,874 | | 7,836,924 |
| | | | 117,728,616 |
| United States 12.7% |
| Aon plc, Class A (Insurance) | 28,932 | | 8,419,791 |
| Nestle SA (Registered) (Food Products) | 230,586 | | 26,733,774 |
| Roche Holding AG (Pharmaceuticals) | 28,084 | | 8,164,245 |
| S&P Global, Inc. (Capital Markets) | 37,929 | | 16,708,483 |
| | | | 60,026,293 |
Total Common Stocks
(Cost $441,020,297) | | | 471,279,398 |
| Short-Term Investment 0.0% ‡ |
| Affiliated Investment Company 0.0% ‡ |
| United States 0.0% ‡ |
| MainStay U.S. Government Liquidity Fund, 5.235% (a) | 83,001 | | 83,001 |
Total Short-Term Investment
(Cost $83,001) | | | 83,001 |
Total Investments
(Cost $441,103,298) | 99.9% | | 471,362,399 |
| Other Assets, Less Liabilities | 0.1 | | 586,576 |
| Net Assets | 100.0% | | $ 471,948,975 |
| † | Percentages indicated are based on Portfolio net assets. |
| ^ | Industry and country classifications may be different than those used for compliance monitoring purposes. |
| ‡ | Less than one-tenth of a percent. |
| (a) | Current yield as of December 31, 2023. |
The notes to the financial statements are an integral part of, and should be read in conjunction with, the financial statements.
11
Portfolio of Investments December 31, 2023†^ (continued)
Investments in Affiliates (in 000's)
Investments in issuers considered to be affiliate(s) of the Portfolio during the year ended December 31, 2023 for purposes of Section 2(a)(3) of the Investment Company Act of 1940, as amended, were as follows:
| Affiliated Investment Companies | Value,
Beginning
of Year | Purchases
at Cost | Proceeds
from
Sales | Net
Realized
Gain/(Loss)
on Sales | Change in
Unrealized
Appreciation/
(Depreciation) | Value,
End of
Year | Dividend
Income | Other
Distributions | Shares
End of
Year |
| MainStay U.S. Government Liquidity Fund | $ 872 | $ 188,098 | $ (188,887) | $ — | $ — | $ 83 | $ 129 | $ — | 83 |
| Abbreviation(s): |
| ADR—American Depositary Receipt |
The following is a summary of the fair valuations according to the inputs used as of December 31, 2023, for valuing the Portfolio’s assets:
| Description | Quoted
Prices in
Active
Markets for
Identical
Assets
(Level 1) | | Significant
Other
Observable
Inputs
(Level 2) | | Significant
Unobservable
Inputs
(Level 3) | | Total |
| Asset Valuation Inputs | | | | | | | |
| Investments in Securities (a) | | | | | | | |
| Common Stocks | $ 471,279,398 | | $ — | | $ — | | $ 471,279,398 |
| Short-Term Investment | | | | | | | |
| Affiliated Investment Company | 83,001 | | — | | — | | 83,001 |
| Total Investments in Securities | $ 471,362,399 | | $ — | | $ — | | $ 471,362,399 |
| (a) | For a complete listing of investments and their industries, see the Portfolio of Investments. |
The notes to the financial statements are an integral part of, and should be read in conjunction with, the financial statements.
| 12 | MainStay VP PineStone International Equity Portfolio |
Industry Diversification
| | Value | | Percent †^ |
| Banks | $ 19,721,084 | | 4.2% |
| Beverages | 15,379,308 | | 3.3 |
| Building Products | 11,882,289 | | 2.5 |
| Capital Markets | 40,425,992 | | 8.6 |
| Chemicals | 18,718,719 | | 4.0 |
| Electronic Equipment, Instruments & Components | 16,917,787 | | 3.6 |
| Food Products | 26,733,774 | | 5.7 |
| Ground Transportation | 15,102,987 | | 3.2 |
| Health Care Equipment & Supplies | 30,436,532 | | 6.4 |
| Hotels, Restaurants & Leisure | 19,987,365 | | 4.2 |
| Household Products | 7,433,680 | | 1.6 |
| Insurance | 8,419,791 | | 1.8 |
| Leisure Products | 9,632,177 | | 2.0 |
| Machinery | 29,386,259 | | 6.2 |
| Personal Care Products | 25,929,327 | | 5.5 |
| Pharmaceuticals | 39,543,441 | | 8.4 |
| Professional Services | 8,882,227 | | 1.9 |
| Semiconductors & Semiconductor Equipment | 44,551,302 | | 9.4 |
| Software | 13,994,376 | | 3.0 |
| Textiles, Apparel & Luxury Goods | 36,119,368 | | 7.6 |
| Trading Companies & Distributors | 32,081,613 | | 6.8 |
| | 471,279,398 | | 99.9 |
| Short-Term Investment | 83,001 | | 0.0‡ |
| Other Assets, Less Liabilities | 586,576 | | 0.1 |
| Net Assets | $471,948,975 | | 100.0% |
| † | Percentages indicated are based on Portfolio net assets. |
| ^ | Industry and country classifications may be different than those used for compliance monitoring purposes. |
| ‡ | Less than one-tenth of a percent. |
The notes to the financial statements are an integral part of, and should be read in conjunction with, the financial statements.
13
Statement of Assets and Liabilities as of December 31, 2023
| Assets |
Investment in unaffiliated securities, at value
(identified cost $441,020,297) | $471,279,398 |
Investment in affiliated investment companies, at value
(identified cost $83,001) | 83,001 |
Cash denominated in foreign currencies
(identified cost $503,630) | 520,566 |
| Receivables: | |
| Dividends | 854,445 |
| Portfolio shares sold | 32,924 |
| Other assets | 2,681 |
| Total assets | 472,773,015 |
| Liabilities |
| Due to custodian | 93 |
| Payables: | |
| Portfolio shares redeemed | 386,458 |
| Manager (See Note 3) | 313,101 |
| NYLIFE Distributors (See Note 3) | 47,329 |
| Professional fees | 46,400 |
| Custodian | 28,189 |
| Shareholder communication | 1,621 |
| Accrued expenses | 849 |
| Total liabilities | 824,040 |
| Net assets | $471,948,975 |
| Composition of Net Assets |
| Shares of beneficial interest outstanding (par value of $.001 per share) unlimited number of shares authorized | $ 44,390 |
| Additional paid-in-capital | 553,606,906 |
| | 553,651,296 |
| Total distributable earnings (loss) | (81,702,321) |
| Net assets | $471,948,975 |
| Initial Class | |
| Net assets applicable to outstanding shares | $244,913,570 |
| Shares of beneficial interest outstanding | 22,829,421 |
| Net asset value per share outstanding | $ 10.73 |
| Service Class | |
| Net assets applicable to outstanding shares | $227,035,405 |
| Shares of beneficial interest outstanding | 21,560,568 |
| Net asset value per share outstanding | $ 10.53 |
The notes to the financial statements are an integral part of, and should be read in conjunction with, the financial statements.
| 14 | MainStay VP PineStone International Equity Portfolio |
Statement of Operations for the year ended December 31, 2023
| Investment Income (Loss) |
| Income | |
| Dividends-unaffiliated (net of foreign tax withholding of $637,396) | $ 7,069,830 |
| Dividends-affiliated | 128,910 |
| Securities lending, net | 13,015 |
| Total income | 7,211,755 |
| Expenses | |
| Manager (See Note 3) | 3,945,900 |
| Distribution/Service—Service Class (See Note 3) | 568,429 |
| Professional fees | 163,999 |
| Custodian | 75,866 |
| Trustees | 11,741 |
| Shareholder communication | 7,994 |
| Miscellaneous | 12,673 |
| Total expenses | 4,786,602 |
| Net investment income (loss) | 2,425,153 |
| Realized and Unrealized Gain (Loss) |
| Net realized gain (loss) on: | |
| Unaffiliated investment transactions(a) | (40,369,908) |
| Foreign currency transactions | (13,743) |
| Net realized gain (loss) | (40,383,651) |
| Net change in unrealized appreciation (depreciation) on: | |
| Unaffiliated investments(b) | 57,978,479 |
| Translation of other assets and liabilities in foreign currencies | 92,000 |
| Net change in unrealized appreciation (depreciation) | 58,070,479 |
| Net realized and unrealized gain (loss) | 17,686,828 |
| Net increase (decrease) in net assets resulting from operations | $ 20,111,981 |
| (a) | Realized gain (loss) on security transactions recorded net of foreign capital gains tax in the amount of $(400,126). |
| (b) | Net change in unrealized appreciation (depreciation) on investments recorded net of foreign capital gains tax in the amount of $301,599. |
The notes to the financial statements are an integral part of, and should be read in conjunction with, the financial statements.
15
Statements of Changes in Net Assets
for the years ended December 31, 2023 and December 31, 2022
| | 2023 | 2022 |
| Increase (Decrease) in Net Assets |
| Operations: | | |
| Net investment income (loss) | $ 2,425,153 | $ (31,905) |
| Net realized gain (loss) | (40,383,651) | (71,744,140) |
| Net change in unrealized appreciation (depreciation) | 58,070,479 | (85,428,146) |
| Net increase (decrease) in net assets resulting from operations | 20,111,981 | (157,204,191) |
| Distributions to shareholders: | | |
| Initial Class | — | (42,204,462) |
| Service Class | — | (47,989,156) |
| Total distributions to shareholders | — | (90,193,618) |
| Capital share transactions: | | |
| Net proceeds from sales of shares | 114,523,839 | 56,783,387 |
| Net asset value of shares issued to shareholders in reinvestment of distributions | — | 90,193,618 |
| Cost of shares redeemed | (104,097,981) | (46,049,495) |
| Increase (decrease) in net assets derived from capital share transactions | 10,425,858 | 100,927,510 |
| Net increase (decrease) in net assets | 30,537,839 | (146,470,299) |
| Net Assets |
| Beginning of year | 441,411,136 | 587,881,435 |
| End of year | $ 471,948,975 | $ 441,411,136 |
The notes to the financial statements are an integral part of, and should be read in conjunction with, the financial statements.
| 16 | MainStay VP PineStone International Equity Portfolio |
Financial Highlights selected per share data and ratios
| | Year Ended December 31, |
| Initial Class | 2023 | | 2022 | | 2021 | | 2020 | | 2019 |
| Net asset value at beginning of year | $ 10.29 | | $ 17.98 | | $ 18.43 | | $ 16.21 | | $ 14.99 |
| Net investment income (loss) (a) | 0.07 | | 0.02 | | 0.07 | | 0.03 | | 0.12 |
| Net realized and unrealized gain (loss) | 0.37 | | (5.06) | | 2.12 | | 3.24 | | 3.31 |
| Total from investment operations | 0.44 | | (5.04) | | 2.19 | | 3.27 | | 3.43 |
| Less distributions: | | | | | | | | | |
| From net investment income | — | | (0.04) | | (0.02) | | (0.12) | | (0.08) |
| From net realized gain on investments | — | | (2.61) | | (2.62) | | (0.93) | | (2.13) |
| Total distributions | — | | (2.65) | | (2.64) | | (1.05) | | (2.21) |
| Net asset value at end of year | $ 10.73 | | $ 10.29 | | $ 17.98 | | $ 18.43 | | $ 16.21 |
| Total investment return (b) | 4.28%(c) | | (26.45)% | | 12.24% | | 20.85% | | 24.80% |
| Ratios (to average net assets)/Supplemental Data: | | | | | | | | | |
| Net investment income (loss) | 0.65% | | 0.12% | | 0.37% | | 0.16% | | 0.74% |
| Net expenses (d) | 0.92% | | 0.95% | | 0.93% | | 0.96% | | 0.96% |
| Portfolio turnover rate | 155% | | 102% | | 86% | | 135% | | 66% |
| Net assets at end of year (in 000's) | $ 244,914 | | $ 205,666 | | $ 266,747 | | $ 245,101 | | $ 209,278 |
| (a) | Per share data based on average shares outstanding during the year. |
| (b) | Total return does not reflect any deduction of sales charges, mortality and expense charges, contract charges or administrative charges. For periods of less than one year, total return is not annualized. |
| (c) | Total investment return may reflect adjustments to conform to generally accepted accounting principles. |
| (d) | In addition to the fees and expenses which the Portfolio bears directly, it also indirectly bears a pro-rata share of the fees and expenses of the underlying funds in which it invests. Such indirect expenses are not included in the above expense ratios. |
| | Year Ended December 31, |
| Service Class | 2023 | | 2022 | | 2021 | | 2020 | | 2019 |
| Net asset value at beginning of year | $ 10.12 | | $ 17.75 | | $ 18.24 | | $ 16.06 | | $ 14.86 |
| Net investment income (loss) (a) | 0.04 | | (0.02) | | 0.02 | | (0.01) | | 0.08 |
| Net realized and unrealized gain (loss) | 0.37 | | (5.00) | | 2.11 | | 3.20 | | 3.28 |
| Total from investment operations | 0.41 | | (5.02) | | 2.13 | | 3.19 | | 3.36 |
| Less distributions: | | | | | | | | | |
| From net investment income | — | | — | | — | | (0.08) | | (0.03) |
| From net realized gain on investments | — | | (2.61) | | (2.62) | | (0.93) | | (2.13) |
| Total distributions | — | | (2.61) | | (2.62) | | (1.01) | | (2.16) |
| Net asset value at end of year | $ 10.53 | | $ 10.12 | | $ 17.75 | | $ 18.24 | | $ 16.06 |
| Total investment return (b) | 4.05%(c) | | (26.63)% | | 11.96% | | 20.54% | | 24.49% |
| Ratios (to average net assets)/Supplemental Data: | | | | | | | | | |
| Net investment income (loss) | 0.41% | | (0.12)% | | 0.12% | | (0.08)% | | 0.52% |
| Net expenses (d) | 1.17% | | 1.20% | | 1.18% | | 1.21% | | 1.21% |
| Portfolio turnover rate | 155% | | 102% | | 86% | | 135% | | 66% |
| Net assets at end of year (in 000's) | $ 227,035 | | $ 235,745 | | $ 321,135 | | $ 315,244 | | $ 303,135 |
| (a) | Per share data based on average shares outstanding during the year. |
| (b) | Total return does not reflect any deduction of sales charges, mortality and expense charges, contract charges or administrative charges. For periods of less than one year, total return is not annualized. |
| (c) | Total investment return may reflect adjustments to conform to generally accepted accounting principles. |
| (d) | In addition to the fees and expenses which the Portfolio bears directly, it also indirectly bears a pro-rata share of the fees and expenses of the underlying funds in which it invests. Such indirect expenses are not included in the above expense ratios. |
The notes to the financial statements are an integral part of, and should be read in conjunction with, the financial statements.
17
Notes to Financial Statements
Note 1–Organization and Business
MainStay VP Funds Trust (the “Fund”) was organized as a Delaware statutory trust on February 1, 2011. The Fund is registered under the Investment Company Act of 1940, as amended (the “1940 Act”), as an open-end management investment company. The Fund is comprised of thirty-one separate series (collectively referred to as the “Portfolios”). These financial statements and notes relate to the MainStay VP PineStone International Equity Portfolio (formerly known as MainStay VP MacKay International Equity Portfolio) (the "Portfolio"), a "diversified” portfolio, as that term is defined in the 1940 Act, as interpreted or modified by regulatory authorities having jurisdiction, from time to time.
Shares of the Portfolio are currently offered to certain separate accounts to fund variable annuity policies and variable universal life insurance policies issued by New York Life Insurance and Annuity Corporation (“NYLIAC”), a wholly-owned subsidiary of New York Life Insurance Company (“New York Life”) and may also be offered to fund variable annuity policies and variable universal life insurance policies issued by other insurance companies. NYLIAC allocates shares of the Portfolio to, among others, certain NYLIAC separate accounts. Shares of the Portfolio are also offered to the MainStay VP Conservative Allocation Portfolio, MainStay VP Moderate Allocation Portfolio, MainStay VP Growth Allocation Portfolio and MainStay VP Equity Allocation Portfolio, which operate as “funds-of-funds," and other variable insurance funds.
The following table lists the Portfolio's share classes that have been registered and commenced operations:
| Class | Commenced Operations |
| Initial Class | May 1, 1995 |
| Service Class | June 5, 2003 |
Shares of the Portfolio are offered and are redeemed at a price equal to their respective net asset value (“NAV”) per share. No sales or redemption charge is applicable to the purchase or redemption of the Portfolio's shares. Under the terms of the Fund’s multiple class plan, adopted pursuant to Rule 18f-3 under the 1940 Act, the classes differ in that, among other things, Service Class shares of the Portfolio pay a combined distribution and service fee of 0.25% of average daily net assets attributable to Service Class shares of the Portfolio to the Distributor (as defined in Note 3(B)) pursuant to a plan adopted in accordance with Rule 12b-1 under the 1940 Act. Contract owners of variable annuity contracts purchased after June 2, 2003, are permitted to invest only in the Service Class shares.
The Portfolio's investment objective is to seek long-term growth of capital.
Note 2–Significant Accounting Policies
The Portfolio is an investment company and accordingly follows the investment company accounting and reporting guidance of the Financial Accounting Standards Board (“FASB”) Accounting Standards Codification Topic 946 Financial Services—Investment Companies. The Portfolio
prepares its financial statements in accordance with generally accepted accounting principles (“GAAP”) in the United States of America and follows the significant accounting policies described below.
(A) Securities Valuation. Investments are usually valued as of the close of regular trading on the New York Stock Exchange (the "Exchange") (usually 4:00 p.m. Eastern time) on each day the Portfolio is open for business ("valuation date").
Pursuant to Rule 2a-5 under the 1940 Act, the Board of Trustees of the Fund (the "Board") has designated New York Life Investment Management LLC (“New York Life Investments” or the "Manager") as its Valuation Designee (the "Valuation Designee"). The Valuation Designee is responsible for performing fair valuations relating to all investments in the Portfolio’s portfolio for which market quotations are not readily available; periodically assessing and managing material valuation risks; establishing and applying fair value methodologies; testing fair valuation methodologies; evaluating and overseeing pricing services; ensuring appropriate segregation of valuation and portfolio management functions; providing quarterly, annual and prompt reporting to the Board, as appropriate; identifying potential conflicts of interest; and maintaining appropriate records. The Valuation Designee has established a valuation committee ("Valuation Committee") to assist in carrying out the Valuation Designee’s responsibilities and establish prices of securities for which market quotations are not readily available. The Portfolio's and the Valuation Designee's policies and procedures ("Valuation Procedures") govern the Valuation Designee’s selection and application of methodologies for determining and calculating the fair value of Portfolio investments. The Valuation Designee may value the Portfolio's portfolio securities for which market quotations are not readily available and other Portfolio assets utilizing inputs from pricing services and other third-party sources. The Valuation Committee meets (in person, via electronic mail or via teleconference) on an ad-hoc basis to determine fair valuations and on a quarterly basis to review fair value events with respect to certain securities for which market quotations are not readily available, including valuation risks and back-testing results, and to preview reports to the Board.
The Valuation Committee establishes prices of securities for which market quotations are not readily available based on such methodologies and measurements on a regular basis after considering information that is reasonably available and deemed relevant by the Valuation Committee. The Board shall oversee the Valuation Designee and review fair valuation materials on a prompt, quarterly and annual basis and approve proposed revisions to the Valuation Procedures.
Investments for which market quotations are not readily available are valued at fair value as determined in good faith pursuant to the Valuation Procedures. A market quotation is readily available only when that quotation is a quoted price (unadjusted) in active markets for identical investments that the Portfolio can access at the measurement date, provided that a quotation will not be readily available if it is not reliable. "Fair value" is defined as the price the Portfolio would reasonably expect to receive upon selling an asset or liability in an orderly transaction to an
| 18 | MainStay VP PineStone International Equity Portfolio |
independent buyer in the principal or most advantageous market for the asset or liability. Fair value measurements are determined within a framework that establishes a three-tier hierarchy that maximizes the use of observable market data and minimizes the use of unobservable inputs to establish a classification of fair value measurements for disclosure purposes. "Inputs" refer broadly to the assumptions that market participants would use in pricing the asset or liability, including assumptions about risk, such as the risk inherent in a particular valuation technique used to measure fair value using a pricing model and/or the risk inherent in the inputs for the valuation technique. Inputs may be observable or unobservable. Observable inputs reflect the assumptions market participants would use in pricing the asset or liability based on market data obtained from sources independent of the Portfolio. Unobservable inputs reflect the Portfolio’s own assumptions about the assumptions market participants would use in pricing the asset or liability based on the information available. The inputs or methodology used for valuing assets or liabilities may not be an indication of the risks associated with investing in those assets or liabilities. The three-tier hierarchy of inputs is summarized below.
| • | Level 1—quoted prices (unadjusted) in active markets for an identical asset or liability |
| • | Level 2—other significant observable inputs (including quoted prices for a similar asset or liability in active markets, interest rates and yield curves, prepayment speeds, credit risk, etc.) |
| • | Level 3—significant unobservable inputs (including the Portfolio's own assumptions about the assumptions that market participants would use in measuring fair value of an asset or liability) |
The level of an asset or liability within the fair value hierarchy is based on the lowest level of an input, both individually and in the aggregate, that is significant to the fair value measurement. The aggregate value by input level of the Portfolio’s assets and liabilities as of December 31, 2023, is included at the end of the Portfolio of Investments.
The Portfolio may use third-party vendor evaluations, whose prices may be derived from one or more of the following standard inputs, among others:
| • Broker/dealer quotes | • Benchmark securities |
| • Two-sided markets | • Reference data (corporate actions or material event notices) |
| • Bids/offers | • Monthly payment information |
| • Industry and economic events | • Reported trades |
An asset or liability for which a market quotation is not readily available is valued by methods deemed reasonable in good faith by the Valuation Committee, following the Valuation Procedures to represent fair value. Under these procedures, the Valuation Designee generally uses a market-based approach which may use related or comparable assets or liabilities, recent transactions, market multiples, book values and other relevant information. The Valuation Designee may also use an income-based valuation approach in which the anticipated future cash
flows of the asset or liability are discounted to calculate fair value. Discounts may also be applied due to the nature and/or duration of any restrictions on the disposition of the asset or liability. Fair value represents a good faith approximation of the value of a security. Fair value determinations involve the consideration of a number of subjective factors, an analysis of applicable facts and circumstances and the exercise of judgment. As a result, it is possible that the fair value for a security determined in good faith in accordance with the Valuation Procedures may differ from valuations for the same security determined for other funds using their own valuation procedures. Although the Valuation Procedures are designed to value a security at the price the Portfolio may reasonably expect to receive upon the security's sale in an orderly transaction, there can be no assurance that any fair value determination thereunder would, in fact, approximate the amount that the Portfolio would actually realize upon the sale of the security or the price at which the security would trade if a reliable market price were readily available. During the year ended December 31, 2023, there were no material changes to the fair value methodologies.
Securities which may be valued in this manner include, but are not limited to: (i) a security for which trading has been halted or suspended or otherwise does not have a readily available market quotation on a given day; (ii) a debt security that has recently gone into default and for which there is not a current market quotation; (iii) a security of an issuer that has entered into a restructuring; (iv) a security that has been delisted from a national exchange; (v) a security subject to trading collars for which no or limited trading takes place; and (vi) a security whose principal market has been temporarily closed at a time when, under normal conditions, it would be open. Securities valued in this manner are generally categorized as Level 2 or 3 in the hierarchy.
Certain securities held by the Portfolio may principally trade in foreign markets. Events may occur between the time the foreign markets close and the time at which the Portfolio's NAVs are calculated. These events may include, but are not limited to, situations relating to a single issuer in a market sector, significant fluctuations in U.S. or foreign markets, natural disasters, armed conflicts, governmental actions or other developments not tied directly to the securities markets. Should the Valuation Designee conclude that such events may have affected the accuracy of the last price of such securities reported on the local foreign market, the Valuation Designee may, pursuant to the Valuation Procedures, adjust the value of the local price to reflect the estimated impact on the price of such securities as a result of such events. In this instance, securities are generally categorized as Level 3 in the hierarchy. Additionally, certain foreign equity securities are also fair valued whenever the movement of a particular index exceeds certain thresholds. In such cases, the securities are fair valued by applying factors provided by a third-party vendor in accordance with the Valuation Procedures and are generally categorized as Level 2 in the hierarchy.
If the principal market of certain foreign equity securities is closed in observance of a local foreign holiday, these securities are valued using the last closing price of regular trading on the relevant exchange and fair valued by applying factors provided by a third-party vendor in accordance
Notes to Financial Statements (continued)
with the Valuation Procedures. These securities are generally categorized as Level 2 in the hierarchy.
Equity securities, rights and warrants, if applicable, are valued at the last quoted sales prices as of the close of regular trading on the relevant exchange on each valuation date. Securities that are not traded on the valuation date are valued at the mean of the last quoted bid and ask prices. Prices are normally taken from the principal market in which each security trades. These securities are generally categorized as Level 1 in the hierarchy.
Investments in mutual funds, including money market funds, are valued at their respective NAVs at the close of business each day on the valuation date. These securities are generally categorized as Level 1 in the hierarchy.
Temporary cash investments acquired in excess of 60 days to maturity at the time of purchase are valued using the latest bid prices or using valuations based on a matrix system (which considers such factors as security prices, yields, maturities and ratings), both as furnished by independent pricing services. Temporary cash investments that mature in 60 days or less at the time of purchase ("Short-Term Investments") are valued using the amortized cost method of valuation, unless the use of such method would be inappropriate. The amortized cost method involves valuing a security at its cost on the date of purchase and thereafter assuming a constant amortization to maturity of the difference between such cost and the value on maturity date. Amortized cost approximates the current fair value of a security. Securities valued using the amortized cost method are not valued using quoted prices in an active market and are generally categorized as Level 2 in the hierarchy.
The information above is not intended to reflect an exhaustive list of the methodologies that may be used to value portfolio investments. The Valuation Procedures permit the use of a variety of valuation methodologies in connection with valuing portfolio investments. The methodology used for a specific type of investment may vary based on the market data available or other considerations. The methodologies summarized above may not represent the specific means by which portfolio investments are valued on any particular business day.
(B) Income Taxes. The Portfolio's policy is to comply with the requirements of the Internal Revenue Code of 1986, as amended (the “Internal Revenue Code”), applicable to regulated investment companies and to distribute all of its taxable income to the shareholders of the Portfolio within the allowable time limits.
The Manager evaluates the Portfolio’s tax positions to determine if the tax positions taken meet the minimum recognition threshold in connection with accounting for uncertainties in income tax positions taken or expected to be taken for the purposes of measuring and recognizing tax liabilities in the financial statements. Recognition of tax benefits of an uncertain tax position is permitted only to the extent the position is “more likely than not” to be sustained assuming examination by taxing authorities. The Manager analyzed the Portfolio's tax positions taken on federal, state and local income tax returns for all open tax years (for up to
three tax years) and has concluded that no provisions for federal, state and local income tax are required in the Portfolio's financial statements. The Portfolio's federal, state and local income tax and federal excise tax returns for tax years for which the applicable statutes of limitations have not expired are subject to examination by the Internal Revenue Service and state and local departments of revenue.
(C) Foreign Taxes. The Portfolio may be subject to foreign taxes on income and other transaction-based taxes imposed by certain countries in which it invests. A portion of the taxes on gains on investments or currency purchases/repatriation may be reclaimable. The Portfolio will accrue such taxes and reclaims as applicable, based upon its current interpretation of tax rules and regulations that exist in the markets in which it invests.
The Portfolio may be subject to taxation on realized capital gains, repatriation proceeds and other transaction-based taxes imposed by certain countries in which it invests. The Portfolio will accrue such taxes as applicable based upon its current interpretation of tax rules and regulations that exist in the market in which it invests. Capital gains taxes relating to positions still held are reflected as a liability in the Statement of Assets and Liabilities, as well as an adjustment to the Portfolio's net unrealized appreciation (depreciation). Taxes related to capital gains realized, if any, are reflected as part of net realized gain (loss) in the Statement of Operations. Changes in tax liabilities related to capital gains taxes on unrealized investment gains, if any, are reflected as part of the change in net unrealized appreciation (depreciation) on investments in the Statement of Operations. Transaction-based charges are generally assessed as a percentage of the transaction amount.
(D) Dividends and Distributions to Shareholders. Dividends and distributions are recorded on the ex-dividend date. The Portfolio intends to declare and pay dividends from net investment income and distributions from net realized capital and currency gains, if any, at least annually. All dividends and distributions are reinvested at NAV in the same class of shares of the Portfolio. Dividends and distributions to shareholders are determined in accordance with federal income tax regulations and may differ from determinations using GAAP.
(E) Security Transactions and Investment Income. The Portfolio records security transactions on the trade date. Realized gains and losses on security transactions are determined using the identified cost method. Dividend income is recognized on the ex-dividend date, net of any foreign tax withheld at the source, and interest income is accrued as earned using the effective interest rate method. Distributions received from real estate investment trusts may be classified as dividends, capital gains and/or return of capital.
Investment income and realized and unrealized gains and losses on investments of the Portfolio are allocated pro rata to the separate classes of shares based upon their relative net assets on the date the income is earned or realized and unrealized gains and losses are incurred.
| 20 | MainStay VP PineStone International Equity Portfolio |
(F) Expenses. Expenses of the Fund are allocated to the individual Portfolios in proportion to the net assets of the respective Portfolios when the expenses are incurred, except where direct allocations of expenses can be made. Expenses (other than fees incurred under the distribution and service plans, further discussed in Note 3(B), which are charged directly to the Service Class shares) are allocated to separate classes of shares pro rata based upon their relative net assets on the date the expenses are incurred. The expenses borne by the Portfolio, including those of related parties to the Portfolio, are shown in the Statement of Operations.
Additionally, the Portfolio may invest in mutual funds, which are subject to management fees and other fees that may cause the costs of investing in mutual funds to be greater than the costs of owning the underlying securities directly. These indirect expenses of mutual funds are not included in the amounts shown as expenses in the Statement of Operations or in the expense ratios included in the Financial Highlights.
(G) Use of Estimates. In preparing financial statements in conformity with GAAP, the Manager makes estimates and assumptions that affect the reported amounts and disclosures in the financial statements. Actual results could differ from those estimates and assumptions.
(H) Foreign Currency Transactions. The Portfolio's books and records are maintained in U.S. dollars. Prices of securities denominated in foreign currency amounts are translated into U.S. dollars at the mean between the buying and selling rates last quoted by any major U.S. bank at the following dates:
(i) market value of investment securities, other assets and liabilities— at the valuation date; and
(ii) purchases and sales of investment securities, income and expenses—at the date of such transactions.
The assets and liabilities that are denominated in foreign currency amounts are presented at the exchange rates and market values at the close of the period. The realized and unrealized changes in net assets arising from fluctuations in exchange rates and market prices of securities are not separately presented.
Net realized gain (loss) on foreign currency transactions represents net currency gains or losses realized as a result of differences between the amounts of securities sale proceeds or purchase cost, dividends, interest and withholding taxes as recorded on the Portfolio's books, and the U.S. dollar equivalent amount actually received or paid. Net currency gains or losses from valuing such foreign currency denominated assets and liabilities, other than investments at valuation date exchange rates, are reflected in unrealized foreign exchange gains or losses.
(I) Securities Lending. In order to realize additional income, the Portfolio may engage in securities lending, subject to the limitations set forth in the 1940 Act and relevant guidance by the staff of the Securities and Exchange Commission (“SEC”). If the Portfolio engages in securities lending, the Portfolio will lend through its custodian, JPMorgan Chase Bank, N.A., ("JPMorgan"), acting as securities lending agent on behalf of
the Portfolio. Under the current arrangement, JPMorgan will manage the Portfolio's collateral in accordance with the securities lending agency agreement between the Portfolio and JPMorgan, and indemnify the Portfolio against counterparty risk. The loans will be collateralized by cash (which may be invested in a money market fund) and/or non-cash collateral (which may include U.S. Treasury securities and/or U.S. government agency securities issued or guaranteed by the United States government or its agencies or instrumentalities) at least equal at all times to the market value of the securities loaned. Non-cash collateral held at year end is segregated and cannot be transferred by the Portfolio. The Portfolio bears the risk of delay in recovery of, or loss of rights in, the securities loaned. The Portfolio may also record a realized gain or loss on securities deemed sold due to a borrower’s inability to return securities on loan. The Portfolio bears the risk of any loss on investment of cash collateral. The Portfolio will receive compensation for lending its securities in the form of fees or it will retain a portion of interest earned on the investment of any cash collateral. The Portfolio will also continue to receive interest and dividends on the securities loaned and any gain or loss in the market price of the securities loaned that may occur during the term of the loan will be for the account of the Portfolio. Income earned from securities lending activities, if any, is reflected in the Statement of Operations.
(J) Foreign Securities Risk. The Portfolio invests in foreign securities, which carry certain risks that are in addition to the usual risks inherent in domestic securities. Foreign regulatory regimes and securities markets can have less stringent investor protections and disclosure standards and less liquid trading markets than U.S. regulatory regimes and securities markets, and can experience political, social and economic developments that may affect the value of investments in foreign securities. These risks include those resulting from currency fluctuations, future adverse political or economic developments and possible imposition of currency exchange blockages or other foreign governmental laws or restrictions. Economic sanctions and other similar governmental actions or developments could, among other things, effectively restrict or eliminate the Portfolio's ability to purchase or sell certain foreign securities or groups of foreign securities, and thus may make the Portfolio's investments in such securities less liquid or more difficult to value. These risks are likely to be greater in emerging markets than in developed markets. The ability of issuers of debt securities held by the Portfolio to meet their obligations may be affected by, among other things, economic or political developments in a specific country, industry or region.
(K) Indemnifications. Under the Fund’s organizational documents, its officers and trustees are indemnified against certain liabilities that may arise out of performance of their duties to the Fund. Additionally, in the normal course of business, the Portfolio enters into contracts with third-party service providers that contain a variety of representations and warranties and that may provide general indemnifications. The Portfolio's maximum exposure under these arrangements is unknown, as this would involve future claims that may be made against the Portfolio that have not yet occurred. The Manager believes that the risk of loss in connection
Notes to Financial Statements (continued)
with these potential indemnification obligations is remote. However, there can be no assurance that material liabilities related to such obligations will not arise in the future, which could adversely impact the Portfolio.
Note 3–Fees and Related Party Transactions
(A) Manager and Subadvisor. New York Life Investments, a registered investment adviser and an indirect, wholly-owned subsidiary of New York Life, serves as the Portfolio's Manager, pursuant to an Amended and Restated Management Agreement ("Management Agreement"). The Manager provides offices, conducts clerical, recordkeeping and bookkeeping services and keeps most of the financial and accounting records required to be maintained by the Portfolio. Except for the portion of salaries and expenses that are the responsibility of the Portfolio, the Manager pays the salaries and expenses of all personnel affiliated with the Portfolio and certain operational expenses of the Portfolio. The Portfolio reimburses New York Life Investments in an amount equal to the portion of the compensation of the Chief Compliance Officer attributable to the Portfolio. The Portfolio's subadvisor changed effective August 28, 2023, due to the replacement of MacKay Shields LLC ("MacKay Shields") as the Portfolio's subadvisor and the appointment of PineStone Asset Management Inc. ("PineStone" or the "Subadvisor") as the Portfolio's subadvisor. PineStone, a registered investment adviser, serves as the Subadvisor to the Portfolio and is responsible for the day-to-day portfolio management of the Portfolio. Pursuant to the terms of a Subadvisory Agreement between New York Life Investments and PineStone, New York Life Investments pays for the services of the Subadvisor.
Effective August 28, 2023, pursuant to the Management Agreement, the Fund pays the Manager, on behalf of the Portfolio, a monthly fee for the services performed and the facilities furnished at an annual rate of 0.80% of the Portfolio's average daily net assets. Prior to August 28, 2023, pursuant, the Fund paid the Manager, on behalf of the Portfolio, a monthly fee for the services performed and the facilities furnished at an annual rate of the Portfolio's average daily net assets as follows: 0.89% up to $500 million; and 0.85% in excess of $500 million. During the year ended December 31, 2023, the effective management fee rate was 0.86% of the Portfolio's average daily net assets.
During the year ended December 31, 2023, New York Life Investments earned fees from the Portfolio in the amount of $3,945,900 and paid MacKay Shields and PineStone fees in the amount of $1,369,235 and $573,518, respectively.
JPMorgan provides sub-administration and sub-accounting services to the Portfolio pursuant to an agreement with New York Life Investments. These services include calculating the daily NAVs of the Portfolio, maintaining the general ledger and sub-ledger accounts for the calculation of the Portfolio's NAVs, and assisting New York Life Investments in conducting various aspects of the Portfolio's administrative operations. For providing these services to the Portfolio, JPMorgan is compensated by New York Life Investments.
Pursuant to an agreement between the Fund and New York Life Investments, New York Life Investments is responsible for providing or procuring certain regulatory reporting services for the Portfolio. The Portfolio will reimburse New York Life Investments for the actual costs incurred by New York Life Investments in connection with providing or procuring these services for the Portfolio.
(B) Distribution and Service Fees. The Fund, on behalf of the Portfolio, has entered into a distribution agreement with NYLIFE Distributors LLC (the “Distributor”), an affiliate of New York Life Investments. The Portfolio has adopted a distribution plan (the “Plan”) in accordance with the provisions of Rule 12b-1 under the 1940 Act. Under the Plan, the Distributor has agreed to provide, through its affiliates or independent third parties, various distribution-related, shareholder and administrative support services to the Service Class shareholders. For its services, the Distributor is entitled to a combined distribution and service fee accrued daily and paid monthly at an annual rate of 0.25% of the average daily net assets attributable to the Service Class shares of the Portfolio.
Note 4-Federal Income Tax
As of December 31, 2023, the cost and unrealized appreciation (depreciation) of the Portfolio’s investment portfolio, including applicable derivative contracts and other financial instruments, as determined on a federal income tax basis, were as follows:
| | Federal Tax
Cost | Gross
Unrealized
Appreciation | Gross
Unrealized
(Depreciation) | Net
Unrealized
Appreciation/
(Depreciation) |
| Investments in Securities | $441,346,884 | $36,862,914 | $(6,847,399) | $30,015,515 |
As of December 31, 2023, the components of accumulated gain (loss) on a tax basis were as follows:
Ordinary
Income | Accumulated
Capital
and Other
Gain (Loss) | Other
Temporary
Differences | Unrealized
Appreciation
(Depreciation) | Total
Accumulated
Gain (Loss) |
| $2,011,284 | $(113,736,555) | $— | $30,022,950 | $(81,702,321) |
The difference between book-basis and tax-basis unrealized appreciation (depreciation) is primarily due to wash sale adjustments.
As of December 31, 2023, for federal income tax purposes, capital loss carryforwards of $113,736,555, as shown in the table below, were available to the extent provided by the regulations to offset future realized gains of the Portfolio. Accordingly, no capital gains distributions are expected to be paid to shareholders until net gains have been realized in excess of such amounts.
Capital Loss
Available Through | Short-Term
Capital Loss
Amounts (000’s) | Long-Term
Capital Loss
Amounts (000’s) |
| Unlimited | $63,034 | $50,703 |
| 22 | MainStay VP PineStone International Equity Portfolio |
During the years ended December 31, 2023 and December 31, 2022, the tax character of distributions paid as reflected in the Statements of Changes in Net Assets was as follows:
| | 2023 | 2022 |
| Distributions paid from: | | |
| Ordinary Income | $— | $46,066,083 |
| Long-Term Capital Gains | — | 44,127,535 |
| Total | $— | $90,193,618 |
Note 5–Custodian
JPMorgan is the custodian of cash and securities held by the Portfolio. Custodial fees are charged to the Portfolio based on the Portfolio's net assets and/or the market value of securities held by the Portfolio and the number of certain transactions incurred by the Portfolio.
Note 6–Line of Credit
The Portfolio and certain other funds managed by New York Life Investments maintain a line of credit with a syndicate of banks in order to secure a source of funds for temporary purposes to meet unanticipated or excessive redemption requests.
Effective July 25, 2023, under the credit agreement (the “Credit Agreement”), the aggregate commitment amount is $600,000,000 with an additional uncommitted amount of $100,000,000. The commitment fee is an annual rate of 0.15% of the average commitment amount payable quarterly, regardless of usage, to JPMorgan, who serves as the agent to the syndicate. The commitment fee is allocated among the Portfolio and certain other funds managed by New York Life Investments based upon their respective net assets and other factors. Interest on any revolving credit loan is charged based upon the Federal Funds Rate, Daily Simple Secured Overnight Financing Rate ("SOFR") + 0.10%, or the Overnight Bank Funding Rate, whichever is higher. The Credit Agreement expires on July 23, 2024, although the Portfolio, certain other funds managed by New York Life Investments and the syndicate of banks may renew the Credit Agreement for an additional year on the same or different terms or enter into a credit agreement with a different syndicate of banks. Prior to July 25, 2023, the aggregate commitment amount and the commitment fee were the same as those under the current Credit Agreement. During the year ended December 31, 2023, there were no borrowings made or outstanding with respect to the Portfolio under the Credit Agreement.
Note 7–Interfund Lending Program
Pursuant to an exemptive order issued by the SEC, the Portfolio, along with certain other funds managed by New York Life Investments, may participate in an interfund lending program. The interfund lending program provides an alternative credit facility that permits the Portfolio and certain other funds managed by New York Life Investments to lend or borrow money for temporary purposes directly to or from one another, subject to the conditions of the exemptive order. During the year ended
December 31, 2023, there were no interfund loans made or outstanding with respect to the Portfolio.
Note 8–Purchases and Sales of Securities (in 000’s)
During the year ended December 31, 2023, purchases and sales of securities, other than short-term securities, were $717,011 and $690,647, respectively.
Note 9–Capital Share Transactions
Transactions in capital shares for the years ended December 31, 2023 and December 31, 2022, were as follows:
| Initial Class | Shares | Amount |
| Year ended December 31, 2023: | | |
| Shares sold | 8,777,135 | $ 93,252,336 |
| Shares redeemed | (5,936,901) | (64,239,211) |
| Net increase (decrease) | 2,840,234 | $ 29,013,125 |
| Year ended December 31, 2022: | | |
| Shares sold | 1,923,130 | $ 26,627,915 |
| Shares issued to shareholders in reinvestment of distributions | 4,555,503 | 42,204,462 |
| Shares redeemed | (1,322,741) | (16,804,815) |
| Net increase (decrease) | 5,155,892 | $ 52,027,562 |
| |
| Service Class | Shares | Amount |
| Year ended December 31, 2023: | | |
| Shares sold | 2,128,562 | $ 21,271,503 |
| Shares redeemed | (3,852,976) | (39,858,770) |
| Net increase (decrease) | (1,724,414) | $(18,587,267) |
| Year ended December 31, 2022: | | |
| Shares sold | 2,224,777 | $ 30,155,472 |
| Shares issued to shareholders in reinvestment of distributions | 5,261,219 | 47,989,156 |
| Shares redeemed | (2,297,584) | (29,244,680) |
| Net increase (decrease) | 5,188,412 | $ 48,899,948 |
Note 10–Other Matters
As of the date of this report, the Portfolio faces a heightened level of risk associated with current uncertainty, volatility and state of economies, financial markets, rising interest rates, and labor and health conditions around the world. Events such as war, acts of terrorism, recessions, rapid inflation, the imposition of international sanctions, earthquakes, hurricanes, epidemics and pandemics and other unforeseen natural or human disasters may have broad adverse social, political and economic effects on the global economy, which could negatively impact the value of the Portfolio's investments. Developments that disrupt global economies and financial markets may magnify factors that affect the Portfolio's performance.
Notes to Financial Statements (continued)
Note 11–Subsequent Events
In connection with the preparation of the financial statements of the Portfolio as of and for the year ended December 31, 2023, events and transactions subsequent to December 31, 2023, through the date the financial statements were issued, have been evaluated by the Manager for possible adjustment and/or disclosure. No subsequent events requiring financial statement adjustment or disclosure have been identified.
| 24 | MainStay VP PineStone International Equity Portfolio |
Report of Independent Registered Public Accounting Firm
To the Board of Trustees of MainStay VP Funds Trust and Shareholders of MainStay VP PineStone International Equity Portfolio (formerly known as MainStay VP MacKay International Equity Portfolio)
Opinion on the Financial Statements
We have audited the accompanying statement of assets and liabilities, including the portfolio of investments, of MainStay VP PineStone International Equity Portfolio (one of the portfolios constituting MainStay VP Funds Trust, referred to hereafter as the “Portfolio”) as of December 31, 2023, the related statement of operations for the year ended December 31, 2023, the statements of changes in net assets for each of the two years in the period ended December 31, 2023, including the related notes, and the financial highlights for each of the five years in the period ended December 31, 2023 (collectively referred to as the “financial statements”). In our opinion, the financial statements present fairly, in all material respects, the financial position of the Portfolio as of December 31, 2023, the results of its operations for the year then ended, the changes in its net assets for each of the two years in the period ended December 31, 2023 and the financial highlights for each of the five years in the period ended December 31, 2023 in conformity with accounting principles generally accepted in the United States of America.
Basis for Opinion
These financial statements are the responsibility of the Portfolio’s management. Our responsibility is to express an opinion on the Portfolio’s financial statements based on our audits. We are a public accounting firm registered with the Public Company Accounting Oversight Board (United States) (PCAOB) and are required to be independent with respect to the Portfolio in accordance with the U.S. federal securities laws and the applicable rules and regulations of the Securities and Exchange Commission and the PCAOB.
We conducted our audits of these financial statements in accordance with the standards of the PCAOB. Those standards require that we plan and perform the audit to obtain reasonable assurance about whether the financial statements are free of material misstatement, whether due to error or fraud.
Our audits included performing procedures to assess the risks of material misstatement of the financial statements, whether due to error or fraud, and performing procedures that respond to those risks. Such procedures included examining, on a test basis, evidence regarding the amounts and disclosures in the financial statements. Our audits also included evaluating the accounting principles used and significant estimates made by management, as well as evaluating the overall presentation of the financial statements. Our procedures included confirmation of securities owned as of December 31, 2023 by correspondence with the custodian and transfer agent. We believe that our audits provide a reasonable basis for our opinion.
/s/PricewaterhouseCoopers LLP
New York, New York
February 26, 2024
We have served as the auditor of one or more investment companies in the MainStay group of funds since 1984.
Board Consideration and Approval of Management Agreement (Unaudited)
The continuation of the Management Agreement with respect to the MainStay PineStone International Equity Portfolio (“Portfolio”) and New York Life Investment Management LLC (“New York Life Investments”) is subject to annual review and approval by the Board of Trustees of MainStay VP Funds Trust (“Board” of the “Trust”) in accordance with Section 15 of the Investment Company Act of 1940, as amended (“1940 Act”). At its December 6–7, 2023 meeting, the Board, including the Trustees who are not an “interested person” (as such term is defined in the 1940 Act) of the Trust (“Independent Trustees”) voting separately, unanimously approved the continuation of the Management Agreement for a one-year period.
In reaching the decision to approve the continuation of the Management Agreement, the Board considered information and materials furnished by New York Life Investments in connection with an annual contract review process undertaken by the Board that took place at meetings of the Board and its Contracts Committee from September 2023 through December 2023, including information and materials furnished by New York Life Investments in response to requests prepared on behalf of the Board, and in consultation with the Independent Trustees, by independent legal counsel to the Independent Trustees, which encompassed a variety of topics, including those summarized below. Information and materials requested by and furnished to the Board for consideration in connection with the contract review process included, among other items, reports on the Portfolio and “peer funds” prepared by Institutional Shareholder Services Inc. (“ISS”), an independent third-party service provider engaged by the Board to report objectively on the Portfolio’s investment performance, management fee and total expenses. The Board also considered information on the fees charged to other investment advisory clients of New York Life Investments and that follow investment strategies similar to those of the Portfolio, if any, and, when applicable, the rationale for differences in the Portfolio’s management fee and the fees charged to those other investment advisory clients. In addition, the Board considered information regarding the legal standards and fiduciary obligations applicable to its consideration of the continuation of the Management Agreement. The contract review process, including the structure and format for information and materials provided to the Board, has been developed in consultation with the Board. The Independent Trustees also met in executive sessions with their independent legal counsel and, for portions thereof, with senior management of New York Life Investments.
The Board’s deliberations with respect to the continuation of the Management Agreement reflect a year-long process, and the Board also took into account information furnished to the Board and its Committees throughout the year, as deemed relevant and appropriate by the Trustees, including, among other items, reports on investment performance of the Portfolio and investment-related matters for the Portfolio as well as presentations from New York Life Investments personnel. In addition, the Board took into account other information provided by New York Life Investments throughout the year, including, among other items, periodic reports on legal and compliance matters, risk management, portfolio
turnover, brokerage commissions and non-advisory services provided to the Portfolio by New York Life Investments, as deemed relevant and appropriate by the Trustees.
In addition to information provided to the Board throughout the year, the Board received information in connection with its June 2023 meeting provided specifically in response to requests prepared on behalf of the Board, and in consultation with the Independent Trustees, by independent legal counsel to the Independent Trustees regarding the Portfolio’s distribution arrangements. In addition, the Board received information regarding the Portfolio’s asset levels, share purchase and redemption activity and the payment of Rule 12b-1 and/or certain other fees by applicable share classes of the Portfolio, among other information.
In considering the continuation of the Management Agreement, the Trustees reviewed and evaluated the information and factors they believed to reasonably be necessary and appropriate in light of legal advice furnished to them by independent legal counsel to the Independent Trustees and through the exercise of their own business judgment. Although individual Trustees may have weighed certain factors or information differently and the Board did not consider any single factor or information controlling in reaching its decision, the factors that figured prominently in the Board’s consideration of the continuation of the Management Agreement are summarized in more detail below and include, among other factors: (i) the nature, extent and quality of the services provided to the Portfolio by New York Life Investments; (ii) the qualifications of the portfolio managers of the Portfolio and the historical investment performance of the Portfolio and New York Life Investments; (iii) the costs of the services provided, and profits realized, by New York Life Investments with respect to its relationship with the Portfolio; (iv) the extent to which economies of scale have been realized or may be realized if the Portfolio grows and the extent to which any economies of scale have been shared, have benefited or may benefit the Portfolio’s shareholders; and (v) the reasonableness of the Portfolio’s management fee and total ordinary operating expenses. Although the Board recognized that comparisons between the Portfolio’s fees and expenses and those of other funds are imprecise given different terms of agreements, variations in fund strategies and other factors, the Board considered the reasonableness of the Portfolio’s management fee and total ordinary operating expenses as compared to the peer funds identified by ISS. Throughout their considerations, the Trustees acknowledged the commitment of New York Life Investments and its affiliates to serve the MainStay Group of Funds, as well as their capacity, experience, resources, financial stability and reputations. The Trustees also acknowledged the entrepreneurial and other risks assumed by New York Life Investments in sponsoring and managing the Portfolio.
The Trustees noted that, throughout the year, the Trustees are afforded an opportunity to ask questions of, and request additional information or materials from, New York Life Investments. The Board’s decision with respect to the Management Agreement may have also been based, in part, on the Board’s knowledge of New York Life Investments resulting from, among other things, the Board’s consideration of the Management Agreement in prior years, the advisory agreements for other funds in the
| 26 | MainStay VP PineStone International Equity Portfolio |
MainStay Group of Funds, the Board’s review throughout the year of the performance and operations of other funds in the MainStay Group of Funds and each Trustee’s business judgment and industry experience. In addition to considering the above-referenced factors, the Board observed that in the marketplace, notably under variable life insurance policies and variable annuity contracts for which the Portfolio serves as an investment option, there are a range of investment options available to investors and that the Portfolio’s shareholders, having had the opportunity to consider other investment options, have invested in the Portfolio.
The factors that figured prominently in the Board’s decision to approve the continuation of the Management Agreement during the Board’s December 6–7, 2023 meeting are summarized in more detail below.
Nature, Extent and Quality of Services Provided by New York Life Investments
The Board examined the nature, extent and quality of the services that New York Life Investments provides to the Portfolio. The Board evaluated New York Life Investments’ experience and capabilities in serving as manager of the Portfolio. The Board noted that New York Life Investments manages other mutual funds, serves a variety of other investment advisory clients, including other pooled investment vehicles, and has experience overseeing mutual fund service providers. The Board considered the experience of senior personnel at New York Life Investments providing management and administrative and other non-advisory services to the Portfolio. The Board observed that New York Life Investments devotes significant resources and time to providing management and administrative and other non-advisory services to the Portfolio.
The Board also considered the range of services that New York Life Investments provides to the Portfolio under the terms of the Management Agreement, including: (i) fund accounting and ongoing supervisory services provided by New York Life Investments’ Fund Administration and Accounting Group; (ii) investment supervisory and analytical services provided by New York Life Investments’ Investment Consulting Group; (iii) compliance services provided by the Trust’s Chief Compliance Officer as well as New York Life Investments’ compliance department, including supervision and implementation of the Portfolio’s compliance program; (iv) legal services provided by New York Life Investments’ Office of the General Counsel; and (v) risk management monitoring and analysis by compliance and investment personnel. In addition, the Board considered New York Life Investments’ willingness to invest in personnel and other resources, such as cyber security, information security and business continuity planning, that may benefit the Portfolio and noted that New York Life Investments is responsible for compensating the Trust’s officers, except for a portion of the salary of the Trust’s Chief Compliance Officer. The Board recognized that New York Life Investments provides certain other non-advisory services to the Portfolio and has over time provided an increasingly broad array of non-advisory services to the MainStay Group of Funds as a result of regulatory and other developments.
The Board also examined the range, and the nature, extent and quality, of the investment advisory services that New York Life Investments provides to the Portfolio and considered the terms of the Management Agreement. The Board evaluated New York Life Investments’ experience and performance in serving as investment adviser to the Portfolio and advising other portfolios and New York Life Investments’ track record and experience in providing investment advisory services as well as the experience of investment advisory, senior management and administrative personnel at New York Life Investments. The Board considered New York Life Investments’ overall resources, legal and compliance environment, capabilities, reputation, financial condition and history. In addition to information provided in connection with quarterly meetings with the Trust’s Chief Compliance Officer, the Board considered information regarding the compliance policies and procedures of New York Life Investments and acknowledged New York Life Investments’ commitment to further developing and strengthening compliance programs that may relate to the Portfolio. The Board also considered New York Life Investments’ ability to recruit and retain qualified investment professionals and willingness to invest in personnel and other resources that may benefit the Portfolio. In this regard, the Board considered the qualifications and experience of the Portfolio’s portfolio managers, the number of accounts managed by the portfolio managers and the method for compensating the portfolio managers.
In addition, the Board considered information provided by New York Life Investments regarding its business continuity and disaster recovery plans.
Based on these considerations, among others, the Board concluded that the Portfolio would likely continue to benefit from the nature, extent and quality of these services.
Investment Performance
In evaluating the Portfolio’s investment performance, the Board considered investment performance results over various periods in light of the Portfolio’s investment objective, strategies and risks. The Board considered investment reports on, and analysis of, the Portfolio’s performance provided to the Board throughout the year. These reports include, among other items, information on the Portfolio’s gross and net returns, the Portfolio’s investment performance compared to a relevant investment category and the Portfolio’s benchmarks, the Portfolio’s risk-adjusted investment performance and the Portfolio’s investment performance as compared to peer funds, as appropriate, as well as portfolio attribution information and commentary on the effect of market conditions. The Board also considered information provided by ISS showing the investment performance of the Portfolio as compared to peer funds. In addition, the Board reviewed the methodology used by ISS to construct the group of peer funds for comparative purposes.
The Board also took into account its and the Board’s Investment Committee’s discussions with senior management at New York Life Investments concerning the Portfolio’s investment performance over various periods. In considering the investment performance of the
Board Consideration and Approval of Management Agreement (Unaudited) (continued)
Portfolio, the Board noted that the Portfolio underperformed its peer funds for the one-, three-, five- and ten-year periods ended July 31, 2023. The Board considered its discussions with representatives from New York Life Investments regarding the Portfolio’s investment performance and the Board’s approval of a new subadvisory agreement between New York Life Investments and PineStone Asset Management Inc. with respect to the Portfolio and approval to reposition the Portfolio, effective August 28, 2023.
Based on these considerations, among others, the Board concluded that its review of the Portfolio’s investment performance and related information supported a determination to approve the continuation of the Management Agreement.
Costs of the Services Provided, and Profits and Other Benefits Realized, by New York Life Investments
The Board considered the costs of the services provided under the Management Agreement. The Board also considered the profitability of New York Life Investments and its affiliates due to their relationships with the Portfolio as well as by New York Life Investments and its affiliates due to their relationships with the MainStay Group of Funds.
In addition, the Board acknowledged the difficulty in obtaining reliable comparative data about mutual fund managers’ profitability because such information generally is not publicly available and may be impacted by numerous factors, including the structure of a fund manager’s organization, the types of funds it manages, the methodology used to allocate certain fixed costs to specific funds and the manager’s capital structure and costs of capital.
In evaluating the costs of the services provided by New York Life Investments, and profitability of New York Life Investments and its affiliates due to their relationships with the Portfolio, the Board considered, among other factors, New York Life Investments’ and its affiliates’ continuing investments in, or willingness to invest in, personnel and other resources that may support and further enhance the management of the Portfolio. The Board also considered the financial resources of New York Life Investments and acknowledged that New York Life Investments must be in a position to recruit and retain experienced professional personnel and to maintain a strong financial position for New York Life Investments to continue to provide high-quality services to the Portfolio. The Board recognized that the Portfolio benefits from the allocation of certain fixed costs among the funds in the MainStay Group of Funds, among other expected benefits resulting from its relationship with New York Life Investments.
The Board considered information regarding New York Life Investments’ methodology for calculating profitability and allocating costs provided by New York Life Investments in connection with the fund profitability analysis presented to the Board. The Board concluded that New York Life Investments’ methods for allocating costs and procedures for estimating overall profitability of the relationship with the funds in the MainStay Group of Funds were reasonable. The Board recognized the difficulty in
calculating and evaluating a manager’s profitability with respect to the Portfolio and considered that other profitability methodologies may also be reasonable.
The Board also considered certain fall-out benefits that may be realized by New York Life Investments and its affiliates due to their relationships with the Portfolio, including reputational and other indirect benefits. In addition, the Board considered its review of the management agreement for a money market fund advised by New York Life Investments and an affiliated subadvisor that serves as an investment option for the Portfolio, including the potential rationale for and costs associated with investments in this money market fund by the Portfolio, if any, and considered information from New York Life Investments that the nature and type of specific investment advisory services provided to this money market fund are distinct from, or in addition to, the investment advisory services provided to the Portfolio. In addition, the Board considered the potential dividend received tax deduction for insurance company affiliates of New York Life Investments from the Portfolio’s securities lending activity.
The Board noted that the Portfolio serves as an investment option primarily under variable contracts issued by affiliates of New York Life Investments that would receive fees under those contracts. The Board observed that, in addition to fees earned by New York Life Investments under the Management Agreement for managing the Portfolio, New York Life Investments’ affiliates also earn revenues from serving the Portfolio in various other capacities, including as the Portfolio’s distributor, and insurance companies affiliated with New York Life Investments would be entitled to receive fees from the Portfolio under a distribution and service plan adopted pursuant to Rule 12b-1 under the 1940 Act. The Board considered information about these other revenues and their impact on the profitability of the relationship with the Portfolio to New York Life Investments and its affiliates. The Board noted that, although it assessed the overall profitability of the relationship with the Portfolio to New York Life Investments and its affiliates as part of the contract review process, when considering the reasonableness of the fee paid to New York Life Investments under the Management Agreement, the Board considered the profitability of New York Life Investments’ relationship with the Portfolio on a pre-tax basis and without regard to distribution expenses incurred by New York Life Investments from its own resources.
After evaluating the information deemed relevant by the Trustees, the Board concluded that any profits realized by New York Life Investments and its affiliates due to their relationships with the Portfolio were not excessive.
Management Fee and Total Ordinary Operating Expenses
The Board evaluated the reasonableness of the fee paid under the Management Agreement and the Portfolio’s total ordinary operating expenses.
In assessing the reasonableness of the Portfolio’s fees and expenses, the Board primarily considered comparative data provided by ISS on the fees and expenses of similar mutual funds managed by other investment advisers. The Board reviewed the methodology used by ISS to construct
| 28 | MainStay VP PineStone International Equity Portfolio |
the group of peer funds for comparative purposes. In addition, the Board considered information provided by New York Life Investments on fees charged to other investment advisory clients, including institutional separate accounts and/or other funds, that follow investment strategies similar to those of the Portfolio, if any. The Board considered the contractual management fee schedule for the Portfolio as compared to those for such other investment advisory clients, taking into account the rationale for differences in fee schedules. The Board also took into account information provided by New York Life Investments about the more extensive scope of services provided to registered investment companies, such as the Portfolio, as compared with other investment advisory clients. Additionally, the Board considered the impact of voluntary waivers on the Portfolio’s net management fee and expenses. The Board also considered that in proposing fees for the Portfolio, New York Life Investments considers the competitive marketplace for mutual funds.
Based on the factors outlined above, among other considerations, the Board concluded that the Portfolio’s management fee and total ordinary operating expenses are within a range that is competitive and support a conclusion that these fees and expenses are reasonable.
Economies of Scale
The Board considered information regarding economies of scale, including whether economies of scale may exist with respect to the Portfolio and whether the Portfolio’s management fee and expense structure permits any economies of scale to be appropriately shared with the Portfolio’s shareholders. The Board also considered a report from New York Life Investments, previously prepared at the request of the Board, that addressed economies of scale, including with respect to the mutual fund business generally, and the various ways in which the benefits of economies of scale may be shared with the funds in the MainStay Group of Funds. Although the Board recognized the difficulty of determining economies of scale with precision, the Board acknowledged that economies of scale may be shared with the Portfolio in a number of ways, including, for example, through the imposition of fee breakpoints, initially setting management fee rates at scale or making additional investments to enhance the services provided to the Portfolio. The Board reviewed information from New York Life Investments showing how the Portfolio’s management fee schedule compared to fee schedules of other funds and accounts managed by New York Life Investments. The Board also reviewed information from ISS showing how the Portfolio’s management fee schedule compared with fees paid for similar services by peer funds at varying asset levels.
Based on this information, the Board concluded that economies of scale are appropriately shared for the benefit of the Portfolio’s shareholders through the Portfolio’s management fee and expense structure and other methods to share benefits from economies of scale.
Conclusion
On the basis of the information and factors summarized above, among other information and factors deemed relevant by the Trustees, and the evaluation thereof, the Board, including the Independent Trustees voting separately, unanimously voted to approve the continuation of the Management Agreement.
Proxy Voting Policies and Procedures and Proxy Voting Record
The Portfolio is required to file with the SEC its proxy voting record for the 12-month period ending June 30 on Form N-PX. A description of the policies and procedures that are used to vote proxies relating to portfolio securities of the Portfolio is available free of charge upon request by calling 800-598-2019 or visiting the SEC's website at www.sec.gov. The most recent Form N-PX or proxy voting record is available free of charge upon request by calling 800-598-2019; visiting https://www.newyorklifeinvestments.com/investment-products/vp; or visiting the SEC’s website at www.sec.gov.
Shareholder Reports and Quarterly Portfolio Disclosure
The Portfolio is required to file its complete schedule of portfolio holdings with the SEC 60 days after its first and third fiscal quarter on Form N-PORT. The Portfolio's holdings report is available free of charge upon request by calling 800-598-2019 or by visiting the SEC’s website at www.sec.gov.
| 30 | MainStay VP PineStone International Equity Portfolio |
Board of Trustees and Officers (Unaudited)
The Trustees and officers of the Portfolio are listed below. The Board oversees the MainStay Group of Funds (which consists of MainStay Funds and MainStay Funds Trust), MainStay VP Funds Trust, MainStay MacKay DefinedTerm Municipal Opportunities Fund, MainStay CBRE Global Infrastructure Megatrends Term Fund, the Manager and the Subadvisors, and elects the officers of the Portfolios who are responsible for the day-to-day operations of the Portfolio. Information pertaining to the Trustees and officers is set forth below. Each Trustee serves until his or her successor is elected and qualified or until his or her resignation,
death or removal. Under the Board’s retirement policy, unless an exception is made, a Trustee must tender his or her resignation by the end of the calendar year during which he or she reaches the age of 75. Officers are elected annually by the Board. The business address of each Trustee and officer listed below is 51 Madison Avenue, New York, New York 10010. A majority of the Trustees are not “interested persons” (as defined by the 1940 Act and rules adopted by the SEC thereunder) of the Portfolio (“Independent Trustees”).
| | Name and
Year of Birth | Term of Office,
Position(s) Held and
Length of Service | Principal Occupation(s)
During Past Five Years | Number of
Portfolios in
Fund Complex
Overseen by
Trustee | Other Directorships
Held by Trustee |
| | | | | | |
| | Naïm Abou-Jaoudé*
1966 | MainStay VP Funds Trust: Trustee since 2023 | Chief Executive Officer of New York Life Investment Management LLC (since 2023). Chief Executive Officer of Candriam (an affiliate of New York Life Investment Management LLC) (2007 to 2023). | 81 | MainStay Funds: Trustee since 2023 (11 Funds)
MainStay Funds Trust: Trustee since 2023 (37 Funds);
MainStay MacKay DefinedTerm Municipal Opportunities Fund: Trustee since 2023;
MainStay CBRE Global Infrastructure Megatrends Term Fund: Trustee since 2023; and
New York Life Investment Management International (Chair) since 2015 |
| * | This Trustee is considered to be an “interested person” of the MainStay Group of Funds, MainStay VP Funds Trust, MainStay CBRE Global Infrastructure Megatrends Term Fund and MainStay MacKay DefinedTerm Municipal Opportunities Fund, within the meaning of the 1940 Act because of his affiliation with New York Life Investment Management LLC and Candriam, as described in detail above in the column entitled “Principal Occupation(s) During Past Five Years.” |
| | |
Board of Trustees and Officers (Unaudited) (continued)
| | Name and
Year of Birth | Term of Office,
Position(s) Held and
Length of Service | Principal Occupation(s)
During Past Five Years | Number of
Portfolios in
Fund Complex
Overseen by
Trustee | Other Directorships
Held by Trustee |
| | | | | | |
| | David H. Chow
1957 | MainStay VP Funds Trust: Trustee since January 2016, Advisory Board Member (June 2015 to December 2015) | Founder and CEO, DanCourt Management, LLC since 1999 | 81 | MainStay Funds: Trustee since January 2016, Advisory Board Member (June 2015 to December 2015) (11 Funds);
MainStay Funds Trust: Trustee since January 2016, Advisory Board Member (June 2015 to December 2015) (37 Funds);
MainStay MacKay DefinedTerm Municipal Opportunities Fund: Trustee since January 2016, Advisory Board Member (June 2015 to December 2015);
MainStay CBRE Global Infrastructure Megatrends Term Fund: Trustee since 2021;
VanEck Vectors Group of Exchange-Traded Funds: Trustee since 2006 and Independent Chairman of the Board of Trustees from 2008 to 2022 (57 portfolios); and
Berea College of Kentucky: Trustee since 2009, Chair of the Investment Committee since 2018 |
| | Karen Hammond
1956 | MainStay VP Funds Trust: Trustee since December 2021, Advisory Board Member (June 2021 to December 2021)
| Retired, Managing Director, Devonshire Investors (2007 to 2013); Senior Vice President, Fidelity Management & Research Co. (2005 to 2007); Senior Vice President and Corporate Treasurer, FMR Corp. (2003 to 2005); Chief Operating Officer, Fidelity Investments Japan (2001 to 2003) | 81 | MainStay Funds: Trustee since December 2021, Advisory Board Member (June 2021 to December 2021) (11 Funds);
MainStay Funds Trust: Trustee since December 2021, Advisory Board Member (June 2021 to December 2021) (37 Funds);
MainStay MacKay DefinedTerm Municipal Opportunities Fund: Trustee since December 2021, Advisory Board Member (June 2021 to December 2021);
MainStay CBRE Global Infrastructure Megatrends Term Fund: Trustee since December 2021, Advisory Board Member (June 2021 to December 2021);
Two Harbors Investment Corp.: Director since 2018;
Rhode Island State Investment Commission: Member since 2017; and
Blue Cross Blue Shield of Rhode Island: Director since 2019 |
| | Susan B. Kerley
1951 | MainStay VP Funds Trust: Chair since 2017 and Trustee since 2007** | President, Strategic Management Advisors LLC since 1990 | 81 | MainStay Funds: Chair since January 2017 and Trustee since 2007 (11 Funds); MainStay Funds Trust: Chair since January 2017 and Trustee since 1990 (37 Funds)***;
MainStay MacKay DefinedTerm Municipal Opportunities Fund: Chair since January 2017 and Trustee since 2011;
MainStay CBRE Global Infrastructure Megatrends Term Fund: Trustee since June 2021; and
Legg Mason Partners Funds: Trustee since 1991 (45 portfolios) |
| 32 | MainStay VP PineStone International Equity Portfolio |
| | Name and
Year of Birth | Term of Office,
Position(s) Held and
Length of Service | Principal Occupation(s)
During Past Five Years | Number of
Portfolios in
Fund Complex
Overseen by
Trustee | Other Directorships
Held by Trustee |
| | | | | | |
| | Alan R. Latshaw
1951 | MainStay VP Funds Trust: Trustee since 2007** | Retired; Partner, Ernst & Young LLP (2002 to 2003); Partner, Arthur Andersen LLP (1989 to 2002); Consultant to the MainStay Funds Audit and Compliance Committee (2004 to 2006) | 81 | MainStay Funds: Trustee since 2006 (11 Funds);
MainStay Funds Trust: Trustee since 2007 (37 Funds)***;
MainStay MacKay DefinedTerm Municipal Opportunities Fund: Trustee since 2011; and
MainStay CBRE Global Infrastructure Megatrends Term Fund: Trustee since June 2021 |
| | Jacques P. Perold
1958 | MainStay VP Funds Trust: Trustee since January 2016, Advisory Board Member (June 2015 to December 2015) | Founder and Chief Executive Officer, CapShift Advisors LLC (since 2018); President, Fidelity Management & Research Company (2009 to 2014); President and Chief Investment Officer, Geode Capital Management, LLC (2001 to 2009) | 81 | MainStay Funds: Trustee since January 2016, Advisory Board Member (June 2015 to December 2015) (11 Funds);
MainStay Funds Trust: Trustee since January 2016, Advisory Board Member (June 2015 to December 2015) (37 Funds);
MainStay MacKay DefinedTerm Municipal Opportunities Fund: Trustee since January 2016, Advisory Board Member (June 2015 to December 2015);
MainStay CBRE Global Infrastructure Megatrends Term Fund: Trustee since June 2021;
Allstate Corporation: Director since 2015;
Partners in Health: Trustee since 2019; and
MSCI Inc.: Director since 2017 |
| | Richard S. Trutanic
1952 | MainStay VP Funds Trust: Trustee since 2007** | Chairman and Chief Executive Officer, Somerset & Company (financial advisory firm) since 2004; Managing Director, The Carlyle Group (private investment firm) (2002 to 2004); Senior Managing Director, Partner and Board Member, Groupe Arnault S.A. (private investment firm) (1999 to 2002) | 81 | MainStay Funds: Trustee since 1994 (11 Funds);
MainStay Funds Trust: Trustee since 2007 (37 Funds)***;
MainStay MacKay DefinedTerm Municipal Opportunities Fund: Trustee since 2011; and
MainStay CBRE Global Infrastructure Megatrends Term Fund: Trustee since June 2021 |
| ** | Includes prior service as a Director of MainStay VP Series Fund, Inc., the predecessor to MainStay VP Funds Trust. |
| *** | Includes prior service as a Director/Trustee of certain predecessor entities to MainStay Funds Trust. |
Board of Trustees and Officers (Unaudited) (continued)
| | Name and
Year of Birth | Position(s) Held and
Length of Service | Principal Occupation(s)
During Past Five Years | |
| | | | | |
| | Kirk C. Lehneis
1974 | President, MainStay VP Funds Trust (since 2017) | Chief Operating Officer and Senior Managing Director (since 2016), New York Life Investment Management LLC and New York Life Investment Management Holdings LLC; Member of the Board of Managers (since 2017) and Senior Managing Director (since 2018), NYLIFE Distributors LLC; Chairman of the Board and Senior Managing Director, NYLIM Service Company LLC (since 2017); Trustee, President and Principal Executive Officer of IndexIQ Trust, IndexIQ ETF Trust and IndexIQ Active ETF Trust (since 2018); President, MainStay CBRE Global Infrastructure Megatrends Term Fund (since 2021), MainStay MacKay DefinedTerm Municipal Opportunities Fund, MainStay Funds and MainStay Funds Trust (since 2017); Senior Managing Director, Global Product Development (from 2015 to 2016); Managing Director, Product Development (from 2010 to 2015), New York Life Investment Management LLC | |
| | Jack R. Benintende
1964 | Treasurer and Principal Financial and Accounting Officer, MainStay VP Funds Trust (since 2007)** | Managing Director, New York Life Investment Management LLC (since 2007); Treasurer and Principal Financial and Accounting Officer, MainStay CBRE Global Infrastructure Megatrends Term Fund (since 2021), MainStay MacKay DefinedTerm Municipal Opportunities Fund (since 2011), MainStay Funds Trust (since 2009) and MainStay Funds (since 2007); and Assistant Treasurer, New York Life Investment Management Holdings LLC (2008 to 2012) | |
| | J. Kevin Gao
1967 | Secretary and Chief Legal Officer, MainStay VP Funds Trust (since 2010)** | Managing Director and Associate General Counsel, New York Life Investment Management LLC (since 2010); Secretary and Chief Legal Officer, MainStay CBRE Global Infrastructure Megatrends Term Fund (since 2021), MainStay MacKay DefinedTerm Municipal Opportunities Fund (since 2011), MainStay Funds and MainStay Funds Trust (since 2010) | |
| | Kevin M. Gleason
1967 | Vice President and Chief Compliance Officer, MainStay VP Funds Trust (since June 2022) | Vice President and Chief Compliance Officer, IndexIQ Trust, IndexIQ ETF Trust and IndexIQ Active ETF Trust (since June 2022); Vice President and Chief Compliance Officer, MainStay CBRE Global Infrastructure Megatrends Term Fund, MainStay MacKay DefinedTerm Municipal Opportunities Fund (since June 2022); MainStay Funds Trust and MainStay Funds (since June 2022); Senior Vice President, Voya Investment Management and Chief Compliance Officer, Voya Family of Funds (2012 to 2022) | |
| | Scott T. Harrington
1959 | Vice President— Administration, MainStay VP Funds Trust (since 2005)** | Managing Director, New York Life Investment Management LLC (including predecessor advisory organizations) (since 2000); Member of the Board of Directors, New York Life Trust Company (since 2009); Vice President—Administration, MainStay CBRE Global Infrastructure Megatrends Term Fund (since 2021), MainStay MacKay DefinedTerm Municipal Opportunities Fund (since 2011), MainStay Funds Trust and MainStay Funds (since 2009) | |
| * | The officers listed above are considered to be “interested persons” of the MainStay Group of Funds, MainStay VP Funds Trust, MainStay CBRE Global Infrastructure Megatrends Term Fund and MainStay MacKay DefinedTerm Municipal Opportunities Fund within the meaning of the 1940 Act because of their affiliation with the MainStay Group of Funds, New York Life Insurance Company and/or its affiliates, including New York Life Investment Management LLC, New York Life Insurance Company, NYLIM Service Company LLC, NYLIFE Securities LLC and/or NYLIFE Distributors LLC, as described in detail in the column captioned “Principal Occupation(s) During Past Five Years.” Officers are elected annually by the Board. |
| ** | Includes prior service as an Officer of MainStay VP Series Fund, Inc., the predecessor to MainStay VP Funds Trust. |
Officers of the Trust (Who are not Trustees)*
| 34 | MainStay VP PineStone International Equity Portfolio |
MainStay VP Portfolios
MainStay VP offers a wide range of Portfolios. The full array of MainStay VP offerings is listed here, with information about the manager, subadvisors, legal counsel, and independent registered public accounting firm.
Equity
MainStay VP American Century Sustainable Equity Portfolio
MainStay VP Candriam Emerging Markets Equity Portfolio
MainStay VP Epoch U.S. Equity Yield Portfolio
MainStay VP Fidelity Institutional AM® Utilities Portfolio†
MainStay VP Natural Resources Portfolio
MainStay VP PineStone International Equity Portfolio1
MainStay VP S&P 500 Index Portfolio
MainStay VP Small Cap Growth Portfolio
MainStay VP Wellington Growth Portfolio
MainStay VP Wellington Mid Cap Portfolio
MainStay VP Wellington Small Cap Portfolio
MainStay VP Wellington U.S. Equity Portfolio
MainStay VP Winslow Large Cap Growth Portfolio
Mixed Asset
MainStay VP Balanced Portfolio
MainStay VP Income Builder Portfolio
MainStay VP Janus Henderson Balanced Portfolio
MainStay VP MacKay Convertible Portfolio
Income
MainStay VP Bond Portfolio
MainStay VP Floating Rate Portfolio
MainStay VP Indexed Bond Portfolio
MainStay VP MacKay Government Portfolio2
MainStay VP MacKay High Yield Corporate Bond Portfolio
MainStay VP MacKay Strategic Bond Portfolio
MainStay VP PIMCO Real Return Portfolio
Money Market
MainStay VP U.S. Government Money Market Portfolio
Alternative
MainStay VP CBRE Global Infrastructure Portfolio
MainStay VP IQ Hedge Multi-Strategy Portfolio
Asset Allocation
MainStay VP Conservative Allocation Portfolio
MainStay VP Equity Allocation Portfolio
MainStay VP Growth Allocation Portfolio
MainStay VP Moderate Allocation Portfolio
Manager
New York Life Investment Management LLC
New York, New York
Subadvisors
American Century Investment Management, Inc.
Kansas City, Missouri
Brown Advisory LLC
Baltimore, Maryland
Candriam*
Strassen, Luxembourg
CBRE Investment Management Listed Real Assets LLC
Radnor, Pennsylvania
Epoch Investment Partners, Inc.
New York, New York
FIAM LLC
Smithfield, Rhode Island
IndexIQ Advisors LLC*
New York, New York
Janus Henderson Investors US LLC
Denver, Colorado
MacKay Shields LLC*
New York, New York
Newton Investment Management North America, LLC
Boston, Massachusetts
NYL Investors LLC*
New York, New York
Pacific Investment Management Company LLC
Newport Beach, California
PineStone Asset Management Inc.
Montreal, Québec
Segall Bryant & Hamill, LLC
Chicago, Illinois
Wellington Management Company LLP
Boston, Massachusetts
Winslow Capital Management, LLC
Minneapolis, Minnesota
Legal Counsel
Dechert LLP
Washington, District of Columbia
Independent Registered Public Accounting Firm
PricewaterhouseCoopers LLP
New York, New York
Distributor
NYLIFE Distributors LLC*
Jersey City, New Jersey
Custodian
JPMorgan Chase Bank, N.A.
New York, New York
Some Portfolios may not be available in all products.
† Fidelity Institutional AM is a registered trade mark of FMR LLC. Used with permission.
* An affiliate of New York Life Investment Management LLC.
| 1. | Prior to August 28, 2023, the Portfolio's name was MainStay VP MacKay International Equity Portfolio. |
| 2. | Effective on or about May 1, 2024, the MainStay VP MacKay Government Portfolio will be renamed the MainStay VP U.S. Infrastructure Bond Portfolio. |
Not part of the Annual Report
2023 Annual Report
This report is for the general information of New York Life Variable Annuities and NYLIAC Variable Universal Life Insurance Products policyowners. It must be preceded or accompanied by the appropriate product(s) and funds prospectuses if it is given to anyone who is not an owner of a New York Life variable annuity policy or a NYLIAC Variable Universal Life Insurance Product. This report does not offer for sale or solicit orders to purchase securities.
The performance data quoted in this report represents past performance. Past performance is no guarantee of future results. Due to market volatility and other factors, current performance may be lower or higher than the figures shown. The most recent month-end performance summary for your variable annuity or variable life policy is available by calling 800-598-2019 and is updated periodically on newyorklife.com.
The New York Life Variable Annuities and NYLIAC Variable Universal Life Insurance Products are issued by New York Life Insurance and Annuity Corporation (a Delaware Corporation) and distributed by NYLIFE Distributors LLC (Member FINRA/SIPC).
New York Life Insurance Company
New York Life Insurance and Annuity
Corporation (NYLIAC) (A Delaware Corporation)
51 Madison Avenue, Room 551
New York, NY 10010
newyorklife.com
newyorklifeinvestments.com
NYLIFE Distributors LLC, 30 Hudson Street, Jersey City, NJ 07302
New York Life Investment Management LLC is the investment manager to the MainStay VP Funds Trust
©2024 by NYLIFE Distributors LLC. All rights reserved.
You may obtain copies of the Prospectus and the Statement of Additional Information free of charge, upon request, by calling toll-free 800-598-2019 or writing to New York Life Insurance and Annuity Corporation, 51 Madison Avenue, New York, NY 10010.
| Not FDIC Insured | No Bank Guarantee | May Lose Value |
(NYLIAC) NI523
MainStay VP Winslow Large Cap Growth Portfolio
Message from the President and Annual Report
December 31, 2023
Special Notice:
Beginning in July 2024, new regulations issued by the Securities and Exchange Commission (SEC) will take effect requiring open-end mutual fund companies and ETFs to (1) overhaul the content of their shareholder reports and (2) mail paper copies of the new tailored shareholder reports to shareholders who have not opted to receive these documents electronically.
If you have not yet elected to receive your shareholder reports electronically, please contact your financial intermediary or visit our website.
| Not FDIC/NCUA Insured | Not a Deposit | May Lose Value | No Bank Guarantee | Not Insured by Any Government Agency |
This page intentionally left blank
Message from the President
Against a backdrop of easing inflationary pressures and continued economic growth, stocks and bonds generally gained ground during the 12-month period ended December 31, 2023, despite high levels of volatility and sharp disparities between the performance of the different market sectors.
Although the war in Ukraine, the outbreak of hostilities in the Middle East and several other notable events affected financial assets, inflation, interest rate, and economic growth trends stood at the forefront of market developments during most of the period. As the reporting period began, high levels of inflation already showed signs of easing in the face of aggressive rate hikes by U.S. Federal Reserve (the “Fed”). From a peak of 9.1% in June 2022, the annualized U.S. inflation rate dropped to 6.4% in January, and 3.4% in December 2023. At the same time, the Fed increased the benchmark federal funds rate from 4.25%–4.50% at the beginning of reporting period, to 5.25%–5.50% as of the end of 2023. Despite the increasing cost of capital and tighter lending environment that resulted from rising rates, economic growth remained surprisingly robust, bolstered by high levels of consumer spending, low levels of unemployment and better-than-expected corporate earnings. With the pace of rate increases slowing from the prior year, investors began hoping for an early shift to a looser monetary policy, with stock prices and bond yields reacting as economic data and statements from the Fed either reinforced or undercut those hopes. Following months of hawkish rhetoric, the Fed finally reversed its stance in December 2023, signaling a positive economic outlook with little chance of a recession and a likelihood of rate cuts in 2024.
The S&P 500® Index, a widely regarded benchmark of U.S. market performance, produced strong gains during the reporting period-– recovering all its losses from 2022 and approached new record territory. A preponderance of the Index’s gains were generated by a relatively small number of mega-cap stocks in the information technology, communication services and consumer discretionary sectors that stood to benefit from rapid developments in generative artificial intelligence (“AI”). Value-oriented, interest-rate sensitive and small-capitalization
shares lagged by significant margins, although market strength widened during the closing weeks of the reporting period. Most overseas equity markets trailed the U.S. market, as developed international economies experienced relatively low growth rates, and weak economic conditions in China undermined emerging markets.
Bonds produced generally positive returns, bolstered by attractive and relatively stable yields. The yield on the 10-year Treasury note hit a high of just under 5% in mid-October 2023, ranging between approximately 3.5% and 4.8% for most of the reporting period. The yield curve remained inverted throughout the year, with the 2-year Treasury yield modestly above the 10-year yield. Corporate bond prices trended moderately higher, generally outperforming government securities. After years of low yields and tight credit spreads, the corporate sector benefited from more attractive valuations and income opportunities. Among corporates, markets generally rewarded longer duration and lower credit quality, although an uptick in default rates posed added risks for high-yield corporate bonds. International bond markets produced mixed returns, with emerging-markets issues advancing over their developed-markets counterparts.
The market volatility of recent years reminds us of the constant need for experienced and steadfast portfolio management in the face of uncertainty. New York Life Investments remains dedicated to providing you, as a valued MainStay VP investor, with the guidance, resources and investment solutions you need to pursue your financial goals.
Thank you for trusting us to help meet your investment needs.
Sincerely,
Kirk C. Lehneis
President
The opinions expressed are as of the date of this report and are subject to change. There is no guarantee that any forecast made will come to pass. This material does not constitute investment advice and is not intended as an endorsement of any specific investment. Past performance is no guarantee of future results.
Not part of the Annual Report
Investors should refer to the Portfolio’s Summary Prospectus and/or Prospectus and consider the Portfolio’s investment objectives, strategies, risks, charges and expenses carefully before investing. The Summary Prospectus and/or Prospectus contain this and other information about the Portfolio. You may obtain copies of the Portfolio’s Summary Prospectus, Prospectus and Statement of Additional Information, which includes information about the MainStay VP Funds Trust's Trustees, free of charge, upon request, by calling toll-free 800-598-2019, by writing to New York Life Insurance and Annuity Corporation, 51 Madison Avenue, Room 251, New York, New York 10010 or by sending an email to MainStayShareholdersServices@nylim.com. These documents are also available at newyorklifeinvestments.com/investment-products/vp. Please read the Portfolio's Summary Prospectus and/or Prospectus carefully before investing. MainStay VP Funds Trust portfolios are separate account options which are purchased through a variable insurance or variable annuity contract.
Investment and Performance Comparison (Unaudited)
Performance data quoted represents past performance. Past performance is no guarantee of future results. Because of market volatility and other factors, current performance may be lower or higher than the figures shown. Investment return and principal value will fluctuate, and as a result, when shares are redeemed, they may be worth more or less than their original cost. The performance table and graph do not reflect any deduction of sales charges, mortality and expense charges, contract charges or administrative charges. Please refer to the Performance Summary appropriate for your policy. For performance information current to the most recent month-end, please call 800-598-2019 or visit www.newyorklife.com.
Performance figures may reflect certain fee waivers and/or expense limitations, without which total returns may have been different. For information on current fee waivers and/or expense limitations (if any), please refer to the Notes to Financial Statements.
| Average Annual Total Returns for the Year-Ended December 31, 2023 |
| Class | Inception
Date | One
Year | Five
Years | Ten
Years | Gross
Expense
Ratio1 |
| Initial Class Shares | 5/1/1998 | 43.05% | 17.58% | 13.47% | 0.75% |
| Service Class Shares | 6/6/2003 | 42.70 | 17.29 | 13.18 | 1.00 |
| 1. | The gross expense ratios presented reflect the Portfolio’s “Total Annual Portfolio Operating Expenses” from the most recent Prospectus and may differ from other expense ratios disclosed in this report. |
| Benchmark Performance* | One
Year | Five
Years | Ten
Years |
| Russell 1000® Growth Index1 | 42.68% | 19.50% | 14.86% |
| S&P 500® Index2 | 26.29 | 15.69 | 12.03 |
| Morningstar Large Growth Category Average3 | 36.74 | 15.74 | 12.03 |
| * | Returns for indices reflect no deductions for fees, expenses or taxes, except for foreign withholding taxes where applicable. Results assume reinvestment of all dividends and capital gains. An investment cannot be made directly in an index. |
| 1. | The Russell 1000® Growth Index is the Portfolio's primary benchmark. The Russell 1000® Growth Index measures the performance of the large-cap growth segment of the U.S. equity universe. It includes those Russell 1000® Index companies with higher price-to-book ratios and higher forecasted growth values. |
| 2. | The S&P 500® Index is the Portfolio's secondary benchmark. S&P 500® is a trademark of The McGraw-Hill Companies, Inc. The S&P 500® Index is widely regarded as the standard index for measuring large-cap U.S. stock market performance. |
| 3. | The Morningstar Large Growth Category Average is representative of funds that invest primarily in big U.S. companies that are projected to grow faster than other large-cap stocks. Stocks in the top 70% of the capitalization of the U.S. equity market are defined as large cap. Growth is defined based on fast growth and high valuations. Most of these funds focus on companies in rapidly expanding industries. Results are based on average total returns of similar funds with all dividends and capital gain distributions reinvested. |
Cost in Dollars of a $1,000 Investment in MainStay VP Winslow Large Cap Growth Portfolio (Unaudited)
The example below is intended to describe the fees and expenses borne by shareholders during the six-month period from July 1, 2023 to December 31, 2023, and the impact of those costs on your investment.
Example
As a shareholder of the Portfolio you incur two types of costs: (1) transaction costs, including exchange fees and sales charges (loads) on purchases (as applicable), and (2) ongoing costs, including management fees, distribution and/or service (12b-1) fees and other Portfolio expenses (as applicable). This example is intended to help you understand your ongoing costs (in dollars) of investing in the Portfolio and to compare these costs with the ongoing costs of investing in other mutual funds. The example is based on an investment of $1,000 made at the beginning of the six-month period and held for the entire period from July 1, 2023 to December 31, 2023. Shares are only sold in connection with variable life and annuity contracts and the example does not reflect any contract level or transactional fees or expenses. If these costs had been included, your costs would have been higher.
This example illustrates your Portfolio’s ongoing costs in two ways:
Actual Expenses
The second and third data columns in the table below provide information about actual account values and actual expenses. You may use the information in these columns, together with the amount you invested, to estimate the expenses that you paid during the six months ended
December 31, 2023. Simply divide your account value by $1,000 (for example, an $8,600 account value divided by $1,000 = 8.6), then multiply the result by the number under the heading entitled “Expenses Paid During Period” to estimate the expenses you paid on your account during this period.
Hypothetical Example for Comparison Purposes
The fourth and fifth data columns in the table below provide information about hypothetical account values and hypothetical expenses based on the Portfolio’s actual expense ratio and an assumed rate of return of 5% per year before expenses, which is not the Portfolio’s actual return. The hypothetical account values and expenses may not be used to estimate the actual ending account balances or expenses you paid for the six-month period shown. You may use this information to compare the ongoing costs of investing in the Portfolio with the ongoing costs of investing in other mutual funds. To do so, compare this 5% hypothetical example with the 5% hypothetical examples that appear in the shareholder reports of the other mutual funds.
Please note that the expenses shown in the table are meant to highlight your ongoing costs only and do not reflect any transactional costs, such as exchange fees or sales charges (loads). Therefore, the fourth and fifth data columns of the table are useful in comparing ongoing costs only and will not help you determine the relative total costs of owning different funds. In addition, if these transactional costs were included, your costs would have been higher.
| Share Class | Beginning
Account
Value
7/1/23 | Ending Account
Value (Based
on Actual
Returns and
Expenses)
12/31/23 | Expenses
Paid
During
Period1 | Ending Account
Value (Based
on Hypothetical
5% Annualized
Return and
Actual Expenses)
12/31/23 | Expenses
Paid
During
Period1 | Net Expense
Ratio
During
Period2 |
| Initial Class Shares | $1,000.00 | $1,138.80 | $3.99 | $1,021.47 | $3.77 | 0.74% |
| Service Class Shares | $1,000.00 | $1,137.40 | $5.33 | $1,020.21 | $5.04 | 0.99% |
| 1. | Expenses are equal to the Portfolio’s annualized expense ratio of each class multiplied by the average account value over the period, divided by 365 and multiplied by 184 (to reflect the six-month period). The table above represents the actual expenses incurred during the six-month period. In addition to the fees and expenses which the Portfolio bears directly, it also indirectly bears a pro rata share of the fees and expenses of the underlying funds in which it invests. Such indirect expenses are not included in the above-reported expense figures. |
| 2. | Expenses are equal to the Portfolio's annualized expense ratio to reflect the six-month period. |
| 6 | MainStay VP Winslow Large Cap Growth Portfolio |
Industry Composition as of December 31, 2023 (Unaudited)
| Software | 21.6% |
| Semiconductors & Semiconductor Equipment | 13.2 |
| Interactive Media & Services | 9.2 |
| Broadline Retail | 6.9 |
| Technology Hardware, Storage & Peripherals | 6.4 |
| Health Care Equipment & Supplies | 6.3 |
| Hotels, Restaurants & Leisure | 5.3 |
| Capital Markets | 4.1 |
| Financial Services | 4.1 |
| IT Services | 2.4 |
| Ground Transportation | 2.2 |
| Entertainment | 1.9 |
| Health Care Providers & Services | 1.8 |
| Biotechnology | 1.6 |
| Pharmaceuticals | 1.6% |
| Life Sciences Tools & Services | 1.6 |
| Chemicals | 1.5 |
| Specialty Retail | 1.5 |
| Machinery | 1.5 |
| Automobiles | 1.4 |
| Consumer Staples Distribution & Retail | 1.2 |
| Textiles, Apparel & Luxury Goods | 1.2 |
| Energy Equipment & Services | 1.0 |
| Short–Term Investment | 0.4 |
| Other Assets, Less Liabilities | 0.1 |
| | 100.0% |
See Portfolio of Investments beginning on page 10 for specific holdings within these categories. The Portfolio's holdings are subject to change.
Top Ten Holdings and/or Issuers Held as of December 31, 2023 (excluding short-term investments) (Unaudited)
| 1. | Microsoft Corp. |
| 2. | Amazon.com, Inc. |
| 3. | Apple, Inc. |
| 4. | Alphabet, Inc. |
| 5. | NVIDIA Corp. |
| 6. | Meta Platforms, Inc., Class A |
| 7. | Broadcom, Inc. |
| 8. | Workday, Inc., Class A |
| 9. | ServiceNow, Inc. |
| 10. | Intuitive Surgical, Inc. |
Portfolio Management Discussion and Analysis (Unaudited)
Answers to the questions reflect the views ofportfolio managers Justin H. Kelly, CFA, Patrick M. Burton, CFA, and Peter A. Dlugosch of Winslow Capital Management, LLC, the Portfolio’s Subadvisor.
How did MainStay VP Winslow Large Cap Growth Portfolio perform relative to its benchmarks and peers during the 12 months December 31, 2023?
For the 12 months ended December 31, 2023, MainStay VP Winslow Large Cap Growth Portfolio returned 43.05% for Initial Class shares and 42.70% for Service Class shares. Over the same period, both share classes outperformed the 42.68% return of the Russell 1000® Growth Index, which is the Portfolio’s primary benchmark, and the 26.29% return of the S&P 500® Index, which is a secondary benchmark of the Portfolio. For the 12 months ended December 31, 2023, both share classes also outperformed the 36.74% return of the Morningstar Large Growth Category Average.1
What factors affected the Portfolio’s relative performance during the reporting period?
The Portfolio outperformed the Russell 1000® Growth Index largely on the strength of underweight exposure to, and favorable stock selection in, the consumer staples and industrials sectors, along with positive stock selection in the information technology sector. Key detractors included allocations and stock selection in the consumer discretionary and materials sectors, as well as overweight exposure to the health care sector.
Strong relative returns reflected the positive impact of our fundamental analysis throughout 2023, culminating with most Portfolio holdings exceeding earnings expectations for the year’s last reported quarter. The only real earnings miss was Tesla, where the Portfolio held an underweight position in anticipation of a potential shortfall. The Portfolio’s positioning in Tesla exemplified our analysis, which signaled lower correlations and fading performance dominance for the so-called “Magnificent 7” (Apple, Microsoft, Alphabet, Amazon.com, NVIDIA, Meta Platforms and Tesla) late in the reporting period. Although we currently own each of these holdings, we do not view them as monolithic and actively weighted each based on their individual interplay of valuation, growth potential and risks.
Which sectors were the strongest positive contributors to the Portfolio’s relative performance, and which sectors were particularly weak?
The sectors making the strongest positive contributions to the Portfolio’s performance relative to the Russell 1000® Growth Index included consumer staples, industrials and information technology. (Contributions take weightings and total returns into account.) In the consumer staples and industrials sectors, underweight allocation and favorable stock selection drove the
Portfolio’s relative outperformance. In information technology, stock selection drove relative outperformance.
The consumer discretionary, health care and materials sectors provided the weakest contributions to the Portfolio’s relative performance. Allocation effect and stock selection produced the underperformance in consumer discretionary and materials, while overweight exposure to health care detracted.
During the reporting period, which individual stocks made the strongest positive contributions to the Portfolio’s absolute performance and which stocks detracted the most?
The leading positive contributors to the Portfolio’s absolute performance during the reporting period included positions in semiconductor maker NVIDIA, productivity software company Microsoft and consumer products company Apple. NVIDIA, the largest contributor to the Portfolio’s absolute performance during the reporting period, reported exceptional earnings as a wide range of customers used the company’s products to leverage generative artificial intelligence (“AI”) in their businesses. Microsoft, the world’s largest software company, delivered strong results as the company benefited from vendor consolidation and its best-in-class product portfolio. Apple, the global leader in smartphones, PC’s, tablets and wearables, was the portfolio’s third strongest absolute contributor, with gains driven by strong operational execution and its significant moat in the smartphone business, which generates more than 50% of the company’s total revenue.
Notable detractors from the Portfolio’s absolute performance during the same period included holdings in health care instrument and supply company Agilent Technologies, health plan provider UnitedHealth Group and agricultural machinery company Deere & Co. We sold the Portfolio’s position in Agilent during the reporting period due to uncertainty regarding estimates for 2024 and beyond, as the breadth and duration of the downturn in demand from key end-markets was difficult to estimate. UnitedHealth Group is both the largest health insurer and the largest provider of health care services in the United States, with services ranging from information technology to outpatient medical treatment. The combination yields a consistent model of high single-digit revenue growth and EPS growth in the low double digits with little macroeconomic sensitivity. Deere, which manufactures agricultural machinery, heavy equipment, forestry machinery, diesel engines, drivetrains used in heavy equipment, and lawn care equipment, was the third most meaningful detractor from the Portfolio’s absolute performance during the
| 1. | See page 5 for more information on benchmark and peer group returns. |
| 8 | MainStay VP Winslow Large Cap Growth Portfolio |
reporting period. We sold the position on concerns that 2023 could be a near-term peak in the agricultural equipment cycle.
Did the Portfolio make any significant purchases or sales during the reporting period?
The Portfolio’s largest purchases included shares in global e-commerce company Amazon.com and Microsoft, described above. Amazon was added back to the Portfolio after materially underperforming in 2022 due to slowing Amazon Web Services growth and poor e-commerce forecasting, leading to an overbuild of the company’s fulfillment network. Microsoft remains a core holding in software, with sustainable double-digit growth driven by continued Azure adoption by enterprises as they move their workloads to the cloud and Office 365. We also believe that generative AI will be a major driver for future growth, as Microsoft is able to offer full-stack solutions to its enterprise customers.
Significant sales included the Portfolio’s positions in internet search company Alphabet and tax preparation and small business accounting software company Intuit. Increasing uncertainty related to Alphabet’s failed AI product demo with Bard (in contrast to Microsoft’s successful rollout of AI-enhanced capabilities within search engine Bing) led us to materially trim the Portfolio’s Alphabet holdings early in the reporting period. With regard to Intuit, data points included in the company’s earnings release led to a lowering of our estimates below street consensus, which prompted our sale of the holding.
How did the Portfolio’s sector weightings change during the reporting period?
During the reporting period the Portfolio’s sector weightings relative to the Russell 1000® Growth Index underwent shifts due to both structural changes within the Portfolio as well as the reconstitution of the Index. In absolute terms, the Portfolio’s exposure to the health care sector decreased significantly, shifting from a significantly overweight position to a mildly overweight position. Similarly, the Portfolio’s absolute exposure to the consumer staples sector declined from a mildly underweight position to a more significantly underweight position.
During the same period, the Portfolio’s largest increase in absolute exposure occurred in the information technology sector, shifting from underweight exposure to a neutral position. The Portfolio’s absolute position in communication services increased as well, also shifting from an underweight position to neutral weight.
How was the Portfolio positioned at the end of the reporting period?
As of December 31, 2023, health care and financials represented the Portfolio’s largest overweight position relative to the Russell 1000® Growth Index. The health care sector was dramatically influenced by highly successful introductions of GLP-1 drugs for diabetes and obesity indications, causing investor exuberance and fear during the reporting period. We believe there are particularly compelling opportunities in medical devices that experienced indiscriminate share price declines related to the success of this new class of drugs. Among financials, the Portfolio’s holdings focus on non-balance sheet financials in digital payments, ratings, and data service providers.
Conversely, the Portfolio held relatively underweight exposure to the consumer staples sector, reflecting our belief that the sector continues to be challenged by declining post-pandemic volumes and three years of higher-than-normal price increases. The industrials sector represents a more mildly underweight position.
The opinions expressed are those of the portfolio managers as of the date of this report and are subject to change. There is no guarantee that any forecasts will come to pass. This material does not constitute investment advice and is not intended as an endorsement of any specific investment.
Not all MainStay VP Portfolios and/or share classes are available under all policies.
Portfolio of Investments December 31, 2023†^
| | Shares | Value |
| Common Stocks 99.5% |
| Automobiles 1.4% |
| Tesla, Inc. (a) | 85,790 | $ 21,317,099 |
| Biotechnology 1.6% |
| Vertex Pharmaceuticals, Inc. (a) | 58,160 | 23,664,722 |
| Broadline Retail 6.9% |
| Amazon.com, Inc. (a) | 683,950 | 103,919,363 |
| Capital Markets 4.1% |
| KKR & Co., Inc. | 262,000 | 21,706,700 |
| Moody's Corp. | 43,940 | 17,161,206 |
| MSCI, Inc. | 40,760 | 23,055,894 |
| | | 61,923,800 |
| Chemicals 1.5% |
| Linde plc | 57,190 | 23,488,505 |
| Consumer Staples Distribution & Retail 1.2% |
| Costco Wholesale Corp. | 26,940 | 17,782,555 |
| Energy Equipment & Services 1.0% |
| Schlumberger NV | 285,400 | 14,852,216 |
| Entertainment 1.9% |
| Netflix, Inc. (a) | 58,130 | 28,302,334 |
| Financial Services 4.1% |
| Mastercard, Inc., Class A | 84,840 | 36,185,108 |
| Visa, Inc., Class A | 96,850 | 25,214,898 |
| | | 61,400,006 |
| Ground Transportation 2.2% |
| Uber Technologies, Inc. (a) | 237,920 | 14,648,734 |
| Union Pacific Corp. | 77,500 | 19,035,550 |
| | | 33,684,284 |
| Health Care Equipment & Supplies 6.3% |
| Boston Scientific Corp. (a) | 325,190 | 18,799,234 |
| Dexcom, Inc. (a) | 146,570 | 18,187,871 |
| IDEXX Laboratories, Inc. (a) | 36,240 | 20,115,012 |
| Intuitive Surgical, Inc. (a) | 114,230 | 38,536,633 |
| | | 95,638,750 |
| Health Care Providers & Services 1.8% |
| UnitedHealth Group, Inc. | 50,350 | 26,507,765 |
| | Shares | Value |
| |
| Hotels, Restaurants & Leisure 5.3% |
| Chipotle Mexican Grill, Inc. (a) | 15,300 | $ 34,990,488 |
| Hilton Worldwide Holdings, Inc. | 92,280 | 16,803,265 |
| McDonald's Corp. | 63,750 | 18,902,513 |
| Starbucks Corp. | 91,390 | 8,774,354 |
| | | 79,470,620 |
| Interactive Media & Services 9.2% |
| Alphabet, Inc. (a) | | |
| Class A | 286,410 | 40,008,613 |
| Class C | 251,050 | 35,380,476 |
| |
| Meta Platforms, Inc., Class A (a) | 181,100 | 64,102,156 |
| | | 139,491,245 |
| IT Services 2.4% |
| Accenture plc, Class A | 55,950 | 19,633,415 |
| Snowflake, Inc., Class A (a) | 87,560 | 17,424,440 |
| | | 37,057,855 |
| Life Sciences Tools & Services 1.6% |
| Thermo Fisher Scientific, Inc. | 44,400 | 23,567,076 |
| Machinery 1.5% |
| Parker-Hannifin Corp. | 49,600 | 22,850,720 |
| Pharmaceuticals 1.6% |
| Eli Lilly & Co. | 40,520 | 23,619,918 |
| Semiconductors & Semiconductor Equipment 13.2% |
| Analog Devices, Inc. | 81,890 | 16,260,078 |
| ASML Holding NV (Registered) | 45,600 | 34,515,552 |
| Broadcom, Inc. | 42,940 | 47,931,775 |
| Lam Research Corp. | 36,410 | 28,518,497 |
| NVIDIA Corp. | 144,190 | 71,405,772 |
| | | 198,631,674 |
| Software 21.6% |
| Atlassian Corp., Class A (a) | 73,640 | 17,516,010 |
| Microsoft Corp. | 453,460 | 170,519,099 |
| Salesforce, Inc. (a) | 144,250 | 37,957,945 |
| ServiceNow, Inc. (a) | 56,270 | 39,754,192 |
| Synopsys, Inc. (a) | 39,190 | 20,179,323 |
| Workday, Inc., Class A (a) | 146,620 | 40,475,917 |
| | | 326,402,486 |
| Specialty Retail 1.5% |
| O'Reilly Automotive, Inc. (a) | 24,500 | 23,276,960 |
The notes to the financial statements are an integral part of, and should be read in conjunction with, the financial statements.
| 10 | MainStay VP Winslow Large Cap Growth Portfolio |
| | Shares | | Value |
| Common Stocks (continued) |
| Technology Hardware, Storage & Peripherals 6.4% |
| Apple, Inc. | 505,450 | | $ 97,314,289 |
| Textiles, Apparel & Luxury Goods 1.2% |
| Lululemon Athletica, Inc. (a) | 34,330 | | 17,552,586 |
Total Common Stocks
(Cost $1,128,816,991) | | | 1,501,716,828 |
| Short-Term Investment 0.4% |
| Affiliated Investment Company 0.4% |
| MainStay U.S. Government Liquidity Fund, 5.235% (b) | 6,290,754 | | 6,290,754 |
Total Short-Term Investment
(Cost $6,290,754) | | | 6,290,754 |
Total Investments
(Cost $1,135,107,745) | 99.9% | | 1,508,007,582 |
| Other Assets, Less Liabilities | 0.1 | | 787,413 |
| Net Assets | 100.0% | | $ 1,508,794,995 |
| † | Percentages indicated are based on Portfolio net assets. |
| ^ | Industry classifications may be different than those used for compliance monitoring purposes. |
| (a) | Non-income producing security. |
| (b) | Current yield as of December 31, 2023. |
Investments in Affiliates (in 000's)
Investments in issuers considered to be affiliate(s) of the Portfolio during the year ended December 31, 2023 for purposes of Section 2(a)(3) of the Investment Company Act of 1940, as amended, were as follows:
| Affiliated Investment Companies | Value,
Beginning
of Year | Purchases
at Cost | Proceeds
from
Sales | Net
Realized
Gain/(Loss)
on Sales | Change in
Unrealized
Appreciation/
(Depreciation) | Value,
End of
Year | Dividend
Income | Other
Distributions | Shares
End of
Year |
| MainStay U.S. Government Liquidity Fund | $ 8,117 | $ 258,817 | $ (260,643) | $ — | $ — | $ 6,291 | $ 313 | $ — | 6,291 |
The notes to the financial statements are an integral part of, and should be read in conjunction with, the financial statements.
11
Portfolio of Investments December 31, 2023†^ (continued)
The following is a summary of the fair valuations according to the inputs used as of December 31, 2023, for valuing the Portfolio’s assets:
| Description | Quoted
Prices in
Active
Markets for
Identical
Assets
(Level 1) | | Significant
Other
Observable
Inputs
(Level 2) | | Significant
Unobservable
Inputs
(Level 3) | | Total |
| Asset Valuation Inputs | | | | | | | |
| Investments in Securities (a) | | | | | | | |
| Common Stocks | $ 1,501,716,828 | | $ — | | $ — | | $ 1,501,716,828 |
| Short-Term Investment | | | | | | | |
| Affiliated Investment Company | 6,290,754 | | — | | — | | 6,290,754 |
| Total Investments in Securities | $ 1,508,007,582 | | $ — | | $ — | | $ 1,508,007,582 |
| (a) | For a complete listing of investments and their industries, see the Portfolio of Investments. |
The notes to the financial statements are an integral part of, and should be read in conjunction with, the financial statements.
| 12 | MainStay VP Winslow Large Cap Growth Portfolio |
Statement of Assets and Liabilities as of December 31, 2023
| Assets |
Investment in unaffiliated securities, at value
(identified cost $1,128,816,991) | $1,501,716,828 |
Investment in affiliated investment companies, at value
(identified cost $6,290,754) | 6,290,754 |
| Receivables: | |
| Investment securities sold | 4,507,658 |
| Dividends | 538,004 |
| Portfolio shares sold | 430,377 |
| Other assets | 8,016 |
| Total assets | 1,513,491,637 |
| Liabilities |
| Payables: | |
| Investment securities purchased | 2,997,765 |
| Manager (See Note 3) | 913,639 |
| Portfolio shares redeemed | 493,376 |
| NYLIFE Distributors (See Note 3) | 240,094 |
| Professional fees | 32,011 |
| Custodian | 13,275 |
| Shareholder communication | 3,777 |
| Accrued expenses | 2,705 |
| Total liabilities | 4,696,642 |
| Net assets | $1,508,794,995 |
| Composition of Net Assets |
| Shares of beneficial interest outstanding (par value of $.001 per share) unlimited number of shares authorized | $ 63,047 |
| Additional paid-in-capital | 974,715,483 |
| | 974,778,530 |
| Total distributable earnings (loss) | 534,016,465 |
| Net assets | $1,508,794,995 |
| Initial Class | |
| Net assets applicable to outstanding shares | $ 364,451,871 |
| Shares of beneficial interest outstanding | 13,961,416 |
| Net asset value per share outstanding | $ 26.10 |
| Service Class | |
| Net assets applicable to outstanding shares | $1,144,343,124 |
| Shares of beneficial interest outstanding | 49,085,562 |
| Net asset value per share outstanding | $ 23.31 |
The notes to the financial statements are an integral part of, and should be read in conjunction with, the financial statements.
13
Statement of Operations for the year ended December 31, 2023
| Investment Income (Loss) |
| Income | |
| Dividends-unaffiliated (net of foreign tax withholding of $54,343) | $ 7,663,207 |
| Dividends-affiliated | 313,161 |
| Securities lending, net | 886 |
| Total income | 7,977,254 |
| Expenses | |
| Manager (See Note 3) | 10,065,569 |
| Distribution/Service—Service Class (See Note 3) | 2,582,926 |
| Professional fees | 125,701 |
| Trustees | 35,114 |
| Shareholder communication | 31,130 |
| Custodian | 30,917 |
| Miscellaneous | 43,961 |
| Total expenses before waiver/reimbursement | 12,915,318 |
| Expense waiver/reimbursement from Manager (See Note 3) | (29,342) |
| Net expenses | 12,885,976 |
| Net investment income (loss) | (4,908,722) |
| Realized and Unrealized Gain (Loss) |
| Net realized gain (loss) on: | |
| Unaffiliated investment transactions | 169,646,539 |
| Foreign currency transactions | (306) |
| Net realized gain (loss) | 169,646,233 |
| Net change in unrealized appreciation (depreciation) on unaffiliated investments | 332,668,480 |
| Net realized and unrealized gain (loss) | 502,314,713 |
| Net increase (decrease) in net assets resulting from operations | $497,405,991 |
The notes to the financial statements are an integral part of, and should be read in conjunction with, the financial statements.
| 14 | MainStay VP Winslow Large Cap Growth Portfolio |
Statements of Changes in Net Assets
for the years ended December 31, 2023 and December 31, 2022
| | 2023 | 2022 |
| Increase (Decrease) in Net Assets |
| Operations: | | |
| Net investment income (loss) | $ (4,908,722) | $ (3,749,572) |
| Net realized gain (loss) | 169,646,233 | 55,370,337 |
| Net change in unrealized appreciation (depreciation) | 332,668,480 | (658,798,432) |
| Net increase (decrease) in net assets resulting from operations | 497,405,991 | (607,177,667) |
| Distributions to shareholders: | | |
| Initial Class | (12,502,210) | (88,754,424) |
| Service Class | (42,877,621) | (263,426,186) |
| Total distributions to shareholders | (55,379,831) | (352,180,610) |
| Capital share transactions: | | |
| Net proceeds from sales of shares | 67,019,422 | 214,496,273 |
| Net asset value of shares issued to shareholders in reinvestment of distributions | 55,379,831 | 352,180,610 |
| Cost of shares redeemed | (323,071,143) | (282,463,949) |
| Increase (decrease) in net assets derived from capital share transactions | (200,671,890) | 284,212,934 |
| Net increase (decrease) in net assets | 241,354,270 | (675,145,343) |
| Net Assets |
| Beginning of year | 1,267,440,725 | 1,942,586,068 |
| End of year | $1,508,794,995 | $1,267,440,725 |
The notes to the financial statements are an integral part of, and should be read in conjunction with, the financial statements.
15
Financial Highlights selected per share data and ratios
| | Year Ended December 31, |
| Initial Class | 2023 | | 2022 | | 2021 | | 2020 | | 2019 |
| Net asset value at beginning of year | $ 18.95 | | $ 37.92 | | $ 32.76 | | $ 25.51 | | $ 21.64 |
| Net investment income (loss) (a) | (0.04) | | (0.02) | | (0.12) | | (0.04) | | 0.00‡ |
| Net realized and unrealized gain (loss) | 8.07 | | (12.18) | | 8.01 | | 9.36 | | 6.95 |
| Total from investment operations | 8.03 | | (12.20) | | 7.89 | | 9.32 | | 6.95 |
| Less distributions: | | | | | | | | | |
| From net realized gain on investments | (0.88) | | (6.77) | | (2.73) | | (2.07) | | (3.08) |
| Net asset value at end of year | $ 26.10 | | $ 18.95 | | $ 37.92 | | $ 32.76 | | $ 25.51 |
| Total investment return (b) | 43.05% | | (31.16)% | | 24.52% | | 37.16% | | 33.64% |
| Ratios (to average net assets)/Supplemental Data: | | | | | | | | | |
| Net investment income (loss) | (0.17)% | | (0.09)% | | (0.34)% | | (0.16)% | | 0.01% |
| Net expenses (c)(d) | 0.74% | | 0.75% | | 0.74% | | 0.75% | | 0.76% |
| Portfolio turnover rate | 82% | | 75% | | 62% | | 54% | | 56% |
| Net assets at end of year (in 000's) | $ 364,452 | | $ 335,309 | | $ 632,666 | | $ 534,965 | | $ 438,089 |
| ‡ | Less than one cent per share. |
| (a) | Per share data based on average shares outstanding during the year. |
| (b) | Total return does not reflect any deduction of sales charges, mortality and expense charges, contract charges or administrative charges. For periods of less than one year, total return is not annualized. |
| (c) | In addition to the fees and expenses which the Portfolio bears directly, it also indirectly bears a pro-rata share of the fees and expenses of the underlying funds in which it invests. Such indirect expenses are not included in the above expense ratios. |
| (d) | Expense waiver/reimbursement less than 0.01%. |
| | Year Ended December 31, |
| Service Class | 2023 | | 2022 | | 2021 | | 2020 | | 2019 |
| Net asset value at beginning of year | $ 17.04 | | $ 35.23 | | $ 30.68 | | $ 24.05 | | $ 20.60 |
| Net investment income (loss) (a) | (0.08) | | (0.08) | | (0.20) | | (0.11) | | (0.06) |
| Net realized and unrealized gain (loss) | 7.23 | | (11.34) | | 7.48 | | 8.81 | | 6.59 |
| Total from investment operations | 7.15 | | (11.42) | | 7.28 | | 8.70 | | 6.53 |
| Less distributions: | | | | | | | | | |
| From net realized gain on investments | (0.88) | | (6.77) | | (2.73) | | (2.07) | | (3.08) |
| Net asset value at end of year | $ 23.31 | | $ 17.04 | | $ 35.23 | | $ 30.68 | | $ 24.05 |
| Total investment return (b) | 42.70% | | (31.34)% | | 24.20% | | 36.81% | | 33.30% |
| Ratios (to average net assets)/Supplemental Data: | | | | | | | | | |
| Net investment income (loss) | (0.42)% | | (0.33)% | | (0.59)% | | (0.41)% | | (0.25)% |
| Net expenses (c)(d) | 0.99% | | 1.00% | | 0.99% | | 1.00% | | 1.01% |
| Portfolio turnover rate | 82% | | 75% | | 62% | | 54% | | 56% |
| Net assets at end of year (in 000's) | $ 1,144,343 | | $ 932,131 | | $ 1,309,920 | | $ 1,093,847 | | $ 825,075 |
| (a) | Per share data based on average shares outstanding during the year. |
| (b) | Total return does not reflect any deduction of sales charges, mortality and expense charges, contract charges or administrative charges. For periods of less than one year, total return is not annualized. |
| (c) | In addition to the fees and expenses which the Portfolio bears directly, it also indirectly bears a pro-rata share of the fees and expenses of the underlying funds in which it invests. Such indirect expenses are not included in the above expense ratios. |
| (d) | Expense waiver/reimbursement less than 0.01%. |
The notes to the financial statements are an integral part of, and should be read in conjunction with, the financial statements.
| 16 | MainStay VP Winslow Large Cap Growth Portfolio |
Notes to Financial Statements
Note 1–Organization and Business
MainStay VP Funds Trust (the “Fund”) was organized as a Delaware statutory trust on February 1, 2011. The Fund is registered under the Investment Company Act of 1940, as amended (the “1940 Act”), as an open-end management investment company. The Fund is comprised of thirty-one separate series (collectively referred to as the “Portfolios”). These financial statements and notes relate to the MainStay VP Winslow Large Cap Growth Portfolio (the "Portfolio"), a "diversified” portfolio, as that term is defined in the 1940 Act, as interpreted or modified by regulatory authorities having jurisdiction, from time to time.
Shares of the Portfolio are currently offered to certain separate accounts to fund variable annuity policies and variable universal life insurance policies issued by New York Life Insurance and Annuity Corporation (“NYLIAC”), a wholly-owned subsidiary of New York Life Insurance Company (“New York Life”) and may also be offered to fund variable annuity policies and variable universal life insurance policies issued by other insurance companies. NYLIAC allocates shares of the Portfolio to, among others, certain NYLIAC separate accounts. Shares of the Portfolio are also offered to the MainStay VP Conservative Allocation Portfolio, MainStay VP Moderate Allocation Portfolio, MainStay VP Growth Allocation Portfolio and MainStay VP Equity Allocation Portfolio, which operate as “funds-of-funds," and other variable insurance funds.
The following table lists the Portfolio's share classes that have been registered and commenced operations:
| Class | Commenced Operations |
| Initial Class | May 1, 1998 |
| Service Class | June 6, 2003 |
Shares of the Portfolio are offered and are redeemed at a price equal to their respective net asset value (“NAV”) per share. No sales or redemption charge is applicable to the purchase or redemption of the Portfolio's shares. Under the terms of the Fund’s multiple class plan, adopted pursuant to Rule 18f-3 under the 1940 Act, the classes differ in that, among other things, Service Class shares of the Portfolio pay a combined distribution and service fee of 0.25% of average daily net assets attributable to Service Class shares of the Portfolio to the Distributor (as defined in Note 3(B)) pursuant to a plan adopted in accordance with Rule 12b-1 under the 1940 Act. Contract owners of variable annuity contracts purchased after June 2, 2003, are permitted to invest only in the Service Class shares.
The Portfolio's investment objective is to seek long-term growth of capital.
Note 2–Significant Accounting Policies
The Portfolio is an investment company and accordingly follows the investment company accounting and reporting guidance of the Financial Accounting Standards Board (“FASB”) Accounting Standards Codification Topic 946 Financial Services—Investment Companies. The Portfolio prepares its financial statements in accordance with generally accepted
accounting principles (“GAAP”) in the United States of America and follows the significant accounting policies described below.
(A) Securities Valuation. Investments are usually valued as of the close of regular trading on the New York Stock Exchange (the "Exchange") (usually 4:00 p.m. Eastern time) on each day the Portfolio is open for business ("valuation date").
Pursuant to Rule 2a-5 under the 1940 Act, the Board of Trustees of the Fund (the "Board") has designated New York Life Investment Management LLC (“New York Life Investments” or the "Manager") as its Valuation Designee (the "Valuation Designee"). The Valuation Designee is responsible for performing fair valuations relating to all investments in the Portfolio’s portfolio for which market quotations are not readily available; periodically assessing and managing material valuation risks; establishing and applying fair value methodologies; testing fair valuation methodologies; evaluating and overseeing pricing services; ensuring appropriate segregation of valuation and portfolio management functions; providing quarterly, annual and prompt reporting to the Board, as appropriate; identifying potential conflicts of interest; and maintaining appropriate records. The Valuation Designee has established a valuation committee ("Valuation Committee") to assist in carrying out the Valuation Designee’s responsibilities and establish prices of securities for which market quotations are not readily available. The Portfolio's and the Valuation Designee's policies and procedures ("Valuation Procedures") govern the Valuation Designee’s selection and application of methodologies for determining and calculating the fair value of Portfolio investments. The Valuation Designee may value the Portfolio's portfolio securities for which market quotations are not readily available and other Portfolio assets utilizing inputs from pricing services and other third-party sources. The Valuation Committee meets (in person, via electronic mail or via teleconference) on an ad-hoc basis to determine fair valuations and on a quarterly basis to review fair value events with respect to certain securities for which market quotations are not readily available, including valuation risks and back-testing results, and to preview reports to the Board.
The Valuation Committee establishes prices of securities for which market quotations are not readily available based on such methodologies and measurements on a regular basis after considering information that is reasonably available and deemed relevant by the Valuation Committee. The Board shall oversee the Valuation Designee and review fair valuation materials on a prompt, quarterly and annual basis and approve proposed revisions to the Valuation Procedures.
Investments for which market quotations are not readily available are valued at fair value as determined in good faith pursuant to the Valuation Procedures. A market quotation is readily available only when that quotation is a quoted price (unadjusted) in active markets for identical investments that the Portfolio can access at the measurement date, provided that a quotation will not be readily available if it is not reliable. "Fair value" is defined as the price the Portfolio would reasonably expect to receive upon selling an asset or liability in an orderly transaction to an independent buyer in the principal or most advantageous market for the
Notes to Financial Statements (continued)
asset or liability. Fair value measurements are determined within a framework that establishes a three-tier hierarchy that maximizes the use of observable market data and minimizes the use of unobservable inputs to establish a classification of fair value measurements for disclosure purposes. "Inputs" refer broadly to the assumptions that market participants would use in pricing the asset or liability, including assumptions about risk, such as the risk inherent in a particular valuation technique used to measure fair value using a pricing model and/or the risk inherent in the inputs for the valuation technique. Inputs may be observable or unobservable. Observable inputs reflect the assumptions market participants would use in pricing the asset or liability based on market data obtained from sources independent of the Portfolio. Unobservable inputs reflect the Portfolio’s own assumptions about the assumptions market participants would use in pricing the asset or liability based on the information available. The inputs or methodology used for valuing assets or liabilities may not be an indication of the risks associated with investing in those assets or liabilities. The three-tier hierarchy of inputs is summarized below.
| • | Level 1—quoted prices (unadjusted) in active markets for an identical asset or liability |
| • | Level 2—other significant observable inputs (including quoted prices for a similar asset or liability in active markets, interest rates and yield curves, prepayment speeds, credit risk, etc.) |
| • | Level 3—significant unobservable inputs (including the Portfolio's own assumptions about the assumptions that market participants would use in measuring fair value of an asset or liability) |
The level of an asset or liability within the fair value hierarchy is based on the lowest level of an input, both individually and in the aggregate, that is significant to the fair value measurement. The aggregate value by input level of the Portfolio’s assets and liabilities as of December 31, 2023, is included at the end of the Portfolio of Investments.
The Portfolio may use third-party vendor evaluations, whose prices may be derived from one or more of the following standard inputs, among others:
| • Broker/dealer quotes | • Benchmark securities |
| • Two-sided markets | • Reference data (corporate actions or material event notices) |
| • Bids/offers | • Monthly payment information |
| • Industry and economic events | • Reported trades |
An asset or liability for which a market quotation is not readily available is valued by methods deemed reasonable in good faith by the Valuation Committee, following the Valuation Procedures to represent fair value. Under these procedures, the Valuation Designee generally uses a market-based approach which may use related or comparable assets or liabilities, recent transactions, market multiples, book values and other relevant information. The Valuation Designee may also use an income-based valuation approach in which the anticipated future cash flows of the asset or liability are discounted to calculate fair value.
Discounts may also be applied due to the nature and/or duration of any restrictions on the disposition of the asset or liability. Fair value represents a good faith approximation of the value of a security. Fair value determinations involve the consideration of a number of subjective factors, an analysis of applicable facts and circumstances and the exercise of judgment. As a result, it is possible that the fair value for a security determined in good faith in accordance with the Valuation Procedures may differ from valuations for the same security determined for other funds using their own valuation procedures. Although the Valuation Procedures are designed to value a security at the price the Portfolio may reasonably expect to receive upon the security's sale in an orderly transaction, there can be no assurance that any fair value determination thereunder would, in fact, approximate the amount that the Portfolio would actually realize upon the sale of the security or the price at which the security would trade if a reliable market price were readily available. During the year ended December 31, 2023, there were no material changes to the fair value methodologies.
Securities which may be valued in this manner include, but are not limited to: (i) a security for which trading has been halted or suspended or otherwise does not have a readily available market quotation on a given day; (ii) a debt security that has recently gone into default and for which there is not a current market quotation; (iii) a security of an issuer that has entered into a restructuring; (iv) a security that has been delisted from a national exchange; (v) a security subject to trading collars for which no or limited trading takes place; and (vi) a security whose principal market has been temporarily closed at a time when, under normal conditions, it would be open. Securities valued in this manner are generally categorized as Level 2 or 3 in the hierarchy.
Equity securities, rights and warrants, if applicable, are valued at the last quoted sales prices as of the close of regular trading on the relevant exchange on each valuation date. Securities that are not traded on the valuation date are valued at the mean of the last quoted bid and ask prices. Prices are normally taken from the principal market in which each security trades. These securities are generally categorized as Level 1 in the hierarchy.
Investments in mutual funds, including money market funds, are valued at their respective NAVs at the close of business each day on the valuation date. These securities are generally categorized as Level 1 in the hierarchy.
Temporary cash investments acquired in excess of 60 days to maturity at the time of purchase are valued using the latest bid prices or using valuations based on a matrix system (which considers such factors as security prices, yields, maturities and ratings), both as furnished by independent pricing services. Temporary cash investments that mature in 60 days or less at the time of purchase ("Short-Term Investments") are valued using the amortized cost method of valuation, unless the use of such method would be inappropriate. The amortized cost method involves valuing a security at its cost on the date of purchase and thereafter assuming a constant amortization to maturity of the difference between such cost and the value on maturity date. Amortized cost approximates
| 18 | MainStay VP Winslow Large Cap Growth Portfolio |
the current fair value of a security. Securities valued using the amortized cost method are not valued using quoted prices in an active market and are generally categorized as Level 2 in the hierarchy.
The information above is not intended to reflect an exhaustive list of the methodologies that may be used to value portfolio investments. The Valuation Procedures permit the use of a variety of valuation methodologies in connection with valuing portfolio investments. The methodology used for a specific type of investment may vary based on the market data available or other considerations. The methodologies summarized above may not represent the specific means by which portfolio investments are valued on any particular business day.
(B) Income Taxes. The Portfolio's policy is to comply with the requirements of the Internal Revenue Code of 1986, as amended (the “Internal Revenue Code”), applicable to regulated investment companies and to distribute all of its taxable income to the shareholders of the Portfolio within the allowable time limits.
The Manager evaluates the Portfolio’s tax positions to determine if the tax positions taken meet the minimum recognition threshold in connection with accounting for uncertainties in income tax positions taken or expected to be taken for the purposes of measuring and recognizing tax liabilities in the financial statements. Recognition of tax benefits of an uncertain tax position is permitted only to the extent the position is “more likely than not” to be sustained assuming examination by taxing authorities. The Manager analyzed the Portfolio's tax positions taken on federal, state and local income tax returns for all open tax years (for up to three tax years) and has concluded that no provisions for federal, state and local income tax are required in the Portfolio's financial statements. The Portfolio's federal, state and local income tax and federal excise tax returns for tax years for which the applicable statutes of limitations have not expired are subject to examination by the Internal Revenue Service and state and local departments of revenue.
(C) Dividends and Distributions to Shareholders. Dividends and distributions are recorded on the ex-dividend date. The Portfolio intends to declare and pay dividends from net investment income and distributions from net realized capital and currency gains, if any, at least annually. All dividends and distributions are reinvested at NAV in the same class of shares of the Portfolio. Dividends and distributions to shareholders are determined in accordance with federal income tax regulations and may differ from determinations using GAAP.
(D) Security Transactions and Investment Income. The Portfolio records security transactions on the trade date. Realized gains and losses on security transactions are determined using the identified cost method. Dividend income is recognized on the ex-dividend date, net of any foreign tax withheld at the source, and interest income is accrued as earned using the effective interest rate method. Distributions received from real estate investment trusts may be classified as dividends, capital gains and/or return of capital.
Investment income and realized and unrealized gains and losses on investments of the Portfolio are allocated pro rata to the separate classes
of shares based upon their relative net assets on the date the income is earned or realized and unrealized gains and losses are incurred.
(E) Expenses. Expenses of the Fund are allocated to the individual Portfolios in proportion to the net assets of the respective Portfolios when the expenses are incurred, except where direct allocations of expenses can be made. Expenses (other than fees incurred under the distribution and service plans, further discussed in Note 3(B), which are charged directly to the Service Class shares) are allocated to separate classes of shares pro rata based upon their relative net assets on the date the expenses are incurred. The expenses borne by the Portfolio, including those of related parties to the Portfolio, are shown in the Statement of Operations.
Additionally, the Portfolio may invest in mutual funds, which are subject to management fees and other fees that may cause the costs of investing in mutual funds to be greater than the costs of owning the underlying securities directly. These indirect expenses of mutual funds are not included in the amounts shown as expenses in the Statement of Operations or in the expense ratios included in the Financial Highlights.
(F) Use of Estimates. In preparing financial statements in conformity with GAAP, the Manager makes estimates and assumptions that affect the reported amounts and disclosures in the financial statements. Actual results could differ from those estimates and assumptions.
(G) Foreign Currency Transactions. The Portfolio's books and records are maintained in U.S. dollars. Prices of securities denominated in foreign currency amounts are translated into U.S. dollars at the mean between the buying and selling rates last quoted by any major U.S. bank at the following dates:
(i) market value of investment securities, other assets and liabilities— at the valuation date; and
(ii) purchases and sales of investment securities, income and expenses—at the date of such transactions.
The assets and liabilities that are denominated in foreign currency amounts are presented at the exchange rates and market values at the close of the period. The realized and unrealized changes in net assets arising from fluctuations in exchange rates and market prices of securities are not separately presented.
Net realized gain (loss) on foreign currency transactions represents net currency gains or losses realized as a result of differences between the amounts of securities sale proceeds or purchase cost, dividends, interest and withholding taxes as recorded on the Portfolio's books, and the U.S. dollar equivalent amount actually received or paid. Net currency gains or losses from valuing such foreign currency denominated assets and liabilities, other than investments at valuation date exchange rates, are reflected in unrealized foreign exchange gains or losses.
(H) Securities Lending. In order to realize additional income, the Portfolio may engage in securities lending, subject to the limitations set forth in the 1940 Act and relevant guidance by the staff of the Securities
Notes to Financial Statements (continued)
and Exchange Commission (“SEC”). If the Portfolio engages in securities lending, the Portfolio will lend through its custodian, JPMorgan Chase Bank, N.A., ("JPMorgan"), acting as securities lending agent on behalf of the Portfolio. Under the current arrangement, JPMorgan will manage the Portfolio's collateral in accordance with the securities lending agency agreement between the Portfolio and JPMorgan, and indemnify the Portfolio against counterparty risk. The loans will be collateralized by cash (which may be invested in a money market fund) and/or non-cash collateral (which may include U.S. Treasury securities and/or U.S. government agency securities issued or guaranteed by the United States government or its agencies or instrumentalities) at least equal at all times to the market value of the securities loaned. Non-cash collateral held at year end is segregated and cannot be transferred by the Portfolio. The Portfolio bears the risk of delay in recovery of, or loss of rights in, the securities loaned. The Portfolio may also record a realized gain or loss on securities deemed sold due to a borrower’s inability to return securities on loan. The Portfolio bears the risk of any loss on investment of cash collateral. The Portfolio will receive compensation for lending its securities in the form of fees or it will retain a portion of interest earned on the investment of any cash collateral. The Portfolio will also continue to receive interest and dividends on the securities loaned and any gain or loss in the market price of the securities loaned that may occur during the term of the loan will be for the account of the Portfolio. Income earned from securities lending activities, if any, is reflected in the Statement of Operations.
(I) Indemnifications. Under the Fund’s organizational documents, its officers and trustees are indemnified against certain liabilities that may arise out of performance of their duties to the Fund. Additionally, in the normal course of business, the Portfolio enters into contracts with third-party service providers that contain a variety of representations and warranties and that may provide general indemnifications. The Portfolio's maximum exposure under these arrangements is unknown, as this would involve future claims that may be made against the Portfolio that have not yet occurred. The Manager believes that the risk of loss in connection with these potential indemnification obligations is remote. However, there can be no assurance that material liabilities related to such obligations will not arise in the future, which could adversely impact the Portfolio.
Note 3–Fees and Related Party Transactions
(A) Manager and Subadvisor. New York Life Investments, a registered investment adviser and an indirect, wholly-owned subsidiary of New York Life, serves as the Portfolio’s Manager, pursuant to an Amended and Restated Management Agreement (“Management Agreement”). The Manager provides offices, conducts clerical, recordkeeping and bookkeeping services and keeps most of the financial and accounting records required to be maintained by the Portfolio. Except for the portion of salaries and expenses that are the responsibility of the Portfolio, the Manager pays the salaries and expenses of all personnel affiliated with the Portfolio and certain operational expenses of the Portfolio. The Portfolio reimburses New York Life Investments in an amount equal to the portion of the compensation of the Chief Compliance Officer attributable
to the Portfolio. Winslow Capital Management, LLC. (“Winslow” or the “Subadvisor”), a registered investment adviser, serves as the Subadvisor to the Portfolio and is responsible for the day-to-day portfolio management of the Portfolio. Pursuant to the terms of a Subadvisory Agreement between New York Life Investments and Winslow, New York Life Investments pays for the services of the Subadvisor.
Pursuant to the Management Agreement, the Fund pays the Manager, on behalf of the Portfolio, a monthly fee for the services performed and the facilities furnished at an annual rate of the Portfolio's average daily net assets as follows: 0.75% up to $500 million; 0.725% from $500 million to $750 million; 0.71% from $750 million to $1 billion; 0.70% from $1 billion to $2 billion; 0.66% from $2 billion to $3 billion; 0.61% from $3 billion to $7 billion; 0.585% from $7 billion to $9 billion; and 0.575% in excess of $9 billion.
New York Life Investments has voluntarily agreed to waive a portion of its management fee when the subadvisory fee is reduced as a result of achieving breakpoints in the subadvisory fee schedule. The savings that result from the reduced subadvisory fee will be shared equally with the Portfolio provided that the amount of the management fee retained by New York Life Investments, after payment of the subadvisory fee, exceeds 0.35% of the average daily net assets of the Portfolio. This waiver may be discontinued at any time.
New York Life Investments has contractually agreed to waive a portion of its management fee so that the management fee does not exceed 0.55% of the Portfolio’s average daily net assets from $11 billion to $13 billion; and 0.525% of the Portfolio’s average daily net assets over $13 billion. This agreement expires May 1, 2024, and may only be amended or terminated prior to that date by action of the Board. During the year ended December 31, 2023, the effective management fee rate was 0.72% (exclusive of any applicable waivers/reimbursements).
During the year ended December 31, 2023, New York Life Investments earned fees from the Portfolio in the amount of $10,065,569 and waived fees and/or reimbursed expenses in the amount of $29,342 and paid the Subadvisor fees in the amount of $3,746,264.
JPMorgan provides sub-administration and sub-accounting services to the Portfolio pursuant to an agreement with New York Life Investments. These services include calculating the daily NAVs of the Portfolio, maintaining the general ledger and sub-ledger accounts for the calculation of the Portfolio's NAVs, and assisting New York Life Investments in conducting various aspects of the Portfolio's administrative operations. For providing these services to the Portfolio, JPMorgan is compensated by New York Life Investments.
Pursuant to an agreement between the Fund and New York Life Investments, New York Life Investments is responsible for providing or procuring certain regulatory reporting services for the Portfolio. The Portfolio will reimburse New York Life Investments for the actual costs incurred by New York Life Investments in connection with providing or procuring these services for the Portfolio.
| 20 | MainStay VP Winslow Large Cap Growth Portfolio |
(B) Distribution and Service Fees. The Fund, on behalf of the Portfolio, has entered into a distribution agreement with NYLIFE Distributors LLC (the “Distributor”), an affiliate of New York Life Investments. The Portfolio has adopted a distribution plan (the “Plan”) in accordance with the provisions of Rule 12b-1 under the 1940 Act. Under the Plan, the Distributor has agreed to provide, through its affiliates or independent third parties, various distribution-related, shareholder and administrative support services to the Service Class shareholders. For its services, the Distributor is entitled to a combined distribution and service fee accrued daily and paid monthly at an annual rate of 0.25% of the average daily net assets attributable to the Service Class shares of the Portfolio.
Note 4-Federal Income Tax
As of December 31, 2023, the cost and unrealized appreciation (depreciation) of the Portfolio’s investment portfolio, including applicable derivative contracts and other financial instruments, as determined on a federal income tax basis, were as follows:
| | Federal Tax
Cost | Gross
Unrealized
Appreciation | Gross
Unrealized
(Depreciation) | Net
Unrealized
Appreciation/
(Depreciation) |
| Investments in Securities | $1,137,385,449 | $371,594,891 | $(972,758) | $370,622,133 |
As of December 31, 2023, the components of accumulated gain (loss) on a tax basis were as follows:
Ordinary
Income | Accumulated
Capital
and Other
Gain (Loss) | Other
Temporary
Differences | Unrealized
Appreciation
(Depreciation) | Total
Accumulated
Gain (Loss) |
| $39,141,583 | $124,252,749 | $— | $370,622,133 | $534,016,465 |
The difference between book-basis and tax-basis unrealized appreciation (depreciation) is primarily due to wash sale adjustments.
The following table discloses the current year reclassifications between total distributable earnings (loss) and additional paid-in capital arising from permanent differences; net assets as of December 31, 2023 were not affected.
| | Total
Distributable
Earnings (Loss) | Additional
Paid-In
Capital |
| | $331,932 | $(331,932) |
The reclassifications for the Portfolio are primarily due to net operating losses.
During the years ended December 31, 2023 and December 31, 2022, the tax character of distributions paid as reflected in the Statements of Changes in Net Assets was as follows:
| | 2023 | 2022 |
| Distributions paid from: | | |
| Ordinary Income | $ — | $ 51,907,115 |
| Long-Term Capital Gains | 55,379,831 | 300,273,495 |
| Total | $55,379,831 | $352,180,610 |
Note 5–Custodian
JPMorgan is the custodian of cash and securities held by the Portfolio. Custodial fees are charged to the Portfolio based on the Portfolio's net assets and/or the market value of securities held by the Portfolio and the number of certain transactions incurred by the Portfolio.
Note 6–Line of Credit
The Portfolio and certain other funds managed by New York Life Investments maintain a line of credit with a syndicate of banks in order to secure a source of funds for temporary purposes to meet unanticipated or excessive redemption requests.
Effective July 25, 2023, under the credit agreement (the “Credit Agreement”), the aggregate commitment amount is $600,000,000 with an additional uncommitted amount of $100,000,000. The commitment fee is an annual rate of 0.15% of the average commitment amount payable quarterly, regardless of usage, to JPMorgan, who serves as the agent to the syndicate. The commitment fee is allocated among the Portfolio and certain other funds managed by New York Life Investments based upon their respective net assets and other factors. Interest on any revolving credit loan is charged based upon the Federal Funds Rate, Daily Simple Secured Overnight Financing Rate ("SOFR") + 0.10%, or the Overnight Bank Funding Rate, whichever is higher. The Credit Agreement expires on July 23, 2024, although the Portfolio, certain other funds managed by New York Life Investments and the syndicate of banks may renew the Credit Agreement for an additional year on the same or different terms or enter into a credit agreement with a different syndicate of banks. Prior to July 25, 2023, the aggregate commitment amount and the commitment fee were the same as those under the current Credit Agreement. During the year ended December 31, 2023, there were no borrowings made or outstanding with respect to the Portfolio under the Credit Agreement.
Note 7–Interfund Lending Program
Pursuant to an exemptive order issued by the SEC, the Portfolio, along with certain other funds managed by New York Life Investments, may participate in an interfund lending program. The interfund lending program provides an alternative credit facility that permits the Portfolio and certain other funds managed by New York Life Investments to lend or borrow money for temporary purposes directly to or from one another, subject to the conditions of the exemptive order. During the year ended
Notes to Financial Statements (continued)
December 31, 2023, there were no interfund loans made or outstanding with respect to the Portfolio.
Note 8–Purchases and Sales of Securities (in 000’s)
During the year ended December 31, 2023, purchases and sales of securities, other than short-term securities, were $1,131,307 and $1,391,442, respectively.
Note 9–Capital Share Transactions
Transactions in capital shares for the years ended December 31, 2023 and December 31, 2022, were as follows:
| Initial Class | Shares | Amount |
| Year ended December 31, 2023: | | |
| Shares sold | 471,629 | $ 10,182,187 |
| Shares issued to shareholders in reinvestment of distributions | 550,050 | 12,502,210 |
| Shares redeemed | (4,751,218) | (109,156,142) |
| Net increase (decrease) | (3,729,539) | $ (86,471,745) |
| Year ended December 31, 2022: | | |
| Shares sold | 2,106,607 | $ 63,629,404 |
| Shares issued to shareholders in reinvestment of distributions | 4,944,646 | 88,754,424 |
| Shares redeemed | (6,044,937) | (171,066,781) |
| Net increase (decrease) | 1,006,316 | $ (18,682,953) |
| |
| Service Class | Shares | Amount |
| Year ended December 31, 2023: | | |
| Shares sold | 2,796,721 | $ 56,837,235 |
| Shares issued to shareholders in reinvestment of distributions | 2,111,148 | 42,877,621 |
| Shares redeemed | (10,509,566) | (213,915,001) |
| Net increase (decrease) | (5,601,697) | $(114,200,145) |
| Year ended December 31, 2022: | | |
| Shares sold | 5,856,023 | $ 150,866,869 |
| Shares issued to shareholders in reinvestment of distributions | 16,310,714 | 263,426,186 |
| Shares redeemed | (4,663,155) | (111,397,168) |
| Net increase (decrease) | 17,503,582 | $ 302,895,887 |
Note 10–Other Matters
As of the date of this report, the Portfolio faces a heightened level of risk associated with current uncertainty, volatility and state of economies, financial markets, rising interest rates, and labor and health conditions around the world. Events such as war, acts of terrorism, recessions, rapid inflation, the imposition of international sanctions, earthquakes, hurricanes, epidemics and pandemics and other unforeseen natural or human disasters may have broad adverse social, political and economic effects on the global economy, which could negatively impact the value of the Portfolio's investments. Developments that disrupt global economies
and financial markets may magnify factors that affect the Portfolio's performance.
Note 11–Subsequent Events
In connection with the preparation of the financial statements of the Portfolio as of and for the year ended December 31, 2023, events and transactions subsequent to December 31, 2023, through the date the financial statements were issued, have been evaluated by the Manager for possible adjustment and/or disclosure. No subsequent events requiring financial statement adjustment or disclosure have been identified.
| 22 | MainStay VP Winslow Large Cap Growth Portfolio |
Report of Independent Registered Public Accounting Firm
To the Board of Trustees of MainStay VP Funds Trust and Shareholders of MainStay VP Winslow Large Cap Growth Portfolio
Opinion on the Financial Statements
We have audited the accompanying statement of assets and liabilities, including the portfolio of investments, of MainStay VP Winslow Large Cap Growth Portfolio (one of the portfolios constituting MainStay VP Funds Trust, referred to hereafter as the “Portfolio”) as of December 31, 2023, the related statement of operations for the year ended December 31, 2023, the statements of changes in net assets for each of the two years in the period ended December 31, 2023, including the related notes, and the financial highlights for each of the five years in the period ended December 31, 2023 (collectively referred to as the “financial statements”). In our opinion, the financial statements present fairly, in all material respects, the financial position of the Portfolio as of December 31, 2023, the results of its operations for the year then ended, the changes in its net assets for each of the two years in the period ended December 31, 2023 and the financial highlights for each of the five years in the period ended December 31, 2023 in conformity with accounting principles generally accepted in the United States of America.
Basis for Opinion
These financial statements are the responsibility of the Portfolio’s management. Our responsibility is to express an opinion on the Portfolio’s financial statements based on our audits. We are a public accounting firm registered with the Public Company Accounting Oversight Board (United States) (PCAOB) and are required to be independent with respect to the Portfolio in accordance with the U.S. federal securities laws and the applicable rules and regulations of the Securities and Exchange Commission and the PCAOB.
We conducted our audits of these financial statements in accordance with the standards of the PCAOB. Those standards require that we plan and perform the audit to obtain reasonable assurance about whether the financial statements are free of material misstatement, whether due to error or fraud.
Our audits included performing procedures to assess the risks of material misstatement of the financial statements, whether due to error or fraud, and performing procedures that respond to those risks. Such procedures included examining, on a test basis, evidence regarding the amounts and disclosures in the financial statements. Our audits also included evaluating the accounting principles used and significant estimates made by management, as well as evaluating the overall presentation of the financial statements. Our procedures included confirmation of securities owned as of December 31, 2023 by correspondence with the custodian, transfer agent, and broker; when replies were not received from broker, we performed other auditing procedures. We believe that our audits provide a reasonable basis for our opinion.
/s/PricewaterhouseCoopers LLP
New York, New York
February 26, 2024
We have served as the auditor of one or more investment companies in the MainStay group of funds since 1984.
Board Consideration and Approval of Management Agreement and Subadvisory Agreement (Unaudited)
The continuation of the Management Agreement with respect to the MainStay VP Winslow Large Cap Growth Portfolio (“Portfolio”) and New York Life Investment Management LLC (“New York Life Investments”) and the Subadvisory Agreement between New York Life Investments and Winslow Capital Management, LLC (“Winslow Capital”) with respect to the Portfolio (together, “Advisory Agreements”) is subject to annual review and approval by the Board of Trustees of MainStay VP Funds Trust (“Board” of the “Trust”) in accordance with Section 15 of the Investment Company Act of 1940, as amended (“1940 Act”). At its December 6–7, 2023 meeting, the Board, including the Trustees who are not an “interested person” (as such term is defined in the 1940 Act) of the Trust (“Independent Trustees”) voting separately, unanimously approved the continuation of each of the Advisory Agreements for a one-year period.
In reaching the decision to approve the continuation of each of the Advisory Agreements, the Board considered information and materials furnished by New York Life Investments and Winslow Capital in connection with an annual contract review process undertaken by the Board that took place at meetings of the Board and its Contracts Committee from September 2023 through December 2023, including information and materials furnished by New York Life Investments and Winslow Capital in response to requests prepared on behalf of the Board, and in consultation with the Independent Trustees, by independent legal counsel to the Independent Trustees, which encompassed a variety of topics, including those summarized below. Information and materials requested by and furnished to the Board for consideration in connection with the contract review process included, among other items, reports on the Portfolio and “peer funds” prepared by Institutional Shareholder Services Inc. (“ISS”), an independent third-party service provider engaged by the Board to report objectively on the Portfolio’s investment performance, management fee and total expenses. The Board also considered information on the fees charged to other investment advisory clients of New York Life Investments and/or Winslow Capital that follow investment strategies similar to those of the Portfolio, if any, and, when applicable, the rationale for differences in the Portfolio’s management and subadvisory fees and the fees charged to those other investment advisory clients. In addition, the Board considered information regarding the legal standards and fiduciary obligations applicable to its consideration of the continuation of each of the Advisory Agreements. The contract review process, including the structure and format for information and materials provided to the Board, has been developed in consultation with the Board. The Independent Trustees also met in executive sessions with their independent legal counsel and, for portions thereof, with senior management of New York Life Investments.
The Board’s deliberations with respect to the continuation of each of the Advisory Agreements reflect a year-long process, and the Board also took into account information furnished to the Board and its Committees throughout the year, as deemed relevant and appropriate by the Trustees, including, among other items, reports on investment performance of the Portfolio and investment-related matters for the Portfolio as well as presentations from New York Life Investments and, generally annually, Winslow Capital personnel. In addition, the Board took into
account other information provided by New York Life Investments throughout the year, including, among other items, periodic reports on legal and compliance matters, risk management, portfolio turnover, brokerage commissions and non-advisory services provided to the Portfolio by New York Life Investments, as deemed relevant and appropriate by the Trustees.
In addition to information provided to the Board throughout the year, the Board received information in connection with its June 2023 meeting provided specifically in response to requests prepared on behalf of the Board, and in consultation with the Independent Trustees, by independent legal counsel to the Independent Trustees regarding the Portfolio’s distribution arrangements. In addition, the Board received information regarding the Portfolio’s asset levels, share purchase and redemption activity and the payment of Rule 12b-1 and/or certain other fees by applicable share classes of the Portfolio, among other information.
In considering the continuation of each of the Advisory Agreements, the Trustees reviewed and evaluated the information and factors they believed to reasonably be necessary and appropriate in light of legal advice furnished to them by independent legal counsel to the Independent Trustees and through the exercise of their own business judgment. Although individual Trustees may have weighed certain factors or information differently and the Board did not consider any single factor or information controlling in reaching its decision, the factors that figured prominently in the Board’s consideration of the continuation of each of the Advisory Agreements are summarized in more detail below and include, among other factors: (i) the nature, extent and quality of the services provided to the Portfolio by New York Life Investments and Winslow Capital; (ii) the qualifications of the portfolio managers of the Portfolio and the historical investment performance of the Portfolio, New York Life Investments and Winslow Capital; (iii) the costs of the services provided, and profits realized, by New York Life Investments and Winslow Capital with respect to their relationships with the Portfolio; (iv) the extent to which economies of scale have been realized or may be realized if the Portfolio grows and the extent to which any economies of scale have been shared, have benefited or may benefit the Portfolio’s shareholders; and (v) the reasonableness of the Portfolio’s management and subadvisory fees and total ordinary operating expenses. Although the Board recognized that comparisons between the Portfolio’s fees and expenses and those of other funds are imprecise given different terms of agreements, variations in fund strategies and other factors, the Board considered the reasonableness of the Portfolio’s management fee and total ordinary operating expenses as compared to the peer funds identified by ISS. Throughout their considerations, the Trustees acknowledged the commitment of New York Life Investments and its affiliates to serve the MainStay Group of Funds, as well as their capacity, experience, resources, financial stability and reputations. The Trustees also acknowledged the entrepreneurial and other risks assumed by New York Life Investments in sponsoring and managing the Portfolio. With respect to the Subadvisory Agreement, the Board took into account New York Life Investments’ recommendation to approve the continuation of the Subadvisory Agreement.
| 24 | MainStay VP Winslow Large Cap Growth Portfolio |
The Trustees noted that, throughout the year, the Trustees are afforded an opportunity to ask questions of, and request additional information or materials from, New York Life Investments and Winslow Capital. The Board’s decision with respect to each of the Advisory Agreements may have also been based, in part, on the Board’s knowledge of New York Life Investments and Winslow Capital resulting from, among other things, the Board’s consideration of each of the Advisory Agreements in prior years, the advisory agreements for other funds in the MainStay Group of Funds, the Board’s review throughout the year of the performance and operations of other funds in the MainStay Group of Funds and each Trustee’s business judgment and industry experience. In addition to considering the above-referenced factors, the Board observed that in the marketplace, notably under variable life insurance policies and variable annuity contracts for which the Portfolio serves as an investment option, there are a range of investment options available to investors and that the Portfolio’s shareholders, having had the opportunity to consider other investment options, have invested in the Portfolio.
The factors that figured prominently in the Board’s decision to approve the continuation of each of the Advisory Agreements during the Board’s December 6–7, 2023 meeting are summarized in more detail below.
Nature, Extent and Quality of Services Provided by New York Life Investments and Winslow Capital
The Board examined the nature, extent and quality of the services that New York Life Investments provides to the Portfolio. The Board evaluated New York Life Investments’ experience and capabilities in serving as manager of the Portfolio and considered that the Portfolio operates in a “manager-of-managers” structure. The Board also considered New York Life Investments’ responsibilities and services provided pursuant to this structure, including overseeing the services provided by Winslow Capital, evaluating the performance of Winslow Capital, making recommendations to the Board as to whether the Subadvisory Agreement should be renewed, modified or terminated and periodically reporting to the Board regarding the results of New York Life Investments’ evaluation and monitoring functions. The Board noted that New York Life Investments manages other mutual funds, serves a variety of other investment advisory clients, including other pooled investment vehicles, and has experience overseeing mutual fund service providers, including subadvisors. The Board considered the experience of senior personnel at New York Life Investments providing management and administrative and other non-advisory services to the Portfolio. The Board observed that New York Life Investments devotes significant resources and time to providing management and administrative and other non-advisory services to the Portfolio, including New York Life Investments’ oversight and due diligence reviews of Winslow Capital and ongoing analysis of, and interactions with, Winslow Capital with respect to, among other things, the Portfolio’s investment performance and risks as well as Winslow Capital’s investment capabilities and subadvisory services with respect to the Portfolio.
The Board also considered the range of services that New York Life Investments provides to the Portfolio under the terms of the Management Agreement, including: (i) fund accounting and ongoing supervisory services provided by New York Life Investments’ Fund Administration and Accounting Group; (ii) investment supervisory and analytical services provided by New York Life Investments’ Investment Consulting Group; (iii) compliance services provided by the Trust’s Chief Compliance Officer as well as New York Life Investments’ compliance department, including supervision and implementation of the Portfolio’s compliance program; (iv) legal services provided by New York Life Investments’ Office of the General Counsel; and (v) risk management monitoring and analysis by compliance and investment personnel. In addition, the Board considered New York Life Investments’ willingness to invest in personnel and other resources, such as cyber security, information security and business continuity planning, that may benefit the Portfolio and noted that New York Life Investments is responsible for compensating the Trust’s officers, except for a portion of the salary of the Trust’s Chief Compliance Officer. The Board recognized that New York Life Investments provides certain other non-advisory services to the Portfolio and has over time provided an increasingly broad array of non-advisory services to the MainStay Group of Funds as a result of regulatory and other developments.
The Board also examined the range, and the nature, extent and quality, of the investment advisory services that Winslow Capital provides to the Portfolio and considered the terms of each of the Advisory Agreements. The Board evaluated Winslow Capital’s experience and performance in serving as subadvisor to the Portfolio and advising other portfolios and Winslow Capital’s track record and experience in providing investment advisory services as well as the experience of investment advisory, senior management and administrative personnel at Winslow Capital. The Board considered New York Life Investments’ and Winslow Capital’s overall resources, legal and compliance environment, capabilities, reputation, financial condition and history. In addition to information provided in connection with quarterly meetings with the Trust’s Chief Compliance Officer, the Board considered information regarding the compliance policies and procedures of New York Life Investments and Winslow Capital and acknowledged their commitment to further developing and strengthening compliance programs that may relate to the Portfolio. The Board also considered Winslow Capital’s ability to recruit and retain qualified investment professionals and willingness to invest in personnel and other resources that may benefit the Portfolio. In this regard, the Board considered the qualifications and experience of the Portfolio’s portfolio managers, the number of accounts managed by the portfolio managers and the method for compensating the portfolio managers.
In addition, the Board considered information provided by New York Life Investments and Winslow Capital regarding their respective business continuity and disaster recovery plans.
Based on these considerations, among others, the Board concluded that the Portfolio would likely continue to benefit from the nature, extent and quality of these services.
Board Consideration and Approval of Management Agreement and Subadvisory Agreement (Unaudited) (continued)
Investment Performance
In evaluating the Portfolio’s investment performance, the Board considered investment performance results over various periods in light of the Portfolio’s investment objective, strategies and risks. The Board considered investment reports on, and analysis of, the Portfolio’s performance provided to the Board throughout the year. These reports include, among other items, information on the Portfolio’s gross and net returns, the Portfolio’s investment performance compared to a relevant investment category and the Portfolio’s benchmarks, the Portfolio’s risk-adjusted investment performance and the Portfolio’s investment performance as compared to peer funds, as appropriate, as well as portfolio attribution information and commentary on the effect of market conditions. The Board also considered information provided by ISS showing the investment performance of the Portfolio as compared to peer funds. In addition, the Board reviewed the methodology used by ISS to construct the group of peer funds for comparative purposes.
The Board also took into account its discussions with senior management at New York Life Investments concerning the Portfolio’s investment performance over various periods as well as discussions between representatives of Winslow Capital and the members of the Board’s Investment Committee, which generally occur on an annual basis.
Based on these considerations, among others, the Board concluded that its review of the Portfolio’s investment performance and related information supported a determination to approve the continuation of each of the Advisory Agreements.
Costs of the Services Provided, and Profits and Other Benefits Realized, by New York Life Investments and Winslow Capital
The Board considered the costs of the services provided under each of the Advisory Agreements. The Board also considered the profitability of New York Life Investments and its affiliates and Winslow Capital due to their relationships with the Portfolio as well as by New York Life Investments and its affiliates due to their relationships with the MainStay Group of Funds. With respect to the profitability of Winslow Capital’s relationship with the Portfolio, the Board considered information from New York Life Investments that Winslow Capital’s subadvisory fee reflected an arm’s-length negotiation and that this fee is paid by New York Life Investments, not the Portfolio, and the relevance of Winslow Capital’s profitability was considered by the Trustees in that context. On this basis, the Board primarily considered the costs and profitability for New York Life Investments and its affiliates with respect to the Portfolio.
In addition, the Board acknowledged the difficulty in obtaining reliable comparative data about mutual fund managers’ profitability because such information generally is not publicly available and may be impacted by numerous factors, including the structure of a fund manager’s organization, the types of funds it manages, the methodology used to allocate certain fixed costs to specific funds and the manager’s capital structure and costs of capital.
In evaluating the costs of the services provided by New York Life Investments and Winslow Capital, and profitability of New York Life Investments and its affiliates and Winslow Capital due to their relationships with the Portfolio, the Board considered, among other factors, New York Life Investments’ and its affiliates’ and Winslow Capital’s continuing investments in, or willingness to invest in, personnel and other resources that may support and further enhance the management of the Portfolio, and that New York Life Investments is responsible for paying the subadvisory fee for the Portfolio. The Board also considered the financial resources of New York Life Investments and Winslow Capital and acknowledged that New York Life Investments and Winslow Capital must be in a position to recruit and retain experienced professional personnel and to maintain a strong financial position for New York Life Investments and Winslow Capital to continue to provide high-quality services to the Portfolio. The Board recognized that the Portfolio benefits from the allocation of certain fixed costs among the funds in the MainStay Group of Funds, among other expected benefits resulting from its relationship with New York Life Investments.
The Board considered information regarding New York Life Investments’ methodology for calculating profitability and allocating costs provided by New York Life Investments in connection with the fund profitability analysis presented to the Board. The Board concluded that New York Life Investments’ methods for allocating costs and procedures for estimating overall profitability of the relationship with the funds in the MainStay Group of Funds were reasonable. The Board recognized the difficulty in calculating and evaluating a manager’s profitability with respect to the Portfolio and considered that other profitability methodologies may also be reasonable.
The Board also considered certain fall-out benefits that may be realized by New York Life Investments and its affiliates and Winslow Capital and its affiliates due to their relationships with the Portfolio, including reputational and other indirect benefits. The Board recognized, for example, the benefits to Winslow Capital from legally permitted “soft-dollar” arrangements by which brokers provide research and other services to Winslow Capital in exchange for commissions paid by the Portfolio with respect to trades in the Portfolio’s portfolio securities. In this regard, the Board also requested and considered information from New York Life Investments concerning other material business relationships between Winslow Capital and its affiliates and New York Life Investments and its affiliates that relates to certain current and future products and represents a potential conflict of interest associated with New York Life Investments’ recommendation to approve the Subadvisory Agreement. In addition, the Board considered its review of the management agreement for a money market fund advised by New York Life Investments and an affiliated subadvisor that serves as an investment option for the Portfolio, including the potential rationale for and costs associated with investments in this money market fund by the Portfolio, if any, and considered information from New York Life Investments that the nature and type of specific investment advisory services provided to this money market fund are distinct from, or in addition to, the investment advisory services
| 26 | MainStay VP Winslow Large Cap Growth Portfolio |
provided to the Portfolio. In addition, the Board considered the potential dividend received tax deduction for insurance company affiliates of New York Life Investments from the Portfolio’s securities lending activity.
The Board noted that the Portfolio serves as an investment option primarily under variable contracts issued by affiliates of New York Life Investments that would receive fees under those contracts. The Board observed that, in addition to fees earned by New York Life Investments under the Management Agreement for managing the Portfolio, New York Life Investments’ affiliates also earn revenues from serving the Portfolio in various other capacities, including as the Portfolio’s distributor, and insurance companies affiliated with New York Life Investments would be entitled to receive fees from the Portfolio under a distribution and service plan adopted pursuant to Rule 12b-1 under the 1940 Act. The Board considered information about these other revenues and their impact on the profitability of the relationship with the Portfolio to New York Life Investments and its affiliates. The Board noted that, although it assessed the overall profitability of the relationship with the Portfolio to New York Life Investments and its affiliates as part of the contract review process, when considering the reasonableness of the fee paid to New York Life Investments under the Management Agreement, the Board considered the profitability of New York Life Investments’ relationship with the Portfolio on a pre-tax basis and without regard to distribution expenses incurred by New York Life Investments from its own resources.
After evaluating the information deemed relevant by the Trustees, the Board concluded that any profits realized by New York Life Investments and its affiliates due to their relationships with the Portfolio were not excessive, other expected benefits that may accrue to New York Life Investments and its affiliates are reasonable and other expected benefits that may accrue to Winslow Capital and its affiliates are consistent with those expected for a subadvisor to a mutual fund. With respect to Winslow Capital, the Board considered that any profits realized by Winslow Capital due to its relationship with the Portfolio are the result of arm’s-length negotiations between New York Life Investments and Winslow Capital, acknowledging that any such profits are based on the subadvisory fee paid to Winslow Capital by New York Life Investments, not the Portfolio.
Management and Subadvisory Fees and Total Ordinary Operating Expenses
The Board evaluated the reasonableness of the fee paid under each of the Advisory Agreements and the Portfolio’s total ordinary operating expenses. With respect to the management fee and subadvisory fee, the Board primarily considered the reasonableness of the management fee paid by the Portfolio to New York Life Investments because the subadvisory fee paid to Winslow Capital is paid by New York Life Investments, not the Portfolio. The Board also considered the reasonableness of the subadvisory fee paid by New York Life Investments and the amount of the management fee retained by New York Life Investments.
In assessing the reasonableness of the Portfolio’s fees and expenses, the Board primarily considered comparative data provided by ISS on the fees and expenses of similar mutual funds managed by other investment advisers. The Board reviewed the methodology used by ISS to construct the group of peer funds for comparative purposes. In addition, the Board considered information provided by New York Life Investments and Winslow Capital on fees charged to other investment advisory clients, including institutional separate accounts and/or other funds, that follow investment strategies similar to those of the Portfolio, if any. The Board considered the contractual management fee schedule for the Portfolio as compared to those for such other investment advisory clients, taking into account the rationale for differences in fee schedules. The Board also took into account information provided by New York Life Investments about the more extensive scope of services provided to registered investment companies, such as the Portfolio, as compared with other investment advisory clients. Additionally, the Board considered the impact of contractual breakpoints and voluntary waivers on the Portfolio’s net management fee and expenses. The Board also considered that in proposing fees for the Portfolio, New York Life Investments considers the competitive marketplace for mutual funds. The Board considered its discussions with representatives from New York Life Investments regarding the management fee paid by the Portfolio.
Based on the factors outlined above, among other considerations, the Board concluded that the Portfolio’s management fee and total ordinary operating expenses are within a range that is competitive and support a conclusion that these fees and expenses are reasonable.
Economies of Scale
The Board considered information regarding economies of scale, including whether economies of scale may exist with respect to the Portfolio and whether the Portfolio’s management fee and expense structure permits any economies of scale to be appropriately shared with the Portfolio’s shareholders. The Board also considered a report from New York Life Investments, previously prepared at the request of the Board, that addressed economies of scale, including with respect to the mutual fund business generally, and the various ways in which the benefits of economies of scale may be shared with the funds in the MainStay Group of Funds. Although the Board recognized the difficulty of determining economies of scale with precision, the Board acknowledged that economies of scale may be shared with the Portfolio in a number of ways, including, for example, through the imposition of fee breakpoints, initially setting management fee rates at scale or making additional investments to enhance the services provided to the Portfolio. The Board reviewed information from New York Life Investments showing how the Portfolio’s management fee schedule compared to fee schedules of other funds and accounts managed by New York Life Investments. The Board also reviewed information from ISS showing how the Portfolio’s management fee schedule compared with fees paid for similar services by peer funds at varying asset levels.
Board Consideration and Approval of Management Agreement and Subadvisory Agreement (Unaudited) (continued)
Based on this information, the Board concluded that economies of scale are appropriately shared for the benefit of the Portfolio’s shareholders through the Portfolio’s management fee and expense structure and other methods to share benefits from economies of scale.
Conclusion
On the basis of the information and factors summarized above, among other information and factors deemed relevant by the Trustees, and the evaluation thereof, the Board, including the Independent Trustees voting separately, unanimously voted to approve the continuation of each of the Advisory Agreements.
| 28 | MainStay VP Winslow Large Cap Growth Portfolio |
Proxy Voting Policies and Procedures and Proxy Voting Record
The Portfolio is required to file with the SEC its proxy voting record for the 12-month period ending June 30 on Form N-PX. A description of the policies and procedures that are used to vote proxies relating to portfolio securities of the Portfolio is available free of charge upon request by calling 800-598-2019 or visiting the SEC's website at www.sec.gov. The most recent Form N-PX or proxy voting record is available free of charge upon request by calling 800-598-2019; visiting https://www.newyorklifeinvestments.com/investment-products/vp; or visiting the SEC’s website at www.sec.gov.
Shareholder Reports and Quarterly Portfolio Disclosure
The Portfolio is required to file its complete schedule of portfolio holdings with the SEC 60 days after its first and third fiscal quarter on Form N-PORT. The Portfolio's holdings report is available free of charge upon request by calling 800-598-2019 or by visiting the SEC’s website at www.sec.gov.
Board of Trustees and Officers (Unaudited)
The Trustees and officers of the Portfolio are listed below. The Board oversees the MainStay Group of Funds (which consists of MainStay Funds and MainStay Funds Trust), MainStay VP Funds Trust, MainStay MacKay DefinedTerm Municipal Opportunities Fund, MainStay CBRE Global Infrastructure Megatrends Term Fund, the Manager and the Subadvisors, and elects the officers of the Portfolios who are responsible for the day-to-day operations of the Portfolio. Information pertaining to the Trustees and officers is set forth below. Each Trustee serves until his or her successor is elected and qualified or until his or her resignation,
death or removal. Under the Board’s retirement policy, unless an exception is made, a Trustee must tender his or her resignation by the end of the calendar year during which he or she reaches the age of 75. Officers are elected annually by the Board. The business address of each Trustee and officer listed below is 51 Madison Avenue, New York, New York 10010. A majority of the Trustees are not “interested persons” (as defined by the 1940 Act and rules adopted by the SEC thereunder) of the Portfolio (“Independent Trustees”).
| | Name and
Year of Birth | Term of Office,
Position(s) Held and
Length of Service | Principal Occupation(s)
During Past Five Years | Number of
Portfolios in
Fund Complex
Overseen by
Trustee | Other Directorships
Held by Trustee |
| | | | | | |
| | Naïm Abou-Jaoudé*
1966 | MainStay VP Funds Trust: Trustee since 2023 | Chief Executive Officer of New York Life Investment Management LLC (since 2023). Chief Executive Officer of Candriam (an affiliate of New York Life Investment Management LLC) (2007 to 2023). | 81 | MainStay Funds: Trustee since 2023 (11 Funds)
MainStay Funds Trust: Trustee since 2023 (37 Funds);
MainStay MacKay DefinedTerm Municipal Opportunities Fund: Trustee since 2023;
MainStay CBRE Global Infrastructure Megatrends Term Fund: Trustee since 2023; and
New York Life Investment Management International (Chair) since 2015 |
| * | This Trustee is considered to be an “interested person” of the MainStay Group of Funds, MainStay VP Funds Trust, MainStay CBRE Global Infrastructure Megatrends Term Fund and MainStay MacKay DefinedTerm Municipal Opportunities Fund, within the meaning of the 1940 Act because of his affiliation with New York Life Investment Management LLC and Candriam, as described in detail above in the column entitled “Principal Occupation(s) During Past Five Years.” |
| | |
| 30 | MainStay VP Winslow Large Cap Growth Portfolio |
| | Name and
Year of Birth | Term of Office,
Position(s) Held and
Length of Service | Principal Occupation(s)
During Past Five Years | Number of
Portfolios in
Fund Complex
Overseen by
Trustee | Other Directorships
Held by Trustee |
| | | | | | |
| | David H. Chow
1957 | MainStay VP Funds Trust: Trustee since January 2016, Advisory Board Member (June 2015 to December 2015) | Founder and CEO, DanCourt Management, LLC since 1999 | 81 | MainStay Funds: Trustee since January 2016, Advisory Board Member (June 2015 to December 2015) (11 Funds);
MainStay Funds Trust: Trustee since January 2016, Advisory Board Member (June 2015 to December 2015) (37 Funds);
MainStay MacKay DefinedTerm Municipal Opportunities Fund: Trustee since January 2016, Advisory Board Member (June 2015 to December 2015);
MainStay CBRE Global Infrastructure Megatrends Term Fund: Trustee since 2021;
VanEck Vectors Group of Exchange-Traded Funds: Trustee since 2006 and Independent Chairman of the Board of Trustees from 2008 to 2022 (57 portfolios); and
Berea College of Kentucky: Trustee since 2009, Chair of the Investment Committee since 2018 |
| | Karen Hammond
1956 | MainStay VP Funds Trust: Trustee since December 2021, Advisory Board Member (June 2021 to December 2021)
| Retired, Managing Director, Devonshire Investors (2007 to 2013); Senior Vice President, Fidelity Management & Research Co. (2005 to 2007); Senior Vice President and Corporate Treasurer, FMR Corp. (2003 to 2005); Chief Operating Officer, Fidelity Investments Japan (2001 to 2003) | 81 | MainStay Funds: Trustee since December 2021, Advisory Board Member (June 2021 to December 2021) (11 Funds);
MainStay Funds Trust: Trustee since December 2021, Advisory Board Member (June 2021 to December 2021) (37 Funds);
MainStay MacKay DefinedTerm Municipal Opportunities Fund: Trustee since December 2021, Advisory Board Member (June 2021 to December 2021);
MainStay CBRE Global Infrastructure Megatrends Term Fund: Trustee since December 2021, Advisory Board Member (June 2021 to December 2021);
Two Harbors Investment Corp.: Director since 2018;
Rhode Island State Investment Commission: Member since 2017; and
Blue Cross Blue Shield of Rhode Island: Director since 2019 |
| | Susan B. Kerley
1951 | MainStay VP Funds Trust: Chair since 2017 and Trustee since 2007** | President, Strategic Management Advisors LLC since 1990 | 81 | MainStay Funds: Chair since January 2017 and Trustee since 2007 (11 Funds); MainStay Funds Trust: Chair since January 2017 and Trustee since 1990 (37 Funds)***;
MainStay MacKay DefinedTerm Municipal Opportunities Fund: Chair since January 2017 and Trustee since 2011;
MainStay CBRE Global Infrastructure Megatrends Term Fund: Trustee since June 2021; and
Legg Mason Partners Funds: Trustee since 1991 (45 portfolios) |
Board of Trustees and Officers (Unaudited) (continued)
| | Name and
Year of Birth | Term of Office,
Position(s) Held and
Length of Service | Principal Occupation(s)
During Past Five Years | Number of
Portfolios in
Fund Complex
Overseen by
Trustee | Other Directorships
Held by Trustee |
| | | | | | |
| | Alan R. Latshaw
1951 | MainStay VP Funds Trust: Trustee since 2007** | Retired; Partner, Ernst & Young LLP (2002 to 2003); Partner, Arthur Andersen LLP (1989 to 2002); Consultant to the MainStay Funds Audit and Compliance Committee (2004 to 2006) | 81 | MainStay Funds: Trustee since 2006 (11 Funds);
MainStay Funds Trust: Trustee since 2007 (37 Funds)***;
MainStay MacKay DefinedTerm Municipal Opportunities Fund: Trustee since 2011; and
MainStay CBRE Global Infrastructure Megatrends Term Fund: Trustee since June 2021 |
| | Jacques P. Perold
1958 | MainStay VP Funds Trust: Trustee since January 2016, Advisory Board Member (June 2015 to December 2015) | Founder and Chief Executive Officer, CapShift Advisors LLC (since 2018); President, Fidelity Management & Research Company (2009 to 2014); President and Chief Investment Officer, Geode Capital Management, LLC (2001 to 2009) | 81 | MainStay Funds: Trustee since January 2016, Advisory Board Member (June 2015 to December 2015) (11 Funds);
MainStay Funds Trust: Trustee since January 2016, Advisory Board Member (June 2015 to December 2015) (37 Funds);
MainStay MacKay DefinedTerm Municipal Opportunities Fund: Trustee since January 2016, Advisory Board Member (June 2015 to December 2015);
MainStay CBRE Global Infrastructure Megatrends Term Fund: Trustee since June 2021;
Allstate Corporation: Director since 2015;
Partners in Health: Trustee since 2019; and
MSCI Inc.: Director since 2017 |
| | Richard S. Trutanic
1952 | MainStay VP Funds Trust: Trustee since 2007** | Chairman and Chief Executive Officer, Somerset & Company (financial advisory firm) since 2004; Managing Director, The Carlyle Group (private investment firm) (2002 to 2004); Senior Managing Director, Partner and Board Member, Groupe Arnault S.A. (private investment firm) (1999 to 2002) | 81 | MainStay Funds: Trustee since 1994 (11 Funds);
MainStay Funds Trust: Trustee since 2007 (37 Funds)***;
MainStay MacKay DefinedTerm Municipal Opportunities Fund: Trustee since 2011; and
MainStay CBRE Global Infrastructure Megatrends Term Fund: Trustee since June 2021 |
| ** | Includes prior service as a Director of MainStay VP Series Fund, Inc., the predecessor to MainStay VP Funds Trust. |
| *** | Includes prior service as a Director/Trustee of certain predecessor entities to MainStay Funds Trust. |
| 32 | MainStay VP Winslow Large Cap Growth Portfolio |
| | Name and
Year of Birth | Position(s) Held and
Length of Service | Principal Occupation(s)
During Past Five Years | |
| | | | | |
| | Kirk C. Lehneis
1974 | President, MainStay VP Funds Trust (since 2017) | Chief Operating Officer and Senior Managing Director (since 2016), New York Life Investment Management LLC and New York Life Investment Management Holdings LLC; Member of the Board of Managers (since 2017) and Senior Managing Director (since 2018), NYLIFE Distributors LLC; Chairman of the Board and Senior Managing Director, NYLIM Service Company LLC (since 2017); Trustee, President and Principal Executive Officer of IndexIQ Trust, IndexIQ ETF Trust and IndexIQ Active ETF Trust (since 2018); President, MainStay CBRE Global Infrastructure Megatrends Term Fund (since 2021), MainStay MacKay DefinedTerm Municipal Opportunities Fund, MainStay Funds and MainStay Funds Trust (since 2017); Senior Managing Director, Global Product Development (from 2015 to 2016); Managing Director, Product Development (from 2010 to 2015), New York Life Investment Management LLC | |
| | Jack R. Benintende
1964 | Treasurer and Principal Financial and Accounting Officer, MainStay VP Funds Trust (since 2007)** | Managing Director, New York Life Investment Management LLC (since 2007); Treasurer and Principal Financial and Accounting Officer, MainStay CBRE Global Infrastructure Megatrends Term Fund (since 2021), MainStay MacKay DefinedTerm Municipal Opportunities Fund (since 2011), MainStay Funds Trust (since 2009) and MainStay Funds (since 2007); and Assistant Treasurer, New York Life Investment Management Holdings LLC (2008 to 2012) | |
| | J. Kevin Gao
1967 | Secretary and Chief Legal Officer, MainStay VP Funds Trust (since 2010)** | Managing Director and Associate General Counsel, New York Life Investment Management LLC (since 2010); Secretary and Chief Legal Officer, MainStay CBRE Global Infrastructure Megatrends Term Fund (since 2021), MainStay MacKay DefinedTerm Municipal Opportunities Fund (since 2011), MainStay Funds and MainStay Funds Trust (since 2010) | |
| | Kevin M. Gleason
1967 | Vice President and Chief Compliance Officer, MainStay VP Funds Trust (since June 2022) | Vice President and Chief Compliance Officer, IndexIQ Trust, IndexIQ ETF Trust and IndexIQ Active ETF Trust (since June 2022); Vice President and Chief Compliance Officer, MainStay CBRE Global Infrastructure Megatrends Term Fund, MainStay MacKay DefinedTerm Municipal Opportunities Fund (since June 2022); MainStay Funds Trust and MainStay Funds (since June 2022); Senior Vice President, Voya Investment Management and Chief Compliance Officer, Voya Family of Funds (2012 to 2022) | |
| | Scott T. Harrington
1959 | Vice President— Administration, MainStay VP Funds Trust (since 2005)** | Managing Director, New York Life Investment Management LLC (including predecessor advisory organizations) (since 2000); Member of the Board of Directors, New York Life Trust Company (since 2009); Vice President—Administration, MainStay CBRE Global Infrastructure Megatrends Term Fund (since 2021), MainStay MacKay DefinedTerm Municipal Opportunities Fund (since 2011), MainStay Funds Trust and MainStay Funds (since 2009) | |
| * | The officers listed above are considered to be “interested persons” of the MainStay Group of Funds, MainStay VP Funds Trust, MainStay CBRE Global Infrastructure Megatrends Term Fund and MainStay MacKay DefinedTerm Municipal Opportunities Fund within the meaning of the 1940 Act because of their affiliation with the MainStay Group of Funds, New York Life Insurance Company and/or its affiliates, including New York Life Investment Management LLC, New York Life Insurance Company, NYLIM Service Company LLC, NYLIFE Securities LLC and/or NYLIFE Distributors LLC, as described in detail in the column captioned “Principal Occupation(s) During Past Five Years.” Officers are elected annually by the Board. |
| ** | Includes prior service as an Officer of MainStay VP Series Fund, Inc., the predecessor to MainStay VP Funds Trust. |
Officers of the Trust (Who are not Trustees)*
This page intentionally left blank
MainStay VP Portfolios
MainStay VP offers a wide range of Portfolios. The full array of MainStay VP offerings is listed here, with information about the manager, subadvisors, legal counsel, and independent registered public accounting firm.
Equity
MainStay VP American Century Sustainable Equity Portfolio
MainStay VP Candriam Emerging Markets Equity Portfolio
MainStay VP Epoch U.S. Equity Yield Portfolio
MainStay VP Fidelity Institutional AM® Utilities Portfolio†
MainStay VP Natural Resources Portfolio
MainStay VP PineStone International Equity Portfolio1
MainStay VP S&P 500 Index Portfolio
MainStay VP Small Cap Growth Portfolio
MainStay VP Wellington Growth Portfolio
MainStay VP Wellington Mid Cap Portfolio
MainStay VP Wellington Small Cap Portfolio
MainStay VP Wellington U.S. Equity Portfolio
MainStay VP Winslow Large Cap Growth Portfolio
Mixed Asset
MainStay VP Balanced Portfolio
MainStay VP Income Builder Portfolio
MainStay VP Janus Henderson Balanced Portfolio
MainStay VP MacKay Convertible Portfolio
Income
MainStay VP Bond Portfolio
MainStay VP Floating Rate Portfolio
MainStay VP Indexed Bond Portfolio
MainStay VP MacKay Government Portfolio2
MainStay VP MacKay High Yield Corporate Bond Portfolio
MainStay VP MacKay Strategic Bond Portfolio
MainStay VP PIMCO Real Return Portfolio
Money Market
MainStay VP U.S. Government Money Market Portfolio
Alternative
MainStay VP CBRE Global Infrastructure Portfolio
MainStay VP IQ Hedge Multi-Strategy Portfolio
Asset Allocation
MainStay VP Conservative Allocation Portfolio
MainStay VP Equity Allocation Portfolio
MainStay VP Growth Allocation Portfolio
MainStay VP Moderate Allocation Portfolio
Manager
New York Life Investment Management LLC
New York, New York
Subadvisors
American Century Investment Management, Inc.
Kansas City, Missouri
Brown Advisory LLC
Baltimore, Maryland
Candriam*
Strassen, Luxembourg
CBRE Investment Management Listed Real Assets LLC
Radnor, Pennsylvania
Epoch Investment Partners, Inc.
New York, New York
FIAM LLC
Smithfield, Rhode Island
IndexIQ Advisors LLC*
New York, New York
Janus Henderson Investors US LLC
Denver, Colorado
MacKay Shields LLC*
New York, New York
Newton Investment Management North America, LLC
Boston, Massachusetts
NYL Investors LLC*
New York, New York
Pacific Investment Management Company LLC
Newport Beach, California
PineStone Asset Management Inc.
Montreal, Québec
Segall Bryant & Hamill, LLC
Chicago, Illinois
Wellington Management Company LLP
Boston, Massachusetts
Winslow Capital Management, LLC
Minneapolis, Minnesota
Legal Counsel
Dechert LLP
Washington, District of Columbia
Independent Registered Public Accounting Firm
PricewaterhouseCoopers LLP
New York, New York
Distributor
NYLIFE Distributors LLC*
Jersey City, New Jersey
Custodian
JPMorgan Chase Bank, N.A.
New York, New York
Some Portfolios may not be available in all products.
† Fidelity Institutional AM is a registered trade mark of FMR LLC. Used with permission.
* An affiliate of New York Life Investment Management LLC.
| 1. | Prior to August 28, 2023, the Portfolio's name was MainStay VP MacKay International Equity Portfolio. |
| 2. | Effective on or about May 1, 2024, the MainStay VP MacKay Government Portfolio will be renamed the MainStay VP U.S. Infrastructure Bond Portfolio. |
Not part of the Annual Report
2023 Annual Report
This report is for the general information of New York Life Variable Annuities and NYLIAC Variable Universal Life Insurance Products policyowners. It must be preceded or accompanied by the appropriate product(s) and funds prospectuses if it is given to anyone who is not an owner of a New York Life variable annuity policy or a NYLIAC Variable Universal Life Insurance Product. This report does not offer for sale or solicit orders to purchase securities.
The performance data quoted in this report represents past performance. Past performance is no guarantee of future results. Due to market volatility and other factors, current performance may be lower or higher than the figures shown. The most recent month-end performance summary for your variable annuity or variable life policy is available by calling 800-598-2019 and is updated periodically on newyorklife.com.
The New York Life Variable Annuities and NYLIAC Variable Universal Life Insurance Products are issued by New York Life Insurance and Annuity Corporation (a Delaware Corporation) and distributed by NYLIFE Distributors LLC (Member FINRA/SIPC).
New York Life Insurance Company
New York Life Insurance and Annuity
Corporation (NYLIAC) (A Delaware Corporation)
51 Madison Avenue, Room 551
New York, NY 10010
newyorklife.com
newyorklifeinvestments.com
NYLIFE Distributors LLC, 30 Hudson Street, Jersey City, NJ 07302
New York Life Investment Management LLC is the investment manager to the MainStay VP Funds Trust
©2024 by NYLIFE Distributors LLC. All rights reserved.
You may obtain copies of the Prospectus and the Statement of Additional Information free of charge, upon request, by calling toll-free 800-598-2019 or writing to New York Life Insurance and Annuity Corporation, 51 Madison Avenue, New York, NY 10010.
| Not FDIC Insured | No Bank Guarantee | May Lose Value |
(NYLIAC) NI525
MainStay VP Wellington Mid Cap Portfolio
Message from the President and Annual Report
December 31, 2023
Special Notice:
Beginning in July 2024, new regulations issued by the Securities and Exchange Commission (SEC) will take effect requiring open-end mutual fund companies and ETFs to (1) overhaul the content of their shareholder reports and (2) mail paper copies of the new tailored shareholder reports to shareholders who have not opted to receive these documents electronically.
If you have not yet elected to receive your shareholder reports electronically, please contact your financial intermediary or visit our website.
| Not FDIC/NCUA Insured | Not a Deposit | May Lose Value | No Bank Guarantee | Not Insured by Any Government Agency |
This page intentionally left blank
Message from the President
Against a backdrop of easing inflationary pressures and continued economic growth, stocks and bonds generally gained ground during the 12-month period ended December 31, 2023, despite high levels of volatility and sharp disparities between the performance of the different market sectors.
Although the war in Ukraine, the outbreak of hostilities in the Middle East and several other notable events affected financial assets, inflation, interest rate, and economic growth trends stood at the forefront of market developments during most of the period. As the reporting period began, high levels of inflation already showed signs of easing in the face of aggressive rate hikes by U.S. Federal Reserve (the “Fed”). From a peak of 9.1% in June 2022, the annualized U.S. inflation rate dropped to 6.4% in January, and 3.4% in December 2023. At the same time, the Fed increased the benchmark federal funds rate from 4.25%–4.50% at the beginning of reporting period, to 5.25%–5.50% as of the end of 2023. Despite the increasing cost of capital and tighter lending environment that resulted from rising rates, economic growth remained surprisingly robust, bolstered by high levels of consumer spending, low levels of unemployment and better-than-expected corporate earnings. With the pace of rate increases slowing from the prior year, investors began hoping for an early shift to a looser monetary policy, with stock prices and bond yields reacting as economic data and statements from the Fed either reinforced or undercut those hopes. Following months of hawkish rhetoric, the Fed finally reversed its stance in December 2023, signaling a positive economic outlook with little chance of a recession and a likelihood of rate cuts in 2024.
The S&P 500® Index, a widely regarded benchmark of U.S. market performance, produced strong gains during the reporting period-– recovering all its losses from 2022 and approached new record territory. A preponderance of the Index’s gains were generated by a relatively small number of mega-cap stocks in the information technology, communication services and consumer discretionary sectors that stood to benefit from rapid developments in generative artificial intelligence (“AI”). Value-oriented, interest-rate sensitive and small-capitalization
shares lagged by significant margins, although market strength widened during the closing weeks of the reporting period. Most overseas equity markets trailed the U.S. market, as developed international economies experienced relatively low growth rates, and weak economic conditions in China undermined emerging markets.
Bonds produced generally positive returns, bolstered by attractive and relatively stable yields. The yield on the 10-year Treasury note hit a high of just under 5% in mid-October 2023, ranging between approximately 3.5% and 4.8% for most of the reporting period. The yield curve remained inverted throughout the year, with the 2-year Treasury yield modestly above the 10-year yield. Corporate bond prices trended moderately higher, generally outperforming government securities. After years of low yields and tight credit spreads, the corporate sector benefited from more attractive valuations and income opportunities. Among corporates, markets generally rewarded longer duration and lower credit quality, although an uptick in default rates posed added risks for high-yield corporate bonds. International bond markets produced mixed returns, with emerging-markets issues advancing over their developed-markets counterparts.
The market volatility of recent years reminds us of the constant need for experienced and steadfast portfolio management in the face of uncertainty. New York Life Investments remains dedicated to providing you, as a valued MainStay VP investor, with the guidance, resources and investment solutions you need to pursue your financial goals.
Thank you for trusting us to help meet your investment needs.
Sincerely,
Kirk C. Lehneis
President
The opinions expressed are as of the date of this report and are subject to change. There is no guarantee that any forecast made will come to pass. This material does not constitute investment advice and is not intended as an endorsement of any specific investment. Past performance is no guarantee of future results.
Not part of the Annual Report
Investors should refer to the Portfolio’s Summary Prospectus and/or Prospectus and consider the Portfolio’s investment objectives, strategies, risks, charges and expenses carefully before investing. The Summary Prospectus and/or Prospectus contain this and other information about the Portfolio. You may obtain copies of the Portfolio’s Summary Prospectus, Prospectus and Statement of Additional Information, which includes information about the MainStay VP Funds Trust's Trustees, free of charge, upon request, by calling toll-free 800-598-2019, by writing to New York Life Insurance and Annuity Corporation, 51 Madison Avenue, Room 251, New York, New York 10010 or by sending an email to MainStayShareholdersServices@nylim.com. These documents are also available at newyorklifeinvestments.com/investment-products/vp. Please read the Portfolio's Summary Prospectus and/or Prospectus carefully before investing. MainStay VP Funds Trust portfolios are separate account options which are purchased through a variable insurance or variable annuity contract.
Investment and Performance Comparison (Unaudited)
Performance data quoted represents past performance. Past performance is no guarantee of future results. Because of market volatility and other factors, current performance may be lower or higher than the figures shown. Investment return and principal value will fluctuate, and as a result, when shares are redeemed, they may be worth more or less than their original cost. The performance table and graph do not reflect any deduction of sales charges, mortality and expense charges, contract charges or administrative charges. Please refer to the Performance Summary appropriate for your policy. For performance information current to the most recent month-end, please call 800-598-2019 or visit www.newyorklife.com.
Performance figures may reflect certain fee waivers and/or expense limitations, without which total returns may have been different. For information on current fee waivers and/or expense limitations (if any), please refer to the Notes to Financial Statements.
| Average Annual Total Returns for the Year-Ended December 31, 2023 |
| Class | Inception
Date1, 2 | One
Year | Five
Years | Ten
Years | Gross
Expense
Ratio3 |
| Initial Class Shares | 7/2/2001 | 13.69% | 8.20% | 6.66% | 0.89% |
| Service Class Shares | 6/5/2003 | 13.41 | 7.93 | 6.39 | 1.14 |
| 1. | Effective January 1, 2018, due to an organizational restructuring whereby all investment personnel of Cornerstone Capital Management Holdings LLC, a former subadvisor, transitioned to MacKay Shields LLC. |
| 2. | Effective May 1, 2021, the Portfolio replaced its subadvisor, MacKay Shields LLC, and modified its principal investment strategies. The past performance in the graph and table prior to that date reflects the Portfolio’s prior subadvisors and principal investment strategies. |
| 3. | The gross expense ratios presented reflect the Portfolio’s “Total Annual Portfolio Operating Expenses” from the most recent Prospectus and may differ from other expense ratios disclosed in this report. |
| Benchmark Performance* | One
Year | Five
Years | Ten
Years |
| Russell Midcap® Index1 | 17.23% | 12.68% | 9.42% |
| S&P MidCap 400® Index2 | 16.44 | 12.62 | 9.27 |
| Morningstar Mid-Cap Blend Category Average3 | 16.00 | 11.96 | 8.28 |
| * | Returns for indices reflect no deductions for fees, expenses or taxes, except for foreign withholding taxes where applicable. Results assume reinvestment of all dividends and capital gains. An investment cannot be made directly in an index. |
| 1. | The Russell Midcap® Index is the Portfolio's primary benchmark. The Russell Midcap® Index measures the performance of the mid-cap segment of the U.S. equity universe. The Russell Midcap® Index is a subset of the Russell 1000® Index and includes approximately 800 of the smallest companies based on a combination of their market cap and current index membership. The Russell Midcap® Index represents approximately 31% of the total market capitalization of the Russell 1000® Index companies. |
| 2. | The Portfolio has selected the S&P MidCap 400® Index as its secondary benchmark. The S&P MidCap 400® Index is a market capitalization-weighted index of common stocks representing the mid-cap U.S. equity market. |
| 3. | The Morningstar Mid-Cap Blend Category Average is representative of funds that invest primarily in U.S. stocks of various sizes and styles, giving it a middle-of-the-road profile. The U.S. mid-cap range for market capitalization typically falls between $1 billion and $8 billion and represents 20% of the total capitalization of the U.S. equity market. The blend style is assigned to funds where neither growth nor value characteristics predominate. Results are based on average total returns of similar funds with all dividends and capital gain distributions reinvested. |
Cost in Dollars of a $1,000 Investment in MainStay VP Wellington Mid Cap Portfolio (Unaudited)
The example below is intended to describe the fees and expenses borne by shareholders during the six-month period from July 1, 2023 to December 31, 2023, and the impact of those costs on your investment.
Example
As a shareholder of the Portfolio you incur two types of costs: (1) transaction costs, including exchange fees and sales charges (loads) on purchases (as applicable), and (2) ongoing costs, including management fees, distribution and/or service (12b-1) fees and other Portfolio expenses (as applicable). This example is intended to help you understand your ongoing costs (in dollars) of investing in the Portfolio and to compare these costs with the ongoing costs of investing in other mutual funds. The example is based on an investment of $1,000 made at the beginning of the six-month period and held for the entire period from July 1, 2023 to December 31, 2023. Shares are only sold in connection with variable life and annuity contracts and the example does not reflect any contract level or transactional fees or expenses. If these costs had been included, your costs would have been higher.
This example illustrates your Portfolio’s ongoing costs in two ways:
Actual Expenses
The second and third data columns in the table below provide information about actual account values and actual expenses. You may use the information in these columns, together with the amount you invested, to estimate the expenses that you paid during the six months ended
December 31, 2023. Simply divide your account value by $1,000 (for example, an $8,600 account value divided by $1,000 = 8.6), then multiply the result by the number under the heading entitled “Expenses Paid During Period” to estimate the expenses you paid on your account during this period.
Hypothetical Example for Comparison Purposes
The fourth and fifth data columns in the table below provide information about hypothetical account values and hypothetical expenses based on the Portfolio’s actual expense ratio and an assumed rate of return of 5% per year before expenses, which is not the Portfolio’s actual return. The hypothetical account values and expenses may not be used to estimate the actual ending account balances or expenses you paid for the six-month period shown. You may use this information to compare the ongoing costs of investing in the Portfolio with the ongoing costs of investing in other mutual funds. To do so, compare this 5% hypothetical example with the 5% hypothetical examples that appear in the shareholder reports of the other mutual funds.
Please note that the expenses shown in the table are meant to highlight your ongoing costs only and do not reflect any transactional costs, such as exchange fees or sales charges (loads). Therefore, the fourth and fifth data columns of the table are useful in comparing ongoing costs only and will not help you determine the relative total costs of owning different funds. In addition, if these transactional costs were included, your costs would have been higher.
| Share Class | Beginning
Account
Value
7/1/23 | Ending Account
Value (Based
on Actual
Returns and
Expenses)
12/31/23 | Expenses
Paid
During
Period1 | Ending Account
Value (Based
on Hypothetical
5% Annualized
Return and
Actual Expenses)
12/31/23 | Expenses
Paid
During
Period1 | Net Expense
Ratio
During
Period2 |
| Initial Class Shares | $1,000.00 | $1,060.40 | $4.47 | $1,020.87 | $4.38 | 0.86% |
| Service Class Shares | $1,000.00 | $1,059.10 | $5.76 | $1,019.61 | $5.65 | 1.11% |
| 1. | Expenses are equal to the Portfolio’s annualized expense ratio of each class multiplied by the average account value over the period, divided by 365 and multiplied by 184 (to reflect the six-month period). The table above represents the actual expenses incurred during the six-month period. In addition to the fees and expenses which the Portfolio bears directly, it also indirectly bears a pro rata share of the fees and expenses of the underlying funds in which it invests. Such indirect expenses are not included in the above-reported expense figures. |
| 2. | Expenses are equal to the Portfolio's annualized expense ratio to reflect the six-month period. |
| 6 | MainStay VP Wellington Mid Cap Portfolio |
Industry Composition as of December 31, 2023 (Unaudited)
| Banks | 7.2% |
| Machinery | 6.7 |
| Chemicals | 5.9 |
| Insurance | 5.6 |
| Oil, Gas & Consumable Fuels | 5.2 |
| Software | 4.3 |
| Professional Services | 4.1 |
| Biotechnology | 3.9 |
| Financial Services | 3.8 |
| Ground Transportation | 3.7 |
| Semiconductors & Semiconductor Equipment | 3.7 |
| Health Care Equipment & Supplies | 3.6 |
| Building Products | 3.6 |
| Hotels, Restaurants & Leisure | 2.9 |
| Automobile Components | 2.8 |
| Specialty Retail | 2.5 |
| Containers & Packaging | 2.3 |
| Textiles, Apparel & Luxury Goods | 2.2 |
| Health Care Providers & Services | 2.1 |
| Electronic Equipment, Instruments & Components | 2.1 |
| Communications Equipment | 2.0 |
| Specialized REITs | 1.9 |
| Trading Companies & Distributors | 1.6 |
| Household Durables | 1.6 |
| Consumer Staples Distribution & Retail | 1.4% |
| Consumer Finance | 1.2 |
| IT Services | 1.1 |
| Aerospace & Defense | 1.1 |
| Air Freight & Logistics | 1.1 |
| Retail REITs | 1.0 |
| Pharmaceuticals | 1.0 |
| Life Sciences Tools & Services | 0.9 |
| Gas Utilities | 0.8 |
| Electric Utilities | 0.8 |
| Electrical Equipment | 0.6 |
| Capital Markets | 0.6 |
| Multi–Utilities | 0.6 |
| Food Products | 0.6 |
| Interactive Media & Services | 0.5 |
| Media | 0.4 |
| Metals & Mining | 0.3 |
| Industrial REITs | 0.3 |
| Entertainment | 0.3 |
| Short–Term Investments | 1.5 |
| Other Assets, Less Liabilities | –1.4 |
| | 100.0% |
See Portfolio of Investments beginning on page 10 for specific holdings within these categories. The Portfolio's holdings are subject to change.
Top Ten Holdings and/or Issuers Held as of December 31, 2023 (excluding short-term investments) (Unaudited)
| 1. | Celanese Corp. |
| 2. | Knight-Swift Transportation Holdings, Inc. |
| 3. | MKS Instruments, Inc. |
| 4. | M&T Bank Corp. |
| 5. | Marathon Oil Corp. |
| 6. | NVR, Inc. |
| 7. | Flex Ltd. |
| 8. | Builders FirstSource, Inc. |
| 9. | WEX, Inc. |
| 10. | Lennox International, Inc. |
Portfolio Management Discussion and Analysis (Unaudited)
Answers to the questions reflect the views of portfolio managers Gregory J. Garabedian, Mark A. Whitaker, CFA, and Philip W. Ruedi, CFA, of Wellington Management Company LLP (“Wellington”), the Portfolio’s Subadvisor.
How did MainStay VP Wellington Mid Cap Portfolio perform relative to its benchmarks and peers during the 12 months ended December 31, 2023?
For the 12 months ended December 31, 2023, MainStay VP Wellington Mid Cap Portfolio returned 13.69% for Initial Class shares and 13.41% for Service Class shares. Over the same period, both share classes underperformed the 17.23% return of the Russell Midcap® Index, which is the Portfolio’s primary benchmark, and the 16.44% return of the S&P MidCap 400® Index, which is the Portfolio’s secondary benchmark. For the 12 months ended December 31, 2023, both share classes also underperformed the 16.00% return of the Morningstar Mid-Cap Blend Category Average.1
What factors affected the Portfolio’s relative performance during the reporting period?
The Portfolio underperformed the Russell Midcap® Index, primarily due to stock selection. Specifically, overweight exposure to financials, consumer discretionary and health care detracted from relative performance, while overweight exposure to industrials made a positive contribution to relative returns. (Contributions take weightings and total returns into account.)
The Portfolio includes two, separately managed investment strategies: Mid Cap Opportunities, which uses the S&P MidCap 400® Index as its benchmark, and Select Mid Cap Value, which uses the Russell 2500™ Value Index as its benchmark. The Portfolio’s Mid Cap Opportunities strategy underperformed the S&P MidCap 400® Index, primarily due to security selection arising from the strategy’s growth bias. Sector allocation bolstered the strategy’s relative returns. The Portfolio’s Select Mid Cap Value strategy outperformed the Russell 2500™ Value Index, largely due to sector allocation, a result of the strategy’s bottom-up stock selection process. Security selection detracted from relative results.
Which sectors were the strongest positive contributors to the Portfolio’s relative performance, and which sectors were particularly weak?
For the overall Portfolio, security selection in the financials, consumer discretionary and health care sectors weighed on results relative to the Russell Midcap® Index, partly offset by relatively strong returns from the industrials and utilities sectors.
Within the Mid Cap Opportunities strategy, security selection in consumer discretionary, health care and financials detracted most from performance relative to the S&P MidCap 400® Index. These negative selection effects were partially offset by positive contributions from selection in information technology, communication services and real estate. Sector allocation made a positive contribution to relative results, driven by overweight
exposure to information technology and underweight exposure to real estate and utilities. Positive allocation effects were partly offset by the negative impacts of an overweight position in health care and an underweight position in consumer discretionary.
Within the Select Mid Cap Value strategy, the strongest contributions to performance relative to the Russell 2500™ Value Index came from lack of exposure to utilities, and overweight allocations to industrials and financials, partly offset by the negative impact of overweight exposure to consumer discretionary. From a security selection perspective, weak selection in financials, materials and consumer discretionary detracted the most from relative returns, although this was partially offset by relatively strong selection in industrials, consumer staples and health care.
During the reporting period, which individual stocks made the strongest positive contributions to the Portfolio’s absolute performance and which stocks detracted the most?
Within the Mid Cap Opportunities strategy, leading contributors to absolute performance included U.S.-based bank holding company First Citizens, biopharmaceutical developer Apellis Pharmaceuticals and HVAC systems provider Lennox International. First Citizens shares rose during the reporting period when the company reported deposits that surpassed estimates following its rescue deal for Silicon Valley Bank. Apellis shares gained ground after the company reported strong revenues for Syfovre, a recently approved drug to treat geographic atrophy secondary to age-related macular degeneration. Lennox shares advanced on better-than-expected housing fundamentals.
The most significant detractors from the absolute performance of the Mid Cap Opportunities strategy were First Republic Bank, medical device company Insulet and global professional services company Genpact. First Republic Bank shares fell sharply in the first quarter of 2023 on fears related to U.S. banking failures. Insulet shares declined on concerns that the uptake of new weight loss drugs could lead to lower incidence rates of diabetes and softer demand for the company’s insulin pumps. Genpact shares lost ground on concerns that advancements in artificial intelligence could negatively impact the competitive advantage of the business.
Within the Select Mid Cap Value strategy, leading contributors to absolute performance included Builders FirstSource, described above, chemistry solutions and specialty materials producer Celanese, and packaged software company National Instruments. Celanese shares rose despite a challenging industry backdrop, as the company was able to delever significantly and faced less pressure than peers in a rising rates environment, leading shares to rerate higher. National Instruments shares advanced following
| 1. | See "Investment and Performance Comparison" for more information on benchmark and peer group returns. |
| 8 | MainStay VP Wellington Mid Cap Portfolio |
an acquisition bid to take over the company at a premium to the pre-offer share price.
The most significant detractors from the absolute performance of the Select Mid Cap Value strategy were agricultural sciences company FMC, loyalty and marketing services provider Bread Financial Holdings, and regional bank Western Alliance Bancorp. FMC shares fell as the company faced pressure from lower crop prices, higher raw material costs and increased competition in its key markets. Bread Financial shares declined following disappointing quarterly results due to environmental headwinds that led to lower estimates on provisions and loan growth. Concerns within the banking sector over the Silicon Valley Bank collapse also weighed on the stock's price. Western Alliance shares came under pressure, along with those of other small lenders, after the failure of Silicon Valley Bank caused concerns that other banks would need to sell long-term assets at steep losses to meet liquidity needs.
Did the Portfolio make any significant purchases or sales during the reporting period?
During the reporting period, the Mid Cap Opportunities strategy initiated a position in medical device company Shockwave Medical. Shockwave uses sound technology to clean arteries and other blockages in the body. The Portfolio also added a position in Atmos Energy, the largest pureplay natural gas utility in the United States, with over three million customers across eight states.
During the same period, we eliminated the Mid Cap Opportunities strategy’s position in CarGurus, an online platform for new and used car listings. Weakness in the wholesale business led us to conclude the business would likely face difficulty growing. We also eliminated a position in YETI Holdings, a premium cooler and drinkware producer, on valuation concerns.
The Select Mid Cap Value strategy initiated positions in American motor carrier holding company Knight-Swift Transportation and commercial real estate agency Brixmor Property Group. We initiated the position in Knight-Swift after shares underperformed due to continued softness in freight demand and depressed spot pricing. We believe waning headwinds from inventory drawdowns in the near term could alleviate downward pressure on the company’s earnings. Longer term, management initiatives to grow beyond industry-level cyclicality—including expanding its intermodal division and the less-than-truckload division, and potential merger and acquisition opportunities at the bottom of the cycle—could drive earnings upside. In the case of Brixmor Property, a real estate investment trust that focuses on
grocery-anchored outdoor shopping malls, we saw an opportunity based on the company’s strong fundamentals and a lack of new supply over the past decade, despite pressures on the real estate sector due to rapidly rising interest rates. The company’s high tenant retention, strong pricing, and solid leasing demand have the potential to provide protection when the economy weakens.
The largest sales for the Select Mid Cap Value included positions in packaged software company National Instruments and waste management company Clean Harbors, after both stocks strongly outperformed during the reporting period.
How did the Portfolio’s sector weightings change during the reporting period?
For the Mid Cap Opportunities strategy, the most notable increases in absolute sector exposures were to information technology and utilities, while the most notable reductions were to health care and communication services. For the Select Mid Cap Value strategy, the most notable increases in absolute sector exposures were to financials and information technology, while the most notable reductions were to industrials and health care.
How was the Portfolio positioned at the end of the reporting period?
As of December 31, 2023, the Mid Cap Opportunities strategy held its most overweight exposures relative to the S&P MidCap 400® Index to the health care and information technology sectors, while its most underweight exposures were to real estate and consumer discretionary. As of the same date, the Select Mid Cap Value strategy held its most overweight exposures relative to the Russell 2500™ Value Index to information technology and materials, and its most underweight exposures to real estate and utilities.
The opinions expressed are those of the portfolio managers as of the date of this report and are subject to change. There is no guarantee that any forecasts will come to pass. This material does not constitute investment advice and is not intended as an endorsement of any specific investment.
Not all MainStay VP Portfolios and/or share classes are available under all policies.
Portfolio of Investments December 31, 2023†^
| | Shares | Value |
| Common Stocks 99.9% |
| Aerospace & Defense 1.1% |
| Axon Enterprise, Inc. (a) | 29,748 | $ 7,684,801 |
| Air Freight & Logistics 1.1% |
| Expeditors International of Washington, Inc. | 59,584 | 7,579,085 |
| Automobile Components 2.8% |
| BorgWarner, Inc. | 123,851 | 4,440,058 |
| Gentex Corp. | 192,022 | 6,271,439 |
| Goodyear Tire & Rubber Co. (The) (a) | 260,388 | 3,728,756 |
| Visteon Corp. (a) | 43,053 | 5,377,320 |
| | | 19,817,573 |
| Banks 7.2% |
| Cadence Bank | 198,090 | 5,861,483 |
| Cullen | 57,562 | 6,244,901 |
| First Citizens BancShares, Inc., Class A | 6,038 | 8,567,741 |
| M&T Bank Corp. | 87,891 | 12,048,098 |
| New York Community Bancorp, Inc. | 624,706 | 6,390,743 |
| Prosperity Bancshares, Inc. | 71,318 | 4,830,368 |
| SouthState Corp. | 84,919 | 7,171,410 |
| | | 51,114,744 |
| Biotechnology 3.9% |
| Apellis Pharmaceuticals, Inc. (a) | 79,234 | 4,742,947 |
| Exact Sciences Corp. (a) | 32,575 | 2,409,899 |
| Neurocrine Biosciences, Inc. (a) | 29,894 | 3,938,833 |
| PTC Therapeutics, Inc. (a) | 136,967 | 3,774,811 |
| Sarepta Therapeutics, Inc. (a) | 16,887 | 1,628,413 |
| Ultragenyx Pharmaceutical, Inc. (a) | 73,812 | 3,529,690 |
| United Therapeutics Corp. (a) | 33,499 | 7,366,095 |
| | | 27,390,688 |
| Building Products 3.6% |
| Builders FirstSource, Inc. (a) | 60,705 | 10,134,092 |
| Fortune Brands Innovations, Inc. | 80,020 | 6,092,723 |
| Lennox International, Inc. | 21,146 | 9,463,258 |
| | | 25,690,073 |
| Capital Markets 0.6% |
| Hamilton Lane, Inc., Class A | 32,265 | 3,660,142 |
| Morningstar, Inc. | 2,405 | 688,407 |
| | | 4,348,549 |
| Chemicals 5.9% |
| Celanese Corp. | 95,962 | 14,909,616 |
| Element Solutions, Inc. | 367,235 | 8,497,818 |
| FMC Corp. | 122,703 | 7,736,424 |
| | Shares | Value |
| |
| Chemicals (continued) |
| Huntsman Corp. | 207,182 | $ 5,206,484 |
| Ingevity Corp. (a) | 109,319 | 5,162,043 |
| | | 41,512,385 |
| Communications Equipment 2.0% |
| F5, Inc. (a) | 46,887 | 8,391,835 |
| Lumentum Holdings, Inc. (a) | 105,661 | 5,538,750 |
| | | 13,930,585 |
| Consumer Finance 1.2% |
| Credit Acceptance Corp. (a) | 16,094 | 8,573,757 |
| Consumer Staples Distribution & Retail 1.4% |
| BJ's Wholesale Club Holdings, Inc. (a) | 60,258 | 4,016,798 |
| U.S. Foods Holding Corp. (a) | 125,631 | 5,704,904 |
| | | 9,721,702 |
| Containers & Packaging 2.3% |
| Ball Corp. | 62,379 | 3,588,040 |
| Graphic Packaging Holding Co. | 240,469 | 5,927,561 |
| Silgan Holdings, Inc. | 143,142 | 6,477,175 |
| | | 15,992,776 |
| Electric Utilities 0.8% |
| Alliant Energy Corp. | 107,943 | 5,537,476 |
| Electrical Equipment 0.6% |
| Acuity Brands, Inc. | 21,381 | 4,379,470 |
| Electronic Equipment, Instruments & Components 2.1% |
| CDW Corp. | 17,321 | 3,937,410 |
| Flex Ltd. (a) | 348,433 | 10,613,269 |
| | | 14,550,679 |
| Entertainment 0.3% |
| Roku, Inc. (a) | 21,151 | 1,938,701 |
| Financial Services 3.8% |
| Nuvei Corp. (b) | 153,217 | 4,023,478 |
| Shift4 Payments, Inc., Class A (a) | 101,911 | 7,576,064 |
| Voya Financial, Inc. | 79,103 | 5,771,355 |
| WEX, Inc. (a) | 49,106 | 9,553,572 |
| | | 26,924,469 |
| Food Products 0.6% |
| Post Holdings, Inc. (a) | 45,926 | 4,044,243 |
The notes to the financial statements are an integral part of, and should be read in conjunction with, the financial statements.
| 10 | MainStay VP Wellington Mid Cap Portfolio |
| | Shares | Value |
| Common Stocks (continued) |
| Gas Utilities 0.8% |
| Atmos Energy Corp. | 49,355 | $ 5,720,244 |
| Ground Transportation 3.7% |
| JB Hunt Transport Services, Inc. | 28,371 | 5,666,823 |
| Knight-Swift Transportation Holdings, Inc. | 237,841 | 13,711,534 |
| U-Haul Holding Co. | 100,311 | 7,065,907 |
| | | 26,444,264 |
| Health Care Equipment & Supplies 3.6% |
| Dentsply Sirona, Inc. | 181,027 | 6,442,751 |
| Hologic, Inc. (a) | 48,560 | 3,469,612 |
| Inari Medical, Inc. (a) | 88,570 | 5,749,964 |
| Integra LifeSciences Holdings Corp. (a) | 133,671 | 5,821,372 |
| Shockwave Medical, Inc. (a) | 22,360 | 4,260,922 |
| | | 25,744,621 |
| Health Care Providers & Services 2.1% |
| Acadia Healthcare Co., Inc. (a) | 65,462 | 5,090,325 |
| agilon health, Inc. (a) | 250,762 | 3,147,063 |
| Molina Healthcare, Inc. (a) | 17,644 | 6,374,954 |
| | | 14,612,342 |
| Hotels, Restaurants & Leisure 2.9% |
| Choice Hotels International, Inc. (b) | 41,352 | 4,685,182 |
| Denny's Corp. (a) | 400,622 | 4,358,767 |
| DraftKings, Inc., Class A (a) | 20,433 | 720,263 |
| Hyatt Hotels Corp., Class A (b) | 41,112 | 5,361,416 |
| Wyndham Hotels & Resorts, Inc. | 68,148 | 5,479,781 |
| | | 20,605,409 |
| Household Durables 1.6% |
| NVR, Inc. (a) | 1,586 | 11,102,714 |
| Industrial REITs 0.3% |
| Rexford Industrial Realty, Inc. | 37,632 | 2,111,155 |
| Insurance 5.6% |
| Aegon Ltd. (Registered) | 1,091,227 | 6,285,468 |
| Globe Life, Inc. | 36,976 | 4,500,719 |
| Hanover Insurance Group, Inc. (The) | 45,208 | 5,489,155 |
| Kemper Corp. | 177,203 | 8,624,471 |
| Markel Group, Inc. (a) | 6,256 | 8,882,894 |
| W R Berkley Corp. | 40,612 | 2,872,081 |
| White Mountains Insurance Group Ltd. | 2,199 | 3,309,517 |
| | | 39,964,305 |
| | Shares | Value |
| |
| Interactive Media & Services 0.5% |
| Cargurus, Inc. (a) | 142,078 | $ 3,432,604 |
| IT Services 1.1% |
| MongoDB, Inc. (a) | 6,558 | 2,681,238 |
| VeriSign, Inc. (a) | 26,612 | 5,481,008 |
| | | 8,162,246 |
| Life Sciences Tools & Services 0.9% |
| Bio-Techne Corp. | 31,134 | 2,402,299 |
| ICON plc (a) | 13,365 | 3,783,231 |
| | | 6,185,530 |
| Machinery 6.7% |
| Fortive Corp. | 69,168 | 5,092,840 |
| Graco, Inc. | 82,725 | 7,177,221 |
| IDEX Corp. | 26,702 | 5,797,271 |
| Ingersoll Rand, Inc. | 63,668 | 4,924,083 |
| John Bean Technologies Corp. | 40,028 | 3,980,784 |
| Lincoln Electric Holdings, Inc. | 20,369 | 4,429,443 |
| Middleby Corp. (The) (a) | 47,387 | 6,973,945 |
| Westinghouse Air Brake Technologies Corp. | 70,428 | 8,937,313 |
| | | 47,312,900 |
| Media 0.4% |
| Cable One, Inc. | 5,515 | 3,069,594 |
| Metals & Mining 0.3% |
| Steel Dynamics, Inc. | 19,407 | 2,291,967 |
| Multi-Utilities 0.6% |
| NiSource, Inc. | 153,986 | 4,088,328 |
| Oil, Gas & Consumable Fuels 5.2% |
| Coterra Energy, Inc. | 157,415 | 4,017,231 |
| Diamondback Energy, Inc. | 30,438 | 4,720,325 |
| Marathon Oil Corp. | 479,397 | 11,582,231 |
| Ovintiv, Inc. | 164,127 | 7,208,458 |
| Targa Resources Corp. | 104,937 | 9,115,877 |
| | | 36,644,122 |
| Pharmaceuticals 1.0% |
| Jazz Pharmaceuticals plc (a) | 55,640 | 6,843,720 |
| Professional Services 4.1% |
| Ceridian HCM Holding, Inc. (a) | 79,460 | 5,333,355 |
| Genpact Ltd. | 247,173 | 8,579,375 |
The notes to the financial statements are an integral part of, and should be read in conjunction with, the financial statements.
11
Portfolio of Investments December 31, 2023†^ (continued)
| | Shares | Value |
| Common Stocks (continued) |
| Professional Services (continued) |
| Leidos Holdings, Inc. | 43,050 | $ 4,659,732 |
| Robert Half, Inc. | 55,728 | 4,899,606 |
| Science Applications International Corp. | 35,243 | 4,381,410 |
| TransUnion | 18,806 | 1,292,160 |
| | | 29,145,638 |
| Retail REITs 1.0% |
| Brixmor Property Group, Inc. | 313,032 | 7,284,255 |
| Semiconductors & Semiconductor Equipment 3.7% |
| First Solar, Inc. (a) | 14,471 | 2,493,064 |
| Lattice Semiconductor Corp. (a) | 20,764 | 1,432,508 |
| MKS Instruments, Inc. | 118,127 | 12,151,724 |
| Onto Innovation, Inc. (a) | 15,932 | 2,436,003 |
| Rambus, Inc. (a) | 43,880 | 2,994,810 |
| Silicon Motion Technology Corp., ADR | 80,128 | 4,909,443 |
| | | 26,417,552 |
| Software 4.3% |
| CyberArk Software Ltd. (a) | 16,545 | 3,624,182 |
| Dynatrace, Inc. (a) | 161,443 | 8,829,318 |
| Fair Isaac Corp. (a) | 6,872 | 7,999,077 |
| HubSpot, Inc. (a) | 5,139 | 2,983,395 |
| Informatica, Inc., Class A (a) | 85,470 | 2,426,493 |
| PTC, Inc. (a) | 17,708 | 3,098,192 |
| Unity Software, Inc. (a)(b) | 39,400 | 1,611,066 |
| | | 30,571,723 |
| Specialized REITs 1.9% |
| Extra Space Storage, Inc. | 16,641 | 2,668,052 |
| Gaming and Leisure Properties, Inc. | 107,355 | 5,297,969 |
| Lamar Advertising Co., Class A | 55,169 | 5,863,361 |
| | | 13,829,382 |
| Specialty Retail 2.5% |
| CarMax, Inc. (a) | 77,813 | 5,971,370 |
| Chewy, Inc., Class A (a)(b) | 95,380 | 2,253,829 |
| Floor & Decor Holdings, Inc., Class A (a) | 31,343 | 3,496,625 |
| Valvoline, Inc. (a) | 159,701 | 6,001,564 |
| | | 17,723,388 |
| Textiles, Apparel & Luxury Goods 2.2% |
| Deckers Outdoor Corp. (a) | 11,173 | 7,468,368 |
| Steven Madden Ltd. | 191,400 | 8,038,800 |
| | | 15,507,168 |
| | Shares | | Value |
| |
| Trading Companies & Distributors 1.6% |
| AerCap Holdings NV (a) | 70,155 | | $ 5,213,919 |
| Watsco, Inc. | 13,921 | | 5,964,731 |
| | | | 11,178,650 |
Total Common Stocks
(Cost $616,137,212) | | | 706,725,577 |
| Short-Term Investments 1.5% |
| Affiliated Investment Company 0.2% |
| MainStay U.S. Government Liquidity Fund, 5.235% (c) | 1,471,327 | | 1,471,327 |
| Unaffiliated Investment Companies 1.3% |
| BlackRock Liquidity FedFund, 5.374% (c)(d) | 2,000,000 | | 2,000,000 |
| Dreyfus Treasury Obligations Cash Management Fund, 5.40% (c)(d) | 1,000,000 | | 1,000,000 |
| Invesco Government & Agency Portfolio, 5.361% (c)(d) | 5,355,134 | | 5,355,134 |
| Morgan Stanley Institutional Liquidity Fund Government Portfolio, 5.363% (c)(d) | 1,000,000 | | 1,000,000 |
| | | | 9,355,134 |
Total Short-Term Investments
(Cost $10,826,461) | | | 10,826,461 |
Total Investments
(Cost $626,963,673) | 101.4% | | 717,552,038 |
| Other Assets, Less Liabilities | (1.4) | | (10,073,537) |
| Net Assets | 100.0% | | $ 707,478,501 |
| † | Percentages indicated are based on Portfolio net assets. |
| ^ | Industry classifications may be different than those used for compliance monitoring purposes. |
| (a) | Non-income producing security. |
| (b) | All or a portion of this security was held on loan. As of December 31, 2023, the aggregate market value of securities on loan was $14,012,339; the total market value of collateral held by the Portfolio was $14,465,363. The market value of the collateral held included non-cash collateral in the form of U.S. Treasury securities with a value of $5,110,229. The Portfolio received cash collateral with a value of $9,355,134. (See Note 2(H)) |
| (c) | Current yield as of December 31, 2023. |
| (d) | Represents a security purchased with cash collateral received for securities on loan. |
The notes to the financial statements are an integral part of, and should be read in conjunction with, the financial statements.
| 12 | MainStay VP Wellington Mid Cap Portfolio |
Investments in Affiliates (in 000's)
Investments in issuers considered to be affiliate(s) of the Portfolio during the year ended December 31, 2023 for purposes of Section 2(a)(3) of the Investment Company Act of 1940, as amended, were as follows:
| Affiliated Investment Companies | Value,
Beginning
of Year | Purchases
at Cost | Proceeds
from
Sales | Net
Realized
Gain/(Loss)
on Sales | Change in
Unrealized
Appreciation/
(Depreciation) | Value,
End of
Year | Dividend
Income | Other
Distributions | Shares
End of
Year |
| MainStay U.S. Government Liquidity Fund | $ 995 | $ 90,159 | $ (89,683) | $ — | $ — | $ 1,471 | $ 73 | $ — | 1,471 |
| Abbreviation(s): |
| ADR—American Depositary Receipt |
| REIT—Real Estate Investment Trust |
The following is a summary of the fair valuations according to the inputs used as of December 31, 2023, for valuing the Portfolio’s assets:
| Description | Quoted
Prices in
Active
Markets for
Identical
Assets
(Level 1) | | Significant
Other
Observable
Inputs
(Level 2) | | Significant
Unobservable
Inputs
(Level 3) | | Total |
| Asset Valuation Inputs | | | | | | | |
| Investments in Securities (a) | | | | | | | |
| Common Stocks | $ 706,725,577 | | $ — | | $ — | | $ 706,725,577 |
| Short-Term Investments | | | | | | | |
| Affiliated Investment Company | 1,471,327 | | — | | — | | 1,471,327 |
| Unaffiliated Investment Companies | 9,355,134 | | — | | — | | 9,355,134 |
| Total Short-Term Investments | 10,826,461 | | — | | — | | 10,826,461 |
| Total Investments in Securities | $ 717,552,038 | | $ — | | $ — | | $ 717,552,038 |
| (a) | For a complete listing of investments and their industries, see the Portfolio of Investments. |
The notes to the financial statements are an integral part of, and should be read in conjunction with, the financial statements.
13
Statement of Assets and Liabilities as of December 31, 2023
| Assets |
Investment in unaffiliated securities, at value
(identified cost $625,492,346) including securities on loan of $14,012,339 | $716,080,711 |
Investment in affiliated investment companies, at value
(identified cost $1,471,327) | 1,471,327 |
| Receivables: | |
| Dividends | 301,826 |
| Portfolio shares sold | 86,167 |
| Securities lending | 1,142 |
| Other assets | 4,213 |
| Total assets | 717,945,386 |
| Liabilities |
| Cash collateral received for securities on loan | 9,355,134 |
| Due to custodian | 18 |
| Payables: | |
| Manager (See Note 3) | 490,160 |
| Portfolio shares redeemed | 430,110 |
| NYLIFE Distributors (See Note 3) | 90,583 |
| Shareholder communication | 52,462 |
| Professional fees | 28,802 |
| Custodian | 18,089 |
| Accrued expenses | 1,527 |
| Total liabilities | 10,466,885 |
| Net assets | $707,478,501 |
| Composition of Net Assets |
| Shares of beneficial interest outstanding (par value of $.001 per share) unlimited number of shares authorized | $ 86,153 |
| Additional paid-in-capital | 765,851,509 |
| | 765,937,662 |
| Total distributable earnings (loss) | (58,459,161) |
| Net assets | $707,478,501 |
| Initial Class | |
| Net assets applicable to outstanding shares | $272,691,243 |
| Shares of beneficial interest outstanding | 32,359,316 |
| Net asset value per share outstanding | $ 8.43 |
| Service Class | |
| Net assets applicable to outstanding shares | $434,787,258 |
| Shares of beneficial interest outstanding | 53,793,723 |
| Net asset value per share outstanding | $ 8.08 |
The notes to the financial statements are an integral part of, and should be read in conjunction with, the financial statements.
| 14 | MainStay VP Wellington Mid Cap Portfolio |
Statement of Operations for the year ended December 31, 2023
| Investment Income (Loss) |
| Income | |
| Dividends-unaffiliated (net of foreign tax withholding of $61,870) | $ 8,061,978 |
| Dividends-affiliated | 73,264 |
| Securities lending, net | 48,120 |
| Total income | 8,183,362 |
| Expenses | |
| Manager (See Note 3) | 5,918,420 |
| Distribution/Service—Service Class (See Note 3) | 1,058,458 |
| Professional fees | 92,589 |
| Custodian | 44,902 |
| Trustees | 17,879 |
| Miscellaneous | 15,841 |
| Total expenses before waiver/reimbursement | 7,148,089 |
| Expense waiver/reimbursement from Manager (See Note 3) | (101,577) |
| Net expenses | 7,046,512 |
| Net investment income (loss) | 1,136,850 |
| Realized and Unrealized Gain (Loss) |
| Net realized gain (loss) on: | |
| Unaffiliated investment transactions | (62,984,706) |
| Foreign currency transactions | (36) |
| Net realized gain (loss) | (62,984,742) |
| Net change in unrealized appreciation (depreciation) on: | |
| Unaffiliated investments | 151,672,379 |
| Translation of other assets and liabilities in foreign currencies | (15) |
| Net change in unrealized appreciation (depreciation) | 151,672,364 |
| Net realized and unrealized gain (loss) | 88,687,622 |
| Net increase (decrease) in net assets resulting from operations | $ 89,824,472 |
The notes to the financial statements are an integral part of, and should be read in conjunction with, the financial statements.
15
Statements of Changes in Net Assets
for the years ended December 31, 2023 and December 31, 2022
| | 2023 | 2022 |
| Increase (Decrease) in Net Assets |
| Operations: | | |
| Net investment income (loss) | $ 1,136,850 | $ (213,024) |
| Net realized gain (loss) | (62,984,742) | (85,034,575) |
| Net change in unrealized appreciation (depreciation) | 151,672,364 | (105,118,238) |
| Net increase (decrease) in net assets resulting from operations | 89,824,472 | (190,365,837) |
| Distributions to shareholders: | | |
| Initial Class | (294,972) | (116,195,297) |
| Service Class | — | (181,440,133) |
| Total distributions to shareholders | (294,972) | (297,635,430) |
| Capital share transactions: | | |
| Net proceeds from sales of shares | 30,975,645 | 49,449,693 |
| Net asset value of shares issued to shareholders in reinvestment of distributions | 294,972 | 297,635,430 |
| Cost of shares redeemed | (125,818,257) | (78,282,585) |
| Increase (decrease) in net assets derived from capital share transactions | (94,547,640) | 268,802,538 |
| Net increase (decrease) in net assets | (5,018,140) | (219,198,729) |
| Net Assets |
| Beginning of year | 712,496,641 | 931,695,370 |
| End of year | $ 707,478,501 | $ 712,496,641 |
The notes to the financial statements are an integral part of, and should be read in conjunction with, the financial statements.
| 16 | MainStay VP Wellington Mid Cap Portfolio |
Financial Highlights selected per share data and ratios
| | Year Ended December 31, |
| Initial Class | 2023 | | 2022 | | 2021 | | 2020 | | 2019 |
| Net asset value at beginning of year | $ 7.42 | | $ 16.34 | | $ 13.96 | | $ 13.56 | | $ 11.94 |
| Net investment income (loss) (a) | 0.02 | | 0.02 | | (0.02) | | 0.08 | | 0.11 |
| Net realized and unrealized gain (loss) | 1.00 | | (3.69) | | 2.80 | | 1.32 | | 2.54 |
| Total from investment operations | 1.02 | | (3.67) | | 2.78 | | 1.40 | | 2.65 |
| Less distributions: | | | | | | | | | |
| From net investment income | (0.01) | | — | | (0.10) | | (0.12) | | (0.16) |
| From net realized gain on investments | — | | (5.25) | | (0.30) | | (0.88) | | (0.87) |
| Total distributions | (0.01) | | (5.25) | | (0.40) | | (1.00) | | (1.03) |
| Net asset value at end of year | $ 8.43 | | $ 7.42 | | $ 16.34 | | $ 13.96 | | $ 13.56 |
| Total investment return (b) | 13.69% | | (20.52)% | | 20.00% | | 11.28% | | 22.88% |
| Ratios (to average net assets)/Supplemental Data: | | | | | | | | | |
| Net investment income (loss) | 0.31% | | 0.13% | | (0.12)% | | 0.65% | | 0.84% |
| Net expenses (c) | 0.86% | | 0.86% | | 0.86% | | 0.86% | | 0.86% |
| Expenses (before waiver/reimbursement) (c) | 0.88% | | 0.89% | | 0.89% | | 0.89% | | 0.88% |
| Portfolio turnover rate | 60% | | 49% | | 54% | | 178% | | 174% |
| Net assets at end of year (in 000's) | $ 272,691 | | $ 286,378 | | $ 360,437 | | $ 346,379 | | $ 398,240 |
| (a) | Per share data based on average shares outstanding during the year. |
| (b) | Total return does not reflect any deduction of sales charges, mortality and expense charges, contract charges or administrative charges. For periods of less than one year, total return is not annualized. |
| (c) | In addition to the fees and expenses which the Portfolio bears directly, it also indirectly bears a pro-rata share of the fees and expenses of the underlying funds in which it invests. Such indirect expenses are not included in the above expense ratios. |
| | Year Ended December 31, |
| Service Class | 2023 | | 2022 | | 2021 | | 2020 | | 2019 |
| Net asset value at beginning of year | $ 7.13 | | $ 16.00 | | $ 13.68 | | $ 13.32 | | $ 11.74 |
| Net investment income (loss) (a) | 0.01 | | (0.01) | | (0.04) | | 0.05 | | 0.08 |
| Net realized and unrealized gain (loss) | 0.94 | | (3.61) | | 2.72 | | 1.28 | | 2.49 |
| Total from investment operations | 0.95 | | (3.62) | | 2.68 | | 1.33 | | 2.57 |
| Less distributions: | | | | | | | | | |
| From net investment income | — | | — | | (0.06) | | (0.09) | | (0.12) |
| From net realized gain on investments | — | | (5.25) | | (0.30) | | (0.88) | | (0.87) |
| Total distributions | — | | (5.25) | | (0.36) | | (0.97) | | (0.99) |
| Net asset value at end of year | $ 8.08 | | $ 7.13 | | $ 16.00 | | $ 13.68 | | $ 13.32 |
| Total investment return (b) | 13.32%(c) | | (20.71)% | | 19.70% | | 11.00% | | 22.57% |
| Ratios (to average net assets)/Supplemental Data: | | | | | | | | | |
| Net investment income (loss) | 0.07% | | (0.13)% | | (0.25)% | | 0.42% | | 0.58% |
| Net expenses (d) | 1.11% | | 1.11% | | 1.11% | | 1.11% | | 1.11% |
| Expenses (before waiver/reimbursement) (d) | 1.13% | | 1.14% | | 1.14% | | 1.14% | | 1.13% |
| Portfolio turnover rate | 60% | | 49% | | 54% | | 178% | | 174% |
| Net assets at end of year (in 000's) | $ 434,787 | | $ 426,119 | | $ 571,259 | | $ 551,856 | | $ 516,445 |
| (a) | Per share data based on average shares outstanding during the year. |
| (b) | Total return does not reflect any deduction of sales charges, mortality and expense charges, contract charges or administrative charges. For periods of less than one year, total return is not annualized. |
| (c) | Total investment return may reflect adjustments to conform to generally accepted accounting principles. |
| (d) | In addition to the fees and expenses which the Portfolio bears directly, it also indirectly bears a pro-rata share of the fees and expenses of the underlying funds in which it invests. Such indirect expenses are not included in the above expense ratios. |
The notes to the financial statements are an integral part of, and should be read in conjunction with, the financial statements.
17
Notes to Financial Statements
Note 1–Organization and Business
MainStay VP Funds Trust (the “Fund”) was organized as a Delaware statutory trust on February 1, 2011. The Fund is registered under the Investment Company Act of 1940, as amended (the “1940 Act”), as an open-end management investment company. The Fund is comprised of thirty-one separate series (collectively referred to as the “Portfolios”). These financial statements and notes relate to the MainStay VP Wellington Mid Cap Portfolio (the "Portfolio"), a "diversified” portfolio, as that term is defined in the 1940 Act, as interpreted or modified by regulatory authorities having jurisdiction, from time to time.
Shares of the Portfolio are currently offered to certain separate accounts to fund variable annuity policies and variable universal life insurance policies issued by New York Life Insurance and Annuity Corporation (“NYLIAC”), a wholly-owned subsidiary of New York Life Insurance Company (“New York Life”) and may also be offered to fund variable annuity policies and variable universal life insurance policies issued by other insurance companies. NYLIAC allocates shares of the Portfolio to, among others, certain NYLIAC separate accounts. Shares of the Portfolio are also offered to the MainStay VP Conservative Allocation Portfolio, MainStay VP Moderate Allocation Portfolio, MainStay VP Growth Allocation Portfolio and MainStay VP Equity Allocation Portfolio, which operate as “funds-of-funds," and other variable insurance funds.
The following table lists the Portfolio's share classes that have been registered and commenced operations:
| Class | Commenced Operations |
| Initial Class | July 2, 2001 |
| Service Class | June 5, 2003 |
Shares of the Portfolio are offered and are redeemed at a price equal to their respective net asset value (“NAV”) per share. No sales or redemption charge is applicable to the purchase or redemption of the Portfolio's shares. Under the terms of the Fund’s multiple class plan, adopted pursuant to Rule 18f-3 under the 1940 Act, the classes differ in that, among other things, Service Class shares of the Portfolio pay a combined distribution and service fee of 0.25% of average daily net assets attributable to Service Class shares of the Portfolio to the Distributor (as defined in Note 3(B)) pursuant to a plan adopted in accordance with Rule 12b-1 under the 1940 Act. Contract owners of variable annuity contracts purchased after June 2, 2003, are permitted to invest only in the Service Class shares.
The Portfolio's investment objective is to seek long-term growth of capital.
Note 2–Significant Accounting Policies
The Portfolio is an investment company and accordingly follows the investment company accounting and reporting guidance of the Financial Accounting Standards Board (“FASB”) Accounting Standards Codification Topic 946 Financial Services—Investment Companies. The Portfolio prepares its financial statements in accordance with generally accepted
accounting principles (“GAAP”) in the United States of America and follows the significant accounting policies described below.
(A) Securities Valuation. Investments are usually valued as of the close of regular trading on the New York Stock Exchange (the "Exchange") (usually 4:00 p.m. Eastern time) on each day the Portfolio is open for business ("valuation date").
Pursuant to Rule 2a-5 under the 1940 Act, the Board of Trustees of the Fund (the "Board") has designated New York Life Investment Management LLC (“New York Life Investments” or the "Manager") as its Valuation Designee (the "Valuation Designee"). The Valuation Designee is responsible for performing fair valuations relating to all investments in the Portfolio’s portfolio for which market quotations are not readily available; periodically assessing and managing material valuation risks; establishing and applying fair value methodologies; testing fair valuation methodologies; evaluating and overseeing pricing services; ensuring appropriate segregation of valuation and portfolio management functions; providing quarterly, annual and prompt reporting to the Board, as appropriate; identifying potential conflicts of interest; and maintaining appropriate records. The Valuation Designee has established a valuation committee ("Valuation Committee") to assist in carrying out the Valuation Designee’s responsibilities and establish prices of securities for which market quotations are not readily available. The Portfolio's and the Valuation Designee's policies and procedures ("Valuation Procedures") govern the Valuation Designee’s selection and application of methodologies for determining and calculating the fair value of Portfolio investments. The Valuation Designee may value the Portfolio's portfolio securities for which market quotations are not readily available and other Portfolio assets utilizing inputs from pricing services and other third-party sources. The Valuation Committee meets (in person, via electronic mail or via teleconference) on an ad-hoc basis to determine fair valuations and on a quarterly basis to review fair value events with respect to certain securities for which market quotations are not readily available, including valuation risks and back-testing results, and to preview reports to the Board.
The Valuation Committee establishes prices of securities for which market quotations are not readily available based on such methodologies and measurements on a regular basis after considering information that is reasonably available and deemed relevant by the Valuation Committee. The Board shall oversee the Valuation Designee and review fair valuation materials on a prompt, quarterly and annual basis and approve proposed revisions to the Valuation Procedures.
Investments for which market quotations are not readily available are valued at fair value as determined in good faith pursuant to the Valuation Procedures. A market quotation is readily available only when that quotation is a quoted price (unadjusted) in active markets for identical investments that the Portfolio can access at the measurement date, provided that a quotation will not be readily available if it is not reliable. "Fair value" is defined as the price the Portfolio would reasonably expect to receive upon selling an asset or liability in an orderly transaction to an independent buyer in the principal or most advantageous market for the
| 18 | MainStay VP Wellington Mid Cap Portfolio |
asset or liability. Fair value measurements are determined within a framework that establishes a three-tier hierarchy that maximizes the use of observable market data and minimizes the use of unobservable inputs to establish a classification of fair value measurements for disclosure purposes. "Inputs" refer broadly to the assumptions that market participants would use in pricing the asset or liability, including assumptions about risk, such as the risk inherent in a particular valuation technique used to measure fair value using a pricing model and/or the risk inherent in the inputs for the valuation technique. Inputs may be observable or unobservable. Observable inputs reflect the assumptions market participants would use in pricing the asset or liability based on market data obtained from sources independent of the Portfolio. Unobservable inputs reflect the Portfolio’s own assumptions about the assumptions market participants would use in pricing the asset or liability based on the information available. The inputs or methodology used for valuing assets or liabilities may not be an indication of the risks associated with investing in those assets or liabilities. The three-tier hierarchy of inputs is summarized below.
| • | Level 1—quoted prices (unadjusted) in active markets for an identical asset or liability |
| • | Level 2—other significant observable inputs (including quoted prices for a similar asset or liability in active markets, interest rates and yield curves, prepayment speeds, credit risk, etc.) |
| • | Level 3—significant unobservable inputs (including the Portfolio's own assumptions about the assumptions that market participants would use in measuring fair value of an asset or liability) |
The level of an asset or liability within the fair value hierarchy is based on the lowest level of an input, both individually and in the aggregate, that is significant to the fair value measurement. The aggregate value by input level of the Portfolio’s assets and liabilities as of December 31, 2023, is included at the end of the Portfolio of Investments.
The Portfolio may use third-party vendor evaluations, whose prices may be derived from one or more of the following standard inputs, among others:
| • Broker/dealer quotes | • Benchmark securities |
| • Two-sided markets | • Reference data (corporate actions or material event notices) |
| • Bids/offers | • Monthly payment information |
| • Industry and economic events | • Reported trades |
An asset or liability for which a market quotation is not readily available is valued by methods deemed reasonable in good faith by the Valuation Committee, following the Valuation Procedures to represent fair value. Under these procedures, the Valuation Designee generally uses a market-based approach which may use related or comparable assets or liabilities, recent transactions, market multiples, book values and other relevant information. The Valuation Designee may also use an income-based valuation approach in which the anticipated future cash flows of the asset or liability are discounted to calculate fair value.
Discounts may also be applied due to the nature and/or duration of any restrictions on the disposition of the asset or liability. Fair value represents a good faith approximation of the value of a security. Fair value determinations involve the consideration of a number of subjective factors, an analysis of applicable facts and circumstances and the exercise of judgment. As a result, it is possible that the fair value for a security determined in good faith in accordance with the Valuation Procedures may differ from valuations for the same security determined for other funds using their own valuation procedures. Although the Valuation Procedures are designed to value a security at the price the Portfolio may reasonably expect to receive upon the security's sale in an orderly transaction, there can be no assurance that any fair value determination thereunder would, in fact, approximate the amount that the Portfolio would actually realize upon the sale of the security or the price at which the security would trade if a reliable market price were readily available. During the year ended December 31, 2023, there were no material changes to the fair value methodologies.
Securities which may be valued in this manner include, but are not limited to: (i) a security for which trading has been halted or suspended or otherwise does not have a readily available market quotation on a given day; (ii) a debt security that has recently gone into default and for which there is not a current market quotation; (iii) a security of an issuer that has entered into a restructuring; (iv) a security that has been delisted from a national exchange; (v) a security subject to trading collars for which no or limited trading takes place; and (vi) a security whose principal market has been temporarily closed at a time when, under normal conditions, it would be open. Securities valued in this manner are generally categorized as Level 2 or 3 in the hierarchy.
Equity securities, rights and warrants, if applicable, are valued at the last quoted sales prices as of the close of regular trading on the relevant exchange on each valuation date. Securities that are not traded on the valuation date are valued at the mean of the last quoted bid and ask prices. Prices are normally taken from the principal market in which each security trades. These securities are generally categorized as Level 1 in the hierarchy.
Investments in mutual funds, including money market funds, are valued at their respective NAVs at the close of business each day on the valuation date. These securities are generally categorized as Level 1 in the hierarchy.
Temporary cash investments acquired in excess of 60 days to maturity at the time of purchase are valued using the latest bid prices or using valuations based on a matrix system (which considers such factors as security prices, yields, maturities and ratings), both as furnished by independent pricing services. Temporary cash investments that mature in 60 days or less at the time of purchase ("Short-Term Investments") are valued using the amortized cost method of valuation, unless the use of such method would be inappropriate. The amortized cost method involves valuing a security at its cost on the date of purchase and thereafter assuming a constant amortization to maturity of the difference between such cost and the value on maturity date. Amortized cost approximates
Notes to Financial Statements (continued)
the current fair value of a security. Securities valued using the amortized cost method are not valued using quoted prices in an active market and are generally categorized as Level 2 in the hierarchy.
The information above is not intended to reflect an exhaustive list of the methodologies that may be used to value portfolio investments. The Valuation Procedures permit the use of a variety of valuation methodologies in connection with valuing portfolio investments. The methodology used for a specific type of investment may vary based on the market data available or other considerations. The methodologies summarized above may not represent the specific means by which portfolio investments are valued on any particular business day.
(B) Income Taxes. The Portfolio's policy is to comply with the requirements of the Internal Revenue Code of 1986, as amended (the “Internal Revenue Code”), applicable to regulated investment companies and to distribute all of its taxable income to the shareholders of the Portfolio within the allowable time limits.
The Manager evaluates the Portfolio’s tax positions to determine if the tax positions taken meet the minimum recognition threshold in connection with accounting for uncertainties in income tax positions taken or expected to be taken for the purposes of measuring and recognizing tax liabilities in the financial statements. Recognition of tax benefits of an uncertain tax position is permitted only to the extent the position is “more likely than not” to be sustained assuming examination by taxing authorities. The Manager analyzed the Portfolio's tax positions taken on federal, state and local income tax returns for all open tax years (for up to three tax years) and has concluded that no provisions for federal, state and local income tax are required in the Portfolio's financial statements. The Portfolio's federal, state and local income tax and federal excise tax returns for tax years for which the applicable statutes of limitations have not expired are subject to examination by the Internal Revenue Service and state and local departments of revenue.
(C) Dividends and Distributions to Shareholders. Dividends and distributions are recorded on the ex-dividend date. The Portfolio intends to declare and pay dividends from net investment income and distributions from net realized capital and currency gains, if any, at least annually. All dividends and distributions are reinvested at NAV in the same class of shares of the Portfolio. Dividends and distributions to shareholders are determined in accordance with federal income tax regulations and may differ from determinations using GAAP.
(D) Security Transactions and Investment Income. The Portfolio records security transactions on the trade date. Realized gains and losses on security transactions are determined using the identified cost method. Dividend income is recognized on the ex-dividend date, net of any foreign tax withheld at the source, and interest income is accrued as earned using the effective interest rate method. Distributions received from real estate investment trusts may be classified as dividends, capital gains and/or return of capital.
Investment income and realized and unrealized gains and losses on investments of the Portfolio are allocated pro rata to the separate classes
of shares based upon their relative net assets on the date the income is earned or realized and unrealized gains and losses are incurred.
(E) Expenses. Expenses of the Fund are allocated to the individual Portfolios in proportion to the net assets of the respective Portfolios when the expenses are incurred, except where direct allocations of expenses can be made. Expenses (other than fees incurred under the distribution and service plans, further discussed in Note 3(B), which are charged directly to the Service Class shares) are allocated to separate classes of shares pro rata based upon their relative net assets on the date the expenses are incurred. The expenses borne by the Portfolio, including those of related parties to the Portfolio, are shown in the Statement of Operations.
Additionally, the Portfolio may invest in mutual funds, which are subject to management fees and other fees that may cause the costs of investing in mutual funds to be greater than the costs of owning the underlying securities directly. These indirect expenses of mutual funds are not included in the amounts shown as expenses in the Statement of Operations or in the expense ratios included in the Financial Highlights.
(F) Use of Estimates. In preparing financial statements in conformity with GAAP, the Manager makes estimates and assumptions that affect the reported amounts and disclosures in the financial statements. Actual results could differ from those estimates and assumptions.
(G) Foreign Currency Transactions. The Portfolio's books and records are maintained in U.S. dollars. Prices of securities denominated in foreign currency amounts are translated into U.S. dollars at the mean between the buying and selling rates last quoted by any major U.S. bank at the following dates:
(i) market value of investment securities, other assets and liabilities— at the valuation date; and
(ii) purchases and sales of investment securities, income and expenses—at the date of such transactions.
The assets and liabilities that are denominated in foreign currency amounts are presented at the exchange rates and market values at the close of the period. The realized and unrealized changes in net assets arising from fluctuations in exchange rates and market prices of securities are not separately presented.
Net realized gain (loss) on foreign currency transactions represents net currency gains or losses realized as a result of differences between the amounts of securities sale proceeds or purchase cost, dividends, interest and withholding taxes as recorded on the Portfolio's books, and the U.S. dollar equivalent amount actually received or paid. Net currency gains or losses from valuing such foreign currency denominated assets and liabilities, other than investments at valuation date exchange rates, are reflected in unrealized foreign exchange gains or losses.
(H) Securities Lending. In order to realize additional income, the Portfolio may engage in securities lending, subject to the limitations set forth in the 1940 Act and relevant guidance by the staff of the Securities
| 20 | MainStay VP Wellington Mid Cap Portfolio |
and Exchange Commission (“SEC”). If the Portfolio engages in securities lending, the Portfolio will lend through its custodian, JPMorgan Chase Bank, N.A., ("JPMorgan"), acting as securities lending agent on behalf of the Portfolio. Under the current arrangement, JPMorgan will manage the Portfolio's collateral in accordance with the securities lending agency agreement between the Portfolio and JPMorgan, and indemnify the Portfolio against counterparty risk. The loans will be collateralized by cash (which may be invested in a money market fund) and/or non-cash collateral (which may include U.S. Treasury securities and/or U.S. government agency securities issued or guaranteed by the United States government or its agencies or instrumentalities) at least equal at all times to the market value of the securities loaned. Non-cash collateral held at year end is segregated and cannot be transferred by the Portfolio. The Portfolio bears the risk of delay in recovery of, or loss of rights in, the securities loaned. The Portfolio may also record a realized gain or loss on securities deemed sold due to a borrower’s inability to return securities on loan. The Portfolio bears the risk of any loss on investment of cash collateral. The Portfolio will receive compensation for lending its securities in the form of fees or it will retain a portion of interest earned on the investment of any cash collateral. The Portfolio will also continue to receive interest and dividends on the securities loaned and any gain or loss in the market price of the securities loaned that may occur during the term of the loan will be for the account of the Portfolio. Income earned from securities lending activities, if any, is reflected in the Statement of Operations.
(I) Indemnifications. Under the Fund’s organizational documents, its officers and trustees are indemnified against certain liabilities that may arise out of performance of their duties to the Fund. Additionally, in the normal course of business, the Portfolio enters into contracts with third-party service providers that contain a variety of representations and warranties and that may provide general indemnifications. The Portfolio's maximum exposure under these arrangements is unknown, as this would involve future claims that may be made against the Portfolio that have not yet occurred. The Manager believes that the risk of loss in connection with these potential indemnification obligations is remote. However, there can be no assurance that material liabilities related to such obligations will not arise in the future, which could adversely impact the Portfolio.
Note 3–Fees and Related Party Transactions
(A) Manager and Subadvisor. New York Life Investments, a registered investment adviser and an indirect, wholly-owned subsidiary of New York Life, serves as the Portfolio's Manager, pursuant to an Amended and Restated Management Agreement ("Management Agreement"). The Manager provides offices, conducts clerical, recordkeeping and bookkeeping services and keeps most of the financial and accounting records required to be maintained by the Portfolio. Except for the portion of salaries and expenses that are the responsibility of the Portfolio, the Manager pays the salaries and expenses of all personnel affiliated with the Portfolio and certain operational expenses of the Portfolio. The Portfolio reimburses New York Life Investments in an amount equal to the portion of the compensation of the Chief Compliance Officer attributable
to the Portfolio. Wellington Management Company LLP ("Wellington" or the "Subadvisor"), a registered investment adviser, serves as the Subadvisor to the Portfolio and is responsible for the day-to-day portfolio management of the Portfolio. Pursuant to the terms of a Subadvisory Agreement between New York Life Investments and Wellington, New York Life Investments pays for the services of the Subadvisor.
Pursuant to the Management Agreement, the Fund pays the Manager, on behalf of the Portfolio, a monthly fee for the services performed and the facilities furnished at an annual rate of the Portfolio's average daily net assets as follows: 0.85% up to $1 billion; 0.80% from $1 billion to $2 billion; and 0.775% in excess of $2 billion. During the year ended December 31, 2023, the effective management fee rate was 0.85% (exclusive of any applicable waivers/reimbursements) of the Portfolio's average daily net assets.
New York Life Investments has contractually agreed to waive fees and/or reimburse expenses so that the Total Annual Portfolio Operating Expenses (excluding taxes, interest, litigation, extraordinary expenses, brokerage and other transaction expenses relating to the purchase or sale of portfolio investments, and acquired (underlying) portfolio/fund fees and expenses) of Initial Class shares and Service Class shares do not exceed 0.86% and 1.11%, respectively, of the Portfolio's average daily net assets. This agreement will remain in effect until May 1, 2024, and shall renew automatically for one-year terms unless New York Life Investments provides written notice of termination prior to the start of the next term or upon approval of the Board.
During the year ended December 31, 2023, New York Life Investments earned fees from the Portfolio in the amount of $5,918,420 and waived fees and/or reimbursed certain class specific expenses in the amount of $101,577 and paid the Subadvisor fees in the amount of $2,600,172.
JPMorgan provides sub-administration and sub-accounting services to the Portfolio pursuant to an agreement with New York Life Investments. These services include calculating the daily NAVs of the Portfolio, maintaining the general ledger and sub-ledger accounts for the calculation of the Portfolio's NAVs, and assisting New York Life Investments in conducting various aspects of the Portfolio's administrative operations. For providing these services to the Portfolio, JPMorgan is compensated by New York Life Investments.
Pursuant to an agreement between the Fund and New York Life Investments, New York Life Investments is responsible for providing or procuring certain regulatory reporting services for the Portfolio. The Portfolio will reimburse New York Life Investments for the actual costs incurred by New York Life Investments in connection with providing or procuring these services for the Portfolio.
(B) Distribution and Service Fees. The Fund, on behalf of the Portfolio, has entered into a distribution agreement with NYLIFE Distributors LLC (the “Distributor”), an affiliate of New York Life Investments. The Portfolio has adopted a distribution plan (the “Plan”) in accordance with the provisions of Rule 12b-1 under the 1940 Act. Under the Plan, the Distributor has agreed to provide, through its affiliates or
Notes to Financial Statements (continued)
independent third parties, various distribution-related, shareholder and administrative support services to the Service Class shareholders. For its services, the Distributor is entitled to a combined distribution and service fee accrued daily and paid monthly at an annual rate of 0.25% of the average daily net assets attributable to the Service Class shares of the Portfolio.
Note 4-Federal Income Tax
As of December 31, 2023, the cost and unrealized appreciation (depreciation) of the Portfolio’s investment portfolio, including applicable derivative contracts and other financial instruments, as determined on a federal income tax basis, were as follows:
| | Federal Tax
Cost | Gross
Unrealized
Appreciation | Gross
Unrealized
(Depreciation) | Net
Unrealized
Appreciation/
(Depreciation) |
| Investments in Securities | $655,617,325 | $90,272,007 | $(28,337,294) | $61,934,713 |
As of December 31, 2023, the components of accumulated gain (loss) on a tax basis were as follows:
Ordinary
Income | Accumulated
Capital
and Other
Gain (Loss) | Other
Temporary
Differences | Unrealized
Appreciation
(Depreciation) | Total
Accumulated
Gain (Loss) |
| $1,232,012 | $(121,625,886) | $— | $61,934,713 | $(58,459,161) |
The difference between book-basis and tax-basis unrealized appreciation (depreciation) is primarily due to wash sale adjustments.
The following table discloses the current year reclassifications between total distributable earnings (loss) and additional paid-in capital arising from permanent differences; net assets as of December 31, 2023 were not affected.
| | Total
Distributable
Earnings (Loss) | Additional
Paid-In
Capital |
| | $10,655 | $(10,655) |
The reclassifications for the Portfolio are primarily due to Real Estate Investment Trust ("REIT") adjustments.
As of December 31, 2023, for federal income tax purposes, capital loss carryforwards of $121,625,886, as shown in the table below, were available to the extent provided by the regulations to offset future realized gains of the Portfolio. Accordingly, no capital gains distributions are expected to be paid to shareholders until net gains have been realized in excess of such amounts.
Capital Loss
Available Through | Short-Term
Capital Loss
Amounts (000’s) | Long-Term
Capital Loss
Amounts (000’s) |
| Unlimited | $17,562 | $104,064 |
During the years ended December 31, 2023 and December 31, 2022, the tax character of distributions paid as reflected in the Statements of Changes in Net Assets was as follows:
| | 2023 | 2022 |
| Distributions paid from: | | |
| Ordinary Income | $294,972 | $163,719,831 |
| Long-Term Capital Gains | — | 133,915,599 |
| Total | $294,972 | $297,635,430 |
Note 5–Custodian
JPMorgan is the custodian of cash and securities held by the Portfolio. Custodial fees are charged to the Portfolio based on the Portfolio's net assets and/or the market value of securities held by the Portfolio and the number of certain transactions incurred by the Portfolio.
Note 6–Line of Credit
The Portfolio and certain other funds managed by New York Life Investments maintain a line of credit with a syndicate of banks in order to secure a source of funds for temporary purposes to meet unanticipated or excessive redemption requests.
Effective July 25, 2023, under the credit agreement (the “Credit Agreement”), the aggregate commitment amount is $600,000,000 with an additional uncommitted amount of $100,000,000. The commitment fee is an annual rate of 0.15% of the average commitment amount payable quarterly, regardless of usage, to JPMorgan, who serves as the agent to the syndicate. The commitment fee is allocated among the Portfolio and certain other funds managed by New York Life Investments based upon their respective net assets and other factors. Interest on any revolving credit loan is charged based upon the Federal Funds Rate, Daily Simple Secured Overnight Financing Rate ("SOFR") + 0.10%, or the Overnight Bank Funding Rate, whichever is higher. The Credit Agreement expires on July 23, 2024, although the Portfolio, certain other funds managed by New York Life Investments and the syndicate of banks may renew the Credit Agreement for an additional year on the same or different terms or enter into a credit agreement with a different syndicate of banks. Prior to July 25, 2023, the aggregate commitment amount and the commitment fee were the same as those under the current Credit Agreement. During the year ended December 31, 2023, there were no borrowings made or outstanding with respect to the Portfolio under the Credit Agreement.
Note 7–Interfund Lending Program
Pursuant to an exemptive order issued by the SEC, the Portfolio, along with certain other funds managed by New York Life Investments, may participate in an interfund lending program. The interfund lending program provides an alternative credit facility that permits the Portfolio and certain other funds managed by New York Life Investments to lend or borrow money for temporary purposes directly to or from one another, subject to the conditions of the exemptive order. During the year ended
| 22 | MainStay VP Wellington Mid Cap Portfolio |
December 31, 2023, there were no interfund loans made or outstanding with respect to the Portfolio.
Note 8–Purchases and Sales of Securities (in 000’s)
During the year ended December 31, 2023, purchases and sales of securities, other than short-term securities, were $421,852 and $515,455, respectively.
Note 9–Capital Share Transactions
Transactions in capital shares for the years ended December 31, 2023 and December 31, 2022, were as follows:
| Initial Class | Shares | Amount |
| Year ended December 31, 2023: | | |
| Shares sold | 1,214,876 | $ 9,459,304 |
| Shares issued to shareholders in reinvestment of distributions | 39,462 | 294,972 |
| Shares redeemed | (7,485,796) | (58,703,344) |
| Net increase (decrease) | (6,231,458) | $ (48,949,068) |
| Year ended December 31, 2022: | | |
| Shares sold | 1,878,622 | $ 23,300,580 |
| Shares issued to shareholders in reinvestment of distributions | 16,591,980 | 116,195,297 |
| Shares redeemed | (1,943,510) | (23,906,575) |
| Net increase (decrease) | 16,527,092 | $115,589,302 |
| |
| Service Class | Shares | Amount |
| Year ended December 31, 2023: | | |
| Shares sold | 2,918,716 | $ 21,516,341 |
| Shares redeemed | (8,916,610) | (67,114,913) |
| Net increase (decrease) | (5,997,894) | $ (45,598,572) |
| Year ended December 31, 2022: | | |
| Shares sold | 2,130,972 | $ 26,149,113 |
| Shares issued to shareholders in reinvestment of distributions | 26,963,106 | 181,440,133 |
| Shares redeemed | (5,000,775) | (54,376,010) |
| Net increase (decrease) | 24,093,303 | $153,213,236 |
Note 10–Other Matters
As of the date of this report, the Portfolio faces a heightened level of risk associated with current uncertainty, volatility and state of economies, financial markets, rising interest rates, and labor and health conditions around the world. Events such as war, acts of terrorism, recessions, rapid inflation, the imposition of international sanctions, earthquakes, hurricanes, epidemics and pandemics and other unforeseen natural or human disasters may have broad adverse social, political and economic effects on the global economy, which could negatively impact the value of the Portfolio's investments. Developments that disrupt global economies and financial markets may magnify factors that affect the Portfolio's performance.
Note 11–Subsequent Events
In connection with the preparation of the financial statements of the Portfolio as of and for the year ended December 31, 2023, events and transactions subsequent to December 31, 2023, through the date the financial statements were issued, have been evaluated by the Manager for possible adjustment and/or disclosure. No subsequent events requiring financial statement adjustment or disclosure have been identified.
Report of Independent Registered Public Accounting Firm
To the Board of Trustees of MainStay VP Funds Trust and Shareholders of MainStay VP Wellington Mid Cap Portfolio
Opinion on the Financial Statements
We have audited the accompanying statement of assets and liabilities, including the portfolio of investments, of MainStay VP Wellington Mid Cap Portfolio (one of the portfolios constituting MainStay VP Funds Trust, referred to hereafter as the “Portfolio”) as of December 31, 2023, the related statement of operations for the year ended December 31, 2023, the statements of changes in net assets for each of the two years in the period ended December 31, 2023, including the related notes, and the financial highlights for each of the five years in the period ended December 31, 2023 (collectively referred to as the “financial statements”). In our opinion, the financial statements present fairly, in all material respects, the financial position of the Portfolio as of December 31, 2023, the results of its operations for the year then ended, the changes in its net assets for each of the two years in the period ended December 31, 2023 and the financial highlights for each of the five years in the period ended December 31, 2023 in conformity with accounting principles generally accepted in the United States of America.
Basis for Opinion
These financial statements are the responsibility of the Portfolio’s management. Our responsibility is to express an opinion on the Portfolio’s financial statements based on our audits. We are a public accounting firm registered with the Public Company Accounting Oversight Board (United States) (PCAOB) and are required to be independent with respect to the Portfolio in accordance with the U.S. federal securities laws and the applicable rules and regulations of the Securities and Exchange Commission and the PCAOB.
We conducted our audits of these financial statements in accordance with the standards of the PCAOB. Those standards require that we plan and perform the audit to obtain reasonable assurance about whether the financial statements are free of material misstatement, whether due to error or fraud.
Our audits included performing procedures to assess the risks of material misstatement of the financial statements, whether due to error or fraud, and performing procedures that respond to those risks. Such procedures included examining, on a test basis, evidence regarding the amounts and disclosures in the financial statements. Our audits also included evaluating the accounting principles used and significant estimates made by management, as well as evaluating the overall presentation of the financial statements. Our procedures included confirmation of securities owned as of December 31, 2023 by correspondence with the custodian and transfer agents. We believe that our audits provide a reasonable basis for our opinion.
/s/PricewaterhouseCoopers LLP
New York, New York
February 26, 2024
We have served as the auditor of one or more investment companies in the MainStay group of funds since 1984.
| 24 | MainStay VP Wellington Mid Cap Portfolio |
Board Consideration and Approval of Management Agreement and Subadvisory Agreement (Unaudited)
The continuation of the Management Agreement with respect to the MainStay VP Wellington Mid Cap Portfolio (“Portfolio”) and New York Life Investment Management LLC (“New York Life Investments”) and the Subadvisory Agreement between New York Life Investments and Wellington Management Company LLP (“WMC”) with respect to the Portfolio (together, “Advisory Agreements”) is subject to annual review and approval by the Board of Trustees of MainStay VP Funds Trust (“Board” of the “Trust”) in accordance with Section 15 of the Investment Company Act of 1940, as amended (“1940 Act”). At its December 6–7, 2023 meeting, the Board, including the Trustees who are not an “interested person” (as such term is defined in the 1940 Act) of the Trust (“Independent Trustees”) voting separately, unanimously approved the continuation of each of the Advisory Agreements for a one-year period.
In reaching the decision to approve the continuation of each of the Advisory Agreements, the Board considered information and materials furnished by New York Life Investments and WMC in connection with an annual contract review process undertaken by the Board that took place at meetings of the Board and its Contracts Committee from September 2023 through December 2023, including information and materials furnished by New York Life Investments and WMC in response to requests prepared on behalf of the Board, and in consultation with the Independent Trustees, by independent legal counsel to the Independent Trustees, which encompassed a variety of topics, including those summarized below. Information and materials requested by and furnished to the Board for consideration in connection with the contract review process included, among other items, reports on the Portfolio and “peer funds” prepared by Institutional Shareholder Services Inc. (“ISS”), an independent third-party service provider engaged by the Board to report objectively on the Portfolio’s investment performance, management fee and total expenses. The Board also considered information on the fees charged to other investment advisory clients of New York Life Investments and/or WMC that follow investment strategies similar to those of the Portfolio, if any, and, when applicable, the rationale for differences in the Portfolio’s management and subadvisory fees and the fees charged to those other investment advisory clients. In addition, the Board considered information regarding the legal standards and fiduciary obligations applicable to its consideration of the continuation of each of the Advisory Agreements. The contract review process, including the structure and format for information and materials provided to the Board, has been developed in consultation with the Board. The Independent Trustees also met in executive sessions with their independent legal counsel and, for portions thereof, with senior management of New York Life Investments.
The Board’s deliberations with respect to the continuation of each of the Advisory Agreements reflect a year-long process, and the Board also took into account information furnished to the Board and its Committees throughout the year, as deemed relevant and appropriate by the Trustees, including, among other items, reports on investment performance of the Portfolio and investment-related matters for the Portfolio as well as presentations from New York Life Investments and, generally annually, WMC personnel. In addition, the Board took into account other information provided by New York Life Investments throughout the year,
including, among other items, periodic reports on legal and compliance matters, risk management, portfolio turnover, brokerage commissions and non-advisory services provided to the Portfolio by New York Life Investments, as deemed relevant and appropriate by the Trustees.
In addition to information provided to the Board throughout the year, the Board received information in connection with its June 2023 meeting provided specifically in response to requests prepared on behalf of the Board, and in consultation with the Independent Trustees, by independent legal counsel to the Independent Trustees regarding the Portfolio’s distribution arrangements. In addition, the Board received information regarding the Portfolio’s asset levels, share purchase and redemption activity and the payment of Rule 12b-1 and/or certain other fees by applicable share classes of the Portfolio, among other information.
In considering the continuation of each of the Advisory Agreements, the Trustees reviewed and evaluated the information and factors they believed to reasonably be necessary and appropriate in light of legal advice furnished to them by independent legal counsel to the Independent Trustees and through the exercise of their own business judgment. Although individual Trustees may have weighed certain factors or information differently and the Board did not consider any single factor or information controlling in reaching its decision, the factors that figured prominently in the Board’s consideration of the continuation of each of the Advisory Agreements are summarized in more detail below and include, among other factors: (i) the nature, extent and quality of the services provided to the Portfolio by New York Life Investments and WMC; (ii) the qualifications of the portfolio managers of the Portfolio and the historical investment performance of the Portfolio, New York Life Investments and WMC; (iii) the costs of the services provided, and profits realized, by New York Life Investments and WMC with respect to their relationships with the Portfolio; (iv) the extent to which economies of scale have been realized or may be realized if the Portfolio grows and the extent to which any economies of scale have been shared, have benefited or may benefit the Portfolio’s shareholders; and (v) the reasonableness of the Portfolio’s management and subadvisory fees and total ordinary operating expenses. Although the Board recognized that comparisons between the Portfolio’s fees and expenses and those of other funds are imprecise given different terms of agreements, variations in fund strategies and other factors, the Board considered the reasonableness of the Portfolio’s management fee and total ordinary operating expenses as compared to the peer funds identified by ISS. Throughout their considerations, the Trustees acknowledged the commitment of New York Life Investments and its affiliates to serve the MainStay Group of Funds, as well as their capacity, experience, resources, financial stability and reputations. The Trustees also acknowledged the entrepreneurial and other risks assumed by New York Life Investments in sponsoring and managing the Portfolio. With respect to the Subadvisory Agreement, the Board took into account New York Life Investments’ recommendation to approve the continuation of the Subadvisory Agreement.
The Trustees noted that, throughout the year, the Trustees are afforded an opportunity to ask questions of, and request additional information or materials from, New York Life Investments and WMC. The Board’s
Board Consideration and Approval of Management Agreement and Subadvisory Agreement (Unaudited) (continued)
decision with respect to each of the Advisory Agreements may have also been based, in part, on the Board’s knowledge of New York Life Investments and WMC resulting from, among other things, the Board’s consideration of each of the Advisory Agreements in prior years, the advisory agreements for other funds in the MainStay Group of Funds, the Board’s review throughout the year of the performance and operations of other funds in the MainStay Group of Funds and each Trustee’s business judgment and industry experience. In addition to considering the above-referenced factors, the Board observed that in the marketplace, notably under variable life insurance policies and variable annuity contracts for which the Portfolio serves as an investment option, there are a range of investment options available to investors and that the Portfolio’s shareholders, having had the opportunity to consider other investment options, have invested in the Portfolio.
The factors that figured prominently in the Board’s decision to approve the continuation of each of the Advisory Agreements during the Board’s December 6–7, 2023 meeting are summarized in more detail below.
Nature, Extent and Quality of Services Provided by New York Life Investments and WMC
The Board examined the nature, extent and quality of the services that New York Life Investments provides to the Portfolio. The Board evaluated New York Life Investments’ experience and capabilities in serving as manager of the Portfolio and considered that the Portfolio operates in a “manager-of-managers” structure. The Board also considered New York Life Investments’ responsibilities and services provided pursuant to this structure, including overseeing the services provided by WMC, evaluating the performance of WMC, making recommendations to the Board as to whether the Subadvisory Agreement should be renewed, modified or terminated and periodically reporting to the Board regarding the results of New York Life Investments’ evaluation and monitoring functions. The Board noted that New York Life Investments manages other mutual funds, serves a variety of other investment advisory clients, including other pooled investment vehicles, and has experience overseeing mutual fund service providers, including subadvisors. The Board considered the experience of senior personnel at New York Life Investments providing management and administrative and other non-advisory services to the Portfolio. The Board observed that New York Life Investments devotes significant resources and time to providing management and administrative and other non-advisory services to the Portfolio, including New York Life Investments’ oversight and due diligence reviews of WMC and ongoing analysis of, and interactions with, WMC with respect to, among other things, the Portfolio’s investment performance and risks as well as WMC’s investment capabilities and subadvisory services with respect to the Portfolio.
The Board also considered the range of services that New York Life Investments provides to the Portfolio under the terms of the Management Agreement, including: (i) fund accounting and ongoing supervisory services provided by New York Life Investments’ Fund Administration and Accounting Group; (ii) investment supervisory and analytical services provided by New York Life Investments’ Investment Consulting Group; (iii)
compliance services provided by the Trust’s Chief Compliance Officer as well as New York Life Investments’ compliance department, including supervision and implementation of the Portfolio’s compliance program; (iv) legal services provided by New York Life Investments’ Office of the General Counsel; and (v) risk management monitoring and analysis by compliance and investment personnel. In addition, the Board considered New York Life Investments’ willingness to invest in personnel and other resources, such as cyber security, information security and business continuity planning, that may benefit the Portfolio and noted that New York Life Investments is responsible for compensating the Trust’s officers, except for a portion of the salary of the Trust’s Chief Compliance Officer. The Board recognized that New York Life Investments provides certain other non-advisory services to the Portfolio and has over time provided an increasingly broad array of non-advisory services to the MainStay Group of Funds as a result of regulatory and other developments.
The Board also examined the range, and the nature, extent and quality, of the investment advisory services that WMC provides to the Portfolio and considered the terms of each of the Advisory Agreements. The Board evaluated WMC’s experience and performance in serving as subadvisor to the Portfolio and advising other portfolios and WMC’s track record and experience in providing investment advisory services as well as the experience of investment advisory, senior management and administrative personnel at WMC. The Board considered New York Life Investments’ and WMC’s overall resources, legal and compliance environment, capabilities, reputation, financial condition and history. In addition to information provided in connection with quarterly meetings with the Trust’s Chief Compliance Officer, the Board considered information regarding the compliance policies and procedures of New York Life Investments and WMC and acknowledged their commitment to further developing and strengthening compliance programs that may relate to the Portfolio. The Board also considered WMC’s ability to recruit and retain qualified investment professionals and willingness to invest in personnel and other resources that may benefit the Portfolio. In this regard, the Board considered the qualifications and experience of the Portfolio’s portfolio managers, the number of accounts managed by the portfolio managers and the method for compensating the portfolio managers.
In addition, the Board considered information provided by New York Life Investments and WMC regarding their respective business continuity and disaster recovery plans.
Based on these considerations, among others, the Board concluded that the Portfolio would likely continue to benefit from the nature, extent and quality of these services.
Investment Performance
In evaluating the Portfolio’s investment performance, the Board considered investment performance results over various periods in light of the Portfolio’s investment objective, strategies and risks. The Board considered investment reports on, and analysis of, the Portfolio’s performance provided to the Board throughout the year. These reports include, among other items, information on the Portfolio’s gross and net
| 26 | MainStay VP Wellington Mid Cap Portfolio |
returns, the Portfolio’s investment performance compared to a relevant investment category and the Portfolio’s benchmarks, the Portfolio’s risk-adjusted investment performance and the Portfolio’s investment performance as compared to peer funds, as appropriate, as well as portfolio attribution information and commentary on the effect of market conditions. The Board also considered information provided by ISS showing the investment performance of the Portfolio as compared to peer funds. In addition, the Board reviewed the methodology used by ISS to construct the group of peer funds for comparative purposes.
The Board also took into account its discussions with senior management at New York Life Investments concerning the Portfolio’s investment performance over various periods as well as discussions between representatives of WMC and the members of the Board’s Investment Committee, which generally occur on an annual basis. In considering the investment performance of the Portfolio, the Board noted that the Portfolio underperformed its peer funds for the one-, three-, five- and ten-year periods ended July 31, 2023. The Board considered its discussions with representatives from New York Life Investments and WMC regarding the Portfolio’s investment performance.
Based on these considerations, among others, the Board concluded that its review of the Portfolio’s investment performance and related information supported a determination to approve the continuation of each of the Advisory Agreements.
Costs of the Services Provided, and Profits and Other Benefits Realized, by New York Life Investments and WMC
The Board considered the costs of the services provided under each of the Advisory Agreements. The Board also considered the profitability of New York Life Investments and its affiliates and WMC due to their relationships with the Portfolio as well as by New York Life Investments and its affiliates due to their relationships with the MainStay Group of Funds. With respect to the profitability of WMC’s relationship with the Portfolio, the Board considered information from New York Life Investments that WMC’s subadvisory fee reflected an arm’s-length negotiation and that this fee is paid by New York Life Investments, not the Portfolio, and the relevance of WMC’s profitability was considered by the Trustees in that context. On this basis, the Board primarily considered the costs and profitability for New York Life Investments and its affiliates with respect to the Portfolio.
In addition, the Board acknowledged the difficulty in obtaining reliable comparative data about mutual fund managers’ profitability because such information generally is not publicly available and may be impacted by numerous factors, including the structure of a fund manager’s organization, the types of funds it manages, the methodology used to allocate certain fixed costs to specific funds and the manager’s capital structure and costs of capital.
In evaluating the costs of the services provided by New York Life Investments and WMC, and profitability of New York Life Investments and its affiliates and WMC due to their relationships with the Portfolio, the Board considered, among other factors, New York Life Investments’ and
its affiliates’ and WMC’s continuing investments in, or willingness to invest in, personnel and other resources that may support and further enhance the management of the Portfolio, and that New York Life Investments is responsible for paying the subadvisory fee for the Portfolio. The Board also considered the financial resources of New York Life Investments and WMC and acknowledged that New York Life Investments and WMC must be in a position to recruit and retain experienced professional personnel and to maintain a strong financial position for New York Life Investments and WMC to continue to provide high-quality services to the Portfolio. The Board recognized that the Portfolio benefits from the allocation of certain fixed costs among the funds in the MainStay Group of Funds, among other expected benefits resulting from its relationship with New York Life Investments.
The Board considered information regarding New York Life Investments’ methodology for calculating profitability and allocating costs provided by New York Life Investments in connection with the fund profitability analysis presented to the Board. The Board concluded that New York Life Investments’ methods for allocating costs and procedures for estimating overall profitability of the relationship with the funds in the MainStay Group of Funds were reasonable. The Board recognized the difficulty in calculating and evaluating a manager’s profitability with respect to the Portfolio and considered that other profitability methodologies may also be reasonable.
The Board also considered certain fall-out benefits that may be realized by New York Life Investments and its affiliates and WMC and its affiliates due to their relationships with the Portfolio, including reputational and other indirect benefits. The Board recognized, for example, the benefits to WMC from legally permitted “soft-dollar” arrangements by which brokers provide research and other services to WMC in exchange for commissions paid by the Portfolio with respect to trades in the Portfolio’s portfolio securities. In this regard, the Board also requested and considered information from New York Life Investments concerning other material business relationships between WMC and its affiliates and New York Life Investments and its affiliates and considered the existence of a strategic partnership between New York Life Investments and WMC that relates to certain current and future products and represents a potential conflict of interest associated with New York Life Investments’ recommendation to approve the Subadvisory Agreement. In addition, the Board considered its review of the management agreement for a money market fund advised by New York Life Investments and an affiliated subadvisor that serves as an investment option for the Portfolio, including the potential rationale for and costs associated with investments in this money market fund by the Portfolio, if any, and considered information from New York Life Investments that the nature and type of specific investment advisory services provided to this money market fund are distinct from, or in addition to, the investment advisory services provided to the Portfolio. In addition, the Board considered the potential dividend received tax deduction for insurance company affiliates of New York Life Investments from the Portfolio’s securities lending activity.
Board Consideration and Approval of Management Agreement and Subadvisory Agreement (Unaudited) (continued)
The Board noted that the Portfolio serves as an investment option primarily under variable contracts issued by affiliates of New York Life Investments that would receive fees under those contracts. The Board observed that, in addition to fees earned by New York Life Investments under the Management Agreement for managing the Portfolio, New York Life Investments’ affiliates also earn revenues from serving the Portfolio in various other capacities, including as the Portfolio’s distributor, and insurance companies affiliated with New York Life Investments would be entitled to receive fees from the Portfolio under a distribution and service plan adopted pursuant to Rule 12b-1 under the 1940 Act. The Board considered information about these other revenues and their impact on the profitability of the relationship with the Portfolio to New York Life Investments and its affiliates. The Board noted that, although it assessed the overall profitability of the relationship with the Portfolio to New York Life Investments and its affiliates as part of the contract review process, when considering the reasonableness of the fee paid to New York Life Investments under the Management Agreement, the Board considered the profitability of New York Life Investments’ relationship with the Portfolio on a pre-tax basis and without regard to distribution expenses incurred by New York Life Investments from its own resources.
After evaluating the information deemed relevant by the Trustees, the Board concluded that any profits realized by New York Life Investments and its affiliates due to their relationships with the Portfolio were not excessive, other expected benefits that may accrue to New York Life Investments and its affiliates are reasonable and other expected benefits that may accrue to WMC and its affiliates are consistent with those expected for a subadvisor to a mutual fund. With respect to WMC, the Board considered that any profits realized by WMC due to its relationship with the Portfolio are the result of arm’s-length negotiations between New York Life Investments and WMC, acknowledging that any such profits are based on the subadvisory fee paid to WMC by New York Life Investments, not the Portfolio.
Management and Subadvisory Fees and Total Ordinary Operating Expenses
The Board evaluated the reasonableness of the fee paid under each of the Advisory Agreements and the Portfolio’s total ordinary operating expenses. With respect to the management fee and subadvisory fee, the Board primarily considered the reasonableness of the management fee paid by the Portfolio to New York Life Investments because the subadvisory fee paid to WMC is paid by New York Life Investments, not the Portfolio. The Board also considered the reasonableness of the subadvisory fee paid by New York Life Investments and the amount of the management fee retained by New York Life Investments.
In assessing the reasonableness of the Portfolio’s fees and expenses, the Board primarily considered comparative data provided by ISS on the fees and expenses of similar mutual funds managed by other investment advisers. The Board reviewed the methodology used by ISS to construct the group of peer funds for comparative purposes. In addition, the Board considered information provided by New York Life Investments and WMC on fees charged to other investment advisory clients, including
institutional separate accounts and/or other funds, that follow investment strategies similar to those of the Portfolio, if any. The Board considered the contractual management fee schedule for the Portfolio as compared to those for such other investment advisory clients, taking into account the rationale for differences in fee schedules. The Board also took into account information provided by New York Life Investments about the more extensive scope of services provided to registered investment companies, such as the Portfolio, as compared with other investment advisory clients. Additionally, the Board considered the impact of contractual breakpoints, voluntary waivers and expense limitation arrangements on the Portfolio’s net management fee and expenses. The Board also considered that in proposing fees for the Portfolio, New York Life Investments considers the competitive marketplace for mutual funds.
Based on the factors outlined above, among other considerations, the Board concluded that the Portfolio’s management fee and total ordinary operating expenses are within a range that is competitive and support a conclusion that these fees and expenses are reasonable.
Economies of Scale
The Board considered information regarding economies of scale, including whether economies of scale may exist with respect to the Portfolio and whether the Portfolio’s management fee and expense structure permits any economies of scale to be appropriately shared with the Portfolio’s shareholders. The Board also considered a report from New York Life Investments, previously prepared at the request of the Board, that addressed economies of scale, including with respect to the mutual fund business generally, and the various ways in which the benefits of economies of scale may be shared with the funds in the MainStay Group of Funds. Although the Board recognized the difficulty of determining economies of scale with precision, the Board acknowledged that economies of scale may be shared with the Portfolio in a number of ways, including, for example, through the imposition of fee breakpoints, initially setting management fee rates at scale or making additional investments to enhance the services provided to the Portfolio. The Board reviewed information from New York Life Investments showing how the Portfolio’s management fee schedule compared to fee schedules of other funds and accounts managed by New York Life Investments. The Board also reviewed information from ISS showing how the Portfolio’s management fee schedule compared with fees paid for similar services by peer funds at varying asset levels.
Based on this information, the Board concluded that economies of scale are appropriately shared for the benefit of the Portfolio’s shareholders through the Portfolio’s management fee and expense structure and other methods to share benefits from economies of scale.
| 28 | MainStay VP Wellington Mid Cap Portfolio |
Conclusion
On the basis of the information and factors summarized above, among other information and factors deemed relevant by the Trustees, and the evaluation thereof, the Board, including the Independent Trustees voting separately, unanimously voted to approve the continuation of each of the Advisory Agreements.
Proxy Voting Policies and Procedures and Proxy Voting Record
The Portfolio is required to file with the SEC its proxy voting record for the 12-month period ending June 30 on Form N-PX. A description of the policies and procedures that are used to vote proxies relating to portfolio securities of the Portfolio is available free of charge upon request by calling 800-598-2019 or visiting the SEC's website at www.sec.gov. The most recent Form N-PX or proxy voting record is available free of charge upon request by calling 800-598-2019; visiting https://www.newyorklifeinvestments.com/investment-products/vp; or visiting the SEC’s website at www.sec.gov.
Shareholder Reports and Quarterly Portfolio Disclosure
The Portfolio is required to file its complete schedule of portfolio holdings with the SEC 60 days after its first and third fiscal quarter on Form N-PORT. The Portfolio's holdings report is available free of charge upon request by calling 800-598-2019 or by visiting the SEC’s website at www.sec.gov.
| 30 | MainStay VP Wellington Mid Cap Portfolio |
Board of Trustees and Officers (Unaudited)
The Trustees and officers of the Portfolio are listed below. The Board oversees the MainStay Group of Funds (which consists of MainStay Funds and MainStay Funds Trust), MainStay VP Funds Trust, MainStay MacKay DefinedTerm Municipal Opportunities Fund, MainStay CBRE Global Infrastructure Megatrends Term Fund, the Manager and the Subadvisors, and elects the officers of the Portfolios who are responsible for the day-to-day operations of the Portfolio. Information pertaining to the Trustees and officers is set forth below. Each Trustee serves until his or her successor is elected and qualified or until his or her resignation,
death or removal. Under the Board’s retirement policy, unless an exception is made, a Trustee must tender his or her resignation by the end of the calendar year during which he or she reaches the age of 75. Officers are elected annually by the Board. The business address of each Trustee and officer listed below is 51 Madison Avenue, New York, New York 10010. A majority of the Trustees are not “interested persons” (as defined by the 1940 Act and rules adopted by the SEC thereunder) of the Portfolio (“Independent Trustees”).
| | Name and
Year of Birth | Term of Office,
Position(s) Held and
Length of Service | Principal Occupation(s)
During Past Five Years | Number of
Portfolios in
Fund Complex
Overseen by
Trustee | Other Directorships
Held by Trustee |
| | | | | | |
| | Naïm Abou-Jaoudé*
1966 | MainStay VP Funds Trust: Trustee since 2023 | Chief Executive Officer of New York Life Investment Management LLC (since 2023). Chief Executive Officer of Candriam (an affiliate of New York Life Investment Management LLC) (2007 to 2023). | 81 | MainStay Funds: Trustee since 2023 (11 Funds)
MainStay Funds Trust: Trustee since 2023 (37 Funds);
MainStay MacKay DefinedTerm Municipal Opportunities Fund: Trustee since 2023;
MainStay CBRE Global Infrastructure Megatrends Term Fund: Trustee since 2023; and
New York Life Investment Management International (Chair) since 2015 |
| * | This Trustee is considered to be an “interested person” of the MainStay Group of Funds, MainStay VP Funds Trust, MainStay CBRE Global Infrastructure Megatrends Term Fund and MainStay MacKay DefinedTerm Municipal Opportunities Fund, within the meaning of the 1940 Act because of his affiliation with New York Life Investment Management LLC and Candriam, as described in detail above in the column entitled “Principal Occupation(s) During Past Five Years.” |
| | |
Board of Trustees and Officers (Unaudited) (continued)
| | Name and
Year of Birth | Term of Office,
Position(s) Held and
Length of Service | Principal Occupation(s)
During Past Five Years | Number of
Portfolios in
Fund Complex
Overseen by
Trustee | Other Directorships
Held by Trustee |
| | | | | | |
| | David H. Chow
1957 | MainStay VP Funds Trust: Trustee since January 2016, Advisory Board Member (June 2015 to December 2015) | Founder and CEO, DanCourt Management, LLC since 1999 | 81 | MainStay Funds: Trustee since January 2016, Advisory Board Member (June 2015 to December 2015) (11 Funds);
MainStay Funds Trust: Trustee since January 2016, Advisory Board Member (June 2015 to December 2015) (37 Funds);
MainStay MacKay DefinedTerm Municipal Opportunities Fund: Trustee since January 2016, Advisory Board Member (June 2015 to December 2015);
MainStay CBRE Global Infrastructure Megatrends Term Fund: Trustee since 2021;
VanEck Vectors Group of Exchange-Traded Funds: Trustee since 2006 and Independent Chairman of the Board of Trustees from 2008 to 2022 (57 portfolios); and
Berea College of Kentucky: Trustee since 2009, Chair of the Investment Committee since 2018 |
| | Karen Hammond
1956 | MainStay VP Funds Trust: Trustee since December 2021, Advisory Board Member (June 2021 to December 2021)
| Retired, Managing Director, Devonshire Investors (2007 to 2013); Senior Vice President, Fidelity Management & Research Co. (2005 to 2007); Senior Vice President and Corporate Treasurer, FMR Corp. (2003 to 2005); Chief Operating Officer, Fidelity Investments Japan (2001 to 2003) | 81 | MainStay Funds: Trustee since December 2021, Advisory Board Member (June 2021 to December 2021) (11 Funds);
MainStay Funds Trust: Trustee since December 2021, Advisory Board Member (June 2021 to December 2021) (37 Funds);
MainStay MacKay DefinedTerm Municipal Opportunities Fund: Trustee since December 2021, Advisory Board Member (June 2021 to December 2021);
MainStay CBRE Global Infrastructure Megatrends Term Fund: Trustee since December 2021, Advisory Board Member (June 2021 to December 2021);
Two Harbors Investment Corp.: Director since 2018;
Rhode Island State Investment Commission: Member since 2017; and
Blue Cross Blue Shield of Rhode Island: Director since 2019 |
| | Susan B. Kerley
1951 | MainStay VP Funds Trust: Chair since 2017 and Trustee since 2007** | President, Strategic Management Advisors LLC since 1990 | 81 | MainStay Funds: Chair since January 2017 and Trustee since 2007 (11 Funds); MainStay Funds Trust: Chair since January 2017 and Trustee since 1990 (37 Funds)***;
MainStay MacKay DefinedTerm Municipal Opportunities Fund: Chair since January 2017 and Trustee since 2011;
MainStay CBRE Global Infrastructure Megatrends Term Fund: Trustee since June 2021; and
Legg Mason Partners Funds: Trustee since 1991 (45 portfolios) |
| 32 | MainStay VP Wellington Mid Cap Portfolio |
| | Name and
Year of Birth | Term of Office,
Position(s) Held and
Length of Service | Principal Occupation(s)
During Past Five Years | Number of
Portfolios in
Fund Complex
Overseen by
Trustee | Other Directorships
Held by Trustee |
| | | | | | |
| | Alan R. Latshaw
1951 | MainStay VP Funds Trust: Trustee since 2007** | Retired; Partner, Ernst & Young LLP (2002 to 2003); Partner, Arthur Andersen LLP (1989 to 2002); Consultant to the MainStay Funds Audit and Compliance Committee (2004 to 2006) | 81 | MainStay Funds: Trustee since 2006 (11 Funds);
MainStay Funds Trust: Trustee since 2007 (37 Funds)***;
MainStay MacKay DefinedTerm Municipal Opportunities Fund: Trustee since 2011; and
MainStay CBRE Global Infrastructure Megatrends Term Fund: Trustee since June 2021 |
| | Jacques P. Perold
1958 | MainStay VP Funds Trust: Trustee since January 2016, Advisory Board Member (June 2015 to December 2015) | Founder and Chief Executive Officer, CapShift Advisors LLC (since 2018); President, Fidelity Management & Research Company (2009 to 2014); President and Chief Investment Officer, Geode Capital Management, LLC (2001 to 2009) | 81 | MainStay Funds: Trustee since January 2016, Advisory Board Member (June 2015 to December 2015) (11 Funds);
MainStay Funds Trust: Trustee since January 2016, Advisory Board Member (June 2015 to December 2015) (37 Funds);
MainStay MacKay DefinedTerm Municipal Opportunities Fund: Trustee since January 2016, Advisory Board Member (June 2015 to December 2015);
MainStay CBRE Global Infrastructure Megatrends Term Fund: Trustee since June 2021;
Allstate Corporation: Director since 2015;
Partners in Health: Trustee since 2019; and
MSCI Inc.: Director since 2017 |
| | Richard S. Trutanic
1952 | MainStay VP Funds Trust: Trustee since 2007** | Chairman and Chief Executive Officer, Somerset & Company (financial advisory firm) since 2004; Managing Director, The Carlyle Group (private investment firm) (2002 to 2004); Senior Managing Director, Partner and Board Member, Groupe Arnault S.A. (private investment firm) (1999 to 2002) | 81 | MainStay Funds: Trustee since 1994 (11 Funds);
MainStay Funds Trust: Trustee since 2007 (37 Funds)***;
MainStay MacKay DefinedTerm Municipal Opportunities Fund: Trustee since 2011; and
MainStay CBRE Global Infrastructure Megatrends Term Fund: Trustee since June 2021 |
| ** | Includes prior service as a Director of MainStay VP Series Fund, Inc., the predecessor to MainStay VP Funds Trust. |
| *** | Includes prior service as a Director/Trustee of certain predecessor entities to MainStay Funds Trust. |
Board of Trustees and Officers (Unaudited) (continued)
| | Name and
Year of Birth | Position(s) Held and
Length of Service | Principal Occupation(s)
During Past Five Years | |
| | | | | |
| | Kirk C. Lehneis
1974 | President, MainStay VP Funds Trust (since 2017) | Chief Operating Officer and Senior Managing Director (since 2016), New York Life Investment Management LLC and New York Life Investment Management Holdings LLC; Member of the Board of Managers (since 2017) and Senior Managing Director (since 2018), NYLIFE Distributors LLC; Chairman of the Board and Senior Managing Director, NYLIM Service Company LLC (since 2017); Trustee, President and Principal Executive Officer of IndexIQ Trust, IndexIQ ETF Trust and IndexIQ Active ETF Trust (since 2018); President, MainStay CBRE Global Infrastructure Megatrends Term Fund (since 2021), MainStay MacKay DefinedTerm Municipal Opportunities Fund, MainStay Funds and MainStay Funds Trust (since 2017); Senior Managing Director, Global Product Development (from 2015 to 2016); Managing Director, Product Development (from 2010 to 2015), New York Life Investment Management LLC | |
| | Jack R. Benintende
1964 | Treasurer and Principal Financial and Accounting Officer, MainStay VP Funds Trust (since 2007)** | Managing Director, New York Life Investment Management LLC (since 2007); Treasurer and Principal Financial and Accounting Officer, MainStay CBRE Global Infrastructure Megatrends Term Fund (since 2021), MainStay MacKay DefinedTerm Municipal Opportunities Fund (since 2011), MainStay Funds Trust (since 2009) and MainStay Funds (since 2007); and Assistant Treasurer, New York Life Investment Management Holdings LLC (2008 to 2012) | |
| | J. Kevin Gao
1967 | Secretary and Chief Legal Officer, MainStay VP Funds Trust (since 2010)** | Managing Director and Associate General Counsel, New York Life Investment Management LLC (since 2010); Secretary and Chief Legal Officer, MainStay CBRE Global Infrastructure Megatrends Term Fund (since 2021), MainStay MacKay DefinedTerm Municipal Opportunities Fund (since 2011), MainStay Funds and MainStay Funds Trust (since 2010) | |
| | Kevin M. Gleason
1967 | Vice President and Chief Compliance Officer, MainStay VP Funds Trust (since June 2022) | Vice President and Chief Compliance Officer, IndexIQ Trust, IndexIQ ETF Trust and IndexIQ Active ETF Trust (since June 2022); Vice President and Chief Compliance Officer, MainStay CBRE Global Infrastructure Megatrends Term Fund, MainStay MacKay DefinedTerm Municipal Opportunities Fund (since June 2022); MainStay Funds Trust and MainStay Funds (since June 2022); Senior Vice President, Voya Investment Management and Chief Compliance Officer, Voya Family of Funds (2012 to 2022) | |
| | Scott T. Harrington
1959 | Vice President— Administration, MainStay VP Funds Trust (since 2005)** | Managing Director, New York Life Investment Management LLC (including predecessor advisory organizations) (since 2000); Member of the Board of Directors, New York Life Trust Company (since 2009); Vice President—Administration, MainStay CBRE Global Infrastructure Megatrends Term Fund (since 2021), MainStay MacKay DefinedTerm Municipal Opportunities Fund (since 2011), MainStay Funds Trust and MainStay Funds (since 2009) | |
| * | The officers listed above are considered to be “interested persons” of the MainStay Group of Funds, MainStay VP Funds Trust, MainStay CBRE Global Infrastructure Megatrends Term Fund and MainStay MacKay DefinedTerm Municipal Opportunities Fund within the meaning of the 1940 Act because of their affiliation with the MainStay Group of Funds, New York Life Insurance Company and/or its affiliates, including New York Life Investment Management LLC, New York Life Insurance Company, NYLIM Service Company LLC, NYLIFE Securities LLC and/or NYLIFE Distributors LLC, as described in detail in the column captioned “Principal Occupation(s) During Past Five Years.” Officers are elected annually by the Board. |
| ** | Includes prior service as an Officer of MainStay VP Series Fund, Inc., the predecessor to MainStay VP Funds Trust. |
Officers of the Trust (Who are not Trustees)*
| 34 | MainStay VP Wellington Mid Cap Portfolio |
MainStay VP Portfolios
MainStay VP offers a wide range of Portfolios. The full array of MainStay VP offerings is listed here, with information about the manager, subadvisors, legal counsel, and independent registered public accounting firm.
Equity
MainStay VP American Century Sustainable Equity Portfolio
MainStay VP Candriam Emerging Markets Equity Portfolio
MainStay VP Epoch U.S. Equity Yield Portfolio
MainStay VP Fidelity Institutional AM® Utilities Portfolio†
MainStay VP Natural Resources Portfolio
MainStay VP PineStone International Equity Portfolio1
MainStay VP S&P 500 Index Portfolio
MainStay VP Small Cap Growth Portfolio
MainStay VP Wellington Growth Portfolio
MainStay VP Wellington Mid Cap Portfolio
MainStay VP Wellington Small Cap Portfolio
MainStay VP Wellington U.S. Equity Portfolio
MainStay VP Winslow Large Cap Growth Portfolio
Mixed Asset
MainStay VP Balanced Portfolio
MainStay VP Income Builder Portfolio
MainStay VP Janus Henderson Balanced Portfolio
MainStay VP MacKay Convertible Portfolio
Income
MainStay VP Bond Portfolio
MainStay VP Floating Rate Portfolio
MainStay VP Indexed Bond Portfolio
MainStay VP MacKay Government Portfolio2
MainStay VP MacKay High Yield Corporate Bond Portfolio
MainStay VP MacKay Strategic Bond Portfolio
MainStay VP PIMCO Real Return Portfolio
Money Market
MainStay VP U.S. Government Money Market Portfolio
Alternative
MainStay VP CBRE Global Infrastructure Portfolio
MainStay VP IQ Hedge Multi-Strategy Portfolio
Asset Allocation
MainStay VP Conservative Allocation Portfolio
MainStay VP Equity Allocation Portfolio
MainStay VP Growth Allocation Portfolio
MainStay VP Moderate Allocation Portfolio
Manager
New York Life Investment Management LLC
New York, New York
Subadvisors
American Century Investment Management, Inc.
Kansas City, Missouri
Brown Advisory LLC
Baltimore, Maryland
Candriam*
Strassen, Luxembourg
CBRE Investment Management Listed Real Assets LLC
Radnor, Pennsylvania
Epoch Investment Partners, Inc.
New York, New York
FIAM LLC
Smithfield, Rhode Island
IndexIQ Advisors LLC*
New York, New York
Janus Henderson Investors US LLC
Denver, Colorado
MacKay Shields LLC*
New York, New York
Newton Investment Management North America, LLC
Boston, Massachusetts
NYL Investors LLC*
New York, New York
Pacific Investment Management Company LLC
Newport Beach, California
PineStone Asset Management Inc.
Montreal, Québec
Segall Bryant & Hamill, LLC
Chicago, Illinois
Wellington Management Company LLP
Boston, Massachusetts
Winslow Capital Management, LLC
Minneapolis, Minnesota
Legal Counsel
Dechert LLP
Washington, District of Columbia
Independent Registered Public Accounting Firm
PricewaterhouseCoopers LLP
New York, New York
Distributor
NYLIFE Distributors LLC*
Jersey City, New Jersey
Custodian
JPMorgan Chase Bank, N.A.
New York, New York
Some Portfolios may not be available in all products.
† Fidelity Institutional AM is a registered trade mark of FMR LLC. Used with permission.
* An affiliate of New York Life Investment Management LLC.
| 1. | Prior to August 28, 2023, the Portfolio's name was MainStay VP MacKay International Equity Portfolio. |
| 2. | Effective on or about May 1, 2024, the MainStay VP MacKay Government Portfolio will be renamed the MainStay VP U.S. Infrastructure Bond Portfolio. |
Not part of the Annual Report
2023 Annual Report
This report is for the general information of New York Life Variable Annuities and NYLIAC Variable Universal Life Insurance Products policyowners. It must be preceded or accompanied by the appropriate product(s) and funds prospectuses if it is given to anyone who is not an owner of a New York Life variable annuity policy or a NYLIAC Variable Universal Life Insurance Product. This report does not offer for sale or solicit orders to purchase securities.
The performance data quoted in this report represents past performance. Past performance is no guarantee of future results. Due to market volatility and other factors, current performance may be lower or higher than the figures shown. The most recent month-end performance summary for your variable annuity or variable life policy is available by calling 800-598-2019 and is updated periodically on newyorklife.com.
The New York Life Variable Annuities and NYLIAC Variable Universal Life Insurance Products are issued by New York Life Insurance and Annuity Corporation (a Delaware Corporation) and distributed by NYLIFE Distributors LLC (Member FINRA/SIPC).
New York Life Insurance Company
New York Life Insurance and Annuity
Corporation (NYLIAC) (A Delaware Corporation)
51 Madison Avenue, Room 551
New York, NY 10010
newyorklife.com
newyorklifeinvestments.com
NYLIFE Distributors LLC, 30 Hudson Street, Jersey City, NJ 07302
New York Life Investment Management LLC is the investment manager to the MainStay VP Funds Trust
©2024 by NYLIFE Distributors LLC. All rights reserved.
You may obtain copies of the Prospectus and the Statement of Additional Information free of charge, upon request, by calling toll-free 800-598-2019 or writing to New York Life Insurance and Annuity Corporation, 51 Madison Avenue, New York, NY 10010.
| Not FDIC Insured | No Bank Guarantee | May Lose Value |
(NYLIAC) NI527
MainStay VP U.S. Government Money Market Portfolio
Message from the President and Annual Report
December 31, 2023
Special Notice:
Beginning in July 2024, new regulations issued by the Securities and Exchange Commission (SEC) will take effect requiring open-end mutual fund companies and ETFs to (1) overhaul the content of their shareholder reports and (2) mail paper copies of the new tailored shareholder reports to shareholders who have not opted to receive these documents electronically.
If you have not yet elected to receive your shareholder reports electronically, please contact your financial intermediary or visit our website.
| Not FDIC/NCUA Insured | Not a Deposit | May Lose Value | No Bank Guarantee | Not Insured by Any Government Agency |
This page intentionally left blank
Message from the President
Against a backdrop of easing inflationary pressures and continued economic growth, stocks and bonds generally gained ground during the 12-month period ended December 31, 2023, despite high levels of volatility and sharp disparities between the performance of the different market sectors.
Although the war in Ukraine, the outbreak of hostilities in the Middle East and several other notable events affected financial assets, inflation, interest rate, and economic growth trends stood at the forefront of market developments during most of the period. As the reporting period began, high levels of inflation already showed signs of easing in the face of aggressive rate hikes by U.S. Federal Reserve (the “Fed”). From a peak of 9.1% in June 2022, the annualized U.S. inflation rate dropped to 6.4% in January, and 3.4% in December 2023. At the same time, the Fed increased the benchmark federal funds rate from 4.25%–4.50% at the beginning of reporting period, to 5.25%–5.50% as of the end of 2023. Despite the increasing cost of capital and tighter lending environment that resulted from rising rates, economic growth remained surprisingly robust, bolstered by high levels of consumer spending, low levels of unemployment and better-than-expected corporate earnings. With the pace of rate increases slowing from the prior year, investors began hoping for an early shift to a looser monetary policy, with stock prices and bond yields reacting as economic data and statements from the Fed either reinforced or undercut those hopes. Following months of hawkish rhetoric, the Fed finally reversed its stance in December 2023, signaling a positive economic outlook with little chance of a recession and a likelihood of rate cuts in 2024.
The S&P 500® Index, a widely regarded benchmark of U.S. market performance, produced strong gains during the reporting period-– recovering all its losses from 2022 and approached new record territory. A preponderance of the Index’s gains were generated by a relatively small number of mega-cap stocks in the information technology, communication services and consumer discretionary sectors that stood to benefit from rapid developments in generative artificial intelligence (“AI”). Value-oriented, interest-rate sensitive and small-capitalization
shares lagged by significant margins, although market strength widened during the closing weeks of the reporting period. Most overseas equity markets trailed the U.S. market, as developed international economies experienced relatively low growth rates, and weak economic conditions in China undermined emerging markets.
Bonds produced generally positive returns, bolstered by attractive and relatively stable yields. The yield on the 10-year Treasury note hit a high of just under 5% in mid-October 2023, ranging between approximately 3.5% and 4.8% for most of the reporting period. The yield curve remained inverted throughout the year, with the 2-year Treasury yield modestly above the 10-year yield. Corporate bond prices trended moderately higher, generally outperforming government securities. After years of low yields and tight credit spreads, the corporate sector benefited from more attractive valuations and income opportunities. Among corporates, markets generally rewarded longer duration and lower credit quality, although an uptick in default rates posed added risks for high-yield corporate bonds. International bond markets produced mixed returns, with emerging-markets issues advancing over their developed-markets counterparts.
The market volatility of recent years reminds us of the constant need for experienced and steadfast portfolio management in the face of uncertainty. New York Life Investments remains dedicated to providing you, as a valued MainStay VP investor, with the guidance, resources and investment solutions you need to pursue your financial goals.
Thank you for trusting us to help meet your investment needs.
Sincerely,
Kirk C. Lehneis
President
The opinions expressed are as of the date of this report and are subject to change. There is no guarantee that any forecast made will come to pass. This material does not constitute investment advice and is not intended as an endorsement of any specific investment. Past performance is no guarantee of future results.
Not part of the Annual Report
Investors should refer to the Portfolio’s Summary Prospectus and/or Prospectus and consider the Portfolio’s investment objectives, strategies, risks, charges and expenses carefully before investing. The Summary Prospectus and/or Prospectus contain this and other information about the Portfolio. You may obtain copies of the Portfolio’s Summary Prospectus, Prospectus and Statement of Additional Information, which includes information about the MainStay VP Funds Trust's Trustees, free of charge, upon request, by calling toll-free 800-598-2019, by writing to New York Life Insurance and Annuity Corporation, 51 Madison Avenue, Room 251, New York, New York 10010 or by sending an email to MainStayShareholdersServices@nylim.com. These documents are also available at newyorklifeinvestments.com/investment-products/vp. Please read the Portfolio's Summary Prospectus and/or Prospectus carefully before investing. MainStay VP Funds Trust portfolios are separate account options which are purchased through a variable insurance or variable annuity contract.
Investment and Performance Comparison (Unaudited)
Performance data quoted represents past performance. Past performance is no guarantee of future results. Because of market volatility and other factors, current performance may be lower or higher than the figures shown. Investment return and principal value will fluctuate, and as a result, when shares are redeemed, they may be worth more or less than their original cost. The performance table and graph do not reflect any deduction of sales charges, mortality and expense charges, contract charges or administrative charges. Please refer to the Performance Summary appropriate for your policy. For performance information current to the most recent month-end, please call 800-598-2019 or visit www.newyorklife.com.
An investment in the Portfolio is not insured or guaranteed by the Federal Deposit Insurance Corporation or any other government agency. Although the Portfolio seeks to preserve the value of your investment at $1.00 per share, it is possible to lose money by investing in the Portfolio.
Performance figures may reflect certain fee waivers and/or expense limitations, without which total returns may have been different. For information on current fee waivers and/or expense limitations (if any), please refer to the Notes to Financial Statements.
| Average Annual Total Returns for the Year-Ended December 31, 2023 |
| Class | Inception
Date1 | One
Year | Five
Years | Ten
Years | Gross
Expense
Ratio2 |
| Initial Class Shares | 1/29/1993 | 4.81% | 1.61% | 0.99% | 0.40% |
| | | | | | |
| 7-Day Current Yield = 5.11%; 7-Day Effective Yield = 5.24%.3 | | | | | |
| 1. | Effective August 26, 2016 and October 14, 2016, the Portfolio modified its principal investment strategies in connection with commencing operations as a "government money market fund." Consequently the performance information may have been different if the current investment strategies had been in effect during the period prior to the Portfolio commencing operations as a "government money market fund." |
| 2. | The gross expense ratios presented reflect the Portfolio’s “Total Annual Portfolio Operating Expenses” from the most recent Prospectus and may differ from other expense ratios disclosed in this report. |
3. Figures are presented as of December 31, 2023. The 7-Day Current Yield is calculated in accordance with securities industry regulations and does not include net capital gains. 7-Day Current Yield may differ slightly from the actual distribution rate of the Portfolio because of the exclusion of distributed capital gains, which are non-recurring. The 7-Day Current Yield more closely reflects the Portfolio's current earnings than do the total return figures. The 7-Day Effective Yield is calculated in accordance with securities industry regulations and does not include net capital gains. The 7-Day Effective Yield assumes reinvestment of dividends for one year.
| Benchmark Performance* | One
Year | Five
Years | Ten
Years |
| Average Lipper Variable Products U.S. Government Money Market Portfolio1 | 4.66% | 1.56% | 0.95% |
| Morningstar Prime Money Market Category Average2 | 4.84 | 1.69 | 1.11 |
| * | Returns for indices reflect no deductions for fees, expenses or taxes, except for foreign withholding taxes where applicable. |
| 1. | The Average Lipper VP U.S. Government Money Market Portfolio is an equally weighted performance average consisting of funds that invest 99.5% of their assets in cash, government securities and/or repurchase agreements that are collateralized solely by government securities or cash, and have a weighted average maturity of 60 days or less. These funds intend to keep a constant net asset value. |
| 2. | The Morningstar Prime Money Market Category Average is representative of funds that invest in short-term money market securities in order to provide a level of current income that is consistent with the preservation of capital. Results are based on average total returns of similar funds with all dividends and capital gain distributions reinvested. |
Cost in Dollars of a $1,000 Investment in MainStay VP U.S. Government Money Market Portfolio (Unaudited)
The example below is intended to describe the fees and expenses borne by shareholders during the six-month period from July 1, 2023 to December 31, 2023, and the impact of those costs on your investment.
Example
As a shareholder of the Portfolio you incur two types of costs: (1) transaction costs, including exchange fees and sales charges (loads) on purchases (as applicable), and (2) ongoing costs, including management fees and other Portfolio expenses (as applicable). This example is intended to help you understand your ongoing costs (in dollars) of investing in the Portfolio and to compare these costs with the ongoing costs of investing in other mutual funds. The example is based on an investment of $1,000 made at the beginning of the six-month period and held for the entire period from July 1, 2023 to December 31, 2023. Shares are only sold in connection with variable life and annuity contracts and the example does not reflect any contract level or transactional fees or expenses. If these costs had been included, your costs would have been higher.
This example illustrates your Portfolio’s ongoing costs in two ways:
Actual Expenses
The second and third data columns in the table below provide information about actual account values and actual expenses. You may use the information in these columns, together with the amount you invested, to estimate the expenses that you paid during the six months ended
December 31, 2023. Simply divide your account value by $1,000 (for example, an $8,600 account value divided by $1,000 = 8.6), then multiply the result by the number under the heading entitled “Expenses Paid During Period” to estimate the expenses you paid on your account during this period.
Hypothetical Example for Comparison Purposes
The fourth and fifth data columns in the table below provide information about hypothetical account values and hypothetical expenses based on the Portfolio’s actual expense ratio and an assumed rate of return of 5% per year before expenses, which is not the Portfolio’s actual return. The hypothetical account values and expenses may not be used to estimate the actual ending account balances or expenses you paid for the six-month period shown. You may use this information to compare the ongoing costs of investing in the Portfolio with the ongoing costs of investing in other mutual funds. To do so, compare this 5% hypothetical example with the 5% hypothetical examples that appear in the shareholder reports of the other mutual funds.
Please note that the expenses shown in the table are meant to highlight your ongoing costs only and do not reflect any transactional costs, such as exchange fees or sales charges (loads). Therefore, the fourth and fifth data columns of the table are useful in comparing ongoing costs only and will not help you determine the relative total costs of owning different funds. In addition, if these transactional costs were included, your costs would have been higher.
| Share Class | Beginning
Account
Value
7/1/23 | Ending Account
Value (Based
on Actual
Returns and
Expenses)
12/31/23 | Expenses
Paid
During
Period1 | Ending Account
Value (Based
on Hypothetical
5% Annualized
Return and
Actual Expenses)
12/31/23 | Expenses
Paid
During
Period1 | Net Expense
Ratio
During
Period2 |
| Initial Class Shares | $1,000.00 | $1,025.70 | $1.43 | $1,023.79 | $1.43 | 0.28% |
| 1. | Expenses are equal to the Portfolio’s annualized expense ratio of each class multiplied by the average account value over the period, divided by 365 and multiplied by 184 (to reflect the six-month period). The table above represents the actual expenses incurred during the six-month period. |
| 2. | Expenses are equal to the Portfolio's annualized expense ratio to reflect the six-month period. |
| 6 | MainStay VP U.S. Government Money Market Portfolio |
Portfolio Composition as of December 31, 2023 (Unaudited)
‡ Less than one-tenth of a percent.
See Portfolio of Investments beginning on page 9 for specific holdings within these categories. The Portfolio's holdings are subject to change.
Portfolio Management Discussion and Analysis (Unaudited)
Questions answered by NYL Investors LLC, the Portfolio’s Subadvisor.
How did MainStay VP U.S. Government Money Market Portfolio perform relative to its peers during the 12 months ended December 31, 2023?
For the 12 months ended December 31, 2023, Initial Class shares of MainStay VP U.S. Government Money Market Portfolio provided a 7-day current yield of 5.11% and a 7-day effective yield of 5.24%. For the 12 months ended December 31, 2023, Initial Class shares of MainStay VP U.S. Government Money Market Portfolio returned 4.81%. For the same period, the Portfolio outperformed the 4.66% return of the Average Lipper Variable Products U.S. Government Money Market Portfolio, and underperformed the 4.84% return of the Morningstar Prime Money Market Category.1
What was the Portfolio’s duration2 strategy during the reporting period?
During the majority of the reporting period, the Portfolio maintained a duration shorter than that of the Bloomberg 1 Month T-Bill Index. Our strategy throughout the reporting period was to keep the duration of the Portfolio as short as possible to stay in front of each U.S. Federal Reserve (“Fed”) monetary policy meeting. We expected that the Fed would tighten monetary policy by raising interest rates at each meeting. The shorter duration profile of the Portfolio allowed us to reinvest maturing securities at higher interest rates after each subsequent meeting. Toward the end of the reporting period, as we became more convinced that the Fed had finished raising rates in this hiking cycle, we extended the Portfolio’s duration, bringing it closer to that of the designated benchmark. As of December 31, 2023, the Portfolio’s duration was 0.08 years compared to a duration of 0.09 years for the Bloomberg 1 Month T-Bill Index.
What specific factors, risks or market forces prompted significant decisions for the Portfolio during the reporting period?
During the reporting period, the Portfolio continued to benefit from upward pressure on interest rates as the Fed tightened monetary policy. The Fed increased rates 100 basis points, lifting yields for commercial paper (“CP”), agency discount notes, U.S. Treasury bills (“T-Bills”) and repo. (A basis point is one one-hundredth of a percentage point.) We kept the weighted average life (“WAL”) of the Portfolio short for the first half of 2023 to benefit from these rate hikes in real time. Toward the end of the year, as it became more apparent that the Fed had finished tightening monetary policy, we extended the WAL of the Portfolio to lock in higher yields for longer as the market started to price in anticipated cuts
in 2024. Supply was not able to keep up with the cash inflows into the money market funds, driving T-Bill and agency discount note rates lower than the effective federal funds rate. CP interest rates remained higher than the effective federal funds rate, providing a yield pickup that was unavailable in T-Bills or agency discount notes.
During the reporting period, which market segments were the strongest contributors to the Portfolio’s performance and which market segments were particularly weak?
During the reporting period, T-Bills provided the Portfolio’s strongest absolute performance. U.S. agency discount notes were also accretive to performance. Within the U.S. agency subcomponent, Tennessee Valley Authority and Federal National Mortgage Association were the best performers. The Portfolio’s allocation to tri-party repo also added to absolute performance.
Within the U.S. agency subcomponent, the Portfolio’s allocation to Federal Farm Credit Banks Funding Corp and Federal Agricultural Mortgage Corporation were the weakest contributors to absolute performance.
Did the Portfolio make any significant purchases or sales during the reporting period?
The top issuers purchased by the Portfolio, outside of T-Bills, included BofA Securities, TD Securities, RBC Capital Markets (New York), Federal Agricultural Mortgage Corp. and Federal Home Loan Banks. Throughout the reporting period, the Portfolio sold T-Bills to cover redemptions and/or any cash shortfalls.
How did the Portfolio’s sector weightings change during the reporting period?
We increased the Portfolio’s allocation to T-Bills from 32% to 50% during the reporting period. Conversely, we decreased the Portfolio’s allocation to agency discount notes from 59% to 34% during the same time frame. During the reporting period, the yield difference (premium) between U.S. agency discount notes and T-Bills tightened considerably as uncertainty regarding the debt ceiling impasse caused T-Bill yields to move higher at a much faster pace than agency discount notes. With the yield premium between T-Bills and agency discount notes essentially flat, we reduced the Portfolio’s agency discount note allocation and added to T-Bills. We increased the Portfolio’s allocation to tri-party repo from 10% to 16% during the reporting period. In addition to these sector weighting changes, we increased the Portfolio’s duration from 0.02 years to 0.08 years.
| 1. | See "Investment and Performance Comparison" for more information on benchmark and peer group returns. |
| 2. | Duration is a measure of the price sensitivity of a fixed-income investment to changes in interest rates. Duration is expressed as a number of years and is considered a more accurate sensitivity gauge than average maturity. |
The opinions expressed are those of the Subadvisor as of the date of this report and are subject to change. There is no guarantee that any forecasts will come to pass. This material does not constitute investment advice and is not intended as an endorsement of any specific investment.
Not all MainStay VP Portfolios and/or share classes are available under all policies.
| 8 | MainStay VP U.S. Government Money Market Portfolio |
Portfolio of Investments December 31, 2023†^
| | Principal
Amount | Value |
| Short-Term Investments 100.0% |
| Government Agency Debt 34.0% |
| Federal Agricultural Mortgage Corp. | | |
| 5.292%, due 2/1/24 | $ 20,000,000 | $ 19,909,411 |
| 5.346%, due 1/25/24 | 15,000,000 | 14,947,000 |
| Federal Farm Credit Banks | | |
| 5.286%, due 1/16/24 | 50,000,000 | 49,890,208 |
| Federal Home Loan Banks | | |
| 5.302%, due 1/8/24 | 50,000,000 | 49,948,764 |
| 5.302%, due 1/10/24 | 25,000,000 | 24,967,062 |
| Federal Home Loan Mortgage Corp. | | |
| 5.252%, due 1/3/24 | 75,000,000 | 74,978,167 |
| Tennessee Valley Authority | | |
| 5.266%, due 1/3/24 | 50,000,000 | 49,985,403 |
| 5.291%, due 1/10/24 | 96,300,000 | 96,172,884 |
Total Government Agency Debt
(Cost $380,798,899) | | 380,798,899 |
| Treasury Debt 49.5% |
| U.S. Treasury Bills (a) | | |
| 5.287%, due 1/16/24 | 103,000,000 | 102,774,252 |
| 5.311%, due 1/11/24 | 99,000,000 | 98,854,855 |
| 5.318%, due 1/9/24 | 43,000,000 | 42,949,596 |
| 5.321%, due 1/23/24 | 111,000,000 | 110,642,009 |
| 5.344%, due 3/19/24 | 200,000,000 | 197,724,567 |
Total Treasury Debt
(Cost $552,945,279) | | 552,945,279 |
| Treasury Repurchase Agreements 16.5% |
BofA Securities, Inc.
5.31%, dated 12/29/23
due 1/2/24
Proceeds at Maturity $95,000,062
(Collateralized by United States Treasury securities with rates between 0.00% and 4.375% and maturity dates between 05/15/26 and 03/31/28, with a Principal Amount of $96,848,000 and a Market Value of $96,900,063) | 95,000,000 | 95,000,000 |
| | Principal
Amount | | Value |
| |
| Treasury Repurchase Agreements (continued) |
RBC Capital Markets LLC
5.32%, dated 12/29/23
due 1/2/24
Proceeds at Maturity $39,150,211
(Collateralized by United States Treasury security with a rate of 5.368% and with maturity date of 07/31/24, with a Principal Amount of $39,618,300 and a Market Value of $39,933,216) | $ 39,127,000 | | $ 39,127,000 |
TD Securities, Inc.
5.32%, dated 12/29/23
due 1/2/24
Proceeds at Maturity $50,000,077
(Collateralized by United States Treasury securities with rates between 1.125% and 4.125% and maturity dates between 02/28/25 and 02/15/30, with a Principal Amount of $54,237,000 and a Market Value of $51,000,079) | 50,000,000 | | 50,000,000 |
Total Treasury Repurchase Agreements
(Cost $184,127,000) | | | 184,127,000 |
Total Short-Term Investments
(Cost $1,117,871,178) | 100.0% | | 1,117,871,178 |
| Other Assets, Less Liabilities | (0.0)‡ | | (194,337) |
| Net Assets | 100.0% | | $ 1,117,676,841 |
| † | Percentages indicated are based on Portfolio net assets. |
| ^ | Industry classifications may be different than those used for compliance monitoring purposes. |
| ‡ | Less than one-tenth of a percent. |
| (a) | Interest rate shown represents yield to maturity. |
The notes to the financial statements are an integral part of, and should be read in conjunction with, the financial statements.
9
Portfolio of Investments December 31, 2023†^ (continued)
The following is a summary of the fair valuations according to the inputs used as of December 31, 2023, for valuing the Portfolio’s assets:
| Description | Quoted
Prices in
Active
Markets for
Identical
Assets
(Level 1) | | Significant
Other
Observable
Inputs
(Level 2) | | Significant
Unobservable
Inputs
(Level 3) | | Total |
| Asset Valuation Inputs | | | | | | | |
| Investments in Securities (a) | | | | | | | |
| Short-Term Investments | | | | | | | |
| Government Agency Debt | $ — | | $ 380,798,899 | | $ — | | $ 380,798,899 |
| Treasury Debt | — | | 552,945,279 | | — | | 552,945,279 |
| Treasury Repurchase Agreements | — | | 184,127,000 | | — | | 184,127,000 |
| Total Investments in Securities | $ — | | $ 1,117,871,178 | | $ — | | $ 1,117,871,178 |
| (a) | For a complete listing of investments and their industries, see the Portfolio of Investments. |
The notes to the financial statements are an integral part of, and should be read in conjunction with, the financial statements.
| 10 | MainStay VP U.S. Government Money Market Portfolio |
Statement of Assets and Liabilities as of December 31, 2023
| Assets |
Investment in securities, at value
(amortized cost $933,744,178) | $ 933,744,178 |
Repurchase agreements, at value
(amortized cost $184,127,000) | 184,127,000 |
| Cash | 415 |
| Receivables: | |
| Interest | 81,550 |
| Other assets | 4,488 |
| Total assets | 1,117,957,631 |
| Liabilities |
| Payables: | |
| Manager (See Note 3) | 245,274 |
| Professional fees | 24,938 |
| Custodian | 10,509 |
| Shareholder communication | 34 |
| Accrued expenses | 35 |
| Total liabilities | 280,790 |
| Net assets | $1,117,676,841 |
| Composition of Net Assets |
| Shares of beneficial interest outstanding (par value of $.001 per share) unlimited number of shares authorized | $ 1,117,567 |
| Additional paid-in-capital | 1,116,548,080 |
| | 1,117,665,647 |
| Total distributable earnings (loss) | 11,194 |
| Net assets | $1,117,676,841 |
| Initial Class | |
| Net assets applicable to outstanding shares | $1,117,676,841 |
| Shares of beneficial interest outstanding | 1,117,567,298 |
| Net asset value per share outstanding | $ 1.00 |
The notes to the financial statements are an integral part of, and should be read in conjunction with, the financial statements.
11
Statement of Operations for the year ended December 31, 2023
| Investment Income (Loss) |
| Income | |
| Interest | $44,534,777 |
| Expenses | |
| Manager (See Note 3) | 3,354,484 |
| Professional fees | 101,245 |
| Shareholder communication | 37,690 |
| Custodian | 25,009 |
| Trustees | 22,250 |
| Miscellaneous | 18,381 |
| Total expenses before waiver/reimbursement | 3,559,059 |
| Expense waiver/reimbursement from Manager (See Note 3) | (1,065,586) |
| Net expenses | 2,493,473 |
| Net investment income (loss) | 42,041,304 |
| Realized Gain (Loss) |
| Net realized gain (loss) on investments | 10,901 |
| Net increase (decrease) in net assets resulting from operations | $42,052,205 |
The notes to the financial statements are an integral part of, and should be read in conjunction with, the financial statements.
| 12 | MainStay VP U.S. Government Money Market Portfolio |
Statements of Changes in Net Assets
for the years ended December 31, 2023 and December 31, 2022
| | 2023 | 2022 |
| Increase (Decrease) in Net Assets |
| Operations: | | |
| Net investment income (loss) | $ 42,041,304 | $ 11,150,568 |
| Net realized gain (loss) | 10,901 | (14,591) |
| Net increase (decrease) in net assets resulting from operations | 42,052,205 | 11,135,977 |
| Distributions to shareholders: | | |
| Initial Class | (42,041,305) | (11,150,567) |
| Capital share transactions: | | |
| Net proceeds from sales of shares | 819,313,638 | 767,061,320 |
| Net asset value of shares issued to shareholders in reinvestment of distributions | 42,041,305 | 11,150,567 |
| Cost of shares redeemed | (601,012,209) | (550,908,451) |
| Increase (decrease) in net assets derived from capital share transactions | 260,342,734 | 227,303,436 |
| Net increase (decrease) in net assets | 260,353,634 | 227,288,846 |
| Net Assets |
| Beginning of year | 857,323,207 | 630,034,361 |
| End of year | $1,117,676,841 | $ 857,323,207 |
The notes to the financial statements are an integral part of, and should be read in conjunction with, the financial statements.
13
Financial Highlights selected per share data and ratios
| | Year Ended December 31, |
| Initial Class | 2023 | | 2022 | | 2021 | | 2020 | | 2019 |
| Net asset value at beginning of year | $ 1.00 | | $ 1.00 | | $ 1.00 | | $ 1.00 | | $ 1.00 |
| Net investment income (loss) | 0.05 | | 0.01 | | 0.00‡ | | 0.00‡ | | 0.02 |
| Net realized and unrealized gain (loss) on investments | 0.00‡ | | 0.00‡ | | 0.00 | | 0.00 | | 0.00 |
| Total from investment operations | 0.05 | | 0.01 | | 0.00‡ | | 0.00‡ | | 0.02 |
| Less distributions: | | | | | | | | | |
| From net investment income | (0.05) | | (0.01) | | (0.00)‡ | | 0.00‡ | | (0.02) |
| Net asset value at end of year | $ 1.00 | | $ 1.00 | | $ 1.00 | | $ 1.00 | | $ 1.00 |
| Total investment return (a) | 4.81% | | 1.29% | | 0.01% | | 0.24% | | 1.78% |
| Ratios (to average net assets)/Supplemental Data: | | | | | | | | | |
| Net investment income (loss) | 4.72% | | 1.40% | | 0.01% | | 0.15% | | 1.78% |
| Net expenses | 0.28% | | 0.24% | | 0.04% | | 0.16% | | 0.44% |
| Expenses (before waiver/reimbursement) | 0.40% | | 0.40% | | 0.41% | | 0.42% | | 0.44% |
| Net assets at end of year (in 000's) | $ 1,117,677 | | $ 857,323 | | $ 630,034 | | $ 827,050 | | $ 396,254 |
| ‡ | Less than one cent per share. |
| (a) | Total return does not reflect any deduction of sales charges, mortality and expense charges, contract charges or administrative charges. For periods of less than one year, total return is not annualized. |
The notes to the financial statements are an integral part of, and should be read in conjunction with, the financial statements.
| 14 | MainStay VP U.S. Government Money Market Portfolio |
Notes to Financial Statements
Note 1–Organization and Business
MainStay VP Funds Trust (the “Fund”) was organized as a Delaware statutory trust on February 1, 2011. The Fund is registered under the Investment Company Act of 1940, as amended (the “1940 Act”), as an open-end management investment company. The Fund is comprised of thirty-one separate series (collectively referred to as the “Portfolios”). These financial statements and notes relate to the MainStay VP U.S. Government Money Market Portfolio (the "Portfolio"), a "diversified” portfolio, as that term is defined in the 1940 Act, as interpreted or modified by regulatory authorities having jurisdiction, from time to time.
Shares of the Portfolio are currently offered to certain separate accounts to fund variable annuity policies and variable universal life insurance policies issued by New York Life Insurance and Annuity Corporation (“NYLIAC”), a wholly-owned subsidiary of New York Life Insurance Company (“New York Life”) and may also be offered to fund variable annuity policies and variable universal life insurance policies issued by other insurance companies. NYLIAC allocates shares of the Portfolio to, among others, certain NYLIAC separate accounts. Shares of the Portfolio are also offered to the MainStay VP Conservative Allocation Portfolio, MainStay VP Moderate Allocation Portfolio, MainStay VP Growth Allocation Portfolio and MainStay VP Equity Allocation Portfolio, which operate as “funds-of-funds," and other variable insurance funds.
The following table lists the Portfolio's share class that has been registered and commenced operations:
| Class | Commenced Operations |
| Initial Class | January 29, 1993 |
Shares of the Portfolio are offered and are redeemed at a price equal to their respective net asset value (“NAV”) per share. No sales or redemption charge is applicable to the purchase or redemption of the Portfolio's shares.
The Portfolio's investment objective is to seek a high level of current income while preserving capital and maintaining liquidity.
Note 2–Significant Accounting Policies
The Portfolio is an investment company and accordingly follows the investment company accounting and reporting guidance of the Financial Accounting Standards Board (“FASB”) Accounting Standards Codification Topic 946 Financial Services—Investment Companies. The Portfolio prepares its financial statements in accordance with generally accepted accounting principles (“GAAP”) in the United States of America and follows the significant accounting policies described below.
(A) Valuation of Shares. Although the Portfolio seeks to preserve a stable $1.00 per share, it cannot guarantee it will do so. You could lose money by investing in the Portfolio. An investment in the Portfolio is not a bank account and is not insured or guaranteed by the Federal Deposit Insurance Corporation or any other government agency. The Portfolio’s sponsor is not required to reimburse the Portfolio for losses, and you
should not expect that the sponsor will provide financial support to the Portfolio at any time, including during periods of market stress.
(B) Securities Valuation. Investments are usually valued as of the close of regular trading on the New York Stock Exchange (the “Exchange”) (generally 4:00 p.m. Eastern time) on each day the Portfolio is open for business (“valuation date”). Securities are valued using the amortized cost method of valuation, unless the use of such method would be inappropriate per the requirements of Rule 2a-7 under the 1940 Act. The amortized cost method involves valuing a security at its cost on the date of purchase and thereafter assuming a constant amortization to maturity of the difference between such cost and the value on maturity date. Amortized cost approximates the current fair value of a security.
Pursuant to Rule 2a-5 under the 1940 Act, the Board of Trustees of the Fund (the "Board") has designated New York Life Investment Management LLC (“New York Life Investments” or the "Manager") as its Valuation Designee (the "Valuation Designee"). The Valuation Designee is responsible for performing fair valuations relating to all investments in the Portfolio’s portfolio for which market quotations are not readily available; periodically assessing and managing material valuation risks; establishing and applying fair value methodologies; testing fair valuation methodologies; evaluating and overseeing pricing services; ensuring appropriate segregation of valuation and portfolio management functions; providing quarterly, annual and prompt reporting to the Board, as appropriate; identifying potential conflicts of interest; and maintaining appropriate records. The Valuation Designee has established a valuation committee ("Valuation Committee") to assist in carrying out the Valuation Designee’s responsibilities and establish prices of securities for which market quotations are not readily available. The Portfolio's and the Valuation Designee's policies and procedures ("Valuation Procedures") govern the Valuation Designee’s selection and application of methodologies for determining and calculating the fair value of Portfolio investments. The Valuation Designee may value the Portfolio's portfolio securities for which market quotations are not readily available and other Portfolio assets utilizing inputs from pricing services and other third-party sources. The Valuation Committee meets (in person, via electronic mail or via teleconference) on an ad-hoc basis to determine fair valuations and on a quarterly basis to review fair value events with respect to certain securities for which market quotations are not readily available, including valuation risks and back-testing results, and to preview reports to the Board.
The Valuation Committee establishes prices of securities for which market quotations are not readily available based on such methodologies and measurements on a regular basis after considering information that is reasonably available and deemed relevant by the Valuation Committee. The Board shall oversee the Valuation Designee and review fair valuation materials on a prompt, quarterly and annual basis and approve proposed revisions to the Valuation Procedures.
Investments for which market quotations are not readily available are valued at fair value as determined in good faith pursuant to the Valuation Procedures. A market quotation is readily available only when that
Notes to Financial Statements (continued)
quotation is a quoted price (unadjusted) in active markets for identical investments that the Portfolio can access at the measurement date, provided that a quotation will not be readily available if it is not reliable. "Fair value" is defined as the price the Portfolio would reasonably expect to receive upon selling an asset or liability in an orderly transaction to an independent buyer in the principal or most advantageous market for the asset or liability. Fair value measurements are determined within a framework that establishes a three-tier hierarchy that maximizes the use of observable market data and minimizes the use of unobservable inputs to establish a classification of fair value measurements for disclosure purposes. "Inputs" refer broadly to the assumptions that market participants would use in pricing the asset or liability, including assumptions about risk, such as the risk inherent in a particular valuation technique used to measure fair value using a pricing model and/or the risk inherent in the inputs for the valuation technique. Inputs may be observable or unobservable. Observable inputs reflect the assumptions market participants would use in pricing the asset or liability based on market data obtained from sources independent of the Portfolio. Unobservable inputs reflect the Portfolio’s own assumptions about the assumptions market participants would use in pricing the asset or liability based on the information available. The inputs or methodology used for valuing assets or liabilities may not be an indication of the risks associated with investing in those assets or liabilities. The three-tier hierarchy of inputs is summarized below.
| • | Level 1—quoted prices (unadjusted) in active markets for an identical asset or liability |
| • | Level 2—other significant observable inputs (including quoted prices for a similar asset or liability in active markets, interest rates and yield curves, prepayment speeds, credit risk, etc.) |
| • | Level 3—significant unobservable inputs (including the Portfolio's own assumptions about the assumptions that market participants would use in measuring fair value of an asset or liability) |
Securities valued at amortized cost are not obtained from a quoted price in an active market and are generally categorized as Level 2 in the hierarchy. The level of an asset or liability within the fair value hierarchy is based on the lowest level of an input, both individually and in the aggregate, that is significant to the fair value measurement. As of December 31, 2023, the aggregate value by input level of the Portfolio’s assets and liabilities is included at the end of the Portfolio of Investments.
The Portfolio may use third-party vendor evaluations, whose prices may be derived from one or more of the following standard inputs, among others:
| • Benchmark yields | • Reported trades |
| • Broker/dealer quotes | • Issuer spreads |
| • Two-sided markets | • Benchmark securities |
| • Bids/offers | • Reference data (corporate actions or material event notices) |
| • Industry and economic events | • Comparable bonds |
| • Monthly payment information | |
An asset or liability for which market values cannot be measured using the methodologies described above is valued by methods deemed reasonable in good faith by the Valuation Committee, following the procedures established by the Board, to represent fair value. Under these procedures, the Portfolio may utilize some of the following fair value techniques: multi-dimensional relational pricing models and option adjusted spread pricing. During the year ended December 31, 2023, there were no material changes to the fair value methodologies. Securities valued in this manner are generally categorized as Level 3 in the hierarchy. No securities held by the Portfolio as of December 31, 2023, were fair valued in such a manner.
Temporary cash investments acquired in excess of 60 days to maturity at the time of purchase are valued using the latest bid prices or using valuations based on a matrix system (which considers such factors as security prices, yields, maturities and ratings), both as furnished by independent pricing services. Temporary cash investments that mature in 60 days or less at the time of purchase ("Short-Term Investments") are valued using the amortized cost method of valuation, unless the use of such method would be inappropriate. The amortized cost method involves valuing a security at its cost on the date of purchase and thereafter assuming a constant amortization to maturity of the difference between such cost and the value on maturity date. Amortized cost approximates the current fair value of a security. Securities valued using the amortized cost method are not valued using quoted prices in an active market and are generally categorized as Level 2 in the hierarchy.
The information above is not intended to reflect an exhaustive list of the methodologies that may be used to value portfolio investments. The Valuation Procedures permit the use of a variety of valuation methodologies in connection with valuing portfolio investments. The methodology used for a specific type of investment may vary based on the market data available or other considerations. The methodologies summarized above may not represent the specific means by which portfolio investments are valued on any particular business day.
(C) Income Taxes. The Portfolio's policy is to comply with the requirements of the Internal Revenue Code of 1986, as amended (the “Internal Revenue Code”), applicable to regulated investment companies and to distribute all of its taxable income to the shareholders of the Portfolio within the allowable time limits.
| 16 | MainStay VP U.S. Government Money Market Portfolio |
The Manager evaluates the Portfolio’s tax positions to determine if the tax positions taken meet the minimum recognition threshold in connection with accounting for uncertainties in income tax positions taken or expected to be taken for the purposes of measuring and recognizing tax liabilities in the financial statements. Recognition of tax benefits of an uncertain tax position is permitted only to the extent the position is “more likely than not” to be sustained assuming examination by taxing authorities. The Manager analyzed the Portfolio's tax positions taken on federal, state and local income tax returns for all open tax years (for up to three tax years) and has concluded that no provisions for federal, state and local income tax are required in the Portfolio's financial statements. The Portfolio's federal, state and local income tax and federal excise tax returns for tax years for which the applicable statutes of limitations have not expired are subject to examination by the Internal Revenue Service and state and local departments of revenue.
(D) Dividends and Distributions to Shareholders. Dividends and distributions are recorded on the ex-dividend date. The Portfolio intends to declare dividends from net investment income, if any, daily and intends to pay them at least monthly and declares and pays distributions from net realized capital and currency gains, if any, at least annually. All dividends and distributions are reinvested at NAV in the same class of shares of the Portfolio. Dividends and distributions to shareholders are determined in accordance with federal income tax regulations and may differ from determinations using GAAP.
(E) Security Transactions and Investment Income. The Portfolio records security transactions on the trade date. Realized gains and losses on security transactions are determined using the identified cost method. Dividend income is recognized on the ex-dividend date, net of any foreign tax withheld at the source, and interest income is accrued as earned using the effective interest rate method. Distributions received from real estate investment trusts may be classified as dividends, capital gains and/or return of capital.
(F) Expenses. Expenses of the Fund are allocated to the individual Funds in proportion to the net assets of the respective Portfolios when the expenses are incurred, except where direct allocations of expenses can be made. The expenses borne by the Portfolio, including those of related parties to the Portfolio, are shown in the Statement of Operations.
(G) Use of Estimates. In preparing financial statements in conformity with GAAP, the Manager makes estimates and assumptions that affect the reported amounts and disclosures in the financial statements. Actual results could differ from those estimates and assumptions.
(H) Repurchase Agreements. The Portfolio may enter into repurchase agreements (i.e., buy a security from another party with the agreement that it will be sold back in the future) to earn income. The Portfolio may enter into repurchase agreements only with counterparties, usually financial institutions, that are deemed by the Manager or the Subadvisor to be creditworthy, pursuant to guidelines established by the Board. During the term of any repurchase agreement, the Manager or the Subadvisor will continue to monitor the creditworthiness of the
counterparty. Under the 1940 Act, repurchase agreements are considered to be collateralized loans by the Portfolio to the counterparty secured by the securities transferred to the Portfolio.
Repurchase agreements are subject to counterparty risk, meaning the Portfolio could lose money by the counterparty’s failure to perform under the terms of the agreement. The Portfolio mitigates this risk by ensuring the repurchase agreement is collateralized by cash, U.S. government securities, fixed income securities and/or other securities. The collateral is held by the Portfolio's custodian and valued daily on a mark to market basis to determine if the value, including accrued interest, exceeds the repurchase price. In the event of the counterparty’s default on the obligation to repurchase, the Portfolio has the right to liquidate the collateral and apply the proceeds in satisfaction of the obligation. Under certain circumstances, such as in the event of default or bankruptcy by the counterparty, realization and/or retention of the collateral may be limited or subject to delay, to legal proceedings and possible realized loss to the Portfolio.
(I) Debt Securities Risk. The ability of issuers of debt securities held by the Portfolio to meet their obligations may be affected by, among other things, economic or political developments in a specific country, industry or region. Debt securities are also subject to the risks associated with changes in interest rates.
Investments in the Portfolio are not guaranteed, even though some of the Portfolio’s underlying investments are guaranteed by the U.S. government or its agencies or instrumentalities. The principal risk of mortgage-related and asset-backed securities is that the underlying debt may be prepaid ahead of schedule, if interest rates fall, thereby reducing the value of the Portfolio’s investment. If interest rates rise, less of the debt may be prepaid and the Portfolio may lose money because the Portfolio may be unable to invest in higher yielding assets. The Portfolio is subject to interest-rate risk and can lose principal value when interest rates rise. Bonds are also subject to credit risk, in which the bond issuer may fail to pay interest and principal in a timely manner.
(J) Indemnifications. Under the Fund’s organizational documents, its officers and trustees are indemnified against certain liabilities that may arise out of performance of their duties to the Fund. Additionally, in the normal course of business, the Portfolio enters into contracts with third-party service providers that contain a variety of representations and warranties and that may provide general indemnifications. The Portfolio's maximum exposure under these arrangements is unknown, as this would involve future claims that may be made against the Portfolio that have not yet occurred. The Manager believes that the risk of loss in connection with these potential indemnification obligations is remote. However, there can be no assurance that material liabilities related to such obligations will not arise in the future, which could adversely impact the Portfolio.
Notes to Financial Statements (continued)
Note 3–Fees and Related Party Transactions
(A) Manager and Subadvisor. New York Life Investments, a registered investment adviser and an indirect, wholly-owned subsidiary of New York Life, serves as the Portfolio's Manager pursuant to an Amended and Restated Management Agreement ("Management Agreement"). The Manager provides offices, conducts clerical, recordkeeping and bookkeeping services and keeps most of the financial and accounting records required to be maintained by the Portfolio. Except for the portion of salaries and expenses that are the responsibility of the Portfolio, the Manager pays the salaries and expenses of all personnel affiliated with the Portfolio and certain operational expenses of the Portfolio. The Portfolio reimburses New York Life Investments in an amount equal to the portion of the compensation of the Chief Compliance Officer attributable to the Portfolio. NYL Investors LLC ("NYL Investors" or ''Subadvisor''), a registered investment adviser and a direct, wholly-owned subsidiary of New York Life, serves as the Subadvisor to the Portfolio and is responsible for the day-to-day portfolio management of the Portfolio. Pursuant to the terms of a Subadvisory Agreement between New York Life Investments and NYL Investors, New York Life Investments pays for the services of the Subadvisor.
The Fund, on behalf of the Portfolio, pays New York Life Investments in its capacity as the Portfolio’s investment manager and administrator, pursuant to the Management Agreement, a monthly fee for the services performed and the facilities furnished at an annual rate of 0.40% up to $500 million; 0.35% from $500 million to $1 billion; and 0.30% in excess of $1 billion.
New York Life Investments has contractually agreed to waive fees and/or reimburse expenses so that total annual operating expenses (excluding taxes, interest, litigation, extraordinary expenses, brokerage and other transaction expenses relating to the purchase or sale of portfolio investments and acquired (underlying) fund fees and expenses) of Initial Class shares do not exceed 0.28% of average daily net assets. This agreement will remain in effect until May 1, 2024 and shall renew automatically for one-year terms unless New York Life Investments provides written notice of termination prior to the start of the next term or upon approval of the Board. During the year ended December 31, 2023, the effective management fee rate was 0.38%.
New York Life Investments may voluntarily waive fees or reimburse expenses of the Fund to the extent it deems appropriate to enhance the yield of the Fund’s during periods when expenses have a significant impact on the yield of the Fund, as applicable, because of low interest rates. This expense limitation policy is voluntary and in addition to any contractual arrangements that may be in place with respect to the Fund and described in the Fund’s prospectus.
During the year ended December 31, 2023, New York Life Investments earned fees from the Portfolio in the amount of $3,354,484 and paid the Subadvisor in the amount of $1,144,449. Additionally, New York Life Investments reimbursed expenses in the amount of $1,065,586, without which the Portfolio's total returns would have been lower.
JPMorgan Chase Bank, N.A. ("JPMorgan") provides sub-administration and sub-accounting services to the Portfolio pursuant to an agreement with New York Life Investments. These services include calculating the daily NAVs of the Portfolio, maintaining the general ledger and sub-ledger accounts for the calculation of the Portfolio's NAVs, and assisting New York Life Investments in conducting various aspects of the Portfolio's administrative operations. For providing these services to the Portfolio, JPMorgan is compensated by New York Life Investments.
Pursuant to an agreement between the Fund and New York Life Investments, New York Life Investments is responsible for providing or procuring certain regulatory reporting services for the Portfolio. The Portfolio will reimburse New York Life Investments for the actual costs incurred by New York Life Investments in connection with providing or procuring these services for the Portfolio.
Note 4-Federal Income Tax
The amortized cost also represents the aggregate cost for federal income tax purposes.
As of December 31, 2023, the components of accumulated gain (loss) on a tax basis were as follows:
Ordinary
Income | Accumulated
Capital
and Other
Gain (Loss) | Other
Temporary
Differences | Unrealized
Appreciation
(Depreciation) | Total
Accumulated
Gain (Loss) |
| $14,884 | $(3,690) | $— | $— | $11,194 |
As of December 31, 2023, for federal income tax purposes, capital loss carryforwards of $3,690, as shown in the table below, were available to the extent provided by the regulations to offset future realized gains of the Portfolio. Accordingly, no capital gains distributions are expected to be paid to shareholders until net gains have been realized in excess of such amounts.
Capital Loss
Available Through | Short-Term
Capital Loss
Amounts (000’s) | Long-Term
Capital Loss
Amounts (000’s) |
| Unlimited | $4 | $— |
The Portfolio utilized $10,901 of capital loss carryforwards during the year ended December 31, 2023.
During the years ended December 31, 2023 and December 31, 2022, the tax character of distributions paid as reflected in the Statements of Changes in Net Assets was as follows:
| | 2023 | 2022 |
| Distributions paid from: | | |
| Ordinary Income | $42,041,305 | $11,150,567 |
| 18 | MainStay VP U.S. Government Money Market Portfolio |
Note 5–Custodian
JPMorgan is the custodian of cash and securities held by the Portfolio. Custodial fees are charged to the Portfolio based on the Portfolio's net assets and/or the market value of securities held by the Portfolio and the number of certain transactions incurred by the Portfolio.
Note 6–Capital Share Transactions
Transactions in capital shares for the years ended December 31, 2023 and December 31, 2022, were as follows:
| Initial Class (at $1 per share) | Shares |
| Year ended December 31, 2023: | |
| Shares sold | 819,231,716 |
| Shares issued to shareholders in reinvestment of distributions | 42,038,318 |
| Shares redeemed | (600,952,109) |
| Net increase (decrease) | 260,317,925 |
| Year ended December 31, 2022: | |
| Shares sold | 766,984,622 |
| Shares issued to shareholders in reinvestment of distributions | 11,149,452 |
| Shares redeemed | (550,853,367) |
| Net increase (decrease) | 227,280,707 |
Note 7–Other Matters
As of the date of this report, the Portfolio faces a heightened level of risk associated with current uncertainty, volatility and state of economies, financial markets, rising interest rates, and labor and health conditions around the world. Events such as war, acts of terrorism, recessions, rapid inflation, the imposition of international sanctions, earthquakes, hurricanes, epidemics and pandemics and other unforeseen natural or human disasters may have broad adverse social, political and economic effects on the global economy, which could negatively impact the value of the Portfolio's investments. Developments that disrupt global economies and financial markets may magnify factors that affect the Portfolio's performance.
On July 12, 2023, the SEC adopted certain amendments to the regulatory requirements for money market funds, including the Portfolio. In particular, the SEC, among other things, amended Rule 2a-7 under the 1940 Act to remove the ability of a money market fund to impose a redemption gate (except as part of a liquidation), while preserving the discretion to impose liquidity fees for non-government money market funds, such as the Portfolio (without regard to weekly liquid asset levels). Prior to these amendments, the Portfolio was permitted to impose a liquidity fee and/or redemption gate if the Portfolio invested less than 30% of its total assets in weekly liquid assets. The Portfolio is no longer permitted to temporarily impose a redemption gate, except as part of its liquidation, and the Portfolio may subject redemptions to a liquidity fee of up to 2% without regard to the Portfolio's level of weekly liquid assets if the Portfolio's Board of Trustees believes such fee to be in the best interest of the Portfolio.
Note 8–Subsequent Events
In connection with the preparation of the financial statements of the Portfolio as of and for the year ended December 31, 2023, events and transactions subsequent to December 31, 2023, through the date the financial statements were issued, have been evaluated by the Manager for possible adjustment and/or disclosure. No subsequent events requiring financial statement adjustment or disclosure have been identified.
Report of Independent Registered Public Accounting Firm
To the Board of Trustees of MainStay VP Funds Trust and Shareholders of MainStay VP U.S. Government Money Market Portfolio
Opinion on the Financial Statements
We have audited the accompanying statement of assets and liabilities, including the portfolio of investments, of MainStay VP U.S. Government Money Market Portfolio (one of the portfolios constituting MainStay VP Funds Trust, referred to hereafter as the “Portfolio”) as of December 31, 2023, the related statement of operations for the year ended December 31, 2023, the statements of changes in net assets for each of the two years in the period ended December 31, 2023, including the related notes, and the financial highlights for each of the five years in the period ended December 31, 2023 (collectively referred to as the “financial statements”). In our opinion, the financial statements present fairly, in all material respects, the financial position of the Portfolio as of December 31, 2023, the results of its operations for the year then ended, the changes in its net assets for each of the two years in the period ended December 31, 2023 and the financial highlights for each of the five years in the period ended December 31, 2023 in conformity with accounting principles generally accepted in the United States of America.
Basis for Opinion
These financial statements are the responsibility of the Portfolio’s management. Our responsibility is to express an opinion on the Portfolio’s financial statements based on our audits. We are a public accounting firm registered with the Public Company Accounting Oversight Board (United States) (PCAOB) and are required to be independent with respect to the Portfolio in accordance with the U.S. federal securities laws and the applicable rules and regulations of the Securities and Exchange Commission and the PCAOB.
We conducted our audits of these financial statements in accordance with the standards of the PCAOB. Those standards require that we plan and perform the audit to obtain reasonable assurance about whether the financial statements are free of material misstatement, whether due to error or fraud.
Our audits included performing procedures to assess the risks of material misstatement of the financial statements, whether due to error or fraud, and performing procedures that respond to those risks. Such procedures included examining, on a test basis, evidence regarding the amounts and disclosures in the financial statements. Our audits also included evaluating the accounting principles used and significant estimates made by management, as well as evaluating the overall presentation of the financial statements. Our procedures included confirmation of securities owned as of December 31, 2023 by correspondence with the custodian and brokers. We believe that our audits provide a reasonable basis for our opinion.
/s/PricewaterhouseCoopers LLP
New York, New York
February 26, 2024
We have served as the auditor of one or more investment companies in the MainStay group of funds since 1984.
| 20 | MainStay VP U.S. Government Money Market Portfolio |
Board Consideration and Approval of Management Agreement and Subadvisory Agreement (Unaudited)
The continuation of the Management Agreement with respect to the MainStay VP U.S. Government Money Market Portfolio (“Portfolio”) and New York Life Investment Management LLC (“New York Life Investments”) and the Subadvisory Agreement between New York Life Investments and NYL Investors LLC (“NYL Investors”) with respect to the Portfolio (together, “Advisory Agreements”) is subject to annual review and approval by the Board of Trustees of MainStay VP Funds Trust (“Board” of the “Trust”) in accordance with Section 15 of the Investment Company Act of 1940, as amended (“1940 Act”). At its December 6–7, 2023 meeting, the Board, including the Trustees who are not an “interested person” (as such term is defined in the 1940 Act) of the Trust (“Independent Trustees”) voting separately, unanimously approved the continuation of each of the Advisory Agreements for a one-year period.
In reaching the decision to approve the continuation of each of the Advisory Agreements, the Board considered information and materials furnished by New York Life Investments and NYL Investors in connection with an annual contract review process undertaken by the Board that took place at meetings of the Board and its Contracts Committee from September 2023 through December 2023, including information and materials furnished by New York Life Investments and NYL Investors in response to requests prepared on behalf of the Board, and in consultation with the Independent Trustees, by independent legal counsel to the Independent Trustees, which encompassed a variety of topics, including those summarized below. Information and materials requested by and furnished to the Board for consideration in connection with the contract review process included, among other items, reports on the Portfolio and “peer funds” prepared by Institutional Shareholder Services Inc. (“ISS”), an independent third-party service provider engaged by the Board to report objectively on the Portfolio’s investment performance, management fee and total expenses. The Board also considered information on the fees charged to other investment advisory clients of New York Life Investments and/or NYL Investors that follow investment strategies similar to those of the Portfolio, if any, and, when applicable, the rationale for differences in the Portfolio’s management and subadvisory fees and the fees charged to those other investment advisory clients. In addition, the Board considered information regarding the legal standards and fiduciary obligations applicable to its consideration of the continuation of each of the Advisory Agreements. The contract review process, including the structure and format for information and materials provided to the Board, has been developed in consultation with the Board. The Independent Trustees also met in executive sessions with their independent legal counsel and, for portions thereof, with senior management of New York Life Investments.
The Board’s deliberations with respect to the continuation of each of the Advisory Agreements reflect a year-long process, and the Board also took into account information furnished to the Board and its Committees throughout the year, as deemed relevant and appropriate by the Trustees, including, among other items, reports on investment performance of the Portfolio and investment-related matters for the Portfolio as well as presentations from New York Life Investments and, generally annually, NYL Investors personnel. In addition, the Board took into
account other information provided by New York Life Investments throughout the year, including, among other items, periodic reports on legal and compliance matters, risk management, portfolio turnover, brokerage commissions and non-advisory services provided to the Portfolio by New York Life Investments, as deemed relevant and appropriate by the Trustees.
In addition to information provided to the Board throughout the year, the Board received information in connection with its June 2023 meeting provided specifically in response to requests prepared on behalf of the Board, and in consultation with the Independent Trustees, by independent legal counsel to the Independent Trustees regarding the Portfolio’s distribution arrangements. In addition, the Board received information regarding the Portfolio’s asset levels and share purchase and redemption activity, among other information.
In considering the continuation of each of the Advisory Agreements, the Trustees reviewed and evaluated the information and factors they believed to reasonably be necessary and appropriate in light of legal advice furnished to them by independent legal counsel to the Independent Trustees and through the exercise of their own business judgment. Although individual Trustees may have weighed certain factors or information differently and the Board did not consider any single factor or information controlling in reaching its decision, the factors that figured prominently in the Board’s consideration of the continuation of each of the Advisory Agreements are summarized in more detail below and include, among other factors: (i) the nature, extent and quality of the services provided to the Portfolio by New York Life Investments and NYL Investors; (ii) the qualifications of the portfolio managers of the Portfolio and the historical investment performance of the Portfolio, New York Life Investments and NYL Investors; (iii) the costs of the services provided, and profits realized, by New York Life Investments and NYL Investors with respect to their relationships with the Portfolio; (iv) the extent to which economies of scale have been realized or may be realized if the Portfolio grows and the extent to which any economies of scale have been shared, have benefited or may benefit the Portfolio’s shareholders; and (v) the reasonableness of the Portfolio’s management and subadvisory fees and total ordinary operating expenses. Although the Board recognized that comparisons between the Portfolio’s fees and expenses and those of other funds are imprecise given different terms of agreements, variations in fund strategies and other factors, the Board considered the reasonableness of the Portfolio’s management fee and total ordinary operating expenses as compared to the peer funds identified by ISS. Throughout their considerations, the Trustees acknowledged the commitment of New York Life Investments and its affiliates to serve the MainStay Group of Funds, as well as their capacity, experience, resources, financial stability and reputations. The Trustees also acknowledged the entrepreneurial and other risks assumed by New York Life Investments in sponsoring and managing the Portfolio. With respect to the Subadvisory Agreement, the Board took into account New York Life Investments’ recommendation to approve the continuation of the Subadvisory Agreement.
Board Consideration and Approval of Management Agreement and Subadvisory Agreement (Unaudited) (continued)
The Trustees noted that, throughout the year, the Trustees are afforded an opportunity to ask questions of, and request additional information or materials from, New York Life Investments and NYL Investors. The Board’s decision with respect to each of the Advisory Agreements may have also been based, in part, on the Board’s knowledge of New York Life Investments and NYL Investors resulting from, among other things, the Board’s consideration of each of the Advisory Agreements in prior years, the advisory agreements for other funds in the MainStay Group of Funds, the Board’s review throughout the year of the performance and operations of other funds in the MainStay Group of Funds and each Trustee’s business judgment and industry experience. In addition to considering the above-referenced factors, the Board observed that in the marketplace, notably under variable life insurance policies and variable annuity contracts for which the Portfolio serves as an investment option, there are a range of investment options available to investors and that the Portfolio’s shareholders, having had the opportunity to consider other investment options, have invested in the Portfolio.
The factors that figured prominently in the Board’s decision to approve the continuation of each of the Advisory Agreements during the Board’s December 6–7, 2023 meeting are summarized in more detail below.
Nature, Extent and Quality of Services Provided by New York Life Investments and NYL Investors
The Board examined the nature, extent and quality of the services that New York Life Investments provides to the Portfolio. The Board evaluated New York Life Investments’ experience and capabilities in serving as manager of the Portfolio and considered that the Portfolio operates in a “manager-of-managers” structure. The Board also considered New York Life Investments’ responsibilities and services provided pursuant to this structure, including overseeing the services provided by NYL Investors, evaluating the performance of NYL Investors, making recommendations to the Board as to whether the Subadvisory Agreement should be renewed, modified or terminated and periodically reporting to the Board regarding the results of New York Life Investments’ evaluation and monitoring functions. The Board noted that New York Life Investments manages other mutual funds, serves a variety of other investment advisory clients, including other pooled investment vehicles, and has experience overseeing mutual fund service providers, including subadvisors. The Board considered the experience of senior personnel at New York Life Investments providing management and administrative and other non-advisory services to the Portfolio. The Board observed that New York Life Investments devotes significant resources and time to providing management and administrative and other non-advisory services to the Portfolio, including New York Life Investments’ oversight and due diligence reviews of NYL Investors and ongoing analysis of, and interactions with, NYL Investors with respect to, among other things, the Portfolio’s investment performance and risks as well as NYL Investors’ investment capabilities and subadvisory services with respect to the Portfolio.
The Board also considered the range of services that New York Life Investments provides to the Portfolio under the terms of the Management Agreement, including: (i) fund accounting and ongoing supervisory services provided by New York Life Investments’ Fund Administration and Accounting Group; (ii) investment supervisory and analytical services provided by New York Life Investments’ Investment Consulting Group; (iii) compliance services provided by the Trust’s Chief Compliance Officer as well as New York Life Investments’ compliance department, including supervision and implementation of the Portfolio’s compliance program; (iv) legal services provided by New York Life Investments’ Office of the General Counsel; and (v) risk management monitoring and analysis by compliance and investment personnel. In addition, the Board considered New York Life Investments’ willingness to invest in personnel and other resources, such as cyber security, information security and business continuity planning, that may benefit the Portfolio and noted that New York Life Investments is responsible for compensating the Trust’s officers, except for a portion of the salary of the Trust’s Chief Compliance Officer. The Board recognized that New York Life Investments provides certain other non-advisory services to the Portfolio and has over time provided an increasingly broad array of non-advisory services to the MainStay Group of Funds as a result of regulatory and other developments.
The Board also examined the range, and the nature, extent and quality, of the investment advisory services that NYL Investors provides to the Portfolio and considered the terms of each of the Advisory Agreements. The Board evaluated NYL Investors’ experience and performance in serving as subadvisor to the Portfolio and advising other portfolios and NYL Investors’ track record and experience in providing investment advisory services as well as the experience of investment advisory, senior management and administrative personnel at NYL Investors. The Board considered New York Life Investments’ and NYL Investors’ overall resources, legal and compliance environment, capabilities, reputation, financial condition and history. In addition to information provided in connection with quarterly meetings with the Trust’s Chief Compliance Officer, the Board considered information regarding the compliance policies and procedures of New York Life Investments and NYL Investors and acknowledged their commitment to further developing and strengthening compliance programs that may relate to the Portfolio. The Board also considered NYL Investors’ ability to recruit and retain qualified investment professionals and willingness to invest in personnel and other resources that may benefit the Portfolio. In this regard, the Board considered the qualifications and experience of the Portfolio’s portfolio managers, the number of accounts managed by the portfolio managers and the method for compensating the portfolio managers.
In addition, the Board considered information provided by New York Life Investments and NYL Investors regarding their respective business continuity and disaster recovery plans.
Based on these considerations, among others, the Board concluded that the Portfolio would likely continue to benefit from the nature, extent and quality of these services.
| 22 | MainStay VP U.S. Government Money Market Portfolio |
Investment Performance
In evaluating the Portfolio’s investment performance, the Board considered investment performance results over various periods in light of the Portfolio’s investment objective, strategies and risks. The Board considered investment reports on, and analysis of, the Portfolio’s performance provided to the Board throughout the year. These reports include, among other items, information on the Portfolio’s gross and net returns, the Portfolio’s investment performance compared to a relevant investment category and the Portfolio’s benchmark, the Portfolio’s risk-adjusted investment performance and the Portfolio’s investment performance as compared to peer funds, as appropriate, as well as portfolio attribution information and commentary on the effect of market conditions. The Board also considered information provided by ISS showing the investment performance of the Portfolio as compared to peer funds. In addition, the Board reviewed the methodology used by ISS to construct the group of peer funds for comparative purposes.
The Board also took into account its discussions with senior management at New York Life Investments concerning the Portfolio’s investment performance over various periods as well as discussions between representatives of NYL Investors and the members of the Board’s Investment Committee, which generally occur on an annual basis.
Based on these considerations, among others, the Board concluded that its review of the Portfolio’s investment performance and related information supported a determination to approve the continuation of each of the Advisory Agreements.
Costs of the Services Provided, and Profits and Other Benefits Realized, by New York Life Investments and NYL Investors
The Board considered the costs of the services provided under each of the Advisory Agreements. The Board also considered the profitability of New York Life Investments and its affiliates, including NYL Investors, due to their relationships with the Portfolio as well as by New York Life Investments and its affiliates due to their relationships with the MainStay Group of Funds. Because NYL Investors is an affiliate of New York Life Investments whose subadvisory fee is paid by New York Life Investments, not the Portfolio, the Board considered cost and profitability information for New York Life Investments and NYL Investors in the aggregate.
In addition, the Board acknowledged the difficulty in obtaining reliable comparative data about mutual fund managers’ profitability because such information generally is not publicly available and may be impacted by numerous factors, including the structure of a fund manager’s organization, the types of funds it manages, the methodology used to allocate certain fixed costs to specific funds and the manager’s capital structure and costs of capital.
In evaluating the costs of the services provided by New York Life Investments and NYL Investors, and profitability of New York Life Investments and its affiliates, including NYL Investors due to their relationships with the Portfolio, the Board considered, among other
factors, New York Life Investments’ and its affiliates’, including NYL Investors’, continuing investments in, or willingness to invest in, personnel and other resources that may support and further enhance the management of the Portfolio, and that New York Life Investments is responsible for paying the subadvisory fee for the Portfolio. The Board also considered the financial resources of New York Life Investments and NYL Investors and acknowledged that New York Life Investments and NYL Investors must be in a position to recruit and retain experienced professional personnel and to maintain a strong financial position for New York Life Investments and NYL Investors to continue to provide high-quality services to the Portfolio. The Board recognized that the Portfolio benefits from the allocation of certain fixed costs among the funds in the MainStay Group of Funds, among other expected benefits resulting from its relationship with New York Life Investments.
The Board considered information regarding New York Life Investments’ methodology for calculating profitability and allocating costs provided by New York Life Investments in connection with the fund profitability analysis presented to the Board. The Board concluded that New York Life Investments’ methods for allocating costs and procedures for estimating overall profitability of the relationship with the funds in the MainStay Group of Funds were reasonable. The Board recognized the difficulty in calculating and evaluating a manager’s profitability with respect to the Portfolio and considered that other profitability methodologies may also be reasonable.
The Board also considered certain fall-out benefits that may be realized by New York Life Investments and its affiliates, including NYL Investors, due to their relationships with the Portfolio, including reputational and other indirect benefits. In addition, the Board considered the potential dividend received tax deduction for insurance company affiliates of New York Life Investments from the Portfolio’s securities lending activity.
The Board noted that the Portfolio serves as an investment option primarily under variable contracts issued by affiliates of New York Life Investments that would receive fees under those contracts. The Board observed that, in addition to fees earned by New York Life Investments under the Management Agreement for managing the Portfolio, New York Life Investments’ affiliates also earn revenues from serving the Portfolio in various other capacities. The Board considered information about these other revenues and their impact on the profitability of the relationship with the Portfolio to New York Life Investments and its affiliates. The Board noted that, although it assessed the overall profitability of the relationship with the Portfolio to New York Life Investments and its affiliates as part of the contract review process, when considering the reasonableness of the fee paid to New York Life Investments under the Management Agreement, the Board considered the profitability of New York Life Investments’ relationship with the Portfolio on a pre-tax basis and without regard to distribution expenses incurred by New York Life Investments from its own resources.
After evaluating the information deemed relevant by the Trustees, the Board concluded that any profits realized by New York Life Investments and its affiliates, including NYL Investors, due to their relationships with
Board Consideration and Approval of Management Agreement and Subadvisory Agreement (Unaudited) (continued)
the Portfolio were not excessive and other expected benefits that may accrue to New York Life Investments and its affiliates, including NYL Investors, are reasonable.
Management and Subadvisory Fees and Total Ordinary Operating Expenses
The Board evaluated the reasonableness of the fee paid under each of the Advisory Agreements and the Portfolio’s total ordinary operating expenses. With respect to the management fee and subadvisory fee, the Board primarily considered the reasonableness of the management fee paid by the Portfolio to New York Life Investments because the subadvisory fee paid to NYL Investors is paid by New York Life Investments, not the Portfolio. The Board also considered the reasonableness of the subadvisory fee paid by New York Life Investments and the amount of the management fee retained by New York Life Investments.
In assessing the reasonableness of the Portfolio’s fees and expenses, the Board primarily considered comparative data provided by ISS on the fees and expenses of similar mutual funds managed by other investment advisers. The Board reviewed the methodology used by ISS to construct the group of peer funds for comparative purposes. In addition, the Board considered information provided by New York Life Investments and NYL Investors on fees charged to other investment advisory clients, including institutional separate accounts and/or other funds, that follow investment strategies similar to those of the Portfolio, if any. The Board considered the contractual management fee schedule for the Portfolio as compared to those for such other investment advisory clients, taking into account the rationale for differences in fee schedules. The Board also took into account information provided by New York Life Investments about the more extensive scope of services provided to registered investment companies, such as the Portfolio, as compared with other investment advisory clients. Additionally, the Board considered the impact of contractual breakpoints, voluntary waivers and expense limitation arrangements on the Portfolio’s net management fee and expenses. The Board also considered that in proposing fees for the Portfolio, New York Life Investments considers the competitive marketplace for mutual funds.
Based on the factors outlined above, among other considerations, the Board concluded that the Portfolio’s management fee and total ordinary operating expenses are within a range that is competitive and support a conclusion that these fees and expenses are reasonable.
Economies of Scale
The Board considered information regarding economies of scale, including whether economies of scale may exist with respect to the Portfolio and whether the Portfolio’s management fee and expense structure permits any economies of scale to be appropriately shared with the Portfolio’s shareholders. The Board also considered a report from New York Life Investments, previously prepared at the request of the Board, that addressed economies of scale, including with respect to the
mutual fund business generally, and the various ways in which the benefits of economies of scale may be shared with the funds in the MainStay Group of Funds. Although the Board recognized the difficulty of determining economies of scale with precision, the Board acknowledged that economies of scale may be shared with the Portfolio in a number of ways, including, for example, through the imposition of fee breakpoints, initially setting management fee rates at scale or making additional investments to enhance the services provided to the Portfolio. The Board reviewed information from New York Life Investments showing how the Portfolio’s management fee schedule compared to fee schedules of other funds and accounts managed by New York Life Investments. The Board also reviewed information from ISS showing how the Portfolio’s management fee schedule compared with fees paid for similar services by peer funds at varying asset levels.
Based on this information, the Board concluded that economies of scale are appropriately shared for the benefit of the Portfolio’s shareholders through the Portfolio’s management fee and expense structure and other methods to share benefits from economies of scale.
Conclusion
On the basis of the information and factors summarized above, among other information and factors deemed relevant by the Trustees, and the evaluation thereof, the Board, including the Independent Trustees voting separately, unanimously voted to approve the continuation of each of the Advisory Agreements.
| 24 | MainStay VP U.S. Government Money Market Portfolio |
Proxy Voting Policies and Procedures and Proxy Voting Record
The Portfolio is required to file with the SEC its proxy voting record for the 12-month period ending June 30 on Form N-PX. A description of the policies and procedures that are used to vote proxies relating to portfolio securities of the Portfolio is available free of charge upon request by calling 800-598-2019 or visiting the SEC's website at www.sec.gov. The most recent Form N-PX or proxy voting record is available free of charge upon request by calling 800-598-2019; visiting https://www.newyorklifeinvestments.com/investment-products/vp; or visiting the SEC’s website at www.sec.gov.
Shareholder Reports and Quarterly Portfolio Disclosure
The Portfolio is required to file a Form N-MFP every month disclosing its portfolio holdings. The Portfolio's Form N-MFP is available free of charge upon request by calling 800-598-2019 or by visiting the SEC’s website at www.sec.gov.
Board of Trustees and Officers (Unaudited)
The Trustees and officers of the Portfolio are listed below. The Board oversees the MainStay Group of Funds (which consists of MainStay Funds and MainStay Funds Trust), MainStay VP Funds Trust, MainStay MacKay DefinedTerm Municipal Opportunities Fund, MainStay CBRE Global Infrastructure Megatrends Term Fund, the Manager and the Subadvisors, and elects the officers of the Portfolios who are responsible for the day-to-day operations of the Portfolio. Information pertaining to the Trustees and officers is set forth below. Each Trustee serves until his or her successor is elected and qualified or until his or her resignation,
death or removal. Under the Board’s retirement policy, unless an exception is made, a Trustee must tender his or her resignation by the end of the calendar year during which he or she reaches the age of 75. Officers are elected annually by the Board. The business address of each Trustee and officer listed below is 51 Madison Avenue, New York, New York 10010. A majority of the Trustees are not “interested persons” (as defined by the 1940 Act and rules adopted by the SEC thereunder) of the Portfolio (“Independent Trustees”).
| | Name and
Year of Birth | Term of Office,
Position(s) Held and
Length of Service | Principal Occupation(s)
During Past Five Years | Number of
Portfolios in
Fund Complex
Overseen by
Trustee | Other Directorships
Held by Trustee |
| | | | | | |
| | Naïm Abou-Jaoudé*
1966 | MainStay VP Funds Trust: Trustee since 2023 | Chief Executive Officer of New York Life Investment Management LLC (since 2023). Chief Executive Officer of Candriam (an affiliate of New York Life Investment Management LLC) (2007 to 2023). | 81 | MainStay Funds: Trustee since 2023 (11 Funds)
MainStay Funds Trust: Trustee since 2023 (37 Funds);
MainStay MacKay DefinedTerm Municipal Opportunities Fund: Trustee since 2023;
MainStay CBRE Global Infrastructure Megatrends Term Fund: Trustee since 2023; and
New York Life Investment Management International (Chair) since 2015 |
| * | This Trustee is considered to be an “interested person” of the MainStay Group of Funds, MainStay VP Funds Trust, MainStay CBRE Global Infrastructure Megatrends Term Fund and MainStay MacKay DefinedTerm Municipal Opportunities Fund, within the meaning of the 1940 Act because of his affiliation with New York Life Investment Management LLC and Candriam, as described in detail above in the column entitled “Principal Occupation(s) During Past Five Years.” |
| | |
| 26 | MainStay VP U.S. Government Money Market Portfolio |
| | Name and
Year of Birth | Term of Office,
Position(s) Held and
Length of Service | Principal Occupation(s)
During Past Five Years | Number of
Portfolios in
Fund Complex
Overseen by
Trustee | Other Directorships
Held by Trustee |
| | | | | | |
| | David H. Chow
1957 | MainStay VP Funds Trust: Trustee since January 2016, Advisory Board Member (June 2015 to December 2015) | Founder and CEO, DanCourt Management, LLC since 1999 | 81 | MainStay Funds: Trustee since January 2016, Advisory Board Member (June 2015 to December 2015) (11 Funds);
MainStay Funds Trust: Trustee since January 2016, Advisory Board Member (June 2015 to December 2015) (37 Funds);
MainStay MacKay DefinedTerm Municipal Opportunities Fund: Trustee since January 2016, Advisory Board Member (June 2015 to December 2015);
MainStay CBRE Global Infrastructure Megatrends Term Fund: Trustee since 2021;
VanEck Vectors Group of Exchange-Traded Funds: Trustee since 2006 and Independent Chairman of the Board of Trustees from 2008 to 2022 (57 portfolios); and
Berea College of Kentucky: Trustee since 2009, Chair of the Investment Committee since 2018 |
| | Karen Hammond
1956 | MainStay VP Funds Trust: Trustee since December 2021, Advisory Board Member (June 2021 to December 2021)
| Retired, Managing Director, Devonshire Investors (2007 to 2013); Senior Vice President, Fidelity Management & Research Co. (2005 to 2007); Senior Vice President and Corporate Treasurer, FMR Corp. (2003 to 2005); Chief Operating Officer, Fidelity Investments Japan (2001 to 2003) | 81 | MainStay Funds: Trustee since December 2021, Advisory Board Member (June 2021 to December 2021) (11 Funds);
MainStay Funds Trust: Trustee since December 2021, Advisory Board Member (June 2021 to December 2021) (37 Funds);
MainStay MacKay DefinedTerm Municipal Opportunities Fund: Trustee since December 2021, Advisory Board Member (June 2021 to December 2021);
MainStay CBRE Global Infrastructure Megatrends Term Fund: Trustee since December 2021, Advisory Board Member (June 2021 to December 2021);
Two Harbors Investment Corp.: Director since 2018;
Rhode Island State Investment Commission: Member since 2017; and
Blue Cross Blue Shield of Rhode Island: Director since 2019 |
| | Susan B. Kerley
1951 | MainStay VP Funds Trust: Chair since 2017 and Trustee since 2007** | President, Strategic Management Advisors LLC since 1990 | 81 | MainStay Funds: Chair since January 2017 and Trustee since 2007 (11 Funds); MainStay Funds Trust: Chair since January 2017 and Trustee since 1990 (37 Funds)***;
MainStay MacKay DefinedTerm Municipal Opportunities Fund: Chair since January 2017 and Trustee since 2011;
MainStay CBRE Global Infrastructure Megatrends Term Fund: Trustee since June 2021; and
Legg Mason Partners Funds: Trustee since 1991 (45 portfolios) |
Board of Trustees and Officers (Unaudited) (continued)
| | Name and
Year of Birth | Term of Office,
Position(s) Held and
Length of Service | Principal Occupation(s)
During Past Five Years | Number of
Portfolios in
Fund Complex
Overseen by
Trustee | Other Directorships
Held by Trustee |
| | | | | | |
| | Alan R. Latshaw
1951 | MainStay VP Funds Trust: Trustee since 2007** | Retired; Partner, Ernst & Young LLP (2002 to 2003); Partner, Arthur Andersen LLP (1989 to 2002); Consultant to the MainStay Funds Audit and Compliance Committee (2004 to 2006) | 81 | MainStay Funds: Trustee since 2006 (11 Funds);
MainStay Funds Trust: Trustee since 2007 (37 Funds)***;
MainStay MacKay DefinedTerm Municipal Opportunities Fund: Trustee since 2011; and
MainStay CBRE Global Infrastructure Megatrends Term Fund: Trustee since June 2021 |
| | Jacques P. Perold
1958 | MainStay VP Funds Trust: Trustee since January 2016, Advisory Board Member (June 2015 to December 2015) | Founder and Chief Executive Officer, CapShift Advisors LLC (since 2018); President, Fidelity Management & Research Company (2009 to 2014); President and Chief Investment Officer, Geode Capital Management, LLC (2001 to 2009) | 81 | MainStay Funds: Trustee since January 2016, Advisory Board Member (June 2015 to December 2015) (11 Funds);
MainStay Funds Trust: Trustee since January 2016, Advisory Board Member (June 2015 to December 2015) (37 Funds);
MainStay MacKay DefinedTerm Municipal Opportunities Fund: Trustee since January 2016, Advisory Board Member (June 2015 to December 2015);
MainStay CBRE Global Infrastructure Megatrends Term Fund: Trustee since June 2021;
Allstate Corporation: Director since 2015;
Partners in Health: Trustee since 2019; and
MSCI Inc.: Director since 2017 |
| | Richard S. Trutanic
1952 | MainStay VP Funds Trust: Trustee since 2007** | Chairman and Chief Executive Officer, Somerset & Company (financial advisory firm) since 2004; Managing Director, The Carlyle Group (private investment firm) (2002 to 2004); Senior Managing Director, Partner and Board Member, Groupe Arnault S.A. (private investment firm) (1999 to 2002) | 81 | MainStay Funds: Trustee since 1994 (11 Funds);
MainStay Funds Trust: Trustee since 2007 (37 Funds)***;
MainStay MacKay DefinedTerm Municipal Opportunities Fund: Trustee since 2011; and
MainStay CBRE Global Infrastructure Megatrends Term Fund: Trustee since June 2021 |
| ** | Includes prior service as a Director of MainStay VP Series Fund, Inc., the predecessor to MainStay VP Funds Trust. |
| *** | Includes prior service as a Director/Trustee of certain predecessor entities to MainStay Funds Trust. |
| 28 | MainStay VP U.S. Government Money Market Portfolio |
| | Name and
Year of Birth | Position(s) Held and
Length of Service | Principal Occupation(s)
During Past Five Years | |
| | | | | |
| | Kirk C. Lehneis
1974 | President, MainStay VP Funds Trust (since 2017) | Chief Operating Officer and Senior Managing Director (since 2016), New York Life Investment Management LLC and New York Life Investment Management Holdings LLC; Member of the Board of Managers (since 2017) and Senior Managing Director (since 2018), NYLIFE Distributors LLC; Chairman of the Board and Senior Managing Director, NYLIM Service Company LLC (since 2017); Trustee, President and Principal Executive Officer of IndexIQ Trust, IndexIQ ETF Trust and IndexIQ Active ETF Trust (since 2018); President, MainStay CBRE Global Infrastructure Megatrends Term Fund (since 2021), MainStay MacKay DefinedTerm Municipal Opportunities Fund, MainStay Funds and MainStay Funds Trust (since 2017); Senior Managing Director, Global Product Development (from 2015 to 2016); Managing Director, Product Development (from 2010 to 2015), New York Life Investment Management LLC | |
| | Jack R. Benintende
1964 | Treasurer and Principal Financial and Accounting Officer, MainStay VP Funds Trust (since 2007)** | Managing Director, New York Life Investment Management LLC (since 2007); Treasurer and Principal Financial and Accounting Officer, MainStay CBRE Global Infrastructure Megatrends Term Fund (since 2021), MainStay MacKay DefinedTerm Municipal Opportunities Fund (since 2011), MainStay Funds Trust (since 2009) and MainStay Funds (since 2007); and Assistant Treasurer, New York Life Investment Management Holdings LLC (2008 to 2012) | |
| | J. Kevin Gao
1967 | Secretary and Chief Legal Officer, MainStay VP Funds Trust (since 2010)** | Managing Director and Associate General Counsel, New York Life Investment Management LLC (since 2010); Secretary and Chief Legal Officer, MainStay CBRE Global Infrastructure Megatrends Term Fund (since 2021), MainStay MacKay DefinedTerm Municipal Opportunities Fund (since 2011), MainStay Funds and MainStay Funds Trust (since 2010) | |
| | Kevin M. Gleason
1967 | Vice President and Chief Compliance Officer, MainStay VP Funds Trust (since June 2022) | Vice President and Chief Compliance Officer, IndexIQ Trust, IndexIQ ETF Trust and IndexIQ Active ETF Trust (since June 2022); Vice President and Chief Compliance Officer, MainStay CBRE Global Infrastructure Megatrends Term Fund, MainStay MacKay DefinedTerm Municipal Opportunities Fund (since June 2022); MainStay Funds Trust and MainStay Funds (since June 2022); Senior Vice President, Voya Investment Management and Chief Compliance Officer, Voya Family of Funds (2012 to 2022) | |
| | Scott T. Harrington
1959 | Vice President— Administration, MainStay VP Funds Trust (since 2005)** | Managing Director, New York Life Investment Management LLC (including predecessor advisory organizations) (since 2000); Member of the Board of Directors, New York Life Trust Company (since 2009); Vice President—Administration, MainStay CBRE Global Infrastructure Megatrends Term Fund (since 2021), MainStay MacKay DefinedTerm Municipal Opportunities Fund (since 2011), MainStay Funds Trust and MainStay Funds (since 2009) | |
| * | The officers listed above are considered to be “interested persons” of the MainStay Group of Funds, MainStay VP Funds Trust, MainStay CBRE Global Infrastructure Megatrends Term Fund and MainStay MacKay DefinedTerm Municipal Opportunities Fund within the meaning of the 1940 Act because of their affiliation with the MainStay Group of Funds, New York Life Insurance Company and/or its affiliates, including New York Life Investment Management LLC, New York Life Insurance Company, NYLIM Service Company LLC, NYLIFE Securities LLC and/or NYLIFE Distributors LLC, as described in detail in the column captioned “Principal Occupation(s) During Past Five Years.” Officers are elected annually by the Board. |
| ** | Includes prior service as an Officer of MainStay VP Series Fund, Inc., the predecessor to MainStay VP Funds Trust. |
Officers of the Trust (Who are not Trustees)*
This page intentionally left blank
MainStay VP Portfolios
MainStay VP offers a wide range of Portfolios. The full array of MainStay VP offerings is listed here, with information about the manager, subadvisors, legal counsel, and independent registered public accounting firm.
Equity
MainStay VP American Century Sustainable Equity Portfolio
MainStay VP Candriam Emerging Markets Equity Portfolio
MainStay VP Epoch U.S. Equity Yield Portfolio
MainStay VP Fidelity Institutional AM® Utilities Portfolio†
MainStay VP Natural Resources Portfolio
MainStay VP PineStone International Equity Portfolio1
MainStay VP S&P 500 Index Portfolio
MainStay VP Small Cap Growth Portfolio
MainStay VP Wellington Growth Portfolio
MainStay VP Wellington Mid Cap Portfolio
MainStay VP Wellington Small Cap Portfolio
MainStay VP Wellington U.S. Equity Portfolio
MainStay VP Winslow Large Cap Growth Portfolio
Mixed Asset
MainStay VP Balanced Portfolio
MainStay VP Income Builder Portfolio
MainStay VP Janus Henderson Balanced Portfolio
MainStay VP MacKay Convertible Portfolio
Income
MainStay VP Bond Portfolio
MainStay VP Floating Rate Portfolio
MainStay VP Indexed Bond Portfolio
MainStay VP MacKay Government Portfolio2
MainStay VP MacKay High Yield Corporate Bond Portfolio
MainStay VP MacKay Strategic Bond Portfolio
MainStay VP PIMCO Real Return Portfolio
Money Market
MainStay VP U.S. Government Money Market Portfolio
Alternative
MainStay VP CBRE Global Infrastructure Portfolio
MainStay VP IQ Hedge Multi-Strategy Portfolio
Asset Allocation
MainStay VP Conservative Allocation Portfolio
MainStay VP Equity Allocation Portfolio
MainStay VP Growth Allocation Portfolio
MainStay VP Moderate Allocation Portfolio
Manager
New York Life Investment Management LLC
New York, New York
Subadvisors
American Century Investment Management, Inc.
Kansas City, Missouri
Brown Advisory LLC
Baltimore, Maryland
Candriam*
Strassen, Luxembourg
CBRE Investment Management Listed Real Assets LLC
Radnor, Pennsylvania
Epoch Investment Partners, Inc.
New York, New York
FIAM LLC
Smithfield, Rhode Island
IndexIQ Advisors LLC*
New York, New York
Janus Henderson Investors US LLC
Denver, Colorado
MacKay Shields LLC*
New York, New York
Newton Investment Management North America, LLC
Boston, Massachusetts
NYL Investors LLC*
New York, New York
Pacific Investment Management Company LLC
Newport Beach, California
PineStone Asset Management Inc.
Montreal, Québec
Segall Bryant & Hamill, LLC
Chicago, Illinois
Wellington Management Company LLP
Boston, Massachusetts
Winslow Capital Management, LLC
Minneapolis, Minnesota
Legal Counsel
Dechert LLP
Washington, District of Columbia
Independent Registered Public Accounting Firm
PricewaterhouseCoopers LLP
New York, New York
Distributor
NYLIFE Distributors LLC*
Jersey City, New Jersey
Custodian
JPMorgan Chase Bank, N.A.
New York, New York
Some Portfolios may not be available in all products.
† Fidelity Institutional AM is a registered trade mark of FMR LLC. Used with permission.
* An affiliate of New York Life Investment Management LLC.
| 1. | Prior to August 28, 2023, the Portfolio's name was MainStay VP MacKay International Equity Portfolio. |
| 2. | Effective on or about May 1, 2024, the MainStay VP MacKay Government Portfolio will be renamed the MainStay VP U.S. Infrastructure Bond Portfolio. |
Not part of the Annual Report
2023 Annual Report
This report is for the general information of New York Life Variable Annuities and NYLIAC Variable Universal Life Insurance Products policyowners. It must be preceded or accompanied by the appropriate product(s) and funds prospectuses if it is given to anyone who is not an owner of a New York Life variable annuity policy or a NYLIAC Variable Universal Life Insurance Product. This report does not offer for sale or solicit orders to purchase securities.
The performance data quoted in this report represents past performance. Past performance is no guarantee of future results. Due to market volatility and other factors, current performance may be lower or higher than the figures shown. The most recent month-end performance summary for your variable annuity or variable life policy is available by calling 800-598-2019 and is updated periodically on newyorklife.com.
The New York Life Variable Annuities and NYLIAC Variable Universal Life Insurance Products are issued by New York Life Insurance and Annuity Corporation (a Delaware Corporation) and distributed by NYLIFE Distributors LLC (Member FINRA/SIPC).
New York Life Insurance Company
New York Life Insurance and Annuity
Corporation (NYLIAC) (A Delaware Corporation)
51 Madison Avenue, Room 551
New York, NY 10010
newyorklife.com
newyorklifeinvestments.com
NYLIFE Distributors LLC, 30 Hudson Street, Jersey City, NJ 07302
New York Life Investment Management LLC is the investment manager to the MainStay VP Funds Trust
©2024 by NYLIFE Distributors LLC. All rights reserved.
You may obtain copies of the Prospectus and the Statement of Additional Information free of charge, upon request, by calling toll-free 800-598-2019 or writing to New York Life Insurance and Annuity Corporation, 51 Madison Avenue, New York, NY 10010.
| Not FDIC Insured | No Bank Guarantee | May Lose Value |
| 5015536 | MSVPUSGMM11-02/24 |
(NYLIAC) NI510
MainStay VP MacKay Convertible Portfolio
Message from the President and Annual Report
December 31, 2023
Special Notice:
Beginning in July 2024, new regulations issued by the Securities and Exchange Commission (SEC) will take effect requiring open-end mutual fund companies and ETFs to (1) overhaul the content of their shareholder reports and (2) mail paper copies of the new tailored shareholder reports to shareholders who have not opted to receive these documents electronically.
If you have not yet elected to receive your shareholder reports electronically, please contact your financial intermediary or visit our website.
| Not FDIC/NCUA Insured | Not a Deposit | May Lose Value | No Bank Guarantee | Not Insured by Any Government Agency |
This page intentionally left blank
Message from the President
Against a backdrop of easing inflationary pressures and continued economic growth, stocks and bonds generally gained ground during the 12-month period ended December 31, 2023, despite high levels of volatility and sharp disparities between the performance of the different market sectors.
Although the war in Ukraine, the outbreak of hostilities in the Middle East and several other notable events affected financial assets, inflation, interest rate, and economic growth trends stood at the forefront of market developments during most of the period. As the reporting period began, high levels of inflation already showed signs of easing in the face of aggressive rate hikes by U.S. Federal Reserve (the “Fed”). From a peak of 9.1% in June 2022, the annualized U.S. inflation rate dropped to 6.4% in January, and 3.4% in December 2023. At the same time, the Fed increased the benchmark federal funds rate from 4.25%–4.50% at the beginning of reporting period, to 5.25%–5.50% as of the end of 2023. Despite the increasing cost of capital and tighter lending environment that resulted from rising rates, economic growth remained surprisingly robust, bolstered by high levels of consumer spending, low levels of unemployment and better-than-expected corporate earnings. With the pace of rate increases slowing from the prior year, investors began hoping for an early shift to a looser monetary policy, with stock prices and bond yields reacting as economic data and statements from the Fed either reinforced or undercut those hopes. Following months of hawkish rhetoric, the Fed finally reversed its stance in December 2023, signaling a positive economic outlook with little chance of a recession and a likelihood of rate cuts in 2024.
The S&P 500® Index, a widely regarded benchmark of U.S. market performance, produced strong gains during the reporting period-– recovering all its losses from 2022 and approached new record territory. A preponderance of the Index’s gains were generated by a relatively small number of mega-cap stocks in the information technology, communication services and consumer discretionary sectors that stood to benefit from rapid developments in generative artificial intelligence (“AI”). Value-oriented, interest-rate sensitive and small-capitalization
shares lagged by significant margins, although market strength widened during the closing weeks of the reporting period. Most overseas equity markets trailed the U.S. market, as developed international economies experienced relatively low growth rates, and weak economic conditions in China undermined emerging markets.
Bonds produced generally positive returns, bolstered by attractive and relatively stable yields. The yield on the 10-year Treasury note hit a high of just under 5% in mid-October 2023, ranging between approximately 3.5% and 4.8% for most of the reporting period. The yield curve remained inverted throughout the year, with the 2-year Treasury yield modestly above the 10-year yield. Corporate bond prices trended moderately higher, generally outperforming government securities. After years of low yields and tight credit spreads, the corporate sector benefited from more attractive valuations and income opportunities. Among corporates, markets generally rewarded longer duration and lower credit quality, although an uptick in default rates posed added risks for high-yield corporate bonds. International bond markets produced mixed returns, with emerging-markets issues advancing over their developed-markets counterparts.
The market volatility of recent years reminds us of the constant need for experienced and steadfast portfolio management in the face of uncertainty. New York Life Investments remains dedicated to providing you, as a valued MainStay VP investor, with the guidance, resources and investment solutions you need to pursue your financial goals.
Thank you for trusting us to help meet your investment needs.
Sincerely,
Kirk C. Lehneis
President
The opinions expressed are as of the date of this report and are subject to change. There is no guarantee that any forecast made will come to pass. This material does not constitute investment advice and is not intended as an endorsement of any specific investment. Past performance is no guarantee of future results.
Not part of the Annual Report
Investors should refer to the Portfolio’s Summary Prospectus and/or Prospectus and consider the Portfolio’s investment objectives, strategies, risks, charges and expenses carefully before investing. The Summary Prospectus and/or Prospectus contain this and other information about the Portfolio. You may obtain copies of the Portfolio’s Summary Prospectus, Prospectus and Statement of Additional Information, which includes information about the MainStay VP Funds Trust's Trustees, free of charge, upon request, by calling toll-free 800-598-2019, by writing to New York Life Insurance and Annuity Corporation, 51 Madison Avenue, Room 251, New York, New York 10010 or by sending an email to MainStayShareholdersServices@nylim.com. These documents are also available at newyorklifeinvestments.com/investment-products/vp. Please read the Portfolio's Summary Prospectus and/or Prospectus carefully before investing. MainStay VP Funds Trust portfolios are separate account options which are purchased through a variable insurance or variable annuity contract.
MainStay VP MacKay Convertible Portfolio
Investment and Performance Comparison (Unaudited)
Performance data quoted represents past performance. Past performance is no guarantee of future results. Because of market volatility and other factors, current performance may be lower or higher than the figures shown. Investment return and principal value will fluctuate, and as a result, when shares are redeemed, they may be worth more or less than their original cost. The performance table and graph do not reflect any deduction of sales charges, mortality and expense charges, contract charges or administrative charges. Please refer to the Performance Summary appropriate for your policy. For performance information current to the most recent month-end, please call 800-598-2019 or visit www.newyorklife.com.
Performance figures may reflect certain fee waivers and/or expense limitations, without which total returns may have been different. For information on current fee waivers and/or expense limitations (if any), please refer to the Notes to Financial Statements.
| Average Annual Total Returns for the Year-Ended December 31, 2023 |
| Class | Inception
Date | One
Year | Five
Years | Ten Years
or Since
Inception | Gross
Expense
Ratio1 |
| Initial Class Shares | 10/1/1996 | 8.85% | 11.59% | 8.50% | 0.57% |
| Service Class Shares | 6/5/2003 | 8.58 | 11.31 | 8.23 | 0.82 |
| Service 2 Class Shares | 4/26/2016 | 8.47 | 11.20 | 9.67 | 0.92 |
| 1. | The gross expense ratios presented reflect the Portfolio’s “Total Annual Portfolio Operating Expenses” from the most recent Prospectus and may differ from other expense ratios disclosed in this report. |
| Benchmark Performance* | One
Year | Five
Years | Ten
Years |
| ICE BofA U.S. Convertible Index1 | 12.87% | 11.93% | 8.90% |
| Morningstar Convertibles Category Average2 | 8.97 | 9.88 | 7.21 |
| * | Returns for indices reflect no deductions for fees, expenses or taxes, except for foreign withholding taxes where applicable. Results assume reinvestment of all dividends and capital gains. An investment cannot be made directly in an index. |
| 1. | The ICE BofA U.S. Convertible Index is the Portfolio’s primary broad–based securities market index for comparison purposes. The ICE BofA U.S. Convertible Index is a market-capitalization weighted index of domestic corporate convertible securities. In order to be included in this Index, bonds and preferred stocks must be convertible only to common stock. |
| 2. | The Morningstar Convertibles Category Average is representative of funds that are designed to offer some of the capital-appreciation potential of stock portfolios while also supplying some of the safety and yield of bond portfolios. Results are based on average total returns of similar funds with all dividends and capital gain distributions reinvested. |
| 6 | MainStay VP MacKay Convertible Portfolio |
Cost in Dollars of a $1,000 Investment in MainStay VP MacKay Convertible Portfolio (Unaudited)
The example below is intended to describe the fees and expenses borne by shareholders during the six-month period from July 1, 2023 to December 31, 2023, and the impact of those costs on your investment.
Example
As a shareholder of the Portfolio you incur two types of costs: (1) transaction costs, including exchange fees and sales charges (loads) on purchases (as applicable), and (2) ongoing costs, including management fees, distribution and/or service (12b-1) fees and other Portfolio expenses (as applicable). This example is intended to help you understand your ongoing costs (in dollars) of investing in the Portfolio and to compare these costs with the ongoing costs of investing in other mutual funds. The example is based on an investment of $1,000 made at the beginning of the six-month period and held for the entire period from July 1, 2023 to December 31, 2023. Shares are only sold in connection with variable life and annuity contracts and the example does not reflect any contract level or transactional fees or expenses. If these costs had been included, your costs would have been higher.
This example illustrates your Portfolio’s ongoing costs in two ways:
Actual Expenses
The second and third data columns in the table below provide information about actual account values and actual expenses. You may use the information in these columns, together with the amount you invested, to estimate the expenses that you paid during the six months ended
December 31, 2023. Simply divide your account value by $1,000 (for example, an $8,600 account value divided by $1,000 = 8.6), then multiply the result by the number under the heading entitled “Expenses Paid During Period” to estimate the expenses you paid on your account during this period.
Hypothetical Example for Comparison Purposes
The fourth and fifth data columns in the table below provide information about hypothetical account values and hypothetical expenses based on the Portfolio’s actual expense ratio and an assumed rate of return of 5% per year before expenses, which is not the Portfolio’s actual return. The hypothetical account values and expenses may not be used to estimate the actual ending account balances or expenses you paid for the six-month period shown. You may use this information to compare the ongoing costs of investing in the Portfolio with the ongoing costs of investing in other mutual funds. To do so, compare this 5% hypothetical example with the 5% hypothetical examples that appear in the shareholder reports of the other mutual funds.
Please note that the expenses shown in the table are meant to highlight your ongoing costs only and do not reflect any transactional costs, such as exchange fees or sales charges (loads). Therefore, the fourth and fifth data columns of the table are useful in comparing ongoing costs only and will not help you determine the relative total costs of owning different funds. In addition, if these transactional costs were included, your costs would have been higher.
| Share Class | Beginning
Account
Value
7/1/23 | Ending Account
Value (Based
on Actual
Returns and
Expenses)
12/31/23 | Expenses
Paid
During
Period1 | Ending Account
Value (Based
on Hypothetical
5% Annualized
Return and
Actual Expenses)
12/31/23 | Expenses
Paid
During
Period1 | Net Expense
Ratio
During
Period2 |
| Initial Class Shares | $1,000.00 | $1,027.90 | $2.91 | $1,022.33 | $2.91 | 0.57% |
| Service Class Shares | $1,000.00 | $1,026.60 | $4.19 | $1,021.07 | $4.18 | 0.82% |
| Service 2 Class Shares | $1,000.00 | $1,026.10 | $4.70 | $1,020.57 | $4.69 | 0.92% |
| 1. | Expenses are equal to the Portfolio’s annualized expense ratio of each class multiplied by the average account value over the period, divided by 365 and multiplied by 184 (to reflect the six-month period). The table above represents the actual expenses incurred during the six-month period. In addition to the fees and expenses which the Portfolio bears directly, it also indirectly bears a pro rata share of the fees and expenses of the underlying funds in which it invests. Such indirect expenses are not included in the above-reported expense figures. |
| 2. | Expenses are equal to the Portfolio's annualized expense ratio to reflect the six-month period. |
Portfolio Composition as of December 31, 2023 (Unaudited)
See Portfolio of Investments beginning on page 11 for specific holdings within these categories. The Portfolio's holdings are subject to change.
Top Ten Holdings and/or Issuers Held as of December 31, 2023 (excluding short-term investments) (Unaudited)
| 1. | Nice Ltd., (zero coupon), due 9/15/25 |
| 2. | BioMarin Pharmaceutical, Inc., 1.25%, due 5/15/27 |
| 3. | Microchip Technology, Inc., 0.125%, due 11/15/24 |
| 4. | NRG Energy, Inc., 2.75%, due 6/1/48 |
| 5. | Pioneer Natural Resources Co., 0.25%, due 5/15/25 |
| 6. | Palo Alto Networks, Inc., 0.375%, due 6/1/25 |
| 7. | Ford Motor Co., (zero coupon), due 3/15/26 |
| 8. | Exact Sciences Corp., 0.375%, due 3/1/28 |
| 9. | Southwest Airlines Co., 1.25%, due 5/1/25 |
| 10. | Lantheus Holdings, Inc., 2.625%, due 12/15/27 |
| 8 | MainStay VP MacKay Convertible Portfolio |
Portfolio Management Discussion and Analysis (Unaudited)
Answers to the questions reflect the views of portfolio manager Edward Silverstein, CFA, of MacKay Shields LLC, the Portfolio’s Subadvisor.
How did MainStay VP MacKay Convertible Portfolio perform relative to its benchmark and peers during the 12 months ended December 31, 2023?
For the 12 months ended December 31, 2023, MainStay VP MacKay Convertible Portfolio returned 8.85% for Initial Class shares, 8.58% for Service Class shares and 8.47% for Service 2 Class shares. Over the same period, all share classes underperformed the 12.87% return of the ICE BofA U.S. Convertible Index (“the Index”), which is the Portfolio’s benchmark, and the 8.97% return of the Morningstar Convertibles Category Average.1
During the reporting period, were there any market events that materially impacted the Portfolio’s performance or liquidity?
The reporting period was characterized by consistent gains in the U.S. convertible market. Convertible performance is highly correlated to the performance of the equities of the issuers of convertible securities. Equity performance was sharply higher during the reporting period, with the S&P 500® Index, a widely regarded benchmark of large-cap equity performance, up over 26.29%. However, the more broadly based Russell 2000 Index was up 16.93%, as the performance of the S&P 500® Index was heavily influenced by outsized returns produced by seven of its largest constituents: Apple, Amazon.com, Alphabet, Microsoft, Meta Platforms, NVIDIA and Tesla. None of these securities are represented in the Russell 2000 Index or the ICE BofA U.S. Convertible Index, which is why convertible performance, while positive, proved disappointing relative to the S&P 500® Index. There were no market events that materially impacted the Portfolio during the reporting period.
What factors affected the Portfolio’s relative performance during the reporting period?
The Portfolio underperformed the Index during the reporting period due to the Portfolio’s relatively underweight exposure to the consumer discretionary and information technology sectors, particularly to several issuers within those sectors that substantially added to Index performance. In addition, the Portfolio’s cash holdings were a drag on results, given the positive Index performance.
During the reporting period, which sectors were the strongest positive contributors to the Portfolio’s relative performance, and which sectors were particularly weak?
During the reporting period, underweight allocation to, and security selection in, the utility sector made the strongest contribution to performance relative to the Index. (Contributions take weightings and total returns into account.) Overweight allocation to, and security selection in, the energy sector also
contributed positively. The Portfolio’s underweight exposure to the consumer discretionary and information technology sectors had the most significant negative impact on relative performance. Underweight exposure to, and selection in, health care also detracted.
During the reporting period, which individual securities made the strongest positive contributions to the Portfolio’s absolute performance, and which stocks detracted the most?
The three strongest contributors to the Portfolio’s absolute performance included the common shares of Weatherford International, the convertible bonds of Permian Resources and NRG Energy. Weatherford and Permian are energy related. The common shares of Weatherford International were received by the Fund as part of a reorganization in 2019. The shares rose during the reporting period as the company reported several consecutive quarterly earnings that exceeded analyst expectations. The convertible bonds of exploration and production company Permian Resources also rose during the reporting period, despite the price of crude oil falling slightly during the same period. Permian announced and consummated several acquisitions during the reporting period that were accretive to earnings and cash flow. The convertible bonds of Texas-based utility company NRG performed well because an activist investor pushed the company to maximize shareholder value by prioritizing free cash flow.
The Portfolio’s three worst performers during the reporting period were the convertible bonds of health insurer Elevance Health, Southwest Airlines and BioMarin Pharmaceuticals. All three holdings declined in value. The convertible bonds of Elevance fell despite the company reporting inline or slightly better-than-expected earnings. The decline in Elevance bonds may have been due to investor fear that demand for medical care, deferred during the pandemic, would increase, weighing on the profitability of medical insurers such as Elevance. Southwest convertible bonds underperformed due to series of issues facing the company, including the Christmas 2022 weather fiascos, which led to thousands of flight cancellations, plus big increases in costs from new union contacts. Biomarin received approval for a new treatment for hemophilia, but issues with government reimbursement kept the drug from being sold. In addition, most patients and doctors appeared satisfied with therapies already available.
Did the Portfolio make any significant purchases or sales during the reporting period?
The Portfolio made several significant purchases in the health care and consumer discretionary sectors during the reporting period. Within health care, the Portfolio brought two initial public offerings of bonds from medical device manufacturer Integer
| 1. | See "Investment and Performance Comparison" for more information on benchmark and peer group returns. |
Holdings and biotechnology company TransMedics Group. The portfolio also added to its position in medical imaging agent manufacturer Lantheus Holdings. Both Integer and Lantheus generate significant free cash flow and sell for reasonable valuations. TransMedics appears to have a novel method for storing human organs prior to transplantation, and we believe the company should see strong sales and earnings growth in the coming years. Within the consumer discretionary sector, the Portfolio again purchased a position in cruise operator Carnival, and added to the holdings of entertainment company Live Nation. We purchased the Carnival position as we believe the company no longer faced the risk of insolvency. In addition, Carnival’s convertible bonds have a high coupon, and offer downside protection and upside participation with the company’s common shares. We added to the Portfolio’s holdings of Live Nation as the company generates a great deal of free cash flow, and its common shares were trading at an attractive valuation.
Several large holdings left the Portfolio after they either matured or were called by the issuer. These included semiconductor company Silicon Laboratories and health insurer Elevance Health. Additionally, the preferred shares of testing and diagnostics company Danaher converted and we trimmed back our position. In addition, we cut the Portfolio’s exposure to the energy sector by trimming holdings of oil & gas exploration & production companies EQT and Pioneer Natural Resources. Lastly, we sold the Portfolio’s holdings of satellite television company DISH Network, as we were concerned about the company’s ability to refinance its large debt load and meet capital spending requirements.
How did the Portfolio’s sector weightings change during the reporting period?
There were no material changes to positioning during the reporting period. The Portfolio increased its exposure to the industrials, consumer discretionary and health care sectors. Conversely, the Portfolio decreased its exposure to the energy sector and, to a lesser degree, information technology.
How was the Portfolio positioned at the end of the reporting period?
As of December 31, 2023, the Portfolio held overweight exposure relative to the Index in the health care, energy and consumer staples sectors. As of the same date, the Portfolio held underweight exposure in financials, information technology and utilities.
The opinions expressed are those of the portfolio manager as of the date of this report and are subject to change. There is no guarantee that any forecasts will come to pass. This material does not constitute investment advice and is not intended as an endorsement of any specific investment.
Not all MainStay VP Portfolios and/or share classes are available under all policies.
| 10 | MainStay VP MacKay Convertible Portfolio |
Portfolio of Investments December 31, 2023†^
| | Principal
Amount | Value |
| Long-Term Bonds 1.1% |
| Corporate Bonds 1.1% |
| Biotechnology 0.5% |
| Bridgebio Pharma, Inc. | | |
| 2.50%, due 3/15/27 | $ 6,895,000 | $ 8,346,398 |
| Hotels, Restaurants & Leisure 0.6% |
| NCL Corp. Ltd. | | |
| 5.375%, due 8/1/25 | 8,205,000 | 10,527,015 |
Total Corporate Bonds
(Cost $16,869,030) | | 18,873,413 |
Total Long-Term Bonds
(Cost $16,869,030) | | 18,873,413 |
| Convertible Securities 89.8% |
| Convertible Bonds 84.9% |
| Automobile Components 1.1% |
| Patrick Industries, Inc. | | |
| 1.75%, due 12/1/28 | 17,313,000 | 19,736,820 |
| Automobiles 2.8% |
| Ford Motor Co. | | |
| (zero coupon), due 3/15/26 | 32,843,000 | 32,843,000 |
| Rivian Automotive, Inc. | | |
| 4.625%, due 3/15/29 (a) | 11,411,000 | 16,078,099 |
| | | 48,921,099 |
| Beverages 1.4% |
| MGP Ingredients, Inc. | | |
| 1.875%, due 11/15/41 | 20,955,000 | 24,517,350 |
| Biotechnology 7.0% |
| Alnylam Pharmaceuticals, Inc. | | |
| 1.00%, due 9/15/27 | 5,744,000 | 5,672,200 |
| BioMarin Pharmaceutical, Inc. | | |
| 1.25%, due 5/15/27 (b) | 37,741,000 | 38,944,938 |
| Exact Sciences Corp. | | |
| 0.375%, due 3/1/28 | 34,798,000 | 32,710,120 |
| Halozyme Therapeutics, Inc. | | |
| 1.00%, due 8/15/28 | 18,801,000 | 17,513,131 |
| Ionis Pharmaceuticals, Inc. | | |
| (zero coupon), due 4/1/26 | 13,035,000 | 13,777,995 |
| Mirum Pharmaceuticals, Inc. | | |
| 4.00%, due 5/1/29 (a) | 10,839,000 | 13,223,580 |
| | | 121,841,964 |
| | Principal
Amount | Value |
| |
| Broadline Retail 1.2% |
| Etsy, Inc. | | |
| 0.25%, due 6/15/28 | $ 26,578,000 | $ 21,344,792 |
| Commercial Services & Supplies 1.3% |
| Tetra Tech, Inc. | | |
| 2.25%, due 8/15/28 (a) | 21,270,000 | 22,399,437 |
| Communications Equipment 2.4% |
| Infinera Corp. | | |
| 2.50%, due 3/1/27 | 4,490,000 | 4,120,914 |
| Lumentum Holdings, Inc. | | |
| 0.50%, due 12/15/26 | 26,640,000 | 23,869,440 |
| Viavi Solutions, Inc. | | |
| 1.00%, due 3/1/24 | 14,133,000 | 13,868,006 |
| | | 41,858,360 |
| Consumer Staples Distribution & Retail 0.7% |
| Chefs' Warehouse, Inc. (The) | | |
| 2.375%, due 12/15/28 | 11,991,000 | 11,442,016 |
| Electric Utilities 3.4% |
| NRG Energy, Inc. | | |
| 2.75%, due 6/1/48 | 29,752,000 | 38,380,080 |
| PG&E Corp. | | |
| 4.25%, due 12/1/27 (a) | 19,748,000 | 20,794,644 |
| | | 59,174,724 |
| Electrical Equipment 0.5% |
| Array Technologies, Inc. | | |
| 1.00%, due 12/1/28 | 8,045,000 | 7,942,426 |
| Electronic Equipment, Instruments & Components 0.7% |
| Advanced Energy Industries, Inc. | | |
| 2.50%, due 9/15/28 (a) | 11,024,000 | 11,657,880 |
| Energy Equipment & Services 1.5% |
| Oil States International, Inc. | | |
| 4.75%, due 4/1/26 | 26,829,000 | 26,863,878 |
| Entertainment 2.9% |
| Liberty Media Corp. | | |
| 2.25%, due 8/15/27 | 14,461,000 | 14,741,931 |
| 3.75%, due 3/15/28 (a) | 14,595,000 | 17,492,107 |
| Live Nation Entertainment, Inc. | | |
| 3.125%, due 1/15/29 (a)(b) | 16,943,000 | 19,282,828 |
| | | 51,516,866 |
The notes to the financial statements are an integral part of, and should be read in conjunction with, the financial statements.
11
Portfolio of Investments December 31, 2023†^ (continued)
| | Principal
Amount | Value |
| Convertible Bonds (continued) |
| Financial Services 2.8% |
| Block, Inc. | | |
| 0.125%, due 3/1/25 | $ 20,457,000 | $ 20,086,728 |
| Euronet Worldwide, Inc. | | |
| 0.75%, due 3/15/49 | 11,685,000 | 11,042,325 |
| Shift4 Payments, Inc. | | |
| (zero coupon), due 12/15/25 | 15,202,000 | 16,941,109 |
| | | 48,070,162 |
| Food Products 0.9% |
| Post Holdings, Inc. | | |
| 2.50%, due 8/15/27 | 15,651,000 | 15,893,591 |
| Ground Transportation 1.2% |
| Uber Technologies, Inc. | | |
| Series 2028 | | |
| 0.875%, due 12/1/28 (a) | 18,821,000 | 20,561,942 |
| Health Care Equipment & Supplies 11.7% |
| CONMED Corp. | | |
| 2.25%, due 6/15/27 | 24,108,000 | 24,214,075 |
| Dexcom, Inc. | | |
| 0.25%, due 11/15/25 | 16,942,000 | 17,772,158 |
| Envista Holdings Corp. | | |
| 1.75%, due 8/15/28 (a) | 14,683,000 | 13,434,945 |
| Haemonetics Corp. | | |
| (zero coupon), due 3/1/26 | 9,354,000 | 8,371,830 |
| Integer Holdings Corp. | | |
| 2.125%, due 2/15/28 (a) | 18,837,000 | 24,130,197 |
| Integra LifeSciences Holdings Corp. | | |
| 0.50%, due 8/15/25 | 8,831,000 | 8,336,464 |
| Lantheus Holdings, Inc. | | |
| 2.625%, due 12/15/27 | 25,213,000 | 28,379,753 |
| Merit Medical Systems, Inc. | | |
| 3.00%, due 2/1/29 (a) | 19,757,000 | 21,959,905 |
| NuVasive, Inc. | | |
| 0.375%, due 3/15/25 | 12,958,000 | 11,953,755 |
| Omnicell, Inc. | | |
| 0.25%, due 9/15/25 | 10,024,000 | 9,240,875 |
| Shockwave Medical, Inc. | | |
| 1.00%, due 8/15/28 (a) | 14,655,000 | 14,339,918 |
| TransMedics Group, Inc. | | |
| 1.50%, due 6/1/28 (a) | 20,422,000 | 23,154,464 |
| | | 205,288,339 |
| Health Care Technology 0.6% |
| Teladoc Health, Inc. | | |
| 1.25%, due 6/1/27 | 12,551,000 | 10,378,422 |
| | Principal
Amount | Value |
| |
| Hotel & Resort REITs 1.0% |
| Pebblebrook Hotel Trust | | |
| 1.75%, due 12/15/26 | $ 5,863,000 | $ 5,250,903 |
| Summit Hotel Properties, Inc. | | |
| 1.50%, due 2/15/26 | 13,238,000 | 11,801,677 |
| | | 17,052,580 |
| Hotels, Restaurants & Leisure 5.3% |
| Booking Holdings, Inc. | | |
| 0.75%, due 5/1/25 | 11,000,000 | 20,776,800 |
| Carnival Corp. | | |
| 5.75%, due 12/1/27 | 10,962,000 | 18,043,452 |
| Cheesecake Factory, Inc. (The) | | |
| 0.375%, due 6/15/26 | 9,488,000 | 8,230,840 |
| Expedia Group, Inc. | | |
| (zero coupon), due 2/15/26 | 2,758,000 | 2,621,479 |
| Marriott Vacations Worldwide Corp. | | |
| (zero coupon), due 1/15/26 | 3,060,000 | 2,701,980 |
| NCL Corp. Ltd. | | |
| 6.00%, due 5/15/24 | 1,756,000 | 2,650,506 |
| Royal Caribbean Cruises Ltd. | | |
| 6.00%, due 8/15/25 | 3,850,000 | 10,267,950 |
| Sabre GLBL, Inc. | | |
| 4.00%, due 4/15/25 | 1,185,000 | 1,168,766 |
| Vail Resorts, Inc. | | |
| (zero coupon), due 1/1/26 | 30,094,000 | 26,915,321 |
| | | 93,377,094 |
| Interactive Media & Services 1.9% |
| Match Group Financeco 2, Inc. | | |
| 0.875%, due 6/15/26 (a) | 13,160,000 | 11,901,904 |
| Snap, Inc. | | |
| (zero coupon), due 5/1/27 | 10,555,000 | 8,484,109 |
| 0.125%, due 3/1/28 | 12,850,000 | 10,112,950 |
| Ziff Davis, Inc. | | |
| 1.75%, due 11/1/26 | 3,285,000 | 3,120,750 |
| | | 33,619,713 |
| IT Services 2.4% |
| Akamai Technologies, Inc. | | |
| 0.375%, due 9/1/27 | 18,297,000 | 20,465,194 |
| MongoDB, Inc. | | |
| 0.25%, due 1/15/26 | 7,540,000 | 14,919,775 |
| Okta, Inc. | | |
| 0.125%, due 9/1/25 | 7,194,000 | 6,658,047 |
| | | 42,043,016 |
| Machinery 0.5% |
| Greenbrier Cos., Inc. (The) | | |
| 2.875%, due 4/15/28 | 9,472,000 | 9,339,392 |
The notes to the financial statements are an integral part of, and should be read in conjunction with, the financial statements.
| 12 | MainStay VP MacKay Convertible Portfolio |
| | Principal
Amount | Value |
| Convertible Bonds (continued) |
| Media 0.6% |
| Liberty Broadband Corp. | | |
| 3.125%, due 3/31/53 (a) | $ 9,771,000 | $ 9,703,580 |
| Oil, Gas & Consumable Fuels 4.8% |
| EQT Corp. | | |
| 1.75%, due 5/1/26 | 7,385,000 | 19,639,669 |
| Northern Oil and Gas, Inc. | | |
| 3.625%, due 4/15/29 | 6,828,000 | 8,084,352 |
| Permian Resources Operating LLC | | |
| 3.25%, due 4/1/28 | 7,534,000 | 17,530,865 |
| Pioneer Natural Resources Co. | | |
| 0.25%, due 5/15/25 | 15,534,000 | 37,825,290 |
| | | 83,080,176 |
| Passenger Airlines 2.1% |
| American Airlines Group, Inc. | | |
| 6.50%, due 7/1/25 | 6,895,000 | 7,670,688 |
| Southwest Airlines Co. | | |
| 1.25%, due 5/1/25 | 29,005,000 | 29,418,321 |
| | | 37,089,009 |
| Pharmaceuticals 2.2% |
| Amphastar Pharmaceuticals, Inc. | | |
| 2.00%, due 3/15/29 (a) | 18,758,000 | 22,837,865 |
| Pacira BioSciences, Inc. | | |
| 0.75%, due 8/1/25 | 17,427,000 | 16,152,651 |
| | | 38,990,516 |
| Professional Services 0.2% |
| Parsons Corp. | | |
| 0.25%, due 8/15/25 | 2,878,000 | 4,131,369 |
| Real Estate Management & Development 1.1% |
| Zillow Group, Inc. | | |
| 2.75%, due 5/15/25 | 17,202,000 | 18,987,568 |
| Semiconductors & Semiconductor Equipment 5.7% |
| Enphase Energy, Inc. | | |
| (zero coupon), due 3/1/26 | 16,664,000 | 15,264,224 |
| Impinj, Inc. | | |
| 1.125%, due 5/15/27 | 4,870,000 | 5,326,806 |
| Microchip Technology, Inc. | | |
| 0.125%, due 11/15/24 (b) | 35,083,000 | 38,503,592 |
| ON Semiconductor Corp. | | |
| 0.50%, due 3/1/29 (a) | 24,345,000 | 25,988,287 |
| | Principal
Amount | Value |
| |
| Semiconductors & Semiconductor Equipment (continued) |
| SolarEdge Technologies, Inc. | | |
| (zero coupon), due 9/15/25 | $ 8,449,000 | $ 7,725,766 |
| Wolfspeed, Inc. | | |
| 0.25%, due 2/15/28 (b) | 9,771,000 | 6,629,624 |
| 1.875%, due 12/1/29 | 1,000 | 685 |
| | | 99,438,984 |
| Software 11.2% |
| Bentley Systems, Inc. | | |
| 0.125%, due 1/15/26 | 3,445,000 | 3,421,230 |
| BILL Holdings, Inc. | | |
| (zero coupon), due 12/1/25 | 5,190,000 | 4,894,170 |
| Datadog, Inc. | | |
| 0.125%, due 6/15/25 | 10,168,000 | 14,245,368 |
| Dropbox, Inc. | | |
| (zero coupon), due 3/1/28 | 12,063,000 | 12,198,709 |
| Envestnet, Inc. | | |
| 2.625%, due 12/1/27 | 14,965,000 | 14,834,056 |
| InterDigital, Inc. | | |
| 2.00%, due 6/1/24 | 2,860,000 | 3,857,425 |
| Model N, Inc. | | |
| 1.875%, due 3/15/28 (a) | 11,215,000 | 10,464,716 |
| Nice Ltd. | | |
| (zero coupon), due 9/15/25 | 48,248,000 | 45,883,848 |
| Palo Alto Networks, Inc. | | |
| 0.375%, due 6/1/25 | 11,770,000 | 34,933,360 |
| Q2 Holdings, Inc. | | |
| 0.75%, due 6/1/26 | 2,800,000 | 2,558,640 |
| Rapid7, Inc. | | |
| 1.25%, due 3/15/29 (a) | 6,375,000 | 7,116,412 |
| Splunk, Inc. | | |
| 1.125%, due 9/15/25 | 17,442,000 | 19,255,968 |
| Workiva, Inc. | | |
| 1.25%, due 8/15/28 (a) | 8,290,000 | 8,401,915 |
| Zscaler, Inc. | | |
| 0.125%, due 7/1/25 | 9,088,000 | 13,818,304 |
| | | 195,884,121 |
| Specialty Retail 0.7% |
| Burlington Stores, Inc. | | |
| 1.25%, due 12/15/27 (a) | 10,100,000 | 11,418,050 |
| Technology Hardware, Storage & Peripherals 1.1% |
| Seagate HDD Cayman | | |
| 3.50%, due 6/1/28 (a) | 4,885,000 | 5,918,178 |
The notes to the financial statements are an integral part of, and should be read in conjunction with, the financial statements.
13
Portfolio of Investments December 31, 2023†^ (continued)
| | Principal
Amount | Value |
| Convertible Bonds (continued) |
| Technology Hardware, Storage & Peripherals (continued) |
| Western Digital Corp. | | |
| 1.50%, due 2/1/24 (c) | $ 4,634,000 | $ 4,638,634 |
| 3.00%, due 11/15/28 (a) | 7,380,000 | 9,044,190 |
| | | 19,601,002 |
Total Convertible Bonds
(Cost $1,456,680,810) | | 1,483,166,238 |
| |
| | Shares | |
| |
| Convertible Preferred Stocks 4.9% |
| Banks 1.6% |
| Bank of America Corp. | |
| Series L | | |
| 7.25% (d) | 11,636 | 14,024,638 |
| Wells Fargo & Co. | |
| Series L | | |
| 7.50% (d) | 12,264 | 14,663,084 |
| | | 28,687,722 |
| Electric Utilities 1.0% |
| NextEra Energy, Inc. | |
| 6.926% | 480,000 | 18,297,600 |
| Financial Services 1.0% |
| Apollo Global Management, Inc. | |
| 6.75% | 308,350 | 17,387,856 |
| Independent Power and Renewable Electricity Producers 0.7% |
| AES Corp. (The) | |
| 6.875% | 150,600 | 11,457,648 |
| Machinery 0.6% |
| Chart Industries, Inc. | |
| Series B | | |
| 6.75% | 172,700 | 9,598,666 |
Total Convertible Preferred Stocks
(Cost $93,600,217) | | 85,429,492 |
Total Convertible Securities
(Cost $1,550,281,027) | | 1,568,595,730 |
| Common Stocks 1.3% |
| Life Sciences Tools & Services 1.0% |
| Danaher Corp. | 76,813 | 17,769,919 |
| | Shares | | Value |
| |
| Oil, Gas & Consumable Fuels 0.3% |
| Kosmos Energy Ltd. (e) | 772,131 | | $ 5,180,999 |
Total Common Stocks
(Cost $24,614,987) | | | 22,950,918 |
| Short-Term Investments 10.8% |
| Affiliated Investment Company 7.6% |
| MainStay U.S. Government Liquidity Fund, 5.235% (f)(g) | 133,028,844 | | 133,028,844 |
| Unaffiliated Investment Companies 3.2% |
| BlackRock Liquidity FedFund, 5.374% (g)(h) | 10,000,000 | | 10,000,000 |
| Dreyfus Treasury Obligations Cash Management Fund, 5.40% (g)(h) | 8,610,264 | | 8,610,264 |
| Fidelity Government Portfolio, 5.356% (g)(h) | 10,000,000 | | 10,000,000 |
| Goldman Sachs Financial Square Government Fund, 5.351% (g)(h) | 10,000,000 | | 10,000,000 |
| Invesco Government & Agency Portfolio, 5.361% (g)(h) | 4,394,609 | | 4,394,609 |
| Morgan Stanley Institutional Liquidity Fund Government Portfolio, 5.363% (g)(h) | 7,000,000 | | 7,000,000 |
| RBC U.S. Government Money Market Fund, 5.293% (g)(h) | 1,000,000 | | 1,000,000 |
| State Street Institutional U.S. Government Money Market Fund, 5.379% (g)(h) | 5,505,068 | | 5,505,068 |
| | | | 56,509,941 |
Total Short-Term Investments
(Cost $189,538,785) | | | 189,538,785 |
Total Investments
(Cost $1,781,303,829) | 103.0% | | 1,799,958,846 |
| Other Assets, Less Liabilities | (3.0) | | (52,844,020) |
| Net Assets | 100.0% | | $ 1,747,114,826 |
| † | Percentages indicated are based on Portfolio net assets. |
| ^ | Industry classifications may be different than those used for compliance monitoring purposes. |
| (a) | May be sold to institutional investors only under Rule 144A or securities offered pursuant to Section 4(a)(2) of the Securities Act of 1933, as amended. |
| (b) | All or a portion of this security was held on loan. As of December 31, 2023, the aggregate market value of securities on loan was $55,262,886. The Portfolio received cash collateral with a value of $56,509,941. (See Note 2(G)) |
| (c) | Step coupon—Rate shown was the rate in effect as of December 31, 2023. |
The notes to the financial statements are an integral part of, and should be read in conjunction with, the financial statements.
| 14 | MainStay VP MacKay Convertible Portfolio |
| (d) | Security is perpetual and, thus, does not have a predetermined maturity date. The date shown, if applicable, reflects the next call date. |
| (e) | Non-income producing security. |
| (f) | As of December 31, 2023, the Portfolio's ownership exceeds 5% of the outstanding shares of the Underlying Portfolio's share class. |
| (g) | Current yield as of December 31, 2023. |
| (h) | Represents a security purchased with cash collateral received for securities on loan. |
Investments in Affiliates (in 000's)
Investments in issuers considered to be affiliate(s) of the Portfolio during the year ended December 31, 2023 for purposes of Section 2(a)(3) of the Investment Company Act of 1940, as amended, were as follows:
| Affiliated Investment Companies | Value,
Beginning
of Year | Purchases
at Cost | Proceeds
from
Sales | Net
Realized
Gain/(Loss)
on Sales | Change in
Unrealized
Appreciation/
(Depreciation) | Value,
End of
Year | Dividend
Income | Other
Distributions | Shares
End of
Year |
| MainStay U.S. Government Liquidity Fund | $ 87,784 | $ 480,040 | $ (434,795) | $ — | $ — | $ 133,029 | $ 6,611 | $ — | 133,029 |
| Abbreviation(s): |
| REIT—Real Estate Investment Trust |
The following is a summary of the fair valuations according to the inputs used as of December 31, 2023, for valuing the Portfolio’s assets:
| Description | Quoted
Prices in
Active
Markets for
Identical
Assets
(Level 1) | | Significant
Other
Observable
Inputs
(Level 2) | | Significant
Unobservable
Inputs
(Level 3) | | Total |
| Asset Valuation Inputs | | | | | | | |
| Investments in Securities (a) | | | | | | | |
| Long-Term Bonds | | | | | | | |
| Corporate Bonds | $ — | | $ 18,873,413 | | $ — | | $ 18,873,413 |
| Total Corporate Bonds | — | | 18,873,413 | | — | | 18,873,413 |
| Convertible Securities | | | | | | | |
| Convertible Bonds | — | | 1,483,166,238 | | — | | 1,483,166,238 |
| Convertible Preferred Stocks | 85,429,492 | | — | | — | | 85,429,492 |
| Total Convertible Securities | 85,429,492 | | 1,483,166,238 | | — | | 1,568,595,730 |
| Common Stocks | 22,950,918 | | — | | — | | 22,950,918 |
| Short-Term Investments | | | | | | | |
| Affiliated Investment Company | 133,028,844 | | — | | — | | 133,028,844 |
| Unaffiliated Investment Companies | 56,509,941 | | — | | — | | 56,509,941 |
| Total Short-Term Investments | 189,538,785 | | — | | — | | 189,538,785 |
| Total Investments in Securities | $ 297,919,195 | | $ 1,502,039,651 | | $ — | | $ 1,799,958,846 |
| (a) | For a complete listing of investments and their industries, see the Portfolio of Investments. |
The notes to the financial statements are an integral part of, and should be read in conjunction with, the financial statements.
15
Statement of Assets and Liabilities as of December 31, 2023
| Assets |
Investment in unaffiliated securities, at value
(identified cost $1,648,274,985) including securities on loan of $55,262,886 | $1,666,930,002 |
Investment in affiliated investment companies, at value
(identified cost $133,028,844) | 133,028,844 |
| Cash | 76,336 |
| Receivables: | |
| Dividends and interest | 5,058,601 |
| Portfolio shares sold | 342,267 |
| Securities lending | 153,120 |
| Other assets | 9,465 |
| Total assets | 1,805,598,635 |
| Liabilities |
| Cash collateral received for securities on loan | 56,509,941 |
| Payables: | |
| Portfolio shares redeemed | 893,821 |
| Manager (See Note 3) | 796,607 |
| NYLIFE Distributors (See Note 3) | 192,461 |
| Professional fees | 48,572 |
| Shareholder communication | 20,070 |
| Custodian | 14,535 |
| Accrued expenses | 7,802 |
| Total liabilities | 58,483,809 |
| Net assets | $1,747,114,826 |
| Composition of Net Assets |
| Shares of beneficial interest outstanding (par value of $.001 per share) unlimited number of shares authorized | $ 118,489 |
| Additional paid-in-capital | 1,679,991,510 |
| | 1,680,109,999 |
| Total distributable earnings (loss) | 67,004,827 |
| Net assets | $1,747,114,826 |
| Initial Class | |
| Net assets applicable to outstanding shares | $833,552,659 |
| Shares of beneficial interest outstanding | 56,160,743 |
| Net asset value per share outstanding | $ 14.84 |
| Service Class | |
| Net assets applicable to outstanding shares | $905,662,582 |
| Shares of beneficial interest outstanding | 61,788,902 |
| Net asset value per share outstanding | $ 14.66 |
| Service 2 Class | |
| Net assets applicable to outstanding shares | $ 7,899,585 |
| Shares of beneficial interest outstanding | 538,876 |
| Net asset value and offering price per share outstanding | $ 14.66 |
The notes to the financial statements are an integral part of, and should be read in conjunction with, the financial statements.
| 16 | MainStay VP MacKay Convertible Portfolio |
Statement of Operations for the year ended December 31, 2023
| Investment Income (Loss) |
| Income | |
| Interest | $ 17,815,926 |
| Dividends-unaffiliated | 6,624,788 |
| Dividends-affiliated | 6,610,636 |
| Securities lending, net | 1,867,424 |
| Total income | 32,918,774 |
| Expenses | |
| Manager (See Note 3) | 9,262,503 |
| Distribution/Service—Service Class (See Note 3) | 2,228,740 |
| Distribution/Service—Service 2 Class (See Note 3) | 18,456 |
| Professional fees | 180,481 |
| Shareholder communication | 99,075 |
| Trustees | 43,982 |
| Custodian | 29,293 |
| Shareholder service (See Note 3) | 7,383 |
| Miscellaneous | 62,537 |
| Total expenses | 11,932,450 |
| Net investment income (loss) | 20,986,324 |
| Realized and Unrealized Gain (Loss) |
| Net realized gain (loss) on unaffiliated investments | 67,703,508 |
| Net change in unrealized appreciation (depreciation) on unaffiliated investments | 53,359,581 |
| Net realized and unrealized gain (loss) | 121,063,089 |
| Net increase (decrease) in net assets resulting from operations | $142,049,413 |
The notes to the financial statements are an integral part of, and should be read in conjunction with, the financial statements.
17
Statements of Changes in Net Assets
for the years ended December 31, 2023 and December 31, 2022
| | 2023 | 2022 |
| Increase (Decrease) in Net Assets |
| Operations: | | |
| Net investment income (loss) | $ 20,986,324 | $ 12,372,739 |
| Net realized gain (loss) | 67,703,508 | (1,458,820) |
| Net change in unrealized appreciation (depreciation) | 53,359,581 | (272,476,633) |
| Net increase (decrease) in net assets resulting from operations | 142,049,413 | (261,562,714) |
| Distributions to shareholders: | | |
| Initial Class | (17,237,211) | (119,474,150) |
| Service Class | (17,118,342) | (135,597,007) |
| Service 2 Class | (130,346) | (1,046,632) |
| Total distributions to shareholders | (34,485,899) | (256,117,789) |
| Capital share transactions: | | |
| Net proceeds from sales of shares | 106,654,993 | 113,733,843 |
| Net asset value of shares issued to shareholders in reinvestment of distributions | 34,485,899 | 256,117,789 |
| Cost of shares redeemed | (163,442,197) | (275,440,951) |
| Increase (decrease) in net assets derived from capital share transactions | (22,301,305) | 94,410,681 |
| Net increase (decrease) in net assets | 85,262,209 | (423,269,822) |
| Net Assets |
| Beginning of year | 1,661,852,617 | 2,085,122,439 |
| End of year | $1,747,114,826 | $1,661,852,617 |
The notes to the financial statements are an integral part of, and should be read in conjunction with, the financial statements.
| 18 | MainStay VP MacKay Convertible Portfolio |
Financial Highlights selected per share data and ratios
| | Year Ended December 31, |
| Initial Class | 2023 | | 2022 | | 2021 | | 2020 | | 2019 |
| Net asset value at beginning of year | $ 13.93 | | $ 18.68 | | $ 18.17 | | $ 13.60 | | $ 12.31 |
| Net investment income (loss) (a) | 0.19 | | 0.13 | | 0.10 | | 0.10 | | 0.13 |
| Net realized and unrealized gain (loss) | 1.03 | | (2.49) | | 1.56 | | 4.74 | | 2.56 |
| Total from investment operations | 1.22 | | (2.36) | | 1.66 | | 4.84 | | 2.69 |
| Less distributions: | | | | | | | | | |
| From net investment income | (0.31) | | (0.55) | | (0.22) | | (0.11) | | (0.20) |
| From net realized gain on investments | — | | (1.84) | | (0.93) | | (0.16) | | (1.20) |
| Total distributions | (0.31) | | (2.39) | | (1.15) | | (0.27) | | (1.40) |
| Net asset value at end of year | $ 14.84 | | $ 13.93 | | $ 18.68 | | $ 18.17 | | $ 13.60 |
| Total investment return (b) | 8.85% | | (12.67)% | | 9.25% | | 36.04% | | 22.46% |
| Ratios (to average net assets)/Supplemental Data: | | | | | | | | | |
| Net investment income (loss) | 1.37% | | 0.82% | | 0.51% | | 0.70% | | 0.94% |
| Net expenses (c) | 0.57% | | 0.57% | | 0.56% | | 0.61% | | 0.61% |
| Portfolio turnover rate | 38% | | 14% | | 41% | | 49% | | 26% |
| Net assets at end of year (in 000's) | $ 833,553 | | $ 782,970 | | $ 946,696 | | $ 370,733 | | $ 202,104 |
| (a) | Per share data based on average shares outstanding during the year. |
| (b) | Total return does not reflect any deduction of sales charges, mortality and expense charges, contract charges or administrative charges. For periods of less than one year, total return is not annualized. |
| (c) | In addition to the fees and expenses which the Portfolio bears directly, it also indirectly bears a pro-rata share of the fees and expenses of the underlying funds in which it invests. Such indirect expenses are not included in the above expense ratios. |
| | Year Ended December 31, |
| Service Class | 2023 | | 2022 | | 2021 | | 2020 | | 2019 |
| Net asset value at beginning of year | $ 13.76 | | $ 18.48 | | $ 17.99 | | $ 13.47 | | $ 12.21 |
| Net investment income (loss) (a) | 0.16 | | 0.09 | | 0.05 | | 0.06 | | 0.09 |
| Net realized and unrealized gain (loss) | 1.01 | | (2.46) | | 1.54 | | 4.69 | | 2.53 |
| Total from investment operations | 1.17 | | (2.37) | | 1.59 | | 4.75 | | 2.62 |
| Less distributions: | | | | | | | | | |
| From net investment income | (0.27) | | (0.51) | | (0.17) | | (0.07) | | (0.16) |
| From net realized gain on investments | — | | (1.84) | | (0.93) | | (0.16) | | (1.20) |
| Total distributions | (0.27) | | (2.35) | | (1.10) | | (0.23) | | (1.36) |
| Net asset value at end of year | $ 14.66 | | $ 13.76 | | $ 18.48 | | $ 17.99 | | $ 13.47 |
| Total investment return (b) | 8.58% | | (12.89)% | | 8.98% | | 35.70% | | 22.15% |
| Ratios (to average net assets)/Supplemental Data: | | | | | | | | | |
| Net investment income (loss) | 1.12% | | 0.57% | | 0.25% | | 0.44% | | 0.69% |
| Net expenses (c) | 0.82% | | 0.82% | | 0.81% | | 0.86% | | 0.86% |
| Portfolio turnover rate | 38% | | 14% | | 41% | | 49% | | 26% |
| Net assets at end of year (in 000's) | $ 905,663 | | $ 872,109 | | $ 1,129,151 | | $ 982,863 | | $ 752,670 |
| (a) | Per share data based on average shares outstanding during the year. |
| (b) | Total return does not reflect any deduction of sales charges, mortality and expense charges, contract charges or administrative charges. For periods of less than one year, total return is not annualized. |
| (c) | In addition to the fees and expenses which the Portfolio bears directly, it also indirectly bears a pro-rata share of the fees and expenses of the underlying funds in which it invests. Such indirect expenses are not included in the above expense ratios. |
The notes to the financial statements are an integral part of, and should be read in conjunction with, the financial statements.
19
Financial Highlights selected per share data and ratios
| | Year Ended December 31, |
| Service Class 2 | 2023 | | 2022 | | 2021 | | 2020 | | 2019 |
| Net asset value at beginning of year | $ 13.76 | | $ 18.48 | | $ 18.00 | | $ 13.47 | | $ 12.21 |
| Net investment income (loss) (a) | 0.14 | | 0.08 | | 0.03 | | 0.05 | | 0.08 |
| Net realized and unrealized gain (loss) | 1.02 | | (2.47) | | 1.53 | | 4.70 | | 2.53 |
| Total from investment operations | 1.16 | | (2.39) | | 1.56 | | 4.75 | | 2.61 |
| Less distributions: | | | | | | | | | |
| From net investment income | (0.26) | | (0.49) | | (0.15) | | (0.06) | | (0.15) |
| From net realized gain on investments | — | | (1.84) | | (0.93) | | (0.16) | | (1.20) |
| Total distributions | (0.26) | | (2.33) | | (1.08) | | (0.22) | | (1.35) |
| Net asset value at end of year | $ 14.66 | | $ 13.76 | | $ 18.48 | | $ 18.00 | | $ 13.47 |
| Total investment return (b) | 8.47% | | (12.97)% | | 8.87% | | 35.57% | | 22.03% |
| Ratios (to average net assets)/Supplemental Data: | | | | | | | | | |
| Net investment income (loss) | 1.02% | | 0.47% | | 0.16% | | 0.32% | | 0.56% |
| Net expenses (c) | 0.92% | | 0.92% | | 0.91% | | 0.96% | | 0.96% |
| Portfolio turnover rate | 38% | | 14% | | 41% | | 49% | | 26% |
| Net assets at end of year (in 000's) | $ 7,900 | | $ 6,774 | | $ 9,275 | | $ 8,196 | | $ 6,555 |
| (a) | Per share data based on average shares outstanding during the year. |
| (b) | Total return does not reflect any deduction of sales charges, mortality and expense charges, contract charges or administrative charges. For periods of less than one year, total return is not annualized. |
| (c) | In addition to the fees and expenses which the Portfolio bears directly, it also indirectly bears a pro-rata share of the fees and expenses of the underlying funds in which it invests. Such indirect expenses are not included in the above expense ratios. |
The notes to the financial statements are an integral part of, and should be read in conjunction with, the financial statements.
| 20 | MainStay VP MacKay Convertible Portfolio |
Notes to Financial Statements
Note 1–Organization and Business
MainStay VP Funds Trust (the “Fund”) was organized as a Delaware statutory trust on February 1, 2011. The Fund is registered under the Investment Company Act of 1940, as amended (the “1940 Act”), as an open-end management investment company. The Fund is comprised of thirty-one separate series (collectively referred to as the “Portfolios”). These financial statements and notes relate to the MainStay VP MacKay Convertible Portfolio (the "Portfolio"), a "diversified” portfolio, as that term is defined in the 1940 Act, as interpreted or modified by regulatory authorities having jurisdiction, from time to time.
Shares of the Portfolio are currently offered to certain separate accounts to fund variable annuity policies and variable universal life insurance policies issued by New York Life Insurance and Annuity Corporation (“NYLIAC”), a wholly-owned subsidiary of New York Life Insurance Company (“New York Life”) and may also be offered to fund variable annuity policies and variable universal life insurance policies issued by other insurance companies. NYLIAC allocates shares of the Portfolio to, among others, certain NYLIAC separate accounts. Service 2 Class shares of the Portfolio are currently offered to certain separate accounts to fund variable annuity policies and variable universal life insurance policies issued by participating insurance companies. Shares of the Portfolio are also offered to the MainStay VP Conservative Allocation Portfolio, MainStay VP Moderate Allocation Portfolio, MainStay VP Growth Allocation Portfolio and MainStay VP Equity Allocation Portfolio, which operate as “funds-of-funds," and other variable insurance funds.
The following table lists the Portfolio's share classes that have been registered and commenced operations:
| Class | Commenced Operations |
| Initial Class | October 1, 1996 |
| Service Class | June 5, 2003 |
| Service 2 Class | April 26, 2016 |
Shares of the Portfolio are offered and are redeemed at a price equal to their respective net asset value (“NAV”) per share. No sales or redemption charge is applicable to the purchase or redemption of the Portfolio's shares. Under the terms of the Fund’s multiple class plan, adopted pursuant to Rule 18f-3 under the 1940 Act, the classes differ in that, among other things, each of Service Class and Service 2 Class shares of the Portfolio pay a combined distribution and service fee of 0.25% of average daily net assets attributable to such Class's shares of the Portfolio to the Distributor (as defined in Note 3(B)) pursuant to a plan adopted in accordance with Rule 12b-1 under the 1940 Act. Contract owners of variable annuity contracts purchased after June 2, 2003, are permitted to invest only in the Service Class and Service 2 Class shares.
The Portfolio's investment objective is to seek capital appreciation together with current income.
Note 2–Significant Accounting Policies
The Portfolio is an investment company and accordingly follows the investment company accounting and reporting guidance of the Financial Accounting Standards Board (“FASB”) Accounting Standards Codification Topic 946 Financial Services—Investment Companies. The Portfolio prepares its financial statements in accordance with generally accepted accounting principles (“GAAP”) in the United States of America and follows the significant accounting policies described below.
(A) Securities Valuation. Investments are usually valued as of the close of regular trading on the New York Stock Exchange (the "Exchange") (usually 4:00 p.m. Eastern time) on each day the Portfolio is open for business ("valuation date").
Pursuant to Rule 2a-5 under the 1940 Act, the Board of Trustees of the Fund (the "Board") has designated New York Life Investment Management LLC (“New York Life Investments” or the "Manager") as its Valuation Designee (the "Valuation Designee"). The Valuation Designee is responsible for performing fair valuations relating to all investments in the Portfolio’s portfolio for which market quotations are not readily available; periodically assessing and managing material valuation risks; establishing and applying fair value methodologies; testing fair valuation methodologies; evaluating and overseeing pricing services; ensuring appropriate segregation of valuation and portfolio management functions; providing quarterly, annual and prompt reporting to the Board, as appropriate; identifying potential conflicts of interest; and maintaining appropriate records. The Valuation Designee has established a valuation committee ("Valuation Committee") to assist in carrying out the Valuation Designee’s responsibilities and establish prices of securities for which market quotations are not readily available. The Portfolio's and the Valuation Designee's policies and procedures ("Valuation Procedures") govern the Valuation Designee’s selection and application of methodologies for determining and calculating the fair value of Portfolio investments. The Valuation Designee may value the Portfolio's portfolio securities for which market quotations are not readily available and other Portfolio assets utilizing inputs from pricing services and other third-party sources. The Valuation Committee meets (in person, via electronic mail or via teleconference) on an ad-hoc basis to determine fair valuations and on a quarterly basis to review fair value events with respect to certain securities for which market quotations are not readily available, including valuation risks and back-testing results, and to preview reports to the Board.
The Valuation Committee establishes prices of securities for which market quotations are not readily available based on such methodologies and measurements on a regular basis after considering information that is reasonably available and deemed relevant by the Valuation Committee. The Board shall oversee the Valuation Designee and review fair valuation materials on a prompt, quarterly and annual basis and approve proposed revisions to the Valuation Procedures.
Investments for which market quotations are not readily available are valued at fair value as determined in good faith pursuant to the Valuation
Notes to Financial Statements (continued)
Procedures. A market quotation is readily available only when that quotation is a quoted price (unadjusted) in active markets for identical investments that the Portfolio can access at the measurement date, provided that a quotation will not be readily available if it is not reliable. "Fair value" is defined as the price the Portfolio would reasonably expect to receive upon selling an asset or liability in an orderly transaction to an independent buyer in the principal or most advantageous market for the asset or liability. Fair value measurements are determined within a framework that establishes a three-tier hierarchy that maximizes the use of observable market data and minimizes the use of unobservable inputs to establish a classification of fair value measurements for disclosure purposes. "Inputs" refer broadly to the assumptions that market participants would use in pricing the asset or liability, including assumptions about risk, such as the risk inherent in a particular valuation technique used to measure fair value using a pricing model and/or the risk inherent in the inputs for the valuation technique. Inputs may be observable or unobservable. Observable inputs reflect the assumptions market participants would use in pricing the asset or liability based on market data obtained from sources independent of the Portfolio. Unobservable inputs reflect the Portfolio’s own assumptions about the assumptions market participants would use in pricing the asset or liability based on the information available. The inputs or methodology used for valuing assets or liabilities may not be an indication of the risks associated with investing in those assets or liabilities. The three-tier hierarchy of inputs is summarized below.
| • | Level 1—quoted prices (unadjusted) in active markets for an identical asset or liability |
| • | Level 2—other significant observable inputs (including quoted prices for a similar asset or liability in active markets, interest rates and yield curves, prepayment speeds, credit risk, etc.) |
| • | Level 3—significant unobservable inputs (including the Portfolio's own assumptions about the assumptions that market participants would use in measuring fair value of an asset or liability) |
The level of an asset or liability within the fair value hierarchy is based on the lowest level of an input, both individually and in the aggregate, that is significant to the fair value measurement. The aggregate value by input level of the Portfolio’s assets and liabilities as of December 31, 2023, is included at the end of the Portfolio of Investments.
The Portfolio may use third-party vendor evaluations, whose prices may be derived from one or more of the following standard inputs, among others:
| • Benchmark yields | • Reported trades |
| • Broker/dealer quotes | • Issuer spreads |
| • Two-sided markets | • Benchmark securities |
| • Bids/offers | • Reference data (corporate actions or material event notices) |
| • Industry and economic events | • Comparable bonds |
| • Monthly payment information | |
An asset or liability for which a market quotation is not readily available is valued by methods deemed reasonable in good faith by the Valuation Committee, following the Valuation Procedures to represent fair value. Under these procedures, the Valuation Designee generally uses a market-based approach which may use related or comparable assets or liabilities, recent transactions, market multiples, book values and other relevant information. The Valuation Designee may also use an income-based valuation approach in which the anticipated future cash flows of the asset or liability are discounted to calculate fair value. Discounts may also be applied due to the nature and/or duration of any restrictions on the disposition of the asset or liability. Fair value represents a good faith approximation of the value of a security. Fair value determinations involve the consideration of a number of subjective factors, an analysis of applicable facts and circumstances and the exercise of judgment. As a result, it is possible that the fair value for a security determined in good faith in accordance with the Valuation Procedures may differ from valuations for the same security determined for other funds using their own valuation procedures. Although the Valuation Procedures are designed to value a security at the price the Portfolio may reasonably expect to receive upon the security's sale in an orderly transaction, there can be no assurance that any fair value determination thereunder would, in fact, approximate the amount that the Portfolio would actually realize upon the sale of the security or the price at which the security would trade if a reliable market price were readily available. During the year ended December 31, 2023, there were no material changes to the fair value methodologies.
Securities which may be valued in this manner include, but are not limited to: (i) a security for which trading has been halted or suspended or otherwise does not have a readily available market quotation on a given day; (ii) a debt security that has recently gone into default and for which there is not a current market quotation; (iii) a security of an issuer that has entered into a restructuring; (iv) a security that has been delisted from a national exchange; (v) a security subject to trading collars for which no or limited trading takes place; and (vi) a security whose principal market has been temporarily closed at a time when, under normal conditions, it would be open. Securities valued in this manner are generally categorized as Level 2 or 3 in the hierarchy.
Equity securities, rights and warrants, if applicable, are valued at the last quoted sales prices as of the close of regular trading on the relevant exchange on each valuation date. Securities that are not traded on the valuation date are valued at the mean of the last quoted bid and ask prices. Prices are normally taken from the principal market in which each security trades. These securities are generally categorized as Level 1 in the hierarchy.
Certain convertible preferred stocks may be valued utilizing evaluated prices based on market inputs obtained from the pricing vendor and are generally categorized as Level 2 in the hierarchy.
| 22 | MainStay VP MacKay Convertible Portfolio |
Investments in mutual funds, including money market funds, are valued at their respective NAVs at the close of business each day on the valuation date. These securities are generally categorized as Level 1 in the hierarchy.
Debt securities (other than convertible and municipal bonds) are valued at the evaluated bid prices (evaluated mean prices in the case of convertible and municipal bonds) supplied by a pricing agent or broker selected by the Valuation Designee, in consultation with the Subadvisor. The evaluations are market-based measurements processed through a pricing application and represents the pricing agent’s good faith determination as to what a holder may receive in an orderly transaction under market conditions. The rules-based logic utilizes valuation techniques that reflect participants’ assumptions and vary by asset class and per methodology, maximizing the use of relevant observable data including quoted prices for similar assets, benchmark yield curves and market corroborated inputs. The evaluated bid or mean prices are deemed by the Valuation Designee, in consultation with the Subadvisor, to be representative of market values at the regular close of trading of the Exchange on each valuation date. Debt securities purchased on a delayed delivery basis are marked to market daily until settlement at the forward settlement date. Debt securities, including corporate bonds, U.S. government and federal agency bonds, municipal bonds, foreign bonds, convertible bonds, asset-backed securities and mortgage-backed securities are generally categorized as Level 2 in the hierarchy.
Temporary cash investments acquired in excess of 60 days to maturity at the time of purchase are valued using the latest bid prices or using valuations based on a matrix system (which considers such factors as security prices, yields, maturities and ratings), both as furnished by independent pricing services. Temporary cash investments that mature in 60 days or less at the time of purchase ("Short-Term Investments") are valued using the amortized cost method of valuation, unless the use of such method would be inappropriate. The amortized cost method involves valuing a security at its cost on the date of purchase and thereafter assuming a constant amortization to maturity of the difference between such cost and the value on maturity date. Amortized cost approximates the current fair value of a security. Securities valued using the amortized cost method are not valued using quoted prices in an active market and are generally categorized as Level 2 in the hierarchy.
The information above is not intended to reflect an exhaustive list of the methodologies that may be used to value portfolio investments. The Valuation Procedures permit the use of a variety of valuation methodologies in connection with valuing portfolio investments. The methodology used for a specific type of investment may vary based on the market data available or other considerations. The methodologies summarized above may not represent the specific means by which portfolio investments are valued on any particular business day.
(B) Income Taxes. The Portfolio's policy is to comply with the requirements of the Internal Revenue Code of 1986, as amended (the “Internal Revenue Code”), applicable to regulated investment companies
and to distribute all of its taxable income to the shareholders of the Portfolio within the allowable time limits.
The Manager evaluates the Portfolio’s tax positions to determine if the tax positions taken meet the minimum recognition threshold in connection with accounting for uncertainties in income tax positions taken or expected to be taken for the purposes of measuring and recognizing tax liabilities in the financial statements. Recognition of tax benefits of an uncertain tax position is permitted only to the extent the position is “more likely than not” to be sustained assuming examination by taxing authorities. The Manager analyzed the Portfolio's tax positions taken on federal, state and local income tax returns for all open tax years (for up to three tax years) and has concluded that no provisions for federal, state and local income tax are required in the Portfolio's financial statements. The Portfolio's federal, state and local income tax and federal excise tax returns for tax years for which the applicable statutes of limitations have not expired are subject to examination by the Internal Revenue Service and state and local departments of revenue.
(C) Dividends and Distributions to Shareholders. Dividends and distributions are recorded on the ex-dividend date. The Portfolio intends to declare and pay dividends from net investment income, if any, at least quarterly and distributions from net realized capital and currency gains, if any, at least annually. All dividends and distributions are reinvested at NAV in the same class of shares of the Portfolio. Dividends and distributions to shareholders are determined in accordance with federal income tax regulations and may differ from determinations using GAAP.
(D) Security Transactions and Investment Income. The Portfolio records security transactions on the trade date. Realized gains and losses on security transactions are determined using the identified cost method. Dividend income is recognized on the ex-dividend date, net of any foreign tax withheld at the source, and interest income is accrued as earned using the effective interest rate method. Distributions received from real estate investment trusts may be classified as dividends, capital gains and/or return of capital. Discounts and premiums on securities purchased for the Portfolio are accreted and amortized, respectively, on the effective interest rate method. Premium associated with the conversion feature on a convertible bond is not amortized.
Investment income and realized and unrealized gains and losses on investments of the Portfolio are allocated pro rata to the separate classes of shares based upon their relative net assets on the date the income is earned or realized and unrealized gains and losses are incurred.
The Portfolio may place a debt security on non-accrual status and reduce related interest income by ceasing current accruals and writing off all or a portion of any interest receivables when the collection of all or a portion of such interest has become doubtful. A debt security is removed from non-accrual status when the issuer resumes interest payments or when collectability of interest is reasonably assured.
(E) Expenses. Expenses of the Fund are allocated to the individual Portfolios in proportion to the net assets of the respective Portfolios when the expenses are incurred, except where direct allocations of expenses
Notes to Financial Statements (continued)
can be made. Expenses (other than fees incurred under the distribution and service plans and shareholder service plans, further discussed in Note 3(B), which are charged directly to the Service Class and Service 2 Class shares, as applicable) are allocated to separate classes of shares pro rata based upon their relative net assets on the date the expenses are incurred. The expenses borne by the Portfolio, including those of related parties to the Portfolio, are shown in the Statement of Operations.
Additionally, the Portfolio may invest in mutual funds, which are subject to management fees and other fees that may cause the costs of investing in mutual funds to be greater than the costs of owning the underlying securities directly. These indirect expenses of mutual funds are not included in the amounts shown as expenses in the Statement of Operations or in the expense ratios included in the Financial Highlights.
(F) Use of Estimates. In preparing financial statements in conformity with GAAP, the Manager makes estimates and assumptions that affect the reported amounts and disclosures in the financial statements. Actual results could differ from those estimates and assumptions.
(G) Securities Lending. In order to realize additional income, the Portfolio may engage in securities lending, subject to the limitations set forth in the 1940 Act and relevant guidance by the staff of the Securities and Exchange Commission (“SEC”). If the Portfolio engages in securities lending, the Portfolio will lend through its custodian, JPMorgan Chase Bank, N.A., ("JPMorgan"), acting as securities lending agent on behalf of the Portfolio. Under the current arrangement, JPMorgan will manage the Portfolio's collateral in accordance with the securities lending agency agreement between the Portfolio and JPMorgan, and indemnify the Portfolio against counterparty risk. The loans will be collateralized by cash (which may be invested in a money market fund) and/or non-cash collateral (which may include U.S. Treasury securities and/or U.S. government agency securities issued or guaranteed by the United States government or its agencies or instrumentalities) at least equal at all times to the market value of the securities loaned. Non-cash collateral held at year end is segregated and cannot be transferred by the Portfolio. The Portfolio bears the risk of delay in recovery of, or loss of rights in, the securities loaned. The Portfolio may also record a realized gain or loss on securities deemed sold due to a borrower’s inability to return securities on loan. The Portfolio bears the risk of any loss on investment of cash collateral. The Portfolio will receive compensation for lending its securities in the form of fees or it will retain a portion of interest earned on the investment of any cash collateral. The Portfolio will also continue to receive interest and dividends on the securities loaned and any gain or loss in the market price of the securities loaned that may occur during the term of the loan will be for the account of the Portfolio. Income earned from securities lending activities, if any, is reflected in the Statement of Operations.
(H) Debt and Convertible Securities Risk. The ability of issuers of debt securities held by the Portfolio to meet their obligations may be affected by, among other things, economic or political developments in a specific country, industry or region. Debt securities are also subject to the risks associated with changes in interest rates.
Convertible securities may be subordinate to other securities. In part, the total return for a convertible security depends upon the performance of the underlying stock into which it can be converted. Also, issuers of convertible securities are often not as strong financially as those issuing securities with higher credit ratings, are more likely to encounter financial difficulties and typically are more vulnerable to changes in the economy, such as a recession or a sustained period of rising interest rates, which could affect their ability to make interest and principal payments.
(I) Indemnifications. Under the Fund’s organizational documents, its officers and trustees are indemnified against certain liabilities that may arise out of performance of their duties to the Fund. Additionally, in the normal course of business, the Portfolio enters into contracts with third-party service providers that contain a variety of representations and warranties and that may provide general indemnifications. The Portfolio's maximum exposure under these arrangements is unknown, as this would involve future claims that may be made against the Portfolio that have not yet occurred. The Manager believes that the risk of loss in connection with these potential indemnification obligations is remote. However, there can be no assurance that material liabilities related to such obligations will not arise in the future, which could adversely impact the Portfolio.
Note 3–Fees and Related Party Transactions
(A) Manager and Subadvisor. New York Life Investments, a registered investment adviser and an indirect, wholly-owned subsidiary of New York Life, serves as the Portfolio's Manager, pursuant to an Amended and Restated Management Agreement ("Management Agreement"). The Manager provides offices, conducts clerical, recordkeeping and bookkeeping services and keeps most of the financial and accounting records required to be maintained by the Portfolio. Except for the portion of salaries and expenses that are the responsibility of the Portfolio, the Manager pays the salaries and expenses of all personnel affiliated with the Portfolio and certain operational expenses of the Portfolio. The Portfolio reimburses New York Life Investments in an amount equal to the portion of the compensation of the Chief Compliance Officer attributable to the Portfolio. MacKay Shields LLC ("MacKay Shields" or the "Subadvisor"), a registered investment adviser and an indirect, wholly-owned subsidiary of New York Life, serves as the Subadvisor to the Portfolio and is responsible for the day-to-day portfolio management of the Portfolio. Pursuant to the terms of an Amended and Restated Subadvisory Agreement between New York Life Investments and MacKay Shields, New York Life Investments pays for the services of the Subadvisor.
Pursuant to the Management Agreement, the Fund pays the Manager, on behalf of the Portfolio, a monthly fee for the services performed and the facilities furnished at an annual rate of the Portfolio's average daily net assets as follows: 0.60% up to $500 million; 0.55% from $500 million to $1 billion; 0.50% from $1 billion to $2 billion; and 0.49% in excess of $2 billion. During the year ended December 31, 2023, the effective management fee rate was 0.54% of the Portfolio's average daily net assets.
| 24 | MainStay VP MacKay Convertible Portfolio |
During the year ended December 31, 2023, New York Life Investments earned fees from the Portfolio in the amount of $9,262,503 and paid the Subadvisor fees in the amount of $4,631,252.
JPMorgan provides sub-administration and sub-accounting services to the Portfolio pursuant to an agreement with New York Life Investments. These services include calculating the daily NAVs of the Portfolio, maintaining the general ledger and sub-ledger accounts for the calculation of the Portfolio's NAVs, and assisting New York Life Investments in conducting various aspects of the Portfolio's administrative operations. For providing these services to the Portfolio, JPMorgan is compensated by New York Life Investments.
Pursuant to an agreement between the Fund and New York Life Investments, New York Life Investments is responsible for providing or procuring certain regulatory reporting services for the Portfolio. The Portfolio will reimburse New York Life Investments for the actual costs incurred by New York Life Investments in connection with providing or procuring these services for the Portfolio.
(B) Distribution, Service and Shareholder Service Fees. The Fund, on behalf of the Portfolio, has entered into a distribution agreement with NYLIFE Distributors LLC (the “Distributor”), an affiliate of New York Life Investments. The Portfolio has adopted a distribution plan (the “Plan”) in accordance with the provisions of Rule 12b-1 under the 1940 Act. Under the Plan, the Distributor has agreed to provide, through its affiliates or independent third parties, various distribution-related, shareholder and administrative support services to the Service Class and Service 2 Class shareholders. For its services, the Distributor is entitled to a combined distribution and service fee accrued daily and paid monthly at an annual rate of 0.25% of the average daily net assets attributable to the Service Class and Service 2 Class shares of the Portfolio.
The Board has adopted a shareholder services plan (the “Service Plan”) with respect to the Service 2 Class shares of the Portfolio. Under the terms of the Services Plan, the Portfolio is authorized to pay to New York Life Investments, its affiliates or independent third-party service providers, as compensation for services rendered to shareholders of the Service 2 Class shares, in connection with the administration of plans or programs that use Portfolio shares as their funding medium a shareholder servicing fee at the rate of 0.10% on an annualized basis of the average daily net assets of the Service 2 Class shares.
(C) Transfer and Dividend Disbursing Agent. NYLIM Service Company LLC, an affiliate of New York Life Investments, serves as the transfer agent and dividend disbursing agent for Service Class and Service 2 Class shares of the Portfolio. NYLIM Service Company LLC has entered into an agreement with SS&C Global Investor & Distributor Solutions, Inc. (“SS&C”), pursuant to which SS&C performs certain transfer agent services on behalf of NYLIM Service Company LLC. During the year ended December 31, 2023, all associated fees were paid by the Manager.
Note 4-Federal Income Tax
As of December 31, 2023, the cost and unrealized appreciation (depreciation) of the Portfolio’s investment portfolio, including applicable derivative contracts and other financial instruments, as determined on a federal income tax basis, were as follows:
| | Federal Tax
Cost | Gross
Unrealized
Appreciation | Gross
Unrealized
(Depreciation) | Net
Unrealized
Appreciation/
(Depreciation) |
| Investments in Securities | $1,797,148,859 | $112,361,777 | $(109,551,790) | $2,809,987 |
As of December 31, 2023, the components of accumulated gain (loss) on a tax basis were as follows:
Ordinary
Income | Accumulated
Capital
and Other
Gain (Loss) | Other
Temporary
Differences | Unrealized
Appreciation
(Depreciation) | Total
Accumulated
Gain (Loss) |
| $37,373,339 | $26,821,501 | $— | $2,809,987 | $67,004,827 |
The difference between book-basis and tax-basis unrealized appreciation (depreciation) is primarily due to cumulative section 305(c) adjustment.
The Portfolio utilized $5,201,253 of capital loss carryforwards during the year ended December 31, 2023.
During the years ended December 31, 2023 and December 31, 2022, the tax character of distributions paid as reflected in the Statements of Changes in Net Assets was as follows:
| | 2023 | 2022 |
| Distributions paid from: | | |
| Ordinary Income | $34,485,899 | $ 81,124,031 |
| Long-Term Capital Gains | — | 174,993,758 |
| Total | $34,485,899 | $256,117,789 |
Note 5–Custodian
JPMorgan is the custodian of cash and securities held by the Portfolio. Custodial fees are charged to the Portfolio based on the Portfolio's net assets and/or the market value of securities held by the Portfolio and the number of certain transactions incurred by the Portfolio.
Note 6–Line of Credit
The Portfolio and certain other funds managed by New York Life Investments maintain a line of credit with a syndicate of banks in order to secure a source of funds for temporary purposes to meet unanticipated or excessive redemption requests.
Effective July 25, 2023, under the credit agreement (the “Credit Agreement”), the aggregate commitment amount is $600,000,000 with an additional uncommitted amount of $100,000,000. The commitment fee is an annual rate of 0.15% of the average commitment amount payable quarterly, regardless of usage, to JPMorgan, who serves as the
Notes to Financial Statements (continued)
agent to the syndicate. The commitment fee is allocated among the Portfolio and certain other funds managed by New York Life Investments based upon their respective net assets and other factors. Interest on any revolving credit loan is charged based upon the Federal Funds Rate, Daily Simple Secured Overnight Financing Rate ("SOFR") + 0.10%, or the Overnight Bank Funding Rate, whichever is higher. The Credit Agreement expires on July 23, 2024, although the Portfolio, certain other funds managed by New York Life Investments and the syndicate of banks may renew the Credit Agreement for an additional year on the same or different terms or enter into a credit agreement with a different syndicate of banks. Prior to July 25, 2023, the aggregate commitment amount and the commitment fee were the same as those under the current Credit Agreement. During the year ended December 31, 2023, there were no borrowings made or outstanding with respect to the Portfolio under the Credit Agreement.
Note 7–Interfund Lending Program
Pursuant to an exemptive order issued by the SEC, the Portfolio, along with certain other funds managed by New York Life Investments, may participate in an interfund lending program. The interfund lending program provides an alternative credit facility that permits the Portfolio and certain other funds managed by New York Life Investments to lend or borrow money for temporary purposes directly to or from one another, subject to the conditions of the exemptive order. During the year ended December 31, 2023, there were no interfund loans made or outstanding with respect to the Portfolio.
Note 8–Purchases and Sales of Securities (in 000’s)
During the year ended December 31, 2023, purchases and sales of securities, other than short-term securities, were $596,255 and $677,477, respectively.
Note 9–Capital Share Transactions
Transactions in capital shares for the years ended December 31, 2023 and December 31, 2022, were as follows:
| Initial Class | Shares | Amount |
| Year ended December 31, 2023: | | |
| Shares sold | 716,916 | $ 10,224,385 |
| Shares issued to shareholders in reinvestment of distributions | 1,207,380 | 17,237,211 |
| Shares redeemed | (1,968,945) | (28,103,401) |
| Net increase (decrease) | (44,649) | $ (641,805) |
| Year ended December 31, 2022: | | |
| Shares sold | 960,462 | $ 15,906,247 |
| Shares issued to shareholders in reinvestment of distributions | 8,323,723 | 119,474,150 |
| Shares redeemed | (3,767,669) | (61,588,499) |
| Net increase (decrease) | 5,516,516 | $ 73,791,898 |
| |
| Service Class | Shares | Amount |
| Year ended December 31, 2023: | | |
| Shares sold | 6,712,086 | $ 94,803,492 |
| Shares issued to shareholders in reinvestment of distributions | 1,215,573 | 17,118,342 |
| Shares redeemed | (9,515,370) | (134,196,532) |
| Net increase (decrease) | (1,587,711) | $ (22,274,698) |
| Year ended December 31, 2022: | | |
| Shares sold | 5,529,322 | $ 89,567,994 |
| Shares issued to shareholders in reinvestment of distributions | 9,560,026 | 135,597,007 |
| Shares redeemed | (12,812,180) | (204,200,397) |
| Net increase (decrease) | 2,277,168 | $ 20,964,604 |
| |
| Service 2 Class | Shares | Amount |
| Year ended December 31, 2023: | | |
| Shares sold | 118,793 | $ 1,627,116 |
| Shares issued to shareholders in reinvestment of distributions | 9,249 | 130,346 |
| Shares redeemed | (81,329) | (1,142,264) |
| Net increase (decrease) | 46,713 | $ 615,198 |
| Year ended December 31, 2022: | | |
| Shares sold | 499,962 | $ 8,259,602 |
| Shares issued to shareholders in reinvestment of distributions | 73,917 | 1,046,632 |
| Shares redeemed | (583,606) | (9,652,055) |
| Net increase (decrease) | (9,727) | $ (345,821) |
Note 10–Other Matters
As of the date of this report, the Portfolio faces a heightened level of risk associated with current uncertainty, volatility and state of economies, financial markets, rising interest rates, and labor and health conditions around the world. Events such as war, acts of terrorism, recessions, rapid inflation, the imposition of international sanctions, earthquakes,
| 26 | MainStay VP MacKay Convertible Portfolio |
hurricanes, epidemics and pandemics and other unforeseen natural or human disasters may have broad adverse social, political and economic effects on the global economy, which could negatively impact the value of the Portfolio's investments. Developments that disrupt global economies and financial markets may magnify factors that affect the Portfolio's performance.
Note 11–Subsequent Events
In connection with the preparation of the financial statements of the Portfolio as of and for the year ended December 31, 2023, events and transactions subsequent to December 31, 2023, through the date the financial statements were issued, have been evaluated by the Manager for possible adjustment and/or disclosure. No subsequent events requiring financial statement adjustment or disclosure have been identified.
Report of Independent Registered Public Accounting Firm
To the Board of Trustees of MainStay VP Funds Trust and Shareholders of MainStay VP MacKay Convertible Portfolio
Opinion on the Financial Statements
We have audited the accompanying statement of assets and liabilities, including the portfolio of investments, of MainStay VP MacKay Convertible Portfolio (one of the portfolios constituting MainStay VP Funds Trust, referred to hereafter as the “Portfolio”) as of December 31, 2023, the related statement of operations for the year ended December 31, 2023, the statements of changes in net assets for each of the two years in the period ended December 31, 2023, including the related notes, and the financial highlights for each of the five years in the period ended December 31, 2023 (collectively referred to as the “financial statements”). In our opinion, the financial statements present fairly, in all material respects, the financial position of the Portfolio as of December 31, 2023, the results of its operations for the year then ended, the changes in its net assets for each of the two years in the period ended December 31, 2023 and the financial highlights for each of the five years in the period ended December 31, 2023 in conformity with accounting principles generally accepted in the United States of America.
Basis for Opinion
These financial statements are the responsibility of the Portfolio’s management. Our responsibility is to express an opinion on the Portfolio’s financial statements based on our audits. We are a public accounting firm registered with the Public Company Accounting Oversight Board (United States) (PCAOB) and are required to be independent with respect to the Portfolio in accordance with the U.S. federal securities laws and the applicable rules and regulations of the Securities and Exchange Commission and the PCAOB.
We conducted our audits of these financial statements in accordance with the standards of the PCAOB. Those standards require that we plan and perform the audit to obtain reasonable assurance about whether the financial statements are free of material misstatement, whether due to error or fraud.
Our audits included performing procedures to assess the risks of material misstatement of the financial statements, whether due to error or fraud, and performing procedures that respond to those risks. Such procedures included examining, on a test basis, evidence regarding the amounts and disclosures in the financial statements. Our audits also included evaluating the accounting principles used and significant estimates made by management, as well as evaluating the overall presentation of the financial statements. Our procedures included confirmation of securities owned as of December 31, 2023 by correspondence with the custodian and transfer agents. We believe that our audits provide a reasonable basis for our opinion.
/s/PricewaterhouseCoopers LLP
New York, New York
February 26, 2024
We have served as the auditor of one or more investment companies in the MainStay group of funds since 1984.
| 28 | MainStay VP MacKay Convertible Portfolio |
Board Consideration and Approval of Management Agreement and Subadvisory Agreement (Unaudited)
The continuation of the Management Agreement with respect to the MainStay VP MacKay Convertible Portfolio (“Portfolio”) and New York Life Investment Management LLC (“New York Life Investments”) and the Subadvisory Agreement between New York Life Investments and MacKay Shields LLC (“MacKay”) with respect to the Portfolio (together, “Advisory Agreements”) is subject to annual review and approval by the Board of Trustees of MainStay VP Funds Trust (“Board” of the “Trust”) in accordance with Section 15 of the Investment Company Act of 1940, as amended (“1940 Act”). At its December 6–7, 2023 meeting, the Board, including the Trustees who are not an “interested person” (as such term is defined in the 1940 Act) of the Trust (“Independent Trustees”) voting separately, unanimously approved the continuation of each of the Advisory Agreements for a one-year period.
In reaching the decision to approve the continuation of each of the Advisory Agreements, the Board considered information and materials furnished by New York Life Investments and MacKay in connection with an annual contract review process undertaken by the Board that took place at meetings of the Board and its Contracts Committee from September 2023 through December 2023, including information and materials furnished by New York Life Investments and MacKay in response to requests prepared on behalf of the Board, and in consultation with the Independent Trustees, by independent legal counsel to the Independent Trustees, which encompassed a variety of topics, including those summarized below. Information and materials requested by and furnished to the Board for consideration in connection with the contract review process included, among other items, reports on the Portfolio and “peer funds” prepared by Institutional Shareholder Services Inc. (“ISS”), an independent third-party service provider engaged by the Board to report objectively on the Portfolio’s investment performance, management fee and total expenses. The Board also considered information on the fees charged to other investment advisory clients of New York Life Investments and/or MacKay that follow investment strategies similar to those of the Portfolio, if any, and, when applicable, the rationale for differences in the Portfolio’s management and subadvisory fees and the fees charged to those other investment advisory clients. In addition, the Board considered information regarding the legal standards and fiduciary obligations applicable to its consideration of the continuation of each of the Advisory Agreements. The contract review process, including the structure and format for information and materials provided to the Board, has been developed in consultation with the Board. The Independent Trustees also met in executive sessions with their independent legal counsel and, for portions thereof, with senior management of New York Life Investments.
The Board’s deliberations with respect to the continuation of each of the Advisory Agreements reflect a year-long process, and the Board also took into account information furnished to the Board and its Committees throughout the year, as deemed relevant and appropriate by the Trustees, including, among other items, reports on investment performance of the Portfolio and investment-related matters for the Portfolio as well as presentations from New York Life Investments and, generally annually, MacKay personnel. In addition, the Board took into account
other information provided by New York Life Investments throughout the year, including, among other items, periodic reports on legal and compliance matters, risk management, portfolio turnover, brokerage commissions and non-advisory services provided to the Portfolio by New York Life Investments, as deemed relevant and appropriate by the Trustees.
In addition to information provided to the Board throughout the year, the Board received information in connection with its June 2023 meeting provided specifically in response to requests prepared on behalf of the Board, and in consultation with the Independent Trustees, by independent legal counsel to the Independent Trustees regarding the Portfolio’s distribution arrangements. In addition, the Board received information regarding the Portfolio’s asset levels, share purchase and redemption activity and the payment of Rule 12b-1 and/or certain other fees by the applicable share classes of the Portfolio, among other information.
In considering the continuation of each of the Advisory Agreements, the Trustees reviewed and evaluated the information and factors they believed to reasonably be necessary and appropriate in light of legal advice furnished to them by independent legal counsel to the Independent Trustees and through the exercise of their own business judgment. Although individual Trustees may have weighed certain factors or information differently and the Board did not consider any single factor or information controlling in reaching its decision, the factors that figured prominently in the Board’s consideration of the continuation of each of the Advisory Agreements are summarized in more detail below and include, among other factors: (i) the nature, extent and quality of the services provided to the Portfolio by New York Life Investments and MacKay; (ii) the qualifications of the portfolio manager of the Portfolio and the historical investment performance of the Portfolio, New York Life Investments and MacKay; (iii) the costs of the services provided, and profits realized, by New York Life Investments and MacKay with respect to their relationships with the Portfolio; (iv) the extent to which economies of scale have been realized or may be realized if the Portfolio grows and the extent to which any economies of scale have been shared, have benefited or may benefit the Portfolio’s shareholders; and (v) the reasonableness of the Portfolio’s management and subadvisory fees and total ordinary operating expenses. Although the Board recognized that comparisons between the Portfolio’s fees and expenses and those of other funds are imprecise given different terms of agreements, variations in fund strategies and other factors, the Board considered the reasonableness of the Portfolio’s management fee and total ordinary operating expenses as compared to the peer funds identified by ISS. Throughout their considerations, the Trustees acknowledged the commitment of New York Life Investments and its affiliates to serve the MainStay Group of Funds, as well as their capacity, experience, resources, financial stability and reputations. The Trustees also acknowledged the entrepreneurial and other risks assumed by New York Life Investments in sponsoring and managing the Portfolio. With respect to the Subadvisory Agreement, the Board took into account New York Life Investments’ recommendation to approve the continuation of the Subadvisory Agreement.
Board Consideration and Approval of Management Agreement and Subadvisory Agreement (Unaudited) (continued)
The Trustees noted that, throughout the year, the Trustees are afforded an opportunity to ask questions of, and request additional information or materials from, New York Life Investments and MacKay. The Board’s decision with respect to each of the Advisory Agreements may have also been based, in part, on the Board’s knowledge of New York Life Investments and MacKay resulting from, among other things, the Board’s consideration of each of the Advisory Agreements in prior years, the advisory agreements for other funds in the MainStay Group of Funds, the Board’s review throughout the year of the performance and operations of other funds in the MainStay Group of Funds and each Trustee’s business judgment and industry experience. In addition to considering the above-referenced factors, the Board observed that in the marketplace, notably under variable life insurance policies and variable annuity contracts for which the Portfolio serves as an investment option, there are a range of investment options available to investors and that the Portfolio’s shareholders, having had the opportunity to consider other investment options, have invested in the Portfolio.
The factors that figured prominently in the Board’s decision to approve the continuation of each of the Advisory Agreements during the Board’s December 6–7, 2023 meeting are summarized in more detail below.
Nature, Extent and Quality of Services Provided by New York Life Investments and MacKay
The Board examined the nature, extent and quality of the services that New York Life Investments provides to the Portfolio. The Board evaluated New York Life Investments’ experience and capabilities in serving as manager of the Portfolio and considered that the Portfolio operates in a “manager-of-managers” structure. The Board also considered New York Life Investments’ responsibilities and services provided pursuant to this structure, including overseeing the services provided by MacKay, evaluating the performance of MacKay, making recommendations to the Board as to whether the Subadvisory Agreement should be renewed, modified or terminated and periodically reporting to the Board regarding the results of New York Life Investments’ evaluation and monitoring functions. The Board noted that New York Life Investments manages other mutual funds, serves a variety of other investment advisory clients, including other pooled investment vehicles, and has experience overseeing mutual fund service providers, including subadvisors. The Board considered the experience of senior personnel at New York Life Investments providing management and administrative and other non-advisory services to the Portfolio. The Board observed that New York Life Investments devotes significant resources and time to providing management and administrative and other non-advisory services to the Portfolio, including New York Life Investments’ oversight and due diligence reviews of MacKay and ongoing analysis of, and interactions with, MacKay with respect to, among other things, the Portfolio’s investment performance and risks as well as MacKay’s investment capabilities and subadvisory services with respect to the Portfolio.
The Board also considered the range of services that New York Life Investments provides to the Portfolio under the terms of the Management Agreement, including: (i) fund accounting and ongoing supervisory
services provided by New York Life Investments’ Fund Administration and Accounting Group; (ii) investment supervisory and analytical services provided by New York Life Investments’ Investment Consulting Group; (iii) compliance services provided by the Trust’s Chief Compliance Officer as well as New York Life Investments’ compliance department, including supervision and implementation of the Portfolio’s compliance program; (iv) legal services provided by New York Life Investments’ Office of the General Counsel; and (v) risk management monitoring and analysis by compliance and investment personnel. In addition, the Board considered New York Life Investments’ willingness to invest in personnel and other resources, such as cyber security, information security and business continuity planning, that may benefit the Portfolio and noted that New York Life Investments is responsible for compensating the Trust’s officers, except for a portion of the salary of the Trust’s Chief Compliance Officer. The Board recognized that New York Life Investments provides certain other non-advisory services to the Portfolio and has over time provided an increasingly broad array of non-advisory services to the MainStay Group of Funds as a result of regulatory and other developments.
The Board also examined the range, and the nature, extent and quality, of the investment advisory services that MacKay provides to the Portfolio and considered the terms of each of the Advisory Agreements. The Board evaluated MacKay’s experience and performance in serving as subadvisor to the Portfolio and advising other portfolios and MacKay’s track record and experience in providing investment advisory services as well as the experience of investment advisory, senior management and administrative personnel at MacKay. The Board considered New York Life Investments’ and MacKay’s overall resources, legal and compliance environment, capabilities, reputation, financial condition and history. In addition to information provided in connection with quarterly meetings with the Trust’s Chief Compliance Officer, the Board considered information regarding the compliance policies and procedures of New York Life Investments and MacKay and acknowledged their commitment to further developing and strengthening compliance programs that may relate to the Portfolio. The Board also considered MacKay’s ability to recruit and retain qualified investment professionals and willingness to invest in personnel and other resources that may benefit the Portfolio. In this regard, the Board considered the qualifications and experience of the Portfolio’s portfolio manager, the number of accounts managed by the portfolio manager and the method for compensating the portfolio manager.
In addition, the Board considered information provided by New York Life Investments and MacKay regarding their respective business continuity and disaster recovery plans.
Based on these considerations, among others, the Board concluded that the Portfolio would likely continue to benefit from the nature, extent and quality of these services.
Investment Performance
In evaluating the Portfolio’s investment performance, the Board considered investment performance results over various periods in light of the Portfolio’s investment objective, strategies and risks. The Board
| 30 | MainStay VP MacKay Convertible Portfolio |
considered investment reports on, and analysis of, the Portfolio’s performance provided to the Board throughout the year. These reports include, among other items, information on the Portfolio’s gross and net returns, the Portfolio’s investment performance compared to a relevant investment category and the Portfolio’s benchmark, the Portfolio’s risk-adjusted investment performance and the Portfolio’s investment performance as compared to peer funds, as appropriate, as well as portfolio attribution information and commentary on the effect of market conditions. The Board also considered information provided by ISS showing the investment performance of the Portfolio as compared to peer funds. In addition, the Board reviewed the methodology used by ISS to construct the group of peer funds for comparative purposes.
The Board also took into account its discussions with senior management at New York Life Investments concerning the Portfolio’s investment performance over various periods as well as discussions between representatives of MacKay and the members of the Board’s Investment Committee, which generally occur on an annual basis.
Based on these considerations, among others, the Board concluded that its review of the Portfolio’s investment performance and related information supported a determination to approve the continuation of each of the Advisory Agreements.
Costs of the Services Provided, and Profits and Other Benefits Realized, by New York Life Investments and MacKay
The Board considered the costs of the services provided under each of the Advisory Agreements. The Board also considered the profitability of New York Life Investments and its affiliates, including MacKay, due to their relationships with the Portfolio as well as by New York Life Investments and its affiliates due to their relationships with the MainStay Group of Funds. Because MacKay is an affiliate of New York Life Investments whose subadvisory fee is paid by New York Life Investments, not the Portfolio, the Board considered cost and profitability information for New York Life Investments and MacKay in the aggregate.
In addition, the Board acknowledged the difficulty in obtaining reliable comparative data about mutual fund managers’ profitability because such information generally is not publicly available and may be impacted by numerous factors, including the structure of a fund manager’s organization, the types of funds it manages, the methodology used to allocate certain fixed costs to specific funds and the manager’s capital structure and costs of capital.
In evaluating the costs of the services provided by New York Life Investments and MacKay, and profitability of New York Life Investments and its affiliates, including MacKay due to their relationships with the Portfolio, the Board considered, among other factors, New York Life Investments’ and its affiliates’, including MacKay’s, continuing investments in, or willingness to invest in, personnel and other resources that may support and further enhance the management of the Portfolio, and that New York Life Investments is responsible for paying the subadvisory fee for the Portfolio. The Board also considered the financial resources of New York Life Investments and MacKay and acknowledged
that New York Life Investments and MacKay must be in a position to recruit and retain experienced professional personnel and to maintain a strong financial position for New York Life Investments and MacKay to continue to provide high-quality services to the Portfolio. The Board recognized that the Portfolio benefits from the allocation of certain fixed costs among the funds in the MainStay Group of Funds, among other expected benefits resulting from its relationship with New York Life Investments.
The Board considered information regarding New York Life Investments’ methodology for calculating profitability and allocating costs provided by New York Life Investments in connection with the fund profitability analysis presented to the Board. The Board concluded that New York Life Investments’ methods for allocating costs and procedures for estimating overall profitability of the relationship with the funds in the MainStay Group of Funds were reasonable. The Board recognized the difficulty in calculating and evaluating a manager’s profitability with respect to the Portfolio and considered that other profitability methodologies may also be reasonable.
The Board also considered certain fall-out benefits that may be realized by New York Life Investments and its affiliates, including MacKay, due to their relationships with the Portfolio, including reputational and other indirect benefits. The Board recognized, for example, the benefits to MacKay from legally permitted “soft-dollar” arrangements by which brokers provide research and other services to MacKay in exchange for commissions paid by the Portfolio with respect to trades in the Portfolio’s portfolio securities. In addition, the Board considered its review of the management agreement for a money market fund advised by New York Life Investments and an affiliated subadvisor that serves as an investment option for the Portfolio, including the potential rationale for and costs associated with investments in this money market fund by the Portfolio, if any, and considered information from New York Life Investments that the nature and type of specific investment advisory services provided to this money market fund are distinct from, or in addition to, the investment advisory services provided to the Portfolio. In addition, the Board considered the potential dividend received tax deduction for insurance company affiliates of New York Life Investments from the Portfolio’s securities lending activity.
The Board noted that the Portfolio serves as an investment option primarily under variable contracts issued by affiliates of New York Life Investments that would receive fees under those contracts. The Board observed that, in addition to fees earned by New York Life Investments under the Management Agreement for managing the Portfolio, New York Life Investments’ affiliates also earn revenues from serving the Portfolio in various other capacities, including as the Portfolio’s distributor, and insurance companies affiliated with New York Life Investments would be entitled to receive fees from the Portfolio under a distribution and service plan adopted pursuant to Rule 12b-1 under the 1940 Act. The Board considered information about these other revenues and their impact on the profitability of the relationship with the Portfolio to New York Life Investments and its affiliates. The Board noted that, although it assessed the overall profitability of the relationship with the Portfolio to New York
Board Consideration and Approval of Management Agreement and Subadvisory Agreement (Unaudited) (continued)
Life Investments and its affiliates as part of the contract review process, when considering the reasonableness of the fee paid to New York Life Investments under the Management Agreement, the Board considered the profitability of New York Life Investments’ relationship with the Portfolio on a pre-tax basis and without regard to distribution expenses incurred by New York Life Investments from its own resources.
After evaluating the information deemed relevant by the Trustees, the Board concluded that any profits realized by New York Life Investments and its affiliates, including MacKay, due to their relationships with the Portfolio were not excessive and other expected benefits that may accrue to New York Life Investments and its affiliates, including MacKay, are reasonable.
Management and Subadvisory Fees and Total Ordinary Operating Expenses
The Board evaluated the reasonableness of the fee paid under each of the Advisory Agreements and the Portfolio’s total ordinary operating expenses. With respect to the management fee and subadvisory fee, the Board primarily considered the reasonableness of the management fee paid by the Portfolio to New York Life Investments because the subadvisory fee paid to MacKay is paid by New York Life Investments, not the Portfolio. The Board also considered the reasonableness of the subadvisory fee paid by New York Life Investments and the amount of the management fee retained by New York Life Investments.
In assessing the reasonableness of the Portfolio’s fees and expenses, the Board primarily considered comparative data provided by ISS on the fees and expenses of similar mutual funds managed by other investment advisers. The Board reviewed the methodology used by ISS to construct the group of peer funds for comparative purposes. In addition, the Board considered information provided by New York Life Investments and MacKay on fees charged to other investment advisory clients, including institutional separate accounts and/or other funds, that follow investment strategies similar to those of the Portfolio, if any. The Board considered the contractual management fee schedule for the Portfolio as compared to those for such other investment advisory clients, taking into account the rationale for differences in fee schedules. The Board also took into account information provided by New York Life Investments about the more extensive scope of services provided to registered investment companies, such as the Portfolio, as compared with other investment advisory clients. Additionally, the Board considered the impact of contractual breakpoints and voluntary waivers on the Portfolio’s net management fee and expenses. The Board also considered that in proposing fees for the Portfolio, New York Life Investments considers the competitive marketplace for mutual funds. The Board noted that New York Life Investments proposed an additional management fee and subadvisory fee breakpoint for the Portfolio, effective May 1, 2024.
Additionally, the Board noted that NYLIM Service Company LLC, an affiliate of New York Life Investments, serves as the transfer agent and dividend disbursing agent for the Service Class and Service 2 Class Shares of the Portfolio but that the Service Class and Service 2 Class Shares do not incur any fees for these services.
Based on the factors outlined above, among other considerations, the Board concluded that the Portfolio’s management fee and total ordinary operating expenses are within a range that is competitive and support a conclusion that these fees and expenses are reasonable.
Economies of Scale
The Board considered information regarding economies of scale, including whether economies of scale may exist with respect to the Portfolio and whether the Portfolio’s management fee and expense structure permits any economies of scale to be appropriately shared with the Portfolio’s shareholders. The Board also considered a report from New York Life Investments, previously prepared at the request of the Board, that addressed economies of scale, including with respect to the mutual fund business generally, and the various ways in which the benefits of economies of scale may be shared with the funds in the MainStay Group of Funds. Although the Board recognized the difficulty of determining economies of scale with precision, the Board acknowledged that economies of scale may be shared with the Portfolio in a number of ways, including, for example, through the imposition of fee breakpoints, initially setting management fee rates at scale or making additional investments to enhance the services provided to the Portfolio. The Board reviewed information from New York Life Investments showing how the Portfolio’s management fee schedule compared to fee schedules of other funds and accounts managed by New York Life Investments. The Board also reviewed information from ISS showing how the Portfolio’s management fee schedule compared with fees paid for similar services by peer funds at varying asset levels.
Based on this information, the Board concluded that economies of scale are appropriately shared for the benefit of the Portfolio’s shareholders through the Portfolio’s management fee and expense structure and other methods to share benefits from economies of scale.
Conclusion
On the basis of the information and factors summarized above, among other information and factors deemed relevant by the Trustees, and the evaluation thereof, the Board, including the Independent Trustees voting separately, unanimously voted to approve the continuation of each of the Advisory Agreements.
| 32 | MainStay VP MacKay Convertible Portfolio |
Proxy Voting Policies and Procedures and Proxy Voting Record
The Portfolio is required to file with the SEC its proxy voting record for the 12-month period ending June 30 on Form N-PX. A description of the policies and procedures that are used to vote proxies relating to portfolio securities of the Portfolio is available free of charge upon request by calling 800-598-2019 or visiting the SEC's website at www.sec.gov. The most recent Form N-PX or proxy voting record is available free of charge upon request by calling 800-598-2019; visiting https://www.newyorklifeinvestments.com/investment-products/vp; or visiting the SEC’s website at www.sec.gov.
Shareholder Reports and Quarterly Portfolio Disclosure
The Portfolio is required to file its complete schedule of portfolio holdings with the SEC 60 days after its first and third fiscal quarter on Form N-PORT. The Portfolio's holdings report is available free of charge upon request by calling 800-598-2019 or by visiting the SEC’s website at www.sec.gov.
Board of Trustees and Officers (Unaudited)
The Trustees and officers of the Portfolio are listed below. The Board oversees the MainStay Group of Funds (which consists of MainStay Funds and MainStay Funds Trust), MainStay VP Funds Trust, MainStay MacKay DefinedTerm Municipal Opportunities Fund, MainStay CBRE Global Infrastructure Megatrends Term Fund, the Manager and the Subadvisors, and elects the officers of the Portfolios who are responsible for the day-to-day operations of the Portfolio. Information pertaining to the Trustees and officers is set forth below. Each Trustee serves until his or her successor is elected and qualified or until his or her resignation,
death or removal. Under the Board’s retirement policy, unless an exception is made, a Trustee must tender his or her resignation by the end of the calendar year during which he or she reaches the age of 75. Officers are elected annually by the Board. The business address of each Trustee and officer listed below is 51 Madison Avenue, New York, New York 10010. A majority of the Trustees are not “interested persons” (as defined by the 1940 Act and rules adopted by the SEC thereunder) of the Portfolio (“Independent Trustees”).
| | Name and
Year of Birth | Term of Office,
Position(s) Held and
Length of Service | Principal Occupation(s)
During Past Five Years | Number of
Portfolios in
Fund Complex
Overseen by
Trustee | Other Directorships
Held by Trustee |
| | | | | | |
| | Naïm Abou-Jaoudé*
1966 | MainStay VP Funds Trust: Trustee since 2023 | Chief Executive Officer of New York Life Investment Management LLC (since 2023). Chief Executive Officer of Candriam (an affiliate of New York Life Investment Management LLC) (2007 to 2023). | 81 | MainStay Funds: Trustee since 2023 (11 Funds)
MainStay Funds Trust: Trustee since 2023 (37 Funds);
MainStay MacKay DefinedTerm Municipal Opportunities Fund: Trustee since 2023;
MainStay CBRE Global Infrastructure Megatrends Term Fund: Trustee since 2023; and
New York Life Investment Management International (Chair) since 2015 |
| * | This Trustee is considered to be an “interested person” of the MainStay Group of Funds, MainStay VP Funds Trust, MainStay CBRE Global Infrastructure Megatrends Term Fund and MainStay MacKay DefinedTerm Municipal Opportunities Fund, within the meaning of the 1940 Act because of his affiliation with New York Life Investment Management LLC and Candriam, as described in detail above in the column entitled “Principal Occupation(s) During Past Five Years.” |
| | |
| 34 | MainStay VP MacKay Convertible Portfolio |
| | Name and
Year of Birth | Term of Office,
Position(s) Held and
Length of Service | Principal Occupation(s)
During Past Five Years | Number of
Portfolios in
Fund Complex
Overseen by
Trustee | Other Directorships
Held by Trustee |
| | | | | | |
| | David H. Chow
1957 | MainStay VP Funds Trust: Trustee since January 2016, Advisory Board Member (June 2015 to December 2015) | Founder and CEO, DanCourt Management, LLC since 1999 | 81 | MainStay Funds: Trustee since January 2016, Advisory Board Member (June 2015 to December 2015) (11 Funds);
MainStay Funds Trust: Trustee since January 2016, Advisory Board Member (June 2015 to December 2015) (37 Funds);
MainStay MacKay DefinedTerm Municipal Opportunities Fund: Trustee since January 2016, Advisory Board Member (June 2015 to December 2015);
MainStay CBRE Global Infrastructure Megatrends Term Fund: Trustee since 2021;
VanEck Vectors Group of Exchange-Traded Funds: Trustee since 2006 and Independent Chairman of the Board of Trustees from 2008 to 2022 (57 portfolios); and
Berea College of Kentucky: Trustee since 2009, Chair of the Investment Committee since 2018 |
| | Karen Hammond
1956 | MainStay VP Funds Trust: Trustee since December 2021, Advisory Board Member (June 2021 to December 2021)
| Retired, Managing Director, Devonshire Investors (2007 to 2013); Senior Vice President, Fidelity Management & Research Co. (2005 to 2007); Senior Vice President and Corporate Treasurer, FMR Corp. (2003 to 2005); Chief Operating Officer, Fidelity Investments Japan (2001 to 2003) | 81 | MainStay Funds: Trustee since December 2021, Advisory Board Member (June 2021 to December 2021) (11 Funds);
MainStay Funds Trust: Trustee since December 2021, Advisory Board Member (June 2021 to December 2021) (37 Funds);
MainStay MacKay DefinedTerm Municipal Opportunities Fund: Trustee since December 2021, Advisory Board Member (June 2021 to December 2021);
MainStay CBRE Global Infrastructure Megatrends Term Fund: Trustee since December 2021, Advisory Board Member (June 2021 to December 2021);
Two Harbors Investment Corp.: Director since 2018;
Rhode Island State Investment Commission: Member since 2017; and
Blue Cross Blue Shield of Rhode Island: Director since 2019 |
| | Susan B. Kerley
1951 | MainStay VP Funds Trust: Chair since 2017 and Trustee since 2007** | President, Strategic Management Advisors LLC since 1990 | 81 | MainStay Funds: Chair since January 2017 and Trustee since 2007 (11 Funds); MainStay Funds Trust: Chair since January 2017 and Trustee since 1990 (37 Funds)***;
MainStay MacKay DefinedTerm Municipal Opportunities Fund: Chair since January 2017 and Trustee since 2011;
MainStay CBRE Global Infrastructure Megatrends Term Fund: Trustee since June 2021; and
Legg Mason Partners Funds: Trustee since 1991 (45 portfolios) |
Board of Trustees and Officers (Unaudited) (continued)
| | Name and
Year of Birth | Term of Office,
Position(s) Held and
Length of Service | Principal Occupation(s)
During Past Five Years | Number of
Portfolios in
Fund Complex
Overseen by
Trustee | Other Directorships
Held by Trustee |
| | | | | | |
| | Alan R. Latshaw
1951 | MainStay VP Funds Trust: Trustee since 2007** | Retired; Partner, Ernst & Young LLP (2002 to 2003); Partner, Arthur Andersen LLP (1989 to 2002); Consultant to the MainStay Funds Audit and Compliance Committee (2004 to 2006) | 81 | MainStay Funds: Trustee since 2006 (11 Funds);
MainStay Funds Trust: Trustee since 2007 (37 Funds)***;
MainStay MacKay DefinedTerm Municipal Opportunities Fund: Trustee since 2011; and
MainStay CBRE Global Infrastructure Megatrends Term Fund: Trustee since June 2021 |
| | Jacques P. Perold
1958 | MainStay VP Funds Trust: Trustee since January 2016, Advisory Board Member (June 2015 to December 2015) | Founder and Chief Executive Officer, CapShift Advisors LLC (since 2018); President, Fidelity Management & Research Company (2009 to 2014); President and Chief Investment Officer, Geode Capital Management, LLC (2001 to 2009) | 81 | MainStay Funds: Trustee since January 2016, Advisory Board Member (June 2015 to December 2015) (11 Funds);
MainStay Funds Trust: Trustee since January 2016, Advisory Board Member (June 2015 to December 2015) (37 Funds);
MainStay MacKay DefinedTerm Municipal Opportunities Fund: Trustee since January 2016, Advisory Board Member (June 2015 to December 2015);
MainStay CBRE Global Infrastructure Megatrends Term Fund: Trustee since June 2021;
Allstate Corporation: Director since 2015;
Partners in Health: Trustee since 2019; and
MSCI Inc.: Director since 2017 |
| | Richard S. Trutanic
1952 | MainStay VP Funds Trust: Trustee since 2007** | Chairman and Chief Executive Officer, Somerset & Company (financial advisory firm) since 2004; Managing Director, The Carlyle Group (private investment firm) (2002 to 2004); Senior Managing Director, Partner and Board Member, Groupe Arnault S.A. (private investment firm) (1999 to 2002) | 81 | MainStay Funds: Trustee since 1994 (11 Funds);
MainStay Funds Trust: Trustee since 2007 (37 Funds)***;
MainStay MacKay DefinedTerm Municipal Opportunities Fund: Trustee since 2011; and
MainStay CBRE Global Infrastructure Megatrends Term Fund: Trustee since June 2021 |
| ** | Includes prior service as a Director of MainStay VP Series Fund, Inc., the predecessor to MainStay VP Funds Trust. |
| *** | Includes prior service as a Director/Trustee of certain predecessor entities to MainStay Funds Trust. |
| 36 | MainStay VP MacKay Convertible Portfolio |
| | Name and
Year of Birth | Position(s) Held and
Length of Service | Principal Occupation(s)
During Past Five Years | |
| | | | | |
| | Kirk C. Lehneis
1974 | President, MainStay VP Funds Trust (since 2017) | Chief Operating Officer and Senior Managing Director (since 2016), New York Life Investment Management LLC and New York Life Investment Management Holdings LLC; Member of the Board of Managers (since 2017) and Senior Managing Director (since 2018), NYLIFE Distributors LLC; Chairman of the Board and Senior Managing Director, NYLIM Service Company LLC (since 2017); Trustee, President and Principal Executive Officer of IndexIQ Trust, IndexIQ ETF Trust and IndexIQ Active ETF Trust (since 2018); President, MainStay CBRE Global Infrastructure Megatrends Term Fund (since 2021), MainStay MacKay DefinedTerm Municipal Opportunities Fund, MainStay Funds and MainStay Funds Trust (since 2017); Senior Managing Director, Global Product Development (from 2015 to 2016); Managing Director, Product Development (from 2010 to 2015), New York Life Investment Management LLC | |
| | Jack R. Benintende
1964 | Treasurer and Principal Financial and Accounting Officer, MainStay VP Funds Trust (since 2007)** | Managing Director, New York Life Investment Management LLC (since 2007); Treasurer and Principal Financial and Accounting Officer, MainStay CBRE Global Infrastructure Megatrends Term Fund (since 2021), MainStay MacKay DefinedTerm Municipal Opportunities Fund (since 2011), MainStay Funds Trust (since 2009) and MainStay Funds (since 2007); and Assistant Treasurer, New York Life Investment Management Holdings LLC (2008 to 2012) | |
| | J. Kevin Gao
1967 | Secretary and Chief Legal Officer, MainStay VP Funds Trust (since 2010)** | Managing Director and Associate General Counsel, New York Life Investment Management LLC (since 2010); Secretary and Chief Legal Officer, MainStay CBRE Global Infrastructure Megatrends Term Fund (since 2021), MainStay MacKay DefinedTerm Municipal Opportunities Fund (since 2011), MainStay Funds and MainStay Funds Trust (since 2010) | |
| | Kevin M. Gleason
1967 | Vice President and Chief Compliance Officer, MainStay VP Funds Trust (since June 2022) | Vice President and Chief Compliance Officer, IndexIQ Trust, IndexIQ ETF Trust and IndexIQ Active ETF Trust (since June 2022); Vice President and Chief Compliance Officer, MainStay CBRE Global Infrastructure Megatrends Term Fund, MainStay MacKay DefinedTerm Municipal Opportunities Fund (since June 2022); MainStay Funds Trust and MainStay Funds (since June 2022); Senior Vice President, Voya Investment Management and Chief Compliance Officer, Voya Family of Funds (2012 to 2022) | |
| | Scott T. Harrington
1959 | Vice President— Administration, MainStay VP Funds Trust (since 2005)** | Managing Director, New York Life Investment Management LLC (including predecessor advisory organizations) (since 2000); Member of the Board of Directors, New York Life Trust Company (since 2009); Vice President—Administration, MainStay CBRE Global Infrastructure Megatrends Term Fund (since 2021), MainStay MacKay DefinedTerm Municipal Opportunities Fund (since 2011), MainStay Funds Trust and MainStay Funds (since 2009) | |
| * | The officers listed above are considered to be “interested persons” of the MainStay Group of Funds, MainStay VP Funds Trust, MainStay CBRE Global Infrastructure Megatrends Term Fund and MainStay MacKay DefinedTerm Municipal Opportunities Fund within the meaning of the 1940 Act because of their affiliation with the MainStay Group of Funds, New York Life Insurance Company and/or its affiliates, including New York Life Investment Management LLC, New York Life Insurance Company, NYLIM Service Company LLC, NYLIFE Securities LLC and/or NYLIFE Distributors LLC, as described in detail in the column captioned “Principal Occupation(s) During Past Five Years.” Officers are elected annually by the Board. |
| ** | Includes prior service as an Officer of MainStay VP Series Fund, Inc., the predecessor to MainStay VP Funds Trust. |
Officers of the Trust (Who are not Trustees)*
This page intentionally left blank.
MainStay VP Portfolios
MainStay VP offers a wide range of Portfolios. The full array of MainStay VP offerings is listed here, with information about the manager, subadvisors, legal counsel, and independent registered public accounting firm.
Equity
MainStay VP American Century Sustainable Equity Portfolio
MainStay VP Candriam Emerging Markets Equity Portfolio
MainStay VP Epoch U.S. Equity Yield Portfolio
MainStay VP Fidelity Institutional AM® Utilities Portfolio†
MainStay VP Natural Resources Portfolio
MainStay VP PineStone International Equity Portfolio1
MainStay VP S&P 500 Index Portfolio
MainStay VP Small Cap Growth Portfolio
MainStay VP Wellington Growth Portfolio
MainStay VP Wellington Mid Cap Portfolio
MainStay VP Wellington Small Cap Portfolio
MainStay VP Wellington U.S. Equity Portfolio
MainStay VP Winslow Large Cap Growth Portfolio
Mixed Asset
MainStay VP Balanced Portfolio
MainStay VP Income Builder Portfolio
MainStay VP Janus Henderson Balanced Portfolio
MainStay VP MacKay Convertible Portfolio
Income
MainStay VP Bond Portfolio
MainStay VP Floating Rate Portfolio
MainStay VP Indexed Bond Portfolio
MainStay VP MacKay Government Portfolio2
MainStay VP MacKay High Yield Corporate Bond Portfolio
MainStay VP MacKay Strategic Bond Portfolio
MainStay VP PIMCO Real Return Portfolio
Money Market
MainStay VP U.S. Government Money Market Portfolio
Alternative
MainStay VP CBRE Global Infrastructure Portfolio
MainStay VP IQ Hedge Multi-Strategy Portfolio
Asset Allocation
MainStay VP Conservative Allocation Portfolio
MainStay VP Equity Allocation Portfolio
MainStay VP Growth Allocation Portfolio
MainStay VP Moderate Allocation Portfolio
Manager
New York Life Investment Management LLC
New York, New York
Subadvisors
American Century Investment Management, Inc.
Kansas City, Missouri
Brown Advisory LLC
Baltimore, Maryland
Candriam*
Strassen, Luxembourg
CBRE Investment Management Listed Real Assets LLC
Radnor, Pennsylvania
Epoch Investment Partners, Inc.
New York, New York
FIAM LLC
Smithfield, Rhode Island
IndexIQ Advisors LLC*
New York, New York
Janus Henderson Investors US LLC
Denver, Colorado
MacKay Shields LLC*
New York, New York
Newton Investment Management North America, LLC
Boston, Massachusetts
NYL Investors LLC*
New York, New York
Pacific Investment Management Company LLC
Newport Beach, California
PineStone Asset Management Inc.
Montreal, Québec
Segall Bryant & Hamill, LLC
Chicago, Illinois
Wellington Management Company LLP
Boston, Massachusetts
Winslow Capital Management, LLC
Minneapolis, Minnesota
Legal Counsel
Dechert LLP
Washington, District of Columbia
Independent Registered Public Accounting Firm
PricewaterhouseCoopers LLP
New York, New York
Distributor
NYLIFE Distributors LLC*
Jersey City, New Jersey
Custodian
JPMorgan Chase Bank, N.A.
New York, New York
Some Portfolios may not be available in all products.
† Fidelity Institutional AM is a registered trade mark of FMR LLC. Used with permission.
* An affiliate of New York Life Investment Management LLC.
| 1. | Prior to August 28, 2023, the Portfolio's name was MainStay VP MacKay International Equity Portfolio. |
| 2. | Effective on or about May 1, 2024, the MainStay VP MacKay Government Portfolio will be renamed the MainStay VP U.S. Infrastructure Bond Portfolio. |
Not part of the Annual Report
2023 Annual Report
This report is for the general information of New York Life Variable Annuities and NYLIAC Variable Universal Life Insurance Products policyowners. It must be preceded or accompanied by the appropriate product(s) and funds prospectuses if it is given to anyone who is not an owner of a New York Life variable annuity policy or a NYLIAC Variable Universal Life Insurance Product. This report does not offer for sale or solicit orders to purchase securities.
The performance data quoted in this report represents past performance. Past performance is no guarantee of future results. Due to market volatility and other factors, current performance may be lower or higher than the figures shown. The most recent month-end performance summary for your variable annuity or variable life policy is available by calling 800-598-2019 and is updated periodically on newyorklife.com.
The New York Life Variable Annuities and NYLIAC Variable Universal Life Insurance Products are issued by New York Life Insurance and Annuity Corporation (a Delaware Corporation) and distributed by NYLIFE Distributors LLC (Member FINRA/SIPC).
New York Life Insurance Company
New York Life Insurance and Annuity
Corporation (NYLIAC) (A Delaware Corporation)
51 Madison Avenue, Room 551
New York, NY 10010
newyorklife.com
newyorklifeinvestments.com
NYLIFE Distributors LLC, 30 Hudson Street, Jersey City, NJ 07302
New York Life Investment Management LLC is the investment manager to the MainStay VP Funds Trust
©2024 by NYLIFE Distributors LLC. All rights reserved.
You may obtain copies of the Prospectus and the Statement of Additional Information free of charge, upon request, by calling toll-free 800-598-2019 or writing to New York Life Insurance and Annuity Corporation, 51 Madison Avenue, New York, NY 10010.
| Not FDIC Insured | No Bank Guarantee | May Lose Value |
(NYLIAC) NI512
MainStay VP Wellington Growth Portfolio
Message from the President and Annual Report
December 31, 2023
Special Notice:
Beginning in July 2024, new regulations issued by the Securities and Exchange Commission (SEC) will take effect requiring open-end mutual fund companies and ETFs to (1) overhaul the content of their shareholder reports and (2) mail paper copies of the new tailored shareholder reports to shareholders who have not opted to receive these documents electronically.
If you have not yet elected to receive your shareholder reports electronically, please contact your financial intermediary or visit our website.
| Not FDIC/NCUA Insured | Not a Deposit | May Lose Value | No Bank Guarantee | Not Insured by Any Government Agency |
This page intentionally left blank
Message from the President
Against a backdrop of easing inflationary pressures and continued economic growth, stocks and bonds generally gained ground during the 12-month period ended December 31, 2023, despite high levels of volatility and sharp disparities between the performance of the different market sectors.
Although the war in Ukraine, the outbreak of hostilities in the Middle East and several other notable events affected financial assets, inflation, interest rate, and economic growth trends stood at the forefront of market developments during most of the period. As the reporting period began, high levels of inflation already showed signs of easing in the face of aggressive rate hikes by U.S. Federal Reserve (the “Fed”). From a peak of 9.1% in June 2022, the annualized U.S. inflation rate dropped to 6.4% in January, and 3.4% in December 2023. At the same time, the Fed increased the benchmark federal funds rate from 4.25%–4.50% at the beginning of reporting period, to 5.25%–5.50% as of the end of 2023. Despite the increasing cost of capital and tighter lending environment that resulted from rising rates, economic growth remained surprisingly robust, bolstered by high levels of consumer spending, low levels of unemployment and better-than-expected corporate earnings. With the pace of rate increases slowing from the prior year, investors began hoping for an early shift to a looser monetary policy, with stock prices and bond yields reacting as economic data and statements from the Fed either reinforced or undercut those hopes. Following months of hawkish rhetoric, the Fed finally reversed its stance in December 2023, signaling a positive economic outlook with little chance of a recession and a likelihood of rate cuts in 2024.
The S&P 500® Index, a widely regarded benchmark of U.S. market performance, produced strong gains during the reporting period-– recovering all its losses from 2022 and approached new record territory. A preponderance of the Index’s gains were generated by a relatively small number of mega-cap stocks in the information technology, communication services and consumer discretionary sectors that stood to benefit from rapid developments in generative artificial intelligence (“AI”). Value-oriented, interest-rate sensitive and small-capitalization
shares lagged by significant margins, although market strength widened during the closing weeks of the reporting period. Most overseas equity markets trailed the U.S. market, as developed international economies experienced relatively low growth rates, and weak economic conditions in China undermined emerging markets.
Bonds produced generally positive returns, bolstered by attractive and relatively stable yields. The yield on the 10-year Treasury note hit a high of just under 5% in mid-October 2023, ranging between approximately 3.5% and 4.8% for most of the reporting period. The yield curve remained inverted throughout the year, with the 2-year Treasury yield modestly above the 10-year yield. Corporate bond prices trended moderately higher, generally outperforming government securities. After years of low yields and tight credit spreads, the corporate sector benefited from more attractive valuations and income opportunities. Among corporates, markets generally rewarded longer duration and lower credit quality, although an uptick in default rates posed added risks for high-yield corporate bonds. International bond markets produced mixed returns, with emerging-markets issues advancing over their developed-markets counterparts.
The market volatility of recent years reminds us of the constant need for experienced and steadfast portfolio management in the face of uncertainty. New York Life Investments remains dedicated to providing you, as a valued MainStay VP investor, with the guidance, resources and investment solutions you need to pursue your financial goals.
Thank you for trusting us to help meet your investment needs.
Sincerely,
Kirk C. Lehneis
President
The opinions expressed are as of the date of this report and are subject to change. There is no guarantee that any forecast made will come to pass. This material does not constitute investment advice and is not intended as an endorsement of any specific investment. Past performance is no guarantee of future results.
Not part of the Annual Report
Investors should refer to the Portfolio’s Summary Prospectus and/or Prospectus and consider the Portfolio’s investment objectives, strategies, risks, charges and expenses carefully before investing. The Summary Prospectus and/or Prospectus contain this and other information about the Portfolio. You may obtain copies of the Portfolio’s Summary Prospectus, Prospectus and Statement of Additional Information, which includes information about the MainStay VP Funds Trust's Trustees, free of charge, upon request, by calling toll-free 800-598-2019, by writing to New York Life Insurance and Annuity Corporation, 51 Madison Avenue, Room 251, New York, New York 10010 or by sending an email to MainStayShareholdersServices@nylim.com. These documents are also available at newyorklifeinvestments.com/investment-products/vp. Please read the Portfolio's Summary Prospectus and/or Prospectus carefully before investing. MainStay VP Funds Trust portfolios are separate account options which are purchased through a variable insurance or variable annuity contract.
MainStay VP Wellington Growth Portfolio
Investment and Performance Comparison (Unaudited)
Performance data quoted represents past performance. Past performance is no guarantee of future results. Because of market volatility and other factors, current performance may be lower or higher than the figures shown. Investment return and principal value will fluctuate, and as a result, when shares are redeemed, they may be worth more or less than their original cost. The performance table and graph do not reflect any deduction of sales charges, mortality and expense charges, contract charges or administrative charges. Please refer to the Performance Summary appropriate for your policy. For performance information current to the most recent month-end, please call 800-598-2019 or visit www.newyorklife.com.
Performance figures may reflect certain fee waivers and/or expense limitations, without which total returns may have been different. For information on current fee waivers and/or expense limitations (if any), please refer to the Notes to Financial Statements.
| Average Annual Total Returns for the Year-Ended December 31, 2023 |
| Class | Inception
Date1, 2, 3 | One
Year | Five
Years | Ten
Years | Gross
Expense
Ratio4 |
| Initial Class Shares | 1/29/1993 | 38.61% | 13.79% | 10.32% | 0.73% |
| Service Class Shares | 6/5/2003 | 38.26 | 13.51 | 10.05 | 0.98 |
| 1. | Effective January 11, 2013 and July 29, 2016, the Portfolio modified its principal investment strategies in connection with changes in the Portfolio’s Subadvisor. The past performance in the graph and table reflect the Subadvisors and strategies in place during their respective time periods. |
| 2. | Effective January 1, 2018 due to an organizational restructuring, all investment personnel of Cornerstone Capital Management Holdings LLC, a former subadvisor, transitioned to MacKay Shields LLC. |
| 3. | Effective May 1, 2021, the Portfolio replaced its subadvisor, MacKay Shields LLC, and modified its principal investment strategies. The past performance in the graph and table prior to that date reflects the Portfolio's prior subadvisors and principal investment strategies. |
| 4. | The gross expense ratios presented reflect the Portfolio’s “Total Annual Portfolio Operating Expenses” from the most recent Prospectus and may differ from other expense ratios disclosed in this report. |
| Benchmark Performance* | One
Year | Five
Years | Ten
Years |
| Russell 1000® Growth Index1 | 42.68% | 19.50% | 14.86% |
| Morningstar Large Growth Category Average2 | 36.74 | 15.74 | 12.03 |
| * | Returns for indices reflect no deductions for fees, expenses or taxes, except for foreign withholding taxes where applicable. Results assume reinvestment of all dividends and capital gains. An investment cannot be made directly in an index. |
| 1. | The Russell 1000® Growth Index is the Portfolio's primary benchmark. The Russell 1000® Growth Index measures the performance of the large-cap growth segment of the U.S. equity universe. It includes those Russell 1000® Index companies with higher price-to-book ratios and higher forecasted growth values. |
| 2. | The Morningstar Large Growth Category Average is representative of funds that invest primarily in big U.S. companies that are projected to grow faster than other large-cap stocks. Stocks in the top 70% of the capitalization of the U.S. equity market are defined as large cap. Growth is defined based on fast growth and high valuations. Most of these funds focus on companies in rapidly expanding industries. Results are based on average total returns of similar funds with all dividends and capital gain distributions reinvested. |
Cost in Dollars of a $1,000 Investment in MainStay VP Wellington Growth Portfolio (Unaudited)
The example below is intended to describe the fees and expenses borne by shareholders during the six-month period from July 1, 2023 to December 31, 2023, and the impact of those costs on your investment.
Example
As a shareholder of the Portfolio you incur two types of costs: (1) transaction costs, including exchange fees and sales charges (loads) on purchases (as applicable), and (2) ongoing costs, including management fees, distribution and/or service (12b-1) fees and other Portfolio expenses (as applicable). This example is intended to help you understand your ongoing costs (in dollars) of investing in the Portfolio and to compare these costs with the ongoing costs of investing in other mutual funds. The example is based on an investment of $1,000 made at the beginning of the six-month period and held for the entire period from July 1, 2023 to December 31, 2023. Shares are only sold in connection with variable life and annuity contracts and the example does not reflect any contract level or transactional fees or expenses. If these costs had been included, your costs would have been higher.
This example illustrates your Portfolio’s ongoing costs in two ways:
Actual Expenses
The second and third data columns in the table below provide information about actual account values and actual expenses. You may use the information in these columns, together with the amount you invested, to estimate the expenses that you paid during the six months ended
December 31, 2023. Simply divide your account value by $1,000 (for example, an $8,600 account value divided by $1,000 = 8.6), then multiply the result by the number under the heading entitled “Expenses Paid During Period” to estimate the expenses you paid on your account during this period.
Hypothetical Example for Comparison Purposes
The fourth and fifth data columns in the table below provide information about hypothetical account values and hypothetical expenses based on the Portfolio’s actual expense ratio and an assumed rate of return of 5% per year before expenses, which is not the Portfolio’s actual return. The hypothetical account values and expenses may not be used to estimate the actual ending account balances or expenses you paid for the six-month period shown. You may use this information to compare the ongoing costs of investing in the Portfolio with the ongoing costs of investing in other mutual funds. To do so, compare this 5% hypothetical example with the 5% hypothetical examples that appear in the shareholder reports of the other mutual funds.
Please note that the expenses shown in the table are meant to highlight your ongoing costs only and do not reflect any transactional costs, such as exchange fees or sales charges (loads). Therefore, the fourth and fifth data columns of the table are useful in comparing ongoing costs only and will not help you determine the relative total costs of owning different funds. In addition, if these transactional costs were included, your costs would have been higher.
| Share Class | Beginning
Account
Value
7/1/23 | Ending Account
Value (Based
on Actual
Returns and
Expenses)
12/31/23 | Expenses
Paid
During
Period1 | Ending Account
Value (Based
on Hypothetical
5% Annualized
Return and
Actual Expenses)
12/31/23 | Expenses
Paid
During
Period1 | Net Expense
Ratio
During
Period2 |
| Initial Class Shares | $1,000.00 | $1,092.20 | $3.80 | $1,021.58 | $3.67 | 0.72% |
| Service Class Shares | $1,000.00 | $1,090.80 | $5.11 | $1,020.32 | $4.94 | 0.97% |
| 1. | Expenses are equal to the Portfolio’s annualized expense ratio of each class multiplied by the average account value over the period, divided by 365 and multiplied by 184 (to reflect the six-month period). The table above represents the actual expenses incurred during the six-month period. In addition to the fees and expenses which the Portfolio bears directly, it also indirectly bears a pro rata share of the fees and expenses of the underlying funds in which it invests. Such indirect expenses are not included in the above-reported expense figures. |
| 2. | Expenses are equal to the Portfolio's annualized expense ratio to reflect the six-month period. |
| 6 | MainStay VP Wellington Growth Portfolio |
Industry Composition as of December 31, 2023 (Unaudited)
| Software | 19.3% |
| Interactive Media & Services | 10.9 |
| Semiconductors & Semiconductor Equipment | 10.0 |
| Financial Services | 7.8 |
| Technology Hardware, Storage & Peripherals | 7.2 |
| Capital Markets | 5.9 |
| Broadline Retail | 4.6 |
| Pharmaceuticals | 4.1 |
| Health Care Providers & Services | 2.9 |
| Hotels, Restaurants & Leisure | 2.7 |
| IT Services | 2.7 |
| Specialized REITs | 2.7 |
| Insurance | 2.6 |
| Life Sciences Tools & Services | 1.8 |
| Aerospace & Defense | 1.6 |
| Commercial Services & Supplies | 1.5 |
| Specialty Retail | 1.5% |
| Ground Transportation | 1.5 |
| Entertainment | 1.4 |
| Professional Services | 1.3 |
| Health Care Equipment & Supplies | 1.1 |
| Health Care REITs | 1.0 |
| Biotechnology | 1.0 |
| Textiles, Apparel & Luxury Goods | 0.6 |
| Automobiles | 0.5 |
| Industrial REITs | 0.5 |
| Consumer Finance | 0.4 |
| Machinery | 0.3 |
| Short–Term Investments | 0.7 |
| Other Assets, Less Liabilities | –0.1 |
| | 100.0% |
See Portfolio of Investments beginning on page 10 for specific holdings within these categories. The Portfolio's holdings are subject to change.
Top Ten Holdings and/or Issuers Held as of December 31, 2023 (excluding short-term investments) (Unaudited)
| 1. | Microsoft Corp. |
| 2. | Apple, Inc. |
| 3. | Alphabet, Inc., Class C |
| 4. | Amazon.com, Inc. |
| 5. | NVIDIA Corp. |
| 6. | Mastercard, Inc., Class A |
| 7. | Meta Platforms, Inc., Class A |
| 8. | UnitedHealth Group, Inc. |
| 9. | Eli Lilly & Co. |
| 10. | S&P Global, Inc. |
Portfolio Management Discussion and Analysis (Unaudited)
Answers to the questions reflect the views of portfolio managers Andrew J. Shilling, CFA, and Clark R. Shields of Wellington Management Company LLP (“Wellington”), the Portfolio’s Subadvisor.
How did MainStay VP Wellington Growth Portfolio perform relative to its benchmark and peers during the 12 months ended December 31, 2023?
For the 12 months ended December 31, 2023, MainStay VP Wellington Growth Portfolio returned 38.61% for Initial Class shares and 38.26% for Service Class shares. Over the same period, both share classes underperformed the 42.68% return of the Russell 1000® Growth Index (“the Index”), which is the Portfolio’s benchmark, and outperformed the 36.74% return of the Morningstar Large Growth Category Average.1
What factors affected the Portfolio’s relative performance during the reporting period?
During the reporting period, the Portfolio underperformed the Index primarily due to security selection. Sector allocation, a result of our bottom-up stock selection process, modestly detracted from relative performance as well.
Which sectors were the strongest positive contributors to the Portfolio’s relative performance, and which sectors were particularly weak?
Security selection in the health care, communication services and consumer discretionary sectors detracted most significantly from results relative to the Index, while selection in industrials and information technology made the strongest positive contributions. (Contributions take weightings and total returns into account.) From a sector allocation perspective, overweight exposure to financials and health care, and underweight exposure to consumer discretionary detracted from relative returns. These negative contributions were partially offset by the Portfolio’s underweight exposure to consumer staples, materials and industrials, which contributed positively to relative performance.
During the reporting period, which individual stocks made the strongest positive contributions to the Portfolio’s absolute performance and which stocks detracted the most?
During the reporting period, many technology stocks reversed their 2022 declines as new artificial intelligence (“AI”) applications jolted technology holdings higher. At the issuer level, the individual stocks making the strongest positive contributions to absolute performance included enterprise software company Microsoft, semiconductor maker NVIDIA and consumer electronics firm Apple. Microsoft shares rose as the company remained well-aligned with many of the most important secular drivers in enterprise technology, including cloud infrastructure, workforce collaboration, cyber security, AI /machine learning frameworks and developer tools. Continued strong business fundamentals and optimism regarding the future of emerging AI-technologies drove performance. NVIDIA shares gained ground after management
reported strong first-quarter earnings and far-better-than-expected guidance on continuing demand for its chips for AI applications. Apple shares rose in response to growing revenues in the company’s services and iPhone divisions. Apple’s valuation reflected a very positive view of the company’s ability to continue to grow revenue and earnings per share (EPS), we believe there are more attractive opportunities elsewhere. As of the end of the reporting period, the Portfolio maintained an overweight position in NVIDIA and underweight positions in Microsoft and Apple.
The most significant detractors from absolute performance included salesforce productivity company ZoomInfo Technologies (ZoomInfo), financial management firm The Charles Schwab Corporation (Schwab) and global prestige beauty products maker The Estée Lauder Companies (Estée Lauder). ZoomInfo shares declined due to macroeconomic pressures, which caused a slowdown in spending and hiring at certain customers. The stock price reflects a long-term negative view of the company prospects, while our view remains positive. After the collapse of Silicon Valley Bank in March 2023, which sparked a material sell off of financial sector companies, Schwab shares fell sharply. Estée Lauder shares lost ground, as weak sales in China weighed on investor sentiment. As of the end of the reporting period, the Portfolio maintained an overweight position in ZoomInfo and had eliminated its holdings in Schwab and Estée Lauder.
Did the Portfolio make any significant purchases or sales during the reporting period?
During the reporting period, the Portfolio initiated positions in social media company Meta Platforms and pharmaceutical company Eli Lilly. Meta has started to monetize their Reels platform, which we anticipate will be a strong contributor to earnings and is also likely to benefit from increased regulatory and government scrutiny of competitor TikTok. In addition, we are encouraged by Meta’s increased focus on cost efficiency, and management’s intention to reduce spending on the metaverse. Eli Lilly stock benefited in 2023 from evidence that GLP-1 drugs—including the company’s Mounjaro and Zepbound—have a profound impact not only on blood sugar and weight, but also on other serious health conditions, such as cardiovascular and kidney disease. We added a position due to Eli Lilly’s best-in-class incretin portfolio and strong, diversified drug pipeline.
During the same period, the Portfolio eliminated positions in international alcoholic beverage producer Constellation Brands and consumer credit reporting agency Equifax. Despite strong execution and resilient beer volumes, we eliminated the Portfolio’s position in Constellation Brands to fund other investment opportunities. We sold the Portfolio’s Equifax holdings due to a combination of weakness in the mortgage market and a dramatic deceleration in the company’s non-mortgage businesses.
| 1. | See "Investment and Performance Comparison" for more information on benchmark and peer group returns. |
| 8 | MainStay VP Wellington Growth Portfolio |
How did the Portfolio’s sector weightings change during the reporting period?
The most notable increase to sector exposures occurred in financials, where the Portfolio ended the reporting period with an overweight position relative to the Index. The most notable reduction was in information technology, which shifted from an overweight position to an underweight position during the reporting period.
How was the Portfolio positioned at the end of the reporting period?
As of December 31, 2023, the Portfolio held its most overweight exposures relative to the Index in the financials and real estate sectors. As of the same date, the Portfolio’s most significantly underweight positions were in the consumer discretionary, information technology and consumer staples sectors.
The opinions expressed are those of the portfolio managers as of the date of this report and are subject to change. There is no guarantee that any forecasts will come to pass. This material does not constitute investment advice and is not intended as an endorsement of any specific investment.
Not all MainStay VP Portfolios and/or share classes are available under all policies.
Portfolio of Investments December 31, 2023†^
| | Shares | Value |
| Common Stocks 99.4% |
| Aerospace & Defense 1.6% |
| Airbus SE, ADR | 109,404 | $ 4,219,712 |
| General Dynamics Corp. | 20,484 | 5,319,080 |
| | | 9,538,792 |
| Automobiles 0.5% |
| Tesla, Inc. (a) | 13,186 | 3,276,457 |
| Biotechnology 1.0% |
| Vertex Pharmaceuticals, Inc. (a) | 15,048 | 6,122,881 |
| Broadline Retail 4.6% |
| Amazon.com, Inc. (a) | 186,309 | 28,307,789 |
| Capital Markets 5.9% |
| Ares Management Corp. | 46,899 | 5,577,229 |
| Blackstone, Inc. | 21,254 | 2,782,574 |
| KKR & Co., Inc. | 57,305 | 4,747,719 |
| Morgan Stanley | 54,360 | 5,069,070 |
| MSCI, Inc. | 12,631 | 7,144,725 |
| S&P Global, Inc. | 24,888 | 10,963,662 |
| | | 36,284,979 |
| Commercial Services & Supplies 1.5% |
| Copart, Inc. (a) | 124,696 | 6,110,104 |
| Waste Connections, Inc. | 22,085 | 3,296,628 |
| | | 9,406,732 |
| Consumer Finance 0.4% |
| American Express Co. | 11,600 | 2,173,144 |
| Entertainment 1.4% |
| Netflix, Inc. (a) | 17,231 | 8,389,429 |
| Financial Services 7.8% |
| FleetCor Technologies, Inc. (a) | 35,793 | 10,115,460 |
| Global Payments, Inc. | 31,146 | 3,955,542 |
| Mastercard, Inc., Class A | 61,591 | 26,269,177 |
| Visa, Inc., Class A | 29,119 | 7,581,132 |
| | | 47,921,311 |
| Ground Transportation 1.5% |
| Uber Technologies, Inc. (a) | 145,153 | 8,937,070 |
| Health Care Equipment & Supplies 1.1% |
| Boston Scientific Corp. (a) | 64,010 | 3,700,418 |
| | Shares | Value |
| |
| Health Care Equipment & Supplies (continued) |
| Stryker Corp. | 10,141 | $ 3,036,824 |
| | | 6,737,242 |
| Health Care Providers & Services 2.9% |
| UnitedHealth Group, Inc. | 33,861 | 17,826,801 |
| Health Care REITs 1.0% |
| Welltower, Inc. | 71,040 | 6,405,677 |
| Hotels, Restaurants & Leisure 2.7% |
| Airbnb, Inc., Class A (a) | 63,373 | 8,627,600 |
| Hilton Worldwide Holdings, Inc. | 44,121 | 8,033,993 |
| | | 16,661,593 |
| Industrial REITs 0.5% |
| Prologis, Inc. | 24,435 | 3,257,185 |
| Insurance 2.6% |
| Marsh & McLennan Cos., Inc. | 30,449 | 5,769,172 |
| Progressive Corp. (The) | 65,658 | 10,458,006 |
| | | 16,227,178 |
| Interactive Media & Services 10.9% |
| Alphabet, Inc., Class C (a) | 257,458 | 36,283,556 |
| Meta Platforms, Inc., Class A (a) | 69,094 | 24,456,512 |
| ZoomInfo Technologies, Inc. (a) | 315,732 | 5,837,885 |
| | | 66,577,953 |
| IT Services 2.7% |
| Gartner, Inc. (a) | 7,626 | 3,440,165 |
| MongoDB, Inc. (a) | 19,432 | 7,944,773 |
| Shopify, Inc., Class A (a) | 64,728 | 5,042,311 |
| VeriSign, Inc. (a) | 1,036 | 213,375 |
| | | 16,640,624 |
| Life Sciences Tools & Services 1.8% |
| Danaher Corp. | 37,807 | 8,746,271 |
| Mettler-Toledo International, Inc. (a) | 1,663 | 2,017,153 |
| | | 10,763,424 |
| Machinery 0.3% |
| IDEX Corp. | 7,311 | 1,587,291 |
| Pharmaceuticals 4.1% |
| Eli Lilly & Co. | 25,606 | 14,926,249 |
| Zoetis, Inc. | 50,088 | 9,885,869 |
| | | 24,812,118 |
The notes to the financial statements are an integral part of, and should be read in conjunction with, the financial statements.
| 10 | MainStay VP Wellington Growth Portfolio |
| | Shares | Value |
| Common Stocks (continued) |
| Professional Services 1.3% |
| TransUnion | 114,070 | $ 7,837,750 |
| Semiconductors & Semiconductor Equipment 10.0% |
| Advanced Micro Devices, Inc. (a) | 56,846 | 8,379,669 |
| ARM Holdings plc, ADR (a)(b) | 15,096 | 1,134,389 |
| ASML Holding NV (Registered) | 9,558 | 7,234,641 |
| Microchip Technology, Inc. | 63,660 | 5,740,859 |
| Monolithic Power Systems, Inc. | 16,231 | 10,238,190 |
| NVIDIA Corp. | 57,057 | 28,255,768 |
| | | 60,983,516 |
| Software 19.3% |
| ANSYS, Inc. (a) | 16,780 | 6,089,126 |
| Atlassian Corp., Class A (a) | 35,344 | 8,406,924 |
| Cadence Design Systems, Inc. (a) | 18,977 | 5,168,766 |
| HubSpot, Inc. (a) | 11,537 | 6,697,690 |
| Intuit, Inc. | 17,431 | 10,894,898 |
| Microsoft Corp. | 169,160 | 63,610,926 |
| Salesforce, Inc. (a) | 29,964 | 7,884,727 |
| ServiceNow, Inc. (a) | 13,243 | 9,356,047 |
| | | 118,109,104 |
| Specialized REITs 2.7% |
| American Tower Corp. | 46,607 | 10,061,519 |
| Equinix, Inc. | 7,863 | 6,332,782 |
| | | 16,394,301 |
| Specialty Retail 1.5% |
| TJX Cos., Inc. (The) | 98,107 | 9,203,418 |
| Technology Hardware, Storage & Peripherals 7.2% |
| Apple, Inc. | 229,468 | 44,179,474 |
| Textiles, Apparel & Luxury Goods 0.6% |
| Lululemon Athletica, Inc. (a) | 7,193 | 3,677,709 |
Total Common Stocks
(Cost $475,156,271) | | 608,240,942 |
| | Shares | | Value |
| Short-Term Investments 0.7% |
| Affiliated Investment Company 0.6% |
| MainStay U.S. Government Liquidity Fund, 5.235% (c) | 3,733,076 | | $ 3,733,076 |
| Unaffiliated Investment Company 0.1% |
| Invesco Government & Agency Portfolio, 5.361% (c)(d) | 212,170 | | 212,170 |
Total Short-Term Investments
(Cost $3,945,246) | | | 3,945,246 |
Total Investments
(Cost $479,101,517) | 100.1% | | 612,186,188 |
| Other Assets, Less Liabilities | (0.1) | | (463,992) |
| Net Assets | 100.0% | | $ 611,722,196 |
| † | Percentages indicated are based on Portfolio net assets. |
| ^ | Industry classifications may be different than those used for compliance monitoring purposes. |
| (a) | Non-income producing security. |
| (b) | All or a portion of this security was held on loan. As of December 31, 2023, the aggregate market value of securities on loan was $1,134,314; the total market value of collateral held by the Portfolio was $1,287,477. The market value of the collateral held included non-cash collateral in the form of U.S. Treasury securities with a value of $1,075,307. The Portfolio received cash collateral with a value of $212,170. (See Note 2(G)) |
| (c) | Current yield as of December 31, 2023. |
| (d) | Represents a security purchased with cash collateral received for securities on loan. |
Investments in Affiliates (in 000's)
Investments in issuers considered to be affiliate(s) of the Portfolio during the year ended December 31, 2023 for purposes of Section 2(a)(3) of the Investment Company Act of 1940, as amended, were as follows:
| Affiliated Investment Companies | Value,
Beginning
of Year | Purchases
at Cost | Proceeds
from
Sales | Net
Realized
Gain/(Loss)
on Sales | Change in
Unrealized
Appreciation/
(Depreciation) | Value,
End of
Year | Dividend
Income | Other
Distributions | Shares
End of
Year |
| MainStay U.S. Government Liquidity Fund | $ 16,085 | $ 118,008 | $ (130,360) | $ — | $ — | $ 3,733 | $ 454 | $ — | 3,733 |
The notes to the financial statements are an integral part of, and should be read in conjunction with, the financial statements.
11
Portfolio of Investments December 31, 2023†^ (continued)
| Abbreviation(s): |
| ADR—American Depositary Receipt |
| REIT—Real Estate Investment Trust |
The following is a summary of the fair valuations according to the inputs used as of December 31, 2023, for valuing the Portfolio’s assets:
| Description | Quoted
Prices in
Active
Markets for
Identical
Assets
(Level 1) | | Significant
Other
Observable
Inputs
(Level 2) | | Significant
Unobservable
Inputs
(Level 3) | | Total |
| Asset Valuation Inputs | | | | | | | |
| Investments in Securities (a) | | | | | | | |
| Common Stocks | $ 608,240,942 | | $ — | | $ — | | $ 608,240,942 |
| Short-Term Investments | | | | | | | |
| Affiliated Investment Company | 3,733,076 | | — | | — | | 3,733,076 |
| Unaffiliated Investment Company | 212,170 | | — | | — | | 212,170 |
| Total Short-Term Investments | 3,945,246 | | — | | — | | 3,945,246 |
| Total Investments in Securities | $ 612,186,188 | | $ — | | $ — | | $ 612,186,188 |
| (a) | For a complete listing of investments and their industries, see the Portfolio of Investments. |
The notes to the financial statements are an integral part of, and should be read in conjunction with, the financial statements.
| 12 | MainStay VP Wellington Growth Portfolio |
Statement of Assets and Liabilities as of December 31, 2023
| Assets |
Investment in unaffiliated securities, at value
(identified cost $475,368,441) including securities on loan of $1,134,314 | $608,453,112 |
Investment in affiliated investment companies, at value
(identified cost $3,733,076) | 3,733,076 |
| Receivables: | |
| Investment securities sold | 2,377,978 |
| Dividends | 152,905 |
| Portfolio shares sold | 7,152 |
| Securities lending | 1,796 |
| Other assets | 3,263 |
| Total assets | 614,729,282 |
| Liabilities |
| Cash collateral received for securities on loan | 212,170 |
| Payables: | |
| Investment securities purchased | 2,175,067 |
| Manager (See Note 3) | 354,410 |
| Portfolio shares redeemed | 176,575 |
| Shareholder communication | 34,718 |
| Professional fees | 29,172 |
| Custodian | 10,277 |
| NYLIFE Distributors (See Note 3) | 8,289 |
| Accrued expenses | 6,408 |
| Total liabilities | 3,007,086 |
| Net assets | $611,722,196 |
| Composition of Net Assets |
| Shares of beneficial interest outstanding (par value of $.001 per share) unlimited number of shares authorized | $ 25,079 |
| Additional paid-in-capital | 535,322,975 |
| | 535,348,054 |
| Total distributable earnings (loss) | 76,374,142 |
| Net assets | $611,722,196 |
| Initial Class | |
| Net assets applicable to outstanding shares | $572,152,635 |
| Shares of beneficial interest outstanding | 23,406,205 |
| Net asset value per share outstanding | $ 24.44 |
| Service Class | |
| Net assets applicable to outstanding shares | $ 39,569,561 |
| Shares of beneficial interest outstanding | 1,673,131 |
| Net asset value per share outstanding | $ 23.65 |
The notes to the financial statements are an integral part of, and should be read in conjunction with, the financial statements.
13
Statement of Operations for the year ended December 31, 2023
| Investment Income (Loss) |
| Income | |
| Dividends-unaffiliated (net of foreign tax withholding of $16,859) | $ 3,586,564 |
| Dividends-affiliated | 453,981 |
| Securities lending, net | 4,838 |
| Total income | 4,045,383 |
| Expenses | |
| Manager (See Note 3) | 4,083,433 |
| Distribution/Service—Service Class (See Note 3) | 95,322 |
| Professional fees | 91,731 |
| Custodian | 23,708 |
| Trustees | 14,999 |
| Miscellaneous | 24,323 |
| Total expenses | 4,333,516 |
| Net investment income (loss) | (288,133) |
| Realized and Unrealized Gain (Loss) |
| Net realized gain (loss) on unaffiliated investments | 2,925,180 |
| Net change in unrealized appreciation (depreciation) on unaffiliated investments | 189,464,907 |
| Net realized and unrealized gain (loss) | 192,390,087 |
| Net increase (decrease) in net assets resulting from operations | $192,101,954 |
The notes to the financial statements are an integral part of, and should be read in conjunction with, the financial statements.
| 14 | MainStay VP Wellington Growth Portfolio |
Statements of Changes in Net Assets
for the years ended December 31, 2023 and December 31, 2022
| | 2023 | 2022 |
| Increase (Decrease) in Net Assets |
| Operations: | | |
| Net investment income (loss) | $ (288,133) | $ (827,127) |
| Net realized gain (loss) | 2,925,180 | (58,896,810) |
| Net change in unrealized appreciation (depreciation) | 189,464,907 | (205,606,983) |
| Net increase (decrease) in net assets resulting from operations | 192,101,954 | (265,330,920) |
| Distributions to shareholders: | | |
| Initial Class | — | (171,459,297) |
| Service Class | — | (12,259,342) |
| Total distributions to shareholders | — | (183,718,639) |
| Capital share transactions: | | |
| Net proceeds from sales of shares | 3,301,321 | 94,150,878 |
| Net asset value of shares issued to shareholders in reinvestment of distributions | — | 183,718,639 |
| Cost of shares redeemed | (127,839,061) | (58,166,556) |
| Increase (decrease) in net assets derived from capital share transactions | (124,537,740) | 219,702,961 |
| Net increase (decrease) in net assets | 67,564,214 | (229,346,598) |
| Net Assets |
| Beginning of year | 544,157,982 | 773,504,580 |
| End of year | $ 611,722,196 | $ 544,157,982 |
The notes to the financial statements are an integral part of, and should be read in conjunction with, the financial statements.
15
Financial Highlights selected per share data and ratios
| | Year Ended December 31, |
| Initial Class | 2023 | | 2022 | | 2021 | | 2020 | | 2019 |
| Net asset value at beginning of year | $ 17.64 | | $ 40.09 | | $ 39.15 | | $ 32.64 | | $ 27.74 |
| Net investment income (loss) (a) | (0.01) | | (0.03) | | (0.12) | | 0.12 | | 0.18 |
| Net realized and unrealized gain (loss) | 6.81 | | (13.45) | | 7.70 | | 10.08 | | 7.77 |
| Total from investment operations | 6.80 | | (13.48) | | 7.58 | | 10.20 | | 7.95 |
| Less distributions: | | | | | | | | | |
| From net investment income | — | | — | | (0.15) | | (0.21) | | (0.19) |
| From net realized gain on investments | — | | (8.97) | | (6.49) | | (3.48) | | (2.86) |
| Total distributions | — | | (8.97) | | (6.64) | | (3.69) | | (3.05) |
| Net asset value at end of year | $ 24.44 | | $ 17.64 | | $ 40.09 | | $ 39.15 | | $ 32.64 |
| Total investment return (b) | 38.55%(c) | | (33.17)% | | 19.75% | | 32.30% | | 30.01% |
| Ratios (to average net assets)/Supplemental Data: | | | | | | | | | |
| Net investment income (loss) | (0.03)% | | (0.12)% | | (0.28)% | | 0.35% | | 0.56% |
| Net expenses (d) | 0.72% | | 0.73% | | 0.72% | | 0.73% | | 0.72% |
| Expenses (before waiver/reimbursement) (d) | 0.72% | | 0.73% | | 0.73% | | 0.73% | | 0.72% |
| Portfolio turnover rate | 40% | | 42% | | 48% | | 144% | | 156% |
| Net assets at end of year (in 000's) | $ 572,153 | | $ 509,030 | | $ 716,521 | | $ 590,841 | | $ 652,081 |
| (a) | Per share data based on average shares outstanding during the year. |
| (b) | Total return does not reflect any deduction of sales charges, mortality and expense charges, contract charges or administrative charges. For periods of less than one year, total return is not annualized. |
| (c) | Total investment return may reflect adjustments to conform to generally accepted accounting principles. |
| (d) | In addition to the fees and expenses which the Portfolio bears directly, it also indirectly bears a pro-rata share of the fees and expenses of the underlying funds in which it invests. Such indirect expenses are not included in the above expense ratios. |
| | Year Ended December 31, |
| Service Class | 2023 | | 2022 | | 2021 | | 2020 | | 2019 |
| Net asset value at beginning of year | $ 17.11 | | $ 39.39 | | $ 38.57 | | $ 32.19 | | $ 27.38 |
| Net investment income (loss) (a) | (0.06) | | (0.10) | | (0.22) | | 0.04 | | 0.10 |
| Net realized and unrealized gain (loss) | 6.60 | | (13.21) | | 7.57 | | 9.93 | | 7.66 |
| Total from investment operations | 6.54 | | (13.31) | | 7.35 | | 9.97 | | 7.76 |
| Less distributions: | | | | | | | | | |
| From net investment income | — | | — | | (0.04) | | (0.11) | | (0.09) |
| From net realized gain on investments | — | | (8.97) | | (6.49) | | (3.48) | | (2.86) |
| Total distributions | — | | (8.97) | | (6.53) | | (3.59) | | (2.95) |
| Net asset value at end of year | $ 23.65 | | $ 17.11 | | $ 39.39 | | $ 38.57 | | $ 32.19 |
| Total investment return (b) | 38.22%(c) | | (33.33)% | | 19.45% | | 31.97% | | 29.69% |
| Ratios (to average net assets)/Supplemental Data: | | | | | | | | | |
| Net investment income (loss) | (0.28)% | | (0.37)% | | (0.53)% | | 0.11% | | 0.32% |
| Net expenses (d) | 0.97% | | 0.98% | | 0.97% | | 0.98% | | 0.97% |
| Expenses (before waiver/reimbursement) (d) | 0.97% | | 0.98% | | 0.98% | | 0.98% | | 0.97% |
| Portfolio turnover rate | 40% | | 42% | | 48% | | 144% | | 156% |
| Net assets at end of year (in 000's) | $ 39,570 | | $ 35,128 | | $ 56,983 | | $ 57,351 | | $ 56,122 |
| (a) | Per share data based on average shares outstanding during the year. |
| (b) | Total return does not reflect any deduction of sales charges, mortality and expense charges, contract charges or administrative charges. For periods of less than one year, total return is not annualized. |
| (c) | Total investment return may reflect adjustments to conform to generally accepted accounting principles. |
| (d) | In addition to the fees and expenses which the Portfolio bears directly, it also indirectly bears a pro-rata share of the fees and expenses of the underlying funds in which it invests. Such indirect expenses are not included in the above expense ratios. |
The notes to the financial statements are an integral part of, and should be read in conjunction with, the financial statements.
| 16 | MainStay VP Wellington Growth Portfolio |
Notes to Financial Statements
Note 1–Organization and Business
MainStay VP Funds Trust (the “Fund”) was organized as a Delaware statutory trust on February 1, 2011. The Fund is registered under the Investment Company Act of 1940, as amended (the “1940 Act”), as an open-end management investment company. The Fund is comprised of thirty-one separate series (collectively referred to as the “Portfolios”). These financial statements and notes relate to the MainStay VP Wellington Growth Portfolio (the "Portfolio"), a "diversified” portfolio, as that term is defined in the 1940 Act, as interpreted or modified by regulatory authorities having jurisdiction, from time to time.
Shares of the Portfolio are currently offered to certain separate accounts to fund variable annuity policies and variable universal life insurance policies issued by New York Life Insurance and Annuity Corporation (“NYLIAC”), a wholly-owned subsidiary of New York Life Insurance Company (“New York Life”) and may also be offered to fund variable annuity policies and variable universal life insurance policies issued by other insurance companies. NYLIAC allocates shares of the Portfolio to, among others, certain NYLIAC separate accounts. Shares of the Portfolio are also offered to the MainStay VP Conservative Allocation Portfolio, MainStay VP Moderate Allocation Portfolio, MainStay VP Growth Allocation Portfolio and MainStay VP Equity Allocation Portfolio, which operate as “funds-of-funds," and other variable insurance funds.
The following table lists the Portfolio's share classes that have been registered and commenced operations:
| Class | Commenced Operations |
| Initial Class | January 29, 1993 |
| Service Class | June 5, 2003 |
Shares of the Portfolio are offered and are redeemed at a price equal to their respective net asset value (“NAV”) per share. No sales or redemption charge is applicable to the purchase or redemption of the Portfolio's shares. Under the terms of the Fund’s multiple class plan, adopted pursuant to Rule 18f-3 under the 1940 Act, the classes differ in that, among other things, Service Class shares of the Portfolio pay a combined distribution and service fee of 0.25% of average daily net assets attributable to Service Class shares of the Portfolio to the Distributor (as defined in Note 3(B)) pursuant to a plan adopted in accordance with Rule 12b-1 under the 1940 Act. Contract owners of variable annuity contracts purchased after June 2, 2003, are permitted to invest only in the Service Class shares.
The Portfolio's investment objective is to seek long-term growth of capital.
Note 2–Significant Accounting Policies
The Portfolio is an investment company and accordingly follows the investment company accounting and reporting guidance of the Financial Accounting Standards Board (“FASB”) Accounting Standards Codification Topic 946 Financial Services—Investment Companies. The Portfolio prepares its financial statements in accordance with generally accepted
accounting principles (“GAAP”) in the United States of America and follows the significant accounting policies described below.
(A) Securities Valuation. Investments are usually valued as of the close of regular trading on the New York Stock Exchange (the "Exchange") (usually 4:00 p.m. Eastern time) on each day the Portfolio is open for business ("valuation date").
Pursuant to Rule 2a-5 under the 1940 Act, the Board of Trustees of the Fund (the "Board") has designated New York Life Investment Management LLC (“New York Life Investments” or the "Manager") as its Valuation Designee (the "Valuation Designee"). The Valuation Designee is responsible for performing fair valuations relating to all investments in the Portfolio’s portfolio for which market quotations are not readily available; periodically assessing and managing material valuation risks; establishing and applying fair value methodologies; testing fair valuation methodologies; evaluating and overseeing pricing services; ensuring appropriate segregation of valuation and portfolio management functions; providing quarterly, annual and prompt reporting to the Board, as appropriate; identifying potential conflicts of interest; and maintaining appropriate records. The Valuation Designee has established a valuation committee ("Valuation Committee") to assist in carrying out the Valuation Designee’s responsibilities and establish prices of securities for which market quotations are not readily available. The Portfolio's and the Valuation Designee's policies and procedures ("Valuation Procedures") govern the Valuation Designee’s selection and application of methodologies for determining and calculating the fair value of Portfolio investments. The Valuation Designee may value the Portfolio's portfolio securities for which market quotations are not readily available and other Portfolio assets utilizing inputs from pricing services and other third-party sources. The Valuation Committee meets (in person, via electronic mail or via teleconference) on an ad-hoc basis to determine fair valuations and on a quarterly basis to review fair value events with respect to certain securities for which market quotations are not readily available, including valuation risks and back-testing results, and to preview reports to the Board.
The Valuation Committee establishes prices of securities for which market quotations are not readily available based on such methodologies and measurements on a regular basis after considering information that is reasonably available and deemed relevant by the Valuation Committee. The Board shall oversee the Valuation Designee and review fair valuation materials on a prompt, quarterly and annual basis and approve proposed revisions to the Valuation Procedures.
Investments for which market quotations are not readily available are valued at fair value as determined in good faith pursuant to the Valuation Procedures. A market quotation is readily available only when that quotation is a quoted price (unadjusted) in active markets for identical investments that the Portfolio can access at the measurement date, provided that a quotation will not be readily available if it is not reliable. "Fair value" is defined as the price the Portfolio would reasonably expect to receive upon selling an asset or liability in an orderly transaction to an independent buyer in the principal or most advantageous market for the
Notes to Financial Statements (continued)
asset or liability. Fair value measurements are determined within a framework that establishes a three-tier hierarchy that maximizes the use of observable market data and minimizes the use of unobservable inputs to establish a classification of fair value measurements for disclosure purposes. "Inputs" refer broadly to the assumptions that market participants would use in pricing the asset or liability, including assumptions about risk, such as the risk inherent in a particular valuation technique used to measure fair value using a pricing model and/or the risk inherent in the inputs for the valuation technique. Inputs may be observable or unobservable. Observable inputs reflect the assumptions market participants would use in pricing the asset or liability based on market data obtained from sources independent of the Portfolio. Unobservable inputs reflect the Portfolio’s own assumptions about the assumptions market participants would use in pricing the asset or liability based on the information available. The inputs or methodology used for valuing assets or liabilities may not be an indication of the risks associated with investing in those assets or liabilities. The three-tier hierarchy of inputs is summarized below.
| • | Level 1—quoted prices (unadjusted) in active markets for an identical asset or liability |
| • | Level 2—other significant observable inputs (including quoted prices for a similar asset or liability in active markets, interest rates and yield curves, prepayment speeds, credit risk, etc.) |
| • | Level 3—significant unobservable inputs (including the Portfolio's own assumptions about the assumptions that market participants would use in measuring fair value of an asset or liability) |
The level of an asset or liability within the fair value hierarchy is based on the lowest level of an input, both individually and in the aggregate, that is significant to the fair value measurement. The aggregate value by input level of the Portfolio’s assets and liabilities as of December 31, 2023, is included at the end of the Portfolio of Investments.
The Portfolio may use third-party vendor evaluations, whose prices may be derived from one or more of the following standard inputs, among others:
| • Broker/dealer quotes | • Benchmark securities |
| • Two-sided markets | • Reference data (corporate actions or material event notices) |
| • Bids/offers | • Monthly payment information |
| • Industry and economic events | • Reported trades |
An asset or liability for which a market quotation is not readily available is valued by methods deemed reasonable in good faith by the Valuation Committee, following the Valuation Procedures to represent fair value. Under these procedures, the Valuation Designee generally uses a market-based approach which may use related or comparable assets or liabilities, recent transactions, market multiples, book values and other relevant information. The Valuation Designee may also use an income-based valuation approach in which the anticipated future cash flows of the asset or liability are discounted to calculate fair value.
Discounts may also be applied due to the nature and/or duration of any restrictions on the disposition of the asset or liability. Fair value represents a good faith approximation of the value of a security. Fair value determinations involve the consideration of a number of subjective factors, an analysis of applicable facts and circumstances and the exercise of judgment. As a result, it is possible that the fair value for a security determined in good faith in accordance with the Valuation Procedures may differ from valuations for the same security determined for other funds using their own valuation procedures. Although the Valuation Procedures are designed to value a security at the price the Portfolio may reasonably expect to receive upon the security's sale in an orderly transaction, there can be no assurance that any fair value determination thereunder would, in fact, approximate the amount that the Portfolio would actually realize upon the sale of the security or the price at which the security would trade if a reliable market price were readily available. During the year ended December 31, 2023, there were no material changes to the fair value methodologies.
Securities which may be valued in this manner include, but are not limited to: (i) a security for which trading has been halted or suspended or otherwise does not have a readily available market quotation on a given day; (ii) a debt security that has recently gone into default and for which there is not a current market quotation; (iii) a security of an issuer that has entered into a restructuring; (iv) a security that has been delisted from a national exchange; (v) a security subject to trading collars for which no or limited trading takes place; and (vi) a security whose principal market has been temporarily closed at a time when, under normal conditions, it would be open. Securities valued in this manner are generally categorized as Level 2 or 3 in the hierarchy.
Equity securities, rights and warrants, if applicable, are valued at the last quoted sales prices as of the close of regular trading on the relevant exchange on each valuation date. Securities that are not traded on the valuation date are valued at the mean of the last quoted bid and ask prices. Prices are normally taken from the principal market in which each security trades. These securities are generally categorized as Level 1 in the hierarchy.
Investments in mutual funds, including money market funds, are valued at their respective NAVs at the close of business each day on the valuation date. These securities are generally categorized as Level 1 in the hierarchy.
Temporary cash investments acquired in excess of 60 days to maturity at the time of purchase are valued using the latest bid prices or using valuations based on a matrix system (which considers such factors as security prices, yields, maturities and ratings), both as furnished by independent pricing services. Temporary cash investments that mature in 60 days or less at the time of purchase ("Short-Term Investments") are valued using the amortized cost method of valuation, unless the use of such method would be inappropriate. The amortized cost method involves valuing a security at its cost on the date of purchase and thereafter assuming a constant amortization to maturity of the difference between such cost and the value on maturity date. Amortized cost approximates
| 18 | MainStay VP Wellington Growth Portfolio |
the current fair value of a security. Securities valued using the amortized cost method are not valued using quoted prices in an active market and are generally categorized as Level 2 in the hierarchy.
The information above is not intended to reflect an exhaustive list of the methodologies that may be used to value portfolio investments. The Valuation Procedures permit the use of a variety of valuation methodologies in connection with valuing portfolio investments. The methodology used for a specific type of investment may vary based on the market data available or other considerations. The methodologies summarized above may not represent the specific means by which portfolio investments are valued on any particular business day.
(B) Income Taxes. The Portfolio's policy is to comply with the requirements of the Internal Revenue Code of 1986, as amended (the “Internal Revenue Code”), applicable to regulated investment companies and to distribute all of its taxable income to the shareholders of the Portfolio within the allowable time limits.
The Manager evaluates the Portfolio’s tax positions to determine if the tax positions taken meet the minimum recognition threshold in connection with accounting for uncertainties in income tax positions taken or expected to be taken for the purposes of measuring and recognizing tax liabilities in the financial statements. Recognition of tax benefits of an uncertain tax position is permitted only to the extent the position is “more likely than not” to be sustained assuming examination by taxing authorities. The Manager analyzed the Portfolio's tax positions taken on federal, state and local income tax returns for all open tax years (for up to three tax years) and has concluded that no provisions for federal, state and local income tax are required in the Portfolio's financial statements. The Portfolio's federal, state and local income tax and federal excise tax returns for tax years for which the applicable statutes of limitations have not expired are subject to examination by the Internal Revenue Service and state and local departments of revenue.
(C) Dividends and Distributions to Shareholders. Dividends and distributions are recorded on the ex-dividend date. The Portfolio intends to declare and pay dividends from net investment income and distributions from net realized capital and currency gains, if any, at least annually. All dividends and distributions are reinvested at NAV in the same class of shares of the Portfolio. Dividends and distributions to shareholders are determined in accordance with federal income tax regulations and may differ from determinations using GAAP.
(D) Security Transactions and Investment Income. The Portfolio records security transactions on the trade date. Realized gains and losses on security transactions are determined using the identified cost method. Dividend income is recognized on the ex-dividend date, net of any foreign tax withheld at the source, and interest income is accrued as earned using the effective interest rate method. Distributions received from real estate investment trusts may be classified as dividends, capital gains and/or return of capital.
Investment income and realized and unrealized gains and losses on investments of the Portfolio are allocated pro rata to the separate classes
of shares based upon their relative net assets on the date the income is earned or realized and unrealized gains and losses are incurred.
(E) Expenses. Expenses of the Fund are allocated to the individual Portfolios in proportion to the net assets of the respective Portfolios when the expenses are incurred, except where direct allocations of expenses can be made. Expenses (other than fees incurred under the distribution and service plans, further discussed in Note 3(B), which are charged directly to the Service Class shares) are allocated to separate classes of shares pro rata based upon their relative net assets on the date the expenses are incurred. The expenses borne by the Portfolio, including those of related parties to the Portfolio, are shown in the Statement of Operations.
Additionally, the Portfolio may invest in mutual funds, which are subject to management fees and other fees that may cause the costs of investing in mutual funds to be greater than the costs of owning the underlying securities directly. These indirect expenses of mutual funds are not included in the amounts shown as expenses in the Statement of Operations or in the expense ratios included in the Financial Highlights.
(F) Use of Estimates. In preparing financial statements in conformity with GAAP, the Manager makes estimates and assumptions that affect the reported amounts and disclosures in the financial statements. Actual results could differ from those estimates and assumptions.
(G) Securities Lending. In order to realize additional income, the Portfolio may engage in securities lending, subject to the limitations set forth in the 1940 Act and relevant guidance by the staff of the Securities and Exchange Commission (“SEC”). If the Portfolio engages in securities lending, the Portfolio will lend through its custodian, JPMorgan Chase Bank, N.A., ("JPMorgan"), acting as securities lending agent on behalf of the Portfolio. Under the current arrangement, JPMorgan will manage the Portfolio's collateral in accordance with the securities lending agency agreement between the Portfolio and JPMorgan, and indemnify the Portfolio against counterparty risk. The loans will be collateralized by cash (which may be invested in a money market fund) and/or non-cash collateral (which may include U.S. Treasury securities and/or U.S. government agency securities issued or guaranteed by the United States government or its agencies or instrumentalities) at least equal at all times to the market value of the securities loaned. Non-cash collateral held at year end is segregated and cannot be transferred by the Portfolio. The Portfolio bears the risk of delay in recovery of, or loss of rights in, the securities loaned. The Portfolio may also record a realized gain or loss on securities deemed sold due to a borrower’s inability to return securities on loan. The Portfolio bears the risk of any loss on investment of cash collateral. The Portfolio will receive compensation for lending its securities in the form of fees or it will retain a portion of interest earned on the investment of any cash collateral. The Portfolio will also continue to receive interest and dividends on the securities loaned and any gain or loss in the market price of the securities loaned that may occur during the term of the loan will be for the account of the Portfolio. Income earned from securities lending activities, if any, is reflected in the Statement of Operations.
Notes to Financial Statements (continued)
(H) Indemnifications. Under the Fund’s organizational documents, its officers and trustees are indemnified against certain liabilities that may arise out of performance of their duties to the Fund. Additionally, in the normal course of business, the Portfolio enters into contracts with third-party service providers that contain a variety of representations and warranties and that may provide general indemnifications. The Portfolio's maximum exposure under these arrangements is unknown, as this would involve future claims that may be made against the Portfolio that have not yet occurred. The Manager believes that the risk of loss in connection with these potential indemnification obligations is remote. However, there can be no assurance that material liabilities related to such obligations will not arise in the future, which could adversely impact the Portfolio.
Note 3–Fees and Related Party Transactions
(A) Manager and Subadvisor. New York Life Investments, a registered investment adviser and an indirect, wholly-owned subsidiary of New York Life, serves as the Portfolio's Manager, pursuant to an Amended and Restated Management Agreement ("Management Agreement"). The Manager provides offices, conducts clerical, recordkeeping and bookkeeping services and keeps most of the financial and accounting records required to be maintained by the Portfolio. Except for the portion of salaries and expenses that are the responsibility of the Portfolio, the Manager pays the salaries and expenses of all personnel affiliated with the Portfolio and certain operational expenses of the Portfolio. The Portfolio reimburses New York Life Investments in an amount equal to the portion of the compensation of the Chief Compliance Officer attributable to the Portfolio. Wellington Management Company LLP ("Wellington" or the "Subadvisor"), a registered investment adviser, serves as the Subadvisor to the Portfolio and is responsible for the day-to-day portfolio management of the Portfolio. Pursuant to the terms of a Subadvisory Agreement between New York Life Investments and Wellington, New York Life Investments pays for the services of the Subadvisor.
Pursuant to the Management Agreement, the Fund pays the Manager, on behalf of the Portfolio, a monthly fee for the services performed and the facilities furnished at an annual rate of the Portfolio's average daily net assets as follows: 0.70% up to $500 million; 0.65% from $500 million to $1 billion; 0.625% from $1 billion to $2 billion; and 0.60% in excess of $2 billion. During the year ended December 31, 2023, the effective management fee rate was 0.69% of the Portfolio's average daily net assets.
During the year ended December 31, 2023, New York Life Investments earned fees from the Portfolio in the amount of $4,083,433 and paid the Subadvisor fees in the amount of $1,687,856.
JPMorgan provides sub-administration and sub-accounting services to the Portfolio pursuant to an agreement with New York Life Investments. These services include calculating the daily NAVs of the Portfolio, maintaining the general ledger and sub-ledger accounts for the calculation of the Portfolio's NAVs, and assisting New York Life Investments in conducting various aspects of the Portfolio's
administrative operations. For providing these services to the Portfolio, JPMorgan is compensated by New York Life Investments.
Pursuant to an agreement between the Fund and New York Life Investments, New York Life Investments is responsible for providing or procuring certain regulatory reporting services for the Portfolio. The Portfolio will reimburse New York Life Investments for the actual costs incurred by New York Life Investments in connection with providing or procuring these services for the Portfolio.
(B) Distribution and Service Fees. The Fund, on behalf of the Portfolio, has entered into a distribution agreement with NYLIFE Distributors LLC (the “Distributor”), an affiliate of New York Life Investments. The Portfolio has adopted a distribution plan (the “Plan”) in accordance with the provisions of Rule 12b-1 under the 1940 Act. Under the Plan, the Distributor has agreed to provide, through its affiliates or independent third parties, various distribution-related, shareholder and administrative support services to the Service Class shareholders. For its services, the Distributor is entitled to a combined distribution and service fee accrued daily and paid monthly at an annual rate of 0.25% of the average daily net assets attributable to the Service Class shares of the Portfolio.
Note 4-Federal Income Tax
As of December 31, 2023, the cost and unrealized appreciation (depreciation) of the Portfolio’s investment portfolio, including applicable derivative contracts and other financial instruments, as determined on a federal income tax basis, were as follows:
| | Federal Tax
Cost | Gross
Unrealized
Appreciation | Gross
Unrealized
(Depreciation) | Net
Unrealized
Appreciation/
(Depreciation) |
| Investments in Securities | $483,693,402 | $138,067,155 | $(9,574,369) | $128,492,786 |
As of December 31, 2023, the components of accumulated gain (loss) on a tax basis were as follows:
Ordinary
Income | Accumulated
Capital
and Other
Gain (Loss) | Other
Temporary
Differences | Unrealized
Appreciation
(Depreciation) | Total
Accumulated
Gain (Loss) |
| $— | $(52,198,170) | $79,526 | $128,492,786 | $76,374,142 |
The difference between book-basis and tax-basis unrealized appreciation (depreciation) is primarily due to wash sale adjustments.
| 20 | MainStay VP Wellington Growth Portfolio |
The following table discloses the current year reclassifications between total distributable earnings (loss) and additional paid-in capital arising from permanent differences; net assets as of December 31, 2023 were not affected.
| | Total
Distributable
Earnings (Loss) | Additional
Paid-In
Capital |
| | $365,022 | $(365,022) |
The reclassifications for the Portfolio are primarily due to net operating losses.
As of December 31, 2023, for federal income tax purposes, capital loss carryforwards of $52,198,170, as shown in the table below, were available to the extent provided by the regulations to offset future realized gains of the Portfolio. Accordingly, no capital gains distributions are expected to be paid to shareholders until net gains have been realized in excess of such amounts.
Capital Loss
Available Through | Short-Term
Capital Loss
Amounts (000’s) | Long-Term
Capital Loss
Amounts (000’s) |
| Unlimited | $44,091 | $8,107 |
The Portfolio utilized $3,412,663 of capital loss carryforwards during the year ended December 31, 2023.
During the years ended December 31, 2023 and December 31, 2022, the tax character of distributions paid as reflected in the Statements of Changes in Net Assets was as follows:
| | 2023 | 2022 |
| Distributions paid from: | | |
| Ordinary Income | $— | $ 50,614,417 |
| Long-Term Capital Gains | — | 133,104,222 |
| Total | $— | $183,718,639 |
Note 5–Custodian
JPMorgan is the custodian of cash and securities held by the Portfolio. Custodial fees are charged to the Portfolio based on the Portfolio's net assets and/or the market value of securities held by the Portfolio and the number of certain transactions incurred by the Portfolio.
Note 6–Line of Credit
The Portfolio and certain other funds managed by New York Life Investments maintain a line of credit with a syndicate of banks in order to secure a source of funds for temporary purposes to meet unanticipated or excessive redemption requests.
Effective July 25, 2023, under the credit agreement (the “Credit Agreement”), the aggregate commitment amount is $600,000,000 with an additional uncommitted amount of $100,000,000. The commitment fee is an annual rate of 0.15% of the average commitment amount payable quarterly, regardless of usage, to JPMorgan, who serves as the agent to the syndicate. The commitment fee is allocated among the
Portfolio and certain other funds managed by New York Life Investments based upon their respective net assets and other factors. Interest on any revolving credit loan is charged based upon the Federal Funds Rate, Daily Simple Secured Overnight Financing Rate ("SOFR") + 0.10%, or the Overnight Bank Funding Rate, whichever is higher. The Credit Agreement expires on July 23, 2024, although the Portfolio, certain other funds managed by New York Life Investments and the syndicate of banks may renew the Credit Agreement for an additional year on the same or different terms or enter into a credit agreement with a different syndicate of banks. Prior to July 25, 2023, the aggregate commitment amount and the commitment fee were the same as those under the current Credit Agreement. During the year ended December 31, 2023, there were no borrowings made or outstanding with respect to the Portfolio under the Credit Agreement.
Note 7–Interfund Lending Program
Pursuant to an exemptive order issued by the SEC, the Portfolio, along with certain other funds managed by New York Life Investments, may participate in an interfund lending program. The interfund lending program provides an alternative credit facility that permits the Portfolio and certain other funds managed by New York Life Investments to lend or borrow money for temporary purposes directly to or from one another, subject to the conditions of the exemptive order. During the year ended December 31, 2023, there were no interfund loans made or outstanding with respect to the Portfolio.
Note 8–Purchases and Sales of Securities (in 000’s)
During the year ended December 31, 2023, purchases and sales of securities, other than short-term securities, were $235,142 and $347,604, respectively.
The Portfolio may purchase securities from or sell securities to other portfolios managed by the Subadvisor. These interportfolio transactions are primarily used for cash management purposes and are made pursuant to Rule 17a-7 under the 1940 Act. During the year ended December 31, 2023, such purchases were $815.
Notes to Financial Statements (continued)
Note 9–Capital Share Transactions
Transactions in capital shares for the years ended December 31, 2023 and December 31, 2022, were as follows:
| Initial Class | Shares | Amount |
| Year ended December 31, 2023: | | |
| Shares sold | 127,521 | $ 2,517,254 |
| Shares redeemed | (5,584,865) | (119,216,813) |
| Net increase (decrease) | (5,457,344) | $(116,699,559) |
| Year ended December 31, 2022: | | |
| Shares sold | 2,942,593 | $ 91,387,732 |
| Shares issued to shareholders in reinvestment of distributions | 9,922,872 | 171,459,297 |
| Shares redeemed | (1,875,302) | (52,233,565) |
| Net increase (decrease) | 10,990,163 | $ 210,613,464 |
| |
| Service Class | Shares | Amount |
| Year ended December 31, 2023: | | |
| Shares sold | 38,294 | $ 784,067 |
| Shares redeemed | (418,809) | (8,622,248) |
| Net increase (decrease) | (380,515) | $ (7,838,181) |
| Year ended December 31, 2022: | | |
| Shares sold | 98,484 | $ 2,763,146 |
| Shares issued to shareholders in reinvestment of distributions | 731,094 | 12,259,342 |
| Shares redeemed | (222,717) | (5,932,991) |
| Net increase (decrease) | 606,861 | $ 9,089,497 |
Note 10–Other Matters
As of the date of this report, the Portfolio faces a heightened level of risk associated with current uncertainty, volatility and state of economies, financial markets, rising interest rates, and labor and health conditions around the world. Events such as war, acts of terrorism, recessions, rapid inflation, the imposition of international sanctions, earthquakes, hurricanes, epidemics and pandemics and other unforeseen natural or human disasters may have broad adverse social, political and economic effects on the global economy, which could negatively impact the value of the Portfolio's investments. Developments that disrupt global economies and financial markets may magnify factors that affect the Portfolio's performance.
Note 11–Subsequent Events
In connection with the preparation of the financial statements of the Portfolio as of and for the year ended December 31, 2023, events and transactions subsequent to December 31, 2023, through the date the financial statements were issued, have been evaluated by the Manager for possible adjustment and/or disclosure. No subsequent events requiring financial statement adjustment or disclosure have been identified.
| 22 | MainStay VP Wellington Growth Portfolio |
Report of Independent Registered Public Accounting Firm
To the Board of Trustees of MainStay VP Funds Trust and Shareholders of MainStay VP Wellington Growth Portfolio
Opinion on the Financial Statements
We have audited the accompanying statement of assets and liabilities, including the portfolio of investments, of MainStay VP Wellington Growth Portfolio (one of the portfolios constituting MainStay VP Funds Trust, referred to hereafter as the “Portfolio”) as of December 31, 2023, the related statement of operations for the year ended December 31, 2023, the statements of changes in net assets for each of the two years in the period ended December 31, 2023, including the related notes, and the financial highlights for each of the five years in the period ended December 31, 2023 (collectively referred to as the “financial statements”). In our opinion, the financial statements present fairly, in all material respects, the financial position of the Portfolio as of December 31, 2023, the results of its operations for the year then ended, the changes in its net assets for each of the two years in the period ended December 31, 2023 and the financial highlights for each of the five years in the period ended December 31, 2023 in conformity with accounting principles generally accepted in the United States of America.
Basis for Opinion
These financial statements are the responsibility of the Portfolio’s management. Our responsibility is to express an opinion on the Portfolio’s financial statements based on our audits. We are a public accounting firm registered with the Public Company Accounting Oversight Board (United States) (PCAOB) and are required to be independent with respect to the Portfolio in accordance with the U.S. federal securities laws and the applicable rules and regulations of the Securities and Exchange Commission and the PCAOB.
We conducted our audits of these financial statements in accordance with the standards of the PCAOB. Those standards require that we plan and perform the audit to obtain reasonable assurance about whether the financial statements are free of material misstatement, whether due to error or fraud.
Our audits included performing procedures to assess the risks of material misstatement of the financial statements, whether due to error or fraud, and performing procedures that respond to those risks. Such procedures included examining, on a test basis, evidence regarding the amounts and disclosures in the financial statements. Our audits also included evaluating the accounting principles used and significant estimates made by management, as well as evaluating the overall presentation of the financial statements. Our procedures included confirmation of securities owned as of December 31, 2023 by correspondence with the custodian, transfer agents and brokers; when replies were not received from brokers, we performed other auditing procedures. We believe that our audits provide a reasonable basis for our opinion.
/s/PricewaterhouseCoopers LLP
New York, New York
February 26, 2024
We have served as the auditor of one or more investment companies in the MainStay group of funds since 1984.
Board Consideration and Approval of Management Agreement and Subadvisory Agreement (Unaudited)
The continuation of the Management Agreement with respect to the MainStay VP Wellington Growth Portfolio (“Portfolio”) and New York Life Investment Management LLC (“New York Life Investments”) and the Subadvisory Agreement between New York Life Investments and Wellington Management Company LLP (“WMC”) with respect to the Portfolio (together, “Advisory Agreements”) is subject to annual review and approval by the Board of Trustees of MainStay VP Funds Trust (“Board” of the “Trust”) in accordance with Section 15 of the Investment Company Act of 1940, as amended (“1940 Act”). At its December 6–7, 2023 meeting, the Board, including the Trustees who are not an “interested person” (as such term is defined in the 1940 Act) of the Trust (“Independent Trustees”) voting separately, unanimously approved the continuation of each of the Advisory Agreements for a one-year period.
In reaching the decision to approve the continuation of each of the Advisory Agreements, the Board considered information and materials furnished by New York Life Investments and WMC in connection with an annual contract review process undertaken by the Board that took place at meetings of the Board and its Contracts Committee from September 2023 through December 2023, including information and materials furnished by New York Life Investments and WMC in response to requests prepared on behalf of the Board, and in consultation with the Independent Trustees, by independent legal counsel to the Independent Trustees, which encompassed a variety of topics, including those summarized below. Information and materials requested by and furnished to the Board for consideration in connection with the contract review process included, among other items, reports on the Portfolio and “peer funds” prepared by Institutional Shareholder Services Inc. (“ISS”), an independent third-party service provider engaged by the Board to report objectively on the Portfolio’s investment performance, management fee and total expenses. The Board also considered information on the fees charged to other investment advisory clients of New York Life Investments and/or WMC that follow investment strategies similar to those of the Portfolio, if any, and, when applicable, the rationale for differences in the Portfolio’s management and subadvisory fees and the fees charged to those other investment advisory clients. In addition, the Board considered information regarding the legal standards and fiduciary obligations applicable to its consideration of the continuation of each of the Advisory Agreements. The contract review process, including the structure and format for information and materials provided to the Board, has been developed in consultation with the Board. The Independent Trustees also met in executive sessions with their independent legal counsel and, for portions thereof, with senior management of New York Life Investments.
The Board’s deliberations with respect to the continuation of each of the Advisory Agreements reflect a year-long process, and the Board also took into account information furnished to the Board and its Committees throughout the year, as deemed relevant and appropriate by the Trustees, including, among other items, reports on investment performance of the Portfolio and investment-related matters for the Portfolio as well as presentations from New York Life Investments and, generally annually, WMC personnel. In addition, the Board took into account other information provided by New York Life Investments throughout the year,
including, among other items, periodic reports on legal and compliance matters, risk management, portfolio turnover, brokerage commissions and non-advisory services provided to the Portfolio by New York Life Investments, as deemed relevant and appropriate by the Trustees.
In addition to information provided to the Board throughout the year, the Board received information in connection with its June 2023 meeting provided specifically in response to requests prepared on behalf of the Board, and in consultation with the Independent Trustees, by independent legal counsel to the Independent Trustees regarding the Portfolio’s distribution arrangements. In addition, the Board received information regarding the Portfolio’s asset levels, share purchase and redemption activity and the payment of Rule 12b-1 and/or certain other fees by applicable share classes of the Portfolio, among other information.
In considering the continuation of each of the Advisory Agreements, the Trustees reviewed and evaluated the information and factors they believed to reasonably be necessary and appropriate in light of legal advice furnished to them by independent legal counsel to the Independent Trustees and through the exercise of their own business judgment. Although individual Trustees may have weighed certain factors or information differently and the Board did not consider any single factor or information controlling in reaching its decision, the factors that figured prominently in the Board’s consideration of the continuation of each of the Advisory Agreements are summarized in more detail below and include, among other factors: (i) the nature, extent and quality of the services provided to the Portfolio by New York Life Investments and WMC; (ii) the qualifications of the portfolio managers of the Portfolio and the historical investment performance of the Portfolio, New York Life Investments and WMC; (iii) the costs of the services provided, and profits realized, by New York Life Investments and WMC with respect to their relationships with the Portfolio; (iv) the extent to which economies of scale have been realized or may be realized if the Portfolio grows and the extent to which any economies of scale have been shared, have benefited or may benefit the Portfolio’s shareholders; and (v) the reasonableness of the Portfolio’s management and subadvisory fees and total ordinary operating expenses. Although the Board recognized that comparisons between the Portfolio’s fees and expenses and those of other funds are imprecise given different terms of agreements, variations in fund strategies and other factors, the Board considered the reasonableness of the Portfolio’s management fee and total ordinary operating expenses as compared to the peer funds identified by ISS. Throughout their considerations, the Trustees acknowledged the commitment of New York Life Investments and its affiliates to serve the MainStay Group of Funds, as well as their capacity, experience, resources, financial stability and reputations. The Trustees also acknowledged the entrepreneurial and other risks assumed by New York Life Investments in sponsoring and managing the Portfolio. With respect to the Subadvisory Agreement, the Board took into account New York Life Investments’ recommendation to approve the continuation of the Subadvisory Agreement.
The Trustees noted that, throughout the year, the Trustees are afforded an opportunity to ask questions of, and request additional information or materials from, New York Life Investments and WMC. The Board’s
| 24 | MainStay VP Wellington Growth Portfolio |
decision with respect to each of the Advisory Agreements may have also been based, in part, on the Board’s knowledge of New York Life Investments and WMC resulting from, among other things, the Board’s consideration of each of the Advisory Agreements in prior years, the advisory agreements for other funds in the MainStay Group of Funds, the Board’s review throughout the year of the performance and operations of other funds in the MainStay Group of Funds and each Trustee’s business judgment and industry experience. In addition to considering the above-referenced factors, the Board observed that in the marketplace, notably under variable life insurance policies and variable annuity contracts for which the Portfolio serves as an investment option, there are a range of investment options available to investors and that the Portfolio’s shareholders, having had the opportunity to consider other investment options, have invested in the Portfolio.
The factors that figured prominently in the Board’s decision to approve the continuation of each of the Advisory Agreements during the Board’s December 6–7, 2023 meeting are summarized in more detail below.
Nature, Extent and Quality of Services Provided by New York Life Investments and WMC
The Board examined the nature, extent and quality of the services that New York Life Investments provides to the Portfolio. The Board evaluated New York Life Investments’ experience and capabilities in serving as manager of the Portfolio and considered that the Portfolio operates in a “manager-of-managers” structure. The Board also considered New York Life Investments’ responsibilities and services provided pursuant to this structure, including overseeing the services provided by WMC, evaluating the performance of WMC, making recommendations to the Board as to whether the Subadvisory Agreement should be renewed, modified or terminated and periodically reporting to the Board regarding the results of New York Life Investments’ evaluation and monitoring functions. The Board noted that New York Life Investments manages other mutual funds, serves a variety of other investment advisory clients, including other pooled investment vehicles, and has experience overseeing mutual fund service providers, including subadvisors. The Board considered the experience of senior personnel at New York Life Investments providing management and administrative and other non-advisory services to the Portfolio. The Board observed that New York Life Investments devotes significant resources and time to providing management and administrative and other non-advisory services to the Portfolio, including New York Life Investments’ oversight and due diligence reviews of WMC and ongoing analysis of, and interactions with, WMC with respect to, among other things, the Portfolio’s investment performance and risks as well as WMC’s investment capabilities and subadvisory services with respect to the Portfolio.
The Board also considered the range of services that New York Life Investments provides to the Portfolio under the terms of the Management Agreement, including: (i) fund accounting and ongoing supervisory services provided by New York Life Investments’ Fund Administration and Accounting Group; (ii) investment supervisory and analytical services provided by New York Life Investments’ Investment Consulting Group; (iii)
compliance services provided by the Trust’s Chief Compliance Officer as well as New York Life Investments’ compliance department, including supervision and implementation of the Portfolio’s compliance program; (iv) legal services provided by New York Life Investments’ Office of the General Counsel; and (v) risk management monitoring and analysis by compliance and investment personnel. In addition, the Board considered New York Life Investments’ willingness to invest in personnel and other resources, such as cyber security, information security and business continuity planning, that may benefit the Portfolio and noted that New York Life Investments is responsible for compensating the Trust’s officers, except for a portion of the salary of the Trust’s Chief Compliance Officer. The Board recognized that New York Life Investments provides certain other non-advisory services to the Portfolio and has over time provided an increasingly broad array of non-advisory services to the MainStay Group of Funds as a result of regulatory and other developments.
The Board also examined the range, and the nature, extent and quality, of the investment advisory services that WMC provides to the Portfolio and considered the terms of each of the Advisory Agreements. The Board evaluated WMC’s experience and performance in serving as subadvisor to the Portfolio and advising other portfolios and WMC’s track record and experience in providing investment advisory services as well as the experience of investment advisory, senior management and administrative personnel at WMC. The Board considered New York Life Investments’ and WMC’s overall resources, legal and compliance environment, capabilities, reputation, financial condition and history. In addition to information provided in connection with quarterly meetings with the Trust’s Chief Compliance Officer, the Board considered information regarding the compliance policies and procedures of New York Life Investments and WMC and acknowledged their commitment to further developing and strengthening compliance programs that may relate to the Portfolio. The Board also considered WMC’s ability to recruit and retain qualified investment professionals and willingness to invest in personnel and other resources that may benefit the Portfolio. In this regard, the Board considered the qualifications and experience of the Portfolio’s portfolio managers, the number of accounts managed by the portfolio managers and the method for compensating the portfolio managers.
In addition, the Board considered information provided by New York Life Investments and WMC regarding their respective business continuity and disaster recovery plans.
Based on these considerations, among others, the Board concluded that the Portfolio would likely continue to benefit from the nature, extent and quality of these services.
Investment Performance
In evaluating the Portfolio’s investment performance, the Board considered investment performance results over various periods in light of the Portfolio’s investment objective, strategies and risks. The Board considered investment reports on, and analysis of, the Portfolio’s performance provided to the Board throughout the year. These reports include, among other items, information on the Portfolio’s gross and net
Board Consideration and Approval of Management Agreement and Subadvisory Agreement (Unaudited) (continued)
returns, the Portfolio’s investment performance compared to a relevant investment category and the Portfolio’s benchmark, the Portfolio’s risk-adjusted investment performance and the Portfolio’s investment performance as compared to peer funds, as appropriate, as well as portfolio attribution information and commentary on the effect of market conditions. The Board also considered information provided by ISS showing the investment performance of the Portfolio as compared to peer funds. In addition, the Board reviewed the methodology used by ISS to construct the group of peer funds for comparative purposes.
The Board also took into account its discussions with senior management at New York Life Investments concerning the Portfolio’s investment performance over various periods as well as discussions between representatives of WMC and the members of the Board’s Investment Committee, which generally occur on an annual basis. In considering the investment performance of the Portfolio, the Board noted that the Portfolio underperformed its peer funds for the three-, five- and ten-year periods ended July 31, 2023, and performed favorably compared to its peer funds for the one-year period ended July 31, 2023. The Board considered its discussions with representatives from New York Life Investments and WMC regarding the Portfolio’s investment performance.
Based on these considerations, among others, the Board concluded that its review of the Portfolio’s investment performance and related information supported a determination to approve the continuation of each of the Advisory Agreements.
Costs of the Services Provided, and Profits and Other Benefits Realized, by New York Life Investments and WMC
The Board considered the costs of the services provided under each of the Advisory Agreements. The Board also considered the profitability of New York Life Investments and its affiliates and WMC due to their relationships with the Portfolio as well as by New York Life Investments and its affiliates due to their relationships with the MainStay Group of Funds. With respect to the profitability of WMC’s relationship with the Portfolio, the Board considered information from New York Life Investments that WMC’s subadvisory fee reflected an arm’s-length negotiation and that this fee is paid by New York Life Investments, not the Portfolio, and the relevance of WMC’s profitability was considered by the Trustees in that context. On this basis, the Board primarily considered the costs and profitability for New York Life Investments and its affiliates with respect to the Portfolio.
In addition, the Board acknowledged the difficulty in obtaining reliable comparative data about mutual fund managers’ profitability because such information generally is not publicly available and may be impacted by numerous factors, including the structure of a fund manager’s organization, the types of funds it manages, the methodology used to allocate certain fixed costs to specific funds and the manager’s capital structure and costs of capital.
In evaluating the costs of the services provided by New York Life Investments and WMC, and profitability of New York Life Investments and its affiliates and WMC due to their relationships with the Portfolio, the
Board considered, among other factors, New York Life Investments’ and its affiliates’ and WMC’s continuing investments in, or willingness to invest in, personnel and other resources that may support and further enhance the management of the Portfolio, and that New York Life Investments is responsible for paying the subadvisory fee for the Portfolio. The Board also considered the financial resources of New York Life Investments and WMC and acknowledged that New York Life Investments and WMC must be in a position to recruit and retain experienced professional personnel and to maintain a strong financial position for New York Life Investments and WMC to continue to provide high-quality services to the Portfolio. The Board recognized that the Portfolio benefits from the allocation of certain fixed costs among the funds in the MainStay Group of Funds, among other expected benefits resulting from its relationship with New York Life Investments.
The Board considered information regarding New York Life Investments’ methodology for calculating profitability and allocating costs provided by New York Life Investments in connection with the fund profitability analysis presented to the Board. The Board concluded that New York Life Investments’ methods for allocating costs and procedures for estimating overall profitability of the relationship with the funds in the MainStay Group of Funds were reasonable. The Board recognized the difficulty in calculating and evaluating a manager’s profitability with respect to the Portfolio and considered that other profitability methodologies may also be reasonable.
The Board also considered certain fall-out benefits that may be realized by New York Life Investments and its affiliates and WMC and its affiliates due to their relationships with the Portfolio, including reputational and other indirect benefits. The Board recognized, for example, the benefits to WMC from legally permitted “soft-dollar” arrangements by which brokers provide research and other services to WMC in exchange for commissions paid by the Portfolio with respect to trades in the Portfolio’s portfolio securities. In this regard, the Board also requested and considered information from New York Life Investments concerning other material business relationships between WMC and its affiliates and New York Life Investments and its affiliates and considered the existence of a strategic partnership between New York Life Investments and WMC that relates to certain current and future products and represents a potential conflict of interest associated with New York Life Investments’ recommendation to approve the Subadvisory Agreement. In addition, the Board considered its review of the management agreement for a money market fund advised by New York Life Investments and an affiliated subadvisor that serves as an investment option for the Portfolio, including the potential rationale for and costs associated with investments in this money market fund by the Portfolio, if any, and considered information from New York Life Investments that the nature and type of specific investment advisory services provided to this money market fund are distinct from, or in addition to, the investment advisory services provided to the Portfolio. In addition, the Board considered the potential dividend received tax deduction for insurance company affiliates of New York Life Investments from the Portfolio’s securities lending activity.
| 26 | MainStay VP Wellington Growth Portfolio |
The Board noted that the Portfolio serves as an investment option primarily under variable contracts issued by affiliates of New York Life Investments that would receive fees under those contracts. The Board observed that, in addition to fees earned by New York Life Investments under the Management Agreement for managing the Portfolio, New York Life Investments’ affiliates also earn revenues from serving the Portfolio in various other capacities, including as the Portfolio’s distributor, and insurance companies affiliated with New York Life Investments would be entitled to receive fees from the Portfolio under a distribution and service plan adopted pursuant to Rule 12b-1 under the 1940 Act. The Board considered information about these other revenues and their impact on the profitability of the relationship with the Portfolio to New York Life Investments and its affiliates. The Board noted that, although it assessed the overall profitability of the relationship with the Portfolio to New York Life Investments and its affiliates as part of the contract review process, when considering the reasonableness of the fee paid to New York Life Investments under the Management Agreement, the Board considered the profitability of New York Life Investments’ relationship with the Portfolio on a pre-tax basis and without regard to distribution expenses incurred by New York Life Investments from its own resources.
After evaluating the information deemed relevant by the Trustees, the Board concluded that any profits realized by New York Life Investments and its affiliates due to their relationships with the Portfolio were not excessive, other expected benefits that may accrue to New York Life Investments and its affiliates are reasonable and other expected benefits that may accrue to WMC and its affiliates are consistent with those expected for a subadvisor to a mutual fund. With respect to WMC, the Board considered that any profits realized by WMC due to its relationship with the Portfolio are the result of arm’s-length negotiations between New York Life Investments and WMC, acknowledging that any such profits are based on the subadvisory fee paid to WMC by New York Life Investments, not the Portfolio.
Management and Subadvisory Fees and Total Ordinary Operating Expenses
The Board evaluated the reasonableness of the fee paid under each of the Advisory Agreements and the Portfolio’s total ordinary operating expenses. With respect to the management fee and subadvisory fee, the Board primarily considered the reasonableness of the management fee paid by the Portfolio to New York Life Investments because the subadvisory fee paid to WMC is paid by New York Life Investments, not the Portfolio. The Board also considered the reasonableness of the subadvisory fee paid by New York Life Investments and the amount of the management fee retained by New York Life Investments.
In assessing the reasonableness of the Portfolio’s fees and expenses, the Board primarily considered comparative data provided by ISS on the fees and expenses of similar mutual funds managed by other investment advisers. The Board reviewed the methodology used by ISS to construct the group of peer funds for comparative purposes. In addition, the Board considered information provided by New York Life Investments and WMC on fees charged to other investment advisory clients, including
institutional separate accounts and/or other funds, that follow investment strategies similar to those of the Portfolio, if any. The Board considered the contractual management fee schedule for the Portfolio as compared to those for such other investment advisory clients, taking into account the rationale for differences in fee schedules. The Board also took into account information provided by New York Life Investments about the more extensive scope of services provided to registered investment companies, such as the Portfolio, as compared with other investment advisory clients. Additionally, the Board considered the impact of contractual breakpoints and voluntary waivers on the Portfolio’s net management fee and expenses. The Board also considered that in proposing fees for the Portfolio, New York Life Investments considers the competitive marketplace for mutual funds.
Based on the factors outlined above, among other considerations, the Board concluded that the Portfolio’s management fee and total ordinary operating expenses are within a range that is competitive and support a conclusion that these fees and expenses are reasonable.
Economies of Scale
The Board considered information regarding economies of scale, including whether economies of scale may exist with respect to the Portfolio and whether the Portfolio’s management fee and expense structure permits any economies of scale to be appropriately shared with the Portfolio’s shareholders. The Board also considered a report from New York Life Investments, previously prepared at the request of the Board, that addressed economies of scale, including with respect to the mutual fund business generally, and the various ways in which the benefits of economies of scale may be shared with the funds in the MainStay Group of Funds. Although the Board recognized the difficulty of determining economies of scale with precision, the Board acknowledged that economies of scale may be shared with the Portfolio in a number of ways, including, for example, through the imposition of fee breakpoints, initially setting management fee rates at scale or making additional investments to enhance the services provided to the Portfolio. The Board reviewed information from New York Life Investments showing how the Portfolio’s management fee schedule compared to fee schedules of other funds and accounts managed by New York Life Investments. The Board also reviewed information from ISS showing how the Portfolio’s management fee schedule compared with fees paid for similar services by peer funds at varying asset levels.
Based on this information, the Board concluded that economies of scale are appropriately shared for the benefit of the Portfolio’s shareholders through the Portfolio’s management fee and expense structure and other methods to share benefits from economies of scale.
Board Consideration and Approval of Management Agreement and Subadvisory Agreement (Unaudited) (continued)
Conclusion
On the basis of the information and factors summarized above, among other information and factors deemed relevant by the Trustees, and the evaluation thereof, the Board, including the Independent Trustees voting separately, unanimously voted to approve the continuation of each of the Advisory Agreements.
| 28 | MainStay VP Wellington Growth Portfolio |
Proxy Voting Policies and Procedures and Proxy Voting Record
The Portfolio is required to file with the SEC its proxy voting record for the 12-month period ending June 30 on Form N-PX. A description of the policies and procedures that are used to vote proxies relating to portfolio securities of the Portfolio is available free of charge upon request by calling 800-598-2019 or visiting the SEC's website at www.sec.gov. The most recent Form N-PX or proxy voting record is available free of charge upon request by calling 800-598-2019; visiting https://www.newyorklifeinvestments.com/investment-products/vp; or visiting the SEC’s website at www.sec.gov.
Shareholder Reports and Quarterly Portfolio Disclosure
The Portfolio is required to file its complete schedule of portfolio holdings with the SEC 60 days after its first and third fiscal quarter on Form N-PORT. The Portfolio's holdings report is available free of charge upon request by calling 800-598-2019 or by visiting the SEC’s website at www.sec.gov.
Board of Trustees and Officers (Unaudited)
The Trustees and officers of the Portfolio are listed below. The Board oversees the MainStay Group of Funds (which consists of MainStay Funds and MainStay Funds Trust), MainStay VP Funds Trust, MainStay MacKay DefinedTerm Municipal Opportunities Fund, MainStay CBRE Global Infrastructure Megatrends Term Fund, the Manager and the Subadvisors, and elects the officers of the Portfolios who are responsible for the day-to-day operations of the Portfolio. Information pertaining to the Trustees and officers is set forth below. Each Trustee serves until his or her successor is elected and qualified or until his or her resignation,
death or removal. Under the Board’s retirement policy, unless an exception is made, a Trustee must tender his or her resignation by the end of the calendar year during which he or she reaches the age of 75. Officers are elected annually by the Board. The business address of each Trustee and officer listed below is 51 Madison Avenue, New York, New York 10010. A majority of the Trustees are not “interested persons” (as defined by the 1940 Act and rules adopted by the SEC thereunder) of the Portfolio (“Independent Trustees”).
| | Name and
Year of Birth | Term of Office,
Position(s) Held and
Length of Service | Principal Occupation(s)
During Past Five Years | Number of
Portfolios in
Fund Complex
Overseen by
Trustee | Other Directorships
Held by Trustee |
| | | | | | |
| | Naïm Abou-Jaoudé*
1966 | MainStay VP Funds Trust: Trustee since 2023 | Chief Executive Officer of New York Life Investment Management LLC (since 2023). Chief Executive Officer of Candriam (an affiliate of New York Life Investment Management LLC) (2007 to 2023). | 81 | MainStay Funds: Trustee since 2023 (11 Funds)
MainStay Funds Trust: Trustee since 2023 (37 Funds);
MainStay MacKay DefinedTerm Municipal Opportunities Fund: Trustee since 2023;
MainStay CBRE Global Infrastructure Megatrends Term Fund: Trustee since 2023; and
New York Life Investment Management International (Chair) since 2015 |
| * | This Trustee is considered to be an “interested person” of the MainStay Group of Funds, MainStay VP Funds Trust, MainStay CBRE Global Infrastructure Megatrends Term Fund and MainStay MacKay DefinedTerm Municipal Opportunities Fund, within the meaning of the 1940 Act because of his affiliation with New York Life Investment Management LLC and Candriam, as described in detail above in the column entitled “Principal Occupation(s) During Past Five Years.” |
| | |
| 30 | MainStay VP Wellington Growth Portfolio |
| | Name and
Year of Birth | Term of Office,
Position(s) Held and
Length of Service | Principal Occupation(s)
During Past Five Years | Number of
Portfolios in
Fund Complex
Overseen by
Trustee | Other Directorships
Held by Trustee |
| | | | | | |
| | David H. Chow
1957 | MainStay VP Funds Trust: Trustee since January 2016, Advisory Board Member (June 2015 to December 2015) | Founder and CEO, DanCourt Management, LLC since 1999 | 81 | MainStay Funds: Trustee since January 2016, Advisory Board Member (June 2015 to December 2015) (11 Funds);
MainStay Funds Trust: Trustee since January 2016, Advisory Board Member (June 2015 to December 2015) (37 Funds);
MainStay MacKay DefinedTerm Municipal Opportunities Fund: Trustee since January 2016, Advisory Board Member (June 2015 to December 2015);
MainStay CBRE Global Infrastructure Megatrends Term Fund: Trustee since 2021;
VanEck Vectors Group of Exchange-Traded Funds: Trustee since 2006 and Independent Chairman of the Board of Trustees from 2008 to 2022 (57 portfolios); and
Berea College of Kentucky: Trustee since 2009, Chair of the Investment Committee since 2018 |
| | Karen Hammond
1956 | MainStay VP Funds Trust: Trustee since December 2021, Advisory Board Member (June 2021 to December 2021)
| Retired, Managing Director, Devonshire Investors (2007 to 2013); Senior Vice President, Fidelity Management & Research Co. (2005 to 2007); Senior Vice President and Corporate Treasurer, FMR Corp. (2003 to 2005); Chief Operating Officer, Fidelity Investments Japan (2001 to 2003) | 81 | MainStay Funds: Trustee since December 2021, Advisory Board Member (June 2021 to December 2021) (11 Funds);
MainStay Funds Trust: Trustee since December 2021, Advisory Board Member (June 2021 to December 2021) (37 Funds);
MainStay MacKay DefinedTerm Municipal Opportunities Fund: Trustee since December 2021, Advisory Board Member (June 2021 to December 2021);
MainStay CBRE Global Infrastructure Megatrends Term Fund: Trustee since December 2021, Advisory Board Member (June 2021 to December 2021);
Two Harbors Investment Corp.: Director since 2018;
Rhode Island State Investment Commission: Member since 2017; and
Blue Cross Blue Shield of Rhode Island: Director since 2019 |
| | Susan B. Kerley
1951 | MainStay VP Funds Trust: Chair since 2017 and Trustee since 2007** | President, Strategic Management Advisors LLC since 1990 | 81 | MainStay Funds: Chair since January 2017 and Trustee since 2007 (11 Funds); MainStay Funds Trust: Chair since January 2017 and Trustee since 1990 (37 Funds)***;
MainStay MacKay DefinedTerm Municipal Opportunities Fund: Chair since January 2017 and Trustee since 2011;
MainStay CBRE Global Infrastructure Megatrends Term Fund: Trustee since June 2021; and
Legg Mason Partners Funds: Trustee since 1991 (45 portfolios) |
Board of Trustees and Officers (Unaudited) (continued)
| | Name and
Year of Birth | Term of Office,
Position(s) Held and
Length of Service | Principal Occupation(s)
During Past Five Years | Number of
Portfolios in
Fund Complex
Overseen by
Trustee | Other Directorships
Held by Trustee |
| | | | | | |
| | Alan R. Latshaw
1951 | MainStay VP Funds Trust: Trustee since 2007** | Retired; Partner, Ernst & Young LLP (2002 to 2003); Partner, Arthur Andersen LLP (1989 to 2002); Consultant to the MainStay Funds Audit and Compliance Committee (2004 to 2006) | 81 | MainStay Funds: Trustee since 2006 (11 Funds);
MainStay Funds Trust: Trustee since 2007 (37 Funds)***;
MainStay MacKay DefinedTerm Municipal Opportunities Fund: Trustee since 2011; and
MainStay CBRE Global Infrastructure Megatrends Term Fund: Trustee since June 2021 |
| | Jacques P. Perold
1958 | MainStay VP Funds Trust: Trustee since January 2016, Advisory Board Member (June 2015 to December 2015) | Founder and Chief Executive Officer, CapShift Advisors LLC (since 2018); President, Fidelity Management & Research Company (2009 to 2014); President and Chief Investment Officer, Geode Capital Management, LLC (2001 to 2009) | 81 | MainStay Funds: Trustee since January 2016, Advisory Board Member (June 2015 to December 2015) (11 Funds);
MainStay Funds Trust: Trustee since January 2016, Advisory Board Member (June 2015 to December 2015) (37 Funds);
MainStay MacKay DefinedTerm Municipal Opportunities Fund: Trustee since January 2016, Advisory Board Member (June 2015 to December 2015);
MainStay CBRE Global Infrastructure Megatrends Term Fund: Trustee since June 2021;
Allstate Corporation: Director since 2015;
Partners in Health: Trustee since 2019; and
MSCI Inc.: Director since 2017 |
| | Richard S. Trutanic
1952 | MainStay VP Funds Trust: Trustee since 2007** | Chairman and Chief Executive Officer, Somerset & Company (financial advisory firm) since 2004; Managing Director, The Carlyle Group (private investment firm) (2002 to 2004); Senior Managing Director, Partner and Board Member, Groupe Arnault S.A. (private investment firm) (1999 to 2002) | 81 | MainStay Funds: Trustee since 1994 (11 Funds);
MainStay Funds Trust: Trustee since 2007 (37 Funds)***;
MainStay MacKay DefinedTerm Municipal Opportunities Fund: Trustee since 2011; and
MainStay CBRE Global Infrastructure Megatrends Term Fund: Trustee since June 2021 |
| ** | Includes prior service as a Director of MainStay VP Series Fund, Inc., the predecessor to MainStay VP Funds Trust. |
| *** | Includes prior service as a Director/Trustee of certain predecessor entities to MainStay Funds Trust. |
| 32 | MainStay VP Wellington Growth Portfolio |
| | Name and
Year of Birth | Position(s) Held and
Length of Service | Principal Occupation(s)
During Past Five Years | |
| | | | | |
| | Kirk C. Lehneis
1974 | President, MainStay VP Funds Trust (since 2017) | Chief Operating Officer and Senior Managing Director (since 2016), New York Life Investment Management LLC and New York Life Investment Management Holdings LLC; Member of the Board of Managers (since 2017) and Senior Managing Director (since 2018), NYLIFE Distributors LLC; Chairman of the Board and Senior Managing Director, NYLIM Service Company LLC (since 2017); Trustee, President and Principal Executive Officer of IndexIQ Trust, IndexIQ ETF Trust and IndexIQ Active ETF Trust (since 2018); President, MainStay CBRE Global Infrastructure Megatrends Term Fund (since 2021), MainStay MacKay DefinedTerm Municipal Opportunities Fund, MainStay Funds and MainStay Funds Trust (since 2017); Senior Managing Director, Global Product Development (from 2015 to 2016); Managing Director, Product Development (from 2010 to 2015), New York Life Investment Management LLC | |
| | Jack R. Benintende
1964 | Treasurer and Principal Financial and Accounting Officer, MainStay VP Funds Trust (since 2007)** | Managing Director, New York Life Investment Management LLC (since 2007); Treasurer and Principal Financial and Accounting Officer, MainStay CBRE Global Infrastructure Megatrends Term Fund (since 2021), MainStay MacKay DefinedTerm Municipal Opportunities Fund (since 2011), MainStay Funds Trust (since 2009) and MainStay Funds (since 2007); and Assistant Treasurer, New York Life Investment Management Holdings LLC (2008 to 2012) | |
| | J. Kevin Gao
1967 | Secretary and Chief Legal Officer, MainStay VP Funds Trust (since 2010)** | Managing Director and Associate General Counsel, New York Life Investment Management LLC (since 2010); Secretary and Chief Legal Officer, MainStay CBRE Global Infrastructure Megatrends Term Fund (since 2021), MainStay MacKay DefinedTerm Municipal Opportunities Fund (since 2011), MainStay Funds and MainStay Funds Trust (since 2010) | |
| | Kevin M. Gleason
1967 | Vice President and Chief Compliance Officer, MainStay VP Funds Trust (since June 2022) | Vice President and Chief Compliance Officer, IndexIQ Trust, IndexIQ ETF Trust and IndexIQ Active ETF Trust (since June 2022); Vice President and Chief Compliance Officer, MainStay CBRE Global Infrastructure Megatrends Term Fund, MainStay MacKay DefinedTerm Municipal Opportunities Fund (since June 2022); MainStay Funds Trust and MainStay Funds (since June 2022); Senior Vice President, Voya Investment Management and Chief Compliance Officer, Voya Family of Funds (2012 to 2022) | |
| | Scott T. Harrington
1959 | Vice President— Administration, MainStay VP Funds Trust (since 2005)** | Managing Director, New York Life Investment Management LLC (including predecessor advisory organizations) (since 2000); Member of the Board of Directors, New York Life Trust Company (since 2009); Vice President—Administration, MainStay CBRE Global Infrastructure Megatrends Term Fund (since 2021), MainStay MacKay DefinedTerm Municipal Opportunities Fund (since 2011), MainStay Funds Trust and MainStay Funds (since 2009) | |
| * | The officers listed above are considered to be “interested persons” of the MainStay Group of Funds, MainStay VP Funds Trust, MainStay CBRE Global Infrastructure Megatrends Term Fund and MainStay MacKay DefinedTerm Municipal Opportunities Fund within the meaning of the 1940 Act because of their affiliation with the MainStay Group of Funds, New York Life Insurance Company and/or its affiliates, including New York Life Investment Management LLC, New York Life Insurance Company, NYLIM Service Company LLC, NYLIFE Securities LLC and/or NYLIFE Distributors LLC, as described in detail in the column captioned “Principal Occupation(s) During Past Five Years.” Officers are elected annually by the Board. |
| ** | Includes prior service as an Officer of MainStay VP Series Fund, Inc., the predecessor to MainStay VP Funds Trust. |
Officers of the Trust (Who are not Trustees)*
This page intentionally left blank
MainStay VP Portfolios
MainStay VP offers a wide range of Portfolios. The full array of MainStay VP offerings is listed here, with information about the manager, subadvisors, legal counsel, and independent registered public accounting firm.
Equity
MainStay VP American Century Sustainable Equity Portfolio
MainStay VP Candriam Emerging Markets Equity Portfolio
MainStay VP Epoch U.S. Equity Yield Portfolio
MainStay VP Fidelity Institutional AM® Utilities Portfolio†
MainStay VP Natural Resources Portfolio
MainStay VP PineStone International Equity Portfolio1
MainStay VP S&P 500 Index Portfolio
MainStay VP Small Cap Growth Portfolio
MainStay VP Wellington Growth Portfolio
MainStay VP Wellington Mid Cap Portfolio
MainStay VP Wellington Small Cap Portfolio
MainStay VP Wellington U.S. Equity Portfolio
MainStay VP Winslow Large Cap Growth Portfolio
Mixed Asset
MainStay VP Balanced Portfolio
MainStay VP Income Builder Portfolio
MainStay VP Janus Henderson Balanced Portfolio
MainStay VP MacKay Convertible Portfolio
Income
MainStay VP Bond Portfolio
MainStay VP Floating Rate Portfolio
MainStay VP Indexed Bond Portfolio
MainStay VP MacKay Government Portfolio2
MainStay VP MacKay High Yield Corporate Bond Portfolio
MainStay VP MacKay Strategic Bond Portfolio
MainStay VP PIMCO Real Return Portfolio
Money Market
MainStay VP U.S. Government Money Market Portfolio
Alternative
MainStay VP CBRE Global Infrastructure Portfolio
MainStay VP IQ Hedge Multi-Strategy Portfolio
Asset Allocation
MainStay VP Conservative Allocation Portfolio
MainStay VP Equity Allocation Portfolio
MainStay VP Growth Allocation Portfolio
MainStay VP Moderate Allocation Portfolio
Manager
New York Life Investment Management LLC
New York, New York
Subadvisors
American Century Investment Management, Inc.
Kansas City, Missouri
Brown Advisory LLC
Baltimore, Maryland
Candriam*
Strassen, Luxembourg
CBRE Investment Management Listed Real Assets LLC
Radnor, Pennsylvania
Epoch Investment Partners, Inc.
New York, New York
FIAM LLC
Smithfield, Rhode Island
IndexIQ Advisors LLC*
New York, New York
Janus Henderson Investors US LLC
Denver, Colorado
MacKay Shields LLC*
New York, New York
Newton Investment Management North America, LLC
Boston, Massachusetts
NYL Investors LLC*
New York, New York
Pacific Investment Management Company LLC
Newport Beach, California
PineStone Asset Management Inc.
Montreal, Québec
Segall Bryant & Hamill, LLC
Chicago, Illinois
Wellington Management Company LLP
Boston, Massachusetts
Winslow Capital Management, LLC
Minneapolis, Minnesota
Legal Counsel
Dechert LLP
Washington, District of Columbia
Independent Registered Public Accounting Firm
KPMG LLP
Philadelphia, Pennsylvania
Distributor
NYLIFE Distributors LLC*
Jersey City, New Jersey
Custodian
JPMorgan Chase Bank, N.A.
New York, New York
Some Portfolios may not be available in all products.
† Fidelity Institutional AM is a registered trade mark of FMR LLC. Used with permission.
* An affiliate of New York Life Investment Management LLC.
| 1. | Prior to August 28, 2023, the Portfolio's name was MainStay VP MacKay International Equity Portfolio. |
| 2. | Effective on or about May 1, 2024, the MainStay VP MacKay Government Portfolio will be renamed the MainStay VP U.S. Infrastructure Bond Portfolio. |
Not part of the Annual Report
2023 Annual Report
This report is for the general information of New York Life Variable Annuities and NYLIAC Variable Universal Life Insurance Products policyowners. It must be preceded or accompanied by the appropriate product(s) and funds prospectuses if it is given to anyone who is not an owner of a New York Life variable annuity policy or a NYLIAC Variable Universal Life Insurance Product. This report does not offer for sale or solicit orders to purchase securities.
The performance data quoted in this report represents past performance. Past performance is no guarantee of future results. Due to market volatility and other factors, current performance may be lower or higher than the figures shown. The most recent month-end performance summary for your variable annuity or variable life policy is available by calling 800-598-2019 and is updated periodically on newyorklife.com.
The New York Life Variable Annuities and NYLIAC Variable Universal Life Insurance Products are issued by New York Life Insurance and Annuity Corporation (a Delaware Corporation) and distributed by NYLIFE Distributors LLC (Member FINRA/SIPC).
New York Life Insurance Company
New York Life Insurance and Annuity
Corporation (NYLIAC) (A Delaware Corporation)
51 Madison Avenue, Room 551
New York, NY 10010
newyorklife.com
newyorklifeinvestments.com
NYLIFE Distributors LLC, 30 Hudson Street, Jersey City, NJ 07302
New York Life Investment Management LLC is the investment manager to the MainStay VP Funds Trust
©2024 by NYLIFE Distributors LLC. All rights reserved.
You may obtain copies of the Prospectus and the Statement of Additional Information free of charge, upon request, by calling toll-free 800-598-2019 or writing to New York Life Insurance and Annuity Corporation, 51 Madison Avenue, New York, NY 10010.
| Not FDIC Insured | No Bank Guarantee | May Lose Value |
(NYLIAC) NI513
MainStay VP Epoch U.S. Equity Yield Portfolio
Message from the President and Annual Report
December 31, 2023
Special Notice:
Beginning in July 2024, new regulations issued by the Securities and Exchange Commission (SEC) will take effect requiring open-end mutual fund companies and ETFs to (1) overhaul the content of their shareholder reports and (2) mail paper copies of the new tailored shareholder reports to shareholders who have not opted to receive these documents electronically.
If you have not yet elected to receive your shareholder reports electronically, please contact your financial intermediary or visit our website.
| Not FDIC/NCUA Insured | Not a Deposit | May Lose Value | No Bank Guarantee | Not Insured by Any Government Agency |
This page intentionally left blank
Message from the President
Against a backdrop of easing inflationary pressures and continued economic growth, stocks and bonds generally gained ground during the 12-month period ended December 31, 2023, despite high levels of volatility and sharp disparities between the performance of the different market sectors.
Although the war in Ukraine, the outbreak of hostilities in the Middle East and several other notable events affected financial assets, inflation, interest rate, and economic growth trends stood at the forefront of market developments during most of the period. As the reporting period began, high levels of inflation already showed signs of easing in the face of aggressive rate hikes by U.S. Federal Reserve (the “Fed”). From a peak of 9.1% in June 2022, the annualized U.S. inflation rate dropped to 6.4% in January, and 3.4% in December 2023. At the same time, the Fed increased the benchmark federal funds rate from 4.25%–4.50% at the beginning of reporting period, to 5.25%–5.50% as of the end of 2023. Despite the increasing cost of capital and tighter lending environment that resulted from rising rates, economic growth remained surprisingly robust, bolstered by high levels of consumer spending, low levels of unemployment and better-than-expected corporate earnings. With the pace of rate increases slowing from the prior year, investors began hoping for an early shift to a looser monetary policy, with stock prices and bond yields reacting as economic data and statements from the Fed either reinforced or undercut those hopes. Following months of hawkish rhetoric, the Fed finally reversed its stance in December 2023, signaling a positive economic outlook with little chance of a recession and a likelihood of rate cuts in 2024.
The S&P 500® Index, a widely regarded benchmark of U.S. market performance, produced strong gains during the reporting period-– recovering all its losses from 2022 and approached new record territory. A preponderance of the Index’s gains were generated by a relatively small number of mega-cap stocks in the information technology, communication services and consumer discretionary sectors that stood to benefit from rapid developments in generative artificial intelligence (“AI”). Value-oriented, interest-rate sensitive and small-capitalization
shares lagged by significant margins, although market strength widened during the closing weeks of the reporting period. Most overseas equity markets trailed the U.S. market, as developed international economies experienced relatively low growth rates, and weak economic conditions in China undermined emerging markets.
Bonds produced generally positive returns, bolstered by attractive and relatively stable yields. The yield on the 10-year Treasury note hit a high of just under 5% in mid-October 2023, ranging between approximately 3.5% and 4.8% for most of the reporting period. The yield curve remained inverted throughout the year, with the 2-year Treasury yield modestly above the 10-year yield. Corporate bond prices trended moderately higher, generally outperforming government securities. After years of low yields and tight credit spreads, the corporate sector benefited from more attractive valuations and income opportunities. Among corporates, markets generally rewarded longer duration and lower credit quality, although an uptick in default rates posed added risks for high-yield corporate bonds. International bond markets produced mixed returns, with emerging-markets issues advancing over their developed-markets counterparts.
The market volatility of recent years reminds us of the constant need for experienced and steadfast portfolio management in the face of uncertainty. New York Life Investments remains dedicated to providing you, as a valued MainStay VP investor, with the guidance, resources and investment solutions you need to pursue your financial goals.
Thank you for trusting us to help meet your investment needs.
Sincerely,
Kirk C. Lehneis
President
The opinions expressed are as of the date of this report and are subject to change. There is no guarantee that any forecast made will come to pass. This material does not constitute investment advice and is not intended as an endorsement of any specific investment. Past performance is no guarantee of future results.
Not part of the Annual Report
Investors should refer to the Portfolio’s Summary Prospectus and/or Prospectus and consider the Portfolio’s investment objectives, strategies, risks, charges and expenses carefully before investing. The Summary Prospectus and/or Prospectus contain this and other information about the Portfolio. You may obtain copies of the Portfolio’s Summary Prospectus, Prospectus and Statement of Additional Information, which includes information about the MainStay VP Funds Trust's Trustees, free of charge, upon request, by calling toll-free 800-598-2019, by writing to New York Life Insurance and Annuity Corporation, 51 Madison Avenue, Room 251, New York, New York 10010 or by sending an email to MainStayShareholdersServices@nylim.com. These documents are also available at newyorklifeinvestments.com/investment-products/vp. Please read the Portfolio's Summary Prospectus and/or Prospectus carefully before investing. MainStay VP Funds Trust portfolios are separate account options which are purchased through a variable insurance or variable annuity contract.
Investment and Performance Comparison (Unaudited)
Performance data quoted represents past performance. Past performance is no guarantee of future results. Because of market volatility and other factors, current performance may be lower or higher than the figures shown. Investment return and principal value will fluctuate, and as a result, when shares are redeemed, they may be worth more or less than their original cost. The performance table and graph do not reflect any deduction of sales charges, mortality and expense charges, contract charges or administrative charges. Please refer to the Performance Summary appropriate for your policy. For performance information current to the most recent month-end, please call 800-598-2019 or visit www.newyorklife.com.
Performance figures may reflect certain fee waivers and/or expense limitations, without which total returns may have been different. For information on current fee waivers and/or expense limitations (if any), please refer to the Notes to Financial Statements.
| Average Annual Total Returns for the Year-Ended December 31, 2023 |
| Class | Inception
Date1 | One
Year | Five
Years | Ten
Years | Gross
Expense
Ratio2 |
| Initial Class Shares | 5/1/1998 | 8.69% | 10.10% | 7.17% | 0.71% |
| Service Class Shares | 6/5/2003 | 8.42 | 9.82 | 6.91 | 0.96 |
| 1. | Effective January 9, 2017, the Portfolio replaced its subadvisor and modified its principal investment strategy as of March 13, 2017. The past performance in the graph and table prior to those dates reflects the Portfolio’s prior subadvisor and principal investment strategies. |
| 2. | The gross expense ratios presented reflect the Portfolio’s “Total Annual Portfolio Operating Expenses” from the most recent Prospectus and may differ from other expense ratios disclosed in this report. |
| Benchmark Performance* | One
Year | Five
Years | Ten
Years |
| Russell 1000® Value Index1 | 11.46% | 10.91% | 8.40% |
| U.S. Equity Yield Composite Index2 | 7.18 | 8.88 | 8.92 |
| Morningstar Large Value Category Average3 | 11.63 | 11.37 | 8.39 |
| * | Returns for indices reflect no deductions for fees, expenses or taxes, except for foreign withholding taxes where applicable. Results assume reinvestment of all dividends and capital gains. An investment cannot be made directly in an index. |
| 1. | The Portfolio has selected the Russell 1000® Value Index as its primary benchmark. The Russell 1000® Value Index measures the performance of the large-cap value segment of the U.S. equity universe. It includes those Russell 1000® Index companies with lower price-to-book ratios and lower expected growth values. |
| 2. | The Portfolio has selected the U.S. Equity Yield Composite Index as its secondary benchmark. The U.S. Equity Yield Composite Index consists of the MSCI USA High Dividend Yield Index and the MSCI USA Minimum Volatility (USD) Index weighted at 60% and 40%, respectively. The MSCI USA High Dividend Yield Index is based on the MSCI USA Index and includes large and mid-cap stocks. The MSCI USA High Dividend Yield Index is designed to reflect the performance of equities in the MSCI USA Index (excluding real estate investment trusts) with higher dividend income and quality characteristics than average dividend yields that are both sustainable and persistent. The MSCI USA Minimum Volatility (USD) Index aims to reflect the performance characteristics of a minimum variance strategy applied to the large- and mid-cap U.S. equity universe. The MSCI USA Minimum Volatility (USD) Index is calculated by optimizing the MSCI USA Index in U.S. dollars for the lowest absolute risk (within a given set of constraints). |
| 3. | The Morningstar Large Value Category Average is representative of funds that invest primarily in big U.S. companies that are less expensive or growing more slowly than other large-cap stocks. Results are based on average total returns of similar funds with all dividends and capital gain distributions reinvested. |
Cost in Dollars of a $1,000 Investment in MainStay VP Epoch U.S. Equity Yield Portfolio (Unaudited)
The example below is intended to describe the fees and expenses borne by shareholders during the six-month period from July 1, 2023 to December 31, 2023, and the impact of those costs on your investment.
Example
As a shareholder of the Portfolio you incur two types of costs: (1) transaction costs, including exchange fees and sales charges (loads) on purchases (as applicable), and (2) ongoing costs, including management fees, distribution and/or service (12b-1) fees and other Portfolio expenses (as applicable). This example is intended to help you understand your ongoing costs (in dollars) of investing in the Portfolio and to compare these costs with the ongoing costs of investing in other mutual funds. The example is based on an investment of $1,000 made at the beginning of the six-month period and held for the entire period from July 1, 2023 to December 31, 2023. Shares are only sold in connection with variable life and annuity contracts and the example does not reflect any contract level or transactional fees or expenses. If these costs had been included, your costs would have been higher.
This example illustrates your Portfolio’s ongoing costs in two ways:
Actual Expenses
The second and third data columns in the table below provide information about actual account values and actual expenses. You may use the information in these columns, together with the amount you invested, to estimate the expenses that you paid during the six months ended
December 31, 2023. Simply divide your account value by $1,000 (for example, an $8,600 account value divided by $1,000 = 8.6), then multiply the result by the number under the heading entitled “Expenses Paid During Period” to estimate the expenses you paid on your account during this period.
Hypothetical Example for Comparison Purposes
The fourth and fifth data columns in the table below provide information about hypothetical account values and hypothetical expenses based on the Portfolio’s actual expense ratio and an assumed rate of return of 5% per year before expenses, which is not the Portfolio’s actual return. The hypothetical account values and expenses may not be used to estimate the actual ending account balances or expenses you paid for the six-month period shown. You may use this information to compare the ongoing costs of investing in the Portfolio with the ongoing costs of investing in other mutual funds. To do so, compare this 5% hypothetical example with the 5% hypothetical examples that appear in the shareholder reports of the other mutual funds.
Please note that the expenses shown in the table are meant to highlight your ongoing costs only and do not reflect any transactional costs, such as exchange fees or sales charges (loads). Therefore, the fourth and fifth data columns of the table are useful in comparing ongoing costs only and will not help you determine the relative total costs of owning different funds. In addition, if these transactional costs were included, your costs would have been higher.
| Share Class | Beginning
Account
Value
7/1/23 | Ending Account
Value (Based
on Actual
Returns and
Expenses)
12/31/23 | Expenses
Paid
During
Period1 | Ending Account
Value (Based
on Hypothetical
5% Annualized
Return and
Actual Expenses)
12/31/23 | Expenses
Paid
During
Period1 | Net Expense
Ratio
During
Period2 |
| Initial Class Shares | $1,000.00 | $1,062.10 | $3.53 | $1,021.78 | $3.47 | 0.68% |
| Service Class Shares | $1,000.00 | $1,060.70 | $4.83 | $1,020.52 | $4.74 | 0.93% |
| 1. | Expenses are equal to the Portfolio’s annualized expense ratio of each class multiplied by the average account value over the period, divided by 365 and multiplied by 184 (to reflect the six-month period). The table above represents the actual expenses incurred during the six-month period. In addition to the fees and expenses which the Portfolio bears directly, it also indirectly bears a pro rata share of the fees and expenses of the underlying funds in which it invests. Such indirect expenses are not included in the above-reported expense figures. |
| 2. | Expenses are equal to the Portfolio's annualized expense ratio to reflect the six-month period. |
| 6 | MainStay VP Epoch U.S. Equity Yield Portfolio |
Industry Composition as of December 31, 2023 (Unaudited)
| Banks | 9.1% |
| Pharmaceuticals | 7.1 |
| Semiconductors & Semiconductor Equipment | 6.2 |
| Oil, Gas & Consumable Fuels | 5.6 |
| Electric Utilities | 5.4 |
| Insurance | 5.0 |
| Chemicals | 4.6 |
| Electrical Equipment | 3.4 |
| Health Care Providers & Services | 3.2 |
| Technology Hardware, Storage & Peripherals | 3.1 |
| Specialized REITs | 3.0 |
| Capital Markets | 2.9 |
| Biotechnology | 2.8 |
| Aerospace & Defense | 2.8 |
| Media | 2.4 |
| Beverages | 2.4 |
| Multi–Utilities | 2.3 |
| Hotels, Restaurants & Leisure | 1.9 |
| Machinery | 1.8 |
| Diversified Telecommunication Services | 1.7 |
| Household Products | 1.7 |
| Specialty Retail | 1.6 |
| Software | 1.6% |
| Consumer Staples Distribution & Retail | 1.6 |
| Health Care Equipment & Supplies | 1.6 |
| IT Services | 1.4 |
| Communications Equipment | 1.3 |
| Tobacco | 1.2 |
| Trading Companies & Distributors | 1.2 |
| Commercial Services & Supplies | 1.2 |
| Professional Services | 1.1 |
| Industrial Conglomerates | 1.1 |
| Air Freight & Logistics | 0.8 |
| Leisure Products | 0.8 |
| Industrial REITs | 0.6 |
| Household Durables | 0.6 |
| Retail REITs | 0.6 |
| Health Care REITs | 0.6 |
| Food Products | 0.5 |
| Containers & Packaging | 0.5 |
| Short–Term Investments | 2.3 |
| Other Assets, Less Liabilities | –0.6 |
| | 100.0% |
See Portfolio of Investments beginning on page 11 for specific holdings within these categories. The Portfolio's holdings are subject to change.
Top Ten Holdings and/or Issuers Held as of December 31, 2023 (excluding short-term investments) (Unaudited)
| 1. | JPMorgan Chase & Co. |
| 2. | Broadcom, Inc. |
| 3. | Eli Lilly & Co. |
| 4. | MetLife, Inc. |
| 5. | Bank of America Corp. |
| 6. | UnitedHealth Group, Inc. |
| 7. | AbbVie, Inc. |
| 8. | Merck & Co., Inc. |
| 9. | Cummins, Inc. |
| 10. | Johnson & Johnson |
Portfolio Management Discussion and Analysis (Unaudited)
Answers to the questions reflect the views of portfolio managers Michael A. Welhoelter, CFA, William W. Priest, CFA, John M. Tobin, PhD, CFA, and Kera Van Valen, CFA, of Epoch Investment Partners, Inc. (“Epoch”), the Portfolio’s Subadvisor.
How did MainStay VP Epoch U.S. Equity Yield Portfolio perform relative to its benchmarks and peers during the 12 months ended December 31, 2023?
For the 12 months ended December 31, 2023, MainStay VP Epoch U.S. Equity Yield Portfolio returned 8.69% for Initial Class shares and 8.42% for Service Class shares. Over the same period, both share classes underperformed the 11.46% return of the Russell 1000® Value Index, which is the Portfolio’s primary benchmark, and outperformed the 7.18% return of the U.S. Equity Yield Composite Index, which is the Portfolio’s secondary benchmark. For the 12 months ended December 31, 2023, both share classes underperformed the 11.63% return of the Morningstar Large Value Category Average.1
During the reporting period, were there any market events that materially impacted the Portfolio’s performance or liquidity?
U.S. equities staged a remarkable recovery in 2023, as policy actions and a strong labor market gradually reduced the odds of a recession, ending the year with the U.S. Federal Reserve (the “Fed”) finally signaling the future pivot on interest rates that had been anticipated for the prior two years. The economic backdrop and uncertainties that had plagued the markets through a challenging 2022 remained in place at the start of the reporting period: inflation at multi-decade highs, central bankers adamantly hawkish, elevated geopolitical tensions driving a trend of deglobalizing trade and forecasts for a near-term recession almost ubiquitous. Despite these pressures, investors began 2023 optimistic that sluggish disinflation would lead to a dovish policy pivot, fueling a steep rally in January. However, swift hawkish pushback from the Fed drove markets lower in February, making it clear that equities would remain heavily influenced by long-standing uncertainties about the trajectory for inflation and interest rates.
The market’s response to the high-profile collapse of a few regional banks in March drove this point home forcefully. Markets dipped briefly on the news, but rather than sparking lasting economic fears, the episode ultimately fueled broad expectations for an early dovish pivot by the Fed. Those hopes reignited risk-on sentiment and drove markets higher. Rising broad market indices painted a misleading picture, however, as market leadership proved extraordinarily narrow. Many of the mega-cap technology titans that frequently led markets in recent years once again emerged as market darlings, with Apple, Microsoft, Alphabet, Amazon.com, NVIDIA, Meta Platforms and Tesla collectively earning the name “The Magnificent 7.” The concentrated rally was turbocharged by the fact that these stocks were central players in the mainstream arrival of generative artificial intelligence (“AI”). AI’s headlining emergence further galvanized bullish sentiment,
with market caps soaring for the Magnificent 7, and several other companies perceived as early movers in the space.
The rally powered through most of the summer, sustained by remarkably resilient consumer spending alongside a thriving economy, continued disinflation and a pause in rate hikes. However, sentiment shifted once again in August, as markets began to digest the Fed's hawkish messaging and "higher-for-longer" stance on rates. Surging bond yields accompanied declining equities through late October, before sentiment abruptly reversed again on another bout of peak-Fed and soft-landing hopes. The Fed’s revised December forecast of 75 basis points (A basis point is one one-hundredth of a percentage point.) of easing in 2024 drove the market even higher, with investors pricing in more cuts than the Fed suggested. Markets ended the year having recouped nearly all the ground lost in 2022.
What factors affected the Portfolio’s relative performance during the reporting period?
The reporting period proved challenging on a relative basis, as the market’s overall risk-on bias left dividend paying stocks out of favor, working against the Portfolio’s investment strategy. More traditionally defensive sectors also lagged from a relative standpoint, causing a meaningful detraction to return from utilities, a sector that the Portfolio tends to emphasize. While the impacts of the Magnificent 7/AI trade were more pronounced within broader market indices, they were also felt within the Russell 1000® Value Index, as recent years have seen some historically growth-oriented stocks, including Meta and Alphabet, added to Index. Both stocks do not pay dividends and so are outside of the Portfolio’s investible universe. The Portfolio participated in the market rallies and provided limited loss exposure during the reporting period’s two broad market downturns. The Portfolio also continued to find companies with strong, growing cash flows and capital allocation policies that emphasize returning excess free cash flow to shareholders. Dividend growth remained central to the investment strategy with most of the Portfolio’s holdings increasing their dividends in 2023.
Which sectors were the strongest positive contributors to the Portfolio’s relative performance, and which sectors were particularly weak?
During the reporting period, the strongest positive sector contributions to the Portfolio’s performance relative to the Russell 1000® Value Index came from information technology and health care, driven by a mix of stock selection and sector allocation. (Contributions take weightings and total returns into account.) Conversely, communication services provided the weakest contribution to the Portfolio’s relative performance, due to disappointing stock selection and underweight allocation. The
| 1. | See page 5 for more information on benchmark and peer group returns. |
| 8 | MainStay VP Epoch U.S. Equity Yield Portfolio |
financials sector was the next most significant detractor, driven by stock selection. Consumer discretionary also undermined relative returns, due to stock selection.
During the reporting period, which individual stocks made the strongest positive contributions to the Portfolio’s absolute performance and which stocks detracted the most?
The strongest positive contributions to the Portfolio’s absolute performance came from positions in semiconductor maker Broadcom, pharmaceutical developer Eli Lilly and productivity software company Microsoft.
Broadcom designs and manufactures digital and analog semiconductors focused on connectivity. It also develops and maintains software for mainframe applications. Shares outperformed based on continued support for, and backlog of, enterprise network upgrades. The stock also benefited from growing AI-related workloads and the completion of the company’s acquisition of cloud computing and virtualization company VMWare, which led Broadcom’s management to provide positive forward guidance for 2024. Broadcom returns cash to shareholders via an attractive dividend, with a target of paying out 50% of free cash flow. The balance of cash generation is used to fund debt reduction, share repurchases and/or accretive mergers and acquisitions.
Eli Lilly discovers, develops and commercializes medicines in large, growing and defensive therapeutic areas with high unmet needs. Shares trended steadily higher on enthusiasm for a new class of drugs called GLP-1s, which demonstrated high efficacy in the treatment of diabetes while contributing to significant weight loss. Recent studies also demonstrated positive cardiovascular benefits for the drugs, as well as improvement for chronic kidney disease patients. Lilly's Mounjaro experienced rapid commercial uptake in the diabetes indication after receiving FDA approval in May of 2022, and the company’s application to use the drug in the obesity indication received FDA approval in November 2023. Eli Lilly returns cash to owners through a growing dividend and regular share repurchases. The dividend is targeted to grow in line with earnings and is well covered by free cash flow.
Microsoft shares rose on the company’s strong position in generative AI. The company is at the forefront of AI adoption through its investment in, and integration of, models developed by OpenAI. Shared plans for integration, pricing and a better board structure all helped drive Microsoft’s stock price higher. Management is dedicated to shareholder returns through continued improvements to its dividend and share repurchase plans.
The most significant detractors from the Portfolio’s absolute returns included regional bank KeyCorp, pharmaceutical firm Pfizer and integrated oil & gas company Chevron.
KeyCorp maintains branches in 15 states in the Northeast, Midwest and Northwest United States. Shares declined along with those of banking industry peers when the failures of Silicon Valley Bank and Signature Bank in March 2023 caused a crisis of confidence that reverberated through the entire sector. We believe KeyCorp will continue to generate strong earnings power. However, as higher capital standards for the industry are expected to be imposed by regulators, we anticipate that KeyCorp will need to build equity by retaining a greater proportion of earnings, holding dividends flat and deferring share repurchases for several years. We exited the Portfolio’s position to reallocate funds toward other companies in the sector that offer stronger potential for capital returns over the medium term.
Pfizer develops and markets drugs and vaccines in several therapeutic areas. Shares lagged in 2023, underperforming peers in the pharmaceutical industry as the company adjusted to life without the strong tailwind from its COVID-19 franchise drugs. The impact was compounded in December, when preliminary guidance for 2024 suggested COVID-19-related sales below market expectations. During the reporting period, Pfizer also reported that its entry in the GLP-1 class failed in a key clinical trial. Despite these near-term stumbles, we expect that ongoing revenues and earnings from the COVID-19 franchise will remain substantial, with other pipeline opportunities to offset the GLP-1 disappointment. Pfizer raised its dividend in December in line with other dividend increases in recent years, demonstrating management's confidence in, and commitment to, the company’s attractive and well-covered dividend policy.
Chevron explores, produces and markets crude oil and natural gas. It also owns and operates downstream assets that include refining, chemicals, lubricants & additives, and fuel retail & marketing. Shares underperformed due to weaker oil and natural gas prices, along with management’s announced plan to acquire Hess Corporation, while delaying the startup of a major oil project located in Kazakhstan. Chevron's integrated business model, geographic and product diversification, strong balance sheet, and continued efforts to manage costs and improve capital efficiencies allow the company to generate sustainable cash flow through commodity price cycles, while returning cash to shareholders via an attractive and growing dividend and share buybacks using excess free cash flow.
Did the Portfolio make any significant purchases or sales during the reporting period?
The Portfolio initiated multiple positions during the reporting period, including Hewlett Packard Enterprise and Best Buy. Hewlett Packard Enterprise provides information technology solutions in the areas of compute, intelligent edge, hybrid cloud (storage), high performance compute & AI, and financial services to support enterprise-focused customers. The company attempts to drive growth by addressing expanding computing needs along
with its traditional server business. Hewlett Packard Enterprises returns cash through a combination of a growing dividend and share repurchases. Best Buy serves as a key retail partner for electronics original equipment manufacturers, providing an attractive retail environment of 1,150 stores in which to showcase and sell innovative products. Sales focus on home theater, smart home, computing, and mobile phone devices. Although Best Buy’s store base is ex-growth, management grows the company’s top line by obtaining allocations of innovative products, moving stores to better locations and increasing e-commerce revenue. In our view, the company has also proven adept at growing cash flow by holding overall costs flat while funding initiatives that are accretive to return on invested capital and reducing spending elsewhere. The company returns cash to shareholders through a growing, well-covered dividend and share buybacks.
Notable positions closed during the reporting period included Eversource Energy and T. Rowe Price Group. Regulated utility Eversource Energy provides natural gas, electricity and water services to customers in Connecticut, New Hampshire and western Massachusetts. The company faces a challenging situation with the pending sale of non-regulated offshore wind assets that have been written down a few times already and could be further impaired. Its relationship with Connecticut regulators has also deteriorated, reducing the company’s growth prospects in that state and dampening overall growth. We sold the Portfolio’s position to fund other shareholder yield opportunities. T. Rowe Price provides investment management services through an array of mutual funds, subadvisory services and separate account management for individual and institutional investors, retirement plans and financial intermediaries. The company has a transparent capital allocation policy, generates significant free cash flow, pays an attractive growing dividend and regularly repurchases shares. While we believe T. Rowe remains well-positioned to grow assets under management over the course of the capital markets cycle, we exited the Portfolio’s position to allocate funds to more attractive opportunities.
How did the Portfolio’s sector weightings change during the reporting period?
The Portfolio's most significant sector allocation changes during the reporting period included increases in information technology and real estate, and decreases in utilities and financials. The Portfolio’s sector allocations are a result of our bottom-up fundamental investment process and reflect the companies and securities that we confidently believe can collect and distribute sustainable, growing shareholder yield.
How was the Portfolio positioned at the end of the reporting period?
As of December 31, 2023, the Portfolio held its most overweight allocations relative to the Russell 1000® Value Index in the information technology and utilities sectors. The Portfolio's most underweight allocations were in the financials and energy sectors. These positions resulted from individual stock selections rather than top-down macroeconomic views.
The opinions expressed are those of the portfolio managers as of the date of this report and are subject to change. There is no guarantee that any forecasts will come to pass. This material does not constitute investment advice and is not intended as an endorsement of any specific investment.
Not all MainStay VP Portfolios and/or share classes are available under all policies.
| 10 | MainStay VP Epoch U.S. Equity Yield Portfolio |
Portfolio of Investments December 31, 2023†^
| | Shares | Value |
| Common Stocks 98.3% |
| Aerospace & Defense 2.8% |
| General Dynamics Corp. | 35,612 | $ 9,247,368 |
| Lockheed Martin Corp. | 17,741 | 8,040,931 |
| RTX Corp. | 89,967 | 7,569,823 |
| | | 24,858,122 |
| Air Freight & Logistics 0.8% |
| United Parcel Service, Inc., Class B | 48,615 | 7,643,736 |
| Banks 9.1% |
| Bank of America Corp. | 528,320 | 17,788,534 |
| Columbia Banking System, Inc. | 343,465 | 9,163,646 |
| JPMorgan Chase & Co. | 131,751 | 22,410,845 |
| PNC Financial Services Group, Inc. (The) | 45,187 | 6,997,207 |
| Regions Financial Corp. | 351,433 | 6,810,772 |
| Truist Financial Corp. | 155,154 | 5,728,286 |
| U.S. Bancorp | 297,998 | 12,897,353 |
| | | 81,796,643 |
| Beverages 2.4% |
| Coca-Cola Co. (The) | 116,021 | 6,837,118 |
| Coca-Cola Europacific Partners plc | 134,527 | 8,978,332 |
| PepsiCo, Inc. | 35,661 | 6,056,664 |
| | | 21,872,114 |
| Biotechnology 2.8% |
| AbbVie, Inc. | 112,113 | 17,374,151 |
| Amgen, Inc. | 26,689 | 7,686,966 |
| | | 25,061,117 |
| Capital Markets 2.9% |
| BlackRock, Inc. | 15,095 | 12,254,121 |
| CME Group, Inc. | 32,201 | 6,781,531 |
| Lazard Ltd., Class A | 200,012 | 6,960,417 |
| | | 25,996,069 |
| Chemicals 4.6% |
| Air Products and Chemicals, Inc. | 24,409 | 6,683,184 |
| Dow, Inc. | 132,728 | 7,278,804 |
| Linde plc | 25,402 | 10,432,855 |
| LyondellBasell Industries NV, Class A | 71,371 | 6,785,955 |
| Nutrien Ltd. (a) | 97,840 | 5,511,327 |
| PPG Industries, Inc. | 34,603 | 5,174,879 |
| | | 41,867,004 |
| Commercial Services & Supplies 1.2% |
| Republic Services, Inc. | 31,110 | 5,130,350 |
| Waste Management, Inc. | 29,905 | 5,355,986 |
| | | 10,486,336 |
| | Shares | Value |
| |
| Communications Equipment 1.3% |
| Cisco Systems, Inc. | 231,610 | $ 11,700,937 |
| Consumer Staples Distribution & Retail 1.6% |
| Walmart, Inc. | 90,537 | 14,273,158 |
| Containers & Packaging 0.5% |
| Amcor plc | 494,598 | 4,767,925 |
| Diversified Telecommunication Services 1.7% |
| AT&T, Inc. | 394,934 | 6,626,993 |
| Verizon Communications, Inc. | 235,200 | 8,867,040 |
| | | 15,494,033 |
| Electric Utilities 5.4% |
| Alliant Energy Corp. | 113,936 | 5,844,917 |
| American Electric Power Co., Inc. | 132,337 | 10,748,411 |
| Duke Energy Corp. | 52,989 | 5,142,052 |
| Entergy Corp. | 72,877 | 7,374,424 |
| Evergy, Inc. | 96,505 | 5,037,561 |
| NextEra Energy, Inc. | 152,038 | 9,234,788 |
| Pinnacle West Capital Corp. | 69,212 | 4,972,190 |
| | | 48,354,343 |
| Electrical Equipment 3.4% |
| Eaton Corp. plc | 50,650 | 12,197,533 |
| Emerson Electric Co. | 115,426 | 11,234,412 |
| Hubbell, Inc. | 23,106 | 7,600,257 |
| | | 31,032,202 |
| Food Products 0.5% |
| Mondelez International, Inc., Class A | 68,122 | 4,934,076 |
| Health Care Equipment & Supplies 1.6% |
| Medtronic plc | 172,346 | 14,197,864 |
| Health Care Providers & Services 3.2% |
| CVS Health Corp. | 145,470 | 11,486,311 |
| UnitedHealth Group, Inc. | 33,284 | 17,523,028 |
| | | 29,009,339 |
| Health Care REITs 0.6% |
| Welltower, Inc. | 56,154 | 5,063,406 |
| Hotels, Restaurants & Leisure 1.9% |
| McDonald's Corp. | 34,399 | 10,199,647 |
| Vail Resorts, Inc. | 32,685 | 6,977,267 |
| | | 17,176,914 |
The notes to the financial statements are an integral part of, and should be read in conjunction with, the financial statements.
11
Portfolio of Investments December 31, 2023†^ (continued)
| | Shares | Value |
| Common Stocks (continued) |
| Household Durables 0.6% |
| Garmin Ltd. | 42,321 | $ 5,439,941 |
| Household Products 1.7% |
| Colgate-Palmolive Co. | 72,576 | 5,785,033 |
| Procter & Gamble Co. (The) | 64,157 | 9,401,567 |
| | | 15,186,600 |
| Industrial Conglomerates 1.1% |
| Honeywell International, Inc. | 45,610 | 9,564,873 |
| Industrial REITs 0.6% |
| Prologis, Inc. | 42,989 | 5,730,434 |
| Insurance 5.0% |
| Arthur J. Gallagher & Co. | 22,250 | 5,003,580 |
| Marsh & McLennan Cos., Inc. | 47,507 | 9,001,152 |
| MetLife, Inc. | 280,501 | 18,549,531 |
| Travelers Cos., Inc. (The) | 64,937 | 12,369,849 |
| | | 44,924,112 |
| IT Services 1.4% |
| International Business Machines Corp. | 75,613 | 12,366,506 |
| Leisure Products 0.8% |
| Hasbro, Inc. | 149,459 | 7,631,377 |
| Machinery 1.8% |
| Cummins, Inc. | 68,851 | 16,494,634 |
| Media 2.4% |
| Comcast Corp., Class A | 316,057 | 13,859,100 |
| Omnicom Group, Inc. | 93,481 | 8,087,041 |
| | | 21,946,141 |
| Multi-Utilities 2.3% |
| Ameren Corp. | 58,963 | 4,265,383 |
| CMS Energy Corp. | 111,266 | 6,461,217 |
| NiSource, Inc. | 208,756 | 5,542,472 |
| WEC Energy Group, Inc. | 58,924 | 4,959,633 |
| | | 21,228,705 |
| Oil, Gas & Consumable Fuels 5.6% |
| Chevron Corp. | 102,147 | 15,236,247 |
| Enterprise Products Partners LP | 433,242 | 11,415,927 |
| MPLX LP | 263,509 | 9,676,050 |
| TotalEnergies SE, Sponsored ADR (a) | 97,229 | 6,551,290 |
| | Shares | Value |
| |
| Oil, Gas & Consumable Fuels (continued) |
| Williams Cos., Inc. (The) | 234,435 | $ 8,165,371 |
| | | 51,044,885 |
| Pharmaceuticals 7.1% |
| Bristol-Myers Squibb Co. | 95,275 | 4,888,560 |
| Eli Lilly & Co. | 33,463 | 19,506,252 |
| Johnson & Johnson | 102,958 | 16,137,637 |
| Merck & Co., Inc. | 152,233 | 16,596,442 |
| Pfizer, Inc. | 239,947 | 6,908,074 |
| | | 64,036,965 |
| Professional Services 1.1% |
| Automatic Data Processing, Inc. | 21,673 | 5,049,159 |
| Paychex, Inc. | 41,572 | 4,951,641 |
| | | 10,000,800 |
| Retail REITs 0.6% |
| Realty Income Corp. | 88,827 | 5,100,446 |
| Semiconductors & Semiconductor Equipment 6.2% |
| Analog Devices, Inc. | 72,666 | 14,428,561 |
| Broadcom, Inc. | 19,280 | 21,521,300 |
| KLA Corp. | 22,740 | 13,218,762 |
| Texas Instruments, Inc. | 38,478 | 6,558,960 |
| | | 55,727,583 |
| Software 1.6% |
| Microsoft Corp. | 38,405 | 14,441,816 |
| Specialized REITs 3.0% |
| American Tower Corp. | 27,308 | 5,895,251 |
| Iron Mountain, Inc. | 204,017 | 14,277,110 |
| VICI Properties, Inc. | 227,503 | 7,252,795 |
| | | 27,425,156 |
| Specialty Retail 1.6% |
| Best Buy Co., Inc. | 65,134 | 5,098,690 |
| Home Depot, Inc. (The) | 26,990 | 9,353,384 |
| | | 14,452,074 |
| Technology Hardware, Storage & Peripherals 3.1% |
| Apple, Inc. | 39,024 | 7,513,291 |
| Dell Technologies, Inc., Class C | 97,742 | 7,477,263 |
| Hewlett Packard Enterprise Co. | 304,023 | 5,162,310 |
| NetApp, Inc. | 90,179 | 7,950,181 |
| | | 28,103,045 |
| Tobacco 1.2% |
| Philip Morris International, Inc. | 117,722 | 11,075,286 |
The notes to the financial statements are an integral part of, and should be read in conjunction with, the financial statements.
| 12 | MainStay VP Epoch U.S. Equity Yield Portfolio |
| | Shares | | Value |
| Common Stocks (continued) |
| Trading Companies & Distributors 1.2% |
| MSC Industrial Direct Co., Inc., Class A | 107,594 | | $ 10,894,968 |
Total Common Stocks
(Cost $719,475,664) | | | 888,401,685 |
| Short-Term Investments 2.3% |
| Affiliated Investment Company 1.6% |
| MainStay U.S. Government Liquidity Fund, 5.235% (b) | 14,122,333 | | 14,122,333 |
| Unaffiliated Investment Companies 0.7% |
| Fidelity Government Portfolio, 5.356% (b)(c) | 2,000,000 | | 2,000,000 |
| Invesco Government & Agency Portfolio, 5.361% (b)(c) | 4,494,573 | | 4,494,573 |
| | | | 6,494,573 |
Total Short-Term Investments
(Cost $20,616,906) | | | 20,616,906 |
Total Investments
(Cost $740,092,570) | 100.6% | | 909,018,591 |
| Other Assets, Less Liabilities | (0.6) | | (5,156,174) |
| Net Assets | 100.0% | | $ 903,862,417 |
| † | Percentages indicated are based on Portfolio net assets. |
| ^ | Industry classifications may be different than those used for compliance monitoring purposes. |
| (a) | All or a portion of this security was held on loan. As of December 31, 2023, the aggregate market value of securities on loan was $6,346,648. The Portfolio received cash collateral with a value of $6,494,573. (See Note 2(H)) |
| (b) | Current yield as of December 31, 2023. |
| (c) | Represents a security purchased with cash collateral received for securities on loan. |
Investments in Affiliates (in 000's)
Investments in issuers considered to be affiliate(s) of the Portfolio during the year ended December 31, 2023 for purposes of Section 2(a)(3) of the Investment Company Act of 1940, as amended, were as follows:
| Affiliated Investment Companies | Value,
Beginning
of Year | Purchases
at Cost | Proceeds
from
Sales | Net
Realized
Gain/(Loss)
on Sales | Change in
Unrealized
Appreciation/
(Depreciation) | Value,
End of
Year | Dividend
Income | Other
Distributions | Shares
End of
Year |
| MainStay U.S. Government Liquidity Fund | $ 7,380 | $ 188,873 | $ (182,131) | $ — | $ — | $ 14,122 | $ 509 | $ — | 14,122 |
The notes to the financial statements are an integral part of, and should be read in conjunction with, the financial statements.
13
Portfolio of Investments December 31, 2023†^ (continued)
| Abbreviation(s): |
| ADR—American Depositary Receipt |
| REIT—Real Estate Investment Trust |
The following is a summary of the fair valuations according to the inputs used as of December 31, 2023, for valuing the Portfolio’s assets:
| Description | Quoted
Prices in
Active
Markets for
Identical
Assets
(Level 1) | | Significant
Other
Observable
Inputs
(Level 2) | | Significant
Unobservable
Inputs
(Level 3) | | Total |
| Asset Valuation Inputs | | | | | | | |
| Investments in Securities (a) | | | | | | | |
| Common Stocks | $ 888,401,685 | | $ — | | $ — | | $ 888,401,685 |
| Short-Term Investments | | | | | | | |
| Affiliated Investment Company | 14,122,333 | | — | | — | | 14,122,333 |
| Unaffiliated Investment Companies | 6,494,573 | | — | | — | | 6,494,573 |
| Total Short-Term Investments | 20,616,906 | | — | | — | | 20,616,906 |
| Total Investments in Securities | $ 909,018,591 | | $ — | | $ — | | $ 909,018,591 |
| (a) | For a complete listing of investments and their industries, see the Portfolio of Investments. |
The notes to the financial statements are an integral part of, and should be read in conjunction with, the financial statements.
| 14 | MainStay VP Epoch U.S. Equity Yield Portfolio |
Statement of Assets and Liabilities as of December 31, 2023
| Assets |
Investment in unaffiliated securities, at value
(identified cost $725,970,237) including securities on loan of $6,346,648 | $894,896,258 |
Investment in affiliated investment companies, at value
(identified cost $14,122,333) | 14,122,333 |
| Receivables: | |
| Investment securities sold | 2,301,916 |
| Dividends | 1,896,452 |
| Portfolio shares sold | 113,396 |
| Securities lending | 857 |
| Other assets | 4,902 |
| Total assets | 913,336,114 |
| Liabilities |
| Cash collateral received for securities on loan | 6,494,573 |
| Due to custodian | 12,464 |
| Payables: | |
| Investment securities purchased | 2,116,123 |
| Manager (See Note 3) | 492,644 |
| Portfolio shares redeemed | 222,765 |
| NYLIFE Distributors (See Note 3) | 81,164 |
| Professional fees | 36,510 |
| Custodian | 11,925 |
| Shareholder communication | 3,154 |
| Accrued expenses | 2,375 |
| Total liabilities | 9,473,697 |
| Net assets | $903,862,417 |
| Composition of Net Assets |
| Shares of beneficial interest outstanding (par value of $.001 per share) unlimited number of shares authorized | $ 54,932 |
| Additional paid-in-capital | 665,865,842 |
| | 665,920,774 |
| Total distributable earnings (loss) | 237,941,643 |
| Net assets | $903,862,417 |
| Initial Class | |
| Net assets applicable to outstanding shares | $516,354,329 |
| Shares of beneficial interest outstanding | 31,145,872 |
| Net asset value per share outstanding | $ 16.58 |
| Service Class | |
| Net assets applicable to outstanding shares | $387,508,088 |
| Shares of beneficial interest outstanding | 23,785,878 |
| Net asset value per share outstanding | $ 16.29 |
The notes to the financial statements are an integral part of, and should be read in conjunction with, the financial statements.
15
Statement of Operations for the year ended December 31, 2023
| Investment Income (Loss) |
| Income | |
| Dividends-unaffiliated (net of foreign tax withholding of $89,531) | $27,885,081 |
| Dividends-affiliated | 509,155 |
| Securities lending, net | 21,426 |
| Total income | 28,415,662 |
| Expenses | |
| Manager (See Note 3) | 6,272,695 |
| Distribution/Service—Service Class (See Note 3) | 970,121 |
| Professional fees | 120,350 |
| Shareholder communication | 28,333 |
| Custodian | 26,077 |
| Trustees | 23,589 |
| Miscellaneous | 29,657 |
| Total expenses before waiver/reimbursement | 7,470,822 |
| Expense waiver/reimbursement from Manager (See Note 3) | (328,000) |
| Net expenses | 7,142,822 |
| Net investment income (loss) | 21,272,840 |
| Realized and Unrealized Gain (Loss) |
| Net realized gain (loss) on: | |
| Unaffiliated investment transactions | 53,543,397 |
| Foreign currency transactions | (128) |
| Net realized gain (loss) | 53,543,269 |
| Net change in unrealized appreciation (depreciation) on unaffiliated investments | (1,650,954) |
| Net realized and unrealized gain (loss) | 51,892,315 |
| Net increase (decrease) in net assets resulting from operations | $73,165,155 |
The notes to the financial statements are an integral part of, and should be read in conjunction with, the financial statements.
| 16 | MainStay VP Epoch U.S. Equity Yield Portfolio |
Statements of Changes in Net Assets
for the years ended December 31, 2023 and December 31, 2022
| | 2023 | 2022 |
| Increase (Decrease) in Net Assets |
| Operations: | | |
| Net investment income (loss) | $ 21,272,840 | $ 20,017,367 |
| Net realized gain (loss) | 53,543,269 | 59,959,200 |
| Net change in unrealized appreciation (depreciation) | (1,650,954) | (109,365,957) |
| Net increase (decrease) in net assets resulting from operations | 73,165,155 | (29,389,390) |
| Distributions to shareholders: | | |
| Initial Class | (46,136,902) | (24,054,585) |
| Service Class | (34,391,207) | (17,626,723) |
| Total distributions to shareholders | (80,528,109) | (41,681,308) |
| Capital share transactions: | | |
| Net proceeds from sales of shares | 65,644,769 | 75,116,545 |
| Net asset value of shares issued to shareholders in reinvestment of distributions | 80,528,109 | 41,681,308 |
| Cost of shares redeemed | (184,794,294) | (198,345,383) |
| Increase (decrease) in net assets derived from capital share transactions | (38,621,416) | (81,547,530) |
| Net increase (decrease) in net assets | (45,984,370) | (152,618,228) |
| Net Assets |
| Beginning of year | 949,846,787 | 1,102,465,015 |
| End of year | $ 903,862,417 | $ 949,846,787 |
The notes to the financial statements are an integral part of, and should be read in conjunction with, the financial statements.
17
Financial Highlights selected per share data and ratios
| | Year Ended December 31, |
| Initial Class | 2023 | | 2022 | | 2021 | | 2020 | | 2019 |
| Net asset value at beginning of year | $ 16.85 | | $ 18.15 | | $ 15.13 | | $ 16.12 | | $ 14.01 |
| Net investment income (loss) (a) | 0.41 | | 0.37 | | 0.34 | | 0.35 | | 0.38 |
| Net realized and unrealized gain (loss) | 0.91 | | (0.90) | | 3.09 | | (0.41) | | 2.92 |
| Total from investment operations | 1.32 | | (0.53) | | 3.43 | | (0.06) | | 3.30 |
| Less distributions: | | | | | | | | | |
| From net investment income | (0.47) | | (0.37) | | (0.41) | | (0.41) | | (0.52) |
| From net realized gain on investments | (1.12) | | (0.40) | | — | | (0.52) | | (0.67) |
| Total distributions | (1.59) | | (0.77) | | (0.41) | | (0.93) | | (1.19) |
| Net asset value at end of year | $ 16.58 | | $ 16.85 | | $ 18.15 | | $ 15.13 | | $ 16.12 |
| Total investment return (b) | 8.69% | | (2.50)% | | 22.89% | | 0.03% | | 24.18% |
| Ratios (to average net assets)/Supplemental Data: | | | | | | | | | |
| Net investment income (loss) | 2.45% | | 2.13% | | 2.02% | | 2.47% | | 2.43% |
| Net expenses (c) | 0.68% | | 0.68% | | 0.68% | | 0.68% | | 0.68% |
| Expenses (before waiver/reimbursement) (c) | 0.72% | | 0.71% | | 0.72% | | 0.73% | | 0.72% |
| Portfolio turnover rate | 19% | | 19% | | 20% | | 26% | | 22% |
| Net assets at end of year (in 000's) | $ 516,354 | | $ 539,762 | | $ 640,585 | | $ 495,193 | | $ 591,185 |
| (a) | Per share data based on average shares outstanding during the year. |
| (b) | Total return does not reflect any deduction of sales charges, mortality and expense charges, contract charges or administrative charges. For periods of less than one year, total return is not annualized. |
| (c) | In addition to the fees and expenses which the Portfolio bears directly, it also indirectly bears a pro-rata share of the fees and expenses of the underlying funds in which it invests. Such indirect expenses are not included in the above expense ratios. |
| | Year Ended December 31, |
| Service Class | 2023 | | 2022 | | 2021 | | 2020 | | 2019 |
| Net asset value at beginning of year | $ 16.57 | | $ 17.86 | | $ 14.90 | | $ 15.89 | | $ 13.81 |
| Net investment income (loss) (a) | 0.36 | | 0.32 | | 0.29 | | 0.31 | | 0.34 |
| Net realized and unrealized gain (loss) | 0.90 | | (0.88) | | 3.05 | | (0.42) | | 2.88 |
| Total from investment operations | 1.26 | | (0.56) | | 3.34 | | (0.11) | | 3.22 |
| Less distributions: | | | | | | | | | |
| From net investment income | (0.42) | | (0.33) | | (0.38) | | (0.36) | | (0.47) |
| From net realized gain on investments | (1.12) | | (0.40) | | — | | (0.52) | | (0.67) |
| Total distributions | (1.54) | | (0.73) | | (0.38) | | (0.88) | | (1.14) |
| Net asset value at end of year | $ 16.29 | | $ 16.57 | | $ 17.86 | | $ 14.90 | | $ 15.89 |
| Total investment return (b) | 8.42% | | (2.74)% | | 22.58% | | (0.22)% | | 23.87% |
| Ratios (to average net assets)/Supplemental Data: | | | | | | | | | |
| Net investment income (loss) | 2.20% | | 1.89% | | 1.77% | | 2.21% | | 2.18% |
| Net expenses (c) | 0.93% | | 0.93% | | 0.93% | | 0.93% | | 0.93% |
| Expenses (before waiver/reimbursement) (c) | 0.97% | | 0.96% | | 0.97% | | 0.98% | | 0.97% |
| Portfolio turnover rate | 19% | | 19% | | 20% | | 26% | | 22% |
| Net assets at end of year (in 000's) | $ 387,508 | | $ 410,085 | | $ 461,880 | | $ 422,053 | | $ 460,793 |
| (a) | Per share data based on average shares outstanding during the year. |
| (b) | Total return does not reflect any deduction of sales charges, mortality and expense charges, contract charges or administrative charges. For periods of less than one year, total return is not annualized. |
| (c) | In addition to the fees and expenses which the Portfolio bears directly, it also indirectly bears a pro-rata share of the fees and expenses of the underlying funds in which it invests. Such indirect expenses are not included in the above expense ratios. |
The notes to the financial statements are an integral part of, and should be read in conjunction with, the financial statements.
| 18 | MainStay VP Epoch U.S. Equity Yield Portfolio |
Notes to Financial Statements
Note 1–Organization and Business
MainStay VP Funds Trust (the “Fund”) was organized as a Delaware statutory trust on February 1, 2011. The Fund is registered under the Investment Company Act of 1940, as amended (the “1940 Act”), as an open-end management investment company. The Fund is comprised of thirty-one separate series (collectively referred to as the “Portfolios”). These financial statements and notes relate to the MainStay VP Epoch U.S. Equity Yield Portfolio (the "Portfolio"), a "diversified” portfolio, as that term is defined in the 1940 Act, as interpreted or modified by regulatory authorities having jurisdiction, from time to time.
Shares of the Portfolio are currently offered to certain separate accounts to fund variable annuity policies and variable universal life insurance policies issued by New York Life Insurance and Annuity Corporation (“NYLIAC”), a wholly-owned subsidiary of New York Life Insurance Company (“New York Life”) and may also be offered to fund variable annuity policies and variable universal life insurance policies issued by other insurance companies. NYLIAC allocates shares of the Portfolio to, among others, certain NYLIAC separate accounts. Shares of the Portfolio are also offered to the MainStay VP Conservative Allocation Portfolio, MainStay VP Moderate Allocation Portfolio, MainStay VP Growth Allocation Portfolio and MainStay VP Equity Allocation Portfolio, which operate as “funds-of-funds," and other variable insurance funds.
The following table lists the Portfolio's share classes that have been registered and commenced operations:
| Class | Commenced Operations |
| Initial Class | May 1, 1998 |
| Service Class | June 5, 2003 |
Shares of the Portfolio are offered and are redeemed at a price equal to their respective net asset value (“NAV”) per share. No sales or redemption charge is applicable to the purchase or redemption of the Portfolio's shares. Under the terms of the Fund’s multiple class plan, adopted pursuant to Rule 18f-3 under the 1940 Act, the classes differ in that, among other things, Service Class shares of the Portfolio pay a combined distribution and service fee of 0.25% of average daily net assets attributable to Service Class shares of the Portfolio to the Distributor (as defined in Note 3(B)) pursuant to a plan adopted in accordance with Rule 12b-1 under the 1940 Act. Contract owners of variable annuity contracts purchased after June 2, 2003, are permitted to invest only in the Service Class shares.
The Portfolio's investment objective is to seek current income and capital appreciation.
Note 2–Significant Accounting Policies
The Portfolio is an investment company and accordingly follows the investment company accounting and reporting guidance of the Financial Accounting Standards Board (“FASB”) Accounting Standards Codification Topic 946 Financial Services—Investment Companies. The Portfolio prepares its financial statements in accordance with generally accepted
accounting principles (“GAAP”) in the United States of America and follows the significant accounting policies described below.
(A) Securities Valuation. Investments are usually valued as of the close of regular trading on the New York Stock Exchange (the "Exchange") (usually 4:00 p.m. Eastern time) on each day the Portfolio is open for business ("valuation date").
Pursuant to Rule 2a-5 under the 1940 Act, the Board of Trustees of the Fund (the "Board") has designated New York Life Investment Management LLC (“New York Life Investments” or the "Manager") as its Valuation Designee (the "Valuation Designee"). The Valuation Designee is responsible for performing fair valuations relating to all investments in the Portfolio’s portfolio for which market quotations are not readily available; periodically assessing and managing material valuation risks; establishing and applying fair value methodologies; testing fair valuation methodologies; evaluating and overseeing pricing services; ensuring appropriate segregation of valuation and portfolio management functions; providing quarterly, annual and prompt reporting to the Board, as appropriate; identifying potential conflicts of interest; and maintaining appropriate records. The Valuation Designee has established a valuation committee ("Valuation Committee") to assist in carrying out the Valuation Designee’s responsibilities and establish prices of securities for which market quotations are not readily available. The Portfolio's and the Valuation Designee's policies and procedures ("Valuation Procedures") govern the Valuation Designee’s selection and application of methodologies for determining and calculating the fair value of Portfolio investments. The Valuation Designee may value the Portfolio's portfolio securities for which market quotations are not readily available and other Portfolio assets utilizing inputs from pricing services and other third-party sources. The Valuation Committee meets (in person, via electronic mail or via teleconference) on an ad-hoc basis to determine fair valuations and on a quarterly basis to review fair value events with respect to certain securities for which market quotations are not readily available, including valuation risks and back-testing results, and to preview reports to the Board.
The Valuation Committee establishes prices of securities for which market quotations are not readily available based on such methodologies and measurements on a regular basis after considering information that is reasonably available and deemed relevant by the Valuation Committee. The Board shall oversee the Valuation Designee and review fair valuation materials on a prompt, quarterly and annual basis and approve proposed revisions to the Valuation Procedures.
Investments for which market quotations are not readily available are valued at fair value as determined in good faith pursuant to the Valuation Procedures. A market quotation is readily available only when that quotation is a quoted price (unadjusted) in active markets for identical investments that the Portfolio can access at the measurement date, provided that a quotation will not be readily available if it is not reliable. "Fair value" is defined as the price the Portfolio would reasonably expect to receive upon selling an asset or liability in an orderly transaction to an independent buyer in the principal or most advantageous market for the
Notes to Financial Statements (continued)
asset or liability. Fair value measurements are determined within a framework that establishes a three-tier hierarchy that maximizes the use of observable market data and minimizes the use of unobservable inputs to establish a classification of fair value measurements for disclosure purposes. "Inputs" refer broadly to the assumptions that market participants would use in pricing the asset or liability, including assumptions about risk, such as the risk inherent in a particular valuation technique used to measure fair value using a pricing model and/or the risk inherent in the inputs for the valuation technique. Inputs may be observable or unobservable. Observable inputs reflect the assumptions market participants would use in pricing the asset or liability based on market data obtained from sources independent of the Portfolio. Unobservable inputs reflect the Portfolio’s own assumptions about the assumptions market participants would use in pricing the asset or liability based on the information available. The inputs or methodology used for valuing assets or liabilities may not be an indication of the risks associated with investing in those assets or liabilities. The three-tier hierarchy of inputs is summarized below.
| • | Level 1—quoted prices (unadjusted) in active markets for an identical asset or liability |
| • | Level 2—other significant observable inputs (including quoted prices for a similar asset or liability in active markets, interest rates and yield curves, prepayment speeds, credit risk, etc.) |
| • | Level 3—significant unobservable inputs (including the Portfolio's own assumptions about the assumptions that market participants would use in measuring fair value of an asset or liability) |
The level of an asset or liability within the fair value hierarchy is based on the lowest level of an input, both individually and in the aggregate, that is significant to the fair value measurement. The aggregate value by input level of the Portfolio’s assets and liabilities as of December 31, 2023, is included at the end of the Portfolio of Investments.
The Portfolio may use third-party vendor evaluations, whose prices may be derived from one or more of the following standard inputs, among others:
| • Broker/dealer quotes | • Benchmark securities |
| • Two-sided markets | • Reference data (corporate actions or material event notices) |
| • Bids/offers | • Monthly payment information |
| • Industry and economic events | • Reported trades |
An asset or liability for which a market quotation is not readily available is valued by methods deemed reasonable in good faith by the Valuation Committee, following the Valuation Procedures to represent fair value. Under these procedures, the Valuation Designee generally uses a market-based approach which may use related or comparable assets or liabilities, recent transactions, market multiples, book values and other relevant information. The Valuation Designee may also use an income-based valuation approach in which the anticipated future cash flows of the asset or liability are discounted to calculate fair value.
Discounts may also be applied due to the nature and/or duration of any restrictions on the disposition of the asset or liability. Fair value represents a good faith approximation of the value of a security. Fair value determinations involve the consideration of a number of subjective factors, an analysis of applicable facts and circumstances and the exercise of judgment. As a result, it is possible that the fair value for a security determined in good faith in accordance with the Valuation Procedures may differ from valuations for the same security determined for other funds using their own valuation procedures. Although the Valuation Procedures are designed to value a security at the price the Portfolio may reasonably expect to receive upon the security's sale in an orderly transaction, there can be no assurance that any fair value determination thereunder would, in fact, approximate the amount that the Portfolio would actually realize upon the sale of the security or the price at which the security would trade if a reliable market price were readily available. During the year ended December 31, 2023, there were no material changes to the fair value methodologies.
Securities which may be valued in this manner include, but are not limited to: (i) a security for which trading has been halted or suspended or otherwise does not have a readily available market quotation on a given day; (ii) a debt security that has recently gone into default and for which there is not a current market quotation; (iii) a security of an issuer that has entered into a restructuring; (iv) a security that has been delisted from a national exchange; (v) a security subject to trading collars for which no or limited trading takes place; and (vi) a security whose principal market has been temporarily closed at a time when, under normal conditions, it would be open. Securities valued in this manner are generally categorized as Level 2 or 3 in the hierarchy.
Equity securities, rights and warrants, if applicable, are valued at the last quoted sales prices as of the close of regular trading on the relevant exchange on each valuation date. Securities that are not traded on the valuation date are valued at the mean of the last quoted bid and ask prices. Prices are normally taken from the principal market in which each security trades. These securities are generally categorized as Level 1 in the hierarchy.
Investments in mutual funds, including money market funds, are valued at their respective NAVs at the close of business each day on the valuation date. These securities are generally categorized as Level 1 in the hierarchy.
Temporary cash investments acquired in excess of 60 days to maturity at the time of purchase are valued using the latest bid prices or using valuations based on a matrix system (which considers such factors as security prices, yields, maturities and ratings), both as furnished by independent pricing services. Temporary cash investments that mature in 60 days or less at the time of purchase ("Short-Term Investments") are valued using the amortized cost method of valuation, unless the use of such method would be inappropriate. The amortized cost method involves valuing a security at its cost on the date of purchase and thereafter assuming a constant amortization to maturity of the difference between such cost and the value on maturity date. Amortized cost approximates
| 20 | MainStay VP Epoch U.S. Equity Yield Portfolio |
the current fair value of a security. Securities valued using the amortized cost method are not valued using quoted prices in an active market and are generally categorized as Level 2 in the hierarchy.
The information above is not intended to reflect an exhaustive list of the methodologies that may be used to value portfolio investments. The Valuation Procedures permit the use of a variety of valuation methodologies in connection with valuing portfolio investments. The methodology used for a specific type of investment may vary based on the market data available or other considerations. The methodologies summarized above may not represent the specific means by which portfolio investments are valued on any particular business day.
(B) Income Taxes. The Portfolio's policy is to comply with the requirements of the Internal Revenue Code of 1986, as amended (the “Internal Revenue Code”), applicable to regulated investment companies and to distribute all of its taxable income to the shareholders of the Portfolio within the allowable time limits.
The Manager evaluates the Portfolio’s tax positions to determine if the tax positions taken meet the minimum recognition threshold in connection with accounting for uncertainties in income tax positions taken or expected to be taken for the purposes of measuring and recognizing tax liabilities in the financial statements. Recognition of tax benefits of an uncertain tax position is permitted only to the extent the position is “more likely than not” to be sustained assuming examination by taxing authorities. The Manager analyzed the Portfolio's tax positions taken on federal, state and local income tax returns for all open tax years (for up to three tax years) and has concluded that no provisions for federal, state and local income tax are required in the Portfolio's financial statements. The Portfolio's federal, state and local income tax and federal excise tax returns for tax years for which the applicable statutes of limitations have not expired are subject to examination by the Internal Revenue Service and state and local departments of revenue.
(C) Dividends and Distributions to Shareholders. Dividends and distributions are recorded on the ex-dividend date. The Portfolio intends to declare and pay dividends from net investment income and distributions from net realized capital and currency gains, if any, at least annually. All dividends and distributions are reinvested at NAV in the same class of shares of the Portfolio. Dividends and distributions to shareholders are determined in accordance with federal income tax regulations and may differ from determinations using GAAP.
(D) Security Transactions and Investment Income. The Portfolio records security transactions on the trade date. Realized gains and losses on security transactions are determined using the identified cost method. Dividend income is recognized on the ex-dividend date, net of any foreign tax withheld at the source, and interest income is accrued as earned using the effective interest rate method. Distributions received from real estate investment trusts may be classified as dividends, capital gains and/or return of capital.
Investment income and realized and unrealized gains and losses on investments of the Portfolio are allocated pro rata to the separate classes
of shares based upon their relative net assets on the date the income is earned or realized and unrealized gains and losses are incurred.
(E) Expenses. Expenses of the Fund are allocated to the individual Portfolios in proportion to the net assets of the respective Portfolios when the expenses are incurred, except where direct allocations of expenses can be made. Expenses (other than fees incurred under the distribution and service plans, further discussed in Note 3(B), which are charged directly to the Service Class shares) are allocated to separate classes of shares pro rata based upon their relative net assets on the date the expenses are incurred. The expenses borne by the Portfolio, including those of related parties to the Portfolio, are shown in the Statement of Operations.
Additionally, the Portfolio may invest in mutual funds, which are subject to management fees and other fees that may cause the costs of investing in mutual funds to be greater than the costs of owning the underlying securities directly. These indirect expenses of mutual funds are not included in the amounts shown as expenses in the Statement of Operations or in the expense ratios included in the Financial Highlights.
(F) Use of Estimates. In preparing financial statements in conformity with GAAP, the Manager makes estimates and assumptions that affect the reported amounts and disclosures in the financial statements. Actual results could differ from those estimates and assumptions.
(G) Foreign Currency Transactions. The Portfolio's books and records are maintained in U.S. dollars. Prices of securities denominated in foreign currency amounts are translated into U.S. dollars at the mean between the buying and selling rates last quoted by any major U.S. bank at the following dates:
(i) market value of investment securities, other assets and liabilities— at the valuation date; and
(ii) purchases and sales of investment securities, income and expenses—at the date of such transactions.
The assets and liabilities that are denominated in foreign currency amounts are presented at the exchange rates and market values at the close of the period. The realized and unrealized changes in net assets arising from fluctuations in exchange rates and market prices of securities are not separately presented.
Net realized gain (loss) on foreign currency transactions represents net currency gains or losses realized as a result of differences between the amounts of securities sale proceeds or purchase cost, dividends, interest and withholding taxes as recorded on the Portfolio's books, and the U.S. dollar equivalent amount actually received or paid. Net currency gains or losses from valuing such foreign currency denominated assets and liabilities, other than investments at valuation date exchange rates, are reflected in unrealized foreign exchange gains or losses.
(H) Securities Lending. In order to realize additional income, the Portfolio may engage in securities lending, subject to the limitations set forth in the 1940 Act and relevant guidance by the staff of the Securities
Notes to Financial Statements (continued)
and Exchange Commission (“SEC”). If the Portfolio engages in securities lending, the Portfolio will lend through its custodian, JPMorgan Chase Bank, N.A., ("JPMorgan"), acting as securities lending agent on behalf of the Portfolio. Under the current arrangement, JPMorgan will manage the Portfolio's collateral in accordance with the securities lending agency agreement between the Portfolio and JPMorgan, and indemnify the Portfolio against counterparty risk. The loans will be collateralized by cash (which may be invested in a money market fund) and/or non-cash collateral (which may include U.S. Treasury securities and/or U.S. government agency securities issued or guaranteed by the United States government or its agencies or instrumentalities) at least equal at all times to the market value of the securities loaned. Non-cash collateral held at year end is segregated and cannot be transferred by the Portfolio. The Portfolio bears the risk of delay in recovery of, or loss of rights in, the securities loaned. The Portfolio may also record a realized gain or loss on securities deemed sold due to a borrower’s inability to return securities on loan. The Portfolio bears the risk of any loss on investment of cash collateral. The Portfolio will receive compensation for lending its securities in the form of fees or it will retain a portion of interest earned on the investment of any cash collateral. The Portfolio will also continue to receive interest and dividends on the securities loaned and any gain or loss in the market price of the securities loaned that may occur during the term of the loan will be for the account of the Portfolio. Income earned from securities lending activities, if any, is reflected in the Statement of Operations.
(I) Indemnifications. Under the Fund’s organizational documents, its officers and trustees are indemnified against certain liabilities that may arise out of performance of their duties to the Fund. Additionally, in the normal course of business, the Portfolio enters into contracts with third-party service providers that contain a variety of representations and warranties and that may provide general indemnifications. The Portfolio's maximum exposure under these arrangements is unknown, as this would involve future claims that may be made against the Portfolio that have not yet occurred. The Manager believes that the risk of loss in connection with these potential indemnification obligations is remote. However, there can be no assurance that material liabilities related to such obligations will not arise in the future, which could adversely impact the Portfolio.
Note 3–Fees and Related Party Transactions
(A) Manager and Subadvisor. New York Life Investments, a registered investment adviser and an indirect, wholly-owned subsidiary of New York Life, serves as the Portfolio's Manager, pursuant to an Amended and Restated Management Agreement (“Management Agreement”). The Manager provides offices, conducts clerical, recordkeeping and bookkeeping services and keeps most of the financial and accounting records required to be maintained by the Portfolio. Except for the portion of salaries and expenses that are the responsibility of the Portfolio, the Manager pays the salaries and expenses of all personnel affiliated with the Portfolio and certain operational expenses of the Portfolio. The Portfolio reimburses New York Life Investments in an amount equal to the portion of the compensation of the Chief Compliance Officer attributable
to the Portfolio. Epoch Investment Partners, Inc. (“Epoch” or the “Subadvisor”), a registered investment adviser, serves as the Subadvisor to the Portfolio and is responsible for the day-to-day portfolio management of the Portfolio. Pursuant to the terms of an Amended and Restated Subadvisory Agreement between New York Life Investments and Epoch, New York Life Investments pays for the services of the Subadvisor.
Pursuant to the Management Agreement, the Fund pays the Manager, on behalf of the Portfolio, a monthly fee for the services performed and the facilities furnished at an annual rate of the Portfolio's average daily net assets as follows: 0.70% up to $500 million; 0.68% from $500 million to $1 billion; 0.66% from $1 billion to $2 billion; and 0.65% in excess of $2 billion. During the year ended December 31, 2023, the effective management fee rate was 0.69% (exclusive of any applicable waivers/reimbursements) of the Portfolio's average daily net assets.
New York Life Investments has contractually agreed to waive fees and/or reimburse expenses so that Total Annual Portfolio Operating Expenses (excluding taxes, interest, litigation, extraordinary expenses, brokerage and other transaction expenses relating to the purchase or sale of portfolio investments and acquired (underlying) portfolio/fund fees and expenses) of Service Class shares do not exceed 0.93% of the Portfolio's average daily net assets. New York Life Investments will apply an equivalent waiver or reimbursement, in an equal number of basis points, to Initial Class shares. This agreement will remain in effect until May 1, 2024, and shall renew automatically for one-year terms unless New York Life Investments provides written notice of termination prior to the start of the next term or upon approval of the Board.
During the year ended December 31, 2023, New York Life Investments earned fees from the Portfolio in the amount of $6,272,695 and waived fees and/or reimbursed expenses in the amount of $328,000 and paid the Subadvisor fees in the amount of $2,972,348.
JPMorgan provides sub-administration and sub-accounting services to the Portfolio pursuant to an agreement with New York Life Investments. These services include calculating the daily NAVs of the Portfolio, maintaining the general ledger and sub-ledger accounts for the calculation of the Portfolio's NAVs, and assisting New York Life Investments in conducting various aspects of the Portfolio's administrative operations. For providing these services to the Portfolio, JPMorgan is compensated by New York Life Investments.
Pursuant to an agreement between the Fund and New York Life Investments, New York Life Investments is responsible for providing or procuring certain regulatory reporting services for the Portfolio. The Portfolio will reimburse New York Life Investments for the actual costs incurred by New York Life Investments in connection with providing or procuring these services for the Portfolio.
(B) Distribution and Service Fees. The Fund, on behalf of the Portfolio, has entered into a distribution agreement with NYLIFE Distributors LLC (the “Distributor”), an affiliate of New York Life Investments. The Portfolio has adopted a distribution plan (the “Plan”) in accordance with the provisions of Rule 12b-1 under the 1940 Act. Under
| 22 | MainStay VP Epoch U.S. Equity Yield Portfolio |
the Plan, the Distributor has agreed to provide, through its affiliates or independent third parties, various distribution-related, shareholder and administrative support services to the Service Class shareholders. For its services, the Distributor is entitled to a combined distribution and service fee accrued daily and paid monthly at an annual rate of 0.25% of the average daily net assets attributable to the Service Class shares of the Portfolio.
Note 4-Federal Income Tax
As of December 31, 2023, the cost and unrealized appreciation (depreciation) of the Portfolio’s investment portfolio, including applicable derivative contracts and other financial instruments, as determined on a federal income tax basis, were as follows:
| | Federal Tax
Cost | Gross
Unrealized
Appreciation | Gross
Unrealized
(Depreciation) | Net
Unrealized
Appreciation/
(Depreciation) |
| Investments in Securities | $745,752,451 | $189,699,572 | $(26,433,432) | $163,266,140 |
As of December 31, 2023, the components of accumulated gain (loss) on a tax basis were as follows:
Ordinary
Income | Accumulated
Capital
and Other
Gain (Loss) | Other
Temporary
Differences | Unrealized
Appreciation
(Depreciation) | Total
Accumulated
Gain (Loss) |
| $20,342,963 | $54,101,072 | $231,468 | $163,266,140 | $237,941,643 |
The difference between book-basis and tax-basis unrealized appreciation (depreciation) is primarily due to wash sale and partnership adjustments.
During the years ended December 31, 2023 and December 31, 2022, the tax character of distributions paid as reflected in the Statements of Changes in Net Assets was as follows:
| | 2023 | 2022 |
| Distributions paid from: | | |
| Ordinary Income | $22,976,175 | $19,553,373 |
| Long-Term Capital Gains | 57,551,934 | 22,127,935 |
| Total | $80,528,109 | $41,681,308 |
Note 5–Custodian
JPMorgan is the custodian of cash and securities held by the Portfolio. Custodial fees are charged to the Portfolio based on the Portfolio's net assets and/or the market value of securities held by the Portfolio and the number of certain transactions incurred by the Portfolio.
Note 6–Line of Credit
The Portfolio and certain other funds managed by New York Life Investments maintain a line of credit with a syndicate of banks in order to secure a source of funds for temporary purposes to meet unanticipated or excessive redemption requests.
Effective July 25, 2023, under the credit agreement (the “Credit Agreement”), the aggregate commitment amount is $600,000,000 with an additional uncommitted amount of $100,000,000. The commitment fee is an annual rate of 0.15% of the average commitment amount payable quarterly, regardless of usage, to JPMorgan, who serves as the agent to the syndicate. The commitment fee is allocated among the Portfolio and certain other funds managed by New York Life Investments based upon their respective net assets and other factors. Interest on any revolving credit loan is charged based upon the Federal Funds Rate, Daily Simple Secured Overnight Financing Rate ("SOFR") + 0.10%, or the Overnight Bank Funding Rate, whichever is higher. The Credit Agreement expires on July 23, 2024, although the Portfolio, certain other funds managed by New York Life Investments and the syndicate of banks may renew the Credit Agreement for an additional year on the same or different terms or enter into a credit agreement with a different syndicate of banks. Prior to July 25, 2023, the aggregate commitment amount and the commitment fee were the same as those under the current Credit Agreement. During the year ended December 31, 2023, there were no borrowings made or outstanding with respect to the Portfolio under the Credit Agreement.
Note 7–Interfund Lending Program
Pursuant to an exemptive order issued by the SEC, the Portfolio, along with certain other funds managed by New York Life Investments, may participate in an interfund lending program. The interfund lending program provides an alternative credit facility that permits the Portfolio and certain other funds managed by New York Life Investments to lend or borrow money for temporary purposes directly to or from one another, subject to the conditions of the exemptive order. During the year ended December 31, 2023, there were no interfund loans made or outstanding with respect to the Portfolio.
Note 8–Purchases and Sales of Securities (in 000’s)
During the year ended December 31, 2023, purchases and sales of securities, other than short-term securities, were $170,521 and $273,407, respectively.
Notes to Financial Statements (continued)
Note 9–Capital Share Transactions
Transactions in capital shares for the years ended December 31, 2023 and December 31, 2022, were as follows:
| Initial Class | Shares | Amount |
| Year ended December 31, 2023: | | |
| Shares sold | 2,083,263 | $ 34,699,500 |
| Shares issued to shareholders in reinvestment of distributions | 3,026,105 | 46,136,902 |
| Shares redeemed | (6,005,847) | (100,601,391) |
| Net increase (decrease) | (896,479) | $ (19,764,989) |
| Year ended December 31, 2022: | | |
| Shares sold | 1,806,350 | $ 31,122,708 |
| Shares issued to shareholders in reinvestment of distributions | 1,580,024 | 24,054,585 |
| Shares redeemed | (6,640,134) | (115,275,069) |
| Net increase (decrease) | (3,253,760) | $ (60,097,776) |
| |
| Service Class | Shares | Amount |
| Year ended December 31, 2023: | | |
| Shares sold | 1,884,974 | $ 30,945,269 |
| Shares issued to shareholders in reinvestment of distributions | 2,294,200 | 34,391,207 |
| Shares redeemed | (5,135,703) | (84,192,903) |
| Net increase (decrease) | (956,529) | $ (18,856,427) |
| Year ended December 31, 2022: | | |
| Shares sold | 2,619,444 | $ 43,993,837 |
| Shares issued to shareholders in reinvestment of distributions | 1,176,110 | 17,626,723 |
| Shares redeemed | (4,908,892) | (83,070,314) |
| Net increase (decrease) | (1,113,338) | $ (21,449,754) |
Note 10–Other Matters
As of the date of this report, the Portfolio faces a heightened level of risk associated with current uncertainty, volatility and state of economies, financial markets, rising interest rates, and labor and health conditions around the world. Events such as war, acts of terrorism, recessions, rapid inflation, the imposition of international sanctions, earthquakes, hurricanes, epidemics and pandemics and other unforeseen natural or human disasters may have broad adverse social, political and economic effects on the global economy, which could negatively impact the value of the Portfolio's investments. Developments that disrupt global economies and financial markets may magnify factors that affect the Portfolio's performance.
Note 11–Subsequent Events
In connection with the preparation of the financial statements of the Portfolio as of and for the year ended December 31, 2023, events and transactions subsequent to December 31, 2023, through the date the financial statements were issued, have been evaluated by the Manager
for possible adjustment and/or disclosure. No subsequent events requiring financial statement adjustment or disclosure have been identified.
| 24 | MainStay VP Epoch U.S. Equity Yield Portfolio |
Report of Independent Registered Public Accounting Firm
To the Board of Trustees of MainStay VP Funds Trust and Shareholders of MainStay VP Epoch U.S. Equity Yield Portfolio
Opinion on the Financial Statements
We have audited the accompanying statement of assets and liabilities, including the portfolio of investments, of MainStay VP Epoch U.S. Equity Yield Portfolio (one of the portfolios constituting MainStay VP Funds Trust, referred to hereafter as the “Portfolio”) as of December 31, 2023, the related statement of operations for the year ended December 31, 2023, the statements of changes in net assets for each of the two years in the period ended December 31, 2023, including the related notes, and the financial highlights for each of the five years in the period ended December 31, 2023 (collectively referred to as the “financial statements”). In our opinion, the financial statements present fairly, in all material respects, the financial position of the Portfolio as of December 31, 2023, the results of its operations for the year then ended, the changes in its net assets for each of the two years in the period ended December 31, 2023 and the financial highlights for each of the five years in the period ended December 31, 2023 in conformity with accounting principles generally accepted in the United States of America.
Basis for Opinion
These financial statements are the responsibility of the Portfolio’s management. Our responsibility is to express an opinion on the Portfolio’s financial statements based on our audits. We are a public accounting firm registered with the Public Company Accounting Oversight Board (United States) (PCAOB) and are required to be independent with respect to the Portfolio in accordance with the U.S. federal securities laws and the applicable rules and regulations of the Securities and Exchange Commission and the PCAOB.
We conducted our audits of these financial statements in accordance with the standards of the PCAOB. Those standards require that we plan and perform the audit to obtain reasonable assurance about whether the financial statements are free of material misstatement, whether due to error or fraud.
Our audits included performing procedures to assess the risks of material misstatement of the financial statements, whether due to error or fraud, and performing procedures that respond to those risks. Such procedures included examining, on a test basis, evidence regarding the amounts and disclosures in the financial statements. Our audits also included evaluating the accounting principles used and significant estimates made by management, as well as evaluating the overall presentation of the financial statements. Our procedures included confirmation of securities owned as of December 31, 2023 by correspondence with the custodian, transfer agents and broker; when replies were not received from broker, we performed other auditing procedures. We believe that our audits provide a reasonable basis for our opinion.
/s/PricewaterhouseCoopers LLP
New York, New York
February 26, 2024
We have served as the auditor of one or more investment companies in the MainStay group of funds since 1984.
Board Consideration and Approval of Management Agreement and Subadvisory Agreement (Unaudited)
The continuation of the Management Agreement with respect to the MainStay VP Epoch U.S. Equity Yield Portfolio (“Portfolio”) and New York Life Investment Management LLC (“New York Life Investments”) and the Subadvisory Agreement between New York Life Investments and Epoch Investment Partners, Inc. (“Epoch”) with respect to the Portfolio (together, “Advisory Agreements”) is subject to annual review and approval by the Board of Trustees of MainStay VP Funds Trust (“Board” of the “Trust”) in accordance with Section 15 of the Investment Company Act of 1940, as amended (“1940 Act”). At its December 6–7, 2023 meeting, the Board, including the Trustees who are not an “interested person” (as such term is defined in the 1940 Act) of the Trust (“Independent Trustees”) voting separately, unanimously approved the continuation of each of the Advisory Agreements for a one-year period.
In reaching the decision to approve the continuation of each of the Advisory Agreements, the Board considered information and materials furnished by New York Life Investments and Epoch in connection with an annual contract review process undertaken by the Board that took place at meetings of the Board and its Contracts Committee from September 2023 through December 2023, including information and materials furnished by New York Life Investments and Epoch in response to requests prepared on behalf of the Board, and in consultation with the Independent Trustees, by independent legal counsel to the Independent Trustees, which encompassed a variety of topics, including those summarized below. Information and materials requested by and furnished to the Board for consideration in connection with the contract review process included, among other items, reports on the Portfolio and “peer funds” prepared by Institutional Shareholder Services Inc. (“ISS”), an independent third-party service provider engaged by the Board to report objectively on the Portfolio’s investment performance, management fee and total expenses. The Board also considered information on the fees charged to other investment advisory clients of New York Life Investments and/or Epoch that follow investment strategies similar to those of the Portfolio, if any, and, when applicable, the rationale for differences in the Portfolio’s management and subadvisory fees and the fees charged to those other investment advisory clients. In addition, the Board considered information regarding the legal standards and fiduciary obligations applicable to its consideration of the continuation of each of the Advisory Agreements. The contract review process, including the structure and format for information and materials provided to the Board, has been developed in consultation with the Board. The Independent Trustees also met in executive sessions with their independent legal counsel and, for portions thereof, with senior management of New York Life Investments.
The Board’s deliberations with respect to the continuation of each of the Advisory Agreements reflect a year-long process, and the Board also took into account information furnished to the Board and its Committees throughout the year, as deemed relevant and appropriate by the Trustees, including, among other items, reports on investment performance of the Portfolio and investment-related matters for the Portfolio as well as presentations from New York Life Investments and, generally annually, Epoch personnel. In addition, the Board took into account other information provided by New York Life Investments throughout the year,
including, among other items, periodic reports on legal and compliance matters, risk management, portfolio turnover, brokerage commissions and non-advisory services provided to the Portfolio by New York Life Investments, as deemed relevant and appropriate by the Trustees.
In addition to information provided to the Board throughout the year, the Board received information in connection with its June 2023 meeting provided specifically in response to requests prepared on behalf of the Board, and in consultation with the Independent Trustees, by independent legal counsel to the Independent Trustees regarding the Portfolio’s distribution arrangements. In addition, the Board received information regarding the Portfolio’s asset levels, share purchase and redemption activity and the payment of Rule 12b-1 and/or certain other fees by applicable share classes of the Portfolio, among other information.
In considering the continuation of each of the Advisory Agreements, the Trustees reviewed and evaluated the information and factors they believed to reasonably be necessary and appropriate in light of legal advice furnished to them by independent legal counsel to the Independent Trustees and through the exercise of their own business judgment. Although individual Trustees may have weighed certain factors or information differently and the Board did not consider any single factor or information controlling in reaching its decision, the factors that figured prominently in the Board’s consideration of the continuation of each of the Advisory Agreements are summarized in more detail below and include, among other factors: (i) the nature, extent and quality of the services provided to the Portfolio by New York Life Investments and Epoch; (ii) the qualifications of the portfolio managers of the Portfolio and the historical investment performance of the Portfolio, New York Life Investments and Epoch; (iii) the costs of the services provided, and profits realized, by New York Life Investments and Epoch with respect to their relationships with the Portfolio; (iv) the extent to which economies of scale have been realized or may be realized if the Portfolio grows and the extent to which any economies of scale have been shared, have benefited or may benefit the Portfolio’s shareholders; and (v) the reasonableness of the Portfolio’s management and subadvisory fees and total ordinary operating expenses. Although the Board recognized that comparisons between the Portfolio’s fees and expenses and those of other funds are imprecise given different terms of agreements, variations in fund strategies and other factors, the Board considered the reasonableness of the Portfolio’s management fee and total ordinary operating expenses as compared to the peer funds identified by ISS. Throughout their considerations, the Trustees acknowledged the commitment of New York Life Investments and its affiliates to serve the MainStay Group of Funds, as well as their capacity, experience, resources, financial stability and reputations. The Trustees also acknowledged the entrepreneurial and other risks assumed by New York Life Investments in sponsoring and managing the Portfolio. With respect to the Subadvisory Agreement, the Board took into account New York Life Investments’ recommendation to approve the continuation of the Subadvisory Agreement.
The Trustees noted that, throughout the year, the Trustees are afforded an opportunity to ask questions of, and request additional information or materials from, New York Life Investments and Epoch. The Board’s
| 26 | MainStay VP Epoch U.S. Equity Yield Portfolio |
decision with respect to each of the Advisory Agreements may have also been based, in part, on the Board’s knowledge of New York Life Investments and Epoch resulting from, among other things, the Board’s consideration of each of the Advisory Agreements in prior years, the advisory agreements for other funds in the MainStay Group of Funds, the Board’s review throughout the year of the performance and operations of other funds in the MainStay Group of Funds and each Trustee’s business judgment and industry experience. In addition to considering the above-referenced factors, the Board observed that in the marketplace, notably under variable life insurance policies and variable annuity contracts for which the Portfolio serves as an investment option, there are a range of investment options available to investors and that the Portfolio’s shareholders, having had the opportunity to consider other investment options, have invested in the Portfolio.
The factors that figured prominently in the Board’s decision to approve the continuation of each of the Advisory Agreements during the Board’s December 6–7, 2023 meeting are summarized in more detail below.
Nature, Extent and Quality of Services Provided by New York Life Investments and Epoch
The Board examined the nature, extent and quality of the services that New York Life Investments provides to the Portfolio. The Board evaluated New York Life Investments’ experience and capabilities in serving as manager of the Portfolio and considered that the Portfolio operates in a “manager-of-managers” structure. The Board also considered New York Life Investments’ responsibilities and services provided pursuant to this structure, including overseeing the services provided by Epoch, evaluating the performance of Epoch, making recommendations to the Board as to whether the Subadvisory Agreement should be renewed, modified or terminated and periodically reporting to the Board regarding the results of New York Life Investments’ evaluation and monitoring functions. The Board noted that New York Life Investments manages other mutual funds, serves a variety of other investment advisory clients, including other pooled investment vehicles, and has experience overseeing mutual fund service providers, including subadvisors. The Board considered the experience of senior personnel at New York Life Investments providing management and administrative and other non-advisory services to the Portfolio. The Board observed that New York Life Investments devotes significant resources and time to providing management and administrative and other non-advisory services to the Portfolio, including New York Life Investments’ oversight and due diligence reviews of Epoch and ongoing analysis of, and interactions with, Epoch with respect to, among other things, the Portfolio’s investment performance and risks as well as Epoch’s investment capabilities and subadvisory services with respect to the Portfolio.
The Board also considered the range of services that New York Life Investments provides to the Portfolio under the terms of the Management Agreement, including: (i) fund accounting and ongoing supervisory services provided by New York Life Investments’ Fund Administration and Accounting Group; (ii) investment supervisory and analytical services provided by New York Life Investments’ Investment Consulting Group; (iii)
compliance services provided by the Trust’s Chief Compliance Officer as well as New York Life Investments’ compliance department, including supervision and implementation of the Portfolio’s compliance program; (iv) legal services provided by New York Life Investments’ Office of the General Counsel; and (v) risk management monitoring and analysis by compliance and investment personnel. In addition, the Board considered New York Life Investments’ willingness to invest in personnel and other resources, such as cyber security, information security and business continuity planning, that may benefit the Portfolio and noted that New York Life Investments is responsible for compensating the Trust’s officers, except for a portion of the salary of the Trust’s Chief Compliance Officer. The Board recognized that New York Life Investments provides certain other non-advisory services to the Portfolio and has over time provided an increasingly broad array of non-advisory services to the MainStay Group of Funds as a result of regulatory and other developments.
The Board also examined the range, and the nature, extent and quality, of the investment advisory services that Epoch provides to the Portfolio and considered the terms of each of the Advisory Agreements. The Board evaluated Epoch’s experience and performance in serving as subadvisor to the Portfolio and advising other portfolios and Epoch’s track record and experience in providing investment advisory services as well as the experience of investment advisory, senior management and administrative personnel at Epoch. The Board considered New York Life Investments’ and Epoch’s overall resources, legal and compliance environment, capabilities, reputation, financial condition and history. In addition to information provided in connection with quarterly meetings with the Trust’s Chief Compliance Officer, the Board considered information regarding the compliance policies and procedures of New York Life Investments and Epoch and acknowledged their commitment to further developing and strengthening compliance programs that may relate to the Portfolio. The Board also considered Epoch’s ability to recruit and retain qualified investment professionals and willingness to invest in personnel and other resources that may benefit the Portfolio. In this regard, the Board considered the qualifications and experience of the Portfolio’s portfolio managers, the number of accounts managed by the portfolio managers and the method for compensating the portfolio managers.
In addition, the Board considered information provided by New York Life Investments and Epoch regarding their respective business continuity and disaster recovery plans.
Based on these considerations, among others, the Board concluded that the Portfolio would likely continue to benefit from the nature, extent and quality of these services.
Investment Performance
In evaluating the Portfolio’s investment performance, the Board considered investment performance results over various periods in light of the Portfolio’s investment objective, strategies and risks. The Board considered investment reports on, and analysis of, the Portfolio’s performance provided to the Board throughout the year. These reports include, among other items, information on the Portfolio’s gross and net
Board Consideration and Approval of Management Agreement and Subadvisory Agreement (Unaudited) (continued)
returns, the Portfolio’s investment performance compared to a relevant investment category and the Portfolio’s benchmarks, the Portfolio’s risk-adjusted investment performance and the Portfolio’s investment performance as compared to peer funds, as appropriate, as well as portfolio attribution information and commentary on the effect of market conditions. The Board also considered information provided by ISS showing the investment performance of the Portfolio as compared to peer funds. In addition, the Board reviewed the methodology used by ISS to construct the group of peer funds for comparative purposes.
The Board also took into account its discussions with senior management at New York Life Investments concerning the Portfolio’s investment performance over various periods as well as discussions between representatives of Epoch and the members of the Board’s Investment Committee, which generally occur on an annual basis. In considering the investment performance of the Portfolio, the Board noted that the Portfolio underperformed its peer funds for the one-, three- and ten-year periods ended July 31, 2023, and performed in line with its peer funds for the five-year period ended July 31, 2023. The Board considered its discussions with representatives from New York Life Investments and Epoch regarding the Portfolio’s investment performance.
Based on these considerations, among others, the Board concluded that its review of the Portfolio’s investment performance and related information supported a determination to approve the continuation of each of the Advisory Agreements.
Costs of the Services Provided, and Profits and Other Benefits Realized, by New York Life Investments and Epoch
The Board considered the costs of the services provided under each of the Advisory Agreements. The Board also considered the profitability of New York Life Investments and its affiliates and Epoch due to their relationships with the Portfolio as well as by New York Life Investments and its affiliates due to their relationships with the MainStay Group of Funds. With respect to the profitability of Epoch’s relationship with the Portfolio, the Board considered information from New York Life Investments that Epoch’s subadvisory fee reflected an arm’s-length negotiation and that this fee is paid by New York Life Investments, not the Portfolio, and the relevance of Epoch’s profitability was considered by the Trustees in that context. On this basis, the Board primarily considered the costs and profitability for New York Life Investments and its affiliates with respect to the Portfolio.
In addition, the Board acknowledged the difficulty in obtaining reliable comparative data about mutual fund managers’ profitability because such information generally is not publicly available and may be impacted by numerous factors, including the structure of a fund manager’s organization, the types of funds it manages, the methodology used to allocate certain fixed costs to specific funds and the manager’s capital structure and costs of capital.
In evaluating the costs of the services provided by New York Life Investments and Epoch, and profitability of New York Life Investments and its affiliates and Epoch due to their relationships with the Portfolio, the
Board considered, among other factors, New York Life Investments’ and its affiliates’ and Epoch’s continuing investments in, or willingness to invest in, personnel and other resources that may support and further enhance the management of the Portfolio, and that New York Life Investments is responsible for paying the subadvisory fee for the Portfolio. The Board also considered the financial resources of New York Life Investments and Epoch and acknowledged that New York Life Investments and Epoch must be in a position to recruit and retain experienced professional personnel and to maintain a strong financial position for New York Life Investments and Epoch to continue to provide high-quality services to the Portfolio. The Board recognized that the Portfolio benefits from the allocation of certain fixed costs among the funds in the MainStay Group of Funds, among other expected benefits resulting from its relationship with New York Life Investments.
The Board considered information regarding New York Life Investments’ methodology for calculating profitability and allocating costs provided by New York Life Investments in connection with the fund profitability analysis presented to the Board. The Board concluded that New York Life Investments’ methods for allocating costs and procedures for estimating overall profitability of the relationship with the funds in the MainStay Group of Funds were reasonable. The Board recognized the difficulty in calculating and evaluating a manager’s profitability with respect to the Portfolio and considered that other profitability methodologies may also be reasonable.
The Board also considered certain fall-out benefits that may be realized by New York Life Investments and its affiliates and Epoch and its affiliates due to their relationships with the Portfolio, including reputational and other indirect benefits. The Board recognized, for example, the benefits to Epoch from legally permitted “soft-dollar” arrangements by which brokers provide research and other services to Epoch in exchange for commissions paid by the Portfolio with respect to trades in the Portfolio’s portfolio securities. In this regard, the Board also requested and considered information from New York Life Investments concerning other material business relationships between Epoch and its affiliates and New York Life Investments and its affiliates and considered the existence of a strategic partnership between New York Life Investments and Epoch that relates to certain current and future products and represents a potential conflict of interest associated with New York Life Investments’ recommendation to approve the Subadvisory Agreement. In addition, the Board considered its review of the management agreement for a money market fund advised by New York Life Investments and an affiliated subadvisor that serves as an investment option for the Portfolio, including the potential rationale for and costs associated with investments in this money market fund by the Portfolio, if any, and considered information from New York Life Investments that the nature and type of specific investment advisory services provided to this money market fund are distinct from, or in addition to, the investment advisory services provided to the Portfolio. In addition, the Board considered the potential dividend received tax deduction for insurance company affiliates of New York Life Investments from the Portfolio’s securities lending activity.
| 28 | MainStay VP Epoch U.S. Equity Yield Portfolio |
The Board noted that the Portfolio serves as an investment option primarily under variable contracts issued by affiliates of New York Life Investments that would receive fees under those contracts. The Board observed that, in addition to fees earned by New York Life Investments under the Management Agreement for managing the Portfolio, New York Life Investments’ affiliates also earn revenues from serving the Portfolio in various other capacities, including as the Portfolio’s distributor, and insurance companies affiliated with New York Life Investments would be entitled to receive fees from the Portfolio under a distribution and service plan adopted pursuant to Rule 12b-1 under the 1940 Act. The Board considered information about these other revenues and their impact on the profitability of the relationship with the Portfolio to New York Life Investments and its affiliates. The Board noted that, although it assessed the overall profitability of the relationship with the Portfolio to New York Life Investments and its affiliates as part of the contract review process, when considering the reasonableness of the fee paid to New York Life Investments under the Management Agreement, the Board considered the profitability of New York Life Investments’ relationship with the Portfolio on a pre-tax basis and without regard to distribution expenses incurred by New York Life Investments from its own resources.
After evaluating the information deemed relevant by the Trustees, the Board concluded that any profits realized by New York Life Investments and its affiliates due to their relationships with the Portfolio were not excessive, other expected benefits that may accrue to New York Life Investments and its affiliates are reasonable and other expected benefits that may accrue to Epoch and its affiliates are consistent with those expected for a subadvisor to a mutual fund. With respect to Epoch, the Board considered that any profits realized by Epoch due to its relationship with the Portfolio are the result of arm’s-length negotiations between New York Life Investments and Epoch, acknowledging that any such profits are based on the subadvisory fee paid to Epoch by New York Life Investments, not the Portfolio.
Management and Subadvisory Fees and Total Ordinary Operating Expenses
The Board evaluated the reasonableness of the fee paid under each of the Advisory Agreements and the Portfolio’s total ordinary operating expenses. With respect to the management fee and subadvisory fee, the Board primarily considered the reasonableness of the management fee paid by the Portfolio to New York Life Investments because the subadvisory fee paid to Epoch is paid by New York Life Investments, not the Portfolio. The Board also considered the reasonableness of the subadvisory fee paid by New York Life Investments and the amount of the management fee retained by New York Life Investments.
In assessing the reasonableness of the Portfolio’s fees and expenses, the Board primarily considered comparative data provided by ISS on the fees and expenses of similar mutual funds managed by other investment advisers. The Board reviewed the methodology used by ISS to construct the group of peer funds for comparative purposes. In addition, the Board considered information provided by New York Life Investments and Epoch on fees charged to other investment advisory clients, including
institutional separate accounts and/or other funds, that follow investment strategies similar to those of the Portfolio, if any. The Board considered the contractual management fee schedule for the Portfolio as compared to those for such other investment advisory clients, taking into account the rationale for differences in fee schedules. The Board also took into account information provided by New York Life Investments about the more extensive scope of services provided to registered investment companies, such as the Portfolio, as compared with other investment advisory clients. Additionally, the Board considered the impact of contractual breakpoints, voluntary waivers and expense limitation arrangements on the Portfolio’s net management fee and expenses. The Board also considered that in proposing fees for the Portfolio, New York Life Investments considers the competitive marketplace for mutual funds.
Based on the factors outlined above, among other considerations, the Board concluded that the Portfolio’s management fee and total ordinary operating expenses are within a range that is competitive and support a conclusion that these fees and expenses are reasonable.
Economies of Scale
The Board considered information regarding economies of scale, including whether economies of scale may exist with respect to the Portfolio and whether the Portfolio’s management fee and expense structure permits any economies of scale to be appropriately shared with the Portfolio’s shareholders. The Board also considered a report from New York Life Investments, previously prepared at the request of the Board, that addressed economies of scale, including with respect to the mutual fund business generally, and the various ways in which the benefits of economies of scale may be shared with the funds in the MainStay Group of Funds. Although the Board recognized the difficulty of determining economies of scale with precision, the Board acknowledged that economies of scale may be shared with the Portfolio in a number of ways, including, for example, through the imposition of fee breakpoints, initially setting management fee rates at scale or making additional investments to enhance the services provided to the Portfolio. The Board reviewed information from New York Life Investments showing how the Portfolio’s management fee schedule compared to fee schedules of other funds and accounts managed by New York Life Investments. The Board also reviewed information from ISS showing how the Portfolio’s management fee schedule compared with fees paid for similar services by peer funds at varying asset levels.
Based on this information, the Board concluded that economies of scale are appropriately shared for the benefit of the Portfolio’s shareholders through the Portfolio’s management fee and expense structure and other methods to share benefits from economies of scale.
Board Consideration and Approval of Management Agreement and Subadvisory Agreement (Unaudited) (continued)
Conclusion
On the basis of the information and factors summarized above, among other information and factors deemed relevant by the Trustees, and the evaluation thereof, the Board, including the Independent Trustees voting separately, unanimously voted to approve the continuation of each of the Advisory Agreements.
| 30 | MainStay VP Epoch U.S. Equity Yield Portfolio |
Proxy Voting Policies and Procedures and Proxy Voting Record
The Portfolio is required to file with the SEC its proxy voting record for the 12-month period ending June 30 on Form N-PX. A description of the policies and procedures that are used to vote proxies relating to portfolio securities of the Portfolio is available free of charge upon request by calling 800-598-2019 or visiting the SEC's website at www.sec.gov. The most recent Form N-PX or proxy voting record is available free of charge upon request by calling 800-598-2019; visiting https://www.newyorklifeinvestments.com/investment-products/vp; or visiting the SEC’s website at www.sec.gov.
Shareholder Reports and Quarterly Portfolio Disclosure
The Portfolio is required to file its complete schedule of portfolio holdings with the SEC 60 days after its first and third fiscal quarter on Form N-PORT. The Portfolio's holdings report is available free of charge upon request by calling 800-598-2019 or by visiting the SEC’s website at www.sec.gov.
Board of Trustees and Officers (Unaudited)
The Trustees and officers of the Portfolio are listed below. The Board oversees the MainStay Group of Funds (which consists of MainStay Funds and MainStay Funds Trust), MainStay VP Funds Trust, MainStay MacKay DefinedTerm Municipal Opportunities Fund, MainStay CBRE Global Infrastructure Megatrends Term Fund, the Manager and the Subadvisors, and elects the officers of the Portfolios who are responsible for the day-to-day operations of the Portfolio. Information pertaining to the Trustees and officers is set forth below. Each Trustee serves until his or her successor is elected and qualified or until his or her resignation,
death or removal. Under the Board’s retirement policy, unless an exception is made, a Trustee must tender his or her resignation by the end of the calendar year during which he or she reaches the age of 75. Officers are elected annually by the Board. The business address of each Trustee and officer listed below is 51 Madison Avenue, New York, New York 10010. A majority of the Trustees are not “interested persons” (as defined by the 1940 Act and rules adopted by the SEC thereunder) of the Portfolio (“Independent Trustees”).
| | Name and
Year of Birth | Term of Office,
Position(s) Held and
Length of Service | Principal Occupation(s)
During Past Five Years | Number of
Portfolios in
Fund Complex
Overseen by
Trustee | Other Directorships
Held by Trustee |
| | | | | | |
| | Naïm Abou-Jaoudé*
1966 | MainStay VP Funds Trust: Trustee since 2023 | Chief Executive Officer of New York Life Investment Management LLC (since 2023). Chief Executive Officer of Candriam (an affiliate of New York Life Investment Management LLC) (2007 to 2023). | 81 | MainStay Funds: Trustee since 2023 (11 Funds)
MainStay Funds Trust: Trustee since 2023 (37 Funds);
MainStay MacKay DefinedTerm Municipal Opportunities Fund: Trustee since 2023;
MainStay CBRE Global Infrastructure Megatrends Term Fund: Trustee since 2023; and
New York Life Investment Management International (Chair) since 2015 |
| * | This Trustee is considered to be an “interested person” of the MainStay Group of Funds, MainStay VP Funds Trust, MainStay CBRE Global Infrastructure Megatrends Term Fund and MainStay MacKay DefinedTerm Municipal Opportunities Fund, within the meaning of the 1940 Act because of his affiliation with New York Life Investment Management LLC and Candriam, as described in detail above in the column entitled “Principal Occupation(s) During Past Five Years.” |
| | |
| 32 | MainStay VP Epoch U.S. Equity Yield Portfolio |
| | Name and
Year of Birth | Term of Office,
Position(s) Held and
Length of Service | Principal Occupation(s)
During Past Five Years | Number of
Portfolios in
Fund Complex
Overseen by
Trustee | Other Directorships
Held by Trustee |
| | | | | | |
| | David H. Chow
1957 | MainStay VP Funds Trust: Trustee since January 2016, Advisory Board Member (June 2015 to December 2015) | Founder and CEO, DanCourt Management, LLC since 1999 | 81 | MainStay Funds: Trustee since January 2016, Advisory Board Member (June 2015 to December 2015) (11 Funds);
MainStay Funds Trust: Trustee since January 2016, Advisory Board Member (June 2015 to December 2015) (37 Funds);
MainStay MacKay DefinedTerm Municipal Opportunities Fund: Trustee since January 2016, Advisory Board Member (June 2015 to December 2015);
MainStay CBRE Global Infrastructure Megatrends Term Fund: Trustee since 2021;
VanEck Vectors Group of Exchange-Traded Funds: Trustee since 2006 and Independent Chairman of the Board of Trustees from 2008 to 2022 (57 portfolios); and
Berea College of Kentucky: Trustee since 2009, Chair of the Investment Committee since 2018 |
| | Karen Hammond
1956 | MainStay VP Funds Trust: Trustee since December 2021, Advisory Board Member (June 2021 to December 2021)
| Retired, Managing Director, Devonshire Investors (2007 to 2013); Senior Vice President, Fidelity Management & Research Co. (2005 to 2007); Senior Vice President and Corporate Treasurer, FMR Corp. (2003 to 2005); Chief Operating Officer, Fidelity Investments Japan (2001 to 2003) | 81 | MainStay Funds: Trustee since December 2021, Advisory Board Member (June 2021 to December 2021) (11 Funds);
MainStay Funds Trust: Trustee since December 2021, Advisory Board Member (June 2021 to December 2021) (37 Funds);
MainStay MacKay DefinedTerm Municipal Opportunities Fund: Trustee since December 2021, Advisory Board Member (June 2021 to December 2021);
MainStay CBRE Global Infrastructure Megatrends Term Fund: Trustee since December 2021, Advisory Board Member (June 2021 to December 2021);
Two Harbors Investment Corp.: Director since 2018;
Rhode Island State Investment Commission: Member since 2017; and
Blue Cross Blue Shield of Rhode Island: Director since 2019 |
| | Susan B. Kerley
1951 | MainStay VP Funds Trust: Chair since 2017 and Trustee since 2007** | President, Strategic Management Advisors LLC since 1990 | 81 | MainStay Funds: Chair since January 2017 and Trustee since 2007 (11 Funds); MainStay Funds Trust: Chair since January 2017 and Trustee since 1990 (37 Funds)***;
MainStay MacKay DefinedTerm Municipal Opportunities Fund: Chair since January 2017 and Trustee since 2011;
MainStay CBRE Global Infrastructure Megatrends Term Fund: Trustee since June 2021; and
Legg Mason Partners Funds: Trustee since 1991 (45 portfolios) |
Board of Trustees and Officers (Unaudited) (continued)
| | Name and
Year of Birth | Term of Office,
Position(s) Held and
Length of Service | Principal Occupation(s)
During Past Five Years | Number of
Portfolios in
Fund Complex
Overseen by
Trustee | Other Directorships
Held by Trustee |
| | | | | | |
| | Alan R. Latshaw
1951 | MainStay VP Funds Trust: Trustee since 2007** | Retired; Partner, Ernst & Young LLP (2002 to 2003); Partner, Arthur Andersen LLP (1989 to 2002); Consultant to the MainStay Funds Audit and Compliance Committee (2004 to 2006) | 81 | MainStay Funds: Trustee since 2006 (11 Funds);
MainStay Funds Trust: Trustee since 2007 (37 Funds)***;
MainStay MacKay DefinedTerm Municipal Opportunities Fund: Trustee since 2011; and
MainStay CBRE Global Infrastructure Megatrends Term Fund: Trustee since June 2021 |
| | Jacques P. Perold
1958 | MainStay VP Funds Trust: Trustee since January 2016, Advisory Board Member (June 2015 to December 2015) | Founder and Chief Executive Officer, CapShift Advisors LLC (since 2018); President, Fidelity Management & Research Company (2009 to 2014); President and Chief Investment Officer, Geode Capital Management, LLC (2001 to 2009) | 81 | MainStay Funds: Trustee since January 2016, Advisory Board Member (June 2015 to December 2015) (11 Funds);
MainStay Funds Trust: Trustee since January 2016, Advisory Board Member (June 2015 to December 2015) (37 Funds);
MainStay MacKay DefinedTerm Municipal Opportunities Fund: Trustee since January 2016, Advisory Board Member (June 2015 to December 2015);
MainStay CBRE Global Infrastructure Megatrends Term Fund: Trustee since June 2021;
Allstate Corporation: Director since 2015;
Partners in Health: Trustee since 2019; and
MSCI Inc.: Director since 2017 |
| | Richard S. Trutanic
1952 | MainStay VP Funds Trust: Trustee since 2007** | Chairman and Chief Executive Officer, Somerset & Company (financial advisory firm) since 2004; Managing Director, The Carlyle Group (private investment firm) (2002 to 2004); Senior Managing Director, Partner and Board Member, Groupe Arnault S.A. (private investment firm) (1999 to 2002) | 81 | MainStay Funds: Trustee since 1994 (11 Funds);
MainStay Funds Trust: Trustee since 2007 (37 Funds)***;
MainStay MacKay DefinedTerm Municipal Opportunities Fund: Trustee since 2011; and
MainStay CBRE Global Infrastructure Megatrends Term Fund: Trustee since June 2021 |
| ** | Includes prior service as a Director of MainStay VP Series Fund, Inc., the predecessor to MainStay VP Funds Trust. |
| *** | Includes prior service as a Director/Trustee of certain predecessor entities to MainStay Funds Trust. |
| 34 | MainStay VP Epoch U.S. Equity Yield Portfolio |
| | Name and
Year of Birth | Position(s) Held and
Length of Service | Principal Occupation(s)
During Past Five Years | |
| | | | | |
| | Kirk C. Lehneis
1974 | President, MainStay VP Funds Trust (since 2017) | Chief Operating Officer and Senior Managing Director (since 2016), New York Life Investment Management LLC and New York Life Investment Management Holdings LLC; Member of the Board of Managers (since 2017) and Senior Managing Director (since 2018), NYLIFE Distributors LLC; Chairman of the Board and Senior Managing Director, NYLIM Service Company LLC (since 2017); Trustee, President and Principal Executive Officer of IndexIQ Trust, IndexIQ ETF Trust and IndexIQ Active ETF Trust (since 2018); President, MainStay CBRE Global Infrastructure Megatrends Term Fund (since 2021), MainStay MacKay DefinedTerm Municipal Opportunities Fund, MainStay Funds and MainStay Funds Trust (since 2017); Senior Managing Director, Global Product Development (from 2015 to 2016); Managing Director, Product Development (from 2010 to 2015), New York Life Investment Management LLC | |
| | Jack R. Benintende
1964 | Treasurer and Principal Financial and Accounting Officer, MainStay VP Funds Trust (since 2007)** | Managing Director, New York Life Investment Management LLC (since 2007); Treasurer and Principal Financial and Accounting Officer, MainStay CBRE Global Infrastructure Megatrends Term Fund (since 2021), MainStay MacKay DefinedTerm Municipal Opportunities Fund (since 2011), MainStay Funds Trust (since 2009) and MainStay Funds (since 2007); and Assistant Treasurer, New York Life Investment Management Holdings LLC (2008 to 2012) | |
| | J. Kevin Gao
1967 | Secretary and Chief Legal Officer, MainStay VP Funds Trust (since 2010)** | Managing Director and Associate General Counsel, New York Life Investment Management LLC (since 2010); Secretary and Chief Legal Officer, MainStay CBRE Global Infrastructure Megatrends Term Fund (since 2021), MainStay MacKay DefinedTerm Municipal Opportunities Fund (since 2011), MainStay Funds and MainStay Funds Trust (since 2010) | |
| | Kevin M. Gleason
1967 | Vice President and Chief Compliance Officer, MainStay VP Funds Trust (since June 2022) | Vice President and Chief Compliance Officer, IndexIQ Trust, IndexIQ ETF Trust and IndexIQ Active ETF Trust (since June 2022); Vice President and Chief Compliance Officer, MainStay CBRE Global Infrastructure Megatrends Term Fund, MainStay MacKay DefinedTerm Municipal Opportunities Fund (since June 2022); MainStay Funds Trust and MainStay Funds (since June 2022); Senior Vice President, Voya Investment Management and Chief Compliance Officer, Voya Family of Funds (2012 to 2022) | |
| | Scott T. Harrington
1959 | Vice President— Administration, MainStay VP Funds Trust (since 2005)** | Managing Director, New York Life Investment Management LLC (including predecessor advisory organizations) (since 2000); Member of the Board of Directors, New York Life Trust Company (since 2009); Vice President—Administration, MainStay CBRE Global Infrastructure Megatrends Term Fund (since 2021), MainStay MacKay DefinedTerm Municipal Opportunities Fund (since 2011), MainStay Funds Trust and MainStay Funds (since 2009) | |
| * | The officers listed above are considered to be “interested persons” of the MainStay Group of Funds, MainStay VP Funds Trust, MainStay CBRE Global Infrastructure Megatrends Term Fund and MainStay MacKay DefinedTerm Municipal Opportunities Fund within the meaning of the 1940 Act because of their affiliation with the MainStay Group of Funds, New York Life Insurance Company and/or its affiliates, including New York Life Investment Management LLC, New York Life Insurance Company, NYLIM Service Company LLC, NYLIFE Securities LLC and/or NYLIFE Distributors LLC, as described in detail in the column captioned “Principal Occupation(s) During Past Five Years.” Officers are elected annually by the Board. |
| ** | Includes prior service as an Officer of MainStay VP Series Fund, Inc., the predecessor to MainStay VP Funds Trust. |
Officers of the Trust (Who are not Trustees)*
This page intentionally left blank.
This page intentionally left blank.
This page intentionally left blank.
MainStay VP Portfolios
MainStay VP offers a wide range of Portfolios. The full array of MainStay VP offerings is listed here, with information about the manager, subadvisors, legal counsel, and independent registered public accounting firm.
Equity
MainStay VP American Century Sustainable Equity Portfolio
MainStay VP Candriam Emerging Markets Equity Portfolio
MainStay VP Epoch U.S. Equity Yield Portfolio
MainStay VP Fidelity Institutional AM® Utilities Portfolio†
MainStay VP Natural Resources Portfolio
MainStay VP PineStone International Equity Portfolio1
MainStay VP S&P 500 Index Portfolio
MainStay VP Small Cap Growth Portfolio
MainStay VP Wellington Growth Portfolio
MainStay VP Wellington Mid Cap Portfolio
MainStay VP Wellington Small Cap Portfolio
MainStay VP Wellington U.S. Equity Portfolio
MainStay VP Winslow Large Cap Growth Portfolio
Mixed Asset
MainStay VP Balanced Portfolio
MainStay VP Income Builder Portfolio
MainStay VP Janus Henderson Balanced Portfolio
MainStay VP MacKay Convertible Portfolio
Income
MainStay VP Bond Portfolio
MainStay VP Floating Rate Portfolio
MainStay VP Indexed Bond Portfolio
MainStay VP MacKay Government Portfolio2
MainStay VP MacKay High Yield Corporate Bond Portfolio
MainStay VP MacKay Strategic Bond Portfolio
MainStay VP PIMCO Real Return Portfolio
Money Market
MainStay VP U.S. Government Money Market Portfolio
Alternative
MainStay VP CBRE Global Infrastructure Portfolio
MainStay VP IQ Hedge Multi-Strategy Portfolio
Asset Allocation
MainStay VP Conservative Allocation Portfolio
MainStay VP Equity Allocation Portfolio
MainStay VP Growth Allocation Portfolio
MainStay VP Moderate Allocation Portfolio
Manager
New York Life Investment Management LLC
New York, New York
Subadvisors
American Century Investment Management, Inc.
Kansas City, Missouri
Brown Advisory LLC
Baltimore, Maryland
Candriam*
Strassen, Luxembourg
CBRE Investment Management Listed Real Assets LLC
Radnor, Pennsylvania
Epoch Investment Partners, Inc.
New York, New York
FIAM LLC
Smithfield, Rhode Island
IndexIQ Advisors LLC*
New York, New York
Janus Henderson Investors US LLC
Denver, Colorado
MacKay Shields LLC*
New York, New York
Newton Investment Management North America, LLC
Boston, Massachusetts
NYL Investors LLC*
New York, New York
Pacific Investment Management Company LLC
Newport Beach, California
PineStone Asset Management Inc.
Montreal, Québec
Segall Bryant & Hamill, LLC
Chicago, Illinois
Wellington Management Company LLP
Boston, Massachusetts
Winslow Capital Management, LLC
Minneapolis, Minnesota
Legal Counsel
Dechert LLP
Washington, District of Columbia
Independent Registered Public Accounting Firm
KPMG LLP
Philadelphia, Pennsylvania
Distributor
NYLIFE Distributors LLC*
Jersey City, New Jersey
Custodian
JPMorgan Chase Bank, N.A.
New York, New York
Some Portfolios may not be available in all products.
† Fidelity Institutional AM is a registered trade mark of FMR LLC. Used with permission.
* An affiliate of New York Life Investment Management LLC.
| 1. | Prior to August 28, 2023, the Portfolio's name was MainStay VP MacKay International Equity Portfolio. |
| 2. | Effective on or about May 1, 2024, the MainStay VP MacKay Government Portfolio will be renamed the MainStay VP U.S. Infrastructure Bond Portfolio. |
Not part of the Annual Report
2023 Annual Report
This report is for the general information of New York Life Variable Annuities and NYLIAC Variable Universal Life Insurance Products policyowners. It must be preceded or accompanied by the appropriate product(s) and funds prospectuses if it is given to anyone who is not an owner of a New York Life variable annuity policy or a NYLIAC Variable Universal Life Insurance Product. This report does not offer for sale or solicit orders to purchase securities.
The performance data quoted in this report represents past performance. Past performance is no guarantee of future results. Due to market volatility and other factors, current performance may be lower or higher than the figures shown. The most recent month-end performance summary for your variable annuity or variable life policy is available by calling 800-598-2019 and is updated periodically on newyorklife.com.
The New York Life Variable Annuities and NYLIAC Variable Universal Life Insurance Products are issued by New York Life Insurance and Annuity Corporation (a Delaware Corporation) and distributed by NYLIFE Distributors LLC (Member FINRA/SIPC).
New York Life Insurance Company
New York Life Insurance and Annuity
Corporation (NYLIAC) (A Delaware Corporation)
51 Madison Avenue, Room 551
New York, NY 10010
newyorklife.com
newyorklifeinvestments.com
NYLIFE Distributors LLC, 30 Hudson Street, Jersey City, NJ 07302
New York Life Investment Management LLC is the investment manager to the MainStay VP Funds Trust
©2024 by NYLIFE Distributors LLC. All rights reserved.
You may obtain copies of the Prospectus and the Statement of Additional Information free of charge, upon request, by calling toll-free 800-598-2019 or writing to New York Life Insurance and Annuity Corporation, 51 Madison Avenue, New York, NY 10010.
| Not FDIC Insured | No Bank Guarantee | May Lose Value |
(NYLIAC) NI521
MainStay VP American Century Sustainable Equity Portfolio
Message from the President and Annual Report
December 31, 2023
Special Notice:
Beginning in July 2024, new regulations issued by the Securities and Exchange Commission (SEC) will take effect requiring open-end mutual fund companies and ETFs to (1) overhaul the content of their shareholder reports and (2) mail paper copies of the new tailored shareholder reports to shareholders who have not opted to receive these documents electronically.
If you have not yet elected to receive your shareholder reports electronically, please contact your financial intermediary or visit our website.
| Not FDIC/NCUA Insured | Not a Deposit | May Lose Value | No Bank Guarantee | Not Insured by Any Government Agency |
This page intentionally left blank
Message from the President
Against a backdrop of easing inflationary pressures and continued economic growth, stocks and bonds generally gained ground during the 12-month period ended December 31, 2023, despite high levels of volatility and sharp disparities between the performance of the different market sectors.
Although the war in Ukraine, the outbreak of hostilities in the Middle East and several other notable events affected financial assets, inflation, interest rate, and economic growth trends stood at the forefront of market developments during most of the period. As the reporting period began, high levels of inflation already showed signs of easing in the face of aggressive rate hikes by U.S. Federal Reserve (the “Fed”). From a peak of 9.1% in June 2022, the annualized U.S. inflation rate dropped to 6.4% in January, and 3.4% in December 2023. At the same time, the Fed increased the benchmark federal funds rate from 4.25%–4.50% at the beginning of reporting period, to 5.25%–5.50% as of the end of 2023. Despite the increasing cost of capital and tighter lending environment that resulted from rising rates, economic growth remained surprisingly robust, bolstered by high levels of consumer spending, low levels of unemployment and better-than-expected corporate earnings. With the pace of rate increases slowing from the prior year, investors began hoping for an early shift to a looser monetary policy, with stock prices and bond yields reacting as economic data and statements from the Fed either reinforced or undercut those hopes. Following months of hawkish rhetoric, the Fed finally reversed its stance in December 2023, signaling a positive economic outlook with little chance of a recession and a likelihood of rate cuts in 2024.
The S&P 500® Index, a widely regarded benchmark of U.S. market performance, produced strong gains during the reporting period-– recovering all its losses from 2022 and approached new record territory. A preponderance of the Index’s gains were generated by a relatively small number of mega-cap stocks in the information technology, communication services and consumer discretionary sectors that stood to benefit from rapid developments in generative artificial intelligence (“AI”). Value-oriented, interest-rate sensitive and small-capitalization
shares lagged by significant margins, although market strength widened during the closing weeks of the reporting period. Most overseas equity markets trailed the U.S. market, as developed international economies experienced relatively low growth rates, and weak economic conditions in China undermined emerging markets.
Bonds produced generally positive returns, bolstered by attractive and relatively stable yields. The yield on the 10-year Treasury note hit a high of just under 5% in mid-October 2023, ranging between approximately 3.5% and 4.8% for most of the reporting period. The yield curve remained inverted throughout the year, with the 2-year Treasury yield modestly above the 10-year yield. Corporate bond prices trended moderately higher, generally outperforming government securities. After years of low yields and tight credit spreads, the corporate sector benefited from more attractive valuations and income opportunities. Among corporates, markets generally rewarded longer duration and lower credit quality, although an uptick in default rates posed added risks for high-yield corporate bonds. International bond markets produced mixed returns, with emerging-markets issues advancing over their developed-markets counterparts.
The market volatility of recent years reminds us of the constant need for experienced and steadfast portfolio management in the face of uncertainty. New York Life Investments remains dedicated to providing you, as a valued MainStay VP investor, with the guidance, resources and investment solutions you need to pursue your financial goals.
Thank you for trusting us to help meet your investment needs.
Sincerely,
Kirk C. Lehneis
President
The opinions expressed are as of the date of this report and are subject to change. There is no guarantee that any forecast made will come to pass. This material does not constitute investment advice and is not intended as an endorsement of any specific investment. Past performance is no guarantee of future results.
Not part of the Annual Report
Investors should refer to the Portfolio’s Summary Prospectus and/or Prospectus and consider the Portfolio’s investment objectives, strategies, risks, charges and expenses carefully before investing. The Summary Prospectus and/or Prospectus contain this and other information about the Portfolio. You may obtain copies of the Portfolio’s Summary Prospectus, Prospectus and Statement of Additional Information, which includes information about the MainStay VP Funds Trust's Trustees, free of charge, upon request, by calling toll-free 800-598-2019, by writing to New York Life Insurance and Annuity Corporation, 51 Madison Avenue, Room 251, New York, New York 10010 or by sending an email to MainStayShareholdersServices@nylim.com. These documents are also available at newyorklifeinvestments.com/investment-products/vp. Please read the Portfolio's Summary Prospectus and/or Prospectus carefully before investing. MainStay VP Funds Trust portfolios are separate account options which are purchased through a variable insurance or variable annuity contract.
Investment and Performance Comparison (Unaudited)
Performance data quoted represents past performance. Past performance is no guarantee of future results. Because of market volatility and other factors, current performance may be lower or higher than the figures shown. Investment return and principal value will fluctuate, and as a result, when shares are redeemed, they may be worth more or less than their original cost. The performance table and graph do not reflect any deduction of sales charges, mortality and expense charges, contract charges or administrative charges. Please refer to the Performance Summary appropriate for your policy. For performance information current to the most recent month-end, please call 800-598-2019 or visit www.newyorklife.com.
Performance figures may reflect certain fee waivers and/or expense limitations, without which total returns may have been different. For information on current fee waivers and/or expense limitations (if any), please refer to the Notes to Financial Statements.
| Average Annual Total Returns for the Year-Ended December 31, 2023 |
| Class | Inception
Date1 | One
Year | Five
Years | Ten
Years | Gross
Expense
Ratio2 |
| Initial Class Shares | 2/17/2012 | 24.39% | 12.95% | 8.73% | 0.67% |
| Service Class Shares | 2/17/2012 | 24.08 | 12.66 | 8.46 | 0.92 |
| 1. | Effective May 1, 2022, the Portfolio replaced its subadvisor, changed its investment objective and modified its principal investment strategies. The past performance in the graph and table prior to that date reflects the Portfolio's prior subadvisor and principal investment strategies. |
| 2. | The gross expense ratios presented reflect the Portfolio’s “Total Annual Portfolio Operating Expenses” from the most recent Prospectus and may differ from other expense ratios disclosed in this report. |
| Benchmark Performance* | One
Year | Five
Years | Ten
Years |
| S&P 500® Index1 | 26.29% | 15.69% | 12.03% |
| Morningstar Large Value Category Average2 | 11.63 | 11.37 | 8.39 |
| * | Returns for indices reflect no deductions for fees, expenses or taxes, except for foreign withholding taxes where applicable. Results assume reinvestment of all dividends and capital gains. An investment cannot be made directly in an index. |
| 1. | The S&P 500® Index is the Portfolio's primary broad-based securities market index for comparison purposes. The S&P 500® Index is widely regarded as the standard index for measuring large-cap U.S. stock market performance. |
| 2. | The Morningstar Large Value Category Average is representative of funds that invest primarily in big U.S. companies that are less expensive or growing more slowly than other large-cap stocks. Results are based on average total returns of similar funds with all dividends and capital gain distributions reinvested. |
Cost in Dollars of a $1,000 Investment in MainStay VP American Century Sustainable Equity Portfolio (Unaudited)
The example below is intended to describe the fees and expenses borne by shareholders during the six-month period from July 1, 2023 to December 31, 2023, and the impact of those costs on your investment.
Example
As a shareholder of the Portfolio you incur two types of costs: (1) transaction costs, including exchange fees and sales charges (loads) on purchases (as applicable), and (2) ongoing costs, including management fees, distribution and/or service (12b-1) fees and other Portfolio expenses (as applicable). This example is intended to help you understand your ongoing costs (in dollars) of investing in the Portfolio and to compare these costs with the ongoing costs of investing in other mutual funds. The example is based on an investment of $1,000 made at the beginning of the six-month period and held for the entire period from July 1, 2023 to December 31, 2023. Shares are only sold in connection with variable life and annuity contracts and the example does not reflect any contract level or transactional fees or expenses. If these costs had been included, your costs would have been higher.
This example illustrates your Portfolio’s ongoing costs in two ways:
Actual Expenses
The second and third data columns in the table below provide information about actual account values and actual expenses. You may use the information in these columns, together with the amount you invested, to estimate the expenses that you paid during the six months ended
December 31, 2023. Simply divide your account value by $1,000 (for example, an $8,600 account value divided by $1,000 = 8.6), then multiply the result by the number under the heading entitled “Expenses Paid During Period” to estimate the expenses you paid on your account during this period.
Hypothetical Example for Comparison Purposes
The fourth and fifth data columns in the table below provide information about hypothetical account values and hypothetical expenses based on the Portfolio’s actual expense ratio and an assumed rate of return of 5% per year before expenses, which is not the Portfolio’s actual return. The hypothetical account values and expenses may not be used to estimate the actual ending account balances or expenses you paid for the six-month period shown. You may use this information to compare the ongoing costs of investing in the Portfolio with the ongoing costs of investing in other mutual funds. To do so, compare this 5% hypothetical example with the 5% hypothetical examples that appear in the shareholder reports of the other mutual funds.
Please note that the expenses shown in the table are meant to highlight your ongoing costs only and do not reflect any transactional costs, such as exchange fees or sales charges (loads). Therefore, the fourth and fifth data columns of the table are useful in comparing ongoing costs only and will not help you determine the relative total costs of owning different funds. In addition, if these transactional costs were included, your costs would have been higher.
| Share Class | Beginning
Account
Value
7/1/23 | Ending Account
Value (Based
on Actual
Returns and
Expenses)
12/31/23 | Expenses
Paid
During
Period1 | Ending Account
Value (Based
on Hypothetical
5% Annualized
Return and
Actual Expenses)
12/31/23 | Expenses
Paid
During
Period1 | Net Expense
Ratio
During
Period2 |
| Initial Class Shares | $1,000.00 | $1,081.70 | $3.52 | $1,021.83 | $3.41 | 0.67% |
| Service Class Shares | $1,000.00 | $1,080.40 | $4.82 | $1,020.57 | $4.69 | 0.92% |
| 1. | Expenses are equal to the Portfolio’s annualized expense ratio of each class multiplied by the average account value over the period, divided by 365 and multiplied by 184 (to reflect the six-month period). The table above represents the actual expenses incurred during the six-month period. In addition to the fees and expenses which the Portfolio bears directly, it also indirectly bears a pro rata share of the fees and expenses of the underlying funds in which it invests. Such indirect expenses are not included in the above-reported expense figures. |
| 2. | Expenses are equal to the Portfolio's annualized expense ratio to reflect the six-month period. |
| 6 | MainStay VP American Century Sustainable Equity Portfolio |
Industry Composition as of December 31, 2023 (Unaudited)
| Software | 11.8% |
| Semiconductors & Semiconductor Equipment | 6.9 |
| Interactive Media & Services | 6.2 |
| Technology Hardware, Storage & Peripherals | 5.2 |
| Capital Markets | 4.7 |
| Pharmaceuticals | 3.7 |
| Specialty Retail | 3.6 |
| Banks | 3.2 |
| Life Sciences Tools & Services | 3.2 |
| Broadline Retail | 3.1 |
| Health Care Providers & Services | 3.0 |
| Financial Services | 2.9 |
| Consumer Staples Distribution & Retail | 2.9 |
| Oil, Gas & Consumable Fuels | 2.6 |
| Machinery | 2.4 |
| Biotechnology | 2.3 |
| Insurance | 2.2 |
| IT Services | 2.1 |
| Chemicals | 2.0 |
| Electronic Equipment, Instruments & Components | 2.0 |
| Industrial REITs | 1.8 |
| Building Products | 1.5 |
| Ground Transportation | 1.4 |
| Electric Utilities | 1.3 |
| Beverages | 1.3 |
| Automobiles | 1.2% |
| Electrical Equipment | 1.2 |
| Energy Equipment & Services | 1.2 |
| Household Products | 1.1 |
| Diversified Telecommunication Services | 1.1 |
| Communications Equipment | 1.1 |
| Air Freight & Logistics | 1.0 |
| Entertainment | 1.0 |
| Hotels, Restaurants & Leisure | 1.0 |
| Automobile Components | 0.8 |
| Industrial Conglomerates | 0.8 |
| Food Products | 0.8 |
| Health Care Equipment & Supplies | 0.7 |
| Specialized REITs | 0.6 |
| Distributors | 0.6 |
| Textiles, Apparel & Luxury Goods | 0.6 |
| Consumer Finance | 0.6 |
| Aerospace & Defense | 0.5 |
| Containers & Packaging | 0.5 |
| Exchange–Traded Fund | 0.1 |
| Short–Term Investments | 0.4 |
| Other Assets, Less Liabilities | –0.2 |
| | 100.0% |
See Portfolio of Investments beginning on page 10 for specific holdings within these categories. The Portfolio's holdings are subject to change.
Top Ten Holdings and/or Issuers Held as of December 31, 2023 (excluding short-term investments) (Unaudited)
| 1. | Microsoft Corp. |
| 2. | Apple, Inc. |
| 3. | Alphabet, Inc., Class A |
| 4. | NVIDIA Corp. |
| 5. | Amazon.com, Inc. |
| 6. | UnitedHealth Group, Inc. |
| 7. | Prologis, Inc. |
| 8. | Meta Platforms, Inc., Class A |
| 9. | Visa, Inc., Class A |
| 10. | Home Depot, Inc. (The) |
Portfolio Management Discussion and Analysis (Unaudited)
Answers to the questions reflect the views of Justin M. Brown, CFA, Joseph Reiland, CFA, and Robert J. Bove of American Century Investment Management, Inc. (“American Century”), the Portfolio’s Subadvisor.
How did MainStay VP American Century Sustainable Equity Portfolio perform relative to its benchmarks and peers during the 12 months ended December 31, 2023?
For the 12 months ended December 31, 2023, MainStay VP American Century Sustainable Equity Portfolio returned 24.39% for Initial Class shares and 24.08% for Service Class shares. Over the same period, both share classes underperformed the 26.29% return of the S&P 500® Index (“the Index”), which is the Portfolio’s primary benchmark. For the 12 months ended December 31, 2023, both share classes outperformed the 11.63% return of the Morningstar Large Value Category Average.1
What factors affected the Portfolio’s relative performance during the reporting period?
During the reporting period, the Portfolio underperformed the S&P 500® Index primarily as a result of stock selection.
Which sectors were the strongest positive contributors to the Portfolio’s relative performance, and which sectors were particularly weak?
The financials sector made the strongest positive contribution to the Portfolio’s performance relative to the Index, due to stock selection. (Contributions take weightings and total returns into account.) Stock selection in the consumer staples and health care sectors also contributed positively.
The consumer discretionary, industrials and communication services sectors detracted most significantly from relative performance, primarily as a result of stock selection.
During the reporting period, which individual stocks made the strongest positive contributions to the Portfolio’s absolute performance and which stocks detracted the most?
Top contributors to the Portfolio’s absolute performance during the reporting period included software and consumer electronics firm Microsoft, semiconductor manufacturer NVIDIA and consumer electronics company Apple.
Microsoft shares gained ground on solid earnings, driven by the strong performance of the company’s business segment and better expense management. The stock also benefited from the company’s strong position in artificial intelligence (AI), having taken an ownership stake in AI research firm OpenAI (ChatGPT’s parent), which is doing all of its model training on Microsoft’s cloud-computing system, Azure. NVIDIA exceeded earnings expectations and raised forward guidance based on demand for its graphics processing unit products for generative AI, which relies on NVIDIA for training models and inference (using the model to perform a function). Despite softness in revenues,
Apple’s profitability remained solid because of the company’s favorable product mix and superior execution.
Major detractors from absolute performance included electric utility NextEra Energy, pharmaceutical company Bristol-Myers Squibb, and retail pharmacy company and pharmacy benefit manager CVS Health.
NextEra shares lagged initially on rising interest rates. A sell-off of the stock occurred after an affiliated yield company cut its dividend growth expectations as a result of higher interest rates. This news sparked fear that a higher cost of capital would pressure returns and slow NextEra’s renewable project growth. Bristol-Myers Squibb's stock declined after a rival abandoned trials on a cardiovascular drug that is similar to one Bristol-Myers has in trials. In addition, Bristol-Myers’ medium-term earnings guidance disappointed. Although CVS reported solid financial results, shares fell sharply after insurer Blue Shield of California said it would drop CVS in favor of other pharmacy benefit managers, including Amazon.
Did the Portfolio make any significant purchases or sales during the reporting period?
The Portfolio initiated a position in Facebook’s parent company, Meta Platforms. The company became more disciplined with regard to spending, and reported strong revenue growth as digital advertising recovered. The Portfolio also initiated a position in oil & natural gas producer EOG Resources. We liked the company’s favorable financial position with a focus on low-cost production, its lack of net debt, its commitment to returning free cash flow to investors, and its relatively low carbon footprint.
During the same period, we eliminated the Portfolio’s position in medical device manufacturer Edwards Lifesciences. The company’s growth was negatively impacted by multiple factors, including hospital staffing shortages, which, along with a relatively high valuation, led us to exit the position. We also sold the Portfolio’s position in athletic shoe and apparel manufacturer Nike in response to deteriorating fundamentals due to weaker China demand and increasing competition, as well as the company’s less attractive sustainability profile.
How did the Portfolio’s sector weightings change during the reporting period?
The Portfolio’s allocation variations relative to the Index are fairly narrow, generally within a percentage point. During the reporting period, the largest shifts in the Portfolio’s allocations—a reduction in information technology and an increase in financials—were driven by an industry recategorization, which moved the digital payments and credit card processing networks industry group out of the information technology sector and into the financials sector.
| 1. | See "Investment and Performance Comparison" for more information on benchmark and peer group returns. |
| 8 | MainStay VP American Century Sustainable Equity Portfolio |
Due to the recategorization mentioned above, the Portfolio’s financials allocation shifted from an underweight position to an overweight position. During the reporting period, we also increased the Portfolio’s allocation to communication services, which remained modestly underweight. Despite the recategorization-driven reduction in information technology exposure, the Portfolio continued to hold an overweight position in the sector. We also reduced the Portfolio’s allocation to materials, which remained a slightly overweight position.
How was the Portfolio positioned at the end of the reporting period?
As of December 31, 2023, the Portfolio held its largest position relative to the Index in the financials sector, led by holdings in the capital markets and insurance industries, where we see companies benefiting from higher interest rates. As mentioned above, the change in the Portfolio’s relative weighting in the financials sector during the reporting period was driven primarily by the recategorization of a major industry group from technology to financials. The Portfolio also held overweight exposure to health care, where we favor health care, pharmaceuticals and biotechnology issues, which tend to be somewhat insulated from inflation and better positioned to hold up in a recession.
As of the same date, the Portfolio held underweight exposure to the utilities sector, reflecting a comparative lack of fundamental business opportunities. The Portfolio also held underweight exposure to the communication services sector, since many companies in the media and entertainment industries do not currently fit our investment process.
The opinions expressed are those of the portfolio managers as of the date of this report and are subject to change. There is no guarantee that any forecasts will come to pass. This material does not constitute investment advice and is not intended as an endorsement of any specific investment.
Not all MainStay VP Portfolios and/or share classes are available under all policies.
Portfolio of Investments December 31, 2023†^
| | Shares | Value |
| Common Stocks 99.7% |
| Aerospace & Defense 0.5% |
| Lockheed Martin Corp. | 4,814 | $ 2,181,897 |
| Air Freight & Logistics 1.0% |
| FedEx Corp. | 4,954 | 1,253,213 |
| United Parcel Service, Inc., Class B | 20,468 | 3,218,184 |
| | | 4,471,397 |
| Automobile Components 0.8% |
| Aptiv plc (a) | 40,369 | 3,621,907 |
| Automobiles 1.2% |
| Tesla, Inc. (a) | 21,193 | 5,266,037 |
| Banks 3.2% |
| Bank of America Corp. | 119,350 | 4,018,515 |
| JPMorgan Chase & Co. | 40,460 | 6,882,246 |
| Regions Financial Corp. | 159,566 | 3,092,389 |
| | | 13,993,150 |
| Beverages 1.3% |
| PepsiCo, Inc. | 32,779 | 5,567,185 |
| Biotechnology 2.3% |
| AbbVie, Inc. | 31,771 | 4,923,552 |
| Amgen, Inc. | 11,583 | 3,336,136 |
| Vertex Pharmaceuticals, Inc. (a) | 4,509 | 1,834,667 |
| | | 10,094,355 |
| Broadline Retail 3.1% |
| Amazon.com, Inc. (a) | 88,387 | 13,429,521 |
| Building Products 1.5% |
| Johnson Controls International plc | 71,021 | 4,093,650 |
| Masco Corp. | 34,377 | 2,302,572 |
| | | 6,396,222 |
| Capital Markets 4.7% |
| Ameriprise Financial, Inc. | 7,559 | 2,871,135 |
| BlackRock, Inc. | 4,642 | 3,768,376 |
| Intercontinental Exchange, Inc. | 17,407 | 2,235,581 |
| Morgan Stanley | 70,422 | 6,566,851 |
| S&P Global, Inc. | 11,182 | 4,925,895 |
| | | 20,367,838 |
| Chemicals 2.0% |
| Air Products and Chemicals, Inc. | 12,695 | 3,475,891 |
| | Shares | Value |
| |
| Chemicals (continued) |
| Ecolab, Inc. | 9,967 | $ 1,976,954 |
| Linde plc | 7,814 | 3,209,288 |
| | | 8,662,133 |
| Communications Equipment 1.1% |
| Cisco Systems, Inc. | 93,956 | 4,746,657 |
| Consumer Finance 0.6% |
| American Express Co. | 13,101 | 2,454,341 |
| Consumer Staples Distribution & Retail 2.9% |
| Costco Wholesale Corp. | 4,769 | 3,147,922 |
| Kroger Co. (The) | 53,849 | 2,461,438 |
| Sysco Corp. | 52,941 | 3,871,575 |
| Target Corp. | 21,094 | 3,004,207 |
| | | 12,485,142 |
| Containers & Packaging 0.5% |
| Ball Corp. | 35,213 | 2,025,452 |
| Distributors 0.6% |
| LKQ Corp. | 54,390 | 2,599,298 |
| Diversified Telecommunication Services 1.1% |
| Verizon Communications, Inc. | 126,792 | 4,780,058 |
| Electric Utilities 1.3% |
| NextEra Energy, Inc. | 96,149 | 5,840,090 |
| Electrical Equipment 1.2% |
| Eaton Corp. plc | 18,781 | 4,522,841 |
| Generac Holdings, Inc. (a) | 4,322 | 558,575 |
| | | 5,081,416 |
| Electronic Equipment, Instruments & Components 2.0% |
| CDW Corp. | 19,134 | 4,349,541 |
| Keysight Technologies, Inc. (a) | 26,591 | 4,230,362 |
| | | 8,579,903 |
| Energy Equipment & Services 1.2% |
| Schlumberger NV | 97,049 | 5,050,430 |
| Entertainment 1.0% |
| Electronic Arts, Inc. | 11,796 | 1,613,811 |
| Liberty Media Corp.-Liberty Formula One, Class C (a) | 12,805 | 808,380 |
The notes to the financial statements are an integral part of, and should be read in conjunction with, the financial statements.
| 10 | MainStay VP American Century Sustainable Equity Portfolio |
| | Shares | Value |
| Common Stocks (continued) |
| Entertainment (continued) |
| Walt Disney Co. (The) (a) | 20,098 | $ 1,814,648 |
| | | 4,236,839 |
| Financial Services 2.9% |
| Block, Inc. (a) | 5,752 | 444,917 |
| Mastercard, Inc., Class A | 10,456 | 4,459,589 |
| Visa, Inc., Class A (b) | 29,769 | 7,750,359 |
| | | 12,654,865 |
| Food Products 0.8% |
| Mondelez International, Inc., Class A | 45,389 | 3,287,525 |
| Ground Transportation 1.4% |
| Uber Technologies, Inc. (a) | 33,561 | 2,066,351 |
| Union Pacific Corp. | 16,358 | 4,017,852 |
| | | 6,084,203 |
| Health Care Equipment & Supplies 0.7% |
| Dexcom, Inc. (a) | 6,559 | 813,907 |
| Intuitive Surgical, Inc. (a) | 7,223 | 2,436,751 |
| | | 3,250,658 |
| Health Care Providers & Services 3.0% |
| Cigna Group (The) | 14,659 | 4,389,638 |
| CVS Health Corp. | 7,888 | 622,836 |
| UnitedHealth Group, Inc. | 15,555 | 8,189,241 |
| | | 13,201,715 |
| Hotels, Restaurants & Leisure 1.0% |
| Airbnb, Inc., Class A (a) | 7,170 | 976,124 |
| Chipotle Mexican Grill, Inc. (a) | 496 | 1,134,332 |
| Starbucks Corp. | 21,149 | 2,030,515 |
| | | 4,140,971 |
| Household Products 1.1% |
| Colgate-Palmolive Co. | 15,183 | 1,210,237 |
| Procter & Gamble Co. (The) | 25,319 | 3,710,246 |
| | | 4,920,483 |
| Industrial Conglomerates 0.8% |
| Honeywell International, Inc. | 16,846 | 3,532,775 |
| Industrial REITs 1.8% |
| Prologis, Inc. | 59,105 | 7,878,697 |
| Insurance 2.2% |
| Marsh & McLennan Cos., Inc. | 16,826 | 3,188,022 |
| | Shares | Value |
| |
| Insurance (continued) |
| MetLife, Inc. | 26,621 | $ 1,760,447 |
| Prudential Financial, Inc. | 26,479 | 2,746,137 |
| Travelers Cos., Inc. (The) | 10,164 | 1,936,140 |
| | | 9,630,746 |
| Interactive Media & Services 6.2% |
| Alphabet, Inc., Class A (a) | 136,859 | 19,117,834 |
| Meta Platforms, Inc., Class A (a) | 22,169 | 7,846,939 |
| | | 26,964,773 |
| IT Services 2.1% |
| Accenture plc, Class A | 14,137 | 4,960,815 |
| International Business Machines Corp. | 26,807 | 4,384,285 |
| | | 9,345,100 |
| Life Sciences Tools & Services 3.2% |
| Agilent Technologies, Inc. | 32,836 | 4,565,189 |
| Danaher Corp. | 19,128 | 4,425,071 |
| Thermo Fisher Scientific, Inc. | 9,407 | 4,993,142 |
| | | 13,983,402 |
| Machinery 2.4% |
| Cummins, Inc. | 12,840 | 3,076,079 |
| Deere & Co. | 5,376 | 2,149,701 |
| Parker-Hannifin Corp. | 5,943 | 2,737,940 |
| Xylem, Inc. | 21,348 | 2,441,357 |
| | | 10,405,077 |
| Oil, Gas & Consumable Fuels 2.6% |
| ConocoPhillips | 52,889 | 6,138,826 |
| EOG Resources, Inc. | 42,716 | 5,166,500 |
| | | 11,305,326 |
| Pharmaceuticals 3.7% |
| Bristol-Myers Squibb Co. | 57,221 | 2,936,009 |
| Eli Lilly & Co. | 4,054 | 2,363,158 |
| Merck & Co., Inc. | 37,478 | 4,085,852 |
| Novo Nordisk A/S, Class B | 29,408 | 3,040,225 |
| Zoetis, Inc. | 18,190 | 3,590,160 |
| | | 16,015,404 |
| Semiconductors & Semiconductor Equipment 6.9% |
| Advanced Micro Devices, Inc. (a) | 41,391 | 6,101,447 |
| Analog Devices, Inc. | 23,107 | 4,588,126 |
| Applied Materials, Inc. | 22,489 | 3,644,792 |
| ASML Holding NV | 1,673 | 1,259,038 |
| GlobalFoundries, Inc. (a)(b) | 14,802 | 897,001 |
| NVIDIA Corp. | 27,288 | 13,513,563 |
| | | 30,003,967 |
The notes to the financial statements are an integral part of, and should be read in conjunction with, the financial statements.
11
Portfolio of Investments December 31, 2023†^ (continued)
| | Shares | Value |
| Common Stocks (continued) |
| Software 11.8% |
| Adobe, Inc. (a) | 2,502 | $ 1,492,693 |
| Cadence Design Systems, Inc. (a) | 14,542 | 3,960,805 |
| Microsoft Corp. | 100,821 | 37,912,729 |
| Salesforce, Inc. (a) | 19,311 | 5,081,496 |
| ServiceNow, Inc. (a) | 1,768 | 1,249,074 |
| Workday, Inc., Class A (a) | 6,246 | 1,724,271 |
| | | 51,421,068 |
| Specialized REITs 0.6% |
| Equinix, Inc. | 3,231 | 2,602,215 |
| Specialty Retail 3.6% |
| CarMax, Inc. (a) | 19,551 | 1,500,344 |
| Home Depot, Inc. (The) | 21,299 | 7,381,168 |
| TJX Cos., Inc. (The) | 47,711 | 4,475,769 |
| Tractor Supply Co. | 9,752 | 2,096,973 |
| | | 15,454,254 |
| Technology Hardware, Storage & Peripherals 5.2% |
| Apple, Inc. | 117,592 | 22,639,988 |
| Textiles, Apparel & Luxury Goods 0.6% |
| Deckers Outdoor Corp. (a) | 3,717 | 2,484,554 |
Total Common Stocks
(Cost $382,119,775) | | 433,139,034 |
| Exchange-Traded Fund 0.1% |
| SPDR S&P 500 ETF Trust | 1,122 | 533,298 |
Total Exchange-Traded Fund
(Cost $530,095) | | 533,298 |
| | Shares | | Value |
| Short-Term Investments 0.4% |
| Affiliated Investment Company 0.2% |
| MainStay U.S. Government Liquidity Fund, 5.235% (c) | 905,596 | | $ 905,596 |
| Unaffiliated Investment Company 0.2% |
| Invesco Government & Agency Portfolio, 5.361% (c)(d) | 899,270 | | 899,270 |
Total Short-Term Investments
(Cost $1,804,866) | | | 1,804,866 |
Total Investments
(Cost $384,454,736) | 100.2% | | 435,477,198 |
| Other Assets, Less Liabilities | (0.2) | | (1,017,828) |
| Net Assets | 100.0% | | $ 434,459,370 |
| † | Percentages indicated are based on Portfolio net assets. |
| ^ | Industry classifications may be different than those used for compliance monitoring purposes. |
| (a) | Non-income producing security. |
| (b) | All or a portion of this security was held on loan. As of December 31, 2023, the aggregate market value of securities on loan was $1,082,987; the total market value of collateral held by the Portfolio was $1,169,781. The market value of the collateral held included non-cash collateral in the form of U.S. Treasury securities with a value of $270,511. The Portfolio received cash collateral with a value of $899,270. (See Note 2(J)) |
| (c) | Current yield as of December 31, 2023. |
| (d) | Represents a security purchased with cash collateral received for securities on loan. |
Investments in Affiliates (in 000's)
Investments in issuers considered to be affiliate(s) of the Portfolio during the year ended December 31, 2023 for purposes of Section 2(a)(3) of the Investment Company Act of 1940, as amended, were as follows:
| Affiliated Investment Companies | Value,
Beginning
of Year | Purchases
at Cost | Proceeds
from
Sales | Net
Realized
Gain/(Loss)
on Sales | Change in
Unrealized
Appreciation/
(Depreciation) | Value,
End of
Year | Dividend
Income | Other
Distributions | Shares
End of
Year |
| MainStay U.S. Government Liquidity Fund | $ 467 | $ 53,374 | $ (52,935) | $ — | $ — | $ 906 | $ 34 | $ — | 906 |
The notes to the financial statements are an integral part of, and should be read in conjunction with, the financial statements.
| 12 | MainStay VP American Century Sustainable Equity Portfolio |
Foreign Currency Forward Contracts
As of December 31, 2023, the Portfolio held the following foreign currency forward contracts1:
| Currency Purchased | Currency Sold | Counterparty | Settlement
Date | Unrealized
Appreciation
(Depreciation) |
| USD | 354,830 | EUR | 323,374 | Bank of America N.A. | 3/28/24 | $ (3,391) |
| USD | 354,893 | EUR | 323,374 | JPMorgan Chase Bank N.A. | 3/28/24 | (3,327) |
| USD | 354,893 | EUR | 323,374 | Morgan Stanley & Co. | 3/28/24 | (3,327) |
| Total Unrealized Depreciation | $ (10,045) |
| 1. | Foreign Currency Forward Contracts are subject to limitations such that they cannot be “sold or repurchased,” although the Portfolio would be able to exit the transaction through other means, such as through the execution of an offsetting transaction. |
| Abbreviation(s): |
| ETF—Exchange-Traded Fund |
| EUR—Euro |
| REIT—Real Estate Investment Trust |
| SPDR—Standard & Poor’s Depositary Receipt |
| USD—United States Dollar |
The following is a summary of the fair valuations according to the inputs used as of December 31, 2023, for valuing the Portfolio’s assets and liabilities:
| Description | Quoted
Prices in
Active
Markets for
Identical
Assets
(Level 1) | | Significant
Other
Observable
Inputs
(Level 2) | | Significant
Unobservable
Inputs
(Level 3) | | Total |
| Asset Valuation Inputs | | | | | | | |
| Investments in Securities (a) | | | | | | | |
| Common Stocks | $ 433,139,034 | | $ — | | $ — | | $ 433,139,034 |
| Exchange-Traded Fund | 533,298 | | — | | — | | 533,298 |
| Short-Term Investments | | | | | | | |
| Affiliated Investment Company | 905,596 | | — | | — | | 905,596 |
| Unaffiliated Investment Company | 899,270 | | — | | — | | 899,270 |
| Total Short-Term Investments | 1,804,866 | | — | | — | | 1,804,866 |
| Total Investments in Securities | $ 435,477,198 | | $ — | | $ — | | $ 435,477,198 |
| Liability Valuation Inputs | | | | | | | |
| Other Financial Instruments | | | | | | | |
| Foreign Currency Forward Contracts (b) | $ — | | $ (10,045) | | $ — | | $ (10,045) |
| (a) | For a complete listing of investments and their industries, see the Portfolio of Investments. |
| (b) | The value listed for these securities reflects unrealized appreciation (depreciation) as shown on the Portfolio of Investments. |
The notes to the financial statements are an integral part of, and should be read in conjunction with, the financial statements.
13
Statement of Assets and Liabilities as of December 31, 2023
| Assets |
Investment in unaffiliated securities, at value
(identified cost $383,549,140) including securities on loan of $1,082,987 | $434,571,602 |
Investment in affiliated investment companies, at value
(identified cost $905,596) | 905,596 |
Cash denominated in foreign currencies
(identified cost $15) | 15 |
| Receivables: | |
| Dividends | 354,206 |
| Portfolio shares sold | 49,932 |
| Securities lending | 443 |
| Other assets | 4,068 |
| Total assets | 435,885,862 |
| Liabilities |
| Cash collateral received for securities on loan | 899,270 |
| Due to custodian | 1,200 |
| Payables: | |
| Manager (See Note 3) | 231,547 |
| Portfolio shares redeemed | 162,208 |
| Professional fees | 47,427 |
| NYLIFE Distributors (See Note 3) | 36,529 |
| Shareholder communication | 23,896 |
| Custodian | 10,678 |
| Accrued expenses | 3,692 |
| Unrealized depreciation on foreign currency forward contracts | 10,045 |
| Total liabilities | 1,426,492 |
| Net assets | $434,459,370 |
| Composition of Net Assets |
| Shares of beneficial interest outstanding (par value of $.001 per share) unlimited number of shares authorized | $ 48,684 |
| Additional paid-in-capital | 370,178,299 |
| | 370,226,983 |
| Total distributable earnings (loss) | 64,232,387 |
| Net assets | $434,459,370 |
| Initial Class | |
| Net assets applicable to outstanding shares | $260,343,871 |
| Shares of beneficial interest outstanding | 29,119,791 |
| Net asset value per share outstanding | $ 8.94 |
| Service Class | |
| Net assets applicable to outstanding shares | $174,115,499 |
| Shares of beneficial interest outstanding | 19,564,195 |
| Net asset value per share outstanding | $ 8.90 |
The notes to the financial statements are an integral part of, and should be read in conjunction with, the financial statements.
| 14 | MainStay VP American Century Sustainable Equity Portfolio |
Statement of Operations for the year ended December 31, 2023
| Investment Income (Loss) |
| Income | |
| Dividends-unaffiliated (net of foreign tax withholding of $9,746) | $ 7,446,348 |
| Dividends-affiliated | 33,866 |
| Securities lending, net | 15,645 |
| Total income | 7,495,859 |
| Expenses | |
| Manager (See Note 3) | 2,840,782 |
| Distribution/Service—Service Class (See Note 3) | 432,476 |
| Professional fees | 101,442 |
| Shareholder communication | 35,665 |
| Custodian | 25,896 |
| Trustees | 11,723 |
| Miscellaneous | 9,580 |
| Total expenses | 3,457,564 |
| Net investment income (loss) | 4,038,295 |
| Realized and Unrealized Gain (Loss) |
| Net realized gain (loss) on: | |
| Unaffiliated investment transactions | 9,837,383 |
| Futures transactions | (78,896) |
| Foreign currency transactions | 1,649 |
| Foreign currency forward transactions | 12,155 |
| Net realized gain (loss) | 9,772,291 |
| Net change in unrealized appreciation (depreciation) on: | |
| Unaffiliated investments | 84,416,236 |
| Foreign currency forward contracts | 4,286 |
| Translation of other assets and liabilities in foreign currencies | 2,119 |
| Net change in unrealized appreciation (depreciation) | 84,422,641 |
| Net realized and unrealized gain (loss) | 94,194,932 |
| Net increase (decrease) in net assets resulting from operations | $98,233,227 |
The notes to the financial statements are an integral part of, and should be read in conjunction with, the financial statements.
15
Statements of Changes in Net Assets
for the years ended December 31, 2023 and December 31, 2022
| | 2023 | 2022 |
| Increase (Decrease) in Net Assets |
| Operations: | | |
| Net investment income (loss) | $ 4,038,295 | $ 4,673,156 |
| Net realized gain (loss) | 9,772,291 | 145,834,961 |
| Net change in unrealized appreciation (depreciation) | 84,422,641 | (190,246,775) |
| Net increase (decrease) in net assets resulting from operations | 98,233,227 | (39,738,658) |
| Distributions to shareholders: | | |
| Initial Class | (88,591,811) | (38,151,110) |
| Service Class | (57,869,790) | (23,305,146) |
| Total distributions to shareholders | (146,461,601) | (61,456,256) |
| Capital share transactions: | | |
| Net proceeds from sales of shares | 12,120,830 | 21,588,692 |
| Net asset value of shares issued to shareholders in reinvestment of distributions | 146,461,601 | 61,456,256 |
| Cost of shares redeemed | (130,462,666) | (80,669,845) |
| Increase (decrease) in net assets derived from capital share transactions | 28,119,765 | 2,375,103 |
| Net increase (decrease) in net assets | (20,108,609) | (98,819,811) |
| Net Assets |
| Beginning of year | 454,567,979 | 553,387,790 |
| End of year | $ 434,459,370 | $ 454,567,979 |
The notes to the financial statements are an integral part of, and should be read in conjunction with, the financial statements.
| 16 | MainStay VP American Century Sustainable Equity Portfolio |
Financial Highlights selected per share data and ratios
| | Year Ended December 31, |
| Initial Class | 2023 | | 2022 | | 2021 | | 2020 | | 2019 |
| Net asset value at beginning of year | $ 11.07 | | $ 13.93 | | $ 11.56 | | $ 12.89 | | $ 11.39 |
| Net investment income (loss) (a) | 0.11 | | 0.13 | | 0.21 | | 0.25 | | 0.29 |
| Net realized and unrealized gain (loss) | 2.14 | | (1.30) | | 2.71 | | (0.33) | | 2.58 |
| Total from investment operations | 2.25 | | (1.17) | | 2.92 | | (0.08) | | 2.87 |
| Less distributions: | | | | | | | | | |
| From net investment income | (0.17) | | (0.23) | | (0.34) | | (0.40) | | (0.31) |
| From net realized gain on investments | (4.21) | | (1.46) | | (0.21) | | (0.85) | | (1.06) |
| Total distributions | (4.38) | | (1.69) | | (0.55) | | (1.25) | | (1.37) |
| Net asset value at end of year | $ 8.94 | | $ 11.07 | | $ 13.93 | | $ 11.56 | | $ 12.89 |
| Total investment return (b) | 24.39% | | (7.70)% | | 25.49% | | 0.96% | | 26.36%(c) |
| Ratios (to average net assets)/Supplemental Data: | | | | | | | | | |
| Net investment income (loss) | 0.99% | | 1.03% | | 1.57% | | 2.32% | | 2.30% |
| Net expenses (d) | 0.67% | | 0.70% | | 0.76% | | 0.76% | | 0.75% |
| Portfolio turnover rate | 28% | | 20% | | 18% | | 28% | | 16% |
| Net assets at end of year (in 000's) | $ 260,344 | | $ 281,471 | | $ 324,378 | | $ 302,584 | | $ 464,120 |
| (a) | Per share data based on average shares outstanding during the year. |
| (b) | Total return does not reflect any deduction of sales charges, mortality and expense charges, contract charges or administrative charges. For periods of less than one year, total return is not annualized. |
| (c) | In 2019, the Portfolio’s total investment return includes impact of payments from affiliates due to trade communications error. Excluding these items, total return would have been 26.36%. |
| (d) | In addition to the fees and expenses which the Portfolio bears directly, it also indirectly bears a pro-rata share of the fees and expenses of the underlying funds in which it invests. Such indirect expenses are not included in the above expense ratios. |
| | Year Ended December 31, |
| Service Class | 2023 | | 2022 | | 2021 | | 2020 | | 2019 |
| Net asset value at beginning of year | $ 11.03 | | $ 13.87 | | $ 11.51 | | $ 12.83 | | $ 11.34 |
| Net investment income (loss) (a) | 0.08 | | 0.10 | | 0.17 | | 0.22 | | 0.26 |
| Net realized and unrealized gain (loss) | 2.13 | | (1.29) | | 2.71 | | (0.33) | | 2.56 |
| Total from investment operations | 2.21 | | (1.19) | | 2.88 | | (0.11) | | 2.82 |
| Less distributions: | | | | | | | | | |
| From net investment income | (0.13) | | (0.19) | | (0.31) | | (0.36) | | (0.27) |
| From net realized gain on investments | (4.21) | | (1.46) | | (0.21) | | (0.85) | | (1.06) |
| Total distributions | (4.34) | | (1.65) | | (0.52) | | (1.21) | | (1.33) |
| Net asset value at end of year | $ 8.90 | | $ 11.03 | | $ 13.87 | | $ 11.51 | | $ 12.83 |
| Total investment return (b) | 24.08% | | (7.93)% | | 25.18% | | 0.71% | | 26.04%(c) |
| Ratios (to average net assets)/Supplemental Data: | | | | | | | | | |
| Net investment income (loss) | 0.74% | | 0.79% | | 1.32% | | 2.05% | | 2.05% |
| Net expenses (d) | 0.92% | | 0.95% | | 1.01% | | 1.01% | | 1.00% |
| Portfolio turnover rate | 28% | | 20% | | 18% | | 28% | | 16% |
| Net assets at end of year (in 000's) | $ 174,115 | | $ 173,097 | | $ 229,010 | | $ 226,836 | | $ 262,717 |
| (a) | Per share data based on average shares outstanding during the year. |
| (b) | Total return does not reflect any deduction of sales charges, mortality and expense charges, contract charges or administrative charges. For periods of less than one year, total return is not annualized. |
| (c) | In 2019, the Portfolio’s total investment return includes impact of payments from affiliates due to trade communications error. Excluding these items, total return would have been 26.04%. |
| (d) | In addition to the fees and expenses which the Portfolio bears directly, it also indirectly bears a pro-rata share of the fees and expenses of the underlying funds in which it invests. Such indirect expenses are not included in the above expense ratios. |
The notes to the financial statements are an integral part of, and should be read in conjunction with, the financial statements.
17
Notes to Financial Statements
Note 1–Organization and Business
MainStay VP Funds Trust (the “Fund”) was organized as a Delaware statutory trust on February 1, 2011. The Fund is registered under the Investment Company Act of 1940, as amended (the “1940 Act”), as an open-end management investment company. The Fund is comprised of thirty-one separate series (collectively referred to as the “Portfolios”). These financial statements and notes relate to the MainStay VP American Century Sustainable Equity Portfolio (formerly known as MainStay VP T. Rowe Price Equity Income Portfolio) (the "Portfolio"), a "diversified” portfolio, as that term is defined in the 1940 Act, as interpreted or modified by regulatory authorities having jurisdiction, from time to time.
Shares of the Portfolio are currently offered to certain separate accounts to fund variable annuity policies and variable universal life insurance policies issued by New York Life Insurance and Annuity Corporation (“NYLIAC”), a wholly-owned subsidiary of New York Life Insurance Company (“New York Life”) and may also be offered to fund variable annuity policies and variable universal life insurance policies issued by other insurance companies. NYLIAC allocates shares of the Portfolio to, among others, certain NYLIAC separate accounts. Shares of the Portfolio are also offered to the MainStay VP Conservative Allocation Portfolio, MainStay VP Moderate Allocation Portfolio, MainStay VP Growth Allocation Portfolio and MainStay VP Equity Allocation Portfolio, which operate as “funds-of-funds," and other variable insurance funds.
The following table lists the Portfolio's share classes that have been registered and commenced operations:
| Class | Commenced Operations |
| Initial Class | February 17, 2012 |
| Service Class | February 17, 2012 |
Shares of the Portfolio are offered and are redeemed at a price equal to their respective net asset value (“NAV”) per share. No sales or redemption charge is applicable to the purchase or redemption of the Portfolio's shares. Under the terms of the Fund’s multiple class plan, adopted pursuant to Rule 18f-3 under the 1940 Act, the classes differ in that, among other things, Service Class shares of the Portfolio pay a combined distribution and service fee of 0.25% of average daily net assets attributable to Service Class shares of the Portfolio to the Distributor (as defined in Note 3(B)) pursuant to a plan adopted in accordance with Rule 12b-1 under the 1940 Act. Contract owners of variable annuity contracts purchased after June 2, 2003, are permitted to invest only in the Service Class shares.
The Portfolio's investment objective is to seek a high level of dividend income and long-term capital growth primarily through investments in stocks.
Note 2–Significant Accounting Policies
The Portfolio is an investment company and accordingly follows the investment company accounting and reporting guidance of the Financial Accounting Standards Board (“FASB”) Accounting Standards Codification
Topic 946 Financial Services—Investment Companies. The Portfolio prepares its financial statements in accordance with generally accepted accounting principles (“GAAP”) in the United States of America and follows the significant accounting policies described below.
(A) Securities Valuation. Investments are usually valued as of the close of regular trading on the New York Stock Exchange (the "Exchange") (usually 4:00 p.m. Eastern time) on each day the Portfolio is open for business ("valuation date").
Pursuant to Rule 2a-5 under the 1940 Act, the Board of Trustees of the Fund (the "Board") has designated New York Life Investment Management LLC (“New York Life Investments” or the "Manager") as its Valuation Designee (the "Valuation Designee"). The Valuation Designee is responsible for performing fair valuations relating to all investments in the Portfolio’s portfolio for which market quotations are not readily available; periodically assessing and managing material valuation risks; establishing and applying fair value methodologies; testing fair valuation methodologies; evaluating and overseeing pricing services; ensuring appropriate segregation of valuation and portfolio management functions; providing quarterly, annual and prompt reporting to the Board, as appropriate; identifying potential conflicts of interest; and maintaining appropriate records. The Valuation Designee has established a valuation committee ("Valuation Committee") to assist in carrying out the Valuation Designee’s responsibilities and establish prices of securities for which market quotations are not readily available. The Portfolio's and the Valuation Designee's policies and procedures ("Valuation Procedures") govern the Valuation Designee’s selection and application of methodologies for determining and calculating the fair value of Portfolio investments. The Valuation Designee may value the Portfolio's portfolio securities for which market quotations are not readily available and other Portfolio assets utilizing inputs from pricing services and other third-party sources. The Valuation Committee meets (in person, via electronic mail or via teleconference) on an ad-hoc basis to determine fair valuations and on a quarterly basis to review fair value events with respect to certain securities for which market quotations are not readily available, including valuation risks and back-testing results, and to preview reports to the Board.
The Valuation Committee establishes prices of securities for which market quotations are not readily available based on such methodologies and measurements on a regular basis after considering information that is reasonably available and deemed relevant by the Valuation Committee. The Board shall oversee the Valuation Designee and review fair valuation materials on a prompt, quarterly and annual basis and approve proposed revisions to the Valuation Procedures.
Investments for which market quotations are not readily available are valued at fair value as determined in good faith pursuant to the Valuation Procedures. A market quotation is readily available only when that quotation is a quoted price (unadjusted) in active markets for identical investments that the Portfolio can access at the measurement date, provided that a quotation will not be readily available if it is not reliable. "Fair value" is defined as the price the Portfolio would reasonably expect
| 18 | MainStay VP American Century Sustainable Equity Portfolio |
to receive upon selling an asset or liability in an orderly transaction to an independent buyer in the principal or most advantageous market for the asset or liability. Fair value measurements are determined within a framework that establishes a three-tier hierarchy that maximizes the use of observable market data and minimizes the use of unobservable inputs to establish a classification of fair value measurements for disclosure purposes. "Inputs" refer broadly to the assumptions that market participants would use in pricing the asset or liability, including assumptions about risk, such as the risk inherent in a particular valuation technique used to measure fair value using a pricing model and/or the risk inherent in the inputs for the valuation technique. Inputs may be observable or unobservable. Observable inputs reflect the assumptions market participants would use in pricing the asset or liability based on market data obtained from sources independent of the Portfolio. Unobservable inputs reflect the Portfolio’s own assumptions about the assumptions market participants would use in pricing the asset or liability based on the information available. The inputs or methodology used for valuing assets or liabilities may not be an indication of the risks associated with investing in those assets or liabilities. The three-tier hierarchy of inputs is summarized below.
| • | Level 1—quoted prices (unadjusted) in active markets for an identical asset or liability |
| • | Level 2—other significant observable inputs (including quoted prices for a similar asset or liability in active markets, interest rates and yield curves, prepayment speeds, credit risk, etc.) |
| • | Level 3—significant unobservable inputs (including the Portfolio's own assumptions about the assumptions that market participants would use in measuring fair value of an asset or liability) |
The level of an asset or liability within the fair value hierarchy is based on the lowest level of an input, both individually and in the aggregate, that is significant to the fair value measurement. The aggregate value by input level of the Portfolio’s assets and liabilities as of December 31, 2023, is included at the end of the Portfolio of Investments.
The Portfolio may use third-party vendor evaluations, whose prices may be derived from one or more of the following standard inputs, among others:
| • Benchmark yields | • Reported trades |
| • Broker/dealer quotes | • Issuer spreads |
| • Two-sided markets | • Benchmark securities |
| • Bids/offers | • Reference data (corporate actions or material event notices) |
| • Industry and economic events | • Comparable bonds |
| • Monthly payment information | |
An asset or liability for which a market quotation is not readily available is valued by methods deemed reasonable in good faith by the Valuation Committee, following the Valuation Procedures to represent fair value. Under these procedures, the Valuation Designee generally uses a market-based approach which may use related or comparable assets or
liabilities, recent transactions, market multiples, book values and other relevant information. The Valuation Designee may also use an income-based valuation approach in which the anticipated future cash flows of the asset or liability are discounted to calculate fair value. Discounts may also be applied due to the nature and/or duration of any restrictions on the disposition of the asset or liability. Fair value represents a good faith approximation of the value of a security. Fair value determinations involve the consideration of a number of subjective factors, an analysis of applicable facts and circumstances and the exercise of judgment. As a result, it is possible that the fair value for a security determined in good faith in accordance with the Valuation Procedures may differ from valuations for the same security determined for other funds using their own valuation procedures. Although the Valuation Procedures are designed to value a security at the price the Portfolio may reasonably expect to receive upon the security's sale in an orderly transaction, there can be no assurance that any fair value determination thereunder would, in fact, approximate the amount that the Portfolio would actually realize upon the sale of the security or the price at which the security would trade if a reliable market price were readily available. During the year ended December 31, 2023, there were no material changes to the fair value methodologies.
Securities which may be valued in this manner include, but are not limited to: (i) a security for which trading has been halted or suspended or otherwise does not have a readily available market quotation on a given day; (ii) a debt security that has recently gone into default and for which there is not a current market quotation; (iii) a security of an issuer that has entered into a restructuring; (iv) a security that has been delisted from a national exchange; (v) a security subject to trading collars for which no or limited trading takes place; and (vi) a security whose principal market has been temporarily closed at a time when, under normal conditions, it would be open. Securities valued in this manner are generally categorized as Level 2 or 3 in the hierarchy.
Equity securities, rights and warrants, if applicable, are valued at the last quoted sales prices as of the close of regular trading on the relevant exchange on each valuation date. Securities that are not traded on the valuation date are valued at the mean of the last quoted bid and ask prices. Prices are normally taken from the principal market in which each security trades. These securities are generally categorized as Level 1 in the hierarchy.
Exchange-traded funds (“ETFs”) are valued at the last quoted sales prices as of the close of regular trading on the relevant exchange on each valuation date. Securities that are not traded on the valuation date are valued at the mean of the last quoted bid and ask prices. Prices are normally taken from the principal market in which each security trades. These securities are generally categorized as Level 1 in the hierarchy.
Investments in mutual funds, including money market funds, are valued at their respective NAVs at the close of business each day on the valuation date. These securities are generally categorized as Level 1 in the hierarchy.
Notes to Financial Statements (continued)
Foreign currency forward contracts are valued at their fair market values measured on the basis of the mean between the last current bid and ask prices based on dealer or exchange quotations and are generally categorized as Level 2 in the hierarchy.
Temporary cash investments acquired in excess of 60 days to maturity at the time of purchase are valued using the latest bid prices or using valuations based on a matrix system (which considers such factors as security prices, yields, maturities and ratings), both as furnished by independent pricing services. Temporary cash investments that mature in 60 days or less at the time of purchase ("Short-Term Investments") are valued using the amortized cost method of valuation, unless the use of such method would be inappropriate. The amortized cost method involves valuing a security at its cost on the date of purchase and thereafter assuming a constant amortization to maturity of the difference between such cost and the value on maturity date. Amortized cost approximates the current fair value of a security. Securities valued using the amortized cost method are not valued using quoted prices in an active market and are generally categorized as Level 2 in the hierarchy.
The information above is not intended to reflect an exhaustive list of the methodologies that may be used to value portfolio investments. The Valuation Procedures permit the use of a variety of valuation methodologies in connection with valuing portfolio investments. The methodology used for a specific type of investment may vary based on the market data available or other considerations. The methodologies summarized above may not represent the specific means by which portfolio investments are valued on any particular business day.
(B) Income Taxes. The Portfolio's policy is to comply with the requirements of the Internal Revenue Code of 1986, as amended (the “Internal Revenue Code”), applicable to regulated investment companies and to distribute all of its taxable income to the shareholders of the Portfolio within the allowable time limits.
The Manager evaluates the Portfolio’s tax positions to determine if the tax positions taken meet the minimum recognition threshold in connection with accounting for uncertainties in income tax positions taken or expected to be taken for the purposes of measuring and recognizing tax liabilities in the financial statements. Recognition of tax benefits of an uncertain tax position is permitted only to the extent the position is “more likely than not” to be sustained assuming examination by taxing authorities. The Manager analyzed the Portfolio's tax positions taken on federal, state and local income tax returns for all open tax years (for up to three tax years) and has concluded that no provisions for federal, state and local income tax are required in the Portfolio's financial statements. The Portfolio's federal, state and local income tax and federal excise tax returns for tax years for which the applicable statutes of limitations have not expired are subject to examination by the Internal Revenue Service and state and local departments of revenue.
(C) Dividends and Distributions to Shareholders. Dividends and distributions are recorded on the ex-dividend date. The Portfolio intends to declare and pay dividends from net investment income and
distributions from net realized capital and currency gains, if any, at least annually. All dividends and distributions are reinvested at NAV in the same class of shares of the Portfolio. Dividends and distributions to shareholders are determined in accordance with federal income tax regulations and may differ from determinations using GAAP.
(D) Security Transactions and Investment Income. The Portfolio records security transactions on the trade date. Realized gains and losses on security transactions are determined using the identified cost method. Dividend income is recognized on the ex-dividend date, net of any foreign tax withheld at the source, and interest income is accrued as earned using the effective interest rate method and includes any realized gains and losses from repayments of principal on mortgage-backed securities. Distributions received from real estate investment trusts may be classified as dividends, capital gains and/or return of capital. Discounts and premiums on securities purchased for the Portfolio are accreted and amortized, respectively, on the effective interest rate method.
Investment income and realized and unrealized gains and losses on investments of the Portfolio are allocated pro rata to the separate classes of shares based upon their relative net assets on the date the income is earned or realized and unrealized gains and losses are incurred.
(E) Expenses. Expenses of the Fund are allocated to the individual Portfolios in proportion to the net assets of the respective Portfolios when the expenses are incurred, except where direct allocations of expenses can be made. Expenses (other than fees incurred under the distribution and service plans, further discussed in Note 3(B), which are charged directly to the Service Class shares) are allocated to separate classes of shares pro rata based upon their relative net assets on the date the expenses are incurred. The expenses borne by the Portfolio, including those of related parties to the Portfolio, are shown in the Statement of Operations.
Additionally, the Portfolio may invest in mutual funds, which are subject to management fees and other fees that may cause the costs of investing in mutual funds to be greater than the costs of owning the underlying securities directly. These indirect expenses of mutual funds are not included in the amounts shown as expenses in the Statement of Operations or in the expense ratios included in the Financial Highlights.
(F) Use of Estimates. In preparing financial statements in conformity with GAAP, the Manager makes estimates and assumptions that affect the reported amounts and disclosures in the financial statements. Actual results could differ from those estimates and assumptions.
(G) Futures Contracts. A futures contract is an agreement to purchase or sell a specified quantity of an underlying instrument at a specified future date and price, or to make or receive a cash payment based on the value of a financial instrument (e.g., foreign currency, interest rate, security or securities index). The Portfolio is subject to risks such as market price risk, leverage risk, liquidity risk, counterparty risk, operational risk, legal risk and/or interest rate risk in the normal course of investing in these contracts. Upon entering into a futures contract, the Portfolio is required to pledge to the broker or futures commission
| 20 | MainStay VP American Century Sustainable Equity Portfolio |
merchant an amount of cash and/or U.S. government securities equal to a certain percentage of the collateral amount, known as the “initial margin.” During the period the futures contract is open, changes in the value of the contract are recognized as unrealized appreciation or depreciation by marking to market such contract on a daily basis to reflect the market value of the contract at the end of each day’s trading. The Portfolio agrees to receive from or pay to the broker or futures commission merchant an amount of cash equal to the daily fluctuation in the value of the contract. Such receipts or payments are known as “variation margin.” When the futures contract is closed, the Portfolio records a realized gain or loss equal to the difference between the proceeds from (or cost of) the closing transaction and the Portfolio's basis in the contract.
The use of futures contracts involves, to varying degrees, elements of market risk in excess of the amount recognized in the Statement of Assets and Liabilities. The contract or notional amounts and variation margin reflect the extent of the Portfolio's involvement in open futures positions. There are several risks associated with the use of futures contracts as hedging techniques. There can be no assurance that a liquid market will exist at the time when the Portfolio seeks to close out a futures contract. If no liquid market exists, the Portfolio would remain obligated to meet margin requirements until the position is closed. Futures contracts may involve a small initial investment relative to the risk assumed, which could result in losses greater than if the Portfolio did not invest in futures contracts. Futures contracts may be more volatile than direct investments in the instrument underlying the futures and may not correlate to the underlying instrument, causing a given hedge not to achieve its objectives. The Portfolio's activities in futures contracts have minimal counterparty risk as they are conducted through regulated exchanges that guarantee the futures against default by the counterparty. In the event of a bankruptcy or insolvency of a futures commission merchant that holds margin on behalf of the Portfolio, the Portfolio may not be entitled to the return of the entire margin owed to the Portfolio, potentially resulting in a loss. The Portfolio may invest in futures contracts to seek enhanced returns or to reduce the risk of loss by hedging certain of its holdings. The Portfolio's investment in futures contracts and other derivatives may increase the volatility of the Portfolio's NAVs and may result in a loss to the Portfolio.
(H) Foreign Currency Forward Contracts. The Portfolio may enter into foreign currency forward contracts, which are agreements to buy or sell foreign currencies on a specified future date at a specified rate. The Portfolio is subject to foreign currency exchange rate risk in the normal course of investing in these transactions. During the period the forward contract is open, changes in the value of the contract are recognized as unrealized appreciation or depreciation by marking to market such contract on a daily basis to reflect the market value of the contract at the end of each day’s trading. Cash movement occurs on the settlement date. When the forward contract is closed, the Portfolio records a realized gain or loss equal to the difference between the proceeds from (or cost of) the closing transaction and the Portfolio's basis in the contract. The Portfolio may purchase and sell foreign currency forward contracts for purposes of
seeking to enhance portfolio returns and manage portfolio risk more efficiently. Foreign currency forward contracts may also be used to gain exposure to a particular currency or to hedge against the risk of loss due to changing currency exchange rates. Foreign currency forward contracts to purchase or sell a foreign currency may also be used in anticipation of future purchases or sales of securities denominated in foreign currency, even if the specific investments have not yet been selected.
The use of foreign currency forward contracts involves, to varying degrees, elements of risk in excess of the amount recognized in the Statement of Assets and Liabilities, including counterparty risk, market risk, leverage risk, operational risk, legal risk and liquidity risk. Counterparty risk is heightened for these instruments because foreign currency forward contracts are not exchange-traded and therefore no clearinghouse or exchange stands ready to meet the obligations under such contracts. Thus, the Portfolio faces the risk that its counterparties under such contracts may not perform their obligations. Market risk is the risk that the value of a foreign currency forward contract will depreciate due to unfavorable changes in exchange rates. Liquidity risk arises because the secondary market for foreign currency forward contracts may have less liquidity relative to markets for other securities and financial instruments. Liquidity risk also can arise when forward currency contracts create margin or settlement payment obligations for the Portfolio. Leverage risk is the risk that a foreign currency forward contract can magnify the Portfolio's gains and losses. Operational risk refers to risk related to potential operational issues (including documentation issues, settlement issues, systems failures, inadequate controls and human error), and legal risk refers to insufficient documentation, insufficient capacity or authority of the counterparty, or legality or enforceability of a foreign currency forward contract. Risks also arise from the possible movements in the foreign exchange rates underlying these instruments. While the Portfolio may enter into forward contracts to reduce currency exchange risks, changes in currency exchange rates may result in poorer overall performance for the Portfolio than if it had not engaged in such transactions. Exchange rate movements can be large, depending on the currency, and can last for extended periods of time, affecting the value of the Portfolio's assets. Moreover, there may be an imperfect correlation between the Portfolio's holdings of securities denominated in a particular currency and forward contracts entered into by the Portfolio. Such imperfect correlation may prevent the Portfolio from achieving the intended hedge or expose the Portfolio to the risk of currency exchange loss. The unrealized appreciation (depreciation) on forward contracts also reflects the Portfolio's exposure at the valuation date to credit loss in the event of a counterparty’s failure to perform its obligations.
(I) Foreign Currency Transactions. The Portfolio's books and records are maintained in U.S. dollars. Prices of securities denominated in foreign currency amounts are translated into U.S. dollars at the mean
Notes to Financial Statements (continued)
between the buying and selling rates last quoted by any major U.S. bank at the following dates:
(i) market value of investment securities, other assets and liabilities— at the valuation date; and
(ii) purchases and sales of investment securities, income and expenses—at the date of such transactions.
The assets and liabilities that are denominated in foreign currency amounts are presented at the exchange rates and market values at the close of the period. The realized and unrealized changes in net assets arising from fluctuations in exchange rates and market prices of securities are not separately presented.
Net realized gain (loss) on foreign currency transactions represents net currency gains or losses realized as a result of differences between the amounts of securities sale proceeds or purchase cost, dividends, interest and withholding taxes as recorded on the Portfolio's books, and the U.S. dollar equivalent amount actually received or paid. Net currency gains or losses from valuing such foreign currency denominated assets and liabilities, other than investments at valuation date exchange rates, are reflected in unrealized foreign exchange gains or losses.
(J) Securities Lending. In order to realize additional income, the Portfolio may engage in securities lending, subject to the limitations set forth in the 1940 Act and relevant guidance by the staff of the Securities and Exchange Commission (“SEC”). If the Portfolio engages in securities lending, the Portfolio will lend through its custodian, JPMorgan Chase Bank, N.A., ("JPMorgan"), acting as securities lending agent on behalf of the Portfolio. Under the current arrangement, JPMorgan will manage the Portfolio's collateral in accordance with the securities lending agency agreement between the Portfolio and JPMorgan, and indemnify the Portfolio against counterparty risk. The loans will be collateralized by cash (which may be invested in a money market fund) and/or non-cash collateral (which may include U.S. Treasury securities and/or U.S. government agency securities issued or guaranteed by the United States government or its agencies or instrumentalities) at least equal at all times to the market value of the securities loaned. Non-cash collateral held at year end is segregated and cannot be transferred by the Portfolio. The Portfolio bears the risk of delay in recovery of, or loss of rights in, the securities loaned. The Portfolio may also record a realized gain or loss on securities deemed sold due to a borrower’s inability to return securities on loan. The Portfolio bears the risk of any loss on investment of cash collateral. The Portfolio will receive compensation for lending its securities in the form of fees or it will retain a portion of interest earned on the investment of any cash collateral. The Portfolio will also continue to receive interest and dividends on the securities loaned and any gain or loss in the market price of the securities loaned that may occur during the term of the loan will be for the account of the Portfolio. Income earned from securities lending activities, if any, is reflected in the Statement of Operations.
(K) Securities Risk. The ability of issuers of debt securities held by the Portfolio to meet their obligations may be affected by, among other things, economic or political developments in a specific country, industry or region. Debt securities are also subject to the risks associated with changes in interest rates.
Convertible securities may be subordinate to other securities. In part, the total return for a convertible security depends upon the performance of the underlying stock into which it can be converted. Also, issuers of convertible securities are often not as strong financially as those issuing securities with higher credit ratings, are more likely to encounter financial difficulties and typically are more vulnerable to changes in the economy, such as a recession or a sustained period of rising interest rates, which could affect their ability to make interest and principal payments.
The Portfolio invests in foreign securities, which carry certain risks that are in addition to the usual risks inherent in domestic securities. These risks include those resulting from currency fluctuations, future adverse political or economic developments and possible imposition of currency exchange blockages or other foreign governmental laws or restrictions. These risks are likely to be greater in emerging markets than in developed markets. The ability of issuers of securities held by the Portfolio to meet their obligations may be affected by, among other things, economic or political developments in a specific country, industry or region.
(L) Indemnifications. Under the Fund’s organizational documents, its officers and trustees are indemnified against certain liabilities that may arise out of performance of their duties to the Fund. Additionally, in the normal course of business, the Portfolio enters into contracts with third-party service providers that contain a variety of representations and warranties and that may provide general indemnifications. The Portfolio's maximum exposure under these arrangements is unknown, as this would involve future claims that may be made against the Portfolio that have not yet occurred. The Manager believes that the risk of loss in connection with these potential indemnification obligations is remote. However, there can be no assurance that material liabilities related to such obligations will not arise in the future, which could adversely impact the Portfolio.
(M) Quantitative Disclosure of Derivative Holdings. The following tables show additional disclosures related to the Portfolio's derivative and hedging activities, including how such activities are accounted for and their effect on the Portfolio's financial positions, performance and cash flows.
The Portfolio entered into futures contracts to manage its exposure to the securities markets or to movements in interest rates and currency values.
The Portfolio entered into foreign currency forward contracts to hedge currency risk due its exposure in foreign securities.
| 22 | MainStay VP American Century Sustainable Equity Portfolio |
Fair value of derivative instruments as of December 31, 2023:
| Liability Derivatives | Foreign
Exchange
Contracts
Risk | Total |
| Forward Contracts - Unrealized depreciation on foreign currency forward contracts | $(10,045) | $(10,045) |
| Total Fair Value | $(10,045) | $(10,045) |
The effect of derivative instruments on the Statement of Operations for the year ended December 31, 2023:
| Net Realized Gain (Loss) from: | Foreign
Exchange
Contracts
Risk | Equity
Contracts
Risk | Total |
| Futures Transactions | $ — | $(78,896) | $(78,896) |
| Forward Transactions | 12,155 | — | 12,155 |
| Total Net Realized Gain (Loss) | $12,155 | $(78,896) | $(66,741) |
| Net Change in Unrealized Appreciation (Depreciation) | Foreign
Exchange
Contracts
Risk | Total |
| Forward Contracts | $4,286 | $4,286 |
| Total Net Change in Unrealized Appreciation (Depreciation) | $4,286 | $4,286 |
| Average Notional Amount | Total |
| Forward Contracts Long (a) | $ 611,174 |
| Forward Contracts Short | $(2,677,936) |
| (a) | Positions were open for nine months during the reporting period. |
Note 3–Fees and Related Party Transactions
(A) Manager and Subadvisor. New York Life Investments, a registered investment adviser and an indirect, wholly-owned subsidiary of New York Life, serves as the Portfolio’s Manager pursuant to an Amended and Restated Management Agreement (“Management Agreement”). The Manager provides offices, conducts clerical, recordkeeping and bookkeeping services, and keeps most of the financial and accounting records required to be maintained by the Portfolio. Except for the portion of salaries and expenses that are the responsibility of the Portfolio, the Manager pays the salaries and expenses of all personnel affiliated with the Portfolio and certain operational expenses of the Portfolio. The Portfolio reimburses New York Life Investments in an amount equal to the portion of the compensation of the Chief Compliance Officer attributable to the Portfolio. American Century Investment Management, Inc. ("American Century" or the "Subadvisor"), a registered investment adviser, serves as the Subadvisor to the Portfolio and is responsible for the day-to-day portfolio management of the Portfolio. Pursuant to the terms of a Subadvisory Agreement between New York Life Investments and American Century, New York Life Investments pays for the services of the Subadvisor.
Pursuant to the Management Agreement, the Portfolio pays the Manager a monthly fee for the services performed and the facilities furnished at an annual rate of the Portfolio’s average daily net assets as follows: 0.63% up to $500 million; 0.61% from $500 million to $1 billion; and 0.585% in excess of $1 billion. During the year ended December 31, 2023, the effective management fee rate was 0.63% of the Portfolio's average daily net assets.
During the year ended December 31, 2023, New York Life Investments earned fees from the Portfolio in the amount of $2,840,782 and paid the Subadvisor fees in the amount of $992,019.
JPMorgan provides sub-administration and sub-accounting services to the Portfolio pursuant to an agreement with New York Life Investments. These services include calculating the daily NAVs of the Portfolio, maintaining the general ledger and sub-ledger accounts for the calculation of the Portfolio's NAVs, and assisting New York Life Investments in conducting various aspects of the Portfolio's administrative operations. For providing these services to the Portfolio, JPMorgan is compensated by New York Life Investments.
Pursuant to an agreement between the Fund and New York Life Investments, New York Life Investments is responsible for providing or procuring certain regulatory reporting services for the Portfolio. The Portfolio will reimburse New York Life Investments for the actual costs incurred by New York Life Investments in connection with providing or procuring these services for the Portfolio.
(B) Distribution and Service Fees. The Fund, on behalf of the Portfolio, has entered into a distribution agreement with NYLIFE Distributors LLC (the “Distributor”), an affiliate of New York Life Investments. The Portfolio has adopted a distribution plan (the “Plan”) in accordance with the provisions of Rule 12b-1 under the 1940 Act. Under the Plan, the Distributor has agreed to provide, through its affiliates or independent third parties, various distribution-related, shareholder and administrative support services to the Service Class shareholders. For its services, the Distributor is entitled to a combined distribution and service fee accrued daily and paid monthly at an annual rate of 0.25% of the average daily net assets attributable to the Service Class shares of the Portfolio.
Note 4-Federal Income Tax
As of December 31, 2023, the cost and unrealized appreciation (depreciation) of the Portfolio’s investment portfolio, including applicable derivative contracts and other financial instruments, as determined on a federal income tax basis, were as follows:
| | Federal Tax
Cost | Gross
Unrealized
Appreciation | Gross
Unrealized
(Depreciation) | Net
Unrealized
Appreciation/
(Depreciation) |
| Investments in Securities | $385,776,126 | $65,071,441 | $(15,370,369) | $49,701,072 |
Notes to Financial Statements (continued)
As of December 31, 2023, the components of accumulated gain (loss) on a tax basis were as follows:
Ordinary
Income | Accumulated
Capital
and Other
Gain (Loss) | Other
Temporary
Differences | Unrealized
Appreciation
(Depreciation) | Total
Accumulated
Gain (Loss) |
| $4,040,429 | $10,492,653 | $— | $49,699,305 | $64,232,387 |
The difference between book-basis and tax-basis unrealized appreciation (depreciation) is primarily due to wash sale adjustments.
During the years ended December 31, 2023 and December 31, 2022, the tax character of distributions paid as reflected in the Statements of Changes in Net Assets was as follows:
| | 2023 | 2022 |
| Distributions paid from: | | |
| Ordinary Income | $ 5,052,058 | $13,654,316 |
| Long-Term Capital Gains | 141,409,543 | 47,801,940 |
| Total | $146,461,601 | $61,456,256 |
Note 5–Custodian
JPMorgan is the custodian of cash and securities held by the Portfolio. Custodial fees are charged to the Portfolio based on the Portfolio's net assets and/or the market value of securities held by the Portfolio and the number of certain transactions incurred by the Portfolio.
Note 6–Line of Credit
The Portfolio and certain other funds managed by New York Life Investments maintain a line of credit with a syndicate of banks in order to secure a source of funds for temporary purposes to meet unanticipated or excessive redemption requests.
Effective July 25, 2023, under the credit agreement (the “Credit Agreement”), the aggregate commitment amount is $600,000,000 with an additional uncommitted amount of $100,000,000. The commitment fee is an annual rate of 0.15% of the average commitment amount payable quarterly, regardless of usage, to JPMorgan, who serves as the agent to the syndicate. The commitment fee is allocated among the Portfolio and certain other funds managed by New York Life Investments based upon their respective net assets and other factors. Interest on any revolving credit loan is charged based upon the Federal Funds Rate, Daily Simple Secured Overnight Financing Rate ("SOFR") + 0.10%, or the Overnight Bank Funding Rate, whichever is higher. The Credit Agreement expires on July 23, 2024, although the Portfolio, certain other funds managed by New York Life Investments and the syndicate of banks may renew the Credit Agreement for an additional year on the same or different terms or enter into a credit agreement with a different syndicate of banks. Prior to July 25, 2023, the aggregate commitment amount and the commitment fee were the same as those under the current Credit Agreement. During the year ended December 31, 2023, there were no
borrowings made or outstanding with respect to the Portfolio under the Credit Agreement.
Note 7–Interfund Lending Program
Pursuant to an exemptive order issued by the SEC, the Portfolio, along with certain other funds managed by New York Life Investments, may participate in an interfund lending program. The interfund lending program provides an alternative credit facility that permits the Portfolio and certain other funds managed by New York Life Investments to lend or borrow money for temporary purposes directly to or from one another, subject to the conditions of the exemptive order. During the year ended December 31, 2023, there were no interfund loans made or outstanding with respect to the Portfolio.
Note 8–Purchases and Sales of Securities (in 000’s)
During the year ended December 31, 2023, purchases and sales of securities, other than short-term securities, were $124,117 and $238,480, respectively.
Note 9–Capital Share Transactions
Transactions in capital shares for the years ended December 31, 2023 and December 31, 2022, were as follows:
| Initial Class | Shares | Amount |
| Year ended December 31, 2023: | | |
| Shares sold | 193,775 | $ 2,200,917 |
| Shares issued to shareholders in reinvestment of distributions | 10,919,197 | 88,591,811 |
| Shares redeemed | (7,425,754) | (84,155,536) |
| Net increase (decrease) | 3,687,218 | $ 6,637,192 |
| Year ended December 31, 2022: | | |
| Shares sold | 1,253,742 | $ 16,610,052 |
| Shares issued to shareholders in reinvestment of distributions | 3,651,418 | 38,151,110 |
| Shares redeemed | (2,760,864) | (35,999,613) |
| Net increase (decrease) | 2,144,296 | $ 18,761,549 |
| |
| Service Class | Shares | Amount |
| Year ended December 31, 2023: | | |
| Shares sold | 943,390 | $ 9,919,913 |
| Shares issued to shareholders in reinvestment of distributions | 7,161,393 | 57,869,790 |
| Shares redeemed | (4,237,815) | (46,307,130) |
| Net increase (decrease) | 3,866,968 | $ 21,482,573 |
| Year ended December 31, 2022: | | |
| Shares sold | 397,512 | $ 4,978,640 |
| Shares issued to shareholders in reinvestment of distributions | 2,237,437 | 23,305,146 |
| Shares redeemed | (3,446,787) | (44,670,232) |
| Net increase (decrease) | (811,838) | $(16,386,446) |
| 24 | MainStay VP American Century Sustainable Equity Portfolio |
Note 10–Other Matters
As of the date of this report, the Portfolio faces a heightened level of risk associated with current uncertainty, volatility and state of economies, financial markets, rising interest rates, and labor and health conditions around the world. Events such as war, acts of terrorism, recessions, rapid inflation, the imposition of international sanctions, earthquakes, hurricanes, epidemics and pandemics and other unforeseen natural or human disasters may have broad adverse social, political and economic effects on the global economy, which could negatively impact the value of the Portfolio's investments. Developments that disrupt global economies and financial markets may magnify factors that affect the Portfolio's performance.
Note 11–Subsequent Events
In connection with the preparation of the financial statements of the Portfolio as of and for the year ended December 31, 2023, events and transactions subsequent to December 31, 2023, through the date the financial statements were issued, have been evaluated by the Manager for possible adjustment and/or disclosure. No subsequent events requiring financial statement adjustment or disclosure have been identified.
Report of Independent Registered Public Accounting Firm
To the Board of Trustees of MainStay VP Funds Trust and Shareholders of MainStay VP American Century Sustainable Equity Portfolio
Opinion on the Financial Statements
We have audited the accompanying statement of assets and liabilities, including the portfolio of investments, of MainStay VP American Century Sustainable Equity Portfolio (one of the portfolios constituting MainStay VP Funds Trust, referred to hereafter as the “Portfolio”) as of December 31, 2023, the related statement of operations for the year ended December 31, 2023, the statements of changes in net assets for each of the two years in the period ended December 31, 2023, including the related notes, and the financial highlights for each of the five years in the period ended December 31, 2023 (collectively referred to as the “financial statements”). In our opinion, the financial statements present fairly, in all material respects, the financial position of the Portfolio as of December 31, 2023, the results of its operations for the year then ended, the changes in its net assets for each of the two years in the period ended December 31, 2023 and the financial highlights for each of the five years in the period ended December 31, 2023 in conformity with accounting principles generally accepted in the United States of America.
Basis for Opinion
These financial statements are the responsibility of the Portfolio’s management. Our responsibility is to express an opinion on the Portfolio’s financial statements based on our audits. We are a public accounting firm registered with the Public Company Accounting Oversight Board (United States) (PCAOB) and are required to be independent with respect to the Portfolio in accordance with the U.S. federal securities laws and the applicable rules and regulations of the Securities and Exchange Commission and the PCAOB.
We conducted our audits of these financial statements in accordance with the standards of the PCAOB. Those standards require that we plan and perform the audit to obtain reasonable assurance about whether the financial statements are free of material misstatement, whether due to error or fraud.
Our audits included performing procedures to assess the risks of material misstatement of the financial statements, whether due to error or fraud, and performing procedures that respond to those risks. Such procedures included examining, on a test basis, evidence regarding the amounts and disclosures in the financial statements. Our audits also included evaluating the accounting principles used and significant estimates made by management, as well as evaluating the overall presentation of the financial statements. Our procedures included confirmation of securities owned as of December 31, 2023 by correspondence with the custodian, transfer agents and brokers. We believe that our audits provide a reasonable basis for our opinion.
/s/PricewaterhouseCoopers LLP
New York, New York
February 26, 2024
We have served as the auditor of one or more investment companies in the MainStay group of funds since 1984.
| 26 | MainStay VP American Century Sustainable Equity Portfolio |
Board Consideration and Approval of Management Agreement and Subadvisory Agreement (Unaudited)
The continuation of the Management Agreement with respect to the MainStay VP American Century Sustainable Equity Portfolio (“Portfolio”) and New York Life Investment Management LLC (“New York Life Investments”) and the Subadvisory Agreement between New York Life Investments and American Century Investment Management, Inc. (“American Century”) with respect to the Portfolio (together, “Advisory Agreements”) is subject to annual review and approval by the Board of Trustees of MainStay VP Funds Trust (“Board” of the “Trust”) in accordance with Section 15 of the Investment Company Act of 1940, as amended (“1940 Act”). At its December 6–7, 2023 meeting, the Board, including the Trustees who are not an “interested person” (as such term is defined in the 1940 Act) of the Trust (“Independent Trustees”) voting separately, unanimously approved the continuation of each of the Advisory Agreements for a one-year period.
In reaching the decision to approve the continuation of each of the Advisory Agreements, the Board considered information and materials furnished by New York Life Investments and American Century in connection with an annual contract review process undertaken by the Board that took place at meetings of the Board and its Contracts Committee from September 2023 through December 2023, including information and materials furnished by New York Life Investments and American Century in response to requests prepared on behalf of the Board, and in consultation with the Independent Trustees, by independent legal counsel to the Independent Trustees, which encompassed a variety of topics, including those summarized below. Information and materials requested by and furnished to the Board for consideration in connection with the contract review process included, among other items, reports on the Portfolio and “peer funds” prepared by Institutional Shareholder Services Inc. (“ISS”), an independent third-party service provider engaged by the Board to report objectively on the Portfolio’s investment performance, management fee and total expenses. The Board also considered information on the fees charged to other investment advisory clients of New York Life Investments and/or American Century that follow investment strategies similar to those of the Portfolio, if any, and, when applicable, the rationale for differences in the Portfolio’s management and subadvisory fees and the fees charged to those other investment advisory clients. In addition, the Board considered information regarding the legal standards and fiduciary obligations applicable to its consideration of the continuation of each of the Advisory Agreements. The contract review process, including the structure and format for information and materials provided to the Board, has been developed in consultation with the Board. The Independent Trustees also met in executive sessions with their independent legal counsel and, for portions thereof, with senior management of New York Life Investments.
The Board’s deliberations with respect to the continuation of each of the Advisory Agreements reflect a year-long process, and the Board also took into account information furnished to the Board and its Committees throughout the year, as deemed relevant and appropriate by the Trustees, including, among other items, reports on investment performance of the Portfolio and investment-related matters for the Portfolio as well as presentations from New York Life Investments and, generally annually,
American Century personnel. In addition, the Board took into account other information provided by New York Life Investments throughout the year, including, among other items, periodic reports on legal and compliance matters, risk management, portfolio turnover, brokerage commissions and non-advisory services provided to the Portfolio by New York Life Investments, as deemed relevant and appropriate by the Trustees.
In addition to information provided to the Board throughout the year, the Board received information in connection with its June 2023 meeting provided specifically in response to requests prepared on behalf of the Board, and in consultation with the Independent Trustees, by independent legal counsel to the Independent Trustees regarding the Portfolio’s distribution arrangements. In addition, the Board received information regarding the Portfolio’s asset levels, share purchase and redemption activity and the payment of Rule 12b-1 and/or certain other fees by the applicable share classes of the Portfolio, among other information.
In considering the continuation of each of the Advisory Agreements, the Trustees reviewed and evaluated the information and factors they believed to reasonably be necessary and appropriate in light of legal advice furnished to them by independent legal counsel to the Independent Trustees and through the exercise of their own business judgment. Although individual Trustees may have weighed certain factors or information differently and the Board did not consider any single factor or information controlling in reaching its decision, the factors that figured prominently in the Board’s consideration of the continuation of each of the Advisory Agreements are summarized in more detail below and include, among other factors: (i) the nature, extent and quality of the services provided to the Portfolio by New York Life Investments and American Century; (ii) the qualifications of the portfolio managers of the Portfolio and the historical investment performance of the Portfolio, New York Life Investments and American Century; (iii) the costs of the services provided, and profits realized, by New York Life Investments and American Century with respect to their relationships with the Portfolio; (iv) the extent to which economies of scale have been realized or may be realized if the Portfolio grows and the extent to which any economies of scale have been shared, have benefited or may benefit the Portfolio’s shareholders; and (v) the reasonableness of the Portfolio’s management and subadvisory fees and total ordinary operating expenses. Although the Board recognized that comparisons between the Portfolio’s fees and expenses and those of other funds are imprecise given different terms of agreements, variations in fund strategies and other factors, the Board considered the reasonableness of the Portfolio’s management fee and total ordinary operating expenses as compared to the peer funds identified by ISS. Throughout their considerations, the Trustees acknowledged the commitment of New York Life Investments and its affiliates to serve the MainStay Group of Funds, as well as their capacity, experience, resources, financial stability and reputations. The Trustees also acknowledged the entrepreneurial and other risks assumed by New York Life Investments in sponsoring and managing the Portfolio. With
Board Consideration and Approval of Management Agreement and Subadvisory Agreement (Unaudited) (continued)
respect to the Subadvisory Agreement, the Board took into account New York Life Investments’ recommendation to approve the continuation of the Subadvisory Agreement.
The Trustees noted that, throughout the year, the Trustees are afforded an opportunity to ask questions of, and request additional information or materials from, New York Life Investments and American Century. The Board’s decision with respect to each of the Advisory Agreements may have also been based, in part, on the Board’s knowledge of New York Life Investments and American Century resulting from, among other things, the Board’s consideration of each of the Advisory Agreements in prior years, the advisory agreements for other funds in the MainStay Group of Funds, the Board’s review throughout the year of the performance and operations of other funds in the MainStay Group of Funds and each Trustee’s business judgment and industry experience. In addition to considering the above-referenced factors, the Board observed that in the marketplace, notably under variable life insurance policies and variable annuity contracts for which the Portfolio serves as an investment option, there are a range of investment options available to investors and that the Portfolio’s shareholders, having had the opportunity to consider other investment options, have invested in the Portfolio.
The factors that figured prominently in the Board’s decision to approve the continuation of each of the Advisory Agreements during the Board’s December 6–7, 2023 meeting are summarized in more detail below.
Nature, Extent and Quality of Services Provided by New York Life Investments and American Century
The Board examined the nature, extent and quality of the services that New York Life Investments provides to the Portfolio. The Board evaluated New York Life Investments’ experience and capabilities in serving as manager of the Portfolio and considered that the Portfolio operates in a “manager-of-managers” structure. The Board also considered New York Life Investments’ responsibilities and services provided pursuant to this structure, including overseeing the services provided by American Century, evaluating the performance of American Century, making recommendations to the Board as to whether the Subadvisory Agreement should be renewed, modified or terminated and periodically reporting to the Board regarding the results of New York Life Investments’ evaluation and monitoring functions. The Board noted that New York Life Investments manages other mutual funds, serves a variety of other investment advisory clients, including other pooled investment vehicles, and has experience overseeing mutual fund service providers, including subadvisors. The Board considered the experience of senior personnel at New York Life Investments providing management and administrative and other non-advisory services to the Portfolio. The Board observed that New York Life Investments devotes significant resources and time to providing management and administrative and other non-advisory services to the Portfolio, including New York Life Investments’ oversight and due diligence reviews of American Century and ongoing analysis of, and interactions with, American Century with respect to, among other
things, the Portfolio’s investment performance and risks as well as American Century’s investment capabilities and subadvisory services with respect to the Portfolio.
The Board also considered the range of services that New York Life Investments provides to the Portfolio under the terms of the Management Agreement, including: (i) fund accounting and ongoing supervisory services provided by New York Life Investments’ Fund Administration and Accounting Group; (ii) investment supervisory and analytical services provided by New York Life Investments’ Investment Consulting Group; (iii) compliance services provided by the Trust’s Chief Compliance Officer as well as New York Life Investments’ compliance department, including supervision and implementation of the Portfolio’s compliance program; (iv) legal services provided by New York Life Investments’ Office of the General Counsel; and (v) risk management monitoring and analysis by compliance and investment personnel. In addition, the Board considered New York Life Investments’ willingness to invest in personnel and other resources, such as cyber security, information security and business continuity planning, that may benefit the Portfolio and noted that New York Life Investments is responsible for compensating the Trust’s officers, except for a portion of the salary of the Trust’s Chief Compliance Officer. The Board recognized that New York Life Investments provides certain other non-advisory services to the Portfolio and has over time provided an increasingly broad array of non-advisory services to the MainStay Group of Funds as a result of regulatory and other developments.
The Board also examined the range, and the nature, extent and quality, of the investment advisory services that American Century provides to the Portfolio and considered the terms of each of the Advisory Agreements. The Board evaluated American Century’s experience and performance in serving as subadvisor to the Portfolio and advising other portfolios and American Century’s track record and experience in providing investment advisory services as well as the experience of investment advisory, senior management and administrative personnel at American Century. The Board considered New York Life Investments’ and American Century’s overall resources, legal and compliance environment, capabilities, reputation, financial condition and history. In addition to information provided in connection with quarterly meetings with the Trust’s Chief Compliance Officer, the Board considered information regarding the compliance policies and procedures of New York Life Investments and American Century and acknowledged their commitment to further developing and strengthening compliance programs that may relate to the Portfolio. The Board also considered American Century’s ability to recruit and retain qualified investment professionals and willingness to invest in personnel and other resources that may benefit the Portfolio. In this regard, the Board considered the qualifications and experience of the Portfolio’s portfolio managers, the number of accounts managed by the portfolio managers and the method for compensating the portfolio managers.
In addition, the Board considered information provided by New York Life Investments and American Century regarding their respective business continuity and disaster recovery plans.
| 28 | MainStay VP American Century Sustainable Equity Portfolio |
Based on these considerations, among others, the Board concluded that the Portfolio would likely continue to benefit from the nature, extent and quality of these services.
Investment Performance
In evaluating the Portfolio’s investment performance, the Board considered investment performance results over various periods in light of the Portfolio’s investment objective, strategies and risks. The Board considered investment reports on, and analysis of, the Portfolio’s performance provided to the Board throughout the year. These reports include, among other items, information on the Portfolio’s gross and net returns, the Portfolio’s investment performance compared to a relevant investment category and the Portfolio’s benchmark, the Portfolio’s risk-adjusted investment performance and the Portfolio’s investment performance as compared to peer funds, as appropriate, as well as portfolio attribution information and commentary on the effect of market conditions. The Board also considered information provided by ISS showing the investment performance of the Portfolio as compared to peer funds. In addition, the Board reviewed the methodology used by ISS to construct the group of peer funds for comparative purposes.
The Board also took into account its discussions with senior management at New York Life Investments concerning the Portfolio’s investment performance over various periods as well as discussions between representatives of American Century and the members of the Board’s Investment Committee, which generally occur on an annual basis. In considering the investment performance of the Portfolio, the Board noted that the Portfolio underperformed its peer funds for the five- and ten-year periods ended July 31, 2023, and performed favorably relative to its peer funds for the one- and three-year periods ended July 31, 2023. The Board considered its discussions with representatives from New York Life Investments and American Century regarding the Portfolio’s investment performance.
Based on these considerations, among others, the Board concluded that its review of the Portfolio’s investment performance and related information supported a determination to approve the continuation of each of the Advisory Agreements.
Costs of the Services Provided, and Profits and Other Benefits Realized, by New York Life Investments and SA ABBR
The Board considered the costs of the services provided under each of the Advisory Agreements. The Board also considered the profitability of New York Life Investments and its affiliates and American Century due to their relationships with the Portfolio as well as by New York Life Investments and its affiliates due to their relationships with the MainStay Group of Funds. With respect to the profitability of American Century’s relationship with the Portfolio, the Board considered information from New York Life Investments that American Century’s subadvisory fee reflected an arm’s-length negotiation and that this fee is paid by New York Life Investments, not the Portfolio, and the relevance of American Century’s
profitability was considered by the Trustees in that context. On this basis, the Board primarily considered the costs and profitability for New York Life Investments and its affiliates with respect to the Portfolio.
In addition, the Board acknowledged the difficulty in obtaining reliable comparative data about mutual fund managers’ profitability because such information generally is not publicly available and may be impacted by numerous factors, including the structure of a fund manager’s organization, the types of funds it manages, the methodology used to allocate certain fixed costs to specific funds and the manager’s capital structure and costs of capital.
In evaluating the costs of the services provided by New York Life Investments and American Century, and profitability of New York Life Investments and its affiliates and American Century due to their relationships with the Portfolio, the Board considered, among other factors, New York Life Investments’ and its affiliates’ and American Century’s continuing investments in, or willingness to invest in, personnel and other resources that may support and further enhance the management of the Portfolio, and that New York Life Investments is responsible for paying the subadvisory fee for the Portfolio. The Board also considered the financial resources of New York Life Investments and American Century and acknowledged that New York Life Investments and American Century must be in a position to recruit and retain experienced professional personnel and to maintain a strong financial position for New York Life Investments and American Century to continue to provide high-quality services to the Portfolio. The Board recognized that the Portfolio benefits from the allocation of certain fixed costs among the funds in the MainStay Group of Funds, among other expected benefits resulting from its relationship with New York Life Investments.
The Board considered information regarding New York Life Investments’ methodology for calculating profitability and allocating costs provided by New York Life Investments in connection with the fund profitability analysis presented to the Board. The Board concluded that New York Life Investments’ methods for allocating costs and procedures for estimating overall profitability of the relationship with the funds in the MainStay Group of Funds were reasonable. The Board recognized the difficulty in calculating and evaluating a manager’s profitability with respect to the Portfolio and considered that other profitability methodologies may also be reasonable.
The Board also considered certain fall-out benefits that may be realized by New York Life Investments and its affiliates and American Century and its affiliates due to their relationships with the Portfolio, including reputational and other indirect benefits. The Board recognized, for example, the benefits to American Century from legally permitted “soft-dollar” arrangements by which brokers provide research and other services to American Century in exchange for commissions paid by the Portfolio with respect to trades in the Portfolio’s portfolio securities. In this regard, the Board also requested and considered information from New York Life Investments concerning other material business relationships between American Century and its affiliates and New York Life Investments and its affiliates that relates to certain current and future
Board Consideration and Approval of Management Agreement and Subadvisory Agreement (Unaudited) (continued)
products and represents a potential conflict of interest associated with New York Life Investments’ recommendation to approve the Subadvisory Agreement. In addition, the Board considered its review of the management agreement for a money market fund advised by New York Life Investments and an affiliated subadvisor that serves as an investment option for the Portfolio, including the potential rationale for and costs associated with investments in this money market fund by the Portfolio, if any, and considered information from New York Life Investments that the nature and type of specific investment advisory services provided to this money market fund are distinct from, or in addition to, the investment advisory services provided to the Portfolio. In addition, the Board considered the potential dividend received tax deduction for insurance company affiliates of New York Life Investments from the Portfolio’s securities lending activity.
The Board noted that the Portfolio serves as an investment option primarily under variable contracts issued by affiliates of New York Life Investments that would receive fees under those contracts. The Board observed that, in addition to fees earned by New York Life Investments under the Management Agreement for managing the Portfolio, New York Life Investments’ affiliates also earn revenues from serving the Portfolio in various other capacities, including as the Portfolio’s distributor, and insurance companies affiliated with New York Life Investments would be entitled to receive fees from the Portfolio under a distribution and service plan adopted pursuant to Rule 12b-1 under the 1940 Act. The Board considered information about these other revenues and their impact on the profitability of the relationship with the Portfolio to New York Life Investments and its affiliates. The Board noted that, although it assessed the overall profitability of the relationship with the Portfolio to New York Life Investments and its affiliates as part of the contract review process, when considering the reasonableness of the fee paid to New York Life Investments under the Management Agreement, the Board considered the profitability of New York Life Investments’ relationship with the Portfolio on a pre-tax basis and without regard to distribution expenses incurred by New York Life Investments from its own resources.
After evaluating the information deemed relevant by the Trustees, the Board concluded that any profits realized by New York Life Investments and its affiliates due to their relationships with the Portfolio were not excessive, other expected benefits that may accrue to New York Life Investments and its affiliates are reasonable and other expected benefits that may accrue to American Century and its affiliates are consistent with those expected for a subadvisor to a mutual fund. With respect to American Century, the Board considered that any profits realized by American Century due to its relationship with the Portfolio are the result of arm’s-length negotiations between New York Life Investments and American Century, acknowledging that any such profits are based on the subadvisory fee paid to American Century by New York Life Investments, not the Portfolio.
Management and Subadvisory Fees and Total Ordinary Operating Expenses
The Board evaluated the reasonableness of the fee paid under each of the Advisory Agreements and the Portfolio’s total ordinary operating expenses. With respect to the management fee and subadvisory fee, the Board primarily considered the reasonableness of the management fee paid by the Portfolio to New York Life Investments because the subadvisory fee paid to American Century is paid by New York Life Investments, not the Portfolio. The Board also considered the reasonableness of the subadvisory fee paid by New York Life Investments and the amount of the management fee retained by New York Life Investments.
In assessing the reasonableness of the Portfolio’s fees and expenses, the Board primarily considered comparative data provided by ISS on the fees and expenses of similar mutual funds managed by other investment advisers. The Board reviewed the methodology used by ISS to construct the group of peer funds for comparative purposes. In addition, the Board considered information provided by New York Life Investments and American Century on fees charged to other investment advisory clients, including institutional separate accounts and/or other funds, that follow investment strategies similar to those of the Portfolio, if any. The Board considered the contractual management fee schedule for the Portfolio as compared to those for such other investment advisory clients, taking into account the rationale for differences in fee schedules. The Board also took into account information provided by New York Life Investments about the more extensive scope of services provided to registered investment companies, such as the Portfolio, as compared with other investment advisory clients. Additionally, the Board considered the impact of contractual breakpoints and voluntary waivers on the Portfolio’s net management fee and expenses. The Board also considered that in proposing fees for the Portfolio, New York Life Investments considers the competitive marketplace for mutual funds.
Based on the factors outlined above, among other considerations, the Board concluded that the Portfolio’s management fee and total ordinary operating expenses are within a range that is competitive and support a conclusion that these fees and expenses are reasonable.
Economies of Scale
The Board considered information regarding economies of scale, including whether economies of scale may exist with respect to the Portfolio and whether the Portfolio’s management fee and expense structure permits any economies of scale to be appropriately shared with the Portfolio’s shareholders. The Board also considered a report from New York Life Investments, previously prepared at the request of the Board, that addressed economies of scale, including with respect to the mutual fund business generally, and the various ways in which the benefits of economies of scale may be shared with the funds in the MainStay Group of Funds. Although the Board recognized the difficulty of determining economies of scale with precision, the Board acknowledged that economies of scale may be shared with the Portfolio in a number of
| 30 | MainStay VP American Century Sustainable Equity Portfolio |
ways, including, for example, through the imposition of fee breakpoints, initially setting management fee rates at scale or making additional investments to enhance the services provided to the Portfolio. The Board reviewed information from New York Life Investments showing how the Portfolio’s management fee schedule compared to fee schedules of other funds and accounts managed by New York Life Investments. The Board also reviewed information from ISS showing how the Portfolio’s management fee schedule compared with fees paid for similar services by peer funds at varying asset levels.
Based on this information, the Board concluded that economies of scale are appropriately shared for the benefit of the Portfolio’s shareholders through the Portfolio’s management fee and expense structure and other methods to share benefits from economies of scale.
Conclusion
On the basis of the information and factors summarized above, among other information and factors deemed relevant by the Trustees, and the evaluation thereof, the Board, including the Independent Trustees voting separately, unanimously voted to approve the continuation of each of the Advisory Agreements.
Proxy Voting Policies and Procedures and Proxy Voting Record
The Portfolio is required to file with the SEC its proxy voting record for the 12-month period ending June 30 on Form N-PX. A description of the policies and procedures that are used to vote proxies relating to portfolio securities of the Portfolio is available free of charge upon request by calling 800-598-2019 or visiting the SEC's website at www.sec.gov. The most recent Form N-PX or proxy voting record is available free of charge upon request by calling 800-598-2019; visiting https://www.newyorklifeinvestments.com/investment-products/vp; or visiting the SEC’s website at www.sec.gov.
Shareholder Reports and Quarterly Portfolio Disclosure
The Portfolio is required to file its complete schedule of portfolio holdings with the SEC 60 days after its first and third fiscal quarter on Form N-PORT. The Portfolio's holdings report is available free of charge upon request by calling 800-598-2019 or by visiting the SEC’s website at www.sec.gov.
| 32 | MainStay VP American Century Sustainable Equity Portfolio |
Board of Trustees and Officers (Unaudited)
The Trustees and officers of the Portfolio are listed below. The Board oversees the MainStay Group of Funds (which consists of MainStay Funds and MainStay Funds Trust), MainStay VP Funds Trust, MainStay MacKay DefinedTerm Municipal Opportunities Fund, MainStay CBRE Global Infrastructure Megatrends Term Fund, the Manager and the Subadvisors, and elects the officers of the Portfolios who are responsible for the day-to-day operations of the Portfolio. Information pertaining to the Trustees and officers is set forth below. Each Trustee serves until his or her successor is elected and qualified or until his or her resignation,
death or removal. Under the Board’s retirement policy, unless an exception is made, a Trustee must tender his or her resignation by the end of the calendar year during which he or she reaches the age of 75. Officers are elected annually by the Board. The business address of each Trustee and officer listed below is 51 Madison Avenue, New York, New York 10010. A majority of the Trustees are not “interested persons” (as defined by the 1940 Act and rules adopted by the SEC thereunder) of the Portfolio (“Independent Trustees”).
| | Name and
Year of Birth | Term of Office,
Position(s) Held and
Length of Service | Principal Occupation(s)
During Past Five Years | Number of
Portfolios in
Fund Complex
Overseen by
Trustee | Other Directorships
Held by Trustee |
| | | | | | |
| | Naïm Abou-Jaoudé*
1966 | MainStay VP Funds Trust: Trustee since 2023 | Chief Executive Officer of New York Life Investment Management LLC (since 2023). Chief Executive Officer of Candriam (an affiliate of New York Life Investment Management LLC) (2007 to 2023). | 81 | MainStay Funds: Trustee since 2023 (11 Funds)
MainStay Funds Trust: Trustee since 2023 (37 Funds);
MainStay MacKay DefinedTerm Municipal Opportunities Fund: Trustee since 2023;
MainStay CBRE Global Infrastructure Megatrends Term Fund: Trustee since 2023; and
New York Life Investment Management International (Chair) since 2015 |
| * | This Trustee is considered to be an “interested person” of the MainStay Group of Funds, MainStay VP Funds Trust, MainStay CBRE Global Infrastructure Megatrends Term Fund and MainStay MacKay DefinedTerm Municipal Opportunities Fund, within the meaning of the 1940 Act because of his affiliation with New York Life Investment Management LLC and Candriam, as described in detail above in the column entitled “Principal Occupation(s) During Past Five Years.” |
| | |
Board of Trustees and Officers (Unaudited) (continued)
| | Name and
Year of Birth | Term of Office,
Position(s) Held and
Length of Service | Principal Occupation(s)
During Past Five Years | Number of
Portfolios in
Fund Complex
Overseen by
Trustee | Other Directorships
Held by Trustee |
| | | | | | |
| | David H. Chow
1957 | MainStay VP Funds Trust: Trustee since January 2016, Advisory Board Member (June 2015 to December 2015) | Founder and CEO, DanCourt Management, LLC since 1999 | 81 | MainStay Funds: Trustee since January 2016, Advisory Board Member (June 2015 to December 2015) (11 Funds);
MainStay Funds Trust: Trustee since January 2016, Advisory Board Member (June 2015 to December 2015) (37 Funds);
MainStay MacKay DefinedTerm Municipal Opportunities Fund: Trustee since January 2016, Advisory Board Member (June 2015 to December 2015);
MainStay CBRE Global Infrastructure Megatrends Term Fund: Trustee since 2021;
VanEck Vectors Group of Exchange-Traded Funds: Trustee since 2006 and Independent Chairman of the Board of Trustees from 2008 to 2022 (57 portfolios); and
Berea College of Kentucky: Trustee since 2009, Chair of the Investment Committee since 2018 |
| | Karen Hammond
1956 | MainStay VP Funds Trust: Trustee since December 2021, Advisory Board Member (June 2021 to December 2021)
| Retired, Managing Director, Devonshire Investors (2007 to 2013); Senior Vice President, Fidelity Management & Research Co. (2005 to 2007); Senior Vice President and Corporate Treasurer, FMR Corp. (2003 to 2005); Chief Operating Officer, Fidelity Investments Japan (2001 to 2003) | 81 | MainStay Funds: Trustee since December 2021, Advisory Board Member (June 2021 to December 2021) (11 Funds);
MainStay Funds Trust: Trustee since December 2021, Advisory Board Member (June 2021 to December 2021) (37 Funds);
MainStay MacKay DefinedTerm Municipal Opportunities Fund: Trustee since December 2021, Advisory Board Member (June 2021 to December 2021);
MainStay CBRE Global Infrastructure Megatrends Term Fund: Trustee since December 2021, Advisory Board Member (June 2021 to December 2021);
Two Harbors Investment Corp.: Director since 2018;
Rhode Island State Investment Commission: Member since 2017; and
Blue Cross Blue Shield of Rhode Island: Director since 2019 |
| | Susan B. Kerley
1951 | MainStay VP Funds Trust: Chair since 2017 and Trustee since 2007** | President, Strategic Management Advisors LLC since 1990 | 81 | MainStay Funds: Chair since January 2017 and Trustee since 2007 (11 Funds); MainStay Funds Trust: Chair since January 2017 and Trustee since 1990 (37 Funds)***;
MainStay MacKay DefinedTerm Municipal Opportunities Fund: Chair since January 2017 and Trustee since 2011;
MainStay CBRE Global Infrastructure Megatrends Term Fund: Trustee since June 2021; and
Legg Mason Partners Funds: Trustee since 1991 (45 portfolios) |
| 34 | MainStay VP American Century Sustainable Equity Portfolio |
| | Name and
Year of Birth | Term of Office,
Position(s) Held and
Length of Service | Principal Occupation(s)
During Past Five Years | Number of
Portfolios in
Fund Complex
Overseen by
Trustee | Other Directorships
Held by Trustee |
| | | | | | |
| | Alan R. Latshaw
1951 | MainStay VP Funds Trust: Trustee since 2007** | Retired; Partner, Ernst & Young LLP (2002 to 2003); Partner, Arthur Andersen LLP (1989 to 2002); Consultant to the MainStay Funds Audit and Compliance Committee (2004 to 2006) | 81 | MainStay Funds: Trustee since 2006 (11 Funds);
MainStay Funds Trust: Trustee since 2007 (37 Funds)***;
MainStay MacKay DefinedTerm Municipal Opportunities Fund: Trustee since 2011; and
MainStay CBRE Global Infrastructure Megatrends Term Fund: Trustee since June 2021 |
| | Jacques P. Perold
1958 | MainStay VP Funds Trust: Trustee since January 2016, Advisory Board Member (June 2015 to December 2015) | Founder and Chief Executive Officer, CapShift Advisors LLC (since 2018); President, Fidelity Management & Research Company (2009 to 2014); President and Chief Investment Officer, Geode Capital Management, LLC (2001 to 2009) | 81 | MainStay Funds: Trustee since January 2016, Advisory Board Member (June 2015 to December 2015) (11 Funds);
MainStay Funds Trust: Trustee since January 2016, Advisory Board Member (June 2015 to December 2015) (37 Funds);
MainStay MacKay DefinedTerm Municipal Opportunities Fund: Trustee since January 2016, Advisory Board Member (June 2015 to December 2015);
MainStay CBRE Global Infrastructure Megatrends Term Fund: Trustee since June 2021;
Allstate Corporation: Director since 2015;
Partners in Health: Trustee since 2019; and
MSCI Inc.: Director since 2017 |
| | Richard S. Trutanic
1952 | MainStay VP Funds Trust: Trustee since 2007** | Chairman and Chief Executive Officer, Somerset & Company (financial advisory firm) since 2004; Managing Director, The Carlyle Group (private investment firm) (2002 to 2004); Senior Managing Director, Partner and Board Member, Groupe Arnault S.A. (private investment firm) (1999 to 2002) | 81 | MainStay Funds: Trustee since 1994 (11 Funds);
MainStay Funds Trust: Trustee since 2007 (37 Funds)***;
MainStay MacKay DefinedTerm Municipal Opportunities Fund: Trustee since 2011; and
MainStay CBRE Global Infrastructure Megatrends Term Fund: Trustee since June 2021 |
| ** | Includes prior service as a Director of MainStay VP Series Fund, Inc., the predecessor to MainStay VP Funds Trust. |
| *** | Includes prior service as a Director/Trustee of certain predecessor entities to MainStay Funds Trust. |
Board of Trustees and Officers (Unaudited) (continued)
| | Name and
Year of Birth | Position(s) Held and
Length of Service | Principal Occupation(s)
During Past Five Years | |
| | | | | |
| | Kirk C. Lehneis
1974 | President, MainStay VP Funds Trust (since 2017) | Chief Operating Officer and Senior Managing Director (since 2016), New York Life Investment Management LLC and New York Life Investment Management Holdings LLC; Member of the Board of Managers (since 2017) and Senior Managing Director (since 2018), NYLIFE Distributors LLC; Chairman of the Board and Senior Managing Director, NYLIM Service Company LLC (since 2017); Trustee, President and Principal Executive Officer of IndexIQ Trust, IndexIQ ETF Trust and IndexIQ Active ETF Trust (since 2018); President, MainStay CBRE Global Infrastructure Megatrends Term Fund (since 2021), MainStay MacKay DefinedTerm Municipal Opportunities Fund, MainStay Funds and MainStay Funds Trust (since 2017); Senior Managing Director, Global Product Development (from 2015 to 2016); Managing Director, Product Development (from 2010 to 2015), New York Life Investment Management LLC | |
| | Jack R. Benintende
1964 | Treasurer and Principal Financial and Accounting Officer, MainStay VP Funds Trust (since 2007)** | Managing Director, New York Life Investment Management LLC (since 2007); Treasurer and Principal Financial and Accounting Officer, MainStay CBRE Global Infrastructure Megatrends Term Fund (since 2021), MainStay MacKay DefinedTerm Municipal Opportunities Fund (since 2011), MainStay Funds Trust (since 2009) and MainStay Funds (since 2007); and Assistant Treasurer, New York Life Investment Management Holdings LLC (2008 to 2012) | |
| | J. Kevin Gao
1967 | Secretary and Chief Legal Officer, MainStay VP Funds Trust (since 2010)** | Managing Director and Associate General Counsel, New York Life Investment Management LLC (since 2010); Secretary and Chief Legal Officer, MainStay CBRE Global Infrastructure Megatrends Term Fund (since 2021), MainStay MacKay DefinedTerm Municipal Opportunities Fund (since 2011), MainStay Funds and MainStay Funds Trust (since 2010) | |
| | Kevin M. Gleason
1967 | Vice President and Chief Compliance Officer, MainStay VP Funds Trust (since June 2022) | Vice President and Chief Compliance Officer, IndexIQ Trust, IndexIQ ETF Trust and IndexIQ Active ETF Trust (since June 2022); Vice President and Chief Compliance Officer, MainStay CBRE Global Infrastructure Megatrends Term Fund, MainStay MacKay DefinedTerm Municipal Opportunities Fund (since June 2022); MainStay Funds Trust and MainStay Funds (since June 2022); Senior Vice President, Voya Investment Management and Chief Compliance Officer, Voya Family of Funds (2012 to 2022) | |
| | Scott T. Harrington
1959 | Vice President— Administration, MainStay VP Funds Trust (since 2005)** | Managing Director, New York Life Investment Management LLC (including predecessor advisory organizations) (since 2000); Member of the Board of Directors, New York Life Trust Company (since 2009); Vice President—Administration, MainStay CBRE Global Infrastructure Megatrends Term Fund (since 2021), MainStay MacKay DefinedTerm Municipal Opportunities Fund (since 2011), MainStay Funds Trust and MainStay Funds (since 2009) | |
| * | The officers listed above are considered to be “interested persons” of the MainStay Group of Funds, MainStay VP Funds Trust, MainStay CBRE Global Infrastructure Megatrends Term Fund and MainStay MacKay DefinedTerm Municipal Opportunities Fund within the meaning of the 1940 Act because of their affiliation with the MainStay Group of Funds, New York Life Insurance Company and/or its affiliates, including New York Life Investment Management LLC, New York Life Insurance Company, NYLIM Service Company LLC, NYLIFE Securities LLC and/or NYLIFE Distributors LLC, as described in detail in the column captioned “Principal Occupation(s) During Past Five Years.” Officers are elected annually by the Board. |
| ** | Includes prior service as an Officer of MainStay VP Series Fund, Inc., the predecessor to MainStay VP Funds Trust. |
Officers of the Trust (Who are not Trustees)*
| 36 | MainStay VP American Century Sustainable Equity Portfolio |
This page intentionally left blank
This page intentionally left blank.
MainStay VP Portfolios
MainStay VP offers a wide range of Portfolios. The full array of MainStay VP offerings is listed here, with information about the manager, subadvisors, legal counsel, and independent registered public accounting firm.
Equity
MainStay VP American Century Sustainable Equity Portfolio
MainStay VP Candriam Emerging Markets Equity Portfolio
MainStay VP Epoch U.S. Equity Yield Portfolio
MainStay VP Fidelity Institutional AM® Utilities Portfolio†
MainStay VP Natural Resources Portfolio
MainStay VP PineStone International Equity Portfolio1
MainStay VP S&P 500 Index Portfolio
MainStay VP Small Cap Growth Portfolio
MainStay VP Wellington Growth Portfolio
MainStay VP Wellington Mid Cap Portfolio
MainStay VP Wellington Small Cap Portfolio
MainStay VP Wellington U.S. Equity Portfolio
MainStay VP Winslow Large Cap Growth Portfolio
Mixed Asset
MainStay VP Balanced Portfolio
MainStay VP Income Builder Portfolio
MainStay VP Janus Henderson Balanced Portfolio
MainStay VP MacKay Convertible Portfolio
Income
MainStay VP Bond Portfolio
MainStay VP Floating Rate Portfolio
MainStay VP Indexed Bond Portfolio
MainStay VP MacKay Government Portfolio2
MainStay VP MacKay High Yield Corporate Bond Portfolio
MainStay VP MacKay Strategic Bond Portfolio
MainStay VP PIMCO Real Return Portfolio
Money Market
MainStay VP U.S. Government Money Market Portfolio
Alternative
MainStay VP CBRE Global Infrastructure Portfolio
MainStay VP IQ Hedge Multi-Strategy Portfolio
Asset Allocation
MainStay VP Conservative Allocation Portfolio
MainStay VP Equity Allocation Portfolio
MainStay VP Growth Allocation Portfolio
MainStay VP Moderate Allocation Portfolio
Manager
New York Life Investment Management LLC
New York, New York
Subadvisors
American Century Investment Management, Inc.
Kansas City, Missouri
Brown Advisory LLC
Baltimore, Maryland
Candriam*
Strassen, Luxembourg
CBRE Investment Management Listed Real Assets LLC
Radnor, Pennsylvania
Epoch Investment Partners, Inc.
New York, New York
FIAM LLC
Smithfield, Rhode Island
IndexIQ Advisors LLC*
New York, New York
Janus Henderson Investors US LLC
Denver, Colorado
MacKay Shields LLC*
New York, New York
Newton Investment Management North America, LLC
Boston, Massachusetts
NYL Investors LLC*
New York, New York
Pacific Investment Management Company LLC
Newport Beach, California
PineStone Asset Management Inc.
Montreal, Québec
Segall Bryant & Hamill, LLC
Chicago, Illinois
Wellington Management Company LLP
Boston, Massachusetts
Winslow Capital Management, LLC
Minneapolis, Minnesota
Legal Counsel
Dechert LLP
Washington, District of Columbia
Independent Registered Public Accounting Firm
PricewaterhouseCoopers LLP
New York, New York
Distributor
NYLIFE Distributors LLC*
Jersey City, New Jersey
Custodian
JPMorgan Chase Bank, N.A.
New York, New York
Some Portfolios may not be available in all products.
† Fidelity Institutional AM is a registered trade mark of FMR LLC. Used with permission.
* An affiliate of New York Life Investment Management LLC.
| 1. | Prior to August 28, 2023, the Portfolio's name was MainStay VP MacKay International Equity Portfolio. |
| 2. | Effective on or about May 1, 2024, the MainStay VP MacKay Government Portfolio will be renamed the MainStay VP U.S. Infrastructure Bond Portfolio. |
Not part of the Annual Report
2023 Annual Report
This report is for the general information of New York Life Variable Annuities and NYLIAC Variable Universal Life Insurance Products policyowners. It must be preceded or accompanied by the appropriate product(s) and funds prospectuses if it is given to anyone who is not an owner of a New York Life variable annuity policy or a NYLIAC Variable Universal Life Insurance Product. This report does not offer for sale or solicit orders to purchase securities.
The performance data quoted in this report represents past performance. Past performance is no guarantee of future results. Due to market volatility and other factors, current performance may be lower or higher than the figures shown. The most recent month-end performance summary for your variable annuity or variable life policy is available by calling 800-598-2019 and is updated periodically on newyorklife.com.
The New York Life Variable Annuities and NYLIAC Variable Universal Life Insurance Products are issued by New York Life Insurance and Annuity Corporation (a Delaware Corporation) and distributed by NYLIFE Distributors LLC (Member FINRA/SIPC).
New York Life Insurance Company
New York Life Insurance and Annuity
Corporation (NYLIAC) (A Delaware Corporation)
51 Madison Avenue, Room 551
New York, NY 10010
newyorklife.com
newyorklifeinvestments.com
NYLIFE Distributors LLC, 30 Hudson Street, Jersey City, NJ 07302
New York Life Investment Management LLC is the investment manager to the MainStay VP Funds Trust
©2024 by NYLIFE Distributors LLC. All rights reserved.
You may obtain copies of the Prospectus and the Statement of Additional Information free of charge, upon request, by calling toll-free 800-598-2019 or writing to New York Life Insurance and Annuity Corporation, 51 Madison Avenue, New York, NY 10010.
| Not FDIC Insured | No Bank Guarantee | May Lose Value |
(NYLIAC) NI531
MainStay VP Natural Resources Portfolio
Message from the President and Annual Report
December 31, 2023
Special Notice:
Beginning in July 2024, new regulations issued by the Securities and Exchange Commission (SEC) will take effect requiring open-end mutual fund companies and ETFs to (1) overhaul the content of their shareholder reports and (2) mail paper copies of the new tailored shareholder reports to shareholders who have not opted to receive these documents electronically.
If you have not yet elected to receive your shareholder reports electronically, please contact your financial intermediary or visit our website.
| Not FDIC/NCUA Insured | Not a Deposit | May Lose Value | No Bank Guarantee | Not Insured by Any Government Agency |
This page intentionally left blank
Message from the President
Against a backdrop of easing inflationary pressures and continued economic growth, stocks and bonds generally gained ground during the 12-month period ended December 31, 2023, despite high levels of volatility and sharp disparities between the performance of the different market sectors.
Although the war in Ukraine, the outbreak of hostilities in the Middle East and several other notable events affected financial assets, inflation, interest rate, and economic growth trends stood at the forefront of market developments during most of the period. As the reporting period began, high levels of inflation already showed signs of easing in the face of aggressive rate hikes by U.S. Federal Reserve (the “Fed”). From a peak of 9.1% in June 2022, the annualized U.S. inflation rate dropped to 6.4% in January, and 3.4% in December 2023. At the same time, the Fed increased the benchmark federal funds rate from 4.25%–4.50% at the beginning of reporting period, to 5.25%–5.50% as of the end of 2023. Despite the increasing cost of capital and tighter lending environment that resulted from rising rates, economic growth remained surprisingly robust, bolstered by high levels of consumer spending, low levels of unemployment and better-than-expected corporate earnings. With the pace of rate increases slowing from the prior year, investors began hoping for an early shift to a looser monetary policy, with stock prices and bond yields reacting as economic data and statements from the Fed either reinforced or undercut those hopes. Following months of hawkish rhetoric, the Fed finally reversed its stance in December 2023, signaling a positive economic outlook with little chance of a recession and a likelihood of rate cuts in 2024.
The S&P 500® Index, a widely regarded benchmark of U.S. market performance, produced strong gains during the reporting period-– recovering all its losses from 2022 and approached new record territory. A preponderance of the Index’s gains were generated by a relatively small number of mega-cap stocks in the information technology, communication services and consumer discretionary sectors that stood to benefit from rapid developments in generative artificial intelligence (“AI”). Value-oriented, interest-rate sensitive and small-capitalization
shares lagged by significant margins, although market strength widened during the closing weeks of the reporting period. Most overseas equity markets trailed the U.S. market, as developed international economies experienced relatively low growth rates, and weak economic conditions in China undermined emerging markets.
Bonds produced generally positive returns, bolstered by attractive and relatively stable yields. The yield on the 10-year Treasury note hit a high of just under 5% in mid-October 2023, ranging between approximately 3.5% and 4.8% for most of the reporting period. The yield curve remained inverted throughout the year, with the 2-year Treasury yield modestly above the 10-year yield. Corporate bond prices trended moderately higher, generally outperforming government securities. After years of low yields and tight credit spreads, the corporate sector benefited from more attractive valuations and income opportunities. Among corporates, markets generally rewarded longer duration and lower credit quality, although an uptick in default rates posed added risks for high-yield corporate bonds. International bond markets produced mixed returns, with emerging-markets issues advancing over their developed-markets counterparts.
The market volatility of recent years reminds us of the constant need for experienced and steadfast portfolio management in the face of uncertainty. New York Life Investments remains dedicated to providing you, as a valued MainStay VP investor, with the guidance, resources and investment solutions you need to pursue your financial goals.
Thank you for trusting us to help meet your investment needs.
Sincerely,
Kirk C. Lehneis
President
The opinions expressed are as of the date of this report and are subject to change. There is no guarantee that any forecast made will come to pass. This material does not constitute investment advice and is not intended as an endorsement of any specific investment. Past performance is no guarantee of future results.
Not part of the Annual Report
Investors should refer to the Portfolio’s Summary Prospectus and/or Prospectus and consider the Portfolio’s investment objectives, strategies, risks, charges and expenses carefully before investing. The Summary Prospectus and/or Prospectus contain this and other information about the Portfolio. You may obtain copies of the Portfolio’s Summary Prospectus, Prospectus and Statement of Additional Information, which includes information about the MainStay VP Funds Trust's Trustees, free of charge, upon request, by calling toll-free 800-598-2019, by writing to New York Life Insurance and Annuity Corporation, 51 Madison Avenue, Room 251, New York, New York 10010 or by sending an email to MainStayShareholdersServices@nylim.com. These documents are also available at newyorklifeinvestments.com/investment-products/vp. Please read the Portfolio's Summary Prospectus and/or Prospectus carefully before investing. MainStay VP Funds Trust portfolios are separate account options which are purchased through a variable insurance or variable annuity contract.
Investment and Performance Comparison (Unaudited)
Performance data quoted represents past performance. Past performance is no guarantee of future results. Because of market volatility and other factors, current performance may be lower or higher than the figures shown. Investment return and principal value will fluctuate, and as a result, when shares are redeemed, they may be worth more or less than their original cost. The performance table and graph do not reflect any deduction of sales charges, mortality and expense charges, contract charges or administrative charges. Please refer to the Performance Summary appropriate for your policy. For performance information current to the most recent month-end, please call 800-598-2019 or visit www.newyorklife.com.
Performance figures may reflect certain fee waivers and/or expense limitations, without which total returns may have been different. For information on current fee waivers and/or expense limitations (if any), please refer to the Notes to Financial Statements.
| Average Annual Total Returns for the Year-Ended December 31, 20231 |
| Class | Inception
Date2 | One
Year | Five
Years | Ten
Years | Gross
Expense
Ratio3 |
| Initial Class Shares | 2/17/2012 | 1.92% | 18.96% | 2.79% | 0.83% |
| 1. | The Portfolio replaced its subadvisor and modified its principal investment strategies as of November 30, 2018. Therefore, the performance information shown in this report prior to November 30, 2018 reflects the Portfolio’s prior subadvisor, investment objective and principal investment strategies. |
| 2. | Due to an organizational restructuring, the portfolio managers from Mellon Investments Corporation who managed the day-to-day operations of the Portfolio transitioned to Newton Investment Management North America, LLC as of September 1, 2021. The past performance in the graph and table prior to that date reflects the Portfolio’s prior subadvisor. |
| 3. | The gross expense ratios presented reflect the Portfolio’s “Total Annual Portfolio Operating Expenses” from the most recent Prospectus and may differ from other expense ratios disclosed in this report. |
| Benchmark Performance* | One
Year | Five
Years | Ten
Years |
| S&P Global Natural Resources Index1 | 4.08% | 11.15% | 5.15% |
| Morningstar Natural Resources Category Average2 | 7.61 | 12.51 | 4.77 |
| * | Returns for indices reflect no deductions for fees, expenses or taxes, except for foreign withholding taxes where applicable. Results assume reinvestment of all dividends and capital gains. An investment cannot be made directly in an index. |
| 1. | The Portfolio has selected the S&P Global Natural Resources Index as its primary benchmark. The S&P Global Natural Resources Index includes 90 of the largest publicly-traded companies in natural resources and commodities businesses that meet specific investability requirements, offering investors diversified and investable equity exposure across 3 primary commodity-related sectors: agribusiness, energy, and metals & mining. |
| 2. | The Morningstar Natural Resources Category Average is representative of funds that invest primarily on commodity-based industries such as energy, chemicals, minerals, and forest products in the United States or outside of the United States. Some funds invest across this spectrum to offer broad natural-resources exposure. Others concentrate heavily or even exclusively in specific industries. Funds that concentrate primarily in energy-related industries are part of the equity energy category. Results are based on average total returns of similar funds with all dividends and capital gain distributions reinvested. |
Cost in Dollars of a $1,000 Investment in MainStay VP Natural Resources Portfolio (Unaudited)
The example below is intended to describe the fees and expenses borne by shareholders during the six-month period from July 1, 2023 to December 31, 2023, and the impact of those costs on your investment.
Example
As a shareholder of the Portfolio you incur two types of costs: (1) transaction costs, including exchange fees and sales charges (loads) on purchases (as applicable), and (2) ongoing costs, including management fees and other Portfolio expenses (as applicable). This example is intended to help you understand your ongoing costs (in dollars) of investing in the Portfolio and to compare these costs with the ongoing costs of investing in other mutual funds. The example is based on an investment of $1,000 made at the beginning of the six-month period and held for the entire period from July 1, 2023 to December 31, 2023. Shares are only sold in connection with variable life and annuity contracts and the example does not reflect any contract level or transactional fees or expenses. If these costs had been included, your costs would have been higher.
This example illustrates your Portfolio’s ongoing costs in two ways:
Actual Expenses
The second and third data columns in the table below provide information about actual account values and actual expenses. You may use the information in these columns, together with the amount you invested, to estimate the expenses that you paid during the six months ended
December 31, 2023. Simply divide your account value by $1,000 (for example, an $8,600 account value divided by $1,000 = 8.6), then multiply the result by the number under the heading entitled “Expenses Paid During Period” to estimate the expenses you paid on your account during this period.
Hypothetical Example for Comparison Purposes
The fourth and fifth data columns in the table below provide information about hypothetical account values and hypothetical expenses based on the Portfolio’s actual expense ratio and an assumed rate of return of 5% per year before expenses, which is not the Portfolio’s actual return. The hypothetical account values and expenses may not be used to estimate the actual ending account balances or expenses you paid for the six-month period shown. You may use this information to compare the ongoing costs of investing in the Portfolio with the ongoing costs of investing in other mutual funds. To do so, compare this 5% hypothetical example with the 5% hypothetical examples that appear in the shareholder reports of the other mutual funds.
Please note that the expenses shown in the table are meant to highlight your ongoing costs only and do not reflect any transactional costs, such as exchange fees or sales charges (loads). Therefore, the fourth and fifth data columns of the table are useful in comparing ongoing costs only and will not help you determine the relative total costs of owning different funds. In addition, if these transactional costs were included, your costs would have been higher.
| Share Class | Beginning
Account
Value
7/1/23 | Ending Account
Value (Based
on Actual
Returns and
Expenses)
12/31/23 | Expenses
Paid
During
Period1 | Ending Account
Value (Based
on Hypothetical
5% Annualized
Return and
Actual Expenses)
12/31/23 | Expenses
Paid
During
Period1 | Net Expense
Ratio
During
Period2 |
| Initial Class Shares | $1,000.00 | $1,049.20 | $4.34 | $1,020.97 | $4.28 | 0.84% |
| 1. | Expenses are equal to the Portfolio’s annualized expense ratio of each class multiplied by the average account value over the period, divided by 365 and multiplied by 184 (to reflect the six-month period). The table above represents the actual expenses incurred during the six-month period. In addition to the fees and expenses which the Portfolio bears directly, it also indirectly bears a pro rata share of the fees and expenses of the underlying funds in which it invests. Such indirect expenses are not included in the above-reported expense figures. |
| 2. | Expenses are equal to the Portfolio's annualized expense ratio to reflect the six-month period. |
| 6 | MainStay VP Natural Resources Portfolio |
Country Composition as of December 31, 2023 (Unaudited)
| United States | 77.9% |
| Canada | 12.2 |
| Netherlands | 4.6 |
| Norway | 2.7 |
| Germany | 2.4 |
| Australia | 1.4 |
| Chile | 1.2% |
| Brazil | 0.5 |
| Zambia | 0.5 |
| Other Assets, Less Liabilities | –3.4 |
| | 100.0% |
See Portfolio of Investments beginning on page 10 for specific holdings within these categories. The Portfolio's holdings are subject to change.
Top Ten Holdings and/or Issuers Held as of December 31, 2023 (excluding short-term investments) (Unaudited)
| 1. | Freeport-McMoRan, Inc. |
| 2. | Weatherford International plc |
| 3. | Occidental Petroleum Corp. |
| 4. | Shell plc |
| 5. | CF Industries Holdings, Inc. |
| 6. | ConocoPhillips |
| 7. | CRH plc |
| 8. | Schlumberger NV |
| 9. | Teck Resources Ltd., Class B |
| 10. | Phillips 66 |
Portfolio Management Discussion and Analysis (Unaudited)
Answers to the questions reflect the views of portfolio manager Brock Campbell, CFA, and David S. Intoppa of Newton Investment Management North America, LLC, the Portfolio’s Subadvisor.
How did MainStay VP Natural Resources Portfolio perform relative to its benchmark and peers during the 12 months ended December 31, 2023?
For the 12 months ended December 31, 2023, MainStay VP Natural Resources Portfolio returned 1.92% for Initial Class shares. Over the same period, Initial Class shares of the Portfolio underperformed the 4.08% return of the S&P Global Natural Resources Index (the “Index”), which is the Portfolio’s benchmark, and the 7.61% return of the Morningstar Natural Resources Category Average.1
What factors affected the Portfolio’s relative performance during the reporting period?
Natural-resource equities are highly correlated to commodity prices, which are largely determined by supply and demand factors that can be affected by macroeconomic data, geopolitical events, and idiosyncratic, subsector and/or company news. Each of these factors affected the Portfolio’s performance relative to the Index over the reporting period.
In addition, the Portfolio is designed to take concentrated positions in our highest conviction ideas across the natural-resource equity universe. We believe this provides a solid opportunity to deliver commodity alpha2 to our investors, as opposed to broad commodity exposure or beta.3 As the Portfolio does not offer diversified commodity exposure, there may be times when the Portfolio outperforms or underperforms the Index.
Which sectors were the strongest contributors to the Portfolio’s relative performance and which sectors were particularly weak?
Energy services, industrials and agriculture made the strongest contributions to the Portfolio’s relative performance over the reporting period. (Contributions take weightings and total returns into account.) Conversely, steel, forest, and paper products and U.S. onshore upstream detracted the most from the Portfolio's relative performance.
During the reporting period, which individual stocks made the strongest positive contributions to the Portfolio’s absolute performance and which stocks detracted the most?
The strongest positive contributions to the Portfolio’s absolute performance came from uranium miner Cameco, energy drilling equipment company Weatherford International and offshore oil & gas drilling services provider Transocean. Cameco shares advanced throughout the year as investors began to focus on
increasing tightness in the uranium market. Weatherford International shares rose amid increased activity and much higher capacity utilization rates. Demand for services outstripped available supply, leading to a solid pricing environment, which benefited many of the high-quality operators in this sector. Transocean shares benefited as the oilfield services industry had a solid year, marked by increased activity and significantly higher capacity utilization rates. Once again, demand for services outstripped available supply, leading to a robust pricing environment, which benefited many of the sector’s high-quality operators.
The most significant detractors from the Portfolio’s absolute performance during the same period included positions in Canadian mineral producer First Quantum Minerals, German pharmaceutical company Bayer and aluminum producer Alcoa. First Quantum Minerals shares declined as the company’s key Panamanian mine faced a referendum, raising concerns regarding future profits and cash flows. Bayer shares suffered in the face of several negative news stories regarding the company, including a downgrade of its debt by rating agency Fitch Ratings, Inc. litigation related to its agriculture business, and the termination of a clinical trial for an anticoagulant drug due to lack of efficacy. Alcoa shares lagged as investors grew increasingly concerned over the prospect of slowing global growth, the pace and sustainability of China’s reopening, and concerns regarding aluminum oversupply.
Did the Portfolio make any significant purchases or sales during the reporting period?
Key additions to the Portfolio during the reporting period included new positions in international energy and petrochemical company Shell, globally diversified building materials company CRH and diversified energy company Phillips 66. Shell engages in the exploration, production, refining and marketing of oil and natural gas, and the manufacturing and marketing of chemicals. In addition to our positive outlook on energy, we believe Shell is in the early stages of cleaning up its balance sheet, paying down debt and returning more capital to shareholders. CRH manufactures and supplies a diverse range of building materials and products for use in the construction and maintenance of infrastructure, housing and commercial projects. We believe CRH could be among the leading beneficiaries of deglobalization, as countries and companies spend on infrastructure buildouts. In our view, the company should benefit from recent U.S. legislation, including the Inflation Reduction Act and the CHIPs Act. Phillips 66 appears well positioned to benefit from gains in the natural
| 1. | See "Investment and Performance Comparison" for more information on benchmark and peer group returns. |
| 2. | Alpha measures the relationship between a mutual fund’s return and its beta over a three-year period. Often, alpha is viewed as the excess return (positive or negative) or the value added by the portfolio manager. |
| 3. | Beta is a measure of volatility in relation to the market as a whole. A beta higher than 1 indicates that a security or portfolio will tend to exhibit higher volatility than the market. A beta lower than 1 indicates that a security or portfolio will tend to exhibit lower volatility than the market. |
| 8 | MainStay VP Natural Resources Portfolio |
resources sector as a high-quality refiner that is now very focused on controlling expenses and improving returns.
During the same period, the Portfolio eliminated its entire positions in oil & gas exploration & production companies Hess and EOG Resources, and global mining company Anglo American, in favor of more compelling risk/reward opportunities.
How did the Portfolio’s subsector and subindustry weightings change during the reporting period?
During the reporting period, the Portfolio increased its exposure to refining and chemicals from an equally weighted position to a markedly overweight position relative to the Index. Precious metals increased from zero exposure, but remained an underweight position relative to the Index. Industrials, energy services and agriculture saw the largest decreases in overall weights during the reporting period.
How was the Portfolio positioned at the end of the reporting period?
As of December 31, 2023, we continue to maintain strong conviction in the natural resources sector and foresee a tight supply/demand environment in the coming years. While inflation has declined somewhat, it continues to permeate the global economy, and we believe the supply response could take some time to alleviate inflationary pressures. The rise of environmental, social and governance (ESG) concerns are likely to continue to distort price signals to commodity producers, thereby exacerbating supply shortfalls. We believe that the potential impact of a recession on the Portfolio’s commodity holdings has been exaggerated by the market, despite an uneven China reopening. Our analysis suggests that the impact of slowing demand on energy and metals, the Portfolio’s major overweight positions, should be relatively moderate.
In this environment, the Portfolio’s investment process and style remains unchanged. We continue to seek investments in areas where the commodity macroeconomic and company-specific factors are aligned. In our opinion, the natural resources sector remains one of the best sources of overall portfolio diversification, inflation protection and dividend yield generation.
The opinions expressed are those of the portfolio managers as of the date of this report and are subject to change. There is no guarantee that any forecasts will come to pass. This material does not constitute investment advice and is not intended as an endorsement of any specific investment.
Not all MainStay VP Portfolios and/or share classes are available under all policies.
Portfolio of Investments December 31, 2023†^
| | Shares | Value |
| Common Stocks 99.5% |
| Australia 1.4% |
| South32 Ltd. (Metals & Mining) | 1,346,400 | $ 3,055,289 |
| Woodside Energy Group Ltd. (Oil, Gas & Consumable Fuels) | 83,859 | 1,774,946 |
| | | 4,830,235 |
| Brazil 0.5% |
| Adecoagro SA (Food Products) | 146,602 | 1,627,282 |
| Canada 12.2% |
| Cameco Corp. (Oil, Gas & Consumable Fuels) | 248,517 | 10,711,083 |
| Capstone Copper Corp. (Metals & Mining) (a) | 818,386 | 3,983,691 |
| Ivanhoe Mines Ltd., Class A (Metals & Mining) (a) | 430,086 | 4,170,865 |
| NexGen Energy Ltd. (Oil, Gas & Consumable Fuels) (a) | 881,905 | 6,169,774 |
| Nutrien Ltd. (Chemicals) (b) | 58,060 | 3,270,520 |
| Teck Resources Ltd., Class B (Metals & Mining) | 302,291 | 12,777,841 |
| | | 41,083,774 |
| Chile 1.2% |
| Antofagasta plc (Metals & Mining) | 189,805 | 4,063,297 |
| Germany 2.4% |
| Bayer AG (Registered) (Pharmaceuticals) | 221,757 | 8,232,915 |
| Netherlands 4.6% |
| Shell plc (Oil, Gas & Consumable Fuels) | 468,291 | 15,349,467 |
| Norway 2.7% |
| Equinor ASA, Sponsored ADR (Oil, Gas & Consumable Fuels) | 228,492 | 7,229,487 |
| Norsk Hydro ASA (Metals & Mining) | 276,419 | 1,860,949 |
| | | 9,090,436 |
| United States 74.0% |
| Albemarle Corp. (Chemicals) | 21,220 | 3,065,866 |
| Alcoa Corp. (Metals & Mining) | 231,562 | 7,873,108 |
| Antero Resources Corp. (Oil, Gas & Consumable Fuels) (a) | 452,486 | 10,262,382 |
| Bunge Global SA (Food Products) | 90,840 | 9,170,298 |
| CF Industries Holdings, Inc. (Chemicals) | 188,651 | 14,997,754 |
| Chemours Co. (The) (Chemicals) | 240,861 | 7,596,756 |
| | Shares | Value |
| |
| United States (continued) |
| Chesapeake Energy Corp. (Oil, Gas & Consumable Fuels) (b) | 74,246 | $ 5,712,487 |
| ConocoPhillips (Oil, Gas & Consumable Fuels) | 128,699 | 14,938,093 |
| Corteva, Inc. (Chemicals) | 71,777 | 3,439,554 |
| CRH plc (Construction Materials) | 197,703 | 13,673,139 |
| Darling Ingredients, Inc. (Food Products) (a) | 135,365 | 6,746,592 |
| Diamondback Energy, Inc. (Oil, Gas & Consumable Fuels) | 64,007 | 9,926,206 |
| Energy Fuels, Inc. (Oil, Gas & Consumable Fuels) (a)(b) | 348,141 | 2,503,134 |
| EQT Corp. (Oil, Gas & Consumable Fuels) | 286,859 | 11,089,969 |
| Fluor Corp. (Construction & Engineering) (a) | 115,915 | 4,540,391 |
| Freeport-McMoRan, Inc. (Metals & Mining) | 375,418 | 15,981,544 |
| Marathon Oil Corp. (Oil, Gas & Consumable Fuels) | 453,668 | 10,960,619 |
| Marathon Petroleum Corp. (Oil, Gas & Consumable Fuels) | 70,636 | 10,479,557 |
| Mosaic Co. (The) (Chemicals) | 101,424 | 3,623,880 |
| Newmont Corp. (Metals & Mining) | 204,106 | 8,447,947 |
| NOV, Inc. (Energy Equipment & Services) | 156,144 | 3,166,600 |
| Occidental Petroleum Corp. (Oil, Gas & Consumable Fuels) | 260,827 | 15,573,980 |
| Phillips 66 (Oil, Gas & Consumable Fuels) | 92,207 | 12,276,440 |
| Schlumberger NV (Energy Equipment & Services) | 261,100 | 13,587,644 |
| Transocean Ltd. (Energy Equipment & Services) (a) | 1,584,391 | 10,060,883 |
| Valero Energy Corp. (Oil, Gas & Consumable Fuels) | 12,632 | 1,642,160 |
| Vulcan Materials Co. (Construction Materials) | 8,239 | 1,870,335 |
| Weatherford International plc (Energy Equipment & Services) (a) | 163,128 | 15,958,812 |
| | | 249,166,130 |
| Zambia 0.5% |
| First Quantum Minerals Ltd. (Metals & Mining) | 194,549 | 1,593,039 |
Total Common Stocks
(Cost $306,842,141) | | 335,036,575 |
The notes to the financial statements are an integral part of, and should be read in conjunction with, the financial statements.
| 10 | MainStay VP Natural Resources Portfolio |
| | Shares | | Value |
| Short-Term Investments 3.9% |
| Affiliated Investment Company 0.4% |
| United States 0.4% |
| MainStay U.S. Government Liquidity Fund, 5.235% (c) | 1,387,605 | | $ 1,387,605 |
| Unaffiliated Investment Companies 3.5% |
| United States 3.5% |
| Dreyfus Treasury Obligations Cash Management Fund, 5.40% (c)(d) | 5,865,355 | | 5,865,355 |
| Fidelity Government Portfolio, 5.356% (c)(d) | 2,000,000 | | 2,000,000 |
| Invesco Government & Agency Portfolio, 5.361% (c)(d) | 3,715,123 | | 3,715,123 |
| | | | 11,580,478 |
Total Short-Term Investments
(Cost $12,968,083) | | | 12,968,083 |
Total Investments
(Cost $319,810,224) | 103.4% | | 348,004,658 |
| Other Assets, Less Liabilities | (3.4) | | (11,325,433) |
| Net Assets | 100.0% | | $ 336,679,225 |
| † | Percentages indicated are based on Portfolio net assets. |
| ^ | Industry and country classifications may be different than those used for compliance monitoring purposes. |
| (a) | Non-income producing security. |
| (b) | All or a portion of this security was held on loan. As of December 31, 2023, the aggregate market value of securities on loan was $11,232,661. The Portfolio received cash collateral with a value of $11,580,478. (See Note 2(I)) |
| (c) | Current yield as of December 31, 2023. |
| (d) | Represents a security purchased with cash collateral received for securities on loan. |
Investments in Affiliates (in 000's)
Investments in issuers considered to be affiliate(s) of the Portfolio during the year ended December 31, 2023 for purposes of Section 2(a)(3) of the Investment Company Act of 1940, as amended, were as follows:
| Affiliated Investment Companies | Value,
Beginning
of Year | Purchases
at Cost | Proceeds
from
Sales | Net
Realized
Gain/(Loss)
on Sales | Change in
Unrealized
Appreciation/
(Depreciation) | Value,
End of
Year | Dividend
Income | Other
Distributions | Shares
End of
Year |
| MainStay U.S. Government Liquidity Fund | $ 1,917 | $ 100,172 | $ (100,701) | $ — | $ — | $ 1,388 | $ 107 | $ — | 1,388 |
The notes to the financial statements are an integral part of, and should be read in conjunction with, the financial statements.
11
Portfolio of Investments December 31, 2023†^ (continued)
| Abbreviation(s): |
| ADR—American Depositary Receipt |
The following is a summary of the fair valuations according to the inputs used as of December 31, 2023, for valuing the Portfolio’s assets:
| Description | Quoted
Prices in
Active
Markets for
Identical
Assets
(Level 1) | | Significant
Other
Observable
Inputs
(Level 2) | | Significant
Unobservable
Inputs
(Level 3) | | Total |
| Asset Valuation Inputs | | | | | | | |
| Investments in Securities (a) | | | | | | | |
| Common Stocks | $ 335,036,575 | | $ — | | $ — | | $ 335,036,575 |
| Short-Term Investments | | | | | | | |
| Affiliated Investment Company | 1,387,605 | | — | | — | | 1,387,605 |
| Unaffiliated Investment Companies | 11,580,478 | | — | | — | | 11,580,478 |
| Total Short-Term Investments | 12,968,083 | | — | | — | | 12,968,083 |
| Total Investments in Securities | $ 348,004,658 | | $ — | | $ — | | $ 348,004,658 |
| (a) | For a complete listing of investments and their industries, see the Portfolio of Investments. |
The notes to the financial statements are an integral part of, and should be read in conjunction with, the financial statements.
| 12 | MainStay VP Natural Resources Portfolio |
The table below sets forth the diversification of the Portfolio’s investments by industry.
Industry Diversification
| | Value | | Percent †^ |
| Chemicals | $ 35,994,330 | | 10.7% |
| Construction & Engineering | 4,540,391 | | 1.4 |
| Construction Materials | 15,543,474 | | 4.6 |
| Energy Equipment & Services | 42,773,939 | | 12.7 |
| Food Products | 17,544,172 | | 5.2 |
| Metals & Mining | 63,807,570 | | 19.0 |
| Oil, Gas & Consumable Fuels | 146,599,784 | | 43.5 |
| Pharmaceuticals | 8,232,915 | | 2.4 |
| | 335,036,575 | | 99.5 |
| Short-Term Investments | 12,968,083 | | 3.9 |
| Other Assets, Less Liabilities | (11,325,433) | | (3.4) |
| Net Assets | $336,679,225 | | 100.0% |
| † | Percentages indicated are based on Portfolio net assets. |
| ^ | Industry and country classifications may be different than those used for compliance monitoring purposes. |
The notes to the financial statements are an integral part of, and should be read in conjunction with, the financial statements.
13
Statement of Assets and Liabilities as of December 31, 2023
| Assets |
Investment in unaffiliated securities, at value
(identified cost $318,422,619) including securities on loan of $11,232,661 | $346,617,053 |
Investment in affiliated investment companies, at value
(identified cost $1,387,605) | 1,387,605 |
Cash denominated in foreign currencies
(identified cost $355,448) | 365,666 |
| Receivables: | |
| Dividends | 441,818 |
| Portfolio shares sold | 17,560 |
| Securities lending | 1,811 |
| Other assets | 1,506 |
| Total assets | 348,833,019 |
| Liabilities |
| Cash collateral received for securities on loan | 11,580,478 |
| Payables: | |
| Portfolio shares redeemed | 294,000 |
| Manager (See Note 3) | 221,288 |
| Professional fees | 44,419 |
| Custodian | 13,547 |
| Shareholder communication | 46 |
| Accrued expenses | 16 |
| Total liabilities | 12,153,794 |
| Net assets | $336,679,225 |
| Composition of Net Assets |
| Shares of beneficial interest outstanding (par value of $.001 per share) unlimited number of shares authorized | $ 28,124 |
| Additional paid-in-capital | 343,127,406 |
| | 343,155,530 |
| Total distributable earnings (loss) | (6,476,305) |
| Net assets | $336,679,225 |
| Initial Class | |
| Net assets applicable to outstanding shares | $336,679,225 |
| Shares of beneficial interest outstanding | 28,123,768 |
| Net asset value per share outstanding | $ 11.97 |
The notes to the financial statements are an integral part of, and should be read in conjunction with, the financial statements.
| 14 | MainStay VP Natural Resources Portfolio |
Statement of Operations for the year ended December 31, 2023
| Investment Income (Loss) |
| Income | |
| Dividends-unaffiliated (net of foreign tax withholding of $323,387) | $ 8,755,987 |
| Securities lending, net | 111,179 |
| Dividends-affiliated | 106,702 |
| Total income | 8,973,868 |
| Expenses | |
| Manager (See Note 3) | 2,886,962 |
| Professional fees | 95,231 |
| Custodian | 36,470 |
| Shareholder communication | 17,773 |
| Trustees | 9,550 |
| Miscellaneous | 17,413 |
| Total expenses | 3,063,399 |
| Net investment income (loss) | 5,910,469 |
| Realized and Unrealized Gain (Loss) |
| Net realized gain (loss) on: | |
| Unaffiliated investment transactions | 39,619,078 |
| Foreign currency transactions | 95,490 |
| Net realized gain (loss) | 39,714,568 |
| Net change in unrealized appreciation (depreciation) on: | |
| Unaffiliated investments | (37,904,702) |
| Translation of other assets and liabilities in foreign currencies | 6,798 |
| Net change in unrealized appreciation (depreciation) | (37,897,904) |
| Net realized and unrealized gain (loss) | 1,816,664 |
| Net increase (decrease) in net assets resulting from operations | $ 7,727,133 |
The notes to the financial statements are an integral part of, and should be read in conjunction with, the financial statements.
15
Statements of Changes in Net Assets
for the years ended December 31, 2023 and December 31, 2022
| | 2023 | 2022 |
| Increase (Decrease) in Net Assets |
| Operations: | | |
| Net investment income (loss) | $ 5,910,469 | $ 7,413,546 |
| Net realized gain (loss) | 39,714,568 | 107,424,418 |
| Net change in unrealized appreciation (depreciation) | (37,897,904) | (8,349,052) |
| Net increase (decrease) in net assets resulting from operations | 7,727,133 | 106,488,912 |
| Distributions to shareholders: | | |
| Initial Class | (7,514,547) | (4,193,860) |
| Capital share transactions: | | |
| Net proceeds from sales of shares | 40,152,127 | 117,317,650 |
| Net asset value of shares issued to shareholders in reinvestment of distributions | 7,514,547 | 4,193,860 |
| Cost of shares redeemed | (107,337,171) | (120,252,694) |
| Increase (decrease) in net assets derived from capital share transactions | (59,670,497) | 1,258,816 |
| Net increase (decrease) in net assets | (59,457,911) | 103,553,868 |
| Net Assets |
| Beginning of year | 396,137,136 | 292,583,268 |
| End of year | $ 336,679,225 | $ 396,137,136 |
The notes to the financial statements are an integral part of, and should be read in conjunction with, the financial statements.
| 16 | MainStay VP Natural Resources Portfolio |
Financial Highlights selected per share data and ratios
| | Year Ended December 31, |
| Initial Class | 2023 | | 2022 | | 2021 | | 2020 | | 2019 |
| Net asset value at beginning of year | $ 12.00 | | $ 8.93 | | $ 6.55 | | $ 6.29 | | $ 5.43 |
| Net investment income (loss) | 0.19 | | 0.22 | | 0.12(a) | | 0.09(a) | | 0.13(a) |
| Net realized and unrealized gain (loss) | 0.04 | | 2.97 | | 2.36 | | 0.32 | | 0.78 |
| Total from investment operations | 0.23 | | 3.19 | | 2.48 | | 0.41 | | 0.91 |
| Less distributions: | | | | | | | | | |
| From net investment income | (0.26) | | (0.12) | | (0.10) | | (0.15) | | (0.05) |
| Net asset value at end of year | $ 11.97 | | $ 12.00 | | $ 8.93 | | $ 6.55 | | $ 6.29 |
| Total investment return (b) | 1.92% | | 35.84% | | 38.02% | | 6.89% | | 16.62% |
| Ratios (to average net assets)/Supplemental Data: | | | | | | | | | |
| Net investment income (loss) | 1.62% | | 1.94% | | 1.56% | | 1.68% | | 2.17% |
| Net expenses (c) | 0.84% | | 0.83% | | 0.85% | | 0.86% | | 0.96% |
| Portfolio turnover rate | 85% | | 92% | | 72% | | 68% | | 87% |
| Net assets at end of year (in 000's) | $ 336,679 | | $ 396,137 | | $ 292,583 | | $ 238,908 | | $ 249,276 |
| (a) | Per share data based on average shares outstanding during the year. |
| (b) | Total return does not reflect any deduction of sales charges, mortality and expense charges, contract charges or administrative charges. For periods of less than one year, total return is not annualized. |
| (c) | In addition to the fees and expenses which the Portfolio bears directly, it also indirectly bears a pro-rata share of the fees and expenses of the underlying funds in which it invests. Such indirect expenses are not included in the above expense ratios. |
The notes to the financial statements are an integral part of, and should be read in conjunction with, the financial statements.
17
Notes to Financial Statements
Note 1–Organization and Business
MainStay VP Funds Trust (the “Fund”) was organized as a Delaware statutory trust on February 1, 2011. The Fund is registered under the Investment Company Act of 1940, as amended (the “1940 Act”), as an open-end management investment company. The Fund is comprised of thirty-one separate series (collectively referred to as the “Portfolios”). These financial statements and notes relate to the MainStay VP Natural Resources Portfolio (the "Portfolio"), a "non-diversified” portfolio, as that term is defined in the 1940 Act, as interpreted or modified by regulatory authorities having jurisdiction, from time to time. However, due to its principal investment strategies and investment processes, the Portfolio has historically operated as a "diversified" portfolio. Therefore, the Portfolio will not operate as "non-diversified" portfolio without first obtaining shareholder approval.
Shares of the Portfolio are currently offered to certain separate accounts to fund variable annuity policies and variable universal life insurance policies issued by New York Life Insurance and Annuity Corporation (“NYLIAC”), a wholly-owned subsidiary of New York Life Insurance Company (“New York Life”) and may also be offered to fund variable annuity policies and variable universal life insurance policies issued by other insurance companies. NYLIAC allocates shares of the Portfolio to, among others, certain NYLIAC separate accounts. Shares of the Portfolio are also offered to the MainStay VP Conservative Allocation Portfolio, MainStay VP Moderate Allocation Portfolio, MainStay VP Growth Allocation Portfolio and MainStay VP Equity Allocation Portfolio, which operate as “funds-of-funds," and other variable insurance funds.
The following table lists the Portfolio's share class that has been registered and commenced operations:
| Class | Commenced Operations |
| Initial Class | February 17, 2012 |
Shares of the Portfolio are offered and are redeemed at a price equal to their respective net asset value (“NAV”) per share. No sales or redemption charge is applicable to the purchase or redemption of the Portfolio's shares.
The Portfolio's investment objective is to seek long-term capital appreciation.
Note 2–Significant Accounting Policies
The Portfolio is an investment company and accordingly follows the investment company accounting and reporting guidance of the Financial Accounting Standards Board (“FASB”) Accounting Standards Codification Topic 946 Financial Services—Investment Companies. The Portfolio prepares its financial statements in accordance with generally accepted accounting principles (“GAAP”) in the United States of America and follows the significant accounting policies described below.
(A) Securities Valuation. Investments are usually valued as of the close of regular trading on the New York Stock Exchange (the "Exchange") (usually 4:00 p.m. Eastern time) on each day the Portfolio is open for business ("valuation date").
Pursuant to Rule 2a-5 under the 1940 Act, the Board of Trustees of the Fund (the "Board") has designated New York Life Investment Management LLC (“New York Life Investments” or the "Manager") as its Valuation Designee (the "Valuation Designee"). The Valuation Designee is responsible for performing fair valuations relating to all investments in the Portfolio’s portfolio for which market quotations are not readily available; periodically assessing and managing material valuation risks; establishing and applying fair value methodologies; testing fair valuation methodologies; evaluating and overseeing pricing services; ensuring appropriate segregation of valuation and portfolio management functions; providing quarterly, annual and prompt reporting to the Board, as appropriate; identifying potential conflicts of interest; and maintaining appropriate records. The Valuation Designee has established a valuation committee ("Valuation Committee") to assist in carrying out the Valuation Designee’s responsibilities and establish prices of securities for which market quotations are not readily available. The Portfolio's and the Valuation Designee's policies and procedures ("Valuation Procedures") govern the Valuation Designee’s selection and application of methodologies for determining and calculating the fair value of Portfolio investments. The Valuation Designee may value the Portfolio's portfolio securities for which market quotations are not readily available and other Portfolio assets utilizing inputs from pricing services and other third-party sources. The Valuation Committee meets (in person, via electronic mail or via teleconference) on an ad-hoc basis to determine fair valuations and on a quarterly basis to review fair value events with respect to certain securities for which market quotations are not readily available, including valuation risks and back-testing results, and to preview reports to the Board.
The Valuation Committee establishes prices of securities for which market quotations are not readily available based on such methodologies and measurements on a regular basis after considering information that is reasonably available and deemed relevant by the Valuation Committee. The Board shall oversee the Valuation Designee and review fair valuation materials on a prompt, quarterly and annual basis and approve proposed revisions to the Valuation Procedures.
Investments for which market quotations are not readily available are valued at fair value as determined in good faith pursuant to the Valuation Procedures. A market quotation is readily available only when that quotation is a quoted price (unadjusted) in active markets for identical investments that the Portfolio can access at the measurement date, provided that a quotation will not be readily available if it is not reliable. "Fair value" is defined as the price the Portfolio would reasonably expect to receive upon selling an asset or liability in an orderly transaction to an independent buyer in the principal or most advantageous market for the asset or liability. Fair value measurements are determined within a framework that establishes a three-tier hierarchy that maximizes the use
| 18 | MainStay VP Natural Resources Portfolio |
of observable market data and minimizes the use of unobservable inputs to establish a classification of fair value measurements for disclosure purposes. "Inputs" refer broadly to the assumptions that market participants would use in pricing the asset or liability, including assumptions about risk, such as the risk inherent in a particular valuation technique used to measure fair value using a pricing model and/or the risk inherent in the inputs for the valuation technique. Inputs may be observable or unobservable. Observable inputs reflect the assumptions market participants would use in pricing the asset or liability based on market data obtained from sources independent of the Portfolio. Unobservable inputs reflect the Portfolio’s own assumptions about the assumptions market participants would use in pricing the asset or liability based on the information available. The inputs or methodology used for valuing assets or liabilities may not be an indication of the risks associated with investing in those assets or liabilities. The three-tier hierarchy of inputs is summarized below.
| • | Level 1—quoted prices (unadjusted) in active markets for an identical asset or liability |
| • | Level 2—other significant observable inputs (including quoted prices for a similar asset or liability in active markets, interest rates and yield curves, prepayment speeds, credit risk, etc.) |
| • | Level 3—significant unobservable inputs (including the Portfolio's own assumptions about the assumptions that market participants would use in measuring fair value of an asset or liability) |
The level of an asset or liability within the fair value hierarchy is based on the lowest level of an input, both individually and in the aggregate, that is significant to the fair value measurement. The aggregate value by input level of the Portfolio’s assets and liabilities as of December 31, 2023, is included at the end of the Portfolio of Investments.
The Portfolio may use third-party vendor evaluations, whose prices may be derived from one or more of the following standard inputs, among others:
| • Broker/dealer quotes | • Benchmark securities |
| • Two-sided markets | • Reference data (corporate actions or material event notices) |
| • Bids/offers | • Monthly payment information |
| • Industry and economic events | • Reported trades |
An asset or liability for which a market quotation is not readily available is valued by methods deemed reasonable in good faith by the Valuation Committee, following the Valuation Procedures to represent fair value. Under these procedures, the Valuation Designee generally uses a market-based approach which may use related or comparable assets or liabilities, recent transactions, market multiples, book values and other relevant information. The Valuation Designee may also use an income-based valuation approach in which the anticipated future cash flows of the asset or liability are discounted to calculate fair value. Discounts may also be applied due to the nature and/or duration of any restrictions on the disposition of the asset or liability. Fair value represents
a good faith approximation of the value of a security. Fair value determinations involve the consideration of a number of subjective factors, an analysis of applicable facts and circumstances and the exercise of judgment. As a result, it is possible that the fair value for a security determined in good faith in accordance with the Valuation Procedures may differ from valuations for the same security determined for other funds using their own valuation procedures. Although the Valuation Procedures are designed to value a security at the price the Portfolio may reasonably expect to receive upon the security's sale in an orderly transaction, there can be no assurance that any fair value determination thereunder would, in fact, approximate the amount that the Portfolio would actually realize upon the sale of the security or the price at which the security would trade if a reliable market price were readily available. During the year ended December 31, 2023, there were no material changes to the fair value methodologies.
Securities which may be valued in this manner include, but are not limited to: (i) a security for which trading has been halted or suspended or otherwise does not have a readily available market quotation on a given day; (ii) a debt security that has recently gone into default and for which there is not a current market quotation; (iii) a security of an issuer that has entered into a restructuring; (iv) a security that has been delisted from a national exchange; (v) a security subject to trading collars for which no or limited trading takes place; and (vi) a security whose principal market has been temporarily closed at a time when, under normal conditions, it would be open. Securities valued in this manner are generally categorized as Level 2 or 3 in the hierarchy.
Certain securities held by the Portfolio may principally trade in foreign markets. Events may occur between the time the foreign markets close and the time at which the Portfolio's NAVs are calculated. These events may include, but are not limited to, situations relating to a single issuer in a market sector, significant fluctuations in U.S. or foreign markets, natural disasters, armed conflicts, governmental actions or other developments not tied directly to the securities markets. Should the Valuation Designee conclude that such events may have affected the accuracy of the last price of such securities reported on the local foreign market, the Valuation Designee may, pursuant to the Valuation Procedures, adjust the value of the local price to reflect the estimated impact on the price of such securities as a result of such events. In this instance, securities are generally categorized as Level 3 in the hierarchy. Additionally, certain foreign equity securities are also fair valued whenever the movement of a particular index exceeds certain thresholds. In such cases, the securities are fair valued by applying factors provided by a third-party vendor in accordance with the Valuation Procedures and are generally categorized as Level 2 in the hierarchy.
If the principal market of certain foreign equity securities is closed in observance of a local foreign holiday, these securities are valued using the last closing price of regular trading on the relevant exchange and fair valued by applying factors provided by a third-party vendor in accordance with the Valuation Procedures. These securities are generally categorized as Level 2 in the hierarchy.
Notes to Financial Statements (continued)
Equity securities, rights and warrants, if applicable, are valued at the last quoted sales prices as of the close of regular trading on the relevant exchange on each valuation date. Securities that are not traded on the valuation date are valued at the mean of the last quoted bid and ask prices. Prices are normally taken from the principal market in which each security trades. These securities are generally categorized as Level 1 in the hierarchy.
Investments in mutual funds, including money market funds, are valued at their respective NAVs at the close of business each day on the valuation date. These securities are generally categorized as Level 1 in the hierarchy.
Temporary cash investments acquired in excess of 60 days to maturity at the time of purchase are valued using the latest bid prices or using valuations based on a matrix system (which considers such factors as security prices, yields, maturities and ratings), both as furnished by independent pricing services. Temporary cash investments that mature in 60 days or less at the time of purchase ("Short-Term Investments") are valued using the amortized cost method of valuation, unless the use of such method would be inappropriate. The amortized cost method involves valuing a security at its cost on the date of purchase and thereafter assuming a constant amortization to maturity of the difference between such cost and the value on maturity date. Amortized cost approximates the current fair value of a security. Securities valued using the amortized cost method are not valued using quoted prices in an active market and are generally categorized as Level 2 in the hierarchy.
The information above is not intended to reflect an exhaustive list of the methodologies that may be used to value portfolio investments. The Valuation Procedures permit the use of a variety of valuation methodologies in connection with valuing portfolio investments. The methodology used for a specific type of investment may vary based on the market data available or other considerations. The methodologies summarized above may not represent the specific means by which portfolio investments are valued on any particular business day.
(B) Income Taxes. The Portfolio's policy is to comply with the requirements of the Internal Revenue Code of 1986, as amended (the “Internal Revenue Code”), applicable to regulated investment companies and to distribute all of its taxable income to the shareholders of the Portfolio within the allowable time limits.
The Manager evaluates the Portfolio’s tax positions to determine if the tax positions taken meet the minimum recognition threshold in connection with accounting for uncertainties in income tax positions taken or expected to be taken for the purposes of measuring and recognizing tax liabilities in the financial statements. Recognition of tax benefits of an uncertain tax position is permitted only to the extent the position is “more likely than not” to be sustained assuming examination by taxing authorities. The Manager analyzed the Portfolio's tax positions taken on federal, state and local income tax returns for all open tax years (for up to three tax years) and has concluded that no provisions for federal, state and local income tax are required in the Portfolio's financial statements.
The Portfolio's federal, state and local income tax and federal excise tax returns for tax years for which the applicable statutes of limitations have not expired are subject to examination by the Internal Revenue Service and state and local departments of revenue.
(C) Foreign Taxes. The Portfolio may be subject to foreign taxes on income and other transaction-based taxes imposed by certain countries in which it invests. A portion of the taxes on gains on investments or currency purchases/repatriation may be reclaimable. The Portfolio will accrue such taxes and reclaims as applicable, based upon its current interpretation of tax rules and regulations that exist in the markets in which it invests.
The Portfolio may be subject to taxation on realized capital gains, repatriation proceeds and other transaction-based taxes imposed by certain countries in which it invests. The Portfolio will accrue such taxes as applicable based upon its current interpretation of tax rules and regulations that exist in the market in which it invests. Capital gains taxes relating to positions still held are reflected as a liability in the Statement of Assets and Liabilities, as well as an adjustment to the Portfolio's net unrealized appreciation (depreciation). Taxes related to capital gains realized, if any, are reflected as part of net realized gain (loss) in the Statement of Operations. Changes in tax liabilities related to capital gains taxes on unrealized investment gains, if any, are reflected as part of the change in net unrealized appreciation (depreciation) on investments in the Statement of Operations. Transaction-based charges are generally assessed as a percentage of the transaction amount.
(D) Dividends and Distributions to Shareholders. Dividends and distributions are recorded on the ex-dividend date. The Portfolio intends to declare and pay dividends from net investment income and distributions from net realized capital and currency gains, if any, at least annually. All dividends and distributions are reinvested at NAV in the same class of shares of the Portfolio. Dividends and distributions to shareholders are determined in accordance with federal income tax regulations and may differ from determinations using GAAP.
(E) Security Transactions and Investment Income. The Portfolio records security transactions on the trade date. Realized gains and losses on security transactions are determined using the identified cost method. Dividend income is recognized on the ex-dividend date, net of any foreign tax withheld at the source, and interest income is accrued as earned using the effective interest rate method. Distributions received from real estate investment trusts may be classified as dividends, capital gains and/or return of capital. Discounts and premiums on securities purchased for the Portfolio are accreted and amortized, respectively, on the effective interest rate method.
(F) Expenses. Expenses of the Fund are allocated to the individual Portfolios in proportion to the net assets of the respective Portfolios when the expenses are incurred, except where direct allocations of expenses can be made. The expenses borne by the Portfolio, including those of related parties to the Portfolio, are shown in the Statement of Operations.
| 20 | MainStay VP Natural Resources Portfolio |
Additionally, the Portfolio may invest in mutual funds, which are subject to management fees and other fees that may cause the costs of investing in mutual funds to be greater than the costs of owning the underlying securities directly. These indirect expenses of mutual funds are not included in the amounts shown as expenses in the Statement of Operations or in the expense ratios included in the Financial Highlights.
(G) Use of Estimates. In preparing financial statements in conformity with GAAP, the Manager makes estimates and assumptions that affect the reported amounts and disclosures in the financial statements. Actual results could differ from those estimates and assumptions.
(H) Foreign Currency Transactions. The Portfolio's books and records are maintained in U.S. dollars. Prices of securities denominated in foreign currency amounts are translated into U.S. dollars at the mean between the buying and selling rates last quoted by any major U.S. bank at the following dates:
(i) market value of investment securities, other assets and liabilities— at the valuation date; and
(ii) purchases and sales of investment securities, income and expenses—at the date of such transactions.
The assets and liabilities that are denominated in foreign currency amounts are presented at the exchange rates and market values at the close of the period. The realized and unrealized changes in net assets arising from fluctuations in exchange rates and market prices of securities are not separately presented.
Net realized gain (loss) on foreign currency transactions represents net currency gains or losses realized as a result of differences between the amounts of securities sale proceeds or purchase cost, dividends, interest and withholding taxes as recorded on the Portfolio's books, and the U.S. dollar equivalent amount actually received or paid. Net currency gains or losses from valuing such foreign currency denominated assets and liabilities, other than investments at valuation date exchange rates, are reflected in unrealized foreign exchange gains or losses.
(I) Securities Lending. In order to realize additional income, the Portfolio may engage in securities lending, subject to the limitations set forth in the 1940 Act and relevant guidance by the staff of the Securities and Exchange Commission (“SEC”). If the Portfolio engages in securities lending, the Portfolio will lend through its custodian, JPMorgan Chase Bank, N.A., ("JPMorgan"), acting as securities lending agent on behalf of the Portfolio. Under the current arrangement, JPMorgan will manage the Portfolio's collateral in accordance with the securities lending agency agreement between the Portfolio and JPMorgan, and indemnify the Portfolio against counterparty risk. The loans will be collateralized by cash (which may be invested in a money market fund) and/or non-cash collateral (which may include U.S. Treasury securities and/or U.S. government agency securities issued or guaranteed by the United States government or its agencies or instrumentalities) at least equal at all times to the market value of the securities loaned. Non-cash collateral held at year end is segregated and cannot be transferred by the Portfolio. The
Portfolio bears the risk of delay in recovery of, or loss of rights in, the securities loaned. The Portfolio may also record a realized gain or loss on securities deemed sold due to a borrower’s inability to return securities on loan. The Portfolio bears the risk of any loss on investment of cash collateral. The Portfolio will receive compensation for lending its securities in the form of fees or it will retain a portion of interest earned on the investment of any cash collateral. The Portfolio will also continue to receive interest and dividends on the securities loaned and any gain or loss in the market price of the securities loaned that may occur during the term of the loan will be for the account of the Portfolio. Income earned from securities lending activities, if any, is reflected in the Statement of Operations.
(J) Foreign Securities Risk. The Portfolio may invest in foreign securities, which carry certain risks that are in addition to the usual risks inherent in domestic securities. Foreign regulatory regimes and securities markets can have less stringent investor protections and disclosure standards and less liquid trading markets than U.S. regulatory regimes and securities markets, and can experience political, social and economic developments that may affect the value of investments in foreign securities. These risks include those resulting from currency fluctuations, future adverse political or economic developments and possible imposition of currency exchange blockages or other foreign governmental laws or restrictions. Economic sanctions and other similar governmental actions or developments could, among other things, effectively restrict or eliminate the Portfolio's ability to purchase or sell certain foreign securities or groups of foreign securities, and thus may make the Portfolio's investments in such securities less liquid or more difficult to value. These risks are likely to be greater in emerging markets than in developed markets. The ability of issuers of debt securities held by the Portfolio to meet their obligations may be affected by, among other things, economic or political developments in a specific country, industry or region.
(K) Indemnifications. Under the Fund’s organizational documents, its officers and trustees are indemnified against certain liabilities that may arise out of performance of their duties to the Fund. Additionally, in the normal course of business, the Portfolio enters into contracts with third-party service providers that contain a variety of representations and warranties and that may provide general indemnifications. The Portfolio's maximum exposure under these arrangements is unknown, as this would involve future claims that may be made against the Portfolio that have not yet occurred. The Manager believes that the risk of loss in connection with these potential indemnification obligations is remote. However, there can be no assurance that material liabilities related to such obligations will not arise in the future, which could adversely impact the Portfolio.
Note 3–Fees and Related Party Transactions
(A) Manager and Subadvisor. New York Life Investments, a registered investment adviser and an indirect, wholly-owned subsidiary of New York Life, serves as the Portfolio’s Manager, pursuant to an Amended and Restated Management Agreement (“Management Agreement”). The
Notes to Financial Statements (continued)
Manager provides offices, conducts clerical, recordkeeping and bookkeeping services, and keeps most of the financial and accounting records required to be maintained by the Portfolio. Except for the portion of salaries and expenses that are the responsibility of the Portfolio, the Manager pays the salaries and expenses of all personnel affiliated with the Portfolio and certain operational expenses of the Portfolio. The Portfolio reimburses New York Life Investments in an amount equal to the portion of the compensation of the Chief Compliance Officer attributable to the Portfolio. Newton Investment Management North America, LLC (“Newton” or the “Subadvisor”), a registered investment adviser, serves as the Subadvisor to the Portfolio and is responsible for the day-to-day portfolio management of the Portfolio. Pursuant to the terms of a Subadvisory Agreement between New York Life Investments and Newton, New York Life Investments pays for the services of the Subadvisor.
Pursuant to the Management Agreement, the Fund pays the Manager, on behalf of the Portfolio, a monthly fee for the services performed and the facilities furnished at an annual rate of the Portfolio's average daily net assets as follows: 0.79% up to $1 billion; and 0.78% in excess of $1 billion. During the year ended December 31, 2023, the effective management fee rate was 0.79% of the Portfolio's average daily net assets.
During the year ended December 31, 2023, New York Life Investments earned fees from the Portfolio in the amount of $2,886,962 and paid the Subadvisor fees in the amount of $1,321,315.
JPMorgan provides sub-administration and sub-accounting services to the Portfolio pursuant to an agreement with New York Life Investments. These services include calculating the daily NAVs of the Portfolio, maintaining the general ledger and sub-ledger accounts for the calculation of the Portfolio's NAVs, and assisting New York Life Investments in conducting various aspects of the Portfolio's administrative operations. For providing these services to the Portfolio, JPMorgan is compensated by New York Life Investments.
Pursuant to an agreement between the Fund and New York Life Investments, New York Life Investments is responsible for providing or procuring certain regulatory reporting services for the Portfolio. The Portfolio will reimburse New York Life Investments for the actual costs incurred by New York Life Investments in connection with providing or procuring these services for the Portfolio.
Note 4-Federal Income Tax
As of December 31, 2023, the cost and unrealized appreciation (depreciation) of the Portfolio’s investment portfolio, including applicable derivative contracts and other financial instruments, as determined on a federal income tax basis, were as follows:
| | Federal Tax
Cost | Gross
Unrealized
Appreciation | Gross
Unrealized
(Depreciation) | Net
Unrealized
Appreciation/
(Depreciation) |
| Investments in Securities | $322,566,870 | $45,084,838 | $(19,647,050) | $25,437,788 |
As of December 31, 2023, the components of accumulated gain (loss) on a tax basis were as follows:
Ordinary
Income | Accumulated
Capital
and Other
Gain (Loss) | Other
Temporary
Differences | Unrealized
Appreciation
(Depreciation) | Total
Accumulated
Gain (Loss) |
| $8,439,500 | $(40,362,591) | $— | $25,446,786 | $(6,476,305) |
The difference between book-basis and tax-basis unrealized appreciation (depreciation) is primarily due to wash sale and Passive Foreign Investment Company (“PFIC”) adjustments.
As of December 31, 2023, for federal income tax purposes, capital loss carryforwards of $40,362,591, as shown in the table below, were available to the extent provided by the regulations to offset future realized gains of the Portfolio. Accordingly, no capital gains distributions are expected to be paid to shareholders until net gains have been realized in excess of such amounts.
Capital Loss
Available Through | Short-Term
Capital Loss
Amounts (000’s) | Long-Term
Capital Loss
Amounts (000’s) |
| Unlimited | $21,667 | $18,695 |
The Portfolio utilized $38,902,835 of capital loss carryforwards during the year ended December 31, 2023.
During the years ended December 31, 2023 and December 31, 2022, the tax character of distributions paid as reflected in the Statements of Changes in Net Assets was as follows:
| | 2023 | 2022 |
| Distributions paid from: | | |
| Ordinary Income | $7,514,547 | $4,193,860 |
Note 5–Custodian
JPMorgan is the custodian of cash and securities held by the Portfolio. Custodial fees are charged to the Portfolio based on the Portfolio's net assets and/or the market value of securities held by the Portfolio and the number of certain transactions incurred by the Portfolio.
| 22 | MainStay VP Natural Resources Portfolio |
Note 6–Line of Credit
The Portfolio and certain other funds managed by New York Life Investments maintain a line of credit with a syndicate of banks in order to secure a source of funds for temporary purposes to meet unanticipated or excessive redemption requests.
Effective July 25, 2023, under the credit agreement (the “Credit Agreement”), the aggregate commitment amount is $600,000,000 with an additional uncommitted amount of $100,000,000. The commitment fee is an annual rate of 0.15% of the average commitment amount payable quarterly, regardless of usage, to JPMorgan, who serves as the agent to the syndicate. The commitment fee is allocated among the Portfolio and certain other funds managed by New York Life Investments based upon their respective net assets and other factors. Interest on any revolving credit loan is charged based upon the Federal Funds Rate, Daily Simple Secured Overnight Financing Rate ("SOFR") + 0.10%, or the Overnight Bank Funding Rate, whichever is higher. The Credit Agreement expires on July 23, 2024, although the Portfolio, certain other funds managed by New York Life Investments and the syndicate of banks may renew the Credit Agreement for an additional year on the same or different terms or enter into a credit agreement with a different syndicate of banks. Prior to July 25, 2023, the aggregate commitment amount and the commitment fee were the same as those under the current Credit Agreement. During the year ended December 31, 2023, there were no borrowings made or outstanding with respect to the Portfolio under the Credit Agreement.
Note 7–Interfund Lending Program
Pursuant to an exemptive order issued by the SEC, the Portfolio, along with certain other funds managed by New York Life Investments, may participate in an interfund lending program. The interfund lending program provides an alternative credit facility that permits the Portfolio and certain other funds managed by New York Life Investments to lend or borrow money for temporary purposes directly to or from one another, subject to the conditions of the exemptive order. During the year ended December 31, 2023, there were no interfund loans made or outstanding with respect to the Portfolio.
Note 8–Purchases and Sales of Securities (in 000’s)
During the year ended December 31, 2023, purchases and sales of securities, other than short-term securities, were $307,520 and $368,317, respectively.
Note 9–Capital Share Transactions
Transactions in capital shares for the years ended December 31, 2023 and December 31, 2022, were as follows:
| Initial Class | Shares | Amount |
| Year ended December 31, 2023: | | |
| Shares sold | 3,386,394 | $ 40,152,127 |
| Shares issued to shareholders in reinvestment of distributions | 620,463 | 7,514,547 |
| Shares redeemed | (8,887,032) | (107,337,171) |
| Net increase (decrease) | (4,880,175) | $ (59,670,497) |
| Year ended December 31, 2022: | | |
| Shares sold | 10,407,226 | $ 117,317,650 |
| Shares issued to shareholders in reinvestment of distributions | 365,214 | 4,193,860 |
| Shares redeemed | (10,531,284) | (120,252,694) |
| Net increase (decrease) | 241,156 | $ 1,258,816 |
Note 10–Other Matters
As of the date of this report, the Portfolio faces a heightened level of risk associated with current uncertainty, volatility and state of economies, financial markets, rising interest rates, and labor and health conditions around the world. Events such as war, acts of terrorism, recessions, rapid inflation, the imposition of international sanctions, earthquakes, hurricanes, epidemics and pandemics and other unforeseen natural or human disasters may have broad adverse social, political and economic effects on the global economy, which could negatively impact the value of the Portfolio's investments. Developments that disrupt global economies and financial markets may magnify factors that affect the Portfolio's performance.
Note 11–Subsequent Events
In connection with the preparation of the financial statements of the Portfolio as of and for the year ended December 31, 2023, events and transactions subsequent to December 31, 2023, through the date the financial statements were issued, have been evaluated by the Manager for possible adjustment and/or disclosure. No subsequent events requiring financial statement adjustment or disclosure have been identified.
Report of Independent Registered Public Accounting Firm
To the Board of Trustees of MainStay VP Funds Trust and Shareholders of MainStay VP Natural Resources Portfolio
Opinion on the Financial Statements
We have audited the accompanying statement of assets and liabilities, including the portfolio of investments, of MainStay VP Natural Resources Portfolio (one of the portfolios constituting MainStay VP Funds Trust, referred to hereafter as the “Portfolio”) as of December 31, 2023, the related statement of operations for the year ended December 31, 2023, the statements of changes in net assets for each of the two years in the period ended December 31, 2023, including the related notes, and the financial highlights for each of the five years in the period ended December 31, 2023 (collectively referred to as the “financial statements”). In our opinion, the financial statements present fairly, in all material respects, the financial position of the Portfolio as of December 31, 2023, the results of its operations for the year then ended, the changes in its net assets for each of the two years in the period ended December 31, 2023 and the financial highlights for each of the five years in the period ended December 31, 2023 in conformity with accounting principles generally accepted in the United States of America.
Basis for Opinion
These financial statements are the responsibility of the Portfolio’s management. Our responsibility is to express an opinion on the Portfolio’s financial statements based on our audits. We are a public accounting firm registered with the Public Company Accounting Oversight Board (United States) (PCAOB) and are required to be independent with respect to the Portfolio in accordance with the U.S. federal securities laws and the applicable rules and regulations of the Securities and Exchange Commission and the PCAOB.
We conducted our audits of these financial statements in accordance with the standards of the PCAOB. Those standards require that we plan and perform the audit to obtain reasonable assurance about whether the financial statements are free of material misstatement, whether due to error or fraud.
Our audits included performing procedures to assess the risks of material misstatement of the financial statements, whether due to error or fraud, and performing procedures that respond to those risks. Such procedures included examining, on a test basis, evidence regarding the amounts and disclosures in the financial statements. Our audits also included evaluating the accounting principles used and significant estimates made by management, as well as evaluating the overall presentation of the financial statements. Our procedures included confirmation of securities owned as of December 31, 2023 by correspondence with the custodian and transfer agents. We believe that our audits provide a reasonable basis for our opinion.
/s/PricewaterhouseCoopers LLP
New York, New York
February 26, 2024
We have served as the auditor of one or more investment companies in the MainStay group of funds since 1984.
| 24 | MainStay VP Natural Resources Portfolio |
Board Consideration and Approval of Management Agreement and Subadvisory Agreement (Unaudited)
The continuation of the Management Agreement with respect to the MainStay VP Natural Resources Portfolio (“Portfolio”) and New York Life Investment Management LLC (“New York Life Investments”) and the Subadvisory Agreement between New York Life Investments and Newton Investment Management North America, LLC (“Newton”) with respect to the Portfolio (together, “Advisory Agreements”) is subject to annual review and approval by the Board of Trustees of MainStay VP Funds Trust (“Board” of the “Trust”) in accordance with Section 15 of the Investment Company Act of 1940, as amended (“1940 Act”). At its December 6–7, 2023 meeting, the Board, including the Trustees who are not an “interested person” (as such term is defined in the 1940 Act) of the Trust (“Independent Trustees”) voting separately, unanimously approved the continuation of each of the Advisory Agreements for a one-year period.
In reaching the decision to approve the continuation of each of the Advisory Agreements, the Board considered information and materials furnished by New York Life Investments and Newton in connection with an annual contract review process undertaken by the Board that took place at meetings of the Board and its Contracts Committee from September 2023 through December 2023, including information and materials furnished by New York Life Investments and Newton in response to requests prepared on behalf of the Board, and in consultation with the Independent Trustees, by independent legal counsel to the Independent Trustees, which encompassed a variety of topics, including those summarized below. Information and materials requested by and furnished to the Board for consideration in connection with the contract review process included, among other items, reports on the Portfolio and “peer funds” prepared by Institutional Shareholder Services Inc. (“ISS”), an independent third-party service provider engaged by the Board to report objectively on the Portfolio’s investment performance, management fee and total expenses. The Board also considered information on the fees charged to other investment advisory clients of New York Life Investments and/or Newton that follow investment strategies similar to those of the Portfolio, if any, and, when applicable, the rationale for differences in the Portfolio’s management and subadvisory fees and the fees charged to those other investment advisory clients. In addition, the Board considered information regarding the legal standards and fiduciary obligations applicable to its consideration of the continuation of each of the Advisory Agreements. The contract review process, including the structure and format for information and materials provided to the Board, has been developed in consultation with the Board. The Independent Trustees also met in executive sessions with their independent legal counsel and, for portions thereof, with senior management of New York Life Investments.
The Board’s deliberations with respect to the continuation of each of the Advisory Agreements reflect a year-long process, and the Board also took into account information furnished to the Board and its Committees throughout the year, as deemed relevant and appropriate by the Trustees, including, among other items, reports on investment performance of the Portfolio and investment-related matters for the Portfolio as well as presentations from New York Life Investments and, generally annually, Newton personnel. In addition, the Board took into account other
information provided by New York Life Investments throughout the year, including, among other items, periodic reports on legal and compliance matters, risk management, portfolio turnover, brokerage commissions and non-advisory services provided to the Portfolio by New York Life Investments, as deemed relevant and appropriate by the Trustees.
In addition to information provided to the Board throughout the year, the Board received information in connection with its June 2023 meeting provided specifically in response to requests prepared on behalf of the Board, and in consultation with the Independent Trustees, by independent legal counsel to the Independent Trustees regarding the Portfolio’s distribution arrangements. In addition, the Board received information regarding the Portfolio’s asset levels and share purchase and redemption activity, among other information.
In considering the continuation of each of the Advisory Agreements, the Trustees reviewed and evaluated the information and factors they believed to reasonably be necessary and appropriate in light of legal advice furnished to them by independent legal counsel to the Independent Trustees and through the exercise of their own business judgment. Although individual Trustees may have weighed certain factors or information differently and the Board did not consider any single factor or information controlling in reaching its decision, the factors that figured prominently in the Board’s consideration of the continuation of each of the Advisory Agreements are summarized in more detail below and include, among other factors: (i) the nature, extent and quality of the services provided to the Portfolio by New York Life Investments and Newton; (ii) the qualifications of the portfolio managers of the Portfolio and the historical investment performance of the Portfolio, New York Life Investments and Newton; (iii) the costs of the services provided, and profits realized, by New York Life Investments and Newton with respect to their relationships with the Portfolio; (iv) the extent to which economies of scale have been realized or may be realized if the Portfolio grows and the extent to which any economies of scale have been shared, have benefited or may benefit the Portfolio’s shareholders; and (v) the reasonableness of the Portfolio’s management and subadvisory fees and total ordinary operating expenses. Although the Board recognized that comparisons between the Portfolio’s fees and expenses and those of other funds are imprecise given different terms of agreements, variations in fund strategies and other factors, the Board considered the reasonableness of the Portfolio’s management fee and total ordinary operating expenses as compared to the peer funds identified by ISS. Throughout their considerations, the Trustees acknowledged the commitment of New York Life Investments and its affiliates to serve the MainStay Group of Funds, as well as their capacity, experience, resources, financial stability and reputations. The Trustees also acknowledged the entrepreneurial and other risks assumed by New York Life Investments in sponsoring and managing the Portfolio. With respect to the Subadvisory Agreement, the Board took into account New York Life Investments’ recommendation to approve the continuation of the Subadvisory Agreement.
The Trustees noted that, throughout the year, the Trustees are afforded an opportunity to ask questions of, and request additional information or materials from, New York Life Investments and Newton. The Board’s
Board Consideration and Approval of Management Agreement and Subadvisory Agreement (Unaudited) (continued)
decision with respect to each of the Advisory Agreements may have also been based, in part, on the Board’s knowledge of New York Life Investments and Newton resulting from, among other things, the Board’s consideration of each of the Advisory Agreements in prior years, the advisory agreements for other funds in the MainStay Group of Funds, the Board’s review throughout the year of the performance and operations of other funds in the MainStay Group of Funds and each Trustee’s business judgment and industry experience. In addition to considering the above-referenced factors, the Board observed that in the marketplace, notably under variable life insurance policies and variable annuity contracts for which the Portfolio serves as an investment option, there are a range of investment options available to investors and that the Portfolio’s shareholders, having had the opportunity to consider other investment options, have invested in the Portfolio.
The factors that figured prominently in the Board’s decision to approve the continuation of each of the Advisory Agreements during the Board’s December 6–7, 2023 meeting are summarized in more detail below.
Nature, Extent and Quality of Services Provided by New York Life Investments and Newton
The Board examined the nature, extent and quality of the services that New York Life Investments provides to the Portfolio. The Board evaluated New York Life Investments’ experience and capabilities in serving as manager of the Portfolio and considered that the Portfolio operates in a “manager-of-managers” structure. The Board also considered New York Life Investments’ responsibilities and services provided pursuant to this structure, including overseeing the services provided by Newton, evaluating the performance of Newton, making recommendations to the Board as to whether the Subadvisory Agreement should be renewed, modified or terminated and periodically reporting to the Board regarding the results of New York Life Investments’ evaluation and monitoring functions. The Board noted that New York Life Investments manages other mutual funds, serves a variety of other investment advisory clients, including other pooled investment vehicles, and has experience overseeing mutual fund service providers, including subadvisors. The Board considered the experience of senior personnel at New York Life Investments providing management and administrative and other non-advisory services to the Portfolio. The Board observed that New York Life Investments devotes significant resources and time to providing management and administrative and other non-advisory services to the Portfolio, including New York Life Investments’ oversight and due diligence reviews of Newton and ongoing analysis of, and interactions with, Newton with respect to, among other things, the Portfolio’s investment performance and risks as well as Newton’s investment capabilities and subadvisory services with respect to the Portfolio.
The Board also considered the range of services that New York Life Investments provides to the Portfolio under the terms of the Management Agreement, including: (i) fund accounting and ongoing supervisory services provided by New York Life Investments’ Fund Administration and Accounting Group; (ii) investment supervisory and analytical services provided by New York Life Investments’ Investment Consulting Group; (iii)
compliance services provided by the Trust’s Chief Compliance Officer as well as New York Life Investments’ compliance department, including supervision and implementation of the Portfolio’s compliance program; (iv) legal services provided by New York Life Investments’ Office of the General Counsel; and (v) risk management monitoring and analysis by compliance and investment personnel. In addition, the Board considered New York Life Investments’ willingness to invest in personnel and other resources, such as cyber security, information security and business continuity planning, that may benefit the Portfolio and noted that New York Life Investments is responsible for compensating the Trust’s officers, except for a portion of the salary of the Trust’s Chief Compliance Officer. The Board recognized that New York Life Investments provides certain other non-advisory services to the Portfolio and has over time provided an increasingly broad array of non-advisory services to the MainStay Group of Funds as a result of regulatory and other developments.
The Board also examined the range, and the nature, extent and quality, of the investment advisory services that Newton provides to the Portfolio and considered the terms of each of the Advisory Agreements. The Board evaluated Newton’s experience and performance in serving as subadvisor to the Portfolio and advising other portfolios and Newton’s track record and experience in providing investment advisory services as well as the experience of investment advisory, senior management and administrative personnel at Newton. The Board considered New York Life Investments’ and Newton’s overall resources, legal and compliance environment, capabilities, reputation, financial condition and history. In addition to information provided in connection with quarterly meetings with the Trust’s Chief Compliance Officer, the Board considered information regarding the compliance policies and procedures of New York Life Investments and Newton and acknowledged their commitment to further developing and strengthening compliance programs that may relate to the Portfolio. The Board also considered Newton’s ability to recruit and retain qualified investment professionals and willingness to invest in personnel and other resources that may benefit the Portfolio. In this regard, the Board considered the qualifications and experience of the Portfolio’s portfolio managers, the number of accounts managed by the portfolio managers and the method for compensating the portfolio managers.
In addition, the Board considered information provided by New York Life Investments and Newton regarding their respective business continuity and disaster recovery plans.
Based on these considerations, among others, the Board concluded that the Portfolio would likely continue to benefit from the nature, extent and quality of these services.
Investment Performance
In evaluating the Portfolio’s investment performance, the Board considered investment performance results over various periods in light of the Portfolio’s investment objective, strategies and risks. The Board considered investment reports on, and analysis of, the Portfolio’s performance provided to the Board throughout the year. These reports include, among other items, information on the Portfolio’s gross and net
| 26 | MainStay VP Natural Resources Portfolio |
returns, the Portfolio’s investment performance compared to a relevant investment category and the Portfolio’s benchmark, the Portfolio’s risk-adjusted investment performance and the Portfolio’s investment performance as compared to peer funds, as appropriate, as well as portfolio attribution information and commentary on the effect of market conditions. The Board also considered information provided by ISS showing the investment performance of the Portfolio as compared to peer funds. In addition, the Board reviewed the methodology used by ISS to construct the group of peer funds for comparative purposes.
The Board also took into account its discussions with senior management at New York Life Investments concerning the Portfolio’s investment performance over various periods as well as discussions between representatives of Newton and the members of the Board’s Investment Committee, which generally occur on an annual basis.
Based on these considerations, among others, the Board concluded that its review of the Portfolio’s investment performance and related information supported a determination to approve the continuation of each of the Advisory Agreements.
Costs of the Services Provided, and Profits and Other Benefits Realized, by New York Life Investments and Newton
The Board considered the costs of the services provided under each of the Advisory Agreements. The Board also considered the profitability of New York Life Investments and its affiliates and Newton due to their relationships with the Portfolio as well as by New York Life Investments and its affiliates due to their relationships with the MainStay Group of Funds. With respect to the profitability of Newton’s relationship with the Portfolio, the Board considered information from New York Life Investments that Newton’s subadvisory fee reflected an arm’s-length negotiation and that this fee is paid by New York Life Investments, not the Portfolio, and the relevance of Newton’s profitability was considered by the Trustees in that context. On this basis, the Board primarily considered the costs and profitability for New York Life Investments and its affiliates with respect to the Portfolio.
In addition, the Board acknowledged the difficulty in obtaining reliable comparative data about mutual fund managers’ profitability because such information generally is not publicly available and may be impacted by numerous factors, including the structure of a fund manager’s organization, the types of funds it manages, the methodology used to allocate certain fixed costs to specific funds and the manager’s capital structure and costs of capital.
In evaluating the costs of the services provided by New York Life Investments and Newton, and profitability of New York Life Investments and its affiliates and Newton due to their relationships with the Portfolio, the Board considered, among other factors, New York Life Investments’ and its affiliates’ and Newton’s continuing investments in, or willingness to invest in, personnel and other resources that may support and further enhance the management of the Portfolio, and that New York Life Investments is responsible for paying the subadvisory fee for the Portfolio. The Board also considered the financial resources of New York
Life Investments and Newton and acknowledged that New York Life Investments and Newton must be in a position to recruit and retain experienced professional personnel and to maintain a strong financial position for New York Life Investments and Newton to continue to provide high-quality services to the Portfolio. The Board recognized that the Portfolio benefits from the allocation of certain fixed costs among the funds in the MainStay Group of Funds, among other expected benefits resulting from its relationship with New York Life Investments.
The Board considered information regarding New York Life Investments’ methodology for calculating profitability and allocating costs provided by New York Life Investments in connection with the fund profitability analysis presented to the Board. The Board concluded that New York Life Investments’ methods for allocating costs and procedures for estimating overall profitability of the relationship with the funds in the MainStay Group of Funds were reasonable. The Board recognized the difficulty in calculating and evaluating a manager’s profitability with respect to the Portfolio and considered that other profitability methodologies may also be reasonable.
The Board also considered certain fall-out benefits that may be realized by New York Life Investments and its affiliates and Newton and its affiliates due to their relationships with the Portfolio, including reputational and other indirect benefits. The Board recognized, for example, the benefits to Newton from legally permitted “soft-dollar” arrangements by which brokers provide research and other services to Newton in exchange for commissions paid by the Portfolio with respect to trades in the Portfolio’s portfolio securities. In this regard, the Board also requested and considered information from New York Life Investments concerning other material business relationships between Newton and its affiliates and New York Life Investments and its affiliates that relates to certain current and future products and represents a potential conflict of interest associated with New York Life Investments’ recommendation to approve the Subadvisory Agreement. In addition, the Board considered its review of the management agreement for a money market fund advised by New York Life Investments and an affiliated subadvisor that serves as an investment option for the Portfolio, including the potential rationale for and costs associated with investments in this money market fund by the Portfolio, if any, and considered information from New York Life Investments that the nature and type of specific investment advisory services provided to this money market fund are distinct from, or in addition to, the investment advisory services provided to the Portfolio. In addition, the Board considered the potential dividend received tax deduction for insurance company affiliates of New York Life Investments from the Portfolio’s securities lending activity.
The Board noted that the Portfolio serves as an investment option primarily under variable contracts issued by affiliates of New York Life Investments that would receive fees under those contracts. The Board observed that, in addition to fees earned by New York Life Investments under the Management Agreement for managing the Portfolio, New York Life Investments’ affiliates also earn revenues from serving the Portfolio in various other capacities. The Board considered information about these other revenues and their impact on the profitability of the relationship with
Board Consideration and Approval of Management Agreement and Subadvisory Agreement (Unaudited) (continued)
the Portfolio to New York Life Investments and its affiliates. The Board noted that, although it assessed the overall profitability of the relationship with the Portfolio to New York Life Investments and its affiliates as part of the contract review process, when considering the reasonableness of the fee paid to New York Life Investments under the Management Agreement, the Board considered the profitability of New York Life Investments’ relationship with the Portfolio on a pre-tax basis and without regard to distribution expenses incurred by New York Life Investments from its own resources.
After evaluating the information deemed relevant by the Trustees, the Board concluded that any profits realized by New York Life Investments and its affiliates due to their relationships with the Portfolio were not excessive, other expected benefits that may accrue to New York Life Investments and its affiliates are reasonable and other expected benefits that may accrue to Newton and its affiliates are consistent with those expected for a subadvisor to a mutual fund. With respect to Newton, the Board considered that any profits realized by Newton due to its relationship with the Portfolio are the result of arm’s-length negotiations between New York Life Investments and Newton, acknowledging that any such profits are based on the subadvisory fee paid to Newton by New York Life Investments, not the Portfolio.
Management and Subadvisory Fees and Total Ordinary Operating Expenses
The Board evaluated the reasonableness of the fee paid under each of the Advisory Agreements and the Portfolio’s total ordinary operating expenses. With respect to the management fee and subadvisory fee, the Board primarily considered the reasonableness of the management fee paid by the Portfolio to New York Life Investments because the subadvisory fee paid to Newton is paid by New York Life Investments, not the Portfolio. The Board also considered the reasonableness of the subadvisory fee paid by New York Life Investments and the amount of the management fee retained by New York Life Investments.
In assessing the reasonableness of the Portfolio’s fees and expenses, the Board primarily considered comparative data provided by ISS on the fees and expenses of similar mutual funds managed by other investment advisers. The Board reviewed the methodology used by ISS to construct the group of peer funds for comparative purposes. In addition, the Board considered information provided by New York Life Investments and Newton on fees charged to other investment advisory clients, including institutional separate accounts and/or other funds, that follow investment strategies similar to those of the Portfolio, if any. The Board considered the contractual management fee schedule for the Portfolio as compared to those for such other investment advisory clients, taking into account the rationale for differences in fee schedules. The Board also took into account information provided by New York Life Investments about the more extensive scope of services provided to registered investment companies, such as the Portfolio, as compared with other investment advisory clients. Additionally, the Board considered the impact of contractual breakpoints and voluntary waivers on the Portfolio’s net
management fee and expenses. The Board also considered that in proposing fees for the Portfolio, New York Life Investments considers the competitive marketplace for mutual funds.
Based on the factors outlined above, among other considerations, the Board concluded that the Portfolio’s management fee and total ordinary operating expenses are within a range that is competitive and support a conclusion that these fees and expenses are reasonable.
Economies of Scale
The Board considered information regarding economies of scale, including whether economies of scale may exist with respect to the Portfolio and whether the Portfolio’s management fee and expense structure permits any economies of scale to be appropriately shared with the Portfolio’s shareholders. The Board also considered a report from New York Life Investments, previously prepared at the request of the Board, that addressed economies of scale, including with respect to the mutual fund business generally, and the various ways in which the benefits of economies of scale may be shared with the funds in the MainStay Group of Funds. Although the Board recognized the difficulty of determining economies of scale with precision, the Board acknowledged that economies of scale may be shared with the Portfolio in a number of ways, including, for example, through the imposition of fee breakpoints, initially setting management fee rates at scale or making additional investments to enhance the services provided to the Portfolio. The Board reviewed information from New York Life Investments showing how the Portfolio’s management fee schedule compared to fee schedules of other funds and accounts managed by New York Life Investments. The Board also reviewed information from ISS showing how the Portfolio’s management fee schedule compared with fees paid for similar services by peer funds at varying asset levels.
Based on this information, the Board concluded that economies of scale are appropriately shared for the benefit of the Portfolio’s shareholders through the Portfolio’s management fee and expense structure and other methods to share benefits from economies of scale.
Conclusion
On the basis of the information and factors summarized above, among other information and factors deemed relevant by the Trustees, and the evaluation thereof, the Board, including the Independent Trustees voting separately, unanimously voted to approve the continuation of each of the Advisory Agreements.
| 28 | MainStay VP Natural Resources Portfolio |
Proxy Voting Policies and Procedures and Proxy Voting Record
The Portfolio is required to file with the SEC its proxy voting record for the 12-month period ending June 30 on Form N-PX. A description of the policies and procedures that are used to vote proxies relating to portfolio securities of the Portfolio is available free of charge upon request by calling 800-598-2019 or visiting the SEC's website at www.sec.gov. The most recent Form N-PX or proxy voting record is available free of charge upon request by calling 800-598-2019; visiting https://www.newyorklifeinvestments.com/investment-products/vp; or visiting the SEC’s website at www.sec.gov.
Shareholder Reports and Quarterly Portfolio Disclosure
The Portfolio is required to file its complete schedule of portfolio holdings with the SEC 60 days after its first and third fiscal quarter on Form N-PORT. The Portfolio's holdings report is available free of charge upon request by calling 800-598-2019 or by visiting the SEC’s website at www.sec.gov.
Board of Trustees and Officers (Unaudited)
The Trustees and officers of the Portfolio are listed below. The Board oversees the MainStay Group of Funds (which consists of MainStay Funds and MainStay Funds Trust), MainStay VP Funds Trust, MainStay MacKay DefinedTerm Municipal Opportunities Fund, MainStay CBRE Global Infrastructure Megatrends Term Fund, the Manager and the Subadvisors, and elects the officers of the Portfolios who are responsible for the day-to-day operations of the Portfolio. Information pertaining to the Trustees and officers is set forth below. Each Trustee serves until his or her successor is elected and qualified or until his or her resignation,
death or removal. Under the Board’s retirement policy, unless an exception is made, a Trustee must tender his or her resignation by the end of the calendar year during which he or she reaches the age of 75. Officers are elected annually by the Board. The business address of each Trustee and officer listed below is 51 Madison Avenue, New York, New York 10010. A majority of the Trustees are not “interested persons” (as defined by the 1940 Act and rules adopted by the SEC thereunder) of the Portfolio (“Independent Trustees”).
| | Name and
Year of Birth | Term of Office,
Position(s) Held and
Length of Service | Principal Occupation(s)
During Past Five Years | Number of
Portfolios in
Fund Complex
Overseen by
Trustee | Other Directorships
Held by Trustee |
| | | | | | |
| | Naïm Abou-Jaoudé*
1966 | MainStay VP Funds Trust: Trustee since 2023 | Chief Executive Officer of New York Life Investment Management LLC (since 2023). Chief Executive Officer of Candriam (an affiliate of New York Life Investment Management LLC) (2007 to 2023). | 81 | MainStay Funds: Trustee since 2023 (11 Funds)
MainStay Funds Trust: Trustee since 2023 (37 Funds);
MainStay MacKay DefinedTerm Municipal Opportunities Fund: Trustee since 2023;
MainStay CBRE Global Infrastructure Megatrends Term Fund: Trustee since 2023; and
New York Life Investment Management International (Chair) since 2015 |
| * | This Trustee is considered to be an “interested person” of the MainStay Group of Funds, MainStay VP Funds Trust, MainStay CBRE Global Infrastructure Megatrends Term Fund and MainStay MacKay DefinedTerm Municipal Opportunities Fund, within the meaning of the 1940 Act because of his affiliation with New York Life Investment Management LLC and Candriam, as described in detail above in the column entitled “Principal Occupation(s) During Past Five Years.” |
| | |
| 30 | MainStay VP Natural Resources Portfolio |
| | Name and
Year of Birth | Term of Office,
Position(s) Held and
Length of Service | Principal Occupation(s)
During Past Five Years | Number of
Portfolios in
Fund Complex
Overseen by
Trustee | Other Directorships
Held by Trustee |
| | | | | | |
| | David H. Chow
1957 | MainStay VP Funds Trust: Trustee since January 2016, Advisory Board Member (June 2015 to December 2015) | Founder and CEO, DanCourt Management, LLC since 1999 | 81 | MainStay Funds: Trustee since January 2016, Advisory Board Member (June 2015 to December 2015) (11 Funds);
MainStay Funds Trust: Trustee since January 2016, Advisory Board Member (June 2015 to December 2015) (37 Funds);
MainStay MacKay DefinedTerm Municipal Opportunities Fund: Trustee since January 2016, Advisory Board Member (June 2015 to December 2015);
MainStay CBRE Global Infrastructure Megatrends Term Fund: Trustee since 2021;
VanEck Vectors Group of Exchange-Traded Funds: Trustee since 2006 and Independent Chairman of the Board of Trustees from 2008 to 2022 (57 portfolios); and
Berea College of Kentucky: Trustee since 2009, Chair of the Investment Committee since 2018 |
| | Karen Hammond
1956 | MainStay VP Funds Trust: Trustee since December 2021, Advisory Board Member (June 2021 to December 2021)
| Retired, Managing Director, Devonshire Investors (2007 to 2013); Senior Vice President, Fidelity Management & Research Co. (2005 to 2007); Senior Vice President and Corporate Treasurer, FMR Corp. (2003 to 2005); Chief Operating Officer, Fidelity Investments Japan (2001 to 2003) | 81 | MainStay Funds: Trustee since December 2021, Advisory Board Member (June 2021 to December 2021) (11 Funds);
MainStay Funds Trust: Trustee since December 2021, Advisory Board Member (June 2021 to December 2021) (37 Funds);
MainStay MacKay DefinedTerm Municipal Opportunities Fund: Trustee since December 2021, Advisory Board Member (June 2021 to December 2021);
MainStay CBRE Global Infrastructure Megatrends Term Fund: Trustee since December 2021, Advisory Board Member (June 2021 to December 2021);
Two Harbors Investment Corp.: Director since 2018;
Rhode Island State Investment Commission: Member since 2017; and
Blue Cross Blue Shield of Rhode Island: Director since 2019 |
| | Susan B. Kerley
1951 | MainStay VP Funds Trust: Chair since 2017 and Trustee since 2007** | President, Strategic Management Advisors LLC since 1990 | 81 | MainStay Funds: Chair since January 2017 and Trustee since 2007 (11 Funds); MainStay Funds Trust: Chair since January 2017 and Trustee since 1990 (37 Funds)***;
MainStay MacKay DefinedTerm Municipal Opportunities Fund: Chair since January 2017 and Trustee since 2011;
MainStay CBRE Global Infrastructure Megatrends Term Fund: Trustee since June 2021; and
Legg Mason Partners Funds: Trustee since 1991 (45 portfolios) |
Board of Trustees and Officers (Unaudited) (continued)
| | Name and
Year of Birth | Term of Office,
Position(s) Held and
Length of Service | Principal Occupation(s)
During Past Five Years | Number of
Portfolios in
Fund Complex
Overseen by
Trustee | Other Directorships
Held by Trustee |
| | | | | | |
| | Alan R. Latshaw
1951 | MainStay VP Funds Trust: Trustee since 2007** | Retired; Partner, Ernst & Young LLP (2002 to 2003); Partner, Arthur Andersen LLP (1989 to 2002); Consultant to the MainStay Funds Audit and Compliance Committee (2004 to 2006) | 81 | MainStay Funds: Trustee since 2006 (11 Funds);
MainStay Funds Trust: Trustee since 2007 (37 Funds)***;
MainStay MacKay DefinedTerm Municipal Opportunities Fund: Trustee since 2011; and
MainStay CBRE Global Infrastructure Megatrends Term Fund: Trustee since June 2021 |
| | Jacques P. Perold
1958 | MainStay VP Funds Trust: Trustee since January 2016, Advisory Board Member (June 2015 to December 2015) | Founder and Chief Executive Officer, CapShift Advisors LLC (since 2018); President, Fidelity Management & Research Company (2009 to 2014); President and Chief Investment Officer, Geode Capital Management, LLC (2001 to 2009) | 81 | MainStay Funds: Trustee since January 2016, Advisory Board Member (June 2015 to December 2015) (11 Funds);
MainStay Funds Trust: Trustee since January 2016, Advisory Board Member (June 2015 to December 2015) (37 Funds);
MainStay MacKay DefinedTerm Municipal Opportunities Fund: Trustee since January 2016, Advisory Board Member (June 2015 to December 2015);
MainStay CBRE Global Infrastructure Megatrends Term Fund: Trustee since June 2021;
Allstate Corporation: Director since 2015;
Partners in Health: Trustee since 2019; and
MSCI Inc.: Director since 2017 |
| | Richard S. Trutanic
1952 | MainStay VP Funds Trust: Trustee since 2007** | Chairman and Chief Executive Officer, Somerset & Company (financial advisory firm) since 2004; Managing Director, The Carlyle Group (private investment firm) (2002 to 2004); Senior Managing Director, Partner and Board Member, Groupe Arnault S.A. (private investment firm) (1999 to 2002) | 81 | MainStay Funds: Trustee since 1994 (11 Funds);
MainStay Funds Trust: Trustee since 2007 (37 Funds)***;
MainStay MacKay DefinedTerm Municipal Opportunities Fund: Trustee since 2011; and
MainStay CBRE Global Infrastructure Megatrends Term Fund: Trustee since June 2021 |
| ** | Includes prior service as a Director of MainStay VP Series Fund, Inc., the predecessor to MainStay VP Funds Trust. |
| *** | Includes prior service as a Director/Trustee of certain predecessor entities to MainStay Funds Trust. |
| 32 | MainStay VP Natural Resources Portfolio |
| | Name and
Year of Birth | Position(s) Held and
Length of Service | Principal Occupation(s)
During Past Five Years | |
| | | | | |
| | Kirk C. Lehneis
1974 | President, MainStay VP Funds Trust (since 2017) | Chief Operating Officer and Senior Managing Director (since 2016), New York Life Investment Management LLC and New York Life Investment Management Holdings LLC; Member of the Board of Managers (since 2017) and Senior Managing Director (since 2018), NYLIFE Distributors LLC; Chairman of the Board and Senior Managing Director, NYLIM Service Company LLC (since 2017); Trustee, President and Principal Executive Officer of IndexIQ Trust, IndexIQ ETF Trust and IndexIQ Active ETF Trust (since 2018); President, MainStay CBRE Global Infrastructure Megatrends Term Fund (since 2021), MainStay MacKay DefinedTerm Municipal Opportunities Fund, MainStay Funds and MainStay Funds Trust (since 2017); Senior Managing Director, Global Product Development (from 2015 to 2016); Managing Director, Product Development (from 2010 to 2015), New York Life Investment Management LLC | |
| | Jack R. Benintende
1964 | Treasurer and Principal Financial and Accounting Officer, MainStay VP Funds Trust (since 2007)** | Managing Director, New York Life Investment Management LLC (since 2007); Treasurer and Principal Financial and Accounting Officer, MainStay CBRE Global Infrastructure Megatrends Term Fund (since 2021), MainStay MacKay DefinedTerm Municipal Opportunities Fund (since 2011), MainStay Funds Trust (since 2009) and MainStay Funds (since 2007); and Assistant Treasurer, New York Life Investment Management Holdings LLC (2008 to 2012) | |
| | J. Kevin Gao
1967 | Secretary and Chief Legal Officer, MainStay VP Funds Trust (since 2010)** | Managing Director and Associate General Counsel, New York Life Investment Management LLC (since 2010); Secretary and Chief Legal Officer, MainStay CBRE Global Infrastructure Megatrends Term Fund (since 2021), MainStay MacKay DefinedTerm Municipal Opportunities Fund (since 2011), MainStay Funds and MainStay Funds Trust (since 2010) | |
| | Kevin M. Gleason
1967 | Vice President and Chief Compliance Officer, MainStay VP Funds Trust (since June 2022) | Vice President and Chief Compliance Officer, IndexIQ Trust, IndexIQ ETF Trust and IndexIQ Active ETF Trust (since June 2022); Vice President and Chief Compliance Officer, MainStay CBRE Global Infrastructure Megatrends Term Fund, MainStay MacKay DefinedTerm Municipal Opportunities Fund (since June 2022); MainStay Funds Trust and MainStay Funds (since June 2022); Senior Vice President, Voya Investment Management and Chief Compliance Officer, Voya Family of Funds (2012 to 2022) | |
| | Scott T. Harrington
1959 | Vice President— Administration, MainStay VP Funds Trust (since 2005)** | Managing Director, New York Life Investment Management LLC (including predecessor advisory organizations) (since 2000); Member of the Board of Directors, New York Life Trust Company (since 2009); Vice President—Administration, MainStay CBRE Global Infrastructure Megatrends Term Fund (since 2021), MainStay MacKay DefinedTerm Municipal Opportunities Fund (since 2011), MainStay Funds Trust and MainStay Funds (since 2009) | |
| * | The officers listed above are considered to be “interested persons” of the MainStay Group of Funds, MainStay VP Funds Trust, MainStay CBRE Global Infrastructure Megatrends Term Fund and MainStay MacKay DefinedTerm Municipal Opportunities Fund within the meaning of the 1940 Act because of their affiliation with the MainStay Group of Funds, New York Life Insurance Company and/or its affiliates, including New York Life Investment Management LLC, New York Life Insurance Company, NYLIM Service Company LLC, NYLIFE Securities LLC and/or NYLIFE Distributors LLC, as described in detail in the column captioned “Principal Occupation(s) During Past Five Years.” Officers are elected annually by the Board. |
| ** | Includes prior service as an Officer of MainStay VP Series Fund, Inc., the predecessor to MainStay VP Funds Trust. |
Officers of the Trust (Who are not Trustees)*
This page intentionally left blank
MainStay VP Portfolios
MainStay VP offers a wide range of Portfolios. The full array of MainStay VP offerings is listed here, with information about the manager, subadvisors, legal counsel, and independent registered public accounting firm.
Equity
MainStay VP American Century Sustainable Equity Portfolio
MainStay VP Candriam Emerging Markets Equity Portfolio
MainStay VP Epoch U.S. Equity Yield Portfolio
MainStay VP Fidelity Institutional AM® Utilities Portfolio†
MainStay VP Natural Resources Portfolio
MainStay VP PineStone International Equity Portfolio1
MainStay VP S&P 500 Index Portfolio
MainStay VP Small Cap Growth Portfolio
MainStay VP Wellington Growth Portfolio
MainStay VP Wellington Mid Cap Portfolio
MainStay VP Wellington Small Cap Portfolio
MainStay VP Wellington U.S. Equity Portfolio
MainStay VP Winslow Large Cap Growth Portfolio
Mixed Asset
MainStay VP Balanced Portfolio
MainStay VP Income Builder Portfolio
MainStay VP Janus Henderson Balanced Portfolio
MainStay VP MacKay Convertible Portfolio
Income
MainStay VP Bond Portfolio
MainStay VP Floating Rate Portfolio
MainStay VP Indexed Bond Portfolio
MainStay VP MacKay Government Portfolio2
MainStay VP MacKay High Yield Corporate Bond Portfolio
MainStay VP MacKay Strategic Bond Portfolio
MainStay VP PIMCO Real Return Portfolio
Money Market
MainStay VP U.S. Government Money Market Portfolio
Alternative
MainStay VP CBRE Global Infrastructure Portfolio
MainStay VP IQ Hedge Multi-Strategy Portfolio
Asset Allocation
MainStay VP Conservative Allocation Portfolio
MainStay VP Equity Allocation Portfolio
MainStay VP Growth Allocation Portfolio
MainStay VP Moderate Allocation Portfolio
Manager
New York Life Investment Management LLC
New York, New York
Subadvisors
American Century Investment Management, Inc.
Kansas City, Missouri
Brown Advisory LLC
Baltimore, Maryland
Candriam*
Strassen, Luxembourg
CBRE Investment Management Listed Real Assets LLC
Radnor, Pennsylvania
Epoch Investment Partners, Inc.
New York, New York
FIAM LLC
Smithfield, Rhode Island
IndexIQ Advisors LLC*
New York, New York
Janus Henderson Investors US LLC
Denver, Colorado
MacKay Shields LLC*
New York, New York
Newton Investment Management North America, LLC
Boston, Massachusetts
NYL Investors LLC*
New York, New York
Pacific Investment Management Company LLC
Newport Beach, California
PineStone Asset Management Inc.
Montreal, Québec
Segall Bryant & Hamill, LLC
Chicago, Illinois
Wellington Management Company LLP
Boston, Massachusetts
Winslow Capital Management, LLC
Minneapolis, Minnesota
Legal Counsel
Dechert LLP
Washington, District of Columbia
Independent Registered Public Accounting Firm
PricewaterhouseCoopers LLP
New York, New York
Distributor
NYLIFE Distributors LLC*
Jersey City, New Jersey
Custodian
JPMorgan Chase Bank, N.A.
New York, New York
Some Portfolios may not be available in all products.
† Fidelity Institutional AM is a registered trade mark of FMR LLC. Used with permission.
* An affiliate of New York Life Investment Management LLC.
| 1. | Prior to August 28, 2023, the Portfolio's name was MainStay VP MacKay International Equity Portfolio. |
| 2. | Effective on or about May 1, 2024, the MainStay VP MacKay Government Portfolio will be renamed the MainStay VP U.S. Infrastructure Bond Portfolio. |
Not part of the Annual Report
2023 Annual Report
This report is for the general information of New York Life Variable Annuities and NYLIAC Variable Universal Life Insurance Products policyowners. It must be preceded or accompanied by the appropriate product(s) and funds prospectuses if it is given to anyone who is not an owner of a New York Life variable annuity policy or a NYLIAC Variable Universal Life Insurance Product. This report does not offer for sale or solicit orders to purchase securities.
The performance data quoted in this report represents past performance. Past performance is no guarantee of future results. Due to market volatility and other factors, current performance may be lower or higher than the figures shown. The most recent month-end performance summary for your variable annuity or variable life policy is available by calling 800-598-2019 and is updated periodically on newyorklife.com.
The New York Life Variable Annuities and NYLIAC Variable Universal Life Insurance Products are issued by New York Life Insurance and Annuity Corporation (a Delaware Corporation) and distributed by NYLIFE Distributors LLC (Member FINRA/SIPC).
New York Life Insurance Company
New York Life Insurance and Annuity
Corporation (NYLIAC) (A Delaware Corporation)
51 Madison Avenue, Room 551
New York, NY 10010
newyorklife.com
newyorklifeinvestments.com
NYLIFE Distributors LLC, 30 Hudson Street, Jersey City, NJ 07302
New York Life Investment Management LLC is the investment manager to the MainStay VP Funds Trust
©2024 by NYLIFE Distributors LLC. All rights reserved.
You may obtain copies of the Prospectus and the Statement of Additional Information free of charge, upon request, by calling toll-free 800-598-2019 or writing to New York Life Insurance and Annuity Corporation, 51 Madison Avenue, New York, NY 10010.
| Not FDIC Insured | No Bank Guarantee | May Lose Value |
(NYLIAC) NI533
MainStay VP S&P 500 Index Portfolio
Message from the President and Annual Report
December 31, 2023
Special Notice:
Beginning in July 2024, new regulations issued by the Securities and Exchange Commission (SEC) will take effect requiring open-end mutual fund companies and ETFs to (1) overhaul the content of their shareholder reports and (2) mail paper copies of the new tailored shareholder reports to shareholders who have not opted to receive these documents electronically.
If you have not yet elected to receive your shareholder reports electronically, please contact your financial intermediary or visit our website.
| Not FDIC/NCUA Insured | Not a Deposit | May Lose Value | No Bank Guarantee | Not Insured by Any Government Agency |
This page intentionally left blank
Message from the President
Against a backdrop of easing inflationary pressures and continued economic growth, stocks and bonds generally gained ground during the 12-month period ended December 31, 2023, despite high levels of volatility and sharp disparities between the performance of the different market sectors.
Although the war in Ukraine, the outbreak of hostilities in the Middle East and several other notable events affected financial assets, inflation, interest rate, and economic growth trends stood at the forefront of market developments during most of the period. As the reporting period began, high levels of inflation already showed signs of easing in the face of aggressive rate hikes by U.S. Federal Reserve (the “Fed”). From a peak of 9.1% in June 2022, the annualized U.S. inflation rate dropped to 6.4% in January, and 3.4% in December 2023. At the same time, the Fed increased the benchmark federal funds rate from 4.25%–4.50% at the beginning of reporting period, to 5.25%–5.50% as of the end of 2023. Despite the increasing cost of capital and tighter lending environment that resulted from rising rates, economic growth remained surprisingly robust, bolstered by high levels of consumer spending, low levels of unemployment and better-than-expected corporate earnings. With the pace of rate increases slowing from the prior year, investors began hoping for an early shift to a looser monetary policy, with stock prices and bond yields reacting as economic data and statements from the Fed either reinforced or undercut those hopes. Following months of hawkish rhetoric, the Fed finally reversed its stance in December 2023, signaling a positive economic outlook with little chance of a recession and a likelihood of rate cuts in 2024.
The S&P 500® Index, a widely regarded benchmark of U.S. market performance, produced strong gains during the reporting period-– recovering all its losses from 2022 and approached new record territory. A preponderance of the Index’s gains were generated by a relatively small number of mega-cap stocks in the information technology, communication services and consumer discretionary sectors that stood to benefit from rapid developments in generative artificial intelligence (“AI”). Value-oriented, interest-rate sensitive and small-capitalization
shares lagged by significant margins, although market strength widened during the closing weeks of the reporting period. Most overseas equity markets trailed the U.S. market, as developed international economies experienced relatively low growth rates, and weak economic conditions in China undermined emerging markets.
Bonds produced generally positive returns, bolstered by attractive and relatively stable yields. The yield on the 10-year Treasury note hit a high of just under 5% in mid-October 2023, ranging between approximately 3.5% and 4.8% for most of the reporting period. The yield curve remained inverted throughout the year, with the 2-year Treasury yield modestly above the 10-year yield. Corporate bond prices trended moderately higher, generally outperforming government securities. After years of low yields and tight credit spreads, the corporate sector benefited from more attractive valuations and income opportunities. Among corporates, markets generally rewarded longer duration and lower credit quality, although an uptick in default rates posed added risks for high-yield corporate bonds. International bond markets produced mixed returns, with emerging-markets issues advancing over their developed-markets counterparts.
The market volatility of recent years reminds us of the constant need for experienced and steadfast portfolio management in the face of uncertainty. New York Life Investments remains dedicated to providing you, as a valued MainStay VP investor, with the guidance, resources and investment solutions you need to pursue your financial goals.
Thank you for trusting us to help meet your investment needs.
Sincerely,
Kirk C. Lehneis
President
The opinions expressed are as of the date of this report and are subject to change. There is no guarantee that any forecast made will come to pass. This material does not constitute investment advice and is not intended as an endorsement of any specific investment. Past performance is no guarantee of future results.
Not part of the Annual Report
Investors should refer to the Portfolio’s Summary Prospectus and/or Prospectus and consider the Portfolio’s investment objectives, strategies, risks, charges and expenses carefully before investing. The Summary Prospectus and/or Prospectus contain this and other information about the Portfolio. You may obtain copies of the Portfolio’s Summary Prospectus, Prospectus and Statement of Additional Information, which includes information about the MainStay VP Funds Trust's Trustees, free of charge, upon request, by calling toll-free 800-598-2019, by writing to New York Life Insurance and Annuity Corporation, 51 Madison Avenue, Room 251, New York, New York 10010 or by sending an email to MainStayShareholdersServices@nylim.com. These documents are also available at newyorklifeinvestments.com/investment-products/vp. Please read the Portfolio's Summary Prospectus and/or Prospectus carefully before investing. MainStay VP Funds Trust portfolios are separate account options which are purchased through a variable insurance or variable annuity contract.
Investment and Performance Comparison (Unaudited)
Performance data quoted represents past performance. Past performance is no guarantee of future results. Because of market volatility and other factors, current performance may be lower or higher than the figures shown. Investment return and principal value will fluctuate, and as a result, when shares are redeemed, they may be worth more or less than their original cost. The performance table and graph do not reflect any deduction of sales charges, mortality and expense charges, contract charges or administrative charges. Please refer to the Performance Summary appropriate for your policy. For performance information current to the most recent month-end, please call 800-598-2019 or visit www.newyorklife.com.
Performance figures may reflect certain fee waivers and/or expense limitations, without which total returns may have been different. For information on current fee waivers and/or expense limitations (if any), please refer to the Notes to Financial Statements.
| Average Annual Total Returns for the Year-Ended December 31, 2023 |
| Class | Inception
Date1 | One
Year | Five
Years | Ten
Years | Gross
Expense
Ratio2 |
| Initial Class Shares | 1/29/1993 | 26.14% | 15.53% | 11.81% | 0.19% |
| Service Class Shares | 6/5/2003 | 25.83 | 15.25 | 11.53 | 0.44 |
| 1. | Effective June 13, 2022, the Portfolio replaced its subadvisor. The past performance in the graph and table prior to that date reflects the Portfolio's prior subadvisor. |
| 2. | The gross expense ratios presented reflect the Portfolio’s “Total Annual Portfolio Operating Expenses” from the most recent Prospectus and may differ from other expense ratios disclosed in this report. |
| Benchmark Performance* | One
Year | Five
Years | Ten
Years |
| S&P 500® Index1 | 26.29% | 15.69% | 12.03% |
| Morningstar Large Blend Category Average2 | 22.32 | 14.26 | 10.55 |
| * | Returns for indices reflect no deductions for fees, expenses or taxes, except for foreign withholding taxes where applicable. Results assume reinvestment of all dividends and capital gains. An investment cannot be made directly in an index. |
| 1. | The S&P 500® Index is the Portfolio's primary broad-based securities market index for comparison purposes. The S&P 500® Index is widely regarded as the standard index for measuring large-cap U.S. stock market performance. S&P® and S&P 500® are registered trademarks of Standard & Poor’s Financial Services LLC (“S&P”) and Dow Jones® is a registered trademark of Dow Jones Trademark Holdings LLC (“Dow Jones”). The foregoing trademarks have been licensed for use by S&P Dow Jones Indices LLC and sublicensed for certain purposes by New York Life Investment Management LLC. The S&P 500® Index is a product of S&P Dow Jones Indices LLC and has been licensed for use by New York Life Investment Management LLC. MainStay S&P 500 Index Portfolio is not sponsored, endorsed, sold or promoted by S&P Dow Jones Indices LLC, Dow Jones, S&P or their respective affiliates and neither S&P Dow Jones Indices LLC, Dow Jones, S&P nor their respective affiliates make any representation regarding the advisability of investing in such product(s). |
| 2. | The Morningstar Large Blend Category Average is representative of funds that represent the overall U.S. stock market in size, growth rates and price. Stocks in the top 70% of the capitalization of the U.S. equity market are defined as large cap. The blend style is assigned to funds where neither growth nor value characteristics predominate. These funds tend to invest across the spectrum of U.S. industries, and owing to their broad exposure, the funds' returns are often similar to those of the S&P 500® Index. Results are based on average total returns of similar funds with all dividends and capital gain distributions reinvested. |
Cost in Dollars of a $1,000 Investment in MainStay VP S&P 500 Index Portfolio (Unaudited)
The example below is intended to describe the fees and expenses borne by shareholders during the six-month period from July 1, 2023 to December 31, 2023, and the impact of those costs on your investment.
Example
As a shareholder of the Portfolio you incur two types of costs: (1) transaction costs, including exchange fees and sales charges (loads) on purchases (as applicable), and (2) ongoing costs, including management fees, distribution and/or service (12b-1) fees and other Portfolio expenses (as applicable). This example is intended to help you understand your ongoing costs (in dollars) of investing in the Portfolio and to compare these costs with the ongoing costs of investing in other mutual funds. The example is based on an investment of $1,000 made at the beginning of the six-month period and held for the entire period from July 1, 2023 to December 31, 2023. Shares are only sold in connection with variable life and annuity contracts and the example does not reflect any contract level or transactional fees or expenses. If these costs had been included, your costs would have been higher.
This example illustrates your Portfolio’s ongoing costs in two ways:
Actual Expenses
The second and third data columns in the table below provide information about actual account values and actual expenses. You may use the information in these columns, together with the amount you invested, to estimate the expenses that you paid during the six months ended
December 31, 2023. Simply divide your account value by $1,000 (for example, an $8,600 account value divided by $1,000 = 8.6), then multiply the result by the number under the heading entitled “Expenses Paid During Period” to estimate the expenses you paid on your account during this period.
Hypothetical Example for Comparison Purposes
The fourth and fifth data columns in the table below provide information about hypothetical account values and hypothetical expenses based on the Portfolio’s actual expense ratio and an assumed rate of return of 5% per year before expenses, which is not the Portfolio’s actual return. The hypothetical account values and expenses may not be used to estimate the actual ending account balances or expenses you paid for the six-month period shown. You may use this information to compare the ongoing costs of investing in the Portfolio with the ongoing costs of investing in other mutual funds. To do so, compare this 5% hypothetical example with the 5% hypothetical examples that appear in the shareholder reports of the other mutual funds.
Please note that the expenses shown in the table are meant to highlight your ongoing costs only and do not reflect any transactional costs, such as exchange fees or sales charges (loads). Therefore, the fourth and fifth data columns of the table are useful in comparing ongoing costs only and will not help you determine the relative total costs of owning different funds. In addition, if these transactional costs were included, your costs would have been higher.
| Share Class | Beginning
Account
Value
7/1/23 | Ending Account
Value (Based
on Actual
Returns and
Expenses)
12/31/23 | Expenses
Paid
During
Period1 | Ending Account
Value (Based
on Hypothetical
5% Annualized
Return and
Actual Expenses)
12/31/23 | Expenses
Paid
During
Period1 | Net Expense
Ratio
During
Period2 |
| Initial Class Shares | $1,000.00 | $1,079.80 | $0.63 | $1,024.60 | $0.61 | 0.12% |
| Service Class Shares | $1,000.00 | $1,078.40 | $1.94 | $1,023.34 | $1.89 | 0.37% |
| 1. | Expenses are equal to the Portfolio’s annualized expense ratio of each class multiplied by the average account value over the period, divided by 365 and multiplied by 184 (to reflect the six-month period). The table above represents the actual expenses incurred during the six-month period. In addition to the fees and expenses which the Portfolio bears directly, it also indirectly bears a pro rata share of the fees and expenses of the underlying funds in which it invests. Such indirect expenses are not included in the above-reported expense figures. |
| 2. | Expenses are equal to the Portfolio's annualized expense ratio to reflect the six-month period. |
| 6 | MainStay VP S&P 500 Index Portfolio |
Industry Composition as of December 31, 2023 (Unaudited)
| Software | 10.6% |
| Semiconductors & Semiconductor Equipment | 8.0 |
| Technology Hardware, Storage & Peripherals | 7.2 |
| Interactive Media & Services | 5.7 |
| Financial Services | 4.1 |
| Pharmaceuticals | 3.7 |
| Oil, Gas & Consumable Fuels | 3.5 |
| Broadline Retail | 3.5 |
| Banks | 3.2 |
| Capital Markets | 3.0 |
| Health Care Providers & Services | 2.8 |
| Health Care Equipment & Supplies | 2.5 |
| Hotels, Restaurants & Leisure | 2.2 |
| Insurance | 2.0 |
| Specialty Retail | 2.0 |
| Biotechnology | 2.0 |
| Automobiles | 1.9 |
| Consumer Staples Distribution & Retail | 1.8 |
| Machinery | 1.8 |
| Aerospace & Defense | 1.6 |
| Chemicals | 1.6 |
| Electric Utilities | 1.5 |
| Beverages | 1.5 |
| Life Sciences Tools & Services | 1.4 |
| IT Services | 1.2 |
| Household Products | 1.2 |
| Entertainment | 1.2 |
| Specialized REITs | 1.1 |
| Ground Transportation | 1.1 |
| Food Products | 0.9 |
| Industrial Conglomerates | 0.8 |
| Communications Equipment | 0.8 |
| Professional Services | 0.7 |
| Diversified Telecommunication Services | 0.7 |
| Media | 0.7 |
| Multi–Utilities | 0.6 |
| Electrical Equipment | 0.6% |
| Electronic Equipment, Instruments & Components | 0.6 |
| Commercial Services & Supplies | 0.6 |
| Tobacco | 0.5 |
| Textiles, Apparel & Luxury Goods | 0.5 |
| Consumer Finance | 0.5 |
| Air Freight & Logistics | 0.5 |
| Building Products | 0.5 |
| Metals & Mining | 0.4 |
| Household Durables | 0.4 |
| Energy Equipment & Services | 0.4 |
| Industrial REITs | 0.3 |
| Residential REITs | 0.3 |
| Retail REITs | 0.3 |
| Trading Companies & Distributors | 0.3 |
| Containers & Packaging | 0.2 |
| Wireless Telecommunication Services | 0.2 |
| Health Care REITs | 0.2 |
| Personal Care Products | 0.2 |
| Passenger Airlines | 0.2 |
| Real Estate Management & Development | 0.2 |
| Construction Materials | 0.2 |
| Distributors | 0.1 |
| Automobile Components | 0.1 |
| Construction & Engineering | 0.1 |
| Office REITs | 0.1 |
| Water Utilities | 0.1 |
| Gas Utilities | 0.0‡ |
| Hotel & Resort REITs | 0.0‡ |
| Independent Power and Renewable Electricity Producers | 0.0‡ |
| Leisure Products | 0.0‡ |
| Short–Term Investments | 1.2 |
| Other Assets, Less Liabilities | 0.1 |
| | 100.0% |
| ‡ | Less than one–tenth of a percent. |
See Portfolio of Investments beginning on page 10 for specific holdings within these categories. The Portfolio's holdings are subject to change.
Top Ten Holdings and/or Issuers Held as of December 31, 2023 (excluding short-term investments) (Unaudited)
| 1. | Apple, Inc. |
| 2. | Microsoft Corp. |
| 3. | Alphabet, Inc. |
| 4. | Amazon.com, Inc. |
| 5. | NVIDIA Corp. |
| 6. | Meta Platforms, Inc., Class A |
| 7. | Tesla, Inc. |
| 8. | Berkshire Hathaway, Inc., Class B |
| 9. | JPMorgan Chase & Co. |
| 10. | Broadcom, Inc. |
| 8 | MainStay VP S&P 500 Index Portfolio |
Portfolio Management Discussion and Analysis (Unaudited)
Answers to the questions reflect the views of portfolio manager Francis J. Ok of IndexIQ Advisors LLC, the Portfolio’s Subadvisor.
How did MainStay VP S&P 500® Index Portfolio perform relative to its benchmark and peers during the 12 months ended December 31, 2023?
For the 12 months December 31, 2023, MainStay VP S&P 500® Index Portfolio returned 26.14% for Initial Class shares and 25.83% for Service Class shares. Over the same period, both share classes underperformed the 26.29% return of the S&P 500® Index (the “Index”), which is the Portfolio’s benchmark. Although the Portfolio seeks investment results that correspond to the total return performance of common stocks in the aggregate as represented by the S&P 500® Index, the Portfolio’s net performance will typically lag that of the Index because the Portfolio incurs operating expenses that the Index does not. For the 12 months ended December 31, 2023, both share classes outperformed the 22.32% return of the Morningstar Large Blend Category Average.1
During the reporting period, which S&P 500® industries had the highest total returns and which industries had the lowest total returns?
The Index industry groups with the highest total returns during the reporting period included semiconductors & semiconductor equipment, interactive media & services and automobile manufacturers. Conversely, the industry groups that had the lowest total returns were alternative carriers, housewares & specialties, and personal care products.
During the reporting period, which S&P 500® industries made the strongest positive contributions to the Portfolio’s absolute performance and which industries made the weakest contributions?
The Index industries that made the strongest positive contributions to the Portfolio’s absolute performance during the reporting period included semiconductors, systems software and interactive media & services. (Contributions take weightings and total returns into account.) During the same period, the industries that made the weakest contributions to the Portfolio’s absolute performance included integrated oil & gas, regional banks and electric utilities.
During the reporting period, which individual stocks in the S&P 500® Index had the highest total returns and which individual stocks had the lowest total returns?
The Index stocks with the highest total returns during the reporting period included semiconductor maker NVIDIA, social media company Meta Platforms and cruise line operator Carnival. Conversely, the stocks of solar energy systems producer Enphase
Energy, agricultural sciences company FMC and pharmaceutical developer Moderna produced the weakest total returns.
During the reporting period, which S&P 500® stocks made the strongest positive contributions to the Portfolio’s absolute performance and which S&P 500® stocks made the weakest contributions?
The Index stocks that made the strongest positive contributions to the Portfolio’s absolute performance during the reporting period included productivity software company Microsoft, consumer products maker Apple and semiconductor manufacturer NVIDIA. The stocks making the weakest contributions included pharmaceutical company Pfizer, integrated oil & gas firm Chevron and electric utility NextEra Energy.
Were there any changes in the S&P 500® Index during the reporting period?
During the reporting period, there were 16 additions to and 17 deletions from the S&P 500® Index. In terms of index weight, significant additions to the S&P 500® Index included Blackstone and Palo Alto Networks, while significant deletions included Activision Blizzard and SVB Financial Group.
| 1. | See "Investment and Performance Comparison" for more information on benchmark and peer group returns. |
The opinions expressed are those of the portfolio manager as of the date of this report and are subject to change. There is no guarantee that any forecasts will come to pass. This material does not constitute investment advice and is not intended as an endorsement of any specific investment.
Not all MainStay VP Portfolios and/or share classes are available under all policies.
Portfolio of Investments December 31, 2023†^
| | Shares | Value |
| Common Stocks 98.7% |
| Aerospace & Defense 1.6% |
| Axon Enterprise, Inc. (a) | 6,583 | $ 1,700,587 |
| Boeing Co. (The) (a) | 53,152 | 13,854,600 |
| General Dynamics Corp. | 21,170 | 5,497,214 |
| Howmet Aerospace, Inc. | 36,560 | 1,978,627 |
| Huntington Ingalls Industries, Inc. | 3,713 | 964,043 |
| L3Harris Technologies, Inc. | 17,715 | 3,731,133 |
| Lockheed Martin Corp. | 20,638 | 9,353,967 |
| Northrop Grumman Corp. | 13,248 | 6,201,919 |
| RTX Corp. | 134,394 | 11,307,911 |
| Textron, Inc. | 18,320 | 1,473,295 |
| TransDigm Group, Inc. | 5,170 | 5,229,972 |
| | | 61,293,268 |
| Air Freight & Logistics 0.5% |
| CH Robinson Worldwide, Inc. | 10,896 | 941,305 |
| Expeditors International of Washington, Inc. | 13,589 | 1,728,521 |
| FedEx Corp. | 21,619 | 5,468,958 |
| United Parcel Service, Inc., Class B | 67,599 | 10,628,591 |
| | | 18,767,375 |
| Automobile Components 0.1% |
| Aptiv plc (a) | 26,438 | 2,372,018 |
| BorgWarner, Inc. | 21,999 | 788,664 |
| | | 3,160,682 |
| Automobiles 1.9% |
| Ford Motor Co. | 367,515 | 4,480,008 |
| General Motors Co. | 127,999 | 4,597,724 |
| Tesla, Inc. (a) | 258,493 | 64,230,341 |
| | | 73,308,073 |
| Banks 3.2% |
| Bank of America Corp. | 643,503 | 21,666,746 |
| Citigroup, Inc. | 178,881 | 9,201,639 |
| Citizens Financial Group, Inc. | 43,576 | 1,444,109 |
| Comerica, Inc. | 12,333 | 688,305 |
| Fifth Third Bancorp | 63,651 | 2,195,323 |
| Huntington Bancshares, Inc. | 135,345 | 1,721,588 |
| JPMorgan Chase & Co. | 270,209 | 45,962,551 |
| KeyCorp | 87,508 | 1,260,115 |
| M&T Bank Corp. | 15,511 | 2,126,248 |
| PNC Financial Services Group, Inc. (The) | 37,231 | 5,765,220 |
| Regions Financial Corp. | 86,929 | 1,684,684 |
| Truist Financial Corp. | 124,655 | 4,602,262 |
| U.S. Bancorp | 145,525 | 6,298,322 |
| Wells Fargo & Co. | 339,432 | 16,706,843 |
| | Shares | Value |
| |
| Banks (continued) |
| Zions Bancorp NA | 13,864 | $ 608,214 |
| | | 121,932,169 |
| Beverages 1.5% |
| Brown-Forman Corp., Class B | 17,102 | 976,524 |
| Coca-Cola Co. (The) | 363,680 | 21,431,662 |
| Constellation Brands, Inc., Class A | 15,106 | 3,651,876 |
| Keurig Dr Pepper, Inc. | 94,101 | 3,135,445 |
| Molson Coors Beverage Co., Class B | 17,307 | 1,059,361 |
| Monster Beverage Corp. (a) | 69,044 | 3,977,625 |
| PepsiCo, Inc. | 128,502 | 21,824,780 |
| | | 56,057,273 |
| Biotechnology 2.0% |
| AbbVie, Inc. | 165,016 | 25,572,529 |
| Amgen, Inc. | 50,020 | 14,406,760 |
| Biogen, Inc. (a) | 13,543 | 3,504,522 |
| Gilead Sciences, Inc. | 116,462 | 9,434,587 |
| Incyte Corp. (a) | 17,385 | 1,091,604 |
| Moderna, Inc. (a) | 31,004 | 3,083,348 |
| Regeneron Pharmaceuticals, Inc. (a) | 10,013 | 8,794,318 |
| Vertex Pharmaceuticals, Inc. (a) | 24,084 | 9,799,539 |
| | | 75,687,207 |
| Broadline Retail 3.5% |
| Amazon.com, Inc. (a) | 849,967 | 129,143,987 |
| eBay, Inc. | 48,508 | 2,115,919 |
| Etsy, Inc. (a) | 11,192 | 907,112 |
| | | 132,167,018 |
| Building Products 0.5% |
| A O Smith Corp. | 11,480 | 946,411 |
| Allegion plc | 8,205 | 1,039,492 |
| Builders FirstSource, Inc. (a) | 11,534 | 1,925,486 |
| Carrier Global Corp. | 78,422 | 4,505,344 |
| Johnson Controls International plc | 63,586 | 3,665,097 |
| Masco Corp. | 20,983 | 1,405,441 |
| Trane Technologies plc | 21,347 | 5,206,533 |
| | | 18,693,804 |
| Capital Markets 3.0% |
| Ameriprise Financial, Inc. | 9,458 | 3,592,432 |
| Bank of New York Mellon Corp. (The) | 71,882 | 3,741,458 |
| BlackRock, Inc. | 13,070 | 10,610,226 |
| Blackstone, Inc. | 66,411 | 8,694,528 |
| Cboe Global Markets, Inc. | 9,866 | 1,761,673 |
| Charles Schwab Corp. (The) | 139,096 | 9,569,805 |
| CME Group, Inc. | 33,647 | 7,086,058 |
| FactSet Research Systems, Inc. | 3,551 | 1,694,005 |
The notes to the financial statements are an integral part of, and should be read in conjunction with, the financial statements.
| 10 | MainStay VP S&P 500 Index Portfolio |
| | Shares | Value |
| Common Stocks (continued) |
| Capital Markets (continued) |
| Franklin Resources, Inc. | 26,349 | $ 784,937 |
| Goldman Sachs Group, Inc. (The) | 30,480 | 11,758,270 |
| Intercontinental Exchange, Inc. | 53,496 | 6,870,491 |
| Invesco Ltd. | 41,985 | 749,012 |
| MarketAxess Holdings, Inc. | 3,543 | 1,037,568 |
| Moody's Corp. | 14,710 | 5,745,138 |
| Morgan Stanley | 118,122 | 11,014,876 |
| MSCI, Inc. | 7,392 | 4,181,285 |
| Nasdaq, Inc. | 31,816 | 1,849,782 |
| Northern Trust Corp. | 19,351 | 1,632,837 |
| Raymond James Financial, Inc. | 17,564 | 1,958,386 |
| S&P Global, Inc. | 30,283 | 13,340,267 |
| State Street Corp. | 28,842 | 2,234,101 |
| T. Rowe Price Group, Inc. | 20,887 | 2,249,321 |
| | | 112,156,456 |
| Chemicals 1.6% |
| Air Products and Chemicals, Inc. | 20,763 | 5,684,909 |
| Albemarle Corp. | 10,968 | 1,584,657 |
| Celanese Corp. | 9,367 | 1,455,351 |
| CF Industries Holdings, Inc. | 17,857 | 1,419,631 |
| Corteva, Inc. | 65,868 | 3,156,395 |
| Dow, Inc. | 65,556 | 3,595,091 |
| DuPont de Nemours, Inc. | 40,194 | 3,092,124 |
| Eastman Chemical Co. | 11,082 | 995,385 |
| Ecolab, Inc. | 23,719 | 4,704,664 |
| FMC Corp. | 11,651 | 734,596 |
| International Flavors & Fragrances, Inc. | 23,860 | 1,931,944 |
| Linde plc | 45,320 | 18,613,377 |
| LyondellBasell Industries NV, Class A | 23,950 | 2,277,166 |
| Mosaic Co. (The) | 30,548 | 1,091,480 |
| PPG Industries, Inc. | 22,041 | 3,296,232 |
| Sherwin-Williams Co. (The) | 22,010 | 6,864,919 |
| | | 60,497,921 |
| Commercial Services & Supplies 0.6% |
| Cintas Corp. | 8,093 | 4,877,327 |
| Copart, Inc. (a) | 81,667 | 4,001,683 |
| Republic Services, Inc. | 19,115 | 3,152,255 |
| Rollins, Inc. | 26,251 | 1,146,381 |
| Veralto Corp. | 20,499 | 1,686,248 |
| Waste Management, Inc. | 34,257 | 6,135,429 |
| | | 20,999,323 |
| Communications Equipment 0.8% |
| Arista Networks, Inc. (a) | 23,552 | 5,546,732 |
| Cisco Systems, Inc. | 378,585 | 19,126,114 |
| F5, Inc. (a) | 5,581 | 998,887 |
| | Shares | Value |
| |
| Communications Equipment (continued) |
| Juniper Networks, Inc. | 29,803 | $ 878,593 |
| Motorola Solutions, Inc. | 15,512 | 4,856,652 |
| | | 31,406,978 |
| Construction & Engineering 0.1% |
| Quanta Services, Inc. | 13,579 | 2,930,348 |
| Construction Materials 0.2% |
| Martin Marietta Materials, Inc. | 5,777 | 2,882,203 |
| Vulcan Materials Co. | 12,419 | 2,819,237 |
| | | 5,701,440 |
| Consumer Finance 0.5% |
| American Express Co. | 53,809 | 10,080,578 |
| Capital One Financial Corp. | 35,596 | 4,667,348 |
| Discover Financial Services | 23,372 | 2,627,013 |
| Synchrony Financial | 38,676 | 1,477,036 |
| | | 18,851,975 |
| Consumer Staples Distribution & Retail 1.8% |
| Costco Wholesale Corp. | 41,381 | 27,314,771 |
| Dollar General Corp. | 20,513 | 2,788,742 |
| Dollar Tree, Inc. (a) | 19,535 | 2,774,947 |
| Kroger Co. (The) | 61,853 | 2,827,301 |
| Sysco Corp. | 47,125 | 3,446,251 |
| Target Corp. | 43,144 | 6,144,568 |
| Walgreens Boots Alliance, Inc. | 67,056 | 1,750,832 |
| Walmart, Inc. | 133,331 | 21,019,632 |
| | | 68,067,044 |
| Containers & Packaging 0.2% |
| Amcor plc | 135,089 | 1,302,258 |
| Avery Dennison Corp. | 7,527 | 1,521,658 |
| Ball Corp. | 29,485 | 1,695,977 |
| International Paper Co. | 32,337 | 1,168,983 |
| Packaging Corp. of America | 8,377 | 1,364,697 |
| Westrock Co. | 23,984 | 995,816 |
| | | 8,049,389 |
| Distributors 0.1% |
| Genuine Parts Co. | 13,104 | 1,814,904 |
| LKQ Corp. | 25,011 | 1,195,276 |
| Pool Corp. | 3,615 | 1,441,336 |
| | | 4,451,516 |
| Diversified Telecommunication Services 0.7% |
| AT&T, Inc. | 668,278 | 11,213,705 |
| Verizon Communications, Inc. | 392,937 | 14,813,725 |
| | | 26,027,430 |
The notes to the financial statements are an integral part of, and should be read in conjunction with, the financial statements.
11
Portfolio of Investments December 31, 2023†^ (continued)
| | Shares | Value |
| Common Stocks (continued) |
| Electric Utilities 1.5% |
| Alliant Energy Corp. | 23,850 | $ 1,223,505 |
| American Electric Power Co., Inc. | 49,151 | 3,992,044 |
| Constellation Energy Corp. | 29,851 | 3,489,283 |
| Duke Energy Corp. | 72,035 | 6,990,277 |
| Edison International | 35,824 | 2,561,058 |
| Entergy Corp. | 19,765 | 2,000,020 |
| Evergy, Inc. | 21,471 | 1,120,786 |
| Eversource Energy | 32,650 | 2,015,158 |
| Exelon Corp. | 93,039 | 3,340,100 |
| FirstEnergy Corp. | 48,293 | 1,770,421 |
| NextEra Energy, Inc. | 191,763 | 11,647,685 |
| NRG Energy, Inc. | 21,101 | 1,090,922 |
| PG&E Corp. | 199,409 | 3,595,344 |
| Pinnacle West Capital Corp. | 10,605 | 761,863 |
| PPL Corp. | 68,895 | 1,867,055 |
| Southern Co. (The) | 101,935 | 7,147,682 |
| Xcel Energy, Inc. | 51,576 | 3,193,070 |
| | | 57,806,273 |
| Electrical Equipment 0.6% |
| AMETEK, Inc. | 21,572 | 3,557,007 |
| Eaton Corp. plc | 37,321 | 8,987,643 |
| Emerson Electric Co. | 53,284 | 5,186,132 |
| Generac Holdings, Inc. (a) | 5,742 | 742,096 |
| Hubbell, Inc. | 5,015 | 1,649,584 |
| Rockwell Automation, Inc. | 10,718 | 3,327,725 |
| | | 23,450,187 |
| Electronic Equipment, Instruments & Components 0.6% |
| Amphenol Corp., Class A | 55,921 | 5,543,449 |
| CDW Corp. | 12,521 | 2,846,274 |
| Corning, Inc. | 71,768 | 2,185,335 |
| Jabil, Inc. | 11,958 | 1,523,449 |
| Keysight Technologies, Inc. (a) | 16,597 | 2,640,417 |
| TE Connectivity Ltd. | 29,047 | 4,081,103 |
| Teledyne Technologies, Inc. (a) | 4,410 | 1,968,139 |
| Trimble, Inc. (a) | 23,240 | 1,236,368 |
| Zebra Technologies Corp., Class A (a) | 4,800 | 1,311,984 |
| | | 23,336,518 |
| Energy Equipment & Services 0.4% |
| Baker Hughes Co. | 94,048 | 3,214,561 |
| Halliburton Co. | 83,656 | 3,024,164 |
| Schlumberger NV | 133,511 | 6,947,912 |
| | | 13,186,637 |
| Entertainment 1.2% |
| Electronic Arts, Inc. | 22,876 | 3,129,666 |
| | Shares | Value |
| |
| Entertainment (continued) |
| Live Nation Entertainment, Inc. (a) | 13,269 | $ 1,241,978 |
| Netflix, Inc. (a) | 40,908 | 19,917,287 |
| Take-Two Interactive Software, Inc. (a) | 14,783 | 2,379,324 |
| Walt Disney Co. (The) (a) | 171,021 | 15,441,486 |
| Warner Bros Discovery, Inc. (a) | 207,408 | 2,360,303 |
| | | 44,470,044 |
| Financial Services 4.1% |
| Berkshire Hathaway, Inc., Class B (a) | 170,054 | 60,651,460 |
| Fidelity National Information Services, Inc. | 55,377 | 3,326,496 |
| Fiserv, Inc. (a) | 56,096 | 7,451,793 |
| FleetCor Technologies, Inc. (a) | 6,749 | 1,907,335 |
| Global Payments, Inc. | 24,332 | 3,090,164 |
| Jack Henry & Associates, Inc. | 6,807 | 1,112,332 |
| Mastercard, Inc., Class A | 77,398 | 33,011,021 |
| PayPal Holdings, Inc. (a) | 100,769 | 6,188,224 |
| Visa, Inc., Class A | 148,983 | 38,787,724 |
| | | 155,526,549 |
| Food Products 0.9% |
| Archer-Daniels-Midland Co. | 49,853 | 3,600,384 |
| Bunge Global SA | 13,579 | 1,370,800 |
| Campbell Soup Co. | 18,359 | 793,660 |
| Conagra Brands, Inc. | 44,673 | 1,280,328 |
| General Mills, Inc. | 54,329 | 3,538,991 |
| Hershey Co. (The) | 14,009 | 2,611,838 |
| Hormel Foods Corp. | 27,095 | 870,020 |
| J M Smucker Co. (The) | 9,928 | 1,254,701 |
| Kellanova | 24,670 | 1,379,300 |
| Kraft Heinz Co. (The) | 74,515 | 2,755,565 |
| Lamb Weston Holdings, Inc. | 13,546 | 1,464,187 |
| McCormick & Co., Inc. (Non-Voting) | 23,500 | 1,607,870 |
| Mondelez International, Inc., Class A | 127,152 | 9,209,619 |
| Tyson Foods, Inc., Class A | 26,659 | 1,432,921 |
| | | 33,170,184 |
| Gas Utilities 0.0% ‡ |
| Atmos Energy Corp. | 13,879 | 1,608,576 |
| Ground Transportation 1.1% |
| CSX Corp. | 184,699 | 6,403,514 |
| JB Hunt Transport Services, Inc. | 7,616 | 1,521,220 |
| Norfolk Southern Corp. | 21,136 | 4,996,128 |
| Old Dominion Freight Line, Inc. | 8,363 | 3,389,775 |
| Uber Technologies, Inc. (a) | 192,154 | 11,830,922 |
| Union Pacific Corp. | 56,976 | 13,994,445 |
| | | 42,136,004 |
The notes to the financial statements are an integral part of, and should be read in conjunction with, the financial statements.
| 12 | MainStay VP S&P 500 Index Portfolio |
| | Shares | Value |
| Common Stocks (continued) |
| Health Care Equipment & Supplies 2.5% |
| Abbott Laboratories | 162,196 | $ 17,852,914 |
| Align Technology, Inc. (a) | 6,661 | 1,825,114 |
| Baxter International, Inc. | 47,393 | 1,832,213 |
| Becton Dickinson & Co. | 27,115 | 6,611,451 |
| Boston Scientific Corp. (a) | 136,854 | 7,911,530 |
| Cooper Cos., Inc. (The) | 4,629 | 1,751,799 |
| Dentsply Sirona, Inc. | 19,798 | 704,611 |
| Dexcom, Inc. (a) | 36,113 | 4,481,262 |
| Edwards Lifesciences Corp. (a) | 56,687 | 4,322,384 |
| GE HealthCare Technologies, Inc. | 36,607 | 2,830,453 |
| Hologic, Inc. (a) | 22,894 | 1,635,776 |
| IDEXX Laboratories, Inc. (a) | 7,767 | 4,311,073 |
| Insulet Corp. (a) | 6,526 | 1,416,012 |
| Intuitive Surgical, Inc. (a) | 32,906 | 11,101,168 |
| Medtronic plc | 124,359 | 10,244,694 |
| ResMed, Inc. | 13,751 | 2,365,447 |
| STERIS plc | 9,232 | 2,029,655 |
| Stryker Corp. | 31,601 | 9,463,236 |
| Teleflex, Inc. | 4,392 | 1,095,101 |
| Zimmer Biomet Holdings, Inc. | 19,532 | 2,377,044 |
| | | 96,162,937 |
| Health Care Providers & Services 2.8% |
| Cardinal Health, Inc. | 23,036 | 2,322,029 |
| Cencora, Inc. | 15,581 | 3,200,026 |
| Centene Corp. (a) | 49,929 | 3,705,231 |
| Cigna Group (The) | 27,350 | 8,189,957 |
| CVS Health Corp. | 120,047 | 9,478,911 |
| DaVita, Inc. (a) | 5,040 | 527,990 |
| Elevance Health, Inc. | 21,960 | 10,355,458 |
| HCA Healthcare, Inc. | 18,513 | 5,011,099 |
| Henry Schein, Inc. (a) | 12,206 | 924,116 |
| Humana, Inc. | 11,507 | 5,268,020 |
| Laboratory Corp. of America Holdings | 7,935 | 1,803,546 |
| McKesson Corp. | 12,437 | 5,758,082 |
| Molina Healthcare, Inc. (a) | 5,449 | 1,968,778 |
| Quest Diagnostics, Inc. | 10,504 | 1,448,292 |
| UnitedHealth Group, Inc. | 86,448 | 45,512,279 |
| Universal Health Services, Inc., Class B | 5,702 | 869,213 |
| | | 106,343,027 |
| Health Care REITs 0.2% |
| Healthpeak Properties, Inc. | 51,132 | 1,012,414 |
| Ventas, Inc. | 37,609 | 1,874,432 |
| Welltower, Inc. | 51,730 | 4,664,494 |
| | | 7,551,340 |
| | Shares | Value |
| |
| Hotel & Resort REITs 0.0% ‡ |
| Host Hotels & Resorts, Inc. | 65,934 | $ 1,283,735 |
| Hotels, Restaurants & Leisure 2.2% |
| Airbnb, Inc., Class A (a) | 40,634 | 5,531,913 |
| Booking Holdings, Inc. (a) | 3,261 | 11,567,484 |
| Caesars Entertainment, Inc. (a) | 20,148 | 944,538 |
| Carnival Corp. (a) | 94,166 | 1,745,838 |
| Chipotle Mexican Grill, Inc. (a) | 2,565 | 5,866,052 |
| Darden Restaurants, Inc. | 11,245 | 1,847,553 |
| Domino's Pizza, Inc. | 3,260 | 1,343,870 |
| Expedia Group, Inc. (a) | 12,461 | 1,891,455 |
| Hilton Worldwide Holdings, Inc. | 23,968 | 4,364,333 |
| Las Vegas Sands Corp. | 34,503 | 1,697,893 |
| Marriott International, Inc., Class A | 23,058 | 5,199,810 |
| McDonald's Corp. | 67,794 | 20,101,599 |
| MGM Resorts International (a) | 25,541 | 1,141,172 |
| Norwegian Cruise Line Holdings Ltd. (a) | 39,814 | 797,873 |
| Royal Caribbean Cruises Ltd. (a) | 22,033 | 2,853,053 |
| Starbucks Corp. | 106,793 | 10,253,196 |
| Wynn Resorts Ltd. | 8,973 | 817,530 |
| Yum! Brands, Inc. | 26,199 | 3,423,161 |
| | | 81,388,323 |
| Household Durables 0.4% |
| DR Horton, Inc. | 28,167 | 4,280,821 |
| Garmin Ltd. | 14,306 | 1,838,893 |
| Lennar Corp., Class A | 23,380 | 3,484,555 |
| Mohawk Industries, Inc. (a) | 4,947 | 512,015 |
| NVR, Inc. (a) | 297 | 2,079,134 |
| PulteGroup, Inc. | 20,151 | 2,079,986 |
| Whirlpool Corp. | 5,130 | 624,680 |
| | | 14,900,084 |
| Household Products 1.2% |
| Church & Dwight Co., Inc. | 23,027 | 2,177,433 |
| Clorox Co. (The) | 11,588 | 1,652,333 |
| Colgate-Palmolive Co. | 76,957 | 6,134,242 |
| Kimberly-Clark Corp. | 31,586 | 3,838,015 |
| Procter & Gamble Co. (The) | 220,287 | 32,280,857 |
| | | 46,082,880 |
| Independent Power and Renewable Electricity Producers 0.0% ‡ |
| AES Corp. (The) | 62,587 | 1,204,800 |
| Industrial Conglomerates 0.8% |
| 3M Co. | 51,622 | 5,643,317 |
| General Electric Co. | 101,726 | 12,983,290 |
The notes to the financial statements are an integral part of, and should be read in conjunction with, the financial statements.
13
Portfolio of Investments December 31, 2023†^ (continued)
| | Shares | Value |
| Common Stocks (continued) |
| Industrial Conglomerates (continued) |
| Honeywell International, Inc. | 61,617 | $ 12,921,701 |
| | | 31,548,308 |
| Industrial REITs 0.3% |
| Prologis, Inc. | 86,359 | 11,511,655 |
| Insurance 2.0% |
| Aflac, Inc. | 49,703 | 4,100,497 |
| Allstate Corp. (The) | 24,459 | 3,423,771 |
| American International Group, Inc. | 65,616 | 4,445,484 |
| Aon plc, Class A | 18,713 | 5,445,857 |
| Arch Capital Group Ltd. (a) | 34,879 | 2,590,463 |
| Arthur J. Gallagher & Co. | 20,179 | 4,537,853 |
| Assurant, Inc. | 4,915 | 828,128 |
| Brown & Brown, Inc. | 22,078 | 1,569,967 |
| Chubb Ltd. | 38,132 | 8,617,832 |
| Cincinnati Financial Corp. | 14,665 | 1,517,241 |
| Everest Group Ltd. | 4,056 | 1,434,120 |
| Globe Life, Inc. | 8,005 | 974,369 |
| Hartford Financial Services Group, Inc. (The) | 28,112 | 2,259,643 |
| Loews Corp. | 17,110 | 1,190,685 |
| Marsh & McLennan Cos., Inc. | 46,085 | 8,731,725 |
| MetLife, Inc. | 58,113 | 3,843,013 |
| Principal Financial Group, Inc. | 20,501 | 1,612,814 |
| Progressive Corp. (The) | 54,681 | 8,709,590 |
| Prudential Financial, Inc. | 33,741 | 3,499,279 |
| Travelers Cos., Inc. (The) | 21,347 | 4,066,390 |
| W R Berkley Corp. | 19,040 | 1,346,509 |
| Willis Towers Watson plc | 9,651 | 2,327,821 |
| | | 77,073,051 |
| Interactive Media & Services 5.7% |
| Alphabet, Inc. (a) | | |
| Class A | 553,127 | 77,266,311 |
| Class C | 465,527 | 65,606,720 |
| |
| Match Group, Inc. (a) | 25,405 | 927,282 |
| Meta Platforms, Inc., Class A (a) | 207,456 | 73,431,126 |
| | | 217,231,439 |
| IT Services 1.2% |
| Accenture plc, Class A | 58,660 | 20,584,381 |
| Akamai Technologies, Inc. (a) | 14,098 | 1,668,498 |
| Cognizant Technology Solutions Corp., Class A | 46,865 | 3,539,713 |
| EPAM Systems, Inc. (a) | 5,393 | 1,603,555 |
| Gartner, Inc. (a) | 7,286 | 3,286,787 |
| | Shares | Value |
| |
| IT Services (continued) |
| International Business Machines Corp. | 85,345 | $ 13,958,175 |
| VeriSign, Inc. (a) | 8,302 | 1,709,880 |
| | | 46,350,989 |
| Leisure Products 0.0% ‡ |
| Hasbro, Inc. | 12,205 | 623,187 |
| Life Sciences Tools & Services 1.4% |
| Agilent Technologies, Inc. | 27,347 | 3,802,053 |
| Bio-Rad Laboratories, Inc., Class A (a) | 1,954 | 630,927 |
| Bio-Techne Corp. | 14,782 | 1,140,579 |
| Charles River Laboratories International, Inc. (a) | 4,798 | 1,134,247 |
| Danaher Corp. | 61,467 | 14,219,776 |
| Illumina, Inc. (a) | 14,842 | 2,066,600 |
| IQVIA Holdings, Inc. (a) | 17,116 | 3,960,300 |
| Mettler-Toledo International, Inc. (a) | 2,027 | 2,458,670 |
| Revvity, Inc. | 11,534 | 1,260,782 |
| Thermo Fisher Scientific, Inc. | 36,112 | 19,167,888 |
| Waters Corp. (a) | 5,526 | 1,819,325 |
| West Pharmaceutical Services, Inc. | 6,915 | 2,434,910 |
| | | 54,096,057 |
| Machinery 1.8% |
| Caterpillar, Inc. | 47,681 | 14,097,841 |
| Cummins, Inc. | 13,248 | 3,173,823 |
| Deere & Co. | 25,034 | 10,010,346 |
| Dover Corp. | 13,075 | 2,011,066 |
| Fortive Corp. | 32,847 | 2,418,525 |
| IDEX Corp. | 7,068 | 1,534,533 |
| Illinois Tool Works, Inc. | 25,591 | 6,703,306 |
| Ingersoll Rand, Inc. | 37,846 | 2,927,010 |
| Nordson Corp. | 5,062 | 1,337,178 |
| Otis Worldwide Corp. | 38,251 | 3,422,317 |
| PACCAR, Inc. (a) | 48,889 | 4,774,011 |
| Parker-Hannifin Corp. | 12,007 | 5,531,625 |
| Pentair plc | 15,452 | 1,123,515 |
| Snap-on, Inc. | 4,933 | 1,424,848 |
| Stanley Black & Decker, Inc. | 14,340 | 1,406,754 |
| Westinghouse Air Brake Technologies Corp. | 16,745 | 2,124,940 |
| Xylem, Inc. | 22,538 | 2,577,446 |
| | | 66,599,084 |
| Media 0.7% |
| Charter Communications, Inc., Class A (a) | 9,401 | 3,653,980 |
| Comcast Corp., Class A | 375,322 | 16,457,870 |
The notes to the financial statements are an integral part of, and should be read in conjunction with, the financial statements.
| 14 | MainStay VP S&P 500 Index Portfolio |
| | Shares | Value |
| Common Stocks (continued) |
| Media (continued) |
| Fox Corp. | | |
| Class A | 23,107 | $ 685,585 |
| Class B | 12,346 | 341,367 |
| |
| Interpublic Group of Cos., Inc. (The) | 35,798 | 1,168,447 |
| News Corp. | | |
| Class A | 35,571 | 873,268 |
| Class B | 10,730 | 275,975 |
| |
| Omnicom Group, Inc. | 18,490 | 1,599,570 |
| Paramount Global, Class B | 45,129 | 667,458 |
| | | 25,723,520 |
| Metals & Mining 0.4% |
| Freeport-McMoRan, Inc. | 134,027 | 5,705,529 |
| Newmont Corp. | 107,718 | 4,458,448 |
| Nucor Corp. | 22,977 | 3,998,917 |
| Steel Dynamics, Inc. | 14,217 | 1,679,028 |
| | | 15,841,922 |
| Multi-Utilities 0.6% |
| Ameren Corp. | 24,590 | 1,778,841 |
| CenterPoint Energy, Inc. | 58,997 | 1,685,544 |
| CMS Energy Corp. | 27,270 | 1,583,569 |
| Consolidated Edison, Inc. | 32,266 | 2,935,238 |
| Dominion Energy, Inc. | 78,211 | 3,675,917 |
| DTE Energy Co. | 19,270 | 2,124,710 |
| NiSource, Inc. | 38,625 | 1,025,494 |
| Public Service Enterprise Group, Inc. | 46,575 | 2,848,061 |
| Sempra | 58,820 | 4,395,619 |
| WEC Energy Group, Inc. | 29,482 | 2,481,500 |
| | | 24,534,493 |
| Office REITs 0.1% |
| Alexandria Real Estate Equities, Inc. | 14,618 | 1,853,124 |
| Boston Properties, Inc. | 13,506 | 947,716 |
| | | 2,800,840 |
| Oil, Gas & Consumable Fuels 3.5% |
| APA Corp. | 28,668 | 1,028,608 |
| Chevron Corp. | 164,088 | 24,475,366 |
| ConocoPhillips | 110,981 | 12,881,565 |
| Coterra Energy, Inc. | 70,304 | 1,794,158 |
| Devon Energy Corp. | 59,883 | 2,712,700 |
| Diamondback Energy, Inc. | 16,735 | 2,595,264 |
| EOG Resources, Inc. | 54,504 | 6,592,259 |
| EQT Corp. | 38,445 | 1,486,284 |
| Exxon Mobil Corp. | 374,391 | 37,431,612 |
| Hess Corp. | 25,838 | 3,724,806 |
| Kinder Morgan, Inc. | 180,744 | 3,188,324 |
| | Shares | Value |
| |
| Oil, Gas & Consumable Fuels (continued) |
| Marathon Oil Corp. | 54,700 | $ 1,321,552 |
| Marathon Petroleum Corp. | 35,488 | 5,265,000 |
| Occidental Petroleum Corp. | 61,713 | 3,684,883 |
| ONEOK, Inc. | 54,448 | 3,823,338 |
| Phillips 66 | 41,121 | 5,474,850 |
| Pioneer Natural Resources Co. | 21,806 | 4,903,733 |
| Targa Resources Corp. | 20,840 | 1,810,371 |
| Valero Energy Corp. | 31,820 | 4,136,600 |
| Williams Cos., Inc. (The) | 113,700 | 3,960,171 |
| | | 132,291,444 |
| Passenger Airlines 0.2% |
| American Airlines Group, Inc. (a) | 61,146 | 840,146 |
| Delta Air Lines, Inc. | 60,141 | 2,419,473 |
| Southwest Airlines Co. | 55,743 | 1,609,858 |
| United Airlines Holdings, Inc. (a) | 30,655 | 1,264,825 |
| | | 6,134,302 |
| Personal Care Products 0.2% |
| Estee Lauder Cos., Inc. (The), Class A | 21,712 | 3,175,380 |
| Kenvue, Inc. | 161,087 | 3,468,203 |
| | | 6,643,583 |
| Pharmaceuticals 3.7% |
| Bristol-Myers Squibb Co. | 190,179 | 9,758,084 |
| Catalent, Inc. (a) | 16,871 | 758,014 |
| Eli Lilly & Co. | 74,531 | 43,445,611 |
| Johnson & Johnson | 224,997 | 35,266,030 |
| Merck & Co., Inc. | 236,843 | 25,820,624 |
| Pfizer, Inc. | 527,743 | 15,193,721 |
| Viatris, Inc. | 112,127 | 1,214,335 |
| Zoetis, Inc. | 42,911 | 8,469,344 |
| | | 139,925,763 |
| Professional Services 0.7% |
| Automatic Data Processing, Inc. | 38,443 | 8,956,066 |
| Broadridge Financial Solutions, Inc. | 10,996 | 2,262,427 |
| Ceridian HCM Holding, Inc. (a) | 14,563 | 977,469 |
| Equifax, Inc. | 11,516 | 2,847,792 |
| Jacobs Solutions, Inc. | 11,769 | 1,527,616 |
| Leidos Holdings, Inc. | 12,854 | 1,391,317 |
| Paychex, Inc. | 30,049 | 3,579,136 |
| Paycom Software, Inc. | 4,584 | 947,604 |
| Robert Half, Inc. | 9,897 | 870,144 |
| Verisk Analytics, Inc. | 13,555 | 3,237,747 |
| | | 26,597,318 |
| Real Estate Management & Development 0.2% |
| CBRE Group, Inc., Class A (a) | 28,488 | 2,651,948 |
The notes to the financial statements are an integral part of, and should be read in conjunction with, the financial statements.
15
Portfolio of Investments December 31, 2023†^ (continued)
| | Shares | Value |
| Common Stocks (continued) |
| Real Estate Management & Development (continued) |
| CoStar Group, Inc. (a) | 38,168 | $ 3,335,501 |
| | | 5,987,449 |
| Residential REITs 0.3% |
| AvalonBay Communities, Inc. | 13,273 | 2,484,971 |
| Camden Property Trust | 9,979 | 990,815 |
| Equity Residential | 32,280 | 1,974,245 |
| Essex Property Trust, Inc. | 5,999 | 1,487,392 |
| Invitation Homes, Inc. | 53,765 | 1,833,924 |
| Mid-America Apartment Communities, Inc. | 10,906 | 1,466,421 |
| UDR, Inc. | 28,284 | 1,082,994 |
| | | 11,320,762 |
| Retail REITs 0.3% |
| Federal Realty OP LP | 6,867 | 707,644 |
| Kimco Realty Corp. | 62,145 | 1,324,310 |
| Realty Income Corp. | 67,662 | 3,885,152 |
| Regency Centers Corp. | 15,354 | 1,028,718 |
| Simon Property Group, Inc. | 30,492 | 4,349,379 |
| | | 11,295,203 |
| Semiconductors & Semiconductor Equipment 8.0% |
| Advanced Micro Devices, Inc. (a) | 151,009 | 22,260,237 |
| Analog Devices, Inc. | 46,575 | 9,247,932 |
| Applied Materials, Inc. | 78,187 | 12,671,767 |
| Broadcom, Inc. | 41,026 | 45,795,272 |
| Enphase Energy, Inc. (a) | 12,769 | 1,687,296 |
| First Solar, Inc. (a) | 9,986 | 1,720,388 |
| Intel Corp. | 394,049 | 19,800,962 |
| KLA Corp. | 12,705 | 7,385,416 |
| Lam Research Corp. | 12,318 | 9,648,197 |
| Microchip Technology, Inc. | 50,569 | 4,560,312 |
| Micron Technology, Inc. | 102,628 | 8,758,274 |
| Monolithic Power Systems, Inc. | 4,478 | 2,824,633 |
| NVIDIA Corp. | 230,859 | 114,325,994 |
| NXP Semiconductors NV | 24,092 | 5,533,451 |
| ON Semiconductor Corp. (a) | 40,255 | 3,362,500 |
| Qorvo, Inc. (a) | 9,098 | 1,024,526 |
| QUALCOMM, Inc. | 104,027 | 15,045,425 |
| Skyworks Solutions, Inc. | 14,898 | 1,674,833 |
| Teradyne, Inc. | 14,289 | 1,550,642 |
| Texas Instruments, Inc. | 84,885 | 14,469,497 |
| | | 303,347,554 |
| Software 10.6% |
| Adobe, Inc. (a) | 42,555 | 25,388,313 |
| ANSYS, Inc. (a) | 8,112 | 2,943,683 |
| | Shares | Value |
| |
| Software (continued) |
| Autodesk, Inc. (a) | 19,979 | $ 4,864,487 |
| Cadence Design Systems, Inc. (a) | 25,428 | 6,925,824 |
| Fair Isaac Corp. (a) | 2,310 | 2,688,863 |
| Fortinet, Inc. (a) | 59,571 | 3,486,691 |
| Gen Digital, Inc. | 52,662 | 1,201,747 |
| Intuit, Inc. | 26,194 | 16,372,036 |
| Microsoft Corp. | 694,658 | 261,219,194 |
| Oracle Corp. | 148,501 | 15,656,460 |
| Palo Alto Networks, Inc. (a) | 29,050 | 8,566,264 |
| PTC, Inc. (a) | 11,107 | 1,943,281 |
| Roper Technologies, Inc. | 9,984 | 5,442,977 |
| Salesforce, Inc. (a) | 90,942 | 23,930,478 |
| ServiceNow, Inc. (a) | 19,160 | 13,536,348 |
| Synopsys, Inc. (a) | 14,215 | 7,319,446 |
| Tyler Technologies, Inc. (a) | 3,933 | 1,644,466 |
| | | 403,130,558 |
| Specialized REITs 1.1% |
| American Tower Corp. | 43,570 | 9,405,892 |
| Crown Castle, Inc. | 40,564 | 4,672,567 |
| Digital Realty Trust, Inc. | 28,306 | 3,809,421 |
| Equinix, Inc. | 8,775 | 7,067,297 |
| Extra Space Storage, Inc. | 19,747 | 3,166,037 |
| Iron Mountain, Inc. | 27,291 | 1,909,824 |
| Public Storage | 14,791 | 4,511,255 |
| SBA Communications Corp. | 10,084 | 2,558,210 |
| VICI Properties, Inc. | 96,693 | 3,082,573 |
| Weyerhaeuser Co. | 68,230 | 2,372,357 |
| | | 42,555,433 |
| Specialty Retail 2.0% |
| AutoZone, Inc. (a) | 1,648 | 4,261,085 |
| Bath & Body Works, Inc. | 21,252 | 917,236 |
| Best Buy Co., Inc. | 18,104 | 1,417,181 |
| CarMax, Inc. (a) | 14,830 | 1,138,054 |
| Home Depot, Inc. (The) | 93,471 | 32,392,375 |
| Lowe's Cos., Inc. | 53,940 | 12,004,347 |
| O'Reilly Automotive, Inc. (a) | 5,530 | 5,253,943 |
| Ross Stores, Inc. | 31,650 | 4,380,044 |
| TJX Cos., Inc. (The) | 106,932 | 10,031,291 |
| Tractor Supply Co. | 10,105 | 2,172,878 |
| Ulta Beauty, Inc. (a) | 4,601 | 2,254,444 |
| | | 76,222,878 |
| Technology Hardware, Storage & Peripherals 7.2% |
| Apple, Inc. (b) | 1,366,422 | 263,077,228 |
| Hewlett Packard Enterprise Co. | 119,903 | 2,035,953 |
| HP, Inc. | 81,284 | 2,445,835 |
| NetApp, Inc. | 19,515 | 1,720,442 |
The notes to the financial statements are an integral part of, and should be read in conjunction with, the financial statements.
| 16 | MainStay VP S&P 500 Index Portfolio |
| | Shares | Value |
| Common Stocks (continued) |
| Technology Hardware, Storage & Peripherals (continued) |
| Seagate Technology Holdings plc | 18,183 | $ 1,552,283 |
| Western Digital Corp. (a) | 30,305 | 1,587,073 |
| | | 272,418,814 |
| Textiles, Apparel & Luxury Goods 0.5% |
| Lululemon Athletica, Inc. (a) | 10,763 | 5,503,014 |
| NIKE, Inc., Class B | 114,403 | 12,420,734 |
| Ralph Lauren Corp. | 3,715 | 535,703 |
| Tapestry, Inc. | 21,421 | 788,507 |
| VF Corp. (c) | 30,934 | 581,559 |
| | | 19,829,517 |
| Tobacco 0.5% |
| Altria Group, Inc. | 165,307 | 6,668,484 |
| Philip Morris International, Inc. | 145,096 | 13,650,632 |
| | | 20,319,116 |
| Trading Companies & Distributors 0.3% |
| Fastenal Co. | 53,407 | 3,459,171 |
| United Rentals, Inc. | 6,335 | 3,632,616 |
| WW Grainger, Inc. | 4,129 | 3,421,661 |
| | | 10,513,448 |
| Water Utilities 0.1% |
| American Water Works Co., Inc. | 18,198 | 2,401,954 |
| Wireless Telecommunication Services 0.2% |
| T-Mobile US, Inc. | 47,560 | 7,625,295 |
Total Common Stocks (d)
(Cost $1,060,694,584) | | 3,742,309,723 |
| |
| | Number of
Rights | |
| |
| Rights 0.0% ‡ |
| Health Care Equipment & Supplies 0.0% ‡ |
| ABIOMED, Inc., CVR (a)(e)(f) | 4,165 | 4,249 |
Total Rights
(Cost $4,248) | | 4,249 |
| |
| | Shares | |
| |
| Short-Term Investments 1.2% |
| Affiliated Investment Company 0.0% ‡ |
| MainStay U.S. Government Liquidity Fund, 5.235% (g) | 22,379 | 22,379 |
| | Shares | | Value |
| |
| Unaffiliated Investment Company 0.0% ‡ |
| Invesco Government & Agency Portfolio, 5.361% (g)(h) | 570,726 | | $ 570,726 |
| |
| | Principal
Amount | | |
| |
| U.S. Treasury Debt 1.2% |
| U.S. Treasury Bills | | | |
| 5.28%, due 3/19/24 (b)(i) | $ 45,000,000 | | 44,499,524 |
Total Short-Term Investments
(Cost $45,085,393) | | | 45,092,629 |
Total Investments
(Cost $1,105,784,225) | 99.9% | | 3,787,406,601 |
| Other Assets, Less Liabilities | 0.1 | | 2,373,761 |
| Net Assets | 100.0% | | $ 3,789,780,362 |
| † | Percentages indicated are based on Portfolio net assets. |
| ^ | Industry classifications may be different than those used for compliance monitoring purposes. |
| ‡ | Less than one-tenth of a percent. |
| (a) | Non-income producing security. |
| (b) | Represents a security, or portion thereof, which was maintained at the broker as collateral for futures contracts. |
| (c) | All or a portion of this security was held on loan. As of December 31, 2023, the aggregate market value of securities on loan was $550,238. The Portfolio received cash collateral with a value of $570,726. (See Note 2(I)) |
| (d) | The combined market value of common stocks and notional value of Standard & Poor’s 500 Index futures contracts represents 99.9% of the Portfolio’s net assets. |
| (e) | Illiquid security—As of December 31, 2023, the total market value deemed illiquid under procedures approved by the Board of Trustees was $4,249, which represented less than one-tenth of a percent of the Portfolio’s net assets. (Unaudited) |
| (f) | Security in which significant unobservable inputs (Level 3) were used in determining fair value. |
| (g) | Current yield as of December 31, 2023. |
| (h) | Represents a security purchased with cash collateral received for securities on loan. |
| (i) | Interest rate shown represents yield to maturity. |
The notes to the financial statements are an integral part of, and should be read in conjunction with, the financial statements.
17
Portfolio of Investments December 31, 2023†^ (continued)
Investments in Affiliates (in 000's)
Investments in issuers considered to be affiliate(s) of the Portfolio during the year ended December 31, 2023 for purposes of Section 2(a)(3) of the Investment Company Act of 1940, as amended, were as follows:
| Affiliated Investment Companies | Value,
Beginning
of Year | Purchases
at Cost | Proceeds
from
Sales | Net
Realized
Gain/(Loss)
on Sales | Change in
Unrealized
Appreciation/
(Depreciation) | Value,
End of
Year | Dividend
Income | Other
Distributions | Shares
End of
Year |
| MainStay U.S. Government Liquidity Fund | $ —(a) | $ 35,221 | $ (35,199) | $ — | $ — | $ 22 | $ 12 | $ — | 22 |
Futures Contracts
As of December 31, 2023, the Portfolio held the following futures contracts:
| Type | Number of
Contracts | Expiration
Date | Value at
Trade Date | Current
Notional
Amount | Unrealized
Appreciation
(Depreciation)1 |
| Long Contracts | | | | | |
| S&P 500 E-Mini Index | 183 | March 2024 | $ 43,324,810 | $ 44,103,000 | $ 778,190 |
| 1. | Represents the difference between the value of the contracts at the time they were opened and the value as of December 31, 2023. |
| Abbreviation(s): |
| REIT—Real Estate Investment Trust |
The following is a summary of the fair valuations according to the inputs used as of December 31, 2023, for valuing the Portfolio’s assets:
| Description | Quoted
Prices in
Active
Markets for
Identical
Assets
(Level 1) | | Significant
Other
Observable
Inputs
(Level 2) | | Significant
Unobservable
Inputs
(Level 3) | | Total |
| Asset Valuation Inputs | | | | | | | |
| Investments in Securities (a) | | | | | | | |
| Common Stocks | $ 3,742,309,723 | | $ — | | $ — | | $ 3,742,309,723 |
| Rights | — | | — | | 4,249 | | 4,249 |
| Short-Term Investments | | | | | | | |
| Affiliated Investment Company | 22,379 | | — | | — | | 22,379 |
| Unaffiliated Investment Company | 570,726 | | — | | — | | 570,726 |
| U.S. Treasury Debt | — | | 44,499,524 | | — | | 44,499,524 |
| Total Short-Term Investments | 593,105 | | 44,499,524 | | — | | 45,092,629 |
| Total Investments in Securities | 3,742,902,828 | | 44,499,524 | | 4,249 | | 3,787,406,601 |
| Other Financial Instruments | | | | | | | |
| Futures Contracts (b) | 778,190 | | — | | — | | 778,190 |
| Total Investments in Securities and Other Financial Instruments | $ 3,743,681,018 | | $ 44,499,524 | | $ 4,249 | | $ 3,788,184,791 |
| (a) | For a complete listing of investments and their industries, see the Portfolio of Investments. |
| (b) | The value listed for these securities reflects unrealized appreciation (depreciation) as shown on the Portfolio of Investments. |
The notes to the financial statements are an integral part of, and should be read in conjunction with, the financial statements.
| 18 | MainStay VP S&P 500 Index Portfolio |
Statement of Assets and Liabilities as of December 31, 2023
| Assets |
Investment in unaffiliated securities, at value
(identified cost $1,105,761,846) including securities on loan of $550,238 | $3,787,384,222 |
Investment in affiliated investment companies, at value
(identified cost $22,379) | 22,379 |
| Receivables: | |
| Dividends | 3,488,147 |
| Portfolio shares sold | 1,603,513 |
| Securities lending | 2,341 |
| Other assets | 17,076 |
| Total assets | 3,792,517,678 |
| Liabilities |
| Cash collateral received for securities on loan | 570,726 |
| Due to custodian | 5,041 |
| Payables: | |
| Portfolio shares redeemed | 1,155,060 |
| NYLIFE Distributors (See Note 3) | 456,527 |
| Manager (See Note 3) | 274,257 |
| Variation margin on futures contracts | 111,993 |
| Investment securities purchased | 89,699 |
| Professional fees | 42,295 |
| Custodian | 18,638 |
| Shareholder communication | 26 |
| Accrued expenses | 13,054 |
| Total liabilities | 2,737,316 |
| Net assets | $3,789,780,362 |
| Composition of Net Assets |
| Shares of beneficial interest outstanding (par value of $.001 per share) unlimited number of shares authorized | $ 44,666 |
| Additional paid-in-capital | 1,061,747,285 |
| | 1,061,791,951 |
| Total distributable earnings (loss) | 2,727,988,411 |
| Net assets | $3,789,780,362 |
| Initial Class | |
| Net assets applicable to outstanding shares | $1,592,464,944 |
| Shares of beneficial interest outstanding | 18,655,616 |
| Net asset value per share outstanding | $ 85.36 |
| Service Class | |
| Net assets applicable to outstanding shares | $2,197,315,418 |
| Shares of beneficial interest outstanding | 26,010,472 |
| Net asset value per share outstanding | $ 84.48 |
The notes to the financial statements are an integral part of, and should be read in conjunction with, the financial statements.
19
Statement of Operations for the year ended December 31, 2023
| Investment Income (Loss) |
| Income | |
| Dividends-unaffiliated (net of foreign tax withholding of $14,640) | $ 54,958,175 |
| Interest | 1,950,294 |
| Securities lending, net | 61,839 |
| Dividends-affiliated | 11,588 |
| Total income | 56,981,896 |
| Expenses | |
| Manager (See Note 3) | 5,302,180 |
| Distribution/Service—Service Class (See Note 3) | 4,864,298 |
| Professional fees | 248,852 |
| Shareholder communication | 122,996 |
| Trustees | 84,272 |
| Custodian | 51,445 |
| Registration | 79 |
| Miscellaneous | 452,021 |
| Total expenses before waiver/reimbursement | 11,126,143 |
| Expense waiver/reimbursement from Manager (See Note 3) | (2,220,095) |
| Net expenses | 8,906,048 |
| Net investment income (loss) | 48,075,848 |
| Realized and Unrealized Gain (Loss) |
| Net realized gain (loss) on: | |
| Unaffiliated investment transactions | 9,881,329 |
| Futures transactions | 3,231,501 |
| Foreign currency transactions | (167) |
| Net realized gain (loss) | 13,112,663 |
| Net change in unrealized appreciation (depreciation) on: | |
| Unaffiliated investments | 713,894,203 |
| Futures contracts | 1,592,915 |
| Net change in unrealized appreciation (depreciation) | 715,487,118 |
| Net realized and unrealized gain (loss) | 728,599,781 |
| Net increase (decrease) in net assets resulting from operations | $776,675,629 |
The notes to the financial statements are an integral part of, and should be read in conjunction with, the financial statements.
| 20 | MainStay VP S&P 500 Index Portfolio |
Statements of Changes in Net Assets
for the years ended December 31, 2023 and December 31, 2022
| | 2023 | 2022 |
| Increase (Decrease) in Net Assets |
| Operations: | | |
| Net investment income (loss) | $ 48,075,848 | $ 42,206,959 |
| Net realized gain (loss) | 13,112,663 | 54,948,557 |
| Net change in unrealized appreciation (depreciation) | 715,487,118 | (780,676,025) |
| Net increase (decrease) in net assets resulting from operations | 776,675,629 | (683,520,509) |
| Distributions to shareholders: | | |
| Initial Class | (42,435,488) | (62,047,386) |
| Service Class | (53,781,028) | (79,677,136) |
| Total distributions to shareholders | (96,216,516) | (141,724,522) |
| Capital share transactions: | | |
| Net proceeds from sales of shares | 352,819,092 | 291,292,111 |
| Net asset value of shares issued to shareholders in reinvestment of distributions | 96,216,516 | 141,724,522 |
| Cost of shares redeemed | (342,435,534) | (417,633,674) |
| Increase (decrease) in net assets derived from capital share transactions | 106,600,074 | 15,382,959 |
| Net increase (decrease) in net assets | 787,059,187 | (809,862,072) |
| Net Assets |
| Beginning of year | 3,002,721,175 | 3,812,583,247 |
| End of year | $3,789,780,362 | $3,002,721,175 |
The notes to the financial statements are an integral part of, and should be read in conjunction with, the financial statements.
21
Financial Highlights selected per share data and ratios
| | Year Ended December 31, |
| Initial Class | 2023 | | 2022 | | 2021 | | 2020 | | 2019 |
| Net asset value at beginning of year | $ 69.69 | | $ 89.76 | | $ 71.41 | | $ 61.70 | | $ 48.11 |
| Net investment income (loss) (a) | 1.22 | | 1.12 | | 1.03 | | 1.00 | | 1.01 |
| Net realized and unrealized gain (loss) | 16.77 | | (17.63) | | 19.19 | | 10.13 | | 13.88 |
| Total from investment operations | 17.99 | | (16.51) | | 20.22 | | 11.13 | | 14.89 |
| Less distributions: | | | | | | | | | |
| From net investment income | (1.10) | | (1.12) | | (1.01) | | (0.91) | | (1.00) |
| From net realized gain on investments | (1.22) | | (2.44) | | (0.86) | | (0.51) | | (0.30) |
| Total distributions | (2.32) | | (3.56) | | (1.87) | | (1.42) | | (1.30) |
| Net asset value at end of year | $ 85.36 | | $ 69.69 | | $ 89.76 | | $ 71.41 | | $ 61.70 |
| Total investment return (b) | 26.14% | | (18.19)% | | 28.55% | | 18.24% | | 31.25% |
| Ratios (to average net assets)/Supplemental Data: | | | | | | | | | |
| Net investment income (loss) | 1.57% | | 1.45% | | 1.28% | | 1.61% | | 1.80% |
| Net expenses (c) | 0.12% | | 0.12% | | 0.12% | | 0.13% | | 0.16% |
| Expenses (before waiver/reimbursement) (c) | 0.19% | | 0.19% | | 0.18% | | 0.20% | | 0.19% |
| Portfolio turnover rate | 2% | | 2% | | 3% | | 2% | | 7% |
| Net assets at end of year (in 000's) | $ 1,592,465 | | $ 1,271,411 | | $ 1,745,640 | | $ 1,749,834 | | $ 1,123,943 |
| (a) | Per share data based on average shares outstanding during the year. |
| (b) | Total return does not reflect any deduction of sales charges, mortality and expense charges, contract charges or administrative charges. For periods of less than one year, total return is not annualized. |
| (c) | In addition to the fees and expenses which the Portfolio bears directly, it also indirectly bears a pro-rata share of the fees and expenses of the underlying funds in which it invests. Such indirect expenses are not included in the above expense ratios. |
| | Year Ended December 31, |
| Service Class | 2023 | | 2022 | | 2021 | | 2020 | | 2019 |
| Net asset value at beginning of year | $ 69.01 | | $ 88.87 | | $ 70.76 | | $ 61.19 | | $ 47.74 |
| Net investment income (loss) (a) | 1.02 | | 0.92 | | 0.83 | | 0.83 | | 0.86 |
| Net realized and unrealized gain (loss) | 16.59 | | (17.43) | | 18.99 | | 10.03 | | 13.77 |
| Total from investment operations | 17.61 | | (16.51) | | 19.82 | | 10.86 | | 14.63 |
| Less distributions: | | | | | | | | | |
| From net investment income | (0.92) | | (0.91) | | (0.85) | | (0.78) | | (0.88) |
| From net realized gain on investments | (1.22) | | (2.44) | | (0.86) | | (0.51) | | (0.30) |
| Total distributions | (2.14) | | (3.35) | | (1.71) | | (1.29) | | (1.18) |
| Net asset value at end of year | $ 84.48 | | $ 69.01 | | $ 88.87 | | $ 70.76 | | $ 61.19 |
| Total investment return (b) | 25.83% | | (18.40)% | | 28.23% | | 17.95% | | 30.92% |
| Ratios (to average net assets)/Supplemental Data: | | | | | | | | | |
| Net investment income (loss) | 1.32% | | 1.21% | | 1.03% | | 1.37% | | 1.54% |
| Net expenses (c) | 0.37% | | 0.37% | | 0.37% | | 0.38% | | 0.41% |
| Expenses (before waiver/reimbursement) (c) | 0.44% | | 0.44% | | 0.43% | | 0.45% | | 0.44% |
| Portfolio turnover rate | 2% | | 2% | | 3% | | 2% | | 7% |
| Net assets at end of year (in 000's) | $ 2,197,315 | | $ 1,731,310 | | $ 2,066,943 | | $ 1,620,242 | | $ 1,341,639 |
| (a) | Per share data based on average shares outstanding during the year. |
| (b) | Total return does not reflect any deduction of sales charges, mortality and expense charges, contract charges or administrative charges. For periods of less than one year, total return is not annualized. |
| (c) | In addition to the fees and expenses which the Portfolio bears directly, it also indirectly bears a pro-rata share of the fees and expenses of the underlying funds in which it invests. Such indirect expenses are not included in the above expense ratios. |
The notes to the financial statements are an integral part of, and should be read in conjunction with, the financial statements.
| 22 | MainStay VP S&P 500 Index Portfolio |
Notes to Financial Statements
Note 1–Organization and Business
MainStay VP Funds Trust (the “Fund”) was organized as a Delaware statutory trust on February 1, 2011. The Fund is registered under the Investment Company Act of 1940, as amended (the “1940 Act”), as an open-end management investment company. The Fund is comprised of thirty-one separate series (collectively referred to as the “Portfolios”). These financial statements and notes relate to the MainStay VP S&P 500 Index Portfolio (the "Portfolio"), a "diversified” portfolio, as that term is defined in the 1940 Act, as interpreted or modified by regulatory authorities having jurisdiction, from time to time.
Shares of the Portfolio are currently offered to certain separate accounts to fund variable annuity policies and variable universal life insurance policies issued by New York Life Insurance and Annuity Corporation (“NYLIAC”), a wholly-owned subsidiary of New York Life Insurance Company (“New York Life”) and may also be offered to fund variable annuity policies and variable universal life insurance policies issued by other insurance companies. NYLIAC allocates shares of the Portfolio to, among others, certain NYLIAC separate accounts. Shares of the Portfolio are also offered to the MainStay VP Conservative Allocation Portfolio, MainStay VP Moderate Allocation Portfolio, MainStay VP Growth Allocation Portfolio and MainStay VP Equity Allocation Portfolio, which operate as “funds-of-funds," and other variable insurance funds.
The following table lists the Portfolio's share classes that have been registered and commenced operations:
| Class | Commenced Operations |
| Initial Class | January 29, 1993 |
| Service Class | June 5, 2003 |
Shares of the Portfolio are offered and are redeemed at a price equal to their respective net asset value (“NAV”) per share. No sales or redemption charge is applicable to the purchase or redemption of the Portfolio's shares. Under the terms of the Fund’s multiple class plan, adopted pursuant to Rule 18f-3 under the 1940 Act, the classes differ in that, among other things, Service Class shares of the Portfolio pay a combined distribution and service fee of 0.25% of average daily net assets attributable to Service Class shares of the Portfolio to the Distributor (as defined in Note 3(B)) pursuant to a plan adopted in accordance with Rule 12b-1 under the 1940 Act. Contract owners of variable annuity contracts purchased after June 2, 2003, are permitted to invest only in the Service Class shares.
The Portfolio's investment objective is to seek investment results that correspond to the total return performance (reflecting reinvestment of dividends) of common stocks in the aggregate, as represented by the S&P 500® Index.
Note 2–Significant Accounting Policies
The Portfolio is an investment company and accordingly follows the investment company accounting and reporting guidance of the Financial Accounting Standards Board (“FASB”) Accounting Standards Codification
Topic 946 Financial Services—Investment Companies. The Portfolio prepares its financial statements in accordance with generally accepted accounting principles (“GAAP”) in the United States of America and follows the significant accounting policies described below.
(A) Securities Valuation. Investments are usually valued as of the close of regular trading on the New York Stock Exchange (the "Exchange") (usually 4:00 p.m. Eastern time) on each day the Portfolio is open for business ("valuation date").
Pursuant to Rule 2a-5 under the 1940 Act, the Board of Trustees of the Fund (the "Board") has designated New York Life Investment Management LLC (“New York Life Investments” or the "Manager") as its Valuation Designee (the "Valuation Designee"). The Valuation Designee is responsible for performing fair valuations relating to all investments in the Portfolio’s portfolio for which market quotations are not readily available; periodically assessing and managing material valuation risks; establishing and applying fair value methodologies; testing fair valuation methodologies; evaluating and overseeing pricing services; ensuring appropriate segregation of valuation and portfolio management functions; providing quarterly, annual and prompt reporting to the Board, as appropriate; identifying potential conflicts of interest; and maintaining appropriate records. The Valuation Designee has established a valuation committee ("Valuation Committee") to assist in carrying out the Valuation Designee’s responsibilities and establish prices of securities for which market quotations are not readily available. The Portfolio's and the Valuation Designee's policies and procedures ("Valuation Procedures") govern the Valuation Designee’s selection and application of methodologies for determining and calculating the fair value of Portfolio investments. The Valuation Designee may value the Portfolio's portfolio securities for which market quotations are not readily available and other Portfolio assets utilizing inputs from pricing services and other third-party sources. The Valuation Committee meets (in person, via electronic mail or via teleconference) on an ad-hoc basis to determine fair valuations and on a quarterly basis to review fair value events with respect to certain securities for which market quotations are not readily available, including valuation risks and back-testing results, and to preview reports to the Board.
The Valuation Committee establishes prices of securities for which market quotations are not readily available based on such methodologies and measurements on a regular basis after considering information that is reasonably available and deemed relevant by the Valuation Committee. The Board shall oversee the Valuation Designee and review fair valuation materials on a prompt, quarterly and annual basis and approve proposed revisions to the Valuation Procedures.
Investments for which market quotations are not readily available are valued at fair value as determined in good faith pursuant to the Valuation Procedures. A market quotation is readily available only when that quotation is a quoted price (unadjusted) in active markets for identical investments that the Portfolio can access at the measurement date, provided that a quotation will not be readily available if it is not reliable. "Fair value" is defined as the price the Portfolio would reasonably expect
Notes to Financial Statements (continued)
to receive upon selling an asset or liability in an orderly transaction to an independent buyer in the principal or most advantageous market for the asset or liability. Fair value measurements are determined within a framework that establishes a three-tier hierarchy that maximizes the use of observable market data and minimizes the use of unobservable inputs to establish a classification of fair value measurements for disclosure purposes. "Inputs" refer broadly to the assumptions that market participants would use in pricing the asset or liability, including assumptions about risk, such as the risk inherent in a particular valuation technique used to measure fair value using a pricing model and/or the risk inherent in the inputs for the valuation technique. Inputs may be observable or unobservable. Observable inputs reflect the assumptions market participants would use in pricing the asset or liability based on market data obtained from sources independent of the Portfolio. Unobservable inputs reflect the Portfolio’s own assumptions about the assumptions market participants would use in pricing the asset or liability based on the information available. The inputs or methodology used for valuing assets or liabilities may not be an indication of the risks associated with investing in those assets or liabilities. The three-tier hierarchy of inputs is summarized below.
| • | Level 1—quoted prices (unadjusted) in active markets for an identical asset or liability |
| • | Level 2—other significant observable inputs (including quoted prices for a similar asset or liability in active markets, interest rates and yield curves, prepayment speeds, credit risk, etc.) |
| • | Level 3—significant unobservable inputs (including the Portfolio's own assumptions about the assumptions that market participants would use in measuring fair value of an asset or liability) |
The level of an asset or liability within the fair value hierarchy is based on the lowest level of an input, both individually and in the aggregate, that is significant to the fair value measurement. The aggregate value by input level of the Portfolio’s assets and liabilities as of December 31, 2023, is included at the end of the Portfolio of Investments.
The Portfolio may use third-party vendor evaluations, whose prices may be derived from one or more of the following standard inputs, among others:
| • Broker/dealer quotes | • Benchmark securities |
| • Two-sided markets | • Reference data (corporate actions or material event notices) |
| • Bids/offers | • Monthly payment information |
| • Industry and economic events | • Reported trades |
An asset or liability for which a market quotation is not readily available is valued by methods deemed reasonable in good faith by the Valuation Committee, following the Valuation Procedures to represent fair value. Under these procedures, the Valuation Designee generally uses a market-based approach which may use related or comparable assets or liabilities, recent transactions, market multiples, book values and other relevant information. The Valuation Designee may also use an
income-based valuation approach in which the anticipated future cash flows of the asset or liability are discounted to calculate fair value. Discounts may also be applied due to the nature and/or duration of any restrictions on the disposition of the asset or liability. Fair value represents a good faith approximation of the value of a security. Fair value determinations involve the consideration of a number of subjective factors, an analysis of applicable facts and circumstances and the exercise of judgment. As a result, it is possible that the fair value for a security determined in good faith in accordance with the Valuation Procedures may differ from valuations for the same security determined for other funds using their own valuation procedures. Although the Valuation Procedures are designed to value a security at the price the Portfolio may reasonably expect to receive upon the security's sale in an orderly transaction, there can be no assurance that any fair value determination thereunder would, in fact, approximate the amount that the Portfolio would actually realize upon the sale of the security or the price at which the security would trade if a reliable market price were readily available. During the year ended December 31, 2023, there were no material changes to the fair value methodologies.
Securities which may be valued in this manner include, but are not limited to: (i) a security for which trading has been halted or suspended or otherwise does not have a readily available market quotation on a given day; (ii) a debt security that has recently gone into default and for which there is not a current market quotation; (iii) a security of an issuer that has entered into a restructuring; (iv) a security that has been delisted from a national exchange; (v) a security subject to trading collars for which no or limited trading takes place; and (vi) a security whose principal market has been temporarily closed at a time when, under normal conditions, it would be open. Securities valued in this manner are generally categorized as Level 2 or 3 in the hierarchy.
Equity securities, rights and warrants, if applicable, are valued at the last quoted sales prices as of the close of regular trading on the relevant exchange on each valuation date. Securities that are not traded on the valuation date are valued at the mean of the last quoted bid and ask prices. Prices are normally taken from the principal market in which each security trades. These securities are generally categorized as Level 1 in the hierarchy.
Investments in mutual funds, including money market funds, are valued at their respective NAVs at the close of business each day on the valuation date. These securities are generally categorized as Level 1 in the hierarchy.
Futures contracts are valued at the last posted settlement price on the market where such futures are primarily traded. These securities are generally categorized as Level 1 in the hierarchy.
Debt securities (other than convertible and municipal bonds) are valued at the evaluated bid prices (evaluated mean prices in the case of convertible and municipal bonds) supplied by a pricing agent or broker selected by the Valuation Designee, in consultation with the Subadvisor. The evaluations are market-based measurements processed through a pricing application and represents the pricing agent’s good faith determination as
| 24 | MainStay VP S&P 500 Index Portfolio |
to what a holder may receive in an orderly transaction under market conditions. The rules-based logic utilizes valuation techniques that reflect participants’ assumptions and vary by asset class and per methodology, maximizing the use of relevant observable data including quoted prices for similar assets, benchmark yield curves and market corroborated inputs. The evaluated bid or mean prices are deemed by the Valuation Designee, in consultation with the Subadvisor, to be representative of market values at the regular close of trading of the Exchange on each valuation date. Debt securities purchased on a delayed delivery basis are marked to market daily until settlement at the forward settlement date. Debt securities, including corporate bonds, U.S. government and federal agency bonds, municipal bonds, foreign bonds, convertible bonds, asset-backed securities and mortgage-backed securities are generally categorized as Level 2 in the hierarchy.
Temporary cash investments acquired in excess of 60 days to maturity at the time of purchase are valued using the latest bid prices or using valuations based on a matrix system (which considers such factors as security prices, yields, maturities and ratings), both as furnished by independent pricing services. Temporary cash investments that mature in 60 days or less at the time of purchase ("Short-Term Investments") are valued using the amortized cost method of valuation, unless the use of such method would be inappropriate. The amortized cost method involves valuing a security at its cost on the date of purchase and thereafter assuming a constant amortization to maturity of the difference between such cost and the value on maturity date. Amortized cost approximates the current fair value of a security. Securities valued using the amortized cost method are not valued using quoted prices in an active market and are generally categorized as Level 2 in the hierarchy.
The information above is not intended to reflect an exhaustive list of the methodologies that may be used to value portfolio investments. The Valuation Procedures permit the use of a variety of valuation methodologies in connection with valuing portfolio investments. The methodology used for a specific type of investment may vary based on the market data available or other considerations. The methodologies summarized above may not represent the specific means by which portfolio investments are valued on any particular business day.
A portfolio investment may be classified as an illiquid investment under the Portfolio's written liquidity risk management program and related procedures (“Liquidity Program”). Illiquidity of an investment might prevent the sale of such investment at a time when the Manager or the Subadvisor might wish to sell, and these investments could have the effect of decreasing the overall level of the Portfolio's liquidity. Further, the lack of an established secondary market may make it more difficult to value illiquid investments, requiring the Portfolio to rely on judgments that may be somewhat subjective in measuring value, which could vary materially from the amount that the Portfolio could realize upon disposition. Difficulty in selling illiquid investments may result in a loss or may be costly to the Portfolio. An illiquid investment is any investment that the Manager or Subadvisor reasonably expects cannot be sold or disposed of in current market conditions in seven calendar days or less without the sale or disposition significantly changing the market value of
the investment. The liquidity classification of each investment will be made using information obtained after reasonable inquiry and taking into account, among other things, relevant market, trading and investment-specific considerations in accordance with the Liquidity Program. Illiquid investments are often fair valued in accordance with the Portfolio's procedures described above. The liquidity of the Portfolio's investments was determined as of December 31, 2023, and can change at any time.
(B) Income Taxes. The Portfolio's policy is to comply with the requirements of the Internal Revenue Code of 1986, as amended (the “Internal Revenue Code”), applicable to regulated investment companies and to distribute all of its taxable income to the shareholders of the Portfolio within the allowable time limits.
The Manager evaluates the Portfolio’s tax positions to determine if the tax positions taken meet the minimum recognition threshold in connection with accounting for uncertainties in income tax positions taken or expected to be taken for the purposes of measuring and recognizing tax liabilities in the financial statements. Recognition of tax benefits of an uncertain tax position is permitted only to the extent the position is “more likely than not” to be sustained assuming examination by taxing authorities. The Manager analyzed the Portfolio's tax positions taken on federal, state and local income tax returns for all open tax years (for up to three tax years) and has concluded that no provisions for federal, state and local income tax are required in the Portfolio's financial statements. The Portfolio's federal, state and local income tax and federal excise tax returns for tax years for which the applicable statutes of limitations have not expired are subject to examination by the Internal Revenue Service and state and local departments of revenue.
(C) Dividends and Distributions to Shareholders. Dividends and distributions are recorded on the ex-dividend date. The Portfolio intends to declare and pay dividends from net investment income and distributions from net realized capital and currency gains, if any, at least annually. All dividends and distributions are reinvested at NAV in the same class of shares of the Portfolio. Dividends and distributions to shareholders are determined in accordance with federal income tax regulations and may differ from determinations using GAAP.
(D) Security Transactions and Investment Income. The Portfolio records security transactions on the trade date. Realized gains and losses on security transactions are determined using the identified cost method. Dividend income is recognized on the ex-dividend date, net of any foreign tax withheld at the source, and interest income is accrued as earned using the effective interest rate method. Distributions received from real estate investment trusts may be classified as dividends, capital gains and/or return of capital.
Investment income and realized and unrealized gains and losses on investments of the Portfolio are allocated pro rata to the separate classes of shares based upon their relative net assets on the date the income is earned or realized and unrealized gains and losses are incurred.
Notes to Financial Statements (continued)
(E) Expenses. Expenses of the Fund are allocated to the individual Portfolios in proportion to the net assets of the respective Portfolios when the expenses are incurred, except where direct allocations of expenses can be made. Expenses (other than fees incurred under the distribution and service plans, further discussed in Note 3(B), which are charged directly to the Service Class shares) are allocated to separate classes of shares pro rata based upon their relative net assets on the date the expenses are incurred. The expenses borne by the Portfolio, including those of related parties to the Portfolio, are shown in the Statement of Operations.
Additionally, the Portfolio may invest in mutual funds, which are subject to management fees and other fees that may cause the costs of investing in mutual funds to be greater than the costs of owning the underlying securities directly. These indirect expenses of mutual funds are not included in the amounts shown as expenses in the Statement of Operations or in the expense ratios included in the Financial Highlights.
(F) Use of Estimates. In preparing financial statements in conformity with GAAP, the Manager makes estimates and assumptions that affect the reported amounts and disclosures in the financial statements. Actual results could differ from those estimates and assumptions.
(G) Futures Contracts. A futures contract is an agreement to purchase or sell a specified quantity of an underlying instrument at a specified future date and price, or to make or receive a cash payment based on the value of a financial instrument (e.g., foreign currency, interest rate, security or securities index). The Portfolio is subject to risks such as market price risk, leverage risk, liquidity risk, counterparty risk, operational risk, legal risk and/or interest rate risk in the normal course of investing in these contracts. Upon entering into a futures contract, the Portfolio is required to pledge to the broker or futures commission merchant an amount of cash and/or U.S. government securities equal to a certain percentage of the collateral amount, known as the “initial margin.” During the period the futures contract is open, changes in the value of the contract are recognized as unrealized appreciation or depreciation by marking to market such contract on a daily basis to reflect the market value of the contract at the end of each day’s trading. The Portfolio agrees to receive from or pay to the broker or futures commission merchant an amount of cash equal to the daily fluctuation in the value of the contract. Such receipts or payments are known as “variation margin.” When the futures contract is closed, the Portfolio records a realized gain or loss equal to the difference between the proceeds from (or cost of) the closing transaction and the Portfolio's basis in the contract.
The use of futures contracts involves, to varying degrees, elements of market risk in excess of the amount recognized in the Statement of Assets and Liabilities. The contract or notional amounts and variation margin reflect the extent of the Portfolio's involvement in open futures positions. There are several risks associated with the use of futures contracts as hedging techniques. There can be no assurance that a liquid market will exist at the time when the Portfolio seeks to close out a futures contract. If no liquid market exists, the Portfolio would remain
obligated to meet margin requirements until the position is closed. Futures contracts may involve a small initial investment relative to the risk assumed, which could result in losses greater than if the Portfolio did not invest in futures contracts. Futures contracts may be more volatile than direct investments in the instrument underlying the futures and may not correlate to the underlying instrument, causing a given hedge not to achieve its objectives. The Portfolio's activities in futures contracts have minimal counterparty risk as they are conducted through regulated exchanges that guarantee the futures against default by the counterparty. In the event of a bankruptcy or insolvency of a futures commission merchant that holds margin on behalf of the Portfolio, the Portfolio may not be entitled to the return of the entire margin owed to the Portfolio, potentially resulting in a loss. The Portfolio may invest in futures contracts to seek enhanced returns or to reduce the risk of loss by hedging certain of its holdings. The Portfolio's investment in futures contracts and other derivatives may increase the volatility of the Portfolio's NAVs and may result in a loss to the Portfolio.
(H) Foreign Currency Transactions. The Portfolio's books and records are maintained in U.S. dollars. Prices of securities denominated in foreign currency amounts are translated into U.S. dollars at the mean between the buying and selling rates last quoted by any major U.S. bank at the following dates:
(i) market value of investment securities, other assets and liabilities— at the valuation date; and
(ii) purchases and sales of investment securities, income and expenses—at the date of such transactions.
The assets and liabilities that are denominated in foreign currency amounts are presented at the exchange rates and market values at the close of the period. The realized and unrealized changes in net assets arising from fluctuations in exchange rates and market prices of securities are not separately presented.
Net realized gain (loss) on foreign currency transactions represents net currency gains or losses realized as a result of differences between the amounts of securities sale proceeds or purchase cost, dividends, interest and withholding taxes as recorded on the Portfolio's books, and the U.S. dollar equivalent amount actually received or paid. Net currency gains or losses from valuing such foreign currency denominated assets and liabilities, other than investments at valuation date exchange rates, are reflected in unrealized foreign exchange gains or losses.
(I) Securities Lending. In order to realize additional income, the Portfolio may engage in securities lending, subject to the limitations set forth in the 1940 Act and relevant guidance by the staff of the Securities and Exchange Commission (“SEC”). If the Portfolio engages in securities lending, the Portfolio will lend through its custodian, JPMorgan Chase Bank, N.A., ("JPMorgan"), acting as securities lending agent on behalf of the Portfolio. Under the current arrangement, JPMorgan will manage the Portfolio's collateral in accordance with the securities lending agency agreement between the Portfolio and JPMorgan, and indemnify the Portfolio against counterparty risk. The loans will be collateralized by cash
| 26 | MainStay VP S&P 500 Index Portfolio |
(which may be invested in a money market fund) and/or non-cash collateral (which may include U.S. Treasury securities and/or U.S. government agency securities issued or guaranteed by the United States government or its agencies or instrumentalities) at least equal at all times to the market value of the securities loaned. Non-cash collateral held at year end is segregated and cannot be transferred by the Portfolio. The Portfolio bears the risk of delay in recovery of, or loss of rights in, the securities loaned. The Portfolio may also record a realized gain or loss on securities deemed sold due to a borrower’s inability to return securities on loan. The Portfolio bears the risk of any loss on investment of cash collateral. The Portfolio will receive compensation for lending its securities in the form of fees or it will retain a portion of interest earned on the investment of any cash collateral. The Portfolio will also continue to receive interest and dividends on the securities loaned and any gain or loss in the market price of the securities loaned that may occur during the term of the loan will be for the account of the Portfolio. Income earned from securities lending activities, if any, is reflected in the Statement of Operations.
(J) Rights and Warrants. Rights are certificates that permit the holder to purchase a certain number of shares, or a fractional share, of a new stock from the issuer at a specific price. Warrants are instruments that entitle the holder to buy an equity security at a specific price for a specific period of time. These investments can provide a greater potential for profit or loss than an equivalent investment in the underlying security. Prices of these investments do not necessarily move in tandem with the prices of the underlying securities.
There is risk involved in the purchase of rights and warrants in that these investments are speculative investments. The Portfolio could also lose the entire value of its investment in warrants if such warrants are not exercised by the date of its expiration. The Portfolio is exposed to risk until the sale or exercise of each right or warrant is completed.
(K) Securities Risk. The ability of issuers of debt securities held by the Portfolio to meet their obligations may be affected by, among other things, economic or political developments in a specific country, industry or region. Debt securities are also subject to the risks associated with changes in interest rates.
(L) Indemnifications. Under the Fund’s organizational documents, its officers and trustees are indemnified against certain liabilities that may arise out of performance of their duties to the Fund. Additionally, in the normal course of business, the Portfolio enters into contracts with third-party service providers that contain a variety of representations and warranties and that may provide general indemnifications. The Portfolio's maximum exposure under these arrangements is unknown, as this would involve future claims that may be made against the Portfolio that have not yet occurred. The Manager believes that the risk of loss in connection with these potential indemnification obligations is remote. However, there can be no assurance that material liabilities related to such obligations will not arise in the future, which could adversely impact the Portfolio.
(M) Quantitative Disclosure of Derivative Holdings. The following tables show additional disclosures related to the Portfolio's derivative and hedging activities, including how such activities are accounted for and their effect on the Portfolio's financial positions, performance and cash flows.
The Portfolio entered into futures contracts to manage its exposure to the securities markets or to movements in interest rates and currency values.
Fair value of derivative instruments as of December 31, 2023:
| Asset Derivatives | Equity
Contracts
Risk | Total |
| Futures Contracts - Net Assets—Net unrealized appreciation on futures contracts (a) | $778,190 | $778,190 |
| Total Fair Value | $778,190 | $778,190 |
| (a) | Includes cumulative appreciation (depreciation) of futures contracts as reported in the Portfolio of Investments. Only current day’s variation margin is reported within the Statement of Assets and Liabilities. |
The effect of derivative instruments on the Statement of Operations for the year ended December 31, 2023:
| Net Realized Gain (Loss) from: | Equity
Contracts
Risk | Total |
| Futures Transactions | $3,231,501 | $3,231,501 |
| Total Net Realized Gain (Loss) | $3,231,501 | $3,231,501 |
| Net Change in Unrealized Appreciation (Depreciation) | Equity
Contracts
Risk | Total |
| Futures Contracts | $1,592,915 | $1,592,915 |
| Total Net Change in Unrealized Appreciation (Depreciation) | $1,592,915 | $1,592,915 |
| Average Notional Amount | Total |
| Futures Contracts Long | $38,818,693 |
Note 3–Fees and Related Party Transactions
(A) Manager and Subadvisor. New York Life Investments, a registered investment adviser and an indirect, wholly-owned subsidiary of New York Life, serves as the Portfolio's Manager, pursuant to an Amended and Restated Management Agreement ("Management Agreement"). The Manager provides offices, conducts clerical, recordkeeping and bookkeeping services and keeps most of the financial and accounting records required to be maintained by the Portfolio. Except for the portion of salaries and expenses that are the responsibility of the Portfolio, the Manager pays the salaries and expenses of all personnel affiliated with the Portfolio and certain operational expenses of the Portfolio. The Portfolio reimburses New York Life Investments in an amount equal to the portion of the compensation of the Chief Compliance Officer attributable
Notes to Financial Statements (continued)
to the Portfolio. IndexIQ Advisors LLC (“IndexIQ” or the “Subadvisor”), a registered investment adviser and an affiliate of New York Life Investments, is responsible for the day-to-day portfolio management of the Portfolio. Pursuant to the terms of an Amended and Restated Subadvisory Agreement between New York Life Investments and IndexIQ, New York Life Investments pays for the services of the Subadvisor.
Pursuant to the Management Agreement, the Fund pays the Manager, on behalf of the Portfolio, a monthly fee for the services performed and the facilities furnished at an annual rate of the Portfolio's average daily net assets as follows: 0.16% up to $2.5 billion; and 0.15% in excess of $2.5 billion. During the year ended December 31, 2023, the effective management fee rate was 0.16% (exclusive of any applicable waivers/reimbursements) of the Portfolio's average daily net assets.
New York Life Investments has contractually agreed to waive fees and/or reimburse expenses so that the Total Annual Portfolio Operating Expenses (excluding taxes, interest, litigation, extraordinary expenses, brokerage and other transaction expenses relating to the purchase or sale of portfolio investments, and acquired (underlying) portfolio/fund fees and expenses) of Initial Class shares and Service Class shares do not exceed 0.12% and 0.37%, respectively, of the Portfolio's average daily net assets. This agreement will remain in effect until May 1, 2024, and shall renew automatically for one-year terms unless New York Life Investments provides written notice of termination prior to the start of the next term or upon approval of the Board.
During the year ended December 31, 2023, New York Life Investments earned fees from the Portfolio in the amount of $5,302,180 and waived fees and/or reimbursed expenses in the amount of $2,220,095 and paid the Subadvisor fees in the amount of $1,541,043.
JPMorgan provides sub-administration and sub-accounting services to the Portfolio pursuant to an agreement with New York Life Investments. These services include calculating the daily NAVs of the Portfolio, maintaining the general ledger and sub-ledger accounts for the calculation of the Portfolio's NAVs, and assisting New York Life Investments in conducting various aspects of the Portfolio's administrative operations. For providing these services to the Portfolio, JPMorgan is compensated by New York Life Investments.
Pursuant to an agreement between the Fund and New York Life Investments, New York Life Investments is responsible for providing or procuring certain regulatory reporting services for the Portfolio. The Portfolio will reimburse New York Life Investments for the actual costs incurred by New York Life Investments in connection with providing or procuring these services for the Portfolio.
(B) Distribution and Service Fees. The Fund, on behalf of the Portfolio, has entered into a distribution agreement with NYLIFE Distributors LLC (the “Distributor”), an affiliate of New York Life Investments. The Portfolio has adopted a distribution plan (the “Plan”) in accordance with the provisions of Rule 12b-1 under the 1940 Act. Under the Plan, the Distributor has agreed to provide, through its affiliates or independent third parties, various distribution-related, shareholder and
administrative support services to the Service Class shareholders. For its services, the Distributor is entitled to a combined distribution and service fee accrued daily and paid monthly at an annual rate of 0.25% of the average daily net assets attributable to the Service Class shares of the Portfolio.
Note 4-Federal Income Tax
As of December 31, 2023, the cost and unrealized appreciation (depreciation) of the Portfolio’s investment portfolio, including applicable derivative contracts and other financial instruments, as determined on a federal income tax basis, were as follows:
| | Federal Tax
Cost | Gross
Unrealized
Appreciation | Gross
Unrealized
(Depreciation) | Net
Unrealized
Appreciation/
(Depreciation) |
| Investments in Securities | $1,121,798,727 | $2,696,120,905 | $(30,513,031) | $2,665,607,874 |
As of December 31, 2023, the components of accumulated gain (loss) on a tax basis were as follows:
Ordinary
Income | Accumulated
Capital
and Other
Gain (Loss) | Other
Temporary
Differences | Unrealized
Appreciation
(Depreciation) | Total
Accumulated
Gain (Loss) |
| $49,970,336 | $12,123,728 | $286,473 | $2,665,607,874 | $2,727,988,411 |
The difference between book-basis and tax-basis unrealized appreciation (depreciation) is primarily due to wash sale adjustments and mark to market of futures contracts.
The following table discloses the current year reclassifications between total distributable earnings (loss) and additional paid-in capital arising from permanent differences; net assets as of December 31, 2023 were not affected.
| | Total
Distributable
Earnings (Loss) | Additional
Paid-In
Capital |
| | $(17,341) | $17,341 |
The reclassifications for the Portfolio are primarily due to Real Estate Investment Trust ("REIT") adjustments.
During the years ended December 31, 2023 and December 31, 2022, the tax character of distributions paid as reflected in the Statements of Changes in Net Assets was as follows:
| | 2023 | 2022 |
| Distributions paid from: | | |
| Ordinary Income | $43,318,899 | $ 88,524,568 |
| Long-Term Capital Gains | 52,897,617 | 53,199,954 |
| Total | $96,216,516 | $141,724,522 |
| 28 | MainStay VP S&P 500 Index Portfolio |
Note 5–Custodian
JPMorgan is the custodian of cash and securities held by the Portfolio. Custodial fees are charged to the Portfolio based on the Portfolio's net assets and/or the market value of securities held by the Portfolio and the number of certain transactions incurred by the Portfolio.
Note 6–Line of Credit
The Portfolio and certain other funds managed by New York Life Investments maintain a line of credit with a syndicate of banks in order to secure a source of funds for temporary purposes to meet unanticipated or excessive redemption requests.
Effective July 25, 2023, under the credit agreement (the “Credit Agreement”), the aggregate commitment amount is $600,000,000 with an additional uncommitted amount of $100,000,000. The commitment fee is an annual rate of 0.15% of the average commitment amount payable quarterly, regardless of usage, to JPMorgan, who serves as the agent to the syndicate. The commitment fee is allocated among the Portfolio and certain other funds managed by New York Life Investments based upon their respective net assets and other factors. Interest on any revolving credit loan is charged based upon the Federal Funds Rate, Daily Simple Secured Overnight Financing Rate ("SOFR") + 0.10%, or the Overnight Bank Funding Rate, whichever is higher. The Credit Agreement expires on July 23, 2024, although the Portfolio, certain other funds managed by New York Life Investments and the syndicate of banks may renew the Credit Agreement for an additional year on the same or different terms or enter into a credit agreement with a different syndicate of banks. Prior to July 25, 2023, the aggregate commitment amount and the commitment fee were the same as those under the current Credit Agreement. During the year ended December 31, 2023, there were no borrowings made or outstanding with respect to the Portfolio under the Credit Agreement.
Note 7–Interfund Lending Program
Pursuant to an exemptive order issued by the SEC, the Portfolio, along with certain other funds managed by New York Life Investments, may participate in an interfund lending program. The interfund lending program provides an alternative credit facility that permits the Portfolio and certain other funds managed by New York Life Investments to lend or borrow money for temporary purposes directly to or from one another, subject to the conditions of the exemptive order. During the year ended December 31, 2023, there were no interfund loans made or outstanding with respect to the Portfolio.
Note 8–Purchases and Sales of Securities (in 000’s)
During the year ended December 31, 2023, purchases and sales of securities, other than short-term securities, were $115,417 and $64,095, respectively.
Note 9–Capital Share Transactions
Transactions in capital shares for the years ended December 31, 2023 and December 31, 2022, were as follows:
| Initial Class | Shares | Amount |
| Year ended December 31, 2023: | | |
| Shares sold | 1,090,498 | $ 88,147,557 |
| Shares issued to shareholders in reinvestment of distributions | 546,877 | 42,435,488 |
| Shares redeemed | (1,224,341) | (95,637,216) |
| Net increase (decrease) | 413,034 | $ 34,945,829 |
| Year ended December 31, 2022: | | |
| Shares sold | 460,168 | $ 34,910,174 |
| Shares issued to shareholders in reinvestment of distributions | 934,676 | 62,047,386 |
| Shares redeemed | (2,599,133) | (206,953,691) |
| Net increase (decrease) | (1,204,289) | $(109,996,131) |
| |
| Service Class | Shares | Amount |
| Year ended December 31, 2023: | | |
| Shares sold | 3,417,303 | $ 264,671,535 |
| Shares issued to shareholders in reinvestment of distributions | 699,951 | 53,781,028 |
| Shares redeemed | (3,196,047) | (246,798,318) |
| Net increase (decrease) | 921,207 | $ 71,654,245 |
| Year ended December 31, 2022: | | |
| Shares sold | 3,369,175 | $ 256,381,937 |
| Shares issued to shareholders in reinvestment of distributions | 1,211,573 | 79,677,136 |
| Shares redeemed | (2,748,435) | (210,679,983) |
| Net increase (decrease) | 1,832,313 | $ 125,379,090 |
Note 10–Other Matters
As of the date of this report, the Portfolio faces a heightened level of risk associated with current uncertainty, volatility and state of economies, financial markets, rising interest rates, and labor and health conditions around the world. Events such as war, acts of terrorism, recessions, rapid inflation, the imposition of international sanctions, earthquakes, hurricanes, epidemics and pandemics and other unforeseen natural or human disasters may have broad adverse social, political and economic effects on the global economy, which could negatively impact the value of the Portfolio's investments. Developments that disrupt global economies and financial markets may magnify factors that affect the Portfolio's performance.
Note 11–Subsequent Events
In connection with the preparation of the financial statements of the Portfolio as of and for the year ended December 31, 2023, events and transactions subsequent to December 31, 2023, through the date the financial statements were issued, have been evaluated by the Manager
Notes to Financial Statements (continued)
for possible adjustment and/or disclosure. No subsequent events requiring financial statement adjustment or disclosure have been identified.
| 30 | MainStay VP S&P 500 Index Portfolio |
Report of Independent Registered Public Accounting Firm
To the Board of Trustees of MainStay VP Funds Trust and Shareholders of MainStay VP S&P 500 Index Portfolio
Opinion on the Financial Statements
We have audited the accompanying statement of assets and liabilities, including the portfolio of investments, of MainStay VP S&P 500 Index Portfolio (one of the portfolios constituting MainStay VP Funds Trust, referred to hereafter as the “Portfolio”) as of December 31, 2023, the related statement of operations for the year ended December 31, 2023, the statements of changes in net assets for each of the two years in the period ended December 31, 2023, including the related notes, and the financial highlights for each of the five years in the period ended December 31, 2023 (collectively referred to as the “financial statements”). In our opinion, the financial statements present fairly, in all material respects, the financial position of the Portfolio as of December 31, 2023, the results of its operations for the year then ended, the changes in its net assets for each of the two years in the period ended December 31, 2023 and the financial highlights for each of the five years in the period ended December 31, 2023 in conformity with accounting principles generally accepted in the United States of America.
Basis for Opinion
These financial statements are the responsibility of the Portfolio’s management. Our responsibility is to express an opinion on the Portfolio’s financial statements based on our audits. We are a public accounting firm registered with the Public Company Accounting Oversight Board (United States) (PCAOB) and are required to be independent with respect to the Portfolio in accordance with the U.S. federal securities laws and the applicable rules and regulations of the Securities and Exchange Commission and the PCAOB.
We conducted our audits of these financial statements in accordance with the standards of the PCAOB. Those standards require that we plan and perform the audit to obtain reasonable assurance about whether the financial statements are free of material misstatement, whether due to error or fraud.
Our audits included performing procedures to assess the risks of material misstatement of the financial statements, whether due to error or fraud, and performing procedures that respond to those risks. Such procedures included examining, on a test basis, evidence regarding the amounts and disclosures in the financial statements. Our audits also included evaluating the accounting principles used and significant estimates made by management, as well as evaluating the overall presentation of the financial statements. Our procedures included confirmation of securities owned as of December 31, 2023 by correspondence with the custodian, transfer agents and brokers; when replies were not received from brokers, we performed other auditing procedures. We believe that our audits provide a reasonable basis for our opinion.
/s/PricewaterhouseCoopers LLP
New York, New York
February 26, 2024
We have served as the auditor of one or more investment companies in the MainStay group of funds since 1984.
Board Consideration and Approval of Management Agreement and Subadvisory Agreement (Unaudited)
The continuation of the Management Agreement with respect to the MainStay VP S&P 500 Index Portfolio (“Portfolio”) and New York Life Investment Management LLC (“New York Life Investments”) and the Subadvisory Agreement between New York Life Investments and IndexIQ Advisors LLC (“IndexIQ”) with respect to the Portfolio (together, “Advisory Agreements”) is subject to annual review and approval by the Board of Trustees of MainStay VP Funds Trust (“Board” of the “Trust”) in accordance with Section 15 of the Investment Company Act of 1940, as amended (“1940 Act”). At its December 6–7, 2023 meeting, the Board, including the Trustees who are not an “interested person” (as such term is defined in the 1940 Act) of the Trust (“Independent Trustees”) voting separately, unanimously approved the continuation of each of the Advisory Agreements for a one-year period.
In reaching the decision to approve the continuation of each of the Advisory Agreements, the Board considered information and materials furnished by New York Life Investments and IndexIQ in connection with an annual contract review process undertaken by the Board that took place at meetings of the Board and its Contracts Committee from September 2023 through December 2023, including information and materials furnished by New York Life Investments and IndexIQ in response to requests prepared on behalf of the Board, and in consultation with the Independent Trustees, by independent legal counsel to the Independent Trustees, which encompassed a variety of topics, including those summarized below. Information and materials requested by and furnished to the Board for consideration in connection with the contract review process included, among other items, reports on the Portfolio and “peer funds” prepared by Institutional Shareholder Services Inc. (“ISS”), an independent third-party service provider engaged by the Board to report objectively on the Portfolio’s investment performance, management fee and total expenses. The Board also considered information on the fees charged to other investment advisory clients of New York Life Investments and/or IndexIQ that follow investment strategies similar to those of the Portfolio, if any, and, when applicable, the rationale for differences in the Portfolio’s management and subadvisory fees and the fees charged to those other investment advisory clients. In addition, the Board considered information regarding the legal standards and fiduciary obligations applicable to its consideration of the continuation of each of the Advisory Agreements. The contract review process, including the structure and format for information and materials provided to the Board, has been developed in consultation with the Board. The Independent Trustees also met in executive sessions with their independent legal counsel and, for portions thereof, with senior management of New York Life Investments.
The Board’s deliberations with respect to the continuation of each of the Advisory Agreements reflect a year-long process, and the Board also took into account information furnished to the Board and its Committees throughout the year, as deemed relevant and appropriate by the Trustees, including, among other items, reports on investment performance of the Portfolio and investment-related matters for the Portfolio as well as presentations from New York Life Investments and, generally annually, IndexIQ personnel. In addition, the Board took into account other
information provided by New York Life Investments throughout the year, including, among other items, periodic reports on legal and compliance matters, risk management, portfolio turnover, brokerage commissions and non-advisory services provided to the Portfolio by New York Life Investments, as deemed relevant and appropriate by the Trustees.
In addition to information provided to the Board throughout the year, the Board received information in connection with its June 2023 meeting provided specifically in response to requests prepared on behalf of the Board, and in consultation with the Independent Trustees, by independent legal counsel to the Independent Trustees regarding the Portfolio’s distribution arrangements. In addition, the Board received information regarding the Portfolio’s asset levels, share purchase and redemption activity and the payment of Rule 12b-1 and/or certain other fees by the applicable share classes of the Portfolio, among other information.
In considering the continuation of each of the Advisory Agreements, the Trustees reviewed and evaluated the information and factors they believed to reasonably be necessary and appropriate in light of legal advice furnished to them by independent legal counsel to the Independent Trustees and through the exercise of their own business judgment. Although individual Trustees may have weighed certain factors or information differently and the Board did not consider any single factor or information controlling in reaching its decision, the factors that figured prominently in the Board’s consideration of the continuation of each of the Advisory Agreements are summarized in more detail below and include, among other factors: (i) the nature, extent and quality of the services provided to the Portfolio by New York Life Investments and IndexIQ; (ii) the qualifications of the portfolio managers of the Portfolio and the historical investment performance of the Portfolio, New York Life Investments and IndexIQ; (iii) the costs of the services provided, and profits realized, by New York Life Investments and IndexIQ with respect to their relationships with the Portfolio; (iv) the extent to which economies of scale have been realized or may be realized if the Portfolio grows and the extent to which any economies of scale have been shared, have benefited or may benefit the Portfolio’s shareholders; and (v) the reasonableness of the Portfolio’s management and subadvisory fees and total ordinary operating expenses. Although the Board recognized that comparisons between the Portfolio’s fees and expenses and those of other funds are imprecise given different terms of agreements, variations in fund strategies and other factors, the Board considered the reasonableness of the Portfolio’s management fee and total ordinary operating expenses as compared to the peer funds identified by ISS. Throughout their considerations, the Trustees acknowledged the commitment of New York Life Investments and its affiliates to serve the MainStay Group of Funds, as well as their capacity, experience, resources, financial stability and reputations. The Trustees also acknowledged the entrepreneurial and other risks assumed by New York Life Investments in sponsoring and managing the Portfolio. With respect to the Subadvisory Agreement, the Board took into account New York Life Investments’ recommendation to approve the continuation of the Subadvisory Agreement.
| 32 | MainStay VP S&P 500 Index Portfolio |
The Trustees noted that, throughout the year, the Trustees are afforded an opportunity to ask questions of, and request additional information or materials from, New York Life Investments and IndexIQ. The Board’s decision with respect to each of the Advisory Agreements may have also been based, in part, on the Board’s knowledge of New York Life Investments and IndexIQ resulting from, among other things, the Board’s consideration of each of the Advisory Agreements in prior years, the advisory agreements for other funds in the MainStay Group of Funds, the Board’s review throughout the year of the performance and operations of other funds in the MainStay Group of Funds and each Trustee’s business judgment and industry experience. In addition to considering the above-referenced factors, the Board observed that in the marketplace, notably under variable life insurance policies and variable annuity contracts for which the Portfolio serves as an investment option, there are a range of investment options available to investors and that the Portfolio’s shareholders, having had the opportunity to consider other investment options, have invested in the Portfolio.
The factors that figured prominently in the Board’s decision to approve the continuation of each of the Advisory Agreements during the Board’s December 6–7, 2023 meeting are summarized in more detail below.
Nature, Extent and Quality of Services Provided by New York Life Investments and IndexIQ
The Board examined the nature, extent and quality of the services that New York Life Investments provides to the Portfolio. The Board evaluated New York Life Investments’ experience and capabilities in serving as manager of the Portfolio and considered that the Portfolio operates in a “manager-of-managers” structure. The Board also considered New York Life Investments’ responsibilities and services provided pursuant to this structure, including overseeing the services provided by IndexIQ, evaluating the performance of IndexIQ, making recommendations to the Board as to whether the Subadvisory Agreement should be renewed, modified or terminated and periodically reporting to the Board regarding the results of New York Life Investments’ evaluation and monitoring functions. The Board noted that New York Life Investments manages other mutual funds, serves a variety of other investment advisory clients, including other pooled investment vehicles, and has experience overseeing mutual fund service providers, including subadvisors. The Board considered the experience of senior personnel at New York Life Investments providing management and administrative and other non-advisory services to the Portfolio. The Board observed that New York Life Investments devotes significant resources and time to providing management and administrative and other non-advisory services to the Portfolio, including New York Life Investments’ oversight and due diligence reviews of IndexIQ and ongoing analysis of, and interactions with, IndexIQ with respect to, among other things, the Portfolio’s investment performance and risks as well as IndexIQ’s investment capabilities and subadvisory services with respect to the Portfolio.
The Board also considered the range of services that New York Life Investments provides to the Portfolio under the terms of the Management Agreement, including: (i) fund accounting and ongoing supervisory
services provided by New York Life Investments’ Fund Administration and Accounting Group; (ii) investment supervisory and analytical services provided by New York Life Investments’ Investment Consulting Group; (iii) compliance services provided by the Trust’s Chief Compliance Officer as well as New York Life Investments’ compliance department, including supervision and implementation of the Portfolio’s compliance program; (iv) legal services provided by New York Life Investments’ Office of the General Counsel; and (v) risk management monitoring and analysis by compliance and investment personnel. In addition, the Board considered New York Life Investments’ willingness to invest in personnel and other resources, such as cyber security, information security and business continuity planning, that may benefit the Portfolio and noted that New York Life Investments is responsible for compensating the Trust’s officers, except for a portion of the salary of the Trust’s Chief Compliance Officer. The Board recognized that New York Life Investments provides certain other non-advisory services to the Portfolio and has over time provided an increasingly broad array of non-advisory services to the MainStay Group of Funds as a result of regulatory and other developments.
The Board also examined the range, and the nature, extent and quality, of the investment advisory services that IndexIQ provides to the Portfolio and considered the terms of each of the Advisory Agreements. The Board evaluated IndexIQ’s experience and performance in serving as subadvisor to the Portfolio and advising other portfolios and IndexIQ’s track record and experience in providing investment advisory services as well as the experience of investment advisory, senior management and administrative personnel at IndexIQ. The Board considered New York Life Investments’ and IndexIQ’s overall resources, legal and compliance environment, capabilities, reputation, financial condition and history. In addition to information provided in connection with quarterly meetings with the Trust’s Chief Compliance Officer, the Board considered information regarding the compliance policies and procedures of New York Life Investments and IndexIQ and acknowledged their commitment to further developing and strengthening compliance programs that may relate to the Portfolio. The Board also considered IndexIQ’s ability to recruit and retain qualified investment professionals and willingness to invest in personnel and other resources that may benefit the Portfolio. In this regard, the Board considered the qualifications and experience of the Portfolio’s portfolio managers, the number of accounts managed by the portfolio managers and the method for compensating the portfolio managers.
In addition, the Board considered information provided by New York Life Investments and IndexIQ regarding their respective business continuity and disaster recovery plans.
Based on these considerations, among others, the Board concluded that the Portfolio would likely continue to benefit from the nature, extent and quality of these services.
Investment Performance
In evaluating the Portfolio’s investment performance, the Board considered investment performance results over various periods in light of the Portfolio’s investment objective, strategies and risks. The Board
Board Consideration and Approval of Management Agreement and Subadvisory Agreement (Unaudited) (continued)
considered investment reports on, and analysis of, the Portfolio’s performance provided to the Board throughout the year. These reports include, among other items, information on the Portfolio’s gross and net returns, the Portfolio’s investment performance compared to a relevant investment category and the Portfolio’s benchmark, the Portfolio’s risk-adjusted investment performance and the Portfolio’s investment performance as compared to peer funds, as appropriate, as well as portfolio attribution information and commentary on the effect of market conditions. The Board also considered information provided by ISS showing the investment performance of the Portfolio as compared to peer funds. In addition, the Board reviewed the methodology used by ISS to construct the group of peer funds for comparative purposes.
The Board also took into account its discussions with senior management at New York Life Investments concerning the Portfolio’s investment performance over various periods as well as discussions between representatives of IndexIQ and the members of the Board’s Investment Committee, which generally occur on an annual basis.
Based on these considerations, among others, the Board concluded that its review of the Portfolio’s investment performance and related information supported a determination to approve the continuation of each of the Advisory Agreements.
Costs of the Services Provided, and Profits and Other Benefits Realized, by New York Life Investments and IndexIQ
The Board considered the costs of the services provided under each of the Advisory Agreements. The Board also considered the profitability of New York Life Investments and its affiliates, including IndexIQ, due to their relationships with the Portfolio as well as by New York Life Investments and its affiliates due to their relationships with the MainStay Group of Funds. Because IndexIQ is an affiliate of New York Life Investments whose subadvisory fee is paid by New York Life Investments, not the Portfolio, the Board considered cost and profitability information for New York Life Investments and IndexIQ in the aggregate.
In addition, the Board acknowledged the difficulty in obtaining reliable comparative data about mutual fund managers’ profitability because such information generally is not publicly available and may be impacted by numerous factors, including the structure of a fund manager’s organization, the types of funds it manages, the methodology used to allocate certain fixed costs to specific funds and the manager’s capital structure and costs of capital.
In evaluating the costs of the services provided by New York Life Investments and IndexIQ, and profitability of New York Life Investments and its affiliates, including IndexIQ due to their relationships with the Portfolio, the Board considered, among other factors, New York Life Investments’ and its affiliates’, including IndexIQ’s, continuing investments in, or willingness to invest in, personnel and other resources that may support and further enhance the management of the Portfolio, and that New York Life Investments is responsible for paying the subadvisory fee for the Portfolio. The Board also considered the financial resources of New York Life Investments and IndexIQ and acknowledged
that New York Life Investments and IndexIQ must be in a position to recruit and retain experienced professional personnel and to maintain a strong financial position for New York Life Investments and IndexIQ to continue to provide high-quality services to the Portfolio. The Board recognized that the Portfolio benefits from the allocation of certain fixed costs among the funds in the MainStay Group of Funds, among other expected benefits resulting from its relationship with New York Life Investments.
The Board considered information regarding New York Life Investments’ methodology for calculating profitability and allocating costs provided by New York Life Investments in connection with the fund profitability analysis presented to the Board. The Board concluded that New York Life Investments’ methods for allocating costs and procedures for estimating overall profitability of the relationship with the funds in the MainStay Group of Funds were reasonable. The Board recognized the difficulty in calculating and evaluating a manager’s profitability with respect to the Portfolio and considered that other profitability methodologies may also be reasonable.
The Board also considered certain fall-out benefits that may be realized by New York Life Investments and its affiliates, including IndexIQ, due to their relationships with the Portfolio, including reputational and other indirect benefits. The Board recognized, for example, the benefits to IndexIQ from legally permitted “soft-dollar” arrangements by which brokers provide research and other services to IndexIQ in exchange for commissions paid by the Portfolio with respect to trades in the Portfolio’s portfolio securities. In addition, the Board considered its review of the management agreement for a money market fund advised by New York Life Investments and an affiliated subadvisor that serves as an investment option for the Portfolio, including the potential rationale for and costs associated with investments in this money market fund by the Portfolio, if any, and considered information from New York Life Investments that the nature and type of specific investment advisory services provided to this money market fund are distinct from, or in addition to, the investment advisory services provided to the Portfolio. In addition, the Board considered the potential dividend received tax deduction for insurance company affiliates of New York Life Investments from the Portfolio’s securities lending activity.
The Board noted that the Portfolio serves as an investment option primarily under variable contracts issued by affiliates of New York Life Investments that would receive fees under those contracts. The Board observed that, in addition to fees earned by New York Life Investments under the Management Agreement for managing the Portfolio, New York Life Investments’ affiliates also earn revenues from serving the Portfolio in various other capacities, including as the Portfolio’s distributor, and insurance companies affiliated with New York Life Investments would be entitled to receive fees from the Portfolio under a distribution and service plan adopted pursuant to Rule 12b-1 under the 1940 Act. The Board considered information about these other revenues and their impact on the profitability of the relationship with the Portfolio to New York Life Investments and its affiliates. The Board noted that, although it assessed the overall profitability of the relationship with the Portfolio to New York
| 34 | MainStay VP S&P 500 Index Portfolio |
Life Investments and its affiliates as part of the contract review process, when considering the reasonableness of the fee paid to New York Life Investments under the Management Agreement, the Board considered the profitability of New York Life Investments’ relationship with the Portfolio on a pre-tax basis and without regard to distribution expenses incurred by New York Life Investments from its own resources.
After evaluating the information deemed relevant by the Trustees, the Board concluded that any profits realized by New York Life Investments and its affiliates, including IndexIQ, due to their relationships with the Portfolio were not excessive and other expected benefits that may accrue to New York Life Investments and its affiliates, including IndexIQ, are reasonable.
Management and Subadvisory Fees and Total Ordinary Operating Expenses
The Board evaluated the reasonableness of the fee paid under each of the Advisory Agreements and the Portfolio’s total ordinary operating expenses. With respect to the management fee and subadvisory fee, the Board primarily considered the reasonableness of the management fee paid by the Portfolio to New York Life Investments because the subadvisory fee paid to IndexIQ is paid by New York Life Investments, not the Portfolio. The Board also considered the reasonableness of the subadvisory fee paid by New York Life Investments and the amount of the management fee retained by New York Life Investments.
In assessing the reasonableness of the Portfolio’s fees and expenses, the Board primarily considered comparative data provided by ISS on the fees and expenses of similar mutual funds managed by other investment advisers. The Board reviewed the methodology used by ISS to construct the group of peer funds for comparative purposes. In addition, the Board considered information provided by New York Life Investments and IndexIQ on fees charged to other investment advisory clients, including institutional separate accounts and/or other funds, that follow investment strategies similar to those of the Portfolio, if any. The Board considered the contractual management fee schedule for the Portfolio as compared to those for such other investment advisory clients, taking into account the rationale for differences in fee schedules. The Board also took into account information provided by New York Life Investments about the more extensive scope of services provided to registered investment companies, such as the Portfolio, as compared with other investment advisory clients. Additionally, the Board considered the impact of contractual breakpoints, voluntary waivers and expense limitation arrangements on the Portfolio’s net management fee and expenses. The Board also considered that in proposing fees for the Portfolio, New York Life Investments considers the competitive marketplace for mutual funds.
Based on the factors outlined above, among other considerations, the Board concluded that the Portfolio’s management fee and total ordinary operating expenses are within a range that is competitive and support a conclusion that these fees and expenses are reasonable.
Economies of Scale
The Board considered information regarding economies of scale, including whether economies of scale may exist with respect to the Portfolio and whether the Portfolio’s management fee and expense structure permits any economies of scale to be appropriately shared with the Portfolio’s shareholders. The Board also considered a report from New York Life Investments, previously prepared at the request of the Board, that addressed economies of scale, including with respect to the mutual fund business generally, and the various ways in which the benefits of economies of scale may be shared with the funds in the MainStay Group of Funds. Although the Board recognized the difficulty of determining economies of scale with precision, the Board acknowledged that economies of scale may be shared with the Portfolio in a number of ways, including, for example, through the imposition of fee breakpoints, initially setting management fee rates at scale or making additional investments to enhance the services provided to the Portfolio. The Board reviewed information from New York Life Investments showing how the Portfolio’s management fee schedule compared to fee schedules of other funds and accounts managed by New York Life Investments. The Board also reviewed information from ISS showing how the Portfolio’s management fee schedule compared with fees paid for similar services by peer funds at varying asset levels.
Based on this information, the Board concluded that economies of scale are appropriately shared for the benefit of the Portfolio’s shareholders through the Portfolio’s management fee and expense structure and other methods to share benefits from economies of scale.
Conclusion
On the basis of the information and factors summarized above, among other information and factors deemed relevant by the Trustees, and the evaluation thereof, the Board, including the Independent Trustees voting separately, unanimously voted to approve the continuation of each of the Advisory Agreements.
Proxy Voting Policies and Procedures and Proxy Voting Record
The Portfolio is required to file with the SEC its proxy voting record for the 12-month period ending June 30 on Form N-PX. A description of the policies and procedures that are used to vote proxies relating to portfolio securities of the Portfolio is available free of charge upon request by calling 800-598-2019 or visiting the SEC's website at www.sec.gov. The most recent Form N-PX or proxy voting record is available free of charge upon request by calling 800-598-2019; visiting https://www.newyorklifeinvestments.com/investment-products/vp; or visiting the SEC’s website at www.sec.gov.
Shareholder Reports and Quarterly Portfolio Disclosure
The Portfolio is required to file its complete schedule of portfolio holdings with the SEC 60 days after its first and third fiscal quarter on Form N-PORT. The Portfolio's holdings report is available free of charge upon request by calling 800-598-2019 or by visiting the SEC’s website at www.sec.gov.
| 36 | MainStay VP S&P 500 Index Portfolio |
Board of Trustees and Officers (Unaudited)
The Trustees and officers of the Portfolio are listed below. The Board oversees the MainStay Group of Funds (which consists of MainStay Funds and MainStay Funds Trust), MainStay VP Funds Trust, MainStay MacKay DefinedTerm Municipal Opportunities Fund, MainStay CBRE Global Infrastructure Megatrends Term Fund, the Manager and the Subadvisors, and elects the officers of the Portfolios who are responsible for the day-to-day operations of the Portfolio. Information pertaining to the Trustees and officers is set forth below. Each Trustee serves until his or her successor is elected and qualified or until his or her resignation,
death or removal. Under the Board’s retirement policy, unless an exception is made, a Trustee must tender his or her resignation by the end of the calendar year during which he or she reaches the age of 75. Officers are elected annually by the Board. The business address of each Trustee and officer listed below is 51 Madison Avenue, New York, New York 10010. A majority of the Trustees are not “interested persons” (as defined by the 1940 Act and rules adopted by the SEC thereunder) of the Portfolio (“Independent Trustees”).
| | Name and
Year of Birth | Term of Office,
Position(s) Held and
Length of Service | Principal Occupation(s)
During Past Five Years | Number of
Portfolios in
Fund Complex
Overseen by
Trustee | Other Directorships
Held by Trustee |
| | | | | | |
| | Naïm Abou-Jaoudé*
1966 | MainStay VP Funds Trust: Trustee since 2023 | Chief Executive Officer of New York Life Investment Management LLC (since 2023). Chief Executive Officer of Candriam (an affiliate of New York Life Investment Management LLC) (2007 to 2023). | 81 | MainStay Funds: Trustee since 2023 (11 Funds)
MainStay Funds Trust: Trustee since 2023 (37 Funds);
MainStay MacKay DefinedTerm Municipal Opportunities Fund: Trustee since 2023;
MainStay CBRE Global Infrastructure Megatrends Term Fund: Trustee since 2023; and
New York Life Investment Management International (Chair) since 2015 |
| * | This Trustee is considered to be an “interested person” of the MainStay Group of Funds, MainStay VP Funds Trust, MainStay CBRE Global Infrastructure Megatrends Term Fund and MainStay MacKay DefinedTerm Municipal Opportunities Fund, within the meaning of the 1940 Act because of his affiliation with New York Life Investment Management LLC and Candriam, as described in detail above in the column entitled “Principal Occupation(s) During Past Five Years.” |
| | |
Board of Trustees and Officers (Unaudited) (continued)
| | Name and
Year of Birth | Term of Office,
Position(s) Held and
Length of Service | Principal Occupation(s)
During Past Five Years | Number of
Portfolios in
Fund Complex
Overseen by
Trustee | Other Directorships
Held by Trustee |
| | | | | | |
| | David H. Chow
1957 | MainStay VP Funds Trust: Trustee since January 2016, Advisory Board Member (June 2015 to December 2015) | Founder and CEO, DanCourt Management, LLC since 1999 | 81 | MainStay Funds: Trustee since January 2016, Advisory Board Member (June 2015 to December 2015) (11 Funds);
MainStay Funds Trust: Trustee since January 2016, Advisory Board Member (June 2015 to December 2015) (37 Funds);
MainStay MacKay DefinedTerm Municipal Opportunities Fund: Trustee since January 2016, Advisory Board Member (June 2015 to December 2015);
MainStay CBRE Global Infrastructure Megatrends Term Fund: Trustee since 2021;
VanEck Vectors Group of Exchange-Traded Funds: Trustee since 2006 and Independent Chairman of the Board of Trustees from 2008 to 2022 (57 portfolios); and
Berea College of Kentucky: Trustee since 2009, Chair of the Investment Committee since 2018 |
| | Karen Hammond
1956 | MainStay VP Funds Trust: Trustee since December 2021, Advisory Board Member (June 2021 to December 2021)
| Retired, Managing Director, Devonshire Investors (2007 to 2013); Senior Vice President, Fidelity Management & Research Co. (2005 to 2007); Senior Vice President and Corporate Treasurer, FMR Corp. (2003 to 2005); Chief Operating Officer, Fidelity Investments Japan (2001 to 2003) | 81 | MainStay Funds: Trustee since December 2021, Advisory Board Member (June 2021 to December 2021) (11 Funds);
MainStay Funds Trust: Trustee since December 2021, Advisory Board Member (June 2021 to December 2021) (37 Funds);
MainStay MacKay DefinedTerm Municipal Opportunities Fund: Trustee since December 2021, Advisory Board Member (June 2021 to December 2021);
MainStay CBRE Global Infrastructure Megatrends Term Fund: Trustee since December 2021, Advisory Board Member (June 2021 to December 2021);
Two Harbors Investment Corp.: Director since 2018;
Rhode Island State Investment Commission: Member since 2017; and
Blue Cross Blue Shield of Rhode Island: Director since 2019 |
| | Susan B. Kerley
1951 | MainStay VP Funds Trust: Chair since 2017 and Trustee since 2007** | President, Strategic Management Advisors LLC since 1990 | 81 | MainStay Funds: Chair since January 2017 and Trustee since 2007 (11 Funds); MainStay Funds Trust: Chair since January 2017 and Trustee since 1990 (37 Funds)***;
MainStay MacKay DefinedTerm Municipal Opportunities Fund: Chair since January 2017 and Trustee since 2011;
MainStay CBRE Global Infrastructure Megatrends Term Fund: Trustee since June 2021; and
Legg Mason Partners Funds: Trustee since 1991 (45 portfolios) |
| 38 | MainStay VP S&P 500 Index Portfolio |
| | Name and
Year of Birth | Term of Office,
Position(s) Held and
Length of Service | Principal Occupation(s)
During Past Five Years | Number of
Portfolios in
Fund Complex
Overseen by
Trustee | Other Directorships
Held by Trustee |
| | | | | | |
| | Alan R. Latshaw
1951 | MainStay VP Funds Trust: Trustee since 2007** | Retired; Partner, Ernst & Young LLP (2002 to 2003); Partner, Arthur Andersen LLP (1989 to 2002); Consultant to the MainStay Funds Audit and Compliance Committee (2004 to 2006) | 81 | MainStay Funds: Trustee since 2006 (11 Funds);
MainStay Funds Trust: Trustee since 2007 (37 Funds)***;
MainStay MacKay DefinedTerm Municipal Opportunities Fund: Trustee since 2011; and
MainStay CBRE Global Infrastructure Megatrends Term Fund: Trustee since June 2021 |
| | Jacques P. Perold
1958 | MainStay VP Funds Trust: Trustee since January 2016, Advisory Board Member (June 2015 to December 2015) | Founder and Chief Executive Officer, CapShift Advisors LLC (since 2018); President, Fidelity Management & Research Company (2009 to 2014); President and Chief Investment Officer, Geode Capital Management, LLC (2001 to 2009) | 81 | MainStay Funds: Trustee since January 2016, Advisory Board Member (June 2015 to December 2015) (11 Funds);
MainStay Funds Trust: Trustee since January 2016, Advisory Board Member (June 2015 to December 2015) (37 Funds);
MainStay MacKay DefinedTerm Municipal Opportunities Fund: Trustee since January 2016, Advisory Board Member (June 2015 to December 2015);
MainStay CBRE Global Infrastructure Megatrends Term Fund: Trustee since June 2021;
Allstate Corporation: Director since 2015;
Partners in Health: Trustee since 2019; and
MSCI Inc.: Director since 2017 |
| | Richard S. Trutanic
1952 | MainStay VP Funds Trust: Trustee since 2007** | Chairman and Chief Executive Officer, Somerset & Company (financial advisory firm) since 2004; Managing Director, The Carlyle Group (private investment firm) (2002 to 2004); Senior Managing Director, Partner and Board Member, Groupe Arnault S.A. (private investment firm) (1999 to 2002) | 81 | MainStay Funds: Trustee since 1994 (11 Funds);
MainStay Funds Trust: Trustee since 2007 (37 Funds)***;
MainStay MacKay DefinedTerm Municipal Opportunities Fund: Trustee since 2011; and
MainStay CBRE Global Infrastructure Megatrends Term Fund: Trustee since June 2021 |
| ** | Includes prior service as a Director of MainStay VP Series Fund, Inc., the predecessor to MainStay VP Funds Trust. |
| *** | Includes prior service as a Director/Trustee of certain predecessor entities to MainStay Funds Trust. |
Board of Trustees and Officers (Unaudited) (continued)
| | Name and
Year of Birth | Position(s) Held and
Length of Service | Principal Occupation(s)
During Past Five Years | |
| | | | | |
| | Kirk C. Lehneis
1974 | President, MainStay VP Funds Trust (since 2017) | Chief Operating Officer and Senior Managing Director (since 2016), New York Life Investment Management LLC and New York Life Investment Management Holdings LLC; Member of the Board of Managers (since 2017) and Senior Managing Director (since 2018), NYLIFE Distributors LLC; Chairman of the Board and Senior Managing Director, NYLIM Service Company LLC (since 2017); Trustee, President and Principal Executive Officer of IndexIQ Trust, IndexIQ ETF Trust and IndexIQ Active ETF Trust (since 2018); President, MainStay CBRE Global Infrastructure Megatrends Term Fund (since 2021), MainStay MacKay DefinedTerm Municipal Opportunities Fund, MainStay Funds and MainStay Funds Trust (since 2017); Senior Managing Director, Global Product Development (from 2015 to 2016); Managing Director, Product Development (from 2010 to 2015), New York Life Investment Management LLC | |
| | Jack R. Benintende
1964 | Treasurer and Principal Financial and Accounting Officer, MainStay VP Funds Trust (since 2007)** | Managing Director, New York Life Investment Management LLC (since 2007); Treasurer and Principal Financial and Accounting Officer, MainStay CBRE Global Infrastructure Megatrends Term Fund (since 2021), MainStay MacKay DefinedTerm Municipal Opportunities Fund (since 2011), MainStay Funds Trust (since 2009) and MainStay Funds (since 2007); and Assistant Treasurer, New York Life Investment Management Holdings LLC (2008 to 2012) | |
| | J. Kevin Gao
1967 | Secretary and Chief Legal Officer, MainStay VP Funds Trust (since 2010)** | Managing Director and Associate General Counsel, New York Life Investment Management LLC (since 2010); Secretary and Chief Legal Officer, MainStay CBRE Global Infrastructure Megatrends Term Fund (since 2021), MainStay MacKay DefinedTerm Municipal Opportunities Fund (since 2011), MainStay Funds and MainStay Funds Trust (since 2010) | |
| | Kevin M. Gleason
1967 | Vice President and Chief Compliance Officer, MainStay VP Funds Trust (since June 2022) | Vice President and Chief Compliance Officer, IndexIQ Trust, IndexIQ ETF Trust and IndexIQ Active ETF Trust (since June 2022); Vice President and Chief Compliance Officer, MainStay CBRE Global Infrastructure Megatrends Term Fund, MainStay MacKay DefinedTerm Municipal Opportunities Fund (since June 2022); MainStay Funds Trust and MainStay Funds (since June 2022); Senior Vice President, Voya Investment Management and Chief Compliance Officer, Voya Family of Funds (2012 to 2022) | |
| | Scott T. Harrington
1959 | Vice President— Administration, MainStay VP Funds Trust (since 2005)** | Managing Director, New York Life Investment Management LLC (including predecessor advisory organizations) (since 2000); Member of the Board of Directors, New York Life Trust Company (since 2009); Vice President—Administration, MainStay CBRE Global Infrastructure Megatrends Term Fund (since 2021), MainStay MacKay DefinedTerm Municipal Opportunities Fund (since 2011), MainStay Funds Trust and MainStay Funds (since 2009) | |
| * | The officers listed above are considered to be “interested persons” of the MainStay Group of Funds, MainStay VP Funds Trust, MainStay CBRE Global Infrastructure Megatrends Term Fund and MainStay MacKay DefinedTerm Municipal Opportunities Fund within the meaning of the 1940 Act because of their affiliation with the MainStay Group of Funds, New York Life Insurance Company and/or its affiliates, including New York Life Investment Management LLC, New York Life Insurance Company, NYLIM Service Company LLC, NYLIFE Securities LLC and/or NYLIFE Distributors LLC, as described in detail in the column captioned “Principal Occupation(s) During Past Five Years.” Officers are elected annually by the Board. |
| ** | Includes prior service as an Officer of MainStay VP Series Fund, Inc., the predecessor to MainStay VP Funds Trust. |
Officers of the Trust (Who are not Trustees)*
| 40 | MainStay VP S&P 500 Index Portfolio |
This page intentionally left blank
This page intentionally left blank.
MainStay VP Portfolios
MainStay VP offers a wide range of Portfolios. The full array of MainStay VP offerings is listed here, with information about the manager, subadvisors, legal counsel, and independent registered public accounting firm.
Equity
MainStay VP American Century Sustainable Equity Portfolio
MainStay VP Candriam Emerging Markets Equity Portfolio
MainStay VP Epoch U.S. Equity Yield Portfolio
MainStay VP Fidelity Institutional AM® Utilities Portfolio†
MainStay VP Natural Resources Portfolio
MainStay VP PineStone International Equity Portfolio1
MainStay VP S&P 500 Index Portfolio
MainStay VP Small Cap Growth Portfolio
MainStay VP Wellington Growth Portfolio
MainStay VP Wellington Mid Cap Portfolio
MainStay VP Wellington Small Cap Portfolio
MainStay VP Wellington U.S. Equity Portfolio
MainStay VP Winslow Large Cap Growth Portfolio
Mixed Asset
MainStay VP Balanced Portfolio
MainStay VP Income Builder Portfolio
MainStay VP Janus Henderson Balanced Portfolio
MainStay VP MacKay Convertible Portfolio
Income
MainStay VP Bond Portfolio
MainStay VP Floating Rate Portfolio
MainStay VP Indexed Bond Portfolio
MainStay VP MacKay Government Portfolio2
MainStay VP MacKay High Yield Corporate Bond Portfolio
MainStay VP MacKay Strategic Bond Portfolio
MainStay VP PIMCO Real Return Portfolio
Money Market
MainStay VP U.S. Government Money Market Portfolio
Alternative
MainStay VP CBRE Global Infrastructure Portfolio
MainStay VP IQ Hedge Multi-Strategy Portfolio
Asset Allocation
MainStay VP Conservative Allocation Portfolio
MainStay VP Equity Allocation Portfolio
MainStay VP Growth Allocation Portfolio
MainStay VP Moderate Allocation Portfolio
Manager
New York Life Investment Management LLC
New York, New York
Subadvisors
American Century Investment Management, Inc.
Kansas City, Missouri
Brown Advisory LLC
Baltimore, Maryland
Candriam*
Strassen, Luxembourg
CBRE Investment Management Listed Real Assets LLC
Radnor, Pennsylvania
Epoch Investment Partners, Inc.
New York, New York
FIAM LLC
Smithfield, Rhode Island
IndexIQ Advisors LLC*
New York, New York
Janus Henderson Investors US LLC
Denver, Colorado
MacKay Shields LLC*
New York, New York
Newton Investment Management North America, LLC
Boston, Massachusetts
NYL Investors LLC*
New York, New York
Pacific Investment Management Company LLC
Newport Beach, California
PineStone Asset Management Inc.
Montreal, Québec
Segall Bryant & Hamill, LLC
Chicago, Illinois
Wellington Management Company LLP
Boston, Massachusetts
Winslow Capital Management, LLC
Minneapolis, Minnesota
Legal Counsel
Dechert LLP
Washington, District of Columbia
Independent Registered Public Accounting Firm
PricewaterhouseCoopers LLP
New York, New York
Distributor
NYLIFE Distributors LLC*
Jersey City, New Jersey
Custodian
JPMorgan Chase Bank, N.A.
New York, New York
Some Portfolios may not be available in all products.
† Fidelity Institutional AM is a registered trade mark of FMR LLC. Used with permission.
* An affiliate of New York Life Investment Management LLC.
| 1. | Prior to August 28, 2023, the Portfolio's name was MainStay VP MacKay International Equity Portfolio. |
| 2. | Effective on or about May 1, 2024, the MainStay VP MacKay Government Portfolio will be renamed the MainStay VP U.S. Infrastructure Bond Portfolio. |
Not part of the Annual Report
2023 Annual Report
This report is for the general information of New York Life Variable Annuities and NYLIAC Variable Universal Life Insurance Products policyowners. It must be preceded or accompanied by the appropriate product(s) and funds prospectuses if it is given to anyone who is not an owner of a New York Life variable annuity policy or a NYLIAC Variable Universal Life Insurance Product. This report does not offer for sale or solicit orders to purchase securities.
The performance data quoted in this report represents past performance. Past performance is no guarantee of future results. Due to market volatility and other factors, current performance may be lower or higher than the figures shown. The most recent month-end performance summary for your variable annuity or variable life policy is available by calling 800-598-2019 and is updated periodically on newyorklife.com.
The New York Life Variable Annuities and NYLIAC Variable Universal Life Insurance Products are issued by New York Life Insurance and Annuity Corporation (a Delaware Corporation) and distributed by NYLIFE Distributors LLC (Member FINRA/SIPC).
New York Life Insurance Company
New York Life Insurance and Annuity
Corporation (NYLIAC) (A Delaware Corporation)
51 Madison Avenue, Room 551
New York, NY 10010
newyorklife.com
newyorklifeinvestments.com
NYLIFE Distributors LLC, 30 Hudson Street, Jersey City, NJ 07302
New York Life Investment Management LLC is the investment manager to the MainStay VP Funds Trust
©2024 by NYLIFE Distributors LLC. All rights reserved.
You may obtain copies of the Prospectus and the Statement of Additional Information free of charge, upon request, by calling toll-free 800-598-2019 or writing to New York Life Insurance and Annuity Corporation, 51 Madison Avenue, New York, NY 10010.
| Not FDIC Insured | No Bank Guarantee | May Lose Value |
(NYLIAC) NI529
MainStay VP CBRE Global Infrastructure Portfolio
Message from the President and Annual Report
December 31, 2023
Special Notice:
Beginning in July 2024, new regulations issued by the Securities and Exchange Commission (SEC) will take effect requiring open-end mutual fund companies and ETFs to (1) overhaul the content of their shareholder reports and (2) mail paper copies of the new tailored shareholder reports to shareholders who have not opted to receive these documents electronically.
If you have not yet elected to receive your shareholder reports electronically, please contact your financial intermediary or visit our website.
| Not FDIC/NCUA Insured | Not a Deposit | May Lose Value | No Bank Guarantee | Not Insured by Any Government Agency |
This page intentionally left blank
Message from the President
Against a backdrop of easing inflationary pressures and continued economic growth, stocks and bonds generally gained ground during the 12-month period ended December 31, 2023, despite high levels of volatility and sharp disparities between the performance of the different market sectors.
Although the war in Ukraine, the outbreak of hostilities in the Middle East and several other notable events affected financial assets, inflation, interest rate, and economic growth trends stood at the forefront of market developments during most of the period. As the reporting period began, high levels of inflation already showed signs of easing in the face of aggressive rate hikes by U.S. Federal Reserve (the “Fed”). From a peak of 9.1% in June 2022, the annualized U.S. inflation rate dropped to 6.4% in January, and 3.4% in December 2023. At the same time, the Fed increased the benchmark federal funds rate from 4.25%–4.50% at the beginning of reporting period, to 5.25%–5.50% as of the end of 2023. Despite the increasing cost of capital and tighter lending environment that resulted from rising rates, economic growth remained surprisingly robust, bolstered by high levels of consumer spending, low levels of unemployment and better-than-expected corporate earnings. With the pace of rate increases slowing from the prior year, investors began hoping for an early shift to a looser monetary policy, with stock prices and bond yields reacting as economic data and statements from the Fed either reinforced or undercut those hopes. Following months of hawkish rhetoric, the Fed finally reversed its stance in December 2023, signaling a positive economic outlook with little chance of a recession and a likelihood of rate cuts in 2024.
The S&P 500® Index, a widely regarded benchmark of U.S. market performance, produced strong gains during the reporting period-– recovering all its losses from 2022 and approached new record territory. A preponderance of the Index’s gains were generated by a relatively small number of mega-cap stocks in the information technology, communication services and consumer discretionary sectors that stood to benefit from rapid developments in generative artificial intelligence (“AI”). Value-oriented, interest-rate sensitive and small-capitalization
shares lagged by significant margins, although market strength widened during the closing weeks of the reporting period. Most overseas equity markets trailed the U.S. market, as developed international economies experienced relatively low growth rates, and weak economic conditions in China undermined emerging markets.
Bonds produced generally positive returns, bolstered by attractive and relatively stable yields. The yield on the 10-year Treasury note hit a high of just under 5% in mid-October 2023, ranging between approximately 3.5% and 4.8% for most of the reporting period. The yield curve remained inverted throughout the year, with the 2-year Treasury yield modestly above the 10-year yield. Corporate bond prices trended moderately higher, generally outperforming government securities. After years of low yields and tight credit spreads, the corporate sector benefited from more attractive valuations and income opportunities. Among corporates, markets generally rewarded longer duration and lower credit quality, although an uptick in default rates posed added risks for high-yield corporate bonds. International bond markets produced mixed returns, with emerging-markets issues advancing over their developed-markets counterparts.
The market volatility of recent years reminds us of the constant need for experienced and steadfast portfolio management in the face of uncertainty. New York Life Investments remains dedicated to providing you, as a valued MainStay VP investor, with the guidance, resources and investment solutions you need to pursue your financial goals.
Thank you for trusting us to help meet your investment needs.
Sincerely,
Kirk C. Lehneis
President
The opinions expressed are as of the date of this report and are subject to change. There is no guarantee that any forecast made will come to pass. This material does not constitute investment advice and is not intended as an endorsement of any specific investment. Past performance is no guarantee of future results.
Not part of the Annual Report
Investors should refer to the Portfolio’s Summary Prospectus and/or Prospectus and consider the Portfolio’s investment objectives, strategies, risks, charges and expenses carefully before investing. The Summary Prospectus and/or Prospectus contain this and other information about the Portfolio. You may obtain copies of the Portfolio’s Summary Prospectus, Prospectus and Statement of Additional Information, which includes information about the MainStay VP Funds Trust's Trustees, free of charge, upon request, by calling toll-free 800-598-2019, by writing to New York Life Insurance and Annuity Corporation, 51 Madison Avenue, Room 251, New York, New York 10010 or by sending an email to MainStayShareholdersServices@nylim.com. These documents are also available at newyorklifeinvestments.com/investment-products/vp. Please read the Portfolio's Summary Prospectus and/or Prospectus carefully before investing. MainStay VP Funds Trust portfolios are separate account options which are purchased through a variable insurance or variable annuity contract.
Investment and Performance Comparison (Unaudited)
Performance data quoted represents past performance. Past performance is no guarantee of future results. Because of market volatility and other factors, current performance may be lower or higher than the figures shown. Investment return and principal value will fluctuate, and as a result, when shares are redeemed, they may be worth more or less than their original cost. The performance table and graph do not reflect any deduction of sales charges, mortality and expense charges, contract charges or administrative charges. Please refer to the Performance Summary appropriate for your policy. For performance information current to the most recent month-end, please call 800-598-2019 or visit www.newyorklife.com.
Performance figures may reflect certain fee waivers and/or expense limitations, without which total returns may have been different. For information on current fee waivers and/or expense limitations (if any), please refer to the Notes to Financial Statements.
| Average Annual Total Returns for the Year-Ended December 31, 2023 |
| Class | Inception
Date1 | One
Year | Five
Years | Since
Inception | Gross
Expense
Ratio2 |
| Initial Class Shares | 5/1/2015 | 4.06% | 0.71% | -2.61% | 1.13% |
| Service Class Shares | 5/1/2015 | 3.80 | 0.46 | -2.84 | 1.38 |
| 1. | Effective February 28, 2020, the Portfolio replaced its subadvisor and modified its principal investment strategies. The past performance in the graph and table prior to that date reflects the Portfolio’s prior subadvisor and principal investment strategies. |
| 2. | The gross expense ratios presented reflect the Portfolio’s “Total Annual Portfolio Operating Expenses” from the most recent Prospectus and may differ from other expense ratios disclosed in this report. |
| Benchmark Performance* | One
Year | Five
Years | Since
Inception |
| FTSE Global Core Infrastructure 50/50 Index (Net)1 | 2.21% | 6.04% | 5.01% |
| Morningstar Infrastructure Category Average2 | 4.88 | 7.67 | 4.10 |
| * | Returns for indices reflect no deductions for fees, expenses or taxes, except for foreign withholding taxes where applicable. Results assume reinvestment of all dividends and capital gains. An investment cannot be made directly in an index. |
| 1. | The FTSE Global Core Infrastructure 50/50 Index (Net) is the Portfolio’s primary broad-based securities market index for comparison purposes. The FTSE Global Core Infrastructure 50/50 Index (Net) is a market-capitalization-weighted index of worldwide infrastructure and infrastructure-related securities. Constituent weights are adjusted semi-annually according to three broad industry sectors: 50% utilities, 30% transportation, and a 20% mix of other sectors. |
| 2. | The Morningstar Infrastructure Category Average is representative of funds that invest more than 60% of their assets in stocks of companies engaged in infrastructure activities. Industries considered to be part of the infrastructure sector include: oil & gas midstream; waste management; airports; integrated shipping; railroads; shipping & ports; trucking; engineering & construction; infrastructure operations; and the utilities sector. Results are based on average total returns of similar funds with all dividends and capital gain distributions reinvested. |
Cost in Dollars of a $1,000 Investment in MainStay VP CBRE Global Infrastructure Portfolio (Unaudited)
The example below is intended to describe the fees and expenses borne by shareholders during the six-month period from July 1, 2023 to December 31, 2023, and the impact of those costs on your investment.
Example
As a shareholder of the Portfolio you incur two types of costs: (1) transaction costs, including exchange fees and sales charges (loads) on purchases (as applicable), and (2) ongoing costs, including management fees, distribution and/or service (12b-1) fees and other Portfolio expenses (as applicable). This example is intended to help you understand your ongoing costs (in dollars) of investing in the Portfolio and to compare these costs with the ongoing costs of investing in other mutual funds. The example is based on an investment of $1,000 made at the beginning of the six-month period and held for the entire period from July 1, 2023 to December 31, 2023. Shares are only sold in connection with variable life and annuity contracts and the example does not reflect any contract level or transactional fees or expenses. If these costs had been included, your costs would have been higher.
This example illustrates your Portfolio’s ongoing costs in two ways:
Actual Expenses
The second and third data columns in the table below provide information about actual account values and actual expenses. You may use the information in these columns, together with the amount you invested, to estimate the expenses that you paid during the six months ended
December 31, 2023. Simply divide your account value by $1,000 (for example, an $8,600 account value divided by $1,000 = 8.6), then multiply the result by the number under the heading entitled “Expenses Paid During Period” to estimate the expenses you paid on your account during this period.
Hypothetical Example for Comparison Purposes
The fourth and fifth data columns in the table below provide information about hypothetical account values and hypothetical expenses based on the Portfolio’s actual expense ratio and an assumed rate of return of 5% per year before expenses, which is not the Portfolio’s actual return. The hypothetical account values and expenses may not be used to estimate the actual ending account balances or expenses you paid for the six-month period shown. You may use this information to compare the ongoing costs of investing in the Portfolio with the ongoing costs of investing in other mutual funds. To do so, compare this 5% hypothetical example with the 5% hypothetical examples that appear in the shareholder reports of the other mutual funds.
Please note that the expenses shown in the table are meant to highlight your ongoing costs only and do not reflect any transactional costs, such as exchange fees or sales charges (loads). Therefore, the fourth and fifth data columns of the table are useful in comparing ongoing costs only and will not help you determine the relative total costs of owning different funds. In addition, if these transactional costs were included, your costs would have been higher.
| Share Class | Beginning
Account
Value
7/1/23 | Ending Account
Value (Based
on Actual
Returns and
Expenses)
12/31/23 | Expenses
Paid
During
Period1 | Ending Account
Value (Based
on Hypothetical
5% Annualized
Return and
Actual Expenses)
12/31/23 | Expenses
Paid
During
Period1 | Net Expense
Ratio
During
Period2 |
| Initial Class Shares | $1,000.00 | $1,022.10 | $4.84 | $1,020.42 | $4.84 | 0.95% |
| Service Class Shares | $1,000.00 | $1,020.90 | $6.11 | $1,019.16 | $6.11 | 1.20% |
| 1. | Expenses are equal to the Portfolio’s annualized expense ratio of each class multiplied by the average account value over the period, divided by 365 and multiplied by 184 (to reflect the six-month period). The table above represents the actual expenses incurred during the six-month period. In addition to the fees and expenses which the Portfolio bears directly, it also indirectly bears a pro rata share of the fees and expenses of the underlying funds in which it invests. Such indirect expenses are not included in the above-reported expense figures. |
| 2. | Expenses are equal to the Portfolio's annualized expense ratio to reflect the six-month period. |
| 6 | MainStay VP CBRE Global Infrastructure Portfolio |
Country Composition as of December 31, 2023 (Unaudited)
| United States | 56.2% |
| Australia | 7.2 |
| Canada | 7.2 |
| Spain | 7.1 |
| France | 5.6 |
| Japan | 5.5 |
| Italy | 3.0 |
| United Kingdom | 2.8 |
| Portugal | 2.0% |
| China | 1.5 |
| Mexico | 0.8 |
| Switzerland | 0.6 |
| Hong Kong | 0.5 |
| Other Assets, Less Liabilities | 0.0‡ |
| | 100.0% |
| ‡ | Less than one–tenth of a percent. |
See Portfolio of Investments beginning on page 10 for specific holdings within these categories. The Portfolio's holdings are subject to change.
Top Ten Holdings and/or Issuers Held as of December 31, 2023 (excluding short-term investments) (Unaudited)
| 1. | American Tower Corp. |
| 2. | NextEra Energy, Inc. |
| 3. | Transurban Group |
| 4. | CSX Corp. |
| 5. | Cellnex Telecom SA |
| 6. | Sempra |
| 7. | Aena SME SA |
| 8. | WEC Energy Group, Inc. |
| 9. | Central Japan Railway Co. |
| 10. | Targa Resources Corp. |
Portfolio Management Discussion and Analysis (Unaudited)
Answers to the questions reflect the views of portfolio managers Jeremy Anagnos, CFA, Joseph P. Smith, CFA, Daniel Foley, CFA, and Hinds Howard of CBRE Investment Management Listed Real Assets LLC (“CBRE”), the Portfolio’s Subadvisor.
How did MainStay VP CBRE Global Infrastructure Portfolio perform relative to its benchmark and peers during the 12 months ended December 31, 2023?
For the 12 months ended December 31, 2023, MainStay VP CBRE Global Infrastructure Portfolio returned 4.06% for Initial Class shares and 3.80% for Service Class shares. Over the same period, both share classes outperformed the 2.21% return of the FTSE Global Core Infrastructure 50/50 Index (Net) (the “Index”), which is the Portfolio’s benchmark. For the 12 months ended December 31, 2023, both share classes underperformed the 4.88% return of the Morningstar Infrastructure Category Average.1
What factors affected the Portfolio’s relative performance during the reporting period?
During the reporting period, macroeconomic and geopolitical issues negatively affected returns. Global inflation concerns and central bank countermeasures led to higher bond yields globally, which undermined yield-sensitive sectors. Other risk factors included the outbreak of war in the Middle East in addition to the on-going war in Ukraine, as well as a debt crisis in China. Negative headlines regarding renewables and concerns about a higher cost of capital for utilities further weighed on the Portfolio’s positioning among U.S. utilities with renewable development exposure. However, the Portfolio also held exposure to utilities and energy companies exposed to power markets, and these companies had positive returns due to their higher profit margins. Moreover, transportation companies, particularly airports and toll roads in Europe, enjoyed positive returns as traffic continued to recover post pandemic. The ongoing conflicts and wars highlighted the importance of energy supply and security, and the value of broad sources of energy, including traditional fossil fuels, which benefited midstream companies in the United States.
The Portfolio outperformed the Index during the reporting period due to positive sector allocation as well as positive stock selection. Sector allocation provided the larger contribution to relative performance, notably due to the Portfolio’s overweight exposure to continental Europe. (Contributions take weightings and total returns into account.) Continental Europe continued to rebound from weakness in 2022, driven by better-than-feared economic outcomes due in part to warmer weather, which provided relief from an energy crisis prompted by embargos on Russian oil and natural gas. Stock selection among global communications companies further bolstered relative returns.
During the reporting period, which sectors were the strongest positive contributors to the Portfolio’s relative performance, and which sectors were particularly weak?
The sectors providing the strongest positive contributions to the Portfolio’s performance relative to the Index included communications and transportation. Most global communication stocks (with the exception of U.S. towers) performed well, and the Portfolio benefited from both stock selection and allocation. The transportation sector, where the Portfolio held overweight exposure, also produced significant positive returns, most notably in Asia and continental Europe, as volumes for passenger-related transport infrastructure continued to rebound in the wake of the COVID-19 pandemic. Direct pass through of inflation further supported earnings for transportation infrastructure companies.
The weakest contribution to the Portfolio’s relative performance came from structurally underweight exposure to emerging markets, which outperformed the Index. In addition, while the midstream energy sector outperformed, marginally negative stock selection in the area detracted from the Portfolio's relative performance.
During the reporting period, which individual stocks made the strongest positive contributions to the Portfolio’s absolute performance and which stocks detracted the most?
The holdings that contributed most to the Portfolio’s absolute returns included Italian integrated utility company Enel, Spanish airport operator Aena and French toll road operator Vinci. European stocks produced strong absolute performance, with a recovery in the euro relative to the U.S. dollar boosting returns. Enel benefited from stabilization of power markets in Europe, lower bond yields and execution of a disposal strategy that reduced balance sheet leverage. Aena and Vinci both benefited from increased traffic volumes across their transportation networks. The feared recession in Europe did not materialize during the reporting period and tourism remained strong. Another leading performer, Australian data center owner and developer NextDC, saw shares rise as the company expanded into Singapore and raised equity capital in a well-received offering. Demand for data centers continued to increase and the sector was a beneficiary of the growth in generative artificial intelligence, which requires significant computing power and storage of data.
The holdings that detracted the most from the Portfolio’s absolute returns included U.S. integrated utilities NextEra Energy and Ameren, as well as U.S. tower operator Crown Castle. NextEra was a beneficiary of the Inflation Reduction Act (“IRA”) that was passed in September 2022. While the stock initially rebounded after the Act passed, in the first half of 2023 the market focused on the rising cost of capital and inflation in costs for renewable
| 1. | See "Investment and Performance Comparison" for more information on benchmark and peer group returns. |
| 8 | MainStay VP CBRE Global Infrastructure Portfolio |
development. The IRA legislation provides long-term support for predictable earnings growth, but no near-term catalyst for stock appreciation. Ameren shares fell sharply in December 2023 after an adverse regulatory ruling in one of its markets. Crown Castle shares succumbed to higher interest rates set by the U.S. Federal Reserve, as the U.S. tower sector is viewed as interest-rate sensitive. When rates fell later in the year, tower stocks were unable to recover fully. Notably, the entire telecommunications services group produced weak returns, raising concerns that mobile service companies might not be able to invest in their network.
Did the Portfolio make any significant purchases or sales during the reporting period?
The most significant purchases during the reporting period included new positions in U.S. freight railroad operator CSX and U.S. pipeline and midstream company Kinder Morgan. We believe that CSX is poised for growth in volumes and stable margins in 2024, as the company was quick to bring back workers and improve service levels in the wake of the pandemic. We added the position in Kinder Morgan at a time when the company’s stock traded at a significant discount to peers, despite an overall solid outlook and a positive view of the midstream sector. Kinder Morgan executed well in 2023—reducing debt and increasing free cash flow—which we expect will lead to a return of capital flexibility.
The Portfolio’s most significant sales during the same period included exiting positions in U.S. regulated utilities American Electric Power, Ameren Corp and Xcel Energy. We sold all three positions due to a less favorable view of the companies’ regulatory jurisdictions, where we believe there could be weaker outcomes in relation to allowed returns.
How did the Portfolio’s sector weightings change during the reporting period?
During the reporting period, we increased the Portfolio’s sector exposure most significantly in the U.S. and Japanese railroad sectors. We believe the absence of a recession thus far bodes well for traffic volumes of passenger and freight rail. While volumes have remained weak for U.S. freight railroads, 2024 offers easier quarterly comparisons, and companies have improved their service levels to meet the demand. In addition, cost inflation has started to abate, which should lead to improving margins going forward. The end of pandemic-related travel restrictions, most recently in Asia, should also lead to strong growth in leisure travel, which we believe will continue to benefit Japanese passenger rail companies.
During the same period, the Portfolio’s most significant reductions in sector weightings came from U.S. utilities and European communications. U.S. utilities faced rising cost of capital, while the regulatory environment grew less favorable. With regard to European communications, we sold Portfolio positions into strength and very high valuations in Europe, rotating more exposure into communications stocks, including data centers in North America, where valuations appeared relatively attractive.
How was the Portfolio positioned at the end of the reporting period?
As of December 31, 2023, the Portfolio held materially overweight exposure to communications globally. The communications sector continues to experience robust growth driven by trends in increasing data usage and the need for new infrastructure to support the digital economy. We believe communications infrastructure companies in the listed space are among the most well-positioned entities to benefit from positive trends in this sector. Communication assets remain particularly desirable in the private infrastructure market, where transaction activity is supportive of valuations in the listed space. The Portfolio also maintains an overweight bias toward transportation globally. Within transports, the Portfolio has emphasized leisure-exposed assets, including toll roads, passenger rail and select airports, where volumes have remained resilient and valuations attractive. Freight rail in the Americas represents another overweight area for the Portfolio, with additions in the second half of the reporting period based on an improved margin and volume outlook for 2024.
As of the same date, the Portfolio held materially underweight exposure to utilities globally, most significantly among regulated utilities in the Americas and utilities in developed Asia. In addition, as noted above, the Portfolio maintains structurally underweight exposure to emerging markets.
The opinions expressed are those of the portfolio managers as of the date of this report and are subject to change. There is no guarantee that any forecasts will come to pass. This material does not constitute investment advice and is not intended as an endorsement of any specific investment.
Not all MainStay VP Portfolios and/or share classes are available under all policies.
Portfolio of Investments December 31, 2023†^
| | Shares | Value |
| Common Stocks 99.7% |
| Australia 7.2% |
| Atlas Arteria Ltd. (Transportation) | 240,619 | $ 947,746 |
| NEXTDC Ltd. (Communications) (a) | 21,028 | 196,744 |
| Transurban Group (Transportation) | 145,021 | 1,354,885 |
| | | 2,499,375 |
| Canada 7.2% |
| Canadian National Railway Co. (Transportation) | 6,297 | 791,491 |
| Enbridge, Inc. (Midstream / Pipelines) | 16,727 | 602,149 |
| Pembina Pipeline Corp. (Midstream / Pipelines) | 29,532 | 1,016,754 |
| Pembina Pipeline Corp. (Midstream / Pipelines) (a) | 2,242 | 76,141 |
| | | 2,486,535 |
| China 1.5% |
| China Resources Gas Group Ltd. (Utilities) | 78,277 | 256,630 |
| Guangdong Investment Ltd. (Utilities) | 342,395 | 249,062 |
| | | 505,692 |
| France 5.6% |
| Eiffage SA (Transportation) | 8,019 | 858,877 |
| Vinci SA (Transportation) | 8,632 | 1,083,481 |
| | | 1,942,358 |
| Hong Kong 0.5% |
| CK Infrastructure Holdings Ltd. (Utilities) | 31,281 | 173,060 |
| Italy 3.0% |
| Enel SpA (Utilities) | 142,597 | 1,059,436 |
| Japan 5.5% |
| Central Japan Railway Co. (Transportation) | 44,005 | 1,118,538 |
| West Japan Railway Co. (Transportation) | 19,424 | 810,160 |
| | | 1,928,698 |
| Mexico 0.8% |
| Grupo Aeroportuario del Pacifico SAB de CV, Class B (Transportation) | 15,373 | 268,360 |
| Portugal 2.0% |
| EDP - Energias de Portugal SA (Utilities) | 141,835 | 713,216 |
| Spain 7.1% |
| Aena SME SA (Transportation) | 6,617 | 1,198,724 |
| Cellnex Telecom SA (Communications) | 31,884 | 1,255,173 |
| | | 2,453,897 |
| | Shares | Value |
| |
| Switzerland 0.6% |
| Flughafen Zurich AG (Registered) (Transportation) | 1,088 | $ 227,160 |
| United Kingdom 2.8% |
| National Grid plc (Utilities) | 53,247 | 718,078 |
| Pennon Group plc (Utilities) | 26,566 | 254,476 |
| | | 972,554 |
| United States 55.9% |
| AES Corp. (The) (Utilities) | 42,713 | 822,225 |
| ALLETE, Inc. (Utilities) | 4,051 | 247,759 |
| American Tower Corp. (Communications) | 9,146 | 1,974,439 |
| Cheniere Energy, Inc. (Midstream / Pipelines) | 6,098 | 1,040,990 |
| CMS Energy Corp. (Utilities) | 13,259 | 769,950 |
| Constellation Energy Corp. (Utilities) | 3,095 | 361,774 |
| Crown Castle, Inc. (Communications) | 3,211 | 369,875 |
| CSX Corp. (Transportation) | 36,220 | 1,255,747 |
| Duke Energy Corp. (Utilities) | 5,743 | 557,301 |
| Equinix, Inc. (Communications) | 745 | 600,015 |
| Eversource Energy (Utilities) | 5,628 | 347,360 |
| Kinder Morgan, Inc. (Midstream / Pipelines) | 44,887 | 791,807 |
| NextEra Energy Partners LP (Utilities) | 6,429 | 195,506 |
| NextEra Energy, Inc. (Utilities) | 30,350 | 1,843,459 |
| NiSource, Inc. (Utilities) | 13,851 | 367,744 |
| OGE Energy Corp. (Utilities) | 14,129 | 493,526 |
| PG&E Corp. (Utilities) | 36,254 | 653,660 |
| Portland General Electric Co. (Utilities) | 5,237 | 226,972 |
| PPL Corp. (Utilities) | 34,791 | 942,836 |
| SBA Communications Corp. (Communications) | 2,127 | 539,599 |
| Sempra (Utilities) | 16,455 | 1,229,682 |
| Southern Co. (The) (Utilities) | 10,436 | 731,772 |
| Targa Resources Corp. (Midstream / Pipelines) | 12,856 | 1,116,801 |
| Union Pacific Corp. (Transportation) | 3,072 | 754,545 |
| WEC Energy Group, Inc. (Utilities) | 14,030 | 1,180,905 |
| | | 19,416,249 |
Total Common Stocks
(Cost $32,558,458) | | 34,646,590 |
The notes to the financial statements are an integral part of, and should be read in conjunction with, the financial statements.
| 10 | MainStay VP CBRE Global Infrastructure Portfolio |
| | Shares | | Value |
| Short-Term Investment 0.3% |
| Affiliated Investment Company 0.3% |
| United States 0.3% |
| MainStay U.S. Government Liquidity Fund, 5.235% (b) | 97,270 | | $ 97,270 |
Total Short-Term Investment
(Cost $97,270) | | | 97,270 |
Total Investments
(Cost $32,655,728) | 100.0% | | 34,743,860 |
| Other Assets, Less Liabilities | 0.0‡ | | 5,911 |
| Net Assets | 100.0% | | $ 34,749,771 |
| † | Percentages indicated are based on Portfolio net assets. |
| ^ | Industry and country classifications may be different than those used for compliance monitoring purposes. |
| ‡ | Less than one-tenth of a percent. |
| (a) | Non-income producing security. |
| (b) | Current yield as of December 31, 2023. |
Investments in Affiliates (in 000's)
Investments in issuers considered to be affiliate(s) of the Portfolio during the year ended December 31, 2023 for purposes of Section 2(a)(3) of the Investment Company Act of 1940, as amended, were as follows:
| Affiliated Investment Companies | Value,
Beginning
of Year | Purchases
at Cost | Proceeds
from
Sales | Net
Realized
Gain/(Loss)
on Sales | Change in
Unrealized
Appreciation/
(Depreciation) | Value,
End of
Year | Dividend
Income | Other
Distributions | Shares
End of
Year |
| MainStay U.S. Government Liquidity Fund | $ 631 | $ 7,629 | $ (8,163) | $ — | $ — | $ 97 | $ 16 | $ — | 97 |
The following is a summary of the fair valuations according to the inputs used as of December 31, 2023, for valuing the Portfolio’s assets:
| Description | Quoted
Prices in
Active
Markets for
Identical
Assets
(Level 1) | | Significant
Other
Observable
Inputs
(Level 2) | | Significant
Unobservable
Inputs
(Level 3) | | Total |
| Asset Valuation Inputs | | | | | | | |
| Investments in Securities (a) | | | | | | | |
| Common Stocks | $ 34,646,590 | | $ — | | $ — | | $ 34,646,590 |
| Short-Term Investment | | | | | | | |
| Affiliated Investment Company | 97,270 | | — | | — | | 97,270 |
| Total Investments in Securities | $ 34,743,860 | | $ — | | $ — | | $ 34,743,860 |
| (a) | For a complete listing of investments and their industries, see the Portfolio of Investments. |
The notes to the financial statements are an integral part of, and should be read in conjunction with, the financial statements.
11
Portfolio of Investments December 31, 2023†^ (continued)
The table below sets forth the diversification of the Portfolio’s investments by sector.
Sector Diversification
| | Value | | Percent |
| Utilities | $14,396,389 | | 41.4% |
| Transportation | 10,669,714 | | 30.7 |
| Communications | 4,935,845 | | 14.2 |
| Midstream / Pipelines | 4,644,642 | | 13.4 |
| | 34,646,590 | | 99.7 |
| Short-Term Investment | 97,270 | | 0.3 |
| Other Assets, Less Liabilities | 5,911 | | 0.0‡ |
| Net Assets | $34,749,771 | | 100.0% |
| † | Percentages indicated are based on Portfolio net assets. |
| ^ | Industry and country classifications may be different than those used for compliance monitoring purposes. |
| ‡ | Less than one-tenth of a percent. |
The notes to the financial statements are an integral part of, and should be read in conjunction with, the financial statements.
| 12 | MainStay VP CBRE Global Infrastructure Portfolio |
Statement of Assets and Liabilities as of December 31, 2023
| Assets |
Investment in unaffiliated securities, at value
(identified cost $32,558,458) | $ 34,646,590 |
Investment in affiliated investment companies, at value
(identified cost $97,270) | 97,270 |
Cash denominated in foreign currencies
(identified cost $5) | 5 |
| Receivables: | |
| Dividends | 84,620 |
| Investment securities sold | 37,325 |
| Portfolio shares sold | 5,711 |
| Securities lending | 467 |
| Other assets | 125 |
| Total assets | 34,872,113 |
| Liabilities |
| Payables: | |
| Shareholder communication | 26,856 |
| Professional fees | 23,178 |
| Manager (See Note 3) | 20,530 |
| Investment securities purchased | 16,996 |
| Portfolio shares redeemed | 15,157 |
| Custodian | 10,032 |
| NYLIFE Distributors (See Note 3) | 6,817 |
| Accrued expenses | 2,776 |
| Total liabilities | 122,342 |
| Net assets | $ 34,749,771 |
| Composition of Net Assets |
| Shares of beneficial interest outstanding (par value of $.001 per share) unlimited number of shares authorized | $ 4,986 |
| Additional paid-in-capital | 69,192,570 |
| | 69,197,556 |
| Total distributable earnings (loss) | (34,447,785) |
| Net assets | $ 34,749,771 |
| Initial Class | |
| Net assets applicable to outstanding shares | $ 2,439,319 |
| Shares of beneficial interest outstanding | 345,697 |
| Net asset value per share outstanding | $ 7.06 |
| Service Class | |
| Net assets applicable to outstanding shares | $32,310,452 |
| Shares of beneficial interest outstanding | 4,640,490 |
| Net asset value per share outstanding | $ 6.96 |
The notes to the financial statements are an integral part of, and should be read in conjunction with, the financial statements.
13
Statement of Operations for the year ended December 31, 2023
| Investment Income (Loss) |
| Income | |
| Dividends-unaffiliated (net of foreign tax withholding of $57,375) | $1,089,147 |
| Dividends-affiliated | 16,125 |
| Securities lending, net | 4,863 |
| Total income | 1,110,135 |
| Expenses | |
| Manager (See Note 3) | 287,875 |
| Distribution/Service—Service Class (See Note 3) | 79,249 |
| Professional fees | 56,949 |
| Custodian | 24,005 |
| Trustees | 868 |
| Miscellaneous | 278 |
| Total expenses before waiver/reimbursement | 449,224 |
| Expense waiver/reimbursement from Manager (See Note 3) | (48,231) |
| Net expenses | 400,993 |
| Net investment income (loss) | 709,142 |
| Realized and Unrealized Gain (Loss) |
| Net realized gain (loss) on: | |
| Unaffiliated investment transactions | (265,305) |
| Foreign currency transactions | (6,040) |
| Net realized gain (loss) | (271,345) |
| Net change in unrealized appreciation (depreciation) on: | |
| Unaffiliated investments | 875,024 |
| Translation of other assets and liabilities in foreign currencies | 411 |
| Net change in unrealized appreciation (depreciation) | 875,435 |
| Net realized and unrealized gain (loss) | 604,090 |
| Net increase (decrease) in net assets resulting from operations | $1,313,232 |
The notes to the financial statements are an integral part of, and should be read in conjunction with, the financial statements.
| 14 | MainStay VP CBRE Global Infrastructure Portfolio |
Statements of Changes in Net Assets
for the years ended December 31, 2023 and December 31, 2022
| | 2023 | 2022 |
| Increase (Decrease) in Net Assets |
| Operations: | | |
| Net investment income (loss) | $ 709,142 | $ 518,708 |
| Net realized gain (loss) | (271,345) | (937,133) |
| Net change in unrealized appreciation (depreciation) | 875,435 | (2,045,417) |
| Net increase (decrease) in net assets resulting from operations | 1,313,232 | (2,463,842) |
| Distributions to shareholders: | | |
| Initial Class | (40,585) | (27,062) |
| Service Class | (502,552) | (387,536) |
| Total distributions to shareholders | (543,137) | (414,598) |
| Capital share transactions: | | |
| Net proceeds from sales of shares | 8,530,228 | 20,290,734 |
| Net asset value of shares issued to shareholders in reinvestment of distributions | 543,137 | 414,598 |
| Cost of shares redeemed | (8,984,738) | (10,775,375) |
| Increase (decrease) in net assets derived from capital share transactions | 88,627 | 9,929,957 |
| Net increase (decrease) in net assets | 858,722 | 7,051,517 |
| Net Assets |
| Beginning of year | 33,891,049 | 26,839,532 |
| End of year | $34,749,771 | $ 33,891,049 |
The notes to the financial statements are an integral part of, and should be read in conjunction with, the financial statements.
15
Financial Highlights selected per share data and ratios
| | Year Ended December 31, |
| Initial Class | 2023 | | 2022 | | 2021 | | 2020 | | 2019 |
| Net asset value at beginning of year | $ 6.92 | | $ 7.47 | | $ 6.48 | | $ 8.01 | | $ 7.61 |
| Net investment income (loss) (a) | 0.16 | | 0.13 | | 0.15 | | 0.03 | | 0.03 |
| Net realized and unrealized gain (loss) | 0.10 | | (0.58) | | 0.84 | | (1.08) | | 0.37 |
| Total from investment operations | 0.26 | | (0.45) | | 0.99 | | (1.05) | | 0.40 |
| Less distributions: | | | | | | | | | |
| From net investment income | (0.12) | | (0.10) | | — | | (0.48) | | — |
| Net asset value at end of year | $ 7.06 | | $ 6.92 | | $ 7.47 | | $ 6.48 | | $ 8.01 |
| Total investment return (b) | 4.06% | | (5.99)% | | 15.28%(c) | | (12.81)% | | 5.26%(c) |
| Ratios (to average net assets)/Supplemental Data: | | | | | | | | | |
| Net investment income (loss) | 2.32% | | 1.87% | | 2.08% | | 0.41% | | 0.33% |
| Net expenses (d) | 0.95% | | 0.95% | | 0.95% | | 1.05% | | 1.21% |
| Expenses (before waiver/reimbursement) (d) | 1.09% | | 1.13% | | 1.32% | | 1.44% | | 1.21% |
| Portfolio turnover rate | 41% | | 54% | | 43% | | 163% | | 119% |
| Net assets at end of year (in 000's) | $ 2,439 | | $ 2,111 | | $ 1,899 | | $ 1,022 | | $ 1,009 |
| (a) | Per share data based on average shares outstanding during the year. |
| (b) | Total return does not reflect any deduction of sales charges, mortality and expense charges, contract charges or administrative charges. For periods of less than one year, total return is not annualized. |
| (c) | Total investment return may reflect adjustments to conform to generally accepted accounting principles. |
| (d) | In addition to the fees and expenses which the Portfolio bears directly, it also indirectly bears a pro-rata share of the fees and expenses of the underlying funds in which it invests. Such indirect expenses are not included in the above expense ratios. |
| | Year Ended December 31, |
| Service Class | 2023 | | 2022 | | 2021 | | 2020 | | 2019 |
| Net asset value at beginning of year | $ 6.83 | | $ 7.38 | | $ 6.42 | | $ 7.93 | | $ 7.55 |
| Net investment income (loss) (a) | 0.14 | | 0.11 | | 0.12 | | 0.04 | | 0.01 |
| Net realized and unrealized gain (loss) | 0.10 | | (0.58) | | 0.84 | | (1.09) | | 0.37 |
| Total from investment operations | 0.24 | | (0.47) | | 0.96 | | (1.05) | | 0.38 |
| Less distributions: | | | | | | | | | |
| From net investment income | (0.11) | | (0.08) | | — | | (0.46) | | — |
| Net asset value at end of year | $ 6.96 | | $ 6.83 | | $ 7.38 | | $ 6.42 | | $ 7.93 |
| Total investment return (b) | 3.80% | | (6.22)% | | 14.95%(c) | | (13.03)% | | 5.03%(c) |
| Ratios (to average net assets)/Supplemental Data: | | | | | | | | | |
| Net investment income (loss) | 2.08% | | 1.60% | | 1.79% | | 0.62% | | 0.11% |
| Net expenses (d) | 1.20% | | 1.20% | | 1.20% | | 1.52% | | 1.62% |
| Expenses (before waiver/reimbursement) (d) | 1.34% | | 1.38% | | 1.60% | | 1.95% | | 1.62% |
| Portfolio turnover rate | 41% | | 54% | | 43% | | 163% | | 119% |
| Net assets at end of year (in 000's) | $ 32,310 | | $ 31,780 | | $ 24,941 | | $ 20,041 | | $ 22,798 |
| (a) | Per share data based on average shares outstanding during the year. |
| (b) | Total return does not reflect any deduction of sales charges, mortality and expense charges, contract charges or administrative charges. For periods of less than one year, total return is not annualized. |
| (c) | Total investment return may reflect adjustments to conform to generally accepted accounting principles. |
| (d) | In addition to the fees and expenses which the Portfolio bears directly, it also indirectly bears a pro-rata share of the fees and expenses of the underlying funds in which it invests. Such indirect expenses are not included in the above expense ratios. |
The notes to the financial statements are an integral part of, and should be read in conjunction with, the financial statements.
| 16 | MainStay VP CBRE Global Infrastructure Portfolio |
Notes to Financial Statements
Note 1–Organization and Business
MainStay VP Funds Trust (the “Fund”) was organized as a Delaware statutory trust on February 1, 2011. The Fund is registered under the Investment Company Act of 1940, as amended (the “1940 Act”), as an open-end management investment company. The Fund is comprised of thirty-one separate series (collectively referred to as the “Portfolios”). These financial statements and notes relate to the MainStay VP CBRE Global Infrastructure Portfolio (the "Portfolio"), a "non-diversified” portfolio, as that term is defined in the 1940 Act, as interpreted or modified by regulatory authorities having jurisdiction, from time to time. However, due to its principal investment strategies and investment processes, the Portfolio has historically operated as a "diversified" portfolio. Therefore, the Portfolio will not operate as "non-diversified" portfolio without first obtaining shareholder approval.
Shares of the Portfolio are currently offered to certain separate accounts to fund variable annuity policies and variable universal life insurance policies issued by New York Life Insurance and Annuity Corporation (“NYLIAC”), a wholly-owned subsidiary of New York Life Insurance Company (“New York Life”) and may also be offered to fund variable annuity policies and variable universal life insurance policies issued by other insurance companies. NYLIAC allocates shares of the Portfolio to, among others, certain NYLIAC separate accounts. Shares of the Portfolio are also offered to the MainStay VP Conservative Allocation Portfolio, MainStay VP Moderate Allocation Portfolio, MainStay VP Growth Allocation Portfolio and MainStay VP Equity Allocation Portfolio, which operate as “funds-of-funds," and other variable insurance funds.
The following table lists the Portfolio's share classes that have been registered and commenced operations:
| Class | Commenced Operations |
| Initial Class | May 1, 2015 |
| Service Class | May 1, 2015 |
Shares of the Portfolio are offered and are redeemed at a price equal to their respective net asset value (“NAV”) per share. No sales or redemption charge is applicable to the purchase or redemption of the Portfolio's shares. Under the terms of the Fund’s multiple class plan, adopted pursuant to Rule 18f-3 under the 1940 Act, the classes differ in that, among other things, Service Class shares of the Portfolio pay a combined distribution and service fee of 0.25% of average daily net assets attributable to Service Class shares of the Portfolio to the Distributor (as defined in Note 3(B)) pursuant to a plan adopted in accordance with Rule 12b-1 under the 1940 Act. Contract owners of variable annuity contracts purchased after June 2, 2003, are permitted to invest only in the Service Class shares.
The Portfolio's investment objective is to seek total return.
Note 2–Significant Accounting Policies
The Portfolio is an investment company and accordingly follows the investment company accounting and reporting guidance of the Financial Accounting Standards Board (“FASB”) Accounting Standards Codification Topic 946 Financial Services—Investment Companies. The Portfolio prepares its financial statements in accordance with generally accepted accounting principles (“GAAP”) in the United States of America and follows the significant accounting policies described below.
(A) Securities Valuation. Investments are usually valued as of the close of regular trading on the New York Stock Exchange (the "Exchange") (usually 4:00 p.m. Eastern time) on each day the Portfolio is open for business ("valuation date").
Pursuant to Rule 2a-5 under the 1940 Act, the Board of Trustees of the Fund (the "Board") has designated New York Life Investment Management LLC (“New York Life Investments” or the "Manager") as its Valuation Designee (the "Valuation Designee"). The Valuation Designee is responsible for performing fair valuations relating to all investments in the Portfolio’s portfolio for which market quotations are not readily available; periodically assessing and managing material valuation risks; establishing and applying fair value methodologies; testing fair valuation methodologies; evaluating and overseeing pricing services; ensuring appropriate segregation of valuation and portfolio management functions; providing quarterly, annual and prompt reporting to the Board, as appropriate; identifying potential conflicts of interest; and maintaining appropriate records. The Valuation Designee has established a valuation committee ("Valuation Committee") to assist in carrying out the Valuation Designee’s responsibilities and establish prices of securities for which market quotations are not readily available. The Portfolio's and the Valuation Designee's policies and procedures ("Valuation Procedures") govern the Valuation Designee’s selection and application of methodologies for determining and calculating the fair value of Portfolio investments. The Valuation Designee may value the Portfolio's portfolio securities for which market quotations are not readily available and other Portfolio assets utilizing inputs from pricing services and other third-party sources. The Valuation Committee meets (in person, via electronic mail or via teleconference) on an ad-hoc basis to determine fair valuations and on a quarterly basis to review fair value events with respect to certain securities for which market quotations are not readily available, including valuation risks and back-testing results, and to preview reports to the Board.
The Valuation Committee establishes prices of securities for which market quotations are not readily available based on such methodologies and measurements on a regular basis after considering information that is reasonably available and deemed relevant by the Valuation Committee. The Board shall oversee the Valuation Designee and review fair valuation materials on a prompt, quarterly and annual basis and approve proposed revisions to the Valuation Procedures.
Investments for which market quotations are not readily available are valued at fair value as determined in good faith pursuant to the Valuation
Notes to Financial Statements (continued)
Procedures. A market quotation is readily available only when that quotation is a quoted price (unadjusted) in active markets for identical investments that the Portfolio can access at the measurement date, provided that a quotation will not be readily available if it is not reliable. "Fair value" is defined as the price the Portfolio would reasonably expect to receive upon selling an asset or liability in an orderly transaction to an independent buyer in the principal or most advantageous market for the asset or liability. Fair value measurements are determined within a framework that establishes a three-tier hierarchy that maximizes the use of observable market data and minimizes the use of unobservable inputs to establish a classification of fair value measurements for disclosure purposes. "Inputs" refer broadly to the assumptions that market participants would use in pricing the asset or liability, including assumptions about risk, such as the risk inherent in a particular valuation technique used to measure fair value using a pricing model and/or the risk inherent in the inputs for the valuation technique. Inputs may be observable or unobservable. Observable inputs reflect the assumptions market participants would use in pricing the asset or liability based on market data obtained from sources independent of the Portfolio. Unobservable inputs reflect the Portfolio’s own assumptions about the assumptions market participants would use in pricing the asset or liability based on the information available. The inputs or methodology used for valuing assets or liabilities may not be an indication of the risks associated with investing in those assets or liabilities. The three-tier hierarchy of inputs is summarized below.
| • | Level 1—quoted prices (unadjusted) in active markets for an identical asset or liability |
| • | Level 2—other significant observable inputs (including quoted prices for a similar asset or liability in active markets, interest rates and yield curves, prepayment speeds, credit risk, etc.) |
| • | Level 3—significant unobservable inputs (including the Portfolio's own assumptions about the assumptions that market participants would use in measuring fair value of an asset or liability) |
The level of an asset or liability within the fair value hierarchy is based on the lowest level of an input, both individually and in the aggregate, that is significant to the fair value measurement. The aggregate value by input level of the Portfolio’s assets and liabilities as of December 31, 2023, is included at the end of the Portfolio of Investments.
The Portfolio may use third-party vendor evaluations, whose prices may be derived from one or more of the following standard inputs, among others:
| • Broker/dealer quotes | • Benchmark securities |
| • Two-sided markets | • Reference data (corporate actions or material event notices) |
| • Bids/offers | • Monthly payment information |
| • Industry and economic events | • Reported trades |
An asset or liability for which a market quotation is not readily available is valued by methods deemed reasonable in good faith by the Valuation
Committee, following the Valuation Procedures to represent fair value. Under these procedures, the Valuation Designee generally uses a market-based approach which may use related or comparable assets or liabilities, recent transactions, market multiples, book values and other relevant information. The Valuation Designee may also use an income-based valuation approach in which the anticipated future cash flows of the asset or liability are discounted to calculate fair value. Discounts may also be applied due to the nature and/or duration of any restrictions on the disposition of the asset or liability. Fair value represents a good faith approximation of the value of a security. Fair value determinations involve the consideration of a number of subjective factors, an analysis of applicable facts and circumstances and the exercise of judgment. As a result, it is possible that the fair value for a security determined in good faith in accordance with the Valuation Procedures may differ from valuations for the same security determined for other funds using their own valuation procedures. Although the Valuation Procedures are designed to value a security at the price the Portfolio may reasonably expect to receive upon the security's sale in an orderly transaction, there can be no assurance that any fair value determination thereunder would, in fact, approximate the amount that the Portfolio would actually realize upon the sale of the security or the price at which the security would trade if a reliable market price were readily available. During the year ended December 31, 2023, there were no material changes to the fair value methodologies.
Securities which may be valued in this manner include, but are not limited to: (i) a security for which trading has been halted or suspended or otherwise does not have a readily available market quotation on a given day; (ii) a debt security that has recently gone into default and for which there is not a current market quotation; (iii) a security of an issuer that has entered into a restructuring; (iv) a security that has been delisted from a national exchange; (v) a security subject to trading collars for which no or limited trading takes place; and (vi) a security whose principal market has been temporarily closed at a time when, under normal conditions, it would be open. Securities valued in this manner are generally categorized as Level 2 or 3 in the hierarchy.
Certain securities held by the Portfolio may principally trade in foreign markets. Events may occur between the time the foreign markets close and the time at which the Portfolio's NAVs are calculated. These events may include, but are not limited to, situations relating to a single issuer in a market sector, significant fluctuations in U.S. or foreign markets, natural disasters, armed conflicts, governmental actions or other developments not tied directly to the securities markets. Should the Valuation Designee conclude that such events may have affected the accuracy of the last price of such securities reported on the local foreign market, the Valuation Designee may, pursuant to the Valuation Procedures, adjust the value of the local price to reflect the estimated impact on the price of such securities as a result of such events. In this instance, securities are generally categorized as Level 3 in the hierarchy. Additionally, certain foreign equity securities are also fair valued whenever the movement of a particular index exceeds certain thresholds. In such cases, the securities are fair valued by applying factors provided by a third-party vendor in
| 18 | MainStay VP CBRE Global Infrastructure Portfolio |
accordance with the Valuation Procedures and are generally categorized as Level 2 in the hierarchy.
If the principal market of certain foreign equity securities is closed in observance of a local foreign holiday, these securities are valued using the last closing price of regular trading on the relevant exchange and fair valued by applying factors provided by a third-party vendor in accordance with the Valuation Procedures. These securities are generally categorized as Level 2 in the hierarchy.
Equity securities, rights and warrants, if applicable, are valued at the last quoted sales prices as of the close of regular trading on the relevant exchange on each valuation date. Securities that are not traded on the valuation date are valued at the mean of the last quoted bid and ask prices. Prices are normally taken from the principal market in which each security trades. These securities are generally categorized as Level 1 in the hierarchy.
Investments in mutual funds, including money market funds, are valued at their respective NAVs at the close of business each day on the valuation date. These securities are generally categorized as Level 1 in the hierarchy.
Temporary cash investments acquired in excess of 60 days to maturity at the time of purchase are valued using the latest bid prices or using valuations based on a matrix system (which considers such factors as security prices, yields, maturities and ratings), both as furnished by independent pricing services. Temporary cash investments that mature in 60 days or less at the time of purchase ("Short-Term Investments") are valued using the amortized cost method of valuation, unless the use of such method would be inappropriate. The amortized cost method involves valuing a security at its cost on the date of purchase and thereafter assuming a constant amortization to maturity of the difference between such cost and the value on maturity date. Amortized cost approximates the current fair value of a security. Securities valued using the amortized cost method are not valued using quoted prices in an active market and are generally categorized as Level 2 in the hierarchy.
The information above is not intended to reflect an exhaustive list of the methodologies that may be used to value portfolio investments. The Valuation Procedures permit the use of a variety of valuation methodologies in connection with valuing portfolio investments. The methodology used for a specific type of investment may vary based on the market data available or other considerations. The methodologies summarized above may not represent the specific means by which portfolio investments are valued on any particular business day.
(B) Income Taxes. The Portfolio's policy is to comply with the requirements of the Internal Revenue Code of 1986, as amended (the “Internal Revenue Code”), applicable to regulated investment companies and to distribute all of its taxable income to the shareholders of the Portfolio within the allowable time limits.
The Manager evaluates the Portfolio’s tax positions to determine if the tax positions taken meet the minimum recognition threshold in connection
with accounting for uncertainties in income tax positions taken or expected to be taken for the purposes of measuring and recognizing tax liabilities in the financial statements. Recognition of tax benefits of an uncertain tax position is permitted only to the extent the position is “more likely than not” to be sustained assuming examination by taxing authorities. The Manager analyzed the Portfolio's tax positions taken on federal, state and local income tax returns for all open tax years (for up to three tax years) and has concluded that no provisions for federal, state and local income tax are required in the Portfolio's financial statements. The Portfolio's federal, state and local income tax and federal excise tax returns for tax years for which the applicable statutes of limitations have not expired are subject to examination by the Internal Revenue Service and state and local departments of revenue.
(C) Foreign Taxes. The Portfolio may be subject to foreign taxes on income and other transaction-based taxes imposed by certain countries in which it invests. A portion of the taxes on gains on investments or currency purchases/repatriation may be reclaimable. The Portfolio will accrue such taxes and reclaims as applicable, based upon its current interpretation of tax rules and regulations that exist in the markets in which it invests.
The Portfolio may be subject to taxation on realized capital gains, repatriation proceeds and other transaction-based taxes imposed by certain countries in which it invests. The Portfolio will accrue such taxes as applicable based upon its current interpretation of tax rules and regulations that exist in the market in which it invests. Capital gains taxes relating to positions still held are reflected as a liability in the Statement of Assets and Liabilities, as well as an adjustment to the Portfolio's net unrealized appreciation (depreciation). Taxes related to capital gains realized, if any, are reflected as part of net realized gain (loss) in the Statement of Operations. Changes in tax liabilities related to capital gains taxes on unrealized investment gains, if any, are reflected as part of the change in net unrealized appreciation (depreciation) on investments in the Statement of Operations. Transaction-based charges are generally assessed as a percentage of the transaction amount.
(D) Dividends and Distributions to Shareholders. Dividends and distributions are recorded on the ex-dividend date. The Portfolio intends to declare and pay dividends from net investment income and distributions from net realized capital and currency gains, if any, at least annually. All dividends and distributions are reinvested at NAV in the same class of shares of the Portfolio. Dividends and distributions to shareholders are determined in accordance with federal income tax regulations and may differ from determinations using GAAP.
(E) Security Transactions and Investment Income. The Portfolio records security transactions on the trade date. Realized gains and losses on security transactions are determined using the identified cost method. Dividend income is recognized on the ex-dividend date, net of any foreign tax withheld at the source, and interest income is accrued as earned using the effective interest rate method. Distributions received from real estate investment trusts may be classified as dividends, capital gains and/or return of capital.
Notes to Financial Statements (continued)
The Portfolio may also invest up to 25% of its net assets in master limited partnerships.
Investment income and realized and unrealized gains and losses on investments of the Portfolio are allocated pro rata to the separate classes of shares based upon their relative net assets on the date the income is earned or realized and unrealized gains and losses are incurred.
(F) Expenses. Expenses of the Fund are allocated to the individual Portfolios in proportion to the net assets of the respective Portfolios when the expenses are incurred, except where direct allocations of expenses can be made. Expenses (other than fees incurred under the distribution and service plans, further discussed in Note 3(B), which are charged directly to the Service Class shares) are allocated to separate classes of shares pro rata based upon their relative net assets on the date the expenses are incurred. The expenses borne by the Portfolio, including those of related parties to the Portfolio, are shown in the Statement of Operations.
Additionally, the Portfolio may invest in mutual funds, which are subject to management fees and other fees that may cause the costs of investing in mutual funds to be greater than the costs of owning the underlying securities directly. These indirect expenses of mutual funds are not included in the amounts shown as expenses in the Statement of Operations or in the expense ratios included in the Financial Highlights.
(G) Use of Estimates. In preparing financial statements in conformity with GAAP, the Manager makes estimates and assumptions that affect the reported amounts and disclosures in the financial statements. Actual results could differ from those estimates and assumptions.
(H) Foreign Currency Transactions. The Portfolio's books and records are maintained in U.S. dollars. Prices of securities denominated in foreign currency amounts are translated into U.S. dollars at the mean between the buying and selling rates last quoted by any major U.S. bank at the following dates:
(i) market value of investment securities, other assets and liabilities— at the valuation date; and
(ii) purchases and sales of investment securities, income and expenses—at the date of such transactions.
The assets and liabilities that are denominated in foreign currency amounts are presented at the exchange rates and market values at the close of the period. The realized and unrealized changes in net assets arising from fluctuations in exchange rates and market prices of securities are not separately presented.
Net realized gain (loss) on foreign currency transactions represents net currency gains or losses realized as a result of differences between the amounts of securities sale proceeds or purchase cost, dividends, interest and withholding taxes as recorded on the Portfolio's books, and the U.S. dollar equivalent amount actually received or paid. Net currency gains or losses from valuing such foreign currency denominated assets and
liabilities, other than investments at valuation date exchange rates, are reflected in unrealized foreign exchange gains or losses.
(I) Securities Lending. In order to realize additional income, the Portfolio may engage in securities lending, subject to the limitations set forth in the 1940 Act and relevant guidance by the staff of the Securities and Exchange Commission (“SEC”). If the Portfolio engages in securities lending, the Portfolio will lend through its custodian, JPMorgan Chase Bank, N.A., ("JPMorgan"), acting as securities lending agent on behalf of the Portfolio. Under the current arrangement, JPMorgan will manage the Portfolio's collateral in accordance with the securities lending agency agreement between the Portfolio and JPMorgan, and indemnify the Portfolio against counterparty risk. The loans will be collateralized by cash (which may be invested in a money market fund) and/or non-cash collateral (which may include U.S. Treasury securities and/or U.S. government agency securities issued or guaranteed by the United States government or its agencies or instrumentalities) at least equal at all times to the market value of the securities loaned. Non-cash collateral held at year end is segregated and cannot be transferred by the Portfolio. The Portfolio bears the risk of delay in recovery of, or loss of rights in, the securities loaned. The Portfolio may also record a realized gain or loss on securities deemed sold due to a borrower’s inability to return securities on loan. The Portfolio bears the risk of any loss on investment of cash collateral. The Portfolio will receive compensation for lending its securities in the form of fees or it will retain a portion of interest earned on the investment of any cash collateral. The Portfolio will also continue to receive interest and dividends on the securities loaned and any gain or loss in the market price of the securities loaned that may occur during the term of the loan will be for the account of the Portfolio. Income earned from securities lending activities, if any, is reflected in the Statement of Operations.
(J) Foreign Securities Risk. The Portfolio may invest in foreign securities, which carry certain risks that are in addition to the usual risks inherent in domestic securities. Foreign regulatory regimes and securities markets can have less stringent investor protections and disclosure standards and less liquid trading markets than U.S. regulatory regimes and securities markets, and can experience political, social and economic developments that may affect the value of investments in foreign securities. These risks include those resulting from currency fluctuations, future adverse political or economic developments and possible imposition of currency exchange blockages or other foreign governmental laws or restrictions. Economic sanctions and other similar governmental actions or developments could, among other things, effectively restrict or eliminate the Portfolio's ability to purchase or sell certain foreign securities or groups of foreign securities, and thus may make the Portfolio's investments in such securities less liquid or more difficult to value. These risks are likely to be greater in emerging markets than in developed markets. The ability of issuers of debt securities held by the Portfolio to meet their obligations may be affected by, among other things, economic or political developments in a specific country, industry or region.
| 20 | MainStay VP CBRE Global Infrastructure Portfolio |
(K) Indemnifications. Under the Fund’s organizational documents, its officers and trustees are indemnified against certain liabilities that may arise out of performance of their duties to the Fund. Additionally, in the normal course of business, the Portfolio enters into contracts with third-party service providers that contain a variety of representations and warranties and that may provide general indemnifications. The Portfolio's maximum exposure under these arrangements is unknown, as this would involve future claims that may be made against the Portfolio that have not yet occurred. The Manager believes that the risk of loss in connection with these potential indemnification obligations is remote. However, there can be no assurance that material liabilities related to such obligations will not arise in the future, which could adversely impact the Portfolio.
Note 3–Fees and Related Party Transactions
(A) Manager and Subadvisor. New York Life Investments, a registered investment adviser and an indirect, wholly-owned subsidiary of New York Life, serves as the Portfolio's Manager pursuant to an Amended and Restated Management Agreement ("Management Agreement"). The Manager provides offices, conducts clerical, recordkeeping and bookkeeping services and keeps most of the financial and accounting records required to be maintained by the Portfolio. Except for the portion of salaries and expenses that are the responsibility of the Portfolio, the Manager pays the salaries and expenses of all personnel affiliated with the Portfolio and certain operational expenses of the Portfolio. The Portfolio reimburses New York Life Investments in an amount equal to the portion of the compensation of the Chief Compliance Officer attributable to the Portfolio. CBRE Investment Management Listed Real Assets LLC ("CBRE" or the "Subadvisor"), a registered investment adviser, serves as the Subadvisor to the Portfolio and is responsible for the day-to-day portfolio management of the Portfolio. Pursuant to the terms of a Subadvisory Agreement between New York Life Investments and CBRE, New York Life Investments pays for the services of the Subadvisor.
Effective May 1, 2023, pursuant to the Management Agreement, the Fund pays the Manager, on behalf of the Portfolio, a monthly fee for the services performed and the facilities furnished at an annual rate of the Portfolio's average daily net assets as follows: 0.85% up to $3 billion; and 0.84% in excess of $3 billion. During the year ended December 31, 2023, the effective management fee rate was 0.85% of the Portfolio's average daily net assets.
Prior to May 1, 2023, the Fund paid the Manager, on behalf of the Portfolio, a monthly fee for the services performed and the facilities furnished at an annual rate of 0.85% of the Portfolio's average daily net assets.
New York Life Investments has contractually agreed to waive fees and/or reimburse expenses so that the Total Annual Portfolio Operating Expenses (excluding taxes, interest, litigation, extraordinary expenses, brokerage and other transaction expenses relating to the purchase or sale of portfolio investments, and acquired (underlying) portfolio/fund fees and expenses) of Initial Class shares and Service Class shares do not exceed 0.95% and 1.20%, respectively, of the Portfolio's average daily net
assets. This agreement will remain in effect until May 1, 2024, and shall renew automatically for one-year terms unless New York Life Investments provides written notice of termination prior to the start of the next term or upon approval of the Board.
During the year ended December 31, 2023, New York Life Investments earned fees from the Portfolio in the amount of $287,875 and waived fees and/or reimbursed expenses in the amount of $48,231 and paid the Subadvisor fees in the amount of $119,822.
JPMorgan provides sub-administration and sub-accounting services to the Portfolio pursuant to an agreement with New York Life Investments. These services include calculating the daily NAVs of the Portfolio, maintaining the general ledger and sub-ledger accounts for the calculation of the Portfolio's NAVs, and assisting New York Life Investments in conducting various aspects of the Portfolio's administrative operations. For providing these services to the Portfolio, JPMorgan is compensated by New York Life Investments.
Pursuant to an agreement between the Fund and New York Life Investments, New York Life Investments is responsible for providing or procuring certain regulatory reporting services for the Portfolio. The Portfolio will reimburse New York Life Investments for the actual costs incurred by New York Life Investments in connection with providing or procuring these services for the Portfolio.
(B) Distribution and Service Fees. The Fund, on behalf of the Portfolio, has entered into a distribution agreement with NYLIFE Distributors LLC (the “Distributor”), an affiliate of New York Life Investments. The Portfolio has adopted a distribution plan (the “Plan”) in accordance with the provisions of Rule 12b-1 under the 1940 Act. Under the Plan, the Distributor has agreed to provide, through its affiliates or independent third parties, various distribution-related, shareholder and administrative support services to the Service Class shareholders. For its services, the Distributor is entitled to a combined distribution and service fee accrued daily and paid monthly at an annual rate of 0.25% of the average daily net assets attributable to the Service Class shares of the Portfolio.
Note 4-Federal Income Tax
As of December 31, 2023, the cost and unrealized appreciation (depreciation) of the Portfolio’s investment portfolio, including applicable derivative contracts and other financial instruments, as determined on a federal income tax basis, were as follows:
| | Federal Tax
Cost | Gross
Unrealized
Appreciation | Gross
Unrealized
(Depreciation) | Net
Unrealized
Appreciation/
(Depreciation) |
| Investments in Securities | $33,403,315 | $2,348,825 | $(1,008,280) | $1,340,545 |
Notes to Financial Statements (continued)
As of December 31, 2023, the components of accumulated gain (loss) on a tax basis were as follows:
Ordinary
Income | Accumulated
Capital
and Other
Gain (Loss) | Other
Temporary
Differences | Unrealized
Appreciation
(Depreciation) | Total
Accumulated
Gain (Loss) |
| $715,865 | $(36,519,547) | $15,681 | $1,340,216 | $(34,447,785) |
The difference between book-basis and tax-basis unrealized appreciation (depreciation) is primarily due to wash sale adjustments.
As of December 31, 2023, for federal income tax purposes, capital loss carryforwards of $36,519,547, as shown in the table below, were available to the extent provided by the regulations to offset future realized gains of the Portfolio. Accordingly, no capital gains distributions are expected to be paid to shareholders until net gains have been realized in excess of such amounts.
Capital Loss
Available Through | Short-Term
Capital Loss
Amounts (000’s) | Long-Term
Capital Loss
Amounts (000’s) |
| Unlimited | $34,283 | $2,236 |
During the years ended December 31, 2023 and December 31, 2022, the tax character of distributions paid as reflected in the Statements of Changes in Net Assets was as follows:
| | 2023 | 2022 |
| Distributions paid from: | | |
| Ordinary Income | $543,137 | $414,598 |
Note 5–Custodian
JPMorgan is the custodian of cash and securities held by the Portfolio. Custodial fees are charged to the Portfolio based on the Portfolio's net assets and/or the market value of securities held by the Portfolio and the number of certain transactions incurred by the Portfolio.
Note 6–Line of Credit
The Portfolio and certain other funds managed by New York Life Investments maintain a line of credit with a syndicate of banks in order to secure a source of funds for temporary purposes to meet unanticipated or excessive redemption requests.
Effective July 25, 2023, under the credit agreement (the “Credit Agreement”), the aggregate commitment amount is $600,000,000 with an additional uncommitted amount of $100,000,000. The commitment fee is an annual rate of 0.15% of the average commitment amount payable quarterly, regardless of usage, to JPMorgan, who serves as the agent to the syndicate. The commitment fee is allocated among the Portfolio and certain other funds managed by New York Life Investments based upon their respective net assets and other factors. Interest on any revolving credit loan is charged based upon the Federal Funds Rate, Daily Simple Secured Overnight Financing Rate ("SOFR") + 0.10%, or the Overnight Bank Funding Rate, whichever is higher. The Credit Agreement
expires on July 23, 2024, although the Portfolio, certain other funds managed by New York Life Investments and the syndicate of banks may renew the Credit Agreement for an additional year on the same or different terms or enter into a credit agreement with a different syndicate of banks. Prior to July 25, 2023, the aggregate commitment amount and the commitment fee were the same as those under the current Credit Agreement. During the year ended December 31, 2023, there were no borrowings made or outstanding with respect to the Portfolio under the Credit Agreement.
Note 7–Interfund Lending Program
Pursuant to an exemptive order issued by the SEC, the Portfolio, along with certain other funds managed by New York Life Investments, may participate in an interfund lending program. The interfund lending program provides an alternative credit facility that permits the Portfolio and certain other funds managed by New York Life Investments to lend or borrow money for temporary purposes directly to or from one another, subject to the conditions of the exemptive order. During the year ended December 31, 2023, there were no interfund loans made or outstanding with respect to the Portfolio.
Note 8–Purchases and Sales of Securities (in 000’s)
During the year ended December 31, 2023, purchases and sales of securities, other than short-term securities, were $14,509 and $13,763, respectively.
Note 9–Capital Share Transactions
Transactions in capital shares for the years ended December 31, 2023 and December 31, 2022, were as follows:
| Initial Class | Shares | Amount |
| Year ended December 31, 2023: | | |
| Shares sold | 77,302 | $ 519,694 |
| Shares issued to shareholders in reinvestment of distributions | 6,579 | 40,585 |
| Shares redeemed | (43,447) | (306,011) |
| Net increase (decrease) | 40,434 | $ 254,268 |
| Year ended December 31, 2022: | | |
| Shares sold | 100,768 | $ 720,250 |
| Shares issued to shareholders in reinvestment of distributions | 4,406 | 27,062 |
| Shares redeemed | (54,059) | (380,690) |
| Net increase (decrease) | 51,115 | $ 366,622 |
| |
| 22 | MainStay VP CBRE Global Infrastructure Portfolio |
| Service Class | Shares | Amount |
| Year ended December 31, 2023: | | |
| Shares sold | 1,181,990 | $ 8,010,534 |
| Shares issued to shareholders in reinvestment of distributions | 82,511 | 502,552 |
| Shares redeemed | (1,279,988) | (8,678,727) |
| Net increase (decrease) | (15,487) | $ (165,641) |
| Year ended December 31, 2022: | | |
| Shares sold | 2,756,775 | $ 19,570,484 |
| Shares issued to shareholders in reinvestment of distributions | 63,886 | 387,536 |
| Shares redeemed | (1,544,297) | (10,394,685) |
| Net increase (decrease) | 1,276,364 | $ 9,563,335 |
Note 10–Other Matters
As of the date of this report, the Portfolio faces a heightened level of risk associated with current uncertainty, volatility and state of economies, financial markets, rising interest rates, and labor and health conditions around the world. Events such as war, acts of terrorism, recessions, rapid inflation, the imposition of international sanctions, earthquakes, hurricanes, epidemics and pandemics and other unforeseen natural or human disasters may have broad adverse social, political and economic effects on the global economy, which could negatively impact the value of the Portfolio's investments. Developments that disrupt global economies and financial markets may magnify factors that affect the Portfolio's performance.
Note 11–Subsequent Events
In connection with the preparation of the financial statements of the Portfolio as of and for the year ended December 31, 2023, events and transactions subsequent to December 31, 2023, through the date the financial statements were issued, have been evaluated by the Manager for possible adjustment and/or disclosure. No subsequent events requiring financial statement adjustment or disclosure have been identified.
Report of Independent Registered Public Accounting Firm
To the Board of Trustees of MainStay VP Funds Trust and Shareholders of MainStay VP CBRE Global Infrastructure Portfolio
Opinion on the Financial Statements
We have audited the accompanying statement of assets and liabilities, including the portfolio of investments, of MainStay VP CBRE Global Infrastructure Portfolio (one of the portfolios constituting MainStay VP Funds Trust, referred to hereafter as the “Portfolio”) as of December 31, 2023, the related statement of operations for the year ended December 31, 2023, the statements of changes in net assets for each of the two years in the period ended December 31, 2023, including the related notes, and the financial highlights for each of the five years in the period ended December 31, 2023 (collectively referred to as the “financial statements”). In our opinion, the financial statements present fairly, in all material respects, the financial position of the Portfolio as of December 31, 2023, the results of its operations for the year then ended, the changes in its net assets for each of the two years in the period ended December 31, 2023 and the financial highlights for each of the five years in the period ended December 31, 2023 in conformity with accounting principles generally accepted in the United States of America.
Basis for Opinion
These financial statements are the responsibility of the Portfolio’s management. Our responsibility is to express an opinion on the Portfolio’s financial statements based on our audits. We are a public accounting firm registered with the Public Company Accounting Oversight Board (United States) (PCAOB) and are required to be independent with respect to the Portfolio in accordance with the U.S. federal securities laws and the applicable rules and regulations of the Securities and Exchange Commission and the PCAOB.
We conducted our audits of these financial statements in accordance with the standards of the PCAOB. Those standards require that we plan and perform the audit to obtain reasonable assurance about whether the financial statements are free of material misstatement, whether due to error or fraud.
Our audits included performing procedures to assess the risks of material misstatement of the financial statements, whether due to error or fraud, and performing procedures that respond to those risks. Such procedures included examining, on a test basis, evidence regarding the amounts and disclosures in the financial statements. Our audits also included evaluating the accounting principles used and significant estimates made by management, as well as evaluating the overall presentation of the financial statements. Our procedures included confirmation of securities owned as of December 31, 2023 by correspondence with the custodian, transfer agent and broker; when replies were not received from broker, we performed other auditing procedures. We believe that our audits provide a reasonable basis for our opinion.
/s/PricewaterhouseCoopers LLP
New York, New York
February 26, 2024
We have served as the auditor of one or more investment companies in the MainStay group of funds since 1984.
| 24 | MainStay VP CBRE Global Infrastructure Portfolio |
Board Consideration and Approval of Management Agreement and Subadvisory Agreement (Unaudited)
The continuation of the Management Agreement with respect to the MainStay VP CBRE Global Infrastructure Portfolio (“Portfolio”) and New York Life Investment Management LLC (“New York Life Investments”) and the Subadvisory Agreement between New York Life Investments and CBRE Investment Management Listed Real Assets LLC (“CBRE”) with respect to the Portfolio (together, “Advisory Agreements”) is subject to annual review and approval by the Board of Trustees of MainStay VP Funds Trust (“Board” of the “Trust”) in accordance with Section 15 of the Investment Company Act of 1940, as amended (“1940 Act”). At its December 6–7, 2023 meeting, the Board, including the Trustees who are not an “interested person” (as such term is defined in the 1940 Act) of the Trust (“Independent Trustees”) voting separately, unanimously approved the continuation of each of the Advisory Agreements for a one-year period.
In reaching the decision to approve the continuation of each of the Advisory Agreements, the Board considered information and materials furnished by New York Life Investments and CBRE in connection with an annual contract review process undertaken by the Board that took place at meetings of the Board and its Contracts Committee from September 2023 through December 2023, including information and materials furnished by New York Life Investments and CBRE in response to requests prepared on behalf of the Board, and in consultation with the Independent Trustees, by independent legal counsel to the Independent Trustees, which encompassed a variety of topics, including those summarized below. Information and materials requested by and furnished to the Board for consideration in connection with the contract review process included, among other items, reports on the Portfolio and “peer funds” prepared by Institutional Shareholder Services Inc. (“ISS”), an independent third-party service provider engaged by the Board to report objectively on the Portfolio’s investment performance, management fee and total expenses. The Board also considered information on the fees charged to other investment advisory clients of New York Life Investments and/or CBRE that follow investment strategies similar to those of the Portfolio, if any, and, when applicable, the rationale for differences in the Portfolio’s management and subadvisory fees and the fees charged to those other investment advisory clients. In addition, the Board considered information regarding the legal standards and fiduciary obligations applicable to its consideration of the continuation of each of the Advisory Agreements. The contract review process, including the structure and format for information and materials provided to the Board, has been developed in consultation with the Board. The Independent Trustees also met in executive sessions with their independent legal counsel and, for portions thereof, with senior management of New York Life Investments.
The Board’s deliberations with respect to the continuation of each of the Advisory Agreements reflect a year-long process, and the Board also took into account information furnished to the Board and its Committees throughout the year, as deemed relevant and appropriate by the Trustees, including, among other items, reports on investment performance of the Portfolio and investment-related matters for the Portfolio as well as presentations from New York Life Investments and, generally annually, CBRE personnel. In addition, the Board took into account other
information provided by New York Life Investments throughout the year, including, among other items, periodic reports on legal and compliance matters, risk management, portfolio turnover, brokerage commissions and non-advisory services provided to the Portfolio by New York Life Investments, as deemed relevant and appropriate by the Trustees.
In addition to information provided to the Board throughout the year, the Board received information in connection with its June 2023 meeting provided specifically in response to requests prepared on behalf of the Board, and in consultation with the Independent Trustees, by independent legal counsel to the Independent Trustees regarding the Portfolio’s distribution arrangements. In addition, the Board received information regarding the Portfolio’s asset levels, share purchase and redemption activity and the payment of Rule 12b-1 and/or certain other fees by applicable share classes of the Portfolio, among other information.
In considering the continuation of each of the Advisory Agreements, the Trustees reviewed and evaluated the information and factors they believed to reasonably be necessary and appropriate in light of legal advice furnished to them by independent legal counsel to the Independent Trustees and through the exercise of their own business judgment. Although individual Trustees may have weighed certain factors or information differently and the Board did not consider any single factor or information controlling in reaching its decision, the factors that figured prominently in the Board’s consideration of the continuation of each of the Advisory Agreements are summarized in more detail below and include, among other factors: (i) the nature, extent and quality of the services provided to the Portfolio by New York Life Investments and CBRE; (ii) the qualifications of the portfolio managers of the Portfolio and the historical investment performance of the Portfolio, New York Life Investments and CBRE; (iii) the costs of the services provided, and profits realized, by New York Life Investments and CBRE with respect to their relationships with the Portfolio; (iv) the extent to which economies of scale have been realized or may be realized if the Portfolio grows and the extent to which any economies of scale have been shared, have benefited or may benefit the Portfolio’s shareholders; and (v) the reasonableness of the Portfolio’s management and subadvisory fees and total ordinary operating expenses. Although the Board recognized that comparisons between the Portfolio’s fees and expenses and those of other funds are imprecise given different terms of agreements, variations in fund strategies and other factors, the Board considered the reasonableness of the Portfolio’s management fee and total ordinary operating expenses as compared to the peer funds identified by ISS. Throughout their considerations, the Trustees acknowledged the commitment of New York Life Investments and its affiliates to serve the MainStay Group of Funds, as well as their capacity, experience, resources, financial stability and reputations. The Trustees also acknowledged the entrepreneurial and other risks assumed by New York Life Investments in sponsoring and managing the Portfolio. With respect to the Subadvisory Agreement, the Board took into account New York Life Investments’ recommendation to approve the continuation of the Subadvisory Agreement.
Board Consideration and Approval of Management Agreement and Subadvisory Agreement (Unaudited) (continued)
The Trustees noted that, throughout the year, the Trustees are afforded an opportunity to ask questions of, and request additional information or materials from, New York Life Investments and CBRE. The Board’s decision with respect to each of the Advisory Agreements may have also been based, in part, on the Board’s knowledge of New York Life Investments and CBRE resulting from, among other things, the Board’s consideration of each of the Advisory Agreements in prior years, the advisory agreements for other funds in the MainStay Group of Funds, the Board’s review throughout the year of the performance and operations of other funds in the MainStay Group of Funds and each Trustee’s business judgment and industry experience. In addition to considering the above-referenced factors, the Board observed that in the marketplace, notably under variable life insurance policies and variable annuity contracts for which the Portfolio serves as an investment option, there are a range of investment options available to investors and that the Portfolio’s shareholders, having had the opportunity to consider other investment options, have invested in the Portfolio.
The factors that figured prominently in the Board’s decision to approve the continuation of each of the Advisory Agreements during the Board’s December 6–7, 2023 meeting are summarized in more detail below.
Nature, Extent and Quality of Services Provided by New York Life Investments and CBRE
The Board examined the nature, extent and quality of the services that New York Life Investments provides to the Portfolio. The Board evaluated New York Life Investments’ experience and capabilities in serving as manager of the Portfolio and considered that the Portfolio operates in a “manager-of-managers” structure. The Board also considered New York Life Investments’ responsibilities and services provided pursuant to this structure, including overseeing the services provided by CBRE, evaluating the performance of CBRE, making recommendations to the Board as to whether the Subadvisory Agreement should be renewed, modified or terminated and periodically reporting to the Board regarding the results of New York Life Investments’ evaluation and monitoring functions. The Board noted that New York Life Investments manages other mutual funds, serves a variety of other investment advisory clients, including other pooled investment vehicles, and has experience overseeing mutual fund service providers, including subadvisors. The Board considered the experience of senior personnel at New York Life Investments providing management and administrative and other non-advisory services to the Portfolio. The Board observed that New York Life Investments devotes significant resources and time to providing management and administrative and other non-advisory services to the Portfolio, including New York Life Investments’ oversight and due diligence reviews of CBRE and ongoing analysis of, and interactions with, CBRE with respect to, among other things, the Portfolio’s investment performance and risks as well as CBRE’s investment capabilities and subadvisory services with respect to the Portfolio.
The Board also considered the range of services that New York Life Investments provides to the Portfolio under the terms of the Management Agreement, including: (i) fund accounting and ongoing supervisory
services provided by New York Life Investments’ Fund Administration and Accounting Group; (ii) investment supervisory and analytical services provided by New York Life Investments’ Investment Consulting Group; (iii) compliance services provided by the Trust’s Chief Compliance Officer as well as New York Life Investments’ compliance department, including supervision and implementation of the Portfolio’s compliance program; (iv) legal services provided by New York Life Investments’ Office of the General Counsel; and (v) risk management monitoring and analysis by compliance and investment personnel. In addition, the Board considered New York Life Investments’ willingness to invest in personnel and other resources, such as cyber security, information security and business continuity planning, that may benefit the Portfolio and noted that New York Life Investments is responsible for compensating the Trust’s officers, except for a portion of the salary of the Trust’s Chief Compliance Officer. The Board recognized that New York Life Investments provides certain other non-advisory services to the Portfolio and has over time provided an increasingly broad array of non-advisory services to the MainStay Group of Funds as a result of regulatory and other developments.
The Board also examined the range, and the nature, extent and quality, of the investment advisory services that CBRE provides to the Portfolio and considered the terms of each of the Advisory Agreements. The Board evaluated CBRE’s experience and performance in serving as subadvisor to the Portfolio and advising other portfolios and CBRE’s track record and experience in providing investment advisory services as well as the experience of investment advisory, senior management and administrative personnel at CBRE. The Board considered New York Life Investments’ and CBRE’s overall resources, legal and compliance environment, capabilities, reputation, financial condition and history. In addition to information provided in connection with quarterly meetings with the Trust’s Chief Compliance Officer, the Board considered information regarding the compliance policies and procedures of New York Life Investments and CBRE and acknowledged their commitment to further developing and strengthening compliance programs that may relate to the Portfolio. The Board also considered CBRE’s ability to recruit and retain qualified investment professionals and willingness to invest in personnel and other resources that may benefit the Portfolio. In this regard, the Board considered the qualifications and experience of the Portfolio’s portfolio managers, the number of accounts managed by the portfolio managers and the method for compensating the portfolio managers.
In addition, the Board considered information provided by New York Life Investments and CBRE regarding their respective business continuity and disaster recovery plans.
Based on these considerations, among others, the Board concluded that the Portfolio would likely continue to benefit from the nature, extent and quality of these services.
Investment Performance
In evaluating the Portfolio’s investment performance, the Board considered investment performance results over various periods in light of the Portfolio’s investment objective, strategies and risks. The Board
| 26 | MainStay VP CBRE Global Infrastructure Portfolio |
considered investment reports on, and analysis of, the Portfolio’s performance provided to the Board throughout the year. These reports include, among other items, information on the Portfolio’s gross and net returns, the Portfolio’s investment performance compared to a relevant investment category and the Portfolio’s benchmark, the Portfolio’s risk-adjusted investment performance and the Portfolio’s investment performance as compared to peer funds, as appropriate, as well as portfolio attribution information and commentary on the effect of market conditions. The Board also considered information provided by ISS showing the investment performance of the Portfolio as compared to peer funds. In addition, the Board reviewed the methodology used by ISS to construct the group of peer funds for comparative purposes.
The Board also took into account its discussions with senior management at New York Life Investments concerning the Portfolio’s investment performance over various periods as well as discussions between representatives of CBRE and the members of the Board’s Investment Committee, which generally occur on an annual basis. In considering the investment performance of the Portfolio, the Board noted that the Portfolio underperformed its peer funds for the five-year period ended July 31, 2023, and performed in line with its peer funds for the one- and three-year periods ended July 31, 2023. The Board considered its discussions with representatives from New York Life Investments and CBRE regarding the Portfolio’s investment performance.
Based on these considerations, among others, the Board concluded that its review of the Portfolio’s investment performance and related information supported a determination to approve the continuation of each of the Advisory Agreements.
Costs of the Services Provided, and Profits and Other Benefits Realized, by New York Life Investments and CBRE
The Board considered the costs of the services provided under each of the Advisory Agreements. The Board also considered the profitability of New York Life Investments and its affiliates and CBRE due to their relationships with the Portfolio as well as by New York Life Investments and its affiliates due to their relationships with the MainStay Group of Funds. With respect to the profitability of CBRE’s relationship with the Portfolio, the Board considered information from New York Life Investments that CBRE’s subadvisory fee reflected an arm’s-length negotiation and that this fee is paid by New York Life Investments, not the Portfolio, and the relevance of CBRE’s profitability was considered by the Trustees in that context. On this basis, the Board primarily considered the costs and profitability for New York Life Investments and its affiliates with respect to the Portfolio.
In addition, the Board acknowledged the difficulty in obtaining reliable comparative data about mutual fund managers’ profitability because such information generally is not publicly available and may be impacted by numerous factors, including the structure of a fund manager’s organization, the types of funds it manages, the methodology used to allocate certain fixed costs to specific funds and the manager’s capital structure and costs of capital.
In evaluating the costs of the services provided by New York Life Investments and CBRE, and profitability of New York Life Investments and its affiliates and CBRE due to their relationships with the Portfolio, the Board considered, among other factors, New York Life Investments’ and its affiliates’ and CBRE’s continuing investments in, or willingness to invest in, personnel and other resources that may support and further enhance the management of the Portfolio, and that New York Life Investments is responsible for paying the subadvisory fee for the Portfolio. The Board also considered the financial resources of New York Life Investments and CBRE and acknowledged that New York Life Investments and CBRE must be in a position to recruit and retain experienced professional personnel and to maintain a strong financial position for New York Life Investments and CBRE to continue to provide high-quality services to the Portfolio. The Board recognized that the Portfolio benefits from the allocation of certain fixed costs among the funds in the MainStay Group of Funds, among other expected benefits resulting from its relationship with New York Life Investments.
The Board considered information regarding New York Life Investments’ methodology for calculating profitability and allocating costs provided by New York Life Investments in connection with the fund profitability analysis presented to the Board. The Board concluded that New York Life Investments’ methods for allocating costs and procedures for estimating overall profitability of the relationship with the funds in the MainStay Group of Funds were reasonable. The Board recognized the difficulty in calculating and evaluating a manager’s profitability with respect to the Portfolio and considered that other profitability methodologies may also be reasonable.
The Board also considered certain fall-out benefits that may be realized by New York Life Investments and its affiliates and CBRE and its affiliates due to their relationships with the Portfolio, including reputational and other indirect benefits. The Board recognized, for example, the benefits to CBRE from legally permitted “soft-dollar” arrangements by which brokers provide research and other services to CBRE in exchange for commissions paid by the Portfolio with respect to trades in the Portfolio’s portfolio securities. In this regard, the Board also requested and considered information from New York Life Investments concerning other material business relationships between CBRE and its affiliates and New York Life Investments and its affiliates and considered the existence of a strategic partnership between New York Life Investments and CBRE that relates to certain current and future products and represents a potential conflict of interest associated with New York Life Investments’ recommendation to approve the Subadvisory Agreement. In addition, the Board considered its review of the management agreement for a money market fund advised by New York Life Investments and an affiliated subadvisor that serves as an investment option for the Portfolio, including the potential rationale for and costs associated with investments in this money market fund by the Portfolio, if any, and considered information from New York Life Investments that the nature and type of specific investment advisory services provided to this money market fund are distinct from, or in addition to, the investment advisory services provided
Board Consideration and Approval of Management Agreement and Subadvisory Agreement (Unaudited) (continued)
to the Portfolio. In addition, the Board considered the potential dividend received tax deduction for insurance company affiliates of New York Life Investments from the Portfolio’s securities lending activity.
The Board noted that the Portfolio serves as an investment option primarily under variable contracts issued by affiliates of New York Life Investments that would receive fees under those contracts. The Board observed that, in addition to fees earned by New York Life Investments under the Management Agreement for managing the Portfolio, New York Life Investments’ affiliates also earn revenues from serving the Portfolio in various other capacities, including as the Portfolio’s distributor, and insurance companies affiliated with New York Life Investments would be entitled to receive fees from the Portfolio under a distribution and service plan adopted pursuant to Rule 12b-1 under the 1940 Act. The Board considered information about these other revenues and their impact on the profitability of the relationship with the Portfolio to New York Life Investments and its affiliates. The Board noted that, although it assessed the overall profitability of the relationship with the Portfolio to New York Life Investments and its affiliates as part of the contract review process, when considering the reasonableness of the fee paid to New York Life Investments under the Management Agreement, the Board considered the profitability of New York Life Investments’ relationship with the Portfolio on a pre-tax basis and without regard to distribution expenses incurred by New York Life Investments from its own resources.
After evaluating the information deemed relevant by the Trustees, the Board concluded that any profits realized by New York Life Investments and its affiliates due to their relationships with the Portfolio were not excessive, other expected benefits that may accrue to New York Life Investments and its affiliates are reasonable and other expected benefits that may accrue to CBRE and its affiliates are consistent with those expected for a subadvisor to a mutual fund. With respect to CBRE, the Board considered that any profits realized by CBRE due to its relationship with the Portfolio are the result of arm’s-length negotiations between New York Life Investments and CBRE, acknowledging that any such profits are based on the subadvisory fee paid to CBRE by New York Life Investments, not the Portfolio.
Management and Subadvisory Fees and Total Ordinary Operating Expenses
The Board evaluated the reasonableness of the fee paid under each of the Advisory Agreements and the Portfolio’s total ordinary operating expenses. With respect to the management fee and subadvisory fee, the Board primarily considered the reasonableness of the management fee paid by the Portfolio to New York Life Investments because the subadvisory fee paid to CBRE is paid by New York Life Investments, not the Portfolio. The Board also considered the reasonableness of the subadvisory fee paid by New York Life Investments and the amount of the management fee retained by New York Life Investments.
In assessing the reasonableness of the Portfolio’s fees and expenses, the Board primarily considered comparative data provided by ISS on the fees and expenses of similar mutual funds managed by other investment
advisers. The Board reviewed the methodology used by ISS to construct the group of peer funds for comparative purposes. In addition, the Board considered information provided by New York Life Investments and CBRE on fees charged to other investment advisory clients, including institutional separate accounts and/or other funds, that follow investment strategies similar to those of the Portfolio, if any. The Board considered the contractual management fee schedule for the Portfolio as compared to those for such other investment advisory clients, taking into account the rationale for differences in fee schedules. The Board also took into account information provided by New York Life Investments about the more extensive scope of services provided to registered investment companies, such as the Portfolio, as compared with other investment advisory clients. Additionally, the Board considered the impact of contractual breakpoints, voluntary waivers and expense limitation arrangements on the Portfolio’s net management fee and expenses. The Board also considered that in proposing fees for the Portfolio, New York Life Investments considers the competitive marketplace for mutual funds.
Based on the factors outlined above, among other considerations, the Board concluded that the Portfolio’s management fee and total ordinary operating expenses are within a range that is competitive and support a conclusion that these fees and expenses are reasonable.
Economies of Scale
The Board considered information regarding economies of scale, including whether economies of scale may exist with respect to the Portfolio and whether the Portfolio’s management fee and expense structure permits any economies of scale to be appropriately shared with the Portfolio’s shareholders. The Board also considered a report from New York Life Investments, previously prepared at the request of the Board, that addressed economies of scale, including with respect to the mutual fund business generally, and the various ways in which the benefits of economies of scale may be shared with the funds in the MainStay Group of Funds. Although the Board recognized the difficulty of determining economies of scale with precision, the Board acknowledged that economies of scale may be shared with the Portfolio in a number of ways, including, for example, through the imposition of fee breakpoints, initially setting management fee rates at scale or making additional investments to enhance the services provided to the Portfolio.
The Board reviewed information from New York Life Investments showing how the Portfolio’s management fee schedule compared to fee schedules of other funds and accounts managed by New York Life Investments. The Board also reviewed information from ISS showing how the Portfolio’s management fee schedule compared with fees paid for similar services by peer funds at varying asset levels.
Based on this information, the Board concluded that economies of scale are appropriately shared for the benefit of the Portfolio’s shareholders through the Portfolio’s management fee and expense structure and other methods to share benefits from economies of scale.
| 28 | MainStay VP CBRE Global Infrastructure Portfolio |
Conclusion
On the basis of the information and factors summarized above, among other information and factors deemed relevant by the Trustees, and the evaluation thereof, the Board, including the Independent Trustees voting separately, unanimously voted to approve the continuation of each of the Advisory Agreements.
Proxy Voting Policies and Procedures and Proxy Voting Record
The Portfolio is required to file with the SEC its proxy voting record for the 12-month period ending June 30 on Form N-PX. A description of the policies and procedures that are used to vote proxies relating to portfolio securities of the Portfolio is available free of charge upon request by calling 800-598-2019 or visiting the SEC's website at www.sec.gov. The most recent Form N-PX or proxy voting record is available free of charge upon request by calling 800-598-2019; visiting https://www.newyorklifeinvestments.com/investment-products/vp; or visiting the SEC’s website at www.sec.gov.
Shareholder Reports and Quarterly Portfolio Disclosure
The Portfolio is required to file its complete schedule of portfolio holdings with the SEC 60 days after its first and third fiscal quarter on Form N-PORT. The Portfolio's holdings report is available free of charge upon request by calling 800-598-2019 or by visiting the SEC’s website at www.sec.gov.
| 30 | MainStay VP CBRE Global Infrastructure Portfolio |
Board of Trustees and Officers (Unaudited)
The Trustees and officers of the Portfolio are listed below. The Board oversees the MainStay Group of Funds (which consists of MainStay Funds and MainStay Funds Trust), MainStay VP Funds Trust, MainStay MacKay DefinedTerm Municipal Opportunities Fund, MainStay CBRE Global Infrastructure Megatrends Term Fund, the Manager and the Subadvisors, and elects the officers of the Portfolios who are responsible for the day-to-day operations of the Portfolio. Information pertaining to the Trustees and officers is set forth below. Each Trustee serves until his or her successor is elected and qualified or until his or her resignation,
death or removal. Under the Board’s retirement policy, unless an exception is made, a Trustee must tender his or her resignation by the end of the calendar year during which he or she reaches the age of 75. Officers are elected annually by the Board. The business address of each Trustee and officer listed below is 51 Madison Avenue, New York, New York 10010. A majority of the Trustees are not “interested persons” (as defined by the 1940 Act and rules adopted by the SEC thereunder) of the Portfolio (“Independent Trustees”).
| | Name and
Year of Birth | Term of Office,
Position(s) Held and
Length of Service | Principal Occupation(s)
During Past Five Years | Number of
Portfolios in
Fund Complex
Overseen by
Trustee | Other Directorships
Held by Trustee |
| | | | | | |
| | Naïm Abou-Jaoudé*
1966 | MainStay VP Funds Trust: Trustee since 2023 | Chief Executive Officer of New York Life Investment Management LLC (since 2023). Chief Executive Officer of Candriam (an affiliate of New York Life Investment Management LLC) (2007 to 2023). | 81 | MainStay Funds: Trustee since 2023 (11 Funds)
MainStay Funds Trust: Trustee since 2023 (37 Funds);
MainStay MacKay DefinedTerm Municipal Opportunities Fund: Trustee since 2023;
MainStay CBRE Global Infrastructure Megatrends Term Fund: Trustee since 2023; and
New York Life Investment Management International (Chair) since 2015 |
| * | This Trustee is considered to be an “interested person” of the MainStay Group of Funds, MainStay VP Funds Trust, MainStay CBRE Global Infrastructure Megatrends Term Fund and MainStay MacKay DefinedTerm Municipal Opportunities Fund, within the meaning of the 1940 Act because of his affiliation with New York Life Investment Management LLC and Candriam, as described in detail above in the column entitled “Principal Occupation(s) During Past Five Years.” |
| | |
Board of Trustees and Officers (Unaudited) (continued)
| | Name and
Year of Birth | Term of Office,
Position(s) Held and
Length of Service | Principal Occupation(s)
During Past Five Years | Number of
Portfolios in
Fund Complex
Overseen by
Trustee | Other Directorships
Held by Trustee |
| | | | | | |
| | David H. Chow
1957 | MainStay VP Funds Trust: Trustee since January 2016, Advisory Board Member (June 2015 to December 2015) | Founder and CEO, DanCourt Management, LLC since 1999 | 81 | MainStay Funds: Trustee since January 2016, Advisory Board Member (June 2015 to December 2015) (11 Funds);
MainStay Funds Trust: Trustee since January 2016, Advisory Board Member (June 2015 to December 2015) (37 Funds);
MainStay MacKay DefinedTerm Municipal Opportunities Fund: Trustee since January 2016, Advisory Board Member (June 2015 to December 2015);
MainStay CBRE Global Infrastructure Megatrends Term Fund: Trustee since 2021;
VanEck Vectors Group of Exchange-Traded Funds: Trustee since 2006 and Independent Chairman of the Board of Trustees from 2008 to 2022 (57 portfolios); and
Berea College of Kentucky: Trustee since 2009, Chair of the Investment Committee since 2018 |
| | Karen Hammond
1956 | MainStay VP Funds Trust: Trustee since December 2021, Advisory Board Member (June 2021 to December 2021)
| Retired, Managing Director, Devonshire Investors (2007 to 2013); Senior Vice President, Fidelity Management & Research Co. (2005 to 2007); Senior Vice President and Corporate Treasurer, FMR Corp. (2003 to 2005); Chief Operating Officer, Fidelity Investments Japan (2001 to 2003) | 81 | MainStay Funds: Trustee since December 2021, Advisory Board Member (June 2021 to December 2021) (11 Funds);
MainStay Funds Trust: Trustee since December 2021, Advisory Board Member (June 2021 to December 2021) (37 Funds);
MainStay MacKay DefinedTerm Municipal Opportunities Fund: Trustee since December 2021, Advisory Board Member (June 2021 to December 2021);
MainStay CBRE Global Infrastructure Megatrends Term Fund: Trustee since December 2021, Advisory Board Member (June 2021 to December 2021);
Two Harbors Investment Corp.: Director since 2018;
Rhode Island State Investment Commission: Member since 2017; and
Blue Cross Blue Shield of Rhode Island: Director since 2019 |
| | Susan B. Kerley
1951 | MainStay VP Funds Trust: Chair since 2017 and Trustee since 2007** | President, Strategic Management Advisors LLC since 1990 | 81 | MainStay Funds: Chair since January 2017 and Trustee since 2007 (11 Funds); MainStay Funds Trust: Chair since January 2017 and Trustee since 1990 (37 Funds)***;
MainStay MacKay DefinedTerm Municipal Opportunities Fund: Chair since January 2017 and Trustee since 2011;
MainStay CBRE Global Infrastructure Megatrends Term Fund: Trustee since June 2021; and
Legg Mason Partners Funds: Trustee since 1991 (45 portfolios) |
| 32 | MainStay VP CBRE Global Infrastructure Portfolio |
| | Name and
Year of Birth | Term of Office,
Position(s) Held and
Length of Service | Principal Occupation(s)
During Past Five Years | Number of
Portfolios in
Fund Complex
Overseen by
Trustee | Other Directorships
Held by Trustee |
| | | | | | |
| | Alan R. Latshaw
1951 | MainStay VP Funds Trust: Trustee since 2007** | Retired; Partner, Ernst & Young LLP (2002 to 2003); Partner, Arthur Andersen LLP (1989 to 2002); Consultant to the MainStay Funds Audit and Compliance Committee (2004 to 2006) | 81 | MainStay Funds: Trustee since 2006 (11 Funds);
MainStay Funds Trust: Trustee since 2007 (37 Funds)***;
MainStay MacKay DefinedTerm Municipal Opportunities Fund: Trustee since 2011; and
MainStay CBRE Global Infrastructure Megatrends Term Fund: Trustee since June 2021 |
| | Jacques P. Perold
1958 | MainStay VP Funds Trust: Trustee since January 2016, Advisory Board Member (June 2015 to December 2015) | Founder and Chief Executive Officer, CapShift Advisors LLC (since 2018); President, Fidelity Management & Research Company (2009 to 2014); President and Chief Investment Officer, Geode Capital Management, LLC (2001 to 2009) | 81 | MainStay Funds: Trustee since January 2016, Advisory Board Member (June 2015 to December 2015) (11 Funds);
MainStay Funds Trust: Trustee since January 2016, Advisory Board Member (June 2015 to December 2015) (37 Funds);
MainStay MacKay DefinedTerm Municipal Opportunities Fund: Trustee since January 2016, Advisory Board Member (June 2015 to December 2015);
MainStay CBRE Global Infrastructure Megatrends Term Fund: Trustee since June 2021;
Allstate Corporation: Director since 2015;
Partners in Health: Trustee since 2019; and
MSCI Inc.: Director since 2017 |
| | Richard S. Trutanic
1952 | MainStay VP Funds Trust: Trustee since 2007** | Chairman and Chief Executive Officer, Somerset & Company (financial advisory firm) since 2004; Managing Director, The Carlyle Group (private investment firm) (2002 to 2004); Senior Managing Director, Partner and Board Member, Groupe Arnault S.A. (private investment firm) (1999 to 2002) | 81 | MainStay Funds: Trustee since 1994 (11 Funds);
MainStay Funds Trust: Trustee since 2007 (37 Funds)***;
MainStay MacKay DefinedTerm Municipal Opportunities Fund: Trustee since 2011; and
MainStay CBRE Global Infrastructure Megatrends Term Fund: Trustee since June 2021 |
| ** | Includes prior service as a Director of MainStay VP Series Fund, Inc., the predecessor to MainStay VP Funds Trust. |
| *** | Includes prior service as a Director/Trustee of certain predecessor entities to MainStay Funds Trust. |
Board of Trustees and Officers (Unaudited) (continued)
| | Name and
Year of Birth | Position(s) Held and
Length of Service | Principal Occupation(s)
During Past Five Years | |
| | | | | |
| | Kirk C. Lehneis
1974 | President, MainStay VP Funds Trust (since 2017) | Chief Operating Officer and Senior Managing Director (since 2016), New York Life Investment Management LLC and New York Life Investment Management Holdings LLC; Member of the Board of Managers (since 2017) and Senior Managing Director (since 2018), NYLIFE Distributors LLC; Chairman of the Board and Senior Managing Director, NYLIM Service Company LLC (since 2017); Trustee, President and Principal Executive Officer of IndexIQ Trust, IndexIQ ETF Trust and IndexIQ Active ETF Trust (since 2018); President, MainStay CBRE Global Infrastructure Megatrends Term Fund (since 2021), MainStay MacKay DefinedTerm Municipal Opportunities Fund, MainStay Funds and MainStay Funds Trust (since 2017); Senior Managing Director, Global Product Development (from 2015 to 2016); Managing Director, Product Development (from 2010 to 2015), New York Life Investment Management LLC | |
| | Jack R. Benintende
1964 | Treasurer and Principal Financial and Accounting Officer, MainStay VP Funds Trust (since 2007)** | Managing Director, New York Life Investment Management LLC (since 2007); Treasurer and Principal Financial and Accounting Officer, MainStay CBRE Global Infrastructure Megatrends Term Fund (since 2021), MainStay MacKay DefinedTerm Municipal Opportunities Fund (since 2011), MainStay Funds Trust (since 2009) and MainStay Funds (since 2007); and Assistant Treasurer, New York Life Investment Management Holdings LLC (2008 to 2012) | |
| | J. Kevin Gao
1967 | Secretary and Chief Legal Officer, MainStay VP Funds Trust (since 2010)** | Managing Director and Associate General Counsel, New York Life Investment Management LLC (since 2010); Secretary and Chief Legal Officer, MainStay CBRE Global Infrastructure Megatrends Term Fund (since 2021), MainStay MacKay DefinedTerm Municipal Opportunities Fund (since 2011), MainStay Funds and MainStay Funds Trust (since 2010) | |
| | Kevin M. Gleason
1967 | Vice President and Chief Compliance Officer, MainStay VP Funds Trust (since June 2022) | Vice President and Chief Compliance Officer, IndexIQ Trust, IndexIQ ETF Trust and IndexIQ Active ETF Trust (since June 2022); Vice President and Chief Compliance Officer, MainStay CBRE Global Infrastructure Megatrends Term Fund, MainStay MacKay DefinedTerm Municipal Opportunities Fund (since June 2022); MainStay Funds Trust and MainStay Funds (since June 2022); Senior Vice President, Voya Investment Management and Chief Compliance Officer, Voya Family of Funds (2012 to 2022) | |
| | Scott T. Harrington
1959 | Vice President— Administration, MainStay VP Funds Trust (since 2005)** | Managing Director, New York Life Investment Management LLC (including predecessor advisory organizations) (since 2000); Member of the Board of Directors, New York Life Trust Company (since 2009); Vice President—Administration, MainStay CBRE Global Infrastructure Megatrends Term Fund (since 2021), MainStay MacKay DefinedTerm Municipal Opportunities Fund (since 2011), MainStay Funds Trust and MainStay Funds (since 2009) | |
| * | The officers listed above are considered to be “interested persons” of the MainStay Group of Funds, MainStay VP Funds Trust, MainStay CBRE Global Infrastructure Megatrends Term Fund and MainStay MacKay DefinedTerm Municipal Opportunities Fund within the meaning of the 1940 Act because of their affiliation with the MainStay Group of Funds, New York Life Insurance Company and/or its affiliates, including New York Life Investment Management LLC, New York Life Insurance Company, NYLIM Service Company LLC, NYLIFE Securities LLC and/or NYLIFE Distributors LLC, as described in detail in the column captioned “Principal Occupation(s) During Past Five Years.” Officers are elected annually by the Board. |
| ** | Includes prior service as an Officer of MainStay VP Series Fund, Inc., the predecessor to MainStay VP Funds Trust. |
Officers of the Trust (Who are not Trustees)*
| 34 | MainStay VP CBRE Global Infrastructure Portfolio |
MainStay VP Portfolios
MainStay VP offers a wide range of Portfolios. The full array of MainStay VP offerings is listed here, with information about the manager, subadvisors, legal counsel, and independent registered public accounting firm.
Equity
MainStay VP American Century Sustainable Equity Portfolio
MainStay VP Candriam Emerging Markets Equity Portfolio
MainStay VP Epoch U.S. Equity Yield Portfolio
MainStay VP Fidelity Institutional AM® Utilities Portfolio†
MainStay VP Natural Resources Portfolio
MainStay VP PineStone International Equity Portfolio1
MainStay VP S&P 500 Index Portfolio
MainStay VP Small Cap Growth Portfolio
MainStay VP Wellington Growth Portfolio
MainStay VP Wellington Mid Cap Portfolio
MainStay VP Wellington Small Cap Portfolio
MainStay VP Wellington U.S. Equity Portfolio
MainStay VP Winslow Large Cap Growth Portfolio
Mixed Asset
MainStay VP Balanced Portfolio
MainStay VP Income Builder Portfolio
MainStay VP Janus Henderson Balanced Portfolio
MainStay VP MacKay Convertible Portfolio
Income
MainStay VP Bond Portfolio
MainStay VP Floating Rate Portfolio
MainStay VP Indexed Bond Portfolio
MainStay VP MacKay Government Portfolio2
MainStay VP MacKay High Yield Corporate Bond Portfolio
MainStay VP MacKay Strategic Bond Portfolio
MainStay VP PIMCO Real Return Portfolio
Money Market
MainStay VP U.S. Government Money Market Portfolio
Alternative
MainStay VP CBRE Global Infrastructure Portfolio
MainStay VP IQ Hedge Multi-Strategy Portfolio
Asset Allocation
MainStay VP Conservative Allocation Portfolio
MainStay VP Equity Allocation Portfolio
MainStay VP Growth Allocation Portfolio
MainStay VP Moderate Allocation Portfolio
Manager
New York Life Investment Management LLC
New York, New York
Subadvisors
American Century Investment Management, Inc.
Kansas City, Missouri
Brown Advisory LLC
Baltimore, Maryland
Candriam*
Strassen, Luxembourg
CBRE Investment Management Listed Real Assets LLC
Radnor, Pennsylvania
Epoch Investment Partners, Inc.
New York, New York
FIAM LLC
Smithfield, Rhode Island
IndexIQ Advisors LLC*
New York, New York
Janus Henderson Investors US LLC
Denver, Colorado
MacKay Shields LLC*
New York, New York
Newton Investment Management North America, LLC
Boston, Massachusetts
NYL Investors LLC*
New York, New York
Pacific Investment Management Company LLC
Newport Beach, California
PineStone Asset Management Inc.
Montreal, Québec
Segall Bryant & Hamill, LLC
Chicago, Illinois
Wellington Management Company LLP
Boston, Massachusetts
Winslow Capital Management, LLC
Minneapolis, Minnesota
Legal Counsel
Dechert LLP
Washington, District of Columbia
Independent Registered Public Accounting Firm
PricewaterhouseCoopers LLP
New York, New York
Distributor
NYLIFE Distributors LLC*
Jersey City, New Jersey
Custodian
JPMorgan Chase Bank, N.A.
New York, New York
Some Portfolios may not be available in all products.
† Fidelity Institutional AM is a registered trade mark of FMR LLC. Used with permission.
* An affiliate of New York Life Investment Management LLC.
| 1. | Prior to August 28, 2023, the Portfolio's name was MainStay VP MacKay International Equity Portfolio. |
| 2. | Effective on or about May 1, 2024, the MainStay VP MacKay Government Portfolio will be renamed the MainStay VP U.S. Infrastructure Bond Portfolio. |
Not part of the Annual Report
2023 Annual Report
This report is for the general information of New York Life Variable Annuities and NYLIAC Variable Universal Life Insurance Products policyowners. It must be preceded or accompanied by the appropriate product(s) and funds prospectuses if it is given to anyone who is not an owner of a New York Life variable annuity policy or a NYLIAC Variable Universal Life Insurance Product. This report does not offer for sale or solicit orders to purchase securities.
The performance data quoted in this report represents past performance. Past performance is no guarantee of future results. Due to market volatility and other factors, current performance may be lower or higher than the figures shown. The most recent month-end performance summary for your variable annuity or variable life policy is available by calling 800-598-2019 and is updated periodically on newyorklife.com.
The New York Life Variable Annuities and NYLIAC Variable Universal Life Insurance Products are issued by New York Life Insurance and Annuity Corporation (a Delaware Corporation) and distributed by NYLIFE Distributors LLC (Member FINRA/SIPC).
New York Life Insurance Company
New York Life Insurance and Annuity
Corporation (NYLIAC) (A Delaware Corporation)
51 Madison Avenue, Room 551
New York, NY 10010
newyorklife.com
newyorklifeinvestments.com
NYLIFE Distributors LLC, 30 Hudson Street, Jersey City, NJ 07302
New York Life Investment Management LLC is the investment manager to the MainStay VP Funds Trust
©2024 by NYLIFE Distributors LLC. All rights reserved.
You may obtain copies of the Prospectus and the Statement of Additional Information free of charge, upon request, by calling toll-free 800-598-2019 or writing to New York Life Insurance and Annuity Corporation, 51 Madison Avenue, New York, NY 10010.
| Not FDIC Insured | No Bank Guarantee | May Lose Value |
(NYLIAC) NI514
MainStay VP Fidelity Institutional AM® Utilities Portfolio*
Message from the President and Annual Report
December 31, 2023
Special Notice:
Beginning in July 2024, new regulations issued by the Securities and Exchange Commission (SEC) will take effect requiring open-end mutual fund companies and ETFs to (1) overhaul the content of their shareholder reports and (2) mail paper copies of the new tailored shareholder reports to shareholders who have not opted to receive these documents electronically.
If you have not yet elected to receive your shareholder reports electronically, please contact your financial intermediary or visit our website.
| Not FDIC/NCUA Insured | Not a Deposit | May Lose Value | No Bank Guarantee | Not Insured by Any Government Agency |
* Fidelity Institutional AM is a registered trade mark of FMR LLC. Used with permission.
This page intentionally left blank
Message from the President
Against a backdrop of easing inflationary pressures and continued economic growth, stocks and bonds generally gained ground during the 12-month period ended December 31, 2023, despite high levels of volatility and sharp disparities between the performance of the different market sectors.
Although the war in Ukraine, the outbreak of hostilities in the Middle East and several other notable events affected financial assets, inflation, interest rate, and economic growth trends stood at the forefront of market developments during most of the period. As the reporting period began, high levels of inflation already showed signs of easing in the face of aggressive rate hikes by U.S. Federal Reserve (the “Fed”). From a peak of 9.1% in June 2022, the annualized U.S. inflation rate dropped to 6.4% in January, and 3.4% in December 2023. At the same time, the Fed increased the benchmark federal funds rate from 4.25%–4.50% at the beginning of reporting period, to 5.25%–5.50% as of the end of 2023. Despite the increasing cost of capital and tighter lending environment that resulted from rising rates, economic growth remained surprisingly robust, bolstered by high levels of consumer spending, low levels of unemployment and better-than-expected corporate earnings. With the pace of rate increases slowing from the prior year, investors began hoping for an early shift to a looser monetary policy, with stock prices and bond yields reacting as economic data and statements from the Fed either reinforced or undercut those hopes. Following months of hawkish rhetoric, the Fed finally reversed its stance in December 2023, signaling a positive economic outlook with little chance of a recession and a likelihood of rate cuts in 2024.
The S&P 500® Index, a widely regarded benchmark of U.S. market performance, produced strong gains during the reporting period-– recovering all its losses from 2022 and approached new record territory. A preponderance of the Index’s gains were generated by a relatively small number of mega-cap stocks in the information technology, communication services and consumer discretionary sectors that stood to benefit from rapid developments in generative artificial intelligence (“AI”). Value-oriented, interest-rate sensitive and small-capitalization
shares lagged by significant margins, although market strength widened during the closing weeks of the reporting period. Most overseas equity markets trailed the U.S. market, as developed international economies experienced relatively low growth rates, and weak economic conditions in China undermined emerging markets.
Bonds produced generally positive returns, bolstered by attractive and relatively stable yields. The yield on the 10-year Treasury note hit a high of just under 5% in mid-October 2023, ranging between approximately 3.5% and 4.8% for most of the reporting period. The yield curve remained inverted throughout the year, with the 2-year Treasury yield modestly above the 10-year yield. Corporate bond prices trended moderately higher, generally outperforming government securities. After years of low yields and tight credit spreads, the corporate sector benefited from more attractive valuations and income opportunities. Among corporates, markets generally rewarded longer duration and lower credit quality, although an uptick in default rates posed added risks for high-yield corporate bonds. International bond markets produced mixed returns, with emerging-markets issues advancing over their developed-markets counterparts.
The market volatility of recent years reminds us of the constant need for experienced and steadfast portfolio management in the face of uncertainty. New York Life Investments remains dedicated to providing you, as a valued MainStay VP investor, with the guidance, resources and investment solutions you need to pursue your financial goals.
Thank you for trusting us to help meet your investment needs.
Sincerely,
Kirk C. Lehneis
President
The opinions expressed are as of the date of this report and are subject to change. There is no guarantee that any forecast made will come to pass. This material does not constitute investment advice and is not intended as an endorsement of any specific investment. Past performance is no guarantee of future results.
Not part of the Annual Report
Investors should refer to the Portfolio’s Summary Prospectus and/or Prospectus and consider the Portfolio’s investment objectives, strategies, risks, charges and expenses carefully before investing. The Summary Prospectus and/or Prospectus contain this and other information about the Portfolio. You may obtain copies of the Portfolio’s Summary Prospectus, Prospectus and Statement of Additional Information, which includes information about the MainStay VP Funds Trust's Trustees, free of charge, upon request, by calling toll-free 800-598-2019, by writing to New York Life Insurance and Annuity Corporation, 51 Madison Avenue, Room 251, New York, New York 10010 or by sending an email to MainStayShareholdersServices@nylim.com. These documents are also available at newyorklifeinvestments.com/investment-products/vp. Please read the Portfolio's Summary Prospectus and/or Prospectus carefully before investing. MainStay VP Funds Trust portfolios are separate account options which are purchased through a variable insurance or variable annuity contract.
Investment and Performance Comparison (Unaudited)
Performance data quoted represents past performance. Past performance is no guarantee of future results. Because of market volatility and other factors, current performance may be lower or higher than the figures shown. Investment return and principal value will fluctuate, and as a result, when shares are redeemed, they may be worth more or less than their original cost. The performance table and graph do not reflect any deduction of sales charges, mortality and expense charges, contract charges or administrative charges. Please refer to the Performance Summary appropriate for your policy. For performance information current to the most recent month-end, please call 800-598-2019 or visit www.newyorklife.com.
Performance figures may reflect certain fee waivers and/or expense limitations, without which total returns may have been different. For information on current fee waivers and/or expense limitations (if any), please refer to the Notes to Financial Statements.
| Average Annual Total Returns for the Year-Ended December 31, 2023 |
| Class | Inception
Date1 | One
Year | Five
Years | Ten
Years | Gross
Expense
Ratio2 |
| Initial Class Shares | 2/17/2012 | -1.46% | 8.41% | 6.42% | 0.66% |
| Service Class Shares | 2/17/2012 | -1.71 | 8.14 | 6.15 | 0.91 |
| 1. | The Portfolio replaced its subadvisor and modified its principal investment strategies and changed its classification from a diversified fund to a non-diversified fund as of November 30, 2018. Therefore, the performance information shown in this report prior to November 30, 2018 reflects the Portfolio’s prior subadvisor, principal investment strategies and diversification status. |
| 2. | The gross expense ratios presented reflect the Portfolio’s “Total Annual Portfolio Operating Expenses” from the most recent Prospectus, as supplemented, and may differ from other expense ratios disclosed in this report. |
| Benchmark Performance* | One
Year | Five
Years | Ten
Years |
| MSCI USA IMI Utilities 25/50 Index (Gross)1 | -7.37% | 6.46% | 8.64% |
| Morningstar Utilities Category Average2 | -4.36 | 6.18 | 7.35 |
| * | Returns for indices reflect no deductions for fees, expenses or taxes, except for foreign withholding taxes where applicable. Results assume reinvestment of all dividends and capital gains. An investment cannot be made directly in an index. |
| 1. | The MSCI USA IMI Utilities 25/50 Index (Gross) is the Portfolio's primary benchmark. The MSCI USA IMI Utilities 25/50 Index (Gross) is a modified market capitalization-weighted index of stocks designed to measure the performance of utilities companies in the MSCI U.S. Investable Market 2500 Index. |
| 2. | The Morningstar Utilities Category Average is representative of funds that seek capital appreciation by investing primarily in equity securities of U.S. or non-U.S. public utilities including electric, gas, and telephone-service providers. Results are based on average total returns of similar funds with all dividends and capital gain distributions reinvested. |
Cost in Dollars of a $1,000 Investment in MainStay VP Fidelity Institutional AM® Utilities Portfolio (Unaudited)
The example below is intended to describe the fees and expenses borne by shareholders during the six-month period from July 1, 2023 to December 31, 2023, and the impact of those costs on your investment.
Example
As a shareholder of the Portfolio you incur two types of costs: (1) transaction costs, including exchange fees and sales charges (loads) on purchases (as applicable), and (2) ongoing costs, including management fees, distribution and/or service (12b-1) fees and other Portfolio expenses (as applicable). This example is intended to help you understand your ongoing costs (in dollars) of investing in the Portfolio and to compare these costs with the ongoing costs of investing in other mutual funds. The example is based on an investment of $1,000 made at the beginning of the six-month period and held for the entire period from July 1, 2023 to December 31, 2023. Shares are only sold in connection with variable life and annuity contracts and the example does not reflect any contract level or transactional fees or expenses. If these costs had been included, your costs would have been higher.
This example illustrates your Portfolio’s ongoing costs in two ways:
Actual Expenses
The second and third data columns in the table below provide information about actual account values and actual expenses. You may use the information in these columns, together with the amount you invested, to estimate the expenses that you paid during the six months ended
December 31, 2023. Simply divide your account value by $1,000 (for example, an $8,600 account value divided by $1,000 = 8.6), then multiply the result by the number under the heading entitled “Expenses Paid During Period” to estimate the expenses you paid on your account during this period.
Hypothetical Example for Comparison Purposes
The fourth and fifth data columns in the table below provide information about hypothetical account values and hypothetical expenses based on the Portfolio’s actual expense ratio and an assumed rate of return of 5% per year before expenses, which is not the Portfolio’s actual return. The hypothetical account values and expenses may not be used to estimate the actual ending account balances or expenses you paid for the six-month period shown. You may use this information to compare the ongoing costs of investing in the Portfolio with the ongoing costs of investing in other mutual funds. To do so, compare this 5% hypothetical example with the 5% hypothetical examples that appear in the shareholder reports of the other mutual funds.
Please note that the expenses shown in the table are meant to highlight your ongoing costs only and do not reflect any transactional costs, such as exchange fees or sales charges (loads). Therefore, the fourth and fifth data columns of the table are useful in comparing ongoing costs only and will not help you determine the relative total costs of owning different funds. In addition, if these transactional costs were included, your costs would have been higher.
| Share Class | Beginning
Account
Value
7/1/23 | Ending Account
Value (Based
on Actual
Returns and
Expenses)
12/31/23 | Expenses
Paid
During
Period1 | Ending Account
Value (Based
on Hypothetical
5% Annualized
Return and
Actual Expenses)
12/31/23 | Expenses
Paid
During
Period1 | Net Expense
Ratio
During
Period2 |
| Initial Class Shares | $1,000.00 | $1,019.70 | $3.41 | $1,021.83 | $3.41 | 0.67% |
| Service Class Shares | $1,000.00 | $1,018.40 | $4.68 | $1,020.57 | $4.69 | 0.92% |
| 1. | Expenses are equal to the Portfolio’s annualized expense ratio of each class multiplied by the average account value over the period, divided by 365 and multiplied by 184 (to reflect the six-month period). The table above represents the actual expenses incurred during the six-month period. In addition to the fees and expenses which the Portfolio bears directly, it also indirectly bears a pro rata share of the fees and expenses of the underlying funds in which it invests. Such indirect expenses are not included in the above-reported expense figures. |
| 2. | Expenses are equal to the Portfolio's annualized expense ratio to reflect the six-month period. |
| 6 | MainStay VP Fidelity Institutional AM® Utilities Portfolio |
Industry Composition as of December 31, 2023 (Unaudited)
| Electric Utilities | 69.5% |
| Multi–Utilities | 19.2 |
| Independent Power and Renewable Electricity Producers | 7.3 |
| Water Utilities | 0.7 |
| Gas Utilities | 0.7 |
| Electrical Equipment | 0.2% |
| Short–Term Investments | 1.9 |
| Other Assets, Less Liabilities | 0.5 |
| | 100.0% |
See Portfolio of Investments beginning on page 10 for specific holdings within these categories. The Portfolio's holdings are subject to change.
Top Ten Holdings and/or Issuers Held as of December 31, 2023 (excluding short-term investments) (Unaudited)
| 1. | NextEra Energy, Inc. |
| 2. | Sempra |
| 3. | Southern Co. (The) |
| 4. | Duke Energy Corp. |
| 5. | PG&E Corp. |
| 6. | Edison International |
| 7. | Entergy Corp. |
| 8. | American Electric Power Co., Inc. |
| 9. | PPL Corp. |
| 10. | Constellation Energy Corp. |
Portfolio Management Discussion and Analysis (Unaudited)
Answers to the questions reflect the views of portfolio manager Douglas Simmons of FIAM LLC (“FIAM”), the Portfolio’s Subadvisor.
How did MainStay VP Fidelity Institutional AM® Utilities Portfolio1 perform relative to its benchmark and peers during the 12 months ended December 31, 2023?
For the 12 months ended December 31, 2023, MainStay VP Fidelity Institutional AM® Utilities Portfolio returned −1.46% for Initial Class shares and −1.71% for Service Class shares. Over the same period, both share classes outperformed the −7.37% return of the MSCI USA IMI Utilities 25/50 Index (Gross) (the “Index”), which is the Portfolio’s benchmark. For the 12 months ended December 31, 2023, both share classes also outperformed the −4.36% return of the Morningstar Utilities Category Average.2
What factors affected the Portfolio’s relative performance during the reporting period?
The Portfolio outperformed the Index primarily due to favorable security selection, most notably in the electric utilities subsector. Industry allocation, particularly overweight exposure to electric utilities, detracted slightly.
Which subsectors were the strongest positive contributors to the Portfolio’s relative performance, and which subsectors were particularly weak?
The strongest positive contributions to the Portfolio’s relative performance from a subsector standpoint came from electric utilities (the largest segment of the Index), driven by security selection. (Contributions take weightings and total returns into account.) The next two strongest contributors included independent power & renewable electricity producers and oil, gas & consumable fuels, resulting from security selection in both cases.
Electric utilities detracted most significantly from the Portfolio’s relative performance, due to overweight exposure. Overweight exposure to independent power & renewable electricity producers, and underweight exposure to multi-utilities, also detracted.
During the reporting period, which individual stocks made the strongest positive contributions to the Portfolio’s absolute performance and which stocks detracted the most?
On an absolute return basis, the three largest positive contributors to the Portfolio’s overall performance included Vistra Corp, NRG Energy and Sunnova Energy.
Independent power producer & electric provider Vistra Corp serves customers across multiple U.S. states, with a mix of traditional, renewable and nuclear energy. The company reported strong
performance, consistently exceeding earnings expectations throughout the reporting period. The company also closed a deal for Energy Harbor, which expanded its nuclear energy base.
Independent power producer & electric provider NRG Energy serves customers through its Texas, East, and West segments. The company reported strong earnings throughout 2023. However, we trimmed the Portfolio’s position following activist investor activity.
Shares in American residential and commercial solar energy company Sunnova Energy sold off significantly on concerns over the company’s fundamentals, and the Portfolio bought on weakness. Returns benefited from an upswing in the stock’s price following a slightly more positive earnings report in October 2023.
Conversely, the three most significant detractors from absolute performance included Nextera Energy Partners LP, Enphase Energy and Nextera Energy. The spin-off of Nextera Energy Partners LP from Nextera Energy weighed on the stocks of both companies. Enphase stock fell after the company reported lower-than-expected earnings and management lowered guidance, prompting us to sell the Portfolio’s position.
Did the Portfolio make any significant purchases or sales during the reporting period?
The Portfolio initiated a position in U.S.-based water utility American Water Works. Fidelity led a funding round in the company during the reporting period at a particularly favorable valuation. The Portfolio sold its position in diversified utility The AES Corporation early in 2023, but added the position back based on positive fundamentals in the second quarter. The Portfolio sold its position in European utility Enel after the company reached the top of our valuation range.
How did the Portfolio’s sector weightings change during the reporting period?
After having no exposure to water utilities for a long period, the Portfolio initiated a position in the industry through an allocation to American Water Works. We reduced the Portfolio’s overweight exposure to electric utilities during the reporting period, although the position remained significantly overweight. We also trimmed the Portfolio’s underweight exposure to multi-utilities.
How was the Portfolio positioned at the end of the reporting period?
As of December 31, 2023, the Portfolio’s most overweight positions relative to the Index were in electric utilities and
| 1. | Fidelity Institutional AM is a registered trademark of FMR LLC. Used with permission. |
| 2. | See "Investment and Performance Comparison" for more information on benchmark and peer group returns. |
| 8 | MainStay VP Fidelity Institutional AM® Utilities Portfolio |
independent power producers & energy traders. As of the same date, the Portfolio’s most significant underweight positions were in multi-utilities, gas utilities and water utilities.
The opinions expressed are those of the portfolio manager as of the date of this report and are subject to change. There is no guarantee that any forecasts will come to pass. This material does not constitute investment advice and is not intended as an endorsement of any specific investment.
Not all MainStay VP Portfolios and/or share classes are available under all policies.
Portfolio of Investments December 31, 2023†^
| | Shares | Value |
| Common Stocks 97.6% |
| Electric Utilities 69.5% |
| American Electric Power Co., Inc. | 465,500 | $ 37,807,910 |
| Constellation Energy Corp. | 310,968 | 36,349,050 |
| Duke Energy Corp. | 788,013 | 76,468,782 |
| Edison International | 648,537 | 46,363,910 |
| Entergy Corp. | 396,648 | 40,136,811 |
| Evergy, Inc. | 352,400 | 18,395,280 |
| Eversource Energy | 404,009 | 24,935,435 |
| FirstEnergy Corp. | 986,281 | 36,157,061 |
| Fortum OYJ | 180,000 | 2,595,166 |
| IDACORP, Inc. | 46,700 | 4,591,544 |
| NextEra Energy, Inc. | 2,160,560 | 131,232,414 |
| NRG Energy, Inc. | 118,880 | 6,146,096 |
| PG&E Corp. | 4,030,399 | 72,668,094 |
| Pinnacle West Capital Corp. | 102,989 | 7,398,730 |
| PPL Corp. | 1,393,569 | 37,765,720 |
| Southern Co. (The) | 1,115,421 | 78,213,320 |
| | | 657,225,323 |
| Electrical Equipment 0.2% |
| Sunrun, Inc. (a) | 109,900 | 2,157,337 |
| Gas Utilities 0.7% |
| Southwest Gas Holdings, Inc. | 23,100 | 1,463,385 |
| UGI Corp. | 217,795 | 5,357,757 |
| | | 6,821,142 |
| Independent Power and Renewable Electricity Producers 7.3% |
| AES Corp. (The) | 1,112,500 | 21,415,625 |
| Clearway Energy, Inc. | 84,500 | 2,161,510 |
| Energy Harbor Corp. (a) | 164,600 | 13,250,300 |
| NextEra Energy Partners LP | 259,768 | 7,899,545 |
| Sunnova Energy International, Inc. (a)(b) | 352,900 | 5,381,725 |
| Vistra Corp. | 476,710 | 18,362,869 |
| | | 68,471,574 |
| Multi-Utilities 19.2% |
| Consolidated Edison, Inc. | 153,600 | 13,972,992 |
| DTE Energy Co. | 209,900 | 23,143,574 |
| NiSource, Inc. | 1,168,284 | 31,017,940 |
| Public Service Enterprise Group, Inc. | 509,324 | 31,145,163 |
| Sempra | 1,092,886 | 81,671,371 |
| | | 180,951,040 |
| | Shares | | Value |
| |
| Water Utilities 0.7% |
| American Water Works Co., Inc. | 35,815 | | $ 4,727,222 |
| Essential Utilities, Inc. | 60,800 | | 2,270,880 |
| | | | 6,998,102 |
Total Common Stocks
(Cost $913,401,858) | | | 922,624,518 |
| Short-Term Investments 1.9% |
| Affiliated Investment Company 1.4% |
| MainStay U.S. Government Liquidity Fund, 5.235% (c) | 13,214,112 | | 13,214,112 |
| Unaffiliated Investment Companies 0.5% |
| BlackRock Liquidity FedFund, 5.374% (c)(d) | 2,000,000 | | 2,000,000 |
| Invesco Government & Agency Portfolio, 5.361% (c)(d) | 2,981,841 | | 2,981,841 |
| | | | 4,981,841 |
Total Short-Term Investments
(Cost $18,195,953) | | | 18,195,953 |
Total Investments
(Cost $931,597,811) | 99.5% | | 940,820,471 |
| Other Assets, Less Liabilities | 0.5 | | 4,476,722 |
| Net Assets | 100.0% | | $ 945,297,193 |
| † | Percentages indicated are based on Portfolio net assets. |
| ^ | Industry classifications may be different than those used for compliance monitoring purposes. |
| (a) | Non-income producing security. |
| (b) | All or a portion of this security was held on loan. As of December 31, 2023, the aggregate market value of securities on loan was $4,687,179. The Portfolio received cash collateral with a value of $4,981,841. (See Note 2(H)) |
| (c) | Current yield as of December 31, 2023. |
| (d) | Represents a security purchased with cash collateral received for securities on loan. |
The notes to the financial statements are an integral part of, and should be read in conjunction with, the financial statements.
| 10 | MainStay VP Fidelity Institutional AM® Utilities Portfolio |
Investments in Affiliates (in 000's)
Investments in issuers considered to be affiliate(s) of the Portfolio during the year ended December 31, 2023 for purposes of Section 2(a)(3) of the Investment Company Act of 1940, as amended, were as follows:
| Affiliated Investment Companies | Value,
Beginning
of Year | Purchases
at Cost | Proceeds
from
Sales | Net
Realized
Gain/(Loss)
on Sales | Change in
Unrealized
Appreciation/
(Depreciation) | Value,
End of
Year | Dividend
Income | Other
Distributions | Shares
End of
Year |
| MainStay U.S. Government Liquidity Fund | $ 19,414 | $ 285,431 | $ (291,631) | $ — | $ — | $ 13,214 | $ 528 | $ — | 13,214 |
The following is a summary of the fair valuations according to the inputs used as of December 31, 2023, for valuing the Portfolio’s assets:
| Description | Quoted
Prices in
Active
Markets for
Identical
Assets
(Level 1) | | Significant
Other
Observable
Inputs
(Level 2) | | Significant
Unobservable
Inputs
(Level 3) | | Total |
| Asset Valuation Inputs | | | | | | | |
| Investments in Securities (a) | | | | | | | |
| Common Stocks | $ 909,374,218 | | $ 13,250,300 | | $ — | | $ 922,624,518 |
| Short-Term Investments | | | | | | | |
| Affiliated Investment Company | 13,214,112 | | — | | — | | 13,214,112 |
| Unaffiliated Investment Companies | 4,981,841 | | — | | — | | 4,981,841 |
| Total Short-Term Investments | 18,195,953 | | — | | — | | 18,195,953 |
| Total Investments in Securities | $ 927,570,171 | | $ 13,250,300 | | $ — | | $ 940,820,471 |
| (a) | For a complete listing of investments and their industries, see the Portfolio of Investments. |
The notes to the financial statements are an integral part of, and should be read in conjunction with, the financial statements.
11
Statement of Assets and Liabilities as of December 31, 2023
| Assets |
Investment in unaffiliated securities, at value
(identified cost $918,383,699) including securities on loan of $4,687,179 | $927,606,359 |
Investment in affiliated investment companies, at value
(identified cost $13,214,112) | 13,214,112 |
Cash denominated in foreign currencies
(identified cost $30) | 31 |
| Receivables: | |
| Investment securities sold | 9,694,281 |
| Dividends | 1,910,493 |
| Portfolio shares sold | 143,162 |
| Securities lending | 1,201 |
| Other assets | 5,520 |
| Total assets | 952,575,159 |
| Liabilities |
| Cash collateral received for securities on loan | 4,981,841 |
| Payables: | |
| Investment securities purchased | 1,057,519 |
| Manager (See Note 3) | 510,558 |
| Portfolio shares redeemed | 496,387 |
| NYLIFE Distributors (See Note 3) | 152,800 |
| Professional fees | 50,540 |
| Custodian | 16,225 |
| Shareholder communication | 7,560 |
| Accrued expenses | 4,536 |
| Total liabilities | 7,277,966 |
| Net assets | $945,297,193 |
| Composition of Net Assets |
| Shares of beneficial interest outstanding (par value of $.001 per share) unlimited number of shares authorized | $ 88,497 |
| Additional paid-in-capital | 854,095,743 |
| | 854,184,240 |
| Total distributable earnings (loss) | 91,112,953 |
| Net assets | $945,297,193 |
| Initial Class | |
| Net assets applicable to outstanding shares | $222,112,066 |
| Shares of beneficial interest outstanding | 20,722,215 |
| Net asset value per share outstanding | $ 10.72 |
| Service Class | |
| Net assets applicable to outstanding shares | $723,185,127 |
| Shares of beneficial interest outstanding | 67,774,725 |
| Net asset value per share outstanding | $ 10.67 |
The notes to the financial statements are an integral part of, and should be read in conjunction with, the financial statements.
| 12 | MainStay VP Fidelity Institutional AM® Utilities Portfolio |
Statement of Operations for the year ended December 31, 2023
| Investment Income (Loss) |
| Income | |
| Dividends-unaffiliated (net of foreign tax withholding of $12,846) | $ 27,350,777 |
| Dividends-affiliated | 528,240 |
| Securities lending, net | 24,641 |
| Total income | 27,903,658 |
| Expenses | |
| Manager (See Note 3) | 6,207,596 |
| Distribution/Service—Service Class (See Note 3) | 1,908,495 |
| Professional fees | 134,773 |
| Custodian | 42,337 |
| Shareholder communication | 32,245 |
| Trustees | 21,275 |
| Miscellaneous | 30,515 |
| Total expenses | 8,377,236 |
| Net investment income (loss) | 19,526,422 |
| Realized and Unrealized Gain (Loss) |
| Net realized gain (loss) on: | |
| Unaffiliated investment transactions | 65,750,142 |
| Foreign currency transactions | 4,048 |
| Net realized gain (loss) | 65,754,190 |
| Net change in unrealized appreciation (depreciation) on: | |
| Unaffiliated investments | (104,738,214) |
| Translation of other assets and liabilities in foreign currencies | 7,673 |
| Net change in unrealized appreciation (depreciation) | (104,730,541) |
| Net realized and unrealized gain (loss) | (38,976,351) |
| Net increase (decrease) in net assets resulting from operations | $ (19,449,929) |
The notes to the financial statements are an integral part of, and should be read in conjunction with, the financial statements.
13
Statements of Changes in Net Assets
for the years ended December 31, 2023 and December 31, 2022
| | 2023 | 2022 |
| Increase (Decrease) in Net Assets |
| Operations: | | |
| Net investment income (loss) | $ 19,526,422 | $ 13,893,104 |
| Net realized gain (loss) | 65,754,190 | 143,420,705 |
| Net change in unrealized appreciation (depreciation) | (104,730,541) | (99,750,150) |
| Net increase (decrease) in net assets resulting from operations | (19,449,929) | 57,563,659 |
| Distributions to shareholders: | | |
| Initial Class | (35,326,559) | (13,874,720) |
| Service Class | (118,635,558) | (59,581,954) |
| Total distributions to shareholders | (153,962,117) | (73,456,674) |
| Capital share transactions: | | |
| Net proceeds from sales of shares | 90,808,057 | 83,467,996 |
| Net asset value of shares issued to shareholders in reinvestment of distributions | 153,962,117 | 73,456,674 |
| Cost of shares redeemed | (183,186,887) | (278,193,216) |
| Increase (decrease) in net assets derived from capital share transactions | 61,583,287 | (121,268,546) |
| Net increase (decrease) in net assets | (111,828,759) | (137,161,561) |
| Net Assets |
| Beginning of year | 1,057,125,952 | 1,194,287,513 |
| End of year | $ 945,297,193 | $1,057,125,952 |
The notes to the financial statements are an integral part of, and should be read in conjunction with, the financial statements.
| 14 | MainStay VP Fidelity Institutional AM® Utilities Portfolio |
Financial Highlights selected per share data and ratios
| | Year Ended December 31, |
| Initial Class | 2023 | | 2022 | | 2021 | | 2020 | | 2019 |
| Net asset value at beginning of year | $ 13.20 | | $ 13.58 | | $ 12.35 | | $ 13.49 | | $ 11.68 |
| Net investment income (loss) (a) | 0.27 | | 0.20 | | 0.31 | | 0.25 | | 0.31 |
| Net realized and unrealized gain (loss) | (0.69) | | 0.43 | | 1.73 | | (0.34) | | 2.39 |
| Total from investment operations | (0.42) | | 0.63 | | 2.04 | | (0.09) | | 2.70 |
| Less distributions: | | | | | | | | | |
| From net investment income | (0.26) | | (0.30) | | (0.28) | | (0.33) | | (0.34) |
| From net realized gain on investments | (1.80) | | (0.71) | | (0.53) | | (0.72) | | (0.55) |
| Total distributions | (2.06) | | (1.01) | | (0.81) | | (1.05) | | (0.89) |
| Net asset value at end of year | $ 10.72 | | $ 13.20 | | $ 13.58 | | $ 12.35 | | $ 13.49 |
| Total investment return (b) | (1.46)% | | 5.57% | | 17.24% | | (0.38)% | | 23.26% |
| Ratios (to average net assets)/Supplemental Data: | | | | | | | | | |
| Net investment income (loss) | 2.23% | | 1.46% | | 2.41% | | 2.06% | | 2.41% |
| Net expenses (c) | 0.67% | | 0.66% | | 0.66% | | 0.67% | | 0.68% |
| Portfolio turnover rate | 71% | | 53% | | 34% | | 62% | | 47% |
| Net assets at end of year (in 000's) | $ 222,112 | | $ 202,092 | | $ 215,594 | | $ 135,814 | | $ 97,503 |
| (a) | Per share data based on average shares outstanding during the year. |
| (b) | Total return does not reflect any deduction of sales charges, mortality and expense charges, contract charges or administrative charges. For periods of less than one year, total return is not annualized. |
| (c) | In addition to the fees and expenses which the Portfolio bears directly, it also indirectly bears a pro-rata share of the fees and expenses of the underlying funds in which it invests. Such indirect expenses are not included in the above expense ratios. |
| | Year Ended December 31, |
| Service Class | 2023 | | 2022 | | 2021 | | 2020 | | 2019 |
| Net asset value at beginning of year | $ 13.14 | | $ 13.51 | | $ 12.29 | | $ 13.43 | | $ 11.63 |
| Net investment income (loss) (a) | 0.24 | | 0.17 | | 0.27 | | 0.22 | | 0.28 |
| Net realized and unrealized gain (loss) | (0.69) | | 0.43 | | 1.72 | | (0.35) | | 2.37 |
| Total from investment operations | (0.45) | | 0.60 | | 1.99 | | (0.13) | | 2.65 |
| Less distributions: | | | | | | | | | |
| From net investment income | (0.22) | | (0.26) | | (0.24) | | (0.29) | | (0.30) |
| From net realized gain on investments | (1.80) | | (0.71) | | (0.53) | | (0.72) | | (0.55) |
| Total distributions | (2.02) | | (0.97) | | (0.77) | | (1.01) | | (0.85) |
| Net asset value at end of year | $ 10.67 | | $ 13.14 | | $ 13.51 | | $ 12.29 | | $ 13.43 |
| Total investment return (b) | (1.71)% | | 5.31% | | 16.95% | | (0.63)% | | 22.95% |
| Ratios (to average net assets)/Supplemental Data: | | | | | | | | | |
| Net investment income (loss) | 1.95% | | 1.22% | | 2.14% | | 1.80% | | 2.15% |
| Net expenses (c) | 0.92% | | 0.91% | | 0.91% | | 0.92% | | 0.93% |
| Portfolio turnover rate | 71% | | 53% | | 34% | | 62% | | 47% |
| Net assets at end of year (in 000's) | $ 723,185 | | $ 855,034 | | $ 978,694 | | $ 953,655 | | $ 1,121,657 |
| (a) | Per share data based on average shares outstanding during the year. |
| (b) | Total return does not reflect any deduction of sales charges, mortality and expense charges, contract charges or administrative charges. For periods of less than one year, total return is not annualized. |
| (c) | In addition to the fees and expenses which the Portfolio bears directly, it also indirectly bears a pro-rata share of the fees and expenses of the underlying funds in which it invests. Such indirect expenses are not included in the above expense ratios. |
The notes to the financial statements are an integral part of, and should be read in conjunction with, the financial statements.
15
Notes to Financial Statements
Note 1–Organization and Business
MainStay VP Funds Trust (the “Fund”) was organized as a Delaware statutory trust on February 1, 2011. The Fund is registered under the Investment Company Act of 1940, as amended (the “1940 Act”), as an open-end management investment company. The Fund is comprised of thirty-one separate series (collectively referred to as the “Portfolios”). These financial statements and notes relate to the MainStay VP Fidelity Institutional AM® Utilities Portfolio (the "Portfolio"), a "non-diversified” portfolio, as that term is defined in the 1940 Act, as interpreted or modified by regulatory authorities having jurisdiction, from time to time.
Shares of the Portfolio are currently offered to certain separate accounts to fund variable annuity policies and variable universal life insurance policies issued by New York Life Insurance and Annuity Corporation (“NYLIAC”), a wholly-owned subsidiary of New York Life Insurance Company (“New York Life”) and may also be offered to fund variable annuity policies and variable universal life insurance policies issued by other insurance companies. NYLIAC allocates shares of the Portfolio to, among others, certain NYLIAC separate accounts. Shares of the Portfolio are also offered to the MainStay VP Conservative Allocation Portfolio, MainStay VP Moderate Allocation Portfolio, MainStay VP Growth Allocation Portfolio and MainStay VP Equity Allocation Portfolio, which operate as “funds-of-funds," and other variable insurance funds.
The following table lists the Portfolio's share classes that have been registered and commenced operations:
| Class | Commenced Operations |
| Initial Class | February 17, 2012 |
| Service Class | February 17, 2012 |
Shares of the Portfolio are offered and are redeemed at a price equal to their respective net asset value (“NAV”) per share. No sales or redemption charge is applicable to the purchase or redemption of the Portfolio's shares. Under the terms of the Fund’s multiple class plan, adopted pursuant to Rule 18f-3 under the 1940 Act, the classes differ in that, among other things, Service Class shares of the Portfolio pay a combined distribution and service fee of 0.25% of average daily net assets attributable to Service Class shares of the Portfolio to the Distributor (as defined in Note 3(B)) pursuant to a plan adopted in accordance with Rule 12b-1 under the 1940 Act. Contract owners of variable annuity contracts purchased after June 2, 2003, are permitted to invest only in the Service Class shares.
The Portfolio's investment objective is to seek total return.
Note 2–Significant Accounting Policies
The Portfolio is an investment company and accordingly follows the investment company accounting and reporting guidance of the Financial Accounting Standards Board (“FASB”) Accounting Standards Codification Topic 946 Financial Services—Investment Companies. The Portfolio prepares its financial statements in accordance with generally accepted
accounting principles (“GAAP”) in the United States of America and follows the significant accounting policies described below.
(A) Securities Valuation. Investments are usually valued as of the close of regular trading on the New York Stock Exchange (the "Exchange") (usually 4:00 p.m. Eastern time) on each day the Portfolio is open for business ("valuation date").
Pursuant to Rule 2a-5 under the 1940 Act, the Board of Trustees of the Fund (the "Board") has designated New York Life Investment Management LLC (“New York Life Investments” or the "Manager") as its Valuation Designee (the "Valuation Designee"). The Valuation Designee is responsible for performing fair valuations relating to all investments in the Portfolio’s portfolio for which market quotations are not readily available; periodically assessing and managing material valuation risks; establishing and applying fair value methodologies; testing fair valuation methodologies; evaluating and overseeing pricing services; ensuring appropriate segregation of valuation and portfolio management functions; providing quarterly, annual and prompt reporting to the Board, as appropriate; identifying potential conflicts of interest; and maintaining appropriate records. The Valuation Designee has established a valuation committee ("Valuation Committee") to assist in carrying out the Valuation Designee’s responsibilities and establish prices of securities for which market quotations are not readily available. The Portfolio's and the Valuation Designee's policies and procedures ("Valuation Procedures") govern the Valuation Designee’s selection and application of methodologies for determining and calculating the fair value of Portfolio investments. The Valuation Designee may value the Portfolio's portfolio securities for which market quotations are not readily available and other Portfolio assets utilizing inputs from pricing services and other third-party sources. The Valuation Committee meets (in person, via electronic mail or via teleconference) on an ad-hoc basis to determine fair valuations and on a quarterly basis to review fair value events with respect to certain securities for which market quotations are not readily available, including valuation risks and back-testing results, and to preview reports to the Board.
The Valuation Committee establishes prices of securities for which market quotations are not readily available based on such methodologies and measurements on a regular basis after considering information that is reasonably available and deemed relevant by the Valuation Committee. The Board shall oversee the Valuation Designee and review fair valuation materials on a prompt, quarterly and annual basis and approve proposed revisions to the Valuation Procedures.
Investments for which market quotations are not readily available are valued at fair value as determined in good faith pursuant to the Valuation Procedures. A market quotation is readily available only when that quotation is a quoted price (unadjusted) in active markets for identical investments that the Portfolio can access at the measurement date, provided that a quotation will not be readily available if it is not reliable. "Fair value" is defined as the price the Portfolio would reasonably expect to receive upon selling an asset or liability in an orderly transaction to an independent buyer in the principal or most advantageous market for the
| 16 | MainStay VP Fidelity Institutional AM® Utilities Portfolio |
asset or liability. Fair value measurements are determined within a framework that establishes a three-tier hierarchy that maximizes the use of observable market data and minimizes the use of unobservable inputs to establish a classification of fair value measurements for disclosure purposes. "Inputs" refer broadly to the assumptions that market participants would use in pricing the asset or liability, including assumptions about risk, such as the risk inherent in a particular valuation technique used to measure fair value using a pricing model and/or the risk inherent in the inputs for the valuation technique. Inputs may be observable or unobservable. Observable inputs reflect the assumptions market participants would use in pricing the asset or liability based on market data obtained from sources independent of the Portfolio. Unobservable inputs reflect the Portfolio’s own assumptions about the assumptions market participants would use in pricing the asset or liability based on the information available. The inputs or methodology used for valuing assets or liabilities may not be an indication of the risks associated with investing in those assets or liabilities. The three-tier hierarchy of inputs is summarized below.
| • | Level 1—quoted prices (unadjusted) in active markets for an identical asset or liability |
| • | Level 2—other significant observable inputs (including quoted prices for a similar asset or liability in active markets, interest rates and yield curves, prepayment speeds, credit risk, etc.) |
| • | Level 3—significant unobservable inputs (including the Portfolio's own assumptions about the assumptions that market participants would use in measuring fair value of an asset or liability) |
The level of an asset or liability within the fair value hierarchy is based on the lowest level of an input, both individually and in the aggregate, that is significant to the fair value measurement. The aggregate value by input level of the Portfolio’s assets and liabilities as of December 31, 2023, is included at the end of the Portfolio of Investments.
The Portfolio may use third-party vendor evaluations, whose prices may be derived from one or more of the following standard inputs, among others:
| • Broker/dealer quotes | • Benchmark securities |
| • Two-sided markets | • Reference data (corporate actions or material event notices) |
| • Bids/offers | • Monthly payment information |
| • Industry and economic events | • Reported trades |
An asset or liability for which a market quotation is not readily available is valued by methods deemed reasonable in good faith by the Valuation Committee, following the Valuation Procedures to represent fair value. Under these procedures, the Valuation Designee generally uses a market-based approach which may use related or comparable assets or liabilities, recent transactions, market multiples, book values and other relevant information. The Valuation Designee may also use an income-based valuation approach in which the anticipated future cash flows of the asset or liability are discounted to calculate fair value.
Discounts may also be applied due to the nature and/or duration of any restrictions on the disposition of the asset or liability. Fair value represents a good faith approximation of the value of a security. Fair value determinations involve the consideration of a number of subjective factors, an analysis of applicable facts and circumstances and the exercise of judgment. As a result, it is possible that the fair value for a security determined in good faith in accordance with the Valuation Procedures may differ from valuations for the same security determined for other funds using their own valuation procedures. Although the Valuation Procedures are designed to value a security at the price the Portfolio may reasonably expect to receive upon the security's sale in an orderly transaction, there can be no assurance that any fair value determination thereunder would, in fact, approximate the amount that the Portfolio would actually realize upon the sale of the security or the price at which the security would trade if a reliable market price were readily available. During the year ended December 31, 2023, there were no material changes to the fair value methodologies.
Securities which may be valued in this manner include, but are not limited to: (i) a security for which trading has been halted or suspended or otherwise does not have a readily available market quotation on a given day; (ii) a debt security that has recently gone into default and for which there is not a current market quotation; (iii) a security of an issuer that has entered into a restructuring; (iv) a security that has been delisted from a national exchange; (v) a security subject to trading collars for which no or limited trading takes place; and (vi) a security whose principal market has been temporarily closed at a time when, under normal conditions, it would be open. Securities valued in this manner are generally categorized as Level 2 or 3 in the hierarchy.
Equity securities, rights and warrants, if applicable, are valued at the last quoted sales prices as of the close of regular trading on the relevant exchange on each valuation date. Securities that are not traded on the valuation date are valued at the mean of the last quoted bid and ask prices. Prices are normally taken from the principal market in which each security trades. These securities are generally categorized as Level 1 in the hierarchy.
Investments in mutual funds, including money market funds, are valued at their respective NAVs at the close of business each day on the valuation date. These securities are generally categorized as Level 1 in the hierarchy.
Temporary cash investments acquired in excess of 60 days to maturity at the time of purchase are valued using the latest bid prices or using valuations based on a matrix system (which considers such factors as security prices, yields, maturities and ratings), both as furnished by independent pricing services. Temporary cash investments that mature in 60 days or less at the time of purchase ("Short-Term Investments") are valued using the amortized cost method of valuation, unless the use of such method would be inappropriate. The amortized cost method involves valuing a security at its cost on the date of purchase and thereafter assuming a constant amortization to maturity of the difference between such cost and the value on maturity date. Amortized cost approximates
Notes to Financial Statements (continued)
the current fair value of a security. Securities valued using the amortized cost method are not valued using quoted prices in an active market and are generally categorized as Level 2 in the hierarchy.
The information above is not intended to reflect an exhaustive list of the methodologies that may be used to value portfolio investments. The Valuation Procedures permit the use of a variety of valuation methodologies in connection with valuing portfolio investments. The methodology used for a specific type of investment may vary based on the market data available or other considerations. The methodologies summarized above may not represent the specific means by which portfolio investments are valued on any particular business day.
(B) Income Taxes. The Portfolio's policy is to comply with the requirements of the Internal Revenue Code of 1986, as amended (the “Internal Revenue Code”), applicable to regulated investment companies and to distribute all of its taxable income to the shareholders of the Portfolio within the allowable time limits.
The Manager evaluates the Portfolio’s tax positions to determine if the tax positions taken meet the minimum recognition threshold in connection with accounting for uncertainties in income tax positions taken or expected to be taken for the purposes of measuring and recognizing tax liabilities in the financial statements. Recognition of tax benefits of an uncertain tax position is permitted only to the extent the position is “more likely than not” to be sustained assuming examination by taxing authorities. The Manager analyzed the Portfolio's tax positions taken on federal, state and local income tax returns for all open tax years (for up to three tax years) and has concluded that no provisions for federal, state and local income tax are required in the Portfolio's financial statements. The Portfolio's federal, state and local income tax and federal excise tax returns for tax years for which the applicable statutes of limitations have not expired are subject to examination by the Internal Revenue Service and state and local departments of revenue.
(C) Dividends and Distributions to Shareholders. Dividends and distributions are recorded on the ex-dividend date. The Portfolio intends to declare and pay dividends from net investment income and distributions from net realized capital and currency gains, if any, at least annually. All dividends and distributions are reinvested at NAV in the same class of shares of the Portfolio. Dividends and distributions to shareholders are determined in accordance with federal income tax regulations and may differ from determinations using GAAP.
(D) Security Transactions and Investment Income. The Portfolio records security transactions on the trade date. Realized gains and losses on security transactions are determined using the identified cost method. Dividend income is recognized on the ex-dividend date, net of any foreign tax withheld at the source, and interest income is accrued as earned using the effective interest rate method. Distributions received from real estate investment trusts may be classified as dividends, capital gains and/or return of capital.
Investment income and realized and unrealized gains and losses on investments of the Portfolio are allocated pro rata to the separate classes
of shares based upon their relative net assets on the date the income is earned or realized and unrealized gains and losses are incurred.
(E) Expenses. Expenses of the Fund are allocated to the individual Portfolios in proportion to the net assets of the respective Portfolios when the expenses are incurred, except where direct allocations of expenses can be made. Expenses (other than fees incurred under the distribution and service plans, further discussed in Note 3(B), which are charged directly to the Service Class shares) are allocated to separate classes of shares pro rata based upon their relative net assets on the date the expenses are incurred. The expenses borne by the Portfolio, including those of related parties to the Portfolio, are shown in the Statement of Operations.
Additionally, the Portfolio may invest in mutual funds, which are subject to management fees and other fees that may cause the costs of investing in mutual funds to be greater than the costs of owning the underlying securities directly. These indirect expenses of mutual funds are not included in the amounts shown as expenses in the Statement of Operations or in the expense ratios included in the Financial Highlights.
(F) Use of Estimates. In preparing financial statements in conformity with GAAP, the Manager makes estimates and assumptions that affect the reported amounts and disclosures in the financial statements. Actual results could differ from those estimates and assumptions.
(G) Foreign Currency Transactions. The Portfolio's books and records are maintained in U.S. dollars. Prices of securities denominated in foreign currency amounts are translated into U.S. dollars at the mean between the buying and selling rates last quoted by any major U.S. bank at the following dates:
(i) market value of investment securities, other assets and liabilities— at the valuation date; and
(ii) purchases and sales of investment securities, income and expenses—at the date of such transactions.
The assets and liabilities that are denominated in foreign currency amounts are presented at the exchange rates and market values at the close of the period. The realized and unrealized changes in net assets arising from fluctuations in exchange rates and market prices of securities are not separately presented.
Net realized gain (loss) on foreign currency transactions represents net currency gains or losses realized as a result of differences between the amounts of securities sale proceeds or purchase cost, dividends, interest and withholding taxes as recorded on the Portfolio's books, and the U.S. dollar equivalent amount actually received or paid. Net currency gains or losses from valuing such foreign currency denominated assets and liabilities, other than investments at valuation date exchange rates, are reflected in unrealized foreign exchange gains or losses.
(H) Securities Lending. In order to realize additional income, the Portfolio may engage in securities lending, subject to the limitations set forth in the 1940 Act and relevant guidance by the staff of the Securities
| 18 | MainStay VP Fidelity Institutional AM® Utilities Portfolio |
and Exchange Commission (“SEC”). If the Portfolio engages in securities lending, the Portfolio will lend through its custodian, JPMorgan Chase Bank, N.A., ("JPMorgan"), acting as securities lending agent on behalf of the Portfolio. Under the current arrangement, JPMorgan will manage the Portfolio's collateral in accordance with the securities lending agency agreement between the Portfolio and JPMorgan, and indemnify the Portfolio against counterparty risk. The loans will be collateralized by cash (which may be invested in a money market fund) and/or non-cash collateral (which may include U.S. Treasury securities and/or U.S. government agency securities issued or guaranteed by the United States government or its agencies or instrumentalities) at least equal at all times to the market value of the securities loaned. Non-cash collateral held at year end is segregated and cannot be transferred by the Portfolio. The Portfolio bears the risk of delay in recovery of, or loss of rights in, the securities loaned. The Portfolio may also record a realized gain or loss on securities deemed sold due to a borrower’s inability to return securities on loan. The Portfolio bears the risk of any loss on investment of cash collateral. The Portfolio will receive compensation for lending its securities in the form of fees or it will retain a portion of interest earned on the investment of any cash collateral. The Portfolio will also continue to receive interest and dividends on the securities loaned and any gain or loss in the market price of the securities loaned that may occur during the term of the loan will be for the account of the Portfolio. Income earned from securities lending activities, if any, is reflected in the Statement of Operations.
(I) Foreign Securities Risk. The Portfolio may invest in foreign securities, which carry certain risks that are in addition to the usual risks inherent in domestic securities. Foreign regulatory regimes and securities markets can have less stringent investor protections and disclosure standards and less liquid trading markets than U.S. regulatory regimes and securities markets, and can experience political, social and economic developments that may affect the value of investments in foreign securities. These risks include those resulting from currency fluctuations, future adverse political or economic developments and possible imposition of currency exchange blockages or other foreign governmental laws or restrictions. Economic sanctions and other similar governmental actions or developments could, among other things, effectively restrict or eliminate the Portfolio's ability to purchase or sell certain foreign securities or groups of foreign securities, and thus may make the Portfolio's investments in such securities less liquid or more difficult to value. These risks are likely to be greater in emerging markets than in developed markets. The ability of issuers of debt securities held by the Portfolio to meet their obligations may be affected by, among other things, economic or political developments in a specific country, industry or region.
(J) Indemnifications. Under the Fund’s organizational documents, its officers and trustees are indemnified against certain liabilities that may arise out of performance of their duties to the Fund. Additionally, in the normal course of business, the Portfolio enters into contracts with third-party service providers that contain a variety of representations and warranties and that may provide general indemnifications. The Portfolio's
maximum exposure under these arrangements is unknown, as this would involve future claims that may be made against the Portfolio that have not yet occurred. The Manager believes that the risk of loss in connection with these potential indemnification obligations is remote. However, there can be no assurance that material liabilities related to such obligations will not arise in the future, which could adversely impact the Portfolio.
Note 3–Fees and Related Party Transactions
(A) Manager and Subadvisor. New York Life Investments, a registered investment adviser and an indirect, wholly-owned subsidiary of New York Life, serves as the Portfolio’s Manager pursuant to an Amended and Restated Management Agreement (“Management Agreement”). The Manager provides offices, conducts clerical, recordkeeping and bookkeeping services, and keeps most of the financial and accounting records required to be maintained by the Portfolio. Except for the portion of salaries and expenses that are the responsibility of the Portfolio, the Manager pays the salaries and expenses of all personnel affiliated with the Portfolio and certain operational expenses of the Portfolio. The Portfolio reimburses New York Life Investments in an amount equal to the portion of the compensation of the Chief Compliance Officer attributable to the Portfolio. FIAM LLC (“FIAM" or the “Subadvisor”) a registered investment adviser, serves as Subadvisor to the Portfolio and is responsible for the day-to-day portfolio management of the Portfolio. Pursuant to the terms of a Subadvisory Agreement between New York Life Investments and FIAM, New York Life Investments pays for the services of the Subadvisor.
Pursuant to the Management Agreement, the Fund pays the Manager, on behalf of the Portfolio, a monthly fee for the services performed and the facilities furnished at an annual rate of the Portfolio's average daily net assets as follows: 0.64% up to $1 billion; 0.61% from $1 billion to $3 billion; and 0.60% in excess of $3 billion. During the year ended December 31, 2023, the effective management fee rate was 0.64% of the Portfolio's average daily net assets.
During the year ended December 31, 2023, New York Life Investments earned fees from the Portfolio in the amount of $6,207,596 and paid the Subadvisor in the amount of $2,476,517.
JPMorgan provides sub-administration and sub-accounting services to the Portfolio pursuant to an agreement with New York Life Investments. These services include calculating the daily NAVs of the Portfolio, maintaining the general ledger and sub-ledger accounts for the calculation of the Portfolio's NAVs, and assisting New York Life Investments in conducting various aspects of the Portfolio's administrative operations. For providing these services to the Portfolio, JPMorgan is compensated by New York Life Investments.
Pursuant to an agreement between the Fund and New York Life Investments, New York Life Investments is responsible for providing or procuring certain regulatory reporting services for the Portfolio. The Portfolio will reimburse New York Life Investments for the actual costs
Notes to Financial Statements (continued)
incurred by New York Life Investments in connection with providing or procuring these services for the Portfolio.
(B) Distribution and Service Fees. The Fund, on behalf of the Portfolio, has entered into a distribution agreement with NYLIFE Distributors LLC (the “Distributor”), an affiliate of New York Life Investments. The Portfolio has adopted a distribution plan (the “Plan”) in accordance with the provisions of Rule 12b-1 under the 1940 Act. Under the Plan, the Distributor has agreed to provide, through its affiliates or independent third parties, various distribution-related, shareholder and administrative support services to the Service Class shareholders. For its services, the Distributor is entitled to a combined distribution and service fee accrued daily and paid monthly at an annual rate of 0.25% of the average daily net assets attributable to the Service Class shares of the Portfolio.
Note 4-Federal Income Tax
As of December 31, 2023, the cost and unrealized appreciation (depreciation) of the Portfolio’s investment portfolio, including applicable derivative contracts and other financial instruments, as determined on a federal income tax basis, were as follows:
| | Federal Tax
Cost | Gross
Unrealized
Appreciation | Gross
Unrealized
(Depreciation) | Net
Unrealized
Appreciation/
(Depreciation) |
| Investments in Securities | $935,459,627 | $60,267,127 | $(54,906,283) | $5,360,844 |
As of December 31, 2023, the components of accumulated gain (loss) on a tax basis were as follows:
Ordinary
Income | Accumulated
Capital
and Other
Gain (Loss) | Other
Temporary
Differences | Unrealized
Appreciation
(Depreciation) | Total
Accumulated
Gain (Loss) |
| $20,314,084 | $65,451,878 | $— | $5,346,991 | $91,112,953 |
The difference between book-basis and tax-basis unrealized appreciation (depreciation) is primarily due to wash sale adjustments.
The following table discloses the current year reclassifications between total distributable earnings (loss) and additional paid-in capital arising from permanent differences; net assets as of December 31, 2023 were not affected.
| | Total
Distributable
Earnings (Loss) | Additional
Paid-In
Capital |
| | $462 | $(462) |
The reclassifications for the Portfolio are primarily due to partnership adjustments.
During the years ended December 31, 2023 and December 31, 2022, the tax character of distributions paid as reflected in the Statements of Changes in Net Assets was as follows:
| | 2023 | 2022 |
| Distributions paid from: | | |
| Ordinary Income | $ 25,879,043 | $23,960,588 |
| Long-Term Capital Gains | 128,083,074 | 49,496,086 |
| Total | $153,962,117 | $73,456,674 |
Note 5–Custodian
JPMorgan is the custodian of cash and securities held by the Portfolio. Custodial fees are charged to the Portfolio based on the Portfolio's net assets and/or the market value of securities held by the Portfolio and the number of certain transactions incurred by the Portfolio.
Note 6–Line of Credit
The Portfolio and certain other funds managed by New York Life Investments maintain a line of credit with a syndicate of banks in order to secure a source of funds for temporary purposes to meet unanticipated or excessive redemption requests.
Effective July 25, 2023, under the credit agreement (the “Credit Agreement”), the aggregate commitment amount is $600,000,000 with an additional uncommitted amount of $100,000,000. The commitment fee is an annual rate of 0.15% of the average commitment amount payable quarterly, regardless of usage, to JPMorgan, who serves as the agent to the syndicate. The commitment fee is allocated among the Portfolio and certain other funds managed by New York Life Investments based upon their respective net assets and other factors. Interest on any revolving credit loan is charged based upon the Federal Funds Rate, Daily Simple Secured Overnight Financing Rate ("SOFR") + 0.10%, or the Overnight Bank Funding Rate, whichever is higher. The Credit Agreement expires on July 23, 2024, although the Portfolio, certain other funds managed by New York Life Investments and the syndicate of banks may renew the Credit Agreement for an additional year on the same or different terms or enter into a credit agreement with a different syndicate of banks. Prior to July 25, 2023, the aggregate commitment amount and the commitment fee were the same as those under the current Credit Agreement. During the year ended December 31, 2023, there were no borrowings made or outstanding with respect to the Portfolio under the Credit Agreement.
Note 7–Interfund Lending Program
Pursuant to an exemptive order issued by the SEC, the Portfolio, along with certain other funds managed by New York Life Investments, may participate in an interfund lending program. The interfund lending program provides an alternative credit facility that permits the Portfolio and certain other funds managed by New York Life Investments to lend or borrow money for temporary purposes directly to or from one another, subject to the conditions of the exemptive order. During the year ended
| 20 | MainStay VP Fidelity Institutional AM® Utilities Portfolio |
December 31, 2023, there were no interfund loans made or outstanding with respect to the Portfolio.
Note 8–Purchases and Sales of Securities (in 000’s)
During the year ended December 31, 2023, purchases and sales of securities, other than short-term securities, were $677,116 and $749,160, respectively.
The Portfolio may purchase securities from or sell securities to other portfolios managed by the Subadvisor. These interportfolio transactions are primarily used for cash management purposes and are made pursuant to Rule 17a-7 under the 1940 Act. The Rule 17a-7 transactions during the year ended December 31, 2023, were as follows:
Purchases
(000's) | Sales
(000's) | Realized
Gain / (Loss)
(000's) |
| $4,275 | $23,961 | $1,094 |
Note 9–Capital Share Transactions
Transactions in capital shares for the years ended December 31, 2023 and December 31, 2022, were as follows:
| Initial Class | Shares | Amount |
| Year ended December 31, 2023: | | |
| Shares sold | 3,031,623 | $ 36,492,478 |
| Shares issued to shareholders in reinvestment of distributions | 3,657,334 | 35,326,559 |
| Shares redeemed | (1,273,025) | (14,354,261) |
| Net increase (decrease) | 5,415,932 | $ 57,464,776 |
| Year ended December 31, 2022: | | |
| Shares sold | 1,583,682 | $ 20,686,389 |
| Shares issued to shareholders in reinvestment of distributions | 1,176,971 | 13,874,720 |
| Shares redeemed | (3,335,783) | (45,895,265) |
| Net increase (decrease) | (575,130) | $ (11,334,156) |
| |
| Service Class | Shares | Amount |
| Year ended December 31, 2023: | | |
| Shares sold | 4,557,944 | $ 54,315,579 |
| Shares issued to shareholders in reinvestment of distributions | 12,330,897 | 118,635,558 |
| Shares redeemed | (14,170,338) | (168,832,626) |
| Net increase (decrease) | 2,718,503 | $ 4,118,511 |
| Year ended December 31, 2022: | | |
| Shares sold | 4,652,743 | $ 62,781,607 |
| Shares issued to shareholders in reinvestment of distributions | 5,074,648 | 59,581,954 |
| Shares redeemed | (17,109,749) | (232,297,951) |
| Net increase (decrease) | (7,382,358) | $(109,934,390) |
Note 10–Other Matters
As of the date of this report, the Portfolio faces a heightened level of risk associated with current uncertainty, volatility and state of economies, financial markets, rising interest rates, and labor and health conditions around the world. Events such as war, acts of terrorism, recessions, rapid inflation, the imposition of international sanctions, earthquakes, hurricanes, epidemics and pandemics and other unforeseen natural or human disasters may have broad adverse social, political and economic effects on the global economy, which could negatively impact the value of the Portfolio's investments. Developments that disrupt global economies and financial markets may magnify factors that affect the Portfolio's performance.
Note 11–Subsequent Events
In connection with the preparation of the financial statements of the Portfolio as of and for the year ended December 31, 2023, events and transactions subsequent to December 31, 2023, through the date the financial statements were issued, have been evaluated by the Manager for possible adjustment and/or disclosure. No subsequent events requiring financial statement adjustment or disclosure have been identified.
Report of Independent Registered Public Accounting Firm
To the Board of Trustees of MainStay VP Funds Trust and Shareholders of MainStay VP Fidelity Institutional AM® Utilities Portfolio
Opinion on the Financial Statements
We have audited the accompanying statement of assets and liabilities, including the portfolio of investments, of MainStay VP Fidelity Institutional AM® Utilities Portfolio (one of the portfolios constituting MainStay VP Funds Trust, referred to hereafter as the “Portfolio”) as of December 31, 2023, the related statement of operations for the year ended December 31, 2023, the statements of changes in net assets for each of the two years in the period ended December 31, 2023, including the related notes, and the financial highlights for each of the five years in the period ended December 31, 2023 (collectively referred to as the “financial statements”). In our opinion, the financial statements present fairly, in all material respects, the financial position of the Portfolio as of December 31, 2023, the results of its operations for the year then ended, the changes in its net assets for each of the two years in the period ended December 31, 2023 and the financial highlights for each of the five years in the period ended December 31, 2023 in conformity with accounting principles generally accepted in the United States of America.
Basis for Opinion
These financial statements are the responsibility of the Portfolio’s management. Our responsibility is to express an opinion on the Portfolio’s financial statements based on our audits. We are a public accounting firm registered with the Public Company Accounting Oversight Board (United States) (PCAOB) and are required to be independent with respect to the Portfolio in accordance with the U.S. federal securities laws and the applicable rules and regulations of the Securities and Exchange Commission and the PCAOB.
We conducted our audits of these financial statements in accordance with the standards of the PCAOB. Those standards require that we plan and perform the audit to obtain reasonable assurance about whether the financial statements are free of material misstatement, whether due to error or fraud.
Our audits included performing procedures to assess the risks of material misstatement of the financial statements, whether due to error or fraud, and performing procedures that respond to those risks. Such procedures included examining, on a test basis, evidence regarding the amounts and disclosures in the financial statements. Our audits also included evaluating the accounting principles used and significant estimates made by management, as well as evaluating the overall presentation of the financial statements. Our procedures included confirmation of securities owned as of December 31, 2023 by correspondence with the custodian, transfer agents and brokers; when replies were not received from brokers, we performed other auditing procedures. We believe that our audits provide a reasonable basis for our opinion.
/s/PricewaterhouseCoopers LLP
New York, New York
February 26, 2024
We have served as the auditor of one or more investment companies in the MainStay group of funds since 1984.
| 22 | MainStay VP Fidelity Institutional AM® Utilities Portfolio |
Board Consideration and Approval of Management Agreement and Subadvisory Agreement (Unaudited)
The continuation of the Management Agreement with respect to the MainStay VP Fidelity Institutional AM® Utilities Portfolio (“Portfolio”) and New York Life Investment Management LLC (“New York Life Investments”) and the Subadvisory Agreement between New York Life Investments and FIAM LLC (“FIAM”) with respect to the Portfolio (together, “Advisory Agreements”) is subject to annual review and approval by the Board of Trustees of MainStay VP Funds Trust (“Board” of the “Trust”) in accordance with Section 15 of the Investment Company Act of 1940, as amended (“1940 Act”). At its December 6–7, 2023 meeting, the Board, including the Trustees who are not an “interested person” (as such term is defined in the 1940 Act) of the Trust (“Independent Trustees”) voting separately, unanimously approved the continuation of each of the Advisory Agreements for a one-year period.
In reaching the decision to approve the continuation of each of the Advisory Agreements, the Board considered information and materials furnished by New York Life Investments and FIAM in connection with an annual contract review process undertaken by the Board that took place at meetings of the Board and its Contracts Committee from September 2023 through December 2023, including information and materials furnished by New York Life Investments and FIAM in response to requests prepared on behalf of the Board, and in consultation with the Independent Trustees, by independent legal counsel to the Independent Trustees, which encompassed a variety of topics, including those summarized below. Information and materials requested by and furnished to the Board for consideration in connection with the contract review process included, among other items, reports on the Portfolio and “peer funds” prepared by Institutional Shareholder Services Inc. (“ISS”), an independent third-party service provider engaged by the Board to report objectively on the Portfolio’s investment performance, management fee and total expenses. The Board also considered information on the fees charged to other investment advisory clients of New York Life Investments and/or FIAM that follow investment strategies similar to those of the Portfolio, if any, and, when applicable, the rationale for differences in the Portfolio’s management and subadvisory fees and the fees charged to those other investment advisory clients. In addition, the Board considered information regarding the legal standards and fiduciary obligations applicable to its consideration of the continuation of each of the Advisory Agreements. The contract review process, including the structure and format for information and materials provided to the Board, has been developed in consultation with the Board. The Independent Trustees also met in executive sessions with their independent legal counsel and, for portions thereof, with senior management of New York Life Investments.
The Board’s deliberations with respect to the continuation of each of the Advisory Agreements reflect a year-long process, and the Board also took into account information furnished to the Board and its Committees throughout the year, as deemed relevant and appropriate by the Trustees, including, among other items, reports on investment performance of the Portfolio and investment-related matters for the Portfolio as well as presentations from New York Life Investments and, generally annually, FIAM personnel. In addition, the Board took into account other information provided by New York Life Investments throughout the year,
including, among other items, periodic reports on legal and compliance matters, risk management, portfolio turnover, brokerage commissions and non-advisory services provided to the Portfolio by New York Life Investments, as deemed relevant and appropriate by the Trustees.
In addition to information provided to the Board throughout the year, the Board received information in connection with its June 2023 meeting provided specifically in response to requests prepared on behalf of the Board, and in consultation with the Independent Trustees, by independent legal counsel to the Independent Trustees regarding the Portfolio’s distribution arrangements. In addition, the Board received information regarding the Portfolio’s asset levels, share purchase and redemption activity and the payment of Rule 12b-1 and/or certain other fees by the applicable share classes of the Portfolio, among other information.
In considering the continuation of each of the Advisory Agreements, the Trustees reviewed and evaluated the information and factors they believed to reasonably be necessary and appropriate in light of legal advice furnished to them by independent legal counsel to the Independent Trustees and through the exercise of their own business judgment. Although individual Trustees may have weighed certain factors or information differently and the Board did not consider any single factor or information controlling in reaching its decision, the factors that figured prominently in the Board’s consideration of the continuation of each of the Advisory Agreements are summarized in more detail below and include, among other factors: (i) the nature, extent and quality of the services provided to the Portfolio by New York Life Investments and FIAM; (ii) the qualifications of the portfolio manager of the Portfolio and the historical investment performance of the Portfolio, New York Life Investments and FIAM; (iii) the costs of the services provided, and profits realized, by New York Life Investments and FIAM with respect to their relationships with the Portfolio; (iv) the extent to which economies of scale have been realized or may be realized if the Portfolio grows and the extent to which any economies of scale have been shared, have benefited or may benefit the Portfolio’s shareholders; and (v) the reasonableness of the Portfolio’s management and subadvisory fees and total ordinary operating expenses. Although the Board recognized that comparisons between the Portfolio’s fees and expenses and those of other funds are imprecise given different terms of agreements, variations in fund strategies and other factors, the Board considered the reasonableness of the Portfolio’s management fee and total ordinary operating expenses as compared to the peer funds identified by ISS. Throughout their considerations, the Trustees acknowledged the commitment of New York Life Investments and its affiliates to serve the MainStay Group of Funds, as well as their capacity, experience, resources, financial stability and reputations. The Trustees also acknowledged the entrepreneurial and other risks assumed by New York Life Investments in sponsoring and managing the Portfolio. With respect to the Subadvisory Agreement, the Board took into account New York Life Investments’ recommendation to approve the continuation of the Subadvisory Agreement.
The Trustees noted that, throughout the year, the Trustees are afforded an opportunity to ask questions of, and request additional information or materials from, New York Life Investments and FIAM. The Board’s
Board Consideration and Approval of Management Agreement and Subadvisory Agreement (Unaudited) (continued)
decision with respect to each of the Advisory Agreements may have also been based, in part, on the Board’s knowledge of New York Life Investments and FIAM resulting from, among other things, the Board’s consideration of each of the Advisory Agreements in prior years, the advisory agreements for other funds in the MainStay Group of Funds, the Board’s review throughout the year of the performance and operations of other funds in the MainStay Group of Funds and each Trustee’s business judgment and industry experience. In addition to considering the above-referenced factors, the Board observed that in the marketplace, notably under variable life insurance policies and variable annuity contracts for which the Portfolio serves as an investment option, there are a range of investment options available to investors and that the Portfolio’s shareholders, having had the opportunity to consider other investment options, have invested in the Portfolio.
The factors that figured prominently in the Board’s decision to approve the continuation of each of the Advisory Agreements during the Board’s December 6–7, 2023 meeting are summarized in more detail below.
Nature, Extent and Quality of Services Provided by New York Life Investments and FIAM
The Board examined the nature, extent and quality of the services that New York Life Investments provides to the Portfolio. The Board evaluated New York Life Investments’ experience and capabilities in serving as manager of the Portfolio and considered that the Portfolio operates in a “manager-of-managers” structure. The Board also considered New York Life Investments’ responsibilities and services provided pursuant to this structure, including overseeing the services provided by FIAM, evaluating the performance of FIAM, making recommendations to the Board as to whether the Subadvisory Agreement should be renewed, modified or terminated and periodically reporting to the Board regarding the results of New York Life Investments’ evaluation and monitoring functions. The Board noted that New York Life Investments manages other mutual funds, serves a variety of other investment advisory clients, including other pooled investment vehicles, and has experience overseeing mutual fund service providers, including subadvisors. The Board considered the experience of senior personnel at New York Life Investments providing management and administrative and other non-advisory services to the Portfolio. The Board observed that New York Life Investments devotes significant resources and time to providing management and administrative and other non-advisory services to the Portfolio, including New York Life Investments’ oversight and due diligence reviews of FIAM and ongoing analysis of, and interactions with, FIAM with respect to, among other things, the Portfolio’s investment performance and risks as well as FIAM’s investment capabilities and subadvisory services with respect to the Portfolio.
The Board also considered the range of services that New York Life Investments provides to the Portfolio under the terms of the Management Agreement, including: (i) fund accounting and ongoing supervisory services provided by New York Life Investments’ Fund Administration and Accounting Group; (ii) investment supervisory and analytical services provided by New York Life Investments’ Investment Consulting Group; (iii)
compliance services provided by the Trust’s Chief Compliance Officer as well as New York Life Investments’ compliance department, including supervision and implementation of the Portfolio’s compliance program; (iv) legal services provided by New York Life Investments’ Office of the General Counsel; and (v) risk management monitoring and analysis by compliance and investment personnel. In addition, the Board considered New York Life Investments’ willingness to invest in personnel and other resources, such as cyber security, information security and business continuity planning, that may benefit the Portfolio and noted that New York Life Investments is responsible for compensating the Trust’s officers, except for a portion of the salary of the Trust’s Chief Compliance Officer. The Board recognized that New York Life Investments provides certain other non-advisory services to the Portfolio and has over time provided an increasingly broad array of non-advisory services to the MainStay Group of Funds as a result of regulatory and other developments.
The Board also examined the range, and the nature, extent and quality, of the investment advisory services that FIAM provides to the Portfolio and considered the terms of each of the Advisory Agreements. The Board evaluated FIAM’s experience and performance in serving as subadvisor to the Portfolio and advising other portfolios and FIAM’s track record and experience in providing investment advisory services as well as the experience of investment advisory, senior management and administrative personnel at FIAM. The Board considered New York Life Investments’ and FIAM’s overall resources, legal and compliance environment, capabilities, reputation, financial condition and history. In addition to information provided in connection with quarterly meetings with the Trust’s Chief Compliance Officer, the Board considered information regarding the compliance policies and procedures of New York Life Investments and FIAM and acknowledged their commitment to further developing and strengthening compliance programs that may relate to the Portfolio. The Board also considered FIAM’s ability to recruit and retain qualified investment professionals and willingness to invest in personnel and other resources that may benefit the Portfolio. In this regard, the Board considered the qualifications and experience of the Portfolio’s portfolio manager, the number of accounts managed by the portfolio manager and the method for compensating the portfolio manager.
In addition, the Board considered information provided by New York Life Investments and FIAM regarding their respective business continuity and disaster recovery plans.
Based on these considerations, among others, the Board concluded that the Portfolio would likely continue to benefit from the nature, extent and quality of these services.
Investment Performance
In evaluating the Portfolio’s investment performance, the Board considered investment performance results over various periods in light of the Portfolio’s investment objective, strategies and risks. The Board considered investment reports on, and analysis of, the Portfolio’s performance provided to the Board throughout the year. These reports include, among other items, information on the Portfolio’s gross and net
| 24 | MainStay VP Fidelity Institutional AM® Utilities Portfolio |
returns, the Portfolio’s investment performance compared to a relevant investment category and the Portfolio’s benchmark, the Portfolio’s risk-adjusted investment performance and the Portfolio’s investment performance as compared to peer funds, as appropriate, as well as portfolio attribution information and commentary on the effect of market conditions. The Board also considered information provided by ISS showing the investment performance of the Portfolio as compared to peer funds. In addition, the Board reviewed the methodology used by ISS to construct the group of peer funds for comparative purposes.
The Board also took into account its discussions with senior management at New York Life Investments concerning the Portfolio’s investment performance over various periods as well as discussions between representatives of FIAM and the members of the Board’s Investment Committee, which generally occur on an annual basis.
Based on these considerations, among others, the Board concluded that its review of the Portfolio’s investment performance and related information supported a determination to approve the continuation of each of the Advisory Agreements.
Costs of the Services Provided, and Profits and Other Benefits Realized, by New York Life Investments and FIAM
The Board considered the costs of the services provided under each of the Advisory Agreements. The Board also considered the profitability of New York Life Investments and its affiliates and FIAM due to their relationships with the Portfolio as well as by New York Life Investments and its affiliates due to their relationships with the MainStay Group of Funds. With respect to the profitability of FIAM’s relationship with the Portfolio, the Board considered information from New York Life Investments that FIAM’s subadvisory fee reflected an arm’s-length negotiation and that this fee is paid by New York Life Investments, not the Portfolio, and the relevance of FIAM’s profitability was considered by the Trustees in that context. On this basis, the Board primarily considered the costs and profitability for New York Life Investments and its affiliates with respect to the Portfolio.
In addition, the Board acknowledged the difficulty in obtaining reliable comparative data about mutual fund managers’ profitability because such information generally is not publicly available and may be impacted by numerous factors, including the structure of a fund manager’s organization, the types of funds it manages, the methodology used to allocate certain fixed costs to specific funds and the manager’s capital structure and costs of capital.
In evaluating the costs of the services provided by New York Life Investments and FIAM, and profitability of New York Life Investments and its affiliates and FIAM due to their relationships with the Portfolio, the Board considered, among other factors, New York Life Investments’ and its affiliates’ and FIAM’s continuing investments in, or willingness to invest in, personnel and other resources that may support and further enhance the management of the Portfolio, and that New York Life Investments is responsible for paying the subadvisory fee for the Portfolio. The Board also considered the financial resources of New York Life Investments and
FIAM and acknowledged that New York Life Investments and FIAM must be in a position to recruit and retain experienced professional personnel and to maintain a strong financial position for New York Life Investments and FIAM to continue to provide high-quality services to the Portfolio. The Board recognized that the Portfolio benefits from the allocation of certain fixed costs among the funds in the MainStay Group of Funds, among other expected benefits resulting from its relationship with New York Life Investments.
The Board considered information regarding New York Life Investments’ methodology for calculating profitability and allocating costs provided by New York Life Investments in connection with the fund profitability analysis presented to the Board. The Board concluded that New York Life Investments’ methods for allocating costs and procedures for estimating overall profitability of the relationship with the funds in the MainStay Group of Funds were reasonable. The Board recognized the difficulty in calculating and evaluating a manager’s profitability with respect to the Portfolio and considered that other profitability methodologies may also be reasonable.
The Board also considered certain fall-out benefits that may be realized by New York Life Investments and its affiliates and FIAM and its affiliates due to their relationships with the Portfolio, including reputational and other indirect benefits. The Board recognized, for example, the benefits to FIAM from legally permitted “soft-dollar” arrangements by which brokers provide research and other services to FIAM in exchange for commissions paid by the Portfolio with respect to trades in the Portfolio’s portfolio securities. In this regard, the Board also requested and considered information from New York Life Investments concerning other material business relationships between FIAM and its affiliates and New York Life Investments and its affiliates that relates to certain current and future products and represents a potential conflict of interest associated with New York Life Investments’ recommendation to approve the Subadvisory Agreement. In addition, the Board considered its review of the management agreement for a money market fund advised by New York Life Investments and an affiliated subadvisor that serves as an investment option for the Portfolio, including the potential rationale for and costs associated with investments in this money market fund by the Portfolio, if any, and considered information from New York Life Investments that the nature and type of specific investment advisory services provided to this money market fund are distinct from, or in addition to, the investment advisory services provided to the Portfolio. In addition, the Board considered the potential dividend received tax deduction for insurance company affiliates of New York Life Investments from the Portfolio’s securities lending activity.
The Board noted that the Portfolio serves as an investment option primarily under variable contracts issued by affiliates of New York Life Investments that would receive fees under those contracts. The Board observed that, in addition to fees earned by New York Life Investments under the Management Agreement for managing the Portfolio, New York Life Investments’ affiliates also earn revenues from serving the Portfolio in various other capacities, including as the Portfolio’s distributor, and insurance companies affiliated with New York Life Investments would be
Board Consideration and Approval of Management Agreement and Subadvisory Agreement (Unaudited) (continued)
entitled to receive fees from the Portfolio under a distribution and service plan adopted pursuant to Rule 12b-1 under the 1940 Act. The Board considered information about these other revenues and their impact on the profitability of the relationship with the Portfolio to New York Life Investments and its affiliates. The Board noted that, although it assessed the overall profitability of the relationship with the Portfolio to New York Life Investments and its affiliates as part of the contract review process, when considering the reasonableness of the fee paid to New York Life Investments under the Management Agreement, the Board considered the profitability of New York Life Investments’ relationship with the Portfolio on a pre-tax basis and without regard to distribution expenses incurred by New York Life Investments from its own resources.
After evaluating the information deemed relevant by the Trustees, the Board concluded that any profits realized by New York Life Investments and its affiliates due to their relationships with the Portfolio were not excessive, other expected benefits that may accrue to New York Life Investments and its affiliates are reasonable and other expected benefits that may accrue to FIAM and its affiliates are consistent with those expected for a subadvisor to a mutual fund. With respect to FIAM, the Board considered that any profits realized by FIAM due to its relationship with the Portfolio are the result of arm’s-length negotiations between New York Life Investments and FIAM, acknowledging that any such profits are based on the subadvisory fee paid to FIAM by New York Life Investments, not the Portfolio.
Management and Subadvisory Fees and Total Ordinary Operating Expenses
The Board evaluated the reasonableness of the fee paid under each of the Advisory Agreements and the Portfolio’s total ordinary operating expenses. With respect to the management fee and subadvisory fee, the Board primarily considered the reasonableness of the management fee paid by the Portfolio to New York Life Investments because the subadvisory fee paid to FIAM is paid by New York Life Investments, not the Portfolio. The Board also considered the reasonableness of the subadvisory fee paid by New York Life Investments and the amount of the management fee retained by New York Life Investments.
In assessing the reasonableness of the Portfolio’s fees and expenses, the Board primarily considered comparative data provided by ISS on the fees and expenses of similar mutual funds managed by other investment advisers. The Board reviewed the methodology used by ISS to construct the group of peer funds for comparative purposes. In addition, the Board considered information provided by New York Life Investments and FIAM on fees charged to other investment advisory clients, including institutional separate accounts and/or other funds, that follow investment strategies similar to those of the Portfolio, if any. The Board considered the contractual management fee schedule for the Portfolio as compared to those for such other investment advisory clients, taking into account the rationale for differences in fee schedules. The Board also took into account information provided by New York Life Investments about the more extensive scope of services provided to registered investment companies, such as the Portfolio, as compared with other investment
advisory clients. Additionally, the Board considered the impact of contractual breakpoints and voluntary waivers on the Portfolio’s net management fee and expenses. The Board also considered that in proposing fees for the Portfolio, New York Life Investments considers the competitive marketplace for mutual funds.
Based on the factors outlined above, among other considerations, the Board concluded that the Portfolio’s management fee and total ordinary operating expenses are within a range that is competitive and support a conclusion that these fees and expenses are reasonable.
Economies of Scale
The Board considered information regarding economies of scale, including whether economies of scale may exist with respect to the Portfolio and whether the Portfolio’s management fee and expense structure permits any economies of scale to be appropriately shared with the Portfolio’s shareholders. The Board also considered a report from New York Life Investments, previously prepared at the request of the Board, that addressed economies of scale, including with respect to the mutual fund business generally, and the various ways in which the benefits of economies of scale may be shared with the funds in the MainStay Group of Funds. Although the Board recognized the difficulty of determining economies of scale with precision, the Board acknowledged that economies of scale may be shared with the Portfolio in a number of ways, including, for example, through the imposition of fee breakpoints, initially setting management fee rates at scale or making additional investments to enhance the services provided to the Portfolio. The Board reviewed information from New York Life Investments showing how the Portfolio’s management fee schedule compared to fee schedules of other funds and accounts managed by New York Life Investments. The Board also reviewed information from ISS showing how the Portfolio’s management fee schedule compared with fees paid for similar services by peer funds at varying asset levels.
Based on this information, the Board concluded that economies of scale are appropriately shared for the benefit of the Portfolio’s shareholders through the Portfolio’s management fee and expense structure and other methods to share benefits from economies of scale.
Conclusion
On the basis of the information and factors summarized above, among other information and factors deemed relevant by the Trustees, and the evaluation thereof, the Board, including the Independent Trustees voting separately, unanimously voted to approve the continuation of each of the Advisory Agreements.
| 26 | MainStay VP Fidelity Institutional AM® Utilities Portfolio |
Proxy Voting Policies and Procedures and Proxy Voting Record
The Portfolio is required to file with the SEC its proxy voting record for the 12-month period ending June 30 on Form N-PX. A description of the policies and procedures that are used to vote proxies relating to portfolio securities of the Portfolio is available free of charge upon request by calling 800-598-2019 or visiting the SEC's website at www.sec.gov. The most recent Form N-PX or proxy voting record is available free of charge upon request by calling 800-598-2019; visiting https://www.newyorklifeinvestments.com/investment-products/vp; or visiting the SEC’s website at www.sec.gov.
Shareholder Reports and Quarterly Portfolio Disclosure
The Portfolio is required to file its complete schedule of portfolio holdings with the SEC 60 days after its first and third fiscal quarter on Form N-PORT. The Portfolio's holdings report is available free of charge upon request by calling 800-598-2019 or by visiting the SEC’s website at www.sec.gov.
Board of Trustees and Officers (Unaudited)
The Trustees and officers of the Portfolio are listed below. The Board oversees the MainStay Group of Funds (which consists of MainStay Funds and MainStay Funds Trust), MainStay VP Funds Trust, MainStay MacKay DefinedTerm Municipal Opportunities Fund, MainStay CBRE Global Infrastructure Megatrends Term Fund, the Manager and the Subadvisors, and elects the officers of the Portfolios who are responsible for the day-to-day operations of the Portfolio. Information pertaining to the Trustees and officers is set forth below. Each Trustee serves until his or her successor is elected and qualified or until his or her resignation,
death or removal. Under the Board’s retirement policy, unless an exception is made, a Trustee must tender his or her resignation by the end of the calendar year during which he or she reaches the age of 75. Officers are elected annually by the Board. The business address of each Trustee and officer listed below is 51 Madison Avenue, New York, New York 10010. A majority of the Trustees are not “interested persons” (as defined by the 1940 Act and rules adopted by the SEC thereunder) of the Portfolio (“Independent Trustees”).
| | Name and
Year of Birth | Term of Office,
Position(s) Held and
Length of Service | Principal Occupation(s)
During Past Five Years | Number of
Portfolios in
Fund Complex
Overseen by
Trustee | Other Directorships
Held by Trustee |
| | | | | | |
| | Naïm Abou-Jaoudé*
1966 | MainStay VP Funds Trust: Trustee since 2023 | Chief Executive Officer of New York Life Investment Management LLC (since 2023). Chief Executive Officer of Candriam (an affiliate of New York Life Investment Management LLC) (2007 to 2023). | 81 | MainStay Funds: Trustee since 2023 (11 Funds)
MainStay Funds Trust: Trustee since 2023 (37 Funds);
MainStay MacKay DefinedTerm Municipal Opportunities Fund: Trustee since 2023;
MainStay CBRE Global Infrastructure Megatrends Term Fund: Trustee since 2023; and
New York Life Investment Management International (Chair) since 2015 |
| * | This Trustee is considered to be an “interested person” of the MainStay Group of Funds, MainStay VP Funds Trust, MainStay CBRE Global Infrastructure Megatrends Term Fund and MainStay MacKay DefinedTerm Municipal Opportunities Fund, within the meaning of the 1940 Act because of his affiliation with New York Life Investment Management LLC and Candriam, as described in detail above in the column entitled “Principal Occupation(s) During Past Five Years.” |
| | |
| 28 | MainStay VP Fidelity Institutional AM® Utilities Portfolio |
| | Name and
Year of Birth | Term of Office,
Position(s) Held and
Length of Service | Principal Occupation(s)
During Past Five Years | Number of
Portfolios in
Fund Complex
Overseen by
Trustee | Other Directorships
Held by Trustee |
| | | | | | |
| | David H. Chow
1957 | MainStay VP Funds Trust: Trustee since January 2016, Advisory Board Member (June 2015 to December 2015) | Founder and CEO, DanCourt Management, LLC since 1999 | 81 | MainStay Funds: Trustee since January 2016, Advisory Board Member (June 2015 to December 2015) (11 Funds);
MainStay Funds Trust: Trustee since January 2016, Advisory Board Member (June 2015 to December 2015) (37 Funds);
MainStay MacKay DefinedTerm Municipal Opportunities Fund: Trustee since January 2016, Advisory Board Member (June 2015 to December 2015);
MainStay CBRE Global Infrastructure Megatrends Term Fund: Trustee since 2021;
VanEck Vectors Group of Exchange-Traded Funds: Trustee since 2006 and Independent Chairman of the Board of Trustees from 2008 to 2022 (57 portfolios); and
Berea College of Kentucky: Trustee since 2009, Chair of the Investment Committee since 2018 |
| | Karen Hammond
1956 | MainStay VP Funds Trust: Trustee since December 2021, Advisory Board Member (June 2021 to December 2021)
| Retired, Managing Director, Devonshire Investors (2007 to 2013); Senior Vice President, Fidelity Management & Research Co. (2005 to 2007); Senior Vice President and Corporate Treasurer, FMR Corp. (2003 to 2005); Chief Operating Officer, Fidelity Investments Japan (2001 to 2003) | 81 | MainStay Funds: Trustee since December 2021, Advisory Board Member (June 2021 to December 2021) (11 Funds);
MainStay Funds Trust: Trustee since December 2021, Advisory Board Member (June 2021 to December 2021) (37 Funds);
MainStay MacKay DefinedTerm Municipal Opportunities Fund: Trustee since December 2021, Advisory Board Member (June 2021 to December 2021);
MainStay CBRE Global Infrastructure Megatrends Term Fund: Trustee since December 2021, Advisory Board Member (June 2021 to December 2021);
Two Harbors Investment Corp.: Director since 2018;
Rhode Island State Investment Commission: Member since 2017; and
Blue Cross Blue Shield of Rhode Island: Director since 2019 |
| | Susan B. Kerley
1951 | MainStay VP Funds Trust: Chair since 2017 and Trustee since 2007** | President, Strategic Management Advisors LLC since 1990 | 81 | MainStay Funds: Chair since January 2017 and Trustee since 2007 (11 Funds); MainStay Funds Trust: Chair since January 2017 and Trustee since 1990 (37 Funds)***;
MainStay MacKay DefinedTerm Municipal Opportunities Fund: Chair since January 2017 and Trustee since 2011;
MainStay CBRE Global Infrastructure Megatrends Term Fund: Trustee since June 2021; and
Legg Mason Partners Funds: Trustee since 1991 (45 portfolios) |
Board of Trustees and Officers (Unaudited) (continued)
| | Name and
Year of Birth | Term of Office,
Position(s) Held and
Length of Service | Principal Occupation(s)
During Past Five Years | Number of
Portfolios in
Fund Complex
Overseen by
Trustee | Other Directorships
Held by Trustee |
| | | | | | |
| | Alan R. Latshaw
1951 | MainStay VP Funds Trust: Trustee since 2007** | Retired; Partner, Ernst & Young LLP (2002 to 2003); Partner, Arthur Andersen LLP (1989 to 2002); Consultant to the MainStay Funds Audit and Compliance Committee (2004 to 2006) | 81 | MainStay Funds: Trustee since 2006 (11 Funds);
MainStay Funds Trust: Trustee since 2007 (37 Funds)***;
MainStay MacKay DefinedTerm Municipal Opportunities Fund: Trustee since 2011; and
MainStay CBRE Global Infrastructure Megatrends Term Fund: Trustee since June 2021 |
| | Jacques P. Perold
1958 | MainStay VP Funds Trust: Trustee since January 2016, Advisory Board Member (June 2015 to December 2015) | Founder and Chief Executive Officer, CapShift Advisors LLC (since 2018); President, Fidelity Management & Research Company (2009 to 2014); President and Chief Investment Officer, Geode Capital Management, LLC (2001 to 2009) | 81 | MainStay Funds: Trustee since January 2016, Advisory Board Member (June 2015 to December 2015) (11 Funds);
MainStay Funds Trust: Trustee since January 2016, Advisory Board Member (June 2015 to December 2015) (37 Funds);
MainStay MacKay DefinedTerm Municipal Opportunities Fund: Trustee since January 2016, Advisory Board Member (June 2015 to December 2015);
MainStay CBRE Global Infrastructure Megatrends Term Fund: Trustee since June 2021;
Allstate Corporation: Director since 2015;
Partners in Health: Trustee since 2019; and
MSCI Inc.: Director since 2017 |
| | Richard S. Trutanic
1952 | MainStay VP Funds Trust: Trustee since 2007** | Chairman and Chief Executive Officer, Somerset & Company (financial advisory firm) since 2004; Managing Director, The Carlyle Group (private investment firm) (2002 to 2004); Senior Managing Director, Partner and Board Member, Groupe Arnault S.A. (private investment firm) (1999 to 2002) | 81 | MainStay Funds: Trustee since 1994 (11 Funds);
MainStay Funds Trust: Trustee since 2007 (37 Funds)***;
MainStay MacKay DefinedTerm Municipal Opportunities Fund: Trustee since 2011; and
MainStay CBRE Global Infrastructure Megatrends Term Fund: Trustee since June 2021 |
| ** | Includes prior service as a Director of MainStay VP Series Fund, Inc., the predecessor to MainStay VP Funds Trust. |
| *** | Includes prior service as a Director/Trustee of certain predecessor entities to MainStay Funds Trust. |
| 30 | MainStay VP Fidelity Institutional AM® Utilities Portfolio |
| | Name and
Year of Birth | Position(s) Held and
Length of Service | Principal Occupation(s)
During Past Five Years | |
| | | | | |
| | Kirk C. Lehneis
1974 | President, MainStay VP Funds Trust (since 2017) | Chief Operating Officer and Senior Managing Director (since 2016), New York Life Investment Management LLC and New York Life Investment Management Holdings LLC; Member of the Board of Managers (since 2017) and Senior Managing Director (since 2018), NYLIFE Distributors LLC; Chairman of the Board and Senior Managing Director, NYLIM Service Company LLC (since 2017); Trustee, President and Principal Executive Officer of IndexIQ Trust, IndexIQ ETF Trust and IndexIQ Active ETF Trust (since 2018); President, MainStay CBRE Global Infrastructure Megatrends Term Fund (since 2021), MainStay MacKay DefinedTerm Municipal Opportunities Fund, MainStay Funds and MainStay Funds Trust (since 2017); Senior Managing Director, Global Product Development (from 2015 to 2016); Managing Director, Product Development (from 2010 to 2015), New York Life Investment Management LLC | |
| | Jack R. Benintende
1964 | Treasurer and Principal Financial and Accounting Officer, MainStay VP Funds Trust (since 2007)** | Managing Director, New York Life Investment Management LLC (since 2007); Treasurer and Principal Financial and Accounting Officer, MainStay CBRE Global Infrastructure Megatrends Term Fund (since 2021), MainStay MacKay DefinedTerm Municipal Opportunities Fund (since 2011), MainStay Funds Trust (since 2009) and MainStay Funds (since 2007); and Assistant Treasurer, New York Life Investment Management Holdings LLC (2008 to 2012) | |
| | J. Kevin Gao
1967 | Secretary and Chief Legal Officer, MainStay VP Funds Trust (since 2010)** | Managing Director and Associate General Counsel, New York Life Investment Management LLC (since 2010); Secretary and Chief Legal Officer, MainStay CBRE Global Infrastructure Megatrends Term Fund (since 2021), MainStay MacKay DefinedTerm Municipal Opportunities Fund (since 2011), MainStay Funds and MainStay Funds Trust (since 2010) | |
| | Kevin M. Gleason
1967 | Vice President and Chief Compliance Officer, MainStay VP Funds Trust (since June 2022) | Vice President and Chief Compliance Officer, IndexIQ Trust, IndexIQ ETF Trust and IndexIQ Active ETF Trust (since June 2022); Vice President and Chief Compliance Officer, MainStay CBRE Global Infrastructure Megatrends Term Fund, MainStay MacKay DefinedTerm Municipal Opportunities Fund (since June 2022); MainStay Funds Trust and MainStay Funds (since June 2022); Senior Vice President, Voya Investment Management and Chief Compliance Officer, Voya Family of Funds (2012 to 2022) | |
| | Scott T. Harrington
1959 | Vice President— Administration, MainStay VP Funds Trust (since 2005)** | Managing Director, New York Life Investment Management LLC (including predecessor advisory organizations) (since 2000); Member of the Board of Directors, New York Life Trust Company (since 2009); Vice President—Administration, MainStay CBRE Global Infrastructure Megatrends Term Fund (since 2021), MainStay MacKay DefinedTerm Municipal Opportunities Fund (since 2011), MainStay Funds Trust and MainStay Funds (since 2009) | |
| * | The officers listed above are considered to be “interested persons” of the MainStay Group of Funds, MainStay VP Funds Trust, MainStay CBRE Global Infrastructure Megatrends Term Fund and MainStay MacKay DefinedTerm Municipal Opportunities Fund within the meaning of the 1940 Act because of their affiliation with the MainStay Group of Funds, New York Life Insurance Company and/or its affiliates, including New York Life Investment Management LLC, New York Life Insurance Company, NYLIM Service Company LLC, NYLIFE Securities LLC and/or NYLIFE Distributors LLC, as described in detail in the column captioned “Principal Occupation(s) During Past Five Years.” Officers are elected annually by the Board. |
| ** | Includes prior service as an Officer of MainStay VP Series Fund, Inc., the predecessor to MainStay VP Funds Trust. |
Officers of the Trust (Who are not Trustees)*
This page intentionally left blank.
This page intentionally left blank.
This page intentionally left blank.
MainStay VP Portfolios
MainStay VP offers a wide range of Portfolios. The full array of MainStay VP offerings is listed here, with information about the manager, subadvisors, legal counsel, and independent registered public accounting firm.
Equity
MainStay VP American Century Sustainable Equity Portfolio
MainStay VP Candriam Emerging Markets Equity Portfolio
MainStay VP Epoch U.S. Equity Yield Portfolio
MainStay VP Fidelity Institutional AM® Utilities Portfolio†
MainStay VP Natural Resources Portfolio
MainStay VP PineStone International Equity Portfolio1
MainStay VP S&P 500 Index Portfolio
MainStay VP Small Cap Growth Portfolio
MainStay VP Wellington Growth Portfolio
MainStay VP Wellington Mid Cap Portfolio
MainStay VP Wellington Small Cap Portfolio
MainStay VP Wellington U.S. Equity Portfolio
MainStay VP Winslow Large Cap Growth Portfolio
Mixed Asset
MainStay VP Balanced Portfolio
MainStay VP Income Builder Portfolio
MainStay VP Janus Henderson Balanced Portfolio
MainStay VP MacKay Convertible Portfolio
Income
MainStay VP Bond Portfolio
MainStay VP Floating Rate Portfolio
MainStay VP Indexed Bond Portfolio
MainStay VP MacKay Government Portfolio2
MainStay VP MacKay High Yield Corporate Bond Portfolio
MainStay VP MacKay Strategic Bond Portfolio
MainStay VP PIMCO Real Return Portfolio
Money Market
MainStay VP U.S. Government Money Market Portfolio
Alternative
MainStay VP CBRE Global Infrastructure Portfolio
MainStay VP IQ Hedge Multi-Strategy Portfolio
Asset Allocation
MainStay VP Conservative Allocation Portfolio
MainStay VP Equity Allocation Portfolio
MainStay VP Growth Allocation Portfolio
MainStay VP Moderate Allocation Portfolio
Manager
New York Life Investment Management LLC
New York, New York
Subadvisors
American Century Investment Management, Inc.
Kansas City, Missouri
Brown Advisory LLC
Baltimore, Maryland
Candriam*
Strassen, Luxembourg
CBRE Investment Management Listed Real Assets LLC
Radnor, Pennsylvania
Epoch Investment Partners, Inc.
New York, New York
FIAM LLC
Smithfield, Rhode Island
IndexIQ Advisors LLC*
New York, New York
Janus Henderson Investors US LLC
Denver, Colorado
MacKay Shields LLC*
New York, New York
Newton Investment Management North America, LLC
Boston, Massachusetts
NYL Investors LLC*
New York, New York
Pacific Investment Management Company LLC
Newport Beach, California
PineStone Asset Management Inc.
Montreal, Québec
Segall Bryant & Hamill, LLC
Chicago, Illinois
Wellington Management Company LLP
Boston, Massachusetts
Winslow Capital Management, LLC
Minneapolis, Minnesota
Legal Counsel
Dechert LLP
Washington, District of Columbia
Independent Registered Public Accounting Firm
PricewaterhouseCoopers LLP
New York, New York
Distributor
NYLIFE Distributors LLC*
Jersey City, New Jersey
Custodian
JPMorgan Chase Bank, N.A.
New York, New York
Some Portfolios may not be available in all products.
† Fidelity Institutional AM is a registered trade mark of FMR LLC. Used with permission.
* An affiliate of New York Life Investment Management LLC.
| 1. | Prior to August 28, 2023, the Portfolio's name was MainStay VP MacKay International Equity Portfolio. |
| 2. | Effective on or about May 1, 2024, the MainStay VP MacKay Government Portfolio will be renamed the MainStay VP U.S. Infrastructure Bond Portfolio. |
Not part of the Annual Report
2023 Annual Report
This report is for the general information of New York Life Variable Annuities and NYLIAC Variable Universal Life Insurance Products policyowners. It must be preceded or accompanied by the appropriate product(s) and funds prospectuses if it is given to anyone who is not an owner of a New York Life variable annuity policy or a NYLIAC Variable Universal Life Insurance Product. This report does not offer for sale or solicit orders to purchase securities.
The performance data quoted in this report represents past performance. Past performance is no guarantee of future results. Due to market volatility and other factors, current performance may be lower or higher than the figures shown. The most recent month-end performance summary for your variable annuity or variable life policy is available by calling 800-598-2019 and is updated periodically on newyorklife.com.
The New York Life Variable Annuities and NYLIAC Variable Universal Life Insurance Products are issued by New York Life Insurance and Annuity Corporation (a Delaware Corporation) and distributed by NYLIFE Distributors LLC (Member FINRA/SIPC).
New York Life Insurance Company
New York Life Insurance and Annuity
Corporation (NYLIAC) (A Delaware Corporation)
51 Madison Avenue, Room 551
New York, NY 10010
newyorklife.com
newyorklifeinvestments.com
NYLIFE Distributors LLC, 30 Hudson Street, Jersey City, NJ 07302
New York Life Investment Management LLC is the investment manager to the MainStay VP Funds Trust
©2024 by NYLIFE Distributors LLC. All rights reserved.
You may obtain copies of the Prospectus and the Statement of Additional Information free of charge, upon request, by calling toll-free 800-598-2019 or writing to New York Life Insurance and Annuity Corporation, 51 Madison Avenue, New York, NY 10010.
| Not FDIC Insured | No Bank Guarantee | May Lose Value |
(NYLIAC) NI526
MainStay VP Wellington Small Cap Portfolio
Message from the President and Annual Report
December 31, 2023
Special Notice:
Beginning in July 2024, new regulations issued by the Securities and Exchange Commission (SEC) will take effect requiring open-end mutual fund companies and ETFs to (1) overhaul the content of their shareholder reports and (2) mail paper copies of the new tailored shareholder reports to shareholders who have not opted to receive these documents electronically.
If you have not yet elected to receive your shareholder reports electronically, please contact your financial intermediary or visit our website.
| Not FDIC/NCUA Insured | Not a Deposit | May Lose Value | No Bank Guarantee | Not Insured by Any Government Agency |
This page intentionally left blank
Message from the President
Against a backdrop of easing inflationary pressures and continued economic growth, stocks and bonds generally gained ground during the 12-month period ended December 31, 2023, despite high levels of volatility and sharp disparities between the performance of the different market sectors.
Although the war in Ukraine, the outbreak of hostilities in the Middle East and several other notable events affected financial assets, inflation, interest rate, and economic growth trends stood at the forefront of market developments during most of the period. As the reporting period began, high levels of inflation already showed signs of easing in the face of aggressive rate hikes by U.S. Federal Reserve (the “Fed”). From a peak of 9.1% in June 2022, the annualized U.S. inflation rate dropped to 6.4% in January, and 3.4% in December 2023. At the same time, the Fed increased the benchmark federal funds rate from 4.25%–4.50% at the beginning of reporting period, to 5.25%–5.50% as of the end of 2023. Despite the increasing cost of capital and tighter lending environment that resulted from rising rates, economic growth remained surprisingly robust, bolstered by high levels of consumer spending, low levels of unemployment and better-than-expected corporate earnings. With the pace of rate increases slowing from the prior year, investors began hoping for an early shift to a looser monetary policy, with stock prices and bond yields reacting as economic data and statements from the Fed either reinforced or undercut those hopes. Following months of hawkish rhetoric, the Fed finally reversed its stance in December 2023, signaling a positive economic outlook with little chance of a recession and a likelihood of rate cuts in 2024.
The S&P 500® Index, a widely regarded benchmark of U.S. market performance, produced strong gains during the reporting period-– recovering all its losses from 2022 and approached new record territory. A preponderance of the Index’s gains were generated by a relatively small number of mega-cap stocks in the information technology, communication services and consumer discretionary sectors that stood to benefit from rapid developments in generative artificial intelligence (“AI”). Value-oriented, interest-rate sensitive and small-capitalization
shares lagged by significant margins, although market strength widened during the closing weeks of the reporting period. Most overseas equity markets trailed the U.S. market, as developed international economies experienced relatively low growth rates, and weak economic conditions in China undermined emerging markets.
Bonds produced generally positive returns, bolstered by attractive and relatively stable yields. The yield on the 10-year Treasury note hit a high of just under 5% in mid-October 2023, ranging between approximately 3.5% and 4.8% for most of the reporting period. The yield curve remained inverted throughout the year, with the 2-year Treasury yield modestly above the 10-year yield. Corporate bond prices trended moderately higher, generally outperforming government securities. After years of low yields and tight credit spreads, the corporate sector benefited from more attractive valuations and income opportunities. Among corporates, markets generally rewarded longer duration and lower credit quality, although an uptick in default rates posed added risks for high-yield corporate bonds. International bond markets produced mixed returns, with emerging-markets issues advancing over their developed-markets counterparts.
The market volatility of recent years reminds us of the constant need for experienced and steadfast portfolio management in the face of uncertainty. New York Life Investments remains dedicated to providing you, as a valued MainStay VP investor, with the guidance, resources and investment solutions you need to pursue your financial goals.
Thank you for trusting us to help meet your investment needs.
Sincerely,
Kirk C. Lehneis
President
The opinions expressed are as of the date of this report and are subject to change. There is no guarantee that any forecast made will come to pass. This material does not constitute investment advice and is not intended as an endorsement of any specific investment. Past performance is no guarantee of future results.
Not part of the Annual Report
Investors should refer to the Portfolio’s Summary Prospectus and/or Prospectus and consider the Portfolio’s investment objectives, strategies, risks, charges and expenses carefully before investing. The Summary Prospectus and/or Prospectus contain this and other information about the Portfolio. You may obtain copies of the Portfolio’s Summary Prospectus, Prospectus and Statement of Additional Information, which includes information about the MainStay VP Funds Trust's Trustees, free of charge, upon request, by calling toll-free 800-598-2019, by writing to New York Life Insurance and Annuity Corporation, 51 Madison Avenue, Room 251, New York, New York 10010 or by sending an email to MainStayShareholdersServices@nylim.com. These documents are also available at newyorklifeinvestments.com/investment-products/vp. Please read the Portfolio's Summary Prospectus and/or Prospectus carefully before investing. MainStay VP Funds Trust portfolios are separate account options which are purchased through a variable insurance or variable annuity contract.
Investment and Performance Comparison (Unaudited)
Performance data quoted represents past performance. Past performance is no guarantee of future results. Because of market volatility and other factors, current performance may be lower or higher than the figures shown. Investment return and principal value will fluctuate, and as a result, when shares are redeemed, they may be worth more or less than their original cost. The performance table and graph do not reflect any deduction of sales charges, mortality and expense charges, contract charges or administrative charges. Please refer to the Performance Summary appropriate for your policy. For performance information current to the most recent month-end, please call 800-598-2019 or visit www.newyorklife.com.
Performance figures may reflect certain fee waivers and/or expense limitations, without which total returns may have been different. For information on current fee waivers and/or expense limitations (if any), please refer to the Notes to Financial Statements.
| Average Annual Total Returns for the Year-Ended December 31, 2023 |
| Class | Inception
Date1, 2 | One
Year | Five
Years | Since
Inception | Gross
Expense
Ratio3 |
| Initial Class Shares | 5/2/2016 | 13.89% | 6.68% | 6.25% | 0.86% |
| Service Class Shares | 5/2/2016 | 13.60 | 6.42 | 5.99 | 1.11 |
| 1. | Effective January 1, 2018, due to an organizational restructuring, all investment personnel of Cornerstone Capital Management Holdings LLC, a former subadvisor, transitioned to MacKay Shields LLC. |
| 2. | Effective May 1, 2021, the Portfolio replaced its subadvisor, MacKay Shields LLC, and modified its principal investment strategies. The past performance in the graph and table prior to that date reflects the Portfolio's prior subadvisors and principal investment strategies. |
| 3. | The gross expense ratios presented reflect the Portfolio’s “Total Annual Portfolio Operating Expenses” from the most recent Prospectus and may differ from other expense ratios disclosed in this report. |
| Benchmark Performance* | One
Year | Five
Years | Since
Inception |
| Russell 2000® Index1 | 16.93% | 9.97% | 9.27% |
| Morningstar Small Blend Category Average2 | 16.18 | 10.86 | 8.63 |
| * | Returns for indices reflect no deductions for fees, expenses or taxes, except for foreign withholding taxes where applicable. Results assume reinvestment of all dividends and capital gains. An investment cannot be made directly in an index. |
| 1. | The Russell 2000® Index is the Portfolio’s primary broad-based securities market index for comparison purposes. The Russell 2000® Index measures the performance of the small-cap segment of the U.S. equity universe. It is a subset of the Russell 3000® Index and includes approximately 2,000 of the smallest securities based on a combination of their market cap and current index membership. |
| 2. | The Morningstar Small Blend Category Average is representative of funds that favor U.S. firms at the smaller end of the market-capitalization range. Some aim to own an array of value and growth stocks while others employ a discipline that leads to holdings with valuations and growth rates close to the small-cap averages. Stocks in the bottom 10% of the capitalization of the U.S. equity market are defined as small cap. The blend style is assigned to funds where neither growth nor value characteristics predominate. Results are based on average total returns of similar funds with all dividends and capital gain distributions reinvested. |
Cost in Dollars of a $1,000 Investment in MainStay VP Wellington Small Cap Portfolio (Unaudited)
The example below is intended to describe the fees and expenses borne by shareholders during the six-month period from July 1, 2023 to December 31, 2023, and the impact of those costs on your investment.
Example
As a shareholder of the Portfolio you incur two types of costs: (1) transaction costs, including exchange fees and sales charges (loads) on purchases (as applicable), and (2) ongoing costs, including management fees, distribution and/or service (12b-1) fees and other Portfolio expenses (as applicable). This example is intended to help you understand your ongoing costs (in dollars) of investing in the Portfolio and to compare these costs with the ongoing costs of investing in other mutual funds. The example is based on an investment of $1,000 made at the beginning of the six-month period and held for the entire period from July 1, 2023 to December 31, 2023. Shares are only sold in connection with variable life and annuity contracts and the example does not reflect any contract level or transactional fees or expenses. If these costs had been included, your costs would have been higher.
This example illustrates your Portfolio’s ongoing costs in two ways:
Actual Expenses
The second and third data columns in the table below provide information about actual account values and actual expenses. You may use the information in these columns, together with the amount you invested, to estimate the expenses that you paid during the six months ended
December 31, 2023. Simply divide your account value by $1,000 (for example, an $8,600 account value divided by $1,000 = 8.6), then multiply the result by the number under the heading entitled “Expenses Paid During Period” to estimate the expenses you paid on your account during this period.
Hypothetical Example for Comparison Purposes
The fourth and fifth data columns in the table below provide information about hypothetical account values and hypothetical expenses based on the Portfolio’s actual expense ratio and an assumed rate of return of 5% per year before expenses, which is not the Portfolio’s actual return. The hypothetical account values and expenses may not be used to estimate the actual ending account balances or expenses you paid for the six-month period shown. You may use this information to compare the ongoing costs of investing in the Portfolio with the ongoing costs of investing in other mutual funds. To do so, compare this 5% hypothetical example with the 5% hypothetical examples that appear in the shareholder reports of the other mutual funds.
Please note that the expenses shown in the table are meant to highlight your ongoing costs only and do not reflect any transactional costs, such as exchange fees or sales charges (loads). Therefore, the fourth and fifth data columns of the table are useful in comparing ongoing costs only and will not help you determine the relative total costs of owning different funds. In addition, if these transactional costs were included, your costs would have been higher.
| Share Class | Beginning
Account
Value
7/1/23 | Ending Account
Value (Based
on Actual
Returns and
Expenses)
12/31/23 | Expenses
Paid
During
Period1 | Ending Account
Value (Based
on Hypothetical
5% Annualized
Return and
Actual Expenses)
12/31/23 | Expenses
Paid
During
Period1 | Net Expense
Ratio
During
Period2 |
| Initial Class Shares | $1,000.00 | $1,081.00 | $3.88 | $1,021.47 | $3.77 | 0.74% |
| Service Class Shares | $1,000.00 | $1,079.70 | $5.19 | $1,020.21 | $5.04 | 0.99% |
| 1. | Expenses are equal to the Portfolio’s annualized expense ratio of each class multiplied by the average account value over the period, divided by 365 and multiplied by 184 (to reflect the six-month period). The table above represents the actual expenses incurred during the six-month period. In addition to the fees and expenses which the Portfolio bears directly, it also indirectly bears a pro rata share of the fees and expenses of the underlying funds in which it invests. Such indirect expenses are not included in the above-reported expense figures. |
| 2. | Expenses are equal to the Portfolio's annualized expense ratio to reflect the six-month period. |
| 6 | MainStay VP Wellington Small Cap Portfolio |
Industry Composition as of December 31, 2023 (Unaudited)
| Banks | 9.1% |
| Software | 6.3 |
| Biotechnology | 6.3 |
| Health Care Equipment & Supplies | 4.2 |
| Trading Companies & Distributors | 3.9 |
| Energy Equipment & Services | 3.6 |
| Semiconductors & Semiconductor Equipment | 3.2 |
| Financial Services | 2.9 |
| Machinery | 2.8 |
| Commercial Services & Supplies | 2.8 |
| Chemicals | 2.7 |
| Diversified Consumer Services | 2.7 |
| Textiles, Apparel & Luxury Goods | 2.5 |
| Electronic Equipment, Instruments & Components | 2.3 |
| Consumer Finance | 2.2 |
| Insurance | 2.0 |
| Household Durables | 2.0 |
| Hotels, Restaurants & Leisure | 2.0 |
| Professional Services | 2.0 |
| Exchange–Traded Funds | 1.8 |
| Gas Utilities | 1.7 |
| Automobile Components | 1.6 |
| Health Care Providers & Services | 1.6 |
| Building Products | 1.5 |
| Mortgage Real Estate Investment Trusts | 1.4 |
| Personal Care Products | 1.3 |
| Media | 1.3 |
| Metals & Mining | 1.3% |
| Oil, Gas & Consumable Fuels | 1.3 |
| Capital Markets | 1.3 |
| Real Estate Management & Development | 1.2 |
| Hotel & Resort REITs | 1.2 |
| Interactive Media & Services | 1.2 |
| Food Products | 1.2 |
| Aerospace & Defense | 1.2 |
| Pharmaceuticals | 1.2 |
| Ground Transportation | 1.1 |
| Construction & Engineering | 0.9 |
| Leisure Products | 0.7 |
| Health Care REITs | 0.6 |
| Office REITs | 0.6 |
| Electrical Equipment | 0.6 |
| Specialized REITs | 0.6 |
| Health Care Technology | 0.6 |
| Specialty Retail | 0.6 |
| Communications Equipment | 0.5 |
| Household Products | 0.5 |
| Electric Utilities | 0.4 |
| Beverages | 0.4 |
| Broadline Retail | 0.4 |
| Short–Term Investments | 5.2 |
| Other Assets, Less Liabilities | –2.5 |
| | 100.0% |
See Portfolio of Investments beginning on page 10 for specific holdings within these categories. The Portfolio's holdings are subject to change.
Top Ten Holdings and/or Issuers Held as of December 31, 2023 (excluding short-term investments) (Unaudited)
| 1. | Skyline Champion Corp. |
| 2. | Cadence Bank |
| 3. | H&R Block, Inc. |
| 4. | iShares Russell 2000 Value ETF |
| 5. | Cytokinetics, Inc. |
| 6. | elf Beauty, Inc. |
| 7. | Freshpet, Inc. |
| 8. | Xometry, Inc., Class A |
| 9. | MRC Global, Inc. |
| 10. | Taboola.com Ltd. |
Portfolio Management Discussion and Analysis (Unaudited)
Answers to the questions reflect the views of portfolio managers Gregg R. Thomas and Roberto J. Isch, CFA, of Wellington Management Company LLP (“Wellington”), the Portfolio’s Subadvisor.
How did MainStay VP Wellington Small Cap Portfolio perform relative to its benchmark and peers during the 12 months ended December 31, 2023?
For the 12 months ended December 31, 2023, MainStay VP Wellington Small Cap Portfolio returned 13.89% for Initial Class shares and 13.60% for Service Class shares. Over the same period, both share classes underperformed the 16.93% return of the Russell 2000® Index (“the Index”), which is the Portfolio’s benchmark, and the 16.18% return of the Morningstar Small Blend Category Average.1
What factors affected the Portfolio’s relative performance during the reporting period?
During the reporting period, the Portfolio underperformed the Index due to a combination of security selection and sector allocation.
During the reporting period, how was the Portfolio’s performance materially affected by investments in derivatives?
The Portfolio used Russell 2000® Index futures during the reporting period to equitize cash. These futures positions did not materially impact the Portfolio’s performance.
Which sectors were the strongest positive contributors to the Portfolio’s relative performance, and which sectors were particularly weak?
The sector providing the strongest contribution to the Portfolio’s performance relative to the Index was financials, followed by real estate and utilities. (Contributions take weightings and total returns into account.) The positive relative performance of all three sectors was driven by security selection. Underweight exposure in the utilities and real estate sectors further benefited relative returns. During the same period, the sector that detracted most from relative performance was consumer discretionary, followed by information technology and health care. Security selection undermined relative performance of all three sectors, while underweight exposure to information technology also modestly detracted.
During the reporting period, which individual stocks made the strongest positive contributions to the Portfolio’s absolute performance and which stocks detracted the most?
The strongest positive contributions to the Portfolio’s absolute performance came from holdings in multinational insurance underwriter SiriusPoint, cosmetics company e.l.f. Beauty and wireless communication technology company InterDigital. SiriusPoint shares advanced after the company announced earnings results consistently ahead of expectations. Shares in
e.l.f. Beauty benefited from the company’s increased brand awareness and a lower price point for its products relative to higher-end cosmetics brands. InterDigital shares rose on the company’s solid, top-line growth and continued momentum in its licensing business. In addition, the company’s most recent quarterly release included earnings that were well above estimates and guidance that was higher than expected.
The most significant detractors from the Portfolio’s absolute performance included dermatologist-led biopharmaceutical company Aclaris Therapeutics, collection agency PRA Group and health care technology company Omnicell. Aclaris shares fell sharply during the reporting period when the company announced disappointing top-line results from its Phase 2b clinical study of oral MK2 inhibitor zunsemetinib for the treatment of rheumatoid arthritis. PRA shares declined after first quarter 2023 results missed consensus estimates. Omnicell shares lost ground after the company reported third quarter 2023 earnings that declined significantly compared to the prior year. Management lowered its 2023 earnings and revenue guidance amid weakening demand.
Did the Portfolio make any significant purchases or sales during the reporting period?
The Portfolio initiated positions in health care technology company Omnicell and advertising technology company Taboola.com during the reporting period. We added Omnicell to the Portfolio based on its attractive valuation and high-quality fundamentals. We added Taboola.com to the Portfolio due to its attractive high-quality fundamentals.
During the same period, we eliminated the Portfolio’s positions in wood products and building materials producer Boise Cascade and reduced the Portfolio’s exposure to government-sponsored agricultural loans provider Federal Agricultural Mortgage Corp. (also known as “FAMC” or “Farmer Mac”). We sold the Portfolio’s position in Boise Cascade on strength following substantial price appreciation. Farmer Mac screened well for multiple managers’ investment philosophies. We reduced the Portfolio’s exposure to the stock as valuations rose, but maintained exposure to the name because of its higher-quality fundamentals.
How did the Portfolio’s sector weightings change during the reporting period?
The most notable increases in the Portfolio’s sector exposures were to health care and utilities, reducing the level of the Portfolio’s underweight positions in both sectors. Notable reductions in sector exposures included energy, resulting in more significantly underweight exposure, and industrials, resulting in a more modestly overweight position.
| 1. | See "Investment and Performance Comparison" for more information on benchmark and peer group returns. |
| 8 | MainStay VP Wellington Small Cap Portfolio |
How was the Portfolio positioned at the end of the reporting period?
As of December 31, 2023, the Portfolio held its most overweight positions relative to the Index in the financials and consumer discretionary sectors, and its most underweight positions in energy and real estate.
The opinions expressed are those of the portfolio managers as of the date of this report and are subject to change. There is no guarantee that any forecasts will come to pass. This material does not constitute investment advice and is not intended as an endorsement of any specific investment.
Not all MainStay VP Portfolios and/or share classes are available under all policies.
Portfolio of Investments December 31, 2023†^
| | Shares | Value |
| Common Stocks 95.5% |
| Aerospace & Defense 1.2% |
| BWX Technologies, Inc. | 33,348 | $ 2,558,792 |
| Spirit AeroSystems Holdings, Inc., Class A (a) | 65,249 | 2,073,613 |
| | | 4,632,405 |
| Automobile Components 1.6% |
| Dana, Inc. | 87,136 | 1,273,057 |
| Phinia, Inc. | 66,860 | 2,025,190 |
| Visteon Corp. (a) | 9,381 | 1,171,687 |
| XPEL, Inc. (a) | 33,359 | 1,796,382 |
| | | 6,266,316 |
| Banks 9.1% |
| Bank OZK | 50,429 | 2,512,877 |
| Banner Corp. | 23,304 | 1,248,162 |
| Cadence Bank | 148,929 | 4,406,809 |
| Columbia Banking System, Inc. | 91,004 | 2,427,987 |
| First Hawaiian, Inc. | 98,413 | 2,249,721 |
| First Interstate BancSystem, Inc., Class A | 74,916 | 2,303,667 |
| FNB Corp. | 145,299 | 2,000,767 |
| Home BancShares, Inc. | 97,402 | 2,467,193 |
| OFG Bancorp | 43,971 | 1,648,033 |
| Old National Bancorp | 128,311 | 2,167,173 |
| Pacific Premier Bancorp, Inc. | 88,233 | 2,568,463 |
| Sandy Spring Bancorp, Inc. | 86,399 | 2,353,509 |
| Stellar Bancorp, Inc. | 67,312 | 1,873,966 |
| United Community Banks, Inc. | 59,852 | 1,751,269 |
| Veritex Holdings, Inc. | 73,186 | 1,703,038 |
| WSFS Financial Corp. | 33,163 | 1,523,177 |
| | | 35,205,811 |
| Beverages 0.4% |
| Celsius Holdings, Inc. (a) | 29,947 | 1,632,711 |
| Biotechnology 6.3% |
| Ascendis Pharma A/S, ADR (a) | 3,608 | 454,428 |
| Blueprint Medicines Corp. (a) | 11,367 | 1,048,492 |
| Celldex Therapeutics, Inc. (a) | 76,332 | 3,027,327 |
| Crinetics Pharmaceuticals, Inc. (a) | 10,041 | 357,259 |
| Cytokinetics, Inc. (a) | 43,828 | 3,659,200 |
| Halozyme Therapeutics, Inc. (a) | 49,968 | 1,846,817 |
| Immunocore Holdings plc, ADR (a)(b) | 13,570 | 927,102 |
| Intellia Therapeutics, Inc. (a) | 13,176 | 401,736 |
| Kymera Therapeutics, Inc. (a) | 39,493 | 1,005,492 |
| Merus NV (a) | 72,322 | 1,988,855 |
| Morphic Holding, Inc. (a) | 11,929 | 344,509 |
| Nuvalent, Inc., Class A (a) | 33,131 | 2,438,110 |
| | Shares | Value |
| |
| Biotechnology (continued) |
| Prothena Corp. plc (a) | 8,778 | $ 318,993 |
| PTC Therapeutics, Inc. (a) | 15,680 | 432,141 |
| REVOLUTION Medicines, Inc. (a) | 54,594 | 1,565,756 |
| Rocket Pharmaceuticals, Inc. (a) | 39,896 | 1,195,683 |
| Syndax Pharmaceuticals, Inc. (a) | 26,699 | 576,965 |
| Vaxcyte, Inc. (a) | 44,372 | 2,786,562 |
| | | 24,375,427 |
| Broadline Retail 0.4% |
| Global-e Online Ltd. (a) | 37,371 | 1,481,013 |
| Building Products 1.5% |
| AZEK Co., Inc. (The) (a) | 60,008 | 2,295,306 |
| Masonite International Corp. (a) | 20,996 | 1,777,521 |
| Zurn Elkay Water Solutions Corp. | 59,602 | 1,752,895 |
| | | 5,825,722 |
| Capital Markets 1.3% |
| Hamilton Lane, Inc., Class A | 25,586 | 2,902,476 |
| PJT Partners, Inc., Class A | 19,060 | 1,941,642 |
| | | 4,844,118 |
| Chemicals 2.7% |
| Cabot Corp. | 28,613 | 2,389,185 |
| Livent Corp. (a)(b) | 74,880 | 1,346,342 |
| Mativ Holdings, Inc. | 123,925 | 1,897,292 |
| Minerals Technologies, Inc. | 36,999 | 2,638,399 |
| Quaker Chemical Corp. | 10,395 | 2,218,501 |
| | | 10,489,719 |
| Commercial Services & Supplies 2.8% |
| Brady Corp., Class A | 43,334 | 2,543,273 |
| Casella Waste Systems, Inc., Class A (a) | 19,324 | 1,651,429 |
| Interface, Inc. | 207,339 | 2,616,618 |
| Loomis AB | 65,954 | 1,749,871 |
| MillerKnoll, Inc. | 78,567 | 2,096,168 |
| | | 10,657,359 |
| Communications Equipment 0.5% |
| Calix, Inc. (a) | 42,751 | 1,867,791 |
| Construction & Engineering 0.9% |
| Ameresco, Inc., Class A (a) | 28,082 | 889,357 |
| Fluor Corp. (a) | 63,420 | 2,484,161 |
| | | 3,373,518 |
| Consumer Finance 2.2% |
| Bread Financial Holdings, Inc. | 69,539 | 2,290,615 |
| Enova International, Inc. (a) | 49,511 | 2,740,929 |
The notes to the financial statements are an integral part of, and should be read in conjunction with, the financial statements.
| 10 | MainStay VP Wellington Small Cap Portfolio |
| | Shares | Value |
| Common Stocks (continued) |
| Consumer Finance (continued) |
| Navient Corp. | 93,265 | $ 1,736,594 |
| PROG Holdings, Inc. (a) | 55,320 | 1,709,941 |
| | | 8,478,079 |
| Diversified Consumer Services 2.7% |
| Adtalem Global Education, Inc. (a) | 37,816 | 2,229,253 |
| Duolingo, Inc. (a) | 5,786 | 1,312,554 |
| European Wax Center, Inc., Class A (a)(b) | 48,228 | 655,419 |
| H&R Block, Inc. | 79,145 | 3,828,244 |
| Laureate Education, Inc. | 178,607 | 2,448,702 |
| | | 10,474,172 |
| Electric Utilities 0.4% |
| Portland General Electric Co. | 39,307 | 1,703,565 |
| Electrical Equipment 0.6% |
| Acuity Brands, Inc. | 4,389 | 898,999 |
| Shoals Technologies Group, Inc., Class A (a) | 91,094 | 1,415,601 |
| | | 2,314,600 |
| Electronic Equipment, Instruments & Components 2.3% |
| CTS Corp. | 48,853 | 2,136,830 |
| Napco Security Technologies, Inc. | 64,108 | 2,195,699 |
| Novanta, Inc. (a) | 14,135 | 2,380,475 |
| TTM Technologies, Inc. (a) | 149,339 | 2,361,050 |
| | | 9,074,054 |
| Energy Equipment & Services 3.6% |
| Cactus, Inc., Class A | 40,805 | 1,852,547 |
| ChampionX Corp. | 64,710 | 1,890,179 |
| DMC Global, Inc. (a) | 104,345 | 1,963,773 |
| Helix Energy Solutions Group, Inc. (a) | 188,884 | 1,941,728 |
| Liberty Energy, Inc. | 112,987 | 2,049,584 |
| Patterson-UTI Energy, Inc. | 118,924 | 1,284,379 |
| Seadrill Ltd. (a) | 28,291 | 1,337,598 |
| Select Water Solutions, Inc. | 234,901 | 1,782,899 |
| | | 14,102,687 |
| Financial Services 2.9% |
| Federal Agricultural Mortgage Corp., Class C | 11,880 | 2,271,694 |
| NMI Holdings, Inc., Class A (a) | 66,596 | 1,976,569 |
| Radian Group, Inc. | 86,615 | 2,472,858 |
| Remitly Global, Inc. (a) | 111,793 | 2,171,020 |
| Shift4 Payments, Inc., Class A (a) | 29,451 | 2,189,388 |
| | | 11,081,529 |
| | Shares | Value |
| |
| Food Products 1.2% |
| Freshpet, Inc. (a) | 39,350 | $ 3,414,006 |
| TreeHouse Foods, Inc. (a) | 31,223 | 1,294,193 |
| | | 4,708,199 |
| Gas Utilities 1.7% |
| New Jersey Resources Corp. | 54,923 | 2,448,467 |
| Spire, Inc. | 35,399 | 2,206,774 |
| UGI Corp. | 82,517 | 2,029,918 |
| | | 6,685,159 |
| Ground Transportation 1.1% |
| Marten Transport Ltd. | 96,496 | 2,024,486 |
| Ryder System, Inc. | 20,566 | 2,366,324 |
| | | 4,390,810 |
| Health Care Equipment & Supplies 4.2% |
| Artivion, Inc. (a) | 137,655 | 2,461,271 |
| Glaukos Corp. (a) | 14,804 | 1,176,770 |
| Globus Medical, Inc., Class A (a) | 33,413 | 1,780,579 |
| Inari Medical, Inc. (a) | 20,448 | 1,327,484 |
| Inspire Medical Systems, Inc. (a) | 9,133 | 1,857,926 |
| Lantheus Holdings, Inc. (a) | 20,211 | 1,253,082 |
| Omnicell, Inc. (a) | 31,739 | 1,194,339 |
| PROCEPT BioRobotics Corp. (a)(b) | 47,120 | 1,974,799 |
| Shockwave Medical, Inc. (a) | 6,014 | 1,146,028 |
| SI-BONE, Inc. (a) | 89,274 | 1,873,861 |
| | | 16,046,139 |
| Health Care Providers & Services 1.6% |
| Acadia Healthcare Co., Inc. (a) | 19,818 | 1,541,048 |
| Cross Country Healthcare, Inc. (a) | 44,560 | 1,008,838 |
| Premier, Inc., Class A | 54,755 | 1,224,322 |
| Progyny, Inc. (a) | 60,048 | 2,232,585 |
| | | 6,006,793 |
| Health Care REITs 0.6% |
| CareTrust REIT, Inc. | 108,960 | 2,438,525 |
| Health Care Technology 0.6% |
| Veradigm, Inc. (a) | 210,174 | 2,204,725 |
| Hotel & Resort REITs 1.2% |
| Pebblebrook Hotel Trust | 152,366 | 2,434,809 |
| Ryman Hospitality Properties, Inc. | 21,217 | 2,335,143 |
| | | 4,769,952 |
| Hotels, Restaurants & Leisure 2.0% |
| Cracker Barrel Old Country Store, Inc. (b) | 29,366 | 2,263,531 |
| Hilton Grand Vacations, Inc. (a) | 62,261 | 2,501,647 |
The notes to the financial statements are an integral part of, and should be read in conjunction with, the financial statements.
11
Portfolio of Investments December 31, 2023†^ (continued)
| | Shares | Value |
| Common Stocks (continued) |
| Hotels, Restaurants & Leisure (continued) |
| Wingstop, Inc. | 11,317 | $ ���2,903,716 |
| | | 7,668,894 |
| Household Durables 2.0% |
| Helen of Troy Ltd. (a) | 17,775 | 2,147,398 |
| Skyline Champion Corp. (a) | 74,533 | 5,534,820 |
| | | 7,682,218 |
| Household Products 0.5% |
| Energizer Holdings, Inc. | 58,421 | 1,850,777 |
| Insurance 2.0% |
| Kemper Corp. | 33,983 | 1,653,953 |
| Lancashire Holdings Ltd. | 260,825 | 2,074,554 |
| ProAssurance Corp. | 137,000 | 1,889,230 |
| SiriusPoint Ltd. (a) | 181,465 | 2,104,994 |
| | | 7,722,731 |
| Interactive Media & Services 1.2% |
| Eventbrite, Inc., Class A (a) | 65,887 | 550,815 |
| Taboola.com Ltd. (a) | 714,278 | 3,092,824 |
| Ziff Davis, Inc. (a) | 16,207 | 1,088,948 |
| | | 4,732,587 |
| Leisure Products 0.7% |
| Sturm Ruger & Co., Inc. | 32,910 | 1,495,759 |
| YETI Holdings, Inc. (a) | 24,510 | 1,269,128 |
| | | 2,764,887 |
| Machinery 2.8% |
| Blue Bird Corp. (a) | 94,994 | 2,561,038 |
| Greenbrier Cos., Inc. (The) | 54,291 | 2,398,576 |
| Kennametal, Inc. | 78,777 | 2,031,659 |
| Middleby Corp. (The) (a) | 8,293 | 1,220,481 |
| REV Group, Inc. | 135,291 | 2,458,238 |
| | | 10,669,992 |
| Media 1.3% |
| Criteo SA, Sponsored ADR (a) | 46,948 | 1,188,723 |
| Magnite, Inc. (a) | 256,399 | 2,394,767 |
| National CineMedia, Inc. (a)(b) | 368,202 | 1,524,356 |
| | | 5,107,846 |
| Metals & Mining 1.3% |
| Carpenter Technology Corp. | 41,382 | 2,929,846 |
| Compass Minerals International, Inc. | 38,676 | 979,276 |
| MP Materials Corp. (a) | 59,200 | 1,175,120 |
| | | 5,084,242 |
| | Shares | Value |
| |
| Mortgage Real Estate Investment Trusts 1.4% |
| Hannon Armstrong Sustainable Infrastructure Capital, Inc. (b) | 46,406 | $ 1,279,878 |
| Redwood Trust, Inc. | 317,259 | 2,350,889 |
| Rithm Capital Corp. | 177,282 | 1,893,372 |
| | | 5,524,139 |
| Office REITs 0.6% |
| Piedmont Office Realty Trust, Inc., Class A | 331,236 | 2,355,088 |
| Oil, Gas & Consumable Fuels 1.3% |
| PBF Energy, Inc., Class A | 50,413 | 2,216,155 |
| Viper Energy, Inc. | 88,354 | 2,772,549 |
| | | 4,988,704 |
| Personal Care Products 1.3% |
| Edgewell Personal Care Co. | 46,386 | 1,699,119 |
| elf Beauty, Inc. (a) | 23,714 | 3,422,879 |
| | | 5,121,998 |
| Pharmaceuticals 1.2% |
| Intra-Cellular Therapies, Inc. (a) | 18,213 | 1,304,415 |
| Pacira BioSciences, Inc. (a) | 66,840 | 2,255,181 |
| Structure Therapeutics, Inc., ADR (a) | 7,376 | 300,646 |
| Verona Pharma plc, ADR (a)(b) | 37,469 | 744,884 |
| | | 4,605,126 |
| Professional Services 2.0% |
| ExlService Holdings, Inc. (a) | 77,993 | 2,406,084 |
| TriNet Group, Inc. (a) | 18,919 | 2,250,037 |
| Verra Mobility Corp. (a) | 128,669 | 2,963,247 |
| | | 7,619,368 |
| Real Estate Management & Development 1.2% |
| Marcus & Millichap, Inc. | 58,993 | 2,576,814 |
| Tricon Residential, Inc. | 245,118 | 2,230,574 |
| | | 4,807,388 |
| Semiconductors & Semiconductor Equipment 3.2% |
| Ichor Holdings Ltd. (a) | 79,955 | 2,688,887 |
| MKS Instruments, Inc. | 10,206 | 1,049,891 |
| Semtech Corp. (a) | 87,693 | 1,921,354 |
| Silicon Motion Technology Corp., ADR | 35,963 | 2,203,453 |
| SiTime Corp. (a) | 7,841 | 957,229 |
| Synaptics, Inc. (a) | 10,468 | 1,194,189 |
| Tower Semiconductor Ltd. (a) | 73,621 | 2,246,913 |
| | | 12,261,916 |
| Software 6.3% |
| Adeia, Inc. | 159,310 | 1,973,851 |
| Agilysys, Inc. (a) | 26,944 | 2,285,390 |
The notes to the financial statements are an integral part of, and should be read in conjunction with, the financial statements.
| 12 | MainStay VP Wellington Small Cap Portfolio |
| | Shares | Value |
| Common Stocks (continued) |
| Software (continued) |
| Altair Engineering, Inc., Class A (a) | 32,165 | $ 2,706,685 |
| Clearwater Analytics Holdings, Inc., Class A (a) | 21,100 | 422,633 |
| CyberArk Software Ltd. (a) | 10,029 | 2,196,852 |
| DoubleVerify Holdings, Inc. (a) | 50,515 | 1,857,942 |
| Five9, Inc. (a) | 21,331 | 1,678,536 |
| Intapp, Inc. (a) | 20,565 | 781,881 |
| InterDigital, Inc. (b) | 21,724 | 2,357,923 |
| Jamf Holding Corp. (a) | 71,478 | 1,290,893 |
| Manhattan Associates, Inc. (a) | 4,881 | 1,050,977 |
| PowerSchool Holdings, Inc., Class A (a) | 77,917 | 1,835,725 |
| SolarWinds Corp. (a) | 169,586 | 2,118,129 |
| Xperi, Inc. (a) | 176,894 | 1,949,372 |
| | | 24,506,789 |
| Specialized REITs 0.6% |
| Uniti Group, Inc. | 400,362 | 2,314,092 |
| Specialty Retail 0.6% |
| Boot Barn Holdings, Inc. (a) | 11,897 | 913,214 |
| Monro, Inc. | 43,375 | 1,272,622 |
| | | 2,185,836 |
| Textiles, Apparel & Luxury Goods 2.5% |
| Carter's, Inc. | 25,153 | 1,883,708 |
| Crocs, Inc. (a) | 13,269 | 1,239,457 |
| Figs, Inc., Class A (a) | 279,995 | 1,945,965 |
| Kontoor Brands, Inc. | 36,189 | 2,258,918 |
| Steven Madden Ltd. | 57,653 | 2,421,426 |
| | | 9,749,474 |
| Trading Companies & Distributors 3.9% |
| Air Lease Corp. | 50,092 | 2,100,859 |
| Applied Industrial Technologies, Inc. | 15,570 | 2,688,783 |
| McGrath RentCorp | 18,708 | 2,237,851 |
| MRC Global, Inc. (a) | 284,887 | 3,136,606 |
| Rush Enterprises, Inc., Class A | 34,086 | 1,714,526 |
| Xometry, Inc., Class A (a) | 90,086 | 3,234,988 |
| | | 15,113,613 |
Total Common Stocks
(Cost $346,183,361) | | 369,568,603 |
| Exchange-Traded Funds 1.8% |
| iShares Russell 2000 ETF (b) | 11,638 | 2,335,863 |
| | Shares | | Value |
| |
| iShares Russell 2000 Growth ETF (b) | 3,752 | | $ 946,329 |
| iShares Russell 2000 Value ETF (b) | 24,391 | | 3,788,654 |
Total Exchange-Traded Funds
(Cost $6,404,655) | | | 7,070,846 |
| Short-Term Investments 5.2% |
| Affiliated Investment Company 2.5% |
| MainStay U.S. Government Liquidity Fund, 5.235% (c) | 9,753,530 | | 9,753,530 |
| Unaffiliated Investment Companies 2.7% |
| Dreyfus Treasury Obligations Cash Management Fund, 5.40% (c)(d) | 2,147,071 | | 2,147,071 |
| Goldman Sachs Financial Square Government Fund, 5.351% (c)(d) | 1,000,000 | | 1,000,000 |
| Invesco Government & Agency Portfolio, 5.361% (c)(d) | 4,074,380 | | 4,074,380 |
| Morgan Stanley Institutional Liquidity Fund Government Portfolio, 5.363% (c)(d) | 2,000,000 | | 2,000,000 |
| RBC U.S. Government Money Market Fund, 5.293% (c)(d) | 1,000,000 | | 1,000,000 |
| | | | 10,221,451 |
Total Short-Term Investments
(Cost $19,974,981) | | | 19,974,981 |
Total Investments
(Cost $372,562,997) | 102.5% | | 396,614,430 |
| Other Assets, Less Liabilities | (2.5) | | (9,790,041) |
| Net Assets | 100.0% | | $ 386,824,389 |
| † | Percentages indicated are based on Portfolio net assets. |
| ^ | Industry classifications may be different than those used for compliance monitoring purposes. |
| (a) | Non-income producing security. |
| (b) | All or a portion of this security was held on loan. As of December 31, 2023, the aggregate market value of securities on loan was $13,789,557; the total market value of collateral held by the Portfolio was $14,372,599. The market value of the collateral held included non-cash collateral in the form of U.S. Treasury securities with a value of $4,151,148. The Portfolio received cash collateral with a value of $10,221,451. (See Note 2(I)) |
| (c) | Current yield as of December 31, 2023. |
| (d) | Represents a security purchased with cash collateral received for securities on loan. |
The notes to the financial statements are an integral part of, and should be read in conjunction with, the financial statements.
13
Portfolio of Investments December 31, 2023†^ (continued)
Investments in Affiliates (in 000's)
Investments in issuers considered to be affiliate(s) of the Portfolio during the year ended December 31, 2023 for purposes of Section 2(a)(3) of the Investment Company Act of 1940, as amended, were as follows:
| Affiliated Investment Companies | Value,
Beginning
of Year | Purchases
at Cost | Proceeds
from
Sales | Net
Realized
Gain/(Loss)
on Sales | Change in
Unrealized
Appreciation/
(Depreciation) | Value,
End of
Year | Dividend
Income | Other
Distributions | Shares
End of
Year |
| MainStay U.S. Government Liquidity Fund | $ 3,651 | $ 95,008 | $ (88,905) | $ — | $ — | $ 9,754 | $ 291 | $ — | 9,754 |
Futures Contracts
As of December 31, 2023, the Portfolio held the following futures contracts1:
| Type | Number of
Contracts | Expiration
Date | Value at
Trade Date | Current
Notional
Amount | Unrealized
Appreciation
(Depreciation)2 |
| Long Contracts | | | | | |
| Russell 2000 E-Mini Index | 88 | March 2024 | $ 8,702,414 | $ 9,009,880 | $ 307,466 |
| 1. | As of December 31, 2023, cash in the amount of $629,200 was on deposit with a broker or futures commission merchant for futures transactions. |
| 2. | Represents the difference between the value of the contracts at the time they were opened and the value as of December 31, 2023. |
| Abbreviation(s): |
| ADR—American Depositary Receipt |
| ETF—Exchange-Traded Fund |
| REIT—Real Estate Investment Trust |
The following is a summary of the fair valuations according to the inputs used as of December 31, 2023, for valuing the Portfolio’s assets:
| Description | Quoted
Prices in
Active
Markets for
Identical
Assets
(Level 1) | | Significant
Other
Observable
Inputs
(Level 2) | | Significant
Unobservable
Inputs
(Level 3) | | Total |
| Asset Valuation Inputs | | | | | | | |
| Investments in Securities (a) | | | | | | | |
| Common Stocks | $ 369,568,603 | | $ — | | $ — | | $ 369,568,603 |
| Exchange-Traded Funds | 7,070,846 | | — | | — | | 7,070,846 |
| Short-Term Investments | | | | | | | |
| Affiliated Investment Company | 9,753,530 | | — | | — | | 9,753,530 |
| Unaffiliated Investment Companies | 10,221,451 | | — | | — | | 10,221,451 |
| Total Short-Term Investments | 19,974,981 | | — | | — | | 19,974,981 |
| Total Investments in Securities | 396,614,430 | | — | | — | | 396,614,430 |
| Other Financial Instruments | | | | | | | |
| Futures Contracts (b) | 307,466 | | — | | — | | 307,466 |
| Total Investments in Securities and Other Financial Instruments | $ 396,921,896 | | $ — | | $ — | | $ 396,921,896 |
| (a) | For a complete listing of investments and their industries, see the Portfolio of Investments. |
| (b) | The value listed for these securities reflects unrealized appreciation (depreciation) as shown on the Portfolio of Investments. |
The notes to the financial statements are an integral part of, and should be read in conjunction with, the financial statements.
| 14 | MainStay VP Wellington Small Cap Portfolio |
Statement of Assets and Liabilities as of December 31, 2023
| Assets |
Investment in unaffiliated securities, at value
(identified cost $362,809,467) including securities on loan of $13,789,557 | $386,860,900 |
Investment in affiliated investment companies, at value
(identified cost $9,753,530) | 9,753,530 |
| Cash collateral on deposit at broker for futures contracts | 629,200 |
| Receivables: | |
| Dividends | 503,250 |
| Portfolio shares sold | 58,853 |
| Securities lending | 3,893 |
| Other assets | 2,435 |
| Total assets | 397,812,061 |
| Liabilities |
| Cash collateral received for securities on loan | 10,221,451 |
| Payables: | |
| Portfolio shares redeemed | 253,203 |
| Manager (See Note 3) | 222,019 |
| Variation margin on futures contracts | 139,135 |
| Shareholder communication | 62,619 |
| NYLIFE Distributors (See Note 3) | 47,478 |
| Professional fees | 27,628 |
| Custodian | 13,440 |
| Accrued expenses | 699 |
| Total liabilities | 10,987,672 |
| Net assets | $386,824,389 |
| Composition of Net Assets |
| Shares of beneficial interest outstanding (par value of $.001 per share) unlimited number of shares authorized | $ 44,912 |
| Additional paid-in-capital | 430,274,669 |
| | 430,319,581 |
| Total distributable earnings (loss) | (43,495,192) |
| Net assets | $386,824,389 |
| Initial Class | |
| Net assets applicable to outstanding shares | $155,564,578 |
| Shares of beneficial interest outstanding | 17,932,065 |
| Net asset value per share outstanding | $ 8.68 |
| Service Class | |
| Net assets applicable to outstanding shares | $231,259,811 |
| Shares of beneficial interest outstanding | 26,979,957 |
| Net asset value per share outstanding | $ 8.57 |
The notes to the financial statements are an integral part of, and should be read in conjunction with, the financial statements.
15
Statement of Operations for the year ended December 31, 2023
| Investment Income (Loss) |
| Income | |
| Dividends-unaffiliated (net of foreign tax withholding of $26,792) | $ 5,640,895 |
| Dividends-affiliated | 291,060 |
| Securities lending, net | 82,987 |
| Total income | 6,014,942 |
| Expenses | |
| Manager (See Note 3) | 3,032,185 |
| Distribution/Service—Service Class (See Note 3) | 551,898 |
| Professional fees | 78,815 |
| Custodian | 30,208 |
| Trustees | 9,762 |
| Miscellaneous | 7,990 |
| Total expenses before waiver/reimbursement | 3,710,858 |
| Expense waiver/reimbursement from Manager (See Note 3) | (354,186) |
| Net expenses | 3,356,672 |
| Net investment income (loss) | 2,658,270 |
| Realized and Unrealized Gain (Loss) |
| Net realized gain (loss) on: | |
| Unaffiliated investment transactions | (21,755,794) |
| Futures transactions | 173,152 |
| Foreign currency transactions | 720 |
| Net realized gain (loss) | (21,581,922) |
| Net change in unrealized appreciation (depreciation) on: | |
| Unaffiliated investments | 68,280,447 |
| Futures contracts | 386,366 |
| Translation of other assets and liabilities in foreign currencies | (2) |
| Net change in unrealized appreciation (depreciation) | 68,666,811 |
| Net realized and unrealized gain (loss) | 47,084,889 |
| Net increase (decrease) in net assets resulting from operations | $ 49,743,159 |
The notes to the financial statements are an integral part of, and should be read in conjunction with, the financial statements.
| 16 | MainStay VP Wellington Small Cap Portfolio |
Statements of Changes in Net Assets
for the years ended December 31, 2023 and December 31, 2022
| | 2023 | 2022 |
| Increase (Decrease) in Net Assets |
| Operations: | | |
| Net investment income (loss) | $ 2,658,270 | $ 2,367,068 |
| Net realized gain (loss) | (21,581,922) | (47,768,878) |
| Net change in unrealized appreciation (depreciation) | 68,666,811 | (62,073,610) |
| Net increase (decrease) in net assets resulting from operations | 49,743,159 | (107,475,420) |
| Distributions to shareholders: | | |
| Initial Class | (1,214,596) | (49,470,351) |
| Service Class | (1,227,562) | (66,408,806) |
| Total distributions to shareholders | (2,442,158) | (115,879,157) |
| Capital share transactions: | | |
| Net proceeds from sales of shares | 32,412,984 | 42,762,495 |
| Net asset value of shares issued to shareholders in reinvestment of distributions | 2,442,158 | 115,879,157 |
| Cost of shares redeemed | (91,826,360) | (57,789,013) |
| Increase (decrease) in net assets derived from capital share transactions | (56,971,218) | 100,852,639 |
| Net increase (decrease) in net assets | (9,670,217) | (122,501,938) |
| Net Assets |
| Beginning of year | 396,494,606 | 518,996,544 |
| End of year | $386,824,389 | $ 396,494,606 |
The notes to the financial statements are an integral part of, and should be read in conjunction with, the financial statements.
17
Financial Highlights selected per share data and ratios
| | Year Ended December 31, |
| Initial Class | 2023 | | 2022 | | 2021 | | 2020 | | 2019 |
| Net asset value at beginning of year | $ 7.69 | | $ 13.79 | | $ 11.73 | | $ 10.65 | | $ 9.82 |
| Net investment income (loss) (a) | 0.07 | | 0.07 | | 0.16 | | 0.04 | | 0.05 |
| Net realized and unrealized gain (loss) | 0.99 | | (3.05) | | 1.95 | | 1.05 | | 1.61 |
| Total from investment operations | 1.06 | | (2.98) | | 2.11 | | 1.09 | | 1.66 |
| Less distributions: | | | | | | | | | |
| From net investment income | (0.07) | | (0.13) | | (0.05) | | (0.01) | | (0.02) |
| From net realized gain on investments | — | | (2.99) | | — | | — | | (0.81) |
| Total distributions | (0.07) | | (3.12) | | (0.05) | | (0.01) | | (0.83) |
| Net asset value at end of year | $ 8.68 | | $ 7.69 | | $ 13.79 | | $ 11.73 | | $ 10.65 |
| Total investment return (b) | 13.89% | | (20.83)% | | 18.03% | | 10.22% | | 17.82% |
| Ratios (to average net assets)/Supplemental Data: | | | | | | | | | |
| Net investment income (loss) | 0.84% | | 0.70% | | 0.93% | | 0.42% | | 0.48% |
| Net expenses (c) | 0.74% | | 0.74% | | 0.74% | | 0.75% | | 0.82% |
| Expenses (before waiver/reimbursement) (c) | 0.83% | | 0.85% | | 0.86% | | 0.86% | | 0.86% |
| Portfolio turnover rate | 61% | | 71% | | 83% | | 225% | | 257% |
| Net assets at end of year (in 000's) | $ 155,565 | | $ 172,629 | | $ 206,410 | | $ 197,586 | | $ 198,292 |
| (a) | Per share data based on average shares outstanding during the year. |
| (b) | Total return does not reflect any deduction of sales charges, mortality and expense charges, contract charges or administrative charges. For periods of less than one year, total return is not annualized. |
| (c) | In addition to the fees and expenses which the Portfolio bears directly, it also indirectly bears a pro-rata share of the fees and expenses of the underlying funds in which it invests. Such indirect expenses are not included in the above expense ratios. |
| | Year Ended December 31, |
| Service Class | 2023 | | 2022 | | 2021 | | 2020 | | 2019 |
| Net asset value at beginning of year | $ 7.59 | | $ 13.65 | | $ 11.61 | | $ 10.56 | | $ 9.76 |
| Net investment income (loss) (a) | 0.05 | | 0.05 | | 0.12 | | 0.02 | | 0.02 |
| Net realized and unrealized gain (loss) | 0.97 | | (3.02) | | 1.95 | | 1.03 | | 1.59 |
| Total from investment operations | 1.02 | | (2.97) | | 2.07 | | 1.05 | | 1.61 |
| Less distributions: | | | | | | | | | |
| From net investment income | (0.04) | | (0.10) | | (0.03) | | — | | (0.00)‡ |
| From net realized gain on investments | — | | (2.99) | | — | | — | | (0.81) |
| Total distributions | (0.04) | | (3.09) | | (0.03) | | — | | (0.81) |
| Net asset value at end of year | $ 8.57 | | $ 7.59 | | $ 13.65 | | $ 11.61 | | $ 10.56 |
| Total investment return (b) | 13.60% | | (21.03)% | | 17.73% | | 9.94%(c) | | 17.53% |
| Ratios (to average net assets)/Supplemental Data: | | | | | | | | | |
| Net investment income (loss) | 0.60% | | 0.44% | | 0.66% | | 0.17% | | 0.22% |
| Net expenses (d) | 0.99% | | 0.99% | | 0.99% | | 1.00% | | 1.07% |
| Expenses (before waiver/reimbursement) (d) | 1.08% | | 1.10% | | 1.11% | | 1.11% | | 1.12% |
| Portfolio turnover rate | 61% | | 71% | | 83% | | 225% | | 257% |
| Net assets at end of year (in 000's) | $ 231,260 | | $ 223,866 | | $ 312,587 | | $ 304,479 | | $ 317,216 |
| ‡ | Less than one cent per share. |
| (a) | Per share data based on average shares outstanding during the year. |
| (b) | Total return does not reflect any deduction of sales charges, mortality and expense charges, contract charges or administrative charges. For periods of less than one year, total return is not annualized. |
| (c) | Total investment return may reflect adjustments to conform to generally accepted accounting principles. |
| (d) | In addition to the fees and expenses which the Portfolio bears directly, it also indirectly bears a pro-rata share of the fees and expenses of the underlying funds in which it invests. Such indirect expenses are not included in the above expense ratios. |
The notes to the financial statements are an integral part of, and should be read in conjunction with, the financial statements.
| 18 | MainStay VP Wellington Small Cap Portfolio |
Notes to Financial Statements
Note 1–Organization and Business
MainStay VP Funds Trust (the “Fund”) was organized as a Delaware statutory trust on February 1, 2011. The Fund is registered under the Investment Company Act of 1940, as amended (the “1940 Act”), as an open-end management investment company. The Fund is comprised of thirty-one separate series (collectively referred to as the “Portfolios”). These financial statements and notes relate to the MainStay VP Wellington Small Cap Portfolio (the "Portfolio"), a "diversified” portfolio, as that term is defined in the 1940 Act, as interpreted or modified by regulatory authorities having jurisdiction, from time to time.
Shares of the Portfolio are currently offered to certain separate accounts to fund variable annuity policies and variable universal life insurance policies issued by New York Life Insurance and Annuity Corporation (“NYLIAC”), a wholly-owned subsidiary of New York Life Insurance Company (“New York Life”) and may also be offered to fund variable annuity policies and variable universal life insurance policies issued by other insurance companies. NYLIAC allocates shares of the Portfolio to, among others, certain NYLIAC separate accounts. Shares of the Portfolio are also offered to the MainStay VP Conservative Allocation Portfolio, MainStay VP Moderate Allocation Portfolio, MainStay VP Growth Allocation Portfolio and MainStay VP Equity Allocation Portfolio, which operate as “funds-of-funds," and other variable insurance funds.
The following table lists the Portfolio's share classes that have been registered and commenced operations:
| Class | Commenced Operations |
| Initial Class | May 2, 2016 |
| Service Class | May 2, 2016 |
Shares of the Portfolio are offered and are redeemed at a price equal to their respective net asset value (“NAV”) per share. No sales or redemption charge is applicable to the purchase or redemption of the Portfolio's shares. Under the terms of the Fund’s multiple class plan, adopted pursuant to Rule 18f-3 under the 1940 Act, the classes differ in that, among other things, Service Class shares of the Portfolio pay a combined distribution and service fee of 0.25% of average daily net assets attributable to Service Class shares of the Portfolio to the Distributor (as defined in Note 3(B)) pursuant to a plan adopted in accordance with Rule 12b-1 under the 1940 Act. Contract owners of variable annuity contracts purchased after June 2, 2003, are permitted to invest only in the Service Class shares.
The Portfolio's investment objective is to seek long-term growth of capital.
Note 2–Significant Accounting Policies
The Portfolio is an investment company and accordingly follows the investment company accounting and reporting guidance of the Financial Accounting Standards Board (“FASB”) Accounting Standards Codification Topic 946 Financial Services—Investment Companies. The Portfolio prepares its financial statements in accordance with generally accepted
accounting principles (“GAAP”) in the United States of America and follows the significant accounting policies described below.
(A) Securities Valuation. Investments are usually valued as of the close of regular trading on the New York Stock Exchange (the "Exchange") (usually 4:00 p.m. Eastern time) on each day the Portfolio is open for business ("valuation date").
Pursuant to Rule 2a-5 under the 1940 Act, the Board of Trustees of the Fund (the "Board") has designated New York Life Investment Management LLC (“New York Life Investments” or the "Manager") as its Valuation Designee (the "Valuation Designee"). The Valuation Designee is responsible for performing fair valuations relating to all investments in the Portfolio’s portfolio for which market quotations are not readily available; periodically assessing and managing material valuation risks; establishing and applying fair value methodologies; testing fair valuation methodologies; evaluating and overseeing pricing services; ensuring appropriate segregation of valuation and portfolio management functions; providing quarterly, annual and prompt reporting to the Board, as appropriate; identifying potential conflicts of interest; and maintaining appropriate records. The Valuation Designee has established a valuation committee ("Valuation Committee") to assist in carrying out the Valuation Designee’s responsibilities and establish prices of securities for which market quotations are not readily available. The Portfolio's and the Valuation Designee's policies and procedures ("Valuation Procedures") govern the Valuation Designee’s selection and application of methodologies for determining and calculating the fair value of Portfolio investments. The Valuation Designee may value the Portfolio's portfolio securities for which market quotations are not readily available and other Portfolio assets utilizing inputs from pricing services and other third-party sources. The Valuation Committee meets (in person, via electronic mail or via teleconference) on an ad-hoc basis to determine fair valuations and on a quarterly basis to review fair value events with respect to certain securities for which market quotations are not readily available, including valuation risks and back-testing results, and to preview reports to the Board.
The Valuation Committee establishes prices of securities for which market quotations are not readily available based on such methodologies and measurements on a regular basis after considering information that is reasonably available and deemed relevant by the Valuation Committee. The Board shall oversee the Valuation Designee and review fair valuation materials on a prompt, quarterly and annual basis and approve proposed revisions to the Valuation Procedures.
Investments for which market quotations are not readily available are valued at fair value as determined in good faith pursuant to the Valuation Procedures. A market quotation is readily available only when that quotation is a quoted price (unadjusted) in active markets for identical investments that the Portfolio can access at the measurement date, provided that a quotation will not be readily available if it is not reliable. "Fair value" is defined as the price the Portfolio would reasonably expect to receive upon selling an asset or liability in an orderly transaction to an independent buyer in the principal or most advantageous market for the
Notes to Financial Statements (continued)
asset or liability. Fair value measurements are determined within a framework that establishes a three-tier hierarchy that maximizes the use of observable market data and minimizes the use of unobservable inputs to establish a classification of fair value measurements for disclosure purposes. "Inputs" refer broadly to the assumptions that market participants would use in pricing the asset or liability, including assumptions about risk, such as the risk inherent in a particular valuation technique used to measure fair value using a pricing model and/or the risk inherent in the inputs for the valuation technique. Inputs may be observable or unobservable. Observable inputs reflect the assumptions market participants would use in pricing the asset or liability based on market data obtained from sources independent of the Portfolio. Unobservable inputs reflect the Portfolio’s own assumptions about the assumptions market participants would use in pricing the asset or liability based on the information available. The inputs or methodology used for valuing assets or liabilities may not be an indication of the risks associated with investing in those assets or liabilities. The three-tier hierarchy of inputs is summarized below.
| • | Level 1—quoted prices (unadjusted) in active markets for an identical asset or liability |
| • | Level 2—other significant observable inputs (including quoted prices for a similar asset or liability in active markets, interest rates and yield curves, prepayment speeds, credit risk, etc.) |
| • | Level 3—significant unobservable inputs (including the Portfolio's own assumptions about the assumptions that market participants would use in measuring fair value of an asset or liability) |
The level of an asset or liability within the fair value hierarchy is based on the lowest level of an input, both individually and in the aggregate, that is significant to the fair value measurement. The aggregate value by input level of the Portfolio’s assets and liabilities as of December 31, 2023, is included at the end of the Portfolio of Investments.
The Portfolio may use third-party vendor evaluations, whose prices may be derived from one or more of the following standard inputs, among others:
| • Broker/dealer quotes | • Benchmark securities |
| • Two-sided markets | • Reference data (corporate actions or material event notices) |
| • Bids/offers | • Monthly payment information |
| • Industry and economic events | • Reported trades |
An asset or liability for which a market quotation is not readily available is valued by methods deemed reasonable in good faith by the Valuation Committee, following the Valuation Procedures to represent fair value. Under these procedures, the Valuation Designee generally uses a market-based approach which may use related or comparable assets or liabilities, recent transactions, market multiples, book values and other relevant information. The Valuation Designee may also use an income-based valuation approach in which the anticipated future cash flows of the asset or liability are discounted to calculate fair value.
Discounts may also be applied due to the nature and/or duration of any restrictions on the disposition of the asset or liability. Fair value represents a good faith approximation of the value of a security. Fair value determinations involve the consideration of a number of subjective factors, an analysis of applicable facts and circumstances and the exercise of judgment. As a result, it is possible that the fair value for a security determined in good faith in accordance with the Valuation Procedures may differ from valuations for the same security determined for other funds using their own valuation procedures. Although the Valuation Procedures are designed to value a security at the price the Portfolio may reasonably expect to receive upon the security's sale in an orderly transaction, there can be no assurance that any fair value determination thereunder would, in fact, approximate the amount that the Portfolio would actually realize upon the sale of the security or the price at which the security would trade if a reliable market price were readily available. During the year ended December 31, 2023, there were no material changes to the fair value methodologies.
Securities which may be valued in this manner include, but are not limited to: (i) a security for which trading has been halted or suspended or otherwise does not have a readily available market quotation on a given day; (ii) a debt security that has recently gone into default and for which there is not a current market quotation; (iii) a security of an issuer that has entered into a restructuring; (iv) a security that has been delisted from a national exchange; (v) a security subject to trading collars for which no or limited trading takes place; and (vi) a security whose principal market has been temporarily closed at a time when, under normal conditions, it would be open. Securities valued in this manner are generally categorized as Level 2 or 3 in the hierarchy.
Equity securities, rights and warrants, if applicable, are valued at the last quoted sales prices as of the close of regular trading on the relevant exchange on each valuation date. Securities that are not traded on the valuation date are valued at the mean of the last quoted bid and ask prices. Prices are normally taken from the principal market in which each security trades. These securities are generally categorized as Level 1 in the hierarchy.
Exchange-traded funds (“ETFs”) are valued at the last quoted sales prices as of the close of regular trading on the relevant exchange on each valuation date. Securities that are not traded on the valuation date are valued at the mean of the last quoted bid and ask prices. Prices are normally taken from the principal market in which each security trades. These securities are generally categorized as Level 1 in the hierarchy.
Investments in mutual funds, including money market funds, are valued at their respective NAVs at the close of business each day on the valuation date. These securities are generally categorized as Level 1 in the hierarchy.
Futures contracts are valued at the last posted settlement price on the market where such futures are primarily traded. These securities are generally categorized as Level 1 in the hierarchy.
| 20 | MainStay VP Wellington Small Cap Portfolio |
Temporary cash investments acquired in excess of 60 days to maturity at the time of purchase are valued using the latest bid prices or using valuations based on a matrix system (which considers such factors as security prices, yields, maturities and ratings), both as furnished by independent pricing services. Temporary cash investments that mature in 60 days or less at the time of purchase ("Short-Term Investments") are valued using the amortized cost method of valuation, unless the use of such method would be inappropriate. The amortized cost method involves valuing a security at its cost on the date of purchase and thereafter assuming a constant amortization to maturity of the difference between such cost and the value on maturity date. Amortized cost approximates the current fair value of a security. Securities valued using the amortized cost method are not valued using quoted prices in an active market and are generally categorized as Level 2 in the hierarchy.
The information above is not intended to reflect an exhaustive list of the methodologies that may be used to value portfolio investments. The Valuation Procedures permit the use of a variety of valuation methodologies in connection with valuing portfolio investments. The methodology used for a specific type of investment may vary based on the market data available or other considerations. The methodologies summarized above may not represent the specific means by which portfolio investments are valued on any particular business day.
(B) Income Taxes. The Portfolio's policy is to comply with the requirements of the Internal Revenue Code of 1986, as amended (the “Internal Revenue Code”), applicable to regulated investment companies and to distribute all of its taxable income to the shareholders of the Portfolio within the allowable time limits.
The Manager evaluates the Portfolio’s tax positions to determine if the tax positions taken meet the minimum recognition threshold in connection with accounting for uncertainties in income tax positions taken or expected to be taken for the purposes of measuring and recognizing tax liabilities in the financial statements. Recognition of tax benefits of an uncertain tax position is permitted only to the extent the position is “more likely than not” to be sustained assuming examination by taxing authorities. The Manager analyzed the Portfolio's tax positions taken on federal, state and local income tax returns for all open tax years (for up to three tax years) and has concluded that no provisions for federal, state and local income tax are required in the Portfolio's financial statements. The Portfolio's federal, state and local income tax and federal excise tax returns for tax years for which the applicable statutes of limitations have not expired are subject to examination by the Internal Revenue Service and state and local departments of revenue.
(C) Dividends and Distributions to Shareholders. Dividends and distributions are recorded on the ex-dividend date. The Portfolio intends to declare and pay dividends from net investment income and distributions from net realized capital and currency gains, if any, at least annually. All dividends and distributions are reinvested at NAV in the same class of shares of the Portfolio. Dividends and distributions to shareholders are determined in accordance with federal income tax regulations and may differ from determinations using GAAP.
(D) Security Transactions and Investment Income. The Portfolio records security transactions on the trade date. Realized gains and losses on security transactions are determined using the identified cost method. Dividend income is recognized on the ex-dividend date, net of any foreign tax withheld at the source, and interest income is accrued as earned using the effective interest rate method. Distributions received from real estate investment trusts may be classified as dividends, capital gains and/or return of capital.
Investment income and realized and unrealized gains and losses on investments of the Portfolio are allocated pro rata to the separate classes of shares based upon their relative net assets on the date the income is earned or realized and unrealized gains and losses are incurred.
(E) Expenses. Expenses of the Fund are allocated to the individual Portfolios in proportion to the net assets of the respective Portfolios when the expenses are incurred, except where direct allocations of expenses can be made. Expenses (other than fees incurred under the distribution and service plans, further discussed in Note 3(B), which are charged directly to the Service Class shares) are allocated to separate classes of shares pro rata based upon their relative net assets on the date the expenses are incurred. The expenses borne by the Portfolio, including those of related parties to the Portfolio, are shown in the Statement of Operations.
Additionally, the Portfolio may invest in ETFs and mutual funds, which are subject to management fees and other fees that may cause the costs of investing in ETFs and mutual funds to be greater than the costs of owning the underlying securities directly. These indirect expenses of ETFs and mutual funds are not included in the amounts shown as expenses in the Statement of Operations or in the expense ratios included in the Financial Highlights.
(F) Use of Estimates. In preparing financial statements in conformity with GAAP, the Manager makes estimates and assumptions that affect the reported amounts and disclosures in the financial statements. Actual results could differ from those estimates and assumptions.
(G) Futures Contracts. A futures contract is an agreement to purchase or sell a specified quantity of an underlying instrument at a specified future date and price, or to make or receive a cash payment based on the value of a financial instrument (e.g., foreign currency, interest rate, security or securities index). The Portfolio is subject to risks such as market price risk, leverage risk, liquidity risk, counterparty risk, operational risk, legal risk and/or interest rate risk in the normal course of investing in these contracts. Upon entering into a futures contract, the Portfolio is required to pledge to the broker or futures commission merchant an amount of cash and/or U.S. government securities equal to a certain percentage of the collateral amount, known as the “initial margin.” During the period the futures contract is open, changes in the value of the contract are recognized as unrealized appreciation or depreciation by marking to market such contract on a daily basis to reflect the market value of the contract at the end of each day’s trading. The Portfolio agrees to receive from or pay to the broker or futures
Notes to Financial Statements (continued)
commission merchant an amount of cash equal to the daily fluctuation in the value of the contract. Such receipts or payments are known as “variation margin.” When the futures contract is closed, the Portfolio records a realized gain or loss equal to the difference between the proceeds from (or cost of) the closing transaction and the Portfolio's basis in the contract.
The use of futures contracts involves, to varying degrees, elements of market risk in excess of the amount recognized in the Statement of Assets and Liabilities. The contract or notional amounts and variation margin reflect the extent of the Portfolio's involvement in open futures positions. There are several risks associated with the use of futures contracts as hedging techniques. There can be no assurance that a liquid market will exist at the time when the Portfolio seeks to close out a futures contract. If no liquid market exists, the Portfolio would remain obligated to meet margin requirements until the position is closed. Futures contracts may involve a small initial investment relative to the risk assumed, which could result in losses greater than if the Portfolio did not invest in futures contracts. Futures contracts may be more volatile than direct investments in the instrument underlying the futures and may not correlate to the underlying instrument, causing a given hedge not to achieve its objectives. The Portfolio's activities in futures contracts have minimal counterparty risk as they are conducted through regulated exchanges that guarantee the futures against default by the counterparty. In the event of a bankruptcy or insolvency of a futures commission merchant that holds margin on behalf of the Portfolio, the Portfolio may not be entitled to the return of the entire margin owed to the Portfolio, potentially resulting in a loss. The Portfolio may invest in futures contracts to seek enhanced returns or to reduce the risk of loss by hedging certain of its holdings. The Portfolio's investment in futures contracts and other derivatives may increase the volatility of the Portfolio's NAVs and may result in a loss to the Portfolio.
(H) Foreign Currency Transactions. The Portfolio's books and records are maintained in U.S. dollars. Prices of securities denominated in foreign currency amounts are translated into U.S. dollars at the mean between the buying and selling rates last quoted by any major U.S. bank at the following dates:
(i) market value of investment securities, other assets and liabilities— at the valuation date; and
(ii) purchases and sales of investment securities, income and expenses—at the date of such transactions.
The assets and liabilities that are denominated in foreign currency amounts are presented at the exchange rates and market values at the close of the period. The realized and unrealized changes in net assets arising from fluctuations in exchange rates and market prices of securities are not separately presented.
Net realized gain (loss) on foreign currency transactions represents net currency gains or losses realized as a result of differences between the amounts of securities sale proceeds or purchase cost, dividends, interest and withholding taxes as recorded on the Portfolio's books, and the U.S.
dollar equivalent amount actually received or paid. Net currency gains or losses from valuing such foreign currency denominated assets and liabilities, other than investments at valuation date exchange rates, are reflected in unrealized foreign exchange gains or losses.
(I) Securities Lending. In order to realize additional income, the Portfolio may engage in securities lending, subject to the limitations set forth in the 1940 Act and relevant guidance by the staff of the Securities and Exchange Commission (“SEC”). If the Portfolio engages in securities lending, the Portfolio will lend through its custodian, JPMorgan Chase Bank, N.A., ("JPMorgan"), acting as securities lending agent on behalf of the Portfolio. Under the current arrangement, JPMorgan will manage the Portfolio's collateral in accordance with the securities lending agency agreement between the Portfolio and JPMorgan, and indemnify the Portfolio against counterparty risk. The loans will be collateralized by cash (which may be invested in a money market fund) and/or non-cash collateral (which may include U.S. Treasury securities and/or U.S. government agency securities issued or guaranteed by the United States government or its agencies or instrumentalities) at least equal at all times to the market value of the securities loaned. Non-cash collateral held at year end is segregated and cannot be transferred by the Portfolio. The Portfolio bears the risk of delay in recovery of, or loss of rights in, the securities loaned. The Portfolio may also record a realized gain or loss on securities deemed sold due to a borrower’s inability to return securities on loan. The Portfolio bears the risk of any loss on investment of cash collateral. The Portfolio will receive compensation for lending its securities in the form of fees or it will retain a portion of interest earned on the investment of any cash collateral. The Portfolio will also continue to receive interest and dividends on the securities loaned and any gain or loss in the market price of the securities loaned that may occur during the term of the loan will be for the account of the Portfolio. Income earned from securities lending activities, if any, is reflected in the Statement of Operations.
(J) Indemnifications. Under the Fund’s organizational documents, its officers and trustees are indemnified against certain liabilities that may arise out of performance of their duties to the Fund. Additionally, in the normal course of business, the Portfolio enters into contracts with third-party service providers that contain a variety of representations and warranties and that may provide general indemnifications. The Portfolio's maximum exposure under these arrangements is unknown, as this would involve future claims that may be made against the Portfolio that have not yet occurred. The Manager believes that the risk of loss in connection with these potential indemnification obligations is remote. However, there can be no assurance that material liabilities related to such obligations will not arise in the future, which could adversely impact the Portfolio.
(K) Quantitative Disclosure of Derivative Holdings. The following tables show additional disclosures related to the Portfolio's derivative and hedging activities, including how such activities are accounted for and their effect on the Portfolio's financial positions, performance and cash flows.
| 22 | MainStay VP Wellington Small Cap Portfolio |
The Portfolio entered into futures contracts to manage its exposure to the securities markets or to movements in interest rates and currency values.
Fair value of derivative instruments as of December 31, 2023:
| Asset Derivatives | Equity
Contracts
Risk | Total |
| Futures Contracts - Net Assets—Net unrealized appreciation on futures contracts (a) | $307,466 | $307,466 |
| Total Fair Value | $307,466 | $307,466 |
| (a) | Includes cumulative appreciation (depreciation) of futures contracts as reported in the Portfolio of Investments. Only current day’s variation margin is reported within the Statement of Assets and Liabilities. |
The effect of derivative instruments on the Statement of Operations for the year ended December 31, 2023:
| Net Realized Gain (Loss) from: | Equity
Contracts
Risk | Total |
| Futures Transactions | $173,152 | $173,152 |
| Total Net Realized Gain (Loss) | $173,152 | $173,152 |
| Net Change in Unrealized Appreciation (Depreciation) | Equity
Contracts
Risk | Total |
| Futures Contracts | $386,366 | $386,366 |
| Total Net Change in Unrealized Appreciation (Depreciation) | $386,366 | $386,366 |
| Average Notional Amount | Total |
| Futures Contracts Long | $4,894,439 |
Note 3–Fees and Related Party Transactions
(A) Manager and Subadvisor. New York Life Investments, a registered investment adviser and an indirect, wholly-owned subsidiary of New York Life, serves as the Portfolio's Manager, pursuant to an Amended and Restated Management Agreement ("Management Agreement"). The Manager provides offices, conducts clerical, recordkeeping and bookkeeping services and keeps most of the financial and accounting records required to be maintained by the Portfolio. Except for the portion of salaries and expenses that are the responsibility of the Portfolio, the Manager pays the salaries and expenses of all personnel affiliated with the Portfolio and certain operational expenses of the Portfolio. The Portfolio reimburses New York Life Investments in an amount equal to the portion of the compensation of the Chief Compliance Officer attributable to the Portfolio. Wellington Management Company LLP ("Wellington" or the "Subadvisor"), a registered investment adviser, serves as the Subadvisor to the Portfolio and is responsible for the day-to-day portfolio management of the Portfolio. Pursuant to the terms of a Subadvisory Agreement between New York Life Investments and Wellington, New York Life Investments pays for the services of the Subadvisor.
Pursuant to the Management Agreement, the Fund pays the Manager, on behalf of the Portfolio, a monthly fee for the services performed and the facilities furnished at an annual rate of the Portfolio's average daily net assets as follows: 0.80% up to $1 billion; 0.775% from $1 billion to $2 billion; and 0.75% in excess of $2 billion. During the year ended December 31, 2023, the effective management fee rate was 0.80% (exclusive of any applicable waivers/reimbursements) of the Portfolio's average daily net assets.
New York Life Investments has contractually agreed to waive fees and/or reimburse expenses so that Total Annual Portfolio Operating Expenses (excluding taxes, interest, litigation, extraordinary expenses, brokerage and other transaction expenses relating to the purchase or sale of portfolio investments and acquired (underlying) portfolio/fund fees and expenses) of Initial Class shares do not exceed 0.74% of the Portfolio's average daily net assets. New York Life Investments will apply an equivalent waiver or reimbursement, in an equal number of basis points, to Service Class shares. This agreement will remain in effect until May 1, 2024, and shall renew automatically for one-year terms unless New York Life Investments provides written notice of termination prior to the start of the next term or upon approval of the Board.
During the year ended December 31, 2023, New York Life Investments earned fees from the Portfolio in the amount of $3,032,185 and waived fees and/or reimbursed expenses in the amount of $354,186 and paid the Subadvisor fees in the amount of $1,318,807.
JPMorgan provides sub-administration and sub-accounting services to the Portfolio pursuant to an agreement with New York Life Investments. These services include calculating the daily NAVs of the Portfolio, maintaining the general ledger and sub-ledger accounts for the calculation of the Portfolio's NAVs, and assisting New York Life Investments in conducting various aspects of the Portfolio's administrative operations. For providing these services to the Portfolio, JPMorgan is compensated by New York Life Investments.
Pursuant to an agreement between the Fund and New York Life Investments, New York Life Investments is responsible for providing or procuring certain regulatory reporting services for the Portfolio. The Portfolio will reimburse New York Life Investments for the actual costs incurred by New York Life Investments in connection with providing or procuring these services for the Portfolio.
(B) Distribution and Service Fees. The Fund, on behalf of the Portfolio, has entered into a distribution agreement with NYLIFE Distributors LLC (the “Distributor”), an affiliate of New York Life Investments. The Portfolio has adopted a distribution plan (the “Plan”) in accordance with the provisions of Rule 12b-1 under the 1940 Act. Under the Plan, the Distributor has agreed to provide, through its affiliates or independent third parties, various distribution-related, shareholder and administrative support services to the Service Class shareholders. For its services, the Distributor is entitled to a combined distribution and service
Notes to Financial Statements (continued)
fee accrued daily and paid monthly at an annual rate of 0.25% of the average daily net assets attributable to the Service Class shares of the Portfolio.
Note 4-Federal Income Tax
As of December 31, 2023, the cost and unrealized appreciation (depreciation) of the Portfolio’s investment portfolio, including applicable derivative contracts and other financial instruments, as determined on a federal income tax basis, were as follows:
| | Federal Tax
Cost | Gross
Unrealized
Appreciation | Gross
Unrealized
(Depreciation) | Net
Unrealized
Appreciation/
(Depreciation) |
| Investments in Securities | $378,524,780 | $48,679,740 | $(30,590,090) | $18,089,650 |
As of December 31, 2023, the components of accumulated gain (loss) on a tax basis were as follows:
Ordinary
Income | Accumulated
Capital
and Other
Gain (Loss) | Other
Temporary
Differences | Unrealized
Appreciation
(Depreciation) | Total
Accumulated
Gain (Loss) |
| $3,544,017 | $(65,262,594) | $133,736 | $18,089,650 | $(43,495,191) |
The difference between book-basis and tax-basis unrealized appreciation (depreciation) is primarily due to wash sale adjustments and mark to market of futures contracts.
As of December 31, 2023, for federal income tax purposes, capital loss carryforwards of $65,262,594, as shown in the table below, were available to the extent provided by the regulations to offset future realized gains of the Portfolio. Accordingly, no capital gains distributions are expected to be paid to shareholders until net gains have been realized in excess of such amounts.
Capital Loss
Available Through | Short-Term
Capital Loss
Amounts (000’s) | Long-Term
Capital Loss
Amounts (000’s) |
| Unlimited | $35,175 | $30,087 |
During the years ended December 31, 2023 and December 31, 2022, the tax character of distributions paid as reflected in the Statements of Changes in Net Assets was as follows:
| | 2023 | 2022 |
| Distributions paid from: | | |
| Ordinary Income | $2,442,158 | $ 88,089,468 |
| Long-Term Capital Gains | — | 27,789,689 |
| Total | $2,442,158 | $115,879,157 |
Note 5–Custodian
JPMorgan is the custodian of cash and securities held by the Portfolio. Custodial fees are charged to the Portfolio based on the Portfolio's net assets and/or the market value of securities held by the Portfolio and the number of certain transactions incurred by the Portfolio.
Note 6–Line of Credit
The Portfolio and certain other funds managed by New York Life Investments maintain a line of credit with a syndicate of banks in order to secure a source of funds for temporary purposes to meet unanticipated or excessive redemption requests.
Effective July 25, 2023, under the credit agreement (the “Credit Agreement”), the aggregate commitment amount is $600,000,000 with an additional uncommitted amount of $100,000,000. The commitment fee is an annual rate of 0.15% of the average commitment amount payable quarterly, regardless of usage, to JPMorgan, who serves as the agent to the syndicate. The commitment fee is allocated among the Portfolio and certain other funds managed by New York Life Investments based upon their respective net assets and other factors. Interest on any revolving credit loan is charged based upon the Federal Funds Rate, Daily Simple Secured Overnight Financing Rate ("SOFR") + 0.10%, or the Overnight Bank Funding Rate, whichever is higher. The Credit Agreement expires on July 23, 2024, although the Portfolio, certain other funds managed by New York Life Investments and the syndicate of banks may renew the Credit Agreement for an additional year on the same or different terms or enter into a credit agreement with a different syndicate of banks. Prior to July 25, 2023, the aggregate commitment amount and the commitment fee were the same as those under the current Credit Agreement. During the year ended December 31, 2023, there were no borrowings made or outstanding with respect to the Portfolio under the Credit Agreement.
Note 7–Interfund Lending Program
Pursuant to an exemptive order issued by the SEC, the Portfolio, along with certain other funds managed by New York Life Investments, may participate in an interfund lending program. The interfund lending program provides an alternative credit facility that permits the Portfolio and certain other funds managed by New York Life Investments to lend or borrow money for temporary purposes directly to or from one another, subject to the conditions of the exemptive order. During the year ended December 31, 2023, there were no interfund loans made or outstanding with respect to the Portfolio.
Note 8–Purchases and Sales of Securities (in 000’s)
During the year ended December 31, 2023, purchases and sales of securities, other than short-term securities, were $228,181 and $290,028, respectively.
The Portfolio may purchase securities from or sell securities to other portfolios managed by the Subadvisor. These interportfolio transactions
| 24 | MainStay VP Wellington Small Cap Portfolio |
are primarily used for cash management purposes and are made pursuant to Rule 17a-7 under the 1940 Act. The Rule 17a-7 transactions during the year ended December 31, 2023, were as follows:
Purchases
(000's) | Sales
(000's) | Realized
Gain / (Loss)
(000's) |
| $397 | $1,360 | $(409) |
Note 9–Capital Share Transactions
Transactions in capital shares for the years ended December 31, 2023 and December 31, 2022, were as follows:
| Initial Class | Shares | Amount |
| Year ended December 31, 2023: | | |
| Shares sold | 1,624,524 | $ 12,642,093 |
| Shares issued to shareholders in reinvestment of distributions | 163,077 | 1,214,596 |
| Shares redeemed | (6,311,366) | (50,520,270) |
| Net increase (decrease) | (4,523,765) | $(36,663,581) |
| Year ended December 31, 2022: | | |
| Shares sold | 2,446,048 | $ 27,488,637 |
| Shares issued to shareholders in reinvestment of distributions | 6,649,151 | 49,470,351 |
| Shares redeemed | (1,607,897) | (17,992,442) |
| Net increase (decrease) | 7,487,302 | $ 58,966,546 |
| |
| Service Class | Shares | Amount |
| Year ended December 31, 2023: | | |
| Shares sold | 2,561,024 | $ 19,770,891 |
| Shares issued to shareholders in reinvestment of distributions | 166,720 | 1,227,562 |
| Shares redeemed | (5,239,480) | (41,306,090) |
| Net increase (decrease) | (2,511,736) | $(20,307,637) |
| Year ended December 31, 2022: | | |
| Shares sold | 1,368,591 | $ 15,273,858 |
| Shares issued to shareholders in reinvestment of distributions | 9,034,597 | 66,408,806 |
| Shares redeemed | (3,804,605) | (39,796,571) |
| Net increase (decrease) | 6,598,583 | $ 41,886,093 |
Note 10–Other Matters
As of the date of this report, the Portfolio faces a heightened level of risk associated with current uncertainty, volatility and state of economies, financial markets, rising interest rates, and labor and health conditions around the world. Events such as war, acts of terrorism, recessions, rapid inflation, the imposition of international sanctions, earthquakes, hurricanes, epidemics and pandemics and other unforeseen natural or human disasters may have broad adverse social, political and economic effects on the global economy, which could negatively impact the value of the Portfolio's investments. Developments that disrupt global economies and financial markets may magnify factors that affect the Portfolio's performance.
Note 11–Subsequent Events
In connection with the preparation of the financial statements of the Portfolio as of and for the year ended December 31, 2023, events and transactions subsequent to December 31, 2023, through the date the financial statements were issued, have been evaluated by the Manager for possible adjustment and/or disclosure. No subsequent events requiring financial statement adjustment or disclosure have been identified.
Report of Independent Registered Public Accounting Firm
To the Board of Trustees of MainStay VP Funds Trust and Shareholders of MainStay VP Wellington Small Cap Portfolio
Opinion on the Financial Statements
We have audited the accompanying statement of assets and liabilities, including the portfolio of investments, of MainStay VP Wellington Small Cap Portfolio (one of the portfolios constituting MainStay VP Funds Trust, referred to hereafter as the “Portfolio”) as of December 31, 2023, the related statement of operations for the year ended December 31, 2023, the statements of changes in net assets for each of the two years in the period ended December 31, 2023, including the related notes, and the financial highlights for each of the five years in the period ended December 31, 2023 (collectively referred to as the “financial statements”). In our opinion, the financial statements present fairly, in all material respects, the financial position of the Portfolio as of December 31, 2023, the results of its operations for the year then ended, the changes in its net assets for each of the two years in the period ended December 31, 2023 and the financial highlights for each of the five years in the period ended December 31, 2023 in conformity with accounting principles generally accepted in the United States of America.
Basis for Opinion
These financial statements are the responsibility of the Portfolio’s management. Our responsibility is to express an opinion on the Portfolio’s financial statements based on our audits. We are a public accounting firm registered with the Public Company Accounting Oversight Board (United States) (PCAOB) and are required to be independent with respect to the Portfolio in accordance with the U.S. federal securities laws and the applicable rules and regulations of the Securities and Exchange Commission and the PCAOB.
We conducted our audits of these financial statements in accordance with the standards of the PCAOB. Those standards require that we plan and perform the audit to obtain reasonable assurance about whether the financial statements are free of material misstatement, whether due to error or fraud.
Our audits included performing procedures to assess the risks of material misstatement of the financial statements, whether due to error or fraud, and performing procedures that respond to those risks. Such procedures included examining, on a test basis, evidence regarding the amounts and disclosures in the financial statements. Our audits also included evaluating the accounting principles used and significant estimates made by management, as well as evaluating the overall presentation of the financial statements. Our procedures included confirmation of securities owned as of December 31, 2023 by correspondence with the custodian, transfer agents and broker. We believe that our audits provide a reasonable basis for our opinion.
/s/PricewaterhouseCoopers LLP
New York, New York
February 26, 2024
We have served as the auditor of one or more investment companies in the MainStay group of funds since 1984.
| 26 | MainStay VP Wellington Small Cap Portfolio |
Board Consideration and Approval of Management Agreement and Subadvisory Agreement (Unaudited)
The continuation of the Management Agreement with respect to the MainStay VP Wellington Small Cap Portfolio (“Portfolio”) and New York Life Investment Management LLC (“New York Life Investments”) and the Subadvisory Agreement between New York Life Investments and Wellington Management Company LLP (“WMC”) with respect to the Portfolio (together, “Advisory Agreements”) is subject to annual review and approval by the Board of Trustees of MainStay VP Funds Trust (“Board” of the “Trust”) in accordance with Section 15 of the Investment Company Act of 1940, as amended (“1940 Act”). At its December 6–7, 2023 meeting, the Board, including the Trustees who are not an “interested person” (as such term is defined in the 1940 Act) of the Trust (“Independent Trustees”) voting separately, unanimously approved the continuation of each of the Advisory Agreements for a one-year period.
In reaching the decision to approve the continuation of each of the Advisory Agreements, the Board considered information and materials furnished by New York Life Investments and WMC in connection with an annual contract review process undertaken by the Board that took place at meetings of the Board and its Contracts Committee from September 2023 through December 2023, including information and materials furnished by New York Life Investments and WMC in response to requests prepared on behalf of the Board, and in consultation with the Independent Trustees, by independent legal counsel to the Independent Trustees, which encompassed a variety of topics, including those summarized below. Information and materials requested by and furnished to the Board for consideration in connection with the contract review process included, among other items, reports on the Portfolio and “peer funds” prepared by Institutional Shareholder Services Inc. (“ISS”), an independent third-party service provider engaged by the Board to report objectively on the Portfolio’s investment performance, management fee and total expenses. The Board also considered information on the fees charged to other investment advisory clients of New York Life Investments and/or WMC that follow investment strategies similar to those of the Portfolio, if any, and, when applicable, the rationale for differences in the Portfolio’s management and subadvisory fees and the fees charged to those other investment advisory clients. In addition, the Board considered information regarding the legal standards and fiduciary obligations applicable to its consideration of the continuation of each of the Advisory Agreements. The contract review process, including the structure and format for information and materials provided to the Board, has been developed in consultation with the Board. The Independent Trustees also met in executive sessions with their independent legal counsel and, for portions thereof, with senior management of New York Life Investments.
The Board’s deliberations with respect to the continuation of each of the Advisory Agreements reflect a year-long process, and the Board also took into account information furnished to the Board and its Committees throughout the year, as deemed relevant and appropriate by the Trustees, including, among other items, reports on investment performance of the Portfolio and investment-related matters for the Portfolio as well as presentations from New York Life Investments and, generally annually, WMC personnel. In addition, the Board took into account other information provided by New York Life Investments throughout the year,
including, among other items, periodic reports on legal and compliance matters, risk management, portfolio turnover, brokerage commissions and non-advisory services provided to the Portfolio by New York Life Investments, as deemed relevant and appropriate by the Trustees.
In addition to information provided to the Board throughout the year, the Board received information in connection with its June 2023 meeting provided specifically in response to requests prepared on behalf of the Board, and in consultation with the Independent Trustees, by independent legal counsel to the Independent Trustees regarding the Portfolio’s distribution arrangements. In addition, the Board received information regarding the Portfolio’s asset levels, share purchase and redemption activity and the payment of Rule 12b-1 and/or certain other fees by applicable share classes of the Portfolio, among other information.
In considering the continuation of each of the Advisory Agreements, the Trustees reviewed and evaluated the information and factors they believed to reasonably be necessary and appropriate in light of legal advice furnished to them by independent legal counsel to the Independent Trustees and through the exercise of their own business judgment. Although individual Trustees may have weighed certain factors or information differently and the Board did not consider any single factor or information controlling in reaching its decision, the factors that figured prominently in the Board’s consideration of the continuation of each of the Advisory Agreements are summarized in more detail below and include, among other factors: (i) the nature, extent and quality of the services provided to the Portfolio by New York Life Investments and WMC; (ii) the qualifications of the portfolio managers of the Portfolio and the historical investment performance of the Portfolio, New York Life Investments and WMC; (iii) the costs of the services provided, and profits realized, by New York Life Investments and WMC with respect to their relationships with the Portfolio; (iv) the extent to which economies of scale have been realized or may be realized if the Portfolio grows and the extent to which any economies of scale have been shared, have benefited or may benefit the Portfolio’s shareholders; and (v) the reasonableness of the Portfolio’s management and subadvisory fees and total ordinary operating expenses. Although the Board recognized that comparisons between the Portfolio’s fees and expenses and those of other funds are imprecise given different terms of agreements, variations in fund strategies and other factors, the Board considered the reasonableness of the Portfolio’s management fee and total ordinary operating expenses as compared to the peer funds identified by ISS. Throughout their considerations, the Trustees acknowledged the commitment of New York Life Investments and its affiliates to serve the MainStay Group of Funds, as well as their capacity, experience, resources, financial stability and reputations. The Trustees also acknowledged the entrepreneurial and other risks assumed by New York Life Investments in sponsoring and managing the Portfolio. With respect to the Subadvisory Agreement, the Board took into account New York Life Investments’ recommendation to approve the continuation of the Subadvisory Agreement.
The Trustees noted that, throughout the year, the Trustees are afforded an opportunity to ask questions of, and request additional information or materials from, New York Life Investments and WMC. The Board’s
Board Consideration and Approval of Management Agreement and Subadvisory Agreement (Unaudited) (continued)
decision with respect to each of the Advisory Agreements may have also been based, in part, on the Board’s knowledge of New York Life Investments and WMC resulting from, among other things, the Board’s consideration of each of the Advisory Agreements in prior years, the advisory agreements for other funds in the MainStay Group of Funds, the Board’s review throughout the year of the performance and operations of other funds in the MainStay Group of Funds and each Trustee’s business judgment and industry experience. In addition to considering the above-referenced factors, the Board observed that in the marketplace, notably under variable life insurance policies and variable annuity contracts for which the Portfolio serves as an investment option, there are a range of investment options available to investors and that the Portfolio’s shareholders, having had the opportunity to consider other investment options, have invested in the Portfolio.
The factors that figured prominently in the Board’s decision to approve the continuation of each of the Advisory Agreements during the Board’s December 6–7, 2023 meeting are summarized in more detail below.
Nature, Extent and Quality of Services Provided by New York Life Investments and WMC
The Board examined the nature, extent and quality of the services that New York Life Investments provides to the Portfolio. The Board evaluated New York Life Investments’ experience and capabilities in serving as manager of the Portfolio and considered that the Portfolio operates in a “manager-of-managers” structure. The Board also considered New York Life Investments’ responsibilities and services provided pursuant to this structure, including overseeing the services provided by WMC, evaluating the performance of WMC, making recommendations to the Board as to whether the Subadvisory Agreement should be renewed, modified or terminated and periodically reporting to the Board regarding the results of New York Life Investments’ evaluation and monitoring functions. The Board noted that New York Life Investments manages other mutual funds, serves a variety of other investment advisory clients, including other pooled investment vehicles, and has experience overseeing mutual fund service providers, including subadvisors. The Board considered the experience of senior personnel at New York Life Investments providing management and administrative and other non-advisory services to the Portfolio. The Board observed that New York Life Investments devotes significant resources and time to providing management and administrative and other non-advisory services to the Portfolio, including New York Life Investments’ oversight and due diligence reviews of WMC and ongoing analysis of, and interactions with, WMC with respect to, among other things, the Portfolio’s investment performance and risks as well as WMC’s investment capabilities and subadvisory services with respect to the Portfolio.
The Board also considered the range of services that New York Life Investments provides to the Portfolio under the terms of the Management Agreement, including: (i) fund accounting and ongoing supervisory services provided by New York Life Investments’ Fund Administration and Accounting Group; (ii) investment supervisory and analytical services provided by New York Life Investments’ Investment Consulting Group; (iii)
compliance services provided by the Trust’s Chief Compliance Officer as well as New York Life Investments’ compliance department, including supervision and implementation of the Portfolio’s compliance program; (iv) legal services provided by New York Life Investments’ Office of the General Counsel; and (v) risk management monitoring and analysis by compliance and investment personnel. In addition, the Board considered New York Life Investments’ willingness to invest in personnel and other resources, such as cyber security, information security and business continuity planning, that may benefit the Portfolio and noted that New York Life Investments is responsible for compensating the Trust’s officers, except for a portion of the salary of the Trust’s Chief Compliance Officer. The Board recognized that New York Life Investments provides certain other non-advisory services to the Portfolio and has over time provided an increasingly broad array of non-advisory services to the MainStay Group of Funds as a result of regulatory and other developments.
The Board also examined the range, and the nature, extent and quality, of the investment advisory services that WMC provides to the Portfolio and considered the terms of each of the Advisory Agreements. The Board evaluated WMC’s experience and performance in serving as subadvisor to the Portfolio and advising other portfolios and WMC’s track record and experience in providing investment advisory services as well as the experience of investment advisory, senior management and administrative personnel at WMC. The Board considered New York Life Investments’ and WMC’s overall resources, legal and compliance environment, capabilities, reputation, financial condition and history. In addition to information provided in connection with quarterly meetings with the Trust’s Chief Compliance Officer, the Board considered information regarding the compliance policies and procedures of New York Life Investments and WMC and acknowledged their commitment to further developing and strengthening compliance programs that may relate to the Portfolio. The Board also considered WMC’s ability to recruit and retain qualified investment professionals and willingness to invest in personnel and other resources that may benefit the Portfolio. In this regard, the Board considered the qualifications and experience of the Portfolio’s portfolio managers, the number of accounts managed by the portfolio managers and the method for compensating the portfolio managers.
In addition, the Board considered information provided by New York Life Investments and WMC regarding their respective business continuity and disaster recovery plans.
Based on these considerations, among others, the Board concluded that the Portfolio would likely continue to benefit from the nature, extent and quality of these services.
Investment Performance
In evaluating the Portfolio’s investment performance, the Board considered investment performance results over various periods in light of the Portfolio’s investment objective, strategies and risks. The Board considered investment reports on, and analysis of, the Portfolio’s performance provided to the Board throughout the year. These reports include, among other items, information on the Portfolio’s gross and net
| 28 | MainStay VP Wellington Small Cap Portfolio |
returns, the Portfolio’s investment performance compared to a relevant investment category and the Portfolio’s benchmark, the Portfolio’s risk-adjusted investment performance and the Portfolio’s investment performance as compared to peer funds, as appropriate, as well as portfolio attribution information and commentary on the effect of market conditions. The Board also considered information provided by ISS showing the investment performance of the Portfolio as compared to peer funds. In addition, the Board reviewed the methodology used by ISS to construct the group of peer funds for comparative purposes.
The Board also took into account its discussions with senior management at New York Life Investments concerning the Portfolio’s investment performance over various periods as well as discussions between representatives of WMC and the members of the Board’s Investment Committee, which generally occur on an annual basis. In considering the investment performance of the Portfolio, the Board noted that the Portfolio underperformed its peer funds for the one-, three- and five-year periods ended July 31, 2023. The Board considered its discussions with representatives from New York Life Investments and WMC regarding the Portfolio’s investment performance.
Based on these considerations, among others, the Board concluded that its review of the Portfolio’s investment performance and related information supported a determination to approve the continuation of each of the Advisory Agreements.
Costs of the Services Provided, and Profits and Other Benefits Realized, by New York Life Investments and WMC
The Board considered the costs of the services provided under each of the Advisory Agreements. The Board also considered the profitability of New York Life Investments and its affiliates and WMC due to their relationships with the Portfolio as well as by New York Life Investments and its affiliates due to their relationships with the MainStay Group of Funds. With respect to the profitability of WMC’s relationship with the Portfolio, the Board considered information from New York Life Investments that WMC’s subadvisory fee reflected an arm’s-length negotiation and that this fee is paid by New York Life Investments, not the Portfolio, and the relevance of WMC’s profitability was considered by the Trustees in that context. On this basis, the Board primarily considered the costs and profitability for New York Life Investments and its affiliates with respect to the Portfolio.
In addition, the Board acknowledged the difficulty in obtaining reliable comparative data about mutual fund managers’ profitability because such information generally is not publicly available and may be impacted by numerous factors, including the structure of a fund manager’s organization, the types of funds it manages, the methodology used to allocate certain fixed costs to specific funds and the manager’s capital structure and costs of capital.
In evaluating the costs of the services provided by New York Life Investments and WMC, and profitability of New York Life Investments and its affiliates and WMC due to their relationships with the Portfolio, the Board considered, among other factors, New York Life Investments’ and
its affiliates’ and WMC’s continuing investments in, or willingness to invest in, personnel and other resources that may support and further enhance the management of the Portfolio, and that New York Life Investments is responsible for paying the subadvisory fee for the Portfolio. The Board also considered the financial resources of New York Life Investments and WMC and acknowledged that New York Life Investments and WMC must be in a position to recruit and retain experienced professional personnel and to maintain a strong financial position for New York Life Investments and WMC to continue to provide high-quality services to the Portfolio. The Board recognized that the Portfolio benefits from the allocation of certain fixed costs among the funds in the MainStay Group of Funds, among other expected benefits resulting from its relationship with New York Life Investments.
The Board considered information regarding New York Life Investments’ methodology for calculating profitability and allocating costs provided by New York Life Investments in connection with the fund profitability analysis presented to the Board. The Board concluded that New York Life Investments’ methods for allocating costs and procedures for estimating overall profitability of the relationship with the funds in the MainStay Group of Funds were reasonable. The Board recognized the difficulty in calculating and evaluating a manager’s profitability with respect to the Portfolio and considered that other profitability methodologies may also be reasonable.
The Board also considered certain fall-out benefits that may be realized by New York Life Investments and its affiliates and WMC and its affiliates due to their relationships with the Portfolio, including reputational and other indirect benefits. The Board recognized, for example, the benefits to WMC from legally permitted “soft-dollar” arrangements by which brokers provide research and other services to WMC in exchange for commissions paid by the Portfolio with respect to trades in the Portfolio’s portfolio securities. In this regard, the Board also requested and considered information from New York Life Investments concerning other material business relationships between WMC and its affiliates and New York Life Investments and its affiliates and considered the existence of a strategic partnership between New York Life Investments and WMC that relates to certain current and future products and represents a potential conflict of interest associated with New York Life Investments’ recommendation to approve the Subadvisory Agreement. In addition, the Board considered its review of the management agreement for a money market fund advised by New York Life Investments and an affiliated subadvisor that serves as an investment option for the Portfolio, including the potential rationale for and costs associated with investments in this money market fund by the Portfolio, if any, and considered information from New York Life Investments that the nature and type of specific investment advisory services provided to this money market fund are distinct from, or in addition to, the investment advisory services provided to the Portfolio. In addition, the Board considered the potential dividend received tax deduction for insurance company affiliates of New York Life Investments from the Portfolio’s securities lending activity.
Board Consideration and Approval of Management Agreement and Subadvisory Agreement (Unaudited) (continued)
The Board noted that the Portfolio serves as an investment option primarily under variable contracts issued by affiliates of New York Life Investments that would receive fees under those contracts. The Board observed that, in addition to fees earned by New York Life Investments under the Management Agreement for managing the Portfolio, New York Life Investments’ affiliates also earn revenues from serving the Portfolio in various other capacities, including as the Portfolio’s distributor, and insurance companies affiliated with New York Life Investments would be entitled to receive fees from the Portfolio under a distribution and service plan adopted pursuant to Rule 12b-1 under the 1940 Act. The Board considered information about these other revenues and their impact on the profitability of the relationship with the Portfolio to New York Life Investments and its affiliates. The Board noted that, although it assessed the overall profitability of the relationship with the Portfolio to New York Life Investments and its affiliates as part of the contract review process, when considering the reasonableness of the fee paid to New York Life Investments under the Management Agreement, the Board considered the profitability of New York Life Investments’ relationship with the Portfolio on a pre-tax basis and without regard to distribution expenses incurred by New York Life Investments from its own resources.
After evaluating the information deemed relevant by the Trustees, the Board concluded that any profits realized by New York Life Investments and its affiliates due to their relationships with the Portfolio were not excessive, other expected benefits that may accrue to New York Life Investments and its affiliates are reasonable and other expected benefits that may accrue to WMC and its affiliates are consistent with those expected for a subadvisor to a mutual fund. With respect to WMC, the Board considered that any profits realized by WMC due to its relationship with the Portfolio are the result of arm’s-length negotiations between New York Life Investments and WMC, acknowledging that any such profits are based on the subadvisory fee paid to WMC by New York Life Investments, not the Portfolio.
Management and Subadvisory Fees and Total Ordinary Operating Expenses
The Board evaluated the reasonableness of the fee paid under each of the Advisory Agreements and the Portfolio’s total ordinary operating expenses. With respect to the management fee and subadvisory fee, the Board primarily considered the reasonableness of the management fee paid by the Portfolio to New York Life Investments because the subadvisory fee paid to WMC is paid by New York Life Investments, not the Portfolio. The Board also considered the reasonableness of the subadvisory fee paid by New York Life Investments and the amount of the management fee retained by New York Life Investments.
In assessing the reasonableness of the Portfolio’s fees and expenses, the Board primarily considered comparative data provided by ISS on the fees and expenses of similar mutual funds managed by other investment advisers. The Board reviewed the methodology used by ISS to construct the group of peer funds for comparative purposes. In addition, the Board considered information provided by New York Life Investments and WMC on fees charged to other investment advisory clients, including
institutional separate accounts and/or other funds, that follow investment strategies similar to those of the Portfolio, if any. The Board considered the contractual management fee schedule for the Portfolio as compared to those for such other investment advisory clients, taking into account the rationale for differences in fee schedules. The Board also took into account information provided by New York Life Investments about the more extensive scope of services provided to registered investment companies, such as the Portfolio, as compared with other investment advisory clients. Additionally, the Board considered the impact of contractual breakpoints, voluntary waivers and expense limitation arrangements on the Portfolio’s net management fee and expenses. The Board also considered that in proposing fees for the Portfolio, New York Life Investments considers the competitive marketplace for mutual funds.
Based on the factors outlined above, among other considerations, the Board concluded that the Portfolio’s management fee and total ordinary operating expenses are within a range that is competitive and support a conclusion that these fees and expenses are reasonable.
Economies of Scale
The Board considered information regarding economies of scale, including whether economies of scale may exist with respect to the Portfolio and whether the Portfolio’s management fee and expense structure permits any economies of scale to be appropriately shared with the Portfolio’s shareholders. The Board also considered a report from New York Life Investments, previously prepared at the request of the Board, that addressed economies of scale, including with respect to the mutual fund business generally, and the various ways in which the benefits of economies of scale may be shared with the funds in the MainStay Group of Funds. Although the Board recognized the difficulty of determining economies of scale with precision, the Board acknowledged that economies of scale may be shared with the Portfolio in a number of ways, including, for example, through the imposition of fee breakpoints, initially setting management fee rates at scale or making additional investments to enhance the services provided to the Portfolio. The Board reviewed information from New York Life Investments showing how the Portfolio’s management fee schedule compared to fee schedules of other funds and accounts managed by New York Life Investments. The Board also reviewed information from ISS showing how the Portfolio’s management fee schedule compared with fees paid for similar services by peer funds at varying asset levels.
Based on this information, the Board concluded that economies of scale are appropriately shared for the benefit of the Portfolio’s shareholders through the Portfolio’s management fee and expense structure and other methods to share benefits from economies of scale.
| 30 | MainStay VP Wellington Small Cap Portfolio |
Conclusion
On the basis of the information and factors summarized above, among other information and factors deemed relevant by the Trustees, and the evaluation thereof, the Board, including the Independent Trustees voting separately, unanimously voted to approve the continuation of each of the Advisory Agreements.
Proxy Voting Policies and Procedures and Proxy Voting Record
The Portfolio is required to file with the SEC its proxy voting record for the 12-month period ending June 30 on Form N-PX. A description of the policies and procedures that are used to vote proxies relating to portfolio securities of the Portfolio is available free of charge upon request by calling 800-598-2019 or visiting the SEC's website at www.sec.gov. The most recent Form N-PX or proxy voting record is available free of charge upon request by calling 800-598-2019; visiting https://www.newyorklifeinvestments.com/investment-products/vp; or visiting the SEC’s website at www.sec.gov.
Shareholder Reports and Quarterly Portfolio Disclosure
The Portfolio is required to file its complete schedule of portfolio holdings with the SEC 60 days after its first and third fiscal quarter on Form N-PORT. The Portfolio's holdings report is available free of charge upon request by calling 800-598-2019 or by visiting the SEC’s website at www.sec.gov.
| 32 | MainStay VP Wellington Small Cap Portfolio |
Board of Trustees and Officers (Unaudited)
The Trustees and officers of the Portfolio are listed below. The Board oversees the MainStay Group of Funds (which consists of MainStay Funds and MainStay Funds Trust), MainStay VP Funds Trust, MainStay MacKay DefinedTerm Municipal Opportunities Fund, MainStay CBRE Global Infrastructure Megatrends Term Fund, the Manager and the Subadvisors, and elects the officers of the Portfolios who are responsible for the day-to-day operations of the Portfolio. Information pertaining to the Trustees and officers is set forth below. Each Trustee serves until his or her successor is elected and qualified or until his or her resignation,
death or removal. Under the Board’s retirement policy, unless an exception is made, a Trustee must tender his or her resignation by the end of the calendar year during which he or she reaches the age of 75. Officers are elected annually by the Board. The business address of each Trustee and officer listed below is 51 Madison Avenue, New York, New York 10010. A majority of the Trustees are not “interested persons” (as defined by the 1940 Act and rules adopted by the SEC thereunder) of the Portfolio (“Independent Trustees”).
| | Name and
Year of Birth | Term of Office,
Position(s) Held and
Length of Service | Principal Occupation(s)
During Past Five Years | Number of
Portfolios in
Fund Complex
Overseen by
Trustee | Other Directorships
Held by Trustee |
| | | | | | |
| | Naïm Abou-Jaoudé*
1966 | MainStay VP Funds Trust: Trustee since 2023 | Chief Executive Officer of New York Life Investment Management LLC (since 2023). Chief Executive Officer of Candriam (an affiliate of New York Life Investment Management LLC) (2007 to 2023). | 81 | MainStay Funds: Trustee since 2023 (11 Funds)
MainStay Funds Trust: Trustee since 2023 (37 Funds);
MainStay MacKay DefinedTerm Municipal Opportunities Fund: Trustee since 2023;
MainStay CBRE Global Infrastructure Megatrends Term Fund: Trustee since 2023; and
New York Life Investment Management International (Chair) since 2015 |
| * | This Trustee is considered to be an “interested person” of the MainStay Group of Funds, MainStay VP Funds Trust, MainStay CBRE Global Infrastructure Megatrends Term Fund and MainStay MacKay DefinedTerm Municipal Opportunities Fund, within the meaning of the 1940 Act because of his affiliation with New York Life Investment Management LLC and Candriam, as described in detail above in the column entitled “Principal Occupation(s) During Past Five Years.” |
| | |
Board of Trustees and Officers (Unaudited) (continued)
| | Name and
Year of Birth | Term of Office,
Position(s) Held and
Length of Service | Principal Occupation(s)
During Past Five Years | Number of
Portfolios in
Fund Complex
Overseen by
Trustee | Other Directorships
Held by Trustee |
| | | | | | |
| | David H. Chow
1957 | MainStay VP Funds Trust: Trustee since January 2016, Advisory Board Member (June 2015 to December 2015) | Founder and CEO, DanCourt Management, LLC since 1999 | 81 | MainStay Funds: Trustee since January 2016, Advisory Board Member (June 2015 to December 2015) (11 Funds);
MainStay Funds Trust: Trustee since January 2016, Advisory Board Member (June 2015 to December 2015) (37 Funds);
MainStay MacKay DefinedTerm Municipal Opportunities Fund: Trustee since January 2016, Advisory Board Member (June 2015 to December 2015);
MainStay CBRE Global Infrastructure Megatrends Term Fund: Trustee since 2021;
VanEck Vectors Group of Exchange-Traded Funds: Trustee since 2006 and Independent Chairman of the Board of Trustees from 2008 to 2022 (57 portfolios); and
Berea College of Kentucky: Trustee since 2009, Chair of the Investment Committee since 2018 |
| | Karen Hammond
1956 | MainStay VP Funds Trust: Trustee since December 2021, Advisory Board Member (June 2021 to December 2021)
| Retired, Managing Director, Devonshire Investors (2007 to 2013); Senior Vice President, Fidelity Management & Research Co. (2005 to 2007); Senior Vice President and Corporate Treasurer, FMR Corp. (2003 to 2005); Chief Operating Officer, Fidelity Investments Japan (2001 to 2003) | 81 | MainStay Funds: Trustee since December 2021, Advisory Board Member (June 2021 to December 2021) (11 Funds);
MainStay Funds Trust: Trustee since December 2021, Advisory Board Member (June 2021 to December 2021) (37 Funds);
MainStay MacKay DefinedTerm Municipal Opportunities Fund: Trustee since December 2021, Advisory Board Member (June 2021 to December 2021);
MainStay CBRE Global Infrastructure Megatrends Term Fund: Trustee since December 2021, Advisory Board Member (June 2021 to December 2021);
Two Harbors Investment Corp.: Director since 2018;
Rhode Island State Investment Commission: Member since 2017; and
Blue Cross Blue Shield of Rhode Island: Director since 2019 |
| | Susan B. Kerley
1951 | MainStay VP Funds Trust: Chair since 2017 and Trustee since 2007** | President, Strategic Management Advisors LLC since 1990 | 81 | MainStay Funds: Chair since January 2017 and Trustee since 2007 (11 Funds); MainStay Funds Trust: Chair since January 2017 and Trustee since 1990 (37 Funds)***;
MainStay MacKay DefinedTerm Municipal Opportunities Fund: Chair since January 2017 and Trustee since 2011;
MainStay CBRE Global Infrastructure Megatrends Term Fund: Trustee since June 2021; and
Legg Mason Partners Funds: Trustee since 1991 (45 portfolios) |
| 34 | MainStay VP Wellington Small Cap Portfolio |
| | Name and
Year of Birth | Term of Office,
Position(s) Held and
Length of Service | Principal Occupation(s)
During Past Five Years | Number of
Portfolios in
Fund Complex
Overseen by
Trustee | Other Directorships
Held by Trustee |
| | | | | | |
| | Alan R. Latshaw
1951 | MainStay VP Funds Trust: Trustee since 2007** | Retired; Partner, Ernst & Young LLP (2002 to 2003); Partner, Arthur Andersen LLP (1989 to 2002); Consultant to the MainStay Funds Audit and Compliance Committee (2004 to 2006) | 81 | MainStay Funds: Trustee since 2006 (11 Funds);
MainStay Funds Trust: Trustee since 2007 (37 Funds)***;
MainStay MacKay DefinedTerm Municipal Opportunities Fund: Trustee since 2011; and
MainStay CBRE Global Infrastructure Megatrends Term Fund: Trustee since June 2021 |
| | Jacques P. Perold
1958 | MainStay VP Funds Trust: Trustee since January 2016, Advisory Board Member (June 2015 to December 2015) | Founder and Chief Executive Officer, CapShift Advisors LLC (since 2018); President, Fidelity Management & Research Company (2009 to 2014); President and Chief Investment Officer, Geode Capital Management, LLC (2001 to 2009) | 81 | MainStay Funds: Trustee since January 2016, Advisory Board Member (June 2015 to December 2015) (11 Funds);
MainStay Funds Trust: Trustee since January 2016, Advisory Board Member (June 2015 to December 2015) (37 Funds);
MainStay MacKay DefinedTerm Municipal Opportunities Fund: Trustee since January 2016, Advisory Board Member (June 2015 to December 2015);
MainStay CBRE Global Infrastructure Megatrends Term Fund: Trustee since June 2021;
Allstate Corporation: Director since 2015;
Partners in Health: Trustee since 2019; and
MSCI Inc.: Director since 2017 |
| | Richard S. Trutanic
1952 | MainStay VP Funds Trust: Trustee since 2007** | Chairman and Chief Executive Officer, Somerset & Company (financial advisory firm) since 2004; Managing Director, The Carlyle Group (private investment firm) (2002 to 2004); Senior Managing Director, Partner and Board Member, Groupe Arnault S.A. (private investment firm) (1999 to 2002) | 81 | MainStay Funds: Trustee since 1994 (11 Funds);
MainStay Funds Trust: Trustee since 2007 (37 Funds)***;
MainStay MacKay DefinedTerm Municipal Opportunities Fund: Trustee since 2011; and
MainStay CBRE Global Infrastructure Megatrends Term Fund: Trustee since June 2021 |
| ** | Includes prior service as a Director of MainStay VP Series Fund, Inc., the predecessor to MainStay VP Funds Trust. |
| *** | Includes prior service as a Director/Trustee of certain predecessor entities to MainStay Funds Trust. |
Board of Trustees and Officers (Unaudited) (continued)
| | Name and
Year of Birth | Position(s) Held and
Length of Service | Principal Occupation(s)
During Past Five Years | |
| | | | | |
| | Kirk C. Lehneis
1974 | President, MainStay VP Funds Trust (since 2017) | Chief Operating Officer and Senior Managing Director (since 2016), New York Life Investment Management LLC and New York Life Investment Management Holdings LLC; Member of the Board of Managers (since 2017) and Senior Managing Director (since 2018), NYLIFE Distributors LLC; Chairman of the Board and Senior Managing Director, NYLIM Service Company LLC (since 2017); Trustee, President and Principal Executive Officer of IndexIQ Trust, IndexIQ ETF Trust and IndexIQ Active ETF Trust (since 2018); President, MainStay CBRE Global Infrastructure Megatrends Term Fund (since 2021), MainStay MacKay DefinedTerm Municipal Opportunities Fund, MainStay Funds and MainStay Funds Trust (since 2017); Senior Managing Director, Global Product Development (from 2015 to 2016); Managing Director, Product Development (from 2010 to 2015), New York Life Investment Management LLC | |
| | Jack R. Benintende
1964 | Treasurer and Principal Financial and Accounting Officer, MainStay VP Funds Trust (since 2007)** | Managing Director, New York Life Investment Management LLC (since 2007); Treasurer and Principal Financial and Accounting Officer, MainStay CBRE Global Infrastructure Megatrends Term Fund (since 2021), MainStay MacKay DefinedTerm Municipal Opportunities Fund (since 2011), MainStay Funds Trust (since 2009) and MainStay Funds (since 2007); and Assistant Treasurer, New York Life Investment Management Holdings LLC (2008 to 2012) | |
| | J. Kevin Gao
1967 | Secretary and Chief Legal Officer, MainStay VP Funds Trust (since 2010)** | Managing Director and Associate General Counsel, New York Life Investment Management LLC (since 2010); Secretary and Chief Legal Officer, MainStay CBRE Global Infrastructure Megatrends Term Fund (since 2021), MainStay MacKay DefinedTerm Municipal Opportunities Fund (since 2011), MainStay Funds and MainStay Funds Trust (since 2010) | |
| | Kevin M. Gleason
1967 | Vice President and Chief Compliance Officer, MainStay VP Funds Trust (since June 2022) | Vice President and Chief Compliance Officer, IndexIQ Trust, IndexIQ ETF Trust and IndexIQ Active ETF Trust (since June 2022); Vice President and Chief Compliance Officer, MainStay CBRE Global Infrastructure Megatrends Term Fund, MainStay MacKay DefinedTerm Municipal Opportunities Fund (since June 2022); MainStay Funds Trust and MainStay Funds (since June 2022); Senior Vice President, Voya Investment Management and Chief Compliance Officer, Voya Family of Funds (2012 to 2022) | |
| | Scott T. Harrington
1959 | Vice President— Administration, MainStay VP Funds Trust (since 2005)** | Managing Director, New York Life Investment Management LLC (including predecessor advisory organizations) (since 2000); Member of the Board of Directors, New York Life Trust Company (since 2009); Vice President—Administration, MainStay CBRE Global Infrastructure Megatrends Term Fund (since 2021), MainStay MacKay DefinedTerm Municipal Opportunities Fund (since 2011), MainStay Funds Trust and MainStay Funds (since 2009) | |
| * | The officers listed above are considered to be “interested persons” of the MainStay Group of Funds, MainStay VP Funds Trust, MainStay CBRE Global Infrastructure Megatrends Term Fund and MainStay MacKay DefinedTerm Municipal Opportunities Fund within the meaning of the 1940 Act because of their affiliation with the MainStay Group of Funds, New York Life Insurance Company and/or its affiliates, including New York Life Investment Management LLC, New York Life Insurance Company, NYLIM Service Company LLC, NYLIFE Securities LLC and/or NYLIFE Distributors LLC, as described in detail in the column captioned “Principal Occupation(s) During Past Five Years.” Officers are elected annually by the Board. |
| ** | Includes prior service as an Officer of MainStay VP Series Fund, Inc., the predecessor to MainStay VP Funds Trust. |
Officers of the Trust (Who are not Trustees)*
| 36 | MainStay VP Wellington Small Cap Portfolio |
This page intentionally left blank
This page intentionally left blank.
MainStay VP Portfolios
MainStay VP offers a wide range of Portfolios. The full array of MainStay VP offerings is listed here, with information about the manager, subadvisors, legal counsel, and independent registered public accounting firm.
Equity
MainStay VP American Century Sustainable Equity Portfolio
MainStay VP Candriam Emerging Markets Equity Portfolio
MainStay VP Epoch U.S. Equity Yield Portfolio
MainStay VP Fidelity Institutional AM® Utilities Portfolio†
MainStay VP Natural Resources Portfolio
MainStay VP PineStone International Equity Portfolio1
MainStay VP S&P 500 Index Portfolio
MainStay VP Small Cap Growth Portfolio
MainStay VP Wellington Growth Portfolio
MainStay VP Wellington Mid Cap Portfolio
MainStay VP Wellington Small Cap Portfolio
MainStay VP Wellington U.S. Equity Portfolio
MainStay VP Winslow Large Cap Growth Portfolio
Mixed Asset
MainStay VP Balanced Portfolio
MainStay VP Income Builder Portfolio
MainStay VP Janus Henderson Balanced Portfolio
MainStay VP MacKay Convertible Portfolio
Income
MainStay VP Bond Portfolio
MainStay VP Floating Rate Portfolio
MainStay VP Indexed Bond Portfolio
MainStay VP MacKay Government Portfolio2
MainStay VP MacKay High Yield Corporate Bond Portfolio
MainStay VP MacKay Strategic Bond Portfolio
MainStay VP PIMCO Real Return Portfolio
Money Market
MainStay VP U.S. Government Money Market Portfolio
Alternative
MainStay VP CBRE Global Infrastructure Portfolio
MainStay VP IQ Hedge Multi-Strategy Portfolio
Asset Allocation
MainStay VP Conservative Allocation Portfolio
MainStay VP Equity Allocation Portfolio
MainStay VP Growth Allocation Portfolio
MainStay VP Moderate Allocation Portfolio
Manager
New York Life Investment Management LLC
New York, New York
Subadvisors
American Century Investment Management, Inc.
Kansas City, Missouri
Brown Advisory LLC
Baltimore, Maryland
Candriam*
Strassen, Luxembourg
CBRE Investment Management Listed Real Assets LLC
Radnor, Pennsylvania
Epoch Investment Partners, Inc.
New York, New York
FIAM LLC
Smithfield, Rhode Island
IndexIQ Advisors LLC*
New York, New York
Janus Henderson Investors US LLC
Denver, Colorado
MacKay Shields LLC*
New York, New York
Newton Investment Management North America, LLC
Boston, Massachusetts
NYL Investors LLC*
New York, New York
Pacific Investment Management Company LLC
Newport Beach, California
PineStone Asset Management Inc.
Montreal, Québec
Segall Bryant & Hamill, LLC
Chicago, Illinois
Wellington Management Company LLP
Boston, Massachusetts
Winslow Capital Management, LLC
Minneapolis, Minnesota
Legal Counsel
Dechert LLP
Washington, District of Columbia
Independent Registered Public Accounting Firm
PricewaterhouseCoopers LLP
New York, New York
Distributor
NYLIFE Distributors LLC*
Jersey City, New Jersey
Custodian
JPMorgan Chase Bank, N.A.
New York, New York
Some Portfolios may not be available in all products.
† Fidelity Institutional AM is a registered trade mark of FMR LLC. Used with permission.
* An affiliate of New York Life Investment Management LLC.
| 1. | Prior to August 28, 2023, the Portfolio's name was MainStay VP MacKay International Equity Portfolio. |
| 2. | Effective on or about May 1, 2024, the MainStay VP MacKay Government Portfolio will be renamed the MainStay VP U.S. Infrastructure Bond Portfolio. |
Not part of the Annual Report
2023 Annual Report
This report is for the general information of New York Life Variable Annuities and NYLIAC Variable Universal Life Insurance Products policyowners. It must be preceded or accompanied by the appropriate product(s) and funds prospectuses if it is given to anyone who is not an owner of a New York Life variable annuity policy or a NYLIAC Variable Universal Life Insurance Product. This report does not offer for sale or solicit orders to purchase securities.
The performance data quoted in this report represents past performance. Past performance is no guarantee of future results. Due to market volatility and other factors, current performance may be lower or higher than the figures shown. The most recent month-end performance summary for your variable annuity or variable life policy is available by calling 800-598-2019 and is updated periodically on newyorklife.com.
The New York Life Variable Annuities and NYLIAC Variable Universal Life Insurance Products are issued by New York Life Insurance and Annuity Corporation (a Delaware Corporation) and distributed by NYLIFE Distributors LLC (Member FINRA/SIPC).
New York Life Insurance Company
New York Life Insurance and Annuity
Corporation (NYLIAC) (A Delaware Corporation)
51 Madison Avenue, Room 551
New York, NY 10010
newyorklife.com
newyorklifeinvestments.com
NYLIFE Distributors LLC, 30 Hudson Street, Jersey City, NJ 07302
New York Life Investment Management LLC is the investment manager to the MainStay VP Funds Trust
©2024 by NYLIFE Distributors LLC. All rights reserved.
You may obtain copies of the Prospectus and the Statement of Additional Information free of charge, upon request, by calling toll-free 800-598-2019 or writing to New York Life Insurance and Annuity Corporation, 51 Madison Avenue, New York, NY 10010.
| Not FDIC Insured | No Bank Guarantee | May Lose Value |
(NYLIAC) NI530
MainStay VP Candriam Emerging Markets Equity Portfolio
Message from the President and Annual Report
December 31, 2023
Special Notice:
Beginning in July 2024, new regulations issued by the Securities and Exchange Commission (SEC) will take effect requiring open-end mutual fund companies and ETFs to (1) overhaul the content of their shareholder reports and (2) mail paper copies of the new tailored shareholder reports to shareholders who have not opted to receive these documents electronically.
If you have not yet elected to receive your shareholder reports electronically, please contact your financial intermediary or visit our website.
| Not FDIC/NCUA Insured | Not a Deposit | May Lose Value | No Bank Guarantee | Not Insured by Any Government Agency |
This page intentionally left blank
Message from the President
Against a backdrop of easing inflationary pressures and continued economic growth, stocks and bonds generally gained ground during the 12-month period ended December 31, 2023, despite high levels of volatility and sharp disparities between the performance of the different market sectors.
Although the war in Ukraine, the outbreak of hostilities in the Middle East and several other notable events affected financial assets, inflation, interest rate, and economic growth trends stood at the forefront of market developments during most of the period. As the reporting period began, high levels of inflation already showed signs of easing in the face of aggressive rate hikes by U.S. Federal Reserve (the “Fed”). From a peak of 9.1% in June 2022, the annualized U.S. inflation rate dropped to 6.4% in January, and 3.4% in December 2023. At the same time, the Fed increased the benchmark federal funds rate from 4.25%–4.50% at the beginning of reporting period, to 5.25%–5.50% as of the end of 2023. Despite the increasing cost of capital and tighter lending environment that resulted from rising rates, economic growth remained surprisingly robust, bolstered by high levels of consumer spending, low levels of unemployment and better-than-expected corporate earnings. With the pace of rate increases slowing from the prior year, investors began hoping for an early shift to a looser monetary policy, with stock prices and bond yields reacting as economic data and statements from the Fed either reinforced or undercut those hopes. Following months of hawkish rhetoric, the Fed finally reversed its stance in December 2023, signaling a positive economic outlook with little chance of a recession and a likelihood of rate cuts in 2024.
The S&P 500® Index, a widely regarded benchmark of U.S. market performance, produced strong gains during the reporting period-– recovering all its losses from 2022 and approached new record territory. A preponderance of the Index’s gains were generated by a relatively small number of mega-cap stocks in the information technology, communication services and consumer discretionary sectors that stood to benefit from rapid developments in generative artificial intelligence (“AI”). Value-oriented, interest-rate sensitive and small-capitalization
shares lagged by significant margins, although market strength widened during the closing weeks of the reporting period. Most overseas equity markets trailed the U.S. market, as developed international economies experienced relatively low growth rates, and weak economic conditions in China undermined emerging markets.
Bonds produced generally positive returns, bolstered by attractive and relatively stable yields. The yield on the 10-year Treasury note hit a high of just under 5% in mid-October 2023, ranging between approximately 3.5% and 4.8% for most of the reporting period. The yield curve remained inverted throughout the year, with the 2-year Treasury yield modestly above the 10-year yield. Corporate bond prices trended moderately higher, generally outperforming government securities. After years of low yields and tight credit spreads, the corporate sector benefited from more attractive valuations and income opportunities. Among corporates, markets generally rewarded longer duration and lower credit quality, although an uptick in default rates posed added risks for high-yield corporate bonds. International bond markets produced mixed returns, with emerging-markets issues advancing over their developed-markets counterparts.
The market volatility of recent years reminds us of the constant need for experienced and steadfast portfolio management in the face of uncertainty. New York Life Investments remains dedicated to providing you, as a valued MainStay VP investor, with the guidance, resources and investment solutions you need to pursue your financial goals.
Thank you for trusting us to help meet your investment needs.
Sincerely,
Kirk C. Lehneis
President
The opinions expressed are as of the date of this report and are subject to change. There is no guarantee that any forecast made will come to pass. This material does not constitute investment advice and is not intended as an endorsement of any specific investment. Past performance is no guarantee of future results.
Not part of the Annual Report
Investors should refer to the Portfolio’s Summary Prospectus and/or Prospectus and consider the Portfolio’s investment objectives, strategies, risks, charges and expenses carefully before investing. The Summary Prospectus and/or Prospectus contain this and other information about the Portfolio. You may obtain copies of the Portfolio’s Summary Prospectus, Prospectus and Statement of Additional Information, which includes information about the MainStay VP Funds Trust's Trustees, free of charge, upon request, by calling toll-free 800-598-2019, by writing to New York Life Insurance and Annuity Corporation, 51 Madison Avenue, Room 251, New York, New York 10010 or by sending an email to MainStayShareholdersServices@nylim.com. These documents are also available at newyorklifeinvestments.com/investment-products/vp. Please read the Portfolio's Summary Prospectus and/or Prospectus carefully before investing. MainStay VP Funds Trust portfolios are separate account options which are purchased through a variable insurance or variable annuity contract.
Investment and Performance Comparison (Unaudited)
Performance data quoted represents past performance. Past performance is no guarantee of future results. Because of market volatility and other factors, current performance may be lower or higher than the figures shown. Investment return and principal value will fluctuate, and as a result, when shares are redeemed, they may be worth more or less than their original cost. The performance table and graph do not reflect any deduction of sales charges, mortality and expense charges, contract charges or administrative charges. Please refer to the Performance Summary appropriate for your policy. For performance information current to the most recent month-end, please call 800-598-2019 or visit www.newyorklife.com.
Performance figures may reflect certain fee waivers and/or expense limitations, without which total returns may have been different. For information on current fee waivers and/or expense limitations (if any), please refer to the Notes to Financial Statements.
| Average Annual Total Returns for the Year-Ended December 31, 2023 |
| Class | Inception
Date1, 2, 3 | One
Year | Five
Years | Ten
Years | Gross
Expense
Ratio4 |
| Initial Class Shares | 2/17/2012 | 7.25% | 2.49% | 0.08% | 1.16% |
| Service Class Shares | 2/17/2012 | 6.98 | 2.24 | -0.17 | 1.41 |
| 1. | Effective January 13, 2015, the Portfolio changed its subadvisors and revised its principal investment strategies. The performance in the graph and table prior to that date reflects the Portfolio’s prior subadvisors and principal investment strategies. |
| 2. | Effective January 1, 2018, due to an organizational restructuring whereby all investment personnel of Cornerstone Capital Management Holdings LLC, a former subadvisor, transitioned to MacKay Shields LLC. |
| 3. | Effective May 1, 2021, the Portfolio replaced one of its subadvisors and modified its principal investment strategies. The past performance in the graph and table prior to that date reflects the Portfolio's prior subadvisor and principal investment strategies. |
| 4. | The gross expense ratios presented reflect the Portfolio’s “Total Annual Portfolio Operating Expenses” from the most recent Prospectus and may differ from other expense ratios disclosed in this report. |
| Benchmark Performance* | One
Year | Five
Years | Ten
Years |
| MSCI Emerging Markets Index (Net)1 | 9.83% | 3.69% | 2.66% |
| Morningstar Diversified Emerging Markets Category Average2 | 12.32 | 4.70 | 2.62 |
| * | Returns for indices reflect no deductions for fees, expenses or taxes, except for foreign withholding taxes where applicable. Results assume reinvestment of all dividends and capital gains. An investment cannot be made directly in an index. |
| 1. | The MSCI Emerging Markets Index (Net) is the Portfolio's primary benchmark. The MSCI Emerging Markets Index (Net) is a free float-adjusted market capitalization index that is designed to measure equity market performance in the global emerging markets. |
| 2. | The Morningstar Diversified Emerging Markets Category Average is representative of funds that tend to divide their assets among 20 or more nations, although they tend to focus on the emerging markets of Asia and Latin America rather than on those of the Middle East, Africa, or Europe. These funds invest predominantly in emerging market equities, but some funds also invest in both equities and fixed income investments from emerging markets. Results are based on average total returns of similar funds with all dividends and capital gain distributions reinvested. |
Cost in Dollars of a $1,000 Investment in MainStay VP Candriam Emerging Markets Equity Portfolio (Unaudited)
The example below is intended to describe the fees and expenses borne by shareholders during the six-month period from July 1, 2023 to December 31, 2023, and the impact of those costs on your investment.
Example
As a shareholder of the Portfolio you incur two types of costs: (1) transaction costs, including exchange fees and sales charges (loads) on purchases (as applicable), and (2) ongoing costs, including management fees, distribution and/or service (12b-1) fees and other Portfolio expenses (as applicable). This example is intended to help you understand your ongoing costs (in dollars) of investing in the Portfolio and to compare these costs with the ongoing costs of investing in other mutual funds. The example is based on an investment of $1,000 made at the beginning of the six-month period and held for the entire period from July 1, 2023 to December 31, 2023. Shares are only sold in connection with variable life and annuity contracts and the example does not reflect any contract level or transactional fees or expenses. If these costs had been included, your costs would have been higher.
This example illustrates your Portfolio’s ongoing costs in two ways:
Actual Expenses
The second and third data columns in the table below provide information about actual account values and actual expenses. You may use the information in these columns, together with the amount you invested, to estimate the expenses that you paid during the six months ended
December 31, 2023. Simply divide your account value by $1,000 (for example, an $8,600 account value divided by $1,000 = 8.6), then multiply the result by the number under the heading entitled “Expenses Paid During Period” to estimate the expenses you paid on your account during this period.
Hypothetical Example for Comparison Purposes
The fourth and fifth data columns in the table below provide information about hypothetical account values and hypothetical expenses based on the Portfolio’s actual expense ratio and an assumed rate of return of 5% per year before expenses, which is not the Portfolio’s actual return. The hypothetical account values and expenses may not be used to estimate the actual ending account balances or expenses you paid for the six-month period shown. You may use this information to compare the ongoing costs of investing in the Portfolio with the ongoing costs of investing in other mutual funds. To do so, compare this 5% hypothetical example with the 5% hypothetical examples that appear in the shareholder reports of the other mutual funds.
Please note that the expenses shown in the table are meant to highlight your ongoing costs only and do not reflect any transactional costs, such as exchange fees or sales charges (loads). Therefore, the fourth and fifth data columns of the table are useful in comparing ongoing costs only and will not help you determine the relative total costs of owning different funds. In addition, if these transactional costs were included, your costs would have been higher.
| Share Class | Beginning
Account
Value
7/1/23 | Ending Account
Value (Based
on Actual
Returns and
Expenses)
12/31/23 | Expenses
Paid
During
Period1 | Ending Account
Value (Based
on Hypothetical
5% Annualized
Return and
Actual Expenses)
12/31/23 | Expenses
Paid
During
Period1 | Net Expense
Ratio
During
Period2 |
| Initial Class Shares | $1,000.00 | $1,027.60 | $5.78 | $1,019.51 | $5.75 | 1.13% |
| Service Class Shares | $1,000.00 | $1,026.30 | $7.05 | $1,018.25 | $7.02 | 1.38% |
| 1. | Expenses are equal to the Portfolio’s annualized expense ratio of each class multiplied by the average account value over the period, divided by 365 and multiplied by 184 (to reflect the six-month period). The table above represents the actual expenses incurred during the six-month period. In addition to the fees and expenses which the Portfolio bears directly, it also indirectly bears a pro rata share of the fees and expenses of the underlying funds in which it invests. Such indirect expenses are not included in the above-reported expense figures. |
| 2. | Expenses are equal to the Portfolio's annualized expense ratio to reflect the six-month period. |
| 6 | MainStay VP Candriam Emerging Markets Equity Portfolio |
Country Composition as of December 31, 2023 (Unaudited)
| China | 25.9% |
| India | 17.5 |
| Taiwan | 15.8 |
| Republic of Korea | 13.7 |
| Brazil | 7.4 |
| South Africa | 4.6 |
| Mexico | 4.4 |
| Indonesia | 3.1 |
| Thailand | 2.0 |
| Turkey | 1.8 |
| Poland | 0.9% |
| Malaysia | 0.8 |
| United States | 0.6 |
| Russia | 0.0‡ |
| Greece | 0.0‡ |
| Hong Kong | 0.0‡ |
| Other Assets, Less Liabilities | 1.5 |
| | 100.0% |
| ‡ | Less than one–tenth of a percent. |
See Portfolio of Investments beginning on page 10 for specific holdings within these categories. The Portfolio's holdings are subject to change.
Top Ten Holdings and/or Issuers Held as of December 31, 2023 (excluding short-term investments) (Unaudited)
| 1. | Taiwan Semiconductor Manufacturing Co. Ltd. |
| 2. | Samsung Electronics Co. Ltd. |
| 3. | Tencent Holdings Ltd. |
| 4. | SK Hynix, Inc. |
| 5. | Alibaba Group Holding Ltd. |
| 6. | Reliance Industries Ltd. |
| 7. | PDD Holdings, Inc., ADR |
| 8. | Bharti Airtel Ltd. |
| 9. | Axis Bank Ltd. |
| 10. | KB Financial Group, Inc. |
Portfolio Management Discussion and Analysis (Unaudited)
Questions answered by Paulo Salazar, Philip Screve and Lamine Saidi of Candriam, the Portfolio’s Subadvisor.
How did MainStay VP Candriam Emerging Markets Equity Portfolio perform relative to its benchmark and peers during the 12 months ended December 31, 2023?
For the 12 months ended December 31, 2023, MainStay VP Candriam Emerging Markets Equity Portfolio returned 7.25% for Initial Class shares and 6.98% for Service Class shares. Over the same period, both share classes underperformed the 9.83% return of the MSCI Emerging Markets Index (Net) (“the Index”), which is the Portfolio’s benchmark, and the 12.32% return of the Morningstar Diversified Emerging Markets Category Average.1
What factors affected the Portfolio’s relative performance during the reporting period?
Returns relative to the Index were negatively affected by investments in Chinese companies, undermined by the country’s lackluster economy. China-based food-delivery company Meituan was the single largest detractor from the Portfolio’s relative performance, as a result of weak domestic consumption trends and high levels of competition. Among China-based financials, Ping An Insurance and China Merchants Bank came under pressure due to property risk that extended to the financials sector via shadow banking. Investments in Thailand were also negatively impacted by spillover effect from China. Relative performance came under further pressure due to the Portfolio’s underweight exposure to Samsung Electronics, prompted by caution regarding the company’s governance quality. At country level, Brazil also detracted on a relative basis.
The Portfolio’s relative performance benefited from holdings related to the artificial intelligence (“AI”) theme, including companies in Taiwan (such as chip designer Alchip Technologies and network switch producer Accton Technology) and South Korea (including memory chip leader SK hynix). In Brazil, the Portfolio’s position in LatAm based (and US listed) MercadoLibre also bolstered relative returns, as a result of gains in market share. From a country perspective, Turkey was among the top relative performers, mainly due to positive selection effect.
Which sectors were the strongest positive contributors to the Portfolio’s relative performance, and which sectors were particularly weak?
Information technology and consumer staples provided the strongest contributions to the Portfolio’s performance relative to the Index, primarily as a result of positive selection effects. (Contributions take weightings and total returns into account.) Holdings in the information technology sector further bolstered investor enthusiasm for companies exposed to advances in AI development, while the consumer staples sector benefited from its perceived defensiveness amid market volatilities. The consumer discretionary sector made the weakest contributions to relative returns, producing negative total returns over the reporting period.
During the reporting period, which individual stocks made the strongest positive contributions to the Portfolio’s absolute performance and which stocks detracted the most?
During the reporting period, several holdings exposed to the AI theme produced the Portfolio’s strongest absolute performance, led by Alchip Technologies, Accton Technology, and SK hynix – all described above. The Portfolio’s weakest performers on an absolute basis included Meituan, Ping An Insurance and China Merchants Bank, also described above. All three of the latter positions produced negative total returns over the reporting period.
Did the Portfolio make any significant purchases or sales during the reporting period?
The Portfolio’s most significant purchases during the reporting period included shares in SK hynix, mentioned above, and in South African e-commerce company Naspers. SK hynix holds approximately one third of the global dynamic random access memory market. The company benefits from the AI trend, particularly due to its expertise in high-bandwidth memory, which is an essential part of AI servers. The Portfolio’s new position in Naspers provides proxy exposure to Tencent, China’s leading multimedia company. Naspers is one of Tencent’s most important shareholders, with Naspers shares trading at an attractive holding discount, particularly given active measures being taken to reduce this holding discount.
During the same period, the Portfolio’s most significant sales included its entire position in Samsung SDI, and partial positions in HDFC Bank and JD.com. Battery manufacturer Samsung SDI, a key contributor to the electric vehicle (EV) supply chain, faced challenges resulting from intense competition and a slowdown in market demand, along with downward pricing trends. We reduced the Portfolio holdings in JD.com given increased competition in the area of Chinese e-commerce, as well as China’s lackluster economy. We reduced the Portfolio’s position in India-based HDFC Bank as we believe the company will need some time to digest a recent merger with Housing Development Finance Corporation, India’s largest mortgage lender.
How did the Portfolio’s sector weightings change during the reporting period?
The Portfolio increased its weighting relative to the Index in the financials and materials sectors, reducing the scale of its underweight positions in both sectors. Conversely, the Portfolio decreased its weightings in the consumer discretionary and industrials sectors, shifting both from overweight positions to more closely match Index weightings.
| 1. | See "Investment and Performance Comparison" for more information on benchmark and peer group returns. |
| 8 | MainStay VP Candriam Emerging Markets Equity Portfolio |
How was the Portfolio positioned at the end of the reporting period?
As of December 31, 2023, the Portfolio held overweight exposure to the consumer staples, financials and information technology sectors, and underweight exposure to the utilities, materials and real estate sectors.
We have turned more optimistic on the outlook for emerging-markets equities, as the headwinds faced by the sector have started to recede. These headwinds—particularly elevated interest rates in the United States and the consequently strengthening U.S. dollar—weighed on emerging-markets returns during the reporting period. A peak in the federal funds rate set by the U.S. Federal Reserve, along with rate cuts anticipated in 2024, should provide a more accommodative environment for emerging markets.
With regard to China, we maintain a cautious outlook since the path to recovery appears to be following a deliberate and gradual trajectory. China’s central government is strategically focusing on longer-term goals, including mitigating income inequality, promoting social benefits and reinforcing data protection. Therefore, we have positioned the Portfolio with tactically underweight China exposure. Emerging-markets outside China have been displaying resilience, transforming adversities into opportunities in the wake of supply-chain reshuffling. At the same time, many are effectively withstanding the spillover effects of China’s economic deceleration. Thematically, AI is expediting a recovery in the technology-related hardware and semiconductor industries, where emerging markets have a strong presence.
Consistent with our strategic outlook, we continue to position the Portfolio with a slightly defensive and balanced stance. While awaiting further confirmation that the U.S. interest rate peak is behind us, we are emphasizing a thematic and selective investment approach. We aim to discover and capitalize on themes with sustained potential and companies with high earnings visibility.
The opinions expressed are those of the portfolio managers as of the date of this report and are subject to change. There is no guarantee that any forecasts will come to pass. This material does not constitute investment advice and is not intended as an endorsement of any specific investment.
Not all MainStay VP Portfolios and/or share classes are available under all policies.
Portfolio of Investments December 31, 2023†^
| | Shares | Value |
| Common Stocks 96.5% |
| Brazil 6.0% |
| Banco do Brasil SA (Banks) | 226,000 | $ 2,581,980 |
| Localiza Rent a Car SA (Ground Transportation) | 148,000 | 1,929,777 |
| MercadoLibre, Inc. (Broadline Retail) (a) | 1,160 | 1,822,986 |
| NU Holdings Ltd., Class A (Banks) (a) | 176,000 | 1,466,080 |
| PRIO SA (Oil, Gas & Consumable Fuels) | 246,000 | 2,323,911 |
| Raia Drogasil SA (Consumer Staples Distribution & Retail) | 294,000 | 1,774,538 |
| WEG SA (Electrical Equipment) | 156,000 | 1,212,150 |
| | | 13,111,422 |
| China 25.9% |
| Aier Eye Hospital Group Co. Ltd., Class A (Health Care Providers & Services) | 300,116 | 669,445 |
| Airtac International Group (Machinery) | 26,000 | 855,639 |
| Alibaba Group Holding Ltd. (Broadline Retail) | 578,000 | 5,596,056 |
| Anhui Huaheng Biotechnology Co. Ltd., Class A (Chemicals) | 72,898 | 1,294,078 |
| ANTA Sports Products Ltd. (Textiles, Apparel & Luxury Goods) | 56,000 | 543,254 |
| Baidu, Inc., Class A (Interactive Media & Services) (a) | 88,000 | 1,308,420 |
| Bank of Jiangsu Co. Ltd., Class A (Banks) | 2,639,994 | 2,490,280 |
| Beijing Compass Technology Development Co. Ltd., Class A (Capital Markets) (a) | 115,992 | 985,544 |
| BYD Co. Ltd., Class H (Automobiles) | 61,961 | 1,701,279 |
| BYD Electronic International Co. Ltd. (Communications Equipment) | 388,000 | 1,818,634 |
| China Merchants Bank Co. Ltd., Class H (Banks) | 402,000 | 1,400,320 |
| China Resources Land Ltd. (Real Estate Management & Development) | 475,888 | 1,706,456 |
| CMOC Group Ltd., Class H (Metals & Mining) | 2,849,828 | 1,558,400 |
| Contemporary Amperex Technology Co. Ltd., Class A (Electrical Equipment) | 24,073 | 554,152 |
| Flat Glass Group Co. Ltd., Class H (Semiconductors & Semiconductor Equipment) | 220,000 | 371,339 |
| JD.com, Inc., Class A (Broadline Retail) | 56,000 | 806,813 |
| Kanzhun Ltd., ADR (Interactive Media & Services) | 40,000 | 664,400 |
| Kuaishou Technology (Interactive Media & Services) (a)(b) | 192,000 | 1,301,966 |
| Li Auto, Inc., Class A (Automobiles) (a) | 77,000 | 1,450,560 |
| Longshine Technology Group Co. Ltd., Class A (Software) | 189,991 | 439,067 |
| Luzhou Laojiao Co. Ltd., Class A (Beverages) | 32,000 | 809,543 |
| | Shares | Value |
| |
| China (continued) |
| Meituan (Hotels, Restaurants & Leisure) (a)(b) | 200,000 | $ 2,097,714 |
| NARI Technology Co. Ltd., Class A (Electrical Equipment) | 300,196 | 944,753 |
| NetEase, Inc. (Entertainment) | 98,000 | 1,764,590 |
| Ningbo Deye Technology Co. Ltd., Class A (Machinery) | 44,175 | 522,586 |
| Nongfu Spring Co. Ltd., Class H (Beverages) (b) | 330,000 | 1,908,113 |
| PDD Holdings, Inc., ADR (Broadline Retail) (a) | 33,000 | 4,828,230 |
| Ping An Insurance Group Co. of China Ltd., Class H (Insurance) | 580,000 | 2,625,728 |
| Proya Cosmetics Co. Ltd., Class A (Personal Care Products) | 73,045 | 1,023,755 |
| Shandong Gold Mining Co. Ltd., Class H (Metals & Mining) (b) | 860,000 | 1,632,221 |
| Shanghai Baosight Software Co. Ltd., Class A (Software) | 142,076 | 977,596 |
| Shenzhen Inovance Technology Co. Ltd., Class A (Machinery) | 90,000 | 801,247 |
| Shenzhen Transsion Holdings Co. Ltd., Class A (Technology Hardware, Storage & Peripherals) | 56,000 | 1,092,806 |
| Tencent Holdings Ltd. (Interactive Media & Services) | 172,000 | 6,467,209 |
| Yadea Group Holdings Ltd. (Automobiles) (b) | 460,000 | 808,247 |
| Yantai Jereh Oilfield Services Group Co. Ltd., Class A (Energy Equipment & Services) | 320,000 | 1,268,323 |
| | | 57,088,763 |
| Greece 0.0% ‡ |
| FF Group (Textiles, Apparel & Luxury Goods) (a)(c)(d) | 19,000 | — |
| Hong Kong 0.0% ‡ |
| China Lumena New Materials Corp. (Chemicals) (a)(c)(d) | 6,500 | — |
| India 17.5% |
| ABB India Ltd. (Electrical Equipment) | 38,000 | 2,134,795 |
| APL Apollo Tubes Ltd. (Metals & Mining) | 92,000 | 1,699,065 |
| Apollo Hospitals Enterprise Ltd. (Health Care Providers & Services) | 24,000 | 1,645,142 |
| Axis Bank Ltd. (Banks) | 278,000 | 3,682,557 |
| Bajaj Finance Ltd. (Consumer Finance) | 26,000 | 2,289,544 |
| Bharti Airtel Ltd. (Wireless Telecommunication Services) | 312,000 | 3,870,110 |
The notes to the financial statements are an integral part of, and should be read in conjunction with, the financial statements.
| 10 | MainStay VP Candriam Emerging Markets Equity Portfolio |
| | Shares | Value |
| Common Stocks (continued) |
| India (continued) |
| HDFC Bank Ltd. (Banks) | 92,000 | $ 1,889,724 |
| ICICI Bank Ltd. (Banks) | 176,000 | 2,107,844 |
| Indraprastha Gas Ltd. (Gas Utilities) | 270,000 | 1,357,402 |
| KPIT Technologies Ltd. (Software) | 84,000 | 1,528,154 |
| Mahindra & Mahindra Ltd. (Automobiles) | 74,000 | 1,537,914 |
| Reliance Industries Ltd. (Oil, Gas & Consumable Fuels) | 158,000 | 4,908,108 |
| SBI Cards & Payment Services Ltd. (Consumer Finance) | 148,000 | 1,351,077 |
| Tata Elxsi Ltd. (Software) | 11,000 | 1,157,116 |
| Tata Motors Ltd. (Automobiles) | 232,000 | 2,174,501 |
| Torrent Pharmaceuticals Ltd. (Pharmaceuticals) | 73,000 | 2,022,564 |
| Varun Beverages Ltd. (Beverages) | 216,000 | 3,210,652 |
| | | 38,566,269 |
| Indonesia 3.1% |
| Aneka Tambang Tbk. (Metals & Mining) | 4,400,000 | 487,238 |
| Bank Central Asia Tbk. PT (Banks) | 4,000,000 | 2,442,034 |
| Bank Mandiri Persero Tbk. PT (Banks) | 4,500,000 | 1,768,202 |
| Merdeka Copper Gold Tbk. PT (Metals & Mining) (a) | 5,000,000 | 876,794 |
| Sumber Alfaria Trijaya Tbk. PT (Consumer Staples Distribution & Retail) | 6,800,000 | 1,294,018 |
| | | 6,868,286 |
| Malaysia 0.8% |
| Press Metal Aluminium Holdings Bhd. (Metals & Mining) | 1,580,000 | 1,653,928 |
| Mexico 4.4% |
| America Movil SAB de CV (Wireless Telecommunication Services) | 2,940,000 | 2,725,140 |
| Cemex SAB de CV (Construction Materials) (a) | 1,420,000 | 1,105,494 |
| Gruma SAB de CV, Class B (Food Products) | 108,000 | 1,978,866 |
| Grupo Aeroportuario del Pacifico SAB de CV, Class B (Transportation Infrastructure) | 40,000 | 698,263 |
| Grupo Financiero Banorte SAB de CV, Class O (Banks) | 324,000 | 3,258,126 |
| | | 9,765,889 |
| Poland 0.9% |
| Dino Polska SA (Consumer Staples Distribution & Retail) (a)(b) | 17,000 | 1,990,444 |
| Republic of Korea 13.7% |
| Coupang, Inc. (Broadline Retail) (a) | 48,000 | 777,120 |
| | Shares | Value |
| |
| Republic of Korea (continued) |
| Daejoo Electronic Materials Co. Ltd. (Electronic Equipment, Instruments & Components) (a) | 10,400 | $ 693,508 |
| DB Insurance Co. Ltd. (Insurance) (a) | 42,000 | 2,724,133 |
| HPSP Co. Ltd. (Semiconductors & Semiconductor Equipment) (a) | 24,000 | 811,043 |
| JYP Entertainment Corp. (Entertainment) (a) | 16,000 | 1,253,390 |
| KB Financial Group, Inc. (Banks) | 87,000 | 3,638,806 |
| LG Chem Ltd. (Chemicals) (a) | 4,500 | 1,733,295 |
| Samsung Biologics Co. Ltd. (Life Sciences Tools & Services) (a)(b) | 2,500 | 1,473,651 |
| Samsung Electronics Co. Ltd. (Technology Hardware, Storage & Peripherals) | 142,000 | 8,636,428 |
| Samsung Engineering Co. Ltd. (Construction & Engineering) (a) | 106,000 | 2,377,587 |
| SK Hynix, Inc. (Semiconductors & Semiconductor Equipment) | 55,000 | 6,005,185 |
| | | 30,124,146 |
| Russia 0.0% ‡ |
| Magnit PJSC (Consumer Staples Distribution & Retail) (c)(d) | 22,529 | — |
| South Africa 4.6% |
| Capitec Bank Holdings Ltd. (Banks) | 18,600 | 2,060,423 |
| FirstRand Ltd. (Financial Services) | 652,000 | 2,620,119 |
| Gold Fields Ltd. (Metals & Mining) | 180,000 | 2,733,383 |
| Naspers Ltd., Class N (Broadline Retail) | 16,400 | 2,804,384 |
| | | 10,218,309 |
| Taiwan 15.8% |
| Accton Technology Corp. (Communications Equipment) | 164,000 | 2,794,741 |
| Alchip Technologies Ltd. (Semiconductors & Semiconductor Equipment) | 22,000 | 2,347,632 |
| Chailease Holding Co. Ltd. (Financial Services) | 330,000 | 2,075,235 |
| CTBC Financial Holding Co. Ltd. (Banks) | 3,080,000 | 2,845,115 |
| Delta Electronics, Inc. (Electronic Equipment, Instruments & Components) | 180,000 | 1,838,680 |
| E Ink Holdings, Inc. (Electronic Equipment, Instruments & Components) | 120,000 | 770,271 |
| Quanta Computer, Inc. (Technology Hardware, Storage & Peripherals) | 160,000 | 1,170,395 |
| Realtek Semiconductor Corp. (Semiconductors & Semiconductor Equipment) | 72,000 | 1,106,140 |
| Taiwan Semiconductor Manufacturing Co. Ltd. (Semiconductors & Semiconductor Equipment) | 972,000 | 18,780,926 |
The notes to the financial statements are an integral part of, and should be read in conjunction with, the financial statements.
11
Portfolio of Investments December 31, 2023†^ (continued)
| | Shares | Value |
| Common Stocks (continued) |
| Taiwan (continued) |
| Voltronic Power Technology Corp. (Electrical Equipment) | 18,000 | $ 1,002,916 |
| | | 34,732,051 |
| Thailand 2.0% |
| Airports of Thailand PCL, NVDR (Transportation Infrastructure) | 820,000 | 1,433,837 |
| Bangkok Dusit Medical Services PCL, NVDR (Health Care Providers & Services) | 820,000 | 666,667 |
| Kasikornbank PCL, NVDR (Banks) | 240,000 | 948,674 |
| PTT PCL, NVDR (Oil, Gas & Consumable Fuels) | 1,360,000 | 1,424,490 |
| | | 4,473,668 |
| Turkey 1.8% |
| BIM Birlesik Magazalar A/S (Consumer Staples Distribution & Retail) | 232,000 | 2,367,729 |
| Turkiye Garanti Bankasi A/S (Banks) (e) | 760,000 | 1,504,848 |
| | | 3,872,577 |
Total Common Stocks
(Cost $204,969,139) | | 212,465,752 |
| Preferred Stock 1.4% |
| Brazil 1.4% |
| Itau Unibanco Holding SA (Banks) | 460,000 | 3,198,623 |
Total Preferred Stock
(Cost $2,271,803) | | 3,198,623 |
| |
| | Number of
Rights | |
| |
| Rights 0.0% ‡ |
| Brazil 0.0% ‡ |
| Localiza Rent a Car SA (Ground Transportation) | | |
| Expires 2/5/24 (a) | 531 | 2,186 |
Total Rights
(Cost $0) | | 2,186 |
| Short-Term Investments 0.6% |
| Unaffiliated Investment Companies 0.6% |
| United States 0.6% |
| Dreyfus Treasury Obligations Cash Management Fund, 5.40% (f)(g) | 3,600 | 3,600 |
| | Number of
Rights | | Value |
| |
| United States (continued) |
| Invesco Government & Agency Portfolio, 5.361% (f)(g) | 1,218,202 | | $ 1,218,202 |
| | | | 1,221,802 |
Total Short-Term Investments
(Cost $1,221,802) | | | 1,221,802 |
Total Investments
(Cost $208,462,744) | 98.5% | | 216,888,363 |
| Other Assets, Less Liabilities | 1.5 | | 3,342,681 |
| Net Assets | 100.0% | | $ 220,231,044 |
| † | Percentages indicated are based on Portfolio net assets. |
| ^ | Industry and country classifications may be different than those used for compliance monitoring purposes. |
| ‡ | Less than one-tenth of a percent. |
| (a) | Non-income producing security. |
| (b) | May be sold to institutional investors only under Rule 144A or securities offered pursuant to Section 4(a)(2) of the Securities Act of 1933, as amended. |
| (c) | Illiquid security—As of December 31, 2023, the total market value deemed illiquid under procedures approved by the Board of Trustees was $0, which represented less than one-tenth of a percent of the Portfolio’s net assets. (Unaudited) |
| (d) | Security in which significant unobservable inputs (Level 3) were used in determining fair value. |
| (e) | All or a portion of this security was held on loan. As of December 31, 2023, the aggregate market value of securities on loan was $1,352,585; the total market value of collateral held by the Portfolio was $1,400,014. The market value of the collateral held included non-cash collateral in the form of U.S. Treasury securities with a value of $178,212. The Portfolio received cash collateral with a value of $1,221,802. (See Note 2(J)) |
| (f) | Current yield as of December 31, 2023. |
| (g) | Represents a security purchased with cash collateral received for securities on loan. |
| Abbreviation(s): |
| ADR—American Depositary Receipt |
| NVDR—Non-Voting Depositary Receipt |
| PCL—Provision for Credit Losses |
The notes to the financial statements are an integral part of, and should be read in conjunction with, the financial statements.
| 12 | MainStay VP Candriam Emerging Markets Equity Portfolio |
The following is a summary of the fair valuations according to the inputs used as of December 31, 2023, for valuing the Portfolio’s assets:
| Description | Quoted
Prices in
Active
Markets for
Identical
Assets
(Level 1) | | Significant
Other
Observable
Inputs
(Level 2) | | Significant
Unobservable
Inputs
(Level 3) | | Total |
| Asset Valuation Inputs | | | | | | | |
| Investments in Securities (a) | | | | | | | |
| Common Stocks | | | | | | | |
| Brazil | $ 3,289,066 | | $ 9,822,356 | | $ — | | $ 13,111,422 |
| Republic of Korea | 777,120 | | 29,347,026 | | — | | 30,124,146 |
| Thailand | — | | 4,473,668 | | — | | 4,473,668 |
| All Other Countries | 164,756,516 | | — | | — | | 164,756,516 |
| Total Common Stocks | 168,822,702 | | 43,643,050 | | — | | 212,465,752 |
| Preferred Stock | — | | 3,198,623 | | — | | 3,198,623 |
| Rights | 2,186 | | — | | — | | 2,186 |
| Short-Term Investments | | | | | | | |
| Unaffiliated Investment Companies | 1,221,802 | | — | | — | | 1,221,802 |
| Total Investments in Securities | $ 170,046,690 | | $ 46,841,673 | | $ — | | $ 216,888,363 |
| (a) | For a complete listing of investments and their industries, see the Portfolio of Investments. |
The notes to the financial statements are an integral part of, and should be read in conjunction with, the financial statements.
13
Portfolio of Investments December 31, 2023†^ (continued)
The table below sets forth the diversification of the Portfolio’s investments by industry.
Industry Diversification
| | Value | | Percent |
| Automobiles | $ 7,672,501 | | 3.5% |
| Banks | 37,283,636 | | 16.9 |
| Beverages | 5,928,308 | | 2.7 |
| Broadline Retail | 16,635,589 | | 7.6 |
| Capital Markets | 985,544 | | 0.4 |
| Chemicals | 3,027,373 | | 1.4 |
| Communications Equipment | 4,613,375 | | 2.1 |
| Construction & Engineering | 2,377,587 | | 1.1 |
| Construction Materials | 1,105,494 | | 0.5 |
| Consumer Finance | 3,640,621 | | 1.6 |
| Consumer Staples Distribution & Retail | 7,426,729 | | 3.4 |
| Electrical Equipment | 5,848,766 | | 2.7 |
| Electronic Equipment, Instruments & Components | 3,302,459 | | 1.5 |
| Energy Equipment & Services | 1,268,323 | | 0.6 |
| Entertainment | 3,017,980 | | 1.4 |
| Financial Services | 4,695,354 | | 2.1 |
| Food Products | 1,978,866 | | 0.9 |
| Gas Utilities | 1,357,402 | | 0.6 |
| Ground Transportation | 1,931,963 | | 0.9 |
| Health Care Providers & Services | 2,981,254 | | 1.3 |
| Hotels, Restaurants & Leisure | 2,097,714 | | 0.9 |
| Insurance | 5,349,861 | | 2.4 |
| Interactive Media & Services | 9,741,995 | | 4.4 |
| Life Sciences Tools & Services | 1,473,651 | | 0.7 |
| Machinery | 2,179,472 | | 1.0 |
| Metals & Mining | 10,641,029 | | 4.8 |
| Oil, Gas & Consumable Fuels | 8,656,509 | | 3.9 |
| Personal Care Products | 1,023,755 | | 0.5 |
| Pharmaceuticals | 2,022,564 | | 0.9 |
| Real Estate Management & Development | 1,706,456 | | 0.8 |
| Semiconductors & Semiconductor Equipment | 29,422,265 | | 13.4 |
| Software | 4,101,933 | | 1.9 |
| Technology Hardware, Storage & Peripherals | 10,899,629 | | 4.9 |
| Textiles, Apparel & Luxury Goods | 543,254 | | 0.2 |
| Transportation Infrastructure | 2,132,100 | | 1.0 |
| Wireless Telecommunication Services | 6,595,250 | | 3.0 |
| | 215,666,561 | | 97.9 |
| Short-Term Investments | 1,221,802 | | 0.6 |
| Other Assets, Less Liabilities | 3,342,681 | | 1.5 |
| Net Assets | $220,231,044 | | 100.0% |
| † | Percentages indicated are based on Portfolio net assets. |
| ^ | Industry classifications may be different than those used for compliance monitoring purposes. |
The notes to the financial statements are an integral part of, and should be read in conjunction with, the financial statements.
| 14 | MainStay VP Candriam Emerging Markets Equity Portfolio |
Statement of Assets and Liabilities as of December 31, 2023
| Assets |
Investment in securities, at value
(identified cost $208,462,744) including securities on loan of $1,352,585 | $216,888,363 |
| Cash | 5,562,597 |
Cash denominated in foreign currencies
(identified cost $168,346) | 169,096 |
| Receivables: | |
| Dividends | 316,613 |
| Portfolio shares sold | 8,743 |
| Securities lending | 3,687 |
| Investment securities sold | 379 |
| Other assets | 1,643 |
| Total assets | 222,951,121 |
| Liabilities |
| Cash collateral received for securities on loan | 1,221,802 |
| Payables: | |
| Foreign capital gains tax (See Note 2) | 1,019,329 |
| Manager (See Note 3) | 181,678 |
| Portfolio shares redeemed | 109,696 |
| Custodian | 67,580 |
| Professional fees | 43,126 |
| Investment securities purchased | 30,372 |
| Shareholder communication | 26,501 |
| NYLIFE Distributors (See Note 3) | 13,626 |
| Accrued expenses | 6,367 |
| Total liabilities | 2,720,077 |
| Net assets | $220,231,044 |
| Composition of Net Assets |
| Shares of beneficial interest outstanding (par value of $.001 per share) unlimited number of shares authorized | $ 31,630 |
| Additional paid-in-capital | 272,071,566 |
| | 272,103,196 |
| Total distributable earnings (loss) | (51,872,152) |
| Net assets | $220,231,044 |
| Initial Class | |
| Net assets applicable to outstanding shares | $154,578,617 |
| Shares of beneficial interest outstanding | 22,223,195 |
| Net asset value per share outstanding | $ 6.96 |
| Service Class | |
| Net assets applicable to outstanding shares | $ 65,652,427 |
| Shares of beneficial interest outstanding | 9,407,176 |
| Net asset value per share outstanding | $ 6.98 |
The notes to the financial statements are an integral part of, and should be read in conjunction with, the financial statements.
15
Statement of Operations for the year ended December 31, 2023
| Investment Income (Loss) |
| Income | |
| Dividends (net of foreign tax withholding of $503,347) | $ 4,882,649 |
| Securities lending, net | 9,103 |
| Other | 55,966 |
| Total income | 4,947,718 |
| Expenses | |
| Manager (See Note 3) | 2,227,427 |
| Distribution/Service—Service Class (See Note 3) | 171,128 |
| Custodian | 162,666 |
| Professional fees | 126,972 |
| Trustees | 5,787 |
| Miscellaneous | 8,765 |
| Total expenses before waiver/reimbursement | 2,702,745 |
| Reimbursement from prior custodian(a) | (10,272) |
| Net expenses | 2,692,473 |
| Net investment income (loss) | 2,255,245 |
| Realized and Unrealized Gain (Loss) |
| Net realized gain (loss) on: | |
| Unaffiliated investment transactions(b) | (14,207,289) |
| Foreign currency transactions | (229,122) |
| Net realized gain (loss) | (14,436,411) |
| Net change in unrealized appreciation (depreciation) on: | |
| Unaffiliated investments(c) | 28,270,386 |
| Translation of other assets and liabilities in foreign currencies | (79,740) |
| Net change in unrealized appreciation (depreciation) | 28,190,646 |
| Net realized and unrealized gain (loss) | 13,754,235 |
| Net increase (decrease) in net assets resulting from operations | $ 16,009,480 |
| (a) | Represents a refund for overbilling of custody fees. |
| (b) | Realized gain (loss) on security transactions recorded net of foreign capital gains tax in the amount of $152,030. |
| (c) | Net change in unrealized appreciation (depreciation) on investments recorded net of foreign capital gains tax in the amount of $(570,082). |
The notes to the financial statements are an integral part of, and should be read in conjunction with, the financial statements.
| 16 | MainStay VP Candriam Emerging Markets Equity Portfolio |
Statements of Changes in Net Assets
for the years ended December 31, 2023 and December 31, 2022
| | 2023 | 2022 |
| Increase (Decrease) in Net Assets |
| Operations: | | |
| Net investment income (loss) | $ 2,255,245 | $ 3,076,160 |
| Net realized gain (loss) | (14,436,411) | (44,773,229) |
| Net change in unrealized appreciation (depreciation) | 28,190,646 | (48,297,244) |
| Net increase (decrease) in net assets resulting from operations | 16,009,480 | (89,994,313) |
| Distributions to shareholders: | | |
| Initial Class | (2,643,644) | (25,368,728) |
| Service Class | (958,432) | (11,240,825) |
| Total distributions to shareholders | (3,602,076) | (36,609,553) |
| Capital share transactions: | | |
| Net proceeds from sales of shares | 7,298,977 | 25,988,468 |
| Net asset value of shares issued to shareholders in reinvestment of distributions | 3,602,076 | 36,609,553 |
| Cost of shares redeemed | (32,178,378) | (20,777,407) |
| Increase (decrease) in net assets derived from capital share transactions | (21,277,325) | 41,820,614 |
| Net increase (decrease) in net assets | (8,869,921) | (84,783,252) |
| Net Assets |
| Beginning of year | 229,100,965 | 313,884,217 |
| End of year | $220,231,044 | $229,100,965 |
The notes to the financial statements are an integral part of, and should be read in conjunction with, the financial statements.
17
Financial Highlights selected per share data and ratios
| | Year Ended December 31, |
| Initial Class | 2023 | | 2022 | | 2021 | | 2020 | | 2019 |
| Net asset value at beginning of year | $ 6.60 | | $ 11.16 | | $ 11.51 | | $ 9.46 | | $ 7.99 |
| Net investment income (loss) | 0.07 | | 0.11 | | 0.12(a) | | 0.07(a) | | 0.19(a) |
| Net realized and unrealized gain (loss) | 0.41 | | (3.39) | | (0.34) | | 2.30 | | 1.41 |
| Total from investment operations | 0.48 | | (3.28) | | (0.22) | | 2.37 | | 1.60 |
| Less distributions: | | | | | | | | | |
| From net investment income | (0.12) | | (0.09) | | (0.13) | | (0.32) | | (0.13) |
| From net realized gain on investments | — | | (1.19) | | — | | — | | — |
| Total distributions | (0.12) | | (1.28) | | (0.13) | | (0.32) | | (0.13) |
| Net asset value at end of year | $ 6.96 | | $ 6.60 | | $ 11.16 | | $ 11.51 | | $ 9.46 |
| Total investment return (b) | 7.25% | | (28.72)% | | (2.00)% | | 25.71% | | 20.08% |
| Ratios (to average net assets)/Supplemental Data: | | | | | | | | | |
| Net investment income (loss) | 1.09%(c) | | 1.28% | | 1.02% | | 0.79% | | 2.18% |
| Net expenses (d) | 1.13%(e) | | 1.16% | | 1.13% | | 1.18% | | 1.17% |
| Expenses (before waiver/reimbursement) (d) | 1.14% | | 1.16% | | 1.14% | | 1.18% | | 1.17% |
| Portfolio turnover rate | 52% | | 115% | | 63% | | 123% | | 121% |
| Net assets at end of year (in 000's) | $ 154,579 | | $ 158,187 | | $ 211,647 | | $ 257,933 | | $ 273,042 |
| (a) | Per share data based on average shares outstanding during the year. |
| (b) | Total return does not reflect any deduction of sales charges, mortality and expense charges, contract charges or administrative charges. For periods of less than one year, total return is not annualized. |
| (c) | Without the custody fee reimbursement, net investment income (loss) would have been 1.08%. |
| (d) | In addition to the fees and expenses which the Portfolio bears directly, it also indirectly bears a pro-rata share of the fees and expenses of the underlying funds in which it invests. Such indirect expenses are not included in the above expense ratios. |
| (e) | Without the custody fee reimbursement, net expenses would have been 1.14%. |
| | Year Ended December 31, |
| Service Class | 2023 | | 2022 | | 2021 | | 2020 | | 2019 |
| Net asset value at beginning of year | $ 6.62 | | $ 11.16 | | $ 11.52 | | $ 9.45 | | $ 7.98 |
| Net investment income (loss) | 0.06 | | 0.09 | | 0.09(a) | | 0.05(a) | | 0.17(a) |
| Net realized and unrealized gain (loss) | 0.40 | | (3.39) | | (0.35) | | 2.31 | | 1.40 |
| Total from investment operations | 0.46 | | (3.30) | | (0.26) | | 2.36 | | 1.57 |
| Less distributions: | | | | | | | | | |
| From net investment income | (0.10) | | (0.05) | | (0.10) | | (0.29) | | (0.10) |
| From net realized gain on investments | — | | (1.19) | | — | | — | | — |
| Total distributions | (0.10) | | (1.24) | | (0.10) | | (0.29) | | (0.10) |
| Net asset value at end of year | $ 6.98 | | $ 6.62 | | $ 11.16 | | $ 11.52 | | $ 9.45 |
| Total investment return (b) | 6.98% | | (28.89)% | | (2.25)% | | 25.40% | | 19.78% |
| Ratios (to average net assets)/Supplemental Data: | | | | | | | | | |
| Net investment income (loss) | 0.84%(c) | | 1.03% | | 0.78% | | 0.57% | | 2.00% |
| Net expenses (d) | 1.38%(e) | | 1.41% | | 1.38% | | 1.43% | | 1.42% |
| Expenses (before waiver/reimbursement) (d) | 1.39% | | 1.41% | | 1.39% | | 1.43% | | 1.42% |
| Portfolio turnover rate | 52% | | 115% | | 63% | | 123% | | 121% |
| Net assets at end of year (in 000's) | $ 65,652 | | $ 70,914 | | $ 102,237 | | $ 120,450 | | $ 127,042 |
| (a) | Per share data based on average shares outstanding during the year. |
| (b) | Total return does not reflect any deduction of sales charges, mortality and expense charges, contract charges or administrative charges. For periods of less than one year, total return is not annualized. |
| (c) | Without the custody fee reimbursement, net investment income (loss) would have been 0.83%. |
| (d) | In addition to the fees and expenses which the Portfolio bears directly, it also indirectly bears a pro-rata share of the fees and expenses of the underlying funds in which it invests. Such indirect expenses are not included in the above expense ratios. |
| (e) | Without the custody fee reimbursement, net expenses would have been 1.39%. |
The notes to the financial statements are an integral part of, and should be read in conjunction with, the financial statements.
| 18 | MainStay VP Candriam Emerging Markets Equity Portfolio |
Notes to Financial Statements
Note 1–Organization and Business
MainStay VP Funds Trust (the “Fund”) was organized as a Delaware statutory trust on February 1, 2011. The Fund is registered under the Investment Company Act of 1940, as amended (the “1940 Act”), as an open-end management investment company. The Fund is comprised of thirty-one separate series (collectively referred to as the “Portfolios”). These financial statements and notes relate to the MainStay VP Candriam Emerging Markets Equity Portfolio (the "Portfolio"), a "diversified” portfolio, as that term is defined in the 1940 Act, as interpreted or modified by regulatory authorities having jurisdiction, from time to time.
Shares of the Portfolio are currently offered to certain separate accounts to fund variable annuity policies and variable universal life insurance policies issued by New York Life Insurance and Annuity Corporation (“NYLIAC”), a wholly-owned subsidiary of New York Life Insurance Company (“New York Life”) and may also be offered to fund variable annuity policies and variable universal life insurance policies issued by other insurance companies. NYLIAC allocates shares of the Portfolio to, among others, certain NYLIAC separate accounts. Shares of the Portfolio are also offered to the MainStay VP Conservative Allocation Portfolio, MainStay VP Moderate Allocation Portfolio, MainStay VP Growth Allocation Portfolio and MainStay VP Equity Allocation Portfolio, which operate as “funds-of-funds," and other variable insurance funds.
The following table lists the Portfolio's share classes that have been registered and commenced operations:
| Class | Commenced Operations |
| Initial Class | February 17, 2012 |
| Service Class | February 17, 2012 |
Shares of the Portfolio are offered and are redeemed at a price equal to their respective net asset value (“NAV”) per share. No sales or redemption charge is applicable to the purchase or redemption of the Portfolio's shares. Under the terms of the Fund’s multiple class plan, adopted pursuant to Rule 18f-3 under the 1940 Act, the classes differ in that, among other things, Service Class shares of the Portfolio pay a combined distribution and service fee of 0.25% of average daily net assets attributable to Service Class shares of the Portfolio to the Distributor (as defined in Note 3(B)) pursuant to a plan adopted in accordance with Rule 12b-1 under the 1940 Act. Contract owners of variable annuity contracts purchased after June 2, 2003, are permitted to invest only in the Service Class shares.
The Portfolio's investment objective is to seek long-term capital appreciation.
Note 2–Significant Accounting Policies
The Portfolio is an investment company and accordingly follows the investment company accounting and reporting guidance of the Financial Accounting Standards Board (“FASB”) Accounting Standards Codification Topic 946 Financial Services—Investment Companies. The Portfolio prepares its financial statements in accordance with generally accepted
accounting principles (“GAAP”) in the United States of America and follows the significant accounting policies described below.
(A) Securities Valuation. Investments are usually valued as of the close of regular trading on the New York Stock Exchange (the "Exchange") (usually 4:00 p.m. Eastern time) on each day the Portfolio is open for business ("valuation date").
Pursuant to Rule 2a-5 under the 1940 Act, the Board of Trustees of the Fund (the "Board") has designated New York Life Investment Management LLC (“New York Life Investments” or the "Manager") as its Valuation Designee (the "Valuation Designee"). The Valuation Designee is responsible for performing fair valuations relating to all investments in the Portfolio’s portfolio for which market quotations are not readily available; periodically assessing and managing material valuation risks; establishing and applying fair value methodologies; testing fair valuation methodologies; evaluating and overseeing pricing services; ensuring appropriate segregation of valuation and portfolio management functions; providing quarterly, annual and prompt reporting to the Board, as appropriate; identifying potential conflicts of interest; and maintaining appropriate records. The Valuation Designee has established a valuation committee ("Valuation Committee") to assist in carrying out the Valuation Designee’s responsibilities and establish prices of securities for which market quotations are not readily available. The Portfolio's and the Valuation Designee's policies and procedures ("Valuation Procedures") govern the Valuation Designee’s selection and application of methodologies for determining and calculating the fair value of Portfolio investments. The Valuation Designee may value the Portfolio's portfolio securities for which market quotations are not readily available and other Portfolio assets utilizing inputs from pricing services and other third-party sources. The Valuation Committee meets (in person, via electronic mail or via teleconference) on an ad-hoc basis to determine fair valuations and on a quarterly basis to review fair value events with respect to certain securities for which market quotations are not readily available, including valuation risks and back-testing results, and to preview reports to the Board.
The Valuation Committee establishes prices of securities for which market quotations are not readily available based on such methodologies and measurements on a regular basis after considering information that is reasonably available and deemed relevant by the Valuation Committee. The Board shall oversee the Valuation Designee and review fair valuation materials on a prompt, quarterly and annual basis and approve proposed revisions to the Valuation Procedures.
Investments for which market quotations are not readily available are valued at fair value as determined in good faith pursuant to the Valuation Procedures. A market quotation is readily available only when that quotation is a quoted price (unadjusted) in active markets for identical investments that the Portfolio can access at the measurement date, provided that a quotation will not be readily available if it is not reliable. "Fair value" is defined as the price the Portfolio would reasonably expect to receive upon selling an asset or liability in an orderly transaction to an independent buyer in the principal or most advantageous market for the
Notes to Financial Statements (continued)
asset or liability. Fair value measurements are determined within a framework that establishes a three-tier hierarchy that maximizes the use of observable market data and minimizes the use of unobservable inputs to establish a classification of fair value measurements for disclosure purposes. "Inputs" refer broadly to the assumptions that market participants would use in pricing the asset or liability, including assumptions about risk, such as the risk inherent in a particular valuation technique used to measure fair value using a pricing model and/or the risk inherent in the inputs for the valuation technique. Inputs may be observable or unobservable. Observable inputs reflect the assumptions market participants would use in pricing the asset or liability based on market data obtained from sources independent of the Portfolio. Unobservable inputs reflect the Portfolio’s own assumptions about the assumptions market participants would use in pricing the asset or liability based on the information available. The inputs or methodology used for valuing assets or liabilities may not be an indication of the risks associated with investing in those assets or liabilities. The three-tier hierarchy of inputs is summarized below.
| • | Level 1—quoted prices (unadjusted) in active markets for an identical asset or liability |
| • | Level 2—other significant observable inputs (including quoted prices for a similar asset or liability in active markets, interest rates and yield curves, prepayment speeds, credit risk, etc.) |
| • | Level 3—significant unobservable inputs (including the Portfolio's own assumptions about the assumptions that market participants would use in measuring fair value of an asset or liability) |
The level of an asset or liability within the fair value hierarchy is based on the lowest level of an input, both individually and in the aggregate, that is significant to the fair value measurement. The aggregate value by input level of the Portfolio’s assets and liabilities as of December 31, 2023, is included at the end of the Portfolio of Investments.
The Portfolio may use third-party vendor evaluations, whose prices may be derived from one or more of the following standard inputs, among others:
| • Broker/dealer quotes | • Benchmark securities |
| • Two-sided markets | • Reference data (corporate actions or material event notices) |
| • Bids/offers | • Monthly payment information |
| • Industry and economic events | • Reported trades |
An asset or liability for which a market quotation is not readily available is valued by methods deemed reasonable in good faith by the Valuation Committee, following the Valuation Procedures to represent fair value. Under these procedures, the Valuation Designee generally uses a market-based approach which may use related or comparable assets or liabilities, recent transactions, market multiples, book values and other relevant information. The Valuation Designee may also use an income-based valuation approach in which the anticipated future cash flows of the asset or liability are discounted to calculate fair value.
Discounts may also be applied due to the nature and/or duration of any restrictions on the disposition of the asset or liability. Fair value represents a good faith approximation of the value of a security. Fair value determinations involve the consideration of a number of subjective factors, an analysis of applicable facts and circumstances and the exercise of judgment. As a result, it is possible that the fair value for a security determined in good faith in accordance with the Valuation Procedures may differ from valuations for the same security determined for other funds using their own valuation procedures. Although the Valuation Procedures are designed to value a security at the price the Portfolio may reasonably expect to receive upon the security's sale in an orderly transaction, there can be no assurance that any fair value determination thereunder would, in fact, approximate the amount that the Portfolio would actually realize upon the sale of the security or the price at which the security would trade if a reliable market price were readily available. During the year ended December 31, 2023, there were no material changes to the fair value methodologies.
Securities which may be valued in this manner include, but are not limited to: (i) a security for which trading has been halted or suspended or otherwise does not have a readily available market quotation on a given day; (ii) a debt security that has recently gone into default and for which there is not a current market quotation; (iii) a security of an issuer that has entered into a restructuring; (iv) a security that has been delisted from a national exchange; (v) a security subject to trading collars for which no or limited trading takes place; and (vi) a security whose principal market has been temporarily closed at a time when, under normal conditions, it would be open. Securities valued in this manner are generally categorized as Level 2 or 3 in the hierarchy.
Certain securities held by the Portfolio may principally trade in foreign markets. Events may occur between the time the foreign markets close and the time at which the Portfolio's NAVs are calculated. These events may include, but are not limited to, situations relating to a single issuer in a market sector, significant fluctuations in U.S. or foreign markets, natural disasters, armed conflicts, governmental actions or other developments not tied directly to the securities markets. Should the Valuation Designee conclude that such events may have affected the accuracy of the last price of such securities reported on the local foreign market, the Valuation Designee may, pursuant to the Valuation Procedures, adjust the value of the local price to reflect the estimated impact on the price of such securities as a result of such events. In this instance, securities are generally categorized as Level 3 in the hierarchy. Additionally, certain foreign equity securities are also fair valued whenever the movement of a particular index exceeds certain thresholds. In such cases, the securities are fair valued by applying factors provided by a third-party vendor in accordance with the Valuation Procedures and are generally categorized as Level 2 in the hierarchy.
If the principal market of certain foreign equity securities is closed in observance of a local foreign holiday, these securities are valued using the last closing price of regular trading on the relevant exchange and fair valued by applying factors provided by a third-party vendor in accordance
| 20 | MainStay VP Candriam Emerging Markets Equity Portfolio |
with the Valuation Procedures. These securities are generally categorized as Level 2 in the hierarchy.
Equity securities, rights and warrants, if applicable, are valued at the last quoted sales prices as of the close of regular trading on the relevant exchange on each valuation date. Securities that are not traded on the valuation date are valued at the mean of the last quoted bid and ask prices. Prices are normally taken from the principal market in which each security trades. These securities are generally categorized as Level 1 in the hierarchy.
Investments in mutual funds, including money market funds, are valued at their respective NAVs at the close of business each day on the valuation date. These securities are generally categorized as Level 1 in the hierarchy.
Temporary cash investments acquired in excess of 60 days to maturity at the time of purchase are valued using the latest bid prices or using valuations based on a matrix system (which considers such factors as security prices, yields, maturities and ratings), both as furnished by independent pricing services. Temporary cash investments that mature in 60 days or less at the time of purchase ("Short-Term Investments") are valued using the amortized cost method of valuation, unless the use of such method would be inappropriate. The amortized cost method involves valuing a security at its cost on the date of purchase and thereafter assuming a constant amortization to maturity of the difference between such cost and the value on maturity date. Amortized cost approximates the current fair value of a security. Securities valued using the amortized cost method are not valued using quoted prices in an active market and are generally categorized as Level 2 in the hierarchy.
The information above is not intended to reflect an exhaustive list of the methodologies that may be used to value portfolio investments. The Valuation Procedures permit the use of a variety of valuation methodologies in connection with valuing portfolio investments. The methodology used for a specific type of investment may vary based on the market data available or other considerations. The methodologies summarized above may not represent the specific means by which portfolio investments are valued on any particular business day.
A portfolio investment may be classified as an illiquid investment under the Portfolio's written liquidity risk management program and related procedures (“Liquidity Program”). Illiquidity of an investment might prevent the sale of such investment at a time when the Manager or the Subadvisor might wish to sell, and these investments could have the effect of decreasing the overall level of the Portfolio's liquidity. Further, the lack of an established secondary market may make it more difficult to value illiquid investments, requiring the Portfolio to rely on judgments that may be somewhat subjective in measuring value, which could vary materially from the amount that the Portfolio could realize upon disposition. Difficulty in selling illiquid investments may result in a loss or may be costly to the Portfolio. An illiquid investment is any investment that the Manager or Subadvisor reasonably expects cannot be sold or disposed of in current market conditions in seven calendar days or less without the sale or disposition significantly changing the market value of
the investment. The liquidity classification of each investment will be made using information obtained after reasonable inquiry and taking into account, among other things, relevant market, trading and investment-specific considerations in accordance with the Liquidity Program. Illiquid investments are often fair valued in accordance with the Portfolio's procedures described above. The liquidity of the Portfolio's investments was determined as of December 31, 2023, and can change at any time.
(B) Income Taxes. The Portfolio's policy is to comply with the requirements of the Internal Revenue Code of 1986, as amended (the “Internal Revenue Code”), applicable to regulated investment companies and to distribute all of its taxable income to the shareholders of the Portfolio within the allowable time limits.
The Manager evaluates the Portfolio’s tax positions to determine if the tax positions taken meet the minimum recognition threshold in connection with accounting for uncertainties in income tax positions taken or expected to be taken for the purposes of measuring and recognizing tax liabilities in the financial statements. Recognition of tax benefits of an uncertain tax position is permitted only to the extent the position is “more likely than not” to be sustained assuming examination by taxing authorities. The Manager analyzed the Portfolio's tax positions taken on federal, state and local income tax returns for all open tax years (for up to three tax years) and has concluded that no provisions for federal, state and local income tax are required in the Portfolio's financial statements. The Portfolio's federal, state and local income tax and federal excise tax returns for tax years for which the applicable statutes of limitations have not expired are subject to examination by the Internal Revenue Service and state and local departments of revenue.
(C) Foreign Taxes. The Portfolio may be subject to foreign taxes on income and other transaction-based taxes imposed by certain countries in which it invests. A portion of the taxes on gains on investments or currency purchases/repatriation may be reclaimable. The Portfolio will accrue such taxes and reclaims as applicable, based upon its current interpretation of tax rules and regulations that exist in the markets in which it invests.
The Portfolio may be subject to taxation on realized capital gains, repatriation proceeds and other transaction-based taxes imposed by certain countries in which it invests. The Portfolio will accrue such taxes as applicable based upon its current interpretation of tax rules and regulations that exist in the market in which it invests. Capital gains taxes relating to positions still held are reflected as a liability in the Statement of Assets and Liabilities, as well as an adjustment to the Portfolio's net unrealized appreciation (depreciation). Taxes related to capital gains realized, if any, are reflected as part of net realized gain (loss) in the Statement of Operations. Changes in tax liabilities related to capital gains taxes on unrealized investment gains, if any, are reflected as part of the change in net unrealized appreciation (depreciation) on investments in the Statement of Operations. Transaction-based charges are generally assessed as a percentage of the transaction amount.
Notes to Financial Statements (continued)
(D) Dividends and Distributions to Shareholders. Dividends and distributions are recorded on the ex-dividend date. The Portfolio intends to declare and pay dividends from net investment income and distributions from net realized capital and currency gains, if any, at least annually. All dividends and distributions are reinvested at NAV in the same class of shares of the Portfolio. Dividends and distributions to shareholders are determined in accordance with federal income tax regulations and may differ from determinations using GAAP.
(E) Security Transactions and Investment Income. The Portfolio records security transactions on the trade date. Realized gains and losses on security transactions are determined using the identified cost method. Dividend income is recognized on the ex-dividend date, net of any foreign tax withheld at the source, and interest income is accrued as earned using the effective interest rate method. Distributions received from real estate investment trusts may be classified as dividends, capital gains and/or return of capital.
Investment income and realized and unrealized gains and losses on investments of the Portfolio are allocated pro rata to the separate classes of shares based upon their relative net assets on the date the income is earned or realized and unrealized gains and losses are incurred.
(F) Expenses. Expenses of the Fund are allocated to the individual Portfolios in proportion to the net assets of the respective Portfolios when the expenses are incurred, except where direct allocations of expenses can be made. Expenses (other than fees incurred under the distribution and service plans, further discussed in Note 3(B), which are charged directly to the Service Class shares) are allocated to separate classes of shares pro rata based upon their relative net assets on the date the expenses are incurred. The expenses borne by the Portfolio, including those of related parties to the Portfolio, are shown in the Statement of Operations.
Additionally, the Portfolio may invest in mutual funds, which are subject to management fees and other fees that may cause the costs of investing in mutual funds to be greater than the costs of owning the underlying securities directly. These indirect expenses of mutual funds are not included in the amounts shown as expenses in the Statement of Operations or in the expense ratios included in the Financial Highlights.
(G) Use of Estimates. In preparing financial statements in conformity with GAAP, the Manager makes estimates and assumptions that affect the reported amounts and disclosures in the financial statements. Actual results could differ from those estimates and assumptions.
(H) Foreign Currency Transactions. The Portfolio's books and records are maintained in U.S. dollars. Prices of securities denominated in foreign currency amounts are translated into U.S. dollars at the mean between the buying and selling rates last quoted by any major U.S. bank at the following dates:
(i) market value of investment securities, other assets and liabilities— at the valuation date; and
(ii) purchases and sales of investment securities, income and expenses—at the date of such transactions.
The assets and liabilities that are denominated in foreign currency amounts are presented at the exchange rates and market values at the close of the period. The realized and unrealized changes in net assets arising from fluctuations in exchange rates and market prices of securities are not separately presented.
Net realized gain (loss) on foreign currency transactions represents net currency gains or losses realized as a result of differences between the amounts of securities sale proceeds or purchase cost, dividends, interest and withholding taxes as recorded on the Portfolio's books, and the U.S. dollar equivalent amount actually received or paid. Net currency gains or losses from valuing such foreign currency denominated assets and liabilities, other than investments at valuation date exchange rates, are reflected in unrealized foreign exchange gains or losses.
(I) Securities Sold Short. During the period a short position is open, depending on the nature and type of security, a short position is reflected as a liability and is marked to market in accordance with the valuation methodologies previously detailed (See Note 2(A)). Liabilities for securities sold short are closed out by purchasing the applicable securities for delivery to the counterparty broker. A gain, limited to the price at which the Portfolio sold the security short, or a loss, unlimited as to dollar amount, will be recognized upon termination of a short sale if the market price on the date the short position is closed out is less or greater, respectively, than the proceeds originally received. Any such gain or loss may be offset, completely or in part, by the change in the value of the hedged investments. Interest on short positions held is accrued daily, while dividends declared on short positions existing on the record date are recorded on the ex-dividend date as a dividend expense in the Statement of Operations. Broker fees and other expenses related to securities sold short are disclosed in the Statement of Operations. Short sales involve risk of loss in excess of the related amounts reflected in the Statement of Assets and Liabilities. As of December 31, 2023, the Portfolio did not enter into any securities sold short.
(J) Securities Lending. In order to realize additional income, the Portfolio may engage in securities lending, subject to the limitations set forth in the 1940 Act and relevant guidance by the staff of the Securities and Exchange Commission (“SEC”). If the Portfolio engages in securities lending, the Portfolio will lend through its custodian, JPMorgan Chase Bank, N.A., ("JPMorgan"), acting as securities lending agent on behalf of the Portfolio. Under the current arrangement, JPMorgan will manage the Portfolio's collateral in accordance with the securities lending agency agreement between the Portfolio and JPMorgan, and indemnify the Portfolio against counterparty risk. The loans will be collateralized by cash (which may be invested in a money market fund) and/or non-cash collateral (which may include U.S. Treasury securities and/or U.S. government agency securities issued or guaranteed by the United States government or its agencies or instrumentalities) at least equal at all times to the market value of the securities loaned. Non-cash collateral held at year end is segregated and cannot be transferred by the Portfolio. The
| 22 | MainStay VP Candriam Emerging Markets Equity Portfolio |
Portfolio bears the risk of delay in recovery of, or loss of rights in, the securities loaned. The Portfolio may also record a realized gain or loss on securities deemed sold due to a borrower’s inability to return securities on loan. The Portfolio bears the risk of any loss on investment of cash collateral. The Portfolio will receive compensation for lending its securities in the form of fees or it will retain a portion of interest earned on the investment of any cash collateral. The Portfolio will also continue to receive interest and dividends on the securities loaned and any gain or loss in the market price of the securities loaned that may occur during the term of the loan will be for the account of the Portfolio. Income earned from securities lending activities, if any, is reflected in the Statement of Operations.
(K) Rights and Warrants. Rights are certificates that permit the holder to purchase a certain number of shares, or a fractional share, of a new stock from the issuer at a specific price. Warrants are instruments that entitle the holder to buy an equity security at a specific price for a specific period of time. These investments can provide a greater potential for profit or loss than an equivalent investment in the underlying security. Prices of these investments do not necessarily move in tandem with the prices of the underlying securities.
There is risk involved in the purchase of rights and warrants in that these investments are speculative investments. The Portfolio could also lose the entire value of its investment in warrants if such warrants are not exercised by the date of its expiration. The Portfolio is exposed to risk until the sale or exercise of each right or warrant is completed.
(L) Foreign Securities Risk. The Portfolio may invest in foreign securities, which carry certain risks that are in addition to the usual risks inherent in domestic securities. Foreign regulatory regimes and securities markets can have less stringent investor protections and disclosure standards and less liquid trading markets than U.S. regulatory regimes and securities markets, and can experience political, social and economic developments that may affect the value of investments in foreign securities. These risks include those resulting from currency fluctuations, future adverse political or economic developments and possible imposition of currency exchange blockages or other foreign governmental laws or restrictions. Economic sanctions and other similar governmental actions or developments could, among other things, effectively restrict or eliminate the Portfolio's ability to purchase or sell certain foreign securities or groups of foreign securities, and thus may make the Portfolio's investments in such securities less liquid or more difficult to value. These risks are likely to be greater in emerging markets than in developed markets. The ability of issuers of debt securities held by the Portfolio to meet their obligations may be affected by, among other things, economic or political developments in a specific country, industry or region. For example, the Portfolio has significant investments in the Asia-Pacific region. The development and stability of the Asia-Pacific region can be adversely affected by, among other regional and global developments, trade barriers, exchange controls and other measures imposed or negotiated by the countries with which they trade. Some Asia-Pacific countries can be characterized as emerging markets or
newly industrialized and may experience more volatile economic cycles and less liquid markets than developed countries.
(M) Indemnifications. Under the Fund’s organizational documents, its officers and trustees are indemnified against certain liabilities that may arise out of performance of their duties to the Fund. Additionally, in the normal course of business, the Portfolio enters into contracts with third-party service providers that contain a variety of representations and warranties and that may provide general indemnifications. The Portfolio's maximum exposure under these arrangements is unknown, as this would involve future claims that may be made against the Portfolio that have not yet occurred. The Manager believes that the risk of loss in connection with these potential indemnification obligations is remote. However, there can be no assurance that material liabilities related to such obligations will not arise in the future, which could adversely impact the Portfolio.
Note 3–Fees and Related Party Transactions
(A) Manager and Subadvisor. New York Life Investments, a registered investment adviser and an indirect, wholly-owned subsidiary of New York Life, serves as the Portfolio's Manager, pursuant to an Amended and Restated Management Agreement (“Management Agreement”). The Manager provides offices, conducts clerical, recordkeeping and bookkeeping services and keeps most of the financial and accounting records required to be maintained by the Portfolio. Except for the portion of salaries and expenses that are the responsibility of the Portfolio, the Manager pays the salaries and expenses of all personnel affiliated with the Portfolio and certain operational expenses of the Portfolio. The Portfolio reimburses New York Life Investments in an amount equal to the portion of the compensation of the Chief Compliance Officer attributable to the Portfolio. Candriam (the "Subadvisor"), a registered investment adviser and an indirect, wholly-owned subsidiary of New York Life, serves as the Subadvisor to the Portfolio and is responsible for the day-to-day portfolio management of the Portfolio. Pursuant to the terms of an Amended and Restated Subadvisory Agreement between New York Life Investments and Candriam, New York Life Investments pays for the services of the Subadvisor.
Pursuant to the Management Agreement, the Fund pays the Manager, on behalf of the Portfolio, a monthly fee for the services performed and the facilities furnished at an annual rate of the Portfolio's average daily net assets as follows: 1.00% up to $1 billion; and 0.975% in excess of $1 billion. During the year ended December 31, 2023, the effective management fee rate was 1.00% of the Portfolio's average daily net assets.
During the year ended December 31, 2023, New York Life Investments earned fees from the Portfolio in the amount of $2,227,427 and paid the Subadvisor fees in the amount of $1,113,713.
JPMorgan provides sub-administration and sub-accounting services to the Portfolio pursuant to an agreement with New York Life Investments. These services include calculating the daily NAVs of the Portfolio, maintaining the general ledger and sub-ledger accounts for the
Notes to Financial Statements (continued)
calculation of the Portfolio's NAVs, and assisting New York Life Investments in conducting various aspects of the Portfolio's administrative operations. For providing these services to the Portfolio, JPMorgan is compensated by New York Life Investments.
Pursuant to an agreement between the Fund and New York Life Investments, New York Life Investments is responsible for providing or procuring certain regulatory reporting services for the Portfolio. The Portfolio will reimburse New York Life Investments for the actual costs incurred by New York Life Investments in connection with providing or procuring these services for the Portfolio.
(B) Distribution and Service Fees. The Fund, on behalf of the Portfolio, has entered into a distribution agreement with NYLIFE Distributors LLC (the “Distributor”), an affiliate of New York Life Investments. The Portfolio has adopted a distribution plan (the “Plan”) in accordance with the provisions of Rule 12b-1 under the 1940 Act. Under the Plan, the Distributor has agreed to provide, through its affiliates or independent third parties, various distribution-related, shareholder and administrative support services to the Service Class shareholders. For its services, the Distributor is entitled to a combined distribution and service fee accrued daily and paid monthly at an annual rate of 0.25% of the average daily net assets attributable to the Service Class shares of the Portfolio.
Note 4-Federal Income Tax
As of December 31, 2023, the cost and unrealized appreciation (depreciation) of the Portfolio’s investment portfolio, including applicable derivative contracts and other financial instruments, as determined on a federal income tax basis, were as follows:
| | Federal Tax
Cost | Gross
Unrealized
Appreciation | Gross
Unrealized
(Depreciation) | Net
Unrealized
Appreciation/
(Depreciation) |
| Investments in Securities | $212,961,818 | $25,363,595 | $(21,437,050) | $3,926,545 |
As of December 31, 2023, the components of accumulated gain (loss) on a tax basis were as follows:
Ordinary
Income | Accumulated
Capital
and Other
Gain (Loss) | Other
Temporary
Differences | Unrealized
Appreciation
(Depreciation) | Total
Accumulated
Gain (Loss) |
| $1,787,586 | $(56,481,526) | $— | $2,821,788 | $(51,872,152) |
The difference between book-basis and tax-basis unrealized appreciation (depreciation) is primarily due to wash sale adjustments.
As of December 31, 2023, for federal income tax purposes, capital loss carryforwards of $56,481,526, as shown in the table below, were available to the extent provided by the regulations to offset future realized gains of the Portfolio. Accordingly, no capital gains distributions are
expected to be paid to shareholders until net gains have been realized in excess of such amounts.
Capital Loss
Available Through | Short-Term
Capital Loss
Amounts (000’s) | Long-Term
Capital Loss
Amounts (000’s) |
| Unlimited | $49,693 | $6,788 |
During the years ended December 31, 2023 and December 31, 2022, the tax character of distributions paid as reflected in the Statements of Changes in Net Assets was as follows:
| | 2023 | 2022 |
| Distributions paid from: | | |
| Ordinary Income | $3,602,076 | $ 2,194,677 |
| Long-Term Capital Gains | — | 34,414,876 |
| Total | $3,602,076 | $36,609,553 |
Note 5–Custodian
JPMorgan is the custodian of cash and securities held by the Portfolio. Custodial fees are charged to the Portfolio based on the Portfolio's net assets and/or the market value of securities held by the Portfolio and the number of certain transactions incurred by the Portfolio.
Note 6–Line of Credit
The Portfolio and certain other funds managed by New York Life Investments maintain a line of credit with a syndicate of banks in order to secure a source of funds for temporary purposes to meet unanticipated or excessive redemption requests.
Effective July 25, 2023, under the credit agreement (the “Credit Agreement”), the aggregate commitment amount is $600,000,000 with an additional uncommitted amount of $100,000,000. The commitment fee is an annual rate of 0.15% of the average commitment amount payable quarterly, regardless of usage, to JPMorgan, who serves as the agent to the syndicate. The commitment fee is allocated among the Portfolio and certain other funds managed by New York Life Investments based upon their respective net assets and other factors. Interest on any revolving credit loan is charged based upon the Federal Funds Rate, Daily Simple Secured Overnight Financing Rate ("SOFR") + 0.10%, or the Overnight Bank Funding Rate, whichever is higher. The Credit Agreement expires on July 23, 2024, although the Portfolio, certain other funds managed by New York Life Investments and the syndicate of banks may renew the Credit Agreement for an additional year on the same or different terms or enter into a credit agreement with a different syndicate of banks. Prior to July 25, 2023, the aggregate commitment amount and the commitment fee were the same as those under the current Credit Agreement. During the year ended December 31, 2023, there were no borrowings made or outstanding with respect to the Portfolio under the Credit Agreement.
| 24 | MainStay VP Candriam Emerging Markets Equity Portfolio |
Note 7–Interfund Lending Program
Pursuant to an exemptive order issued by the SEC, the Portfolio, along with certain other funds managed by New York Life Investments, may participate in an interfund lending program. The interfund lending program provides an alternative credit facility that permits the Portfolio and certain other funds managed by New York Life Investments to lend or borrow money for temporary purposes directly to or from one another, subject to the conditions of the exemptive order. During the year ended December 31, 2023, there were no interfund loans made or outstanding with respect to the Portfolio.
Note 8–Purchases and Sales of Securities (in 000’s)
During the year ended December 31, 2023, purchases and sales of securities, other than short-term securities, were $112,982 and $137,233, respectively.
Note 9–Capital Share Transactions
Transactions in capital shares for the years ended December 31, 2023 and December 31, 2022, were as follows:
| Initial Class | Shares | Amount |
| Year ended December 31, 2023: | | |
| Shares sold | 728,793 | $ 4,910,032 |
| Shares issued to shareholders in reinvestment of distributions | 399,245 | 2,643,644 |
| Shares redeemed | (2,855,196) | (19,862,854) |
| Net increase (decrease) | (1,727,158) | $(12,309,178) |
| Year ended December 31, 2022: | | |
| Shares sold | 1,945,628 | $ 16,657,111 |
| Shares issued to shareholders in reinvestment of distributions | 4,039,028 | 25,368,728 |
| Shares redeemed | (1,007,338) | (9,209,477) |
| Net increase (decrease) | 4,977,318 | $ 32,816,362 |
| |
| Service Class | Shares | Amount |
| Year ended December 31, 2023: | | |
| Shares sold | 351,247 | $ 2,388,945 |
| Shares issued to shareholders in reinvestment of distributions | 144,184 | 958,432 |
| Shares redeemed | (1,797,103) | (12,315,524) |
| Net increase (decrease) | (1,301,672) | $ (8,968,147) |
| Year ended December 31, 2022: | | |
| Shares sold | 1,068,938 | $ 9,331,357 |
| Shares issued to shareholders in reinvestment of distributions | 1,784,088 | 11,240,825 |
| Shares redeemed | (1,305,553) | (11,567,930) |
| Net increase (decrease) | 1,547,473 | $ 9,004,252 |
Note 10–Other Matters
As of the date of this report, the Portfolio faces a heightened level of risk associated with current uncertainty, volatility and state of economies, financial markets, rising interest rates, and labor and health conditions around the world. Events such as war, acts of terrorism, recessions, rapid inflation, the imposition of international sanctions, earthquakes, hurricanes, epidemics and pandemics and other unforeseen natural or human disasters may have broad adverse social, political and economic effects on the global economy, which could negatively impact the value of the Portfolio's investments. Developments that disrupt global economies and financial markets may magnify factors that affect the Portfolio's performance.
Note 11–Subsequent Events
In connection with the preparation of the financial statements of the Portfolio as of and for the year ended December 31, 2023, events and transactions subsequent to December 31, 2023, through the date the financial statements were issued, have been evaluated by the Manager for possible adjustment and/or disclosure. No subsequent events requiring financial statement adjustment or disclosure have been identified.
Report of Independent Registered Public Accounting Firm
To the Board of Trustees of MainStay VP Funds Trust and Shareholders of MainStay VP Candriam Emerging Markets Equity Portfolio
Opinion on the Financial Statements
We have audited the accompanying statement of assets and liabilities, including the portfolio of investments, of MainStay VP Candriam Emerging Markets Equity Portfolio (one of the portfolios constituting MainStay VP Funds Trust, referred to hereafter as the “Portfolio”) as of December 31, 2023, the related statement of operations for the year ended December 31, 2023, the statements of changes in net assets for each of the two years in the period ended December 31, 2023, including the related notes, and the financial highlights for each of the five years in the period ended December 31, 2023 (collectively referred to as the “financial statements”). In our opinion, the financial statements present fairly, in all material respects, the financial position of the Portfolio as of December 31, 2023, the results of its operations for the year then ended, the changes in its net assets for each of the two years in the period ended December 31, 2023 and the financial highlights for each of the five years in the period ended December 31, 2023 in conformity with accounting principles generally accepted in the United States of America.
Basis for Opinion
These financial statements are the responsibility of the Portfolio’s management. Our responsibility is to express an opinion on the Portfolio’s financial statements based on our audits. We are a public accounting firm registered with the Public Company Accounting Oversight Board (United States) (PCAOB) and are required to be independent with respect to the Portfolio in accordance with the U.S. federal securities laws and the applicable rules and regulations of the Securities and Exchange Commission and the PCAOB.
We conducted our audits of these financial statements in accordance with the standards of the PCAOB. Those standards require that we plan and perform the audit to obtain reasonable assurance about whether the financial statements are free of material misstatement, whether due to error or fraud.
Our audits included performing procedures to assess the risks of material misstatement of the financial statements, whether due to error or fraud, and performing procedures that respond to those risks. Such procedures included examining, on a test basis, evidence regarding the amounts and disclosures in the financial statements. Our audits also included evaluating the accounting principles used and significant estimates made by management, as well as evaluating the overall presentation of the financial statements. Our procedures included confirmation of securities owned as of December 31, 2023 by correspondence with the custodian, transfer agents, and broker; when replies were not received from broker, we performed other auditing procedures. We believe that our audits provide a reasonable basis for our opinion.
/s/PricewaterhouseCoopers LLP
New York, New York
February 26, 2024
We have served as the auditor of one or more investment companies in the MainStay group of funds since 1984.
| 26 | MainStay VP Candriam Emerging Markets Equity Portfolio |
Board Consideration and Approval of Management Agreement and Subadvisory Agreement (Unaudited)
The continuation of the Management Agreement with respect to the MainStay VP Candriam Emerging Markets Equity Portfolio (“Portfolio”) and New York Life Investment Management LLC (“New York Life Investments”) and the Subadvisory Agreement between New York Life Investments and Candriam with respect to the Portfolio (together, “Advisory Agreements”) is subject to annual review and approval by the Board of Trustees of MainStay VP Funds Trust (“Board” of the “Trust”) in accordance with Section 15 of the Investment Company Act of 1940, as amended (“1940 Act”). At its December 6–7, 2023 meeting, the Board, including the Trustees who are not an “interested person” (as such term is defined in the 1940 Act) of the Trust (“Independent Trustees”) voting separately, unanimously approved the continuation of each of the Advisory Agreements for a one-year period.
In reaching the decision to approve the continuation of each of the Advisory Agreements, the Board considered information and materials furnished by New York Life Investments and Candriam in connection with an annual contract review process undertaken by the Board that took place at meetings of the Board and its Contracts Committee from September 2023 through December 2023, including information and materials furnished by New York Life Investments and Candriam in response to requests prepared on behalf of the Board, and in consultation with the Independent Trustees, by independent legal counsel to the Independent Trustees, which encompassed a variety of topics, including those summarized below. Information and materials requested by and furnished to the Board for consideration in connection with the contract review process included, among other items, reports on the Portfolio and “peer funds” prepared by Institutional Shareholder Services Inc. (“ISS”), an independent third-party service provider engaged by the Board to report objectively on the Portfolio’s investment performance, management fee and total expenses. The Board also considered information on the fees charged to other investment advisory clients of New York Life Investments and/or Candriam that follow investment strategies similar to those of the Portfolio, if any, and, when applicable, the rationale for differences in the Portfolio’s management and subadvisory fees and the fees charged to those other investment advisory clients. In addition, the Board considered information regarding the legal standards and fiduciary obligations applicable to its consideration of the continuation of each of the Advisory Agreements. The contract review process, including the structure and format for information and materials provided to the Board, has been developed in consultation with the Board. The Independent Trustees also met in executive sessions with their independent legal counsel and, for portions thereof, with senior management of New York Life Investments.
The Board’s deliberations with respect to the continuation of each of the Advisory Agreements reflect a year-long process, and the Board also took into account information furnished to the Board and its Committees throughout the year, as deemed relevant and appropriate by the Trustees, including, among other items, reports on investment performance of the Portfolio and investment-related matters for the Portfolio as well as presentations from New York Life Investments and, generally annually, Candriam personnel. In addition, the Board took into account
other information provided by New York Life Investments throughout the year, including, among other items, periodic reports on legal and compliance matters, risk management, portfolio turnover, brokerage commissions and non-advisory services provided to the Portfolio by New York Life Investments, as deemed relevant and appropriate by the Trustees.
In addition to information provided to the Board throughout the year, the Board received information in connection with its June 2023 meeting provided specifically in response to requests prepared on behalf of the Board, and in consultation with the Independent Trustees, by independent legal counsel to the Independent Trustees regarding the Portfolio’s distribution arrangements. In addition, the Board received information regarding the Portfolio’s asset levels, share purchase and redemption activity and the payment of Rule 12b-1 and/or certain other fees by the applicable share classes of the Portfolio, among other information.
In considering the continuation of each of the Advisory Agreements, the Trustees reviewed and evaluated the information and factors they believed to reasonably be necessary and appropriate in light of legal advice furnished to them by independent legal counsel to the Independent Trustees and through the exercise of their own business judgment. Although individual Trustees may have weighed certain factors or information differently and the Board did not consider any single factor or information controlling in reaching its decision, the factors that figured prominently in the Board’s consideration of the continuation of each of the Advisory Agreements are summarized in more detail below and include, among other factors: (i) the nature, extent and quality of the services provided to the Portfolio by New York Life Investments and Candriam; (ii) the qualifications of the portfolio managers of the Portfolio and the historical investment performance of the Portfolio, New York Life Investments and Candriam; (iii) the costs of the services provided, and profits realized, by New York Life Investments and Candriam with respect to their relationships with the Portfolio; (iv) the extent to which economies of scale have been realized or may be realized if the Portfolio grows and the extent to which any economies of scale have been shared, have benefited or may benefit the Portfolio’s shareholders; and (v) the reasonableness of the Portfolio’s management and subadvisory fees and total ordinary operating expenses. Although the Board recognized that comparisons between the Portfolio’s fees and expenses and those of other funds are imprecise given different terms of agreements, variations in fund strategies and other factors, the Board considered the reasonableness of the Portfolio’s management fee and total ordinary operating expenses as compared to the peer funds identified by ISS. Throughout their considerations, the Trustees acknowledged the commitment of New York Life Investments and its affiliates to serve the MainStay Group of Funds, as well as their capacity, experience, resources, financial stability and reputations. The Trustees also acknowledged the entrepreneurial and other risks assumed by New York Life Investments in sponsoring and managing the Portfolio. With respect to the Subadvisory Agreement, the Board took into account New York Life Investments’ recommendation to approve the continuation of the Subadvisory Agreement.
Board Consideration and Approval of Management Agreement and Subadvisory Agreement (Unaudited) (continued)
The Trustees noted that, throughout the year, the Trustees are afforded an opportunity to ask questions of, and request additional information or materials from, New York Life Investments and Candriam. The Board’s decision with respect to each of the Advisory Agreements may have also been based, in part, on the Board’s knowledge of New York Life Investments and Candriam resulting from, among other things, the Board’s consideration of each of the Advisory Agreements in prior years, the advisory agreements for other funds in the MainStay Group of Funds, the Board’s review throughout the year of the performance and operations of other funds in the MainStay Group of Funds and each Trustee’s business judgment and industry experience. In addition to considering the above-referenced factors, the Board observed that in the marketplace, notably under variable life insurance policies and variable annuity contracts for which the Portfolio serves as an investment option, there are a range of investment options available to investors and that the Portfolio’s shareholders, having had the opportunity to consider other investment options, have invested in the Portfolio.
The factors that figured prominently in the Board’s decision to approve the continuation of each of the Advisory Agreements during the Board’s December 6–7, 2023 meeting are summarized in more detail below.
Nature, Extent and Quality of Services Provided by New York Life Investments and Candriam
The Board examined the nature, extent and quality of the services that New York Life Investments provides to the Portfolio. The Board evaluated New York Life Investments’ experience and capabilities in serving as manager of the Portfolio and considered that the Portfolio operates in a “manager-of-managers” structure. The Board also considered New York Life Investments’ responsibilities and services provided pursuant to this structure, including overseeing the services provided by Candriam, evaluating the performance of Candriam, making recommendations to the Board as to whether the Subadvisory Agreement should be renewed, modified or terminated and periodically reporting to the Board regarding the results of New York Life Investments’ evaluation and monitoring functions. The Board noted that New York Life Investments manages other mutual funds, serves a variety of other investment advisory clients, including other pooled investment vehicles, and has experience overseeing mutual fund service providers, including subadvisors. The Board considered the experience of senior personnel at New York Life Investments providing management and administrative and other non-advisory services to the Portfolio. The Board observed that New York Life Investments devotes significant resources and time to providing management and administrative and other non-advisory services to the Portfolio, including New York Life Investments’ oversight and due diligence reviews of Candriam and ongoing analysis of, and interactions with, Candriam with respect to, among other things, the Portfolio’s investment performance and risks as well as Candriam’s investment capabilities and subadvisory services with respect to the Portfolio.
The Board also considered the range of services that New York Life Investments provides to the Portfolio under the terms of the Management Agreement, including: (i) fund accounting and ongoing supervisory
services provided by New York Life Investments’ Fund Administration and Accounting Group; (ii) investment supervisory and analytical services provided by New York Life Investments’ Investment Consulting Group; (iii) compliance services provided by the Trust’s Chief Compliance Officer as well as New York Life Investments’ compliance department, including supervision and implementation of the Portfolio’s compliance program; (iv) legal services provided by New York Life Investments’ Office of the General Counsel; and (v) risk management monitoring and analysis by compliance and investment personnel. In addition, the Board considered New York Life Investments’ willingness to invest in personnel and other resources, such as cyber security, information security and business continuity planning, that may benefit the Portfolio and noted that New York Life Investments is responsible for compensating the Trust’s officers, except for a portion of the salary of the Trust’s Chief Compliance Officer. The Board recognized that New York Life Investments provides certain other non-advisory services to the Portfolio and has over time provided an increasingly broad array of non-advisory services to the MainStay Group of Funds as a result of regulatory and other developments.
The Board also examined the range, and the nature, extent and quality, of the investment advisory services that Candriam provides to the Portfolio and considered the terms of each of the Advisory Agreements. The Board evaluated Candriam’s experience and performance in serving as subadvisor to the Portfolio and advising other portfolios and Candriam’s track record and experience in providing investment advisory services as well as the experience of investment advisory, senior management and administrative personnel at Candriam. The Board considered New York Life Investments’ and Candriam’s overall resources, legal and compliance environment, capabilities, reputation, financial condition and history. In addition to information provided in connection with quarterly meetings with the Trust’s Chief Compliance Officer, the Board considered information regarding the compliance policies and procedures of New York Life Investments and Candriam and acknowledged their commitment to further developing and strengthening compliance programs that may relate to the Portfolio. The Board also considered Candriam’s ability to recruit and retain qualified investment professionals and willingness to invest in personnel and other resources that may benefit the Portfolio. In this regard, the Board considered the qualifications and experience of the Portfolio’s portfolio managers, the number of accounts managed by the portfolio managers and the method for compensating the portfolio managers.
In addition, the Board considered information provided by New York Life Investments and Candriam regarding their respective business continuity and disaster recovery plans.
Based on these considerations, among others, the Board concluded that the Portfolio would likely continue to benefit from the nature, extent and quality of these services.
| 28 | MainStay VP Candriam Emerging Markets Equity Portfolio |
Investment Performance
In evaluating the Portfolio’s investment performance, the Board considered investment performance results over various periods in light of the Portfolio’s investment objective, strategies and risks. The Board considered investment reports on, and analysis of, the Portfolio’s performance provided to the Board throughout the year. These reports include, among other items, information on the Portfolio’s gross and net returns, the Portfolio’s investment performance compared to a relevant investment category and the Portfolio’s benchmark, the Portfolio’s risk-adjusted investment performance and the Portfolio’s investment performance as compared to peer funds, as appropriate, as well as portfolio attribution information and commentary on the effect of market conditions. The Board also considered information provided by ISS showing the investment performance of the Portfolio as compared to peer funds. In addition, the Board reviewed the methodology used by ISS to construct the group of peer funds for comparative purposes.
The Board also took into account its discussions with senior management at New York Life Investments concerning the Portfolio’s investment performance over various periods as well as discussions between representatives of Candriam and the members of the Board’s Investment Committee, which generally occur on an annual basis. In considering the investment performance of the Portfolio, the Board noted that the Portfolio underperformed its peer funds for the one-, three-, five- and ten-year periods ended July 31, 2023. The Board considered its discussions with representatives from New York Life Investments and Candriam regarding the Portfolio’s investment performance.
Based on these considerations, among others, the Board concluded that its review of the Portfolio’s investment performance and related information supported a determination to approve the continuation of each of the Advisory Agreements.
Costs of the Services Provided, and Profits and Other Benefits Realized, by New York Life Investments and Candriam
The Board considered the costs of the services provided under each of the Advisory Agreements. The Board also considered the profitability of New York Life Investments and its affiliates, including Candriam, due to their relationships with the Portfolio as well as by New York Life Investments and its affiliates due to their relationships with the MainStay Group of Funds. Because Candriam is an affiliate of New York Life Investments whose subadvisory fee is paid by New York Life Investments, not the Portfolio, the Board considered cost and profitability information for New York Life Investments and Candriam in the aggregate.
In addition, the Board acknowledged the difficulty in obtaining reliable comparative data about mutual fund managers’ profitability because such information generally is not publicly available and may be impacted by numerous factors, including the structure of a fund manager’s organization, the types of funds it manages, the methodology used to allocate certain fixed costs to specific funds and the manager’s capital structure and costs of capital.
In evaluating the costs of the services provided by New York Life Investments and Candriam, and profitability of New York Life Investments and its affiliates, including Candriam due to their relationships with the Portfolio, the Board considered, among other factors, New York Life Investments’ and its affiliates’, including Candriam’s, continuing investments in, or willingness to invest in, personnel and other resources that may support and further enhance the management of the Portfolio, and that New York Life Investments is responsible for paying the subadvisory fee for the Portfolio. The Board also considered the financial resources of New York Life Investments and Candriam and acknowledged that New York Life Investments and Candriam must be in a position to recruit and retain experienced professional personnel and to maintain a strong financial position for New York Life Investments and Candriam to continue to provide high-quality services to the Portfolio. The Board recognized that the Portfolio benefits from the allocation of certain fixed costs among the funds in the MainStay Group of Funds, among other expected benefits resulting from its relationship with New York Life Investments.
The Board considered information regarding New York Life Investments’ methodology for calculating profitability and allocating costs provided by New York Life Investments in connection with the fund profitability analysis presented to the Board. The Board concluded that New York Life Investments’ methods for allocating costs and procedures for estimating overall profitability of the relationship with the funds in the MainStay Group of Funds were reasonable. The Board recognized the difficulty in calculating and evaluating a manager’s profitability with respect to the Portfolio and considered that other profitability methodologies may also be reasonable.
The Board also considered certain fall-out benefits that may be realized by New York Life Investments and its affiliates, including Candriam, due to their relationships with the Portfolio, including reputational and other indirect benefits. In addition, the Board considered its review of the management agreement for a money market fund advised by New York Life Investments and an affiliated subadvisor that serves as an investment option for the Portfolio, including the potential rationale for and costs associated with investments in this money market fund by the Portfolio, if any, and considered information from New York Life Investments that the nature and type of specific investment advisory services provided to this money market fund are distinct from, or in addition to, the investment advisory services provided to the Portfolio. In addition, the Board considered the potential dividend received tax deduction for insurance company affiliates of New York Life Investments from the Portfolio’s securities lending activity.
The Board noted that the Portfolio serves as an investment option primarily under variable contracts issued by affiliates of New York Life Investments that would receive fees under those contracts. The Board observed that, in addition to fees earned by New York Life Investments under the Management Agreement for managing the Portfolio, New York Life Investments’ affiliates also earn revenues from serving the Portfolio in various other capacities, including as the Portfolio’s distributor, and insurance companies affiliated with New York Life Investments would be
Board Consideration and Approval of Management Agreement and Subadvisory Agreement (Unaudited) (continued)
entitled to receive fees from the Portfolio under a distribution and service plan adopted pursuant to Rule 12b-1 under the 1940 Act. The Board considered information about these other revenues and their impact on the profitability of the relationship with the Portfolio to New York Life Investments and its affiliates. The Board noted that, although it assessed the overall profitability of the relationship with the Portfolio to New York Life Investments and its affiliates as part of the contract review process, when considering the reasonableness of the fee paid to New York Life Investments under the Management Agreement, the Board considered the profitability of New York Life Investments’ relationship with the Portfolio on a pre-tax basis and without regard to distribution expenses incurred by New York Life Investments from its own resources.
After evaluating the information deemed relevant by the Trustees, the Board concluded that any profits realized by New York Life Investments and its affiliates, including Candriam, due to their relationships with the Portfolio were not excessive and other expected benefits that may accrue to New York Life Investments and its affiliates, including Candriam, are reasonable.
Management and Subadvisory Fees and Total Ordinary Operating Expenses
The Board evaluated the reasonableness of the fee paid under each of the Advisory Agreements and the Portfolio’s total ordinary operating expenses. With respect to the management fee and subadvisory fee, the Board primarily considered the reasonableness of the management fee paid by the Portfolio to New York Life Investments because the subadvisory fee paid to Candriam is paid by New York Life Investments, not the Portfolio. The Board also considered the reasonableness of the subadvisory fee paid by New York Life Investments and the amount of the management fee retained by New York Life Investments.
In assessing the reasonableness of the Portfolio’s fees and expenses, the Board primarily considered comparative data provided by ISS on the fees and expenses of similar mutual funds managed by other investment advisers. The Board reviewed the methodology used by ISS to construct the group of peer funds for comparative purposes. In addition, the Board considered information provided by New York Life Investments and Candriam on fees charged to other investment advisory clients, including institutional separate accounts and/or other funds, that follow investment strategies similar to those of the Portfolio, if any. The Board considered the contractual management fee schedule for the Portfolio as compared to those for such other investment advisory clients, taking into account the rationale for differences in fee schedules. The Board also took into account information provided by New York Life Investments about the more extensive scope of services provided to registered investment companies, such as the Portfolio, as compared with other investment advisory clients. Additionally, the Board considered the impact of contractual breakpoints and voluntary waivers on the Portfolio’s net management fee and expenses. The Board also considered that in proposing fees for the Portfolio, New York Life Investments considers the competitive marketplace for mutual funds.
Based on the factors outlined above, among other considerations, the Board concluded that the Portfolio’s management fee and total ordinary operating expenses are within a range that is competitive and support a conclusion that these fees and expenses are reasonable.
Economies of Scale
The Board considered information regarding economies of scale, including whether economies of scale may exist with respect to the Portfolio and whether the Portfolio’s management fee and expense structure permits any economies of scale to be appropriately shared with the Portfolio’s shareholders. The Board also considered a report from New York Life Investments, previously prepared at the request of the Board, that addressed economies of scale, including with respect to the mutual fund business generally, and the various ways in which the benefits of economies of scale may be shared with the funds in the MainStay Group of Funds. Although the Board recognized the difficulty of determining economies of scale with precision, the Board acknowledged that economies of scale may be shared with the Portfolio in a number of ways, including, for example, through the imposition of fee breakpoints, initially setting management fee rates at scale or making additional investments to enhance the services provided to the Portfolio. The Board reviewed information from New York Life Investments showing how the Portfolio’s management fee schedule compared to fee schedules of other funds and accounts managed by New York Life Investments. The Board also reviewed information from ISS showing how the Portfolio’s management fee schedule compared with fees paid for similar services by peer funds at varying asset levels.
Based on this information, the Board concluded that economies of scale are appropriately shared for the benefit of the Portfolio’s shareholders through the Portfolio’s management fee and expense structure and other methods to share benefits from economies of scale.
Conclusion
On the basis of the information and factors summarized above, among other information and factors deemed relevant by the Trustees, and the evaluation thereof, the Board, including the Independent Trustees voting separately, unanimously voted to approve the continuation of each of the Advisory Agreements.
| 30 | MainStay VP Candriam Emerging Markets Equity Portfolio |
Proxy Voting Policies and Procedures and Proxy Voting Record
The Portfolio is required to file with the SEC its proxy voting record for the 12-month period ending June 30 on Form N-PX. A description of the policies and procedures that are used to vote proxies relating to portfolio securities of the Portfolio is available free of charge upon request by calling 800-598-2019 or visiting the SEC's website at www.sec.gov. The most recent Form N-PX or proxy voting record is available free of charge upon request by calling 800-598-2019; visiting https://www.newyorklifeinvestments.com/investment-products/vp; or visiting the SEC’s website at www.sec.gov.
Shareholder Reports and Quarterly Portfolio Disclosure
The Portfolio is required to file its complete schedule of portfolio holdings with the SEC 60 days after its first and third fiscal quarter on Form N-PORT. The Portfolio's holdings report is available free of charge upon request by calling 800-598-2019 or by visiting the SEC’s website at www.sec.gov.
Board of Trustees and Officers (Unaudited)
The Trustees and officers of the Portfolio are listed below. The Board oversees the MainStay Group of Funds (which consists of MainStay Funds and MainStay Funds Trust), MainStay VP Funds Trust, MainStay MacKay DefinedTerm Municipal Opportunities Fund, MainStay CBRE Global Infrastructure Megatrends Term Fund, the Manager and the Subadvisors, and elects the officers of the Portfolios who are responsible for the day-to-day operations of the Portfolio. Information pertaining to the Trustees and officers is set forth below. Each Trustee serves until his or her successor is elected and qualified or until his or her resignation,
death or removal. Under the Board’s retirement policy, unless an exception is made, a Trustee must tender his or her resignation by the end of the calendar year during which he or she reaches the age of 75. Officers are elected annually by the Board. The business address of each Trustee and officer listed below is 51 Madison Avenue, New York, New York 10010. A majority of the Trustees are not “interested persons” (as defined by the 1940 Act and rules adopted by the SEC thereunder) of the Portfolio (“Independent Trustees”).
| | Name and
Year of Birth | Term of Office,
Position(s) Held and
Length of Service | Principal Occupation(s)
During Past Five Years | Number of
Portfolios in
Fund Complex
Overseen by
Trustee | Other Directorships
Held by Trustee |
| | | | | | |
| | Naïm Abou-Jaoudé*
1966 | MainStay VP Funds Trust: Trustee since 2023 | Chief Executive Officer of New York Life Investment Management LLC (since 2023). Chief Executive Officer of Candriam (an affiliate of New York Life Investment Management LLC) (2007 to 2023). | 81 | MainStay Funds: Trustee since 2023 (11 Funds)
MainStay Funds Trust: Trustee since 2023 (37 Funds);
MainStay MacKay DefinedTerm Municipal Opportunities Fund: Trustee since 2023;
MainStay CBRE Global Infrastructure Megatrends Term Fund: Trustee since 2023; and
New York Life Investment Management International (Chair) since 2015 |
| * | This Trustee is considered to be an “interested person” of the MainStay Group of Funds, MainStay VP Funds Trust, MainStay CBRE Global Infrastructure Megatrends Term Fund and MainStay MacKay DefinedTerm Municipal Opportunities Fund, within the meaning of the 1940 Act because of his affiliation with New York Life Investment Management LLC and Candriam, as described in detail above in the column entitled “Principal Occupation(s) During Past Five Years.” |
| | |
| 32 | MainStay VP Candriam Emerging Markets Equity Portfolio |
| | Name and
Year of Birth | Term of Office,
Position(s) Held and
Length of Service | Principal Occupation(s)
During Past Five Years | Number of
Portfolios in
Fund Complex
Overseen by
Trustee | Other Directorships
Held by Trustee |
| | | | | | |
| | David H. Chow
1957 | MainStay VP Funds Trust: Trustee since January 2016, Advisory Board Member (June 2015 to December 2015) | Founder and CEO, DanCourt Management, LLC since 1999 | 81 | MainStay Funds: Trustee since January 2016, Advisory Board Member (June 2015 to December 2015) (11 Funds);
MainStay Funds Trust: Trustee since January 2016, Advisory Board Member (June 2015 to December 2015) (37 Funds);
MainStay MacKay DefinedTerm Municipal Opportunities Fund: Trustee since January 2016, Advisory Board Member (June 2015 to December 2015);
MainStay CBRE Global Infrastructure Megatrends Term Fund: Trustee since 2021;
VanEck Vectors Group of Exchange-Traded Funds: Trustee since 2006 and Independent Chairman of the Board of Trustees from 2008 to 2022 (57 portfolios); and
Berea College of Kentucky: Trustee since 2009, Chair of the Investment Committee since 2018 |
| | Karen Hammond
1956 | MainStay VP Funds Trust: Trustee since December 2021, Advisory Board Member (June 2021 to December 2021)
| Retired, Managing Director, Devonshire Investors (2007 to 2013); Senior Vice President, Fidelity Management & Research Co. (2005 to 2007); Senior Vice President and Corporate Treasurer, FMR Corp. (2003 to 2005); Chief Operating Officer, Fidelity Investments Japan (2001 to 2003) | 81 | MainStay Funds: Trustee since December 2021, Advisory Board Member (June 2021 to December 2021) (11 Funds);
MainStay Funds Trust: Trustee since December 2021, Advisory Board Member (June 2021 to December 2021) (37 Funds);
MainStay MacKay DefinedTerm Municipal Opportunities Fund: Trustee since December 2021, Advisory Board Member (June 2021 to December 2021);
MainStay CBRE Global Infrastructure Megatrends Term Fund: Trustee since December 2021, Advisory Board Member (June 2021 to December 2021);
Two Harbors Investment Corp.: Director since 2018;
Rhode Island State Investment Commission: Member since 2017; and
Blue Cross Blue Shield of Rhode Island: Director since 2019 |
| | Susan B. Kerley
1951 | MainStay VP Funds Trust: Chair since 2017 and Trustee since 2007** | President, Strategic Management Advisors LLC since 1990 | 81 | MainStay Funds: Chair since January 2017 and Trustee since 2007 (11 Funds); MainStay Funds Trust: Chair since January 2017 and Trustee since 1990 (37 Funds)***;
MainStay MacKay DefinedTerm Municipal Opportunities Fund: Chair since January 2017 and Trustee since 2011;
MainStay CBRE Global Infrastructure Megatrends Term Fund: Trustee since June 2021; and
Legg Mason Partners Funds: Trustee since 1991 (45 portfolios) |
Board of Trustees and Officers (Unaudited) (continued)
| | Name and
Year of Birth | Term of Office,
Position(s) Held and
Length of Service | Principal Occupation(s)
During Past Five Years | Number of
Portfolios in
Fund Complex
Overseen by
Trustee | Other Directorships
Held by Trustee |
| | | | | | |
| | Alan R. Latshaw
1951 | MainStay VP Funds Trust: Trustee since 2007** | Retired; Partner, Ernst & Young LLP (2002 to 2003); Partner, Arthur Andersen LLP (1989 to 2002); Consultant to the MainStay Funds Audit and Compliance Committee (2004 to 2006) | 81 | MainStay Funds: Trustee since 2006 (11 Funds);
MainStay Funds Trust: Trustee since 2007 (37 Funds)***;
MainStay MacKay DefinedTerm Municipal Opportunities Fund: Trustee since 2011; and
MainStay CBRE Global Infrastructure Megatrends Term Fund: Trustee since June 2021 |
| | Jacques P. Perold
1958 | MainStay VP Funds Trust: Trustee since January 2016, Advisory Board Member (June 2015 to December 2015) | Founder and Chief Executive Officer, CapShift Advisors LLC (since 2018); President, Fidelity Management & Research Company (2009 to 2014); President and Chief Investment Officer, Geode Capital Management, LLC (2001 to 2009) | 81 | MainStay Funds: Trustee since January 2016, Advisory Board Member (June 2015 to December 2015) (11 Funds);
MainStay Funds Trust: Trustee since January 2016, Advisory Board Member (June 2015 to December 2015) (37 Funds);
MainStay MacKay DefinedTerm Municipal Opportunities Fund: Trustee since January 2016, Advisory Board Member (June 2015 to December 2015);
MainStay CBRE Global Infrastructure Megatrends Term Fund: Trustee since June 2021;
Allstate Corporation: Director since 2015;
Partners in Health: Trustee since 2019; and
MSCI Inc.: Director since 2017 |
| | Richard S. Trutanic
1952 | MainStay VP Funds Trust: Trustee since 2007** | Chairman and Chief Executive Officer, Somerset & Company (financial advisory firm) since 2004; Managing Director, The Carlyle Group (private investment firm) (2002 to 2004); Senior Managing Director, Partner and Board Member, Groupe Arnault S.A. (private investment firm) (1999 to 2002) | 81 | MainStay Funds: Trustee since 1994 (11 Funds);
MainStay Funds Trust: Trustee since 2007 (37 Funds)***;
MainStay MacKay DefinedTerm Municipal Opportunities Fund: Trustee since 2011; and
MainStay CBRE Global Infrastructure Megatrends Term Fund: Trustee since June 2021 |
| ** | Includes prior service as a Director of MainStay VP Series Fund, Inc., the predecessor to MainStay VP Funds Trust. |
| *** | Includes prior service as a Director/Trustee of certain predecessor entities to MainStay Funds Trust. |
| 34 | MainStay VP Candriam Emerging Markets Equity Portfolio |
| | Name and
Year of Birth | Position(s) Held and
Length of Service | Principal Occupation(s)
During Past Five Years | |
| | | | | |
| | Kirk C. Lehneis
1974 | President, MainStay VP Funds Trust (since 2017) | Chief Operating Officer and Senior Managing Director (since 2016), New York Life Investment Management LLC and New York Life Investment Management Holdings LLC; Member of the Board of Managers (since 2017) and Senior Managing Director (since 2018), NYLIFE Distributors LLC; Chairman of the Board and Senior Managing Director, NYLIM Service Company LLC (since 2017); Trustee, President and Principal Executive Officer of IndexIQ Trust, IndexIQ ETF Trust and IndexIQ Active ETF Trust (since 2018); President, MainStay CBRE Global Infrastructure Megatrends Term Fund (since 2021), MainStay MacKay DefinedTerm Municipal Opportunities Fund, MainStay Funds and MainStay Funds Trust (since 2017); Senior Managing Director, Global Product Development (from 2015 to 2016); Managing Director, Product Development (from 2010 to 2015), New York Life Investment Management LLC | |
| | Jack R. Benintende
1964 | Treasurer and Principal Financial and Accounting Officer, MainStay VP Funds Trust (since 2007)** | Managing Director, New York Life Investment Management LLC (since 2007); Treasurer and Principal Financial and Accounting Officer, MainStay CBRE Global Infrastructure Megatrends Term Fund (since 2021), MainStay MacKay DefinedTerm Municipal Opportunities Fund (since 2011), MainStay Funds Trust (since 2009) and MainStay Funds (since 2007); and Assistant Treasurer, New York Life Investment Management Holdings LLC (2008 to 2012) | |
| | J. Kevin Gao
1967 | Secretary and Chief Legal Officer, MainStay VP Funds Trust (since 2010)** | Managing Director and Associate General Counsel, New York Life Investment Management LLC (since 2010); Secretary and Chief Legal Officer, MainStay CBRE Global Infrastructure Megatrends Term Fund (since 2021), MainStay MacKay DefinedTerm Municipal Opportunities Fund (since 2011), MainStay Funds and MainStay Funds Trust (since 2010) | |
| | Kevin M. Gleason
1967 | Vice President and Chief Compliance Officer, MainStay VP Funds Trust (since June 2022) | Vice President and Chief Compliance Officer, IndexIQ Trust, IndexIQ ETF Trust and IndexIQ Active ETF Trust (since June 2022); Vice President and Chief Compliance Officer, MainStay CBRE Global Infrastructure Megatrends Term Fund, MainStay MacKay DefinedTerm Municipal Opportunities Fund (since June 2022); MainStay Funds Trust and MainStay Funds (since June 2022); Senior Vice President, Voya Investment Management and Chief Compliance Officer, Voya Family of Funds (2012 to 2022) | |
| | Scott T. Harrington
1959 | Vice President— Administration, MainStay VP Funds Trust (since 2005)** | Managing Director, New York Life Investment Management LLC (including predecessor advisory organizations) (since 2000); Member of the Board of Directors, New York Life Trust Company (since 2009); Vice President—Administration, MainStay CBRE Global Infrastructure Megatrends Term Fund (since 2021), MainStay MacKay DefinedTerm Municipal Opportunities Fund (since 2011), MainStay Funds Trust and MainStay Funds (since 2009) | |
| * | The officers listed above are considered to be “interested persons” of the MainStay Group of Funds, MainStay VP Funds Trust, MainStay CBRE Global Infrastructure Megatrends Term Fund and MainStay MacKay DefinedTerm Municipal Opportunities Fund within the meaning of the 1940 Act because of their affiliation with the MainStay Group of Funds, New York Life Insurance Company and/or its affiliates, including New York Life Investment Management LLC, New York Life Insurance Company, NYLIM Service Company LLC, NYLIFE Securities LLC and/or NYLIFE Distributors LLC, as described in detail in the column captioned “Principal Occupation(s) During Past Five Years.” Officers are elected annually by the Board. |
| ** | Includes prior service as an Officer of MainStay VP Series Fund, Inc., the predecessor to MainStay VP Funds Trust. |
Officers of the Trust (Who are not Trustees)*
This page intentionally left blank.
This page intentionally left blank.
This page intentionally left blank.
MainStay VP Portfolios
MainStay VP offers a wide range of Portfolios. The full array of MainStay VP offerings is listed here, with information about the manager, subadvisors, legal counsel, and independent registered public accounting firm.
Equity
MainStay VP American Century Sustainable Equity Portfolio
MainStay VP Candriam Emerging Markets Equity Portfolio
MainStay VP Epoch U.S. Equity Yield Portfolio
MainStay VP Fidelity Institutional AM® Utilities Portfolio†
MainStay VP Natural Resources Portfolio
MainStay VP PineStone International Equity Portfolio1
MainStay VP S&P 500 Index Portfolio
MainStay VP Small Cap Growth Portfolio
MainStay VP Wellington Growth Portfolio
MainStay VP Wellington Mid Cap Portfolio
MainStay VP Wellington Small Cap Portfolio
MainStay VP Wellington U.S. Equity Portfolio
MainStay VP Winslow Large Cap Growth Portfolio
Mixed Asset
MainStay VP Balanced Portfolio
MainStay VP Income Builder Portfolio
MainStay VP Janus Henderson Balanced Portfolio
MainStay VP MacKay Convertible Portfolio
Income
MainStay VP Bond Portfolio
MainStay VP Floating Rate Portfolio
MainStay VP Indexed Bond Portfolio
MainStay VP MacKay Government Portfolio2
MainStay VP MacKay High Yield Corporate Bond Portfolio
MainStay VP MacKay Strategic Bond Portfolio
MainStay VP PIMCO Real Return Portfolio
Money Market
MainStay VP U.S. Government Money Market Portfolio
Alternative
MainStay VP CBRE Global Infrastructure Portfolio
MainStay VP IQ Hedge Multi-Strategy Portfolio
Asset Allocation
MainStay VP Conservative Allocation Portfolio
MainStay VP Equity Allocation Portfolio
MainStay VP Growth Allocation Portfolio
MainStay VP Moderate Allocation Portfolio
Manager
New York Life Investment Management LLC
New York, New York
Subadvisors
American Century Investment Management, Inc.
Kansas City, Missouri
Brown Advisory LLC
Baltimore, Maryland
Candriam*
Strassen, Luxembourg
CBRE Investment Management Listed Real Assets LLC
Radnor, Pennsylvania
Epoch Investment Partners, Inc.
New York, New York
FIAM LLC
Smithfield, Rhode Island
IndexIQ Advisors LLC*
New York, New York
Janus Henderson Investors US LLC
Denver, Colorado
MacKay Shields LLC*
New York, New York
Newton Investment Management North America, LLC
Boston, Massachusetts
NYL Investors LLC*
New York, New York
Pacific Investment Management Company LLC
Newport Beach, California
PineStone Asset Management Inc.
Montreal, Québec
Segall Bryant & Hamill, LLC
Chicago, Illinois
Wellington Management Company LLP
Boston, Massachusetts
Winslow Capital Management, LLC
Minneapolis, Minnesota
Legal Counsel
Dechert LLP
Washington, District of Columbia
Independent Registered Public Accounting Firm
PricewaterhouseCoopers LLP
New York, New York
Distributor
NYLIFE Distributors LLC*
Jersey City, New Jersey
Custodian
JPMorgan Chase Bank, N.A.
New York, New York
Some Portfolios may not be available in all products.
† Fidelity Institutional AM is a registered trade mark of FMR LLC. Used with permission.
* An affiliate of New York Life Investment Management LLC.
| 1. | Prior to August 28, 2023, the Portfolio's name was MainStay VP MacKay International Equity Portfolio. |
| 2. | Effective on or about May 1, 2024, the MainStay VP MacKay Government Portfolio will be renamed the MainStay VP U.S. Infrastructure Bond Portfolio. |
Not part of the Annual Report
2023 Annual Report
This report is for the general information of New York Life Variable Annuities and NYLIAC Variable Universal Life Insurance Products policyowners. It must be preceded or accompanied by the appropriate product(s) and funds prospectuses if it is given to anyone who is not an owner of a New York Life variable annuity policy or a NYLIAC Variable Universal Life Insurance Product. This report does not offer for sale or solicit orders to purchase securities.
The performance data quoted in this report represents past performance. Past performance is no guarantee of future results. Due to market volatility and other factors, current performance may be lower or higher than the figures shown. The most recent month-end performance summary for your variable annuity or variable life policy is available by calling 800-598-2019 and is updated periodically on newyorklife.com.
The New York Life Variable Annuities and NYLIAC Variable Universal Life Insurance Products are issued by New York Life Insurance and Annuity Corporation (a Delaware Corporation) and distributed by NYLIFE Distributors LLC (Member FINRA/SIPC).
New York Life Insurance Company
New York Life Insurance and Annuity
Corporation (NYLIAC) (A Delaware Corporation)
51 Madison Avenue, Room 551
New York, NY 10010
newyorklife.com
newyorklifeinvestments.com
NYLIFE Distributors LLC, 30 Hudson Street, Jersey City, NJ 07302
New York Life Investment Management LLC is the investment manager to the MainStay VP Funds Trust
©2024 by NYLIFE Distributors LLC. All rights reserved.
You may obtain copies of the Prospectus and the Statement of Additional Information free of charge, upon request, by calling toll-free 800-598-2019 or writing to New York Life Insurance and Annuity Corporation, 51 Madison Avenue, New York, NY 10010.
| Not FDIC Insured | No Bank Guarantee | May Lose Value |
(NYLIAC) NI516
MainStay VP IQ Hedge Multi-Strategy Portfolio
Message from the President and Annual Report
December 31, 2023
Special Notice:
Beginning in July 2024, new regulations issued by the Securities and Exchange Commission (SEC) will take effect requiring open-end mutual fund companies and ETFs to (1) overhaul the content of their shareholder reports and (2) mail paper copies of the new tailored shareholder reports to shareholders who have not opted to receive these documents electronically.
If you have not yet elected to receive your shareholder reports electronically, please contact your financial intermediary or visit our website.
| Not FDIC/NCUA Insured | Not a Deposit | May Lose Value | No Bank Guarantee | Not Insured by Any Government Agency |
This page intentionally left blank
Message from the President
Against a backdrop of easing inflationary pressures and continued economic growth, stocks and bonds generally gained ground during the 12-month period ended December 31, 2023, despite high levels of volatility and sharp disparities between the performance of the different market sectors.
Although the war in Ukraine, the outbreak of hostilities in the Middle East and several other notable events affected financial assets, inflation, interest rate, and economic growth trends stood at the forefront of market developments during most of the period. As the reporting period began, high levels of inflation already showed signs of easing in the face of aggressive rate hikes by U.S. Federal Reserve (the “Fed”). From a peak of 9.1% in June 2022, the annualized U.S. inflation rate dropped to 6.4% in January, and 3.4% in December 2023. At the same time, the Fed increased the benchmark federal funds rate from 4.25%–4.50% at the beginning of reporting period, to 5.25%–5.50% as of the end of 2023. Despite the increasing cost of capital and tighter lending environment that resulted from rising rates, economic growth remained surprisingly robust, bolstered by high levels of consumer spending, low levels of unemployment and better-than-expected corporate earnings. With the pace of rate increases slowing from the prior year, investors began hoping for an early shift to a looser monetary policy, with stock prices and bond yields reacting as economic data and statements from the Fed either reinforced or undercut those hopes. Following months of hawkish rhetoric, the Fed finally reversed its stance in December 2023, signaling a positive economic outlook with little chance of a recession and a likelihood of rate cuts in 2024.
The S&P 500® Index, a widely regarded benchmark of U.S. market performance, produced strong gains during the reporting period-– recovering all its losses from 2022 and approached new record territory. A preponderance of the Index’s gains were generated by a relatively small number of mega-cap stocks in the information technology, communication services and consumer discretionary sectors that stood to benefit from rapid developments in generative artificial intelligence (“AI”). Value-oriented, interest-rate sensitive and small-capitalization
shares lagged by significant margins, although market strength widened during the closing weeks of the reporting period. Most overseas equity markets trailed the U.S. market, as developed international economies experienced relatively low growth rates, and weak economic conditions in China undermined emerging markets.
Bonds produced generally positive returns, bolstered by attractive and relatively stable yields. The yield on the 10-year Treasury note hit a high of just under 5% in mid-October 2023, ranging between approximately 3.5% and 4.8% for most of the reporting period. The yield curve remained inverted throughout the year, with the 2-year Treasury yield modestly above the 10-year yield. Corporate bond prices trended moderately higher, generally outperforming government securities. After years of low yields and tight credit spreads, the corporate sector benefited from more attractive valuations and income opportunities. Among corporates, markets generally rewarded longer duration and lower credit quality, although an uptick in default rates posed added risks for high-yield corporate bonds. International bond markets produced mixed returns, with emerging-markets issues advancing over their developed-markets counterparts.
The market volatility of recent years reminds us of the constant need for experienced and steadfast portfolio management in the face of uncertainty. New York Life Investments remains dedicated to providing you, as a valued MainStay VP investor, with the guidance, resources and investment solutions you need to pursue your financial goals.
Thank you for trusting us to help meet your investment needs.
Sincerely,
Kirk C. Lehneis
President
The opinions expressed are as of the date of this report and are subject to change. There is no guarantee that any forecast made will come to pass. This material does not constitute investment advice and is not intended as an endorsement of any specific investment. Past performance is no guarantee of future results.
Not part of the Annual Report
Investors should refer to the Portfolio’s Summary Prospectus and/or Prospectus and consider the Portfolio’s investment objectives, strategies, risks, charges and expenses carefully before investing. The Summary Prospectus and/or Prospectus contain this and other information about the Portfolio. You may obtain copies of the Portfolio’s Summary Prospectus, Prospectus and Statement of Additional Information, which includes information about the MainStay VP Funds Trust's Trustees, free of charge, upon request, by calling toll-free 800-598-2019, by writing to New York Life Insurance and Annuity Corporation, 51 Madison Avenue, Room 251, New York, New York 10010 or by sending an email to MainStayShareholdersServices@nylim.com. These documents are also available at newyorklifeinvestments.com/investment-products/vp. Please read the Portfolio's Summary Prospectus and/or Prospectus carefully before investing. MainStay VP Funds Trust portfolios are separate account options which are purchased through a variable insurance or variable annuity contract.
Investment and Performance Comparison (Unaudited)
Performance data quoted represents past performance. Past performance is no guarantee of future results. Because of market volatility and other factors, current performance may be lower or higher than the figures shown. Investment return and principal value will fluctuate, and as a result, when shares are redeemed, they may be worth more or less than their original cost. The performance table and graph do not reflect any deduction of sales charges, mortality and expense charges, contract charges or administrative charges. Please refer to the Performance Summary appropriate for your policy. For performance information current to the most recent month-end, please call 800-598-2019 or visit www.newyorklife.com.
Performance figures may reflect certain fee waivers and/or expense limitations, without which total returns may have been different. For information on current fee waivers and/or expense limitations (if any), please refer to the Notes to Financial Statements.
| Average Annual Total Returns for the Year-Ended December 31, 2023 |
| Class | Inception
Date1 | One
Year | Five
Years | Ten
Years | Gross
Expense
Ratio2 |
| Initial Class Shares | 5/1/2013 | 10.26% | 2.78% | -1.46% | 1.18% |
| Service Class Shares | 5/1/2013 | 9.98 | 2.53 | -1.67 | 1.43 |
| 1. | Effective November 30, 2018, the Portfolio’s predecessor fund, MainStay VP Absolute Return Multi-Strategy Portfolio (the “VP ARMS Portfolio”), was reorganized into the Portfolio. The Portfolio assumed the VP ARMS Portfolio’s historical performance and accounting information. Therefore, the performance information prior to November 30, 2018, shown in this report is that of the VP ARMS Portfolio, which had a different investment objective and different principal investment strategies and subadvisors. Past performance may have been different if the Portfolio’s current subadvisor, investment objective or principal investment strategies had been in place during the periods. |
| 2. | The gross expense ratios presented reflect the Portfolio’s “Total Annual Portfolio Operating Expenses” from the most recent Prospectus, as supplemented, and may differ from other expense ratios disclosed in this report. |
| Benchmark Performance* | One
Year | Five
Years | Ten
Years |
| S&P Balanced Equity and Bond Conservative Index1 | 9.22% | 4.15% | 4.34% |
| Barclay Hedge Fund Index2 | 9.28 | 6.33 | 4.50 |
| Barclay Fund of Funds Index3 | 5.85 | 4.03 | 2.31 |
| IQ Hedge Multi-Strategy Index4 | 10.80 | 3.50 | 2.63 |
| Morningstar Multistrategy Category Average5 | 6.24 | 4.13 | 2.25 |
| * | Returns for indices reflect no deductions for fees, expenses or taxes, except for foreign withholding taxes where applicable. Results assume reinvestment of all dividends and capital gains. An investment cannot be made directly in an index. |
| 1. | The Portfolio has selected the S&P Balanced Equity and Bond Conservative Index as its primary benchmark. The S&P Balanced Equity and Bond-Conservative Index consists of a position in S&P 500 Total Return Index (25%) and a position in the S&P U.S. Treasury Bond 7-10 Year Index (75%). |
| 2. | The Portfolio has selected the Barclay Hedge Fund Index as an additional benchmark. The Barclay Hedge Fund Index is a measure of the average return of all hedge funds (excepting Funds of Funds) in the Barclay database. The index is simply the arithmetic average of the net returns of all the funds that have reported that month. |
| 3. | The Portfolio has selected the Barclay Fund of Funds Index as its secondary benchmark. The Barclay Fund of Funds Index is a measure of the average return of all reporting funds in the Barclay database. |
| 4. | The IQ Hedge Multi-Strategy Index seeks to replicate the risk-adjusted return characteristics of the collective hedge funds using various hedge fund investment styles, including long/short equity, global macro, market neutral, event-driven, fixed income arbitrage and emerging markets. |
| 5. | The Morningstar Multistrategy Category Average is representative of funds that have a majority of their assets exposed to alternative strategies. Funds in this category include both funds with static allocations to alternative strategies and funds tactically allocating among alternative strategies and asset classes. Results are based on average total returns of similar funds with all dividends and capital gain distributions reinvested. |
| 6 | MainStay VP IQ Hedge Multi-Strategy Portfolio |
Cost in Dollars of a $1,000 Investment in MainStay VP IQ Hedge Multi-Strategy Portfolio (Unaudited)
The example below is intended to describe the fees and expenses borne by shareholders during the six-month period from July 1, 2023 to December 31, 2023, and the impact of those costs on your investment.
Example
As a shareholder of the Portfolio you incur two types of costs: (1) transaction costs, including exchange fees and sales charges (loads) on purchases (as applicable), and (2) ongoing costs, including management fees, distribution and/or service (12b-1) fees and other Portfolio expenses (as applicable). This example is intended to help you understand your ongoing costs (in dollars) of investing in the Portfolio and to compare these costs with the ongoing costs of investing in other mutual funds. The example is based on an investment of $1,000 made at the beginning of the six-month period and held for the entire period from July 1, 2023 to December 31, 2023. Shares are only sold in connection with variable life and annuity contracts and the example does not reflect any contract level or transactional fees or expenses. If these costs had been included, your costs would have been higher.
This example illustrates your Portfolio’s ongoing costs in two ways:
Actual Expenses
The second and third data columns in the table below provide information about actual account values and actual expenses. You may use the information in these columns, together with the amount you invested, to estimate the expenses that you paid during the six months ended
December 31, 2023. Simply divide your account value by $1,000 (for example, an $8,600 account value divided by $1,000 = 8.6), then multiply the result by the number under the heading entitled “Expenses Paid During Period” to estimate the expenses you paid on your account during this period.
Hypothetical Example for Comparison Purposes
The fourth and fifth data columns in the table below provide information about hypothetical account values and hypothetical expenses based on the Portfolio’s actual expense ratio and an assumed rate of return of 5% per year before expenses, which is not the Portfolio’s actual return. The hypothetical account values and expenses may not be used to estimate the actual ending account balances or expenses you paid for the six-month period shown. You may use this information to compare the ongoing costs of investing in the Portfolio with the ongoing costs of investing in other mutual funds. To do so, compare this 5% hypothetical example with the 5% hypothetical examples that appear in the shareholder reports of the other mutual funds.
Please note that the expenses shown in the table are meant to highlight your ongoing costs only and do not reflect any transactional costs, such as exchange fees or sales charges (loads). Therefore, the fourth and fifth data columns of the table are useful in comparing ongoing costs only and will not help you determine the relative total costs of owning different funds. In addition, if these transactional costs were included, your costs would have been higher.
| Share Class | Beginning
Account
Value
7/1/23 | Ending Account
Value (Based
on Actual
Returns and
Expenses)
12/31/23 | Expenses
Paid
During
Period1 | Ending Account
Value (Based
on Hypothetical
5% Annualized
Return and
Actual Expenses)
12/31/23 | Expenses
Paid
During
Period1 | Net Expense
Ratio
During
Period2 |
| Initial Class Shares | $1,000.00 | $1,050.30 | $3.62 | $1,021.68 | $3.57 | 0.70% |
| Service Class Shares | $1,000.00 | $1,049.00 | $4.91 | $1,020.42 | $4.84 | 0.95% |
| 1. | Expenses are equal to the Portfolio’s annualized expense ratio of each class multiplied by the average account value over the period, divided by 365 and multiplied by 184 (to reflect the six-month period). The table above represents the actual expenses incurred during the six-month period. In addition to the fees and expenses which the Portfolio bears directly, it also indirectly bears a pro rata share of the fees and expenses of the underlying funds in which it invests. Such indirect expenses are not included in the above-reported expense figures. |
| 2. | Expenses are equal to the Portfolio's annualized expense ratio to reflect the six-month period. |
Portfolio Composition as of December 31, 2023 (Unaudited)
| Bank Loan Funds | 23.4% |
| Floating Rate—Investment Grade Funds | 23.2 |
| Unaffiliated Investment Companies (a) | 17.1 |
| Convertible Bond Funds | 12.7 |
| Emerging Small Cap Equity Fund | 11.2 |
| Derivative Income Funds | 9.2 |
| U.S. Large Cap Core Funds | 7.7 |
| Affiliated Investment Company | 5.7 |
| International Small Cap Equity Fund | 3.2 |
| Merger Arbitrage Fund | 1.1% |
| Emerging Equity Fund | 0.6 |
| Volatility | 0.6 |
| Broad Fund | 0.6 |
| U.S. Small Cap Core Funds | 0.5 |
| Private Equity Replication Fund | 0.4 |
| Other Assets, Less Liabilities | –17.2 |
| | 100.0% |
| (a) | Represents a security purchased with cash collateral received for securities on loan. |
See Portfolio of Investments beginning on page 11 for specific holdings within these categories. The Portfolio's holdings are subject to change.
Top Ten Holdings and/or Issuers Held as of December 31, 2023 (excluding short-term investments) (Unaudited)
| 1. | iShares Floating Rate Bond ETF |
| 2. | Invesco Senior Loan ETF |
| 3. | SPDR Blackstone Senior Loan ETF |
| 4. | SPDR S&P Emerging Markets Small-Cap ETF |
| 5. | SPDR Bloomberg Convertible Securities ETF |
| 6. | SPDR Bloomberg Investment Grade Floating Rate ETF |
| 7. | JPMorgan Equity Premium Income ETF |
| 8. | IQ Merger Arbitrage ETF |
| 9. | JPMorgan Nasdaq Equity Premium Income ETF |
| 10. | Financial Select Sector SPDR Fund |
| 8 | MainStay VP IQ Hedge Multi-Strategy Portfolio |
Portfolio Management Discussion and Analysis (Unaudited)
Answers to the questions reflect the views of portfolio managers Francis Ok and Greg Barrato of IndexIQ Advisors LLC, the Portfolio’s Subadvisor.
How did MainStay VP IQ Hedge Multi-Strategy Portfolio perform relative to its benchmarks and peers during the 12 months ended December 31, 2023?
For the 12 months ended December 31, 2023, MainStay VP IQ Hedge Multi-Strategy Portfolio returned 10.26% for Initial Class shares and 9.98% for Service Class shares. Over the same period, both share classes outperformed the 9.22% return for the S& P Balanced Equity and Bond Conservative Index, which is the Portfolio’s primary benchmark, and the 9.28% return for the Barclay Hedge Fund Index, which is the Portfolio’s secondary benchmark. For the same period, both share classes outperformed the 5.85% return for the Barclay Fund of Funds Index, which is an additional benchmark for the Portfolio. For the 12 months ended December 31, 2023, both share classes underperformed the 10.80% return of the IQ Hedge Multi-Strategy Index (the “Underlying Index”) and outperformed the 6.24% return of the Morningstar Multistrategy Category Average.1
Were there any changes to the Portfolio during the reporting period?
At a meeting held on March 6–7, 2023, the Board of Trustees of MainStay VP Funds Trust considered and approved, among other related proposals: (i) modifying the Portfolio’s investment objective; and (ii) modifying the Portfolio’s principal investment strategies. See the Supplement dated May 1, 2023, for additional information.
During the reporting period, were there any market events that materially impacted the Portfolio’s performance or liquidity?
Several major events drove market activity during the reporting period. The most significant of these included the trajectory of inflation, the U.S. Federal Reserve’s (the “Fed”) rate decisions and forward guidance by the Fed, a U.S. regional banking crisis, significant advances in generative artificial intelligence (“AI”), the market dominance of the so-called ‘Magnificent 7’ group of companies leading developments in AI, oil market interventions by the OPEC group of oil-exporting nations and sharpening geopolitical tensions and conflicts in Ukraine and the Middle East. The Portfolio’s diversified approach, with low correlation to traditional risk assets, helped soften the impact of these market-shaping events and provided a more stable return stream.
Investment markets underwent a seismic shift during the reporting period, as prevailing narratives and market sentiment started and ended the year at opposite extremes. The consensus
at the beginning of 2023 that a recession was imminent gave way to the broad belief that interest rate tightening by the Fed was likely to produce a soft landing, in which inflation would come under control without a significant economic downturn. Several key factors underpinned this bearish to bullish swing. Inflation trends and Fed policy decisions wielded an outsized influence over the markets and catalyzed sharp volatility in equity prices and fixed-income yields.
At the outset of the reporting period, rising interest rates and hawkish Fed guidance sparked recession concerns and market jitters. Restrictive rates produced chilling effects, demonstrated by several bouts of volatility, most notably related to the U.S. regional banking crisis in March and April. However, by the end of the reporting period, the prevailing risk attitude shifted, as economic growth remained solid. Cooling inflation, labor market resilience, unexpected consumer strength, continued normalization from pandemic-induced economic disruptions and ongoing growth helped catalyze a reconsideration of the Fed’s economic outlook and a pause in its tightening campaign. By the end of the reporting period, belief that the Fed could pilot the economy to a soft-landing had gained widespread acceptance. With this attitude change, stocks soared to a banner year, ending the reporting period at or near record highs.
What factors affected the Portfolio’s relative performance during the reporting period?
The Portfolio outperformed the Index primarily due to asset allocation. Throughout the reporting period, the Portfolio held significantly overweight exposure to fixed-income securities and significantly underweight exposure to equities, with out-of-Index positions in alternatives, commodities, currencies, volatility and real estate. Out-of-Index positions in selected alternatives, commodities and currencies made positive contributions to the Portfolio’s relative returns, while out-of-Index exposures to real estate and volatility detracted. (Contributions take weightings and total returns into account.) Within equities, underweight exposure detracted from relative performance, as did the Portfolio’s diversified allocations across geographic regions, sectors and investment factors, in contrast to the Index’s singular allocation to large-cap core U.S. equities, which were bolstered by the surging performance of AI-related U.S. mega-cap stocks. Within fixed-income,2 the Portfolio outperformed due to a relatively short duration profile and floating rate exposure. In the prevailing environment of rising interest rates and stable growth, exposure to floating rate investment-grade debt, bank loans, convertibles,
| 1. | See "Investment and Performance Comparison" for more information on benchmark and peer group returns. |
| 2. | Duration is a measure of the price sensitivity of a fixed-income investment to changes in interest rates. Duration is expressed as a number of years and is considered a more accurate sensitivity gauge than average maturity. |
short-duration Treasury and corporate investment-grade debt enhanced relative returns.
During the reporting period, how did the Portfolio’s performance correlate with traditional equity and fixed-income indices?
The Portfolio maintained a higher correlation to traditional equity indices and a lower correlation to investment-grade fixed-income indices. The Portfolio’s correlation to the S&P 500® Index3 was 79.5%. The Portfolio’s correlation to the Bloomberg U.S. Aggregate Bond Index4 was 38.8%.
During the reporting period, how did the Portfolio’s volatility compare to that of traditional fixed-income indices?
During the reporting period, the annualized daily volatility of the Portfolio was 6.83%, compared to a volatility of 7.10% for the Bloomberg U.S. Aggregate Bond Index.
How did you allocate the Portfolio’s assets during the reporting period and why?
The Portfolio seeks to achieve performance similar to the overall hedge fund universe by replicating the “beta”5 portion of the hedge fund return characteristics (i.e., that portion of the returns that are non-idiosyncratic, or unrelated to manager skill) over longer term periods and not on a daily basis. It does not seek to replicate the “alpha”6 portion of the return characteristics of the overall hedge fund universe.
Portfolio allocations are all rules-driven and made in accordance with the Underlying Index methodology. Prior to a methodology change that occurred on June 6, 2023, the Portfolio allocated its assets across six underlying hedge fund investment styles: emerging markets, market neutral, long/short equity, event-driven, fixed-income arbitrage, and global macro. Pursuant to the new index methodology, the Portfolio's allocations span hedge fund investment styles including, but not limited to, equity, fixed-income, emerging market, sector, specialized, and alternative strategies.
Prior to the methodology change, the Portfolio’s allocations to the six underlying hedge fund investments styles were relatively
range-bound. The Portfolio’s allocation to its event-driven investment style remained at its maximum weight of 33.33%. The Portfolio’s allocation to its long/short investment style ranged from 6.97% to 10.52%. The Portfolio’s allocation to the fixed-income arbitrage investment style ranged from 14.39% to 20.39%. The Portfolio maintained a short allocation to its market-neutral investment style with weights ranging from −16.67% to −6.96%. The Portfolio’s allocation to its emerging-markets investment style ranged from 18.10% to 23.56%. The Portfolio’s allocation to its global macro investment style ranged from 28.87% to its maximum weight of 33.33%
As of the end of the reporting period (and inclusive of the methodology change), the Portfolio’s allocations were 62.13% to fixed-income, 20.55% to equity, 16.04% to alternatives, 0.62% to commodities, 0.65% to volatility and 0% to real estate and currency.
| 3. | “S&P 500®” is a trademark of The McGraw-Hill Companies, Inc. The S&P 500® Index is widely regarded as the standard index for measuring large-cap U.S. stock market performance. Results assume reinvestment of all dividends and capital gains. An investment cannot be made directly in an index. |
| 4. | The Bloomberg U.S. Aggregate Bond Index is a broad-based benchmark that measures the investment grade, U.S. dollar-denominated, fixed-rate taxable bond market, including Treasuries, government-related and corporate securities, mortgage-backed securities (agency fixed-rate and hybrid adjustable rate mortgage passthroughs), asset-backed securities and commercial mortgage-backed securities. |
| 5. | Beta is a measure of historical volatility relative to an appropriate index (benchmark) based on its investment objective. A beta greater than 1.00 indicates volatility greater than the benchmark’s. |
| 6. | Alpha measures a fund’s risk-adjusted performance and is expressed as an annualized percentage. |
The opinions expressed are those of the portfolio managers as of the date of this report and are subject to change. There is no guarantee that any forecasts will come to pass. This material does not constitute investment advice and is not intended as an endorsement of any specific investment.
Not all MainStay VP Portfolios and/or share classes are available under all policies.
| 10 | MainStay VP IQ Hedge Multi-Strategy Portfolio |
Portfolio of Investments December 31, 2023†^
| | Shares | Value |
| Exchange-Traded Funds 97.8% |
| Alternative 15.3% |
| Affiliated Investment Company 4.6% |
| IQ Merger Arbitrage ETF (a) | 387,129 | $ 12,159,721 |
| Derivative Income Funds 9.2% |
| JPMorgan Equity Premium Income ETF | 228,368 | 12,555,672 |
| JPMorgan Nasdaq Equity Premium Income ETF (a) | 230,190 | 11,493,387 |
| | | 24,049,059 |
| Merger Arbitrage Fund 1.1% |
| AltShares Merger Arbitrage ETF (b) | 112,412 | 3,007,021 |
| Private Equity Replication Fund 0.4% |
| Invesco Global Listed Private Equity ETF | 15,184 | 944,445 |
Total Alternative
(Cost $38,987,290) | | 40,160,246 |
| Bonds 59.3% |
| Bank Loan Funds 23.4% |
| Invesco Senior Loan ETF (a) | 1,510,379 | 31,989,827 |
| SPDR Blackstone Senior Loan ETF (a) | 702,243 | 29,445,049 |
| | | 61,434,876 |
| Convertible Bond Funds 12.7% |
| iShares Convertible Bond ETF | 100,458 | 7,894,994 |
| SPDR Bloomberg Convertible Securities ETF | 351,909 | 25,390,235 |
| | | 33,285,229 |
| Floating Rate—Investment Grade Funds 23.2% |
| iShares Floating Rate Bond ETF (a) | 904,619 | 45,791,814 |
| SPDR Bloomberg Investment Grade Floating Rate ETF | 491,896 | 15,047,098 |
| | | 60,838,912 |
Total Bonds
(Cost $152,606,397) | | 155,559,017 |
| Equities 23.2% |
| Emerging Equity Fund 0.6% |
| iShares MSCI India ETF | 31,586 | 1,541,713 |
| Emerging Small Cap Equity Fund 11.2% |
| SPDR S&P Emerging Markets Small-Cap ETF (a) | 520,776 | 29,403,013 |
| | Shares | Value |
| |
| International Small Cap Equity Fund 3.2% |
| Schwab International Small-Cap Equity ETF (a) | 238,140 | $ 8,308,704 |
| U.S. Large Cap Core Funds 7.7% |
| Energy Select Sector SPDR Fund | 1,993 | 167,093 |
| Financial Select Sector SPDR Fund | 301,772 | 11,346,627 |
| Materials Select Sector SPDR Fund (a) | 40,317 | 3,448,716 |
| Vanguard Energy ETF | 315 | 36,943 |
| Vanguard Financials ETF | 33,824 | 3,120,602 |
| Vanguard Materials ETF (a) | 10,629 | 2,018,873 |
| | | 20,138,854 |
| U.S. Small Cap Core Funds 0.5% |
| iShares Core S&P Small-Cap ETF | 7,187 | 777,993 |
| Schwab U.S. Small-Cap ETF (a) | 3,342 | 157,876 |
| Vanguard Small-Cap ETF (a) | 2,348 | 500,899 |
| | | 1,436,768 |
Total Equities
(Cost $55,262,622) | | 60,829,052 |
Total Exchange-Traded Funds
(Cost $246,856,309) | | 256,548,315 |
| Exchange-Traded Note 0.6% |
| Volatility 0.6% |
| Volatility 0.6% |
| iPath S&P 500 VIX Short-Term Futures ETN (a)(b) | 105,543 | 1,638,027 |
Total Exchange-Traded Note
(Cost $3,034,286) | | 1,638,027 |
| Exchange-Traded Vehicle 0.6% |
| Commodity 0.6% |
| Broad Fund 0.6% |
| iShares GSCI Commodity Dynamic Roll Strategy ETF (a) | 61,922 | 1,552,385 |
Total Exchange-Traded Vehicle
(Cost $1,608,424) | | 1,552,385 |
| |
| Short-Term Investments 18.2% |
| Affiliated Investment Company 1.1% |
| MainStay U.S. Government Liquidity Fund, 5.23% (c) | 2,889,285 | 2,889,285 |
| Unaffiliated Investment Companies 17.1% |
| BlackRock Liquidity FedFund, 5.37% (c)(d) | 18,000,000 | 18,000,000 |
The notes to the financial statements are an integral part of, and should be read in conjunction with, the financial statements.
11
Portfolio of Investments December 31, 2023†^ (continued)
| | Shares | | Value |
| Short-Term Investments (continued) |
| Unaffiliated Investment Companies (continued) |
| Fidelity Government Portfolio, 5.36% (c)(d) | 10,000,000 | | $ 10,000,000 |
| Goldman Sachs Financial Square Government Fund, 5.35% (c)(d) | 3,000,000 | | 3,000,000 |
| Invesco Government & Agency Portfolio, 5.36% (c)(d) | 753,088 | | 753,088 |
| State Street Institutional U.S. Government Money Market Fund, 5.38% (c)(d) | 8,000,000 | | 8,000,000 |
| Wells Fargo Government Money Market Fund, 5.36% (c)(d) | 5,000,000 | | 5,000,000 |
Total Unaffiliated Investment Companies
(Cost $44,753,088) | | | 44,753,088 |
Total Short-Term Investments
(Cost $47,642,373) | | | 47,642,373 |
Total Investments
(Cost $299,141,392) | 117.2% | | 307,381,100 |
| Other Assets, Less Liabilities | (17.2) | | (45,211,153) |
| Net Assets | 100.0% | | $ 262,169,947 |
| † | Percentages indicated are based on Portfolio net assets. |
| ^ | Industry classifications may be different than those used for compliance monitoring purposes. |
| (a) | All or a portion of this security was held on loan. As of December 31, 2023, the aggregate market value of securities on loan was $44,684,449; the total market value of collateral held by the Portfolio was $45,859,837. The market value of the collateral held included non-cash collateral in the form of U.S. Treasury securities with a value of $1,106,749. The Portfolio received cash collateral with a value of $44,753,088. (See Note 2(I)) |
| (b) | Non-income producing security. |
| (c) | Current yield as of December 31, 2023. |
| (d) | Represents a security purchased with cash collateral received for securities on loan. |
The notes to the financial statements are an integral part of, and should be read in conjunction with, the financial statements.
| 12 | MainStay VP IQ Hedge Multi-Strategy Portfolio |
Investments in Affiliates (in 000's)
Investments in issuers considered to be affiliate(s) of the Portfolio during the year ended December 31, 2023 for purposes of Section 2(a)(3) of the Investment Company Act of 1940, as amended, were as follows:
| Affiliated Investment Companies | Value,
Beginning
of Year | Purchases
at Cost | Proceeds
from
Sales | Net
Realized
Gain/(Loss)
on Sales | Change in
Unrealized
Appreciation/
(Depreciation) | Value,
End of
Year | Dividend
Income | Other
Distributions | Shares
End of
Year |
| IQ Merger Arbitrage ETF | $ — | $ 13,093 | $ (1,058) | $ 10 | $ 115 | $ 12,160 | $ 147 | $ — | 387 |
| IQ Ultra Short Duration ETF | 9,690 | 732 | (10,428) | (116) | 122 | — | 151 | — | — |
| MainStay U.S. Government Liquidity Fund | 67 | 37,615 | (34,793) | — | — | 2,889 | 36 | — | 2,889 |
| | $9,757 | $ 51,440 | $ (46,279) | $(106) | $ 237 | $ 15,049 | $ 334 | $ — | |
Swap Contracts
Open OTC total return equity swap contracts as of December 31, 2023 were as follows1:
Swap
Counterparty | Reference Obligation | Floating Rate2 | Termination
Date(s) | Payment
Frequency
Paid/
Received | Notional
Amount
Long/
(Short)
(000)3 | Unrealized
Appreciation/
(Depreciation)4 |
| Bank of America Merrill Lynch | AltShares Merger Arbitrage ETF | Federal Funds Composite Interest Rate plus 0.50% | 9/4/24 | Monthly | 51 | $ — |
| Morgan Stanley & Co. | AltShares Merger Arbitrage ETF | Federal Fund Rate plus 0.50% | 9/16/24 | Monthly | 51 | — |
| Bank of America Merrill Lynch | Energy Select Sector SPDR Fund | Federal Funds Composite Interest Rate plus 0.50% | 9/4/24 | Monthly | 3 | — |
| Morgan Stanley & Co. | Energy Select Sector SPDR Fund | Federal Fund Rate plus 0.50% | 9/16/24 | Monthly | 3 | — |
| Bank of America Merrill Lynch | Financial Select Sector SPDR Fund | Federal Funds Composite Interest Rate plus 0.50% | 9/4/24 | Monthly | 211 | — |
| Morgan Stanley & Co. | Financial Select Sector SPDR Fund | Federal Fund Rate plus 0.50% | 9/16/24 | Monthly | 211 | — |
| Bank of America Merrill Lynch | Invesco Global Listed Private Equity ETF | Federal Funds Composite Interest Rate plus 0.50% | 9/4/24 | Monthly | 17 | — |
| Morgan Stanley & Co. | Invesco Global Listed Private Equity ETF | Federal Fund Rate plus 0.50% | 9/16/24 | Monthly | 17 | — |
| Bank of America Merrill Lynch | Invesco Senior Loan ETF | Federal Funds Composite Interest Rate plus 0.50% | 9/4/24 | Monthly | 595 | — |
| Morgan Stanley & Co. | Invesco Senior Loan ETF | Federal Fund Rate plus 0.50% | 9/16/24 | Monthly | 595 | — |
| Bank of America Merrill Lynch | iPath S&P 500 VIX Short-Term Futures ETN | Federal Funds Composite Interest Rate plus 0.50% | 9/4/24 | Monthly | 29 | — |
| Morgan Stanley & Co. | iPath S&P 500 VIX Short-Term Futures ETN | Federal Fund Rate plus 0.50% | 9/16/24 | Monthly | 28 | — |
| Bank of America Merrill Lynch | IQ Merger Arbitrage ETF | Federal Funds Composite Interest Rate plus 0.50% | 9/4/24 | Monthly | 226 | — |
| Morgan Stanley & Co. | IQ Merger Arbitrage ETF | Federal Fund Rate plus 0.50% | 9/16/24 | Monthly | 226 | — |
| Bank of America Merrill Lynch | iShares Convertible Bond ETF | Federal Funds Composite Interest Rate plus 0.50% | 9/4/24 | Monthly | 147 | — |
| Morgan Stanley & Co. | iShares Convertible Bond ETF | Federal Fund Rate plus 0.50% | 9/16/24 | Monthly | 147 | — |
| Bank of America Merrill Lynch | iShares Core S&P Mid-Cap ETF | Federal Funds Composite Interest Rate | 9/4/24 | Monthly | (2,797) | — |
| Morgan Stanley & Co. | iShares Core S&P Mid-Cap ETF | Federal Fund Rate minus 0.35% | 9/16/24 | Monthly | (2,797) | — |
| Bank of America Merrill Lynch | iShares Core S&P Small-Cap ETF | Federal Funds Composite Interest Rate plus 0.50% | 9/4/24 | Monthly | 14 | — |
| Morgan Stanley & Co. | iShares Core S&P Small-Cap ETF | Federal Fund Rate plus 0.50% | 9/16/24 | Monthly | 14 | — |
| Bank of America Merrill Lynch | iShares Floating Rate Bond ETF | Federal Funds Composite Interest Rate plus 0.50% | 9/4/24 | Monthly | 852 | — |
The notes to the financial statements are an integral part of, and should be read in conjunction with, the financial statements.
13
Portfolio of Investments December 31, 2023†^ (continued)
Swap
Counterparty | Reference Obligation | Floating Rate2 | Termination
Date(s) | Payment
Frequency
Paid/
Received | Notional
Amount
Long/
(Short)
(000)3 | Unrealized
Appreciation/
(Depreciation)4 |
| Morgan Stanley & Co. | iShares Floating Rate Bond ETF | Federal Fund Rate plus 0.50% | 9/16/24 | Monthly | 852 | $ — |
| Bank of America Merrill Lynch | iShares GSCI Commodity Dynamic Roll Strategy ETF | Federal Funds Composite Interest Rate plus 0.50% | 9/4/24 | Monthly | 26 | — |
| Morgan Stanley & Co. | iShares GSCI Commodity Dynamic Roll Strategy ETF | Federal Fund Rate plus 0.50% | 9/16/24 | Monthly | 27 | — |
| Bank of America Merrill Lynch | iShares MSCI India ETF | Federal Funds Composite Interest Rate plus 0.50% | 9/4/24 | Monthly | 26 | — |
| Morgan Stanley & Co. | iShares MSCI India ETF | Federal Fund Rate plus 0.50% | 9/16/24 | Monthly | 26 | — |
| Bank of America Merrill Lynch | JPMorgan Equity Premium Income ETF | Federal Funds Composite Interest Rate plus 0.50% | 9/4/24 | Monthly | 234 | — |
| Morgan Stanley & Co. | JPMorgan Equity Premium Income ETF | Federal Fund Rate plus 0.50% | 9/16/24 | Monthly | 234 | — |
| Bank of America Merrill Lynch | JPMorgan Nasdaq Equity Premium Income ETF | Federal Funds Composite Interest Rate plus 0.50% | 9/4/24 | Monthly | 214 | — |
| Morgan Stanley & Co. | JPMorgan Nasdaq Equity Premium Income ETF | Federal Fund Rate plus 0.50% | 9/16/24 | Monthly | 214 | — |
| Bank of America Merrill Lynch | Materials Select Sector SPDR Fund | Federal Funds Composite Interest Rate plus 0.50% | 9/4/24 | Monthly | 64 | — |
| Morgan Stanley & Co. | Materials Select Sector SPDR Fund | Federal Fund Rate plus 0.50% | 9/16/24 | Monthly | 64 | — |
| Bank of America Merrill Lynch | Schwab International Small-Cap Equity ETF | Federal Funds Composite Interest Rate plus 0.50% | 9/4/24 | Monthly | 155 | — |
| Morgan Stanley & Co. | Schwab International Small-Cap Equity ETF | Federal Fund Rate plus 0.50% | 9/16/24 | Monthly | 155 | — |
| Bank of America Merrill Lynch | Schwab U.S. Small-Cap ETF | Federal Funds Composite Interest Rate plus 0.50% | 9/4/24 | Monthly | 3 | — |
| Morgan Stanley & Co. | Schwab U.S. Small-Cap ETF | Federal Fund Rate plus 0.50% | 9/16/24 | Monthly | 3 | — |
| Bank of America Merrill Lynch | SPDR Blackstone Senior Loan ETF | Federal Funds Composite Interest Rate plus 0.50% | 9/4/24 | Monthly | 548 | — |
| Morgan Stanley & Co. | SPDR Blackstone Senior Loan ETF | Federal Fund Rate plus 0.50% | 9/16/24 | Monthly | 548 | — |
| Bank of America Merrill Lynch | SPDR Bloomberg Convertible Securities ETF | Federal Funds Composite Interest Rate plus 0.50% | 9/4/24 | Monthly | 472 | — |
| Morgan Stanley & Co. | SPDR Bloomberg Convertible Securities ETF | Federal Fund Rate plus 0.50% | 9/16/24 | Monthly | 472 | — |
| Bank of America Merrill Lynch | SPDR Bloomberg Investment Grade Floating Rate ETF | Federal Funds Composite Interest Rate plus 0.50% | 9/4/24 | Monthly | 280 | — |
| Morgan Stanley & Co. | SPDR Bloomberg Investment Grade Floating Rate ETF | Federal Fund Rate plus 0.50% | 9/16/24 | Monthly | 280 | — |
| Bank of America Merrill Lynch | SPDR S&P Emerging Markets Small-Cap ETF | Federal Funds Composite Interest Rate plus 0.50% | 9/4/24 | Monthly | 547 | — |
| Morgan Stanley & Co. | SPDR S&P Emerging Markets Small-Cap ETF | Federal Fund Rate plus 0.50% | 9/16/24 | Monthly | 547 | — |
| Bank of America Merrill Lynch | Vanguard Energy ETF | Federal Funds Composite Interest Rate plus 0.50% | 9/4/24 | Monthly | 1 | — |
| Morgan Stanley & Co. | Vanguard Energy ETF | Federal Fund Rate plus 0.50% | 9/16/24 | Monthly | 1 | — |
| Bank of America Merrill Lynch | Vanguard Financials ETF | Federal Funds Composite Interest Rate plus 0.50% | 9/4/24 | Monthly | 53 | — |
| Morgan Stanley & Co. | Vanguard Financials ETF | Federal Fund Rate plus 0.50% | 9/16/24 | Monthly | 53 | — |
| Bank of America Merrill Lynch | Vanguard Materials ETF | Federal Funds Composite Interest Rate plus 0.50% | 9/4/24 | Monthly | 35 | — |
| Morgan Stanley & Co. | Vanguard Materials ETF | Federal Fund Rate plus 0.50% | 9/16/24 | Monthly | 35 | — |
The notes to the financial statements are an integral part of, and should be read in conjunction with, the financial statements.
| 14 | MainStay VP IQ Hedge Multi-Strategy Portfolio |
Swap
Counterparty | Reference Obligation | Floating Rate2 | Termination
Date(s) | Payment
Frequency
Paid/
Received | Notional
Amount
Long/
(Short)
(000)3 | Unrealized
Appreciation/
(Depreciation)4 |
| Bank of America Merrill Lynch | Vanguard Mid-Cap ETF | Federal Funds Composite Interest Rate | 9/4/24 | Monthly | (2,068) | $ — |
| Morgan Stanley & Co. | Vanguard Mid-Cap ETF | Federal Fund Rate minus 0.68% | 9/16/24 | Monthly | (2,068) | — |
| Bank of America Merrill Lynch | Vanguard Small-Cap ETF | Federal Funds Composite Interest Rate plus 0.50% | 9/4/24 | Monthly | 9 | — |
| Morgan Stanley & Co. | Vanguard Small-Cap ETF | Federal Fund Rate plus 0.50% | 9/16/24 | Monthly | 9 | — |
| | | | | | | $ — |
| 1. | As of December 31, 2023, cash in the amount $88,893 was pledged to brokers for OTC swap contracts. |
| 2. | Portfolio pays or receives the floating rate and receives or pays the total return of the referenced entity. |
| 3. | Notional amounts reflected as a positive value indicate a long position held by the Portfolio or Index and a negative value indicates a short position. |
| 4. | Reflects the value at reset date as of December 31, 2023. |
| Abbreviation(s): |
| ETF—Exchange-Traded Fund |
| ETN—Exchange-Traded Note |
| GSCI—Goldman Sachs Commodity Index |
| MSCI—Morgan Stanley Capital International |
| SPDR—Standard & Poor’s Depositary Receipt |
| VIX—CBOE Volatility Index |
The following is a summary of the fair valuations according to the inputs used as of December 31, 2023, for valuing the Portfolio’s assets:
| Description | Quoted
Prices in
Active
Markets for
Identical
Assets
(Level 1) | | Significant
Other
Observable
Inputs
(Level 2) | | Significant
Unobservable
Inputs
(Level 3) | | Total |
| Asset Valuation Inputs | | | | | | | |
| Investments in Securities (a) | | | | | | | |
| Exchange-Traded Funds | $ 256,548,315 | | $ — | | $ — | | $ 256,548,315 |
| Exchange-Traded Note | 1,638,027 | | — | | — | | 1,638,027 |
| Exchange-Traded Vehicle | 1,552,385 | | — | | — | | 1,552,385 |
| Short-Term Investments | | | | | | | |
| Affiliated Investment Company | 2,889,285 | | — | | — | | 2,889,285 |
| Unaffiliated Investment Companies | 44,753,088 | | — | | — | | 44,753,088 |
| Total Short-Term Investments | 47,642,373 | | — | | — | | 47,642,373 |
| Total Investments in Securities | $ 307,381,100 | | $ — | | $ — | | $ 307,381,100 |
| (a) | For a complete listing of investments and their industries, see the Portfolio of Investments. |
The notes to the financial statements are an integral part of, and should be read in conjunction with, the financial statements.
15
Statement of Assets and Liabilities as of December 31, 2023
| Assets |
Investment in unaffiliated securities, at value
(identified cost $284,207,364) including securities on loan of $44,684,449 | $292,332,094 |
Investment in affiliated investment companies, at value
(identified cost $14,934,028) | 15,049,006 |
Cash denominated in foreign currencies
(identified cost $4,598) | 4,666 |
| Cash collateral on deposit at broker for swap contracts | 88,893 |
| Receivables: | |
| Dividends | 370,523 |
| Portfolio shares sold | 56,714 |
| Securities lending | 43,900 |
| Other assets | 1,840 |
| Total assets | 307,947,636 |
| Liabilities |
| Cash collateral received for securities on loan | 44,753,088 |
| Payables: | |
| Dividends and interest on OTC swaps contracts | 514,102 |
| Portfolio shares redeemed | 239,586 |
| Manager (See Note 3) | 142,684 |
| NYLIFE Distributors (See Note 3) | 52,828 |
| Custodian | 31,167 |
| Professional fees | 22,928 |
| Shareholder communication | 13,184 |
| Accrued expenses | 8,122 |
| Total liabilities | 45,777,689 |
| Net assets | $262,169,947 |
| Composition of Net Assets |
| Shares of beneficial interest outstanding (par value of $.001 per share) unlimited number of shares authorized | $ 31,123 |
| Additional paid-in-capital | 332,279,037 |
| | 332,310,160 |
| Total distributable earnings (loss) | (70,140,213) |
| Net assets | $262,169,947 |
| Initial Class | |
| Net assets applicable to outstanding shares | $ 11,879,742 |
| Shares of beneficial interest outstanding | 1,409,675 |
| Net asset value per share outstanding | $ 8.43 |
| Service Class | |
| Net assets applicable to outstanding shares | $250,290,205 |
| Shares of beneficial interest outstanding | 29,713,303 |
| Net asset value per share outstanding | $ 8.42 |
The notes to the financial statements are an integral part of, and should be read in conjunction with, the financial statements.
| 16 | MainStay VP IQ Hedge Multi-Strategy Portfolio |
Statement of Operations for the year ended December 31, 2023
| Investment Income (Loss) |
| Income | |
| Dividends-unaffiliated | $11,704,596 |
| Securities lending, net | 822,177 |
| Dividends-affiliated | 333,802 |
| Total income | 12,860,575 |
| Expenses | |
| Manager (See Note 3) | 2,061,715 |
| Distribution/Service—Service Class (See Note 3) | 657,839 |
| Professional fees | 68,732 |
| Custodian | 64,519 |
| Trustees | 7,240 |
| Miscellaneous | 5,783 |
| Total expenses before waiver/reimbursement | 2,865,828 |
| Expense waiver/reimbursement from Manager (See Note 3) | (283,457) |
| Reimbursement from prior custodian(a) | (85,488) |
| Net expenses | 2,496,883 |
| Net investment income (loss) | 10,363,692 |
| Realized and Unrealized Gain (Loss) |
| Net realized gain (loss) on: | |
| Unaffiliated investment transactions | (2,120,537) |
| Affiliated investment company transactions | (106,165) |
| Swap transactions | (1,006,017) |
| Foreign currency transactions | (2,667) |
| Net realized gain (loss) | (3,235,386) |
| Net change in unrealized appreciation (depreciation) on: | |
| Unaffiliated investments | 18,558,755 |
| Affiliated investments | 237,349 |
| Translation of other assets and liabilities in foreign currencies | 5,176 |
| Net change in unrealized appreciation (depreciation) | 18,801,280 |
| Net realized and unrealized gain (loss) | 15,565,894 |
| Net increase (decrease) in net assets resulting from operations | $25,929,586 |
| (a) | Represents a refund for overbilling of custody fees. |
The notes to the financial statements are an integral part of, and should be read in conjunction with, the financial statements.
17
Statements of Changes in Net Assets
for the years ended December 31, 2023 and December 31, 2022
| | 2023 | 2022 |
| Increase (Decrease) in Net Assets |
| Operations: | | |
| Net investment income (loss) | $ 10,363,692 | $ 5,845,226 |
| Net realized gain (loss) | (3,235,386) | (28,946,491) |
| Net change in unrealized appreciation (depreciation) | 18,801,280 | (8,397,896) |
| Net increase (decrease) in net assets resulting from operations | 25,929,586 | (31,499,161) |
| Distributions to shareholders: | | |
| Initial Class | (588,271) | (245,307) |
| Service Class | (11,163,374) | (4,860,946) |
| Total distributions to shareholders | (11,751,645) | (5,106,253) |
| Capital share transactions: | | |
| Net proceeds from sales of shares | 9,065,487 | 7,315,445 |
| Net asset value of shares issued to shareholders in reinvestment of distributions | 11,751,645 | 5,106,253 |
| Cost of shares redeemed | (58,900,317) | (63,501,869) |
| Increase (decrease) in net assets derived from capital share transactions | (38,083,185) | (51,080,171) |
| Net increase (decrease) in net assets | (23,905,244) | (87,685,585) |
| Net Assets |
| Beginning of year | 286,075,191 | 373,760,776 |
| End of year | $262,169,947 | $286,075,191 |
The notes to the financial statements are an integral part of, and should be read in conjunction with, the financial statements.
| 18 | MainStay VP IQ Hedge Multi-Strategy Portfolio |
Financial Highlights selected per share data and ratios
| | Year Ended December 31, |
| Initial Class | 2023 | | 2022 | | 2021 | | 2020 | | 2019 |
| Net asset value at beginning of year | $ 8.04 | | $ 8.97 | | $ 9.02 | | $ 8.74 | | $ 8.22 |
| Net investment income (loss) (a) | 0.34 | | 0.18 | | 0.09 | | 0.14 | | 0.20 |
| Net realized and unrealized gain (loss) | 0.49 | | (0.94) | | (0.14) | | 0.33 | | 0.49 |
| Total from investment operations | 0.83 | | (0.76) | | (0.05) | | 0.47 | | 0.69 |
| Less distributions: | | | | | | | | | |
| From net investment income | (0.44) | | (0.17) | | — | | (0.16) | | (0.16) |
| Return of capital | — | | — | | — | | (0.03) | | (0.01) |
| Total distributions | (0.44) | | (0.17) | | — | | (0.19) | | (0.17) |
| Net asset value at end of year | $ 8.43 | | $ 8.04 | | $ 8.97 | | $ 9.02 | | $ 8.74 |
| Total investment return (b) | 10.26% | | (8.48)% | | (0.55)%(c) | | 5.38% | | 8.47% |
| Ratios (to average net assets)/Supplemental Data: | | | | | | | | | |
| Net investment income (loss) | 4.02%(d) | | 2.12% | | 0.97% | | 1.56% | | 2.36% |
| Net expenses (e) | 0.67%(f) | | 0.70% | | 0.70% | | 0.70% | | 0.70% |
| Expenses (before waiver/reimbursement) (e) | 0.80% | | 0.81% | | 0.83% | | 1.00% | | 1.20% |
| Portfolio turnover rate | 107% | | 139% | | 126% | | 179% | | 151% |
| Net assets at end of year (in 000's) | $ 11,880 | | $ 12,070 | | $ 13,499 | | $ 12,044 | | $ 10,749 |
| (a) | Per share data based on average shares outstanding during the year. |
| (b) | Total return does not reflect any deduction of sales charges, mortality and expense charges, contract charges or administrative charges. For periods of less than one year, total return is not annualized. |
| (c) | Total investment return may reflect adjustments to conform to generally accepted accounting principles. |
| (d) | Without the custody fee reimbursement, net investment income (loss) would have been 3.99%. |
| (e) | In addition to the fees and expenses which the Portfolio bears directly, it also indirectly bears a pro-rata share of the fees and expenses of the underlying funds in which it invests. Such indirect expenses are not included in the above expense ratios. |
| (f) | Without the custody fee reimbursement, net expenses would have been 0.70%. |
The notes to the financial statements are an integral part of, and should be read in conjunction with, the financial statements.
19
Financial Highlights selected per share data and ratios
| | Year Ended December 31, |
| Service Class | 2023 | | 2022 | | 2021 | | 2020 | | 2019 |
| Net asset value at beginning of year | $ 8.01 | | $ 8.94 | | $ 9.01 | | $ 8.73 | | $ 8.18 |
| Net investment income (loss) (a) | 0.31 | | 0.15 | | 0.06 | | 0.11 | | 0.18 |
| Net realized and unrealized gain (loss) | 0.49 | | (0.94) | | (0.13) | | 0.34 | | 0.49 |
| Total from investment operations | 0.80 | | (0.79) | | (0.07) | | 0.45 | | 0.67 |
| Less distributions: | | | | | | | | | |
| From net investment income | (0.39) | | (0.14) | | — | | (0.14) | | (0.12) |
| Return of capital | — | | — | | — | | (0.03) | | (0.00)‡ |
| Total distributions | (0.39) | | (0.14) | | — | | (0.17) | | (0.12) |
| Net asset value at end of year | $ 8.42 | | $ 8.01 | | $ 8.94 | | $ 9.01 | | $ 8.73 |
| Total investment return (b) | 9.98% | | (8.70)% | | (0.78)%(c) | | 5.14% | | 8.23% |
| Ratios (to average net assets)/Supplemental Data: | | | | | | | | | |
| Net investment income (loss) | 3.76%(d) | | 1.82% | | 0.65% | | 1.29% | | 2.09% |
| Net expenses (e) | 0.92%(f) | | 0.95% | | 0.95% | | 0.95% | | 0.95% |
| Expenses (before waiver/reimbursement) (e) | 1.05% | | 1.06% | | 1.09% | | 1.25% | | 1.45% |
| Portfolio turnover rate | 107% | | 139% | | 126% | | 179% | | 151% |
| Net assets at end of year (in 000's) | $ 250,290 | | $ 274,005 | | $ 360,262 | | $ 371,833 | | $ 389,101 |
| ‡ | Less than one cent per share. |
| (a) | Per share data based on average shares outstanding during the year. |
| (b) | Total return does not reflect any deduction of sales charges, mortality and expense charges, contract charges or administrative charges. For periods of less than one year, total return is not annualized. |
| (c) | Total investment return may reflect adjustments to conform to generally accepted accounting principles. |
| (d) | Without the custody fee reimbursement, net investment income (loss) would have been 3.73%. |
| (e) | In addition to the fees and expenses which the Portfolio bears directly, it also indirectly bears a pro-rata share of the fees and expenses of the underlying funds in which it invests. Such indirect expenses are not included in the above expense ratios. |
| (f) | Without the custody fee reimbursement, net expenses would have been 0.95%. |
The notes to the financial statements are an integral part of, and should be read in conjunction with, the financial statements.
| 20 | MainStay VP IQ Hedge Multi-Strategy Portfolio |
Notes to Financial Statements
Note 1–Organization and Business
MainStay VP Funds Trust (the “Fund”) was organized as a Delaware statutory trust on February 1, 2011. The Fund is registered under the Investment Company Act of 1940, as amended (the “1940 Act”), as an open-end management investment company. The Fund is comprised of thirty-one separate series (collectively referred to as the “Portfolios”). These financial statements and notes relate to the MainStay VP IQ Hedge Multi-Strategy Portfolio (the "Portfolio"), a "diversified” portfolio, as that term is defined in the 1940 Act, as interpreted or modified by regulatory authorities having jurisdiction, from time to time.
Shares of the Portfolio are currently offered to certain separate accounts to fund variable annuity policies and variable universal life insurance policies issued by New York Life Insurance and Annuity Corporation (“NYLIAC”), a wholly-owned subsidiary of New York Life Insurance Company (“New York Life”) and may also be offered to fund variable annuity policies and variable universal life insurance policies issued by other insurance companies. NYLIAC allocates shares of the Portfolio to, among others, certain NYLIAC separate accounts. Shares of the Portfolio are also offered to the MainStay VP Conservative Allocation Portfolio, MainStay VP Moderate Allocation Portfolio, MainStay VP Growth Allocation Portfolio and MainStay VP Equity Allocation Portfolio, which operate as “funds-of-funds," and other variable insurance funds.
The following table lists the Portfolio's share classes that have been registered and commenced operations:
| Class | Commenced Operations |
| Initial Class | May 1, 2013 |
| Service Class | May 1, 2013 |
Shares of the Portfolio are offered and are redeemed at a price equal to their respective net asset value (“NAV”) per share. No sales or redemption charge is applicable to the purchase or redemption of the Portfolio's shares. Under the terms of the Fund’s multiple class plan, adopted pursuant to Rule 18f-3 under the 1940 Act, the classes differ in that, among other things, Service Class shares of the Portfolio pay a combined distribution and service fee of 0.25% of average daily net assets attributable to Service Class shares of the Portfolio to the Distributor (as defined in Note 3(B)) pursuant to a plan adopted in accordance with Rule 12b-1 under the 1940 Act. Contract owners of variable annuity contracts purchased after June 2, 2003, are permitted to invest only in the Service Class shares.
The Portfolio's investment objective is to seek investment returns that correspond (before fees and expenses) generally to the price and yield performance of its underlying index, the IQ Hedge Multi-Strategy Index. The IQ Hedge Multi-Strategy Index seeks to achieve performance similar to the overall hedge fund universe by replicating the “beta” portion of the hedge fund return characteristics (i.e., that portion of the returns that are non-idiosyncratic, or unrelated to manager skill) by using the following hedge fund investment styles: long/short equity; global macro; market neutral; event-driven; fixed-income arbitrage; and emerging markets.
The Portfolio is a “fund of funds” that seeks to achieve its investment objective by investing primarily in exchange-traded funds (“ETFs”), other exchange-traded vehicles issuing equity securities organized in the U.S., such as exchange-traded commodity pools (“ETVs”), and exchange-traded notes (“ETNs”) (such ETFs, ETVs and ETNs are referred to collectively as “exchange-traded products” or “ETPs”), but may also invest in one or more financial instruments, including but not limited to, futures contracts, reverse repurchase agreements, options, and swap agreements (collectively, “Financial Instruments”) in order to seek to achieve exposure to investment strategies and/or asset classes that are similar to those of the IQ Hedge Multi-Strategy Index.
Note 2–Significant Accounting Policies
The Portfolio is an investment company and accordingly follows the investment company accounting and reporting guidance of the Financial Accounting Standards Board (“FASB”) Accounting Standards Codification Topic 946 Financial Services—Investment Companies. The Portfolio prepares its financial statements in accordance with generally accepted accounting principles (“GAAP”) in the United States of America and follows the significant accounting policies described below.
(A) Securities Valuation. Investments are usually valued as of the close of regular trading on the New York Stock Exchange (the "Exchange") (usually 4:00 p.m. Eastern time) on each day the Portfolio is open for business ("valuation date").
Pursuant to Rule 2a-5 under the 1940 Act, the Board of Trustees of the Fund (the "Board") has designated New York Life Investment Management LLC (“New York Life Investments” or the "Manager") as its Valuation Designee (the "Valuation Designee"). The Valuation Designee is responsible for performing fair valuations relating to all investments in the Portfolio’s portfolio for which market quotations are not readily available; periodically assessing and managing material valuation risks; establishing and applying fair value methodologies; testing fair valuation methodologies; evaluating and overseeing pricing services; ensuring appropriate segregation of valuation and portfolio management functions; providing quarterly, annual and prompt reporting to the Board, as appropriate; identifying potential conflicts of interest; and maintaining appropriate records. The Valuation Designee has established a valuation committee ("Valuation Committee") to assist in carrying out the Valuation Designee’s responsibilities and establish prices of securities for which market quotations are not readily available. The Portfolio's and the Valuation Designee's policies and procedures ("Valuation Procedures") govern the Valuation Designee’s selection and application of methodologies for determining and calculating the fair value of Portfolio investments. The Valuation Designee may value the Portfolio's portfolio securities for which market quotations are not readily available and other Portfolio assets utilizing inputs from pricing services and other third-party sources. The Valuation Committee meets (in person, via electronic mail or via teleconference) on an ad-hoc basis to determine fair valuations and on a quarterly basis to review fair value events with respect to certain
Notes to Financial Statements (continued)
securities for which market quotations are not readily available, including valuation risks and back-testing results, and to preview reports to the Board.
The Valuation Committee establishes prices of securities for which market quotations are not readily available based on such methodologies and measurements on a regular basis after considering information that is reasonably available and deemed relevant by the Valuation Committee. The Board shall oversee the Valuation Designee and review fair valuation materials on a prompt, quarterly and annual basis and approve proposed revisions to the Valuation Procedures.
Investments for which market quotations are not readily available are valued at fair value as determined in good faith pursuant to the Valuation Procedures. A market quotation is readily available only when that quotation is a quoted price (unadjusted) in active markets for identical investments that the Portfolio can access at the measurement date, provided that a quotation will not be readily available if it is not reliable. "Fair value" is defined as the price the Portfolio would reasonably expect to receive upon selling an asset or liability in an orderly transaction to an independent buyer in the principal or most advantageous market for the asset or liability. Fair value measurements are determined within a framework that establishes a three-tier hierarchy that maximizes the use of observable market data and minimizes the use of unobservable inputs to establish a classification of fair value measurements for disclosure purposes. "Inputs" refer broadly to the assumptions that market participants would use in pricing the asset or liability, including assumptions about risk, such as the risk inherent in a particular valuation technique used to measure fair value using a pricing model and/or the risk inherent in the inputs for the valuation technique. Inputs may be observable or unobservable. Observable inputs reflect the assumptions market participants would use in pricing the asset or liability based on market data obtained from sources independent of the Portfolio. Unobservable inputs reflect the Portfolio’s own assumptions about the assumptions market participants would use in pricing the asset or liability based on the information available. The inputs or methodology used for valuing assets or liabilities may not be an indication of the risks associated with investing in those assets or liabilities. The three-tier hierarchy of inputs is summarized below.
| • | Level 1—quoted prices (unadjusted) in active markets for an identical asset or liability |
| • | Level 2—other significant observable inputs (including quoted prices for a similar asset or liability in active markets, interest rates and yield curves, prepayment speeds, credit risk, etc.) |
| • | Level 3—significant unobservable inputs (including the Portfolio's own assumptions about the assumptions that market participants would use in measuring fair value of an asset or liability) |
The level of an asset or liability within the fair value hierarchy is based on the lowest level of an input, both individually and in the aggregate, that is significant to the fair value measurement. The aggregate value by input
level of the Portfolio’s assets and liabilities as of December 31, 2023, is included at the end of the Portfolio of Investments.
The Portfolio may use third-party vendor evaluations, whose prices may be derived from one or more of the following standard inputs, among others:
| • Benchmark yields | • Reported trades |
| • Broker/dealer quotes | • Issuer spreads |
| • Two-sided markets | • Benchmark securities |
| • Bids/offers | • Reference data (corporate actions or material event notices) |
| • Industry and economic events | • Comparable bonds |
| • Monthly payment information | |
An asset or liability for which a market quotation is not readily available is valued by methods deemed reasonable in good faith by the Valuation Committee, following the Valuation Procedures to represent fair value. Under these procedures, the Valuation Designee generally uses a market-based approach which may use related or comparable assets or liabilities, recent transactions, market multiples, book values and other relevant information. The Valuation Designee may also use an income-based valuation approach in which the anticipated future cash flows of the asset or liability are discounted to calculate fair value. Discounts may also be applied due to the nature and/or duration of any restrictions on the disposition of the asset or liability. Fair value represents a good faith approximation of the value of a security. Fair value determinations involve the consideration of a number of subjective factors, an analysis of applicable facts and circumstances and the exercise of judgment. As a result, it is possible that the fair value for a security determined in good faith in accordance with the Valuation Procedures may differ from valuations for the same security determined for other funds using their own valuation procedures. Although the Valuation Procedures are designed to value a security at the price the Portfolio may reasonably expect to receive upon the security's sale in an orderly transaction, there can be no assurance that any fair value determination thereunder would, in fact, approximate the amount that the Portfolio would actually realize upon the sale of the security or the price at which the security would trade if a reliable market price were readily available. During the year ended December 31, 2023, there were no material changes to the fair value methodologies.
Securities which may be valued in this manner include, but are not limited to: (i) a security for which trading has been halted or suspended or otherwise does not have a readily available market quotation on a given day; (ii) a debt security that has recently gone into default and for which there is not a current market quotation; (iii) a security of an issuer that has entered into a restructuring; (iv) a security that has been delisted from a national exchange; (v) a security subject to trading collars for which no or limited trading takes place; and (vi) a security whose principal market has been temporarily closed at a time when, under normal conditions, it would be open. Securities valued in this manner are generally categorized as Level 2 or 3 in the hierarchy.
| 22 | MainStay VP IQ Hedge Multi-Strategy Portfolio |
Exchange-traded funds (“ETFs”) are valued at the last quoted sales prices as of the close of regular trading on the relevant exchange on each valuation date. Securities that are not traded on the valuation date are valued at the mean of the last quoted bid and ask prices. Prices are normally taken from the principal market in which each security trades. These securities are generally categorized as Level 1 in the hierarchy.
Investments in mutual funds, including money market funds, are valued at their respective NAVs at the close of business each day on the valuation date. These securities are generally categorized as Level 1 in the hierarchy.
Swaps are marked to market daily based upon quotations from pricing agents, brokers or market makers. These securities are generally categorized as Level 2 in the hierarchy.
Total return swap contracts, which are arrangements to exchange a market-linked return for a periodic payment, are based on a notional principal amount. To the extent that the total return of the security, index or other financial measure underlying the transaction exceeds or falls short of the offsetting interest rate obligation, the Portfolio will receive a payment from or make a payment to the counterparty. Total return swap contracts are marked to market daily based upon quotations from market makers and these securities are generally categorized as Level 2 in the hierarchy.
Temporary cash investments acquired in excess of 60 days to maturity at the time of purchase are valued using the latest bid prices or using valuations based on a matrix system (which considers such factors as security prices, yields, maturities and ratings), both as furnished by independent pricing services. Temporary cash investments that mature in 60 days or less at the time of purchase ("Short-Term Investments") are valued using the amortized cost method of valuation, unless the use of such method would be inappropriate. The amortized cost method involves valuing a security at its cost on the date of purchase and thereafter assuming a constant amortization to maturity of the difference between such cost and the value on maturity date. Amortized cost approximates the current fair value of a security. Securities valued using the amortized cost method are not valued using quoted prices in an active market and are generally categorized as Level 2 in the hierarchy.
The information above is not intended to reflect an exhaustive list of the methodologies that may be used to value portfolio investments. The Valuation Procedures permit the use of a variety of valuation methodologies in connection with valuing portfolio investments. The methodology used for a specific type of investment may vary based on the market data available or other considerations. The methodologies summarized above may not represent the specific means by which portfolio investments are valued on any particular business day.
(B) Income Taxes. The Portfolio's policy is to comply with the requirements of the Internal Revenue Code of 1986, as amended (the “Internal Revenue Code”), applicable to regulated investment companies and to distribute all of its taxable income to the shareholders of the Portfolio within the allowable time limits.
The Manager evaluates the Portfolio’s tax positions to determine if the tax positions taken meet the minimum recognition threshold in connection with accounting for uncertainties in income tax positions taken or expected to be taken for the purposes of measuring and recognizing tax liabilities in the financial statements. Recognition of tax benefits of an uncertain tax position is permitted only to the extent the position is “more likely than not” to be sustained assuming examination by taxing authorities. The Manager analyzed the Portfolio's tax positions taken on federal, state and local income tax returns for all open tax years (for up to three tax years) and has concluded that no provisions for federal, state and local income tax are required in the Portfolio's financial statements. The Portfolio's federal, state and local income tax and federal excise tax returns for tax years for which the applicable statutes of limitations have not expired are subject to examination by the Internal Revenue Service and state and local departments of revenue.
(C) Dividends and Distributions to Shareholders. Dividends and distributions are recorded on the ex-dividend date. The Portfolio intends to declare and pay dividends from net investment income and distributions from net realized capital and currency gains, if any, at least annually. All dividends and distributions are reinvested at NAV in the same class of shares of the Portfolio. Dividends and distributions to shareholders are determined in accordance with federal income tax regulations and may differ from determinations using GAAP.
(D) Security Transactions and Investment Income. The Portfolio records security transactions on the trade date. Realized gains and losses on security transactions are determined using the identified cost method. Dividend income is recognized on the ex-dividend date, net of any foreign tax withheld at the source, and interest income is accrued as earned using the effective interest rate method. Distributions received from real estate investment trusts and the underlying funds held by the Portfolio may be classified as dividends, capital gains and/or return of capital.
Investment income and realized and unrealized gains and losses on investments of the Portfolio are allocated pro rata to the separate classes of shares based upon their relative net assets on the date the income is earned or realized and unrealized gains and losses are incurred.
(E) Expenses. Expenses of the Fund are allocated to the individual Portfolios in proportion to the net assets of the respective Portfolios when the expenses are incurred, except where direct allocations of expenses can be made. Expenses (other than fees incurred under the distribution and service plans, further discussed in Note 3(B), which are charged directly to the Service Class shares) are allocated to separate classes of shares pro rata based upon their relative net assets on the date the expenses are incurred. The expenses borne by the Portfolio, including those of related parties to the Portfolio, are shown in the Statement of Operations.
Additionally, the Portfolio may invest in ETPs and mutual funds, which are subject to management fees and other fees that may cause the costs of investing in ETPs and mutual funds to be greater than the costs of owning the underlying securities directly. These indirect expenses of ETPs and
Notes to Financial Statements (continued)
mutual funds are not included in the amounts shown as expenses in the Statement of Operations or in the expense ratios included in the Financial Highlights.
In addition, the Portfolio bears a pro rata share of the fees and expenses of the ETPs in which it invests. Because the ETPs have varied expense and fee levels and the Portfolio may own different proportions of the ETPs at different times, the amount of fees and expenses incurred indirectly by the Portfolio may vary.
(F) Use of Estimates. In preparing financial statements in conformity with GAAP, the Manager makes estimates and assumptions that affect the reported amounts and disclosures in the financial statements. Actual results could differ from those estimates and assumptions.
(G) Swap Contracts. The Portfolio may enter into credit default, interest rate, equity, index and currency exchange rate swap contracts (“swaps”). In a typical swap transaction, two parties agree to exchange the future returns (or differentials in rates of future returns) earned or realized at periodic intervals on a particular investment or instrument based on a notional principal amount. Generally, the Portfolio will enter into a swap on a net basis, which means that the two payment streams under the swap are netted, with the Portfolio receiving or paying (as the case may be) only the net amount of the two payment streams. Therefore, the Portfolio's current obligation under a swap generally will be equal to the net amount to be paid or received under the swap, based on the relative value of notional positions attributable to each counterparty to the swap. The payments may be adjusted for transaction costs, interest payments, the amount of interest paid on the investment or instrument or other factors. Collateral, in the form of cash or securities, may be required to be held in segregated accounts with the custodian bank or broker in accordance with the terms of the swap. Swap agreements are privately negotiated in the over the counter (“OTC”) market and may be executed in a multilateral or other trade facilities platform, such as a registered commodities exchange (“centrally cleared swaps”).
Certain standardized swaps, including certain credit default and interest rate swaps, are subject to mandatory clearing and exchange-trading, and more types of standardized swaps are expected to be subject to mandatory clearing and exchange-trading in the future. The counterparty risk for exchange-traded and cleared derivatives is expected to be generally lower than for uncleared derivatives, but cleared contracts are not risk-free. In a cleared derivative transaction, the Portfolio typically enters into the transaction with a financial institution counterparty, and performance of the transaction is effectively guaranteed by a central clearinghouse, thereby reducing or eliminating the Portfolio's exposure to the credit risk of its original counterparty. The Portfolio will be required to post specified levels of margin with the clearinghouse or at the instruction of the clearinghouse; the margin required by a clearinghouse may be greater than the margin the Portfolio would be required to post in an uncleared transaction.
Swaps are marked to market daily based upon quotations from pricing agents, brokers, or market makers and the change in value, if any, is
recorded as unrealized appreciation or depreciation. Any payments made or received upon entering into a swap would be amortized or accreted over the life of the swap and recorded as a realized gain or loss. Early termination of a swap is recorded as a realized gain or loss. Daily changes in valuation of centrally cleared swaps, if any, are recorded as a receivable or payable for the change in value as appropriate on the Statement of Assets and Liabilities.
The Portfolio bears the risk of loss of the amount expected to be received under a swap in the event of the default or bankruptcy of the swap counterparty. The Portfolio may be able to eliminate its exposure under a swap either by assignment or other disposition, or by entering into an offsetting swap with the same party or a similar credit-worthy party. Swaps are not actively traded on financial markets. Entering into swaps involves elements of credit, market, leverage, liquidity, operational, counterparty and legal/documentation risk in excess of the amounts recognized on the Statement of Assets and Liabilities. Such risks involve the possibilities that there will be no liquid market for these swaps, that the counterparty to the swaps may default on its obligation to perform or disagree as to the meaning of the contractual terms in the swaps and that there may be unfavorable changes in interest rates, the price of the index or the security underlying these transactions, among other risks.
Equity Swaps (Total Return Swaps). Total return swap contracts are agreements between counterparties to exchange cash flow, one based on a market-linked return of an individual asset or group of assets (such as an index), and the other on a fixed or floating rate. As a total return swap, an equity swap may be structured in different ways. For example, when the Portfolio enters into a “long” equity swap, the counterparty may agree to pay the Portfolio the amount, if any, by which the notional amount of the equity swap would have increased in value had it been invested in a particular referenced security or securities, plus the dividends that would have been received on those securities. In return, the Portfolio will generally agree to pay the counterparty interest on the notional amount of the equity swap plus the amount, if any, by which that notional amount would have decreased in value had it been invested in such referenced security or securities, plus, in certain instances, commissions or trading spreads on the notional amounts. Therefore, the Portfolio's return on the equity swap generally should equal the gain or loss on the notional amount, plus dividends on the referenced security or securities less the interest paid by the Portfolio on the notional amount. Alternatively, when the Portfolio enters into a “short” equity swap, the counterparty will generally agree to pay the Portfolio the amount, if any, by which the notional amount of the equity swap would have decreased in value had the Portfolio sold a particular referenced security or securities short, less the dividend expense that the Portfolio would have incurred on the referenced security or securities, as adjusted for interest payments or other economic factors. In this situation, the Portfolio will generally be obligated to pay the amount, if any, by which the notional amount of the swap would have increased in value had it been invested directly in the referenced security or securities.
Equity swaps generally do not involve the delivery of securities or other referenced assets. Accordingly, the risk of loss with respect to equity
| 24 | MainStay VP IQ Hedge Multi-Strategy Portfolio |
swaps is normally limited to the net amount of payments that the Portfolio is contractually obligated to make. If the other party to an equity swap defaults, the Portfolio's risk of loss consists of the net amount of payments that the Portfolio is contractually entitled to receive, if any. The Portfolio will segregate cash or liquid assets, enter into offsetting transactions or use other measures permitted by applicable law to “cover” the Portfolio's current obligations. The Portfolio and New York Life Investments, however, believe these transactions do not constitute senior securities under the 1940 Act and, accordingly, will not treat them as being subject to the Portfolio's borrowing restrictions.
Equity swaps are derivatives and their value can be very volatile. The Portfolio may engage in total return swaps to gain exposure to emerging markets securities, along with offsetting long total return swap positions to maintain appropriate currency balances and risk exposures across all swap positions. To the extent that the Manager, or the Subadvisor do not accurately analyze and predict future market trends, the values or assets or economic factors, the Portfolio may suffer a loss, which may be substantial.
(H) Foreign Currency Transactions. The Portfolio's books and records are maintained in U.S. dollars. Prices of securities denominated in foreign currency amounts are translated into U.S. dollars at the mean between the buying and selling rates last quoted by any major U.S. bank at the following dates:
(i) market value of investment securities, other assets and liabilities— at the valuation date; and
(ii) purchases and sales of investment securities, income and expenses—at the date of such transactions.
The assets and liabilities that are denominated in foreign currency amounts are presented at the exchange rates and market values at the close of the period. The realized and unrealized changes in net assets arising from fluctuations in exchange rates and market prices of securities are not separately presented.
Net realized gain (loss) on foreign currency transactions represents net currency gains or losses realized as a result of differences between the amounts of securities sale proceeds or purchase cost, dividends, interest and withholding taxes as recorded on the Portfolio's books, and the U.S. dollar equivalent amount actually received or paid. Net currency gains or losses from valuing such foreign currency denominated assets and liabilities, other than investments at valuation date exchange rates, are reflected in unrealized foreign exchange gains or losses.
(I) Securities Lending. In order to realize additional income, the Portfolio may engage in securities lending, subject to the limitations set forth in the 1940 Act and relevant guidance by the staff of the Securities and Exchange Commission (“SEC”). If the Portfolio engages in securities lending, the Portfolio will lend through its custodian, JPMorgan Chase Bank, N.A., ("JPMorgan"), acting as securities lending agent on behalf of the Portfolio. Under the current arrangement, JPMorgan will manage the Portfolio's collateral in accordance with the securities lending agency
agreement between the Portfolio and JPMorgan, and indemnify the Portfolio against counterparty risk. The loans will be collateralized by cash (which may be invested in a money market fund) and/or non-cash collateral (which may include U.S. Treasury securities and/or U.S. government agency securities issued or guaranteed by the United States government or its agencies or instrumentalities) at least equal at all times to the market value of the securities loaned. Non-cash collateral held at year end is segregated and cannot be transferred by the Portfolio. The Portfolio bears the risk of delay in recovery of, or loss of rights in, the securities loaned. The Portfolio may also record a realized gain or loss on securities deemed sold due to a borrower’s inability to return securities on loan. The Portfolio bears the risk of any loss on investment of cash collateral. The Portfolio will receive compensation for lending its securities in the form of fees or it will retain a portion of interest earned on the investment of any cash collateral. The Portfolio will also continue to receive interest and dividends on the securities loaned and any gain or loss in the market price of the securities loaned that may occur during the term of the loan will be for the account of the Portfolio. Income earned from securities lending activities, if any, is reflected in the Statement of Operations.
(J) Foreign Securities Risk. The Portfolio may invest in foreign securities, which carry certain risks that are in addition to the usual risks inherent in domestic securities. Foreign regulatory regimes and securities markets can have less stringent investor protections and disclosure standards and less liquid trading markets than U.S. regulatory regimes and securities markets, and can experience political, social and economic developments that may affect the value of investments in foreign securities. These risks include those resulting from currency fluctuations, future adverse political or economic developments and possible imposition of currency exchange blockages or other foreign governmental laws or restrictions. Economic sanctions and other similar governmental actions or developments could, among other things, effectively restrict or eliminate the Portfolio's ability to purchase or sell certain foreign securities or groups of foreign securities, and thus may make the Portfolio's investments in such securities less liquid or more difficult to value. These risks are likely to be greater in emerging markets than in developed markets. The ability of issuers of debt securities held by the Portfolio to meet their obligations may be affected by, among other things, economic or political developments in a specific country, industry or region.
(K) Counterparty Credit Risk. In order to better define its contractual rights and to secure rights that will help the Portfolio mitigate its counterparty risk, the Portfolio may enter into an International Swaps and Derivatives Association, Inc. Master Agreement (“ISDA Master Agreement”) or similar agreement with its counterparties. An ISDA Master Agreement is a bilateral agreement between the Portfolio and a counterparty that governs certain OTC derivatives and typically contains collateral posting terms and netting provisions. Under an ISDA Master Agreement, the Portfolio may, under certain circumstances, offset with the counterparty certain derivative financial instruments’ payables and/ or receivables with collateral held and/or posted and create one single net
Notes to Financial Statements (continued)
payment. The provisions of the ISDA Master Agreement typically permit a single net payment in the event of default including the bankruptcy or insolvency of the counterparty. Bankruptcy or insolvency laws of a particular jurisdiction may restrict or prohibit the right of offset in bankruptcy, insolvency or other events. In addition, certain ISDA Master Agreements may contain provisions for early termination of OTC derivative transactions in the event the net assets of the Portfolio decline below specific levels or if the Portfolio fails to meet the terms of its ISDA Master Agreements. The result would cause the Portfolio to accelerate payment of any net liability owed to the counterparty.
For financial reporting purposes, the Portfolio does not offset derivative assets and derivative liabilities that are subject to netting arrangements, if any, in the Statement of Assets and Liabilities.
(L) Indemnifications. Under the Fund’s organizational documents, its officers and trustees are indemnified against certain liabilities that may arise out of performance of their duties to the Fund. Additionally, in the normal course of business, the Portfolio enters into contracts with third-party service providers that contain a variety of representations and warranties and that may provide general indemnifications. The Portfolio's maximum exposure under these arrangements is unknown, as this would involve future claims that may be made against the Portfolio that have not yet occurred. The Manager believes that the risk of loss in connection with these potential indemnification obligations is remote. However, there can be no assurance that material liabilities related to such obligations will not arise in the future, which could adversely impact the Portfolio.
(M) Quantitative Disclosure of Derivative Holdings. The following tables show additional disclosures related to the Portfolio's derivative and hedging activities, including how such activities are accounted for and their effect on the Portfolio's financial positions, performance and cash flows.
The Portfolio utilizes a range of derivative instruments for a variety of different purposes. Total return swaps (“TRS”) are one form of derivative that is used. In some cases, TRS contracts are entered into so as to affect long and short exposure to individual securities or indices within a particular strategy. In other cases, TRS are used to gain exposure to the strategy itself, which may also use derivatives. For example, a TRS contract is used to generate the return available from a customized index comprised of a diversified basket of exchange-traded futures. Other examples of derivative positions into which the Portfolio may enter include interest rate swaps, credit default swaps and option contracts. These instruments are frequently used to obtain a desired return at a lower cost to the Portfolio than is available when investing directly in the underlying instrument or to hedge against credit and interest rate risks. The Portfolio may also enter into foreign currency forward contracts to gain exposure to a particular currency or to hedge against the risk of loss due to changing currency exchange rates. These derivatives are not accounted for as hedging instruments.
The effect of derivative instruments on the Statement of Operations for the year ended December 31, 2023:
| Net Realized Gain (Loss) from: | Equity
Contracts
Risk | Total |
| Swap Transactions | $(1,006,017) | $(1,006,017) |
| Total Net Realized Gain (Loss) | $(1,006,017) | $(1,006,017) |
| Average Notional Amount | Total |
| Swap Contracts Long | $ 17,659,202 |
| Swap Contracts Short | $(17,680,448) |
Note 3–Fees and Related Party Transactions
(A) Manager and Subadvisor. New York Life Investments, a registered investment adviser and an indirect, wholly-owned subsidiary of New York Life, serves as the Portfolio’s Manager, pursuant to an Amended and Restated Management Agreement (“Management Agreement”). The Manager provides offices, conducts clerical, recordkeeping and bookkeeping services, and keeps most of the financial and accounting records required to be maintained by the Portfolio. Except for the portion of salaries and expenses that are the responsibility of the Portfolio, the Manager pays the salaries and expenses of all personnel affiliated with the Portfolio and certain operational expenses of the Portfolio. The Portfolio reimburses New York Life Investments in an amount equal to the portion of the compensation of the Chief Compliance Officer attributable to the Portfolio. IndexIQ Advisors LLC (“IndexIQ Advisors” or “Subadvisor”), a registered investment adviser and an affiliate of New York Life Investments, serves as the Subadvisor to the Portfolio and is responsible for the day-to-day portfolio management of the Portfolio. Pursuant to the terms of a Subadvisory Agreement between New York Life Investments and IndexIQ Advisors, New York Life Investments pays for the services of the Subadvisor.
Pursuant to the Management Agreement, the Fund pays the Manager, on behalf of the Portfolio, a monthly fee for the services performed and the facilities furnished at an annual rate of 0.75% of the Portfolio's average daily net assets.
New York Life Investments has contractually agreed to waive fees and/or reimburse expenses so that the Total Annual Portfolio Operating Expenses (excluding taxes, interest, litigation, extraordinary expenses, brokerage and other transaction expenses relating to the purchase or sale of portfolio investments, and acquired (underlying) portfolio/fund fees and expenses) of Initial Class shares and Service Class shares do not exceed 0.70% and 0.95%, respectively, of the Portfolio's average daily net assets. This agreement will remain in effect until May 1, 2024, and shall renew automatically for one-year terms unless New York Life Investments provides written notice of termination prior to the start of the next term or upon approval of the Board.
During the year ended December 31, 2023, New York Life Investments earned fees from the Portfolio in the amount of $2,061,715 and waived
| 26 | MainStay VP IQ Hedge Multi-Strategy Portfolio |
fees and/or reimbursed expenses in the amount of $283,457 and paid the Subadvisor fees in the amount of $889,234.
JPMorgan provides sub-administration and sub-accounting services to the Portfolio pursuant to an agreement with New York Life Investments. These services include calculating the daily NAVs of the Portfolio, maintaining the general ledger and sub-ledger accounts for the calculation of the Portfolio's NAVs, and assisting New York Life Investments in conducting various aspects of the Portfolio's administrative operations. For providing these services to the Portfolio, JPMorgan is compensated by New York Life Investments.
Pursuant to an agreement between the Fund and New York Life Investments, New York Life Investments is responsible for providing or procuring certain regulatory reporting services for the Portfolio. The Portfolio will reimburse New York Life Investments for the actual costs incurred by New York Life Investments in connection with providing or procuring these services for the Portfolio.
(B) Distribution and Service Fees. The Fund, on behalf of the Portfolio, has entered into a distribution agreement with NYLIFE Distributors LLC (the “Distributor”), an affiliate of New York Life Investments. The Portfolio has adopted a distribution plan (the “Plan”) in accordance with the provisions of Rule 12b-1 under the 1940 Act. Under the Plan, the Distributor has agreed to provide, through its affiliates or independent third parties, various distribution-related, shareholder and administrative support services to the Service Class shareholders. For its services, the Distributor is entitled to a combined distribution and service fee accrued daily and paid monthly at an annual rate of 0.25% of the average daily net assets attributable to the Service Class shares of the Portfolio.
Note 4-Federal Income Tax
As of December 31, 2023, the cost and unrealized appreciation (depreciation) of the Portfolio’s investment portfolio, including applicable derivative contracts and other financial instruments, as determined on a federal income tax basis, were as follows:
| | Federal Tax
Cost | Gross
Unrealized
Appreciation | Gross
Unrealized
(Depreciation) | Net
Unrealized
Appreciation/
(Depreciation) |
| Investments in Securities | $303,027,930 | $5,860,745 | $(1,513,018) | $4,347,727 |
As of December 31, 2023, the components of accumulated gain (loss) on a tax basis were as follows:
Ordinary
Income | Accumulated
Capital
and Other
Gain (Loss) | Other
Temporary
Differences | Unrealized
Appreciation
(Depreciation) | Total
Accumulated
Gain (Loss) |
| $— | $(74,495,096) | $— | $4,354,883 | $(70,140,213) |
The difference between book-basis and tax-basis unrealized appreciation (depreciation) is primarily due to wash sale adjustments. The other
temporary differences are primarily due to deferral of specified late year ordinary losses of $968,185.
As of December 31, 2023, for federal income tax purposes, capital loss carryforwards of $73,521,468, as shown in the table below, were available to the extent provided by the regulations to offset future realized gains of the Portfolio. Accordingly, no capital gains distributions are expected to be paid to shareholders until net gains have been realized in excess of such amounts.
Capital Loss
Available Through | Short-Term
Capital Loss
Amounts (000’s) | Long-Term
Capital Loss
Amounts (000’s) |
| Unlimited | $57,771 | $15,750 |
During the years ended December 31, 2023 and December 31, 2022, the tax character of distributions paid as reflected in the Statements of Changes in Net Assets was as follows:
| | 2023 | 2022 |
| Distributions paid from: | | |
| Ordinary Income | $11,751,645 | $5,106,253 |
Note 5–Custodian
JPMorgan is the custodian of cash and securities held by the Portfolio. Custodial fees are charged to the Portfolio based on the Portfolio's net assets and/or the market value of securities held by the Portfolio and the number of certain transactions incurred by the Portfolio.
Note 6–Line of Credit
The Portfolio and certain other funds managed by New York Life Investments maintain a line of credit with a syndicate of banks in order to secure a source of funds for temporary purposes to meet unanticipated or excessive redemption requests.
Effective July 25, 2023, under the credit agreement (the “Credit Agreement”), the aggregate commitment amount is $600,000,000 with an additional uncommitted amount of $100,000,000. The commitment fee is an annual rate of 0.15% of the average commitment amount payable quarterly, regardless of usage, to JPMorgan, who serves as the agent to the syndicate. The commitment fee is allocated among the Portfolio and certain other funds managed by New York Life Investments based upon their respective net assets and other factors. Interest on any revolving credit loan is charged based upon the Federal Funds Rate, Daily SOFR + 0.10%, or the Overnight Bank Funding Rate, whichever is higher. The Credit Agreement expires on July 23, 2024, although the Portfolio, certain other funds managed by New York Life Investments and the syndicate of banks may renew the Credit Agreement for an additional year on the same or different terms or enter into a credit agreement with a different syndicate of banks. Prior to July 25, 2023, the aggregate commitment amount and the commitment fee were the same as those under the current Credit Agreement. During the year ended December 31, 2023, there were no borrowings made or outstanding with respect to the Portfolio under the Credit Agreement.
Notes to Financial Statements (continued)
Note 7–Interfund Lending Program
Pursuant to an exemptive order issued by the SEC, the Portfolio, along with certain other funds managed by New York Life Investments, may participate in an interfund lending program. The interfund lending program provides an alternative credit facility that permits the Portfolio and certain other funds managed by New York Life Investments to lend or borrow money for temporary purposes directly to or from one another, subject to the conditions of the exemptive order. During the year ended December 31, 2023, there were no interfund loans made or outstanding with respect to the Portfolio.
Note 8–Purchases and Sales of Securities (in 000’s)
During the year ended December 31, 2023, purchases and sales of securities, other than short-term securities, were $293,966 and $336,197, respectively.
Note 9–Capital Share Transactions
Transactions in capital shares for the years ended December 31, 2023 and December 31, 2022, were as follows:
| Initial Class | Shares | Amount |
| Year ended December 31, 2023: | | |
| Shares sold | 92,848 | $ 783,651 |
| Shares issued to shareholders in reinvestment of distributions | 69,798 | 588,271 |
| Shares redeemed | (253,924) | (2,101,275) |
| Net increase (decrease) | (91,278) | $ (729,353) |
| Year ended December 31, 2022: | | |
| Shares sold | 56,268 | $ 474,155 |
| Shares issued to shareholders in reinvestment of distributions | 30,435 | 245,307 |
| Shares redeemed | (90,997) | (758,670) |
| Net increase (decrease) | (4,294) | $ (39,208) |
| |
| Service Class | Shares | Amount |
| Year ended December 31, 2023: | | |
| Shares sold | 986,872 | $ 8,281,836 |
| Shares issued to shareholders in reinvestment of distributions | 1,325,351 | 11,163,374 |
| Shares redeemed | (6,786,433) | (56,799,042) |
| Net increase (decrease) | (4,474,210) | $(37,353,832) |
| Year ended December 31, 2022: | | |
| Shares sold | 820,504 | $ 6,841,290 |
| Shares issued to shareholders in reinvestment of distributions | 605,130 | 4,860,946 |
| Shares redeemed | (7,550,160) | (62,743,199) |
| Net increase (decrease) | (6,124,526) | $(51,040,963) |
Note 10–Other Matters
As of the date of this report, the Portfolio faces a heightened level of risk associated with current uncertainty, volatility and state of economies, financial markets, rising interest rates, and labor and health conditions around the world. Events such as war, acts of terrorism, recessions, rapid inflation, the imposition of international sanctions, earthquakes, hurricanes, epidemics and pandemics and other unforeseen natural or human disasters may have broad adverse social, political and economic effects on the global economy, which could negatively impact the value of the Portfolio's investments. Developments that disrupt global economies and financial markets may magnify factors that affect the Portfolio's performance.
Note 11–Subsequent Events
In connection with the preparation of the financial statements of the Portfolio as of and for the year ended December 31, 2023, events and transactions subsequent to December 31, 2023, through the date the financial statements were issued, have been evaluated by the Manager for possible adjustment and/or disclosure. No subsequent events requiring financial statement adjustment or disclosure have been identified.
| 28 | MainStay VP IQ Hedge Multi-Strategy Portfolio |
Report of Independent Registered Public Accounting Firm
To the Board of Trustees of MainStay VP Funds Trust and Shareholders of MainStay VP IQ Hedge Multi-Strategy Portfolio
Opinion on the Financial Statements
We have audited the accompanying statement of assets and liabilities, including the portfolio of investments, of MainStay VP IQ Hedge Multi-Strategy Portfolio (one of the portfolios constituting MainStay VP Funds Trust, referred to hereafter as the “Portfolio”) as of December 31, 2023, the related statement of operations for the year ended December 31, 2023, the statements of changes in net assets for each of the two years in the period ended December 31, 2023, including the related notes, and the financial highlights for each of the five years in the period ended December 31, 2023 (collectively referred to as the “financial statements”). In our opinion, the financial statements present fairly, in all material respects, the financial position of the Portfolio as of December 31, 2023, the results of its operations for the year then ended, the changes in its net assets for each of the two years in the period ended December 31, 2023 and the financial highlights for each of the five years in the period ended December 31, 2023 in conformity with accounting principles generally accepted in the United States of America.
Basis for Opinion
These financial statements are the responsibility of the Portfolio’s management. Our responsibility is to express an opinion on the Portfolio’s financial statements based on our audits. We are a public accounting firm registered with the Public Company Accounting Oversight Board (United States) (PCAOB) and are required to be independent with respect to the Portfolio in accordance with the U.S. federal securities laws and the applicable rules and regulations of the Securities and Exchange Commission and the PCAOB.
We conducted our audits of these financial statements in accordance with the standards of the PCAOB. Those standards require that we plan and perform the audit to obtain reasonable assurance about whether the financial statements are free of material misstatement, whether due to error or fraud.
Our audits included performing procedures to assess the risks of material misstatement of the financial statements, whether due to error or fraud, and performing procedures that respond to those risks. Such procedures included examining, on a test basis, evidence regarding the amounts and disclosures in the financial statements. Our audits also included evaluating the accounting principles used and significant estimates made by management, as well as evaluating the overall presentation of the financial statements. Our procedures included confirmation of securities owned as of December 31, 2023 by correspondence with the custodian, transfer agents and brokers. We believe that our audits provide a reasonable basis for our opinion.
/s/PricewaterhouseCoopers LLP
New York, New York
February 26, 2024
We have served as the auditor of one or more investment companies in the MainStay group of funds since 1984.
Board Consideration and Approval of Management Agreement and Subadvisory Agreement (Unaudited)
The continuation of the Management Agreement with respect to the MainStay VP IQ Hedge Multi-Strategy Portfolio (“Portfolio”) and New York Life Investment Management LLC (“New York Life Investments”) and the Subadvisory Agreement between New York Life Investments and IndexIQ Advisors LLC (“IndexIQ”) with respect to the Portfolio (together, “Advisory Agreements”) is subject to annual review and approval by the Board of Trustees of MainStay VP Funds Trust (“Board” of the “Trust”) in accordance with Section 15 of the Investment Company Act of 1940, as amended (“1940 Act”). At its December 6–7, 2023 meeting, the Board, including the Trustees who are not an “interested person” (as such term is defined in the 1940 Act) of the Trust (“Independent Trustees”) voting separately, unanimously approved the continuation of each of the Advisory Agreements for a one-year period.
In reaching the decision to approve the continuation of each of the Advisory Agreements, the Board considered information and materials furnished by New York Life Investments and IndexIQ in connection with an annual contract review process undertaken by the Board that took place at meetings of the Board and its Contracts Committee from September 2023 through December 2023, including information and materials furnished by New York Life Investments and IndexIQ in response to requests prepared on behalf of the Board, and in consultation with the Independent Trustees, by independent legal counsel to the Independent Trustees, which encompassed a variety of topics, including those summarized below. Information and materials requested by and furnished to the Board for consideration in connection with the contract review process included, among other items, reports on the Portfolio and “peer funds” prepared by Institutional Shareholder Services Inc. (“ISS”), an independent third-party service provider engaged by the Board to report objectively on the Portfolio’s investment performance, management fee and total expenses. The Board also considered information on the fees charged to other investment advisory clients of New York Life Investments and/or IndexIQ that follow investment strategies similar to those of the Portfolio, if any, and, when applicable, the rationale for differences in the Portfolio’s management and subadvisory fees and the fees charged to those other investment advisory clients. In addition, the Board considered information regarding the legal standards and fiduciary obligations applicable to its consideration of the continuation of each of the Advisory Agreements. The contract review process, including the structure and format for information and materials provided to the Board, has been developed in consultation with the Board. The Independent Trustees also met in executive sessions with their independent legal counsel and, for portions thereof, with senior management of New York Life Investments.
The Board’s deliberations with respect to the continuation of each of the Advisory Agreements reflect a year-long process, and the Board also took into account information furnished to the Board and its Committees throughout the year, as deemed relevant and appropriate by the Trustees, including, among other items, reports on investment performance of the Portfolio and investment-related matters for the Portfolio as well as presentations from New York Life Investments and, generally annually, IndexIQ personnel. In addition, the Board took into account
other information provided by New York Life Investments throughout the year, including, among other items, periodic reports on legal and compliance matters, risk management, portfolio turnover, brokerage commissions and non-advisory services provided to the Portfolio by New York Life Investments, as deemed relevant and appropriate by the Trustees.
In addition to information provided to the Board throughout the year, the Board received information in connection with its June 2023 meeting provided specifically in response to requests prepared on behalf of the Board, and in consultation with the Independent Trustees, by independent legal counsel to the Independent Trustees regarding the Portfolio’s distribution arrangements. In addition, the Board received information regarding the Portfolio’s asset levels, share purchase and redemption activity and the payment of Rule 12b-1 and/or certain other fees by the applicable share classes of the Portfolio, among other information.
In considering the continuation of each of the Advisory Agreements, the Trustees reviewed and evaluated the information and factors they believed to reasonably be necessary and appropriate in light of legal advice furnished to them by independent legal counsel to the Independent Trustees and through the exercise of their own business judgment. Although individual Trustees may have weighed certain factors or information differently and the Board did not consider any single factor or information controlling in reaching its decision, the factors that figured prominently in the Board’s consideration of the continuation of each of the Advisory Agreements are summarized in more detail below and include, among other factors: (i) the nature, extent and quality of the services provided to the Portfolio by New York Life Investments and IndexIQ; (ii) the qualifications of the portfolio managers of the Portfolio and the historical investment performance of the Portfolio, New York Life Investments and IndexIQ; (iii) the costs of the services provided, and profits realized, by New York Life Investments and IndexIQ with respect to their relationships with the Portfolio; (iv) the extent to which economies of scale have been realized or may be realized if the Portfolio grows and the extent to which any economies of scale have been shared, have benefited or may benefit the Portfolio’s shareholders; and (v) the reasonableness of the Portfolio’s management and subadvisory fees and total ordinary operating expenses. Although the Board recognized that comparisons between the Portfolio’s fees and expenses and those of other funds are imprecise given different terms of agreements, variations in fund strategies and other factors, the Board considered the reasonableness of the Portfolio’s management fee and total ordinary operating expenses as compared to the peer funds identified by ISS. Throughout their considerations, the Trustees acknowledged the commitment of New York Life Investments and its affiliates to serve the MainStay Group of Funds, as well as their capacity, experience, resources, financial stability and reputations. The Trustees also acknowledged the entrepreneurial and other risks assumed by New York Life Investments in sponsoring and managing the Portfolio. With respect to the Subadvisory Agreement, the Board took into account New York Life Investments’ recommendation to approve the continuation of the Subadvisory Agreement.
| 30 | MainStay VP IQ Hedge Multi-Strategy Portfolio |
The Trustees noted that, throughout the year, the Trustees are afforded an opportunity to ask questions of, and request additional information or materials from, New York Life Investments and IndexIQ. The Board’s decision with respect to each of the Advisory Agreements may have also been based, in part, on the Board’s knowledge of New York Life Investments and IndexIQ resulting from, among other things, the Board’s consideration of each of the Advisory Agreements in prior years, the advisory agreements for other funds in the MainStay Group of Funds, the Board’s review throughout the year of the performance and operations of other funds in the MainStay Group of Funds and each Trustee’s business judgment and industry experience. In addition to considering the above-referenced factors, the Board observed that in the marketplace, notably under variable life insurance policies and variable annuity contracts for which the Portfolio serves as an investment option, there are a range of investment options available to investors and that the Portfolio’s shareholders, having had the opportunity to consider other investment options, have invested in the Portfolio.
The factors that figured prominently in the Board’s decision to approve the continuation of each of the Advisory Agreements during the Board’s December 6–7, 2023 meeting are summarized in more detail below.
Nature, Extent and Quality of Services Provided by New York Life Investments and IndexIQ
The Board examined the nature, extent and quality of the services that New York Life Investments provides to the Portfolio. The Board evaluated New York Life Investments’ experience and capabilities in serving as manager of the Portfolio and considered that the Portfolio operates in a “manager-of-managers” structure. The Board also considered New York Life Investments’ responsibilities and services provided pursuant to this structure, including overseeing the services provided by IndexIQ, evaluating the performance of IndexIQ, making recommendations to the Board as to whether the Subadvisory Agreement should be renewed, modified or terminated and periodically reporting to the Board regarding the results of New York Life Investments’ evaluation and monitoring functions. The Board noted that New York Life Investments manages other mutual funds, serves a variety of other investment advisory clients, including other pooled investment vehicles, and has experience overseeing mutual fund service providers, including subadvisors. The Board considered the experience of senior personnel at New York Life Investments providing management and administrative and other non-advisory services to the Portfolio. The Board observed that New York Life Investments devotes significant resources and time to providing management and administrative and other non-advisory services to the Portfolio, including New York Life Investments’ oversight and due diligence reviews of IndexIQ and ongoing analysis of, and interactions with, IndexIQ with respect to, among other things, the Portfolio’s investment performance and risks as well as IndexIQ’s investment capabilities and subadvisory services with respect to the Portfolio.
The Board also considered the range of services that New York Life Investments provides to the Portfolio under the terms of the Management Agreement, including: (i) fund accounting and ongoing supervisory
services provided by New York Life Investments’ Fund Administration and Accounting Group; (ii) investment supervisory and analytical services provided by New York Life Investments’ Investment Consulting Group; (iii) compliance services provided by the Trust’s Chief Compliance Officer as well as New York Life Investments’ compliance department, including supervision and implementation of the Portfolio’s compliance program; (iv) legal services provided by New York Life Investments’ Office of the General Counsel; and (v) risk management monitoring and analysis by compliance and investment personnel. In addition, the Board considered New York Life Investments’ willingness to invest in personnel and other resources, such as cyber security, information security and business continuity planning, that may benefit the Portfolio and noted that New York Life Investments is responsible for compensating the Trust’s officers, except for a portion of the salary of the Trust’s Chief Compliance Officer. The Board recognized that New York Life Investments provides certain other non-advisory services to the Portfolio and has over time provided an increasingly broad array of non-advisory services to the MainStay Group of Funds as a result of regulatory and other developments.
The Board also examined the range, and the nature, extent and quality, of the investment advisory services that IndexIQ provides to the Portfolio and considered the terms of each of the Advisory Agreements. The Board evaluated IndexIQ’s experience and performance in serving as subadvisor to the Portfolio and advising other portfolios and IndexIQ’s track record and experience in providing investment advisory services as well as the experience of investment advisory, senior management and administrative personnel at IndexIQ. The Board considered New York Life Investments’ and IndexIQ’s overall resources, legal and compliance environment, capabilities, reputation, financial condition and history. In addition to information provided in connection with quarterly meetings with the Trust’s Chief Compliance Officer, the Board considered information regarding the compliance policies and procedures of New York Life Investments and IndexIQ and acknowledged their commitment to further developing and strengthening compliance programs that may relate to the Portfolio. The Board also considered IndexIQ’s ability to recruit and retain qualified investment professionals and willingness to invest in personnel and other resources that may benefit the Portfolio. In this regard, the Board considered the qualifications and experience of the Portfolio’s portfolio managers, the number of accounts managed by the portfolio managers and the method for compensating the portfolio managers.
In addition, the Board considered information provided by New York Life Investments and IndexIQ regarding their respective business continuity and disaster recovery plans.
Based on these considerations, among others, the Board concluded that the Portfolio would likely continue to benefit from the nature, extent and quality of these services.
Investment Performance
In evaluating the Portfolio’s investment performance, the Board considered investment performance results over various periods in light of the Portfolio’s investment objective, strategies and risks. The Board
Board Consideration and Approval of Management Agreement and Subadvisory Agreement (Unaudited) (continued)
considered investment reports on, and analysis of, the Portfolio’s performance provided to the Board throughout the year. These reports include, among other items, information on the Portfolio’s gross and net returns, the Portfolio’s investment performance compared to a relevant investment category and the Portfolio’s benchmarks, the Portfolio’s risk-adjusted investment performance and the Portfolio’s investment performance as compared to peer funds, as appropriate, as well as portfolio attribution information and commentary on the effect of market conditions. The Board also considered information provided by ISS showing the investment performance of the Portfolio as compared to peer funds. In addition, the Board reviewed the methodology used by ISS to construct the group of peer funds for comparative purposes.
The Board also took into account its discussions with senior management at New York Life Investments concerning the Portfolio’s investment performance over various periods as well as discussions between representatives of IndexIQ and the members of the Board’s Investment Committee, which generally occur on an annual basis. In considering the investment performance of the Portfolio, the Board noted that the Portfolio underperformed its peer funds for the three- and five-year periods ended July 31, 2023, and performed favorably compared to its peer funds for the one-year period ended July 31, 2023. The Board considered its discussions with representatives from New York Life Investments and IndexIQ regarding the Portfolio’s investment performance.
Based on these considerations, among others, the Board concluded that its review of the Portfolio’s investment performance and related information supported a determination to approve the continuation of each of the Advisory Agreements.
Costs of the Services Provided, and Profits and Other Benefits Realized, by New York Life Investments and IndexIQ
The Board considered the costs of the services provided under each of the Advisory Agreements. The Board also considered the profitability of New York Life Investments and its affiliates, including IndexIQ, due to their relationships with the Portfolio as well as by New York Life Investments and its affiliates due to their relationships with the MainStay Group of Funds. Because IndexIQ is an affiliate of New York Life Investments whose subadvisory fee is paid by New York Life Investments, not the Portfolio, the Board considered cost and profitability information for New York Life Investments and IndexIQ in the aggregate.
In addition, the Board acknowledged the difficulty in obtaining reliable comparative data about mutual fund managers’ profitability because such information generally is not publicly available and may be impacted by numerous factors, including the structure of a fund manager’s organization, the types of funds it manages, the methodology used to allocate certain fixed costs to specific funds and the manager’s capital structure and costs of capital.
In evaluating the costs of the services provided by New York Life Investments and IndexIQ, and profitability of New York Life Investments and its affiliates, including IndexIQ due to their relationships with the
Portfolio, the Board considered, among other factors, New York Life Investments’ and its affiliates’, including IndexIQ’s, continuing investments in, or willingness to invest in, personnel and other resources that may support and further enhance the management of the Portfolio, and that New York Life Investments is responsible for paying the subadvisory fee for the Portfolio. The Board also considered the financial resources of New York Life Investments and IndexIQ and acknowledged that New York Life Investments and IndexIQ must be in a position to recruit and retain experienced professional personnel and to maintain a strong financial position for New York Life Investments and IndexIQ to continue to provide high-quality services to the Portfolio. The Board recognized that the Portfolio benefits from the allocation of certain fixed costs among the funds in the MainStay Group of Funds, among other expected benefits resulting from its relationship with New York Life Investments.
The Board considered information regarding New York Life Investments’ methodology for calculating profitability and allocating costs provided by New York Life Investments in connection with the fund profitability analysis presented to the Board. The Board concluded that New York Life Investments’ methods for allocating costs and procedures for estimating overall profitability of the relationship with the funds in the MainStay Group of Funds were reasonable. The Board recognized the difficulty in calculating and evaluating a manager’s profitability with respect to the Portfolio and considered that other profitability methodologies may also be reasonable.
The Board also considered certain fall-out benefits that may be realized by New York Life Investments and its affiliates, including IndexIQ, due to their relationships with the Portfolio, including reputational and other indirect benefits. The Board recognized, for example, the benefits to IndexIQ from legally permitted “soft-dollar” arrangements by which brokers provide research and other services to IndexIQ in exchange for commissions paid by the Portfolio with respect to trades in the Portfolio’s portfolio securities. In addition, the Board considered its review of the management agreement for a money market fund advised by New York Life Investments and an affiliated subadvisor that serves as an investment option for the Portfolio, including the potential rationale for and costs associated with investments in this money market fund by the Portfolio, if any, and considered information from New York Life Investments that the nature and type of specific investment advisory services provided to this money market fund are distinct from, or in addition to, the investment advisory services provided to the Portfolio. In addition, the Board considered the potential dividend received tax deduction for insurance company affiliates of New York Life Investments from the Portfolio’s securities lending activity.
The Board noted that the Portfolio serves as an investment option primarily under variable contracts issued by affiliates of New York Life Investments that would receive fees under those contracts. The Board observed that, in addition to fees earned by New York Life Investments under the Management Agreement for managing the Portfolio, New York Life Investments’ affiliates also earn revenues from serving the Portfolio in various other capacities, including as the Portfolio’s distributor, and
| 32 | MainStay VP IQ Hedge Multi-Strategy Portfolio |
insurance companies affiliated with New York Life Investments would be entitled to receive fees from the Portfolio under a distribution and service plan adopted pursuant to Rule 12b-1 under the 1940 Act. The Board considered information about these other revenues and their impact on the profitability of the relationship with the Portfolio to New York Life Investments and its affiliates. The Board noted that, although it assessed the overall profitability of the relationship with the Portfolio to New York Life Investments and its affiliates as part of the contract review process, when considering the reasonableness of the fee paid to New York Life Investments under the Management Agreement, the Board considered the profitability of New York Life Investments’ relationship with the Portfolio on a pre-tax basis and without regard to distribution expenses incurred by New York Life Investments from its own resources.
After evaluating the information deemed relevant by the Trustees, the Board concluded that any profits realized by New York Life Investments and its affiliates, including IndexIQ, due to their relationships with the Portfolio were not excessive and other expected benefits that may accrue to New York Life Investments and its affiliates, including IndexIQ, are reasonable.
Management and Subadvisory Fees and Total Ordinary Operating Expenses
The Board evaluated the reasonableness of the fee paid under each of the Advisory Agreements and the Portfolio’s total ordinary operating expenses. With respect to the management fee and subadvisory fee, the Board primarily considered the reasonableness of the management fee paid by the Portfolio to New York Life Investments because the subadvisory fee paid to IndexIQ is paid by New York Life Investments, not the Portfolio. The Board also considered the reasonableness of the subadvisory fee paid by New York Life Investments and the amount of the management fee retained by New York Life Investments.
In assessing the reasonableness of the Portfolio’s fees and expenses, the Board primarily considered comparative data provided by ISS on the fees and expenses of similar mutual funds managed by other investment advisers. The Board reviewed the methodology used by ISS to construct the group of peer funds for comparative purposes. In addition, the Board considered information provided by New York Life Investments and IndexIQ on fees charged to other investment advisory clients, including institutional separate accounts and/or other funds, that follow investment strategies similar to those of the Portfolio, if any. The Board considered the contractual management fee schedule for the Portfolio as compared to those for such other investment advisory clients, taking into account the rationale for differences in fee schedules. The Board also took into account information provided by New York Life Investments about the more extensive scope of services provided to registered investment companies, such as the Portfolio, as compared with other investment advisory clients. Additionally, the Board considered the impact of voluntary waivers and expense limitation arrangements on the Portfolio’s net management fee and expenses. The Board also considered that in proposing fees for the Portfolio, New York Life Investments considers the competitive marketplace for mutual funds.
Because the Portfolio invests primarily in ETFs, the Board also considered information provided by New York Life Investments regarding the fees and expenses associated with the Portfolio’s investments in ETFs, including New York Life Investments’ finding that the Portfolio’s fees and expenses do not duplicate the fees and expenses of the corresponding acquired ETF (when required by Rule 12d1-4 under the 1940 Act).
Based on the factors outlined above, among other considerations, the Board concluded that the Portfolio’s management fee and total ordinary operating expenses are within a range that is competitive and support a conclusion that these fees and expenses are reasonable.
Economies of Scale
The Board considered information regarding economies of scale, including whether economies of scale may exist with respect to the Portfolio and whether the Portfolio’s management fee and expense structure permits any economies of scale to be appropriately shared with the Portfolio’s shareholders. The Board also considered a report from New York Life Investments, previously prepared at the request of the Board, that addressed economies of scale, including with respect to the mutual fund business generally, and the various ways in which the benefits of economies of scale may be shared with the funds in the MainStay Group of Funds. Although the Board recognized the difficulty of determining economies of scale with precision, the Board acknowledged that economies of scale may be shared with the Portfolio in a number of ways, including, for example, through the imposition of fee breakpoints, initially setting management fee rates at scale or making additional investments to enhance the services provided to the Portfolio. The Board reviewed information from New York Life Investments showing how the Portfolio’s management fee schedule compared to fee schedules of other funds and accounts managed by New York Life Investments. The Board also reviewed information from ISS showing how the Portfolio’s management fee schedule compared with fees paid for similar services by peer funds at varying asset levels.
Based on this information, the Board concluded that economies of scale are appropriately shared for the benefit of the Portfolio’s shareholders through the Portfolio’s management fee and expense structure and other methods to share benefits from economies of scale.
Conclusion
On the basis of the information and factors summarized above, among other information and factors deemed relevant by the Trustees, and the evaluation thereof, the Board, including the Independent Trustees voting separately, unanimously voted to approve the continuation of each of the Advisory Agreements.
Proxy Voting Policies and Procedures and Proxy Voting Record
The Portfolio is required to file with the SEC its proxy voting record for the 12-month period ending June 30 on Form N-PX. A description of the policies and procedures that are used to vote proxies relating to portfolio securities of the Portfolio is available free of charge upon request by calling 800-598-2019 or visiting the SEC's website at www.sec.gov. The most recent Form N-PX or proxy voting record is available free of charge upon request by calling 800-598-2019; visiting https://www.newyorklifeinvestments.com/investment-products/vp; or visiting the SEC’s website at www.sec.gov.
Shareholder Reports and Quarterly Portfolio Disclosure
The Portfolio is required to file its complete schedule of portfolio holdings with the SEC 60 days after its first and third fiscal quarter on Form N-PORT. The Portfolio's holdings report is available free of charge upon request by calling 800-598-2019 or by visiting the SEC’s website at www.sec.gov.
Board of Trustees and Officers (Unaudited)
The Trustees and officers of the Portfolio are listed below. The Board oversees the MainStay Group of Funds (which consists of MainStay Funds and MainStay Funds Trust), MainStay VP Funds Trust, MainStay MacKay DefinedTerm Municipal Opportunities Fund, MainStay CBRE Global Infrastructure Megatrends Term Fund, the Manager and the Subadvisors, and elects the officers of the Portfolios who are responsible for the day-to-day operations of the Portfolio. Information pertaining to the Trustees and officers is set forth below. Each Trustee serves until his or her successor is elected and qualified or until his or her resignation,
death or removal. Under the Board’s retirement policy, unless an exception is made, a Trustee must tender his or her resignation by the end of the calendar year during which he or she reaches the age of 75. Officers are elected annually by the Board. The business address of each Trustee and officer listed below is 51 Madison Avenue, New York, New York 10010. A majority of the Trustees are not “interested persons” (as defined by the 1940 Act and rules adopted by the SEC thereunder) of the Portfolio (“Independent Trustees”).
| | Name and
Year of Birth | Term of Office,
Position(s) Held and
Length of Service | Principal Occupation(s)
During Past Five Years | Number of
Portfolios in
Fund Complex
Overseen by
Trustee | Other Directorships
Held by Trustee |
| | | | | | |
| | Naïm Abou-Jaoudé*
1966 | MainStay VP Funds Trust: Trustee since 2023 | Chief Executive Officer of New York Life Investment Management LLC (since 2023). Chief Executive Officer of Candriam (an affiliate of New York Life Investment Management LLC) (2007 to 2023). | 81 | MainStay Funds: Trustee since 2023 (11 Funds)
MainStay Funds Trust: Trustee since 2023 (37 Funds);
MainStay MacKay DefinedTerm Municipal Opportunities Fund: Trustee since 2023;
MainStay CBRE Global Infrastructure Megatrends Term Fund: Trustee since 2023; and
New York Life Investment Management International (Chair) since 2015 |
| * | This Trustee is considered to be an “interested person” of the MainStay Group of Funds, MainStay VP Funds Trust, MainStay CBRE Global Infrastructure Megatrends Term Fund and MainStay MacKay DefinedTerm Municipal Opportunities Fund, within the meaning of the 1940 Act because of his affiliation with New York Life Investment Management LLC and Candriam, as described in detail above in the column entitled “Principal Occupation(s) During Past Five Years.” |
| | |
Board of Trustees and Officers (Unaudited) (continued)
| | Name and
Year of Birth | Term of Office,
Position(s) Held and
Length of Service | Principal Occupation(s)
During Past Five Years | Number of
Portfolios in
Fund Complex
Overseen by
Trustee | Other Directorships
Held by Trustee |
| | | | | | |
| | David H. Chow
1957 | MainStay VP Funds Trust: Trustee since January 2016, Advisory Board Member (June 2015 to December 2015) | Founder and CEO, DanCourt Management, LLC since 1999 | 81 | MainStay Funds: Trustee since January 2016, Advisory Board Member (June 2015 to December 2015) (11 Funds);
MainStay Funds Trust: Trustee since January 2016, Advisory Board Member (June 2015 to December 2015) (37 Funds);
MainStay MacKay DefinedTerm Municipal Opportunities Fund: Trustee since January 2016, Advisory Board Member (June 2015 to December 2015);
MainStay CBRE Global Infrastructure Megatrends Term Fund: Trustee since 2021;
VanEck Vectors Group of Exchange-Traded Funds: Trustee since 2006 and Independent Chairman of the Board of Trustees from 2008 to 2022 (57 portfolios); and
Berea College of Kentucky: Trustee since 2009, Chair of the Investment Committee since 2018 |
| | Karen Hammond
1956 | MainStay VP Funds Trust: Trustee since December 2021, Advisory Board Member (June 2021 to December 2021)
| Retired, Managing Director, Devonshire Investors (2007 to 2013); Senior Vice President, Fidelity Management & Research Co. (2005 to 2007); Senior Vice President and Corporate Treasurer, FMR Corp. (2003 to 2005); Chief Operating Officer, Fidelity Investments Japan (2001 to 2003) | 81 | MainStay Funds: Trustee since December 2021, Advisory Board Member (June 2021 to December 2021) (11 Funds);
MainStay Funds Trust: Trustee since December 2021, Advisory Board Member (June 2021 to December 2021) (37 Funds);
MainStay MacKay DefinedTerm Municipal Opportunities Fund: Trustee since December 2021, Advisory Board Member (June 2021 to December 2021);
MainStay CBRE Global Infrastructure Megatrends Term Fund: Trustee since December 2021, Advisory Board Member (June 2021 to December 2021);
Two Harbors Investment Corp.: Director since 2018;
Rhode Island State Investment Commission: Member since 2017; and
Blue Cross Blue Shield of Rhode Island: Director since 2019 |
| | Susan B. Kerley
1951 | MainStay VP Funds Trust: Chair since 2017 and Trustee since 2007** | President, Strategic Management Advisors LLC since 1990 | 81 | MainStay Funds: Chair since January 2017 and Trustee since 2007 (11 Funds); MainStay Funds Trust: Chair since January 2017 and Trustee since 1990 (37 Funds)***;
MainStay MacKay DefinedTerm Municipal Opportunities Fund: Chair since January 2017 and Trustee since 2011;
MainStay CBRE Global Infrastructure Megatrends Term Fund: Trustee since June 2021; and
Legg Mason Partners Funds: Trustee since 1991 (45 portfolios) |
| 36 | MainStay VP IQ Hedge Multi-Strategy Portfolio |
| | Name and
Year of Birth | Term of Office,
Position(s) Held and
Length of Service | Principal Occupation(s)
During Past Five Years | Number of
Portfolios in
Fund Complex
Overseen by
Trustee | Other Directorships
Held by Trustee |
| | | | | | |
| | Alan R. Latshaw
1951 | MainStay VP Funds Trust: Trustee since 2007** | Retired; Partner, Ernst & Young LLP (2002 to 2003); Partner, Arthur Andersen LLP (1989 to 2002); Consultant to the MainStay Funds Audit and Compliance Committee (2004 to 2006) | 81 | MainStay Funds: Trustee since 2006 (11 Funds);
MainStay Funds Trust: Trustee since 2007 (37 Funds)***;
MainStay MacKay DefinedTerm Municipal Opportunities Fund: Trustee since 2011; and
MainStay CBRE Global Infrastructure Megatrends Term Fund: Trustee since June 2021 |
| | Jacques P. Perold
1958 | MainStay VP Funds Trust: Trustee since January 2016, Advisory Board Member (June 2015 to December 2015) | Founder and Chief Executive Officer, CapShift Advisors LLC (since 2018); President, Fidelity Management & Research Company (2009 to 2014); President and Chief Investment Officer, Geode Capital Management, LLC (2001 to 2009) | 81 | MainStay Funds: Trustee since January 2016, Advisory Board Member (June 2015 to December 2015) (11 Funds);
MainStay Funds Trust: Trustee since January 2016, Advisory Board Member (June 2015 to December 2015) (37 Funds);
MainStay MacKay DefinedTerm Municipal Opportunities Fund: Trustee since January 2016, Advisory Board Member (June 2015 to December 2015);
MainStay CBRE Global Infrastructure Megatrends Term Fund: Trustee since June 2021;
Allstate Corporation: Director since 2015;
Partners in Health: Trustee since 2019; and
MSCI Inc.: Director since 2017 |
| | Richard S. Trutanic
1952 | MainStay VP Funds Trust: Trustee since 2007** | Chairman and Chief Executive Officer, Somerset & Company (financial advisory firm) since 2004; Managing Director, The Carlyle Group (private investment firm) (2002 to 2004); Senior Managing Director, Partner and Board Member, Groupe Arnault S.A. (private investment firm) (1999 to 2002) | 81 | MainStay Funds: Trustee since 1994 (11 Funds);
MainStay Funds Trust: Trustee since 2007 (37 Funds)***;
MainStay MacKay DefinedTerm Municipal Opportunities Fund: Trustee since 2011; and
MainStay CBRE Global Infrastructure Megatrends Term Fund: Trustee since June 2021 |
| ** | Includes prior service as a Director of MainStay VP Series Fund, Inc., the predecessor to MainStay VP Funds Trust. |
| *** | Includes prior service as a Director/Trustee of certain predecessor entities to MainStay Funds Trust. |
Board of Trustees and Officers (Unaudited) (continued)
| | Name and
Year of Birth | Position(s) Held and
Length of Service | Principal Occupation(s)
During Past Five Years | |
| | | | | |
| | Kirk C. Lehneis
1974 | President, MainStay VP Funds Trust (since 2017) | Chief Operating Officer and Senior Managing Director (since 2016), New York Life Investment Management LLC and New York Life Investment Management Holdings LLC; Member of the Board of Managers (since 2017) and Senior Managing Director (since 2018), NYLIFE Distributors LLC; Chairman of the Board and Senior Managing Director, NYLIM Service Company LLC (since 2017); Trustee, President and Principal Executive Officer of IndexIQ Trust, IndexIQ ETF Trust and IndexIQ Active ETF Trust (since 2018); President, MainStay CBRE Global Infrastructure Megatrends Term Fund (since 2021), MainStay MacKay DefinedTerm Municipal Opportunities Fund, MainStay Funds and MainStay Funds Trust (since 2017); Senior Managing Director, Global Product Development (from 2015 to 2016); Managing Director, Product Development (from 2010 to 2015), New York Life Investment Management LLC | |
| | Jack R. Benintende
1964 | Treasurer and Principal Financial and Accounting Officer, MainStay VP Funds Trust (since 2007)** | Managing Director, New York Life Investment Management LLC (since 2007); Treasurer and Principal Financial and Accounting Officer, MainStay CBRE Global Infrastructure Megatrends Term Fund (since 2021), MainStay MacKay DefinedTerm Municipal Opportunities Fund (since 2011), MainStay Funds Trust (since 2009) and MainStay Funds (since 2007); and Assistant Treasurer, New York Life Investment Management Holdings LLC (2008 to 2012) | |
| | J. Kevin Gao
1967 | Secretary and Chief Legal Officer, MainStay VP Funds Trust (since 2010)** | Managing Director and Associate General Counsel, New York Life Investment Management LLC (since 2010); Secretary and Chief Legal Officer, MainStay CBRE Global Infrastructure Megatrends Term Fund (since 2021), MainStay MacKay DefinedTerm Municipal Opportunities Fund (since 2011), MainStay Funds and MainStay Funds Trust (since 2010) | |
| | Kevin M. Gleason
1967 | Vice President and Chief Compliance Officer, MainStay VP Funds Trust (since June 2022) | Vice President and Chief Compliance Officer, IndexIQ Trust, IndexIQ ETF Trust and IndexIQ Active ETF Trust (since June 2022); Vice President and Chief Compliance Officer, MainStay CBRE Global Infrastructure Megatrends Term Fund, MainStay MacKay DefinedTerm Municipal Opportunities Fund (since June 2022); MainStay Funds Trust and MainStay Funds (since June 2022); Senior Vice President, Voya Investment Management and Chief Compliance Officer, Voya Family of Funds (2012 to 2022) | |
| | Scott T. Harrington
1959 | Vice President— Administration, MainStay VP Funds Trust (since 2005)** | Managing Director, New York Life Investment Management LLC (including predecessor advisory organizations) (since 2000); Member of the Board of Directors, New York Life Trust Company (since 2009); Vice President—Administration, MainStay CBRE Global Infrastructure Megatrends Term Fund (since 2021), MainStay MacKay DefinedTerm Municipal Opportunities Fund (since 2011), MainStay Funds Trust and MainStay Funds (since 2009) | |
| * | The officers listed above are considered to be “interested persons” of the MainStay Group of Funds, MainStay VP Funds Trust, MainStay CBRE Global Infrastructure Megatrends Term Fund and MainStay MacKay DefinedTerm Municipal Opportunities Fund within the meaning of the 1940 Act because of their affiliation with the MainStay Group of Funds, New York Life Insurance Company and/or its affiliates, including New York Life Investment Management LLC, New York Life Insurance Company, NYLIM Service Company LLC, NYLIFE Securities LLC and/or NYLIFE Distributors LLC, as described in detail in the column captioned “Principal Occupation(s) During Past Five Years.” Officers are elected annually by the Board. |
| ** | Includes prior service as an Officer of MainStay VP Series Fund, Inc., the predecessor to MainStay VP Funds Trust. |
Officers of the Trust (Who are not Trustees)*
| 38 | MainStay VP IQ Hedge Multi-Strategy Portfolio |
MainStay VP Portfolios
MainStay VP offers a wide range of Portfolios. The full array of MainStay VP offerings is listed here, with information about the manager, subadvisors, legal counsel, and independent registered public accounting firm.
Equity
MainStay VP American Century Sustainable Equity Portfolio
MainStay VP Candriam Emerging Markets Equity Portfolio
MainStay VP Epoch U.S. Equity Yield Portfolio
MainStay VP Fidelity Institutional AM® Utilities Portfolio†
MainStay VP Natural Resources Portfolio
MainStay VP PineStone International Equity Portfolio1
MainStay VP S&P 500 Index Portfolio
MainStay VP Small Cap Growth Portfolio
MainStay VP Wellington Growth Portfolio
MainStay VP Wellington Mid Cap Portfolio
MainStay VP Wellington Small Cap Portfolio
MainStay VP Wellington U.S. Equity Portfolio
MainStay VP Winslow Large Cap Growth Portfolio
Mixed Asset
MainStay VP Balanced Portfolio
MainStay VP Income Builder Portfolio
MainStay VP Janus Henderson Balanced Portfolio
MainStay VP MacKay Convertible Portfolio
Income
MainStay VP Bond Portfolio
MainStay VP Floating Rate Portfolio
MainStay VP Indexed Bond Portfolio
MainStay VP MacKay Government Portfolio2
MainStay VP MacKay High Yield Corporate Bond Portfolio
MainStay VP MacKay Strategic Bond Portfolio
MainStay VP PIMCO Real Return Portfolio
Money Market
MainStay VP U.S. Government Money Market Portfolio
Alternative
MainStay VP CBRE Global Infrastructure Portfolio
MainStay VP IQ Hedge Multi-Strategy Portfolio
Asset Allocation
MainStay VP Conservative Allocation Portfolio
MainStay VP Equity Allocation Portfolio
MainStay VP Growth Allocation Portfolio
MainStay VP Moderate Allocation Portfolio
Manager
New York Life Investment Management LLC
New York, New York
Subadvisors
American Century Investment Management, Inc.
Kansas City, Missouri
Brown Advisory LLC
Baltimore, Maryland
Candriam*
Strassen, Luxembourg
CBRE Investment Management Listed Real Assets LLC
Radnor, Pennsylvania
Epoch Investment Partners, Inc.
New York, New York
FIAM LLC
Smithfield, Rhode Island
IndexIQ Advisors LLC*
New York, New York
Janus Henderson Investors US LLC
Denver, Colorado
MacKay Shields LLC*
New York, New York
Newton Investment Management North America, LLC
Boston, Massachusetts
NYL Investors LLC*
New York, New York
Pacific Investment Management Company LLC
Newport Beach, California
PineStone Asset Management Inc.
Montreal, Québec
Segall Bryant & Hamill, LLC
Chicago, Illinois
Wellington Management Company LLP
Boston, Massachusetts
Winslow Capital Management, LLC
Minneapolis, Minnesota
Legal Counsel
Dechert LLP
Washington, District of Columbia
Independent Registered Public Accounting Firm
PricewaterhouseCoopers LLP
New York, New York
Distributor
NYLIFE Distributors LLC*
Jersey City, New Jersey
Custodian
JPMorgan Chase Bank, N.A.
New York, New York
Some Portfolios may not be available in all products.
† Fidelity Institutional AM is a registered trade mark of FMR LLC. Used with permission.
* An affiliate of New York Life Investment Management LLC.
| 1. | Prior to August 28, 2023, the Portfolio's name was MainStay VP MacKay International Equity Portfolio. |
| 2. | Effective on or about May 1, 2024, the MainStay VP MacKay Government Portfolio will be renamed the MainStay VP U.S. Infrastructure Bond Portfolio. |
Not part of the Annual Report
2023 Annual Report
This report is for the general information of New York Life Variable Annuities and NYLIAC Variable Universal Life Insurance Products policyowners. It must be preceded or accompanied by the appropriate product(s) and funds prospectuses if it is given to anyone who is not an owner of a New York Life variable annuity policy or a NYLIAC Variable Universal Life Insurance Product. This report does not offer for sale or solicit orders to purchase securities.
The performance data quoted in this report represents past performance. Past performance is no guarantee of future results. Due to market volatility and other factors, current performance may be lower or higher than the figures shown. The most recent month-end performance summary for your variable annuity or variable life policy is available by calling 800-598-2019 and is updated periodically on newyorklife.com.
The New York Life Variable Annuities and NYLIAC Variable Universal Life Insurance Products are issued by New York Life Insurance and Annuity Corporation (a Delaware Corporation) and distributed by NYLIFE Distributors LLC (Member FINRA/SIPC).
New York Life Insurance Company
New York Life Insurance and Annuity
Corporation (NYLIAC) (A Delaware Corporation)
51 Madison Avenue, Room 551
New York, NY 10010
newyorklife.com
newyorklifeinvestments.com
NYLIFE Distributors LLC, 30 Hudson Street, Jersey City, NJ 07302
New York Life Investment Management LLC is the investment manager to the MainStay VP Funds Trust
©2024 by NYLIFE Distributors LLC. All rights reserved.
You may obtain copies of the Prospectus and the Statement of Additional Information free of charge, upon request, by calling toll-free 800-598-2019 or writing to New York Life Insurance and Annuity Corporation, 51 Madison Avenue, New York, NY 10010.
| Not FDIC Insured | No Bank Guarantee | May Lose Value |
(NYLIAC) NI506
MainStay VP Balanced Portfolio
Message from the President and Annual Report
December 31, 2023
Special Notice:
Beginning in July 2024, new regulations issued by the Securities and Exchange Commission (SEC) will take effect requiring open-end mutual fund companies and ETFs to (1) overhaul the content of their shareholder reports and (2) mail paper copies of the new tailored shareholder reports to shareholders who have not opted to receive these documents electronically.
If you have not yet elected to receive your shareholder reports electronically, please contact your financial intermediary or visit our website.
| Not FDIC/NCUA Insured | Not a Deposit | May Lose Value | No Bank Guarantee | Not Insured by Any Government Agency |
This page intentionally left blank
Message from the President
Against a backdrop of easing inflationary pressures and continued economic growth, stocks and bonds generally gained ground during the 12-month period ended December 31, 2023, despite high levels of volatility and sharp disparities between the performance of the different market sectors.
Although the war in Ukraine, the outbreak of hostilities in the Middle East and several other notable events affected financial assets, inflation, interest rate, and economic growth trends stood at the forefront of market developments during most of the period. As the reporting period began, high levels of inflation already showed signs of easing in the face of aggressive rate hikes by U.S. Federal Reserve (the “Fed”). From a peak of 9.1% in June 2022, the annualized U.S. inflation rate dropped to 6.4% in January, and 3.4% in December 2023. At the same time, the Fed increased the benchmark federal funds rate from 4.25%–4.50% at the beginning of reporting period, to 5.25%–5.50% as of the end of 2023. Despite the increasing cost of capital and tighter lending environment that resulted from rising rates, economic growth remained surprisingly robust, bolstered by high levels of consumer spending, low levels of unemployment and better-than-expected corporate earnings. With the pace of rate increases slowing from the prior year, investors began hoping for an early shift to a looser monetary policy, with stock prices and bond yields reacting as economic data and statements from the Fed either reinforced or undercut those hopes. Following months of hawkish rhetoric, the Fed finally reversed its stance in December 2023, signaling a positive economic outlook with little chance of a recession and a likelihood of rate cuts in 2024.
The S&P 500® Index, a widely regarded benchmark of U.S. market performance, produced strong gains during the reporting period-– recovering all its losses from 2022 and approached new record territory. A preponderance of the Index’s gains were generated by a relatively small number of mega-cap stocks in the information technology, communication services and consumer discretionary sectors that stood to benefit from rapid developments in generative artificial intelligence (“AI”). Value-oriented, interest-rate sensitive and small-capitalization
shares lagged by significant margins, although market strength widened during the closing weeks of the reporting period. Most overseas equity markets trailed the U.S. market, as developed international economies experienced relatively low growth rates, and weak economic conditions in China undermined emerging markets.
Bonds produced generally positive returns, bolstered by attractive and relatively stable yields. The yield on the 10-year Treasury note hit a high of just under 5% in mid-October 2023, ranging between approximately 3.5% and 4.8% for most of the reporting period. The yield curve remained inverted throughout the year, with the 2-year Treasury yield modestly above the 10-year yield. Corporate bond prices trended moderately higher, generally outperforming government securities. After years of low yields and tight credit spreads, the corporate sector benefited from more attractive valuations and income opportunities. Among corporates, markets generally rewarded longer duration and lower credit quality, although an uptick in default rates posed added risks for high-yield corporate bonds. International bond markets produced mixed returns, with emerging-markets issues advancing over their developed-markets counterparts.
The market volatility of recent years reminds us of the constant need for experienced and steadfast portfolio management in the face of uncertainty. New York Life Investments remains dedicated to providing you, as a valued MainStay VP investor, with the guidance, resources and investment solutions you need to pursue your financial goals.
Thank you for trusting us to help meet your investment needs.
Sincerely,
Kirk C. Lehneis
President
The opinions expressed are as of the date of this report and are subject to change. There is no guarantee that any forecast made will come to pass. This material does not constitute investment advice and is not intended as an endorsement of any specific investment. Past performance is no guarantee of future results.
Not part of the Annual Report
Investors should refer to the Portfolio’s Summary Prospectus and/or Prospectus and consider the Portfolio’s investment objectives, strategies, risks, charges and expenses carefully before investing. The Summary Prospectus and/or Prospectus contain this and other information about the Portfolio. You may obtain copies of the Portfolio’s Summary Prospectus, Prospectus and Statement of Additional Information, which includes information about the MainStay VP Funds Trust's Trustees, free of charge, upon request, by calling toll-free 800-598-2019, by writing to New York Life Insurance and Annuity Corporation, 51 Madison Avenue, Room 251, New York, New York 10010 or by sending an email to MainStayShareholdersServices@nylim.com. These documents are also available at newyorklifeinvestments.com/investment-products/vp. Please read the Portfolio's Summary Prospectus and/or Prospectus carefully before investing. MainStay VP Funds Trust portfolios are separate account options which are purchased through a variable insurance or variable annuity contract.
Investment and Performance Comparison (Unaudited)
Performance data quoted represents past performance. Past performance is no guarantee of future results. Because of market volatility and other factors, current performance may be lower or higher than the figures shown. Investment return and principal value will fluctuate, and as a result, when shares are redeemed, they may be worth more or less than their original cost. The performance table and graph do not reflect any deduction of sales charges, mortality and expense charges, contract charges or administrative charges. Please refer to the Performance Summary appropriate for your policy. For performance information current to the most recent month-end, please call 800-598-2019 or visit www.newyorklife.com.
Performance figures may reflect certain fee waivers and/or expense limitations, without which total returns may have been different. For information on current fee waivers and/or expense limitations (if any), please refer to the Notes to Financial Statements.
| Average Annual Total Returns for the Year-Ended December 31, 2023 |
| Class | Inception
Date1, 2 | One
Year | Five
Years | Ten
Years | Gross
Expense
Ratio3 |
| Initial Class Shares | 5/2/2005 | 7.55% | 8.42% | 6.16% | 0.71% |
| Service Class Shares | 5/2/2005 | 7.28 | 8.15 | 5.90 | 0.96 |
| 1. | The Portfolio’s equity subadvisor changed effective January 1, 2018, due to an organizational restructuring whereby all investment personnel of Cornerstone Capital Management Holdings LLC, the former subadvisor, transitioned to MacKay Shields LLC. The past performance in the graph and table prior to that date reflects the Portfolio’s prior subadvisor for the equity portion of the Portfolio. |
| 2. | Effective May 1, 2021, the Portfolio replaced the subadvisor to the equity portion of the Portfolio and modified the equity portion of the Portfolio's principal investment strategies. The past performance in the graph and table prior to that date reflects the Portfolio’s prior subadvisor and principal investment strategies for the equity portion of the Portfolio. |
| 3. | The gross expense ratios presented reflect the Portfolio’s “Total Annual Portfolio Operating Expenses” from the most recent Prospectus and may differ from other expense ratios disclosed in this report. |
The footnotes on the next page are an integral part of the table and graph and should be carefully read in conjunction with them.
| Benchmark Performance* | One
Year | Five
Years | Ten
Years |
| Russell 1000® Value Index1 | 11.46% | 10.91% | 8.40% |
| Bloomberg U.S. Intermediate Government/Credit Bond Index2 | 5.24 | 1.59 | 1.72 |
| Balanced Composite Index3 | 9.13 | 7.51 | 5.97 |
| Morningstar Moderate Allocation Category Average4 | 13.78 | 8.16 | 6.07 |
| * | Returns for indices reflect no deductions for fees, expenses or taxes, except for foreign withholding taxes where applicable. Results assume reinvestment of all dividends and capital gains. An investment cannot be made directly in an index. |
| 1. | The Portfolio has selected the Russell 1000® Value Index as its primary benchmark. The Russell 1000® Value Index measures the performance of the large-cap value segment of the U.S. equity universe. It includes those Russell 1000® Index companies with lower price-to-book ratios and lower expected growth values. |
| 2. | The Portfolio has selected the Bloomberg U.S. Intermediate Government/Credit Bond Index as a secondary benchmark. The Bloomberg U.S. Intermediate Government/Credit Bond Index measures the performance of U.S. dollar denominated U.S. treasuries, government related and investment grade U.S. corporate securities that have a remaining maturity of greater than one year and less than ten years. |
| 3. | The Portfolio has selected the Balanced Composite Index as an additional benchmark. The Balanced Composite Index consists of the Russell 1000® Value Index and the Bloomberg U.S. Intermediate Government/Credit Bond Index weighted 60%/40%, respectively. |
| 4. | The Morningstar Moderate Allocation Category Average is representative of funds in allocation categories that seek to provide both income and capital appreciation by primarily investing in multiple asset classes, including stocks, bonds, and cash. These moderate strategies seek to balance preservation of capital with appreciation. They typically expect volatility similar to a strategic equity exposure between 50% and 70%. Results are based on average total returns of similar funds with all dividends and capital gain distributions reinvested. |
The footnotes on the preceding page are an integral part of the table and graph and should be carefully read in conjunction with them.
| 6 | MainStay VP Balanced Portfolio |
Cost in Dollars of a $1,000 Investment in MainStay VP Balanced Portfolio (Unaudited)
The example below is intended to describe the fees and expenses borne by shareholders during the six-month period from July 1, 2023 to December 31, 2023, and the impact of those costs on your investment.
Example
As a shareholder of the Portfolio you incur two types of costs: (1) transaction costs, including exchange fees and sales charges (loads) on purchases (as applicable), and (2) ongoing costs, including management fees, distribution and/or service (12b-1) fees and other Portfolio expenses (as applicable). This example is intended to help you understand your ongoing costs (in dollars) of investing in the Portfolio and to compare these costs with the ongoing costs of investing in other mutual funds. The example is based on an investment of $1,000 made at the beginning of the six-month period and held for the entire period from July 1, 2023 to December 31, 2023. Shares are only sold in connection with variable life and annuity contracts and the example does not reflect any contract level or transactional fees or expenses. If these costs had been included, your costs would have been higher.
This example illustrates your Portfolio’s ongoing costs in two ways:
Actual Expenses
The second and third data columns in the table below provide information about actual account values and actual expenses. You may use the information in these columns, together with the amount you invested, to estimate the expenses that you paid during the six months ended
December 31, 2023. Simply divide your account value by $1,000 (for example, an $8,600 account value divided by $1,000 = 8.6), then multiply the result by the number under the heading entitled “Expenses Paid During Period” to estimate the expenses you paid on your account during this period.
Hypothetical Example for Comparison Purposes
The fourth and fifth data columns in the table below provide information about hypothetical account values and hypothetical expenses based on the Portfolio’s actual expense ratio and an assumed rate of return of 5% per year before expenses, which is not the Portfolio’s actual return. The hypothetical account values and expenses may not be used to estimate the actual ending account balances or expenses you paid for the six-month period shown. You may use this information to compare the ongoing costs of investing in the Portfolio with the ongoing costs of investing in other mutual funds. To do so, compare this 5% hypothetical example with the 5% hypothetical examples that appear in the shareholder reports of the other mutual funds.
Please note that the expenses shown in the table are meant to highlight your ongoing costs only and do not reflect any transactional costs, such as exchange fees or sales charges (loads). Therefore, the fourth and fifth data columns of the table are useful in comparing ongoing costs only and will not help you determine the relative total costs of owning different funds. In addition, if these transactional costs were included, your costs would have been higher.
| Share Class | Beginning
Account
Value
7/1/23 | Ending Account
Value (Based
on Actual
Returns and
Expenses)
12/31/23 | Expenses
Paid
During
Period1 | Ending Account
Value (Based
on Hypothetical
5% Annualized
Return and
Actual Expenses)
12/31/23 | Expenses
Paid
During
Period1 | Net Expense
Ratio
During
Period2 |
| Initial Class Shares | $1,000.00 | $1,056.70 | $3.58 | $1,021.73 | $3.52 | 0.69% |
| Service Class Shares | $1,000.00 | $1,055.30 | $4.87 | $1,020.47 | $4.79 | 0.94% |
| 1. | Expenses are equal to the Portfolio’s annualized expense ratio of each class multiplied by the average account value over the period, divided by 365 and multiplied by 184 (to reflect the six-month period). The table above represents the actual expenses incurred during the six-month period. In addition to the fees and expenses which the Portfolio bears directly, it also indirectly bears a pro rata share of the fees and expenses of the underlying funds in which it invests. Such indirect expenses are not included in the above-reported expense figures. |
| 2. | Expenses are equal to the Portfolio's annualized expense ratio to reflect the six-month period. |
Portfolio Composition as of December 31, 2023 (Unaudited)
See Portfolio of Investments beginning on page 12 for specific holdings within these categories. The Portfolio's holdings are subject to change.
Top Ten Holdings and/or Issuers Held as of December 31, 2023 (excluding short-term investments) (Unaudited)
| 1. | U.S. Treasury Notes, 2.50%-5.00%, due 5/15/24–11/15/33 |
| 2. | iShares Intermediate Government/Credit Bond ETF |
| 3. | JPMorgan Chase & Co. |
| 4. | iShares Russell 1000 Value ETF |
| 5. | Vanguard Russell 1000 Value |
| 6. | Johnson & Johnson |
| 7. | Merck & Co., Inc. |
| 8. | Cisco Systems, Inc. |
| 9. | PNC Financial Services Group, Inc. |
| 10. | Morgan Stanley |
| 8 | MainStay VP Balanced Portfolio |
Portfolio Management Discussion and Analysis (Unaudited)
Answers to the questions reflect the views of portfolio managers Jae S. Yoon, CFA, and Jonathan Swaney of New York Life Investment Management LLC, the Portfolio’s Manager; Kenneth Sommer and Matthew Downs of NYL Investors LLC, the Portfolio’s fixed-income Subadvisor; and Adam H. Illfelder, CFA, of Wellington Management Company LLP (“Wellington”), the Portfolio’s equity Subadvisor.
How did MainStay VP Balanced Portfolio perform relative to its benchmarks and peers during the 12 months ended December 31, 2023?
For the 12 months ended December 31, 2023, MainStay VP Balanced Portfolio returned 7.55% for Initial Class shares and 7.28% for Service Class shares. Over the same period, both share classes underperformed the 11.46% return of the Russell 1000® Value Index, which is the Portfolio’s primary benchmark, and outperformed the 5.24% return of the Bloomberg U.S. Intermediate Government/Credit Bond Index, which is a secondary benchmark of the Portfolio. For the 12 months ended December 31, 2023, both share classes underperformed the 9.13% return of the Balanced Composite Index, which is an additional benchmark of the Portfolio, and the 13.78% return of the Morningstar Moderate Allocation Category Average.1
Were there any changes to the Portfolio during the reporting period?
Effective June 30, 2023, AJ Rzad was removed as a portfolio manager of the Portfolio. Please see the supplement dated March 3, 2023, for more information.
What factors affected the relative performance of the equity portion of the Portfolio during the reporting period?
The equity portion of the Portfolio underperformed the Russell 1000® Value Index primarily due to security selection, driven by weak selection in the industrials, information technology and utilities sectors.
Which market segments were the strongest positive contributors to relative performance in the equity portion of the Portfolio, and which market segments detracted the most?
The energy sector made the strongest contribution to relative returns, due to positive stock selection and overweight sector exposure. (Contributions take weightings and total returns into account.) Financials and real estate were top positive contributors as well, as a result of strong security selection in both sectors. Conversely, the industrials sector detracted most from the Portfolio’s performance relative to the Russell 1000® Value Index, driven by unfavorable security selection and underweight sector exposure. Communication services and information technology also notably detracted from relative performance.
During the reporting period, which individual stocks made the strongest positive contributions to the Portfolio’s absolute performance and which stocks detracted the most?
The strongest positive contributors to the absolute performance of the equity portion of the Portfolio included holdings in technology conglomerate Alphabet, financial services company JPMorgan Chase and alternative investor manager Ares Management. Alphabet shares rose as consecutive quarterly earnings beat expectations. Revenue growth in the company’s cloud computing unit, stabilizing advertising demand, potential upside driven by artificial intelligence (“AI”) and cost management all contributed to the positive market sentiment. JPMorgan Chase shares gained ground as the company reported consecutive quarterly earnings beats, driven by healthy consumer spending, strong growth in loans and high interest rates. Shares of Ares Management climbed based on the company’s strong fundraising momentum and new capital commitments, as well as easing inflation.
The most significant detractors included pharmaceutical company Pfizer, utility and power generation company AES, and U.S.-based aerospace and defense conglomerate RTX (formerly known as Raytheon Technologies). Pfizer shares declined after the company reported mixed results for their obesity and diabetes drugs study. Soft demand for COVID-19 related products put further pressure on the company's shares. AES shares fell as utilities stocks were pressured by elevated interest rates. RTX shares lost ground after the company disclosed a manufacturing defect in some of its popular jet airliner engines, which led management to trim cash flow guidance for the year. We eliminated the Portfolio’s positions in AES and RTX.
Did the equity portion of the Portfolio make any significant purchases or sales during the reporting period?
Notable purchases during the reporting period included new positions in pharmaceutical company Johnson & Johnson and shipping and supply-chain management company United Parcel Services (“UPS”). The Portfolio initiated a position in Johnson & Johnson as we gained conviction in the three- to five-year growth outlook for the company’s pharmaceutical business, coupled with a positive, albeit modestly lower, growth rate in the medical technology segment. We also believed that Johnson & Johnson’s spinoff of Kenvue, the company’s former consumer health care
| 1. | See "Investment and Performance Comparison" for more information on benchmark and peer group returns. |
division, improves the growth profile of the remaining company. Meanwhile, management’s focus on settling the issue of talc liability could remove the overhang on the stock, supporting a rerate higher. The Portfolio initiated a position in UPS, reflecting our belief that the prevailing valuation overly discounted near-term earnings uncertainty. Once UPS digests year-one of its new union contracts and recoups the related market share loss over 2024, the company can use labor efficiency gains and potential network redesign to drive strong incremental margins in its domestic package business and realize earnings upside over the medium term.
Notable sales included eliminating the Portfolio’s position in U.S.-based pharmaceutical company Eli Lilly and Alphabet, described above, as both companies’ valuations moved to premium levels. We redeployed the capital where we saw more attractive risk/reward tradeoffs.
How did sector weightings in the equity portion of the Portfolio change during the reporting period?
The most notable increases in sector exposures relative to the Russell 1000® Value Index were to health care and financials. Notable reductions in relative sector exposure included information technology and industrials.
How was the equity portion of the Portfolio positioned at the end of the reporting period?
As of December 31, 2023, the equity portion of the Portfolio held its most overweight positions relative to the Russell 1000® Value Index in the health care, financials and information technology sectors. As of the same date, the Portfolio’s most significantly underweight equity positions were in materials, consumer staples and industrials.
What factors affected the relative performance of the fixed-income portion of the Portfolio during the reporting period?
The fixed-income portion of the Portfolio held overweight positions relative to the Bloomberg U.S. Intermediate Government/Credit Bond Index in asset-backed securities (“ABS”) and commercial mortgage-backed securities (“CMBS”) throughout the reporting period. To facilitate these overweight positions, the Portfolio
maintained an underweight position in the U.S. Treasury and government agency sectors.
The best performing sector during the reporting period was corporates. Within the corporate sector, overweight positioning in the banking, communications and electric subcomponents had the most positive impact on performance relative to the Index. Overweight positioning in the ABS sector was also accretive to relative performance. Within the floating-rate subcomponent of the ABS sector, overweight positions in AAA and AA collateralized loan obligations (CLO) were accretive to performance.2 Within the fixed-rate subcomponent of the ABS sector, specialty finance was the primary driver of outperformance.
The U.S. Treasury sector was the worst performing sector relative to the Index during the reporting period. Underweight positioning in the non-corporate sector, led by the taxable munis and sovereign subsectors, also detracted from relative performance.
During the reporting period, how was the performance of the fixed-income portion of the Portfolio materially affected by investments in derivatives?
The use of derivatives in the fixed income portion of the Portfolio was limited to interest rate derivatives used to keep the duration3 of the Portfolio in line with our target. These interest rate derivatives had a negative impact on performance during the reporting period.
What was the duration strategy of the fixed-income portion of the Portfolio during the reporting period?
During the reporting period, the fixed-income portion of the Portfolio maintained a duration relatively close to that of the Bloomberg U.S. Intermediate Government/Credit Bond Index. On two occasions, the duration of the Portfolio differed significantly from that of the Index. During the first half of the reporting period, the Portfolio held a shorter duration than the Index in the 2-year part of the yield curve4, while simultaneously holding a longer duration than the Index in the 10-year part of the curve. This strategy had a slightly negative impact on performance. In the second half of the reporting period, the Portfolio held a longer duration in the 5-year part of the curve relative to the Index. This strategy also had a negative impact on performance. As of
| 2. | An obligation rated ‘AAA’ has the highest rating assigned by Standard & Poor’s (“S&P”), and in the opinion of S&P, the obligor’s capacity to meet its financial commitment on the obligation is extremely strong. An obligation rated ‘AA’ by S&P is deemed by S&P to differ from the highest-rated obligations only to a small degree. In the opinion of S&P, the obligor's capacity to meet its financial commitment on the obligation is very strong. When applied to Fund holdings, ratings are based solely on the creditworthiness of the bonds in the portfolio and are not meant to represent the security or safety of the Fund. |
| 3. | Duration is a measure of the price sensitivity of a fixed-income investment to changes in interest rates. Duration is expressed as a number of years and is considered a more accurate sensitivity gauge than average maturity. |
| 4. | The yield curve is a line that plots the yields of various securities of similar quality—typically U.S. Treasury issues—across a range of maturities. The U.S. Treasury yield curve serves as a benchmark for other debt and is used in economic forecasting. |
| 10 | MainStay VP Balanced Portfolio |
December 31, 2023, the effective duration of the Portfolio was 3.83 years compared to a duration of 3.81 years for the Index.
During the reporting period, which market segments made the strongest positive contributions to the absolute performance of the fixed-income portion of the Portfolio and which market segments were particularly weak?
The corporate sector made the strongest contribution to the absolute performance of the fixed-income portion of the Portfolio. (Contributions take weightings and total returns into account.) Within the sector, the financial subcomponent was the most accretive to absolute performance. The second largest contributor to absolute performance was the U.S. Treasury sector. Within the ABS sector, the Portfolio’s allocation to AAA and AA CLOs was also accretive to absolute performance.
The mortgage-backed securities (“MBS”) sector was the worst performing sector during the reporting period, followed by CMBS and government agencies.
Within the interest rate complex, the Portfolio’s yield curve positioning was accretive to absolute performance, while the Portfolio’s duration positioning detracted.
Among individual issues, those producing the strongest absolute performance during the reporting period were issued by Bank of America, PG&E, Citigroup, UBS Group and Wells Fargo. The bonds with the weakest absolute performance were issued by Alexandria Real Estate Equities, ING Groep, Swedbank, National Australia Bank and Nissan Motor.
Did the fixed-income portion of the Portfolio make any significant purchases or sales during the reporting period?
The largest purchases made by the fixed-income portion of the Portfolio during the reporting period included bonds issued by financial institutions Barclays, U.S. Bancorp, Bank of America, Credit Suisse (New York branch) and PNC Financial Services Group.
The Portfolio’s most significant sales during the same period were bonds issued by software firm Oracle, midstream oil & gas company ONEOK, consumer electronic company Apple, financial company Nordea Bank, and electric utility Virginia Electric and Power.
During the reporting period, how did sector weightings change in the fixed-income portion of the Portfolio?
We increased the fixed-income portion of the Portfolio’s exposure to AAA CLOs during the first quarter of the reporting period, based on our expectation that the U.S. Federal Reserve would continue raising interest rates, and due to the floating-rate nature of the securities. In addition, the option-adjusted spread5 (“OAS”) being offered on AAA CLOs was close to the highest level in two years.
During the second quarter of 2023, we increased the Portfolio’s corporate credit allocation, as fallout from the regional banking crisis put upward pressure on credit spreads,6 ultimately offering more relative value opportunities across the sector. The increase in credit exposure was primarily focused within the financial sector.
In the middle of the reporting period, we increased the Portfolio’s allocation to AAA non-agency mortgages, seeing value versus competing 2–3–year duration assets, with OAS close to 200 basis points over matched-duration U.S. Treasury securities. (A basis point is one one-hundredth of a percentage point.)
We decreased the Portfolio’s corporate credit allocation in the third quarter of 2023, as fears surrounding negative impacts from the regional banking crisis in March subsided, resulting in tighter corporate credit spreads. The decrease in credit exposure was primarily focused within the financial sector.
How was the fixed-income portion of the Portfolio positioned at the end of the reporting period?
As of December 31, 2023, the fixed-income portion of the Portfolio held overweight exposure relative to the Bloomberg U.S. Intermediate Government/Credit Bond Index in corporates, ABS, CMBS and MBS. The largest overweight allocation among spread assets was to the ABS sector. As of the same date, the Portfolio held relatively underweight positions in the U.S. Treasury and government agency sectors.
| 5. | An option-adjusted spread is the measurement of the spread of a fixed-income security rate and the risk-free rate of return, which is then adjusted to take into account an embedded option. |
| 6. | The terms “spread” and “yield spread” may refer to the difference in yield between a security or type of security and comparable U.S. Treasury issues. The terms may also refer to the difference in yield between two specific securities or types of securities at a given time. |
The opinions expressed are those of the portfolio managers as of the date of this report and are subject to change. There is no guarantee that any forecasts will come to pass. This material does not constitute investment advice and is not intended as an endorsement of any specific investment.
Not all MainStay VP Portfolios and/or share classes are available under all policies.
Portfolio of Investments December 31, 2023†^
| | Principal
Amount | Value |
| Long-Term Bonds 33.3% |
| Asset-Backed Securities 1.1% |
| Other Asset-Backed Securities 1.1% |
| Apidos CLO XXX | |
| Series XXXA, Class A2 | | |
| 7.257% (3 Month SOFR + 1.862%), due 10/18/31 (a)(b) | $ 650,000 | $ 648,200 |
| ARES XXXVIII CLO Ltd. | |
| Series 2015-38A, Class BR | | |
| 7.077% (3 Month SOFR + 1.662%), due 4/20/30 (a)(b) | 400,000 | 396,898 |
| Ballyrock CLO 23 Ltd. | |
| Series 2023-23A, Class A1 | | |
| 7.358% (3 Month SOFR + 1.98%), due 4/25/36 (a)(b) | 600,000 | 603,288 |
| Benefit Street Partners CLO XXX Ltd. | |
| Series 2023-30A, Class A | | |
| 7.478% (3 Month SOFR + 2.10%), due 4/25/36 (a)(b) | 600,000 | 603,019 |
| Carlyle Global Market Strategies CLO Ltd. | |
| Series 2013-3A, Class A2R | | |
| 7.055% (3 Month SOFR + 1.662%), due 10/15/30 (a)(b) | 800,000 | 791,519 |
| Palmer Square CLO Ltd. | |
| Series 2015-2A, Class A2R2 | | |
| 7.227% (3 Month SOFR + 1.812%), due 7/20/30 (a)(b) | 750,000 | 749,950 |
| Store Master Funding I-VII XIV XIX XX | |
| Series 2021-1A, Class A1 | | |
| 2.12%, due 6/20/51 (a) | 240,703 | 203,404 |
Total Asset-Backed Securities
(Cost $4,036,651) | | 3,996,278 |
| Corporate Bonds 12.7% |
| Aerospace & Defense 0.1% |
| Boeing Co. (The) | | |
| 5.15%, due 5/1/30 | 230,000 | 234,142 |
| 5.805%, due 5/1/50 | 95,000 | 98,377 |
| HEICO Corp. | | |
| 5.35%, due 8/1/33 | 170,000 | 174,039 |
| | | 506,558 |
| Auto Manufacturers 0.4% |
| Ford Motor Co. | | |
| 3.25%, due 2/12/32 | 175,000 | 145,548 |
| Ford Motor Credit Co. LLC | | |
| 4.542%, due 8/1/26 | 355,000 | 343,750 |
| | Principal
Amount | Value |
| |
| Auto Manufacturers (continued) |
| General Motors Financial Co., Inc. | | |
| 6.05%, due 10/10/25 | $ 505,000 | $ 510,749 |
| Hyundai Capital America | | |
| 5.68%, due 6/26/28 (a) | 460,000 | 468,860 |
| | | 1,468,907 |
| Auto Parts & Equipment 0.1% |
| Aptiv plc | | |
| 3.25%, due 3/1/32 | 260,000 | 229,683 |
| Banks 5.1% |
| ABN AMRO Bank NV | | |
| 6.339% (1 Year Treasury Constant Maturity Rate + 1.65%), due 9/18/27 (a)(b) | 315,000 | 321,874 |
| Bank of America Corp. (c) | | |
| 1.734%, due 7/22/27 | 845,000 | 774,148 |
| 1.922%, due 10/24/31 | 205,000 | 166,429 |
| 2.087%, due 6/14/29 | 675,000 | 594,890 |
| 5.202%, due 4/25/29 | 530,000 | 533,279 |
| Bank of New York Mellon Corp. (The) | | |
| 6.474%, due 10/25/34 (c) | 140,000 | 155,076 |
| Barclays plc | | |
| 5.829%, due 5/9/27 (c) | 780,000 | 786,975 |
| 7.385% (1 Year Treasury Constant Maturity Rate + 3.30%), due 11/2/28 (b) | 325,000 | 347,317 |
| Citigroup, Inc. (c) | | |
| 2.014%, due 1/25/26 | 733,000 | 704,349 |
| 5.61%, due 9/29/26 | 885,000 | 891,447 |
| 6.174%, due 5/25/34 | 325,000 | 336,302 |
| Citizens Bank NA | | |
| 6.064%, due 10/24/25 (c) | 320,000 | 312,182 |
| Credit Suisse AG | | |
| 7.95%, due 1/9/25 | 805,000 | 822,727 |
| Danske Bank A/S | | |
| 6.466% (1 Year Treasury Constant Maturity Rate + 2.10%), due 1/9/26 (a)(b) | 690,000 | 694,892 |
| Deutsche Bank AG | | |
| 7.079%, due 2/10/34 (c) | 210,000 | 215,953 |
| Fifth Third Bancorp | | |
| 6.361%, due 10/27/28 (c) | 315,000 | 326,842 |
| Goldman Sachs Group, Inc. (The) | | |
| 5.70%, due 11/1/24 | 710,000 | 711,693 |
| HSBC Holdings plc (c) | | |
| 6.547%, due 6/20/34 | 260,000 | 271,736 |
| 7.39%, due 11/3/28 | 395,000 | 423,257 |
The notes to the financial statements are an integral part of, and should be read in conjunction with, the financial statements.
| 12 | MainStay VP Balanced Portfolio |
| | Principal
Amount | Value |
| Corporate Bonds (continued) |
| Banks (continued) |
| Huntington National Bank (The) | | |
| 5.65%, due 1/10/30 | $ 455,000 | $ 458,830 |
| JPMorgan Chase & Co. (c) | | |
| 1.578%, due 4/22/27 | 790,000 | 729,031 |
| 4.565%, due 6/14/30 | 440,000 | 430,567 |
| 5.546%, due 12/15/25 | 595,000 | 595,379 |
| Mitsubishi UFJ Financial Group, Inc. | | |
| 5.406% (1 Year Treasury Constant Maturity Rate + 1.97%), due 4/19/34 (b)(d) | 200,000 | 207,129 |
| Morgan Stanley (c) | | |
| 4.679%, due 7/17/26 | 1,150,000 | 1,138,963 |
| 5.123%, due 2/1/29 | 120,000 | 120,546 |
| 6.296%, due 10/18/28 | 140,000 | 146,655 |
| Morgan Stanley Bank NA | | |
| 4.754%, due 4/21/26 | 340,000 | 339,771 |
| National Securities Clearing Corp. | | |
| 5.00%, due 5/30/28 (a) | 300,000 | 305,620 |
| PNC Financial Services Group, Inc. (The) (c) | | |
| 5.812%, due 6/12/26 | 330,000 | 331,980 |
| 6.615%, due 10/20/27 | 430,000 | 446,048 |
| 6.875%, due 10/20/34 | 320,000 | 355,244 |
| Royal Bank of Canada | | |
| 5.66%, due 10/25/24 (d) | 625,000 | 626,430 |
| Truist Financial Corp. | | |
| 5.122%, due 1/26/34 (c) | 130,000 | 125,879 |
| U.S. Bancorp (c) | | |
| 4.653%, due 2/1/29 (d) | 290,000 | 285,432 |
| 5.775%, due 6/12/29 | 395,000 | 405,805 |
| 6.787%, due 10/26/27 | 305,000 | 318,440 |
| UBS Group AG (a) | | |
| 6.327% (1 Year Treasury Constant Maturity Rate + 1.60%), due 12/22/27 (b) | 440,000 | 453,484 |
| 6.442%, due 8/11/28 (c) | 440,000 | 456,939 |
| Wells Fargo & Co. (c) | | |
| 5.389%, due 4/24/34 | 340,000 | 341,477 |
| 6.303%, due 10/23/29 | 495,000 | 521,691 |
| | | 18,532,708 |
| Beverages 0.1% |
| Constellation Brands, Inc. | | |
| 4.90%, due 5/1/33 | 270,000 | 271,629 |
| Keurig Dr Pepper, Inc. | | |
| 4.05%, due 4/15/32 | 90,000 | 86,606 |
| | | 358,235 |
| | Principal
Amount | Value |
| |
| Biotechnology 0.3% |
| Amgen, Inc. | | |
| 4.05%, due 8/18/29 | $ 500,000 | $ 489,500 |
| 5.15%, due 3/2/28 | 250,000 | 255,938 |
| 5.25%, due 3/2/30 | 165,000 | 169,619 |
| | | 915,057 |
| Chemicals 0.3% |
| Celanese US Holdings LLC | | |
| 6.33%, due 7/15/29 | 335,000 | 351,171 |
| 6.55%, due 11/15/30 | 185,000 | 195,569 |
| RPM International, Inc. | | |
| 2.95%, due 1/15/32 | 450,000 | 379,217 |
| | | 925,957 |
| Commercial Services 0.1% |
| Global Payments, Inc. | | |
| 2.15%, due 1/15/27 | 325,000 | 299,194 |
| Computers 0.0% ‡ |
| Dell International LLC | | |
| 5.75%, due 2/1/33 (d) | 120,000 | 126,420 |
| Diversified Financial Services 0.7% |
| Air Lease Corp. | | |
| 0.70%, due 2/15/24 | 550,000 | 546,581 |
| American Express Co. | | |
| 6.489%, due 10/30/31 (c) | 305,000 | 330,762 |
| Ares Management Corp. | | |
| 6.375%, due 11/10/28 | 335,000 | 351,169 |
| Blackstone Holdings Finance Co. LLC | | |
| 5.90%, due 11/3/27 (a)(d) | 500,000 | 518,747 |
| Charles Schwab Corp. (The) | | |
| 6.196%, due 11/17/29 (c) | 370,000 | 388,000 |
| Intercontinental Exchange, Inc. | | |
| 4.35%, due 6/15/29 | 590,000 | 588,090 |
| | | 2,723,349 |
| Electric 1.5% |
| AEP Texas, Inc. | | |
| 4.70%, due 5/15/32 | 45,000 | 43,946 |
| American Electric Power Co., Inc. | | |
| 5.625%, due 3/1/33 | 175,000 | 182,313 |
| Appalachian Power Co. | | |
| Series BB | | |
| 4.50%, due 8/1/32 | 35,000 | 33,689 |
| Arizona Public Service Co. | | |
| 5.55%, due 8/1/33 | 330,000 | 340,974 |
The notes to the financial statements are an integral part of, and should be read in conjunction with, the financial statements.
13
Portfolio of Investments December 31, 2023†^ (continued)
| | Principal
Amount | Value |
| Corporate Bonds (continued) |
| Electric (continued) |
| Commonwealth Edison Co. | | |
| 3.10%, due 11/1/24 | $ 250,000 | $ 245,470 |
| Duke Energy Carolinas LLC | | |
| 4.95%, due 1/15/33 | 170,000 | 173,148 |
| Duke Energy Corp. | | |
| 2.45%, due 6/1/30 | 195,000 | 169,997 |
| 4.50%, due 8/15/32 | 130,000 | 125,834 |
| Duke Energy Ohio, Inc. | | |
| 5.25%, due 4/1/33 | 60,000 | 61,812 |
| Enel Finance America LLC | | |
| 7.10%, due 10/14/27 (a) | 200,000 | 213,422 |
| Entergy Arkansas LLC | | |
| 5.15%, due 1/15/33 | 180,000 | 183,499 |
| Florida Power & Light Co. | | |
| 5.05%, due 4/1/28 | 520,000 | 531,521 |
| Georgia Power Co. | | |
| 4.65%, due 5/16/28 | 605,000 | 609,625 |
| National Rural Utilities Cooperative Finance Corp. | | |
| 5.05%, due 9/15/28 | 260,000 | 266,747 |
| NextEra Energy Capital Holdings, Inc. | | |
| 6.051%, due 3/1/25 | 230,000 | 232,048 |
| Pacific Gas and Electric Co. | | |
| 5.45%, due 6/15/27 | 320,000 | 322,578 |
| 6.10%, due 1/15/29 | 190,000 | 196,612 |
| 6.15%, due 1/15/33 | 365,000 | 378,310 |
| 6.40%, due 6/15/33 | 90,000 | 94,700 |
| PECO Energy Co. | | |
| 4.90%, due 6/15/33 | 245,000 | 249,074 |
| Southern California Edison Co. | | |
| 5.30%, due 3/1/28 | 310,000 | 318,164 |
| 5.95%, due 11/1/32 | 145,000 | 155,777 |
| Southern Co. (The) | | |
| 5.15%, due 10/6/25 | 190,000 | 190,406 |
| 5.70%, due 10/15/32 | 90,000 | 94,481 |
| | | 5,414,147 |
| Entertainment 0.1% |
| Warnermedia Holdings, Inc. | | |
| 4.054%, due 3/15/29 | 192,000 | 182,168 |
| Environmental Control 0.1% |
| Waste Connections, Inc. | | |
| 2.60%, due 2/1/30 | 380,000 | 340,924 |
| | Principal
Amount | Value |
| |
| Food 0.0% ‡ |
| Kraft Heinz Foods Co. | | |
| 3.75%, due 4/1/30 | $ 105,000 | $ 100,321 |
| Gas 0.1% |
| CenterPoint Energy Resources Corp. | | |
| 1.75%, due 10/1/30 (d) | 420,000 | 348,717 |
| Southwest Gas Corp. | | |
| 5.45%, due 3/23/28 | 180,000 | 183,984 |
| | | 532,701 |
| Healthcare-Products 0.1% |
| Baxter International, Inc. | | |
| 3.95%, due 4/1/30 | 480,000 | 454,613 |
| Healthcare-Services 0.1% |
| HCA, Inc. | | |
| 3.625%, due 3/15/32 | 420,000 | 375,553 |
| Insurance 0.2% |
| Corebridge Financial, Inc. | | |
| 3.85%, due 4/5/29 | 275,000 | 259,133 |
| RGA Global Funding | | |
| 6.00%, due 11/21/28 (a) | 555,000 | 575,431 |
| | | 834,564 |
| Internet 0.2% |
| Amazon.com, Inc. | | |
| 2.10%, due 5/12/31 | 355,000 | 306,120 |
| Meta Platforms, Inc. | | |
| 3.85%, due 8/15/32 | 365,000 | 347,166 |
| | | 653,286 |
| Investment Companies 0.1% |
| Blackstone Private Credit Fund | | |
| 7.05%, due 9/29/25 | 350,000 | 356,188 |
| Media 0.2% |
| Charter Communications Operating LLC | | |
| 2.80%, due 4/1/31 | 165,000 | 139,171 |
| Paramount Global | | |
| 4.20%, due 5/19/32 | 490,000 | 437,327 |
| | | 576,498 |
| Miscellaneous—Manufacturing 0.0% ‡ |
| 3M Co. | | |
| 3.05%, due 4/15/30 | 169,000 | 152,323 |
The notes to the financial statements are an integral part of, and should be read in conjunction with, the financial statements.
| 14 | MainStay VP Balanced Portfolio |
| | Principal
Amount | Value |
| Corporate Bonds (continued) |
| Oil & Gas 0.1% |
| Phillips 66 Co. | | |
| 3.15%, due 12/15/29 | $ 455,000 | $ 416,221 |
| Pharmaceuticals 0.2% |
| AbbVie, Inc. | | |
| 2.95%, due 11/21/26 (d) | 190,000 | 182,191 |
| CVS Health Corp. | | |
| 3.75%, due 4/1/30 | 140,000 | 131,698 |
| 5.30%, due 6/1/33 | 55,000 | 56,442 |
| Merck & Co., Inc. | | |
| 2.15%, due 12/10/31 | 385,000 | 328,693 |
| Pfizer Investment Enterprises Pte. Ltd. | | |
| 4.75%, due 5/19/33 | 175,000 | 175,393 |
| | | 874,417 |
| Pipelines 0.4% |
| Columbia Pipelines Operating Co. LLC | | |
| 5.927%, due 8/15/30 (a) | 215,000 | 222,313 |
| Energy Transfer LP | | |
| 3.75%, due 5/15/30 | 150,000 | 139,294 |
| 5.75%, due 2/15/33 | 165,000 | 170,111 |
| Enterprise Products Operating LLC | | |
| 5.35%, due 1/31/33 | 350,000 | 366,297 |
| MPLX LP | | |
| 4.95%, due 9/1/32 | 82,000 | 80,236 |
| Targa Resources Partners LP | | |
| 5.50%, due 3/1/30 | 595,000 | 594,893 |
| | | 1,573,144 |
| Real Estate Investment Trusts 0.4% |
| American Tower Corp. | | |
| 2.10%, due 6/15/30 | 515,000 | 431,988 |
| CubeSmart LP | | |
| 2.25%, due 12/15/28 (d) | 290,000 | 256,073 |
| Simon Property Group LP | | |
| 1.75%, due 2/1/28 | 375,000 | 336,982 |
| Sun Communities Operating LP | | |
| 2.70%, due 7/15/31 (d) | 345,000 | 287,472 |
| | | 1,312,515 |
| Retail 0.3% |
| AutoZone, Inc. | | |
| 5.20%, due 8/1/33 | 330,000 | 335,868 |
| Home Depot, Inc. (The) | | |
| 1.875%, due 9/15/31 | 310,000 | 259,345 |
| Lowe's Cos., Inc. | | |
| 4.80%, due 4/1/26 | 245,000 | 245,157 |
| | Principal
Amount | Value |
| |
| Retail (continued) |
| Lowe's Cos., Inc. (continued) | | |
| 5.00%, due 4/15/33 | $ 170,000 | $ 173,617 |
| 5.15%, due 7/1/33 | 85,000 | 87,334 |
| | | 1,101,321 |
| Semiconductors 0.4% |
| Broadcom, Inc. | | |
| 2.45%, due 2/15/31 (a) | 315,000 | 269,345 |
| Intel Corp. | | |
| 5.125%, due 2/10/30 | 235,000 | 243,715 |
| 5.20%, due 2/10/33 | 170,000 | 177,595 |
| Micron Technology, Inc. | | |
| 5.375%, due 4/15/28 | 310,000 | 315,457 |
| 5.875%, due 9/15/33 | 170,000 | 176,814 |
| QUALCOMM, Inc. | | |
| 2.15%, due 5/20/30 | 410,000 | 361,214 |
| | | 1,544,140 |
| Software 0.2% |
| Microsoft Corp. | | |
| 2.525%, due 6/1/50 | 180,000 | 122,881 |
| Oracle Corp. | | |
| 4.50%, due 5/6/28 | 180,000 | 179,978 |
| 4.90%, due 2/6/33 | 225,000 | 223,976 |
| 6.15%, due 11/9/29 | 160,000 | 172,121 |
| | | 698,956 |
| Telecommunications 0.6% |
| AT&T, Inc. | | |
| 4.35%, due 3/1/29 (d) | 775,000 | 764,854 |
| 5.40%, due 2/15/34 | 40,000 | 41,253 |
| T-Mobile USA, Inc. | | |
| 2.625%, due 4/15/26 (d) | 545,000 | 518,369 |
| 2.625%, due 2/15/29 | 130,000 | 117,036 |
| 5.75%, due 1/15/34 (d) | 320,000 | 339,406 |
| Verizon Communications, Inc. | | |
| 2.10%, due 3/22/28 | 300,000 | 271,381 |
| 3.376%, due 2/15/25 | 6,000 | 5,887 |
| 4.016%, due 12/3/29 | 2,000 | 1,934 |
| | | 2,060,120 |
| Transportation 0.1% |
| Norfolk Southern Corp. | | |
| 3.00%, due 3/15/32 | 200,000 | 177,826 |
| Union Pacific Corp. | | |
| 2.80%, due 2/14/32 (d) | 200,000 | 177,432 |
| United Parcel Service, Inc. | | |
| 4.45%, due 4/1/30 | 180,000 | 181,727 |
| | | 536,985 |
The notes to the financial statements are an integral part of, and should be read in conjunction with, the financial statements.
15
Portfolio of Investments December 31, 2023†^ (continued)
| | Principal
Amount | Value |
| Corporate Bonds (continued) |
| Trucking & Leasing 0.1% |
| Penske Truck Leasing Co. LP (a) | | |
| 5.75%, due 5/24/26 | $ 190,000 | $ 191,505 |
| 6.05%, due 8/1/28 | 130,000 | 134,743 |
| | | 326,248 |
Total Corporate Bonds
(Cost $45,920,880) | | 46,503,421 |
| Mortgage-Backed Securities 0.4% |
| Agency (Collateralized Mortgage Obligation) 0.1% |
| FNMA | |
| REMIC, Series 2021-3, Class TI | | |
| 2.50%, due 2/25/51 (e) | 2,141,183 | 344,139 |
| Commercial Mortgage Loans (Collateralized Mortgage Obligation) 0.1% |
| Citigroup Commercial Mortgage Trust | |
| Series 2020-GC46, Class A5 | | |
| 2.717%, due 2/15/53 | 500,000 | 431,087 |
| Whole Loan (Collateralized Mortgage Obligation) 0.2% |
| BRAVO Residential Funding Trust | |
| Series 2023-NQM8, Class A1 | | |
| 6.394%, due 10/25/63 (a)(f) | 500,000 | 503,157 |
Total Mortgage-Backed Securities
(Cost $1,359,202) | | 1,278,383 |
| U.S. Government & Federal Agencies 19.1% |
| United States Treasury Bonds 0.2% |
| U.S. Treasury Bonds | | |
| 4.375%, due 8/15/43 | 400,000 | 408,313 |
| 4.75%, due 11/15/53 | 200,000 | 224,281 |
| | | 632,594 |
| United States Treasury Notes 18.9% |
| U.S. Treasury Notes | | |
| 2.50%, due 5/15/24 | 5,800,000 | 5,743,359 |
| 4.375%, due 11/30/28 | 10,150,000 | 10,386,305 |
| 4.375%, due 11/30/30 | 13,150,000 | 13,521,898 |
| 4.50%, due 11/15/33 | 4,025,000 | 4,225,621 |
| | Principal
Amount | Value |
| |
| United States Treasury Notes (continued) |
| U.S. Treasury Notes (continued) | | |
| 4.625%, due 11/15/26 (d) | $ 15,550,000 | $ 15,795,399 |
| 5.00%, due 10/31/25 | 19,200,000 | 19,419,001 |
| | | 69,091,583 |
Total U.S. Government & Federal Agencies
(Cost $68,496,923) | | 69,724,177 |
Total Long-Term Bonds
(Cost $119,813,656) | | 121,502,259 |
| |
| | Shares | |
| |
| Common Stocks 55.6% |
| Aerospace & Defense 1.7% |
| General Dynamics Corp. | 11,725 | 3,044,631 |
| L3Harris Technologies, Inc. | 15,516 | 3,267,980 |
| | | 6,312,611 |
| Air Freight & Logistics 0.9% |
| United Parcel Service, Inc., Class B | 21,518 | 3,383,275 |
| Automobile Components 0.8% |
| Gentex Corp. | 94,949 | 3,101,034 |
| Banks 5.2% |
| JPMorgan Chase & Co. | 47,007 | 7,995,891 |
| M&T Bank Corp. | 28,575 | 3,917,061 |
| New York Community Bancorp, Inc. | 293,839 | 3,005,973 |
| PNC Financial Services Group, Inc. (The) | 25,378 | 3,929,783 |
| | | 18,848,708 |
| Beverages 1.4% |
| Keurig Dr Pepper, Inc. | 83,507 | 2,782,453 |
| Pernod Ricard SA, Sponsored ADR | 62,982 | 2,223,265 |
| | | 5,005,718 |
| Biotechnology 0.9% |
| Gilead Sciences, Inc. | 38,549 | 3,122,855 |
| Building Products 1.4% |
| Fortune Brands Innovations, Inc. | 28,533 | 2,172,503 |
| Johnson Controls International plc | 54,021 | 3,113,770 |
| | | 5,286,273 |
| Capital Markets 4.6% |
| Ares Management Corp. | 24,464 | 2,909,259 |
| Intercontinental Exchange, Inc. | 24,175 | 3,104,795 |
The notes to the financial statements are an integral part of, and should be read in conjunction with, the financial statements.
| 16 | MainStay VP Balanced Portfolio |
| | Shares | Value |
| Common Stocks (continued) |
| Capital Markets (continued) |
| KKR & Co., Inc. | 24,408 | $ 2,022,203 |
| LPL Financial Holdings, Inc. | 9,773 | 2,224,530 |
| Morgan Stanley | 35,533 | 3,313,452 |
| Raymond James Financial, Inc. | 29,393 | 3,277,320 |
| | | 16,851,559 |
| Chemicals 0.7% |
| Axalta Coating Systems Ltd. (g) | 71,193 | 2,418,426 |
| Communications Equipment 2.3% |
| Cisco Systems, Inc. | 103,847 | 5,246,350 |
| F5, Inc. (g) | 17,854 | 3,195,509 |
| | | 8,441,859 |
| Containers & Packaging 0.5% |
| Sealed Air Corp. | 49,027 | 1,790,466 |
| Distributors 0.8% |
| LKQ Corp. | 60,154 | 2,874,760 |
| Diversified Consumer Services 0.9% |
| H&R Block, Inc. | 65,199 | 3,153,676 |
| Electric Utilities 0.6% |
| Exelon Corp. | 63,889 | 2,293,615 |
| Electrical Equipment 0.9% |
| Emerson Electric Co. | 35,139 | 3,420,079 |
| Electronic Equipment, Instruments & Components 0.9% |
| Corning, Inc. | 101,934 | 3,103,890 |
| Entertainment 0.8% |
| Electronic Arts, Inc. | 21,903 | 2,996,549 |
| Financial Services 0.6% |
| Global Payments, Inc. | 18,302 | 2,324,354 |
| Food Products 0.8% |
| Archer-Daniels-Midland Co. | 38,295 | 2,765,665 |
| Gas Utilities 0.8% |
| Atmos Energy Corp. | 23,940 | 2,774,646 |
| | Shares | Value |
| |
| Ground Transportation 0.7% |
| Knight-Swift Transportation Holdings, Inc. | 43,116 | $ 2,485,637 |
| Health Care Equipment & Supplies 0.8% |
| Boston Scientific Corp. (g) | 50,073 | 2,894,720 |
| Health Care Providers & Services 3.1% |
| Centene Corp. (g) | 49,410 | 3,666,716 |
| Elevance Health, Inc. | 8,304 | 3,915,834 |
| UnitedHealth Group, Inc. | 6,756 | 3,556,832 |
| | | 11,139,382 |
| Hotel & Resort REITs 0.8% |
| Host Hotels & Resorts, Inc. | 145,269 | 2,828,387 |
| Household Durables 0.7% |
| Lennar Corp., Class A | 16,082 | 2,396,861 |
| Insurance 3.0% |
| American International Group, Inc. | 53,706 | 3,638,581 |
| Chubb Ltd. | 16,201 | 3,661,426 |
| MetLife, Inc. | 55,027 | 3,638,936 |
| | | 10,938,943 |
| Interactive Media & Services 0.6% |
| Alphabet, Inc., Class C (g) | 16,645 | 2,345,780 |
| IT Services 0.6% |
| Amdocs Ltd. | 26,813 | 2,356,595 |
| Machinery 0.7% |
| Middleby Corp. (The) (g) | 16,866 | 2,482,169 |
| Media 0.7% |
| Omnicom Group, Inc. | 31,102 | 2,690,634 |
| Multi-Utilities 0.8% |
| Sempra | 40,230 | 3,006,388 |
| Oil, Gas & Consumable Fuels 4.4% |
| ConocoPhillips | 36,729 | 4,263,135 |
| Coterra Energy, Inc. | 106,559 | 2,719,386 |
| Diamondback Energy, Inc. | 17,646 | 2,736,542 |
| EOG Resources, Inc. | 23,711 | 2,867,845 |
The notes to the financial statements are an integral part of, and should be read in conjunction with, the financial statements.
17
Portfolio of Investments December 31, 2023†^ (continued)
| | Shares | Value |
| Common Stocks (continued) |
| Oil, Gas & Consumable Fuels (continued) |
| Phillips 66 | 26,324 | $ 3,504,777 |
| | | 16,091,685 |
| Personal Care Products 0.7% |
| Unilever plc, Sponsored ADR | 52,558 | 2,548,012 |
| Pharmaceuticals 5.6% |
| AstraZeneca plc, Sponsored ADR | 37,324 | 2,513,771 |
| Johnson & Johnson | 38,640 | 6,056,434 |
| Merck & Co., Inc. | 49,465 | 5,392,674 |
| Pfizer, Inc. | 162,959 | 4,691,590 |
| Roche Holding AG | 6,727 | 1,955,593 |
| | | 20,610,062 |
| Real Estate Management & Development 0.8% |
| CBRE Group, Inc., Class A (g) | 31,187 | 2,903,198 |
| Semiconductors & Semiconductor Equipment 2.2% |
| Analog Devices, Inc. | 15,151 | 3,008,383 |
| NXP Semiconductors NV | 11,972 | 2,749,729 |
| QUALCOMM, Inc. | 16,697 | 2,414,887 |
| | | 8,172,999 |
| Specialized REITs 1.5% |
| Crown Castle, Inc. | 21,509 | 2,477,622 |
| Gaming and Leisure Properties, Inc. | 62,162 | 3,067,694 |
| | | 5,545,316 |
| Specialty Retail 0.4% |
| Victoria's Secret & Co. (g) | 59,556 | 1,580,616 |
Total Common Stocks
(Cost $178,699,246) | | 203,287,402 |
| Exchange-Traded Funds 9.1% |
| iShares Intermediate Government/Credit Bond ETF | 148,659 | 15,573,517 |
| iShares Russell 1000 Value ETF | 52,164 | 8,620,101 |
| Vanguard Intermediate-Term Treasury ETF (d) | 31,315 | 1,857,606 |
| Vanguard Russell 1000 Value | 97,602 | 7,080,049 |
Total Exchange-Traded Funds
(Cost $30,819,363) | | 33,131,273 |
| | Shares | | Value |
| Short-Term Investments 1.3% |
| Affiliated Investment Company 0.4% |
| MainStay U.S. Government Liquidity Fund, 5.235% (h) | 1,725,011 | | $ 1,725,011 |
| Unaffiliated Investment Companies 0.9% |
| Goldman Sachs Financial Square Government Fund, 5.351% (h)(i) | 400,000 | | 400,000 |
| Invesco Government & Agency Portfolio, 5.361% (h)(i) | 2,801,857 | | 2,801,857 |
| | | | 3,201,857 |
Total Short-Term Investments
(Cost $4,926,868) | | | 4,926,868 |
Total Investments
(Cost $334,259,133) | 99.3% | | 362,847,802 |
| Other Assets, Less Liabilities | 0.7 | | 2,462,724 |
| Net Assets | 100.0% | | $ 365,310,526 |
| † | Percentages indicated are based on Portfolio net assets. |
| ^ | Industry classifications may be different than those used for compliance monitoring purposes. |
| ‡ | Less than one-tenth of a percent. |
| (a) | May be sold to institutional investors only under Rule 144A or securities offered pursuant to Section 4(a)(2) of the Securities Act of 1933, as amended. |
| (b) | Floating rate—Rate shown was the rate in effect as of December 31, 2023. |
| (c) | Fixed to floating rate—Rate shown was the rate in effect as of December 31, 2023. |
| (d) | All or a portion of this security was held on loan. As of December 31, 2023, the aggregate market value of securities on loan was $15,451,803; the total market value of collateral held by the Portfolio was $15,854,044. The market value of the collateral held included non-cash collateral in the form of U.S. Treasury securities with a value of $12,652,187. The Portfolio received cash collateral with a value of $3,201,857. (See Note 2(H)) |
| (e) | Collateralized Mortgage Obligation Interest Only Strip—Pays a fixed or variable rate of interest based on mortgage loans or mortgage pass-through securities. The principal amount of the underlying pool represents the notional amount on which the current interest was calculated. The value of these stripped securities may be particularly sensitive to changes in prevailing interest rates and are typically more sensitive to changes in prepayment rates than traditional mortgage-backed securities. |
| (f) | Step coupon—Rate shown was the rate in effect as of December 31, 2023. |
| (g) | Non-income producing security. |
| (h) | Current yield as of December 31, 2023. |
| (i) | Represents a security purchased with cash collateral received for securities on loan. |
The notes to the financial statements are an integral part of, and should be read in conjunction with, the financial statements.
| 18 | MainStay VP Balanced Portfolio |
Investments in Affiliates (in 000's)
Investments in issuers considered to be affiliate(s) of the Portfolio during the year ended December 31, 2023 for purposes of Section 2(a)(3) of the Investment Company Act of 1940, as amended, were as follows:
| Affiliated Investment Companies | Value,
Beginning
of Year | Purchases
at Cost | Proceeds
from
Sales | Net
Realized
Gain/(Loss)
on Sales | Change in
Unrealized
Appreciation/
(Depreciation) | Value,
End of
Year | Dividend
Income | Other
Distributions | Shares
End of
Year |
| MainStay U.S. Government Liquidity Fund | $ 1,793 | $ 39,891 | $ (39,959) | $ — | $ — | $ 1,725 | $ 86 | $ — | 1,725 |
Futures Contracts
As of December 31, 2023, the Portfolio held the following futures contracts1:
| Type | Number of
Contracts | Expiration
Date | Value at
Trade Date | Current
Notional
Amount | Unrealized
Appreciation
(Depreciation)2 |
| Long Contracts | | | | | |
| U.S. Treasury 2 Year Notes | 7 | March 2024 | $ 1,428,421 | $ 1,441,398 | $ 12,977 |
| U.S. Treasury 5 Year Notes | 98 | March 2024 | 10,436,410 | 10,659,797 | 223,387 |
| Total Long Contracts | | | | | 236,364 |
| Short Contracts | | | | | |
| U.S. Treasury 10 Year Notes | (2) | March 2024 | (218,840) | (225,781) | (6,941) |
| U.S. Treasury 10 Year Ultra Bonds | (8) | March 2024 | (905,106) | (944,125) | (39,019) |
| U.S. Treasury Long Bonds | (4) | March 2024 | (464,992) | (499,750) | (34,758) |
| U.S. Treasury Ultra Bonds | (3) | March 2024 | (366,280) | (400,781) | (34,501) |
| Total Short Contracts | | | | | (115,219) |
| Net Unrealized Appreciation | | | | | $ 121,145 |
| 1. | As of December 31, 2023, cash in the amount of $103,488 was on deposit with a broker or futures commission merchant for futures transactions. |
| 2. | Represents the difference between the value of the contracts at the time they were opened and the value as of December 31, 2023. |
| Abbreviation(s): |
| ADR—American Depositary Receipt |
| CLO—Collateralized Loan Obligation |
| ETF—Exchange-Traded Fund |
| FNMA—Federal National Mortgage Association |
| REIT—Real Estate Investment Trust |
| REMIC—Real Estate Mortgage Investment Conduit |
| SOFR—Secured Overnight Financing Rate |
The notes to the financial statements are an integral part of, and should be read in conjunction with, the financial statements.
19
Portfolio of Investments December 31, 2023†^ (continued)
The following is a summary of the fair valuations according to the inputs used as of December 31, 2023, for valuing the Portfolio’s assets and liabilities:
| Description | Quoted
Prices in
Active
Markets for
Identical
Assets
(Level 1) | | Significant
Other
Observable
Inputs
(Level 2) | | Significant
Unobservable
Inputs
(Level 3) | | Total |
| Asset Valuation Inputs | | | | | | | |
| Investments in Securities (a) | | | | | | | |
| Long-Term Bonds | | | | | | | |
| Asset-Backed Securities | $ — | | $ 3,996,278 | | $ — | | $ 3,996,278 |
| Corporate Bonds | — | | 46,503,421 | | — | | 46,503,421 |
| Mortgage-Backed Securities | — | | 1,278,383 | | — | | 1,278,383 |
| U.S. Government & Federal Agencies | — | | 69,724,177 | | — | | 69,724,177 |
| Total Long-Term Bonds | — | | 121,502,259 | | — | | 121,502,259 |
| Common Stocks | 203,287,402 | | — | | — | | 203,287,402 |
| Exchange-Traded Funds | 33,131,273 | | — | | — | | 33,131,273 |
| Short-Term Investments | | | | | | | |
| Affiliated Investment Company | 1,725,011 | | — | | — | | 1,725,011 |
| Unaffiliated Investment Companies | 3,201,857 | | — | | — | | 3,201,857 |
| Total Short-Term Investments | 4,926,868 | | — | | — | | 4,926,868 |
| Total Investments in Securities | 241,345,543 | | 121,502,259 | | — | | 362,847,802 |
| Other Financial Instruments | | | | | | | |
| Futures Contracts (b) | 236,364 | | — | | — | | 236,364 |
| Total Investments in Securities and Other Financial Instruments | $ 241,581,907 | | $ 121,502,259 | | $ — | | $ 363,084,166 |
| Liability Valuation Inputs | | | | | | | |
| Other Financial Instruments | | | | | | | |
| Futures Contracts (b) | $ (115,219) | | $ — | | $ — | | $ (115,219) |
| (a) | For a complete listing of investments and their industries, see the Portfolio of Investments. |
| (b) | The value listed for these securities reflects unrealized appreciation (depreciation) as shown on the Portfolio of Investments. |
The notes to the financial statements are an integral part of, and should be read in conjunction with, the financial statements.
| 20 | MainStay VP Balanced Portfolio |
Statement of Assets and Liabilities as of December 31, 2023
| Assets |
Investment in unaffiliated securities, at value
(identified cost $332,534,122) including securities on loan of $15,451,803 | $361,122,791 |
Investment in affiliated investment companies, at value
(identified cost $1,725,011) | 1,725,011 |
| Cash | 4,155,121 |
| Cash collateral on deposit at broker for futures contracts | 103,488 |
| Receivables: | |
| Dividends and interest | 1,301,352 |
| Investment securities sold | 594,070 |
| Portfolio shares sold | 102,175 |
| Variation margin on futures contracts | 11,335 |
| Securities lending | 3,024 |
| Other assets | 1,890 |
| Total assets | 369,120,257 |
| Liabilities |
| Cash collateral received for securities on loan | 3,201,857 |
| Payables: | |
| Portfolio shares redeemed | 277,203 |
| Manager (See Note 3) | 199,511 |
| NYLIFE Distributors (See Note 3) | 72,249 |
| Professional fees | 29,922 |
| Custodian | 14,369 |
| Shareholder communication | 13,216 |
| Accrued expenses | 1,404 |
| Total liabilities | 3,809,731 |
| Net assets | $365,310,526 |
| Composition of Net Assets |
| Shares of beneficial interest outstanding (par value of $.001 per share) unlimited number of shares authorized | $ 27,685 |
| Additional paid-in-capital | 339,217,158 |
| | 339,244,843 |
| Total distributable earnings (loss) | 26,065,683 |
| Net assets | $365,310,526 |
| Initial Class | |
| Net assets applicable to outstanding shares | $ 21,526,918 |
| Shares of beneficial interest outstanding | 1,609,974 |
| Net asset value per share outstanding | $ 13.37 |
| Service Class | |
| Net assets applicable to outstanding shares | $343,783,608 |
| Shares of beneficial interest outstanding | 26,074,667 |
| Net asset value per share outstanding | $ 13.18 |
The notes to the financial statements are an integral part of, and should be read in conjunction with, the financial statements.
21
Statement of Operations for the year ended December 31, 2023
| Investment Income (Loss) |
| Income | |
| Interest | $ 5,995,355 |
| Dividends-unaffiliated (net of foreign tax withholding of $29,199) | 5,757,972 |
| Dividends-affiliated | 86,334 |
| Securities lending, net | 62,882 |
| Total income | 11,902,543 |
| Expenses | |
| Manager (See Note 3) | 2,420,889 |
| Distribution/Service—Service Class (See Note 3) | 879,217 |
| Professional fees | 84,642 |
| Custodian | 32,359 |
| Trustees | 9,759 |
| Miscellaneous | 13,250 |
| Total expenses | 3,440,116 |
| Net investment income (loss) | 8,462,427 |
| Realized and Unrealized Gain (Loss) |
| Net realized gain (loss) on: | |
| Unaffiliated investment transactions | 1,440,539 |
| Futures transactions | (392,944) |
| Net realized gain (loss) | 1,047,595 |
| Net change in unrealized appreciation (depreciation) on: | |
| Unaffiliated investments | 15,872,886 |
| Futures contracts | 85,981 |
| Translation of other assets and liabilities in foreign currencies | 3,159 |
| Net change in unrealized appreciation (depreciation) | 15,962,026 |
| Net realized and unrealized gain (loss) | 17,009,621 |
| Net increase (decrease) in net assets resulting from operations | $25,472,048 |
The notes to the financial statements are an integral part of, and should be read in conjunction with, the financial statements.
| 22 | MainStay VP Balanced Portfolio |
Statements of Changes in Net Assets
for the years ended December 31, 2023 and December 31, 2022
| | 2023 | 2022 |
| Increase (Decrease) in Net Assets |
| Operations: | | |
| Net investment income (loss) | $ 8,462,427 | $ 5,975,234 |
| Net realized gain (loss) | 1,047,595 | (11,775,579) |
| Net change in unrealized appreciation (depreciation) | 15,962,026 | (19,400,126) |
| Net increase (decrease) in net assets resulting from operations | 25,472,048 | (25,200,471) |
| Distributions to shareholders: | | |
| Initial Class | (395,078) | (3,971,697) |
| Service Class | (5,733,941) | (72,269,473) |
| Total distributions to shareholders | (6,129,019) | (76,241,170) |
| Capital share transactions: | | |
| Net proceeds from sales of shares | 36,006,032 | 76,410,539 |
| Net asset value of shares issued to shareholders in reinvestment of distributions | 6,129,019 | 76,241,170 |
| Cost of shares redeemed | (85,020,318) | (76,942,898) |
| Increase (decrease) in net assets derived from capital share transactions | (42,885,267) | 75,708,811 |
| Net increase (decrease) in net assets | (23,542,238) | (25,732,830) |
| Net Assets |
| Beginning of year | 388,852,764 | 414,585,594 |
| End of year | $365,310,526 | $388,852,764 |
The notes to the financial statements are an integral part of, and should be read in conjunction with, the financial statements.
23
Financial Highlights selected per share data and ratios
| | Year Ended December 31, |
| Initial Class | 2023 | | 2022 | | 2021 | | 2020 | | 2019 |
| Net asset value at beginning of year | $ 12.68 | | $ 16.85 | | $ 14.83 | | $ 14.59 | | $ 13.23 |
| Net investment income (loss) (a) | 0.32 | | 0.26 | | 0.18 | | 0.21 | | 0.25 |
| Net realized and unrealized gain (loss) | 0.62 | | (1.38) | | 2.36 | | 0.88 | | 1.93 |
| Total from investment operations | 0.94 | | (1.12) | | 2.54 | | 1.09 | | 2.18 |
| Less distributions: | | | | | | | | | |
| From net investment income | (0.25) | | (0.17) | | (0.22) | | (0.30) | | (0.29) |
| From net realized gain on investments | — | | (2.88) | | (0.30) | | (0.55) | | (0.53) |
| Total distributions | (0.25) | | (3.05) | | (0.52) | | (0.85) | | (0.82) |
| Net asset value at end of year | $ 13.37 | | $ 12.68 | | $ 16.85 | | $ 14.83 | | $ 14.59 |
| Total investment return (b) | 7.55% | | (5.74)% | | 17.29% | | 7.90% | | 16.75% |
| Ratios (to average net assets)/Supplemental Data: | | | | | | | | | |
| Net investment income (loss) | 2.51% | | 1.73% | | 1.11% | | 1.52% | | 1.75% |
| Net expenses (c) | 0.69% | | 0.70% | | 0.72% | | 0.76% | | 0.76% |
| Portfolio turnover rate | 279% | | 306% | | 195% | | 218% | | 186% |
| Net assets at end of year (in 000's) | $ 21,527 | | $ 20,643 | | $ 22,345 | | $ 18,533 | | $ 18,653 |
| (a) | Per share data based on average shares outstanding during the year. |
| (b) | Total return does not reflect any deduction of sales charges, mortality and expense charges, contract charges or administrative charges. For periods of less than one year, total return is not annualized. |
| (c) | In addition to the fees and expenses which the Portfolio bears directly, it also indirectly bears a pro-rata share of the fees and expenses of the underlying funds in which it invests. Such indirect expenses are not included in the above expense ratios. |
| | Year Ended December 31, |
| Service Class | 2023 | | 2022 | | 2021 | | 2020 | | 2019 |
| Net asset value at beginning of year | $ 12.50 | | $ 16.66 | | $ 14.67 | | $ 14.43 | | $ 13.09 |
| Net investment income (loss) (a) | 0.29 | | 0.22 | | 0.14 | | 0.17 | | 0.21 |
| Net realized and unrealized gain (loss) | 0.60 | | (1.37) | | 2.34 | | 0.88 | | 1.91 |
| Total from investment operations | 0.89 | | (1.15) | | 2.48 | | 1.05 | | 2.12 |
| Less distributions: | | | | | | | | | |
| From net investment income | (0.21) | | (0.13) | | (0.19) | | (0.26) | | (0.25) |
| From net realized gain on investments | — | | (2.88) | | (0.30) | | (0.55) | | (0.53) |
| Total distributions | (0.21) | | (3.01) | | (0.49) | | (0.81) | | (0.78) |
| Net asset value at end of year | $ 13.18 | | $ 12.50 | | $ 16.66 | | $ 14.67 | | $ 14.43 |
| Total investment return (b) | 7.28% | | (5.97)% | | 17.00% | | 7.63% | | 16.46% |
| Ratios (to average net assets)/Supplemental Data: | | | | | | | | | |
| Net investment income (loss) | 2.26% | | 1.49% | | 0.86% | | 1.27% | | 1.50% |
| Net expenses (c) | 0.94% | | 0.95% | | 0.97% | | 1.01% | | 1.01% |
| Portfolio turnover rate | 279% | | 306% | | 195% | | 218% | | 186% |
| Net assets at end of year (in 000's) | $ 343,784 | | $ 368,209 | | $ 392,240 | | $ 335,032 | | $ 375,050 |
| (a) | Per share data based on average shares outstanding during the year. |
| (b) | Total return does not reflect any deduction of sales charges, mortality and expense charges, contract charges or administrative charges. For periods of less than one year, total return is not annualized. |
| (c) | In addition to the fees and expenses which the Portfolio bears directly, it also indirectly bears a pro-rata share of the fees and expenses of the underlying funds in which it invests. Such indirect expenses are not included in the above expense ratios. |
The notes to the financial statements are an integral part of, and should be read in conjunction with, the financial statements.
| 24 | MainStay VP Balanced Portfolio |
Notes to Financial Statements
Note 1–Organization and Business
MainStay VP Funds Trust (the “Fund”) was organized as a Delaware statutory trust on February 1, 2011. The Fund is registered under the Investment Company Act of 1940, as amended (the “1940 Act”), as an open-end management investment company. The Fund is comprised of thirty-one separate series (collectively referred to as the “Portfolios”). These financial statements and notes relate to the MainStay VP Balanced Portfolio (the "Portfolio"), a "diversified” portfolio, as that term is defined in the 1940 Act, as interpreted or modified by regulatory authorities having jurisdiction, from time to time.
Shares of the Portfolio are currently offered to certain separate accounts to fund variable annuity policies and variable universal life insurance policies issued by New York Life Insurance and Annuity Corporation (“NYLIAC”), a wholly-owned subsidiary of New York Life Insurance Company (“New York Life”) and may also be offered to fund variable annuity policies and variable universal life insurance policies issued by other insurance companies. NYLIAC allocates shares of the Portfolio to, among others, certain NYLIAC separate accounts. Shares of the Portfolio are also offered to the MainStay VP Conservative Allocation Portfolio, MainStay VP Moderate Allocation Portfolio, MainStay VP Growth Allocation Portfolio and MainStay VP Equity Allocation Portfolio, which operate as “funds-of-funds," and other variable insurance funds.
The following table lists the Portfolio's share classes that have been registered and commenced operations:
| Class | Commenced Operations |
| Initial Class | May 2, 2005 |
| Service Class | May 2, 2005 |
Shares of the Portfolio are offered and are redeemed at a price equal to their respective net asset value (“NAV”) per share. No sales or redemption charge is applicable to the purchase or redemption of the Portfolio's shares. Under the terms of the Fund’s multiple class plan, adopted pursuant to Rule 18f-3 under the 1940 Act, the classes differ in that, among other things, Service Class shares of the Portfolio pay a combined distribution and service fee of 0.25% of average daily net assets attributable to Service Class shares of the Portfolio to the Distributor (as defined in Note 3(B)) pursuant to a plan adopted in accordance with Rule 12b-1 under the 1940 Act. Contract owners of variable annuity contracts purchased after June 2, 2003, are permitted to invest only in the Service Class shares.
The Portfolio's investment objective is to seek total return.
Note 2–Significant Accounting Policies
The Portfolio is an investment company and accordingly follows the investment company accounting and reporting guidance of the Financial Accounting Standards Board (“FASB”) Accounting Standards Codification Topic 946 Financial Services—Investment Companies. The Portfolio prepares its financial statements in accordance with generally accepted
accounting principles (“GAAP”) in the United States of America and follows the significant accounting policies described below.
(A) Securities Valuation. Investments are usually valued as of the close of regular trading on the New York Stock Exchange (the "Exchange") (usually 4:00 p.m. Eastern time) on each day the Portfolio is open for business ("valuation date").
Pursuant to Rule 2a-5 under the 1940 Act, the Board of Trustees of the Fund (the "Board") has designated New York Life Investment Management LLC (“New York Life Investments” or the "Manager") as its Valuation Designee (the "Valuation Designee"). The Valuation Designee is responsible for performing fair valuations relating to all investments in the Portfolio’s portfolio for which market quotations are not readily available; periodically assessing and managing material valuation risks; establishing and applying fair value methodologies; testing fair valuation methodologies; evaluating and overseeing pricing services; ensuring appropriate segregation of valuation and portfolio management functions; providing quarterly, annual and prompt reporting to the Board, as appropriate; identifying potential conflicts of interest; and maintaining appropriate records. The Valuation Designee has established a valuation committee ("Valuation Committee") to assist in carrying out the Valuation Designee’s responsibilities and establish prices of securities for which market quotations are not readily available. The Portfolio's and the Valuation Designee's policies and procedures ("Valuation Procedures") govern the Valuation Designee’s selection and application of methodologies for determining and calculating the fair value of Portfolio investments. The Valuation Designee may value the Portfolio's portfolio securities for which market quotations are not readily available and other Portfolio assets utilizing inputs from pricing services and other third-party sources. The Valuation Committee meets (in person, via electronic mail or via teleconference) on an ad-hoc basis to determine fair valuations and on a quarterly basis to review fair value events with respect to certain securities for which market quotations are not readily available, including valuation risks and back-testing results, and to preview reports to the Board.
The Valuation Committee establishes prices of securities for which market quotations are not readily available based on such methodologies and measurements on a regular basis after considering information that is reasonably available and deemed relevant by the Valuation Committee. The Board shall oversee the Valuation Designee and review fair valuation materials on a prompt, quarterly and annual basis and approve proposed revisions to the Valuation Procedures.
Investments for which market quotations are not readily available are valued at fair value as determined in good faith pursuant to the Valuation Procedures. A market quotation is readily available only when that quotation is a quoted price (unadjusted) in active markets for identical investments that the Portfolio can access at the measurement date, provided that a quotation will not be readily available if it is not reliable. "Fair value" is defined as the price the Portfolio would reasonably expect to receive upon selling an asset or liability in an orderly transaction to an independent buyer in the principal or most advantageous market for the
Notes to Financial Statements (continued)
asset or liability. Fair value measurements are determined within a framework that establishes a three-tier hierarchy that maximizes the use of observable market data and minimizes the use of unobservable inputs to establish a classification of fair value measurements for disclosure purposes. "Inputs" refer broadly to the assumptions that market participants would use in pricing the asset or liability, including assumptions about risk, such as the risk inherent in a particular valuation technique used to measure fair value using a pricing model and/or the risk inherent in the inputs for the valuation technique. Inputs may be observable or unobservable. Observable inputs reflect the assumptions market participants would use in pricing the asset or liability based on market data obtained from sources independent of the Portfolio. Unobservable inputs reflect the Portfolio’s own assumptions about the assumptions market participants would use in pricing the asset or liability based on the information available. The inputs or methodology used for valuing assets or liabilities may not be an indication of the risks associated with investing in those assets or liabilities. The three-tier hierarchy of inputs is summarized below.
| • | Level 1—quoted prices (unadjusted) in active markets for an identical asset or liability |
| • | Level 2—other significant observable inputs (including quoted prices for a similar asset or liability in active markets, interest rates and yield curves, prepayment speeds, credit risk, etc.) |
| • | Level 3—significant unobservable inputs (including the Portfolio's own assumptions about the assumptions that market participants would use in measuring fair value of an asset or liability) |
The level of an asset or liability within the fair value hierarchy is based on the lowest level of an input, both individually and in the aggregate, that is significant to the fair value measurement. The aggregate value by input level of the Portfolio’s assets and liabilities as of December 31, 2023, is included at the end of the Portfolio of Investments.
The Portfolio may use third-party vendor evaluations, whose prices may be derived from one or more of the following standard inputs, among others:
| • Benchmark yields | • Reported trades |
| • Broker/dealer quotes | • Issuer spreads |
| • Two-sided markets | • Benchmark securities |
| • Bids/offers | • Reference data (corporate actions or material event notices) |
| • Industry and economic events | • Comparable bonds |
| • Monthly payment information | |
An asset or liability for which a market quotation is not readily available is valued by methods deemed reasonable in good faith by the Valuation Committee, following the Valuation Procedures to represent fair value. Under these procedures, the Valuation Designee generally uses a market-based approach which may use related or comparable assets or liabilities, recent transactions, market multiples, book values and other relevant information. The Valuation Designee may also use an
income-based valuation approach in which the anticipated future cash flows of the asset or liability are discounted to calculate fair value. Discounts may also be applied due to the nature and/or duration of any restrictions on the disposition of the asset or liability. Fair value represents a good faith approximation of the value of a security. Fair value determinations involve the consideration of a number of subjective factors, an analysis of applicable facts and circumstances and the exercise of judgment. As a result, it is possible that the fair value for a security determined in good faith in accordance with the Valuation Procedures may differ from valuations for the same security determined for other funds using their own valuation procedures. Although the Valuation Procedures are designed to value a security at the price the Portfolio may reasonably expect to receive upon the security's sale in an orderly transaction, there can be no assurance that any fair value determination thereunder would, in fact, approximate the amount that the Portfolio would actually realize upon the sale of the security or the price at which the security would trade if a reliable market price were readily available. During the year ended December 31, 2023, there were no material changes to the fair value methodologies.
Securities which may be valued in this manner include, but are not limited to: (i) a security for which trading has been halted or suspended or otherwise does not have a readily available market quotation on a given day; (ii) a debt security that has recently gone into default and for which there is not a current market quotation; (iii) a security of an issuer that has entered into a restructuring; (iv) a security that has been delisted from a national exchange; (v) a security subject to trading collars for which no or limited trading takes place; and (vi) a security whose principal market has been temporarily closed at a time when, under normal conditions, it would be open. Securities valued in this manner are generally categorized as Level 2 or 3 in the hierarchy.
Equity securities, rights and warrants, if applicable, are valued at the last quoted sales prices as of the close of regular trading on the relevant exchange on each valuation date. Securities that are not traded on the valuation date are valued at the mean of the last quoted bid and ask prices. Prices are normally taken from the principal market in which each security trades. These securities are generally categorized as Level 1 in the hierarchy.
Exchange-traded funds (“ETFs”) are valued at the last quoted sales prices as of the close of regular trading on the relevant exchange on each valuation date. Securities that are not traded on the valuation date are valued at the mean of the last quoted bid and ask prices. Prices are normally taken from the principal market in which each security trades. These securities are generally categorized as Level 1 in the hierarchy.
Investments in mutual funds, including money market funds, are valued at their respective NAVs at the close of business each day on the valuation date. These securities are generally categorized as Level 1 in the hierarchy.
Futures contracts are valued at the last posted settlement price on the market where such futures are primarily traded. These securities are generally categorized as Level 1 in the hierarchy.
| 26 | MainStay VP Balanced Portfolio |
Debt securities (other than convertible and municipal bonds) are valued at the evaluated bid prices (evaluated mean prices in the case of convertible and municipal bonds) supplied by a pricing agent or broker selected by the Valuation Designee, in consultation with the Subadvisors. The evaluations are market-based measurements processed through a pricing application and represents the pricing agent’s good faith determination as to what a holder may receive in an orderly transaction under market conditions. The rules-based logic utilizes valuation techniques that reflect participants’ assumptions and vary by asset class and per methodology, maximizing the use of relevant observable data including quoted prices for similar assets, benchmark yield curves and market corroborated inputs. The evaluated bid or mean prices are deemed by the Valuation Designee, in consultation with the Subadvisors, to be representative of market values at the regular close of trading of the Exchange on each valuation date. Debt securities purchased on a delayed delivery basis are marked to market daily until settlement at the forward settlement date. Debt securities, including corporate bonds, U.S. government and federal agency bonds, municipal bonds, foreign bonds, convertible bonds, asset-backed securities and mortgage-backed securities are generally categorized as Level 2 in the hierarchy.
Temporary cash investments acquired in excess of 60 days to maturity at the time of purchase are valued using the latest bid prices or using valuations based on a matrix system (which considers such factors as security prices, yields, maturities and ratings), both as furnished by independent pricing services. Temporary cash investments that mature in 60 days or less at the time of purchase ("Short-Term Investments") are valued using the amortized cost method of valuation, unless the use of such method would be inappropriate. The amortized cost method involves valuing a security at its cost on the date of purchase and thereafter assuming a constant amortization to maturity of the difference between such cost and the value on maturity date. Amortized cost approximates the current fair value of a security. Securities valued using the amortized cost method are not valued using quoted prices in an active market and are generally categorized as Level 2 in the hierarchy.
The information above is not intended to reflect an exhaustive list of the methodologies that may be used to value portfolio investments. The Valuation Procedures permit the use of a variety of valuation methodologies in connection with valuing portfolio investments. The methodology used for a specific type of investment may vary based on the market data available or other considerations. The methodologies summarized above may not represent the specific means by which portfolio investments are valued on any particular business day.
(B) Income Taxes. The Portfolio's policy is to comply with the requirements of the Internal Revenue Code of 1986, as amended (the “Internal Revenue Code”), applicable to regulated investment companies and to distribute all of its taxable income to the shareholders of the Portfolio within the allowable time limits.
The Manager evaluates the Portfolio’s tax positions to determine if the tax positions taken meet the minimum recognition threshold in connection with accounting for uncertainties in income tax positions taken or
expected to be taken for the purposes of measuring and recognizing tax liabilities in the financial statements. Recognition of tax benefits of an uncertain tax position is permitted only to the extent the position is “more likely than not” to be sustained assuming examination by taxing authorities. The Manager analyzed the Portfolio's tax positions taken on federal, state and local income tax returns for all open tax years (for up to three tax years) and has concluded that no provisions for federal, state and local income tax are required in the Portfolio's financial statements. The Portfolio's federal, state and local income tax and federal excise tax returns for tax years for which the applicable statutes of limitations have not expired are subject to examination by the Internal Revenue Service and state and local departments of revenue.
(C) Dividends and Distributions to Shareholders. Dividends and distributions are recorded on the ex-dividend date. The Portfolio intends to declare and pay dividends from net investment income and distributions from net realized capital and currency gains, if any, at least annually. All dividends and distributions are reinvested at NAV in the same class of shares of the Portfolio. Dividends and distributions to shareholders are determined in accordance with federal income tax regulations and may differ from determinations using GAAP.
(D) Security Transactions and Investment Income. The Portfolio records security transactions on the trade date. Realized gains and losses on security transactions are determined using the identified cost method. Dividend income is recognized on the ex-dividend date, net of any foreign tax withheld at the source, and interest income is accrued as earned using the effective interest rate method. Distributions received from real estate investment trusts may be classified as dividends, capital gains and/or return of capital. Discounts and premiums on securities purchased for the Portfolio are accreted and amortized, respectively, on the effective interest rate method.
Investment income and realized and unrealized gains and losses on investments of the Portfolio are allocated pro rata to the separate classes of shares based upon their relative net assets on the date the income is earned or realized and unrealized gains and losses are incurred.
The Portfolio may place a debt security on non-accrual status and reduce related interest income by ceasing current accruals and writing off all or a portion of any interest receivables when the collection of all or a portion of such interest has become doubtful. A debt security is removed from non-accrual status when the issuer resumes interest payments or when collectability of interest is reasonably assured.
(E) Expenses. Expenses of the Fund are allocated to the individual Portfolios in proportion to the net assets of the respective Portfolios when the expenses are incurred, except where direct allocations of expenses can be made. Expenses (other than fees incurred under the distribution and service plans, further discussed in Note 3(B), which are charged directly to the Service Class shares) are allocated to separate classes of shares pro rata based upon their relative net assets on the date the
Notes to Financial Statements (continued)
expenses are incurred. The expenses borne by the Portfolio, including those of related parties to the Portfolio, are shown in the Statement of Operations.
Additionally, the Portfolio may invest in ETFs and mutual funds, which are subject to management fees and other fees that may cause the costs of investing in ETFs and mutual funds to be greater than the costs of owning the underlying securities directly. These indirect expenses of ETFs and mutual funds are not included in the amounts shown as expenses in the Statement of Operations or in the expense ratios included in the Financial Highlights.
(F) Use of Estimates. In preparing financial statements in conformity with GAAP, the Manager makes estimates and assumptions that affect the reported amounts and disclosures in the financial statements. Actual results could differ from those estimates and assumptions.
(G) Futures Contracts. A futures contract is an agreement to purchase or sell a specified quantity of an underlying instrument at a specified future date and price, or to make or receive a cash payment based on the value of a financial instrument (e.g., foreign currency, interest rate, security or securities index). The Portfolio is subject to risks such as market price risk, leverage risk, liquidity risk, counterparty risk, operational risk, legal risk and/or interest rate risk in the normal course of investing in these contracts. Upon entering into a futures contract, the Portfolio is required to pledge to the broker or futures commission merchant an amount of cash and/or U.S. government securities equal to a certain percentage of the collateral amount, known as the “initial margin.” During the period the futures contract is open, changes in the value of the contract are recognized as unrealized appreciation or depreciation by marking to market such contract on a daily basis to reflect the market value of the contract at the end of each day’s trading. The Portfolio agrees to receive from or pay to the broker or futures commission merchant an amount of cash equal to the daily fluctuation in the value of the contract. Such receipts or payments are known as “variation margin.” When the futures contract is closed, the Portfolio records a realized gain or loss equal to the difference between the proceeds from (or cost of) the closing transaction and the Portfolio's basis in the contract.
The use of futures contracts involves, to varying degrees, elements of market risk in excess of the amount recognized in the Statement of Assets and Liabilities. The contract or notional amounts and variation margin reflect the extent of the Portfolio's involvement in open futures positions. There are several risks associated with the use of futures contracts as hedging techniques. There can be no assurance that a liquid market will exist at the time when the Portfolio seeks to close out a futures contract. If no liquid market exists, the Portfolio would remain obligated to meet margin requirements until the position is closed. Futures contracts may involve a small initial investment relative to the risk assumed, which could result in losses greater than if the Portfolio did not invest in futures contracts. Futures contracts may be more volatile than direct investments in the instrument underlying the futures and may not correlate to the underlying instrument, causing a given hedge not to
achieve its objectives. The Portfolio's activities in futures contracts have minimal counterparty risk as they are conducted through regulated exchanges that guarantee the futures against default by the counterparty. In the event of a bankruptcy or insolvency of a futures commission merchant that holds margin on behalf of the Portfolio, the Portfolio may not be entitled to the return of the entire margin owed to the Portfolio, potentially resulting in a loss. The Portfolio may invest in futures contracts to seek enhanced returns or to reduce the risk of loss by hedging certain of its holdings. The Portfolio's investment in futures contracts and other derivatives may increase the volatility of the Portfolio's NAVs and may result in a loss to the Portfolio.
(H) Securities Lending. In order to realize additional income, the Portfolio may engage in securities lending, subject to the limitations set forth in the 1940 Act and relevant guidance by the staff of the Securities and Exchange Commission (“SEC”). If the Portfolio engages in securities lending, the Portfolio will lend through its custodian, JPMorgan Chase Bank, N.A., ("JPMorgan"), acting as securities lending agent on behalf of the Portfolio. Under the current arrangement, JPMorgan will manage the Portfolio's collateral in accordance with the securities lending agency agreement between the Portfolio and JPMorgan, and indemnify the Portfolio against counterparty risk. The loans will be collateralized by cash (which may be invested in a money market fund) and/or non-cash collateral (which may include U.S. Treasury securities and/or U.S. government agency securities issued or guaranteed by the United States government or its agencies or instrumentalities) at least equal at all times to the market value of the securities loaned. Non-cash collateral held at year end is segregated and cannot be transferred by the Portfolio. The Portfolio bears the risk of delay in recovery of, or loss of rights in, the securities loaned. The Portfolio may also record a realized gain or loss on securities deemed sold due to a borrower’s inability to return securities on loan. The Portfolio bears the risk of any loss on investment of cash collateral. The Portfolio will receive compensation for lending its securities in the form of fees or it will retain a portion of interest earned on the investment of any cash collateral. The Portfolio will also continue to receive interest and dividends on the securities loaned and any gain or loss in the market price of the securities loaned that may occur during the term of the loan will be for the account of the Portfolio. Income earned from securities lending activities, if any, is reflected in the Statement of Operations.
(I) Debt Securities Risk. The ability of issuers of debt securities held by the Portfolio to meet their obligations may be affected by, among other things, economic or political developments in a specific country, industry or region. Debt securities are also subject to the risks associated with changes in interest rates.
Investments in the Portfolio are not guaranteed, even though some of the Portfolio’s underlying investments are guaranteed by the U.S. government or its agencies or instrumentalities. The principal risk of mortgage-related and asset-backed securities is that the underlying debt may be prepaid ahead of schedule, if interest rates fall, thereby reducing the value of the Portfolio’s investment. If interest rates rise, less of the debt may be
| 28 | MainStay VP Balanced Portfolio |
prepaid and the Portfolio may lose money because the Portfolio may be unable to invest in higher yielding assets. The Portfolio is subject to interest-rate risk and can lose principal value when interest rates rise. Bonds are also subject to credit risk, in which the bond issuer may fail to pay interest and principal in a timely manner.
The Portfolio may invest in foreign debt securities, which carry certain risks that are in addition to the usual risks inherent in domestic instruments. Foreign regulatory regimes and securities markets can have less stringent investor protections and disclosure standards and less liquid trading markets than U.S. regulatory regimes and securities markets, and can experience political, social and economic developments that may affect the value of investments in foreign securities. These risks include those resulting from currency fluctuations, future adverse political or economic developments and possible imposition of currency exchange blockages or other foreign governmental laws or restrictions. Economic sanctions and other similar governmental actions or developments could, among other things, effectively restrict or eliminate the Fund’s ability to purchase or sell certain foreign securities or groups of foreign securities, and thus may make the Fund’s investments in such securities less liquid or more difficult to value. These risks are likely to be greater in emerging markets than in developed markets. The ability of issuers of debt securities held by the Portfolio to meet their obligations may be affected by, among other things, economic or political developments in a specific country, industry or region.
(J) Indemnifications. Under the Fund’s organizational documents, its officers and trustees are indemnified against certain liabilities that may arise out of performance of their duties to the Fund. Additionally, in the normal course of business, the Portfolio enters into contracts with third-party service providers that contain a variety of representations and warranties and that may provide general indemnifications. The Portfolio's maximum exposure under these arrangements is unknown, as this would involve future claims that may be made against the Portfolio that have not yet occurred. The Manager believes that the risk of loss in connection with these potential indemnification obligations is remote. However, there can be no assurance that material liabilities related to such obligations will not arise in the future, which could adversely impact the Portfolio.
(K) Quantitative Disclosure of Derivative Holdings. The following tables show additional disclosures related to the Portfolio's derivative and hedging activities, including how such activities are accounted for and their effect on the Portfolio's financial positions, performance and cash flows.
The Portfolio entered into futures contracts in order to hedge against anticipated changes in interest rates that might otherwise have an adverse effect upon the value of the Portfolio’s securities as well as to help manage the duration and yield curve positioning of the portfolio.
Fair value of derivative instruments as of December 31, 2023:
| Asset Derivatives | Interest
Rate
Contracts
Risk | Total |
| Futures Contracts - Net Assets—Net unrealized appreciation on futures contracts (a) | $236,364 | $236,364 |
| Total Fair Value | $236,364 | $236,364 |
| (a) | Includes cumulative appreciation (depreciation) of futures contracts as reported in the Portfolio of Investments. Only current day’s variation margin is reported within the Statement of Assets and Liabilities. |
| Liability Derivatives | Interest
Rate
Contracts
Risk | Total |
| Futures Contracts - Net Assets—Net unrealized depreciation on futures contracts (a) | $(115,219) | $(115,219) |
| Total Fair Value | $(115,219) | $(115,219) |
| (a) | Includes cumulative appreciation (depreciation) of futures contracts as reported in the Portfolio of Investments. Only current day’s variation margin is reported within the Statement of Assets and Liabilities. |
The effect of derivative instruments on the Statement of Operations for the year ended December 31, 2023:
| Net Realized Gain (Loss) from: | Interest
Rate
Contracts
Risk | Total |
| Futures Transactions | $(392,944) | $(392,944) |
| Total Net Realized Gain (Loss) | $(392,944) | $(392,944) |
| Net Change in Unrealized Appreciation (Depreciation) | Interest
Rate
Contracts
Risk | Total |
| Futures Contracts | $85,981 | $85,981 |
| Total Net Change in Unrealized Appreciation (Depreciation) | $85,981 | $85,981 |
| Average Notional Amount | Total |
| Futures Contracts Long | $15,429,512 |
| Futures Contracts Short | $ (5,981,413) |
Note 3–Fees and Related Party Transactions
(A) Manager and Subadvisors. New York Life Investments, a registered investment adviser and an indirect, wholly-owned subsidiary of New York Life, serves as the Portfolio’s Manager, pursuant to an Amended and Restated Management Agreement (“Management Agreement”). The Manager provides offices, conducts clerical, recordkeeping and bookkeeping services and keeps most of the financial and accounting records required to be maintained by the Portfolio. Except for the portion of salaries and expenses that are the responsibility of the Portfolio, the
Notes to Financial Statements (continued)
Manager pays the salaries and expenses of all personnel affiliated with the Portfolio and certain operational expenses of the Portfolio. The Portfolio reimburses New York Life Investments in an amount equal to the portion of the compensation of the Chief Compliance Officer attributable to the Portfolio. Wellington Management Company LLP (“Wellington” or the "Subadvisor”), a registered investment adviser, serves as the Subadvisor to the Portfolio and is responsible for the day-to-day portfolio management of the equity portion of the Portfolio, pursuant to the terms of a Subadvisory Agreement (a “Subadvisory Agreement”) between New York Life Investments and Wellington. NYL Investors LLC (“NYL Investors” or the “Subadvisor,” and, together with Wellington, the “Subadvisors”), a registered investment adviser and a direct, wholly-owned subsidiary of New York Life, serves as the Subadvisor to the Portfolio and is responsible for the day-to-day portfolio management of the fixed-income portion of the Portfolio, pursuant to the terms of a Subadvisory Agreement between New York Life Investments and NYL Investors. New York Life Investments pays for the services of the Subadvisors.
Pursuant to the Management Agreement, the Fund pays the Manager, on behalf of the Portfolio, a monthly fee for the services performed and the facilities furnished at an annual rate of the Portfolio's average daily net assets as follows: 0.65% up to $1 billion; 0.625% from $1 billion to $2 billion; and 0.60% in excess of $2 billion. During the year ended December 31, 2023, the effective management fee rate was 0.65% of the Portfolio's average daily net assets.
During the year ended December 31, 2023, New York Life Investments earned fees from the Portfolio in the amount of $2,420,889 and paid Wellington and NYL Investors fees in the amount of $424,533 and $568,375, respectively.
JPMorgan Chase Bank, N.A. ("JPMorgan") provides sub-administration and sub-accounting services to the Portfolio pursuant to an agreement with New York Life Investments. These services include calculating the daily NAVs of the Portfolio, maintaining the general ledger and sub-ledger accounts for the calculation of the Portfolio's NAVs, and assisting New York Life Investments in conducting various aspects of the Portfolio's administrative operations. For providing these services to the Portfolio, JPMorgan is compensated by New York Life Investments.
Pursuant to an agreement between the Fund and New York Life Investments, New York Life Investments is responsible for providing or procuring certain regulatory reporting services for the Portfolio. The Portfolio will reimburse New York Life Investments for the actual costs incurred by New York Life Investments in connection with providing or procuring these services for the Portfolio.
(B) Distribution and Service Fees. The Fund, on behalf of the Portfolio, has entered into a distribution agreement with NYLIFE Distributors LLC (the “Distributor”), an affiliate of New York Life Investments. The Portfolio has adopted a distribution plan (the “Plan”) in accordance with the provisions of Rule 12b-1 under the 1940 Act. Under the Plan, the Distributor has agreed to provide, through its affiliates or independent third parties, various distribution-related, shareholder and
administrative support services to the Service Class shareholders. For its services, the Distributor is entitled to a combined distribution and service fee accrued daily and paid monthly at an annual rate of 0.25% of the average daily net assets attributable to the Service Class shares of the Portfolio.
Note 4-Federal Income Tax
As of December 31, 2023, the cost and unrealized appreciation (depreciation) of the Portfolio’s investment portfolio, including applicable derivative contracts and other financial instruments, as determined on a federal income tax basis, were as follows:
| | Federal Tax
Cost | Gross
Unrealized
Appreciation | Gross
Unrealized
(Depreciation) | Net
Unrealized
Appreciation/
(Depreciation) |
| Investments in Securities | $336,991,108 | $31,774,638 | $(6,072,048) | $25,702,590 |
As of December 31, 2023, the components of accumulated gain (loss) on a tax basis were as follows:
Ordinary
Income | Accumulated
Capital
and Other
Gain (Loss) | Other
Temporary
Differences | Unrealized
Appreciation
(Depreciation) | Total
Accumulated
Gain (Loss) |
| $8,555,593 | $(8,344,971) | $— | $25,855,061 | $26,065,683 |
The difference between book-basis and tax-basis unrealized appreciation (depreciation) is primarily due to wash sale adjustments.
As of December 31, 2023, for federal income tax purposes, capital loss carryforwards of $8,190,867, as shown in the table below, were available to the extent provided by the regulations to offset future realized gains of the Portfolio. Accordingly, no capital gains distributions are expected to be paid to shareholders until net gains have been realized in excess of such amounts.
Capital Loss
Available Through | Short-Term
Capital Loss
Amounts (000’s) | Long-Term
Capital Loss
Amounts (000’s) |
| Unlimited | $5,237 | $2,954 |
The Portfolio utilized $2,152,580 of capital loss carryforwards during the year ended December 31, 2023.
During the years ended December 31, 2023 and December 31, 2022, the tax character of distributions paid as reflected in the Statements of Changes in Net Assets was as follows:
| | 2023 | 2022 |
| Distributions paid from: | | |
| Ordinary Income | $6,129,019 | $41,144,789 |
| Long-Term Capital Gains | — | 35,096,381 |
| Total | $6,129,019 | $76,241,170 |
| 30 | MainStay VP Balanced Portfolio |
Note 5–Custodian
JPMorgan is the custodian of cash and securities held by the Portfolio. Custodial fees are charged to the Portfolio based on the Portfolio's net assets and/or the market value of securities held by the Portfolio and the number of certain transactions incurred by the Portfolio.
Note 6–Line of Credit
The Portfolio and certain other funds managed by New York Life Investments maintain a line of credit with a syndicate of banks in order to secure a source of funds for temporary purposes to meet unanticipated or excessive redemption requests.
Effective July 25, 2023, under the credit agreement (the “Credit Agreement”), the aggregate commitment amount is $600,000,000 with an additional uncommitted amount of $100,000,000. The commitment fee is an annual rate of 0.15% of the average commitment amount payable quarterly, regardless of usage, to JPMorgan, who serves as the agent to the syndicate. The commitment fee is allocated among the Portfolio and certain other funds managed by New York Life Investments based upon their respective net assets and other factors. Interest on any revolving credit loan is charged based upon the Federal Funds Rate, Daily SOFR + 0.10%, or the Overnight Bank Funding Rate, whichever is higher. The Credit Agreement expires on July 23, 2024, although the Portfolio, certain other funds managed by New York Life Investments and the syndicate of banks may renew the Credit Agreement for an additional year on the same or different terms or enter into a credit agreement with a different syndicate of banks. Prior to July 25, 2023, the aggregate commitment amount and the commitment fee were the same as those under the current Credit Agreement. During the year ended December 31, 2023, there were no borrowings made or outstanding with respect to the Portfolio under the Credit Agreement.
Note 7–Interfund Lending Program
Pursuant to an exemptive order issued by the SEC, the Portfolio, along with certain other funds managed by New York Life Investments, may participate in an interfund lending program. The interfund lending program provides an alternative credit facility that permits the Portfolio and certain other funds managed by New York Life Investments to lend or borrow money for temporary purposes directly to or from one another, subject to the conditions of the exemptive order. During the year ended December 31, 2023, there were no interfund loans made or outstanding with respect to the Portfolio.
Note 8–Purchases and Sales of Securities (in 000’s)
During the year ended December 31, 2023, purchases and sales of U.S. government securities were $814,661 and $834,457, respectively. Purchases and sales of securities, other than U.S. government securities and short-term securities, were $176,597 and $193,942, respectively.
The Portfolio may purchase securities from or sell securities to other portfolios managed by the Subadvisor. These interportfolio transactions
are primarily used for cash management purposes and are made pursuant to Rule 17a-7 under the 1940 Act. The Rule 17a-7 transactions during the year ended December 31, 2023, were as follows:
Sales
(000's) | Realized
Gain / (Loss)
(000's) |
| $303 | $58 |
Note 9–Capital Share Transactions
Transactions in capital shares for the years ended December 31, 2023 and December 31, 2022, were as follows:
| Initial Class | Shares | Amount |
| Year ended December 31, 2023: | | |
| Shares sold | 106,155 | $ 1,368,105 |
| Shares issued to shareholders in reinvestment of distributions | 31,674 | 395,078 |
| Shares redeemed | (155,604) | (1,992,822) |
| Net increase (decrease) | (17,775) | $ (229,639) |
| Year ended December 31, 2022: | | |
| Shares sold | 94,334 | $ 1,437,172 |
| Shares issued to shareholders in reinvestment of distributions | 328,574 | 3,971,697 |
| Shares redeemed | (121,498) | (1,842,599) |
| Net increase (decrease) | 301,410 | $ 3,566,270 |
| |
| Service Class | Shares | Amount |
| Year ended December 31, 2023: | | |
| Shares sold | 2,737,109 | $ 34,637,927 |
| Shares issued to shareholders in reinvestment of distributions | 465,935 | 5,733,941 |
| Shares redeemed | (6,574,265) | (83,027,496) |
| Net increase (decrease) | (3,371,221) | $(42,655,628) |
| Year ended December 31, 2022: | | |
| Shares sold | 4,898,185 | $ 74,973,367 |
| Shares issued to shareholders in reinvestment of distributions | 6,060,333 | 72,269,473 |
| Shares redeemed | (5,061,179) | (75,100,299) |
| Net increase (decrease) | 5,897,339 | $ 72,142,541 |
Note 10–Other Matters
As of the date of this report, the Portfolio faces a heightened level of risk associated with current uncertainty, volatility and state of economies, financial markets, rising interest rates, and labor and health conditions around the world. Events such as war, acts of terrorism, recessions, rapid inflation, the imposition of international sanctions, earthquakes, hurricanes, epidemics and pandemics and other unforeseen natural or human disasters may have broad adverse social, political and economic effects on the global economy, which could negatively impact the value of the Portfolio's investments. Developments that disrupt global economies and financial markets may magnify factors that affect the Portfolio's performance.
Notes to Financial Statements (continued)
Note 11–Subsequent Events
In connection with the preparation of the financial statements of the Portfolio as of and for the year ended December 31, 2023, events and transactions subsequent to December 31, 2023, through the date the financial statements were issued, have been evaluated by the Manager for possible adjustment and/or disclosure. No subsequent events requiring financial statement adjustment or disclosure have been identified.
| 32 | MainStay VP Balanced Portfolio |
Report of Independent Registered Public Accounting Firm
To the Board of Trustees of MainStay VP Funds Trust and Shareholders of MainStay VP Balanced Portfolio
Opinion on the Financial Statements
We have audited the accompanying statement of assets and liabilities, including the portfolio of investments, of MainStay VP Balanced Portfolio (one of the portfolios constituting MainStay VP Funds Trust, referred to hereafter as the “Portfolio”) as of December 31, 2023, the related statement of operations for the year ended December 31, 2023, the statements of changes in net assets for each of the two years in the period ended December 31, 2023, including the related notes, and the financial highlights for each of the five years in the period ended December 31, 2023 (collectively referred to as the “financial statements”). In our opinion, the financial statements present fairly, in all material respects, the financial position of the Portfolio as of December 31, 2023, the results of its operations for the year then ended, the changes in its net assets for each of the two years in the period ended December 31, 2023 and the financial highlights for each of the five years in the period ended December 31, 2023 in conformity with accounting principles generally accepted in the United States of America.
Basis for Opinion
These financial statements are the responsibility of the Portfolio’s management. Our responsibility is to express an opinion on the Portfolio’s financial statements based on our audits. We are a public accounting firm registered with the Public Company Accounting Oversight Board (United States) (PCAOB) and are required to be independent with respect to the Portfolio in accordance with the U.S. federal securities laws and the applicable rules and regulations of the Securities and Exchange Commission and the PCAOB.
We conducted our audits of these financial statements in accordance with the standards of the PCAOB. Those standards require that we plan and perform the audit to obtain reasonable assurance about whether the financial statements are free of material misstatement, whether due to error or fraud.
Our audits included performing procedures to assess the risks of material misstatement of the financial statements, whether due to error or fraud, and performing procedures that respond to those risks. Such procedures included examining, on a test basis, evidence regarding the amounts and disclosures in the financial statements. Our audits also included evaluating the accounting principles used and significant estimates made by management, as well as evaluating the overall presentation of the financial statements. Our procedures included confirmation of securities owned as of December 31, 2023 by correspondence with the custodian, transfer agents and broker. We believe that our audits provide a reasonable basis for our opinion.
/s/PricewaterhouseCoopers LLP
New York, New York
February 26, 2024
We have served as the auditor of one or more investment companies in the MainStay group of funds since 1984.
Board Consideration and Approval of Management Agreement and Subadvisory
Agreements (Unaudited)
The continuation of the Management Agreement with respect to the MainStay VP Balanced Portfolio (“Portfolio”) and New York Life Investment Management LLC (“New York Life Investments”) and the Subadvisory Agreements between New York Life Investments and each of NYL Investors LLC (“NYL Investors”) and Wellington Management Company LLP (“WMC”) with respect to the Portfolio (together, “Advisory Agreements”) is subject to annual review and approval by the Board of Trustees of MainStay VP Funds Trust (“Board” of the “Trust”) in accordance with Section 15 of the Investment Company Act of 1940, as amended (“1940 Act”). At its December 6–7, 2023 meeting, the Board, including the Trustees who are not an “interested person” (as such term is defined in the 1940 Act) of the Trust (“Independent Trustees”) voting separately, unanimously approved the continuation of each of the Advisory Agreements for a one-year period.
In reaching the decision to approve the continuation of each of the Advisory Agreements, the Board considered information and materials furnished by New York Life Investments, NYL Investors and WMC in connection with an annual contract review process undertaken by the Board that took place at meetings of the Board and its Contracts Committee from September 2023 through December 2023, including information and materials furnished by New York Life Investments, NYL Investors and WMC in response to requests prepared on behalf of the Board, and in consultation with the Independent Trustees, by independent legal counsel to the Independent Trustees, which encompassed a variety of topics, including those summarized below. Information and materials requested by and furnished to the Board for consideration in connection with the contract review process included, among other items, reports on the Portfolio and “peer funds” prepared by Institutional Shareholder Services Inc. (“ISS”), an independent third-party service provider engaged by the Board to report objectively on the Portfolio’s investment performance, management fee and total expenses. The Board also considered information on the fees charged to other investment advisory clients of New York Life Investments, NYL Investors and/or WMC that follow investment strategies similar to those of the Portfolio, if any, and, when applicable, the rationale for differences in the Portfolio’s management and subadvisory fees and the fees charged to those other investment advisory clients. In addition, the Board considered information regarding the legal standards and fiduciary obligations applicable to its consideration of the continuation of each of the Advisory Agreements. The contract review process, including the structure and format for information and materials provided to the Board, has been developed in consultation with the Board. The Independent Trustees also met in executive sessions with their independent legal counsel and, for portions thereof, with senior management of New York Life Investments.
The Board’s deliberations with respect to the continuation of each of the Advisory Agreements reflect a year-long process, and the Board also took into account information furnished to the Board and its Committees throughout the year, as deemed relevant and appropriate by the Trustees, including, among other items, reports on investment performance of the Portfolio and investment-related matters for the Portfolio as well as presentations from New York Life Investments and, generally
annually, NYL Investors and WMC personnel. In addition, the Board took into account other information provided by New York Life Investments throughout the year, including, among other items, periodic reports on legal and compliance matters, risk management, portfolio turnover, brokerage commissions and non-advisory services provided to the Portfolio by New York Life Investments, as deemed relevant and appropriate by the Trustees.
In addition to information provided to the Board throughout the year, the Board received information in connection with its June 2023 meeting provided specifically in response to requests prepared on behalf of the Board, and in consultation with the Independent Trustees, by independent legal counsel to the Independent Trustees regarding the Portfolio’s distribution arrangements. In addition, the Board received information regarding the Portfolio’s asset levels, share purchase and redemption activity and the payment of Rule 12b-1 and/or certain other fees by applicable share classes of the Portfolio, among other information.
In considering the continuation of each of the Advisory Agreements, the Trustees reviewed and evaluated the information and factors they believed to reasonably be necessary and appropriate in light of legal advice furnished to them by independent legal counsel to the Independent Trustees and through the exercise of their own business judgment. Although individual Trustees may have weighed certain factors or information differently and the Board did not consider any single factor or information controlling in reaching its decision, the factors that figured prominently in the Board’s consideration of the continuation of each of the Advisory Agreements are summarized in more detail below and include, among other factors: (i) the nature, extent and quality of the services provided to the Portfolio by New York Life Investments, NYL Investors and WMC; (ii) the qualifications of the portfolio managers of the Portfolio and the historical investment performance of the Portfolio, New York Life Investments, NYL Investors and WMC; (iii) the costs of the services provided, and profits realized, by New York Life Investments, NYL Investors and WMC with respect to their relationships with the Portfolio; (iv) the extent to which economies of scale have been realized or may be realized if the Portfolio grows and the extent to which any economies of scale have been shared, have benefited or may benefit the Portfolio’s shareholders; and (v) the reasonableness of the Portfolio’s management and subadvisory fees and total ordinary operating expenses. Although the Board recognized that comparisons between the Portfolio’s fees and expenses and those of other funds are imprecise given different terms of agreements, variations in fund strategies and other factors, the Board considered the reasonableness of the Portfolio’s management fee and total ordinary operating expenses as compared to the peer funds identified by ISS. Throughout their considerations, the Trustees acknowledged the commitment of New York Life Investments and its affiliates to serve the MainStay Group of Funds, as well as their capacity, experience, resources, financial stability and reputations. The Trustees also acknowledged the entrepreneurial and other risks assumed by New York Life Investments in sponsoring and managing the Portfolio. With
| 34 | MainStay VP Balanced Portfolio |
respect to the Subadvisory Agreements, the Board took into account New York Life Investments’ recommendation to approve the continuation of the Subadvisory Agreements.
The Trustees noted that, throughout the year, the Trustees are afforded an opportunity to ask questions of, and request additional information or materials from, New York Life Investments, NYL Investors and WMC. The Board’s decision with respect to each of the Advisory Agreements may have also been based, in part, on the Board’s knowledge of New York Life Investments, NYL Investors and WMC, resulting from, among other things, the Board’s consideration of each of the Advisory Agreements in prior years, the advisory agreements for other funds in the MainStay Group of Funds, the Board’s review throughout the year of the performance and operations of other funds in the MainStay Group of Funds and each Trustee’s business judgment and industry experience. In addition to considering the above-referenced factors, the Board observed that in the marketplace, notably under variable life insurance policies and variable annuity contracts for which the Portfolio serves as an investment option, there are a range of investment options available to investors and that the Portfolio’s shareholders, having had the opportunity to consider other investment options, have invested in the Portfolio.
The factors that figured prominently in the Board’s decision to approve the continuation of each of the Advisory Agreements during the Board’s December 6–7, 2023 meeting are summarized in more detail below.
Nature, Extent and Quality of Services Provided by New York Life Investments, NYL Investors and WMC
The Board examined the nature, extent and quality of the services that New York Life Investments provides to the Portfolio. The Board evaluated New York Life Investments’ experience and capabilities in serving as manager of the Portfolio and considered that the Portfolio operates in a “manager-of-managers” structure. The Board also considered New York Life Investments’ responsibilities and services provided pursuant to this structure, including overseeing the services provided by NYL Investors and WMC, evaluating the performance of NYL Investors and WMC, making recommendations to the Board as to whether the Subadvisory Agreements should be renewed, modified or terminated and periodically reporting to the Board regarding the results of New York Life Investments’ evaluation and monitoring functions. The Board noted that New York Life Investments manages other mutual funds, serves a variety of other investment advisory clients, including other pooled investment vehicles, and has experience overseeing mutual fund service providers, including subadvisors. The Board considered the experience of senior personnel at New York Life Investments providing management and administrative and other non-advisory services to the Portfolio. The Board observed that New York Life Investments devotes significant resources and time to providing management and administrative and other non-advisory services to the Portfolio, including New York Life Investments’ oversight and due diligence reviews of NYL Investors and WMC and ongoing analysis of, and interactions with, NYL Investors and WMC with respect
to, among other things, the Portfolio’s investment performance and risks as well as NYL Investors’ and WMC’s investment capabilities and subadvisory services with respect to the Portfolio.
The Board also considered the range of services that New York Life Investments provides to the Portfolio under the terms of the Management Agreement, including: (i) fund accounting and ongoing supervisory services provided by New York Life Investments’ Fund Administration and Accounting Group; (ii) investment supervisory and analytical services provided by New York Life Investments’ Investment Consulting Group; (iii) compliance services provided by the Trust’s Chief Compliance Officer as well as New York Life Investments’ compliance department, including supervision and implementation of the Portfolio’s compliance program; (iv) legal services provided by New York Life Investments’ Office of the General Counsel; and (v) risk management monitoring and analysis by compliance and investment personnel. In addition, the Board considered New York Life Investments’ willingness to invest in personnel and other resources, such as cyber security, information security and business continuity planning, that may benefit the Portfolio and noted that New York Life Investments is responsible for compensating the Trust’s officers, except for a portion of the salary of the Trust’s Chief Compliance Officer. The Board recognized that New York Life Investments provides certain other non-advisory services to the Portfolio and has over time provided an increasingly broad array of non-advisory services to the MainStay Group of Funds as a result of regulatory and other developments.
The Board also examined the range, and the nature, extent and quality, of the investment advisory services that NYL Investors and WMC provide to the Portfolio and considered the terms of each of the Advisory Agreements. The Board evaluated NYL Investors’ and WMC’s experience and performance in serving as subadvisors to the Portfolio and advising other portfolios and NYL Investors’ and WMC’s track record and experience in providing investment advisory services as well as the experience of investment advisory, senior management and administrative personnel at NYL Investors and WMC. The Board considered New York Life Investments’, NYL Investors’ and WMC’s overall resources, legal and compliance environment, capabilities, reputation, financial condition and history. In addition to information provided in connection with quarterly meetings with the Trust’s Chief Compliance Officer, the Board considered information regarding the compliance policies and procedures of New York Life Investments, NYL Investors and WMC and acknowledged their commitment to further developing and strengthening compliance programs that may relate to the Portfolio. The Board also considered NYL Investors’ and WMC’s ability to recruit and retain qualified investment professionals and willingness to invest in personnel and other resources that may benefit the Portfolio. In this regard, the Board considered the qualifications and experience of the Portfolio’s portfolio managers, the number of accounts managed by the portfolio managers and the method for compensating the portfolio managers.
In addition, the Board considered information provided by New York Life Investments, NYL Investors and WMC regarding their respective business continuity and disaster recovery plans.
Board Consideration and Approval of Management Agreement and Subadvisory
Agreements (Unaudited) (continued)
Based on these considerations, among others, the Board concluded that the Portfolio would likely continue to benefit from the nature, extent and quality of these services.
Investment Performance
In evaluating the Portfolio’s investment performance, the Board considered investment performance results over various periods in light of the Portfolio’s investment objective, strategies and risks. The Board considered investment reports on, and analysis of, the Portfolio’s performance provided to the Board throughout the year. These reports include, among other items, information on the Portfolio’s gross and net returns, the Portfolio’s investment performance compared to a relevant investment category and the Portfolio’s benchmarks, the Portfolio’s risk-adjusted investment performance and the Portfolio’s investment performance as compared to peer funds, as appropriate, as well as portfolio attribution information and commentary on the effect of market conditions. The Board also considered information provided by ISS showing the investment performance of the Portfolio as compared to peer funds. In addition, the Board reviewed the methodology used by ISS to construct the group of peer funds for comparative purposes.
The Board also took into account its discussions with senior management at New York Life Investments concerning the Portfolio’s investment performance over various periods as well as discussions between representatives of NYL Investors and WMC and the members of the Board’s Investment Committee, which generally occur on an annual basis. In considering the investment performance of the Portfolio, the Board noted that the Portfolio underperformed its peer funds for the one-year period ended July 31, 2023, performed in line with its peer funds for the five- and ten-year periods ended July 31, 2023, and performed favorably relative to its peer funds for the three-year period ended July 31, 2023. The Board considered its discussions with representatives from New York Life Investments, NYL Investors and Wellington regarding the Portfolio’s investment performance.
Based on these considerations, among others, the Board concluded that its review of the Portfolio’s investment performance and related information supported a determination to approve the continuation of each of the Advisory Agreements.
Costs of the Services Provided, and Profits and Other Benefits Realized, by New York Life Investments, NYL Investors and WMC
The Board considered the costs of the services provided under each of the Advisory Agreements. The Board also considered the profitability of New York Life Investments and its affiliates, including NYL Investors, and WMC due to their relationships with the Portfolio as well as by New York Life Investments and its affiliates, including NYL Investors, due to their relationships with the MainStay Group of Funds. Because NYL Investors is an affiliate of New York Life Investments whose subadvisory fee is paid by New York Life Investments, not the Portfolio, the Board considered cost and profitability information for New York Life Investments and NYL
Investors in the aggregate. With respect to the profitability of WMC’s relationship with the Portfolio, the Board considered information from New York Life Investments that WMC’s subadvisory fee reflected an arm’s-length negotiation and that this fee is paid by New York Life Investments, not the Portfolio, and the relevance of WMC’s profitability was considered by the Trustees in that context. On this basis, the Board primarily considered the costs and profitability for New York Life Investments and its affiliates with respect to the Portfolio.
In addition, the Board acknowledged the difficulty in obtaining reliable comparative data about mutual fund managers’ profitability because such information generally is not publicly available and may be impacted by numerous factors, including the structure of a fund manager’s organization, the types of funds it manages, the methodology used to allocate certain fixed costs to specific funds and the manager’s capital structure and costs of capital.
In evaluating the costs of the services provided by New York Life Investments, NYL Investors and WMC and profitability of New York Life Investments and its affiliates, including NYL Investors, and WMC due to their relationships with the Portfolio, the Board considered, among other factors, New York Life Investments’ and its affiliates’, including NYL Investors’, and WMC’s continuing investments in, or willingness to invest in, personnel and other resources that may support and further enhance the management of the Portfolio, and that New York Life Investments is responsible for paying the subadvisory fees for the Portfolio. The Board also considered the financial resources of New York Life Investments, NYL Investors and WMC and acknowledged that New York Life Investments, NYL Investors and WMC must be in a position to recruit and retain experienced professional personnel and to maintain a strong financial position for New York Life Investments, NYL Investors and WMC to continue to provide high-quality services to the Portfolio. The Board recognized that the Portfolio benefits from the allocation of certain fixed costs among the funds in the MainStay Group of Funds, among other expected benefits resulting from its relationship with New York Life Investments.
The Board considered information regarding New York Life Investments’ methodology for calculating profitability and allocating costs provided by New York Life Investments in connection with the fund profitability analysis presented to the Board. The Board concluded that New York Life Investments’ methods for allocating costs and procedures for estimating overall profitability of the relationship with the funds in the MainStay Group of Funds were reasonable. The Board recognized the difficulty in calculating and evaluating a manager’s profitability with respect to the Portfolio and considered that other profitability methodologies may also be reasonable.
The Board also considered certain fall-out benefits that may be realized by New York Life Investments and its affiliates, including NYL Investors, and WMC and its affiliates due to their relationships with the Portfolio, including reputational and other indirect benefits. The Board recognized, for example, the benefits to WMC from legally permitted “soft-dollar” arrangements by which brokers provide research and other services to
| 36 | MainStay VP Balanced Portfolio |
WMC in exchange for commissions paid by the Portfolio with respect to trades in the Portfolio’s portfolio securities. In this regard, the Board also requested and considered information from New York Life Investments concerning other material business relationships between WMC and its affiliates and New York Life Investments and its affiliates and considered the existence of a strategic partnership between New York Life Investments and WMC that relates to certain current and future products and represents a potential conflict of interest associated with New York Life Investments’ recommendation to approve the Subadvisory Agreement. In addition, the Board considered its review of the management agreement for a money market fund advised by New York Life Investments and an affiliated subadvisor that serves as an investment option for the Portfolio, including the potential rationale for and costs associated with investments in this money market fund by the Portfolio, if any, and considered information from New York Life Investments that the nature and type of specific investment advisory services provided to this money market fund are distinct from, or in addition to, the investment advisory services provided to the Portfolio. In addition, the Board considered the potential dividend received tax deduction for insurance company affiliates of New York Life Investments from the Portfolio’s securities lending activity.
The Board noted that the Portfolio serves as an investment option primarily under variable contracts issued by affiliates of New York Life Investments that would receive fees under those contracts. The Board observed that, in addition to fees earned by New York Life Investments under the Management Agreement for managing the Portfolio, New York Life Investments’ affiliates also earn revenues from serving the Portfolio in various other capacities, including as the Portfolio’s distributor, and insurance companies affiliated with New York Life Investments would be entitled to receive fees from the Portfolio under a distribution and service plan adopted pursuant to Rule 12b-1 under the 1940 Act. The Board considered information about these other revenues and their impact on the profitability of the relationship with the Portfolio to New York Life Investments and its affiliates. The Board noted that, although it assessed the overall profitability of the relationship with the Portfolio to New York Life Investments and its affiliates as part of the contract review process, when considering the reasonableness of the fee paid to New York Life Investments under the Management Agreement, the Board considered the profitability of New York Life Investments’ relationship with the Portfolio on a pre-tax basis and without regard to distribution expenses incurred by New York Life Investments from its own resources.
After evaluating the information deemed relevant by the Trustees, the Board concluded that any profits realized by New York Life Investments and its affiliates, including NYL Investors, due to their relationships with the Portfolio were not excessive and other expected benefits that may accrue to New York Life Investments and its affiliates, including NYL Investors, are reasonable, and other expected benefits that may accrue to New York Life Investments and its affiliates are reasonable and other expected benefits that may accrue to WMC and its affiliates are consistent with those expected for a subadvisor to a mutual fund. With respect to WMC, the Board considered that any profits realized by WMC
due to its relationship with the Portfolio are the result of arm’s-length negotiations between New York Life Investments and WMC, acknowledging that any such profits are based on the subadvisory fee paid to WMC by New York Life Investments, not the Portfolio.
Management and Subadvisory Fees and Total Ordinary Operating Expenses
The Board evaluated the reasonableness of the fee paid under each of the Advisory Agreements and the Portfolio’s total ordinary operating expenses. With respect to the management fee and subadvisory fees, the Board primarily considered the reasonableness of the management fee paid by the Portfolio to New York Life Investments because the subadvisory fees paid to NYL Investors and WMC are paid by New York Life Investments, not the Portfolio. The Board also considered the reasonableness of the subadvisory fees paid by New York Life Investments and the amount of the management fee retained by New York Life Investments.
In assessing the reasonableness of the Portfolio’s fees and expenses, the Board primarily considered comparative data provided by ISS on the fees and expenses of similar mutual funds managed by other investment advisers. The Board reviewed the methodology used by ISS to construct the group of peer funds for comparative purposes. In addition, the Board considered information provided by New York Life Investments, NYL Investors and WMC on fees charged to other investment advisory clients, including institutional separate accounts and/or other funds, that follow investment strategies similar to those of the Portfolio, if any. The Board considered the contractual management fee schedule for the Portfolio as compared to those for such other investment advisory clients, taking into account the rationale for differences in fee schedules. The Board also took into account information provided by New York Life Investments about the more extensive scope of services provided to registered investment companies, such as the Portfolio, as compared with other investment advisory clients. Additionally, the Board considered the impact of contractual breakpoints and voluntary waivers on the Portfolio’s net management fee and expenses. The Board also considered that in proposing fees for the Portfolio, New York Life Investments considers the competitive marketplace for mutual funds.
Based on the factors outlined above, among other considerations, the Board concluded that the Portfolio’s management fee and total ordinary operating expenses are within a range that is competitive and support a conclusion that these fees and expenses are reasonable.
Economies of Scale
The Board considered information regarding economies of scale, including whether economies of scale may exist with respect to the Portfolio and whether the Portfolio’s management fee and expense structure permits any economies of scale to be appropriately shared with the Portfolio’s shareholders. The Board also considered a report from New York Life Investments, previously prepared at the request of the Board, that addressed economies of scale, including with respect to the
Board Consideration and Approval of Management Agreement and Subadvisory
Agreements (Unaudited) (continued)
mutual fund business generally, and the various ways in which the benefits of economies of scale may be shared with the funds in the MainStay Group of Funds. Although the Board recognized the difficulty of determining economies of scale with precision, the Board acknowledged that economies of scale may be shared with the Portfolio in a number of ways, including, for example, through the imposition of fee breakpoints, initially setting management fee rates at scale or making additional investments to enhance the services provided to the Portfolio. The Board reviewed information from New York Life Investments showing how the Portfolio’s management fee schedule compared to fee schedules of other funds and accounts managed by New York Life Investments. The Board also reviewed information from ISS showing how the Portfolio’s management fee schedule compared with fees paid for similar services by peer funds at varying asset levels.
Based on this information, the Board concluded that economies of scale are appropriately shared for the benefit of the Portfolio’s shareholders through the Portfolio’s management fee and expense structure and other methods to share benefits from economies of scale.
Conclusion
On the basis of the information and factors summarized above, among other information and factors deemed relevant by the Trustees, and the evaluation thereof, the Board, including the Independent Trustees voting separately, unanimously voted to approve the continuation of each of the Advisory Agreements.
| 38 | MainStay VP Balanced Portfolio |
Proxy Voting Policies and Procedures and Proxy Voting Record
The Portfolio is required to file with the SEC its proxy voting record for the 12-month period ending June 30 on Form N-PX. A description of the policies and procedures that are used to vote proxies relating to portfolio securities of the Portfolio is available free of charge upon request by calling 800-598-2019 or visiting the SEC's website at www.sec.gov. The most recent Form N-PX or proxy voting record is available free of charge upon request by calling 800-598-2019; visiting https://www.newyorklifeinvestments.com/investment-products/vp; or visiting the SEC’s website at www.sec.gov.
Shareholder Reports and Quarterly Portfolio Disclosure
The Portfolio is required to file its complete schedule of portfolio holdings with the SEC 60 days after its first and third fiscal quarter on Form N-PORT. The Portfolio's holdings report is available free of charge upon request by calling 800-598-2019 or by visiting the SEC’s website at www.sec.gov.
Board of Trustees and Officers (Unaudited)
The Trustees and officers of the Portfolio are listed below. The Board oversees the MainStay Group of Funds (which consists of MainStay Funds and MainStay Funds Trust), MainStay VP Funds Trust, MainStay MacKay DefinedTerm Municipal Opportunities Fund, MainStay CBRE Global Infrastructure Megatrends Term Fund, the Manager and the Subadvisors, and elects the officers of the Portfolios who are responsible for the day-to-day operations of the Portfolio. Information pertaining to the Trustees and officers is set forth below. Each Trustee serves until his or her successor is elected and qualified or until his or her resignation,
death or removal. Under the Board’s retirement policy, unless an exception is made, a Trustee must tender his or her resignation by the end of the calendar year during which he or she reaches the age of 75. Officers are elected annually by the Board. The business address of each Trustee and officer listed below is 51 Madison Avenue, New York, New York 10010. A majority of the Trustees are not “interested persons” (as defined by the 1940 Act and rules adopted by the SEC thereunder) of the Portfolio (“Independent Trustees”).
| | Name and
Year of Birth | Term of Office,
Position(s) Held and
Length of Service | Principal Occupation(s)
During Past Five Years | Number of
Portfolios in
Fund Complex
Overseen by
Trustee | Other Directorships
Held by Trustee |
| | | | | | |
| | Naïm Abou-Jaoudé*
1966 | MainStay VP Funds Trust: Trustee since 2023 | Chief Executive Officer of New York Life Investment Management LLC (since 2023). Chief Executive Officer of Candriam (an affiliate of New York Life Investment Management LLC) (2007 to 2023). | 81 | MainStay Funds: Trustee since 2023 (11 Funds)
MainStay Funds Trust: Trustee since 2023 (37 Funds);
MainStay MacKay DefinedTerm Municipal Opportunities Fund: Trustee since 2023;
MainStay CBRE Global Infrastructure Megatrends Term Fund: Trustee since 2023; and
New York Life Investment Management International (Chair) since 2015 |
| * | This Trustee is considered to be an “interested person” of the MainStay Group of Funds, MainStay VP Funds Trust, MainStay CBRE Global Infrastructure Megatrends Term Fund and MainStay MacKay DefinedTerm Municipal Opportunities Fund, within the meaning of the 1940 Act because of his affiliation with New York Life Investment Management LLC and Candriam, as described in detail above in the column entitled “Principal Occupation(s) During Past Five Years.” |
| | |
| 40 | MainStay VP Balanced Portfolio |
| | Name and
Year of Birth | Term of Office,
Position(s) Held and
Length of Service | Principal Occupation(s)
During Past Five Years | Number of
Portfolios in
Fund Complex
Overseen by
Trustee | Other Directorships
Held by Trustee |
| | | | | | |
| | David H. Chow
1957 | MainStay VP Funds Trust: Trustee since January 2016, Advisory Board Member (June 2015 to December 2015) | Founder and CEO, DanCourt Management, LLC since 1999 | 81 | MainStay Funds: Trustee since January 2016, Advisory Board Member (June 2015 to December 2015) (11 Funds);
MainStay Funds Trust: Trustee since January 2016, Advisory Board Member (June 2015 to December 2015) (37 Funds);
MainStay MacKay DefinedTerm Municipal Opportunities Fund: Trustee since January 2016, Advisory Board Member (June 2015 to December 2015);
MainStay CBRE Global Infrastructure Megatrends Term Fund: Trustee since 2021;
VanEck Vectors Group of Exchange-Traded Funds: Trustee since 2006 and Independent Chairman of the Board of Trustees from 2008 to 2022 (57 portfolios); and
Berea College of Kentucky: Trustee since 2009, Chair of the Investment Committee since 2018 |
| | Karen Hammond
1956 | MainStay VP Funds Trust: Trustee since December 2021, Advisory Board Member (June 2021 to December 2021)
| Retired, Managing Director, Devonshire Investors (2007 to 2013); Senior Vice President, Fidelity Management & Research Co. (2005 to 2007); Senior Vice President and Corporate Treasurer, FMR Corp. (2003 to 2005); Chief Operating Officer, Fidelity Investments Japan (2001 to 2003) | 81 | MainStay Funds: Trustee since December 2021, Advisory Board Member (June 2021 to December 2021) (11 Funds);
MainStay Funds Trust: Trustee since December 2021, Advisory Board Member (June 2021 to December 2021) (37 Funds);
MainStay MacKay DefinedTerm Municipal Opportunities Fund: Trustee since December 2021, Advisory Board Member (June 2021 to December 2021);
MainStay CBRE Global Infrastructure Megatrends Term Fund: Trustee since December 2021, Advisory Board Member (June 2021 to December 2021);
Two Harbors Investment Corp.: Director since 2018;
Rhode Island State Investment Commission: Member since 2017; and
Blue Cross Blue Shield of Rhode Island: Director since 2019 |
| | Susan B. Kerley
1951 | MainStay VP Funds Trust: Chair since 2017 and Trustee since 2007** | President, Strategic Management Advisors LLC since 1990 | 81 | MainStay Funds: Chair since January 2017 and Trustee since 2007 (11 Funds); MainStay Funds Trust: Chair since January 2017 and Trustee since 1990 (37 Funds)***;
MainStay MacKay DefinedTerm Municipal Opportunities Fund: Chair since January 2017 and Trustee since 2011;
MainStay CBRE Global Infrastructure Megatrends Term Fund: Trustee since June 2021; and
Legg Mason Partners Funds: Trustee since 1991 (45 portfolios) |
Board of Trustees and Officers (Unaudited) (continued)
| | Name and
Year of Birth | Term of Office,
Position(s) Held and
Length of Service | Principal Occupation(s)
During Past Five Years | Number of
Portfolios in
Fund Complex
Overseen by
Trustee | Other Directorships
Held by Trustee |
| | | | | | |
| | Alan R. Latshaw
1951 | MainStay VP Funds Trust: Trustee since 2007** | Retired; Partner, Ernst & Young LLP (2002 to 2003); Partner, Arthur Andersen LLP (1989 to 2002); Consultant to the MainStay Funds Audit and Compliance Committee (2004 to 2006) | 81 | MainStay Funds: Trustee since 2006 (11 Funds);
MainStay Funds Trust: Trustee since 2007 (37 Funds)***;
MainStay MacKay DefinedTerm Municipal Opportunities Fund: Trustee since 2011; and
MainStay CBRE Global Infrastructure Megatrends Term Fund: Trustee since June 2021 |
| | Jacques P. Perold
1958 | MainStay VP Funds Trust: Trustee since January 2016, Advisory Board Member (June 2015 to December 2015) | Founder and Chief Executive Officer, CapShift Advisors LLC (since 2018); President, Fidelity Management & Research Company (2009 to 2014); President and Chief Investment Officer, Geode Capital Management, LLC (2001 to 2009) | 81 | MainStay Funds: Trustee since January 2016, Advisory Board Member (June 2015 to December 2015) (11 Funds);
MainStay Funds Trust: Trustee since January 2016, Advisory Board Member (June 2015 to December 2015) (37 Funds);
MainStay MacKay DefinedTerm Municipal Opportunities Fund: Trustee since January 2016, Advisory Board Member (June 2015 to December 2015);
MainStay CBRE Global Infrastructure Megatrends Term Fund: Trustee since June 2021;
Allstate Corporation: Director since 2015;
Partners in Health: Trustee since 2019; and
MSCI Inc.: Director since 2017 |
| | Richard S. Trutanic
1952 | MainStay VP Funds Trust: Trustee since 2007** | Chairman and Chief Executive Officer, Somerset & Company (financial advisory firm) since 2004; Managing Director, The Carlyle Group (private investment firm) (2002 to 2004); Senior Managing Director, Partner and Board Member, Groupe Arnault S.A. (private investment firm) (1999 to 2002) | 81 | MainStay Funds: Trustee since 1994 (11 Funds);
MainStay Funds Trust: Trustee since 2007 (37 Funds)***;
MainStay MacKay DefinedTerm Municipal Opportunities Fund: Trustee since 2011; and
MainStay CBRE Global Infrastructure Megatrends Term Fund: Trustee since June 2021 |
| ** | Includes prior service as a Director of MainStay VP Series Fund, Inc., the predecessor to MainStay VP Funds Trust. |
| *** | Includes prior service as a Director/Trustee of certain predecessor entities to MainStay Funds Trust. |
| 42 | MainStay VP Balanced Portfolio |
| | Name and
Year of Birth | Position(s) Held and
Length of Service | Principal Occupation(s)
During Past Five Years | |
| | | | | |
| | Kirk C. Lehneis
1974 | President, MainStay VP Funds Trust (since 2017) | Chief Operating Officer and Senior Managing Director (since 2016), New York Life Investment Management LLC and New York Life Investment Management Holdings LLC; Member of the Board of Managers (since 2017) and Senior Managing Director (since 2018), NYLIFE Distributors LLC; Chairman of the Board and Senior Managing Director, NYLIM Service Company LLC (since 2017); Trustee, President and Principal Executive Officer of IndexIQ Trust, IndexIQ ETF Trust and IndexIQ Active ETF Trust (since 2018); President, MainStay CBRE Global Infrastructure Megatrends Term Fund (since 2021), MainStay MacKay DefinedTerm Municipal Opportunities Fund, MainStay Funds and MainStay Funds Trust (since 2017); Senior Managing Director, Global Product Development (from 2015 to 2016); Managing Director, Product Development (from 2010 to 2015), New York Life Investment Management LLC | |
| | Jack R. Benintende
1964 | Treasurer and Principal Financial and Accounting Officer, MainStay VP Funds Trust (since 2007)** | Managing Director, New York Life Investment Management LLC (since 2007); Treasurer and Principal Financial and Accounting Officer, MainStay CBRE Global Infrastructure Megatrends Term Fund (since 2021), MainStay MacKay DefinedTerm Municipal Opportunities Fund (since 2011), MainStay Funds Trust (since 2009) and MainStay Funds (since 2007); and Assistant Treasurer, New York Life Investment Management Holdings LLC (2008 to 2012) | |
| | J. Kevin Gao
1967 | Secretary and Chief Legal Officer, MainStay VP Funds Trust (since 2010)** | Managing Director and Associate General Counsel, New York Life Investment Management LLC (since 2010); Secretary and Chief Legal Officer, MainStay CBRE Global Infrastructure Megatrends Term Fund (since 2021), MainStay MacKay DefinedTerm Municipal Opportunities Fund (since 2011), MainStay Funds and MainStay Funds Trust (since 2010) | |
| | Kevin M. Gleason
1967 | Vice President and Chief Compliance Officer, MainStay VP Funds Trust (since June 2022) | Vice President and Chief Compliance Officer, IndexIQ Trust, IndexIQ ETF Trust and IndexIQ Active ETF Trust (since June 2022); Vice President and Chief Compliance Officer, MainStay CBRE Global Infrastructure Megatrends Term Fund, MainStay MacKay DefinedTerm Municipal Opportunities Fund (since June 2022); MainStay Funds Trust and MainStay Funds (since June 2022); Senior Vice President, Voya Investment Management and Chief Compliance Officer, Voya Family of Funds (2012 to 2022) | |
| | Scott T. Harrington
1959 | Vice President— Administration, MainStay VP Funds Trust (since 2005)** | Managing Director, New York Life Investment Management LLC (including predecessor advisory organizations) (since 2000); Member of the Board of Directors, New York Life Trust Company (since 2009); Vice President—Administration, MainStay CBRE Global Infrastructure Megatrends Term Fund (since 2021), MainStay MacKay DefinedTerm Municipal Opportunities Fund (since 2011), MainStay Funds Trust and MainStay Funds (since 2009) | |
| * | The officers listed above are considered to be “interested persons” of the MainStay Group of Funds, MainStay VP Funds Trust, MainStay CBRE Global Infrastructure Megatrends Term Fund and MainStay MacKay DefinedTerm Municipal Opportunities Fund within the meaning of the 1940 Act because of their affiliation with the MainStay Group of Funds, New York Life Insurance Company and/or its affiliates, including New York Life Investment Management LLC, New York Life Insurance Company, NYLIM Service Company LLC, NYLIFE Securities LLC and/or NYLIFE Distributors LLC, as described in detail in the column captioned “Principal Occupation(s) During Past Five Years.” Officers are elected annually by the Board. |
| ** | Includes prior service as an Officer of MainStay VP Series Fund, Inc., the predecessor to MainStay VP Funds Trust. |
Officers of the Trust (Who are not Trustees)*
This page intentionally left blank
This page intentionally left blank.
This page intentionally left blank.
MainStay VP Portfolios
MainStay VP offers a wide range of Portfolios. The full array of MainStay VP offerings is listed here, with information about the manager, subadvisors, legal counsel, and independent registered public accounting firm.
Equity
MainStay VP American Century Sustainable Equity Portfolio
MainStay VP Candriam Emerging Markets Equity Portfolio
MainStay VP Epoch U.S. Equity Yield Portfolio
MainStay VP Fidelity Institutional AM® Utilities Portfolio†
MainStay VP Natural Resources Portfolio
MainStay VP PineStone International Equity Portfolio1
MainStay VP S&P 500 Index Portfolio
MainStay VP Small Cap Growth Portfolio
MainStay VP Wellington Growth Portfolio
MainStay VP Wellington Mid Cap Portfolio
MainStay VP Wellington Small Cap Portfolio
MainStay VP Wellington U.S. Equity Portfolio
MainStay VP Winslow Large Cap Growth Portfolio
Mixed Asset
MainStay VP Balanced Portfolio
MainStay VP Income Builder Portfolio
MainStay VP Janus Henderson Balanced Portfolio
MainStay VP MacKay Convertible Portfolio
Income
MainStay VP Bond Portfolio
MainStay VP Floating Rate Portfolio
MainStay VP Indexed Bond Portfolio
MainStay VP MacKay Government Portfolio2
MainStay VP MacKay High Yield Corporate Bond Portfolio
MainStay VP MacKay Strategic Bond Portfolio
MainStay VP PIMCO Real Return Portfolio
Money Market
MainStay VP U.S. Government Money Market Portfolio
Alternative
MainStay VP CBRE Global Infrastructure Portfolio
MainStay VP IQ Hedge Multi-Strategy Portfolio
Asset Allocation
MainStay VP Conservative Allocation Portfolio
MainStay VP Equity Allocation Portfolio
MainStay VP Growth Allocation Portfolio
MainStay VP Moderate Allocation Portfolio
Manager
New York Life Investment Management LLC
New York, New York
Subadvisors
American Century Investment Management, Inc.
Kansas City, Missouri
Brown Advisory LLC
Baltimore, Maryland
Candriam*
Strassen, Luxembourg
CBRE Investment Management Listed Real Assets LLC
Radnor, Pennsylvania
Epoch Investment Partners, Inc.
New York, New York
FIAM LLC
Smithfield, Rhode Island
IndexIQ Advisors LLC*
New York, New York
Janus Henderson Investors US LLC
Denver, Colorado
MacKay Shields LLC*
New York, New York
Newton Investment Management North America, LLC
Boston, Massachusetts
NYL Investors LLC*
New York, New York
Pacific Investment Management Company LLC
Newport Beach, California
PineStone Asset Management Inc.
Montreal, Québec
Segall Bryant & Hamill, LLC
Chicago, Illinois
Wellington Management Company LLP
Boston, Massachusetts
Winslow Capital Management, LLC
Minneapolis, Minnesota
Legal Counsel
Dechert LLP
Washington, District of Columbia
Independent Registered Public Accounting Firm
PricewaterhouseCoopers LLP
New York, New York
Distributor
NYLIFE Distributors LLC*
Jersey City, New Jersey
Custodian
JPMorgan Chase Bank, N.A.
New York, New York
Some Portfolios may not be available in all products.
† Fidelity Institutional AM is a registered trade mark of FMR LLC. Used with permission.
* An affiliate of New York Life Investment Management LLC.
| 1. | Prior to August 28, 2023, the Portfolio's name was MainStay VP MacKay International Equity Portfolio. |
| 2. | Effective on or about May 1, 2024, the MainStay VP MacKay Government Portfolio will be renamed the MainStay VP U.S. Infrastructure Bond Portfolio. |
Not part of the Annual Report
2023 Annual Report
This report is for the general information of New York Life Variable Annuities and NYLIAC Variable Universal Life Insurance Products policyowners. It must be preceded or accompanied by the appropriate product(s) and funds prospectuses if it is given to anyone who is not an owner of a New York Life variable annuity policy or a NYLIAC Variable Universal Life Insurance Product. This report does not offer for sale or solicit orders to purchase securities.
The performance data quoted in this report represents past performance. Past performance is no guarantee of future results. Due to market volatility and other factors, current performance may be lower or higher than the figures shown. The most recent month-end performance summary for your variable annuity or variable life policy is available by calling 800-598-2019 and is updated periodically on newyorklife.com.
The New York Life Variable Annuities and NYLIAC Variable Universal Life Insurance Products are issued by New York Life Insurance and Annuity Corporation (a Delaware Corporation) and distributed by NYLIFE Distributors LLC (Member FINRA/SIPC).
New York Life Insurance Company
New York Life Insurance and Annuity
Corporation (NYLIAC) (A Delaware Corporation)
51 Madison Avenue, Room 551
New York, NY 10010
newyorklife.com
newyorklifeinvestments.com
NYLIFE Distributors LLC, 30 Hudson Street, Jersey City, NJ 07302
New York Life Investment Management LLC is the investment manager to the MainStay VP Funds Trust
©2024 by NYLIFE Distributors LLC. All rights reserved.
You may obtain copies of the Prospectus and the Statement of Additional Information free of charge, upon request, by calling toll-free 800-598-2019 or writing to New York Life Insurance and Annuity Corporation, 51 Madison Avenue, New York, NY 10010.
| Not FDIC Insured | No Bank Guarantee | May Lose Value |
(NYLIAC) NI508
MainStay VP Bond Portfolio
Message from the President and Annual Report
December 31, 2023
Special Notice:
Beginning in July 2024, new regulations issued by the Securities and Exchange Commission (SEC) will take effect requiring open-end mutual fund companies and ETFs to (1) overhaul the content of their shareholder reports and (2) mail paper copies of the new tailored shareholder reports to shareholders who have not opted to receive these documents electronically.
If you have not yet elected to receive your shareholder reports electronically, please contact your financial intermediary or visit our website.
| Not FDIC/NCUA Insured | Not a Deposit | May Lose Value | No Bank Guarantee | Not Insured by Any Government Agency |
This page intentionally left blank
Message from the President
Against a backdrop of easing inflationary pressures and continued economic growth, stocks and bonds generally gained ground during the 12-month period ended December 31, 2023, despite high levels of volatility and sharp disparities between the performance of the different market sectors.
Although the war in Ukraine, the outbreak of hostilities in the Middle East and several other notable events affected financial assets, inflation, interest rate, and economic growth trends stood at the forefront of market developments during most of the period. As the reporting period began, high levels of inflation already showed signs of easing in the face of aggressive rate hikes by U.S. Federal Reserve (the “Fed”). From a peak of 9.1% in June 2022, the annualized U.S. inflation rate dropped to 6.4% in January, and 3.4% in December 2023. At the same time, the Fed increased the benchmark federal funds rate from 4.25%–4.50% at the beginning of reporting period, to 5.25%–5.50% as of the end of 2023. Despite the increasing cost of capital and tighter lending environment that resulted from rising rates, economic growth remained surprisingly robust, bolstered by high levels of consumer spending, low levels of unemployment and better-than-expected corporate earnings. With the pace of rate increases slowing from the prior year, investors began hoping for an early shift to a looser monetary policy, with stock prices and bond yields reacting as economic data and statements from the Fed either reinforced or undercut those hopes. Following months of hawkish rhetoric, the Fed finally reversed its stance in December 2023, signaling a positive economic outlook with little chance of a recession and a likelihood of rate cuts in 2024.
The S&P 500® Index, a widely regarded benchmark of U.S. market performance, produced strong gains during the reporting period-– recovering all its losses from 2022 and approached new record territory. A preponderance of the Index’s gains were generated by a relatively small number of mega-cap stocks in the information technology, communication services and consumer discretionary sectors that stood to benefit from rapid developments in generative artificial intelligence (“AI”). Value-oriented, interest-rate sensitive and small-capitalization
shares lagged by significant margins, although market strength widened during the closing weeks of the reporting period. Most overseas equity markets trailed the U.S. market, as developed international economies experienced relatively low growth rates, and weak economic conditions in China undermined emerging markets.
Bonds produced generally positive returns, bolstered by attractive and relatively stable yields. The yield on the 10-year Treasury note hit a high of just under 5% in mid-October 2023, ranging between approximately 3.5% and 4.8% for most of the reporting period. The yield curve remained inverted throughout the year, with the 2-year Treasury yield modestly above the 10-year yield. Corporate bond prices trended moderately higher, generally outperforming government securities. After years of low yields and tight credit spreads, the corporate sector benefited from more attractive valuations and income opportunities. Among corporates, markets generally rewarded longer duration and lower credit quality, although an uptick in default rates posed added risks for high-yield corporate bonds. International bond markets produced mixed returns, with emerging-markets issues advancing over their developed-markets counterparts.
The market volatility of recent years reminds us of the constant need for experienced and steadfast portfolio management in the face of uncertainty. New York Life Investments remains dedicated to providing you, as a valued MainStay VP investor, with the guidance, resources and investment solutions you need to pursue your financial goals.
Thank you for trusting us to help meet your investment needs.
Sincerely,
Kirk C. Lehneis
President
The opinions expressed are as of the date of this report and are subject to change. There is no guarantee that any forecast made will come to pass. This material does not constitute investment advice and is not intended as an endorsement of any specific investment. Past performance is no guarantee of future results.
Not part of the Annual Report
Investors should refer to the Portfolio’s Summary Prospectus and/or Prospectus and consider the Portfolio’s investment objectives, strategies, risks, charges and expenses carefully before investing. The Summary Prospectus and/or Prospectus contain this and other information about the Portfolio. You may obtain copies of the Portfolio’s Summary Prospectus, Prospectus and Statement of Additional Information, which includes information about the MainStay VP Funds Trust's Trustees, free of charge, upon request, by calling toll-free 800-598-2019, by writing to New York Life Insurance and Annuity Corporation, 51 Madison Avenue, Room 251, New York, New York 10010 or by sending an email to MainStayShareholdersServices@nylim.com. These documents are also available at newyorklifeinvestments.com/investment-products/vp. Please read the Portfolio's Summary Prospectus and/or Prospectus carefully before investing. MainStay VP Funds Trust portfolios are separate account options which are purchased through a variable insurance or variable annuity contract.
Investment and Performance Comparison (Unaudited)
Performance data quoted represents past performance. Past performance is no guarantee of future results. Because of market volatility and other factors, current performance may be lower or higher than the figures shown. Investment return and principal value will fluctuate, and as a result, when shares are redeemed, they may be worth more or less than their original cost. The performance table and graph do not reflect any deduction of sales charges, mortality and expense charges, contract charges or administrative charges. Please refer to the Performance Summary appropriate for your policy. For performance information current to the most recent month-end, please call 800-598-2019 or visit www.newyorklife.com.
Performance figures may reflect certain fee waivers and/or expense limitations, without which total returns may have been different. For information on current fee waivers and/or expense limitations (if any), please refer to the Notes to Financial Statements.
| Average Annual Total Returns for the Year-Ended December 31, 2023 |
| Class | Inception
Date | One
Year | Five
Years | Ten
Years | Gross
Expense
Ratio1 |
| Initial Class Shares | 1/23/1984 | 5.58% | 0.96% | 1.70% | 0.53% |
| Service Class Shares | 6/4/2003 | 5.31 | 0.71 | 1.45 | 0.78 |
| 1. | The gross expense ratios presented reflect the Portfolio’s “Total Annual Portfolio Operating Expenses” from the most recent Prospectus and may differ from other expense ratios disclosed in this report. |
| Benchmark Performance* | One
Year | Five
Years | Ten
Years |
| Bloomberg U.S. Aggregate Bond Index1 | 5.53% | 1.10% | 1.81% |
| Morningstar Intermediate Core Bond Category Average2 | 5.59 | 1.05 | 1.66 |
| * | Returns for indices reflect no deductions for fees, expenses or taxes, except for foreign withholding taxes where applicable. Results assume reinvestment of all dividends and capital gains. An investment cannot be made directly in an index. |
| 1. | The Bloomberg U.S. Aggregate Bond Index is the Portfolio's primary benchmark. The Bloomberg U.S. Aggregate Bond Index is a broad-based benchmark that measures performance of the investment-grade, U.S. dollar denominated, fixed-rate taxable bond market, including Treasuries, government-related and corporate securities, mortgage-backed securities (agency fixed-rate and hybrid adjustable-rate mortgage pass-throughs), asset-backed securities and commercial mortgage-backed securities. |
| 2. | The Morningstar Intermediate Core Bond Category Average is representative of funds that invest primarily in investment-grade U.S. fixed-income issues including government, corporate, and securitized debt, and hold less than 5% in below-investment-grade exposures. Their durations (a measure of interest-rate sensitivity) typically range between 75% and 125% of the three-year average of the effective duration of the Morningstar Core Bond Index. Results are based on average total returns of similar funds with all dividends and capital gain distributions reinvested. |
Cost in Dollars of a $1,000 Investment in MainStay VP Bond Portfolio (Unaudited)
The example below is intended to describe the fees and expenses borne by shareholders during the six-month period from July 1, 2023 to December 31, 2023, and the impact of those costs on your investment.
Example
As a shareholder of the Portfolio you incur two types of costs: (1) transaction costs, including exchange fees and sales charges (loads) on purchases (as applicable), and (2) ongoing costs, including management fees, distribution and/or service (12b-1) fees and other Portfolio expenses (as applicable). This example is intended to help you understand your ongoing costs (in dollars) of investing in the Portfolio and to compare these costs with the ongoing costs of investing in other mutual funds. The example is based on an investment of $1,000 made at the beginning of the six-month period and held for the entire period from July 1, 2023 to December 31, 2023. Shares are only sold in connection with variable life and annuity contracts and the example does not reflect any contract level or transactional fees or expenses. If these costs had been included, your costs would have been higher.
This example illustrates your Portfolio’s ongoing costs in two ways:
Actual Expenses
The second and third data columns in the table below provide information about actual account values and actual expenses. You may use the information in these columns, together with the amount you invested, to estimate the expenses that you paid during the six months ended
December 31, 2023. Simply divide your account value by $1,000 (for example, an $8,600 account value divided by $1,000 = 8.6), then multiply the result by the number under the heading entitled “Expenses Paid During Period” to estimate the expenses you paid on your account during this period.
Hypothetical Example for Comparison Purposes
The fourth and fifth data columns in the table below provide information about hypothetical account values and hypothetical expenses based on the Portfolio’s actual expense ratio and an assumed rate of return of 5% per year before expenses, which is not the Portfolio’s actual return. The hypothetical account values and expenses may not be used to estimate the actual ending account balances or expenses you paid for the six-month period shown. You may use this information to compare the ongoing costs of investing in the Portfolio with the ongoing costs of investing in other mutual funds. To do so, compare this 5% hypothetical example with the 5% hypothetical examples that appear in the shareholder reports of the other mutual funds.
Please note that the expenses shown in the table are meant to highlight your ongoing costs only and do not reflect any transactional costs, such as exchange fees or sales charges (loads). Therefore, the fourth and fifth data columns of the table are useful in comparing ongoing costs only and will not help you determine the relative total costs of owning different funds. In addition, if these transactional costs were included, your costs would have been higher.
| Share Class | Beginning
Account
Value
7/1/23 | Ending Account
Value (Based
on Actual
Returns and
Expenses)
12/31/23 | Expenses
Paid
During
Period1 | Ending Account
Value (Based
on Hypothetical
5% Annualized
Return and
Actual Expenses)
12/31/23 | Expenses
Paid
During
Period1 | Net Expense
Ratio
During
Period2 |
| Initial Class Shares | $1,000.00 | $1,033.90 | $2.67 | $1,022.58 | $2.65 | 0.52% |
| Service Class Shares | $1,000.00 | $1,032.60 | $3.94 | $1,021.32 | $3.92 | 0.77% |
| 1. | Expenses are equal to the Portfolio’s annualized expense ratio of each class multiplied by the average account value over the period, divided by 365 and multiplied by 184 (to reflect the six-month period). The table above represents the actual expenses incurred during the six-month period. In addition to the fees and expenses which the Portfolio bears directly, it also indirectly bears a pro rata share of the fees and expenses of the underlying funds in which it invests. Such indirect expenses are not included in the above-reported expense figures. |
| 2. | Expenses are equal to the Portfolio's annualized expense ratio to reflect the six-month period. |
| 6 | MainStay VP Bond Portfolio |
Portfolio Composition as of December 31, 2023 (Unaudited)
See Portfolio of Investments beginning on page 10 for specific holdings within these categories. The Portfolio's holdings are subject to change.
Top Ten Holdings and/or Issuers Held as of December 31, 2023 (excluding short-term investments) (Unaudited)
| 1. | U.S. Treasury Notes, 4.375%-5.00%, due 10/31/25–11/30/30 |
| 2. | UMBS, 30 Year, 2.00%-7.50%, due 7/1/28–9/1/53 |
| 3. | UMBS Pool, 30 Year, 2.00%-5.50%, due 7/1/50–7/1/53 |
| 4. | U.S. Treasury Bonds, 1.875%-4.75%, due 2/15/41–11/15/53 |
| 5. | GNMA II, 30 Year, 2.00%-4.50%, due 1/20/51–9/20/52 |
| 6. | GNMA II, Single Family, 30 Year, 3.00%-5.00%, due 8/20/51–7/20/52 |
| 7. | Bank of America Corp., 1.734%-5.288%, due 7/22/27–4/25/34 |
| 8. | JPMorgan Chase & Co., 1.578%-5.546%, due 12/15/25–6/14/30 |
| 9. | GNMA, 0.612%-0.859%, due 8/16/59–9/16/63 |
| 10. | UBS Group AG, 6.301%-6.442%, due 12/22/27–9/22/34 |
Portfolio Management Discussion and Analysis (Unaudited)
Answers to the questions reflect the views of Kenneth Sommer and Matthew Downs of NYL Investors LLC, the Portfolio’s Subadvisor.
How did MainStay VP Bond Portfolio perform relative to its benchmark and peers during the 12 months ended December 31, 2023?
For the 12 months ended December 31, 2023, MainStay VP Bond Portfolio returned 5.58% for Initial Class shares and 5.31% for Service Class shares. Over the same period, Initial Class shares outperformed, and Service Class shares underperformed, the 5.53% return of the Bloomberg U.S. Aggregate Bond Index (“the Index”), which is the Portfolio’s benchmark. For the 12 months ended December 31, 2023, Initial Class shares and Service Class shares underperformed the 5.59% return of the Morningstar Intermediate Core Bond Category Average.1
What factors affected the Portfolio’s relative performance during the reporting period?
The Portfolio held overweight positions relative to the Index in asset-backed securities (“ABS”) and corporate securities throughout the reporting period. To facilitate the overweight positions, the Portfolio maintained an underweight position in the U.S. Treasury sector.
The corporate sector produced the strongest relative returns during the reporting period. Within the corporate sector, overweight positioning in the banking, communications, and electric subcomponents made the strongest positive contributions to performance relative to the Index. (Contributions take weightings and total returns into account.) An overweight position in the ABS sector was also accretive to relative performance. Within the floating rate subcomponent of the ABS sector, overweight positions relative to Index in AAA and AA collateralized loan obligations (“CLOs”) were accretive to performance.2 Within the fixed-rate subcomponent of the ABS sector, aircraft, specialty finance and student loans were the primary drivers of outperformance. Positioning in the mortgage-backed securities (“MBS”) sector, particularly the 30-year agency passthrough subcomponent, was also accretive to relative performance.
The U.S. Treasury sector was the worst performing sector relative to the Index during the reporting period. Underweight positioning
relative to the Index in the non-corporate sector, led by the taxable municipal and sovereign subsectors, also detracted.
During the reporting period, how was the Portfolio’s performance materially affected by investments in derivatives?
The Portfolio’s use of derivatives was limited to interest rate derivatives used to keep the duration3 of the Portfolio in line with our target. These interest rate derivatives had a negative impact on the Portfolio's performance during the reporting period.
What was the Portfolio’s duration strategy during the reporting period?
During the reporting period, the Portfolio maintained a duration relatively close to that of the Index. On two occasions, the duration of the Portfolio differed significantly from that of the Index. During the first half of the reporting period, the Portfolio held a shorter duration than the Index in the 2-year part of the yield curve4, while simultaneously holding a longer duration than the Index in the 10-year part of the curve. This strategy had a slightly negative impact on performance. In the second half of the reporting period, the Portfolio held a longer duration in the 5-year part of the curve relative to the Index. This strategy also had a negative impact on performance. As of December 31, 2023, the effective duration of the Portfolio was 6.21 years, compared to a duration of 6.19 years for the Index.
What specific factors, risks or market forces prompted significant decisions for the Portfolio during the reporting period?
In the first quarter of 2023, we increased the Portfolio’s allocation to AAA-rated CLOs, due to the floating rate nature of the securities, and given our expectation that the U.S. Federal Reserve would continue raising interest rates. In addition, the
| 1. | See "Investment and Performance Comparison" for more information on benchmark and peer group returns. |
| 2. | An obligation rated ‘AAA’ has the highest rating assigned by Standard & Poor’s (“S&P”), and in the opinion of S&P, the obligor’s capacity to meet its financial commitment on the obligation is extremely strong. An obligation rated ‘AA’ by S&P is deemed by S&P to differ from the highest-rated obligations only to a small degree. In the opinion of S&P, the obligor's capacity to meet its financial commitment on the obligation is very strong. When applied to Fund holdings, ratings are based solely on the creditworthiness of the bonds in the portfolio and are not meant to represent the security or safety of the Fund. |
| 3. | Duration is a measure of the price sensitivity of a fixed-income investment to changes in interest rates. Duration is expressed as a number of years and is considered a more accurate sensitivity gauge than average maturity. |
| 4. | The yield curve is a line that plots the yields of various securities of similar quality—typically U.S. Treasury issues—across a range of maturities. The U.S. Treasury yield curve serves as a benchmark for other debt and is used in economic forecasting. |
| 8 | MainStay VP Bond Portfolio |
option-adjusted spreads5 (OAS) being offered on AAA CLOs was close to the highest level in two years.
In the second quarter of 2023, we increased the Portfolio’s corporate credit allocation, as fallout from the regional banking crisis in March put upward pressure on credit spreads,6 ultimately offering more relative value opportunities across the sector. The increase in credit exposure was primarily focused within the financial sector.
In the middle of the reporting period, we increased the Portfolio’s allocation to AAA-rated non-agency mortgages, seeing value compared to competing 2-3-year duration assets with OAS close to 200 basis points over matched duration U.S. Treasury securities. (A basis point is one one-hundredth of a percentage point.)
In the third quarter of 2023, we decreased the Portfolio’s corporate credit allocation, as fears surrounding negative impacts from the regional banking crisis subsided, resulting in tighter corporate credit spreads. The decrease in credit exposure was primarily focused within the financial sector.
During the reporting period, which market segments were the strongest positive contributors to the Portfolio’s absolute performance and which market segments were particularly weak?
During the reporting period, the corporate sector made the strongest positive contribution to the Portfolio’s absolute performance. Within the sector, the Portfolio’s allocation to the industrial subcomponent was the most accretive to absolute performance. The second-strongest contributor to absolute performance was the MBS sector, followed by the Treasury sector. Within the ABS sector, the Portfolio’s allocation to AAA and AA CLOs was also accretive to absolute performance.
During the same period, the U.S. government agency sector produced the weakest contribution to the Portfolio’s absolute performance. The second weakest contributor to the Portfolio’s absolute performance was the commercial mortgage-backed securities sector.
Within the interest rate complex, the Portfolio’s curve positioning was accretive to absolute performance, while the Portfolio’s duration position detracted from absolute performance.
Among individual issues, those producing the strongest absolute performance during the reporting period were issued by Bank of
America, UBS Group, PG&E, Wells Fargo and HSBC Holdings. Those with the weakest absolute performance were issued by Alexandria Real Estate Equities, ING Groep, Swedbank, Agree Realty and National Australia Bank.
Did the Portfolio make any significant purchases or sales during the reporting period?
The Portfolio’s largest purchases during the reporting period included bonds issued by financial institutions Credit Suisse (New York branch), US Bancorp, UBS Group, Bank of America and Wells Fargo. The Portfolio’s most significant sales during the same period were bonds issued by Nordea Bank, The Goldman Sachs Group, Southern California Edison, Swedbank and JPMorgan Chase.
How did the Portfolio’s sector weightings change during the reporting period?
As described in greater detail above, during the first quarter of the reporting period, we increased the Portfolio’s allocation to AAA-rated CLOs. In the second quarter, we increased the Portfolio’s corporate credit allocation, primarily in the financial sector. In the middle of the reporting period, we increased the Portfolio’s allocation to AAA-rated non-agency mortgages. In the third quarter, we decreased the Portfolio’s corporate credit allocation, primarily in the financial sector.
How was the Portfolio positioned at the end of the reporting period?
As of December 31, 2023, the Portfolio held overweight exposure relative to the Index in ABS, MBS and corporate securities. The Portfolio’s largest overweight allocation among spread assets was to the financial subcomponent of the corporate sector.
As of the same date, the Portfolio held relatively underweight positions in the U.S. Treasury and government agency sectors. Among corporates, the Portfolio held underweight positions in the industrial, sovereign, supranational, foreign agency and foreign local government subcomponents.
| 5. | An option-adjusted spread is the measurement of the spread of a fixed-income security rate and the risk-free rate of return, which is then adjusted to take into account an embedded option. |
| 6. | The terms “spread” and “yield spread” may refer to the difference in yield between a security or type of security and comparable U.S. Treasury issues. The terms may also refer to the difference in yield between two specific securities or types of securities at a given time. |
The opinions expressed are those of the portfolio managers as of the date of this report and are subject to change. There is no guarantee that any forecasts will come to pass. This material does not constitute investment advice and is not intended as an endorsement of any specific investment.
Not all MainStay VP Portfolios and/or share classes are available under all policies.
Portfolio of Investments December 31, 2023†^
| | Principal
Amount | Value |
| Long-Term Bonds 98.8% |
| Asset-Backed Securities 7.3% |
| Automobile Asset-Backed Security 0.5% |
| Avis Budget Rental Car Funding AESOP LLC | |
| Series 2023-8A, Class A | | |
| 6.02%, due 2/20/30 (a) | $ 3,000,000 | $ 3,088,775 |
| Home Equity Asset-Backed Securities 0.1% |
| Chase Funding Trust | |
| Series 2002-2, Class 1A5 | | |
| 6.333%, due 4/25/32 (b) | 7,592 | 7,548 |
| J.P. Morgan Mortgage Acquisition Trust | |
| Series 2007-CH2, Class AF3 | | |
| 5.552%, due 10/25/30 (b) | 403,926 | 210,069 |
| Morgan Stanley Mortgage Loan Trust | |
| Series 2006-17XS, Class A3A | | |
| 6.151%, due 10/25/46 (b) | 768,243 | 226,871 |
| | | 444,488 |
| Other Asset-Backed Securities 6.7% |
| 522 Funding CLO Ltd. | |
| Series 2019-4A, Class BR | | |
| 7.277% (3 Month SOFR + 1.862%), due 4/20/30 (a)(c) | 3,000,000 | 2,980,743 |
| ALLO Issuer LLC | |
| Series 2023-1A, Class A2 | | |
| 6.20%, due 6/20/53 (a) | 2,200,000 | 2,150,514 |
| ARES XXXVIII CLO Ltd. | |
| Series 2015-38A, Class BR | | |
| 7.077% (3 Month SOFR + 1.662%), due 4/20/30 (a)(c) | 2,000,000 | 1,984,488 |
| Barings Loan Partners CLO Ltd. 3 | |
| Series LP-3A, Class BR | | |
| 7.418% (3 Month SOFR + 2.10%), due 7/20/33 (a)(c)(d) | 2,250,000 | 2,250,000 |
| Cars Net Lease Mortgage Notes | |
| Series 2020-1A, Class A2 | | |
| 2.48%, due 12/15/50 (a) | 1,950,000 | 1,516,358 |
| CARS-DB7 LP | |
| Series 2023-1A, Class A2 | | |
| 6.50%, due 9/15/53 (a) | 1,744,531 | 1,748,910 |
| CMFT Net Lease Master Issuer LLC | |
| Series 2021-1, Class A1 | | |
| 2.09%, due 7/20/51 (a) | 1,915,410 | 1,543,705 |
| Cook Park CLO Ltd. | |
| Series 2018-1A, Class B | | |
| 7.064% (3 Month SOFR + 1.662%), due 4/17/30 (a)(c) | 3,000,000 | 2,974,686 |
| | Principal
Amount | Value |
| |
| Other Asset-Backed Securities (continued) |
| CyrusOne Data Centers Issuer I LLC | |
| Series 2023-1A, Class A2 | | |
| 4.30%, due 4/20/48 (a) | $ 2,750,000 | $ 2,511,573 |
| Galaxy XXI CLO Ltd. | |
| Series 2015-21A, Class BR | | |
| 7.027% (3 Month SOFR + 1.612%), due 4/20/31 (a)(c) | 1,500,000 | 1,482,084 |
| Oak Street Investment Grade Net Lease Fund | |
| Series 2021-2A, Class A1 | | |
| 2.38%, due 11/20/51 (a) | 3,367,384 | 2,972,261 |
| Owl Rock CLO XIV LLC | |
| Series 2023-14A, Class A | | |
| 7.75% (3 Month SOFR + 2.40%), due 10/20/35 (a)(c) | 2,500,000 | 2,500,328 |
| Palmer Square CLO Ltd. | |
| Series 2015-2A, Class A2R2 | | |
| 7.227% (3 Month SOFR + 1.812%), due 7/20/30 (a)(c) | 2,000,000 | 1,999,868 |
| Retained Vantage Data Centers Issuer LLC | |
| Series 2023-1A, Class A2A | | |
| 5.00%, due 9/15/48 (a) | 2,500,000 | 2,347,773 |
| SMB Private Education Loan Trust | |
| Series 2021-A, Class B | | |
| 2.31%, due 1/15/53 (a) | 2,324,148 | 2,150,688 |
| Store Master Funding I-VII XIV XIX XX XXIV | |
| Series 2023-1A, Class A1 | | |
| 6.19%, due 6/20/53 (a) | 2,991,250 | 3,030,199 |
| Texas Debt Capital CLO Ltd. | |
| Series 2023-2A, Class A | | |
| 7.362% (3 Month SOFR + 1.95%), due 7/21/35 (a)(c) | 2,750,000 | 2,759,647 |
| Voya CLO Ltd. (a)(c) | |
| Series 2022-4A, Class A | | |
| 7.566% (3 Month SOFR + 2.15%), due 10/20/33 | 2,000,000 | 2,000,364 |
| Series 2022-4A, Class B | | |
| 8.716% (3 Month SOFR + 3.30%), due 10/20/33 | 2,000,000 | 2,001,100 |
| | | 42,905,289 |
Total Asset-Backed Securities
(Cost $47,127,001) | | 46,438,552 |
| Corporate Bonds 40.0% |
| Aerospace & Defense 0.7% |
| Boeing Co. (The) | | |
| 5.15%, due 5/1/30 | 1,190,000 | 1,211,433 |
| 5.805%, due 5/1/50 | 495,000 | 512,598 |
The notes to the financial statements are an integral part of, and should be read in conjunction with, the financial statements.
| 10 | MainStay VP Bond Portfolio |
| | Principal
Amount | Value |
| Corporate Bonds (continued) |
| Aerospace & Defense (continued) |
| HEICO Corp. | | |
| 5.35%, due 8/1/33 | $ 865,000 | $ 885,549 |
| L3Harris Technologies, Inc. | | |
| 5.40%, due 7/31/33 | 430,000 | 447,090 |
| Lockheed Martin Corp. | | |
| 4.75%, due 2/15/34 | 1,095,000 | 1,114,405 |
| RTX Corp. | | |
| 6.40%, due 3/15/54 | 405,000 | 468,861 |
| | | 4,639,936 |
| Auto Manufacturers 1.7% |
| Ford Motor Credit Co. LLC | | |
| 4.542%, due 8/1/26 | 1,870,000 | 1,810,738 |
| 7.122%, due 11/7/33 | 1,780,000 | 1,917,835 |
| General Motors Financial Co., Inc. | | |
| 6.00%, due 1/9/28 | 1,225,000 | 1,266,557 |
| 6.05%, due 10/10/25 | 3,295,000 | 3,332,511 |
| Hyundai Capital America | | |
| 5.68%, due 6/26/28 (a) | 2,350,000 | 2,395,266 |
| | | 10,722,907 |
| Auto Parts & Equipment 0.1% |
| Aptiv plc | | |
| 4.15%, due 5/1/52 | 730,000 | 577,711 |
| Banks 14.5% |
| ABN AMRO Bank NV | | |
| 6.339% (1 Year Treasury Constant Maturity Rate + 1.65%), due 9/18/27 (a)(c) | 1,655,000 | 1,691,114 |
| Bank of America Corp. (e) | | |
| 1.734%, due 7/22/27 | 4,150,000 | 3,802,027 |
| 1.922%, due 10/24/31 | 2,357,000 | 1,913,532 |
| 2.087%, due 6/14/29 | 1,970,000 | 1,736,197 |
| 5.288%, due 4/25/34 | 1,675,000 | 1,678,855 |
| Bank of New York Mellon Corp. (The) | | |
| 6.474%, due 10/25/34 (e) | 725,000 | 803,071 |
| Barclays plc | | |
| 6.224%, due 5/9/34 (e) | 390,000 | 404,499 |
| 7.119%, due 6/27/34 (e) | 930,000 | 991,124 |
| 7.437% (1 Year Treasury Constant Maturity Rate + 3.50%), due 11/2/33 (c) | 1,850,000 | 2,071,489 |
| Citigroup, Inc. (e) | | |
| 5.61%, due 9/29/26 | 3,705,000 | 3,731,991 |
| 6.174%, due 5/25/34 | 1,640,000 | 1,697,031 |
| | Principal
Amount | Value |
| |
| Banks (continued) |
| Citizens Bank NA | | |
| 6.064%, due 10/24/25 (e) | $ 1,750,000 | $ 1,707,244 |
| Cooperatieve Rabobank UA | | |
| 4.655% (1 Year Treasury Constant Maturity Rate + 1.75%), due 8/22/28 (a)(c) | 1,495,000 | 1,472,227 |
| Credit Suisse AG | | |
| 7.95%, due 1/9/25 | 5,770,000 | 5,897,064 |
| Danske Bank A/S | | |
| 6.466% (1 Year Treasury Constant Maturity Rate + 2.10%), due 1/9/26 (a)(c) | 3,420,000 | 3,444,246 |
| Deutsche Bank AG | | |
| 7.079%, due 2/10/34 (e) | 1,200,000 | 1,234,015 |
| Fifth Third Bancorp | | |
| 6.361%, due 10/27/28 (e) | 1,590,000 | 1,649,772 |
| Goldman Sachs Group, Inc. (The) | | |
| 5.70%, due 11/1/24 | 3,815,000 | 3,824,095 |
| HSBC Holdings plc (e) | | |
| 6.547%, due 6/20/34 | 1,320,000 | 1,379,583 |
| 7.39%, due 11/3/28 | 2,415,000 | 2,587,762 |
| HSBC USA, Inc. | | |
| 5.625%, due 3/17/25 | 3,405,000 | 3,421,100 |
| Huntington National Bank (The) | | |
| 5.65%, due 1/10/30 | 2,285,000 | 2,304,237 |
| JPMorgan Chase & Co. (e) | | |
| 1.578%, due 4/22/27 | 3,505,000 | 3,234,498 |
| 4.565%, due 6/14/30 | 1,290,000 | 1,262,343 |
| 5.546%, due 12/15/25 | 2,915,000 | 2,916,856 |
| Mitsubishi UFJ Financial Group, Inc. | | |
| 5.406% (1 Year Treasury Constant Maturity Rate + 1.97%), due 4/19/34 (c) | 880,000 | 911,369 |
| Morgan Stanley (e) | | |
| 4.679%, due 7/17/26 | 2,590,000 | 2,565,144 |
| 4.889%, due 7/20/33 | 495,000 | 482,659 |
| 5.123%, due 2/1/29 | 605,000 | 607,751 |
| 6.296%, due 10/18/28 | 795,000 | 832,793 |
| Morgan Stanley Bank NA | | |
| 4.754%, due 4/21/26 | 1,730,000 | 1,728,833 |
| National Securities Clearing Corp. | | |
| 5.00%, due 5/30/28 (a) | 1,490,000 | 1,517,912 |
| PNC Financial Services Group, Inc. (The) (e) | | |
| 5.812%, due 6/12/26 | 1,670,000 | 1,680,022 |
| 6.875%, due 10/20/34 | 2,575,000 | 2,858,605 |
| Royal Bank of Canada | | |
| 5.66%, due 10/25/24 | 3,345,000 | 3,352,656 |
The notes to the financial statements are an integral part of, and should be read in conjunction with, the financial statements.
11
Portfolio of Investments December 31, 2023†^ (continued)
| | Principal
Amount | Value |
| Corporate Bonds (continued) |
| Banks (continued) |
| Truist Financial Corp. | | |
| 5.122%, due 1/26/34 (e) | $ 1,715,000 | $ 1,660,640 |
| U.S. Bancorp (e) | | |
| 4.653%, due 2/1/29 | 1,495,000 | 1,471,451 |
| 5.775%, due 6/12/29 | 1,985,000 | 2,039,298 |
| 6.787%, due 10/26/27 | 1,580,000 | 1,649,624 |
| UBS Group AG (a) | | |
| 6.301% (1 Year Treasury Constant Maturity Rate + 2.00%), due 9/22/34 (c) | 1,305,000 | 1,381,503 |
| 6.327% (1 Year Treasury Constant Maturity Rate + 1.60%), due 12/22/27 (c) | 2,310,000 | 2,380,790 |
| 6.442%, due 8/11/28 (e) | 2,485,000 | 2,580,668 |
| Wells Fargo & Co. (e) | | |
| 4.54%, due 8/15/26 | 2,735,000 | 2,705,796 |
| 5.389%, due 4/24/34 | 1,705,000 | 1,712,406 |
| 6.491%, due 10/23/34 | 1,750,000 | 1,903,804 |
| | | 92,879,696 |
| Beverages 0.9% |
| Anheuser-Busch InBev Worldwide, Inc. | | |
| 5.55%, due 1/23/49 | 1,770,000 | 1,902,061 |
| Constellation Brands, Inc. | | |
| 4.90%, due 5/1/33 | 1,595,000 | 1,604,623 |
| Keurig Dr Pepper, Inc. | | |
| 3.20%, due 5/1/30 | 825,000 | 758,445 |
| 4.05%, due 4/15/32 | 765,000 | 736,154 |
| PepsiCo, Inc. | | |
| 2.625%, due 10/21/41 | 1,230,000 | 926,683 |
| | | 5,927,966 |
| Biotechnology 0.2% |
| Amgen, Inc. | | |
| 4.875%, due 3/1/53 | 605,000 | 565,328 |
| 5.25%, due 3/2/30 | 805,000 | 827,537 |
| | | 1,392,865 |
| Chemicals 0.8% |
| Celanese US Holdings LLC | | |
| 6.33%, due 7/15/29 | 1,000,000 | 1,048,272 |
| 6.379%, due 7/15/32 | 480,000 | 507,401 |
| 6.55%, due 11/15/30 | 955,000 | 1,009,556 |
| FMC Corp. | | |
| 6.375%, due 5/18/53 | 555,000 | 567,915 |
| | Principal
Amount | Value |
| |
| Chemicals (continued) |
| RPM International, Inc. | | |
| 2.95%, due 1/15/32 | $ 2,295,000 | $ 1,934,008 |
| | | 5,067,152 |
| Commercial Services 0.3% |
| Global Payments, Inc. | | |
| 2.15%, due 1/15/27 | 1,970,000 | 1,813,578 |
| Computers 0.2% |
| Apple, Inc. | | |
| 2.65%, due 2/8/51 | 1,210,000 | 828,348 |
| Dell International LLC | | |
| 5.75%, due 2/1/33 | 630,000 | 663,705 |
| | | 1,492,053 |
| Diversified Financial Services 1.9% |
| Air Lease Corp. | | |
| 0.70%, due 2/15/24 | 1,550,000 | 1,540,364 |
| American Express Co. | | |
| 6.489%, due 10/30/31 (e) | 1,585,000 | 1,718,880 |
| Ares Management Corp. | | |
| 6.375%, due 11/10/28 | 1,750,000 | 1,834,466 |
| Blackstone Holdings Finance Co. LLC | | |
| 5.90%, due 11/3/27 (a) | 3,000,000 | 3,112,484 |
| Charles Schwab Corp. (The) | | |
| 6.196%, due 11/17/29 (e) | 1,945,000 | 2,039,619 |
| Intercontinental Exchange, Inc. | | |
| 4.35%, due 6/15/29 | 1,625,000 | 1,619,738 |
| 5.20%, due 6/15/62 | 185,000 | 189,075 |
| | | 12,054,626 |
| Electric 4.4% |
| AEP Texas, Inc. | | |
| 5.40%, due 6/1/33 | 90,000 | 91,372 |
| AEP Transmission Co. LLC | | |
| Series O | | |
| 4.50%, due 6/15/52 | 235,000 | 212,168 |
| American Electric Power Co., Inc. | | |
| 5.625%, due 3/1/33 | 865,000 | 901,149 |
| Arizona Public Service Co. | | |
| 5.55%, due 8/1/33 | 1,700,000 | 1,756,531 |
| Baltimore Gas and Electric Co. | | |
| 5.40%, due 6/1/53 | 505,000 | 521,079 |
| Dayton Power & Light Co. (The) | | |
| 3.95%, due 6/15/49 | 500,000 | 383,552 |
| Duke Energy Corp. | | |
| 2.45%, due 6/1/30 | 960,000 | 836,909 |
| 5.00%, due 8/15/52 | 365,000 | 340,718 |
The notes to the financial statements are an integral part of, and should be read in conjunction with, the financial statements.
| 12 | MainStay VP Bond Portfolio |
| | Principal
Amount | Value |
| Corporate Bonds (continued) |
| Electric (continued) |
| Duke Energy Indiana LLC | | |
| 6.45%, due 4/1/39 | $ 600,000 | $ 672,368 |
| Duke Energy Ohio, Inc. | | |
| 5.25%, due 4/1/33 | 205,000 | 211,191 |
| 5.65%, due 4/1/53 | 110,000 | 115,207 |
| Enel Finance America LLC | | |
| 7.10%, due 10/14/27 (a) | 2,280,000 | 2,433,015 |
| Entergy Arkansas LLC | | |
| 5.15%, due 1/15/33 | 1,695,000 | 1,727,946 |
| Florida Power & Light Co. | | |
| 5.05%, due 4/1/28 | 2,550,000 | 2,606,498 |
| Georgia Power Co. | | |
| 4.30%, due 3/15/42 | 141,000 | 124,658 |
| 4.95%, due 5/17/33 | 1,735,000 | 1,748,996 |
| National Rural Utilities Cooperative Finance Corp. | | |
| 5.05%, due 9/15/28 | 1,345,000 | 1,379,902 |
| NextEra Energy Capital Holdings, Inc. | | |
| 6.051%, due 3/1/25 | 1,120,000 | 1,129,975 |
| NSTAR Electric Co. | | |
| 4.55%, due 6/1/52 | 1,060,000 | 965,083 |
| Oklahoma Gas and Electric Co. | | |
| 5.60%, due 4/1/53 | 700,000 | 735,021 |
| Pacific Gas and Electric Co. | | |
| 5.45%, due 6/15/27 | 2,090,000 | 2,106,839 |
| 6.10%, due 1/15/29 | 965,000 | 998,580 |
| 6.40%, due 6/15/33 | 445,000 | 468,237 |
| 6.75%, due 1/15/53 | 570,000 | 620,000 |
| 6.95%, due 3/15/34 | 860,000 | 944,632 |
| PECO Energy Co. | | |
| 4.90%, due 6/15/33 | 1,255,000 | 1,275,867 |
| Southern California Edison Co. | | |
| 5.30%, due 3/1/28 | 760,000 | 780,015 |
| 5.70%, due 3/1/53 | 195,000 | 205,244 |
| 5.95%, due 11/1/32 | 885,000 | 950,774 |
| Southern Co. (The) | | |
| 5.15%, due 10/6/25 | 770,000 | 771,645 |
| 5.70%, due 10/15/32 | 370,000 | 388,423 |
| | | 28,403,594 |
| Engineering & Construction 0.4% |
| Jacobs Engineering Group, Inc. | | |
| 5.90%, due 3/1/33 | 935,000 | 954,484 |
| 6.35%, due 8/18/28 | 1,505,000 | 1,571,817 |
| | | 2,526,301 |
| | Principal
Amount | Value |
| |
| Entertainment 0.2% |
| Warnermedia Holdings, Inc. | | |
| 4.054%, due 3/15/29 | $ 535,000 | $ 507,603 |
| 5.141%, due 3/15/52 | 560,000 | 480,679 |
| | | 988,282 |
| Environmental Control 0.3% |
| Waste Connections, Inc. | | |
| 2.60%, due 2/1/30 | 1,785,000 | 1,601,445 |
| Food 0.0% ‡ |
| Kraft Heinz Foods Co. | | |
| 4.875%, due 10/1/49 | 275,000 | 260,567 |
| Gas 0.4% |
| CenterPoint Energy Resources Corp. | | |
| 1.75%, due 10/1/30 | 1,945,000 | 1,614,893 |
| NiSource, Inc. | | |
| 5.65%, due 2/1/45 | 590,000 | 592,516 |
| Southwest Gas Corp. | | |
| 5.45%, due 3/23/28 | 445,000 | 454,850 |
| | | 2,662,259 |
| Healthcare-Products 0.4% |
| Baxter International, Inc. | | |
| 2.539%, due 2/1/32 | 1,090,000 | 913,869 |
| 3.132%, due 12/1/51 | 620,000 | 426,331 |
| Thermo Fisher Scientific, Inc. | | |
| 4.95%, due 11/21/32 | 1,305,000 | 1,346,694 |
| | | 2,686,894 |
| Healthcare-Services 0.4% |
| HCA, Inc. | | |
| 3.625%, due 3/15/32 | 2,035,000 | 1,819,645 |
| 4.625%, due 3/15/52 | 85,000 | 72,285 |
| UnitedHealth Group, Inc. | | |
| 6.05%, due 2/15/63 | 825,000 | 951,336 |
| | | 2,843,266 |
| Insurance 0.9% |
| Corebridge Financial, Inc. | | |
| 3.85%, due 4/5/29 | 370,000 | 348,651 |
| 4.35%, due 4/5/42 | 190,000 | 161,035 |
| MetLife, Inc. | | |
| 5.875%, due 2/6/41 | 660,000 | 717,932 |
| Metropolitan Life Global Funding I | | |
| 5.15%, due 3/28/33 (a) | 1,300,000 | 1,322,567 |
| Prudential Financial, Inc. | | |
| 3.935%, due 12/7/49 | 225,000 | 185,091 |
The notes to the financial statements are an integral part of, and should be read in conjunction with, the financial statements.
13
Portfolio of Investments December 31, 2023†^ (continued)
| | Principal
Amount | Value |
| Corporate Bonds (continued) |
| Insurance (continued) |
| RGA Global Funding | | |
| 6.00%, due 11/21/28 (a) | $ 2,870,000 | $ 2,975,652 |
| | | 5,710,928 |
| Internet 0.5% |
| Amazon.com, Inc. | | |
| 3.10%, due 5/12/51 | 1,035,000 | 769,302 |
| 3.95%, due 4/13/52 | 710,000 | 621,237 |
| Meta Platforms, Inc. | | |
| 3.85%, due 8/15/32 | 1,115,000 | 1,060,522 |
| 4.45%, due 8/15/52 | 1,000,000 | 918,800 |
| | | 3,369,861 |
| Investment Companies 0.3% |
| Blackstone Private Credit Fund | | |
| 7.05%, due 9/29/25 | 1,870,000 | 1,903,062 |
| Iron & Steel 0.2% |
| Nucor Corp. | | |
| 2.00%, due 6/1/25 | 1,550,000 | 1,487,976 |
| Media 0.5% |
| Charter Communications Operating LLC | | |
| 6.65%, due 2/1/34 | 1,720,000 | 1,813,711 |
| Comcast Corp. | | |
| 4.60%, due 10/15/38 | 740,000 | 714,569 |
| Paramount Global | | |
| 4.20%, due 5/19/32 | 555,000 | 495,339 |
| | | 3,023,619 |
| Miscellaneous—Manufacturing 0.0% ‡ |
| 3M Co. | | |
| 3.625%, due 10/15/47 | 410,000 | 313,006 |
| Oil & Gas 0.5% |
| Occidental Petroleum Corp. | | |
| 6.45%, due 9/15/36 | 720,000 | 761,761 |
| Phillips 66 Co. | | |
| 3.15%, due 12/15/29 | 2,395,000 | 2,190,879 |
| | | 2,952,640 |
| Packaging & Containers 0.1% |
| Berry Global, Inc. | | |
| 5.50%, due 4/15/28 (a) | 865,000 | 874,480 |
| | Principal
Amount | Value |
| |
| Pharmaceuticals 0.8% |
| AbbVie, Inc. | | |
| 2.95%, due 11/21/26 | $ 850,000 | $ 815,063 |
| 4.05%, due 11/21/39 | 135,000 | 121,898 |
| Cigna Group (The) | | |
| 4.90%, due 12/15/48 | 1,025,000 | 974,507 |
| CVS Health Corp. | | |
| 5.30%, due 6/1/33 | 850,000 | 872,285 |
| Eli Lilly & Co. | | |
| 3.375%, due 3/15/29 | 1,215,000 | 1,168,494 |
| Merck & Co., Inc. | | |
| 5.00%, due 5/17/53 | 290,000 | 298,180 |
| 5.15%, due 5/17/63 | 260,000 | 271,066 |
| Pfizer Investment Enterprises Pte. Ltd. | | |
| 5.30%, due 5/19/53 | 370,000 | 377,727 |
| | | 4,899,220 |
| Pipelines 2.2% |
| Cheniere Energy, Inc. | | |
| 4.625%, due 10/15/28 | 2,005,000 | 1,957,139 |
| Columbia Pipelines Operating Co. LLC | | |
| 6.714%, due 8/15/63 (a) | 445,000 | 490,745 |
| Energy Transfer LP | | |
| 5.00%, due 5/15/50 | 1,045,000 | 931,691 |
| Enterprise Products Operating LLC | | |
| 4.80%, due 2/1/49 | 550,000 | 520,245 |
| 5.35%, due 1/31/33 | 1,700,000 | 1,779,155 |
| Kinder Morgan, Inc. | | |
| 5.45%, due 8/1/52 | 390,000 | 373,006 |
| MPLX LP | | |
| 4.95%, due 9/1/32 | 875,000 | 856,178 |
| ONEOK, Inc. | | |
| 5.55%, due 11/1/26 | 980,000 | 997,245 |
| 5.85%, due 1/15/26 | 1,615,000 | 1,638,421 |
| 6.05%, due 9/1/33 | 390,000 | 413,212 |
| 6.625%, due 9/1/53 | 265,000 | 296,571 |
| Targa Resources Partners LP | | |
| 5.50%, due 3/1/30 | 3,075,000 | 3,074,447 |
| Williams Cos., Inc. (The) | | |
| 4.85%, due 3/1/48 | 570,000 | 517,748 |
| | | 13,845,803 |
| Real Estate Investment Trusts 1.1% |
| American Tower Corp. | | |
| 2.10%, due 6/15/30 | 2,695,000 | 2,260,599 |
| Crown Castle, Inc. | | |
| 5.80%, due 3/1/34 | 1,225,000 | 1,267,876 |
| Simon Property Group LP | | |
| 1.75%, due 2/1/28 | 1,950,000 | 1,752,307 |
The notes to the financial statements are an integral part of, and should be read in conjunction with, the financial statements.
| 14 | MainStay VP Bond Portfolio |
| | Principal
Amount | Value |
| Corporate Bonds (continued) |
| Real Estate Investment Trusts (continued) |
| Sun Communities Operating LP | | |
| 2.70%, due 7/15/31 | $ 1,800,000 | $ 1,499,855 |
| | | 6,780,637 |
| Retail 0.7% |
| AutoZone, Inc. | | |
| 5.20%, due 8/1/33 | 1,710,000 | 1,740,406 |
| Home Depot, Inc. (The) | | |
| 4.95%, due 9/15/52 | 1,070,000 | 1,081,176 |
| Lowe's Cos., Inc. | | |
| 5.15%, due 7/1/33 | 450,000 | 462,353 |
| 5.625%, due 4/15/53 | 625,000 | 655,266 |
| 5.75%, due 7/1/53 | 230,000 | 243,672 |
| | | 4,182,873 |
| Semiconductors 1.1% |
| Broadcom, Inc. (a) | | |
| 2.45%, due 2/15/31 | 1,250,000 | 1,068,829 |
| 3.137%, due 11/15/35 | 925,000 | 759,410 |
| 3.469%, due 4/15/34 | 835,000 | 726,454 |
| Intel Corp. | | |
| 5.20%, due 2/10/33 | 605,000 | 632,031 |
| 5.70%, due 2/10/53 | 960,000 | 1,037,865 |
| 5.90%, due 2/10/63 | 205,000 | 228,494 |
| Micron Technology, Inc. | | |
| 6.75%, due 11/1/29 | 1,210,000 | 1,307,509 |
| NXP BV | | |
| 5.00%, due 1/15/33 | 955,000 | 956,477 |
| QUALCOMM, Inc. | | |
| 4.50%, due 5/20/52 | 260,000 | 242,788 |
| Texas Instruments, Inc. | | |
| 5.05%, due 5/18/63 | 90,000 | 92,192 |
| | | 7,052,049 |
| Software 0.5% |
| Microsoft Corp. | | |
| 2.525%, due 6/1/50 | 965,000 | 658,779 |
| Oracle Corp. | | |
| 3.95%, due 3/25/51 | 360,000 | 281,904 |
| 4.90%, due 2/6/33 | 1,170,000 | 1,164,677 |
| 5.55%, due 2/6/53 | 850,000 | 850,237 |
| | | 2,955,597 |
| Telecommunications 1.8% |
| AT&T, Inc. | | |
| 3.50%, due 9/15/53 | 730,000 | 529,766 |
| 3.55%, due 9/15/55 | 997,000 | 716,820 |
| 4.35%, due 3/1/29 | 1,464,000 | 1,444,834 |
| | Principal
Amount | Value |
| |
| Telecommunications (continued) |
| AT&T, Inc. (continued) | | |
| 5.40%, due 2/15/34 | $ 1,565,000 | $ 1,614,024 |
| Bell Canada | | |
| 3.65%, due 8/15/52 | 425,000 | 327,977 |
| Rogers Communications, Inc. | | |
| 4.55%, due 3/15/52 | 385,000 | 335,753 |
| T-Mobile USA, Inc. | | |
| 2.625%, due 2/15/29 | 2,095,000 | 1,886,074 |
| 3.40%, due 10/15/52 | 400,000 | 291,339 |
| 5.75%, due 1/15/34 | 1,680,000 | 1,781,879 |
| Verizon Communications, Inc. | | |
| 3.40%, due 3/22/41 | 685,000 | 545,288 |
| 4.50%, due 8/10/33 | 705,000 | 687,702 |
| 5.05%, due 5/9/33 | 1,285,000 | 1,310,863 |
| | | 11,472,319 |
| Transportation 0.7% |
| FedEx Corp. | | |
| 5.25%, due 5/15/50 | 970,000 | 965,426 |
| Norfolk Southern Corp. | | |
| 3.00%, due 3/15/32 | 1,005,000 | 893,576 |
| 3.05%, due 5/15/50 | 605,000 | 430,314 |
| Union Pacific Corp. | | |
| 2.80%, due 2/14/32 | 2,060,000 | 1,827,546 |
| United Parcel Service, Inc. | | |
| 5.30%, due 4/1/50 | 520,000 | 553,857 |
| | | 4,670,719 |
| Trucking & Leasing 0.3% |
| Penske Truck Leasing Co. LP (a) | | |
| 5.75%, due 5/24/26 | 940,000 | 947,443 |
| 6.05%, due 8/1/28 | 670,000 | 694,447 |
| | | 1,641,890 |
Total Corporate Bonds
(Cost $250,607,513) | | 255,677,777 |
| Mortgage-Backed Securities 6.6% |
| Agency (Collateralized Mortgage Obligations) 1.2% |
| FHLMC, Strips | |
| REMIC, Series 390, Class C5 | | |
| 2.00%, due 4/15/42 (f) | 2,463,390 | 222,564 |
| FNMA (f) | |
| REMIC, Series 2023-2, Class DI | | |
| 2.00%, due 5/25/51 | 16,658,773 | 2,179,196 |
| REMIC, Series 2021-3, Class TI | | |
| 2.50%, due 2/25/51 | 16,701,229 | 2,684,285 |
The notes to the financial statements are an integral part of, and should be read in conjunction with, the financial statements.
15
Portfolio of Investments December 31, 2023†^ (continued)
| | Principal
Amount | Value |
| Mortgage-Backed Securities (continued) |
| Agency (Collateralized Mortgage Obligations) (continued) |
| FNMA, Strips (f) | |
| REMIC, Series 432, Class C6 | | |
| 2.00%, due 4/25/42 (g) | $ 13,219,267 | $ 1,280,094 |
| REMIC, Series 365, Class 13 | | |
| 5.50%, due 5/25/36 | 7,565,892 | 1,390,226 |
| | | 7,756,365 |
| Commercial Mortgage Loans (Collateralized Mortgage Obligations) 2.5% |
| BWAY Mortgage Trust | |
| Series 2013-1515, Class A2 | | |
| 3.454%, due 3/10/33 (a) | 2,320,000 | 2,177,918 |
| CENT Trust | |
| Series 2023-CITY, Class A | | |
| 7.982% (1 Month SOFR + 2.62%), due 9/15/38 (a)(c) | 2,400,000 | 2,412,027 |
| FNMA, ACES | |
| REMIC, Series 2019-M12, Class X3 | | |
| 0.602%, due 6/25/29 (f)(h) | 77,000,000 | 2,206,104 |
| GNMA (f)(h) | |
| REMIC, Series 2023-179 | | |
| 0.612%, due 9/16/63 | 49,913,565 | 2,071,977 |
| REMIC, Series 2023-108 | | |
| 0.699%, due 8/16/59 | 60,840,742 | 2,132,164 |
| REMIC, Series 2021-106 | | |
| 0.859%, due 4/16/63 | 40,376,562 | 2,639,985 |
| OPEN Trust | |
| Series 2023-AIR, Class A | | |
| 8.451% (1 Month SOFR + 3.089%), due 10/15/28 (a)(c) | 2,303,890 | 2,308,604 |
| | | 15,948,779 |
| Whole Loan (Collateralized Mortgage Obligations) 2.9% |
| A&D Mortgage Trust (a)(b) | |
| Series 2023-NQM3, Class A2 | | |
| 7.139%, due 7/25/68 | 2,895,214 | 2,925,694 |
| Series 2023-NQM4, Class A1 | | |
| 7.472%, due 9/25/68 | 2,705,997 | 2,764,701 |
| Series 2023-NQM4, Class A2 | | |
| 7.826%, due 9/25/68 | 1,967,998 | 2,010,851 |
| BRAVO Residential Funding Trust | |
| Series 2023-NQM8, Class A1 | | |
| 6.394%, due 10/25/63 (a)(b) | 2,250,000 | 2,264,204 |
| COLT Mortgage Loan Trust (a)(b) | |
| Series 2023-4, Class A1 | | |
| 7.163%, due 10/25/68 | 2,730,065 | 2,796,868 |
| | Principal
Amount | Value |
| |
| Whole Loan (Collateralized Mortgage Obligations) (continued) |
| COLT Mortgage Loan Trust (a)(b) (continued) | |
| Series 2023-3, Class A1 | | |
| 7.18%, due 9/25/68 | $ 2,461,075 | $ 2,520,828 |
| GCAT Trust | |
| Series 2023-NQM3, Class A1 | | |
| 6.889%, due 8/25/68 (a)(i) | 2,943,647 | 2,987,904 |
| | | 18,271,050 |
Total Mortgage-Backed Securities
(Cost $41,636,306) | | 41,976,194 |
| U.S. Government & Federal Agencies 44.9% |
| Federal Home Loan Mortgage Corporation (Mortgage Pass-Through Securities) 6.0% |
| FHLMC Gold Pools, 15 Year | | |
| 5.00%, due 3/1/25 | 2,142 | 2,156 |
| FHLMC Gold Pools, 30 Year | | |
| 6.50%, due 11/1/35 | 1,737 | 1,817 |
| 6.50%, due 8/1/37 | 13,092 | 13,725 |
| UMBS Pool, 30 Year | | |
| 2.00%, due 8/1/50 | 3,258,368 | 2,682,978 |
| 2.00%, due 11/1/50 | 2,593,726 | 2,158,766 |
| 2.00%, due 3/1/51 | 2,833,269 | 2,333,190 |
| 2.50%, due 7/1/50 | 4,230,746 | 3,665,589 |
| 2.50%, due 10/1/50 | 2,354,681 | 2,037,806 |
| 2.50%, due 11/1/50 | 2,569,653 | 2,238,274 |
| 2.50%, due 2/1/51 | 2,883,854 | 2,504,611 |
| 2.50%, due 10/1/51 | 2,131,471 | 1,842,024 |
| 2.50%, due 4/1/52 | 2,356,761 | 2,032,084 |
| 3.00%, due 3/1/52 | 4,588,763 | 4,148,698 |
| 3.50%, due 11/1/51 | 3,207,527 | 2,957,817 |
| 4.00%, due 10/1/52 | 2,987,255 | 2,839,976 |
| 5.00%, due 12/1/52 | 2,555,164 | 2,531,149 |
| 5.00%, due 7/1/53 | 2,435,897 | 2,418,263 |
| 5.50%, due 10/1/52 | 1,639,451 | 1,651,066 |
| | | 38,059,989 |
| Federal National Mortgage Association (Mortgage Pass-Through Securities) 14.3% |
| UMBS, 15 Year | | |
| 2.00%, due 3/1/37 | 5,398,292 | 4,869,979 |
| 4.50%, due 5/1/24 | 5,708 | 5,676 |
| UMBS, 30 Year | | |
| 2.00%, due 8/1/50 | 3,486,771 | 2,881,425 |
| 2.00%, due 9/1/50 | 5,493,986 | 4,571,380 |
| 2.00%, due 12/1/50 | 3,368,395 | 2,779,244 |
| 2.00%, due 3/1/51 | 4,346,581 | 3,604,240 |
| 2.00%, due 3/1/51 | 5,432,899 | 4,492,435 |
The notes to the financial statements are an integral part of, and should be read in conjunction with, the financial statements.
| 16 | MainStay VP Bond Portfolio |
| | Principal
Amount | Value |
| U.S. Government & Federal Agencies (continued) |
| Federal National Mortgage Association (Mortgage Pass-Through Securities) (continued) |
| UMBS, 30 Year (continued) | | |
| 2.00%, due 3/1/52 | $ 4,846,405 | $ 4,001,427 |
| 2.50%, due 5/1/43 | 233,788 | 203,970 |
| 2.50%, due 6/1/50 | 2,907,316 | 2,514,914 |
| 2.50%, due 9/1/50 | 2,060,769 | 1,792,967 |
| 2.50%, due 8/1/51 | 4,559,861 | 3,952,425 |
| 2.50%, due 9/1/51 | 2,000,000 | 1,717,106 |
| 2.50%, due 10/1/51 | 3,591,691 | 3,095,609 |
| 2.50%, due 10/1/51 | 2,918,977 | 2,535,387 |
| 2.50%, due 11/1/51 | 3,231,276 | 2,804,614 |
| 2.50%, due 4/1/52 | 2,350,000 | 2,026,581 |
| 3.00%, due 11/1/48 | 2,940,479 | 2,678,988 |
| 3.00%, due 2/1/50 | 4,921,684 | 4,473,849 |
| 3.00%, due 1/1/52 | 3,594,430 | 3,217,053 |
| 3.50%, due 5/1/48 | 4,807,753 | 4,511,675 |
| 3.50%, due 2/1/52 | 2,189,941 | 2,019,319 |
| 3.50%, due 3/1/52 | 2,614,340 | 2,407,529 |
| 4.00%, due 5/1/52 | 5,119,480 | 4,886,861 |
| 4.50%, due 7/1/52 | 2,740,739 | 2,658,431 |
| 4.50%, due 7/1/52 | 1,926,998 | 1,877,132 |
| 5.50%, due 10/1/52 | 2,671,393 | 2,689,702 |
| 5.50%, due 12/1/52 | 4,612,851 | 4,694,128 |
| 6.00%, due 9/1/53 | 2,404,082 | 2,487,285 |
| 6.50%, due 10/1/36 | 10,004 | 10,589 |
| 6.50%, due 8/1/37 | 1,831 | 1,901 |
| 7.00%, due 9/1/37 | 15,893 | 16,593 |
| 7.00%, due 10/1/37 | 263 | 275 |
| 7.00%, due 11/1/37 | 3,553 | 3,673 |
| 7.50%, due 7/1/28 | 3,403 | 3,402 |
| UMBS, Single Family, 30 Year (j) | | |
| 4.50%, due 1/25/54 TBA | 1,500,000 | 1,453,945 |
| 6.00%, due 1/25/54 TBA | 1,850,000 | 1,878,328 |
| 6.50%, due 1/25/54 TBA | 1,600,000 | 1,639,563 |
| | | 91,459,600 |
| Government National Mortgage Association (Mortgage Pass-Through Securities) 4.4% |
| GNMA I, Single Family, 30 Year | | |
| 4.00%, due 3/15/44 | 19,243 | 18,677 |
| 4.00%, due 7/15/44 | 127,521 | 123,007 |
| 4.00%, due 7/15/45 | 56,413 | 54,697 |
| 4.50%, due 6/15/39 | 305,806 | 307,547 |
| 4.50%, due 6/15/40 | 127,173 | 126,661 |
| GNMA II, 30 Year | | |
| 2.00%, due 3/20/51 | 3,824,379 | 3,160,116 |
| 2.50%, due 1/20/51 | 1,883,691 | 1,626,855 |
| | Principal
Amount | Value |
| |
| Government National Mortgage Association (Mortgage Pass-Through Securities) (continued) |
| GNMA II, 30 Year (continued) | | |
| 2.50%, due 3/20/51 | $ 3,747,053 | $ 3,268,777 |
| 2.50%, due 4/20/51 | 4,704,175 | 4,100,794 |
| 3.50%, due 5/20/52 | 3,187,589 | 2,961,345 |
| 4.50%, due 9/20/52 | 2,987,124 | 2,923,171 |
| GNMA II, Single Family, 30 Year | | |
| 3.00%, due 8/20/51 | 3,014,974 | 2,734,982 |
| 3.00%, due 10/20/51 | 3,248,238 | 2,942,158 |
| 4.00%, due 4/20/52 | 2,199,742 | 2,098,922 |
| 5.00%, due 7/20/52 | 1,599,098 | 1,589,119 |
| | | 28,036,828 |
| United States Treasury Bonds 3.5% |
| U.S. Treasury Bonds | | |
| 1.875%, due 2/15/41 | 3,770,000 | 2,710,424 |
| 2.375%, due 2/15/42 | 2,140,000 | 1,641,948 |
| 2.875%, due 5/15/52 | 4,560,000 | 3,630,544 |
| 3.25%, due 5/15/42 | 500,000 | 438,672 |
| 4.375%, due 8/15/43 | 5,050,000 | 5,154,945 |
| 4.75%, due 11/15/53 | 7,925,000 | 8,887,145 |
| | | 22,463,678 |
| United States Treasury Notes 16.7% |
| U.S. Treasury Notes | | |
| 4.375%, due 11/30/28 | 16,835,000 | 17,226,940 |
| 4.375%, due 11/30/30 | 37,900,000 | 38,971,859 |
| 4.625%, due 11/15/26 | 30,100,000 | 30,575,015 |
| 5.00%, due 10/31/25 | 19,975,000 | 20,202,840 |
| | | 106,976,654 |
Total U.S. Government & Federal Agencies
(Cost $284,629,849) | | 286,996,749 |
Total Long-Term Bonds
(Cost $624,000,669) | | 631,089,272 |
Total Investments, Before Investments Sold Short
(Cost $624,000,669) | 98.8% | 631,089,272 |
The notes to the financial statements are an integral part of, and should be read in conjunction with, the financial statements.
17
Portfolio of Investments December 31, 2023†^ (continued)
| | Principal
Amount | | Value |
| Investments Sold Short (0.1)% |
| U.S. Government & Federal Agency Sold Short (0.1)% |
| Federal National Mortgage Association (Mortgage Pass-Through Security) (0.1)% | | | |
| UMBS, Single Family, 30 Year | | | |
| 4.00%, due 1/25/54 TBA (j) | $ (750,000) | | $ (709,306) |
Total Investments Sold Short
(Proceeds $688,711) | | | (709,306) |
Total Investments, Net of Investments Sold Short
(Cost $623,311,958) | 98.7% | | 630,379,966 |
| Other Assets, Less Liabilities | 1.3 | | 8,386,738 |
| Net Assets | 100.0% | | $ 638,766,704 |
| † | Percentages indicated are based on Portfolio net assets. |
| ^ | Industry classifications may be different than those used for compliance monitoring purposes. |
| ‡ | Less than one-tenth of a percent. |
| (a) | May be sold to institutional investors only under Rule 144A or securities offered pursuant to Section 4(a)(2) of the Securities Act of 1933, as amended. |
| (b) | Step coupon—Rate shown was the rate in effect as of December 31, 2023. |
| (c) | Floating rate—Rate shown was the rate in effect as of December 31, 2023. |
| (d) | Delayed delivery security. |
| (e) | Fixed to floating rate—Rate shown was the rate in effect as of December 31, 2023. |
| (f) | Collateralized Mortgage Obligation Interest Only Strip—Pays a fixed or variable rate of interest based on mortgage loans or mortgage pass-through securities. The principal amount of the underlying pool represents the notional amount on which the current interest was calculated. The value of these stripped securities may be particularly sensitive to changes in prevailing interest rates and are typically more sensitive to changes in prepayment rates than traditional mortgage-backed securities. |
| (g) | Illiquid security—As of December 31, 2023, the total market value deemed illiquid under procedures approved by the Board of Trustees was $1,280,094, which represented 0.2% of the Portfolio’s net assets. (Unaudited) |
| (h) | Collateral strip rate—A bond whose interest was based on the weighted net interest rate of the collateral. The coupon rate adjusts periodically based on a predetermined schedule. Rate shown was the rate in effect as of December 31, 2023. |
| (i) | Coupon rate may change based on changes of the underlying collateral or prepayments of principal. Rate shown was the rate in effect as of December 31, 2023. |
| (j) | TBA—Security purchased on a forward commitment basis with an approximate principal amount and maturity date. The actual principal amount and maturity date will be determined upon settlement. As of December 31, 2023, the total net market value was $4,262,530, which represented 0.7% of the Portfolio’s net assets. All or a portion of this security is a part of a mortgage dollar roll agreement. |
Futures Contracts
As of December 31, 2023, the Portfolio held the following futures contracts1:
| Type | Number of
Contracts | Expiration
Date | Value at
Trade Date | Current
Notional
Amount | Unrealized
Appreciation
(Depreciation)2 |
| Long Contracts | | | | | |
| U.S. Treasury 2 Year Notes | 87 | March 2024 | $ 17,763,647 | $ 17,914,523 | $ 150,876 |
| U.S. Treasury 5 Year Notes | 110 | March 2024 | 11,720,166 | 11,965,078 | 244,912 |
| U.S. Treasury Ultra Bonds | 334 | March 2024 | 40,804,174 | 44,620,313 | 3,816,139 |
| Total Long Contracts | | | | | 4,211,927 |
| Short Contracts | | | | | |
| U.S. Treasury 10 Year Notes | (136) | March 2024 | (14,915,240) | (15,353,125) | (437,885) |
| U.S. Treasury 10 Year Ultra Bonds | (114) | March 2024 | (12,897,758) | (13,453,781) | (556,023) |
| Total Short Contracts | | | | | (993,908) |
| Net Unrealized Appreciation | | | | | $ 3,218,019 |
| 1. | As of December 31, 2023, cash in the amount of $1,981,500 was on deposit with a broker or futures commission merchant for futures transactions. |
| 2. | Represents the difference between the value of the contracts at the time they were opened and the value as of December 31, 2023. |
| Abbreviation(s): |
| ACES—Alternative Credit Enhancement Securities |
| CLO—Collateralized Loan Obligation |
The notes to the financial statements are an integral part of, and should be read in conjunction with, the financial statements.
| 18 | MainStay VP Bond Portfolio |
| FHLMC—Federal Home Loan Mortgage Corp. |
| FNMA—Federal National Mortgage Association |
| GNMA—Government National Mortgage Association |
| REMIC—Real Estate Mortgage Investment Conduit |
| SOFR—Secured Overnight Financing Rate |
| TBA—To Be Announced |
| UMBS—Uniform Mortgage Backed Securities |
The following is a summary of the fair valuations according to the inputs used as of December 31, 2023, for valuing the Portfolio’s assets and liabilities:
| Description | Quoted
Prices in
Active
Markets for
Identical
Assets
(Level 1) | | Significant
Other
Observable
Inputs
(Level 2) | | Significant
Unobservable
Inputs
(Level 3) | | Total |
| Asset Valuation Inputs | | | | | | | |
| Investments in Securities (a) | | | | | | | |
| Long-Term Bonds | | | | | | | |
| Asset-Backed Securities | $ — | | $ 46,438,552 | | $ — | | $ 46,438,552 |
| Corporate Bonds | — | | 255,677,777 | | — | | 255,677,777 |
| Mortgage-Backed Securities | — | | 41,976,194 | | — | | 41,976,194 |
| U.S. Government & Federal Agencies | — | | 286,996,749 | | — | | 286,996,749 |
| Total Investments in Securities | — | | 631,089,272 | | — | | 631,089,272 |
| Other Financial Instruments | | | | | | | |
| Futures Contracts (b) | 4,211,927 | | — | | — | | 4,211,927 |
| Total Investments in Securities and Other Financial Instruments | $ 4,211,927 | | $ 631,089,272 | | $ — | | $ 635,301,199 |
| Liability Valuation Inputs | | | | | | | |
| Long-Term Bonds Sold Short | | | | | | | |
| U.S. Government & Federal Agency Sold Short | $ — | | $ (709,306) | | $ — | | $ (709,306) |
| Other Financial Instruments | | | | | | | |
| Futures Contracts (b) | (993,908) | | — | | — | | (993,908) |
| Total Investments in Securities Sold Short and Other Financial Instruments | $ (993,908) | | $ (709,306) | | $ — | | $ (1,703,214) |
| (a) | For a complete listing of investments and their industries, see the Portfolio of Investments. |
| (b) | The value listed for these securities reflects unrealized appreciation (depreciation) as shown on the Portfolio of Investments. |
The notes to the financial statements are an integral part of, and should be read in conjunction with, the financial statements.
19
Statement of Assets and Liabilities as of December 31, 2023
| Assets |
Investment in securities, at value
(identified cost $624,000,669) | $631,089,272 |
| Cash | 4,280,651 |
| Cash collateral on deposit at broker for futures contracts | 1,981,500 |
| Receivables: | |
| Investment securities sold | 6,894,292 |
| Interest | 5,281,303 |
| Portfolio shares sold | 24,192 |
| Other assets | 19,325 |
| Total assets | 649,570,535 |
| Liabilities |
| Investments sold short (proceeds $688,711) | 709,306 |
| Payables: | |
| Investment securities purchased | 9,133,555 |
| Portfolio shares redeemed | 439,408 |
| Manager (See Note 3) | 267,615 |
| Variation margin on futures contracts | 103,849 |
| NYLIFE Distributors (See Note 3) | 78,423 |
| Professional fees | 41,324 |
| Custodian | 21,832 |
| Shareholder communication | 7,047 |
| Accrued expenses | 1,472 |
| Total liabilities | 10,803,831 |
| Net assets | $638,766,704 |
| Composition of Net Assets |
| Shares of beneficial interest outstanding (par value of $.001 per share) unlimited number of shares authorized | $ 52,002 |
| Additional paid-in-capital | 736,598,369 |
| | 736,650,371 |
| Total distributable earnings (loss) | (97,883,667) |
| Net assets | $638,766,704 |
| Initial Class | |
| Net assets applicable to outstanding shares | $266,632,296 |
| Shares of beneficial interest outstanding | 21,559,320 |
| Net asset value per share outstanding | $ 12.37 |
| Service Class | |
| Net assets applicable to outstanding shares | $372,134,408 |
| Shares of beneficial interest outstanding | 30,442,965 |
| Net asset value per share outstanding | $ 12.22 |
The notes to the financial statements are an integral part of, and should be read in conjunction with, the financial statements.
| 20 | MainStay VP Bond Portfolio |
Statement of Operations for the year ended December 31, 2023
| Investment Income (Loss) |
| Income | |
| Interest | $ 32,268,620 |
| Expenses | |
| Manager (See Note 3) | 3,301,721 |
| Distribution/Service—Service Class (See Note 3) | 942,184 |
| Professional fees | 117,421 |
| Custodian | 48,058 |
| Trustees | 17,698 |
| Shareholder communication | 3,599 |
| Miscellaneous | 13,325 |
| Total expenses | 4,444,006 |
| Net investment income (loss) | 27,824,614 |
| Realized and Unrealized Gain (Loss) |
| Net realized gain (loss) on: | |
| Unaffiliated investment transactions | (27,627,313) |
| Futures transactions | (7,306,683) |
| Net realized gain (loss) | (34,933,996) |
| Net change in unrealized appreciation (depreciation) on: | |
| Unaffiliated investments | 37,045,289 |
| Futures contracts | 3,914,711 |
| Investments sold short | (20,595) |
| Net change in unrealized appreciation (depreciation) | 40,939,405 |
| Net realized and unrealized gain (loss) | 6,005,409 |
| Net increase (decrease) in net assets resulting from operations | $ 33,830,023 |
The notes to the financial statements are an integral part of, and should be read in conjunction with, the financial statements.
21
Statements of Changes in Net Assets
for the years ended December 31, 2023 and December 31, 2022
| | 2023 | 2022 |
| Increase (Decrease) in Net Assets |
| Operations: | | |
| Net investment income (loss) | $ 27,824,614 | $ 17,635,047 |
| Net realized gain (loss) | (34,933,996) | (99,034,005) |
| Net change in unrealized appreciation (depreciation) | 40,939,405 | (42,710,979) |
| Net increase (decrease) in net assets resulting from operations | 33,830,023 | (124,109,937) |
| Distributions to shareholders: | | |
| Initial Class | (8,428,021) | (5,913,796) |
| Service Class | (9,819,848) | (6,975,813) |
| Total distributions to shareholders | (18,247,869) | (12,889,609) |
| Capital share transactions: | | |
| Net proceeds from sales of shares | 60,830,751 | 90,735,240 |
| Net asset value of shares issued to shareholders in reinvestment of distributions | 18,247,869 | 12,889,609 |
| Cost of shares redeemed | (135,979,597) | (172,961,774) |
| Increase (decrease) in net assets derived from capital share transactions | (56,900,977) | (69,336,925) |
| Net increase (decrease) in net assets | (41,318,823) | (206,336,471) |
| Net Assets |
| Beginning of year | 680,085,527 | 886,421,998 |
| End of year | $ 638,766,704 | $ 680,085,527 |
The notes to the financial statements are an integral part of, and should be read in conjunction with, the financial statements.
| 22 | MainStay VP Bond Portfolio |
Financial Highlights selected per share data and ratios
| | Year Ended December 31, |
| Initial Class | 2023 | | 2022 | | 2021 | | 2020 | | 2019 |
| Net asset value at beginning of year | $ 12.08 | | $ 14.43 | | $ 15.37 | | $ 14.57 | | $ 13.72 |
| Net investment income (loss) (a) | 0.52 | | 0.33 | | 0.21 | | 0.28 | | 0.37 |
| Net realized and unrealized gain (loss) | 0.12 | | (2.42) | | (0.42) | | 0.87 | | 0.88 |
| Total from investment operations | 0.64 | | (2.09) | | (0.21) | | 1.15 | | 1.25 |
| Less distributions: | | | | | | | | | |
| From net investment income | (0.35) | | (0.26) | | (0.27) | | (0.31) | | (0.40) |
| From net realized gain on investments | — | | — | | (0.46) | | (0.04) | | — |
| Total distributions | (0.35) | | (0.26) | | (0.73) | | (0.35) | | (0.40) |
| Net asset value at end of year | $ 12.37 | | $ 12.08 | | $ 14.43 | | $ 15.37 | | $ 14.57 |
| Total investment return (b) | 5.58% | | (14.47)% | | (1.37)% | | 7.94% | | 9.12% |
| Ratios (to average net assets)/Supplemental Data: | | | | | | | | | |
| Net investment income (loss) | 4.30% | | 2.53% | | 1.39% | | 1.83% | | 2.60% |
| Net expenses (c) | 0.52% | | 0.53% | | 0.52% | | 0.53% | | 0.54% |
| Portfolio turnover rate (d) | 469% | | 474% | | 326% | | 255% | | 204% |
| Net assets at end of year (in 000's) | $ 266,632 | | $ 292,815 | | $ 366,020 | | $ 412,053 | | $ 341,408 |
| (a) | Per share data based on average shares outstanding during the year. |
| (b) | Total return does not reflect any deduction of sales charges, mortality and expense charges, contract charges or administrative charges. For periods of less than one year, total return is not annualized. |
| (c) | In addition to the fees and expenses which the Portfolio bears directly, it also indirectly bears a pro-rata share of the fees and expenses of the underlying funds in which it invests. Such indirect expenses are not included in the above expense ratios. |
| (d) | The portfolio turnover rates not including mortgage dollar rolls were 463%, 438%, 194%, 241% and 197% for the years ended December 31, 2023, 2022, 2021, 2020 and 2019, respectively. |
| | Year Ended December 31, |
| Service Class | 2023 | | 2022 | | 2021 | | 2020 | | 2019 |
| Net asset value at beginning of year | $ 11.93 | | $ 14.25 | | $ 15.19 | | $ 14.41 | | $ 13.58 |
| Net investment income (loss) (a) | 0.49 | | 0.29 | | 0.17 | | 0.24 | | 0.33 |
| Net realized and unrealized gain (loss) | 0.12 | | (2.39) | | (0.41) | | 0.86 | | 0.87 |
| Total from investment operations | 0.61 | | (2.10) | | (0.24) | | 1.10 | | 1.20 |
| Less distributions: | | | | | | | | | |
| From net investment income | (0.32) | | (0.22) | | (0.24) | | (0.28) | | (0.37) |
| From net realized gain on investments | — | | — | | (0.46) | | (0.04) | | — |
| Total distributions | (0.32) | | (0.22) | | (0.70) | | (0.32) | | (0.37) |
| Net asset value at end of year | $ 12.22 | | $ 11.93 | | $ 14.25 | | $ 15.19 | | $ 14.41 |
| Total investment return (b) | 5.31% | | (14.68)% | | (1.62)% | | 7.67% | | 8.85% |
| Ratios (to average net assets)/Supplemental Data: | | | | | | | | | |
| Net investment income (loss) | 4.05% | | 2.26% | | 1.14% | | 1.57% | | 2.34% |
| Net expenses (c) | 0.77% | | 0.78% | | 0.77% | | 0.78% | | 0.79% |
| Portfolio turnover rate (d) | 469% | | 474% | | 326% | | 255% | | 204% |
| Net assets at end of year (in 000's) | $ 372,134 | | $ 387,271 | | $ 520,402 | | $ 530,338 | | $ 427,338 |
| (a) | Per share data based on average shares outstanding during the year. |
| (b) | Total return does not reflect any deduction of sales charges, mortality and expense charges, contract charges or administrative charges. For periods of less than one year, total return is not annualized. |
| (c) | In addition to the fees and expenses which the Portfolio bears directly, it also indirectly bears a pro-rata share of the fees and expenses of the underlying funds in which it invests. Such indirect expenses are not included in the above expense ratios. |
| (d) | The portfolio turnover rates not including mortgage dollar rolls were 463%, 438%, 194%, 241% and 197% for the years ended December 31, 2023, 2022, 2021, 2020 and 2019, respectively. |
The notes to the financial statements are an integral part of, and should be read in conjunction with, the financial statements.
23
Notes to Financial Statements
Note 1–Organization and Business
MainStay VP Funds Trust (the “Fund”) was organized as a Delaware statutory trust on February 1, 2011. The Fund is registered under the Investment Company Act of 1940, as amended (the “1940 Act”), as an open-end management investment company. The Fund is comprised of thirty-one separate series (collectively referred to as the “Portfolios”). These financial statements and notes relate to the MainStay VP Bond Portfolio (the "Portfolio"), a "diversified” portfolio, as that term is defined in the 1940 Act, as interpreted or modified by regulatory authorities having jurisdiction, from time to time.
Shares of the Portfolio are currently offered to certain separate accounts to fund variable annuity policies and variable universal life insurance policies issued by New York Life Insurance and Annuity Corporation (“NYLIAC”), a wholly-owned subsidiary of New York Life Insurance Company (“New York Life”) and may also be offered to fund variable annuity policies and variable universal life insurance policies issued by other insurance companies. NYLIAC allocates shares of the Portfolio to, among others, certain NYLIAC separate accounts. Shares of the Portfolio are also offered to the MainStay VP Conservative Allocation Portfolio, MainStay VP Moderate Allocation Portfolio, MainStay VP Growth Allocation Portfolio and MainStay VP Equity Allocation Portfolio, which operate as “funds-of-funds," and other variable insurance funds.
The following table lists the Portfolio's share classes that have been registered and commenced operations:
| Class | Commenced Operations |
| Initial Class | January 23, 1984 |
| Service Class | June 4, 2003 |
Shares of the Portfolio are offered and are redeemed at a price equal to their respective net asset value (“NAV”) per share. No sales or redemption charge is applicable to the purchase or redemption of the Portfolio's shares. Under the terms of the Fund’s multiple class plan, adopted pursuant to Rule 18f-3 under the 1940 Act, the classes differ in that, among other things, Service Class shares of the Portfolio pay a combined distribution and service fee of 0.25% of average daily net assets attributable to Service Class shares of the Portfolio to the Distributor (as defined in Note 3(B)) pursuant to a plan adopted in accordance with Rule 12b-1 under the 1940 Act. Contract owners of variable annuity contracts purchased after June 2, 2003, are permitted to invest only in the Service Class shares.
The Portfolio's investment objective is to seek total return.
Note 2–Significant Accounting Policies
The Portfolio is an investment company and accordingly follows the investment company accounting and reporting guidance of the Financial Accounting Standards Board (“FASB”) Accounting Standards Codification Topic 946 Financial Services—Investment Companies. The Portfolio prepares its financial statements in accordance with generally accepted
accounting principles (“GAAP”) in the United States of America and follows the significant accounting policies described below.
(A) Securities Valuation. Investments are usually valued as of the close of regular trading on the New York Stock Exchange (the "Exchange") (usually 4:00 p.m. Eastern time) on each day the Portfolio is open for business ("valuation date").
Pursuant to Rule 2a-5 under the 1940 Act, the Board of Trustees of the Fund (the "Board") has designated New York Life Investment Management LLC (“New York Life Investments” or the "Manager") as its Valuation Designee (the "Valuation Designee"). The Valuation Designee is responsible for performing fair valuations relating to all investments in the Portfolio’s portfolio for which market quotations are not readily available; periodically assessing and managing material valuation risks; establishing and applying fair value methodologies; testing fair valuation methodologies; evaluating and overseeing pricing services; ensuring appropriate segregation of valuation and portfolio management functions; providing quarterly, annual and prompt reporting to the Board, as appropriate; identifying potential conflicts of interest; and maintaining appropriate records. The Valuation Designee has established a valuation committee ("Valuation Committee") to assist in carrying out the Valuation Designee’s responsibilities and establish prices of securities for which market quotations are not readily available. The Portfolio's and the Valuation Designee's policies and procedures ("Valuation Procedures") govern the Valuation Designee’s selection and application of methodologies for determining and calculating the fair value of Portfolio investments. The Valuation Designee may value the Portfolio's portfolio securities for which market quotations are not readily available and other Portfolio assets utilizing inputs from pricing services and other third-party sources. The Valuation Committee meets (in person, via electronic mail or via teleconference) on an ad-hoc basis to determine fair valuations and on a quarterly basis to review fair value events with respect to certain securities for which market quotations are not readily available, including valuation risks and back-testing results, and to preview reports to the Board.
The Valuation Committee establishes prices of securities for which market quotations are not readily available based on such methodologies and measurements on a regular basis after considering information that is reasonably available and deemed relevant by the Valuation Committee. The Board shall oversee the Valuation Designee and review fair valuation materials on a prompt, quarterly and annual basis and approve proposed revisions to the Valuation Procedures.
Investments for which market quotations are not readily available are valued at fair value as determined in good faith pursuant to the Valuation Procedures. A market quotation is readily available only when that quotation is a quoted price (unadjusted) in active markets for identical investments that the Portfolio can access at the measurement date, provided that a quotation will not be readily available if it is not reliable. "Fair value" is defined as the price the Portfolio would reasonably expect to receive upon selling an asset or liability in an orderly transaction to an independent buyer in the principal or most advantageous market for the
| 24 | MainStay VP Bond Portfolio |
asset or liability. Fair value measurements are determined within a framework that establishes a three-tier hierarchy that maximizes the use of observable market data and minimizes the use of unobservable inputs to establish a classification of fair value measurements for disclosure purposes. "Inputs" refer broadly to the assumptions that market participants would use in pricing the asset or liability, including assumptions about risk, such as the risk inherent in a particular valuation technique used to measure fair value using a pricing model and/or the risk inherent in the inputs for the valuation technique. Inputs may be observable or unobservable. Observable inputs reflect the assumptions market participants would use in pricing the asset or liability based on market data obtained from sources independent of the Portfolio. Unobservable inputs reflect the Portfolio’s own assumptions about the assumptions market participants would use in pricing the asset or liability based on the information available. The inputs or methodology used for valuing assets or liabilities may not be an indication of the risks associated with investing in those assets or liabilities. The three-tier hierarchy of inputs is summarized below.
| • | Level 1—quoted prices (unadjusted) in active markets for an identical asset or liability |
| • | Level 2—other significant observable inputs (including quoted prices for a similar asset or liability in active markets, interest rates and yield curves, prepayment speeds, credit risk, etc.) |
| • | Level 3—significant unobservable inputs (including the Portfolio's own assumptions about the assumptions that market participants would use in measuring fair value of an asset or liability) |
The level of an asset or liability within the fair value hierarchy is based on the lowest level of an input, both individually and in the aggregate, that is significant to the fair value measurement. The aggregate value by input level of the Portfolio’s assets and liabilities as of December 31, 2023, is included at the end of the Portfolio of Investments.
The Portfolio may use third-party vendor evaluations, whose prices may be derived from one or more of the following standard inputs, among others:
| • Benchmark yields | • Reported trades |
| • Broker/dealer quotes | • Issuer spreads |
| • Two-sided markets | • Benchmark securities |
| • Bids/offers | • Reference data (corporate actions or material event notices) |
| • Industry and economic events | • Comparable bonds |
| • Monthly payment information | |
An asset or liability for which a market quotation is not readily available is valued by methods deemed reasonable in good faith by the Valuation Committee, following the Valuation Procedures to represent fair value. Under these procedures, the Valuation Designee generally uses a market-based approach which may use related or comparable assets or liabilities, recent transactions, market multiples, book values and other relevant information. The Valuation Designee may also use an
income-based valuation approach in which the anticipated future cash flows of the asset or liability are discounted to calculate fair value. Discounts may also be applied due to the nature and/or duration of any restrictions on the disposition of the asset or liability. Fair value represents a good faith approximation of the value of a security. Fair value determinations involve the consideration of a number of subjective factors, an analysis of applicable facts and circumstances and the exercise of judgment. As a result, it is possible that the fair value for a security determined in good faith in accordance with the Valuation Procedures may differ from valuations for the same security determined for other funds using their own valuation procedures. Although the Valuation Procedures are designed to value a security at the price the Portfolio may reasonably expect to receive upon the security's sale in an orderly transaction, there can be no assurance that any fair value determination thereunder would, in fact, approximate the amount that the Portfolio would actually realize upon the sale of the security or the price at which the security would trade if a reliable market price were readily available. During the year ended December 31, 2023, there were no material changes to the fair value methodologies.
Securities which may be valued in this manner include, but are not limited to: (i) a security for which trading has been halted or suspended or otherwise does not have a readily available market quotation on a given day; (ii) a debt security that has recently gone into default and for which there is not a current market quotation; (iii) a security of an issuer that has entered into a restructuring; (iv) a security that has been delisted from a national exchange; (v) a security subject to trading collars for which no or limited trading takes place; and (vi) a security whose principal market has been temporarily closed at a time when, under normal conditions, it would be open. Securities valued in this manner are generally categorized as Level 2 or 3 in the hierarchy.
Futures contracts are valued at the last posted settlement price on the market where such futures are primarily traded. These securities are generally categorized as Level 1 in the hierarchy.
Debt securities (other than convertible and municipal bonds) are valued at the evaluated bid prices (evaluated mean prices in the case of convertible and municipal bonds) supplied by a pricing agent or broker selected by the Valuation Designee, in consultation with the Subadvisor. The evaluations are market-based measurements processed through a pricing application and represents the pricing agent’s good faith determination as to what a holder may receive in an orderly transaction under market conditions. The rules-based logic utilizes valuation techniques that reflect participants’ assumptions and vary by asset class and per methodology, maximizing the use of relevant observable data including quoted prices for similar assets, benchmark yield curves and market corroborated inputs. The evaluated bid or mean prices are deemed by the Valuation Designee, in consultation with the Subadvisor, to be representative of market values at the regular close of trading of the Exchange on each valuation date. Debt securities purchased on a delayed delivery basis are marked to market daily until settlement at the forward settlement date. Debt securities, including corporate bonds, U.S. government and federal agency bonds, municipal bonds, foreign bonds, convertible bonds,
Notes to Financial Statements (continued)
asset-backed securities and mortgage-backed securities are generally categorized as Level 2 in the hierarchy.
The information above is not intended to reflect an exhaustive list of the methodologies that may be used to value portfolio investments. The Valuation Procedures permit the use of a variety of valuation methodologies in connection with valuing portfolio investments. The methodology used for a specific type of investment may vary based on the market data available or other considerations. The methodologies summarized above may not represent the specific means by which portfolio investments are valued on any particular business day.
A portfolio investment may be classified as an illiquid investment under the Portfolio's written liquidity risk management program and related procedures (“Liquidity Program”). Illiquidity of an investment might prevent the sale of such investment at a time when the Manager or the Subadvisor might wish to sell, and these investments could have the effect of decreasing the overall level of the Portfolio's liquidity. Further, the lack of an established secondary market may make it more difficult to value illiquid investments, requiring the Portfolio to rely on judgments that may be somewhat subjective in measuring value, which could vary materially from the amount that the Portfolio could realize upon disposition. Difficulty in selling illiquid investments may result in a loss or may be costly to the Portfolio. An illiquid investment is any investment that the Manager or Subadvisor reasonably expects cannot be sold or disposed of in current market conditions in seven calendar days or less without the sale or disposition significantly changing the market value of the investment. The liquidity classification of each investment will be made using information obtained after reasonable inquiry and taking into account, among other things, relevant market, trading and investment-specific considerations in accordance with the Liquidity Program. Illiquid investments are often fair valued in accordance with the Portfolio's procedures described above. The liquidity of the Portfolio's investments was determined as of December 31, 2023, and can change at any time.
(B) Income Taxes. The Portfolio's policy is to comply with the requirements of the Internal Revenue Code of 1986, as amended (the “Internal Revenue Code”), applicable to regulated investment companies and to distribute all of its taxable income to the shareholders of the Portfolio within the allowable time limits.
The Manager evaluates the Portfolio’s tax positions to determine if the tax positions taken meet the minimum recognition threshold in connection with accounting for uncertainties in income tax positions taken or expected to be taken for the purposes of measuring and recognizing tax liabilities in the financial statements. Recognition of tax benefits of an uncertain tax position is permitted only to the extent the position is “more likely than not” to be sustained assuming examination by taxing authorities. The Manager analyzed the Portfolio's tax positions taken on federal, state and local income tax returns for all open tax years (for up to three tax years) and has concluded that no provisions for federal, state and local income tax are required in the Portfolio's financial statements. The Portfolio's federal, state and local income tax and federal excise tax
returns for tax years for which the applicable statutes of limitations have not expired are subject to examination by the Internal Revenue Service and state and local departments of revenue.
(C) Dividends and Distributions to Shareholders. Dividends and distributions are recorded on the ex-dividend date. The Portfolio intends to declare and pay dividends from net investment income and distributions from net realized capital and currency gains, if any, at least annually. All dividends and distributions are reinvested at NAV in the same class of shares of the Portfolio. Dividends and distributions to shareholders are determined in accordance with federal income tax regulations and may differ from determinations using GAAP.
(D) Security Transactions and Investment Income. The Portfolio records security transactions on the trade date. Realized gains and losses on security transactions are determined using the identified cost method. Dividend income is recognized on the ex-dividend date, net of any foreign tax withheld at the source, and interest income is accrued as earned using the effective interest rate method and includes any realized gains and losses from repayments of principal on mortgage-backed securities. Discounts and premiums on securities purchased for the Portfolio are accreted and amortized, respectively, on the effective interest rate method.
Investment income and realized and unrealized gains and losses on investments of the Portfolio are allocated pro rata to the separate classes of shares based upon their relative net assets on the date the income is earned or realized and unrealized gains and losses are incurred.
The Portfolio may place a debt security on non-accrual status and reduce related interest income by ceasing current accruals and writing off all or a portion of any interest receivables when the collection of all or a portion of such interest has become doubtful. A debt security is removed from non-accrual status when the issuer resumes interest payments or when collectability of interest is reasonably assured.
(E) Expenses. Expenses of the Fund are allocated to the individual Portfolios in proportion to the net assets of the respective Portfolios when the expenses are incurred, except where direct allocations of expenses can be made. Expenses (other than fees incurred under the distribution and service plans, further discussed in Note 3(B), which are charged directly to the Service Class shares) are allocated to separate classes of shares pro rata based upon their relative net assets on the date the expenses are incurred. The expenses borne by the Portfolio, including those of related parties to the Portfolio, are shown in the Statement of Operations.
(F) Use of Estimates. In preparing financial statements in conformity with GAAP, the Manager makes estimates and assumptions that affect the reported amounts and disclosures in the financial statements. Actual results could differ from those estimates and assumptions.
(G) Futures Contracts. A futures contract is an agreement to purchase or sell a specified quantity of an underlying instrument at a specified future date and price, or to make or receive a cash payment
| 26 | MainStay VP Bond Portfolio |
based on the value of a financial instrument (e.g., foreign currency, interest rate, security or securities index). The Portfolio is subject to risks such as market price risk, leverage risk, liquidity risk, counterparty risk, operational risk, legal risk and/or interest rate risk in the normal course of investing in these contracts. Upon entering into a futures contract, the Portfolio is required to pledge to the broker or futures commission merchant an amount of cash and/or U.S. government securities equal to a certain percentage of the collateral amount, known as the “initial margin.” During the period the futures contract is open, changes in the value of the contract are recognized as unrealized appreciation or depreciation by marking to market such contract on a daily basis to reflect the market value of the contract at the end of each day’s trading. The Portfolio agrees to receive from or pay to the broker or futures commission merchant an amount of cash equal to the daily fluctuation in the value of the contract. Such receipts or payments are known as “variation margin.” When the futures contract is closed, the Portfolio records a realized gain or loss equal to the difference between the proceeds from (or cost of) the closing transaction and the Portfolio's basis in the contract.
The use of futures contracts involves, to varying degrees, elements of market risk in excess of the amount recognized in the Statement of Assets and Liabilities. The contract or notional amounts and variation margin reflect the extent of the Portfolio's involvement in open futures positions. There are several risks associated with the use of futures contracts as hedging techniques. There can be no assurance that a liquid market will exist at the time when the Portfolio seeks to close out a futures contract. If no liquid market exists, the Portfolio would remain obligated to meet margin requirements until the position is closed. Futures contracts may involve a small initial investment relative to the risk assumed, which could result in losses greater than if the Portfolio did not invest in futures contracts. Futures contracts may be more volatile than direct investments in the instrument underlying the futures and may not correlate to the underlying instrument, causing a given hedge not to achieve its objectives. The Portfolio's activities in futures contracts have minimal counterparty risk as they are conducted through regulated exchanges that guarantee the futures against default by the counterparty. In the event of a bankruptcy or insolvency of a futures commission merchant that holds margin on behalf of the Portfolio, the Portfolio may not be entitled to the return of the entire margin owed to the Portfolio, potentially resulting in a loss. The Portfolio may invest in futures contracts to seek enhanced returns or to reduce the risk of loss by hedging certain of its holdings. The Portfolio's investment in futures contracts and other derivatives may increase the volatility of the Portfolio's NAVs and may result in a loss to the Portfolio.
(H) Securities Sold Short. During the year ended December 31, 2023, the Portfolio engaged in sales of securities it did not own ("short sales") as part of its investment strategies. During the period a short position is open, depending on the nature and type of security, a short position is reflected as a liability and is marked to market in accordance with the valuation methodologies previously detailed (See Note 2(A)). Liabilities for securities sold short are closed out by purchasing the
applicable securities for delivery to the counterparty broker. A gain, limited to the price at which the Portfolio sold the security short, or a loss, unlimited as to dollar amount, will be recognized upon termination of a short sale if the market price on the date the short position is closed out is less or greater, respectively, than the proceeds originally received. Any such gain or loss may be offset, completely or in part, by the change in the value of the hedged investments. Interest on short positions held is accrued daily, while dividends declared on short positions existing on the record date are recorded on the ex-dividend date as a dividend expense in the Statement of Operations. Broker fees and other expenses related to securities sold short are disclosed in the Statement of Operations. Short sales involve risk of loss in excess of the related amounts reflected in the Statement of Assets and Liabilities.
(I) Dollar Rolls. The Portfolio may enter into dollar roll transactions in which it sells mortgage-backed securities ("MBS") from its portfolio to a counterparty from whom it simultaneously agrees to buy a similar security on a delayed delivery basis. The Portfolio generally transfers MBS where the MBS are "to be announced," therefore, the Portfolio accounts for these transactions as purchases and sales.
When accounted for as purchase and sales, the securities sold in connection with the dollar rolls are removed from the portfolio and a realized gain or loss is recognized. The securities the Portfolio has agreed to acquire are included at market value in the Portfolio of Investments and liabilities for such purchase commitments are included as payables for investments purchased. During the roll period, the Portfolio foregoes principal and interest paid on the securities. The Portfolio is compensated by the difference between the current sales price and the forward price for the future as well as by the earnings on the cash proceeds of the initial sale. Dollar rolls may be renewed without physical delivery of the securities subject to the contract. Dollar roll transactions involve certain risks, including the risk that the securities returned to the Portfolio at the end of the roll period, while substantially similar, could be inferior to what was initially sold to the counterparty.
(J) Delayed Delivery Transactions. The Portfolio may purchase or sell securities on a delayed delivery basis. These transactions involve a commitment by the Portfolio to purchase or sell securities for a predetermined price or yield, with payment and delivery taking place beyond the customary settlement period. When delayed delivery purchases are outstanding, the Portfolio will designate liquid assets in an amount sufficient to meet the purchase price. When purchasing a security on a delayed delivery basis, the Portfolio assumes the rights and risks of ownership of the security, including the risk of price and yield fluctuations, and takes such fluctuations into account when determining its NAV. The Portfolio may dispose of or renegotiate a delayed delivery transaction after it is entered into, and may sell delayed delivery securities before they are delivered, which may result in a realized gain or loss. When the Portfolio has sold a security it owns on a delayed delivery basis, the Portfolio does not participate in future gains and losses with respect to the security.
Notes to Financial Statements (continued)
(K) Debt Securities Risk. The ability of issuers of debt securities held by the Portfolio to meet their obligations may be affected by, among other things, economic or political developments in a specific country, industry or region. Debt securities are also subject to the risks associated with changes in interest rates.
Investments in the Portfolio are not guaranteed, even though some of the Portfolio’s underlying investments are guaranteed by the U.S. government or its agencies or instrumentalities. The principal risk of mortgage-related and asset-backed securities is that the underlying debt may be prepaid ahead of schedule, if interest rates fall, thereby reducing the value of the Portfolio’s investment. If interest rates rise, less of the debt may be prepaid and the Portfolio may lose money because the Portfolio may be unable to invest in higher yielding assets. The Portfolio is subject to interest-rate risk and can lose principal value when interest rates rise. Bonds are also subject to credit risk, in which the bond issuer may fail to pay interest and principal in a timely manner.
The Portfolio may invest in foreign debt securities, which carry certain risks that are in addition to the usual risks inherent in domestic instruments. Foreign regulatory regimes and securities markets can have less stringent investor protections and disclosure standards and less liquid trading markets than U.S. regulatory regimes and securities markets, and can experience political, social and economic developments that may affect the value of investments in foreign securities. These risks include those resulting from currency fluctuations, future adverse political or economic developments and possible imposition of currency exchange blockages or other foreign governmental laws or restrictions. Economic sanctions and other similar governmental actions or developments could, among other things, effectively restrict or eliminate the Fund’s ability to purchase or sell certain foreign securities or groups of foreign securities, and thus may make the Fund’s investments in such securities less liquid or more difficult to value. These risks are likely to be greater in emerging markets than in developed markets. The ability of issuers of debt securities held by the Portfolio to meet their obligations may be affected by, among other things, economic or political developments in a specific country, industry or region.
(L) Indemnifications. Under the Fund’s organizational documents, its officers and trustees are indemnified against certain liabilities that may arise out of performance of their duties to the Fund. Additionally, in the normal course of business, the Portfolio enters into contracts with third-party service providers that contain a variety of representations and warranties and that may provide general indemnifications. The Portfolio's maximum exposure under these arrangements is unknown, as this would involve future claims that may be made against the Portfolio that have not yet occurred. The Manager believes that the risk of loss in connection with these potential indemnification obligations is remote. However, there can be no assurance that material liabilities related to such obligations will not arise in the future, which could adversely impact the Portfolio.
(M) Quantitative Disclosure of Derivative Holdings. The following tables show additional disclosures related to the Portfolio's derivative and hedging activities, including how such activities are
accounted for and their effect on the Portfolio's financial positions, performance and cash flows.
The Portfolio entered into futures contracts in order to hedge against anticipated changes in interest rates that might otherwise have an adverse effect upon the value of the Portfolio's securities as well as help manage the duration and yield curve positioning of the portfolio. These derivatives are not accounted for as hedging instruments.
Fair value of derivative instruments as of December 31, 2023:
| Asset Derivatives | Interest
Rate
Contracts
Risk | Total |
| Futures Contracts - Net Assets—Net unrealized appreciation on futures contracts (a) | $4,211,927 | $4,211,927 |
| Total Fair Value | $4,211,927 | $4,211,927 |
| (a) | Includes cumulative appreciation (depreciation) of futures contracts as reported in the Portfolio of Investments. Only current day’s variation margin is reported within the Statement of Assets and Liabilities. |
| Liability Derivatives | Interest
Rate
Contracts
Risk | Total |
| Futures Contracts - Net Assets—Net unrealized depreciation on futures contracts (a) | $(993,908) | $(993,908) |
| Total Fair Value | $(993,908) | $(993,908) |
| (a) | Includes cumulative appreciation (depreciation) of futures contracts as reported in the Portfolio of Investments. Only current day’s variation margin is reported within the Statement of Assets and Liabilities. |
The effect of derivative instruments on the Statement of Operations for the year ended December 31, 2023:
| Net Realized Gain (Loss) from: | Interest
Rate
Contracts
Risk | Total |
| Futures Transactions | $(7,306,683) | $(7,306,683) |
| Total Net Realized Gain (Loss) | $(7,306,683) | $(7,306,683) |
| Net Change in Unrealized Appreciation (Depreciation) | Interest
Rate
Contracts
Risk | Total |
| Futures Contracts | $3,914,711 | $3,914,711 |
| Total Net Change in Unrealized Appreciation (Depreciation) | $3,914,711 | $3,914,711 |
| Average Notional Amount | Total |
| Futures Contracts Long | $ 79,945,218 |
| Futures Contracts Short | $(39,212,523) |
| 28 | MainStay VP Bond Portfolio |
Note 3–Fees and Related Party Transactions
(A) Manager and Subadvisor. New York Life Investments, a registered investment adviser and an indirect, wholly-owned subsidiary of New York Life, serves as the Portfolio's Manager pursuant to an Amended and Restated Management Agreement ("Management Agreement"). The Manager provides offices, conducts clerical, recordkeeping and bookkeeping services and keeps most of the financial and accounting records required to be maintained by the Portfolio. Except for the portion of salaries and expenses that are the responsibility of the Portfolio, the Manager pays the salaries and expenses of all personnel affiliated with the Portfolio and certain operational expenses of the Portfolio. The Portfolio reimburses New York Life Investments in an amount equal to the portion of the compensation of the Chief Compliance Officer attributable to the Portfolio. NYL Investors LLC ("NYL Investors" or ''Subadvisor''), a registered investment adviser and a direct, wholly-owned subsidiary of New York Life, serves as the Subadvisor to the Portfolio and is responsible for the day-to-day portfolio management of the Portfolio. Pursuant to the terms of a Subadvisory Agreement between New York Life Investments and NYL Investors, New York Life Investments pays for the services of the Subadvisor.
Pursuant to the Management Agreement, the Fund pays the Manager, on behalf of the Portfolio, a monthly fee for the services performed and the facilities furnished at an annual rate of the Portfolio's average daily net assets as follows: 0.50% up to $500 million; 0.475% from $500 million to $1 billion; 0.45% from $1 billion to $3 billion; and 0.44% in excess of $3 billion. During the year ended December 31, 2023, the effective management fee rate was 0.49% of the Portfolio's average daily net assets.
During the year ended December 31, 2023, New York Life Investments earned fees from the Portfolio in the amount of $3,301,721 and paid the Subadvisor fees in the amount of $1,650,860.
JPMorgan Chase Bank, N.A. ("JPMorgan") provides sub-administration and sub-accounting services to the Portfolio pursuant to an agreement with New York Life Investments. These services include calculating the daily NAVs of the Portfolio, maintaining the general ledger and sub-ledger accounts for the calculation of the Portfolio's NAVs, and assisting New York Life Investments in conducting various aspects of the Portfolio's administrative operations. For providing these services to the Portfolio, JPMorgan is compensated by New York Life Investments.
Pursuant to an agreement between the Fund and New York Life Investments, New York Life Investments is responsible for providing or procuring certain regulatory reporting services for the Portfolio. The Portfolio will reimburse New York Life Investments for the actual costs incurred by New York Life Investments in connection with providing or procuring these services for the Portfolio.
(B) Distribution and Service Fees. The Fund, on behalf of the Portfolio, has entered into a distribution agreement with NYLIFE Distributors LLC (the “Distributor”), an affiliate of New York Life Investments. The Portfolio has adopted a distribution plan (the “Plan”) in
accordance with the provisions of Rule 12b-1 under the 1940 Act. Under the Plan, the Distributor has agreed to provide, through its affiliates or independent third parties, various distribution-related, shareholder and administrative support services to the Service Class shareholders. For its services, the Distributor is entitled to a combined distribution and service fee accrued daily and paid monthly at an annual rate of 0.25% of the average daily net assets attributable to the Service Class shares of the Portfolio.
Note 4-Federal Income Tax
As of December 31, 2023, the cost and unrealized appreciation (depreciation) of the Portfolio’s investment portfolio, including applicable derivative contracts and other financial instruments, as determined on a federal income tax basis, were as follows:
| | Federal Tax
Cost | Gross
Unrealized
Appreciation | Gross
Unrealized
(Depreciation) | Net
Unrealized
Appreciation/
(Depreciation) |
| Investments in Securities | $623,437,725 | $13,522,406 | $(7,907,495) | $5,614,911 |
As of December 31, 2023, the components of accumulated gain (loss) on a tax basis were as follows:
Ordinary
Income | Accumulated
Capital
and Other
Gain (Loss) | Other
Temporary
Differences | Unrealized
Appreciation
(Depreciation) | Total
Accumulated
Gain (Loss) |
| $27,827,035 | $(132,652,944) | $— | $6,942,242 | $(97,883,667) |
The difference between book-basis and tax-basis unrealized appreciation (depreciation) is primarily due to mark to market of futures contracts, wash sale and straddle loss deferral adjustments.
As of December 31, 2023, for federal income tax purposes, capital loss carryforwards of $131,325,613, as shown in the table below, were available to the extent provided by the regulations to offset future realized gains of the Portfolio. Accordingly, no capital gains distributions are expected to be paid to shareholders until net gains have been realized in excess of such amounts.
Capital Loss
Available Through | Short-Term
Capital Loss
Amounts (000’s) | Long-Term
Capital Loss
Amounts (000’s) |
| Unlimited | $62,592 | $68,733 |
During the years ended December 31, 2023 and December 31, 2022, the tax character of distributions paid as reflected in the Statements of Changes in Net Assets was as follows:
| | 2023 | 2022 |
| Distributions paid from: | | |
| Ordinary Income | $18,247,869 | $12,889,609 |
Notes to Financial Statements (continued)
Note 5–Custodian
JPMorgan is the custodian of cash and securities held by the Portfolio. Custodial fees are charged to the Portfolio based on the Portfolio's net assets and/or the market value of securities held by the Portfolio and the number of certain transactions incurred by the Portfolio.
Note 6–Line of Credit
The Portfolio and certain other funds managed by New York Life Investments maintain a line of credit with a syndicate of banks in order to secure a source of funds for temporary purposes to meet unanticipated or excessive redemption requests.
Effective July 25, 2023, under the credit agreement (the “Credit Agreement”), the aggregate commitment amount is $600,000,000 with an additional uncommitted amount of $100,000,000. The commitment fee is an annual rate of 0.15% of the average commitment amount payable quarterly, regardless of usage, to JPMorgan, who serves as the agent to the syndicate. The commitment fee is allocated among the Portfolio and certain other funds managed by New York Life Investments based upon their respective net assets and other factors. Interest on any revolving credit loan is charged based upon the Federal Funds Rate, Daily SOFR + 0.10%, or the Overnight Bank Funding Rate, whichever is higher. The Credit Agreement expires on July 23, 2024, although the Portfolio, certain other funds managed by New York Life Investments and the syndicate of banks may renew the Credit Agreement for an additional year on the same or different terms or enter into a credit agreement with a different syndicate of banks. Prior to July 25, 2023, the aggregate commitment amount and the commitment fee were the same as those under the current Credit Agreement. During the year ended December 31, 2023, there were no borrowings made or outstanding with respect to the Portfolio under the Credit Agreement.
Note 7–Interfund Lending Program
Pursuant to an exemptive order issued by the SEC, the Portfolio, along with certain other funds managed by New York Life Investments, may participate in an interfund lending program. The interfund lending program provides an alternative credit facility that permits the Portfolio and certain other funds managed by New York Life Investments to lend or borrow money for temporary purposes directly to or from one another, subject to the conditions of the exemptive order. During the year ended December 31, 2023, there were no interfund loans made or outstanding with respect to the Portfolio.
Note 8–Purchases and Sales of Securities (in 000’s)
During the year ended December 31, 2023, purchases and sales of U.S. government securities were $1,897,089 and $1,966,968, respectively. Purchases and sales of securities, other than U.S. government securities and short-term securities, were $1,145,225 and $1,128,024, respectively.
Note 9–Capital Share Transactions
Transactions in capital shares for the years ended December 31, 2023 and December 31, 2022, were as follows:
| Initial Class | Shares | Amount |
| Year ended December 31, 2023: | | |
| Shares sold | 2,871,598 | $ 35,227,311 |
| Shares issued to shareholders in reinvestment of distributions | 734,475 | 8,428,021 |
| Shares redeemed | (6,294,173) | (76,014,720) |
| Net increase (decrease) | (2,688,100) | $(32,359,388) |
| Year ended December 31, 2022: | | |
| Shares sold | 5,245,388 | $ 67,757,317 |
| Shares issued to shareholders in reinvestment of distributions | 502,562 | 5,913,796 |
| Shares redeemed | (6,872,142) | (89,940,899) |
| Net increase (decrease) | (1,124,192) | $(16,269,786) |
| |
| Service Class | Shares | Amount |
| Year ended December 31, 2023: | | |
| Shares sold | 2,124,875 | $ 25,603,440 |
| Shares issued to shareholders in reinvestment of distributions | 865,314 | 9,819,848 |
| Shares redeemed | (4,998,282) | (59,964,877) |
| Net increase (decrease) | (2,008,093) | $(24,541,589) |
| Year ended December 31, 2022: | | |
| Shares sold | 1,796,487 | $ 22,977,923 |
| Shares issued to shareholders in reinvestment of distributions | 599,549 | 6,975,813 |
| Shares redeemed | (6,472,414) | (83,020,875) |
| Net increase (decrease) | (4,076,378) | $(53,067,139) |
Note 10–Other Matters
As of the date of this report, the Portfolio faces a heightened level of risk associated with current uncertainty, volatility and state of economies, financial markets, rising interest rates, and labor and health conditions around the world. Events such as war, acts of terrorism, recessions, rapid inflation, the imposition of international sanctions, earthquakes, hurricanes, epidemics and pandemics and other unforeseen natural or human disasters may have broad adverse social, political and economic effects on the global economy, which could negatively impact the value of the Portfolio's investments. Developments that disrupt global economies and financial markets may magnify factors that affect the Portfolio's performance.
Note 11–Subsequent Events
In connection with the preparation of the financial statements of the Portfolio as of and for the year ended December 31, 2023, events and transactions subsequent to December 31, 2023, through the date the financial statements were issued, have been evaluated by the Manager
| 30 | MainStay VP Bond Portfolio |
for possible adjustment and/or disclosure. No subsequent events requiring financial statement adjustment or disclosure have been identified.
Report of Independent Registered Public Accounting Firm
To the Board of Trustees of MainStay VP Funds Trust and Shareholders of MainStay VP Bond Portfolio
Opinion on the Financial Statements
We have audited the accompanying statement of assets and liabilities, including the portfolio of investments, of MainStay VP Bond Portfolio (one of the portfolios constituting MainStay VP Funds Trust, referred to hereafter as the “Portfolio”) as of December 31, 2023, the related statement of operations for the year ended December 31, 2023, the statements of changes in net assets for each of the two years in the period ended December 31, 2023, including the related notes, and the financial highlights for each of the five years in the period ended December 31, 2023 (collectively referred to as the “financial statements”). In our opinion, the financial statements present fairly, in all material respects, the financial position of the Portfolio as of December 31, 2023, the results of its operations for the year then ended, the changes in its net assets for each of the two years in the period ended December 31, 2023 and the financial highlights for each of the five years in the period ended December 31, 2023 in conformity with accounting principles generally accepted in the United States of America.
Basis for Opinion
These financial statements are the responsibility of the Portfolio’s management. Our responsibility is to express an opinion on the Portfolio’s financial statements based on our audits. We are a public accounting firm registered with the Public Company Accounting Oversight Board (United States) (PCAOB) and are required to be independent with respect to the Portfolio in accordance with the U.S. federal securities laws and the applicable rules and regulations of the Securities and Exchange Commission and the PCAOB.
We conducted our audits of these financial statements in accordance with the standards of the PCAOB. Those standards require that we plan and perform the audit to obtain reasonable assurance about whether the financial statements are free of material misstatement, whether due to error or fraud.
Our audits included performing procedures to assess the risks of material misstatement of the financial statements, whether due to error or fraud, and performing procedures that respond to those risks. Such procedures included examining, on a test basis, evidence regarding the amounts and disclosures in the financial statements. Our audits also included evaluating the accounting principles used and significant estimates made by management, as well as evaluating the overall presentation of the financial statements. Our procedures included confirmation of securities owned as of December 31, 2023 by correspondence with the custodian and brokers; when replies were not received from brokers, we performed other auditing procedures. We believe that our audits provide a reasonable basis for our opinion.
/s/PricewaterhouseCoopers LLP
New York, New York
February 26, 2024
We have served as the auditor of one or more investment companies in the MainStay group of funds since 1984.
| 32 | MainStay VP Bond Portfolio |
Board Consideration and Approval of Management Agreement and Subadvisory Agreement (Unaudited)
The continuation of the Management Agreement with respect to the MainStay VP Bond Portfolio (“Portfolio”) and New York Life Investment Management LLC (“New York Life Investments”) and the Subadvisory Agreement between New York Life Investments and NYL Investors LLC (“NYL Investors”) with respect to the Portfolio (together, “Advisory Agreements”) is subject to annual review and approval by the Board of Trustees of MainStay VP Funds Trust (“Board” of the “Trust”) in accordance with Section 15 of the Investment Company Act of 1940, as amended (“1940 Act”). At its December 6–7, 2023 meeting, the Board, including the Trustees who are not an “interested person” (as such term is defined in the 1940 Act) of the Trust (“Independent Trustees”) voting separately, unanimously approved the continuation of each of the Advisory Agreements for a one-year period.
In reaching the decision to approve the continuation of each of the Advisory Agreements, the Board considered information and materials furnished by New York Life Investments and NYL Investors in connection with an annual contract review process undertaken by the Board that took place at meetings of the Board and its Contracts Committee from September 2023 through December 2023, including information and materials furnished by New York Life Investments and NYL Investors in response to requests prepared on behalf of the Board, and in consultation with the Independent Trustees, by independent legal counsel to the Independent Trustees, which encompassed a variety of topics, including those summarized below. Information and materials requested by and furnished to the Board for consideration in connection with the contract review process included, among other items, reports on the Portfolio and “peer funds” prepared by Institutional Shareholder Services Inc. (“ISS”), an independent third-party service provider engaged by the Board to report objectively on the Portfolio’s investment performance, management fee and total expenses. The Board also considered information on the fees charged to other investment advisory clients of New York Life Investments and/or NYL Investors that follow investment strategies similar to those of the Portfolio, if any, and, when applicable, the rationale for differences in the Portfolio’s management and subadvisory fees and the fees charged to those other investment advisory clients. In addition, the Board considered information regarding the legal standards and fiduciary obligations applicable to its consideration of the continuation of each of the Advisory Agreements. The contract review process, including the structure and format for information and materials provided to the Board, has been developed in consultation with the Board. The Independent Trustees also met in executive sessions with their independent legal counsel and, for portions thereof, with senior management of New York Life Investments.
The Board’s deliberations with respect to the continuation of each of the Advisory Agreements reflect a year-long process, and the Board also took into account information furnished to the Board and its Committees throughout the year, as deemed relevant and appropriate by the Trustees, including, among other items, reports on investment performance of the Portfolio and investment-related matters for the Portfolio as well as presentations from New York Life Investments and, generally annually, NYL Investors personnel. In addition, the Board took into account other
information provided by New York Life Investments throughout the year, including, among other items, periodic reports on legal and compliance matters, risk management, portfolio turnover, brokerage commissions and non-advisory services provided to the Portfolio by New York Life Investments, as deemed relevant and appropriate by the Trustees.
In addition to information provided to the Board throughout the year, the Board received information in connection with its June 2023 meeting provided specifically in response to requests prepared on behalf of the Board, and in consultation with the Independent Trustees, by independent legal counsel to the Independent Trustees regarding the Portfolio’s distribution arrangements. In addition, the Board received information regarding the Portfolio’s asset levels, share purchase and redemption activity and the payment of Rule 12b-1 and/or certain other fees by the applicable share classes of the Portfolio, among other information.
In considering the continuation of each of the Advisory Agreements, the Trustees reviewed and evaluated the information and factors they believed to reasonably be necessary and appropriate in light of legal advice furnished to them by independent legal counsel to the Independent Trustees and through the exercise of their own business judgment. Although individual Trustees may have weighed certain factors or information differently and the Board did not consider any single factor or information controlling in reaching its decision, the factors that figured prominently in the Board’s consideration of the continuation of each of the Advisory Agreements are summarized in more detail below and include, among other factors: (i) the nature, extent and quality of the services provided to the Portfolio by New York Life Investments and NYL Investors; (ii) the qualifications of the portfolio managers of the Portfolio and the historical investment performance of the Portfolio, New York Life Investments and NYL Investors; (iii) the costs of the services provided, and profits realized, by New York Life Investments and NYL Investors with respect to their relationships with the Portfolio; (iv) the extent to which economies of scale have been realized or may be realized if the Portfolio grows and the extent to which any economies of scale have been shared, have benefited or may benefit the Portfolio’s shareholders; and (v) the reasonableness of the Portfolio’s management and subadvisory fees and total ordinary operating expenses. Although the Board recognized that comparisons between the Portfolio’s fees and expenses and those of other funds are imprecise given different terms of agreements, variations in fund strategies and other factors, the Board considered the reasonableness of the Portfolio’s management fee and total ordinary operating expenses as compared to the peer funds identified by ISS. Throughout their considerations, the Trustees acknowledged the commitment of New York Life Investments and its affiliates to serve the MainStay Group of Funds, as well as their capacity, experience, resources, financial stability and reputations. The Trustees also acknowledged the entrepreneurial and other risks assumed by New York Life Investments in sponsoring and managing the Portfolio. With respect to the Subadvisory Agreement, the Board took into account New York Life Investments’ recommendation to approve the continuation of the Subadvisory Agreement.
Board Consideration and Approval of Management Agreement and Subadvisory Agreement (Unaudited) (continued)
The Trustees noted that, throughout the year, the Trustees are afforded an opportunity to ask questions of, and request additional information or materials from, New York Life Investments and NYL Investors. The Board’s decision with respect to each of the Advisory Agreements may have also been based, in part, on the Board’s knowledge of New York Life Investments and NYL Investors resulting from, among other things, the Board’s consideration of each of the Advisory Agreements in prior years, the advisory agreements for other funds in the MainStay Group of Funds, the Board’s review throughout the year of the performance and operations of other funds in the MainStay Group of Funds and each Trustee’s business judgment and industry experience. In addition to considering the above-referenced factors, the Board observed that in the marketplace, notably under variable life insurance policies and variable annuity contracts for which the Portfolio serves as an investment option, there are a range of investment options available to investors and that the Portfolio’s shareholders, having had the opportunity to consider other investment options, have invested in the Portfolio.
The factors that figured prominently in the Board’s decision to approve the continuation of each of the Advisory Agreements during the Board’s December 6–7, 2023 meeting are summarized in more detail below.
Nature, Extent and Quality of Services Provided by New York Life Investments and NYL Investors
The Board examined the nature, extent and quality of the services that New York Life Investments provides to the Portfolio. The Board evaluated New York Life Investments’ experience and capabilities in serving as manager of the Portfolio and considered that the Portfolio operates in a “manager-of-managers” structure. The Board also considered New York Life Investments’ responsibilities and services provided pursuant to this structure, including overseeing the services provided by NYL Investors, evaluating the performance of NYL Investors, making recommendations to the Board as to whether the Subadvisory Agreement should be renewed, modified or terminated and periodically reporting to the Board regarding the results of New York Life Investments’ evaluation and monitoring functions. The Board noted that New York Life Investments manages other mutual funds, serves a variety of other investment advisory clients, including other pooled investment vehicles, and has experience overseeing mutual fund service providers, including subadvisors. The Board considered the experience of senior personnel at New York Life Investments providing management and administrative and other non-advisory services to the Portfolio. The Board observed that New York Life Investments devotes significant resources and time to providing management and administrative and other non-advisory services to the Portfolio, including New York Life Investments’ oversight and due diligence reviews of NYL Investors and ongoing analysis of, and interactions with, NYL Investors with respect to, among other things, the Portfolio’s investment performance and risks as well as NYL Investors’ investment capabilities and subadvisory services with respect to the Portfolio.
The Board also considered the range of services that New York Life Investments provides to the Portfolio under the terms of the Management Agreement, including: (i) fund accounting and ongoing supervisory services provided by New York Life Investments’ Fund Administration and Accounting Group; (ii) investment supervisory and analytical services provided by New York Life Investments’ Investment Consulting Group; (iii) compliance services provided by the Trust’s Chief Compliance Officer as well as New York Life Investments’ compliance department, including supervision and implementation of the Portfolio’s compliance program; (iv) legal services provided by New York Life Investments’ Office of the General Counsel; and (v) risk management monitoring and analysis by compliance and investment personnel. In addition, the Board considered New York Life Investments’ willingness to invest in personnel and other resources, such as cyber security, information security and business continuity planning, that may benefit the Portfolio and noted that New York Life Investments is responsible for compensating the Trust’s officers, except for a portion of the salary of the Trust’s Chief Compliance Officer. The Board recognized that New York Life Investments provides certain other non-advisory services to the Portfolio and has over time provided an increasingly broad array of non-advisory services to the MainStay Group of Funds as a result of regulatory and other developments.
The Board also examined the range, and the nature, extent and quality, of the investment advisory services that NYL Investors provides to the Portfolio and considered the terms of each of the Advisory Agreements. The Board evaluated NYL Investors’ experience and performance in serving as subadvisor to the Portfolio and advising other portfolios and NYL Investors’ track record and experience in providing investment advisory services as well as the experience of investment advisory, senior management and administrative personnel at NYL Investors. The Board considered New York Life Investments’ and NYL Investors’ overall resources, legal and compliance environment, capabilities, reputation, financial condition and history. In addition to information provided in connection with quarterly meetings with the Trust’s Chief Compliance Officer, the Board considered information regarding the compliance policies and procedures of New York Life Investments and NYL Investors and acknowledged their commitment to further developing and strengthening compliance programs that may relate to the Portfolio. The Board also considered NYL Investors’ ability to recruit and retain qualified investment professionals and willingness to invest in personnel and other resources that may benefit the Portfolio. In this regard, the Board considered the qualifications and experience of the Portfolio’s portfolio managers, the number of accounts managed by the portfolio managers and the method for compensating the portfolio managers.
In addition, the Board considered information provided by New York Life Investments and NYL Investors regarding their respective business continuity and disaster recovery plans.
Based on these considerations, among others, the Board concluded that the Portfolio would likely continue to benefit from the nature, extent and quality of these services.
| 34 | MainStay VP Bond Portfolio |
Investment Performance
In evaluating the Portfolio’s investment performance, the Board considered investment performance results over various periods in light of the Portfolio’s investment objective, strategies and risks. The Board considered investment reports on, and analysis of, the Portfolio’s performance provided to the Board throughout the year. These reports include, among other items, information on the Portfolio’s gross and net returns, the Portfolio’s investment performance compared to a relevant investment category and the Portfolio’s benchmark, the Portfolio’s risk-adjusted investment performance and the Portfolio’s investment performance as compared to peer funds, as appropriate, as well as portfolio attribution information and commentary on the effect of market conditions. The Board also considered information provided by ISS showing the investment performance of the Portfolio as compared to peer funds. In addition, the Board reviewed the methodology used by ISS to construct the group of peer funds for comparative purposes.
The Board also took into account its discussions with senior management at New York Life Investments concerning the Portfolio’s investment performance over various periods as well as discussions between representatives of NYL Investors and the members of the Board’s Investment Committee, which generally occur on an annual basis.
Based on these considerations, among others, the Board concluded that its review of the Portfolio’s investment performance and related information supported a determination to approve the continuation of each of the Advisory Agreements.
Costs of the Services Provided, and Profits and Other Benefits Realized, by New York Life Investments and NYL Investors
The Board considered the costs of the services provided under each of the Advisory Agreements. The Board also considered the profitability of New York Life Investments and its affiliates, including NYL Investors, due to their relationships with the Portfolio as well as by New York Life Investments and its affiliates due to their relationships with the MainStay Group of Funds. Because NYL Investors is an affiliate of New York Life Investments whose subadvisory fee is paid by New York Life Investments, not the Portfolio, the Board considered cost and profitability information for New York Life Investments and NYL Investors in the aggregate.
In addition, the Board acknowledged the difficulty in obtaining reliable comparative data about mutual fund managers’ profitability because such information generally is not publicly available and may be impacted by numerous factors, including the structure of a fund manager’s organization, the types of funds it manages, the methodology used to allocate certain fixed costs to specific funds and the manager’s capital structure and costs of capital.
In evaluating the costs of the services provided by New York Life Investments and NYL Investors, and profitability of New York Life Investments and its affiliates, including NYL Investors due to their relationships with the Portfolio, the Board considered, among other
factors, New York Life Investments’ and its affiliates’, including NYL Investors’, continuing investments in, or willingness to invest in, personnel and other resources that may support and further enhance the management of the Portfolio, and that New York Life Investments is responsible for paying the subadvisory fee for the Portfolio. The Board also considered the financial resources of New York Life Investments and NYL Investors and acknowledged that New York Life Investments and NYL Investors must be in a position to recruit and retain experienced professional personnel and to maintain a strong financial position for New York Life Investments and NYL Investors to continue to provide high-quality services to the Portfolio. The Board recognized that the Portfolio benefits from the allocation of certain fixed costs among the funds in the MainStay Group of Funds, among other expected benefits resulting from its relationship with New York Life Investments.
The Board considered information regarding New York Life Investments’ methodology for calculating profitability and allocating costs provided by New York Life Investments in connection with the fund profitability analysis presented to the Board. The Board concluded that New York Life Investments’ methods for allocating costs and procedures for estimating overall profitability of the relationship with the funds in the MainStay Group of Funds were reasonable. The Board recognized the difficulty in calculating and evaluating a manager’s profitability with respect to the Portfolio and considered that other profitability methodologies may also be reasonable.
The Board also considered certain fall-out benefits that may be realized by New York Life Investments and its affiliates, including NYL Investors, due to their relationships with the Portfolio, including reputational and other indirect benefits. In addition, the Board considered its review of the management agreement for a money market fund advised by New York Life Investments and an affiliated subadvisor that serves as an investment option for the Portfolio, including the potential rationale for and costs associated with investments in this money market fund by the Portfolio, if any, and considered information from New York Life Investments that the nature and type of specific investment advisory services provided to this money market fund are distinct from, or in addition to, the investment advisory services provided to the Portfolio. In addition, the Board considered the potential dividend received tax deduction for insurance company affiliates of New York Life Investments from the Portfolio’s securities lending activity.
The Board noted that the Portfolio serves as an investment option primarily under variable contracts issued by affiliates of New York Life Investments that would receive fees under those contracts. The Board observed that, in addition to fees earned by New York Life Investments under the Management Agreement for managing the Portfolio, New York Life Investments’ affiliates also earn revenues from serving the Portfolio in various other capacities, including as the Portfolio’s distributor, and insurance companies affiliated with New York Life Investments would be entitled to receive fees from the Portfolio under a distribution and service plan adopted pursuant to Rule 12b-1 under the 1940 Act. The Board considered information about these other revenues and their impact on the profitability of the relationship with the Portfolio to New York Life
Board Consideration and Approval of Management Agreement and Subadvisory Agreement (Unaudited) (continued)
Investments and its affiliates. The Board noted that, although it assessed the overall profitability of the relationship with the Portfolio to New York Life Investments and its affiliates as part of the contract review process, when considering the reasonableness of the fee paid to New York Life Investments under the Management Agreement, the Board considered the profitability of New York Life Investments’ relationship with the Portfolio on a pre-tax basis and without regard to distribution expenses incurred by New York Life Investments from its own resources.
After evaluating the information deemed relevant by the Trustees, the Board concluded that any profits realized by New York Life Investments and its affiliates, including NYL Investors, due to their relationships with the Portfolio were not excessive and other expected benefits that may accrue to New York Life Investments and its affiliates, including NYL Investors, are reasonable.
Management and Subadvisory Fees and Total Ordinary Operating Expenses
The Board evaluated the reasonableness of the fee paid under each of the Advisory Agreements and the Portfolio’s total ordinary operating expenses. With respect to the management fee and subadvisory fee, the Board primarily considered the reasonableness of the management fee paid by the Portfolio to New York Life Investments because the subadvisory fee paid to NYL Investors is paid by New York Life Investments, not the Portfolio. The Board also considered the reasonableness of the subadvisory fee paid by New York Life Investments and the amount of the management fee retained by New York Life Investments.
In assessing the reasonableness of the Portfolio’s fees and expenses, the Board primarily considered comparative data provided by ISS on the fees and expenses of similar mutual funds managed by other investment advisers. The Board reviewed the methodology used by ISS to construct the group of peer funds for comparative purposes. In addition, the Board considered information provided by New York Life Investments and NYL Investors on fees charged to other investment advisory clients, including institutional separate accounts and/or other funds, that follow investment strategies similar to those of the Portfolio, if any. The Board considered the contractual management fee schedule for the Portfolio as compared to those for such other investment advisory clients, taking into account the rationale for differences in fee schedules. The Board also took into account information provided by New York Life Investments about the more extensive scope of services provided to registered investment companies, such as the Portfolio, as compared with other investment advisory clients. Additionally, the Board considered the impact of contractual breakpoints and voluntary waivers on the Portfolio’s net management fee and expenses. The Board also considered that in proposing fees for the Portfolio, New York Life Investments considers the competitive marketplace for mutual funds.
Based on the factors outlined above, among other considerations, the Board concluded that the Portfolio’s management fee and total ordinary operating expenses are within a range that is competitive and support a conclusion that these fees and expenses are reasonable.
Economies of Scale
The Board considered information regarding economies of scale, including whether economies of scale may exist with respect to the Portfolio and whether the Portfolio’s management fee and expense structure permits any economies of scale to be appropriately shared with the Portfolio’s shareholders. The Board also considered a report from New York Life Investments, previously prepared at the request of the Board, that addressed economies of scale, including with respect to the mutual fund business generally, and the various ways in which the benefits of economies of scale may be shared with the funds in the MainStay Group of Funds. Although the Board recognized the difficulty of determining economies of scale with precision, the Board acknowledged that economies of scale may be shared with the Portfolio in a number of ways, including, for example, through the imposition of fee breakpoints, initially setting management fee rates at scale or making additional investments to enhance the services provided to the Portfolio. The Board reviewed information from New York Life Investments showing how the Portfolio’s management fee schedule compared to fee schedules of other funds and accounts managed by New York Life Investments. The Board also reviewed information from ISS showing how the Portfolio’s management fee schedule compared with fees paid for similar services by peer funds at varying asset levels.
Based on this information, the Board concluded that economies of scale are appropriately shared for the benefit of the Portfolio’s shareholders through the Portfolio’s management fee and expense structure and other methods to share benefits from economies of scale.
Conclusion
On the basis of the information and factors summarized above, among other information and factors deemed relevant by the Trustees, and the evaluation thereof, the Board, including the Independent Trustees voting separately, unanimously voted to approve the continuation of each of the Advisory Agreements.
| 36 | MainStay VP Bond Portfolio |
Proxy Voting Policies and Procedures and Proxy Voting Record
The Portfolio is required to file with the SEC its proxy voting record for the 12-month period ending June 30 on Form N-PX. A description of the policies and procedures that are used to vote proxies relating to portfolio securities of the Portfolio is available free of charge upon request by calling 800-598-2019 or visiting the SEC's website at www.sec.gov. The most recent Form N-PX or proxy voting record is available free of charge upon request by calling 800-598-2019; visiting https://www.newyorklifeinvestments.com/investment-products/vp; or visiting the SEC’s website at www.sec.gov.
Shareholder Reports and Quarterly Portfolio Disclosure
The Portfolio is required to file its complete schedule of portfolio holdings with the SEC 60 days after its first and third fiscal quarter on Form N-PORT. The Portfolio's holdings report is available free of charge upon request by calling 800-598-2019 or by visiting the SEC’s website at www.sec.gov .
Board of Trustees and Officers (Unaudited)
The Trustees and officers of the Portfolio are listed below. The Board oversees the MainStay Group of Funds (which consists of MainStay Funds and MainStay Funds Trust), MainStay VP Funds Trust, MainStay MacKay DefinedTerm Municipal Opportunities Fund, MainStay CBRE Global Infrastructure Megatrends Term Fund, the Manager and the Subadvisors, and elects the officers of the Portfolios who are responsible for the day-to-day operations of the Portfolio. Information pertaining to the Trustees and officers is set forth below. Each Trustee serves until his or her successor is elected and qualified or until his or her resignation,
death or removal. Under the Board’s retirement policy, unless an exception is made, a Trustee must tender his or her resignation by the end of the calendar year during which he or she reaches the age of 75. Officers are elected annually by the Board. The business address of each Trustee and officer listed below is 51 Madison Avenue, New York, New York 10010. A majority of the Trustees are not “interested persons” (as defined by the 1940 Act and rules adopted by the SEC thereunder) of the Portfolio (“Independent Trustees”).
| | Name and
Year of Birth | Term of Office,
Position(s) Held and
Length of Service | Principal Occupation(s)
During Past Five Years | Number of
Portfolios in
Fund Complex
Overseen by
Trustee | Other Directorships
Held by Trustee |
| | | | | | |
| | Naïm Abou-Jaoudé*
1966 | MainStay VP Funds Trust: Trustee since 2023 | Chief Executive Officer of New York Life Investment Management LLC (since 2023). Chief Executive Officer of Candriam (an affiliate of New York Life Investment Management LLC) (2007 to 2023). | 81 | MainStay Funds: Trustee since 2023 (11 Funds)
MainStay Funds Trust: Trustee since 2023 (37 Funds);
MainStay MacKay DefinedTerm Municipal Opportunities Fund: Trustee since 2023;
MainStay CBRE Global Infrastructure Megatrends Term Fund: Trustee since 2023; and
New York Life Investment Management International (Chair) since 2015 |
| * | This Trustee is considered to be an “interested person” of the MainStay Group of Funds, MainStay VP Funds Trust, MainStay CBRE Global Infrastructure Megatrends Term Fund and MainStay MacKay DefinedTerm Municipal Opportunities Fund, within the meaning of the 1940 Act because of his affiliation with New York Life Investment Management LLC and Candriam, as described in detail above in the column entitled “Principal Occupation(s) During Past Five Years.” |
| | |
| 38 | MainStay VP Bond Portfolio |
| | Name and
Year of Birth | Term of Office,
Position(s) Held and
Length of Service | Principal Occupation(s)
During Past Five Years | Number of
Portfolios in
Fund Complex
Overseen by
Trustee | Other Directorships
Held by Trustee |
| | | | | | |
| | David H. Chow
1957 | MainStay VP Funds Trust: Trustee since January 2016, Advisory Board Member (June 2015 to December 2015) | Founder and CEO, DanCourt Management, LLC since 1999 | 81 | MainStay Funds: Trustee since January 2016, Advisory Board Member (June 2015 to December 2015) (11 Funds);
MainStay Funds Trust: Trustee since January 2016, Advisory Board Member (June 2015 to December 2015) (37 Funds);
MainStay MacKay DefinedTerm Municipal Opportunities Fund: Trustee since January 2016, Advisory Board Member (June 2015 to December 2015);
MainStay CBRE Global Infrastructure Megatrends Term Fund: Trustee since 2021;
VanEck Vectors Group of Exchange-Traded Funds: Trustee since 2006 and Independent Chairman of the Board of Trustees from 2008 to 2022 (57 portfolios); and
Berea College of Kentucky: Trustee since 2009, Chair of the Investment Committee since 2018 |
| | Karen Hammond
1956 | MainStay VP Funds Trust: Trustee since December 2021, Advisory Board Member (June 2021 to December 2021)
| Retired, Managing Director, Devonshire Investors (2007 to 2013); Senior Vice President, Fidelity Management & Research Co. (2005 to 2007); Senior Vice President and Corporate Treasurer, FMR Corp. (2003 to 2005); Chief Operating Officer, Fidelity Investments Japan (2001 to 2003) | 81 | MainStay Funds: Trustee since December 2021, Advisory Board Member (June 2021 to December 2021) (11 Funds);
MainStay Funds Trust: Trustee since December 2021, Advisory Board Member (June 2021 to December 2021) (37 Funds);
MainStay MacKay DefinedTerm Municipal Opportunities Fund: Trustee since December 2021, Advisory Board Member (June 2021 to December 2021);
MainStay CBRE Global Infrastructure Megatrends Term Fund: Trustee since December 2021, Advisory Board Member (June 2021 to December 2021);
Two Harbors Investment Corp.: Director since 2018;
Rhode Island State Investment Commission: Member since 2017; and
Blue Cross Blue Shield of Rhode Island: Director since 2019 |
| | Susan B. Kerley
1951 | MainStay VP Funds Trust: Chair since 2017 and Trustee since 2007** | President, Strategic Management Advisors LLC since 1990 | 81 | MainStay Funds: Chair since January 2017 and Trustee since 2007 (11 Funds); MainStay Funds Trust: Chair since January 2017 and Trustee since 1990 (37 Funds)***;
MainStay MacKay DefinedTerm Municipal Opportunities Fund: Chair since January 2017 and Trustee since 2011;
MainStay CBRE Global Infrastructure Megatrends Term Fund: Trustee since June 2021; and
Legg Mason Partners Funds: Trustee since 1991 (45 portfolios) |
Board of Trustees and Officers (Unaudited) (continued)
| | Name and
Year of Birth | Term of Office,
Position(s) Held and
Length of Service | Principal Occupation(s)
During Past Five Years | Number of
Portfolios in
Fund Complex
Overseen by
Trustee | Other Directorships
Held by Trustee |
| | | | | | |
| | Alan R. Latshaw
1951 | MainStay VP Funds Trust: Trustee since 2007** | Retired; Partner, Ernst & Young LLP (2002 to 2003); Partner, Arthur Andersen LLP (1989 to 2002); Consultant to the MainStay Funds Audit and Compliance Committee (2004 to 2006) | 81 | MainStay Funds: Trustee since 2006 (11 Funds);
MainStay Funds Trust: Trustee since 2007 (37 Funds)***;
MainStay MacKay DefinedTerm Municipal Opportunities Fund: Trustee since 2011; and
MainStay CBRE Global Infrastructure Megatrends Term Fund: Trustee since June 2021 |
| | Jacques P. Perold
1958 | MainStay VP Funds Trust: Trustee since January 2016, Advisory Board Member (June 2015 to December 2015) | Founder and Chief Executive Officer, CapShift Advisors LLC (since 2018); President, Fidelity Management & Research Company (2009 to 2014); President and Chief Investment Officer, Geode Capital Management, LLC (2001 to 2009) | 81 | MainStay Funds: Trustee since January 2016, Advisory Board Member (June 2015 to December 2015) (11 Funds);
MainStay Funds Trust: Trustee since January 2016, Advisory Board Member (June 2015 to December 2015) (37 Funds);
MainStay MacKay DefinedTerm Municipal Opportunities Fund: Trustee since January 2016, Advisory Board Member (June 2015 to December 2015);
MainStay CBRE Global Infrastructure Megatrends Term Fund: Trustee since June 2021;
Allstate Corporation: Director since 2015;
Partners in Health: Trustee since 2019; and
MSCI Inc.: Director since 2017 |
| | Richard S. Trutanic
1952 | MainStay VP Funds Trust: Trustee since 2007** | Chairman and Chief Executive Officer, Somerset & Company (financial advisory firm) since 2004; Managing Director, The Carlyle Group (private investment firm) (2002 to 2004); Senior Managing Director, Partner and Board Member, Groupe Arnault S.A. (private investment firm) (1999 to 2002) | 81 | MainStay Funds: Trustee since 1994 (11 Funds);
MainStay Funds Trust: Trustee since 2007 (37 Funds)***;
MainStay MacKay DefinedTerm Municipal Opportunities Fund: Trustee since 2011; and
MainStay CBRE Global Infrastructure Megatrends Term Fund: Trustee since June 2021 |
| ** | Includes prior service as a Director of MainStay VP Series Fund, Inc., the predecessor to MainStay VP Funds Trust. |
| *** | Includes prior service as a Director/Trustee of certain predecessor entities to MainStay Funds Trust. |
| 40 | MainStay VP Bond Portfolio |
| | Name and
Year of Birth | Position(s) Held and
Length of Service | Principal Occupation(s)
During Past Five Years | |
| | | | | |
| | Kirk C. Lehneis
1974 | President, MainStay VP Funds Trust (since 2017) | Chief Operating Officer and Senior Managing Director (since 2016), New York Life Investment Management LLC and New York Life Investment Management Holdings LLC; Member of the Board of Managers (since 2017) and Senior Managing Director (since 2018), NYLIFE Distributors LLC; Chairman of the Board and Senior Managing Director, NYLIM Service Company LLC (since 2017); Trustee, President and Principal Executive Officer of IndexIQ Trust, IndexIQ ETF Trust and IndexIQ Active ETF Trust (since 2018); President, MainStay CBRE Global Infrastructure Megatrends Term Fund (since 2021), MainStay MacKay DefinedTerm Municipal Opportunities Fund, MainStay Funds and MainStay Funds Trust (since 2017); Senior Managing Director, Global Product Development (from 2015 to 2016); Managing Director, Product Development (from 2010 to 2015), New York Life Investment Management LLC | |
| | Jack R. Benintende
1964 | Treasurer and Principal Financial and Accounting Officer, MainStay VP Funds Trust (since 2007)** | Managing Director, New York Life Investment Management LLC (since 2007); Treasurer and Principal Financial and Accounting Officer, MainStay CBRE Global Infrastructure Megatrends Term Fund (since 2021), MainStay MacKay DefinedTerm Municipal Opportunities Fund (since 2011), MainStay Funds Trust (since 2009) and MainStay Funds (since 2007); and Assistant Treasurer, New York Life Investment Management Holdings LLC (2008 to 2012) | |
| | J. Kevin Gao
1967 | Secretary and Chief Legal Officer, MainStay VP Funds Trust (since 2010)** | Managing Director and Associate General Counsel, New York Life Investment Management LLC (since 2010); Secretary and Chief Legal Officer, MainStay CBRE Global Infrastructure Megatrends Term Fund (since 2021), MainStay MacKay DefinedTerm Municipal Opportunities Fund (since 2011), MainStay Funds and MainStay Funds Trust (since 2010) | |
| | Kevin M. Gleason
1967 | Vice President and Chief Compliance Officer, MainStay VP Funds Trust (since June 2022) | Vice President and Chief Compliance Officer, IndexIQ Trust, IndexIQ ETF Trust and IndexIQ Active ETF Trust (since June 2022); Vice President and Chief Compliance Officer, MainStay CBRE Global Infrastructure Megatrends Term Fund, MainStay MacKay DefinedTerm Municipal Opportunities Fund (since June 2022); MainStay Funds Trust and MainStay Funds (since June 2022); Senior Vice President, Voya Investment Management and Chief Compliance Officer, Voya Family of Funds (2012 to 2022) | |
| | Scott T. Harrington
1959 | Vice President— Administration, MainStay VP Funds Trust (since 2005)** | Managing Director, New York Life Investment Management LLC (including predecessor advisory organizations) (since 2000); Member of the Board of Directors, New York Life Trust Company (since 2009); Vice President—Administration, MainStay CBRE Global Infrastructure Megatrends Term Fund (since 2021), MainStay MacKay DefinedTerm Municipal Opportunities Fund (since 2011), MainStay Funds Trust and MainStay Funds (since 2009) | |
| * | The officers listed above are considered to be “interested persons” of the MainStay Group of Funds, MainStay VP Funds Trust, MainStay CBRE Global Infrastructure Megatrends Term Fund and MainStay MacKay DefinedTerm Municipal Opportunities Fund within the meaning of the 1940 Act because of their affiliation with the MainStay Group of Funds, New York Life Insurance Company and/or its affiliates, including New York Life Investment Management LLC, New York Life Insurance Company, NYLIM Service Company LLC, NYLIFE Securities LLC and/or NYLIFE Distributors LLC, as described in detail in the column captioned “Principal Occupation(s) During Past Five Years.” Officers are elected annually by the Board. |
| ** | Includes prior service as an Officer of MainStay VP Series Fund, Inc., the predecessor to MainStay VP Funds Trust. |
Officers of the Trust (Who are not Trustees)*
This page intentionally left blank
MainStay VP Portfolios
MainStay VP offers a wide range of Portfolios. The full array of MainStay VP offerings is listed here, with information about the manager, subadvisors, legal counsel, and independent registered public accounting firm.
Equity
MainStay VP American Century Sustainable Equity Portfolio
MainStay VP Candriam Emerging Markets Equity Portfolio
MainStay VP Epoch U.S. Equity Yield Portfolio
MainStay VP Fidelity Institutional AM® Utilities Portfolio†
MainStay VP Natural Resources Portfolio
MainStay VP PineStone International Equity Portfolio1
MainStay VP S&P 500 Index Portfolio
MainStay VP Small Cap Growth Portfolio
MainStay VP Wellington Growth Portfolio
MainStay VP Wellington Mid Cap Portfolio
MainStay VP Wellington Small Cap Portfolio
MainStay VP Wellington U.S. Equity Portfolio
MainStay VP Winslow Large Cap Growth Portfolio
Mixed Asset
MainStay VP Balanced Portfolio
MainStay VP Income Builder Portfolio
MainStay VP Janus Henderson Balanced Portfolio
MainStay VP MacKay Convertible Portfolio
Income
MainStay VP Bond Portfolio
MainStay VP Floating Rate Portfolio
MainStay VP Indexed Bond Portfolio
MainStay VP MacKay Government Portfolio2
MainStay VP MacKay High Yield Corporate Bond Portfolio
MainStay VP MacKay Strategic Bond Portfolio
MainStay VP PIMCO Real Return Portfolio
Money Market
MainStay VP U.S. Government Money Market Portfolio
Alternative
MainStay VP CBRE Global Infrastructure Portfolio
MainStay VP IQ Hedge Multi-Strategy Portfolio
Asset Allocation
MainStay VP Conservative Allocation Portfolio
MainStay VP Equity Allocation Portfolio
MainStay VP Growth Allocation Portfolio
MainStay VP Moderate Allocation Portfolio
Manager
New York Life Investment Management LLC
New York, New York
Subadvisors
American Century Investment Management, Inc.
Kansas City, Missouri
Brown Advisory LLC
Baltimore, Maryland
Candriam*
Strassen, Luxembourg
CBRE Investment Management Listed Real Assets LLC
Radnor, Pennsylvania
Epoch Investment Partners, Inc.
New York, New York
FIAM LLC
Smithfield, Rhode Island
IndexIQ Advisors LLC*
New York, New York
Janus Henderson Investors US LLC
Denver, Colorado
MacKay Shields LLC*
New York, New York
Newton Investment Management North America, LLC
Boston, Massachusetts
NYL Investors LLC*
New York, New York
Pacific Investment Management Company LLC
Newport Beach, California
PineStone Asset Management Inc.
Montreal, Québec
Segall Bryant & Hamill, LLC
Chicago, Illinois
Wellington Management Company LLP
Boston, Massachusetts
Winslow Capital Management, LLC
Minneapolis, Minnesota
Legal Counsel
Dechert LLP
Washington, District of Columbia
Independent Registered Public Accounting Firm
PricewaterhouseCoopers LLP
New York, New York
Distributor
NYLIFE Distributors LLC*
Jersey City, New Jersey
Custodian
JPMorgan Chase Bank, N.A.
New York, New York
Some Portfolios may not be available in all products.
† Fidelity Institutional AM is a registered trade mark of FMR LLC. Used with permission.
* An affiliate of New York Life Investment Management LLC.
| 1. | Prior to August 28, 2023, the Portfolio's name was MainStay VP MacKay International Equity Portfolio. |
| 2. | Effective on or about May 1, 2024, the MainStay VP MacKay Government Portfolio will be renamed the MainStay VP U.S. Infrastructure Bond Portfolio. |
Not part of the Annual Report
2023 Annual Report
This report is for the general information of New York Life Variable Annuities and NYLIAC Variable Universal Life Insurance Products policyowners. It must be preceded or accompanied by the appropriate product(s) and funds prospectuses if it is given to anyone who is not an owner of a New York Life variable annuity policy or a NYLIAC Variable Universal Life Insurance Product. This report does not offer for sale or solicit orders to purchase securities.
The performance data quoted in this report represents past performance. Past performance is no guarantee of future results. Due to market volatility and other factors, current performance may be lower or higher than the figures shown. The most recent month-end performance summary for your variable annuity or variable life policy is available by calling 800-598-2019 and is updated periodically on newyorklife.com.
The New York Life Variable Annuities and NYLIAC Variable Universal Life Insurance Products are issued by New York Life Insurance and Annuity Corporation (a Delaware Corporation) and distributed by NYLIFE Distributors LLC (Member FINRA/SIPC).
New York Life Insurance Company
New York Life Insurance and Annuity
Corporation (NYLIAC) (A Delaware Corporation)
51 Madison Avenue, Room 551
New York, NY 10010
newyorklife.com
newyorklifeinvestments.com
NYLIFE Distributors LLC, 30 Hudson Street, Jersey City, NJ 07302
New York Life Investment Management LLC is the investment manager to the MainStay VP Funds Trust
©2024 by NYLIFE Distributors LLC. All rights reserved.
You may obtain copies of the Prospectus and the Statement of Additional Information free of charge, upon request, by calling toll-free 800-598-2019 or writing to New York Life Insurance and Annuity Corporation, 51 Madison Avenue, New York, NY 10010.
| Not FDIC Insured | No Bank Guarantee | May Lose Value |
(NYLIAC) NI509
MainStay VP MacKay Government Portfolio
Message from the President and Annual Report
December 31, 2023
Special Notice:
Beginning in July 2024, new regulations issued by the Securities and Exchange Commission (SEC) will take effect requiring open-end mutual fund companies and ETFs to (1) overhaul the content of their shareholder reports and (2) mail paper copies of the new tailored shareholder reports to shareholders who have not opted to receive these documents electronically.
If you have not yet elected to receive your shareholder reports electronically, please contact your financial intermediary or visit our website.
| Not FDIC/NCUA Insured | Not a Deposit | May Lose Value | No Bank Guarantee | Not Insured by Any Government Agency |
This page intentionally left blank
Message from the President
Against a backdrop of easing inflationary pressures and continued economic growth, stocks and bonds generally gained ground during the 12-month period ended December 31, 2023, despite high levels of volatility and sharp disparities between the performance of the different market sectors.
Although the war in Ukraine, the outbreak of hostilities in the Middle East and several other notable events affected financial assets, inflation, interest rate, and economic growth trends stood at the forefront of market developments during most of the period. As the reporting period began, high levels of inflation already showed signs of easing in the face of aggressive rate hikes by U.S. Federal Reserve (the “Fed”). From a peak of 9.1% in June 2022, the annualized U.S. inflation rate dropped to 6.4% in January, and 3.4% in December 2023. At the same time, the Fed increased the benchmark federal funds rate from 4.25%–4.50% at the beginning of reporting period, to 5.25%–5.50% as of the end of 2023. Despite the increasing cost of capital and tighter lending environment that resulted from rising rates, economic growth remained surprisingly robust, bolstered by high levels of consumer spending, low levels of unemployment and better-than-expected corporate earnings. With the pace of rate increases slowing from the prior year, investors began hoping for an early shift to a looser monetary policy, with stock prices and bond yields reacting as economic data and statements from the Fed either reinforced or undercut those hopes. Following months of hawkish rhetoric, the Fed finally reversed its stance in December 2023, signaling a positive economic outlook with little chance of a recession and a likelihood of rate cuts in 2024.
The S&P 500® Index, a widely regarded benchmark of U.S. market performance, produced strong gains during the reporting period-– recovering all its losses from 2022 and approached new record territory. A preponderance of the Index’s gains were generated by a relatively small number of mega-cap stocks in the information technology, communication services and consumer discretionary sectors that stood to benefit from rapid developments in generative artificial intelligence (“AI”). Value-oriented, interest-rate sensitive and small-capitalization
shares lagged by significant margins, although market strength widened during the closing weeks of the reporting period. Most overseas equity markets trailed the U.S. market, as developed international economies experienced relatively low growth rates, and weak economic conditions in China undermined emerging markets.
Bonds produced generally positive returns, bolstered by attractive and relatively stable yields. The yield on the 10-year Treasury note hit a high of just under 5% in mid-October 2023, ranging between approximately 3.5% and 4.8% for most of the reporting period. The yield curve remained inverted throughout the year, with the 2-year Treasury yield modestly above the 10-year yield. Corporate bond prices trended moderately higher, generally outperforming government securities. After years of low yields and tight credit spreads, the corporate sector benefited from more attractive valuations and income opportunities. Among corporates, markets generally rewarded longer duration and lower credit quality, although an uptick in default rates posed added risks for high-yield corporate bonds. International bond markets produced mixed returns, with emerging-markets issues advancing over their developed-markets counterparts.
The market volatility of recent years reminds us of the constant need for experienced and steadfast portfolio management in the face of uncertainty. New York Life Investments remains dedicated to providing you, as a valued MainStay VP investor, with the guidance, resources and investment solutions you need to pursue your financial goals.
Thank you for trusting us to help meet your investment needs.
Sincerely,
Kirk C. Lehneis
President
The opinions expressed are as of the date of this report and are subject to change. There is no guarantee that any forecast made will come to pass. This material does not constitute investment advice and is not intended as an endorsement of any specific investment. Past performance is no guarantee of future results.
Not part of the Annual Report
Investors should refer to the Portfolio’s Summary Prospectus and/or Prospectus and consider the Portfolio’s investment objectives, strategies, risks, charges and expenses carefully before investing. The Summary Prospectus and/or Prospectus contain this and other information about the Portfolio. You may obtain copies of the Portfolio’s Summary Prospectus, Prospectus and Statement of Additional Information, which includes information about the MainStay VP Funds Trust's Trustees, free of charge, upon request, by calling toll-free 800-598-2019, by writing to New York Life Insurance and Annuity Corporation, 51 Madison Avenue, Room 251, New York, New York 10010 or by sending an email to MainStayShareholdersServices@nylim.com. These documents are also available at newyorklifeinvestments.com/investment-products/vp. Please read the Portfolio's Summary Prospectus and/or Prospectus carefully before investing. MainStay VP Funds Trust portfolios are separate account options which are purchased through a variable insurance or variable annuity contract.
Investment and Performance Comparison (Unaudited)
Performance data quoted represents past performance. Past performance is no guarantee of future results. Because of market volatility and other factors, current performance may be lower or higher than the figures shown. Investment return and principal value will fluctuate, and as a result, when shares are redeemed, they may be worth more or less than their original cost. The performance table and graph do not reflect any deduction of sales charges, mortality and expense charges, contract charges or administrative charges. Please refer to the Performance Summary appropriate for your policy. For performance information current to the most recent month-end, please call 800-598-2019 or visit www.newyorklife.com.
Performance figures may reflect certain fee waivers and/or expense limitations, without which total returns may have been different. For information on current fee waivers and/or expense limitations (if any), please refer to the Notes to Financial Statements.
| Average Annual Total Returns for the Year-Ended December 31, 2023 |
| Class | Inception
Date | One
Year | Five
Years | Ten
Years | Gross
Expense
Ratio1 |
| Initial Class Shares | 1/29/1993 | 5.00% | 0.30% | 0.97% | 0.56% |
| Service Class Shares | 6/4/2003 | 4.74 | 0.05 | 0.72 | 0.81 |
| 1. | The gross expense ratios presented reflect the Portfolio’s “Total Annual Portfolio Operating Expenses” from the most recent Prospectus and may differ from other expense ratios disclosed in this report. |
| Benchmark Performance* | One
Year | Five
Years | Ten
Years |
| Bloomberg U.S. Government Bond Index1 | 4.09% | 0.56% | 1.27% |
| Morningstar Intermediate Government Category Average2 | 4.42 | 0.27 | 0.96 |
| * | Returns for indices reflect no deductions for fees, expenses or taxes, except for foreign withholding taxes where applicable. Results assume reinvestment of all dividends and capital gains. An investment cannot be made directly in an index. |
| 1. | The Bloomberg U.S. Government Bond Index is the Portfolio’s primary benchmark. The Bloomberg U.S. Government Bond Index is a broad-based benchmark that consists of publicly issued debt of the U.S. Treasury and government agencies. Results assume the reinvestment of all income and capital gains. An investment cannot be made directly in an index. |
| 2. | The Morningstar Intermediate Government Category Average is representative of funds that have at least 90% of their bond holdings in bonds backed by U.S. government or by U.S. government-linked agencies. These funds have durations between 3.5 and 6 years and/or average effective maturities between 4 and 10 years. Results are based on average total returns of similar funds with all dividends and capital gain distributions reinvested. |
Cost in Dollars of a $1,000 Investment in MainStay VP MacKay Government Portfolio (Unaudited)
The example below is intended to describe the fees and expenses borne by shareholders during the six-month period from July 1, 2023 to December 31, 2023, and the impact of those costs on your investment.
Example
As a shareholder of the Portfolio you incur two types of costs: (1) transaction costs, including exchange fees and sales charges (loads) on purchases (as applicable), and (2) ongoing costs, including management fees, distribution and/or service (12b-1) fees and other Portfolio expenses (as applicable). This example is intended to help you understand your ongoing costs (in dollars) of investing in the Portfolio and to compare these costs with the ongoing costs of investing in other mutual funds. The example is based on an investment of $1,000 made at the beginning of the six-month period and held for the entire period from July 1, 2023 to December 31, 2023. Shares are only sold in connection with variable life and annuity contracts and the example does not reflect any contract level or transactional fees or expenses. If these costs had been included, your costs would have been higher.
This example illustrates your Portfolio’s ongoing costs in two ways:
Actual Expenses
The second and third data columns in the table below provide information about actual account values and actual expenses. You may use the information in these columns, together with the amount you invested, to estimate the expenses that you paid during the six months ended
December 31, 2023. Simply divide your account value by $1,000 (for example, an $8,600 account value divided by $1,000 = 8.6), then multiply the result by the number under the heading entitled “Expenses Paid During Period” to estimate the expenses you paid on your account during this period.
Hypothetical Example for Comparison Purposes
The fourth and fifth data columns in the table below provide information about hypothetical account values and hypothetical expenses based on the Portfolio’s actual expense ratio and an assumed rate of return of 5% per year before expenses, which is not the Portfolio’s actual return. The hypothetical account values and expenses may not be used to estimate the actual ending account balances or expenses you paid for the six-month period shown. You may use this information to compare the ongoing costs of investing in the Portfolio with the ongoing costs of investing in other mutual funds. To do so, compare this 5% hypothetical example with the 5% hypothetical examples that appear in the shareholder reports of the other mutual funds.
Please note that the expenses shown in the table are meant to highlight your ongoing costs only and do not reflect any transactional costs, such as exchange fees or sales charges (loads). Therefore, the fourth and fifth data columns of the table are useful in comparing ongoing costs only and will not help you determine the relative total costs of owning different funds. In addition, if these transactional costs were included, your costs would have been higher.
| Share Class | Beginning
Account
Value
7/1/23 | Ending Account
Value (Based
on Actual
Returns and
Expenses)
12/31/23 | Expenses
Paid
During
Period1 | Ending Account
Value (Based
on Hypothetical
5% Annualized
Return and
Actual Expenses)
12/31/23 | Expenses
Paid
During
Period1 | Net Expense
Ratio
During
Period2 |
| Initial Class Shares | $1,000.00 | $1,030.70 | $2.87 | $1,022.38 | $2.85 | 0.56% |
| Service Class Shares | $1,000.00 | $1,029.40 | $4.14 | $1,021.12 | $4.13 | 0.81% |
| 1. | Expenses are equal to the Portfolio’s annualized expense ratio of each class multiplied by the average account value over the period, divided by 365 and multiplied by 184 (to reflect the six-month period). The table above represents the actual expenses incurred during the six-month period. In addition to the fees and expenses which the Portfolio bears directly, it also indirectly bears a pro rata share of the fees and expenses of the underlying funds in which it invests. Such indirect expenses are not included in the above-reported expense figures. |
| 2. | Expenses are equal to the Portfolio's annualized expense ratio to reflect the six-month period. |
| 6 | MainStay VP MacKay Government Portfolio |
Portfolio Composition as of December 31, 2023 (Unaudited)
See Portfolio of Investments beginning on page 10 for specific holdings within these categories. The Portfolio's holdings are subject to change.
Top Ten Holdings and/or Issuers Held as of December 31, 2023 (excluding short-term investments) (Unaudited)
| 1. | UMBS, 30 Year, 2.00%-6.50%, due 2/1/41–9/1/53 |
| 2. | U.S. Treasury Notes, 0.375%-3.00%, due 8/15/24–2/15/30 |
| 3. | UMBS Pool, 30 Year, 2.00%-6.50%, due 6/1/46–12/1/53 |
| 4. | FREMF Mortgage Trust, 3.455%-4.325%, due 6/25/47–2/25/52 |
| 5. | GNMA, (zero coupon)-6.952%, due 6/16/37–2/20/52 |
| 6. | FNMA, (zero coupon)-3.50%, due 7/25/42–3/25/60 |
| 7. | FNMA, Other, 2.50%-6.50%, due 4/1/25–6/1/57 |
| 8. | FHLMC Gold Pools, 30 Year, 2.50%-5.00%, due 11/1/41–3/1/49 |
| 9. | U.S. Treasury Inflation Linked Notes, 0.125%, due 1/15/30–7/15/30 |
| 10. | UMBS, 20 Year, 2.00%-3.00%, due 10/1/32–7/1/41 |
Portfolio Management Discussion and Analysis (Unaudited)
Answers to the questions reflect the views of portfolio managers Steven H. Rich, Neil Moriarty III, Tom Musmanno, CFA, Michael DePalma and Zach Aronson of MacKay Shields LLC, the Portfolio’s Subadvisor.
How did MainStay VP MacKay Government Portfolio perform relative to its benchmark and peers during the 12 months ended December 31, 2023?
For the 12 months ended December 31, 2023, MainStay VP MacKay Government Portfolio returned 5.00% for Initial Class shares and 4.74% for Service Class shares. Over the same period, both share classes outperformed the 4.09% return of the Bloomberg U.S. Government Bond Index (“the Index”), which is the Portfolio’s benchmark. Over the same period, both share classes also outperformed the 4.42% return of the Morningstar Intermediate Government Category Average.1
What factors affected the Portfolio’s relative performance during the reporting period?
Duration,2 yield-curve3 posture, sector weighting and issue selection were the four factors primarily affecting the Portfolio’s performance relative to the Index. The Portfolio outperformed the Index on all four factors, with yield advantage from overweight exposure to mortgage-backed securities offering the largest effect. The Portfolio’s relative performance also benefited from low turnover and low cash levels. By staying fully invested and minimizing cash, the Portfolio preserved yield.
Duration and yield-curve posture: Snapshots of the U.S. Treasury curve on December 31, 2022, and December 31, 2023, suggest that Treasury yields moved sideways during the reporting period, with higher year-end yields of Treasury bills an outlier. This perspective, however, belies the volatility that unmoored yields intra-year. For example, the yield on the 10-year Treasury troughed during the reporting period at 3.3%, then crested at 5.0%, before settling back to 3.9%, consistent with the prior year-end level. Rate volatility tracked the actions of the policy committee of the U.S. Federal Reserve (the “Fed”), which continued to hike the federal funds rate in 2023, although at smaller (25 basis point) increments than in 2022. (A basis point is one one-hundredth of a percentage point.) Additionally, pockets of event risk were evident during 2023 (i.e., March’s regional bank failures and the debt ceiling standoff in June), and these episodes also roiled Treasury bonds. The possibility of a Fed pause on moderating inflation—or perhaps a pivot to rate cuts—in 2024, buoyed investor spirits toward year-end, as evidenced by the aggressive Treasury rally in November and December.
During 2023, the Portfolio maintained a shorter duration than the Index and held an overweight position in intermediate maturities. The Portfolio’s duration and curve postures contributed mixed quarterly performance relative to the Index due to rate volatility. (Contributions take weightings and total returns into account.)
However, for the reporting period overall, the Portfolio’s short duration posture, along with overweight exposure in the curve’s center, proved accretive to relative performance.
Sector weighting: Residential mortgage-backed securities, some backed by single-family properties and others backed by multifamily properties, represented the Portfolio’s largest sector exposure. Our commitment to the mortgage sector imparted a yield advantage over lower-yielding Treasury securities and agency debentures. However, the reporting period’s interest-rate volatility modestly chipped away at the yield advantage of the single-family mortgage-backed securities. In contrast, securities backed by mortgages on multifamily properties were more volatility-resistant due to their prepayment protection.
What was the Portfolio’s duration strategy during the reporting period?
The Portfolio ended the reporting period with a duration of 5.2 years, 0.3 year shorter than at the beginning of the reporting period. The Portfolio’s duration typically lengthens as Treasury yields rise because of its exposure to single-family residential mortgage-backed securities. Mortgage rates move directionally with Treasury rates. Higher mortgage rates crimp refinancing opportunities and, in turn, slow prepayments. During the reporting period, we offset the mortgage extension by trimming the Portfolio’s Treasury futures position and by swapping some of the Portfolio’s assets from mortgage passthroughs into collateralized mortgage obligations (“CMOs”) with shorter durations and more stable cash-flow patterns.
The Index is composed primarily (97%) of U.S. Treasury securities, and the Index’s constituents are well distributed across the yield curve. With Treasury yields settling into year-end levels not too distant from those at the beginning of the year, the Index’s duration was stable, lengthening from 6.0 years to 6.1 years.
Duration measures price sensitivity to yield change. Accordingly, the Portfolio was advantaged by its relatively short duration during the reporting period because its performance was less affected than the Index by the volatility of Treasury yields.
During the reporting period, which market segments were the strongest positive contributors to the Portfolio’s absolute performance and which market segments were particularly weak?
The Portfolio’s commitment to agency multifamily mortgage-backed securities made a positive contribution to absolute performance during the reporting period. Agency multifamily mortgage-backed securities are backed by Federal
| 1. | See "Investment and Performance Comparison" for more information on benchmark and peer group returns. |
| 2. | Duration is a measure of the price sensitivity of a fixed-income investment to changes in interest rates. Duration is expressed as a number of years and is considered a more accurate sensitivity gauge than average maturity. |
| 3. | The yield curve is a line that plots the yields of various securities of similar quality—typically U.S. Treasury issues—across a range of maturities. The U.S. Treasury yield curve serves as a benchmark for other debt and is used in economic forecasting. |
| 8 | MainStay VP MacKay Government Portfolio |
National Mortgage Association (“FNMA”) or Federal Home Loan Mortgage Corporation (“FHMLC”) mortgages on larger, multifamily developments and apartment buildings. Multifamily mortgages are typically not freely prepayable like single-family mortgages. Consequently, they amortize more slowly. Investors crossed over to multifamily from single family, attracted to the more stable cash-flow profiles offered by securities backed by mortgages on multifamily properties. As a result, multifamily mortgage-backed securities outperformed comparable-duration single-family mortgage-backed passthroughs.
CMOs outperformed comparable-duration single-family mortgage passthroughs. CMO cash-flow profiles are more stable than those of mortgage passthroughs. In turn, CMOs withstood the reporting period’s interest-rate volatility better than mortgage passthroughs. Within the CMO sector, the Portfolio’s interest-only structures performed well. Interest-only structures benefit from slower mortgage prepayment speeds. Slower prepayment speeds were a hallmark of the reporting period against the backdrop of higher mortgage rates.
The Portfolio’s weaker performers were its longer-duration Treasury security holdings. As rising Treasury rates were applied to the securities’ long durations, the negative price impact offset a substantial portion of the securities’ return contributed from yield. Moderating inflation during the reporting period also weighed on the returns of the Portfolio’s Treasury Inflation Protected Securities (2.5% of assets), which underperformed comparable-duration nominal Treasury securities.
How did the Portfolio’s sector weightings change during the reporting period?
During the reporting period, we increased the Portfolio’s allocation to CMOs by reinvesting principal paydowns from mortgage-backed passthroughs. The trade expressed our preference for structured mortgage cash-flows. As a byproduct of these trades, the Portfolio’s exposure to Government National Mortgage Association (“GNMA”) mortgages rose and exposure to FNMA mortgages fell.
The Portfolio’s exposure to securitizations of small business administration (SBA) loans fell modestly during the reporting period as we redeployed the sector’s principal paydowns elsewhere.
All other sector exposures remained stable during the reporting period.
How was the Portfolio positioned at the end of the reporting period?
Relative to the Index, the Portfolio ended the reporting period with underweight exposure to U.S. Treasury securities; equivalently weighted exposure to agency debentures; and overweight exposure to agency residential mortgage-backed securities (both single-family and multifamily) and taxable municipals. The Portfolio also held modestly overweight exposure to asset-backed securities and non-agency mortgage-backed securities. The Portfolio ended the reporting period with 0.9% of net assets in cash or cash equivalents.
The Portfolio benefits from the longer-term advantages of yield. As of December 31, 2023, the Portfolio held a 62-basis-point annualized yield advantage over the Index, compared with a 64-basis-point yield advantage at the beginning of the reporting period. The stable yield advantage is a consequence of the Portfolio’s limited turnover during the reporting period.
The opinions expressed are those of the portfolio managers as of the date of this report and are subject to change. There is no guarantee that any forecasts will come to pass. This material does not constitute investment advice and is not intended as an endorsement of any specific investment.
Portfolio of Investments December 31, 2023†^
| | Principal
Amount | Value |
| Long-Term Bonds 98.7% |
| Asset-Backed Securities 2.1% |
| Other Asset-Backed Securities 2.1% |
| FirstEnergy Ohio PIRB Special Purpose Trust | |
| Series 2013-1, Class A3 | | |
| 3.45%, due 1/15/36 | $ 407,162 | $ 383,048 |
| PSNH Funding LLC 3 | |
| Series 2018-1, Class A1 | | |
| 3.094%, due 2/1/26 | 22,741 | 22,685 |
| United States Small Business Administration | |
| Series 2012-20L, Class 1 | | |
| 1.93%, due 12/1/32 | 182,235 | 165,275 |
| Series 2014-20H, Class 1 | | |
| 2.88%, due 8/1/34 | 218,261 | 203,541 |
| Series 2015-20G, Class 1 | | |
| 2.88%, due 7/1/35 | 622,678 | 582,568 |
| Series 2014-20I, Class 1 | | |
| 2.92%, due 9/1/34 | 241,554 | 225,481 |
| Series 2014-20C, Class 1 | | |
| 3.21%, due 3/1/34 | 399,842 | 378,257 |
| Series 2018-20B, Class 1 | | |
| 3.22%, due 2/1/38 | 1,064,187 | 991,067 |
| Series 2018-20D, Class 1 | | |
| 3.31%, due 4/1/38 | 1,364,265 | 1,271,479 |
Total Asset-Backed Securities
(Cost $4,646,198) | | 4,223,401 |
| Corporate Bonds 1.5% |
| Electric 1.5% |
| Duke Energy Florida Project Finance LLC | | |
| Series 2026 | | |
| 2.538%, due 9/1/29 | 1,631,249 | 1,527,204 |
| PG&E Energy Recovery Funding LLC | | |
| Series A-1 | | |
| 1.46%, due 7/15/31 | 1,657,798 | 1,469,691 |
| | | 2,996,895 |
Total Corporate Bonds
(Cost $3,284,842) | | 2,996,895 |
| Mortgage-Backed Securities 23.0% |
| Agency (Collateralized Mortgage Obligations) 10.8% |
| FHLMC | |
| REMIC, Series 5038, Class SA | | |
| (zero coupon) (SOFR 30A + 4.10%), due 11/25/50 (a)(b) | 2,151,159 | 125,567 |
| | Principal
Amount | Value |
| |
| Agency (Collateralized Mortgage Obligations) (continued) |
| FHLMC (continued) | |
| REMIC, Series 5057, Class SH | | |
| 0.413% (SOFR 30A + 5.75%), due 12/25/50 (a)(b) | $ 749,060 | $ 99,814 |
| REMIC, Series 5019, Class PL | | |
| 1.00%, due 10/25/50 | 596,968 | 435,574 |
| REMIC, Series 5149, Class LI | | |
| 2.50%, due 10/25/51 (a) | 1,726,359 | 212,321 |
| REMIC, Series 5013, Class DI | | |
| 3.00%, due 9/25/50 (a) | 1,534,795 | 288,107 |
| REMIC, Series 5023, Class LI | | |
| 3.00%, due 10/25/50 (a) | 512,968 | 81,948 |
| REMIC, Series 5094, Class IP | | |
| 3.00%, due 4/25/51 (a) | 565,071 | 87,622 |
| REMIC, Series 5155, Class KI | | |
| 3.00%, due 10/25/51 (a) | 1,424,438 | 190,543 |
| REMIC, Series 5160 | | |
| 3.00%, due 10/25/51 (a) | 678,792 | 77,674 |
| REMIC, Series 4888, Class BA | | |
| 3.50%, due 9/15/48 | 116,029 | 108,449 |
| REMIC, Series 4877, Class AT | | |
| 3.50%, due 11/15/48 | 127,723 | 118,852 |
| REMIC, Series 4877, Class BE | | |
| 3.50%, due 11/15/48 | 177,483 | 165,020 |
| FNMA | |
| REMIC, Series 2022-3, Class YS | | |
| (zero coupon) (SOFR 30A + 2.55%), due 2/25/52 (a)(b) | 3,462,562 | 35,252 |
| REMIC, Series 2022-10, Class SA | | |
| 0.413% (SOFR 30A + 5.75%), due 2/25/52 (a)(b) | 1,058,000 | 154,067 |
| REMIC, Series 2016-19, Class SD | | |
| 0.648% (SOFR 30A + 5.986%), due 4/25/46 (a)(b) | 2,685,135 | 241,028 |
| REMIC, Series 2020-74, Class DA | | |
| 1.00%, due 10/25/50 | 529,618 | 377,520 |
| REMIC, Series 2020-63, Class B | | |
| 1.25%, due 9/25/50 | 221,128 | 169,925 |
| REMIC, Series 2012-124, Class PG | | |
| 2.00%, due 7/25/42 | 611,116 | 542,850 |
| REMIC, Series 2021-53, Class GI | | |
| 3.00%, due 7/25/48 (a) | 1,783,190 | 262,773 |
| REMIC, Series 2019-13, Class PE | | |
| 3.00%, due 3/25/49 | 184,828 | 166,623 |
| REMIC, Series 2019-58, Class LP | | |
| 3.00%, due 10/25/49 | 405,334 | 359,158 |
| REMIC, Series 2019-77, Class LZ | | |
| 3.00%, due 1/25/50 | 1,684,957 | 1,492,222 |
The notes to the financial statements are an integral part of, and should be read in conjunction with, the financial statements.
| 10 | MainStay VP MacKay Government Portfolio |
| | Principal
Amount | Value |
| Mortgage-Backed Securities (continued) |
| Agency (Collateralized Mortgage Obligations) (continued) |
| FNMA (continued) | |
| REMIC, Series 2021-13, Class BI | | |
| 3.00%, due 2/25/50 (a) | $ 966,892 | $ 163,125 |
| REMIC, Series 2021-85, Class BI | | |
| 3.00%, due 12/25/51 (a) | 1,361,530 | 220,935 |
| REMIC, Series 2020-10, Class LP | | |
| 3.50%, due 3/25/50 | 1,293,070 | 1,144,529 |
| REMIC, Series 2021-6, Class MC | | |
| 3.50%, due 6/25/50 | 1,245,110 | 1,149,108 |
| REMIC, Series 2021-6, Class ML | | |
| 3.50%, due 6/25/50 | 654,017 | 593,867 |
| REMIC, Series 2021-12, Class GC | | |
| 3.50%, due 7/25/50 | 991,466 | 905,451 |
| REMIC, Series 2020-10, Class DA | | |
| 3.50%, due 3/25/60 | 1,293,055 | 1,142,269 |
| FNMA, Strips (a) | |
| REMIC, Series 427, Class C77 | | |
| 2.50%, due 9/25/51 | 1,353,540 | 194,254 |
| REMIC, Series 360, Class 2 | | |
| 5.00%, due 8/25/35 | 33,929 | 5,498 |
| REMIC, Series 361, Class 2 | | |
| 6.00%, due 10/25/35 | 8,037 | 1,555 |
| GNMA | |
| REMIC, Series 2010-151, Class KO | | |
| (zero coupon), due 6/16/37 | 476,663 | 441,541 |
| REMIC, Series 2021-213, Class ES | | |
| (zero coupon) (SOFR 30A + 1.70%), due 12/20/51 (a)(b) | 5,261,360 | 15,583 |
| REMIC, Series 2020-34, Class SC | | |
| 0.578% (1 Month SOFR + 5.936%), due 3/20/50 (a)(b) | 875,977 | 114,557 |
| REMIC, Series 2020-146, Class SA | | |
| 0.828% (1 Month SOFR + 6.186%), due 10/20/50 (a)(b) | 854,338 | 128,447 |
| REMIC, Series 2021-57, Class SD | | |
| 0.828% (1 Month SOFR + 6.186%), due 3/20/51 (a)(b) | 1,208,051 | 154,803 |
| REMIC, Series 2020-146, Class YK | | |
| 1.00%, due 10/20/50 | 1,335,959 | 1,024,985 |
| REMIC, Series 2021-78, Class LA | | |
| 1.00%, due 5/20/51 | 572,295 | 438,797 |
| REMIC, Series 2021-91, Class MF | | |
| 1.00%, due 5/20/51 | 292,380 | 223,848 |
| REMIC, Series 2021-57, Class AI | | |
| 2.00%, due 2/20/51 (a) | 2,300,141 | 229,487 |
| REMIC, Series 2021-57, Class IN | | |
| 2.00%, due 2/20/51 (a) | 396,544 | 42,903 |
| | Principal
Amount | Value |
| |
| Agency (Collateralized Mortgage Obligations) (continued) |
| GNMA (continued) | |
| REMIC, Series 2014-63, Class PG | | |
| 2.50%, due 7/20/43 | $ 417,943 | $ 392,130 |
| REMIC, Series 2019-159, Class P | | |
| 2.50%, due 9/20/49 | 604,807 | 525,230 |
| REMIC, Series 2023-19 | | |
| 2.50%, due 2/20/51 (a) | 1,621,816 | 222,295 |
| REMIC, Series 2021-188 | | |
| 2.50%, due 10/20/51 (a) | 1,432,269 | 208,962 |
| REMIC, Series 2019-3, Class A | | |
| 3.00%, due 4/20/48 | 59,215 | 56,279 |
| REMIC, Series 2019-59, Class KA | | |
| 3.00%, due 12/20/48 | 345,492 | 310,927 |
| REMIC, Series 2021-98, Class IN | | |
| 3.00%, due 6/20/51 (a) | 529,738 | 91,714 |
| REMIC, Series 2021-139, Class IA | | |
| 3.00%, due 8/20/51 (a) | 2,705,123 | 418,059 |
| REMIC, Series 2021-158, Class NI | | |
| 3.00%, due 9/20/51 (a) | 1,455,345 | 215,598 |
| REMIC, Series 2022-206, Class CN | | |
| 3.00%, due 2/20/52 | 1,174,802 | 1,008,302 |
| REMIC, Series 2019-92, Class GF | | |
| 3.50% (1 Month SOFR + 0.804%), due 7/20/49 (b) | 300,897 | 268,209 |
| REMIC, Series 2019-97, Class FG | | |
| 3.50% (1 Month SOFR + 0.804%), due 8/20/49 (b) | 633,238 | 564,480 |
| REMIC, Series 2019-110, Class FG | | |
| 3.50% (1 Month SOFR + 0.764%), due 9/20/49 (b) | 218,479 | 193,659 |
| REMIC, Series 2019-128, Class KF | | |
| 3.50% (1 Month SOFR + 0.764%), due 10/20/49 (b) | 335,853 | 298,446 |
| REMIC, Series 2019-128, Class YF | | |
| 3.50% (1 Month SOFR + 0.764%), due 10/20/49 (b) | 433,447 | 386,148 |
| REMIC, Series 2021-175, Class DF | | |
| 3.50% (SOFR 30A + 0.25%), due 10/20/51 (b) | 1,850,506 | 1,637,866 |
| REMIC, Series 2023-59, Class YC | | |
| 6.952%, due 9/20/51 (c) | 601,354 | 660,747 |
| Seasoned Loans Structured Transaction | |
| Series 2019-1, Class A1 | | |
| 3.50%, due 5/25/29 | 217,116 | 206,064 |
| | | 21,793,566 |
The notes to the financial statements are an integral part of, and should be read in conjunction with, the financial statements.
11
Portfolio of Investments December 31, 2023†^ (continued)
| | Principal
Amount | Value |
| Mortgage-Backed Securities (continued) |
| Commercial Mortgage Loans (Collateralized Mortgage Obligations) 11.7% |
| Arbor Multifamily Mortgage Securities Trust (d) | |
| Series 2021-MF3, Class A5 | | |
| 2.575%, due 10/15/54 | $ 3,000,000 | $ 2,539,768 |
| Series 2022-MF4, Class A5 | | |
| 3.293%, due 2/15/55 (e) | 2,000,000 | 1,785,372 |
| BXP Trust | |
| Series 2017-GM, Class A | | |
| 3.379%, due 6/13/39 (d) | 1,750,000 | 1,626,373 |
| FREMF Mortgage Trust (d)(e) | |
| REMIC, Series 2019-K103, Class B | | |
| 3.455%, due 12/25/51 | 2,144,000 | 1,933,205 |
| REMIC, Series 2020-K104, Class C | | |
| 3.541%, due 2/25/52 | 1,200,000 | 1,067,206 |
| REMIC, Series 2016-K59, Class B | | |
| 3.58%, due 11/25/49 | 500,000 | 476,989 |
| REMIC, Series 2015-K49, Class C | | |
| 3.721%, due 10/25/48 | 500,000 | 482,749 |
| REMIC, Series 2016-K58, Class B | | |
| 3.738%, due 9/25/49 | 1,000,000 | 958,909 |
| REMIC, Series 2017-K71, Class B | | |
| 3.752%, due 11/25/50 | 1,935,000 | 1,829,397 |
| REMIC, Series 2014-K41, Class B | | |
| 3.834%, due 11/25/47 | 2,700,000 | 2,650,419 |
| REMIC, Series 2014-K40, Class B | | |
| 4.052%, due 11/25/47 | 1,645,000 | 1,619,312 |
| REMIC, Series 2016-K54, Class B | | |
| 4.053%, due 4/25/48 | 695,000 | 674,590 |
| REMIC, Series 2016-K55, Class B | | |
| 4.167%, due 4/25/49 | 1,570,000 | 1,525,085 |
| REMIC, Series 2014-K38, Class B | | |
| 4.196%, due 6/25/47 | 2,000,000 | 1,983,215 |
| REMIC, Series 2019-K87, Class C | | |
| 4.325%, due 1/25/51 | 1,500,000 | 1,410,903 |
| One Bryant Park Trust | |
| Series 2019-OBP, Class A | | |
| 2.516%, due 9/15/54 (d) | 1,265,000 | 1,070,991 |
| | | 23,634,483 |
| Whole Loan (Collateralized Mortgage Obligations) 0.5% |
| Citigroup Mortgage Loan Trust | |
| Series 2006-AR6, Class 1A1 | | |
| 4.546%, due 8/25/36 (e) | 45,221 | 39,496 |
| | Principal
Amount | Value |
| |
| Whole Loan (Collateralized Mortgage Obligations) (continued) |
| J.P. Morgan Mortgage Trust | |
| Series 2021-LTV2, Class A1 | | |
| 2.519%, due 5/25/52 (c)(d) | $ 1,203,711 | $ 988,569 |
| | | 1,028,065 |
Total Mortgage-Backed Securities
(Cost $51,759,522) | | 46,456,114 |
| Municipal Bonds 2.9% |
| New Jersey 1.2% |
New Jersey Turnpike Authority
Revenue Bonds | | |
| Series A | | |
| 7.102%, due 1/1/41 | 2,000,000 | 2,422,418 |
| New York 1.7% |
New York State Thruway Authority
Revenue Bonds | | |
| Series M | | |
| 2.90%, due 1/1/35 | 4,000,000 | 3,487,525 |
Total Municipal Bonds
(Cost $7,293,971) | | 5,909,943 |
| U.S. Government & Federal Agencies 69.2% |
| Federal Home Loan Mortgage Corporation (Mortgage Pass-Through Securities) 16.6% |
| FHLMC Gold Pools, 30 Year | | |
| 2.50%, due 8/1/46 | 533,806 | 465,275 |
| 3.00%, due 2/1/46 | 906,088 | 829,445 |
| 3.00%, due 4/1/47 | 983,895 | 894,158 |
| 3.50%, due 1/1/44 | 230,182 | 217,926 |
| 3.50%, due 1/1/48 | 886,493 | 828,447 |
| 4.00%, due 7/1/44 | 512,775 | 500,124 |
| 4.00%, due 12/1/46 | 341,454 | 329,882 |
| 4.00%, due 10/1/48 | 435,376 | 419,951 |
| 4.00%, due 3/1/49 | 172,547 | 165,059 |
| 4.50%, due 12/1/44 | 695,740 | 695,830 |
| 5.00%, due 11/1/41 | 522,418 | 531,625 |
| FHLMC Gold Pools, Other | | |
| 4.50%, due 3/1/41 | 100,360 | 99,754 |
| Tennessee Valley Authority | | |
| 4.65%, due 6/15/35 | 4,395,000 | 4,475,555 |
| UMBS Pool, 15 Year | | |
| 2.00%, due 6/1/35 | 605,717 | 544,579 |
| 2.50%, due 9/1/34 | 190,892 | 176,219 |
The notes to the financial statements are an integral part of, and should be read in conjunction with, the financial statements.
| 12 | MainStay VP MacKay Government Portfolio |
| | Principal
Amount | Value |
| U.S. Government & Federal Agencies (continued) |
| Federal Home Loan Mortgage Corporation (Mortgage Pass-Through Securities) (continued) |
| UMBS Pool, 30 Year | | |
| 2.00%, due 7/1/50 | $ 2,505,165 | $ 2,068,705 |
| 2.00%, due 7/1/50 | 465,421 | 384,337 |
| 2.00%, due 8/1/50 | 1,173,720 | 966,756 |
| 2.00%, due 8/1/50 | 18,108 | 15,026 |
| 2.00%, due 8/1/50 | 1,676,773 | 1,379,185 |
| 2.00%, due 9/1/50 | 820,471 | 675,376 |
| 2.00%, due 11/1/50 | 1,518,965 | 1,254,326 |
| 2.50%, due 3/1/50 | 847,186 | 726,812 |
| 2.50%, due 7/1/50 | 1,432,671 | 1,228,959 |
| 2.50%, due 10/1/50 | 129,018 | 111,005 |
| 2.50%, due 1/1/51 | 328,812 | 280,695 |
| 2.50%, due 2/1/51 | 1,985,942 | 1,701,594 |
| 2.50%, due 5/1/51 | 1,112,056 | 952,011 |
| 3.00%, due 6/1/46 | 472,706 | 430,478 |
| 3.00%, due 8/1/49 | 863,449 | 773,962 |
| 3.00%, due 9/1/49 | 148,176 | 132,461 |
| 3.00%, due 11/1/49 | 498,932 | 449,323 |
| 3.00%, due 1/1/52 | 3,298,640 | 2,919,152 |
| 3.00%, due 4/1/52 | 949,390 | 839,933 |
| 3.50%, due 1/1/50 | 864,834 | 805,401 |
| 4.00%, due 5/1/52 | 904,028 | 855,106 |
| 4.00%, due 10/1/52 | 1,289,018 | 1,219,122 |
| 4.50%, due 11/1/52 | 601,025 | 582,788 |
| 4.50%, due 5/1/53 | 729,032 | 706,912 |
| 6.50%, due 12/1/53 | 785,000 | 807,087 |
| | | 33,440,341 |
| Federal National Mortgage Association (Mortgage Pass-Through Securities) 30.7% |
| FNMA, Other | | |
| 2.50%, due 1/1/57 | 565,414 | 480,831 |
| 2.68%, due 5/1/25 | 1,939,945 | 1,880,940 |
| 2.73%, due 4/1/25 | 1,025,000 | 995,374 |
| 3.00%, due 9/1/46 | 392,553 | 348,420 |
| 3.00%, due 10/1/46 | 393,936 | 349,701 |
| 3.00%, due 10/1/48 | 7,597 | 6,873 |
| 3.00%, due 2/1/57 | 434,819 | 382,719 |
| 3.00%, due 6/1/57 | 493,249 | 434,189 |
| 4.38%, due 7/1/28 | 2,400,000 | 2,398,566 |
| 6.00%, due 4/1/37 | 4,330 | 4,432 |
| 6.50%, due 8/1/47 | 7,959 | 8,180 |
| UMBS, 20 Year | | |
| 2.00%, due 5/1/41 | 1,968,416 | 1,687,217 |
| 2.50%, due 6/1/41 | 1,608,850 | 1,432,342 |
| 2.50%, due 7/1/41 | 1,703,614 | 1,516,521 |
| | Principal
Amount | Value |
| |
| Federal National Mortgage Association (Mortgage Pass-Through Securities) (continued) |
| UMBS, 20 Year (continued) | | |
| 3.00%, due 10/1/32 | $ 260,405 | $ 246,108 |
| UMBS, 30 Year | | |
| 2.00%, due 6/1/50 | 1,349,319 | 1,111,307 |
| 2.00%, due 10/1/50 | 1,598,929 | 1,313,165 |
| 2.00%, due 3/1/51 | 2,006,765 | 1,659,147 |
| 2.50%, due 1/1/47 | 1,389,659 | 1,201,296 |
| 2.50%, due 9/1/49 | 1,205,953 | 1,034,778 |
| 2.50%, due 3/1/50 | 383,249 | 331,336 |
| 2.50%, due 3/1/50 | 963,456 | 826,092 |
| 2.50%, due 3/1/50 | 942,006 | 807,700 |
| 2.50%, due 4/1/50 | 1,729,429 | 1,493,464 |
| 2.50%, due 5/1/50 | 2,978,417 | 2,553,793 |
| 2.50%, due 7/1/50 | 1,420,533 | 1,218,437 |
| 2.50%, due 8/1/50 | 1,763,933 | 1,513,558 |
| 2.50%, due 8/1/50 | 1,992,321 | 1,721,873 |
| 2.50%, due 9/1/50 | 2,145,407 | 1,859,079 |
| 2.50%, due 10/1/50 | 1,528,070 | 1,308,308 |
| 2.50%, due 11/1/50 | 2,154,601 | 1,866,834 |
| 2.50%, due 1/1/51 | 1,653,184 | 1,423,277 |
| 2.50%, due 4/1/51 | 1,356,640 | 1,171,825 |
| 3.00%, due 10/1/44 | 821,348 | 754,956 |
| 3.00%, due 3/1/47 | 469,481 | 425,745 |
| 3.00%, due 12/1/47 | 582,503 | 529,077 |
| 3.00%, due 10/1/49 | 538,686 | 481,927 |
| 3.00%, due 3/1/50 | 831,780 | 743,066 |
| 3.00%, due 3/1/50 | 909,382 | 811,729 |
| 3.00%, due 5/1/50 | 756,046 | 674,504 |
| 3.00%, due 7/1/50 | 1,433,350 | 1,279,430 |
| 3.00%, due 11/1/51 | 2,429,722 | 2,150,314 |
| 3.50%, due 11/1/44 | 361,475 | 341,526 |
| 3.50%, due 3/1/45 | 420,787 | 393,861 |
| 3.50%, due 8/1/46 | 277,276 | 258,775 |
| 3.50%, due 10/1/47 | 173,920 | 162,312 |
| 3.50%, due 2/1/48 | 95,254 | 88,897 |
| 3.50%, due 8/1/49 | 492,354 | 458,265 |
| 3.50%, due 9/1/50 | 1,533,199 | 1,451,697 |
| 4.00%, due 1/1/46 | 362,139 | 352,268 |
| 4.00%, due 9/1/47 | 141,756 | 136,288 |
| 4.00%, due 7/1/48 | 358,775 | 345,361 |
| 4.00%, due 8/1/48 | 1,817,237 | 1,747,476 |
| 4.00%, due 9/1/48 | 312,347 | 298,993 |
| 4.00%, due 4/1/49 | 89,901 | 86,317 |
| 4.00%, due 3/1/50 | 670,178 | 641,937 |
| 4.50%, due 2/1/41 | 1,205,299 | 1,203,371 |
| 4.50%, due 4/1/41 | 2,904,195 | 2,900,447 |
| 4.50%, due 8/1/42 | 475,025 | 474,412 |
The notes to the financial statements are an integral part of, and should be read in conjunction with, the financial statements.
13
Portfolio of Investments December 31, 2023†^ (continued)
| | Principal
Amount | Value |
| U.S. Government & Federal Agencies (continued) |
| Federal National Mortgage Association (Mortgage Pass-Through Securities) (continued) |
| UMBS, 30 Year (continued) | | |
| 4.50%, due 8/1/44 | $ 547,646 | $ 546,940 |
| 5.00%, due 9/1/41 | 1,041,533 | 1,058,408 |
| 5.00%, due 10/1/41 | 807,702 | 820,739 |
| 5.50%, due 7/1/41 | 1,501,418 | 1,546,149 |
| 6.00%, due 9/1/53 | 419,921 | 427,379 |
| 6.50%, due 9/1/53 | 1,675,785 | 1,717,206 |
| | | 61,897,454 |
| Government National Mortgage Association (Mortgage Pass-Through Securities) 0.4% |
| GNMA II, Other | | |
| 2.50%, due 1/20/50 | 238,635 | 205,057 |
| GNMA II, Single Family, 30 Year | | |
| 4.00%, due 11/20/49 | 325,960 | 312,505 |
| 4.50%, due 7/20/49 | 267,574 | 263,969 |
| | | 781,531 |
| United States Treasury Bonds 1.7% |
| U.S. Treasury Bonds | | |
| 3.00%, due 5/15/45 | 2,790,000 | 2,301,750 |
| 4.375%, due 11/15/39 | 1,200,000 | 1,250,016 |
| | | 3,551,766 |
| United States Treasury Inflation - Indexed Notes 2.6% |
| U.S. Treasury Inflation Linked Notes (f) | | |
| 0.125%, due 1/15/30 | 3,312,477 | 3,001,966 |
| 0.125%, due 7/15/30 | 2,424,020 | 2,189,622 |
| | | 5,191,588 |
| United States Treasury Notes 17.2% |
| U.S. Treasury Notes | | |
| 0.375%, due 9/15/24 | 1,600,000 | 1,549,500 |
| 0.375%, due 4/30/25 | 5,000,000 | 4,731,640 |
| 1.375%, due 10/31/28 | 3,050,000 | 2,714,619 |
| 1.50%, due 2/15/30 | 13,865,000 | 12,079,340 |
| 2.375%, due 8/15/24 | 395,000 | 388,550 |
| 2.625%, due 1/31/26 | 5,900,000 | 5,714,473 |
| 3.00%, due 10/31/25 | 7,805,000 | 7,623,290 |
| | | 34,801,412 |
Total U.S. Government & Federal Agencies
(Cost $157,316,898) | | 139,664,092 |
Total Long-Term Bonds
(Cost $224,301,431) | | 199,250,445 |
| |
| | Shares | | Value |
| |
| Short-Term Investments 0.9% |
| Affiliated Investment Company 0.6% |
| MainStay U.S. Government Liquidity Fund, 5.235% (g) | 1,270,459 | | $ 1,270,459 |
| |
| | Principal
Amount | | |
| |
| U.S. Treasury Debt 0.3% |
| U.S. Treasury Bills | | | |
| 5.291%, due 1/4/24 (h) | $ 550,000 | | 549,840 |
Total Short-Term Investments
(Cost $1,820,217) | | | 1,820,299 |
Total Investments
(Cost $226,121,648) | 99.6% | | 201,070,744 |
| Other Assets, Less Liabilities | 0.4 | | 726,626 |
| Net Assets | 100.0% | | $ 201,797,370 |
| † | Percentages indicated are based on Portfolio net assets. |
| ^ | Industry classifications may be different than those used for compliance monitoring purposes. |
| (a) | Collateralized Mortgage Obligation Interest Only Strip—Pays a fixed or variable rate of interest based on mortgage loans or mortgage pass-through securities. The principal amount of the underlying pool represents the notional amount on which the current interest was calculated. The value of these stripped securities may be particularly sensitive to changes in prevailing interest rates and are typically more sensitive to changes in prepayment rates than traditional mortgage-backed securities. |
| (b) | Floating rate—Rate shown was the rate in effect as of December 31, 2023. |
| (c) | Coupon rate may change based on changes of the underlying collateral or prepayments of principal. Rate shown was the rate in effect as of December 31, 2023. |
| (d) | May be sold to institutional investors only under Rule 144A or securities offered pursuant to Section 4(a)(2) of the Securities Act of 1933, as amended. |
| (e) | Collateral strip rate—A bond whose interest was based on the weighted net interest rate of the collateral. The coupon rate adjusts periodically based on a predetermined schedule. Rate shown was the rate in effect as of December 31, 2023. |
| (f) | Treasury Inflation Protected Security—Pays a fixed rate of interest on a principal amount that is continuously adjusted for inflation based on the Consumer Price Index-Urban Consumers. |
| (g) | Current yield as of December 31, 2023. |
| (h) | Interest rate shown represents yield to maturity. |
The notes to the financial statements are an integral part of, and should be read in conjunction with, the financial statements.
| 14 | MainStay VP MacKay Government Portfolio |
Investments in Affiliates (in 000's)
Investments in issuers considered to be affiliate(s) of the Portfolio during the year ended December 31, 2023 for purposes of Section 2(a)(3) of the Investment Company Act of 1940, as amended, were as follows:
| Affiliated Investment Companies | Value,
Beginning
of Year | Purchases
at Cost | Proceeds
from
Sales | Net
Realized
Gain/(Loss)
on Sales | Change in
Unrealized
Appreciation/
(Depreciation) | Value,
End of
Year | Dividend
Income | Other
Distributions | Shares
End of
Year |
| MainStay U.S. Government Liquidity Fund | $ 844 | $ 35,351 | $ (34,925) | $ — | $ — | $ 1,270 | $ 44 | $ — | 1,270 |
Futures Contracts
As of December 31, 2023, the Portfolio held the following futures contracts1:
| Type | Number of
Contracts | Expiration
Date | Value at
Trade Date | Current
Notional
Amount | Unrealized
Appreciation
(Depreciation)2 |
| Long Contracts | | | | | |
| U.S. Treasury 10 Year Notes | 18 | March 2024 | $ 1,965,089 | $ 2,032,031 | $ 66,942 |
| U.S. Treasury 10 Year Ultra Bonds | 16 | March 2024 | 1,805,638 | 1,888,250 | 82,612 |
| Net Unrealized Appreciation | | | | | $ 149,554 |
| 1. | As of December 31, 2023, cash in the amount of $86,250 was on deposit with a broker or futures commission merchant for futures transactions. |
| 2. | Represents the difference between the value of the contracts at the time they were opened and the value as of December 31, 2023. |
| Abbreviation(s): |
| FHLMC—Federal Home Loan Mortgage Corp. |
| FNMA—Federal National Mortgage Association |
| FREMF—Freddie Mac Multifamily |
| GNMA—Government National Mortgage Association |
| REMIC—Real Estate Mortgage Investment Conduit |
| SOFR—Secured Overnight Financing Rate |
| UMBS—Uniform Mortgage Backed Securities |
The notes to the financial statements are an integral part of, and should be read in conjunction with, the financial statements.
15
Portfolio of Investments December 31, 2023†^ (continued)
The following is a summary of the fair valuations according to the inputs used as of December 31, 2023, for valuing the Portfolio’s assets:
| Description | Quoted
Prices in
Active
Markets for
Identical
Assets
(Level 1) | | Significant
Other
Observable
Inputs
(Level 2) | | Significant
Unobservable
Inputs
(Level 3) | | Total |
| Asset Valuation Inputs | | | | | | | |
| Investments in Securities (a) | | | | | | | |
| Long-Term Bonds | | | | | | | |
| Asset-Backed Securities | $ — | | $ 4,223,401 | | $ — | | $ 4,223,401 |
| Corporate Bonds | — | | 2,996,895 | | — | | 2,996,895 |
| Mortgage-Backed Securities | — | | 46,456,114 | | — | | 46,456,114 |
| Municipal Bonds | — | | 5,909,943 | | — | | 5,909,943 |
| U.S. Government & Federal Agencies | — | | 139,664,092 | | — | | 139,664,092 |
| Total Long-Term Bonds | — | | 199,250,445 | | — | | 199,250,445 |
| Short-Term Investments | | | | | | | |
| Affiliated Investment Company | 1,270,459 | | — | | — | | 1,270,459 |
| U.S. Treasury Debt | — | | 549,840 | | — | | 549,840 |
| Total Short-Term Investments | 1,270,459 | | 549,840 | | — | | 1,820,299 |
| Total Investments in Securities | 1,270,459 | | 199,800,285 | | — | | 201,070,744 |
| Other Financial Instruments | | | | | | | |
| Futures Contracts (b) | 149,554 | | — | | — | | 149,554 |
| Total Investments in Securities and Other Financial Instruments | $ 1,420,013 | | $ 199,800,285 | | $ — | | $ 201,220,298 |
| (a) | For a complete listing of investments and their industries, see the Portfolio of Investments. |
| (b) | The value listed for these securities reflects unrealized appreciation (depreciation) as shown on the Portfolio of Investments. |
The notes to the financial statements are an integral part of, and should be read in conjunction with, the financial statements.
| 16 | MainStay VP MacKay Government Portfolio |
Statement of Assets and Liabilities as of December 31, 2023
| Assets |
Investment in unaffiliated securities, at value
(identified cost $224,851,189) | $199,800,285 |
Investment in affiliated investment companies, at value
(identified cost $1,270,459) | 1,270,459 |
| Cash | 32 |
| Cash collateral on deposit at broker for futures contracts | 86,250 |
| Receivables: | |
| Interest | 872,865 |
| Portfolio shares sold | 11,719 |
| Securities lending | 30 |
| Other assets | 1,713 |
| Total assets | 202,043,353 |
| Liabilities |
| Payables: | |
| Manager (See Note 3) | 84,936 |
| Portfolio shares redeemed | 68,856 |
| NYLIFE Distributors (See Note 3) | 35,589 |
| Professional fees | 28,761 |
| Custodian | 17,117 |
| Shareholder communication | 8,344 |
| Variation margin on futures contracts | 1,416 |
| Accrued expenses | 964 |
| Total liabilities | 245,983 |
| Net assets | $201,797,370 |
| Composition of Net Assets |
| Shares of beneficial interest outstanding (par value of $.001 per share) unlimited number of shares authorized | $ 21,014 |
| Additional paid-in-capital | 230,898,672 |
| | 230,919,686 |
| Total distributable earnings (loss) | (29,122,316) |
| Net assets | $201,797,370 |
| Initial Class | |
| Net assets applicable to outstanding shares | $ 32,615,199 |
| Shares of beneficial interest outstanding | 3,372,310 |
| Net asset value per share outstanding | $ 9.67 |
| Service Class | |
| Net assets applicable to outstanding shares | $169,182,171 |
| Shares of beneficial interest outstanding | 17,641,946 |
| Net asset value per share outstanding | $ 9.59 |
The notes to the financial statements are an integral part of, and should be read in conjunction with, the financial statements.
17
Statement of Operations for the year ended December 31, 2023
| Investment Income (Loss) |
| Income | |
| Interest | $ 5,901,372 |
| Dividends-affiliated | 44,461 |
| Securities lending, net | 259 |
| Total income | 5,946,092 |
| Expenses | |
| Manager (See Note 3) | 1,041,163 |
| Distribution/Service—Service Class (See Note 3) | 436,349 |
| Professional fees | 71,447 |
| Custodian | 41,257 |
| Trustees | 5,512 |
| Miscellaneous | 2,309 |
| Total expenses | 1,598,037 |
| Net investment income (loss) | 4,348,055 |
| Realized and Unrealized Gain (Loss) |
| Net realized gain (loss) on: | |
| Unaffiliated investment transactions | (1,605,268) |
| Futures transactions | (330,102) |
| Net realized gain (loss) | (1,935,370) |
| Net change in unrealized appreciation (depreciation) on: | |
| Unaffiliated investments | 6,788,198 |
| Futures contracts | 163,728 |
| Net change in unrealized appreciation (depreciation) | 6,951,926 |
| Net realized and unrealized gain (loss) | 5,016,556 |
| Net increase (decrease) in net assets resulting from operations | $ 9,364,611 |
The notes to the financial statements are an integral part of, and should be read in conjunction with, the financial statements.
| 18 | MainStay VP MacKay Government Portfolio |
Statements of Changes in Net Assets
for the years ended December 31, 2023 and December 31, 2022
| | 2023 | 2022 |
| Increase (Decrease) in Net Assets |
| Operations: | | |
| Net investment income (loss) | $ 4,348,055 | $ 4,475,430 |
| Net realized gain (loss) | (1,935,370) | (4,157,083) |
| Net change in unrealized appreciation (depreciation) | 6,951,926 | (34,055,749) |
| Net increase (decrease) in net assets resulting from operations | 9,364,611 | (33,737,402) |
| Distributions to shareholders: | | |
| Initial Class | (802,031) | (711,147) |
| Service Class | (3,702,120) | (3,018,585) |
| Total distributions to shareholders | (4,504,151) | (3,729,732) |
| Capital share transactions: | | |
| Net proceeds from sales of shares | 18,552,022 | 21,581,852 |
| Net asset value of shares issued to shareholders in reinvestment of distributions | 4,504,151 | 3,729,732 |
| Cost of shares redeemed | (40,812,646) | (96,041,715) |
| Increase (decrease) in net assets derived from capital share transactions | (17,756,473) | (70,730,131) |
| Net increase (decrease) in net assets | (12,896,013) | (108,197,265) |
| Net Assets |
| Beginning of year | 214,693,383 | 322,890,648 |
| End of year | $201,797,370 | $ 214,693,383 |
The notes to the financial statements are an integral part of, and should be read in conjunction with, the financial statements.
19
Financial Highlights selected per share data and ratios
| | Year Ended December 31, |
| Initial Class | 2023 | | 2022 | | 2021 | | 2020 | | 2019 |
| Net asset value at beginning of year | $ 9.45 | | $ 10.87 | | $ 11.21 | | $ 10.84 | | $ 10.49 |
| Net investment income (loss) (a) | 0.22 | | 0.20 | | 0.13 | | 0.17 | | 0.25 |
| Net realized and unrealized gain (loss) | 0.23 | | (1.43) | | (0.30) | | 0.36 | | 0.32 |
| Total from investment operations | 0.45 | | (1.23) | | (0.17) | | 0.53 | | 0.57 |
| Less distributions: | | | | | | | | | |
| From net investment income | (0.23) | | (0.19) | | (0.17) | | (0.16) | | (0.22) |
| Net asset value at end of year | $ 9.67 | | $ 9.45 | | $ 10.87 | | $ 11.21 | | $ 10.84 |
| Total investment return (b) | 5.00% | | (11.29)% | | (1.50)% | | 4.97% | | 5.42% |
| Ratios (to average net assets)/Supplemental Data: | | | | | | | | | |
| Net investment income (loss) | 2.30% | | 1.92% | | 1.15% | | 1.50% | | 2.35% |
| Net expenses (c) | 0.56% | | 0.56% | | 0.55% | | 0.56% | | 0.57% |
| Portfolio turnover rate | 7% | | 17%(d) | | 69%(d) | | 77%(d) | | 30% |
| Net assets at end of year (in 000's) | $ 32,615 | | $ 34,601 | | $ 83,838 | | $ 107,954 | | $ 51,698 |
| (a) | Per share data based on average shares outstanding during the year. |
| (b) | Total return does not reflect any deduction of sales charges, mortality and expense charges, contract charges or administrative charges. For periods of less than one year, total return is not annualized. |
| (c) | In addition to the fees and expenses which the Portfolio bears directly, it also indirectly bears a pro-rata share of the fees and expenses of the underlying funds in which it invests. Such indirect expenses are not included in the above expense ratios. |
| (d) | The portfolio turnover rates not including mortgage dollar rolls were 13%, 37% and 53% for the years ended December 31, 2022, 2021 and 2020, respectively. |
| | Year Ended December 31, |
| Service Class | 2023 | | 2022 | | 2021 | | 2020 | | 2019 |
| Net asset value at beginning of year | $ 9.37 | | $ 10.77 | | $ 11.10 | | $ 10.74 | | $ 10.41 |
| Net investment income (loss) (a) | 0.19 | | 0.17 | | 0.10 | | 0.14 | | 0.22 |
| Net realized and unrealized gain (loss) | 0.23 | | (1.41) | | (0.29) | | 0.37 | | 0.31 |
| Total from investment operations | 0.42 | | (1.24) | | (0.19) | | 0.51 | | 0.53 |
| Less distributions: | | | | | | | | | |
| From net investment income | (0.20) | | (0.16) | | (0.14) | | (0.15) | | (0.20) |
| Net asset value at end of year | $ 9.59 | | $ 9.37 | | $ 10.77 | | $ 11.10 | | $ 10.74 |
| Total investment return (b) | 4.74% | | (11.51)% | | (1.74)% | | 4.70% | | 5.15% |
| Ratios (to average net assets)/Supplemental Data: | | | | | | | | | |
| Net investment income (loss) | 2.05% | | 1.72% | | 0.94% | | 1.29% | | 2.09% |
| Net expenses (c) | 0.81% | | 0.81% | | 0.80% | | 0.80% | | 0.82% |
| Portfolio turnover rate | 7% | | 17%(d) | | 69%(d) | | 77%(d) | | 30% |
| Net assets at end of year (in 000's) | $ 169,182 | | $ 180,093 | | $ 239,053 | | $ 281,054 | | $ 200,869 |
| (a) | Per share data based on average shares outstanding during the year. |
| (b) | Total return does not reflect any deduction of sales charges, mortality and expense charges, contract charges or administrative charges. For periods of less than one year, total return is not annualized. |
| (c) | In addition to the fees and expenses which the Portfolio bears directly, it also indirectly bears a pro-rata share of the fees and expenses of the underlying funds in which it invests. Such indirect expenses are not included in the above expense ratios. |
| (d) | The portfolio turnover rates not including mortgage dollar rolls were 13%, 37% and 53% for the years ended December 31, 2022, 2021 and 2020, respectively. |
The notes to the financial statements are an integral part of, and should be read in conjunction with, the financial statements.
| 20 | MainStay VP MacKay Government Portfolio |
Notes to Financial Statements
Note 1–Organization and Business
MainStay VP Funds Trust (the “Fund”) was organized as a Delaware statutory trust on February 1, 2011. The Fund is registered under the Investment Company Act of 1940, as amended (the “1940 Act”), as an open-end management investment company. The Fund is comprised of thirty-one separate series (collectively referred to as the “Portfolios”). These financial statements and notes relate to the MainStay VP MacKay Government Portfolio (the "Portfolio"), a "diversified” portfolio, as that term is defined in the 1940 Act, as interpreted or modified by regulatory authorities having jurisdiction, from time to time.
Shares of the Portfolio are currently offered to certain separate accounts to fund variable annuity policies and variable universal life insurance policies issued by New York Life Insurance and Annuity Corporation (“NYLIAC”), a wholly-owned subsidiary of New York Life Insurance Company (“New York Life”) and may also be offered to fund variable annuity policies and variable universal life insurance policies issued by other insurance companies. NYLIAC allocates shares of the Portfolio to, among others, certain NYLIAC separate accounts. Shares of the Portfolio are also offered to the MainStay VP Conservative Allocation Portfolio, MainStay VP Moderate Allocation Portfolio, MainStay VP Growth Allocation Portfolio and MainStay VP Equity Allocation Portfolio, which operate as “funds-of-funds," and other variable insurance funds.
The following table lists the Portfolio's share classes that have been registered and commenced operations:
| Class | Commenced Operations |
| Initial Class | January 29, 1993 |
| Service Class | June 4, 2003 |
Shares of the Portfolio are offered and are redeemed at a price equal to their respective net asset value (“NAV”) per share. No sales or redemption charge is applicable to the purchase or redemption of the Portfolio's shares. Under the terms of the Fund’s multiple class plan, adopted pursuant to Rule 18f-3 under the 1940 Act, the classes differ in that, among other things, Service Class shares of the Portfolio pay a combined distribution and service fee of 0.25% of average daily net assets attributable to Service Class shares of the Portfolio to the Distributor (as defined in Note 3(B)) pursuant to a plan adopted in accordance with Rule 12b-1 under the 1940 Act. Contract owners of variable annuity contracts purchased after June 2, 2003, are permitted to invest only in the Service Class shares.
The Portfolio's investment objective is to seek current income.
Note 2–Significant Accounting Policies
The Portfolio is an investment company and accordingly follows the investment company accounting and reporting guidance of the Financial Accounting Standards Board (“FASB”) Accounting Standards Codification Topic 946 Financial Services—Investment Companies. The Portfolio prepares its financial statements in accordance with generally accepted
accounting principles (“GAAP”) in the United States of America and follows the significant accounting policies described below.
(A) Securities Valuation. Investments are usually valued as of the close of regular trading on the New York Stock Exchange (the "Exchange") (usually 4:00 p.m. Eastern time) on each day the Portfolio is open for business ("valuation date").
Pursuant to Rule 2a-5 under the 1940 Act, the Board of Trustees of the Fund (the "Board") has designated New York Life Investment Management LLC (“New York Life Investments” or the "Manager") as its Valuation Designee (the "Valuation Designee"). The Valuation Designee is responsible for performing fair valuations relating to all investments in the Portfolio’s portfolio for which market quotations are not readily available; periodically assessing and managing material valuation risks; establishing and applying fair value methodologies; testing fair valuation methodologies; evaluating and overseeing pricing services; ensuring appropriate segregation of valuation and portfolio management functions; providing quarterly, annual and prompt reporting to the Board, as appropriate; identifying potential conflicts of interest; and maintaining appropriate records. The Valuation Designee has established a valuation committee ("Valuation Committee") to assist in carrying out the Valuation Designee’s responsibilities and establish prices of securities for which market quotations are not readily available. The Portfolio's and the Valuation Designee's policies and procedures ("Valuation Procedures") govern the Valuation Designee’s selection and application of methodologies for determining and calculating the fair value of Portfolio investments. The Valuation Designee may value the Portfolio's portfolio securities for which market quotations are not readily available and other Portfolio assets utilizing inputs from pricing services and other third-party sources. The Valuation Committee meets (in person, via electronic mail or via teleconference) on an ad-hoc basis to determine fair valuations and on a quarterly basis to review fair value events with respect to certain securities for which market quotations are not readily available, including valuation risks and back-testing results, and to preview reports to the Board.
The Valuation Committee establishes prices of securities for which market quotations are not readily available based on such methodologies and measurements on a regular basis after considering information that is reasonably available and deemed relevant by the Valuation Committee. The Board shall oversee the Valuation Designee and review fair valuation materials on a prompt, quarterly and annual basis and approve proposed revisions to the Valuation Procedures.
Investments for which market quotations are not readily available are valued at fair value as determined in good faith pursuant to the Valuation Procedures. A market quotation is readily available only when that quotation is a quoted price (unadjusted) in active markets for identical investments that the Portfolio can access at the measurement date, provided that a quotation will not be readily available if it is not reliable. "Fair value" is defined as the price the Portfolio would reasonably expect to receive upon selling an asset or liability in an orderly transaction to an independent buyer in the principal or most advantageous market for the
Notes to Financial Statements (continued)
asset or liability. Fair value measurements are determined within a framework that establishes a three-tier hierarchy that maximizes the use of observable market data and minimizes the use of unobservable inputs to establish a classification of fair value measurements for disclosure purposes. "Inputs" refer broadly to the assumptions that market participants would use in pricing the asset or liability, including assumptions about risk, such as the risk inherent in a particular valuation technique used to measure fair value using a pricing model and/or the risk inherent in the inputs for the valuation technique. Inputs may be observable or unobservable. Observable inputs reflect the assumptions market participants would use in pricing the asset or liability based on market data obtained from sources independent of the Portfolio. Unobservable inputs reflect the Portfolio’s own assumptions about the assumptions market participants would use in pricing the asset or liability based on the information available. The inputs or methodology used for valuing assets or liabilities may not be an indication of the risks associated with investing in those assets or liabilities. The three-tier hierarchy of inputs is summarized below.
| • | Level 1—quoted prices (unadjusted) in active markets for an identical asset or liability |
| • | Level 2—other significant observable inputs (including quoted prices for a similar asset or liability in active markets, interest rates and yield curves, prepayment speeds, credit risk, etc.) |
| • | Level 3—significant unobservable inputs (including the Portfolio's own assumptions about the assumptions that market participants would use in measuring fair value of an asset or liability) |
The level of an asset or liability within the fair value hierarchy is based on the lowest level of an input, both individually and in the aggregate, that is significant to the fair value measurement. The aggregate value by input level of the Portfolio’s assets and liabilities as of December 31, 2023, is included at the end of the Portfolio of Investments.
The Portfolio may use third-party vendor evaluations, whose prices may be derived from one or more of the following standard inputs, among others:
| • Benchmark yields | • Reported trades |
| • Broker/dealer quotes | • Issuer spreads |
| • Two-sided markets | • Benchmark securities |
| • Bids/offers | • Reference data (corporate actions or material event notices) |
| • Industry and economic events | • Comparable bonds |
| • Monthly payment information | |
An asset or liability for which a market quotation is not readily available is valued by methods deemed reasonable in good faith by the Valuation Committee, following the Valuation Procedures to represent fair value. Under these procedures, the Valuation Designee generally uses a market-based approach which may use related or comparable assets or liabilities, recent transactions, market multiples, book values and other relevant information. The Valuation Designee may also use an
income-based valuation approach in which the anticipated future cash flows of the asset or liability are discounted to calculate fair value. Discounts may also be applied due to the nature and/or duration of any restrictions on the disposition of the asset or liability. Fair value represents a good faith approximation of the value of a security. Fair value determinations involve the consideration of a number of subjective factors, an analysis of applicable facts and circumstances and the exercise of judgment. As a result, it is possible that the fair value for a security determined in good faith in accordance with the Valuation Procedures may differ from valuations for the same security determined for other funds using their own valuation procedures. Although the Valuation Procedures are designed to value a security at the price the Portfolio may reasonably expect to receive upon the security's sale in an orderly transaction, there can be no assurance that any fair value determination thereunder would, in fact, approximate the amount that the Portfolio would actually realize upon the sale of the security or the price at which the security would trade if a reliable market price were readily available. During the year ended December 31, 2023, there were no material changes to the fair value methodologies.
Securities which may be valued in this manner include, but are not limited to: (i) a security for which trading has been halted or suspended or otherwise does not have a readily available market quotation on a given day; (ii) a debt security that has recently gone into default and for which there is not a current market quotation; (iii) a security of an issuer that has entered into a restructuring; (iv) a security that has been delisted from a national exchange; (v) a security subject to trading collars for which no or limited trading takes place; and (vi) a security whose principal market has been temporarily closed at a time when, under normal conditions, it would be open. Securities valued in this manner are generally categorized as Level 2 or 3 in the hierarchy.
Investments in mutual funds, including money market funds, are valued at their respective NAVs at the close of business each day on the valuation date. These securities are generally categorized as Level 1 in the hierarchy.
Futures contracts are valued at the last posted settlement price on the market where such futures are primarily traded. These securities are generally categorized as Level 1 in the hierarchy.
Debt securities (other than convertible and municipal bonds) are valued at the evaluated bid prices (evaluated mean prices in the case of convertible and municipal bonds) supplied by a pricing agent or broker selected by the Valuation Designee, in consultation with the Subadvisor. The evaluations are market-based measurements processed through a pricing application and represents the pricing agent’s good faith determination as to what a holder may receive in an orderly transaction under market conditions. The rules-based logic utilizes valuation techniques that reflect participants’ assumptions and vary by asset class and per methodology, maximizing the use of relevant observable data including quoted prices for similar assets, benchmark yield curves and market corroborated inputs. The evaluated bid or mean prices are deemed by the Valuation Designee, in consultation with the Subadvisor, to be representative of
| 22 | MainStay VP MacKay Government Portfolio |
market values at the regular close of trading of the Exchange on each valuation date. Debt securities purchased on a delayed delivery basis are marked to market daily until settlement at the forward settlement date. Debt securities, including corporate bonds, U.S. government and federal agency bonds, municipal bonds, foreign bonds, convertible bonds, asset-backed securities and mortgage-backed securities are generally categorized as Level 2 in the hierarchy.
Temporary cash investments acquired in excess of 60 days to maturity at the time of purchase are valued using the latest bid prices or using valuations based on a matrix system (which considers such factors as security prices, yields, maturities and ratings), both as furnished by independent pricing services. Temporary cash investments that mature in 60 days or less at the time of purchase ("Short-Term Investments") are valued using the amortized cost method of valuation, unless the use of such method would be inappropriate. The amortized cost method involves valuing a security at its cost on the date of purchase and thereafter assuming a constant amortization to maturity of the difference between such cost and the value on maturity date. Amortized cost approximates the current fair value of a security. Securities valued using the amortized cost method are not valued using quoted prices in an active market and are generally categorized as Level 2 in the hierarchy.
The information above is not intended to reflect an exhaustive list of the methodologies that may be used to value portfolio investments. The Valuation Procedures permit the use of a variety of valuation methodologies in connection with valuing portfolio investments. The methodology used for a specific type of investment may vary based on the market data available or other considerations. The methodologies summarized above may not represent the specific means by which portfolio investments are valued on any particular business day.
(B) Income Taxes. The Portfolio's policy is to comply with the requirements of the Internal Revenue Code of 1986, as amended (the “Internal Revenue Code”), applicable to regulated investment companies and to distribute all of its taxable income to the shareholders of the Portfolio within the allowable time limits.
The Manager evaluates the Portfolio’s tax positions to determine if the tax positions taken meet the minimum recognition threshold in connection with accounting for uncertainties in income tax positions taken or expected to be taken for the purposes of measuring and recognizing tax liabilities in the financial statements. Recognition of tax benefits of an uncertain tax position is permitted only to the extent the position is “more likely than not” to be sustained assuming examination by taxing authorities. The Manager analyzed the Portfolio's tax positions taken on federal, state and local income tax returns for all open tax years (for up to three tax years) and has concluded that no provisions for federal, state and local income tax are required in the Portfolio's financial statements. The Portfolio's federal, state and local income tax and federal excise tax returns for tax years for which the applicable statutes of limitations have not expired are subject to examination by the Internal Revenue Service and state and local departments of revenue.
(C) Dividends and Distributions to Shareholders. Dividends and distributions are recorded on the ex-dividend date. The Portfolio intends to declare and pay dividends from net investment income and distributions from net realized capital and currency gains, if any, at least annually. All dividends and distributions are reinvested at NAV in the same class of shares of the Portfolio. Dividends and distributions to shareholders are determined in accordance with federal income tax regulations and may differ from determinations using GAAP.
(D) Security Transactions and Investment Income. The Portfolio records security transactions on the trade date. Realized gains and losses on security transactions are determined using the identified cost method. Interest income is accrued as earned using the effective interest rate method and includes any realized gains and losses from repayments of principal on mortgage-backed securities. Discounts and premiums on securities purchased, other than temporary cash investments that mature in 60 days or less at the time of purchase, for the Portfolio are accreted and amortized, respectively, on the effective interest rate method.
Investment income and realized and unrealized gains and losses on investments of the Portfolio are allocated pro rata to the separate classes of shares based upon their relative net assets on the date the income is earned or realized and unrealized gains and losses are incurred.
The Portfolio may place a debt security on non-accrual status and reduce related interest income by ceasing current accruals and writing off all or a portion of any interest receivables when the collection of all or a portion of such interest has become doubtful. A debt security is removed from non-accrual status when the issuer resumes interest payments or when collectability of interest is reasonably assured.
(E) Expenses. Expenses of the Fund are allocated to the individual Portfolios in proportion to the net assets of the respective Portfolios when the expenses are incurred, except where direct allocations of expenses can be made. Expenses (other than fees incurred under the distribution and service plans, further discussed in Note 3(B), which are charged directly to the Service Class shares) are allocated to separate classes of shares pro rata based upon their relative net assets on the date the expenses are incurred. The expenses borne by the Portfolio, including those of related parties to the Portfolio, are shown in the Statement of Operations.
Additionally, the Portfolio may invest in mutual funds, which are subject to management fees and other fees that may cause the costs of investing in mutual funds to be greater than the costs of owning the underlying securities directly. These indirect expenses of mutual funds are not included in the amounts shown as expenses in the Statement of Operations or in the expense ratios included in the Financial Highlights.
(F) Use of Estimates. In preparing financial statements in conformity with GAAP, the Manager makes estimates and assumptions that affect the reported amounts and disclosures in the financial statements. Actual results could differ from those estimates and assumptions.
Notes to Financial Statements (continued)
(G) Futures Contracts. A futures contract is an agreement to purchase or sell a specified quantity of an underlying instrument at a specified future date and price, or to make or receive a cash payment based on the value of a financial instrument (e.g., foreign currency, interest rate, security or securities index). The Portfolio is subject to risks such as market price risk, leverage risk, liquidity risk, counterparty risk, operational risk, legal risk and/or interest rate risk in the normal course of investing in these contracts. Upon entering into a futures contract, the Portfolio is required to pledge to the broker or futures commission merchant an amount of cash and/or U.S. government securities equal to a certain percentage of the collateral amount, known as the “initial margin.” During the period the futures contract is open, changes in the value of the contract are recognized as unrealized appreciation or depreciation by marking to market such contract on a daily basis to reflect the market value of the contract at the end of each day’s trading. The Portfolio agrees to receive from or pay to the broker or futures commission merchant an amount of cash equal to the daily fluctuation in the value of the contract. Such receipts or payments are known as “variation margin.” When the futures contract is closed, the Portfolio records a realized gain or loss equal to the difference between the proceeds from (or cost of) the closing transaction and the Portfolio's basis in the contract.
The use of futures contracts involves, to varying degrees, elements of market risk in excess of the amount recognized in the Statement of Assets and Liabilities. The contract or notional amounts and variation margin reflect the extent of the Portfolio's involvement in open futures positions. There are several risks associated with the use of futures contracts as hedging techniques. There can be no assurance that a liquid market will exist at the time when the Portfolio seeks to close out a futures contract. If no liquid market exists, the Portfolio would remain obligated to meet margin requirements until the position is closed. Futures contracts may involve a small initial investment relative to the risk assumed, which could result in losses greater than if the Portfolio did not invest in futures contracts. Futures contracts may be more volatile than direct investments in the instrument underlying the futures and may not correlate to the underlying instrument, causing a given hedge not to achieve its objectives. The Portfolio's activities in futures contracts have minimal counterparty risk as they are conducted through regulated exchanges that guarantee the futures against default by the counterparty. In the event of a bankruptcy or insolvency of a futures commission merchant that holds margin on behalf of the Portfolio, the Portfolio may not be entitled to the return of the entire margin owed to the Portfolio, potentially resulting in a loss. The Portfolio may invest in futures contracts to seek enhanced returns or to reduce the risk of loss by hedging certain of its holdings. The Portfolio's investment in futures contracts and other derivatives may increase the volatility of the Portfolio's NAVs and may result in a loss to the Portfolio.
(H) Securities Lending. In order to realize additional income, the Portfolio may engage in securities lending, subject to the limitations set forth in the 1940 Act and relevant guidance by the staff of the Securities and Exchange Commission (“SEC”). If the Portfolio engages in securities
lending, the Portfolio will lend through its custodian, JPMorgan Chase Bank, N.A., ("JPMorgan"), acting as securities lending agent on behalf of the Portfolio. Under the current arrangement, JPMorgan will manage the Portfolio's collateral in accordance with the securities lending agency agreement between the Portfolio and JPMorgan, and indemnify the Portfolio against counterparty risk. The loans will be collateralized by cash (which may be invested in a money market fund) and/or non-cash collateral (which may include U.S. Treasury securities and/or U.S. government agency securities issued or guaranteed by the United States government or its agencies or instrumentalities) at least equal at all times to the market value of the securities loaned. Non-cash collateral held at year end is segregated and cannot be transferred by the Portfolio. The Portfolio bears the risk of delay in recovery of, or loss of rights in, the securities loaned. The Portfolio may also record a realized gain or loss on securities deemed sold due to a borrower’s inability to return securities on loan. The Portfolio bears the risk of any loss on investment of cash collateral. The Portfolio will receive compensation for lending its securities in the form of fees or it will retain a portion of interest earned on the investment of any cash collateral. The Portfolio will also continue to receive interest and dividends on the securities loaned and any gain or loss in the market price of the securities loaned that may occur during the term of the loan will be for the account of the Portfolio. Income earned from securities lending activities, if any, is reflected in the Statement of Operations.
(I) Dollar Rolls. The Portfolio may enter into dollar roll transactions in which it sells mortgage-backed securities ("MBS") from its portfolio to a counterparty from whom it simultaneously agrees to buy a similar security on a delayed delivery basis. The Portfolio generally transfers MBS where the MBS are "to be announced," therefore, the Portfolio accounts for these transactions as purchases and sales.
When accounted for as purchase and sales, the securities sold in connection with the dollar rolls are removed from the portfolio and a realized gain or loss is recognized. The securities the Portfolio has agreed to acquire are included at market value in the Portfolio of Investments and liabilities for such purchase commitments are included as payables for investments purchased. During the roll period, the Portfolio foregoes principal and interest paid on the securities. The Portfolio is compensated by the difference between the current sales price and the forward price for the future as well as by the earnings on the cash proceeds of the initial sale. Dollar rolls may be renewed without physical delivery of the securities subject to the contract. Dollar roll transactions involve certain risks, including the risk that the securities returned to the Portfolio at the end of the roll period, while substantially similar, could be inferior to what was initially sold to the counterparty.
(J) Debt Securities Risk. The ability of issuers of debt securities held by the Portfolio to meet their obligations may be affected by, among other things, economic or political developments in a specific country, industry or region. Debt securities are also subject to the risks associated with changes in interest rates.
| 24 | MainStay VP MacKay Government Portfolio |
Investments in the Portfolio are not guaranteed, even though some of the Portfolio’s underlying investments are guaranteed by the U.S. government or its agencies or instrumentalities. The principal risk of mortgage-related and asset-backed securities is that the underlying debt may be prepaid ahead of schedule, if interest rates fall, thereby reducing the value of the Portfolio’s investment. If interest rates rise, less of the debt may be prepaid and the Portfolio may lose money because the Portfolio may be unable to invest in higher yielding assets. The Portfolio is subject to interest-rate risk and can lose principal value when interest rates rise. Bonds are also subject to credit risk, in which the bond issuer may fail to pay interest and principal in a timely manner.
(K) Indemnifications. Under the Fund’s organizational documents, its officers and trustees are indemnified against certain liabilities that may arise out of performance of their duties to the Fund. Additionally, in the normal course of business, the Portfolio enters into contracts with third-party service providers that contain a variety of representations and warranties and that may provide general indemnifications. The Portfolio's maximum exposure under these arrangements is unknown, as this would involve future claims that may be made against the Portfolio that have not yet occurred. The Manager believes that the risk of loss in connection with these potential indemnification obligations is remote. However, there can be no assurance that material liabilities related to such obligations will not arise in the future, which could adversely impact the Portfolio.
(L) Quantitative Disclosure of Derivative Holdings. The following tables show additional disclosures related to the Portfolio's derivative and hedging activities, including how such activities are accounted for and their effect on the Portfolio's financial positions, performance and cash flows.
The Portfolio entered into futures contracts to help manage the duration and yield curve positioning of the portfolio. These derivatives are not accounted for as hedging instruments.
Fair value of derivative instruments as of December 31, 2023:
| Asset Derivatives | Interest
Rate
Contracts
Risk | Total |
| Futures Contracts - Net Assets—Net unrealized appreciation on futures contracts (a) | $149,554 | $149,554 |
| Total Fair Value | $149,554 | $149,554 |
| (a) | Includes cumulative appreciation (depreciation) of futures contracts as reported in the Portfolio of Investments. Only current day’s variation margin is reported within the Statement of Assets and Liabilities. |
The effect of derivative instruments on the Statement of Operations for the year ended December 31, 2023:
| Net Realized Gain (Loss) from: | Interest
Rate
Contracts
Risk | Total |
| Futures Transactions | $(330,102) | $(330,102) |
| Total Net Realized Gain (Loss) | $(330,102) | $(330,102) |
| Net Change in Unrealized Appreciation (Depreciation) | Interest
Rate
Contracts
Risk | Total |
| Futures Contracts | $163,728 | $163,728 |
| Total Net Change in Unrealized Appreciation (Depreciation) | $163,728 | $163,728 |
| Average Notional Amount | Total |
| Futures Contracts Long | $5,778,219 |
Note 3–Fees and Related Party Transactions
(A) Manager and Subadvisor. New York Life Investments, a registered investment adviser and an indirect, wholly-owned subsidiary of New York Life, serves as the Portfolio's Manager, pursuant to an Amended and Restated Management Agreement ("Management Agreement"). The Manager provides offices, conducts clerical, recordkeeping and bookkeeping services and keeps most of the financial and accounting records required to be maintained by the Portfolio. Except for the portion of salaries and expenses that are the responsibility of the Portfolio, the Manager pays the salaries and expenses of all personnel affiliated with the Portfolio and certain operational expenses of the Portfolio. The Portfolio reimburses New York Life Investments in an amount equal to the portion of the compensation of the Chief Compliance Officer attributable to the Portfolio. MacKay Shields LLC ("MacKay Shields" or the "Subadvisor"), a registered investment adviser and an indirect, wholly-owned subsidiary of New York Life, serves as the Subadvisor to the Portfolio and is responsible for the day-to-day portfolio management of the Portfolio. Pursuant to the terms of an Amended and Restated Subadvisory Agreement between New York Life Investments and MacKay Shields, New York Life Investments pays for the services of the Subadvisor.
Pursuant to the Management Agreement, the Fund pays the Manager, on behalf of the Portfolio, a monthly fee for the services performed and the facilities furnished at an annual rate of the Portfolio's average daily net assets as follows: 0.50% up to $500 million; 0.475% from $500 million to $1 billion; and 0.45% in excess of $1 billion. During the year ended December 31, 2023, the effective management fee rate was 0.50% of the Portfolio's average daily net assets.
Notes to Financial Statements (continued)
During the year ended December 31, 2023, New York Life Investments earned fees from the Portfolio in the amount of $1,041,163 and paid the Subadvisor in the amount of $520,582.
JPMorgan provides sub-administration and sub-accounting services to the Portfolio pursuant to an agreement with New York Life Investments. These services include calculating the daily NAVs of the Portfolio, maintaining the general ledger and sub-ledger accounts for the calculation of the Portfolio's NAVs, and assisting New York Life Investments in conducting various aspects of the Portfolio's administrative operations. For providing these services to the Portfolio, JPMorgan is compensated by New York Life Investments.
Pursuant to an agreement between the Fund and New York Life Investments, New York Life Investments is responsible for providing or procuring certain regulatory reporting services for the Portfolio. The Portfolio will reimburse New York Life Investments for the actual costs incurred by New York Life Investments in connection with providing or procuring these services for the Portfolio.
(B) Distribution and Service Fees. The Fund, on behalf of the Portfolio, has entered into a distribution agreement with NYLIFE Distributors LLC (the “Distributor”), an affiliate of New York Life Investments. The Portfolio has adopted a distribution plan (the “Plan”) in accordance with the provisions of Rule 12b-1 under the 1940 Act. Under the Plan, the Distributor has agreed to provide, through its affiliates or independent third parties, various distribution-related, shareholder and administrative support services to the Service Class shareholders. For its services, the Distributor is entitled to a combined distribution and service fee accrued daily and paid monthly at an annual rate of 0.25% of the average daily net assets attributable to the Service Class shares of the Portfolio.
Note 4-Federal Income Tax
As of December 31, 2023, the cost and unrealized appreciation (depreciation) of the Portfolio’s investment portfolio, including applicable derivative contracts and other financial instruments, as determined on a federal income tax basis, were as follows:
| | Federal Tax
Cost | Gross
Unrealized
Appreciation | Gross
Unrealized
(Depreciation) | Net
Unrealized
Appreciation/
(Depreciation) |
| Investments in Securities | $226,175,523 | $693,753 | $(25,798,532) | $(25,104,779) |
As of December 31, 2023, the components of accumulated gain (loss) on a tax basis were as follows:
Ordinary
Income | Accumulated
Capital
and Other
Gain (Loss) | Other
Temporary
Differences | Unrealized
Appreciation
(Depreciation) | Total
Accumulated
Gain (Loss) |
| $4,348,050 | $(8,365,588) | $— | $(25,104,779) | $(29,122,317) |
The difference between book-basis and tax-basis unrealized appreciation (depreciation) is primarily due to mark to market of futures.
As of December 31, 2023, for federal income tax purposes, capital loss carryforwards of $8,365,588, as shown in the table below, were available to the extent provided by the regulations to offset future realized gains of the Portfolio. Accordingly, no capital gains distributions are expected to be paid to shareholders until net gains have been realized in excess of such amounts.
Capital Loss
Available Through | Short-Term
Capital Loss
Amounts (000’s) | Long-Term
Capital Loss
Amounts (000’s) |
| Unlimited | $1,976 | $6,390 |
During the years ended December 31, 2023 and December 31, 2022, the tax character of distributions paid as reflected in the Statements of Changes in Net Assets was as follows:
| | 2023 | 2022 |
| Distributions paid from: | | |
| Ordinary Income | $4,504,151 | $3,729,732 |
Note 5–Custodian
JPMorgan is the custodian of cash and securities held by the Portfolio. Custodial fees are charged to the Portfolio based on the Portfolio's net assets and/or the market value of securities held by the Portfolio and the number of certain transactions incurred by the Portfolio.
Note 6–Line of Credit
The Portfolio and certain other funds managed by New York Life Investments maintain a line of credit with a syndicate of banks in order to secure a source of funds for temporary purposes to meet unanticipated or excessive redemption requests.
Effective July 25, 2023, under the credit agreement (the “Credit Agreement”), the aggregate commitment amount is $600,000,000 with an additional uncommitted amount of $100,000,000. The commitment fee is an annual rate of 0.15% of the average commitment amount payable quarterly, regardless of usage, to JPMorgan, who serves as the agent to the syndicate. The commitment fee is allocated among the Portfolio and certain other funds managed by New York Life Investments based upon their respective net assets and other factors. Interest on any revolving credit loan is charged based upon the Federal Funds Rate, Daily SOFR + 0.10%, or the Overnight Bank Funding Rate, whichever is higher. The Credit Agreement expires on July 23, 2024, although the Portfolio, certain other funds managed by New York Life Investments and the syndicate of banks may renew the Credit Agreement for an additional year on the same or different terms or enter into a credit agreement with a different syndicate of banks. Prior to July 25, 2023, the aggregate commitment amount and the commitment fee were the same as those under the current Credit Agreement. During the year ended December 31, 2023, there were no borrowings made or outstanding with respect to the Portfolio under the Credit Agreement.
| 26 | MainStay VP MacKay Government Portfolio |
Note 7–Interfund Lending Program
Pursuant to an exemptive order issued by the SEC, the Portfolio, along with certain other funds managed by New York Life Investments, may participate in an interfund lending program. The interfund lending program provides an alternative credit facility that permits the Portfolio and certain other funds managed by New York Life Investments to lend or borrow money for temporary purposes directly to or from one another, subject to the conditions of the exemptive order. During the year ended December 31, 2023, there were no interfund loans made or outstanding with respect to the Portfolio.
Note 8–Purchases and Sales of Securities (in 000’s)
During the year ended December 31, 2023, purchases and sales of U.S. government securities were $1,513 and $6,387, respectively. Purchases and sales of securities, other than U.S. government securities and short-term securities, were $12,660 and $25,468, respectively.
Note 9–Capital Share Transactions
Transactions in capital shares for the years ended December 31, 2023 and December 31, 2022, were as follows:
| Initial Class | Shares | Amount |
| Year ended December 31, 2023: | | |
| Shares sold | 179,792 | $ 1,725,962 |
| Shares issued to shareholders in reinvestment of distributions | 88,787 | 802,031 |
| Shares redeemed | (558,392) | (5,298,673) |
| Net increase (decrease) | (289,813) | $ (2,770,680) |
| Year ended December 31, 2022: | | |
| Shares sold | 633,685 | $ 6,612,982 |
| Shares issued to shareholders in reinvestment of distributions | 77,120 | 711,147 |
| Shares redeemed | (4,760,615) | (47,828,335) |
| Net increase (decrease) | (4,049,810) | $(40,504,206) |
| |
| Service Class | Shares | Amount |
| Year ended December 31, 2023: | | |
| Shares sold | 1,779,431 | $ 16,826,060 |
| Shares issued to shareholders in reinvestment of distributions | 413,100 | 3,702,120 |
| Shares redeemed | (3,780,442) | (35,513,973) |
| Net increase (decrease) | (1,587,911) | $(14,985,793) |
| Year ended December 31, 2022: | | |
| Shares sold | 1,512,996 | $ 14,968,870 |
| Shares issued to shareholders in reinvestment of distributions | 330,073 | 3,018,585 |
| Shares redeemed | (4,818,836) | (48,213,380) |
| Net increase (decrease) | (2,975,767) | $(30,225,925) |
Note 10–Other Matters
As of the date of this report, the Portfolio faces a heightened level of risk associated with current uncertainty, volatility and state of economies, financial markets, rising interest rates, and labor and health conditions around the world. Events such as war, acts of terrorism, recessions, rapid inflation, the imposition of international sanctions, earthquakes, hurricanes, epidemics and pandemics and other unforeseen natural or human disasters may have broad adverse social, political and economic effects on the global economy, which could negatively impact the value of the Portfolio's investments. Developments that disrupt global economies and financial markets may magnify factors that affect the Portfolio's performance.
Note 11–Subsequent Events
In connection with the preparation of the financial statements of the Portfolio as of and for the year ended December 31, 2023, events and transactions subsequent to December 31, 2023, through the date the financial statements were issued, have been evaluated by the Manager for possible adjustment and/or disclosure. No subsequent events requiring financial statement adjustment or disclosure have been identified, other than the following:
At a meeting held on December 6-7, 2023, the Board considered and approved, among other related proposals, to be effective on or about May 1, 2024: (i) changing the Portfolio’s name to MainStay VP MacKay U.S. Infrastructure Bond Portfolio and modifying its non-fundamental “names rule” investment policy; (ii) modifying the Portfolio’s principal investment strategies and investment process; and (iii) changing the Portfolio’s primary benchmark.
Report of Independent Registered Public Accounting Firm
To the Board of Trustees of MainStay VP Funds Trust and Shareholders of MainStay VP MacKay Government Portfolio
Opinion on the Financial Statements
We have audited the accompanying statement of assets and liabilities, including the portfolio of investments, of MainStay VP MacKay Government Portfolio (one of the portfolios constituting MainStay VP Funds Trust, referred to hereafter as the “Portfolio”) as of December 31, 2023, the related statement of operations for the year ended December 31, 2023, the statements of changes in net assets for each of the two years in the period ended December 31, 2023, including the related notes, and the financial highlights for each of the five years in the period ended December 31, 2023 (collectively referred to as the “financial statements”). In our opinion, the financial statements present fairly, in all material respects, the financial position of the Portfolio as of December 31, 2023, the results of its operations for the year then ended, the changes in its net assets for each of the two years in the period ended December 31, 2023 and the financial highlights for each of the five years in the period ended December 31, 2023 in conformity with accounting principles generally accepted in the United States of America.
Basis for Opinion
These financial statements are the responsibility of the Portfolio’s management. Our responsibility is to express an opinion on the Portfolio’s financial statements based on our audits. We are a public accounting firm registered with the Public Company Accounting Oversight Board (United States) (PCAOB) and are required to be independent with respect to the Portfolio in accordance with the U.S. federal securities laws and the applicable rules and regulations of the Securities and Exchange Commission and the PCAOB.
We conducted our audits of these financial statements in accordance with the standards of the PCAOB. Those standards require that we plan and perform the audit to obtain reasonable assurance about whether the financial statements are free of material misstatement, whether due to error or fraud.
Our audits included performing procedures to assess the risks of material misstatement of the financial statements, whether due to error or fraud, and performing procedures that respond to those risks. Such procedures included examining, on a test basis, evidence regarding the amounts and disclosures in the financial statements. Our audits also included evaluating the accounting principles used and significant estimates made by management, as well as evaluating the overall presentation of the financial statements. Our procedures included confirmation of securities owned as of December 31, 2023 by correspondence with the custodian, transfer agent and broker. We believe that our audits provide a reasonable basis for our opinion.
/s/PricewaterhouseCoopers LLP
New York, New York
February 26, 2024
We have served as the auditor of one or more investment companies in the MainStay group of funds since 1984.
| 28 | MainStay VP MacKay Government Portfolio |
Board Consideration and Approval of Management Agreement and Subadvisory Agreement (Unaudited)
The continuation of the Management Agreement with respect to the MainStay VP MacKay Government Portfolio (“Portfolio”) and New York Life Investment Management LLC (“New York Life Investments”) and the Subadvisory Agreement between New York Life Investments and MacKay Shields LLC (“MacKay”) with respect to the Portfolio (together, “Advisory Agreements”) is subject to annual review and approval by the Board of Trustees of MainStay VP Funds Trust (“Board” of the “Trust”) in accordance with Section 15 of the Investment Company Act of 1940, as amended (“1940 Act”). At its December 6–7, 2023 meeting, the Board, including the Trustees who are not an “interested person” (as such term is defined in the 1940 Act) of the Trust (“Independent Trustees”) voting separately, unanimously approved the continuation of each of the Advisory Agreements for a one-year period.
In reaching the decision to approve the continuation of each of the Advisory Agreements, the Board considered information and materials furnished by New York Life Investments and MacKay in connection with an annual contract review process undertaken by the Board that took place at meetings of the Board and its Contracts Committee from September 2023 through December 2023, including information and materials furnished by New York Life Investments and MacKay in response to requests prepared on behalf of the Board, and in consultation with the Independent Trustees, by independent legal counsel to the Independent Trustees, which encompassed a variety of topics, including those summarized below. Information and materials requested by and furnished to the Board for consideration in connection with the contract review process included, among other items, reports on the Portfolio and “peer funds” prepared by Institutional Shareholder Services Inc. (“ISS”), an independent third-party service provider engaged by the Board to report objectively on the Portfolio’s investment performance, management fee and total expenses. The Board also considered information on the fees charged to other investment advisory clients of New York Life Investments and/or MacKay that follow investment strategies similar to those of the Portfolio, if any, and, when applicable, the rationale for differences in the Portfolio’s management and subadvisory fees and the fees charged to those other investment advisory clients. In addition, the Board considered information regarding the legal standards and fiduciary obligations applicable to its consideration of the continuation of each of the Advisory Agreements. The contract review process, including the structure and format for information and materials provided to the Board, has been developed in consultation with the Board. The Independent Trustees also met in executive sessions with their independent legal counsel and, for portions thereof, with senior management of New York Life Investments.
The Board’s deliberations with respect to the continuation of each of the Advisory Agreements reflect a year-long process, and the Board also took into account information furnished to the Board and its Committees throughout the year, as deemed relevant and appropriate by the Trustees, including, among other items, reports on investment performance of the Portfolio and investment-related matters for the Portfolio as well as presentations from New York Life Investments and, generally annually, MacKay personnel. In addition, the Board took into account other
information provided by New York Life Investments throughout the year, including, among other items, periodic reports on legal and compliance matters, risk management, portfolio turnover, brokerage commissions and non-advisory services provided to the Portfolio by New York Life Investments, as deemed relevant and appropriate by the Trustees.
In addition to information provided to the Board throughout the year, the Board received information in connection with its June 2023 meeting provided specifically in response to requests prepared on behalf of the Board, and in consultation with the Independent Trustees, by independent legal counsel to the Independent Trustees regarding the Portfolio’s distribution arrangements. In addition, the Board received information regarding the Portfolio’s asset levels, share purchase and redemption activity and the payment of Rule 12b-1 and/or certain other fees by applicable share classes of the Portfolio, among other information.
In considering the continuation of each of the Advisory Agreements, the Trustees reviewed and evaluated the information and factors they believed to reasonably be necessary and appropriate in light of legal advice furnished to them by independent legal counsel to the Independent Trustees and through the exercise of their own business judgment. Although individual Trustees may have weighed certain factors or information differently and the Board did not consider any single factor or information controlling in reaching its decision, the factors that figured prominently in the Board’s consideration of the continuation of each of the Advisory Agreements are summarized in more detail below and include, among other factors: (i) the nature, extent and quality of the services provided to the Portfolio by New York Life Investments and MacKay; (ii) the qualifications of the portfolio managers of the Portfolio and the historical investment performance of the Portfolio, New York Life Investments and MacKay; (iii) the costs of the services provided, and profits realized, by New York Life Investments and MacKay with respect to their relationships with the Portfolio; (iv) the extent to which economies of scale have been realized or may be realized if the Portfolio grows and the extent to which any economies of scale have been shared, have benefited or may benefit the Portfolio’s shareholders; and (v) the reasonableness of the Portfolio’s management and subadvisory fees and total ordinary operating expenses. Although the Board recognized that comparisons between the Portfolio’s fees and expenses and those of other funds are imprecise given different terms of agreements, variations in fund strategies and other factors, the Board considered the reasonableness of the Portfolio’s management fee and total ordinary operating expenses as compared to the peer funds identified by ISS. Throughout their considerations, the Trustees acknowledged the commitment of New York Life Investments and its affiliates to serve the MainStay Group of Funds, as well as their capacity, experience, resources, financial stability and reputations. The Trustees also acknowledged the entrepreneurial and other risks assumed by New York Life Investments in sponsoring and managing the Portfolio. With respect to the Subadvisory Agreement, the Board took into account New York Life Investments’ recommendation to approve the continuation of the Subadvisory Agreement.
Board Consideration and Approval of Management Agreement and Subadvisory Agreement (Unaudited) (continued)
The Trustees noted that, throughout the year, the Trustees are afforded an opportunity to ask questions of, and request additional information or materials from, New York Life Investments and MacKay. The Board’s decision with respect to each of the Advisory Agreements may have also been based, in part, on the Board’s knowledge of New York Life Investments and MacKay resulting from, among other things, the Board’s consideration of each of the Advisory Agreements in prior years, the advisory agreements for other funds in the MainStay Group of Funds, the Board’s review throughout the year of the performance and operations of other funds in the MainStay Group of Funds and each Trustee’s business judgment and industry experience. In addition to considering the above-referenced factors, the Board observed that in the marketplace, notably under variable life insurance policies and variable annuity contracts for which the Portfolio serves as an investment option, there are a range of investment options available to investors and that the Portfolio’s shareholders, having had the opportunity to consider other investment options, have invested in the Portfolio.
The factors that figured prominently in the Board’s decision to approve the continuation of each of the Advisory Agreements during the Board’s December 6–7, 2023 meeting are summarized in more detail below.
Nature, Extent and Quality of Services Provided by New York Life Investments and MacKay
The Board examined the nature, extent and quality of the services that New York Life Investments provides to the Portfolio. The Board evaluated New York Life Investments’ experience and capabilities in serving as manager of the Portfolio and considered that the Portfolio operates in a “manager-of-managers” structure. The Board also considered New York Life Investments’ responsibilities and services provided pursuant to this structure, including overseeing the services provided by MacKay, evaluating the performance of MacKay, making recommendations to the Board as to whether the Subadvisory Agreement should be renewed, modified or terminated and periodically reporting to the Board regarding the results of New York Life Investments’ evaluation and monitoring functions. The Board noted that New York Life Investments manages other mutual funds, serves a variety of other investment advisory clients, including other pooled investment vehicles, and has experience overseeing mutual fund service providers, including subadvisors. The Board considered the experience of senior personnel at New York Life Investments providing management and administrative and other non-advisory services to the Portfolio. The Board observed that New York Life Investments devotes significant resources and time to providing management and administrative and other non-advisory services to the Portfolio, including New York Life Investments’ oversight and due diligence reviews of MacKay and ongoing analysis of, and interactions with, MacKay with respect to, among other things, the Portfolio’s investment performance and risks as well as MacKay’s investment capabilities and subadvisory services with respect to the Portfolio.
The Board also considered the range of services that New York Life Investments provides to the Portfolio under the terms of the Management Agreement, including: (i) fund accounting and ongoing supervisory
services provided by New York Life Investments’ Fund Administration and Accounting Group; (ii) investment supervisory and analytical services provided by New York Life Investments’ Investment Consulting Group; (iii) compliance services provided by the Trust’s Chief Compliance Officer as well as New York Life Investments’ compliance department, including supervision and implementation of the Portfolio’s compliance program; (iv) legal services provided by New York Life Investments’ Office of the General Counsel; and (v) risk management monitoring and analysis by compliance and investment personnel. In addition, the Board considered New York Life Investments’ willingness to invest in personnel and other resources, such as cyber security, information security and business continuity planning, that may benefit the Portfolio and noted that New York Life Investments is responsible for compensating the Trust’s officers, except for a portion of the salary of the Trust’s Chief Compliance Officer. The Board recognized that New York Life Investments provides certain other non-advisory services to the Portfolio and has over time provided an increasingly broad array of non-advisory services to the MainStay Group of Funds as a result of regulatory and other developments.
The Board also examined the range, and the nature, extent and quality, of the investment advisory services that MacKay provides to the Portfolio and considered the terms of each of the Advisory Agreements. The Board evaluated MacKay’s experience and performance in serving as subadvisor to the Portfolio and advising other portfolios and MacKay’s track record and experience in providing investment advisory services as well as the experience of investment advisory, senior management and administrative personnel at MacKay. The Board considered New York Life Investments’ and MacKay’s overall resources, legal and compliance environment, capabilities, reputation, financial condition and history. In addition to information provided in connection with quarterly meetings with the Trust’s Chief Compliance Officer, the Board considered information regarding the compliance policies and procedures of New York Life Investments and MacKay and acknowledged their commitment to further developing and strengthening compliance programs that may relate to the Portfolio. The Board also considered MacKay’s ability to recruit and retain qualified investment professionals and willingness to invest in personnel and other resources that may benefit the Portfolio. In this regard, the Board considered the qualifications and experience of the Portfolio’s portfolio managers, the number of accounts managed by the portfolio managers and the method for compensating the portfolio managers.
In addition, the Board considered information provided by New York Life Investments and MacKay regarding their respective business continuity and disaster recovery plans.
Based on these considerations, among others, the Board concluded that the Portfolio would likely continue to benefit from the nature, extent and quality of these services.
Investment Performance
In evaluating the Portfolio’s investment performance, the Board considered investment performance results over various periods in light of the Portfolio’s investment objective, strategies and risks. The Board
| 30 | MainStay VP MacKay Government Portfolio |
considered investment reports on, and analysis of, the Portfolio’s performance provided to the Board throughout the year. These reports include, among other items, information on the Portfolio’s gross and net returns, the Portfolio’s investment performance compared to a relevant investment category and the Portfolio’s benchmark, the Portfolio’s risk-adjusted investment performance and the Portfolio’s investment performance as compared to peer funds, as appropriate, as well as portfolio attribution information and commentary on the effect of market conditions. The Board also considered information provided by ISS showing the investment performance of the Portfolio as compared to peer funds. In addition, the Board reviewed the methodology used by ISS to construct the group of peer funds for comparative purposes.
The Board also took into account its discussions with senior management at New York Life Investments concerning the Portfolio’s investment performance over various periods as well as discussions between representative of MacKay and the members of the Board’s Investment Committee, which generally occur on an annual basis.
Based on these considerations, among others, the Board concluded that its review of the Portfolio’s investment performance and related information supported a determination to approve the continuation of each of the Advisory Agreements.
Costs of the Services Provided, and Profits and Other Benefits Realized, by New York Life Investments and MacKay
The Board considered the costs of the services provided under each of the Advisory Agreements. The Board also considered the profitability of New York Life Investments and its affiliates, including MacKay, due to their relationships with the Portfolio as well as by New York Life Investments and its affiliates due to their relationships with the MainStay Group of Funds. Because MacKay is an affiliate of New York Life Investments whose subadvisory fee is paid by New York Life Investments, not the Portfolio, the Board considered cost and profitability information for New York Life Investments and MacKay in the aggregate.
In addition, the Board acknowledged the difficulty in obtaining reliable comparative data about mutual fund managers’ profitability because such information generally is not publicly available and may be impacted by numerous factors, including the structure of a fund manager’s organization, the types of funds it manages, the methodology used to allocate certain fixed costs to specific funds and the manager’s capital structure and costs of capital.
In evaluating the costs of the services provided by New York Life Investments and MacKay, and profitability of New York Life Investments and its affiliates, including MacKay due to their relationships with the Portfolio, the Board considered, among other factors, New York Life Investments’ and its affiliates’, including MacKay’s, continuing investments in, or willingness to invest in, personnel and other resources that may support and further enhance the management of the Portfolio, and that New York Life Investments is responsible for paying the subadvisory fee for the Portfolio. The Board also considered the financial resources of New York Life Investments and MacKay and acknowledged
that New York Life Investments and MacKay must be in a position to recruit and retain experienced professional personnel and to maintain a strong financial position for New York Life Investments and MacKay to continue to provide high-quality services to the Portfolio. The Board recognized that the Portfolio benefits from the allocation of certain fixed costs among the funds in the MainStay Group of Funds, among other expected benefits resulting from its relationship with New York Life Investments.
The Board considered information regarding New York Life Investments’ methodology for calculating profitability and allocating costs provided by New York Life Investments in connection with the fund profitability analysis presented to the Board. The Board concluded that New York Life Investments’ methods for allocating costs and procedures for estimating overall profitability of the relationship with the funds in the MainStay Group of Funds were reasonable. The Board recognized the difficulty in calculating and evaluating a manager’s profitability with respect to the Portfolio and considered that other profitability methodologies may also be reasonable.
The Board also considered certain fall-out benefits that may be realized by New York Life Investments and its affiliates, including MacKay, due to their relationships with the Portfolio, including reputational and other indirect benefits. The Board recognized, for example, the benefits to MacKay from legally permitted “soft-dollar” arrangements by which brokers provide research and other services to MacKay in exchange for commissions paid by the Portfolio with respect to trades in the Portfolio’s portfolio securities. In addition, the Board considered its review of the management agreement for a money market fund advised by New York Life Investments and an affiliated subadvisor that serves as an investment option for the Portfolio, including the potential rationale for and costs associated with investments in this money market fund by the Portfolio, if any, and considered information from New York Life Investments that the nature and type of specific investment advisory services provided to this money market fund are distinct from, or in addition to, the investment advisory services provided to the Portfolio. In addition, the Board considered the potential dividend received tax deduction for insurance company affiliates of New York Life Investments from the Portfolio’s securities lending activity.
The Board noted that the Portfolio serves as an investment option primarily under variable contracts issued by affiliates of New York Life Investments that would receive fees under those contracts. The Board observed that, in addition to fees earned by New York Life Investments under the Management Agreement for managing the Portfolio, New York Life Investments’ affiliates also earn revenues from serving the Portfolio in various other capacities, including as the Portfolio’s distributor, and insurance companies affiliated with New York Life Investments would be entitled to receive fees from the Portfolio under a distribution and service plan adopted pursuant to Rule 12b-1 under the 1940 Act. The Board considered information about these other revenues and their impact on the profitability of the relationship with the Portfolio to New York Life Investments and its affiliates. The Board noted that, although it assessed the overall profitability of the relationship with the Portfolio to New York
Board Consideration and Approval of Management Agreement and Subadvisory Agreement (Unaudited) (continued)
Life Investments and its affiliates as part of the contract review process, when considering the reasonableness of the fee paid to New York Life Investments under the Management Agreement, the Board considered the profitability of New York Life Investments’ relationship with the Portfolio on a pre-tax basis and without regard to distribution expenses incurred by New York Life Investments from its own resources.
After evaluating the information deemed relevant by the Trustees, the Board concluded that any profits realized by New York Life Investments and its affiliates, including MacKay, due to their relationships with the Portfolio were not excessive and other expected benefits that may accrue to New York Life Investments and its affiliates, including MacKay, are reasonable.
Management and Subadvisory Fees and Total Ordinary Operating Expenses
The Board evaluated the reasonableness of the fee paid under each of the Advisory Agreements and the Portfolio’s total ordinary operating expenses. With respect to the management fee and subadvisory fee, the Board primarily considered the reasonableness of the management fee paid by the Portfolio to New York Life Investments because the subadvisory fee paid to MacKay is paid by New York Life Investments, not the Portfolio. The Board also considered the reasonableness of the subadvisory fee paid by New York Life Investments and the amount of the management fee retained by New York Life Investments.
In assessing the reasonableness of the Portfolio’s fees and expenses, the Board primarily considered comparative data provided by ISS on the fees and expenses of similar mutual funds managed by other investment advisers. The Board reviewed the methodology used by ISS to construct the group of peer funds for comparative purposes. In addition, the Board considered information provided by New York Life Investments and MacKay on fees charged to other investment advisory clients, including institutional separate accounts and/or other funds, that follow investment strategies similar to those of the Portfolio, if any. The Board considered the contractual management fee schedule for the Portfolio as compared to those for such other investment advisory clients, taking into account the rationale for differences in fee schedules. The Board also took into account information provided by New York Life Investments about the more extensive scope of services provided to registered investment companies, such as the Portfolio, as compared with other investment advisory clients. Additionally, the Board considered the impact of contractual breakpoints and voluntary waivers on the Portfolio’s net management fee and expenses. The Board also considered that in proposing fees for the Portfolio, New York Life Investments considers the competitive marketplace for mutual funds.
Based on the factors outlined above, among other considerations, the Board concluded that the Portfolio’s management fee and total ordinary operating expenses are within a range that is competitive and support a conclusion that these fees and expenses are reasonable.
Economies of Scale
The Board considered information regarding economies of scale, including whether economies of scale may exist with respect to the Portfolio and whether the Portfolio’s management fee and expense structure permits any economies of scale to be appropriately shared with the Portfolio’s shareholders. The Board also considered a report from New York Life Investments, previously prepared at the request of the Board, that addressed economies of scale, including with respect to the mutual fund business generally, and the various ways in which the benefits of economies of scale may be shared with the funds in the MainStay Group of Funds. Although the Board recognized the difficulty of determining economies of scale with precision, the Board acknowledged that economies of scale may be shared with the Portfolio in a number of ways, including, for example, through the imposition of fee breakpoints, initially setting management fee rates at scale or making additional investments to enhance the services provided to the Portfolio. The Board reviewed information from New York Life Investments showing how the Portfolio’s management fee schedule compared to fee schedules of other funds and accounts managed by New York Life Investments. The Board also reviewed information from ISS showing how the Portfolio’s management fee schedule compared with fees paid for similar services by peer funds at varying asset levels.
Based on this information, the Board concluded that economies of scale are appropriately shared for the benefit of the Portfolio’s shareholders through the Portfolio’s management fee and expense structure and other methods to share benefits from economies of scale.
Conclusion
On the basis of the information and factors summarized above, among other information and factors deemed relevant by the Trustees, and the evaluation thereof, the Board, including the Independent Trustees voting separately, unanimously voted to approve the continuation of each of the Advisory Agreements.
| 32 | MainStay VP MacKay Government Portfolio |
Proxy Voting Policies and Procedures and Proxy Voting Record
The Portfolio is required to file with the SEC its proxy voting record for the 12-month period ending June 30 on Form N-PX. A description of the policies and procedures that are used to vote proxies relating to portfolio securities of the Portfolio is available free of charge upon request by calling 800-598-2019 or visiting the SEC's website at www.sec.gov. The most recent Form N-PX or proxy voting record is available free of charge upon request by calling 800-598-2019; visiting https://www.newyorklifeinvestments.com/investment-products/vp; or visiting the SEC’s website at www.sec.gov.
Shareholder Reports and Quarterly Portfolio Disclosure
The Portfolio is required to file its complete schedule of portfolio holdings with the SEC 60 days after its first and third fiscal quarter on Form N-PORT. The Portfolio's holdings report is available free of charge upon request by calling 800-598-2019 or by visiting the SEC’s website at www.sec.gov.
Board of Trustees and Officers (Unaudited)
The Trustees and officers of the Portfolio are listed below. The Board oversees the MainStay Group of Funds (which consists of MainStay Funds and MainStay Funds Trust), MainStay VP Funds Trust, MainStay MacKay DefinedTerm Municipal Opportunities Fund, MainStay CBRE Global Infrastructure Megatrends Term Fund, the Manager and the Subadvisors, and elects the officers of the Portfolios who are responsible for the day-to-day operations of the Portfolio. Information pertaining to the Trustees and officers is set forth below. Each Trustee serves until his or her successor is elected and qualified or until his or her resignation,
death or removal. Under the Board’s retirement policy, unless an exception is made, a Trustee must tender his or her resignation by the end of the calendar year during which he or she reaches the age of 75. Officers are elected annually by the Board. The business address of each Trustee and officer listed below is 51 Madison Avenue, New York, New York 10010. A majority of the Trustees are not “interested persons” (as defined by the 1940 Act and rules adopted by the SEC thereunder) of the Portfolio (“Independent Trustees”).
| | Name and
Year of Birth | Term of Office,
Position(s) Held and
Length of Service | Principal Occupation(s)
During Past Five Years | Number of
Portfolios in
Fund Complex
Overseen by
Trustee | Other Directorships
Held by Trustee |
| | | | | | |
| | Naïm Abou-Jaoudé*
1966 | MainStay VP Funds Trust: Trustee since 2023 | Chief Executive Officer of New York Life Investment Management LLC (since 2023). Chief Executive Officer of Candriam (an affiliate of New York Life Investment Management LLC) (2007 to 2023). | 81 | MainStay Funds: Trustee since 2023 (11 Funds)
MainStay Funds Trust: Trustee since 2023 (37 Funds);
MainStay MacKay DefinedTerm Municipal Opportunities Fund: Trustee since 2023;
MainStay CBRE Global Infrastructure Megatrends Term Fund: Trustee since 2023; and
New York Life Investment Management International (Chair) since 2015 |
| * | This Trustee is considered to be an “interested person” of the MainStay Group of Funds, MainStay VP Funds Trust, MainStay CBRE Global Infrastructure Megatrends Term Fund and MainStay MacKay DefinedTerm Municipal Opportunities Fund, within the meaning of the 1940 Act because of his affiliation with New York Life Investment Management LLC and Candriam, as described in detail above in the column entitled “Principal Occupation(s) During Past Five Years.” |
| | |
| 34 | MainStay VP MacKay Government Portfolio |
| | Name and
Year of Birth | Term of Office,
Position(s) Held and
Length of Service | Principal Occupation(s)
During Past Five Years | Number of
Portfolios in
Fund Complex
Overseen by
Trustee | Other Directorships
Held by Trustee |
| | | | | | |
| | David H. Chow
1957 | MainStay VP Funds Trust: Trustee since January 2016, Advisory Board Member (June 2015 to December 2015) | Founder and CEO, DanCourt Management, LLC since 1999 | 81 | MainStay Funds: Trustee since January 2016, Advisory Board Member (June 2015 to December 2015) (11 Funds);
MainStay Funds Trust: Trustee since January 2016, Advisory Board Member (June 2015 to December 2015) (37 Funds);
MainStay MacKay DefinedTerm Municipal Opportunities Fund: Trustee since January 2016, Advisory Board Member (June 2015 to December 2015);
MainStay CBRE Global Infrastructure Megatrends Term Fund: Trustee since 2021;
VanEck Vectors Group of Exchange-Traded Funds: Trustee since 2006 and Independent Chairman of the Board of Trustees from 2008 to 2022 (57 portfolios); and
Berea College of Kentucky: Trustee since 2009, Chair of the Investment Committee since 2018 |
| | Karen Hammond
1956 | MainStay VP Funds Trust: Trustee since December 2021, Advisory Board Member (June 2021 to December 2021)
| Retired, Managing Director, Devonshire Investors (2007 to 2013); Senior Vice President, Fidelity Management & Research Co. (2005 to 2007); Senior Vice President and Corporate Treasurer, FMR Corp. (2003 to 2005); Chief Operating Officer, Fidelity Investments Japan (2001 to 2003) | 81 | MainStay Funds: Trustee since December 2021, Advisory Board Member (June 2021 to December 2021) (11 Funds);
MainStay Funds Trust: Trustee since December 2021, Advisory Board Member (June 2021 to December 2021) (37 Funds);
MainStay MacKay DefinedTerm Municipal Opportunities Fund: Trustee since December 2021, Advisory Board Member (June 2021 to December 2021);
MainStay CBRE Global Infrastructure Megatrends Term Fund: Trustee since December 2021, Advisory Board Member (June 2021 to December 2021);
Two Harbors Investment Corp.: Director since 2018;
Rhode Island State Investment Commission: Member since 2017; and
Blue Cross Blue Shield of Rhode Island: Director since 2019 |
| | Susan B. Kerley
1951 | MainStay VP Funds Trust: Chair since 2017 and Trustee since 2007** | President, Strategic Management Advisors LLC since 1990 | 81 | MainStay Funds: Chair since January 2017 and Trustee since 2007 (11 Funds); MainStay Funds Trust: Chair since January 2017 and Trustee since 1990 (37 Funds)***;
MainStay MacKay DefinedTerm Municipal Opportunities Fund: Chair since January 2017 and Trustee since 2011;
MainStay CBRE Global Infrastructure Megatrends Term Fund: Trustee since June 2021; and
Legg Mason Partners Funds: Trustee since 1991 (45 portfolios) |
Board of Trustees and Officers (Unaudited) (continued)
| | Name and
Year of Birth | Term of Office,
Position(s) Held and
Length of Service | Principal Occupation(s)
During Past Five Years | Number of
Portfolios in
Fund Complex
Overseen by
Trustee | Other Directorships
Held by Trustee |
| | | | | | |
| | Alan R. Latshaw
1951 | MainStay VP Funds Trust: Trustee since 2007** | Retired; Partner, Ernst & Young LLP (2002 to 2003); Partner, Arthur Andersen LLP (1989 to 2002); Consultant to the MainStay Funds Audit and Compliance Committee (2004 to 2006) | 81 | MainStay Funds: Trustee since 2006 (11 Funds);
MainStay Funds Trust: Trustee since 2007 (37 Funds)***;
MainStay MacKay DefinedTerm Municipal Opportunities Fund: Trustee since 2011; and
MainStay CBRE Global Infrastructure Megatrends Term Fund: Trustee since June 2021 |
| | Jacques P. Perold
1958 | MainStay VP Funds Trust: Trustee since January 2016, Advisory Board Member (June 2015 to December 2015) | Founder and Chief Executive Officer, CapShift Advisors LLC (since 2018); President, Fidelity Management & Research Company (2009 to 2014); President and Chief Investment Officer, Geode Capital Management, LLC (2001 to 2009) | 81 | MainStay Funds: Trustee since January 2016, Advisory Board Member (June 2015 to December 2015) (11 Funds);
MainStay Funds Trust: Trustee since January 2016, Advisory Board Member (June 2015 to December 2015) (37 Funds);
MainStay MacKay DefinedTerm Municipal Opportunities Fund: Trustee since January 2016, Advisory Board Member (June 2015 to December 2015);
MainStay CBRE Global Infrastructure Megatrends Term Fund: Trustee since June 2021;
Allstate Corporation: Director since 2015;
Partners in Health: Trustee since 2019; and
MSCI Inc.: Director since 2017 |
| | Richard S. Trutanic
1952 | MainStay VP Funds Trust: Trustee since 2007** | Chairman and Chief Executive Officer, Somerset & Company (financial advisory firm) since 2004; Managing Director, The Carlyle Group (private investment firm) (2002 to 2004); Senior Managing Director, Partner and Board Member, Groupe Arnault S.A. (private investment firm) (1999 to 2002) | 81 | MainStay Funds: Trustee since 1994 (11 Funds);
MainStay Funds Trust: Trustee since 2007 (37 Funds)***;
MainStay MacKay DefinedTerm Municipal Opportunities Fund: Trustee since 2011; and
MainStay CBRE Global Infrastructure Megatrends Term Fund: Trustee since June 2021 |
| ** | Includes prior service as a Director of MainStay VP Series Fund, Inc., the predecessor to MainStay VP Funds Trust. |
| *** | Includes prior service as a Director/Trustee of certain predecessor entities to MainStay Funds Trust. |
| 36 | MainStay VP MacKay Government Portfolio |
| | Name and
Year of Birth | Position(s) Held and
Length of Service | Principal Occupation(s)
During Past Five Years | |
| | | | | |
| | Kirk C. Lehneis
1974 | President, MainStay VP Funds Trust (since 2017) | Chief Operating Officer and Senior Managing Director (since 2016), New York Life Investment Management LLC and New York Life Investment Management Holdings LLC; Member of the Board of Managers (since 2017) and Senior Managing Director (since 2018), NYLIFE Distributors LLC; Chairman of the Board and Senior Managing Director, NYLIM Service Company LLC (since 2017); Trustee, President and Principal Executive Officer of IndexIQ Trust, IndexIQ ETF Trust and IndexIQ Active ETF Trust (since 2018); President, MainStay CBRE Global Infrastructure Megatrends Term Fund (since 2021), MainStay MacKay DefinedTerm Municipal Opportunities Fund, MainStay Funds and MainStay Funds Trust (since 2017); Senior Managing Director, Global Product Development (from 2015 to 2016); Managing Director, Product Development (from 2010 to 2015), New York Life Investment Management LLC | |
| | Jack R. Benintende
1964 | Treasurer and Principal Financial and Accounting Officer, MainStay VP Funds Trust (since 2007)** | Managing Director, New York Life Investment Management LLC (since 2007); Treasurer and Principal Financial and Accounting Officer, MainStay CBRE Global Infrastructure Megatrends Term Fund (since 2021), MainStay MacKay DefinedTerm Municipal Opportunities Fund (since 2011), MainStay Funds Trust (since 2009) and MainStay Funds (since 2007); and Assistant Treasurer, New York Life Investment Management Holdings LLC (2008 to 2012) | |
| | J. Kevin Gao
1967 | Secretary and Chief Legal Officer, MainStay VP Funds Trust (since 2010)** | Managing Director and Associate General Counsel, New York Life Investment Management LLC (since 2010); Secretary and Chief Legal Officer, MainStay CBRE Global Infrastructure Megatrends Term Fund (since 2021), MainStay MacKay DefinedTerm Municipal Opportunities Fund (since 2011), MainStay Funds and MainStay Funds Trust (since 2010) | |
| | Kevin M. Gleason
1967 | Vice President and Chief Compliance Officer, MainStay VP Funds Trust (since June 2022) | Vice President and Chief Compliance Officer, IndexIQ Trust, IndexIQ ETF Trust and IndexIQ Active ETF Trust (since June 2022); Vice President and Chief Compliance Officer, MainStay CBRE Global Infrastructure Megatrends Term Fund, MainStay MacKay DefinedTerm Municipal Opportunities Fund (since June 2022); MainStay Funds Trust and MainStay Funds (since June 2022); Senior Vice President, Voya Investment Management and Chief Compliance Officer, Voya Family of Funds (2012 to 2022) | |
| | Scott T. Harrington
1959 | Vice President— Administration, MainStay VP Funds Trust (since 2005)** | Managing Director, New York Life Investment Management LLC (including predecessor advisory organizations) (since 2000); Member of the Board of Directors, New York Life Trust Company (since 2009); Vice President—Administration, MainStay CBRE Global Infrastructure Megatrends Term Fund (since 2021), MainStay MacKay DefinedTerm Municipal Opportunities Fund (since 2011), MainStay Funds Trust and MainStay Funds (since 2009) | |
| * | The officers listed above are considered to be “interested persons” of the MainStay Group of Funds, MainStay VP Funds Trust, MainStay CBRE Global Infrastructure Megatrends Term Fund and MainStay MacKay DefinedTerm Municipal Opportunities Fund within the meaning of the 1940 Act because of their affiliation with the MainStay Group of Funds, New York Life Insurance Company and/or its affiliates, including New York Life Investment Management LLC, New York Life Insurance Company, NYLIM Service Company LLC, NYLIFE Securities LLC and/or NYLIFE Distributors LLC, as described in detail in the column captioned “Principal Occupation(s) During Past Five Years.” Officers are elected annually by the Board. |
| ** | Includes prior service as an Officer of MainStay VP Series Fund, Inc., the predecessor to MainStay VP Funds Trust. |
Officers of the Trust (Who are not Trustees)*
This page intentionally left blank.
MainStay VP Portfolios
MainStay VP offers a wide range of Portfolios. The full array of MainStay VP offerings is listed here, with information about the manager, subadvisors, legal counsel, and independent registered public accounting firm.
Equity
MainStay VP American Century Sustainable Equity Portfolio
MainStay VP Candriam Emerging Markets Equity Portfolio
MainStay VP Epoch U.S. Equity Yield Portfolio
MainStay VP Fidelity Institutional AM® Utilities Portfolio†
MainStay VP Natural Resources Portfolio
MainStay VP PineStone International Equity Portfolio1
MainStay VP S&P 500 Index Portfolio
MainStay VP Small Cap Growth Portfolio
MainStay VP Wellington Growth Portfolio
MainStay VP Wellington Mid Cap Portfolio
MainStay VP Wellington Small Cap Portfolio
MainStay VP Wellington U.S. Equity Portfolio
MainStay VP Winslow Large Cap Growth Portfolio
Mixed Asset
MainStay VP Balanced Portfolio
MainStay VP Income Builder Portfolio
MainStay VP Janus Henderson Balanced Portfolio
MainStay VP MacKay Convertible Portfolio
Income
MainStay VP Bond Portfolio
MainStay VP Floating Rate Portfolio
MainStay VP Indexed Bond Portfolio
MainStay VP MacKay Government Portfolio2
MainStay VP MacKay High Yield Corporate Bond Portfolio
MainStay VP MacKay Strategic Bond Portfolio
MainStay VP PIMCO Real Return Portfolio
Money Market
MainStay VP U.S. Government Money Market Portfolio
Alternative
MainStay VP CBRE Global Infrastructure Portfolio
MainStay VP IQ Hedge Multi-Strategy Portfolio
Asset Allocation
MainStay VP Conservative Allocation Portfolio
MainStay VP Equity Allocation Portfolio
MainStay VP Growth Allocation Portfolio
MainStay VP Moderate Allocation Portfolio
Manager
New York Life Investment Management LLC
New York, New York
Subadvisors
American Century Investment Management, Inc.
Kansas City, Missouri
Brown Advisory LLC
Baltimore, Maryland
Candriam*
Strassen, Luxembourg
CBRE Investment Management Listed Real Assets LLC
Radnor, Pennsylvania
Epoch Investment Partners, Inc.
New York, New York
FIAM LLC
Smithfield, Rhode Island
IndexIQ Advisors LLC*
New York, New York
Janus Henderson Investors US LLC
Denver, Colorado
MacKay Shields LLC*
New York, New York
Newton Investment Management North America, LLC
Boston, Massachusetts
NYL Investors LLC*
New York, New York
Pacific Investment Management Company LLC
Newport Beach, California
PineStone Asset Management Inc.
Montreal, Québec
Segall Bryant & Hamill, LLC
Chicago, Illinois
Wellington Management Company LLP
Boston, Massachusetts
Winslow Capital Management, LLC
Minneapolis, Minnesota
Legal Counsel
Dechert LLP
Washington, District of Columbia
Independent Registered Public Accounting Firm
PricewaterhouseCoopers LLP
New York, New York
Distributor
NYLIFE Distributors LLC*
Jersey City, New Jersey
Custodian
JPMorgan Chase Bank, N.A.
New York, New York
Some Portfolios may not be available in all products.
† Fidelity Institutional AM is a registered trade mark of FMR LLC. Used with permission.
* An affiliate of New York Life Investment Management LLC.
| 1. | Prior to August 28, 2023, the Portfolio's name was MainStay VP MacKay International Equity Portfolio. |
| 2. | Effective on or about May 1, 2024, the MainStay VP MacKay Government Portfolio will be renamed the MainStay VP U.S. Infrastructure Bond Portfolio. |
Not part of the Annual Report
2023 Annual Report
This report is for the general information of New York Life Variable Annuities and NYLIAC Variable Universal Life Insurance Products policyowners. It must be preceded or accompanied by the appropriate product(s) and funds prospectuses if it is given to anyone who is not an owner of a New York Life variable annuity policy or a NYLIAC Variable Universal Life Insurance Product. This report does not offer for sale or solicit orders to purchase securities.
The performance data quoted in this report represents past performance. Past performance is no guarantee of future results. Due to market volatility and other factors, current performance may be lower or higher than the figures shown. The most recent month-end performance summary for your variable annuity or variable life policy is available by calling 800-598-2019 and is updated periodically on newyorklife.com.
The New York Life Variable Annuities and NYLIAC Variable Universal Life Insurance Products are issued by New York Life Insurance and Annuity Corporation (a Delaware Corporation) and distributed by NYLIFE Distributors LLC (Member FINRA/SIPC).
New York Life Insurance Company
New York Life Insurance and Annuity
Corporation (NYLIAC) (A Delaware Corporation)
51 Madison Avenue, Room 551
New York, NY 10010
newyorklife.com
newyorklifeinvestments.com
NYLIFE Distributors LLC, 30 Hudson Street, Jersey City, NJ 07302
New York Life Investment Management LLC is the investment manager to the MainStay VP Funds Trust
©2024 by NYLIFE Distributors LLC. All rights reserved.
You may obtain copies of the Prospectus and the Statement of Additional Information free of charge, upon request, by calling toll-free 800-598-2019 or writing to New York Life Insurance and Annuity Corporation, 51 Madison Avenue, New York, NY 10010.
| Not FDIC Insured | No Bank Guarantee | May Lose Value |
(NYLIAC) NI519
MainStay VP Indexed Bond Portfolio
Message from the President and Annual Report
December 31, 2023
Special Notice:
Beginning in July 2024, new regulations issued by the Securities and Exchange Commission (SEC) will take effect requiring open-end mutual fund companies and ETFs to (1) overhaul the content of their shareholder reports and (2) mail paper copies of the new tailored shareholder reports to shareholders who have not opted to receive these documents electronically.
If you have not yet elected to receive your shareholder reports electronically, please contact your financial intermediary or visit our website.
| Not FDIC/NCUA Insured | Not a Deposit | May Lose Value | No Bank Guarantee | Not Insured by Any Government Agency |
This page intentionally left blank
Message from the President
Against a backdrop of easing inflationary pressures and continued economic growth, stocks and bonds generally gained ground during the 12-month period ended December 31, 2023, despite high levels of volatility and sharp disparities between the performance of the different market sectors.
Although the war in Ukraine, the outbreak of hostilities in the Middle East and several other notable events affected financial assets, inflation, interest rate, and economic growth trends stood at the forefront of market developments during most of the period. As the reporting period began, high levels of inflation already showed signs of easing in the face of aggressive rate hikes by U.S. Federal Reserve (the “Fed”). From a peak of 9.1% in June 2022, the annualized U.S. inflation rate dropped to 6.4% in January, and 3.4% in December 2023. At the same time, the Fed increased the benchmark federal funds rate from 4.25%–4.50% at the beginning of reporting period, to 5.25%–5.50% as of the end of 2023. Despite the increasing cost of capital and tighter lending environment that resulted from rising rates, economic growth remained surprisingly robust, bolstered by high levels of consumer spending, low levels of unemployment and better-than-expected corporate earnings. With the pace of rate increases slowing from the prior year, investors began hoping for an early shift to a looser monetary policy, with stock prices and bond yields reacting as economic data and statements from the Fed either reinforced or undercut those hopes. Following months of hawkish rhetoric, the Fed finally reversed its stance in December 2023, signaling a positive economic outlook with little chance of a recession and a likelihood of rate cuts in 2024.
The S&P 500® Index, a widely regarded benchmark of U.S. market performance, produced strong gains during the reporting period-– recovering all its losses from 2022 and approached new record territory. A preponderance of the Index’s gains were generated by a relatively small number of mega-cap stocks in the information technology, communication services and consumer discretionary sectors that stood to benefit from rapid developments in generative artificial intelligence (“AI”). Value-oriented, interest-rate sensitive and small-capitalization
shares lagged by significant margins, although market strength widened during the closing weeks of the reporting period. Most overseas equity markets trailed the U.S. market, as developed international economies experienced relatively low growth rates, and weak economic conditions in China undermined emerging markets.
Bonds produced generally positive returns, bolstered by attractive and relatively stable yields. The yield on the 10-year Treasury note hit a high of just under 5% in mid-October 2023, ranging between approximately 3.5% and 4.8% for most of the reporting period. The yield curve remained inverted throughout the year, with the 2-year Treasury yield modestly above the 10-year yield. Corporate bond prices trended moderately higher, generally outperforming government securities. After years of low yields and tight credit spreads, the corporate sector benefited from more attractive valuations and income opportunities. Among corporates, markets generally rewarded longer duration and lower credit quality, although an uptick in default rates posed added risks for high-yield corporate bonds. International bond markets produced mixed returns, with emerging-markets issues advancing over their developed-markets counterparts.
The market volatility of recent years reminds us of the constant need for experienced and steadfast portfolio management in the face of uncertainty. New York Life Investments remains dedicated to providing you, as a valued MainStay VP investor, with the guidance, resources and investment solutions you need to pursue your financial goals.
Thank you for trusting us to help meet your investment needs.
Sincerely,
Kirk C. Lehneis
President
The opinions expressed are as of the date of this report and are subject to change. There is no guarantee that any forecast made will come to pass. This material does not constitute investment advice and is not intended as an endorsement of any specific investment. Past performance is no guarantee of future results.
Not part of the Annual Report
Investors should refer to the Portfolio’s Summary Prospectus and/or Prospectus and consider the Portfolio’s investment objectives, strategies, risks, charges and expenses carefully before investing. The Summary Prospectus and/or Prospectus contain this and other information about the Portfolio. You may obtain copies of the Portfolio’s Summary Prospectus, Prospectus and Statement of Additional Information, which includes information about the MainStay VP Funds Trust's Trustees, free of charge, upon request, by calling toll-free 800-598-2019, by writing to New York Life Insurance and Annuity Corporation, 51 Madison Avenue, Room 251, New York, New York 10010 or by sending an email to MainStayShareholdersServices@nylim.com. These documents are also available at newyorklifeinvestments.com/investment-products/vp. Please read the Portfolio's Summary Prospectus and/or Prospectus carefully before investing. MainStay VP Funds Trust portfolios are separate account options which are purchased through a variable insurance or variable annuity contract.
Investment and Performance Comparison (Unaudited)
Performance data quoted represents past performance. Past performance is no guarantee of future results. Because of market volatility and other factors, current performance may be lower or higher than the figures shown. Investment return and principal value will fluctuate, and as a result, when shares are redeemed, they may be worth more or less than their original cost. The performance table and graph do not reflect any deduction of sales charges, mortality and expense charges, contract charges or administrative charges. Please refer to the Performance Summary appropriate for your policy. For performance information current to the most recent month-end, please call 800-598-2019 or visit www.newyorklife.com.
Performance figures may reflect certain fee waivers and/or expense limitations, without which total returns may have been different. For information on current fee waivers and/or expense limitations (if any), please refer to the Notes to Financial Statements.
| Average Annual Total Returns for the Year-Ended December 31, 2023 |
| Class | Inception
Date | One
Year | Five
Years | Since
Inception | Gross
Expense
Ratio1 |
| Initial Class Shares | 5/1/2017 | 5.25% | 0.79% | 0.70% | 0.32% |
| 1. | The gross expense ratios presented reflect the Portfolio’s “Total Annual Portfolio Operating Expenses” from the most recent Prospectus and may differ from other expense ratios disclosed in this report. |
| Benchmark Performance* | One
Year | Five
Years | Since
Inception |
| Bloomberg U.S. Aggregate Bond Index1 | 5.53% | 1.10% | 1.12% |
| Morningstar Intermediate Core Bond Category Average2 | 5.59 | 1.05 | 0.91 |
| * | Returns for indices reflect no deductions for fees, expenses or taxes, except for foreign withholding taxes where applicable. Results assume reinvestment of all dividends and capital gains. An investment cannot be made directly in an index. |
| 1. | The Bloomberg U.S. Aggregate Bond Index is the Portfolio's primary benchmark. The Bloomberg U.S. Aggregate Bond Index is a broad-based benchmark that measures performance of the investment-grade, U.S. dollar denominated, fixed-rate taxable bond market, including Treasuries, government-related and corporate securities, mortgage-backed securities (agency fixed-rate and hybrid adjustable-rate mortgage pass-throughs), asset-backed securities and commercial mortgage-backed securities. |
| 2. | The Morningstar Intermediate Core Bond Category Average is representative of funds that invest primarily in investment-grade U.S. fixed-income issues including government, corporate, and securitized debt, and hold less than 5% in below-investment-grade exposures. Their durations (a measure of interest-rate sensitivity) typically range between 75% and 125% of the three-year average of the effective duration of the Morningstar Core Bond Index. Results are based on average total returns of similar funds with all dividends and capital gain distributions reinvested. |
Cost in Dollars of a $1,000 Investment in MainStay VP Indexed Bond Portfolio (Unaudited)
The example below is intended to describe the fees and expenses borne by shareholders during the six-month period from July 1, 2023 to December 31, 2023, and the impact of those costs on your investment.
Example
As a shareholder of the Portfolio you incur two types of costs: (1) transaction costs, including exchange fees and sales charges (loads) on purchases (as applicable), and (2) ongoing costs, including management fees and other Portfolio expenses (as applicable). This example is intended to help you understand your ongoing costs (in dollars) of investing in the Portfolio and to compare these costs with the ongoing costs of investing in other mutual funds. The example is based on an investment of $1,000 made at the beginning of the six-month period and held for the entire period from July 1, 2023 to December 31, 2023. Shares are only sold in connection with variable life and annuity contracts and the example does not reflect any contract level or transactional fees or expenses. If these costs had been included, your costs would have been higher.
This example illustrates your Portfolio’s ongoing costs in two ways:
Actual Expenses
The second and third data columns in the table below provide information about actual account values and actual expenses. You may use the information in these columns, together with the amount you invested, to estimate the expenses that you paid during the six months ended
December 31, 2023. Simply divide your account value by $1,000 (for example, an $8,600 account value divided by $1,000 = 8.6), then multiply the result by the number under the heading entitled “Expenses Paid During Period” to estimate the expenses you paid on your account during this period.
Hypothetical Example for Comparison Purposes
The fourth and fifth data columns in the table below provide information about hypothetical account values and hypothetical expenses based on the Portfolio’s actual expense ratio and an assumed rate of return of 5% per year before expenses, which is not the Portfolio’s actual return. The hypothetical account values and expenses may not be used to estimate the actual ending account balances or expenses you paid for the six-month period shown. You may use this information to compare the ongoing costs of investing in the Portfolio with the ongoing costs of investing in other mutual funds. To do so, compare this 5% hypothetical example with the 5% hypothetical examples that appear in the shareholder reports of the other mutual funds.
Please note that the expenses shown in the table are meant to highlight your ongoing costs only and do not reflect any transactional costs, such as exchange fees or sales charges (loads). Therefore, the fourth and fifth data columns of the table are useful in comparing ongoing costs only and will not help you determine the relative total costs of owning different funds. In addition, if these transactional costs were included, your costs would have been higher.
| Share Class | Beginning
Account
Value
7/1/23 | Ending Account
Value (Based
on Actual
Returns and
Expenses)
12/31/23 | Expenses
Paid
During
Period1 | Ending Account
Value (Based
on Hypothetical
5% Annualized
Return and
Actual Expenses)
12/31/23 | Expenses
Paid
During
Period1 | Net Expense
Ratio
During
Period2 |
| Initial Class Shares | $1,000.00 | $1,029.80 | $1.59 | $1,023.64 | $1.58 | 0.31% |
| 1. | Expenses are equal to the Portfolio’s annualized expense ratio of each class multiplied by the average account value over the period, divided by 365 and multiplied by 184 (to reflect the six-month period). The table above represents the actual expenses incurred during the six-month period. In addition to the fees and expenses which the Portfolio bears directly, it also indirectly bears a pro rata share of the fees and expenses of the underlying funds in which it invests. Such indirect expenses are not included in the above-reported expense figures. |
| 2. | Expenses are equal to the Portfolio's annualized expense ratio to reflect the six-month period. |
| 6 | MainStay VP Indexed Bond Portfolio |
Portfolio Composition as of December 31, 2023 (Unaudited)
See Portfolio of Investments beginning on page 9 for specific holdings within these categories. The Portfolio's holdings are subject to change.
Top Ten Holdings and/or Issuers Held as of December 31, 2023 (excluding short-term investments) (Unaudited)
| 1. | U.S. Treasury Notes, 0.125%-5.00%, due 1/15/24–2/15/33 |
| 2. | UMBS, 30 Year, 2.00%-5.50%, due 6/1/36–2/1/53 |
| 3. | GNMA II, Single Family, 30 Year, 2.00%-5.00%, due 11/20/42–9/20/51 |
| 4. | U.S. Treasury Bonds, 2.75%-4.75%, due 2/15/47–11/15/53 |
| 5. | UMBS Pool, 30 Year, 2.00%-4.50%, due 1/1/49–7/1/52 |
| 6. | UMBS, 15 Year, 1.50%-4.00%, due 5/1/24–9/1/36 |
| 7. | FHLMC Gold Pools, 30 Year, 3.00%-5.50%, due 7/1/38–1/1/49 |
| 8. | Bank of America Corp., 2.972%-5.08%, due 1/20/27–7/21/52 |
| 9. | Mexico Government Bond, 4.125%-4.875%, due 1/21/26–5/19/33 |
| 10. | iShares iBoxx $ Investment Grade Corporate Bond ETF |
Portfolio Management Discussion and Analysis (Unaudited)
Answers to the questions reflect the views of portfolio managers Kenneth Sommer and Matthew Downs, of NYL Investors LLC, the Portfolio’s Subadvisor.
How did MainStay VP Indexed Bond Portfolio perform relative to its benchmark and peers during the 12 months ended December 31, 2023?
For the 12 months ended December 31, 2023, MainStay VP Indexed Bond Portfolio returned 5.25% for Initial Class shares. Over the same period, Initial Class shares underperformed the 5.53% return of the Bloomberg U.S. Aggregate Bond Index (the "Index"), which is the Portfolio’s benchmark. Although the Portfolio seeks investment results that correspond to the total return performance of fixed-income securities in the aggregate, as represented by the Portfolio’s benchmark, the Portfolio’s performance will typically lag that of the Index because the Portfolio incurs fees and expenses that the Index does not. For the 12 months ended December 31, 2023, Initial Class shares also underperformed the 5.59% return of the Morningstar Intermediate Core Bond Category Average.1
Were there any changes to the Fund during the reporting period?
Effective on or about June 30, 2023, AJ Rzad no longer served as a portfolio manager for the Portfolio. See the Supplement dated March 3, 2023, for additional information.
During the reporting period, how was the Portfolio’s performance materially affected by investments in derivatives?
U.S. Treasury futures were used to maintain a duration2 equal to that of the Index and did not materially affect the performance of the Portfolio. Treasury futures were also used to reduce variations between the Portfolio and the Index. These trades reduced tracking error for the Portfolio and the Index.
During the reporting period, which credit-rating categories were strong performers and which credit rating categories were weak?
All the investment-grade rating categories produced positive excess returns during the reporting period, outperforming matched duration Treasury securities. Credits rated BBB
generated the most positive excess return, followed by credits rated A.3 Credits rated AA outperformed credits rated AAA.4
What was the Portfolio’s duration strategy during the reporting period?
The Portfolio employs a passive strategy that attempts to replicate the duration of the Index. The Portfolio’s duration strategy had a neutral impact on performance during the reporting period. As of December 31, 2023, the Portfolio’s duration was approximately 6.12 years, compared to a duration of 6.11 years for the Index.
Which market segments made the strongest contributions to the Portfolio’s performance, and which market segments detracted the most?
During the reporting period, all broad sectors in the Index produced positive total returns. The corporate sector made the strongest positive contribution to performance. (Contributions take weightings and total returns into account.) Within the corporate sector, the industrials and financials subsectors were the best performers. The U.S. Treasury sector produced the second-highest contribution to performance, followed by the mortgage-backed securities sector. The commercial mortgage-backed security and U.S. government agency sectors contributed the least to the Portfolio’s total return during the reporting period.
Were there any significant changes to the Portfolio’s benchmark during the reporting period?
There were no changes to the Index material enough to lead us to change the Portfolio’s investment strategy.
| 1. | See "Investment and Performance Comparison" for more information on benchmark and peer group returns. |
| 2. | Duration is a measure of the price sensitivity of a fixed-income investment to changes in interest rates. Duration is expressed as a number of years and is considered a more accurate sensitivity gauge than average maturity. |
| 3. | An obligation rated ‘A’ by Standard & Poor's ("S&P") is deemed by S&P to be somewhat more susceptible to the adverse effects of changes in circumstances and economic conditions than obligations in higher-rated categories. In the opinion of S&P, however, the obligor's capacity to meet its financial commitment on the obligation is still strong. An obligation rated ‘BBB’ by S&P is deemed by S&P to exhibit adequate protection parameters. In the opinion of S&P, however, adverse economic conditions or changing circumstances are more likely to lead to a weakened capacity of the obligor to meet its financial commitment on the obligation. When applied to Fund holdings, ratings are based solely on the creditworthiness of the bonds in the portfolio and are not meant to represent the security or safety of the Fund. |
| 4. | An obligation rated ‘AAA’ has the highest rating assigned by S&P, and in the opinion of S&P, the obligor’s capacity to meet its financial commitment on the obligation is extremely strong. An obligation rated ‘AA’ by S&P is deemed by S&P to differ from the highest-rated obligations only to a small degree. In the opinion of S&P, the obligor's capacity to meet its financial commitment on the obligation is very strong. When applied to Portfolio holdings, ratings are based solely on the creditworthiness of the bonds in the Portfolio and are not meant to represent the security or safety of the Portfolio. |
The opinions expressed are those of the portfolio managers as of the date of this report and are subject to change. There is no guarantee that any forecasts will come to pass. This material does not constitute investment advice and is not intended as an endorsement of any specific investment.
Not all MainStay VP Portfolios and/or share classes are available under all policies.
| 8 | MainStay VP Indexed Bond Portfolio |
Portfolio of Investments December 31, 2023†^
| | Principal
Amount | Value |
| Long-Term Bonds 97.1% |
| Corporate Bonds 23.3% |
| Aerospace & Defense 0.6% |
| Boeing Co. (The) | | |
| 3.25%, due 3/1/28 | $ 585,000 | $ 549,304 |
| 5.15%, due 5/1/30 | 250,000 | 254,503 |
| Lockheed Martin Corp. | | |
| 4.30%, due 6/15/62 | 135,000 | 120,967 |
| Northrop Grumman Systems Corp. | | |
| 7.75%, due 2/15/31 | 275,000 | 319,284 |
| RTX Corp. | | |
| 3.125%, due 7/1/50 | 105,000 | 73,944 |
| 3.50%, due 3/15/27 | 275,000 | 264,978 |
| | | 1,582,980 |
| Apparel 0.0% ‡ |
| NIKE, Inc. | | |
| 3.625%, due 5/1/43 | 95,000 | 81,797 |
| Auto Manufacturers 0.2% |
| General Motors Co. | | |
| 5.40%, due 4/1/48 | 81,000 | 74,005 |
| General Motors Financial Co., Inc. | | |
| 2.40%, due 10/15/28 | 250,000 | 221,936 |
| 3.10%, due 1/12/32 | 167,000 | 142,178 |
| 4.35%, due 1/17/27 | 130,000 | 127,395 |
| | | 565,514 |
| Banks 5.8% |
| Bank of America Corp. | | |
| 2.972%, due 7/21/52 (a) | 525,000 | 370,071 |
| 3.846% (5 Year Treasury Constant Maturity Rate + 2.00%), due 3/8/37 (b) | 230,000 | 201,941 |
| 5.08%, due 1/20/27 (a) | 3,040,000 | 3,033,304 |
| Barclays plc | | |
| 5.25%, due 8/17/45 | 270,000 | 264,192 |
| Citigroup, Inc. | | |
| 2.561%, due 5/1/32 (a) | 260,000 | 216,925 |
| 4.45%, due 9/29/27 | 1,085,000 | 1,060,055 |
| 4.65%, due 7/30/45 | 180,000 | 163,480 |
| Cooperatieve Rabobank UA | | |
| 5.25%, due 5/24/41 | 215,000 | 226,852 |
| Fifth Third Bancorp | | |
| 4.337%, due 4/25/33 (a) | 200,000 | 185,958 |
| Goldman Sachs Group, Inc. (The) | | |
| 2.64%, due 2/24/28 (a) | 715,000 | 662,812 |
| 4.80%, due 7/8/44 | 420,000 | 396,743 |
| | Principal
Amount | Value |
| |
| Banks (continued) |
| HSBC Holdings plc (a) | | |
| 7.336%, due 11/3/26 | $ 575,000 | $ 596,883 |
| 7.39%, due 11/3/28 | 305,000 | 326,819 |
| JPMorgan Chase & Co. (a) | | |
| 1.578%, due 4/22/27 | 870,000 | 802,857 |
| 4.26%, due 2/22/48 | 605,000 | 534,437 |
| 4.912%, due 7/25/33 | 305,000 | 301,563 |
| Lloyds Banking Group plc | | |
| 3.75%, due 1/11/27 | 1,265,000 | 1,213,976 |
| Morgan Stanley | | |
| 5.05%, due 1/28/27 (a) | 75,000 | 75,072 |
| 5.948% (5 Year Treasury Constant Maturity Rate + 2.43%), due 1/19/38 (b) | 55,000 | 55,621 |
| 6.296%, due 10/18/28 (a) | 1,270,000 | 1,330,374 |
| 6.342%, due 10/18/33 (a) | 375,000 | 404,362 |
| State Street Corp. | | |
| 5.82%, due 11/4/28 (a) | 810,000 | 840,471 |
| UBS Group AG | | |
| 2.593%, due 9/11/25 (a)(c) | 500,000 | 489,142 |
| Wells Fargo & Co. | | |
| 3.00%, due 4/22/26 | 525,000 | 502,893 |
| 4.75%, due 12/7/46 | 605,000 | 532,826 |
| | | 14,789,629 |
| Beverages 0.4% |
| Anheuser-Busch InBev Worldwide, Inc. | | |
| 5.55%, due 1/23/49 | 525,000 | 564,171 |
| Coca-Cola Co. (The) | | |
| 2.60%, due 6/1/50 | 260,000 | 179,595 |
| Constellation Brands, Inc. | | |
| 3.60%, due 2/15/28 | 130,000 | 124,731 |
| Keurig Dr Pepper, Inc. | | |
| 4.985%, due 5/25/38 | 95,000 | 88,794 |
| Molson Coors Beverage Co. | | |
| 4.20%, due 7/15/46 | 95,000 | 80,951 |
| PepsiCo, Inc. | | |
| 3.625%, due 3/19/50 | 30,000 | 25,161 |
| | | 1,063,403 |
| Biotechnology 0.1% |
| Amgen, Inc. | | |
| 3.375%, due 2/21/50 | 205,000 | 152,608 |
| Gilead Sciences, Inc. | | |
| 4.60%, due 9/1/35 | 215,000 | 212,661 |
| | | 365,269 |
The notes to the financial statements are an integral part of, and should be read in conjunction with, the financial statements.
9
Portfolio of Investments December 31, 2023†^ (continued)
| | Principal
Amount | Value |
| Corporate Bonds (continued) |
| Building Materials 0.0% ‡ |
| Johnson Controls International plc | | |
| 6.00%, due 1/15/36 | $ 80,000 | $ 85,400 |
| Chemicals 0.9% |
| Dow Chemical Co. (The) | | |
| 2.10%, due 11/15/30 | 145,000 | 124,082 |
| 3.60%, due 11/15/50 | 65,000 | 50,206 |
| DuPont de Nemours, Inc. | | |
| 4.493%, due 11/15/25 | 470,000 | 466,538 |
| Ecolab, Inc. | | |
| 2.70%, due 11/1/26 | 275,000 | 263,169 |
| LYB International Finance II BV | | |
| 3.50%, due 3/2/27 | 275,000 | 263,781 |
| LYB International Finance III LLC | | |
| 3.625%, due 4/1/51 | 50,000 | 36,381 |
| Mosaic Co. (The) | | |
| 4.05%, due 11/15/27 | 505,000 | 492,438 |
| Nutrien Ltd. | | |
| 5.875%, due 12/1/36 | 275,000 | 286,336 |
| Sherwin-Williams Co. (The) | | |
| 3.95%, due 1/15/26 | 320,000 | 313,744 |
| | | 2,296,675 |
| Commercial Services 0.0% ‡ |
| PayPal Holdings, Inc. | | |
| 5.05%, due 6/1/52 | 95,000 | 95,741 |
| Computers 0.7% |
| Apple, Inc. | | |
| 4.50%, due 2/23/36 | 660,000 | 674,593 |
| Dell International LLC | | |
| 3.45%, due 12/15/51 | 95,000 | 68,662 |
| 5.25%, due 2/1/28 | 310,000 | 317,709 |
| 5.75%, due 2/1/33 | 180,000 | 189,630 |
| HP, Inc. | | |
| 6.00%, due 9/15/41 | 40,000 | 42,135 |
| International Business Machines Corp. | | |
| 3.50%, due 5/15/29 | 465,000 | 443,350 |
| | | 1,736,079 |
| Cosmetics & Personal Care 0.1% |
| Procter & Gamble Co. (The) | | |
| 2.70%, due 2/2/26 | 275,000 | 265,671 |
| Unilever Capital Corp. | | |
| 3.10%, due 7/30/25 | 100,000 | 97,790 |
| | | 363,461 |
| | Principal
Amount | Value |
| |
| Diversified Financial Services 0.3% |
| AerCap Ireland Capital DAC | | |
| 3.85%, due 10/29/41 | $ 150,000 | $ 120,808 |
| Capital One Financial Corp. | | |
| 5.268%, due 5/10/33 (a) | 155,000 | 152,091 |
| Nomura Holdings, Inc. | | |
| 2.999%, due 1/22/32 | 200,000 | 168,603 |
| Visa, Inc. | | |
| 4.30%, due 12/14/45 | 210,000 | 195,653 |
| | | 637,155 |
| Electric 1.9% |
| AEP Texas, Inc. | | |
| 5.25%, due 5/15/52 | 95,000 | 91,753 |
| CenterPoint Energy Houston Electric LLC | | |
| Series AC | | |
| 4.25%, due 2/1/49 | 315,000 | 277,493 |
| Commonwealth Edison Co. | | |
| 3.65%, due 6/15/46 | 195,000 | 153,811 |
| Consolidated Edison Co. of New York, Inc. | | |
| Series 06-A | | |
| 5.85%, due 3/15/36 | 410,000 | 432,643 |
| DTE Electric Co. | | |
| 3.375%, due 3/1/25 | 215,000 | 211,198 |
| Duke Energy Carolinas LLC | | |
| 3.875%, due 3/15/46 | 365,000 | 295,572 |
| Duke Energy Corp. | | |
| 4.50%, due 8/15/32 | 95,000 | 91,955 |
| 5.00%, due 8/15/52 | 95,000 | 88,680 |
| Entergy Louisiana LLC | | |
| 4.20%, due 4/1/50 | 365,000 | 308,223 |
| Florida Power & Light Co. | | |
| 3.80%, due 12/15/42 | 175,000 | 151,144 |
| MidAmerican Energy Co. | | |
| 3.95%, due 8/1/47 | 400,000 | 334,284 |
| Ohio Power Co. | | |
| Series G | | |
| 6.60%, due 2/15/33 | 200,000 | 219,528 |
| PPL Electric Utilities Corp. | | |
| 3.95%, due 6/1/47 | 130,000 | 109,868 |
| Public Service Electric and Gas Co. | | |
| 2.70%, due 5/1/50 | 235,000 | 160,876 |
| Sempra | | |
| 3.80%, due 2/1/38 | 275,000 | 234,820 |
| Southern California Edison Co. | | |
| Series C | | |
| 4.125%, due 3/1/48 | 275,000 | 230,837 |
| Southern Co. (The) | | |
| 4.40%, due 7/1/46 | 350,000 | 308,151 |
The notes to the financial statements are an integral part of, and should be read in conjunction with, the financial statements.
| 10 | MainStay VP Indexed Bond Portfolio |
| | Principal
Amount | Value |
| Corporate Bonds (continued) |
| Electric (continued) |
| Virginia Electric and Power Co. | | |
| 4.00%, due 1/15/43 | $ 410,000 | $ 349,699 |
| Xcel Energy, Inc. | | |
| 3.30%, due 6/1/25 | 885,000 | 863,259 |
| | | 4,913,794 |
| Entertainment 0.1% |
| Warnermedia Holdings, Inc. | | |
| 5.141%, due 3/15/52 | 218,000 | 187,122 |
| Environmental Control 0.2% |
| Republic Services, Inc. | | |
| 3.20%, due 3/15/25 | 320,000 | 312,517 |
| Waste Management, Inc. | | |
| 3.15%, due 11/15/27 | 320,000 | 306,315 |
| | | 618,832 |
| Food 0.4% |
| General Mills, Inc. | | |
| 4.20%, due 4/17/28 | 95,000 | 93,685 |
| Kraft Heinz Foods Co. | | |
| 4.375%, due 6/1/46 | 230,000 | 200,741 |
| Kroger Co. (The) | | |
| 2.20%, due 5/1/30 | 230,000 | 196,831 |
| Sysco Corp. | | |
| 3.25%, due 7/15/27 | 320,000 | 305,874 |
| Tyson Foods, Inc. | | |
| 5.10%, due 9/28/48 | 155,000 | 140,563 |
| | | 937,694 |
| Forest Products & Paper 0.2% |
| Suzano International Finance BV | | |
| 5.50%, due 1/17/27 | 505,000 | 511,330 |
| Gas 0.1% |
| NiSource, Inc. | | |
| 3.49%, due 5/15/27 | 275,000 | 264,756 |
| Healthcare-Products 0.4% |
| Abbott Laboratories | | |
| 3.75%, due 11/30/26 | 185,000 | 182,270 |
| 4.90%, due 11/30/46 | 290,000 | 296,318 |
| Boston Scientific Corp. | | |
| 4.70%, due 3/1/49 | 80,000 | 76,878 |
| Medtronic, Inc. | | |
| 4.625%, due 3/15/45 | 209,000 | 203,080 |
| | Principal
Amount | Value |
| |
| Healthcare-Products (continued) |
| Stryker Corp. | | |
| 3.65%, due 3/7/28 | $ 275,000 | $ 265,965 |
| | | 1,024,511 |
| Healthcare-Services 0.6% |
| Aetna, Inc. | | |
| 6.625%, due 6/15/36 | 275,000 | 307,877 |
| Elevance Health, Inc. | | |
| 4.375%, due 12/1/47 | 320,000 | 285,044 |
| HCA, Inc. | | |
| 3.625%, due 3/15/32 | 85,000 | 76,005 |
| 4.625%, due 3/15/52 | 170,000 | 144,570 |
| Laboratory Corp. of America Holdings | | |
| 3.60%, due 2/1/25 | 320,000 | 314,520 |
| UnitedHealth Group, Inc. | | |
| 4.25%, due 4/15/47 | 315,000 | 280,957 |
| | | 1,408,973 |
| Home Builders 0.1% |
| PulteGroup, Inc. | | |
| 5.50%, due 3/1/26 | 220,000 | 222,135 |
| Household Products & Wares 0.2% |
| Clorox Co. (The) | | |
| 3.90%, due 5/15/28 | 275,000 | 266,230 |
| Kimberly-Clark Corp. | | |
| 2.75%, due 2/15/26 | 275,000 | 265,753 |
| | | 531,983 |
| Insurance 0.8% |
| Allstate Corp. (The) | | |
| 5.35%, due 6/1/33 | 275,000 | 282,419 |
| American International Group, Inc. | | |
| 6.25%, due 5/1/36 | 350,000 | 371,588 |
| Berkshire Hathaway Finance Corp. | | |
| 4.30%, due 5/15/43 | 425,000 | 397,679 |
| MetLife, Inc. | | |
| 3.60%, due 11/13/25 | 815,000 | 800,178 |
| Prudential Financial, Inc. | | |
| 3.70%, due 3/13/51 | 135,000 | 106,629 |
| 3.935%, due 12/7/49 | 155,000 | 127,507 |
| | | 2,086,000 |
| Internet 0.3% |
| Alibaba Group Holding Ltd. | | |
| 2.70%, due 2/9/41 | 200,000 | 136,771 |
| Amazon.com, Inc. | | |
| 3.875%, due 8/22/37 | 535,000 | 496,445 |
| | | 633,216 |
The notes to the financial statements are an integral part of, and should be read in conjunction with, the financial statements.
11
Portfolio of Investments December 31, 2023†^ (continued)
| | Principal
Amount | Value |
| Corporate Bonds (continued) |
| Machinery—Construction & Mining 0.1% |
| Caterpillar, Inc. | | |
| 5.30%, due 9/15/35 | $ 325,000 | $ 350,803 |
| Machinery-Diversified 0.1% |
| Deere & Co. | | |
| 3.90%, due 6/9/42 | 180,000 | 161,697 |
| Media 0.8% |
| Charter Communications Operating LLC | | |
| 4.908%, due 7/23/25 | 445,000 | 440,770 |
| 5.75%, due 4/1/48 | 420,000 | 372,741 |
| Comcast Corp. | | |
| 3.40%, due 7/15/46 | 795,000 | 615,809 |
| Discovery Communications LLC | | |
| 3.95%, due 3/20/28 | 121,000 | 115,091 |
| Fox Corp. | | |
| 5.576%, due 1/25/49 | 86,000 | 82,938 |
| Paramount Global | | |
| 4.95%, due 1/15/31 | 352,000 | 333,810 |
| Walt Disney Co. (The) | | |
| 3.60%, due 1/13/51 | 204,000 | 163,972 |
| | | 2,125,131 |
| Mining 0.1% |
| Barrick North America Finance LLC | | |
| 5.70%, due 5/30/41 | 130,000 | 137,036 |
| Newmont Corp. | | |
| 2.25%, due 10/1/30 | 125,000 | 107,888 |
| 2.60%, due 7/15/32 | 105,000 | 89,754 |
| | | 334,678 |
| Miscellaneous—Manufacturing 0.2% |
| 3M Co. | | |
| 4.00%, due 9/14/48 | 135,000 | 115,345 |
| Eaton Corp. | | |
| 4.00%, due 11/2/32 | 275,000 | 265,988 |
| General Electric Co. | | |
| 4.125%, due 10/9/42 | 99,000 | 83,152 |
| Parker-Hannifin Corp. | | |
| 4.20%, due 11/21/34 | 95,000 | 91,102 |
| | | 555,587 |
| Oil & Gas 0.7% |
| BP Capital Markets America, Inc. | | |
| 3.001%, due 3/17/52 | 115,000 | 80,672 |
| 3.588%, due 4/14/27 | 315,000 | 305,391 |
| | Principal
Amount | Value |
| |
| Oil & Gas (continued) |
| Canadian Natural Resources Ltd. | | |
| 6.25%, due 3/15/38 | $ 130,000 | $ 136,007 |
| ConocoPhillips Co. | | |
| 5.95%, due 3/15/46 | 200,000 | 216,516 |
| EOG Resources, Inc. | | |
| 3.90%, due 4/1/35 | 215,000 | 197,821 |
| Exxon Mobil Corp. | | |
| 4.114%, due 3/1/46 | 215,000 | 191,631 |
| Hess Corp. | | |
| 7.125%, due 3/15/33 | 130,000 | 150,254 |
| Phillips 66 Co. | | |
| 4.68%, due 2/15/45 | 260,000 | 235,104 |
| Shell International Finance BV | | |
| 3.75%, due 9/12/46 | 325,000 | 270,054 |
| | | 1,783,450 |
| Oil & Gas Services 0.0% ‡ |
| Halliburton Co. | | |
| 3.80%, due 11/15/25 | 12,000 | 11,759 |
| Pharmaceuticals 1.2% |
| AbbVie, Inc. | | |
| 3.80%, due 3/15/25 | 185,000 | 182,475 |
| 4.70%, due 5/14/45 | 345,000 | 328,295 |
| Allergan Funding SCS | | |
| 3.80%, due 3/15/25 | 50,000 | 48,636 |
| 4.75%, due 3/15/45 | 25,000 | 18,657 |
| AstraZeneca plc | | |
| 6.45%, due 9/15/37 | 250,000 | 292,171 |
| Bristol-Myers Squibb Co. | | |
| 3.70%, due 3/15/52 | 75,000 | 58,937 |
| Cigna Group (The) | | |
| 4.90%, due 12/15/48 | 185,000 | 175,887 |
| CVS Health Corp. | | |
| 3.75%, due 4/1/30 | 50,000 | 47,035 |
| 5.05%, due 3/25/48 | 340,000 | 318,005 |
| Eli Lilly & Co. | | |
| 3.95%, due 3/15/49 | 155,000 | 137,650 |
| GlaxoSmithKline Capital, Inc. | | |
| 3.875%, due 5/15/28 | 320,000 | 315,496 |
| Johnson & Johnson | | |
| 4.95%, due 5/15/33 | 315,000 | 340,077 |
| Merck & Co., Inc. | | |
| 5.00%, due 5/17/53 | 220,000 | 226,206 |
| Mylan, Inc. | | |
| 5.20%, due 4/15/48 | 95,000 | 78,496 |
The notes to the financial statements are an integral part of, and should be read in conjunction with, the financial statements.
| 12 | MainStay VP Indexed Bond Portfolio |
| | Principal
Amount | Value |
| Corporate Bonds (continued) |
| Pharmaceuticals (continued) |
| Pfizer, Inc. | | |
| 4.00%, due 12/15/36 | $ 395,000 | $ 372,800 |
| | | 2,940,823 |
| Pipelines 1.0% |
| Enbridge, Inc. | | |
| 4.50%, due 6/10/44 | 275,000 | 234,772 |
| Energy Transfer LP | | |
| 5.00%, due 5/15/50 | 200,000 | 178,314 |
| Enterprise Products Operating LLC | | |
| 3.70%, due 2/15/26 | 500,000 | 492,343 |
| 4.80%, due 2/1/49 | 260,000 | 245,934 |
| Kinder Morgan, Inc. | | |
| 4.30%, due 6/1/25 | 590,000 | 582,511 |
| 4.80%, due 2/1/33 | 240,000 | 230,970 |
| 5.45%, due 8/1/52 | 115,000 | 109,989 |
| MPLX LP | | |
| 4.95%, due 3/14/52 | 145,000 | 128,984 |
| ONEOK, Inc. | | |
| 5.20%, due 7/15/48 | 85,000 | 79,654 |
| TransCanada PipeLines Ltd. | | |
| 4.875%, due 1/15/26 | 10,000 | 9,972 |
| 4.875%, due 5/15/48 | 150,000 | 137,420 |
| Williams Cos., Inc. (The) | | |
| 3.50%, due 10/15/51 | 65,000 | 47,443 |
| | | 2,478,306 |
| Real Estate Investment Trusts 0.4% |
| American Tower Corp. | | |
| 2.30%, due 9/15/31 | 145,000 | 119,890 |
| AvalonBay Communities, Inc. | | |
| 2.90%, due 10/15/26 | 215,000 | 204,673 |
| Crown Castle, Inc. | | |
| 3.25%, due 1/15/51 | 95,000 | 66,381 |
| ERP Operating LP | | |
| 3.25%, due 8/1/27 | 275,000 | 261,229 |
| Realty Income Corp. | | |
| 4.65%, due 3/15/47 | 155,000 | 144,319 |
| Simon Property Group LP | | |
| 4.25%, due 11/30/46 | 260,000 | 218,578 |
| | | 1,015,070 |
| Retail 0.5% |
| Home Depot, Inc. (The) | | |
| 2.375%, due 3/15/51 | 365,000 | 230,464 |
| Lowe's Cos., Inc. | | |
| 4.05%, due 5/3/47 | 185,000 | 152,220 |
| | Principal
Amount | Value |
| |
| Retail (continued) |
| McDonald's Corp. | | |
| 4.20%, due 4/1/50 | $ 85,000 | $ 75,176 |
| Starbucks Corp. | | |
| 3.00%, due 2/14/32 | 260,000 | 233,261 |
| Target Corp. | | |
| 2.35%, due 2/15/30 | 185,000 | 165,064 |
| Walmart, Inc. | | |
| 4.30%, due 4/22/44 | 340,000 | 322,403 |
| | | 1,178,588 |
| Semiconductors 0.8% |
| Applied Materials, Inc. | | |
| 5.10%, due 10/1/35 | 275,000 | 288,615 |
| Broadcom, Inc. | | |
| 4.926%, due 5/15/37 (c) | 410,000 | 396,769 |
| Intel Corp. | | |
| 2.00%, due 8/12/31 | 338,000 | 285,432 |
| 4.75%, due 3/25/50 | 112,000 | 105,816 |
| KLA Corp. | | |
| 4.95%, due 7/15/52 | 105,000 | 106,076 |
| NVIDIA Corp. | | |
| 1.55%, due 6/15/28 | 460,000 | 411,880 |
| 2.00%, due 6/15/31 | 220,000 | 188,567 |
| NXP BV | | |
| 5.00%, due 1/15/33 | 75,000 | 75,116 |
| QUALCOMM, Inc. | | |
| 4.65%, due 5/20/35 | 115,000 | 117,626 |
| | | 1,975,897 |
| Software 1.2% |
| Fidelity National Information Services, Inc. | | |
| 5.625%, due 7/15/52 | 75,000 | 76,122 |
| Fiserv, Inc. | | |
| 4.40%, due 7/1/49 | 105,000 | 92,548 |
| Microsoft Corp. | | |
| 2.921%, due 3/17/52 | 290,000 | 214,030 |
| 3.30%, due 2/6/27 | 240,000 | 233,742 |
| Oracle Corp. | | |
| 2.95%, due 5/15/25 | 2,100,000 | 2,038,201 |
| 4.00%, due 7/15/46 | 70,000 | 56,108 |
| 5.375%, due 7/15/40 | 210,000 | 206,338 |
| Salesforce, Inc. | | |
| 3.05%, due 7/15/61 | 65,000 | 45,600 |
| | | 2,962,689 |
| Telecommunications 1.0% |
| AT&T, Inc. | | |
| 2.55%, due 12/1/33 | 507,000 | 413,216 |
| 3.50%, due 9/15/53 | 217,000 | 157,478 |
The notes to the financial statements are an integral part of, and should be read in conjunction with, the financial statements.
13
Portfolio of Investments December 31, 2023†^ (continued)
| | Principal
Amount | Value |
| Corporate Bonds (continued) |
| Telecommunications (continued) |
| AT&T, Inc. (continued) | | |
| 3.55%, due 9/15/55 | $ 261,000 | $ 187,653 |
| Corning, Inc. | | |
| 5.45%, due 11/15/79 | 30,000 | 28,955 |
| Deutsche Telekom International Finance BV | | |
| 8.75%, due 6/15/30 (d) | 275,000 | 331,199 |
| Telefonica Emisiones SA | | |
| 4.895%, due 3/6/48 | 150,000 | 132,209 |
| T-Mobile USA, Inc. | | |
| 3.40%, due 10/15/52 | 113,000 | 82,303 |
| 3.875%, due 4/15/30 | 430,000 | 407,770 |
| Verizon Communications, Inc. | | |
| 2.355%, due 3/15/32 | 128,000 | 106,467 |
| 3.00%, due 11/20/60 | 104,000 | 68,174 |
| 5.50%, due 3/16/47 | 470,000 | 489,911 |
| Vodafone Group plc | | |
| 4.25%, due 9/17/50 | 190,000 | 157,599 |
| | | 2,562,934 |
| Transportation 0.8% |
| Burlington Northern Santa Fe LLC | | |
| 3.25%, due 6/15/27 | 751,000 | 723,849 |
| Canadian National Railway Co. | | |
| 6.25%, due 8/1/34 | 275,000 | 309,676 |
| CSX Corp. | | |
| 3.35%, due 9/15/49 | 155,000 | 117,161 |
| FedEx Corp. | | |
| 2.40%, due 5/15/31 | 75,000 | 64,554 |
| 5.25%, due 5/15/50 | 75,000 | 74,646 |
| Norfolk Southern Corp. | | |
| 3.942%, due 11/1/47 | 156,000 | 130,129 |
| Union Pacific Corp. | | |
| 2.80%, due 2/14/32 | 180,000 | 159,689 |
| 3.50%, due 2/14/53 | 75,000 | 59,397 |
| 3.85%, due 2/14/72 | 40,000 | 31,767 |
| United Parcel Service, Inc. | | |
| 3.40%, due 11/15/46 | 505,000 | 402,407 |
| | | 2,073,275 |
Total Corporate Bonds
(Cost $66,525,708) | | 59,514,136 |
| Foreign Government Bonds 3.0% |
| Canada 0.8% |
| Province of Ontario Canada | | |
| 2.50%, due 4/27/26 | 1,205,000 | 1,155,626 |
| | Principal
Amount | Value |
| |
| Canada (continued) |
| Province of Quebec Canada | | |
| 2.50%, due 4/20/26 | $ 820,000 | $ 786,955 |
| | | 1,942,581 |
| Japan 0.2% |
| Japan Bank for International Cooperation | | |
| 2.875%, due 6/1/27 | 576,000 | 548,494 |
| Mexico 1.1% |
| Mexico Government Bond | | |
| 4.125%, due 1/21/26 | 2,585,000 | 2,562,739 |
| 4.875%, due 5/19/33 | 360,000 | 346,931 |
| | | 2,909,670 |
| Norway 0.2% |
| Equinor ASA | | |
| 5.10%, due 8/17/40 | 405,000 | 415,073 |
| Panama 0.3% |
| Panama Government Bond | | |
| 3.75%, due 3/16/25 | 750,000 | 728,582 |
| Philippines 0.2% |
| Philippines Government Bond | | |
| 5.00%, due 1/13/37 | 600,000 | 615,000 |
| Supranational 0.2% |
| European Investment Bank | | |
| 2.375%, due 5/24/27 | 545,000 | 515,871 |
Total Foreign Government Bonds
(Cost $8,175,997) | | 7,675,271 |
| Mortgage-Backed Securities 1.6% |
| Commercial Mortgage Loans (Collateralized Mortgage Obligations) 1.6% |
| CFCRE Commercial Mortgage Trust | |
| Series 2016-C6, Class A3 | | |
| 3.217%, due 11/10/49 (e) | 300,000 | 282,166 |
| Series 2017-C8, Class A3 | | |
| 3.305%, due 6/15/50 | 163,342 | 153,284 |
| Citigroup Commercial Mortgage Trust | |
| Series 2017-P8, Class A4 | | |
| 3.465%, due 9/15/50 | 300,000 | 281,520 |
| Series 2015-GC35, Class A4 | | |
| 3.818%, due 11/10/48 | 300,000 | 288,874 |
The notes to the financial statements are an integral part of, and should be read in conjunction with, the financial statements.
| 14 | MainStay VP Indexed Bond Portfolio |
| | Principal
Amount | Value |
| Mortgage-Backed Securities (continued) |
| Commercial Mortgage Loans (Collateralized Mortgage Obligations) (continued) |
| CSAIL Commercial Mortgage Trust | |
| Series 2017-CX9, Class A5 | | |
| 3.446%, due 9/15/50 | $ 300,000 | $ 275,657 |
| FHLMC, Multifamily Structured Pass-Through Certificates | |
| REMIC, Series K094, Class A2 | | |
| 2.903%, due 6/25/29 | 2,000,000 | 1,860,548 |
| GS Mortgage Securities Trust | |
| Series 2016-GS3, Class A4 | | |
| 2.85%, due 10/10/49 | 300,000 | 280,612 |
| Series 2014-GC22, Class A5 | | |
| 3.862%, due 6/10/47 | 300,000 | 296,351 |
| Wells Fargo Commercial Mortgage Trust | |
| Series 2015-SG1, Class A4 | | |
| 3.789%, due 9/15/48 | 291,173 | 282,117 |
Total Mortgage-Backed Securities
(Cost $4,466,682) | | 4,001,129 |
| U.S. Government & Federal Agencies 69.2% |
| Federal Home Loan Mortgage Corporation (Mortgage Pass-Through Securities) 7.4% |
| FFCB | | |
| 0.68%, due 1/13/27 | 1,125,000 | 1,012,509 |
| 5.30%, due 10/19/26 | 1,500,000 | 1,499,648 |
| FHLMC | | |
| 5.40%, due 2/24/26 | 700,000 | 698,193 |
| FHLMC Gold Pools, 15 Year | | |
| 2.50%, due 10/1/31 | 30,067 | 27,906 |
| 2.50%, due 2/1/32 | 123,257 | 115,971 |
| 2.50%, due 2/1/33 | 116,017 | 109,262 |
| 2.50%, due 4/1/33 | 172,372 | 160,636 |
| 2.50%, due 6/1/33 | 24,396 | 22,734 |
| 2.50%, due 7/1/33 | 51,082 | 48,108 |
| 3.00%, due 9/1/27 | 45,777 | 44,483 |
| 3.00%, due 4/1/32 | 73,089 | 69,867 |
| 3.00%, due 6/1/32 | 19,292 | 18,432 |
| 3.00%, due 9/1/32 | 9,320 | 8,926 |
| 3.00%, due 10/1/32 | 41,236 | 39,450 |
| 3.00%, due 5/1/33 | 50,630 | 48,275 |
| 3.00%, due 9/1/33 | 38,890 | 37,080 |
| 3.50%, due 12/1/25 | 7,179 | 7,063 |
| 3.50%, due 5/1/33 | 42,814 | 42,196 |
| 3.50%, due 9/1/33 | 12,203 | 11,996 |
| FHLMC Gold Pools, 20 Year | | |
| 3.00%, due 9/1/36 | 71,876 | 66,996 |
| 3.00%, due 11/1/37 | 35,388 | 32,859 |
| | Principal
Amount | Value |
| |
| Federal Home Loan Mortgage Corporation (Mortgage Pass-Through Securities) (continued) |
| FHLMC Gold Pools, 20 Year (continued) | | |
| 3.00%, due 12/1/37 | $ 63,465 | $ 58,902 |
| 3.50%, due 2/1/37 | 66,922 | 64,103 |
| 3.50%, due 1/1/38 | 64,684 | 61,464 |
| 4.50%, due 5/1/38 | 33,502 | 33,472 |
| 5.50%, due 1/1/29 | 3,741 | 3,759 |
| FHLMC Gold Pools, 30 Year | | |
| 3.00%, due 9/1/46 | 316,986 | 288,749 |
| 3.00%, due 12/1/46 | 21,200 | 19,194 |
| 3.00%, due 2/1/47 | 27,752 | 25,179 |
| 3.00%, due 3/1/47 | 124,775 | 113,114 |
| 3.00%, due 4/1/47 | 35,167 | 31,753 |
| 3.00%, due 1/1/48 | 228,724 | 206,281 |
| 3.00%, due 2/1/48 | 133,438 | 120,274 |
| 3.00%, due 3/1/48 | 121,432 | 109,503 |
| 3.00%, due 4/1/48 | 466,981 | 420,135 |
| 3.00%, due 6/1/48 | 218,322 | 196,784 |
| 3.50%, due 6/1/43 | 96,391 | 90,919 |
| 3.50%, due 9/1/44 | 73,078 | 68,484 |
| 3.50%, due 8/1/45 | 114,059 | 106,593 |
| 3.50%, due 8/1/46 | 153,231 | 144,186 |
| 3.50%, due 8/1/47 | 14,165 | 13,238 |
| 3.50%, due 9/1/47 | 35,092 | 32,538 |
| 3.50%, due 11/1/47 | 79,318 | 74,125 |
| 3.50%, due 12/1/47 | 163,694 | 152,621 |
| 3.50%, due 1/1/48 | 16,060 | 15,008 |
| 3.50%, due 3/1/48 | 236,345 | 220,869 |
| 3.50%, due 5/1/48 | 71,716 | 67,020 |
| 3.50%, due 8/1/48 | 117,509 | 109,814 |
| 3.50%, due 9/1/48 | 92,042 | 85,976 |
| 3.50%, due 11/1/48 | 32,448 | 30,303 |
| 3.50%, due 12/1/48 | 91,214 | 85,374 |
| 4.00%, due 4/1/46 | 134,413 | 129,763 |
| 4.00%, due 5/1/46 | 42,125 | 40,668 |
| 4.00%, due 4/1/47 | 31,187 | 30,108 |
| 4.00%, due 6/1/47 | 78,257 | 75,550 |
| 4.00%, due 8/1/47 | 153,201 | 147,853 |
| 4.00%, due 10/1/47 | 37,312 | 35,736 |
| 4.00%, due 12/1/47 | 98,056 | 94,583 |
| 4.00%, due 1/1/48 | 30,004 | 29,065 |
| 4.00%, due 5/1/48 | 41,327 | 39,953 |
| 4.00%, due 9/1/48 | 150,252 | 144,773 |
| 4.00%, due 12/1/48 | 83,389 | 80,314 |
| 4.50%, due 9/1/46 | 8,418 | 8,355 |
| 4.50%, due 9/1/46 | 25,539 | 25,348 |
| 4.50%, due 10/1/46 | 62,786 | 62,367 |
| 4.50%, due 2/1/47 | 13,298 | 13,188 |
The notes to the financial statements are an integral part of, and should be read in conjunction with, the financial statements.
15
Portfolio of Investments December 31, 2023†^ (continued)
| | Principal
Amount | Value |
| U.S. Government & Federal Agencies (continued) |
| Federal Home Loan Mortgage Corporation (Mortgage Pass-Through Securities) (continued) |
| FHLMC Gold Pools, 30 Year (continued) | | |
| 4.50%, due 11/1/47 | $ 16,242 | $ 16,073 |
| 4.50%, due 2/1/48 | 31,697 | 31,310 |
| 4.50%, due 4/1/48 | 37,714 | 37,249 |
| 4.50%, due 6/1/48 | 20,685 | 20,432 |
| 4.50%, due 7/1/48 | 78,095 | 77,001 |
| 4.50%, due 8/1/48 | 76,097 | 74,989 |
| 5.00%, due 9/1/38 | 30,301 | 30,836 |
| 5.00%, due 11/1/41 | 42,081 | 42,823 |
| 5.00%, due 3/1/47 | 100,008 | 100,728 |
| 5.00%, due 9/1/48 | 142,501 | 143,050 |
| 5.00%, due 1/1/49 | 50,052 | 50,427 |
| 5.50%, due 7/1/38 | 45,850 | 47,049 |
| UMBS Pool, 20 Year | | |
| 2.00%, due 1/1/41 | 2,030,336 | 1,747,521 |
| UMBS Pool, 30 Year | | |
| 2.00%, due 11/1/50 | 2,196,034 | 1,806,175 |
| 2.00%, due 3/1/51 | 1,872,839 | 1,542,278 |
| 2.50%, due 5/1/50 | 1,919,244 | 1,655,585 |
| 2.50%, due 10/1/50 | 1,345,532 | 1,164,461 |
| 3.00%, due 3/1/52 | 1,005,158 | 908,762 |
| 4.00%, due 7/1/52 | 1,108,595 | 1,048,599 |
| 4.50%, due 1/1/49 | 100,111 | 98,445 |
| | | 18,773,741 |
| Federal National Mortgage Association (Mortgage Pass-Through Securities) 14.3% |
| UMBS, 10 Year | | |
| 3.00%, due 4/1/25 | 5,183 | 5,098 |
| UMBS, 15 Year | | |
| 1.50%, due 3/1/36 | 1,138,367 | 995,086 |
| 1.50%, due 7/1/36 | 1,655,035 | 1,446,159 |
| 2.00%, due 9/1/36 | 2,267,014 | 2,046,944 |
| 2.50%, due 10/1/27 | 56,979 | 54,815 |
| 2.50%, due 4/1/30 | 49,325 | 47,382 |
| 2.50%, due 10/1/31 | 82,873 | 78,302 |
| 2.50%, due 2/1/32 | 100,357 | 94,524 |
| 2.50%, due 2/1/32 | 113,253 | 106,477 |
| 2.50%, due 8/1/32 | 322,385 | 303,193 |
| 2.50%, due 3/1/33 | 138,750 | 129,119 |
| 2.50%, due 6/1/33 | 78,056 | 73,408 |
| 3.00%, due 11/1/31 | 68,795 | 65,830 |
| 3.00%, due 1/1/32 | 65,108 | 62,155 |
| 3.00%, due 6/1/32 | 50,437 | 48,243 |
| 3.00%, due 1/1/33 | 80,226 | 76,585 |
| 3.00%, due 2/1/33 | 103,369 | 98,678 |
| | Principal
Amount | Value |
| |
| Federal National Mortgage Association (Mortgage Pass-Through Securities) (continued) |
| UMBS, 15 Year (continued) | | |
| 3.00%, due 4/1/33 | $ 94,750 | $ 90,450 |
| 3.00%, due 5/1/33 | 127,996 | 122,208 |
| 3.00%, due 9/1/33 | 20,052 | 19,092 |
| 3.50%, due 5/1/26 | 8,977 | 8,808 |
| 3.50%, due 11/1/31 | 13,613 | 13,286 |
| 3.50%, due 5/1/33 | 35,247 | 34,603 |
| 3.50%, due 6/1/33 | 54,196 | 53,474 |
| 3.50%, due 7/1/33 | 25,838 | 25,367 |
| 3.50%, due 9/1/33 | 33,697 | 33,081 |
| 4.00%, due 5/1/24 | 2,458 | 2,439 |
| 4.00%, due 11/1/29 | 23,773 | 23,338 |
| UMBS, 20 Year | | |
| 3.00%, due 2/1/37 | 104,497 | 97,336 |
| 3.00%, due 1/1/38 | 203,277 | 189,126 |
| 4.00%, due 2/1/37 | 17,631 | 17,215 |
| 4.00%, due 8/1/38 | 106,138 | 103,332 |
| 5.00%, due 8/1/31 | 11,399 | 11,323 |
| 5.50%, due 8/1/27 | 20,512 | 20,589 |
| UMBS, 30 Year | | |
| 2.00%, due 8/1/50 | 1,574,820 | 1,300,751 |
| 2.00%, due 8/1/50 | 1,676,332 | 1,385,301 |
| 2.00%, due 9/1/50 | 2,020,527 | 1,661,727 |
| 2.00%, due 2/1/51 | 1,617,769 | 1,327,556 |
| 2.00%, due 3/1/51 | 1,738,632 | 1,441,696 |
| 2.00%, due 5/1/51 | 1,976,125 | 1,620,804 |
| 2.00%, due 1/1/52 | 2,580,545 | 2,117,603 |
| 2.50%, due 4/1/46 | 23,265 | 20,252 |
| 2.50%, due 10/1/46 | 110,189 | 95,031 |
| 2.50%, due 11/1/50 | 1,662,205 | 1,421,104 |
| 2.50%, due 6/1/51 | 2,045,464 | 1,741,475 |
| 2.50%, due 12/1/51 | 686,130 | 583,993 |
| 2.50%, due 4/1/52 | 867,381 | 756,140 |
| 2.50%, due 4/1/52 | 1,900,000 | 1,638,512 |
| 3.00%, due 9/1/42 | 444,740 | 408,937 |
| 3.00%, due 3/1/43 | 1,267,727 | 1,165,132 |
| 3.00%, due 12/1/43 | 511,455 | 469,650 |
| 3.00%, due 10/1/44 | 334,753 | 307,693 |
| 3.00%, due 10/1/46 | 47,018 | 42,570 |
| 3.00%, due 12/1/46 | 561,492 | 508,781 |
| 3.00%, due 2/1/47 | 89,333 | 80,882 |
| 3.00%, due 8/1/47 | 456,654 | 415,904 |
| 3.00%, due 11/1/47 | 80,614 | 72,646 |
| 3.00%, due 6/1/48 | 46,184 | 41,543 |
| 3.50%, due 5/1/45 | 399,697 | 376,039 |
| 3.50%, due 9/1/45 | 26,846 | 25,055 |
| 3.50%, due 12/1/45 | 71,334 | 66,575 |
The notes to the financial statements are an integral part of, and should be read in conjunction with, the financial statements.
| 16 | MainStay VP Indexed Bond Portfolio |
| | Principal
Amount | Value |
| U.S. Government & Federal Agencies (continued) |
| Federal National Mortgage Association (Mortgage Pass-Through Securities) (continued) |
| UMBS, 30 Year (continued) | | |
| 3.50%, due 12/1/45 | $ 187,998 | $ 177,553 |
| 3.50%, due 1/1/46 | 131,505 | 123,762 |
| 3.50%, due 1/1/46 | 105,865 | 98,802 |
| 3.50%, due 4/1/46 | 44,105 | 41,162 |
| 3.50%, due 9/1/46 | 237,480 | 222,865 |
| 3.50%, due 10/1/46 | 107,748 | 100,557 |
| 3.50%, due 10/1/46 | 41,355 | 38,595 |
| 3.50%, due 1/1/47 | 80,985 | 75,893 |
| 3.50%, due 7/1/47 | 17,053 | 15,915 |
| 3.50%, due 7/1/47 | 100,761 | 94,788 |
| 3.50%, due 10/1/47 | 60,569 | 56,455 |
| 3.50%, due 11/1/47 | 199,966 | 186,621 |
| 3.50%, due 11/1/47 | 85,809 | 80,037 |
| 3.50%, due 11/1/47 | 230,850 | 215,443 |
| 3.50%, due 12/1/47 | 16,523 | 15,411 |
| 3.50%, due 8/1/48 | 106,696 | 99,529 |
| 3.50%, due 9/1/48 | 136,492 | 127,324 |
| 3.50%, due 2/1/49 | 254,319 | 236,450 |
| 3.50%, due 6/1/49 | 2,904 | 2,701 |
| 3.50%, due 10/1/52 | 618,666 | 567,620 |
| 4.00%, due 8/1/44 | 110,615 | 107,324 |
| 4.00%, due 2/1/45 | 88,645 | 85,461 |
| 4.00%, due 9/1/45 | 16,772 | 16,170 |
| 4.00%, due 5/1/46 | 77,111 | 74,340 |
| 4.00%, due 9/1/46 | 30,835 | 29,727 |
| 4.00%, due 9/1/46 | 37,569 | 36,208 |
| 4.00%, due 2/1/47 | 16,277 | 15,692 |
| 4.00%, due 4/1/47 | 6,335 | 6,107 |
| 4.00%, due 5/1/47 | 46,957 | 45,090 |
| 4.00%, due 5/1/47 | 37,949 | 36,586 |
| 4.00%, due 6/1/47 | 147,455 | 142,683 |
| 4.00%, due 10/1/47 | 15,773 | 15,155 |
| 4.00%, due 11/1/47 | 15,423 | 14,836 |
| 4.00%, due 12/1/47 | 35,302 | 33,902 |
| 4.00%, due 1/1/48 | 85,921 | 82,636 |
| 4.00%, due 1/1/48 | 16,217 | 15,621 |
| 4.00%, due 1/1/48 | 92,448 | 88,833 |
| 4.00%, due 2/1/48 | 46,005 | 44,304 |
| 4.00%, due 6/1/48 | 211,255 | 203,138 |
| 4.00%, due 7/1/48 | 110,003 | 105,867 |
| 4.00%, due 7/1/48 | 36,259 | 34,853 |
| 4.00%, due 7/1/48 | 177,219 | 170,486 |
| 4.00%, due 8/1/48 | 28,233 | 27,154 |
| 4.00%, due 9/1/48 | 112,315 | 108,139 |
| 4.00%, due 9/1/48 | 27,358 | 26,305 |
| | Principal
Amount | Value |
| |
| Federal National Mortgage Association (Mortgage Pass-Through Securities) (continued) |
| UMBS, 30 Year (continued) | | |
| 4.00%, due 10/1/48 | $ 19,179 | $ 18,446 |
| 4.00%, due 11/1/48 | 49,180 | 47,311 |
| 4.00%, due 1/1/49 | 39,410 | 37,871 |
| 4.50%, due 7/1/46 | 16,504 | 16,367 |
| 4.50%, due 12/1/46 | 26,006 | 25,775 |
| 4.50%, due 4/1/47 | 250,903 | 246,829 |
| 4.50%, due 5/1/47 | 6,797 | 6,721 |
| 4.50%, due 7/1/47 | 107,008 | 105,020 |
| 4.50%, due 7/1/47 | 25,269 | 24,893 |
| 4.50%, due 8/1/47 | 1,372 | 1,355 |
| 4.50%, due 2/1/48 | 102,440 | 100,713 |
| 4.50%, due 4/1/48 | 15,727 | 15,499 |
| 4.50%, due 4/1/48 | 8,064 | 7,951 |
| 4.50%, due 4/1/48 | 32,491 | 32,090 |
| 4.50%, due 5/1/48 | 62,658 | 61,784 |
| 4.50%, due 6/1/48 | 34,886 | 34,403 |
| 4.50%, due 8/1/48 | 62,000 | 60,883 |
| 4.50%, due 10/1/48 | 21,292 | 20,974 |
| 4.50%, due 9/1/49 | 280,356 | 275,664 |
| 4.50%, due 11/1/52 | 1,104,352 | 1,070,843 |
| 5.00%, due 6/1/39 | 70,782 | 71,926 |
| 5.00%, due 6/1/40 | 17,618 | 17,903 |
| 5.00%, due 7/1/47 | 32,439 | 32,555 |
| 5.00%, due 1/1/48 | 39,178 | 39,378 |
| 5.00%, due 4/1/48 | 26,895 | 27,162 |
| 5.00%, due 5/1/48 | 35,460 | 35,470 |
| 5.00%, due 9/1/48 | 22,586 | 22,777 |
| 5.00%, due 2/1/53 | 472,841 | 467,785 |
| 5.50%, due 6/1/36 | 21,314 | 21,949 |
| 5.50%, due 5/1/44 | 46,343 | 47,724 |
| 5.50%, due 9/1/48 | 71,105 | 72,442 |
| UMBS, Single Family, 30 Year | | |
| 5.50%, due 1/25/54 TBA (f) | 1,650,000 | 1,656,961 |
| | | 36,559,941 |
| Government National Mortgage Association (Mortgage Pass-Through Securities) 5.5% |
| GNMA I, Single Family, 30 Year | | |
| 3.00%, due 6/15/45 | 13,320 | 12,120 |
| 3.00%, due 10/15/45 | 7,917 | 7,224 |
| 3.00%, due 5/15/48 | 58,865 | 52,836 |
| 3.50%, due 3/15/45 | 6,514 | 6,153 |
| 3.50%, due 4/15/45 | 12,882 | 12,166 |
| 3.50%, due 5/15/48 | 23,086 | 21,337 |
| 4.00%, due 8/15/46 | 23,261 | 22,461 |
| 4.00%, due 11/15/47 | 54,233 | 52,368 |
The notes to the financial statements are an integral part of, and should be read in conjunction with, the financial statements.
17
Portfolio of Investments December 31, 2023†^ (continued)
| | Principal
Amount | Value |
| U.S. Government & Federal Agencies (continued) |
| Government National Mortgage Association (Mortgage Pass-Through Securities) (continued) |
GNMA I, Single Family, 30 Year
(continued) | | |
| 4.00%, due 7/15/49 | $ 49,103 | $ 47,174 |
| 4.50%, due 8/15/46 | 48,612 | 48,086 |
| 4.50%, due 2/15/47 | 2,804 | 2,769 |
| 4.50%, due 4/15/47 | 16,875 | 17,109 |
| 4.50%, due 8/15/47 | 88,541 | 88,377 |
| 4.50%, due 8/15/47 | 122,123 | 123,702 |
| 5.00%, due 4/15/47 | 16,072 | 15,948 |
| 5.00%, due 12/15/47 | 18,285 | 18,000 |
| GNMA II, Single Family, 30 Year | | |
| 2.00%, due 6/20/51 | 4,536,603 | 3,841,297 |
| 2.50%, due 4/20/47 | 25,606 | 22,676 |
| 2.50%, due 5/20/51 | 4,614,259 | 4,038,784 |
| 3.00%, due 11/20/45 | 244,430 | 225,052 |
| 3.00%, due 8/20/46 | 81,374 | 74,768 |
| 3.00%, due 9/20/46 | 43,399 | 39,868 |
| 3.00%, due 10/20/46 | 273,091 | 250,809 |
| 3.00%, due 1/20/47 | 316,469 | 290,520 |
| 3.00%, due 5/20/47 | 55,637 | 51,073 |
| 3.00%, due 12/20/47 | 164,301 | 150,424 |
| 3.00%, due 2/20/48 | 180,666 | 165,373 |
| 3.00%, due 3/20/48 | 208,730 | 191,073 |
| 3.00%, due 9/20/51 | 1,330,801 | 1,205,312 |
| 3.50%, due 11/20/42 | 101,894 | 95,281 |
| 3.50%, due 9/20/44 | 135,135 | 127,796 |
| 3.50%, due 11/20/45 | 151,655 | 143,004 |
| 3.50%, due 7/20/46 | 15,674 | 14,775 |
| 3.50%, due 10/20/46 | 16,684 | 15,724 |
| 3.50%, due 11/20/46 | 203,059 | 191,381 |
| 3.50%, due 1/20/47 | 230,135 | 217,120 |
| 3.50%, due 5/20/47 | 166,405 | 156,835 |
| 3.50%, due 9/20/47 | 164,947 | 155,333 |
| 3.50%, due 10/20/47 | 296,883 | 279,555 |
| 3.50%, due 12/20/47 | 147,227 | 138,850 |
| 3.50%, due 7/20/48 | 79,520 | 74,682 |
| 3.50%, due 10/20/48 | 83,524 | 78,602 |
| 4.00%, due 12/20/46 | 13,911 | 13,427 |
| 4.00%, due 1/20/47 | 105,642 | 101,994 |
| 4.00%, due 2/20/47 | 25,426 | 24,551 |
| 4.00%, due 3/20/47 | 18,666 | 18,000 |
| 4.00%, due 4/20/47 | 40,016 | 38,583 |
| 4.00%, due 5/20/47 | 33,647 | 32,523 |
| 4.00%, due 7/20/47 | 13,111 | 12,638 |
| 4.00%, due 11/20/47 | 164,781 | 159,068 |
| 4.00%, due 12/20/47 | 36,432 | 35,108 |
| | Principal
Amount | Value |
| |
| Government National Mortgage Association (Mortgage Pass-Through Securities) (continued) |
GNMA II, Single Family, 30 Year
(continued) | | |
| 4.00%, due 4/20/48 | $ 122,297 | $ 118,134 |
| 4.00%, due 5/20/48 | 54,599 | 52,723 |
| 4.00%, due 6/20/48 | 22,831 | 21,958 |
| 4.00%, due 8/20/48 | 154,430 | 148,574 |
| 4.00%, due 9/20/48 | 82,761 | 79,560 |
| 4.00%, due 3/20/49 | 20,673 | 19,931 |
| 4.50%, due 8/20/46 | 48,336 | 48,405 |
| 4.50%, due 4/20/47 | 37,839 | 37,684 |
| 4.50%, due 11/20/47 | 34,855 | 34,503 |
| 4.50%, due 1/20/48 | 79,665 | 78,821 |
| 4.50%, due 3/20/48 | 33,638 | 33,297 |
| 4.50%, due 5/20/48 | 27,674 | 27,355 |
| 4.50%, due 6/20/48 | 45,616 | 45,084 |
| 5.00%, due 8/20/45 | 61,603 | 62,693 |
| 5.00%, due 11/20/46 | 37,996 | 38,700 |
| 5.00%, due 11/20/47 | 34,361 | 34,647 |
| 5.00%, due 3/20/48 | 20,179 | 20,409 |
| 5.00%, due 6/20/48 | 41,724 | 41,995 |
| | | 14,164,162 |
| United States Treasury Bonds 4.1% |
| U.S. Treasury Bonds | | |
| 2.75%, due 8/15/47 | 235,000 | 182,988 |
| 2.75%, due 11/15/47 | 300,000 | 233,508 |
| 2.875%, due 5/15/49 | 250,000 | 198,652 |
| 3.00%, due 2/15/47 | 315,000 | 257,525 |
| 3.00%, due 5/15/47 | 175,000 | 142,933 |
| 3.00%, due 2/15/48 | 1,730,000 | 1,409,747 |
| 3.00%, due 8/15/48 | 715,000 | 581,999 |
| 3.00%, due 2/15/49 | 845,000 | 687,586 |
| 3.00%, due 8/15/52 | 1,020,000 | 834,129 |
| 3.125%, due 5/15/48 | 1,310,000 | 1,091,394 |
| 3.375%, due 11/15/48 | 550,000 | 479,230 |
| 3.625%, due 5/15/53 | 415,000 | 383,680 |
| 4.00%, due 11/15/52 | 1,900,000 | 1,874,617 |
| 4.125%, due 8/15/53 | 350,000 | 353,773 |
| 4.75%, due 11/15/53 | 1,600,000 | 1,794,250 |
| | | 10,506,011 |
| United States Treasury Notes 37.9% |
| U.S. Treasury Notes | | |
| 0.125%, due 1/15/24 | 700,000 | 698,713 |
| 0.125%, due 2/15/24 | 400,000 | 397,517 |
| 0.25%, due 3/15/24 | 1,400,000 | 1,386,055 |
| 0.25%, due 5/15/24 | 1,300,000 | 1,276,641 |
| 0.25%, due 6/15/24 | 1,300,000 | 1,271,613 |
The notes to the financial statements are an integral part of, and should be read in conjunction with, the financial statements.
| 18 | MainStay VP Indexed Bond Portfolio |
| | Principal
Amount | Value |
| U.S. Government & Federal Agencies (continued) |
| United States Treasury Notes (continued) |
| U.S. Treasury Notes (continued) | | |
| 0.25%, due 5/31/25 | $ 1,850,000 | $ 1,742,252 |
| 0.25%, due 6/30/25 | 200,000 | 187,852 |
| 0.25%, due 8/31/25 | 150,000 | 140,033 |
| 0.375%, due 4/15/24 | 1,000,000 | 986,250 |
| 0.375%, due 7/15/24 | 400,000 | 390,094 |
| 0.375%, due 8/15/24 | 1,250,000 | 1,214,160 |
| 0.50%, due 8/31/27 | 800,000 | 706,812 |
| 0.875%, due 1/31/24 | 1,825,000 | 1,818,534 |
| 1.00%, due 7/31/28 | 225,000 | 197,903 |
| 1.125%, due 2/29/28 | 400,000 | 357,562 |
| 1.25%, due 3/31/28 | 200,000 | 179,344 |
| 1.25%, due 5/31/28 | 875,000 | 781,655 |
| 1.25%, due 6/30/28 | 1,200,000 | 1,070,156 |
| 1.50%, due 2/29/24 | 1,650,000 | 1,639,988 |
| 1.50%, due 1/31/27 | 325,000 | 301,679 |
| 1.75%, due 6/30/24 | 2,875,000 | 2,827,046 |
| 1.75%, due 7/31/24 | 2,100,000 | 2,060,379 |
| 1.875%, due 8/31/24 | 650,000 | 636,695 |
| 1.875%, due 2/28/27 | 475,000 | 445,275 |
| 1.875%, due 2/28/29 | 1,710,000 | 1,550,088 |
| 2.00%, due 4/30/24 | 2,535,000 | 2,508,462 |
| 2.125%, due 7/31/24 | 150,000 | 147,469 |
| 2.25%, due 3/31/24 | 2,575,000 | 2,555,788 |
| 2.375%, due 3/31/29 | 1,550,000 | 1,439,018 |
| 2.375%, due 5/15/29 | 825,000 | 764,672 |
| 2.50%, due 4/30/24 | 300,000 | 297,258 |
| 2.50%, due 5/15/24 | 2,000,000 | 1,980,469 |
| 2.50%, due 5/31/24 | 3,200,000 | 3,164,250 |
| 2.50%, due 3/31/27 | 300,000 | 286,723 |
| 2.625%, due 7/31/29 | 700,000 | 655,484 |
| 2.75%, due 6/30/25 | 275,000 | 268,265 |
| 2.75%, due 7/31/27 | 775,000 | 743,939 |
| 2.75%, due 5/31/29 | 675,000 | 637,268 |
| 2.875%, due 5/31/25 | 300,000 | 293,168 |
| 2.875%, due 6/15/25 | 750,000 | 733,008 |
| 2.875%, due 4/30/29 | 400,000 | 380,484 |
| 3.00%, due 7/31/24 | 1,500,000 | 1,482,305 |
| 3.125%, due 8/15/25 | 3,175,000 | 3,111,748 |
| 3.125%, due 8/31/29 | 1,490,000 | 1,431,040 |
| 3.25%, due 8/31/24 | 1,600,000 | 1,581,062 |
| 3.25%, due 6/30/29 | 1,275,000 | 1,234,011 |
| 3.50%, due 9/15/25 | 1,575,000 | 1,551,806 |
| 3.50%, due 1/31/28 | 1,075,000 | 1,058,035 |
| 3.50%, due 1/31/30 | 1,810,000 | 1,770,194 |
| 3.50%, due 2/15/33 | 175,000 | 169,702 |
| 3.625%, due 5/15/26 | 1,805,000 | 1,784,059 |
| | Principal
Amount | Value |
| |
| United States Treasury Notes (continued) |
| U.S. Treasury Notes (continued) | | |
| 3.625%, due 3/31/28 | $ 250,000 | $ 247,275 |
| 3.75%, due 4/15/26 | 1,000,000 | 990,703 |
| 3.75%, due 6/30/30 | 375,000 | 371,631 |
| 3.875%, due 1/15/26 | 500,000 | 496,191 |
| 3.875%, due 9/30/29 | 2,325,000 | 2,320,277 |
| 3.875%, due 11/30/29 | 1,425,000 | 1,422,272 |
| 4.00%, due 12/15/25 | 2,500,000 | 2,486,621 |
| 4.00%, due 2/15/26 | 1,000,000 | 995,430 |
| 4.00%, due 2/29/28 | 500,000 | 501,641 |
| 4.00%, due 10/31/29 | 1,520,000 | 1,527,066 |
| 4.00%, due 2/28/30 | 2,075,000 | 2,084,808 |
| 4.125%, due 6/15/26 | 1,450,000 | 1,449,660 |
| 4.125%, due 10/31/27 | 960,000 | 966,037 |
| 4.125%, due 8/31/30 | 585,000 | 592,335 |
| 4.25%, due 9/30/24 | 2,375,000 | 2,362,847 |
| 4.25%, due 10/15/25 | 2,300,000 | 2,295,687 |
| 4.375%, due 10/31/24 | 1,200,000 | 1,194,891 |
| 4.375%, due 8/15/26 | 1,300,000 | 1,308,734 |
| 4.375%, due 11/30/30 | 800,000 | 822,625 |
| 4.50%, due 11/15/25 | 3,000,000 | 3,010,078 |
| 4.50%, due 7/15/26 | 700,000 | 706,508 |
| 4.625%, due 6/30/25 | 200,000 | 200,477 |
| 4.625%, due 3/15/26 | 175,000 | 176,518 |
| 4.625%, due 9/15/26 | 2,325,000 | 2,357,423 |
| 4.625%, due 10/15/26 | 1,385,000 | 1,405,559 |
| 4.625%, due 11/15/26 | 2,625,000 | 2,666,426 |
| 4.875%, due 10/31/30 | 795,000 | 840,837 |
| 5.00%, due 8/31/25 | 300,000 | 302,766 |
| 5.00%, due 10/31/25 | 4,275,000 | 4,323,763 |
| | | 96,721,069 |
Total U.S. Government & Federal Agencies
(Cost $184,089,268) | | 176,724,924 |
Total Long-Term Bonds
(Cost $263,257,655) | | 247,915,460 |
| |
The notes to the financial statements are an integral part of, and should be read in conjunction with, the financial statements.
19
Portfolio of Investments December 31, 2023†^ (continued)
| | Shares | | Value |
| |
| Exchange-Traded Fund 1.1% |
| iShares iBoxx $ Investment Grade Corporate Bond ETF | 24,654 | | $ 2,728,212 |
Total Exchange-Traded Fund
(Cost $2,486,968) | | | 2,728,212 |
Total Investments
(Cost $265,744,623) | 98.2% | | 250,643,672 |
| Other Assets, Less Liabilities | 1.8 | | 4,673,990 |
| Net Assets | 100.0% | | $ 255,317,662 |
| † | Percentages indicated are based on Portfolio net assets. |
| ^ | Industry classifications may be different than those used for compliance monitoring purposes. |
| ‡ | Less than one-tenth of a percent. |
| (a) | Fixed to floating rate—Rate shown was the rate in effect as of December 31, 2023. |
| (b) | Floating rate—Rate shown was the rate in effect as of December 31, 2023. |
| (c) | May be sold to institutional investors only under Rule 144A or securities offered pursuant to Section 4(a)(2) of the Securities Act of 1933, as amended. |
| (d) | Step coupon—Rate shown was the rate in effect as of December 31, 2023. |
| (e) | Coupon rate may change based on changes of the underlying collateral or prepayments of principal. Rate shown was the rate in effect as of December 31, 2023. |
| (f) | TBA—Security purchased on a forward commitment basis with an approximate principal amount and maturity date. The actual principal amount and maturity date will be determined upon settlement. As of December 31, 2023, the total net market value was $1,656,961, which represented 0.6% of the Portfolio’s net assets. All or a portion of this security is a part of a mortgage dollar roll agreement. |
Futures Contracts
As of December 31, 2023, the Portfolio held the following futures contracts1:
| Type | Number of
Contracts | Expiration
Date | Value at
Trade Date | Current
Notional
Amount | Unrealized
Appreciation
(Depreciation)2 |
| Long Contracts | | | | | |
| U.S. Treasury 5 Year Notes | 110 | March 2024 | $ 11,736,690 | $ 11,965,078 | $ 228,388 |
| U.S. Treasury 10 Year Notes | 96 | March 2024 | 10,508,286 | 10,837,500 | 329,214 |
| U.S. Treasury 10 Year Ultra Bonds | 42 | March 2024 | 4,752,240 | 4,956,656 | 204,416 |
| U.S. Treasury Long Bonds | 76 | March 2024 | 8,835,737 | 9,495,250 | 659,513 |
| U.S. Treasury Ultra Bonds | 20 | March 2024 | 2,442,588 | 2,671,875 | 229,287 |
| Total Long Contracts | | | | | 1,650,818 |
The notes to the financial statements are an integral part of, and should be read in conjunction with, the financial statements.
| 20 | MainStay VP Indexed Bond Portfolio |
| Type | Number of
Contracts | Expiration
Date | Value at
Trade Date | Current
Notional
Amount | Unrealized
Appreciation
(Depreciation)2 |
| Short Contracts | | | | | |
| U.S. Treasury 2 Year Notes | (52) | March 2024 | $ (10,603,850) | $ (10,707,531) | $ (103,681) |
| Net Unrealized Appreciation | | | | | $ 1,547,137 |
| 1. | As of December 31, 2023, cash in the amount of $933,856 was on deposit with a broker or futures commission merchant for futures transactions. |
| 2. | Represents the difference between the value of the contracts at the time they were opened and the value as of December 31, 2023. |
| Abbreviation(s): |
| ETF—Exchange-Traded Fund |
| FFCB—Federal Farm Credit Bank |
| FHLMC—Federal Home Loan Mortgage Corp. |
| GNMA—Government National Mortgage Association |
| REMIC—Real Estate Mortgage Investment Conduit |
| TBA—To Be Announced |
| UMBS—Uniform Mortgage Backed Securities |
The following is a summary of the fair valuations according to the inputs used as of December 31, 2023, for valuing the Portfolio’s assets and liabilities:
| Description | Quoted
Prices in
Active
Markets for
Identical
Assets
(Level 1) | | Significant
Other
Observable
Inputs
(Level 2) | | Significant
Unobservable
Inputs
(Level 3) | | Total |
| Asset Valuation Inputs | | | | | | | |
| Investments in Securities (a) | | | | | | | |
| Long-Term Bonds | | | | | | | |
| Corporate Bonds | $ — | | $ 59,514,136 | | $ — | | $ 59,514,136 |
| Foreign Government Bonds | — | | 7,675,271 | | — | | 7,675,271 |
| Mortgage-Backed Securities | — | | 4,001,129 | | — | | 4,001,129 |
| U.S. Government & Federal Agencies | — | | 176,724,924 | | — | | 176,724,924 |
| Total Long-Term Bonds | — | | 247,915,460 | | — | | 247,915,460 |
| Exchange-Traded Fund | 2,728,212 | | — | | — | | 2,728,212 |
| Total Investments in Securities | 2,728,212 | | 247,915,460 | | — | | 250,643,672 |
| Other Financial Instruments | | | | | | | |
| Futures Contracts (b) | 1,650,818 | | — | | — | | 1,650,818 |
| Total Investments in Securities and Other Financial Instruments | $ 4,379,030 | | $ 247,915,460 | | $ — | | $ 252,294,490 |
| Liability Valuation Inputs | | | | | | | |
| Other Financial Instruments | | | | | | | |
| Futures Contracts (b) | $ (103,681) | | $ — | | $ — | | $ (103,681) |
| (a) | For a complete listing of investments and their industries, see the Portfolio of Investments. |
| (b) | The value listed for these securities reflects unrealized appreciation (depreciation) as shown on the Portfolio of Investments. |
The notes to the financial statements are an integral part of, and should be read in conjunction with, the financial statements.
21
Statement of Assets and Liabilities as of December 31, 2023
| Assets |
Investment in securities, at value
(identified cost $265,744,623) | $250,643,672 |
| Cash | 3,396,428 |
| Cash collateral on deposit at broker for futures contracts | 933,856 |
| Receivables: | |
| Interest | 1,831,727 |
| Investment securities sold | 650,000 |
| Other assets | 14,049 |
| Total assets | 257,469,732 |
| Liabilities |
| Payables: | |
| Investment securities purchased | 1,941,522 |
| Manager (See Note 3) | 53,754 |
| Shareholder communication | 43,964 |
| Variation margin on futures contracts | 36,056 |
| Professional fees | 32,174 |
| Custodian | 25,989 |
| Accrued expenses | 18,611 |
| Total liabilities | 2,152,070 |
| Net assets | $255,317,662 |
| Composition of Net Assets |
| Shares of beneficial interest outstanding (par value of $.001 per share) unlimited number of shares authorized | $ 29,251 |
| Additional paid-in-capital | 286,366,448 |
| | 286,395,699 |
| Total distributable earnings (loss) | (31,078,037) |
| Net assets | $255,317,662 |
| Initial Class | |
| Net assets applicable to outstanding shares | $255,317,662 |
| Shares of beneficial interest outstanding | 29,250,945 |
| Net asset value per share outstanding | $ 8.73 |
The notes to the financial statements are an integral part of, and should be read in conjunction with, the financial statements.
| 22 | MainStay VP Indexed Bond Portfolio |
Statement of Operations for the year ended December 31, 2023
| Investment Income (Loss) |
| Income | |
| Interest | $ 8,637,626 |
| Dividends | 183,633 |
| Total income | 8,821,259 |
| Expenses | |
| Manager (See Note 3) | 653,881 |
| Professional fees | 78,952 |
| Custodian | 64,183 |
| Trustees | 6,695 |
| Miscellaneous | 2,281 |
| Total expenses | 805,992 |
| Net investment income (loss) | 8,015,267 |
| Realized and Unrealized Gain (Loss) |
| Net realized gain (loss) on: | |
| Unaffiliated investment transactions | (2,176,162) |
| Futures transactions | (2,382,813) |
| Net realized gain (loss) | (4,558,975) |
| Net change in unrealized appreciation (depreciation) on: | |
| Unaffiliated investments | 8,230,646 |
| Futures contracts | 1,739,740 |
| Net change in unrealized appreciation (depreciation) | 9,970,386 |
| Net realized and unrealized gain (loss) | 5,411,411 |
| Net increase (decrease) in net assets resulting from operations | $13,426,678 |
The notes to the financial statements are an integral part of, and should be read in conjunction with, the financial statements.
23
Statements of Changes in Net Assets
for the years ended December 31, 2023 and December 31, 2022
| | 2023 | 2022 |
| Increase (Decrease) in Net Assets |
| Operations: | | |
| Net investment income (loss) | $ 8,015,267 | $ 5,997,650 |
| Net realized gain (loss) | (4,558,975) | (18,031,556) |
| Net change in unrealized appreciation (depreciation) | 9,970,386 | (31,077,237) |
| Net increase (decrease) in net assets resulting from operations | 13,426,678 | (43,111,143) |
| Distributions to shareholders: | | |
| Initial Class | (6,208,537) | (11,493,602) |
| Capital share transactions: | | |
| Net proceeds from sales of shares | 6,717,751 | 66,908,730 |
| Net asset value of shares issued to shareholders in reinvestment of distributions | 6,208,537 | 11,493,602 |
| Cost of shares redeemed | (38,241,669) | (180,601,111) |
| Increase (decrease) in net assets derived from capital share transactions | (25,315,381) | (102,198,779) |
| Net increase (decrease) in net assets | (18,097,240) | (156,803,524) |
| Net Assets |
| Beginning of year | 273,414,902 | 430,218,426 |
| End of year | $255,317,662 | $ 273,414,902 |
The notes to the financial statements are an integral part of, and should be read in conjunction with, the financial statements.
| 24 | MainStay VP Indexed Bond Portfolio |
Financial Highlights selected per share data and ratios
| | Year Ended December 31, |
| Initial Class | 2023 | | 2022 | | 2021 | | 2020 | | 2019 |
| Net asset value at beginning of year | $ 8.51 | | $ 10.30 | | $ 11.25 | | $ 10.62 | | $ 9.80 |
| Net investment income (loss) (a) | 0.26 | | 0.19 | | 0.14 | | 0.18 | | 0.27 |
| Net realized and unrealized gain (loss) | 0.17 | | (1.58) | | (0.36) | | 0.60 | | 0.55 |
| Total from investment operations | 0.43 | | (1.39) | | (0.22) | | 0.78 | | 0.82 |
| Less distributions: | | | | | | | | | |
| From net investment income | (0.21) | | (0.28) | | (0.31) | | (0.13) | | — |
| From net realized gain on investments | — | | (0.12) | | (0.42) | | (0.02) | | — |
| Total distributions | (0.21) | | (0.40) | | (0.73) | | (0.15) | | — |
| Net asset value at end of year | $ 8.73 | | $ 8.51 | | $ 10.30 | | $ 11.25 | | $ 10.62 |
| Total investment return (b) | 5.25% | | (13.34)% | | (1.95)% | | 7.40% | | 8.37%(c) |
| Ratios (to average net assets)/Supplemental Data: | | | | | | | | | |
| Net investment income (loss) | 3.06% | | 2.06% | | 1.26% | | 1.59% | | 2.66% |
| Net expenses (d) | 0.31% | | 0.32% | | 0.30% | | 0.29% | | 0.30% |
| Portfolio turnover rate (e) | 49% | | 182% | | 239% | | 191% | | 65% |
| Net assets at end of year (in 000's) | $ 255,318 | | $ 273,415 | | $ 430,218 | | $ 757,632 | | $ 422,163 |
| (a) | Per share data based on average shares outstanding during the year. |
| (b) | Total return does not reflect any deduction of sales charges, mortality and expense charges, contract charges or administrative charges. For periods of less than one year, total return is not annualized. |
| (c) | Total investment return may reflect adjustments to conform to generally accepted accounting principles. |
| (d) | In addition to the fees and expenses which the Portfolio bears directly, it also indirectly bears a pro-rata share of the fees and expenses of the underlying funds in which it invests. Such indirect expenses are not included in the above expense ratios. |
| (e) | The portfolio turnover rate not including mortgage dollar rolls were 48%, 146%, 55%, 138%, and 57% for the years ended December 31, 2023, 2022, 2021, 2020 and 2019, respectively. |
The notes to the financial statements are an integral part of, and should be read in conjunction with, the financial statements.
25
Notes to Financial Statements
Note 1–Organization and Business
MainStay VP Funds Trust (the “Fund”) was organized as a Delaware statutory trust on February 1, 2011. The Fund is registered under the Investment Company Act of 1940, as amended (the “1940 Act”), as an open-end management investment company. The Fund is comprised of thirty-one separate series (collectively referred to as the “Portfolios”). These financial statements and notes relate to the MainStay VP Indexed Bond Portfolio (the "Portfolio"), a "diversified” portfolio, as that term is defined in the 1940 Act, as interpreted or modified by regulatory authorities having jurisdiction, from time to time.
Shares of the Portfolio are currently offered to certain separate accounts to fund variable annuity policies and variable universal life insurance policies issued by New York Life Insurance and Annuity Corporation (“NYLIAC”), a wholly-owned subsidiary of New York Life Insurance Company (“New York Life”) and may also be offered to fund variable annuity policies and variable universal life insurance policies issued by other insurance companies. NYLIAC allocates shares of the Portfolio to, among others, certain NYLIAC separate accounts. Shares of the Portfolio are also offered to the MainStay VP Conservative Allocation Portfolio, MainStay VP Moderate Allocation Portfolio, MainStay VP Growth Allocation Portfolio and MainStay VP Equity Allocation Portfolio, which operate as “funds-of-funds," and other variable insurance funds.
The following table lists the Portfolio's share class that has been registered and commenced operations:
| Class | Commenced Operations |
| Initial Class | May 1, 2017 |
Shares of the Portfolio are offered and are redeemed at a price equal to their respective net asset value (“NAV”) per share. No sales or redemption charge is applicable to the purchase or redemption of the Portfolio's shares.
The Portfolio's investment objective is to seek investment results that correspond to the total return performance of fixed-income securities in the aggregate, as represented by the Portfolio's primary benchmark index.
Note 2–Significant Accounting Policies
The Portfolio is an investment company and accordingly follows the investment company accounting and reporting guidance of the Financial Accounting Standards Board (“FASB”) Accounting Standards Codification Topic 946 Financial Services—Investment Companies. The Portfolio prepares its financial statements in accordance with generally accepted accounting principles (“GAAP”) in the United States of America and follows the significant accounting policies described below.
(A) Securities Valuation. Investments are usually valued as of the close of regular trading on the New York Stock Exchange (the "Exchange") (usually 4:00 p.m. Eastern time) on each day the Portfolio is open for business ("valuation date").
Pursuant to Rule 2a-5 under the 1940 Act, the Board of Trustees of the Fund (the "Board") has designated New York Life Investment Management LLC (“New York Life Investments” or the "Manager") as its Valuation Designee (the "Valuation Designee"). The Valuation Designee is responsible for performing fair valuations relating to all investments in the Portfolio’s portfolio for which market quotations are not readily available; periodically assessing and managing material valuation risks; establishing and applying fair value methodologies; testing fair valuation methodologies; evaluating and overseeing pricing services; ensuring appropriate segregation of valuation and portfolio management functions; providing quarterly, annual and prompt reporting to the Board, as appropriate; identifying potential conflicts of interest; and maintaining appropriate records. The Valuation Designee has established a valuation committee ("Valuation Committee") to assist in carrying out the Valuation Designee’s responsibilities and establish prices of securities for which market quotations are not readily available. The Portfolio's and the Valuation Designee's policies and procedures ("Valuation Procedures") govern the Valuation Designee’s selection and application of methodologies for determining and calculating the fair value of Portfolio investments. The Valuation Designee may value the Portfolio's portfolio securities for which market quotations are not readily available and other Portfolio assets utilizing inputs from pricing services and other third-party sources. The Valuation Committee meets (in person, via electronic mail or via teleconference) on an ad-hoc basis to determine fair valuations and on a quarterly basis to review fair value events with respect to certain securities for which market quotations are not readily available, including valuation risks and back-testing results, and to preview reports to the Board.
The Valuation Committee establishes prices of securities for which market quotations are not readily available based on such methodologies and measurements on a regular basis after considering information that is reasonably available and deemed relevant by the Valuation Committee. The Board shall oversee the Valuation Designee and review fair valuation materials on a prompt, quarterly and annual basis and approve proposed revisions to the Valuation Procedures.
Investments for which market quotations are not readily available are valued at fair value as determined in good faith pursuant to the Valuation Procedures. A market quotation is readily available only when that quotation is a quoted price (unadjusted) in active markets for identical investments that the Portfolio can access at the measurement date, provided that a quotation will not be readily available if it is not reliable. "Fair value" is defined as the price the Portfolio would reasonably expect to receive upon selling an asset or liability in an orderly transaction to an independent buyer in the principal or most advantageous market for the asset or liability. Fair value measurements are determined within a framework that establishes a three-tier hierarchy that maximizes the use of observable market data and minimizes the use of unobservable inputs to establish a classification of fair value measurements for disclosure purposes. "Inputs" refer broadly to the assumptions that market participants would use in pricing the asset or liability, including assumptions about risk, such as the risk inherent in a particular valuation
| 26 | MainStay VP Indexed Bond Portfolio |
technique used to measure fair value using a pricing model and/or the risk inherent in the inputs for the valuation technique. Inputs may be observable or unobservable. Observable inputs reflect the assumptions market participants would use in pricing the asset or liability based on market data obtained from sources independent of the Portfolio. Unobservable inputs reflect the Portfolio’s own assumptions about the assumptions market participants would use in pricing the asset or liability based on the information available. The inputs or methodology used for valuing assets or liabilities may not be an indication of the risks associated with investing in those assets or liabilities. The three-tier hierarchy of inputs is summarized below.
| • | Level 1—quoted prices (unadjusted) in active markets for an identical asset or liability |
| • | Level 2—other significant observable inputs (including quoted prices for a similar asset or liability in active markets, interest rates and yield curves, prepayment speeds, credit risk, etc.) |
| • | Level 3—significant unobservable inputs (including the Portfolio's own assumptions about the assumptions that market participants would use in measuring fair value of an asset or liability) |
The level of an asset or liability within the fair value hierarchy is based on the lowest level of an input, both individually and in the aggregate, that is significant to the fair value measurement. The aggregate value by input level of the Portfolio’s assets and liabilities as of December 31, 2023, is included at the end of the Portfolio of Investments.
The Portfolio may use third-party vendor evaluations, whose prices may be derived from one or more of the following standard inputs, among others:
| • Benchmark yields | • Reported trades |
| • Broker/dealer quotes | • Issuer spreads |
| • Two-sided markets | • Benchmark securities |
| • Bids/offers | • Reference data (corporate actions or material event notices) |
| • Industry and economic events | • Comparable bonds |
| • Monthly payment information | |
An asset or liability for which a market quotation is not readily available is valued by methods deemed reasonable in good faith by the Valuation Committee, following the Valuation Procedures to represent fair value. Under these procedures, the Valuation Designee generally uses a market-based approach which may use related or comparable assets or liabilities, recent transactions, market multiples, book values and other relevant information. The Valuation Designee may also use an income-based valuation approach in which the anticipated future cash flows of the asset or liability are discounted to calculate fair value. Discounts may also be applied due to the nature and/or duration of any restrictions on the disposition of the asset or liability. Fair value represents a good faith approximation of the value of a security. Fair value determinations involve the consideration of a number of subjective factors, an analysis of applicable facts and circumstances and the
exercise of judgment. As a result, it is possible that the fair value for a security determined in good faith in accordance with the Valuation Procedures may differ from valuations for the same security determined for other funds using their own valuation procedures. Although the Valuation Procedures are designed to value a security at the price the Portfolio may reasonably expect to receive upon the security's sale in an orderly transaction, there can be no assurance that any fair value determination thereunder would, in fact, approximate the amount that the Portfolio would actually realize upon the sale of the security or the price at which the security would trade if a reliable market price were readily available. During the year ended December 31, 2023, there were no material changes to the fair value methodologies.
Securities which may be valued in this manner include, but are not limited to: (i) a security for which trading has been halted or suspended or otherwise does not have a readily available market quotation on a given day; (ii) a debt security that has recently gone into default and for which there is not a current market quotation; (iii) a security of an issuer that has entered into a restructuring; (iv) a security that has been delisted from a national exchange; (v) a security subject to trading collars for which no or limited trading takes place; and (vi) a security whose principal market has been temporarily closed at a time when, under normal conditions, it would be open. Securities valued in this manner are generally categorized as Level 2 or 3 in the hierarchy.
Exchange-traded funds (“ETFs”) are valued at the last quoted sales prices as of the close of regular trading on the relevant exchange on each valuation date. Securities that are not traded on the valuation date are valued at the mean of the last quoted bid and ask prices. Prices are normally taken from the principal market in which each security trades. These securities are generally categorized as Level 1 in the hierarchy.
Futures contracts are valued at the last posted settlement price on the market where such futures are primarily traded. These securities are generally categorized as Level 1 in the hierarchy.
Debt securities (other than convertible and municipal bonds) are valued at the evaluated bid prices (evaluated mean prices in the case of convertible and municipal bonds) supplied by a pricing agent or broker selected by the Valuation Designee, in consultation with the Subadvisor. The evaluations are market-based measurements processed through a pricing application and represents the pricing agent’s good faith determination as to what a holder may receive in an orderly transaction under market conditions. The rules-based logic utilizes valuation techniques that reflect participants’ assumptions and vary by asset class and per methodology, maximizing the use of relevant observable data including quoted prices for similar assets, benchmark yield curves and market corroborated inputs. The evaluated bid or mean prices are deemed by the Valuation Designee, in consultation with the Subadvisor, to be representative of market values at the regular close of trading of the Exchange on each valuation date. Debt securities purchased on a delayed delivery basis are marked to market daily until settlement at the forward settlement date. Debt securities, including corporate bonds, U.S. government and federal agency bonds, municipal bonds, foreign bonds, convertible bonds,
Notes to Financial Statements (continued)
asset-backed securities and mortgage-backed securities are generally categorized as Level 2 in the hierarchy.
The information above is not intended to reflect an exhaustive list of the methodologies that may be used to value portfolio investments. The Valuation Procedures permit the use of a variety of valuation methodologies in connection with valuing portfolio investments. The methodology used for a specific type of investment may vary based on the market data available or other considerations. The methodologies summarized above may not represent the specific means by which portfolio investments are valued on any particular business day.
(B) Income Taxes. The Portfolio's policy is to comply with the requirements of the Internal Revenue Code of 1986, as amended (the “Internal Revenue Code”), applicable to regulated investment companies and to distribute all of its taxable income to the shareholders of the Portfolio within the allowable time limits.
The Manager evaluates the Portfolio’s tax positions to determine if the tax positions taken meet the minimum recognition threshold in connection with accounting for uncertainties in income tax positions taken or expected to be taken for the purposes of measuring and recognizing tax liabilities in the financial statements. Recognition of tax benefits of an uncertain tax position is permitted only to the extent the position is “more likely than not” to be sustained assuming examination by taxing authorities. The Manager analyzed the Portfolio's tax positions taken on federal, state and local income tax returns for all open tax years (for up to three tax years) and has concluded that no provisions for federal, state and local income tax are required in the Portfolio's financial statements. The Portfolio's federal, state and local income tax and federal excise tax returns for tax years for which the applicable statutes of limitations have not expired are subject to examination by the Internal Revenue Service and state and local departments of revenue.
(C) Dividends and Distributions to Shareholders. Dividends and distributions are recorded on the ex-dividend date. The Portfolio intends to declare and pay dividends from net investment income and distributions from net realized capital and currency gains, if any, at least annually. All dividends and distributions are reinvested at NAV in the same class of shares of the Portfolio. Dividends and distributions to shareholders are determined in accordance with federal income tax regulations and may differ from determinations using GAAP.
(D) Security Transactions and Investment Income. The Portfolio records security transactions on the trade date. Realized gains and losses on security transactions are determined using the identified cost method. Dividend income is recognized on the ex-dividend date, net of any foreign tax withheld at the source, and interest income is accrued as earned using the effective interest rate method. Discounts and premiums on securities purchased, other than temporary cash investments that mature in 60 days or less at the time of purchase, for the Portfolio are accreted and amortized, respectively, on the effective interest rate method.
The Portfolio may place a debt security on non-accrual status and reduce related interest income by ceasing current accruals and writing off all or a
portion of any interest receivables when the collection of all or a portion of such interest has become doubtful. A debt security is removed from non-accrual status when the issuer resumes interest payments or when collectability of interest is reasonably assured.
(E) Expenses. Expenses of the Fund are allocated to the individual Portfolios in proportion to the net assets of the respective Portfolios when the expenses are incurred, except where direct allocations of expenses can be made. The expenses borne by the Portfolio, including those of related parties to the Portfolio, are shown in the Statement of Operations.
(F) Use of Estimates. In preparing financial statements in conformity with GAAP, the Manager makes estimates and assumptions that affect the reported amounts and disclosures in the financial statements. Actual results could differ from those estimates and assumptions.
(G) Futures Contracts. A futures contract is an agreement to purchase or sell a specified quantity of an underlying instrument at a specified future date and price, or to make or receive a cash payment based on the value of a financial instrument (e.g., foreign currency, interest rate, security or securities index). The Portfolio is subject to risks such as market price risk, leverage risk, liquidity risk, counterparty risk, operational risk, legal risk and/or interest rate risk in the normal course of investing in these contracts. Upon entering into a futures contract, the Portfolio is required to pledge to the broker or futures commission merchant an amount of cash and/or U.S. government securities equal to a certain percentage of the collateral amount, known as the “initial margin.” During the period the futures contract is open, changes in the value of the contract are recognized as unrealized appreciation or depreciation by marking to market such contract on a daily basis to reflect the market value of the contract at the end of each day’s trading. The Portfolio agrees to receive from or pay to the broker or futures commission merchant an amount of cash equal to the daily fluctuation in the value of the contract. Such receipts or payments are known as “variation margin.” When the futures contract is closed, the Portfolio records a realized gain or loss equal to the difference between the proceeds from (or cost of) the closing transaction and the Portfolio's basis in the contract.
The use of futures contracts involves, to varying degrees, elements of market risk in excess of the amount recognized in the Statement of Assets and Liabilities. The contract or notional amounts and variation margin reflect the extent of the Portfolio's involvement in open futures positions. There are several risks associated with the use of futures contracts as hedging techniques. There can be no assurance that a liquid market will exist at the time when the Portfolio seeks to close out a futures contract. If no liquid market exists, the Portfolio would remain obligated to meet margin requirements until the position is closed. Futures contracts may involve a small initial investment relative to the risk assumed, which could result in losses greater than if the Portfolio did not invest in futures contracts. Futures contracts may be more volatile than direct investments in the instrument underlying the futures and may not correlate to the underlying instrument, causing a given hedge not to achieve its objectives. The Portfolio's activities in futures contracts have
| 28 | MainStay VP Indexed Bond Portfolio |
minimal counterparty risk as they are conducted through regulated exchanges that guarantee the futures against default by the counterparty. In the event of a bankruptcy or insolvency of a futures commission merchant that holds margin on behalf of the Portfolio, the Portfolio may not be entitled to the return of the entire margin owed to the Portfolio, potentially resulting in a loss. The Portfolio may invest in futures contracts to seek enhanced returns or to reduce the risk of loss by hedging certain of its holdings. The Portfolio's investment in futures contracts and other derivatives may increase the volatility of the Portfolio's NAVs and may result in a loss to the Portfolio.
(H) Securities Lending. In order to realize additional income, the Portfolio may engage in securities lending, subject to the limitations set forth in the 1940 Act and relevant guidance by the staff of the Securities and Exchange Commission (“SEC”). If the Portfolio engages in securities lending, the Portfolio will lend through its custodian, JPMorgan Chase Bank, N.A., ("JPMorgan"), acting as securities lending agent on behalf of the Portfolio. Under the current arrangement, JPMorgan will manage the Portfolio's collateral in accordance with the securities lending agency agreement between the Portfolio and JPMorgan, and indemnify the Portfolio against counterparty risk. The loans will be collateralized by cash (which may be invested in a money market fund) and/or non-cash collateral (which may include U.S. Treasury securities and/or U.S. government agency securities issued or guaranteed by the United States government or its agencies or instrumentalities) at least equal at all times to the market value of the securities loaned. Non-cash collateral held at year end is segregated and cannot be transferred by the Portfolio. The Portfolio bears the risk of delay in recovery of, or loss of rights in, the securities loaned. The Portfolio may also record a realized gain or loss on securities deemed sold due to a borrower’s inability to return securities on loan. The Portfolio bears the risk of any loss on investment of cash collateral. The Portfolio will receive compensation for lending its securities in the form of fees or it will retain a portion of interest earned on the investment of any cash collateral. The Portfolio will also continue to receive interest and dividends on the securities loaned and any gain or loss in the market price of the securities loaned that may occur during the term of the loan will be for the account of the Portfolio. Income earned from securities lending activities, if any, is reflected in the Statement of Operations.
(I) Dollar Rolls. The Portfolio may enter into dollar roll transactions in which it sells mortgage-backed securities ("MBS") from its portfolio to a counterparty from whom it simultaneously agrees to buy a similar security on a delayed delivery basis. The Portfolio generally transfers MBS where the MBS are "to be announced," therefore, the Portfolio accounts for these transactions as purchases and sales.
When accounted for as purchase and sales, the securities sold in connection with the dollar rolls are removed from the portfolio and a realized gain or loss is recognized. The securities the Portfolio has agreed to acquire are included at market value in the Portfolio of Investments and liabilities for such purchase commitments are included as payables for investments purchased. During the roll period, the Portfolio foregoes
principal and interest paid on the securities. The Portfolio is compensated by the difference between the current sales price and the forward price for the future as well as by the earnings on the cash proceeds of the initial sale. Dollar rolls may be renewed without physical delivery of the securities subject to the contract. Dollar roll transactions involve certain risks, including the risk that the securities returned to the Portfolio at the end of the roll period, while substantially similar, could be inferior to what was initially sold to the counterparty.
(J) Debt Securities Risk. The ability of issuers of debt securities held by the Portfolio to meet their obligations may be affected by, among other things, economic or political developments in a specific country, industry or region. Debt securities are also subject to the risks associated with changes in interest rates.
Investments in the Portfolio are not guaranteed, even though some of the Portfolio’s underlying investments are guaranteed by the U.S. government or its agencies or instrumentalities. The principal risk of mortgage-related and asset-backed securities is that the underlying debt may be prepaid ahead of schedule, if interest rates fall, thereby reducing the value of the Portfolio’s investment. If interest rates rise, less of the debt may be prepaid and the Portfolio may lose money because the Portfolio may be unable to invest in higher yielding assets. The Portfolio is subject to interest-rate risk and can lose principal value when interest rates rise. Bonds are also subject to credit risk, in which the bond issuer may fail to pay interest and principal in a timely manner.
The Portfolio may invest in foreign debt securities, which carry certain risks that are in addition to the usual risks inherent in domestic instruments. Foreign regulatory regimes and securities markets can have less stringent investor protections and disclosure standards and less liquid trading markets than U.S. regulatory regimes and securities markets, and can experience political, social and economic developments that may affect the value of investments in foreign securities. These risks include those resulting from currency fluctuations, future adverse political or economic developments and possible imposition of currency exchange blockages or other foreign governmental laws or restrictions. Economic sanctions and other similar governmental actions or developments could, among other things, effectively restrict or eliminate the Fund’s ability to purchase or sell certain foreign securities or groups of foreign securities, and thus may make the Fund’s investments in such securities less liquid or more difficult to value. These risks are likely to be greater in emerging markets than in developed markets. The ability of issuers of debt securities held by the Portfolio to meet their obligations may be affected by, among other things, economic or political developments in a specific country, industry or region.
(K) Indemnifications. Under the Fund’s organizational documents, its officers and trustees are indemnified against certain liabilities that may arise out of performance of their duties to the Fund. Additionally, in the normal course of business, the Portfolio enters into contracts with third-party service providers that contain a variety of representations and warranties and that may provide general indemnifications. The Portfolio's maximum exposure under these arrangements is unknown, as this would
Notes to Financial Statements (continued)
involve future claims that may be made against the Portfolio that have not yet occurred. The Manager believes that the risk of loss in connection with these potential indemnification obligations is remote. However, there can be no assurance that material liabilities related to such obligations will not arise in the future, which could adversely impact the Portfolio.
(L) Quantitative Disclosure of Derivative Holdings. The following tables show additional disclosures related to the Portfolio's derivative and hedging activities, including how such activities are accounted for and their effect on the Portfolio's financial positions, performance and cash flows.
The Portfolio entered into futures contracts in order to hedge against anticipated changes in interest rates that might otherwise have an adverse effect upon the value of the Portfolio’s securities as well as help manage the duration and yield curve positioning of the portfolio. These derivatives are not accounted for as hedging instruments.
Fair value of derivative instruments as of December 31, 2023:
| Asset Derivatives | Interest
Rate
Contracts
Risk | Total |
| Futures Contracts - Net Assets—Net unrealized appreciation on futures contracts (a) | $1,650,818 | $1,650,818 |
| Total Fair Value | $1,650,818 | $1,650,818 |
| (a) | Includes cumulative appreciation (depreciation) of futures contracts as reported in the Portfolio of Investments. Only current day’s variation margin is reported within the Statement of Assets and Liabilities. |
| Liability Derivatives | Interest
Rate
Contracts
Risk | Total |
| Futures Contracts - Net Assets—Net unrealized depreciation on futures contracts (a) | $(103,681) | $(103,681) |
| Total Fair Value | $(103,681) | $(103,681) |
| (a) | Includes cumulative appreciation (depreciation) of futures contracts as reported in the Portfolio of Investments. Only current day’s variation margin is reported within the Statement of Assets and Liabilities. |
The effect of derivative instruments on the Statement of Operations for the year ended December 31, 2023:
| Net Realized Gain (Loss) from: | Interest
Rate
Contracts
Risk | Total |
| Futures Transactions | $(2,382,813) | $(2,382,813) |
| Total Net Realized Gain (Loss) | $(2,382,813) | $(2,382,813) |
| Net Change in Unrealized Appreciation (Depreciation) | Interest
Rate
Contracts
Risk | Total |
| Futures Contracts | $1,739,740 | $1,739,740 |
| Total Net Change in Unrealized Appreciation (Depreciation) | $1,739,740 | $1,739,740 |
| Average Notional Amount | Total |
| Futures Contracts Long | $34,826,482 |
| Futures Contracts Short | $ (8,571,606) |
Note 3–Fees and Related Party Transactions
(A) Manager and Subadvisor. New York Life Investments, a registered investment adviser and an indirect, wholly-owned subsidiary of New York Life, serves as the Portfolio's Manager pursuant to an Amended and Restated Management Agreement ("Management Agreement"). The Manager provides offices, conducts clerical, recordkeeping and bookkeeping services and keeps most of the financial and accounting records required to be maintained by the Portfolio. Except for the portion of salaries and expenses that are the responsibility of the Portfolio, the Manager pays the salaries and expenses of all personnel affiliated with the Portfolio and certain operational expenses of the Portfolio. The Portfolio reimburses New York Life Investments in an amount equal to the portion of the compensation of the Chief Compliance Officer attributable to the Portfolio. NYL Investors LLC ("NYL Investors" or ''Subadvisor''), a registered investment adviser and a direct, wholly-owned subsidiary of New York Life, serves as the Subadvisor to the Portfolio and is responsible for the day-to-day portfolio management of the Portfolio. Pursuant to the terms of a Subadvisory Agreement between New York Life Investments and NYL Investors, New York Life Investments pays for the services of the Subadvisor.
Pursuant to the Management Agreement, the Fund pays the Manager, on behalf of the Portfolio, a monthly fee for the services performed and the facilities furnished at an annual rate of the Portfolio's average daily net assets as follows: 0.25% up to $1 billion and 0.20% in excess of $1 billion. During the year ended December 31, 2023, the effective management fee rate was 0.25% (exclusive of any applicable waivers/reimbursements) of the Portfolio's average daily net assets.
New York Life Investments has contractually agreed to waive fees and/or reimburse expenses so that the Total Annual Portfolio Operating Expenses (excluding taxes, interest, litigation, extraordinary expenses, brokerage and other transaction expenses relating to the purchase or sale of portfolio investments and acquired (underlying) portfolio/fund fees and expenses) of Initial Class shares do not exceed 0.375% of the Portfolio's average daily net assets. This agreement will remain in effect until May 1, 2024, and shall renew automatically for one-year terms unless New York Life Investments provides written notice of termination prior to the start of the next term or upon approval of the Board.
| 30 | MainStay VP Indexed Bond Portfolio |
During the year ended December 31, 2023, New York Life Investments earned fees from the Portfolio in the amount of $653,881 and paid the Subadvisor fees in the amount of $326,940.
JPMorgan provides sub-administration and sub-accounting services to the Portfolio pursuant to an agreement with New York Life Investments. These services include calculating the daily NAVs of the Portfolio, maintaining the general ledger and sub-ledger accounts for the calculation of the Portfolio's NAVs, and assisting New York Life Investments in conducting various aspects of the Portfolio's administrative operations. For providing these services to the Portfolio, JPMorgan is compensated by New York Life Investments.
Pursuant to an agreement between the Fund and New York Life Investments, New York Life Investments is responsible for providing or procuring certain regulatory reporting services for the Portfolio. The Portfolio will reimburse New York Life Investments for the actual costs incurred by New York Life Investments in connection with providing or procuring these services for the Portfolio.
Note 4-Federal Income Tax
As of December 31, 2023, the cost and unrealized appreciation (depreciation) of the Portfolio’s investment portfolio, including applicable derivative contracts and other financial instruments, as determined on a federal income tax basis, were as follows:
| | Federal Tax
Cost | Gross
Unrealized
Appreciation | Gross
Unrealized
(Depreciation) | Net
Unrealized
Appreciation/
(Depreciation) |
| Investments in Securities | $266,255,222 | $1,570,678 | $(17,351,659) | $(15,780,981) |
As of December 31, 2023, the components of accumulated gain (loss) on a tax basis were as follows:
Ordinary
Income | Accumulated
Capital
and Other
Gain (Loss) | Other
Temporary
Differences | Unrealized
Appreciation
(Depreciation) | Total
Accumulated
Gain (Loss) |
| $8,026,771 | $(23,493,258) | $— | $(15,611,550) | $(31,078,037) |
The difference between book-basis and tax-basis unrealized appreciation (depreciation) is primarily due to mark to market of futures contracts, wash sale and straddle loss deferral adjustments.
As of December 31, 2023, for federal income tax purposes, capital loss carryforwards of $23,323,827, as shown in the table below, were available to the extent provided by the regulations to offset future realized gains of the Portfolio. Accordingly, no capital gains distributions are
expected to be paid to shareholders until net gains have been realized in excess of such amounts.
Capital Loss
Available Through | Short-Term
Capital Loss
Amounts (000’s) | Long-Term
Capital Loss
Amounts (000’s) |
| Unlimited | $9,353 | $13,970 |
During the years ended December 31, 2023 and December 31, 2022, the tax character of distributions paid as reflected in the Statements of Changes in Net Assets was as follows:
| | 2023 | 2022 |
| Distributions paid from: | | |
| Ordinary Income | $6,208,537 | $ 7,933,251 |
| Long-Term Capital Gains | — | 3,560,351 |
| Total | $6,208,537 | $11,493,602 |
Note 5–Custodian
JPMorgan is the custodian of cash and securities held by the Portfolio. Custodial fees are charged to the Portfolio based on the Portfolio's net assets and/or the market value of securities held by the Portfolio and the number of certain transactions incurred by the Portfolio.
Note 6–Line of Credit
The Portfolio and certain other funds managed by New York Life Investments maintain a line of credit with a syndicate of banks in order to secure a source of funds for temporary purposes to meet unanticipated or excessive redemption requests.
Effective July 25, 2023, under the credit agreement (the “Credit Agreement”), the aggregate commitment amount is $600,000,000 with an additional uncommitted amount of $100,000,000. The commitment fee is an annual rate of 0.15% of the average commitment amount payable quarterly, regardless of usage, to JPMorgan, who serves as the agent to the syndicate. The commitment fee is allocated among the Portfolio and certain other funds managed by New York Life Investments based upon their respective net assets and other factors. Interest on any revolving credit loan is charged based upon the Federal Funds Rate, Daily SOFR + 0.10%, or the Overnight Bank Funding Rate, whichever is higher. The Credit Agreement expires on July 23, 2024, although the Portfolio, certain other funds managed by New York Life Investments and the syndicate of banks may renew the Credit Agreement for an additional year on the same or different terms or enter into a credit agreement with a different syndicate of banks. Prior to July 25, 2023, the aggregate commitment amount and the commitment fee were the same as those under the current Credit Agreement. During the year ended December 31, 2023, there were no borrowings made or outstanding with respect to the Portfolio under the Credit Agreement.
Notes to Financial Statements (continued)
Note 7–Interfund Lending Program
Pursuant to an exemptive order issued by the SEC, the Portfolio, along with certain other funds managed by New York Life Investments, may participate in an interfund lending program. The interfund lending program provides an alternative credit facility that permits the Portfolio and certain other funds managed by New York Life Investments to lend or borrow money for temporary purposes directly to or from one another, subject to the conditions of the exemptive order. During the year ended December 31, 2023, there were no interfund loans made or outstanding with respect to the Portfolio.
Note 8–Purchases and Sales of Securities (in 000’s)
During the year ended December 31, 2023, purchases and sales of U.S. government securities were $82,826 and $98,514, respectively. Purchases and sales of securities, other than U.S. government securities and short-term securities, were $39,975 and $54,615, respectively.
Note 9–Capital Share Transactions
Transactions in capital shares for the years ended December 31, 2023 and December 31, 2022, were as follows:
| Initial Class | Shares | Amount |
| Year ended December 31, 2023: | | |
| Shares sold | 783,139 | $ 6,717,751 |
| Shares issued to shareholders in reinvestment of distributions | 763,686 | 6,208,537 |
| Shares redeemed | (4,420,609) | (38,241,669) |
| Net increase (decrease) | (2,873,784) | $ (25,315,381) |
| Year ended December 31, 2022: | | |
| Shares sold | 7,946,321 | $ 66,908,730 |
| Shares issued to shareholders in reinvestment of distributions | 1,386,074 | 11,493,602 |
| Shares redeemed | (18,986,252) | (180,601,111) |
| Net increase (decrease) | (9,653,857) | $(102,198,779) |
Note 10–Other Matters
As of the date of this report, the Portfolio faces a heightened level of risk associated with current uncertainty, volatility and state of economies, financial markets, rising interest rates, and labor and health conditions around the world. Events such as war, acts of terrorism, recessions, rapid inflation, the imposition of international sanctions, earthquakes, hurricanes, epidemics and pandemics and other unforeseen natural or human disasters may have broad adverse social, political and economic effects on the global economy, which could negatively impact the value of the Portfolio's investments. Developments that disrupt global economies and financial markets may magnify factors that affect the Portfolio's performance.
Note 11–Subsequent Events
In connection with the preparation of the financial statements of the Portfolio as of and for the year ended December 31, 2023, events and transactions subsequent to December 31, 2023, through the date the financial statements were issued, have been evaluated by the Manager for possible adjustment and/or disclosure. No subsequent events requiring financial statement adjustment or disclosure have been identified.
| 32 | MainStay VP Indexed Bond Portfolio |
Report of Independent Registered Public Accounting Firm
To the Board of Trustees of MainStay VP Funds Trust and Shareholders of MainStay VP Indexed Bond Portfolio
Opinion on the Financial Statements
We have audited the accompanying statement of assets and liabilities, including the portfolio of investments, of MainStay VP Indexed Bond Portfolio (one of the portfolios constituting MainStay VP Funds Trust, referred to hereafter as the “Portfolio”) as of December 31, 2023, the related statement of operations for the year ended December 31, 2023, the statements of changes in net assets for each of the two years in the period ended December 31, 2023, including the related notes, and the financial highlights for each of the five years in the period ended December 31, 2023 (collectively referred to as the “financial statements”). In our opinion, the financial statements present fairly, in all material respects, the financial position of the Portfolio as of December 31, 2023, the results of its operations for the year then ended, the changes in its net assets for each of the two years in the period ended December 31, 2023 and the financial highlights for each of the five years in the period ended December 31, 2023 in conformity with accounting principles generally accepted in the United States of America.
Basis for Opinion
These financial statements are the responsibility of the Portfolio’s management. Our responsibility is to express an opinion on the Portfolio’s financial statements based on our audits. We are a public accounting firm registered with the Public Company Accounting Oversight Board (United States) (PCAOB) and are required to be independent with respect to the Portfolio in accordance with the U.S. federal securities laws and the applicable rules and regulations of the Securities and Exchange Commission and the PCAOB.
We conducted our audits of these financial statements in accordance with the standards of the PCAOB. Those standards require that we plan and perform the audit to obtain reasonable assurance about whether the financial statements are free of material misstatement, whether due to error or fraud.
Our audits included performing procedures to assess the risks of material misstatement of the financial statements, whether due to error or fraud, and performing procedures that respond to those risks. Such procedures included examining, on a test basis, evidence regarding the amounts and disclosures in the financial statements. Our audits also included evaluating the accounting principles used and significant estimates made by management, as well as evaluating the overall presentation of the financial statements. Our procedures included confirmation of securities owned as of December 31, 2023 by correspondence with the custodian and brokers; when replies were not received from brokers, we performed other auditing procedures. We believe that our audits provide a reasonable basis for our opinion.
/s/PricewaterhouseCoopers LLP
New York, New York
February 26, 2024
We have served as the auditor of one or more investment companies in the MainStay group of funds since 1984.
Board Consideration and Approval of Management Agreement and Subadvisory Agreement (Unaudited)
The continuation of the Management Agreement with respect to the MainStay VP Indexed Bond Portfolio (“Portfolio”) and New York Life Investment Management LLC (“New York Life Investments”) and the Subadvisory Agreement between New York Life Investments and NYL Investors LLC (“NYL Investors”) with respect to the Portfolio (together, “Advisory Agreements”) is subject to annual review and approval by the Board of Trustees of MainStay VP Funds Trust (“Board” of the “Trust”) in accordance with Section 15 of the Investment Company Act of 1940, as amended (“1940 Act”). At its December 6–7, 2023 meeting, the Board, including the Trustees who are not an “interested person” (as such term is defined in the 1940 Act) of the Trust (“Independent Trustees”) voting separately, unanimously approved the continuation of each of the Advisory Agreements for a one-year period.
In reaching the decision to approve the continuation of each of the Advisory Agreements, the Board considered information and materials furnished by New York Life Investments and NYL Investors in connection with an annual contract review process undertaken by the Board that took place at meetings of the Board and its Contracts Committee from September 2023 through December 2023, including information and materials furnished by New York Life Investments and NYL Investors in response to requests prepared on behalf of the Board, and in consultation with the Independent Trustees, by independent legal counsel to the Independent Trustees, which encompassed a variety of topics, including those summarized below. Information and materials requested by and furnished to the Board for consideration in connection with the contract review process included, among other items, reports on the Portfolio and “peer funds” prepared by Institutional Shareholder Services Inc. (“ISS”), an independent third-party service provider engaged by the Board to report objectively on the Portfolio’s investment performance, management fee and total expenses. The Board also considered information on the fees charged to other investment advisory clients of New York Life Investments and/or NYL Investors that follow investment strategies similar to those of the Portfolio, if any, and, when applicable, the rationale for differences in the Portfolio’s management and subadvisory fees and the fees charged to those other investment advisory clients. In addition, the Board considered information regarding the legal standards and fiduciary obligations applicable to its consideration of the continuation of each of the Advisory Agreements. The contract review process, including the structure and format for information and materials provided to the Board, has been developed in consultation with the Board. The Independent Trustees also met in executive sessions with their independent legal counsel and, for portions thereof, with senior management of New York Life Investments.
The Board’s deliberations with respect to the continuation of each of the Advisory Agreements reflect a year-long process, and the Board also took into account information furnished to the Board and its Committees throughout the year, as deemed relevant and appropriate by the Trustees, including, among other items, reports on investment performance of the Portfolio and investment-related matters for the Portfolio as well as presentations from New York Life Investments and, generally annually, NYL Investors personnel. In addition, the Board took into account other
information provided by New York Life Investments throughout the year, including, among other items, periodic reports on legal and compliance matters, risk management, portfolio turnover, brokerage commissions and non-advisory services provided to the Portfolio by New York Life Investments, as deemed relevant and appropriate by the Trustees.
In addition to information provided to the Board throughout the year, the Board received information in connection with its June 2023 meeting provided specifically in response to requests prepared on behalf of the Board, and in consultation with the Independent Trustees, by independent legal counsel to the Independent Trustees regarding the Portfolio’s distribution arrangements. In addition, the Board received information regarding the Portfolio’s asset levels and share purchase and redemption activity, among other information.
In considering the continuation of each of the Advisory Agreements, the Trustees reviewed and evaluated the information and factors they believed to reasonably be necessary and appropriate in light of legal advice furnished to them by independent legal counsel to the Independent Trustees and through the exercise of their own business judgment. Although individual Trustees may have weighed certain factors or information differently and the Board did not consider any single factor or information controlling in reaching its decision, the factors that figured prominently in the Board’s consideration of the continuation of each of the Advisory Agreements are summarized in more detail below and include, among other factors: (i) the nature, extent and quality of the services provided to the Portfolio by New York Life Investments and NYL Investors; (ii) the qualifications of the portfolio managers of the Portfolio and the historical investment performance of the Portfolio, New York Life Investments and NYL Investors; (iii) the costs of the services provided, and profits realized, by New York Life Investments and NYL Investors with respect to their relationships with the Portfolio; (iv) the extent to which economies of scale have been realized or may be realized if the Portfolio grows and the extent to which any economies of scale have been shared, have benefited or may benefit the Portfolio’s shareholders; and (v) the reasonableness of the Portfolio’s management and subadvisory fees and total ordinary operating expenses. Although the Board recognized that comparisons between the Portfolio’s fees and expenses and those of other funds are imprecise given different terms of agreements, variations in fund strategies and other factors, the Board considered the reasonableness of the Portfolio’s management fee and total ordinary operating expenses as compared to the peer funds identified by ISS. Throughout their considerations, the Trustees acknowledged the commitment of New York Life Investments and its affiliates to serve the MainStay Group of Funds, as well as their capacity, experience, resources, financial stability and reputations. The Trustees also acknowledged the entrepreneurial and other risks assumed by New York Life Investments in sponsoring and managing the Portfolio. With respect to the Subadvisory Agreement, the Board took into account New York Life Investments’ recommendation to approve the continuation of the Subadvisory Agreement.
| 34 | MainStay VP Indexed Bond Portfolio |
The Trustees noted that, throughout the year, the Trustees are afforded an opportunity to ask questions of, and request additional information or materials from, New York Life Investments and NYL Investors. The Board’s decision with respect to each of the Advisory Agreements may have also been based, in part, on the Board’s knowledge of New York Life Investments and NYL Investors resulting from, among other things, the Board’s consideration of each of the Advisory Agreements in prior years, the advisory agreements for other funds in the MainStay Group of Funds, the Board’s review throughout the year of the performance and operations of other funds in the MainStay Group of Funds and each Trustee’s business judgment and industry experience. In addition to considering the above-referenced factors, the Board observed that in the marketplace, notably under variable life insurance policies and variable annuity contracts for which the Portfolio serves as an investment option, there are a range of investment options available to investors and that the Portfolio’s shareholders, having had the opportunity to consider other investment options, have invested in the Portfolio.
The factors that figured prominently in the Board’s decision to approve the continuation of each of the Advisory Agreements during the Board’s December 6–7, 2023 meeting are summarized in more detail below.
Nature, Extent and Quality of Services Provided by New York Life Investments and NYL Investors
The Board examined the nature, extent and quality of the services that New York Life Investments provides to the Portfolio. The Board evaluated New York Life Investments’ experience and capabilities in serving as manager of the Portfolio and considered that the Portfolio operates in a “manager-of-managers” structure. The Board also considered New York Life Investments’ responsibilities and services provided pursuant to this structure, including overseeing the services provided by NYL Investors, evaluating the performance of NYL Investors, making recommendations to the Board as to whether the Subadvisory Agreement should be renewed, modified or terminated and periodically reporting to the Board regarding the results of New York Life Investments’ evaluation and monitoring functions. The Board noted that New York Life Investments manages other mutual funds, serves a variety of other investment advisory clients, including other pooled investment vehicles, and has experience overseeing mutual fund service providers, including subadvisors. The Board considered the experience of senior personnel at New York Life Investments providing management and administrative and other non-advisory services to the Portfolio. The Board observed that New York Life Investments devotes significant resources and time to providing management and administrative and other non-advisory services to the Portfolio, including New York Life Investments’ oversight and due diligence reviews of NYL Investors and ongoing analysis of, and interactions with, NYL Investors with respect to, among other things, the Portfolio’s investment performance and risks as well as NYL Investors’ investment capabilities and subadvisory services with respect to the Portfolio.
The Board also considered the range of services that New York Life Investments provides to the Portfolio under the terms of the Management Agreement, including: (i) fund accounting and ongoing supervisory services provided by New York Life Investments’ Fund Administration and Accounting Group; (ii) investment supervisory and analytical services provided by New York Life Investments’ Investment Consulting Group; (iii) compliance services provided by the Trust’s Chief Compliance Officer as well as New York Life Investments’ compliance department, including supervision and implementation of the Portfolio’s compliance program; (iv) legal services provided by New York Life Investments’ Office of the General Counsel; and (v) risk management monitoring and analysis by compliance and investment personnel. In addition, the Board considered New York Life Investments’ willingness to invest in personnel and other resources, such as cyber security, information security and business continuity planning, that may benefit the Portfolio and noted that New York Life Investments is responsible for compensating the Trust’s officers, except for a portion of the salary of the Trust’s Chief Compliance Officer. The Board recognized that New York Life Investments provides certain other non-advisory services to the Portfolio and has over time provided an increasingly broad array of non-advisory services to the MainStay Group of Funds as a result of regulatory and other developments.
The Board also examined the range, and the nature, extent and quality, of the investment advisory services that NYL Investors provides to the Portfolio and considered the terms of each of the Advisory Agreements. The Board evaluated NYL Investors’ experience and performance in serving as subadvisor to the Portfolio and advising other portfolios and NYL Investors’ track record and experience in providing investment advisory services as well as the experience of investment advisory, senior management and administrative personnel at NYL Investors. The Board considered New York Life Investments’ and NYL Investors’ overall resources, legal and compliance environment, capabilities, reputation, financial condition and history. In addition to information provided in connection with quarterly meetings with the Trust’s Chief Compliance Officer, the Board considered information regarding the compliance policies and procedures of New York Life Investments and NYL Investors and acknowledged their commitment to further developing and strengthening compliance programs that may relate to the Portfolio. The Board also considered NYL Investors’ ability to recruit and retain qualified investment professionals and willingness to invest in personnel and other resources that may benefit the Portfolio. In this regard, the Board considered the qualifications and experience of the Portfolio’s portfolio managers, the number of accounts managed by the portfolio managers and the method for compensating the portfolio managers.
In addition, the Board considered information provided by New York Life Investments and NYL Investors regarding their respective business continuity and disaster recovery plans.
Based on these considerations, among others, the Board concluded that the Portfolio would likely continue to benefit from the nature, extent and quality of these services.
Board Consideration and Approval of Management Agreement and Subadvisory Agreement (Unaudited) (continued)
Investment Performance
In evaluating the Portfolio’s investment performance, the Board considered investment performance results over various periods in light of the Portfolio’s investment objective, strategies and risks. The Board considered investment reports on, and analysis of, the Portfolio’s performance provided to the Board throughout the year. These reports include, among other items, information on the Portfolio’s gross and net returns, the Portfolio’s investment performance compared to a relevant investment category and the Portfolio’s benchmark, the Portfolio’s risk-adjusted investment performance and the Portfolio’s investment performance as compared to peer funds, as appropriate, as well as portfolio attribution information and commentary on the effect of market conditions. The Board also considered information provided by ISS showing the investment performance of the Portfolio as compared to peer funds. In addition, the Board reviewed the methodology used by ISS to construct the group of peer funds for comparative purposes.
The Board also took into account its discussions with senior management at New York Life Investments concerning the Portfolio’s investment performance over various periods as well as discussions between representatives of NYL Investors and the members of the Board’s Investment Committee, which generally occur on an annual basis. In considering the investment performance of the Portfolio, the Board noted that the Portfolio underperformed its peer funds for the one-, three- and five-year periods ended July 31, 2023. The Board considered its discussions with representatives from New York Life Investments and NYL Investors regarding the Portfolio’s investment performance.
Based on these considerations, among others, the Board concluded that its review of the Portfolio’s investment performance and related information supported a determination to approve the continuation of each of the Advisory Agreements.
Costs of the Services Provided, and Profits and Other Benefits Realized, by New York Life Investments and NYL Investors
The Board considered the costs of the services provided under each of the Advisory Agreements. The Board also considered the profitability of New York Life Investments and its affiliates, including NYL Investors, due to their relationships with the Portfolio as well as by New York Life Investments and its affiliates due to their relationships with the MainStay Group of Funds. Because NYL Investors is an affiliate of New York Life Investments whose subadvisory fee is paid by New York Life Investments, not the Portfolio, the Board considered cost and profitability information for New York Life Investments and NYL Investors in the aggregate.
In addition, the Board acknowledged the difficulty in obtaining reliable comparative data about mutual fund managers’ profitability because such information generally is not publicly available and may be impacted by numerous factors, including the structure of a fund manager’s organization, the types of funds it manages, the methodology used to allocate certain fixed costs to specific funds and the manager’s capital structure and costs of capital.
In evaluating the costs of the services provided by New York Life Investments and NYL Investors, and profitability of New York Life Investments and its affiliates, including NYL Investors due to their relationships with the Portfolio, the Board considered, among other factors, New York Life Investments’ and its affiliates’, including NYL Investors’, continuing investments in, or willingness to invest in, personnel and other resources that may support and further enhance the management of the Portfolio, and that New York Life Investments is responsible for paying the subadvisory fee for the Portfolio. The Board also considered the financial resources of New York Life Investments and NYL Investors and acknowledged that New York Life Investments and NYL Investors must be in a position to recruit and retain experienced professional personnel and to maintain a strong financial position for New York Life Investments and NYL Investors to continue to provide high-quality services to the Portfolio. The Board recognized that the Portfolio benefits from the allocation of certain fixed costs among the funds in the MainStay Group of Funds, among other expected benefits resulting from its relationship with New York Life Investments.
The Board considered information regarding New York Life Investments’ methodology for calculating profitability and allocating costs provided by New York Life Investments in connection with the fund profitability analysis presented to the Board. The Board concluded that New York Life Investments’ methods for allocating costs and procedures for estimating overall profitability of the relationship with the funds in the MainStay Group of Funds were reasonable. The Board recognized the difficulty in calculating and evaluating a manager’s profitability with respect to the Portfolio and considered that other profitability methodologies may also be reasonable.
The Board also considered certain fall-out benefits that may be realized by New York Life Investments and its affiliates, including NYL Investors, due to their relationships with the Portfolio, including reputational and other indirect benefits. In addition, the Board considered its review of the management agreement for a money market fund advised by New York Life Investments and an affiliated subadvisor that serves as an investment option for the Portfolio, including the potential rationale for and costs associated with investments in this money market fund by the Portfolio, if any, and considered information from New York Life Investments that the nature and type of specific investment advisory services provided to this money market fund are distinct from, or in addition to, the investment advisory services provided to the Portfolio. In addition, the Board considered the potential dividend received tax deduction for insurance company affiliates of New York Life Investments from the Portfolio’s securities lending activity.
The Board noted that the Portfolio serves as an investment option primarily under variable contracts issued by affiliates of New York Life Investments that would receive fees under those contracts. The Board observed that, in addition to fees earned by New York Life Investments under the Management Agreement for managing the Portfolio, New York Life Investments’ affiliates also earn revenues from serving the Portfolio in various other capacities. The Board considered information about these other revenues and their impact on the profitability of the relationship with
| 36 | MainStay VP Indexed Bond Portfolio |
the Portfolio to New York Life Investments and its affiliates. The Board noted that, although it assessed the overall profitability of the relationship with the Portfolio to New York Life Investments and its affiliates as part of the contract review process, when considering the reasonableness of the fee paid to New York Life Investments under the Management Agreement, the Board considered the profitability of New York Life Investments’ relationship with the Portfolio on a pre-tax basis and without regard to distribution expenses incurred by New York Life Investments from its own resources.
After evaluating the information deemed relevant by the Trustees, the Board concluded that any profits realized by New York Life Investments and its affiliates, including NYL Investors, due to their relationships with the Portfolio were not excessive and other expected benefits that may accrue to New York Life Investments and its affiliates, including NYL Investors, are reasonable.
Management and Subadvisory Fees and Total Ordinary Operating Expenses
The Board evaluated the reasonableness of the fee paid under each of the Advisory Agreements and the Portfolio’s total ordinary operating expenses. With respect to the management fee and subadvisory fee, the Board primarily considered the reasonableness of the management fee paid by the Portfolio to New York Life Investments because the subadvisory fee paid to NYL Investors is paid by New York Life Investments, not the Portfolio. The Board also considered the reasonableness of the subadvisory fee paid by New York Life Investments and the amount of the management fee retained by New York Life Investments.
In assessing the reasonableness of the Portfolio’s fees and expenses, the Board primarily considered comparative data provided by ISS on the fees and expenses of similar mutual funds managed by other investment advisers. The Board reviewed the methodology used by ISS to construct the group of peer funds for comparative purposes. In addition, the Board considered information provided by New York Life Investments and NYL Investors on fees charged to other investment advisory clients, including institutional separate accounts and/or other funds, that follow investment strategies similar to those of the Portfolio, if any. The Board considered the contractual management fee schedule for the Portfolio as compared to those for such other investment advisory clients, taking into account the rationale for differences in fee schedules. The Board also took into account information provided by New York Life Investments about the more extensive scope of services provided to registered investment companies, such as the Portfolio, as compared with other investment advisory clients. Additionally, the Board considered the impact of contractual breakpoints, voluntary waivers and expense limitation arrangements on the Portfolio’s net management fee and expenses. The Board also considered that in proposing fees for the Portfolio, New York Life Investments considers the competitive marketplace for mutual funds.
Based on the factors outlined above, among other considerations, the Board concluded that the Portfolio’s management fee and total ordinary operating expenses are within a range that is competitive and support a conclusion that these fees and expenses are reasonable.
Economies of Scale
The Board considered information regarding economies of scale, including whether economies of scale may exist with respect to the Portfolio and whether the Portfolio’s management fee and expense structure permits any economies of scale to be appropriately shared with the Portfolio’s shareholders. The Board also considered a report from New York Life Investments, previously prepared at the request of the Board, that addressed economies of scale, including with respect to the mutual fund business generally, and the various ways in which the benefits of economies of scale may be shared with the funds in the MainStay Group of Funds. Although the Board recognized the difficulty of determining economies of scale with precision, the Board acknowledged that economies of scale may be shared with the Portfolio in a number of ways, including, for example, through the imposition of fee breakpoints, initially setting management fee rates at scale or making additional investments to enhance the services provided to the Portfolio. The Board reviewed information from New York Life Investments showing how the Portfolio’s management fee schedule compared to fee schedules of other funds and accounts managed by New York Life Investments. The Board also reviewed information from ISS showing how the Portfolio’s management fee schedule compared with fees paid for similar services by peer funds at varying asset levels.
Based on this information, the Board concluded that economies of scale are appropriately shared for the benefit of the Portfolio’s shareholders through the Portfolio’s management fee and expense structure and other methods to share benefits from economies of scale.
Conclusion
On the basis of the information and factors summarized above, among other information and factors deemed relevant by the Trustees, and the evaluation thereof, the Board, including the Independent Trustees voting separately, unanimously voted to approve the continuation of each of the Advisory Agreements.
Proxy Voting Policies and Procedures and Proxy Voting Record
The Portfolio is required to file with the SEC its proxy voting record for the 12-month period ending June 30 on Form N-PX. A description of the policies and procedures that are used to vote proxies relating to portfolio securities of the Portfolio is available free of charge upon request by calling 800-598-2019 or visiting the SEC's website at www.sec.gov. The most recent Form N-PX or proxy voting record is available free of charge upon request by calling 800-598-2019; visiting https://www.newyorklifeinvestments.com/investment-products/vp; or visiting the SEC’s website at www.sec.gov.
Shareholder Reports and Quarterly Portfolio Disclosure
The Portfolio is required to file its complete schedule of portfolio holdings with the SEC 60 days after its first and third fiscal quarter on Form N-PORT. The Portfolio's holdings report is available free of charge upon request by calling 800-598-2019 or by visiting the SEC’s website at www.sec.gov.
Board of Trustees and Officers (Unaudited)
The Trustees and officers of the Portfolio are listed below. The Board oversees the MainStay Group of Funds (which consists of MainStay Funds and MainStay Funds Trust), MainStay VP Funds Trust, MainStay MacKay DefinedTerm Municipal Opportunities Fund, MainStay CBRE Global Infrastructure Megatrends Term Fund, the Manager and the Subadvisors, and elects the officers of the Portfolios who are responsible for the day-to-day operations of the Portfolio. Information pertaining to the Trustees and officers is set forth below. Each Trustee serves until his or her successor is elected and qualified or until his or her resignation,
death or removal. Under the Board’s retirement policy, unless an exception is made, a Trustee must tender his or her resignation by the end of the calendar year during which he or she reaches the age of 75. Officers are elected annually by the Board. The business address of each Trustee and officer listed below is 51 Madison Avenue, New York, New York 10010. A majority of the Trustees are not “interested persons” (as defined by the 1940 Act and rules adopted by the SEC thereunder) of the Portfolio (“Independent Trustees”).
| | Name and
Year of Birth | Term of Office,
Position(s) Held and
Length of Service | Principal Occupation(s)
During Past Five Years | Number of
Portfolios in
Fund Complex
Overseen by
Trustee | Other Directorships
Held by Trustee |
| | | | | | |
| | Naïm Abou-Jaoudé*
1966 | MainStay VP Funds Trust: Trustee since 2023 | Chief Executive Officer of New York Life Investment Management LLC (since 2023). Chief Executive Officer of Candriam (an affiliate of New York Life Investment Management LLC) (2007 to 2023). | 81 | MainStay Funds: Trustee since 2023 (11 Funds)
MainStay Funds Trust: Trustee since 2023 (37 Funds);
MainStay MacKay DefinedTerm Municipal Opportunities Fund: Trustee since 2023;
MainStay CBRE Global Infrastructure Megatrends Term Fund: Trustee since 2023; and
New York Life Investment Management International (Chair) since 2015 |
| * | This Trustee is considered to be an “interested person” of the MainStay Group of Funds, MainStay VP Funds Trust, MainStay CBRE Global Infrastructure Megatrends Term Fund and MainStay MacKay DefinedTerm Municipal Opportunities Fund, within the meaning of the 1940 Act because of his affiliation with New York Life Investment Management LLC and Candriam, as described in detail above in the column entitled “Principal Occupation(s) During Past Five Years.” |
| | |
Board of Trustees and Officers (Unaudited) (continued)
| | Name and
Year of Birth | Term of Office,
Position(s) Held and
Length of Service | Principal Occupation(s)
During Past Five Years | Number of
Portfolios in
Fund Complex
Overseen by
Trustee | Other Directorships
Held by Trustee |
| | | | | | |
| | David H. Chow
1957 | MainStay VP Funds Trust: Trustee since January 2016, Advisory Board Member (June 2015 to December 2015) | Founder and CEO, DanCourt Management, LLC since 1999 | 81 | MainStay Funds: Trustee since January 2016, Advisory Board Member (June 2015 to December 2015) (11 Funds);
MainStay Funds Trust: Trustee since January 2016, Advisory Board Member (June 2015 to December 2015) (37 Funds);
MainStay MacKay DefinedTerm Municipal Opportunities Fund: Trustee since January 2016, Advisory Board Member (June 2015 to December 2015);
MainStay CBRE Global Infrastructure Megatrends Term Fund: Trustee since 2021;
VanEck Vectors Group of Exchange-Traded Funds: Trustee since 2006 and Independent Chairman of the Board of Trustees from 2008 to 2022 (57 portfolios); and
Berea College of Kentucky: Trustee since 2009, Chair of the Investment Committee since 2018 |
| | Karen Hammond
1956 | MainStay VP Funds Trust: Trustee since December 2021, Advisory Board Member (June 2021 to December 2021)
| Retired, Managing Director, Devonshire Investors (2007 to 2013); Senior Vice President, Fidelity Management & Research Co. (2005 to 2007); Senior Vice President and Corporate Treasurer, FMR Corp. (2003 to 2005); Chief Operating Officer, Fidelity Investments Japan (2001 to 2003) | 81 | MainStay Funds: Trustee since December 2021, Advisory Board Member (June 2021 to December 2021) (11 Funds);
MainStay Funds Trust: Trustee since December 2021, Advisory Board Member (June 2021 to December 2021) (37 Funds);
MainStay MacKay DefinedTerm Municipal Opportunities Fund: Trustee since December 2021, Advisory Board Member (June 2021 to December 2021);
MainStay CBRE Global Infrastructure Megatrends Term Fund: Trustee since December 2021, Advisory Board Member (June 2021 to December 2021);
Two Harbors Investment Corp.: Director since 2018;
Rhode Island State Investment Commission: Member since 2017; and
Blue Cross Blue Shield of Rhode Island: Director since 2019 |
| | Susan B. Kerley
1951 | MainStay VP Funds Trust: Chair since 2017 and Trustee since 2007** | President, Strategic Management Advisors LLC since 1990 | 81 | MainStay Funds: Chair since January 2017 and Trustee since 2007 (11 Funds); MainStay Funds Trust: Chair since January 2017 and Trustee since 1990 (37 Funds)***;
MainStay MacKay DefinedTerm Municipal Opportunities Fund: Chair since January 2017 and Trustee since 2011;
MainStay CBRE Global Infrastructure Megatrends Term Fund: Trustee since June 2021; and
Legg Mason Partners Funds: Trustee since 1991 (45 portfolios) |
| 40 | MainStay VP Indexed Bond Portfolio |
| | Name and
Year of Birth | Term of Office,
Position(s) Held and
Length of Service | Principal Occupation(s)
During Past Five Years | Number of
Portfolios in
Fund Complex
Overseen by
Trustee | Other Directorships
Held by Trustee |
| | | | | | |
| | Alan R. Latshaw
1951 | MainStay VP Funds Trust: Trustee since 2007** | Retired; Partner, Ernst & Young LLP (2002 to 2003); Partner, Arthur Andersen LLP (1989 to 2002); Consultant to the MainStay Funds Audit and Compliance Committee (2004 to 2006) | 81 | MainStay Funds: Trustee since 2006 (11 Funds);
MainStay Funds Trust: Trustee since 2007 (37 Funds)***;
MainStay MacKay DefinedTerm Municipal Opportunities Fund: Trustee since 2011; and
MainStay CBRE Global Infrastructure Megatrends Term Fund: Trustee since June 2021 |
| | Jacques P. Perold
1958 | MainStay VP Funds Trust: Trustee since January 2016, Advisory Board Member (June 2015 to December 2015) | Founder and Chief Executive Officer, CapShift Advisors LLC (since 2018); President, Fidelity Management & Research Company (2009 to 2014); President and Chief Investment Officer, Geode Capital Management, LLC (2001 to 2009) | 81 | MainStay Funds: Trustee since January 2016, Advisory Board Member (June 2015 to December 2015) (11 Funds);
MainStay Funds Trust: Trustee since January 2016, Advisory Board Member (June 2015 to December 2015) (37 Funds);
MainStay MacKay DefinedTerm Municipal Opportunities Fund: Trustee since January 2016, Advisory Board Member (June 2015 to December 2015);
MainStay CBRE Global Infrastructure Megatrends Term Fund: Trustee since June 2021;
Allstate Corporation: Director since 2015;
Partners in Health: Trustee since 2019; and
MSCI Inc.: Director since 2017 |
| | Richard S. Trutanic
1952 | MainStay VP Funds Trust: Trustee since 2007** | Chairman and Chief Executive Officer, Somerset & Company (financial advisory firm) since 2004; Managing Director, The Carlyle Group (private investment firm) (2002 to 2004); Senior Managing Director, Partner and Board Member, Groupe Arnault S.A. (private investment firm) (1999 to 2002) | 81 | MainStay Funds: Trustee since 1994 (11 Funds);
MainStay Funds Trust: Trustee since 2007 (37 Funds)***;
MainStay MacKay DefinedTerm Municipal Opportunities Fund: Trustee since 2011; and
MainStay CBRE Global Infrastructure Megatrends Term Fund: Trustee since June 2021 |
| ** | Includes prior service as a Director of MainStay VP Series Fund, Inc., the predecessor to MainStay VP Funds Trust. |
| *** | Includes prior service as a Director/Trustee of certain predecessor entities to MainStay Funds Trust. |
Board of Trustees and Officers (Unaudited) (continued)
| | Name and
Year of Birth | Position(s) Held and
Length of Service | Principal Occupation(s)
During Past Five Years | |
| | | | | |
| | Kirk C. Lehneis
1974 | President, MainStay VP Funds Trust (since 2017) | Chief Operating Officer and Senior Managing Director (since 2016), New York Life Investment Management LLC and New York Life Investment Management Holdings LLC; Member of the Board of Managers (since 2017) and Senior Managing Director (since 2018), NYLIFE Distributors LLC; Chairman of the Board and Senior Managing Director, NYLIM Service Company LLC (since 2017); Trustee, President and Principal Executive Officer of IndexIQ Trust, IndexIQ ETF Trust and IndexIQ Active ETF Trust (since 2018); President, MainStay CBRE Global Infrastructure Megatrends Term Fund (since 2021), MainStay MacKay DefinedTerm Municipal Opportunities Fund, MainStay Funds and MainStay Funds Trust (since 2017); Senior Managing Director, Global Product Development (from 2015 to 2016); Managing Director, Product Development (from 2010 to 2015), New York Life Investment Management LLC | |
| | Jack R. Benintende
1964 | Treasurer and Principal Financial and Accounting Officer, MainStay VP Funds Trust (since 2007)** | Managing Director, New York Life Investment Management LLC (since 2007); Treasurer and Principal Financial and Accounting Officer, MainStay CBRE Global Infrastructure Megatrends Term Fund (since 2021), MainStay MacKay DefinedTerm Municipal Opportunities Fund (since 2011), MainStay Funds Trust (since 2009) and MainStay Funds (since 2007); and Assistant Treasurer, New York Life Investment Management Holdings LLC (2008 to 2012) | |
| | J. Kevin Gao
1967 | Secretary and Chief Legal Officer, MainStay VP Funds Trust (since 2010)** | Managing Director and Associate General Counsel, New York Life Investment Management LLC (since 2010); Secretary and Chief Legal Officer, MainStay CBRE Global Infrastructure Megatrends Term Fund (since 2021), MainStay MacKay DefinedTerm Municipal Opportunities Fund (since 2011), MainStay Funds and MainStay Funds Trust (since 2010) | |
| | Kevin M. Gleason
1967 | Vice President and Chief Compliance Officer, MainStay VP Funds Trust (since June 2022) | Vice President and Chief Compliance Officer, IndexIQ Trust, IndexIQ ETF Trust and IndexIQ Active ETF Trust (since June 2022); Vice President and Chief Compliance Officer, MainStay CBRE Global Infrastructure Megatrends Term Fund, MainStay MacKay DefinedTerm Municipal Opportunities Fund (since June 2022); MainStay Funds Trust and MainStay Funds (since June 2022); Senior Vice President, Voya Investment Management and Chief Compliance Officer, Voya Family of Funds (2012 to 2022) | |
| | Scott T. Harrington
1959 | Vice President— Administration, MainStay VP Funds Trust (since 2005)** | Managing Director, New York Life Investment Management LLC (including predecessor advisory organizations) (since 2000); Member of the Board of Directors, New York Life Trust Company (since 2009); Vice President—Administration, MainStay CBRE Global Infrastructure Megatrends Term Fund (since 2021), MainStay MacKay DefinedTerm Municipal Opportunities Fund (since 2011), MainStay Funds Trust and MainStay Funds (since 2009) | |
| * | The officers listed above are considered to be “interested persons” of the MainStay Group of Funds, MainStay VP Funds Trust, MainStay CBRE Global Infrastructure Megatrends Term Fund and MainStay MacKay DefinedTerm Municipal Opportunities Fund within the meaning of the 1940 Act because of their affiliation with the MainStay Group of Funds, New York Life Insurance Company and/or its affiliates, including New York Life Investment Management LLC, New York Life Insurance Company, NYLIM Service Company LLC, NYLIFE Securities LLC and/or NYLIFE Distributors LLC, as described in detail in the column captioned “Principal Occupation(s) During Past Five Years.” Officers are elected annually by the Board. |
| ** | Includes prior service as an Officer of MainStay VP Series Fund, Inc., the predecessor to MainStay VP Funds Trust. |
Officers of the Trust (Who are not Trustees)*
| 42 | MainStay VP Indexed Bond Portfolio |
MainStay VP Portfolios
MainStay VP offers a wide range of Portfolios. The full array of MainStay VP offerings is listed here, with information about the manager, subadvisors, legal counsel, and independent registered public accounting firm.
Equity
MainStay VP American Century Sustainable Equity Portfolio
MainStay VP Candriam Emerging Markets Equity Portfolio
MainStay VP Epoch U.S. Equity Yield Portfolio
MainStay VP Fidelity Institutional AM® Utilities Portfolio†
MainStay VP Natural Resources Portfolio
MainStay VP PineStone International Equity Portfolio1
MainStay VP S&P 500 Index Portfolio
MainStay VP Small Cap Growth Portfolio
MainStay VP Wellington Growth Portfolio
MainStay VP Wellington Mid Cap Portfolio
MainStay VP Wellington Small Cap Portfolio
MainStay VP Wellington U.S. Equity Portfolio
MainStay VP Winslow Large Cap Growth Portfolio
Mixed Asset
MainStay VP Balanced Portfolio
MainStay VP Income Builder Portfolio
MainStay VP Janus Henderson Balanced Portfolio
MainStay VP MacKay Convertible Portfolio
Income
MainStay VP Bond Portfolio
MainStay VP Floating Rate Portfolio
MainStay VP Indexed Bond Portfolio
MainStay VP MacKay Government Portfolio2
MainStay VP MacKay High Yield Corporate Bond Portfolio
MainStay VP MacKay Strategic Bond Portfolio
MainStay VP PIMCO Real Return Portfolio
Money Market
MainStay VP U.S. Government Money Market Portfolio
Alternative
MainStay VP CBRE Global Infrastructure Portfolio
MainStay VP IQ Hedge Multi-Strategy Portfolio
Asset Allocation
MainStay VP Conservative Allocation Portfolio
MainStay VP Equity Allocation Portfolio
MainStay VP Growth Allocation Portfolio
MainStay VP Moderate Allocation Portfolio
Manager
New York Life Investment Management LLC
New York, New York
Subadvisors
American Century Investment Management, Inc.
Kansas City, Missouri
Brown Advisory LLC
Baltimore, Maryland
Candriam*
Strassen, Luxembourg
CBRE Investment Management Listed Real Assets LLC
Radnor, Pennsylvania
Epoch Investment Partners, Inc.
New York, New York
FIAM LLC
Smithfield, Rhode Island
IndexIQ Advisors LLC*
New York, New York
Janus Henderson Investors US LLC
Denver, Colorado
MacKay Shields LLC*
New York, New York
Newton Investment Management North America, LLC
Boston, Massachusetts
NYL Investors LLC*
New York, New York
Pacific Investment Management Company LLC
Newport Beach, California
PineStone Asset Management Inc.
Montreal, Québec
Segall Bryant & Hamill, LLC
Chicago, Illinois
Wellington Management Company LLP
Boston, Massachusetts
Winslow Capital Management, LLC
Minneapolis, Minnesota
Legal Counsel
Dechert LLP
Washington, District of Columbia
Independent Registered Public Accounting Firm
PricewaterhouseCoopers LLP
New York, New York
Distributor
NYLIFE Distributors LLC*
Jersey City, New Jersey
Custodian
JPMorgan Chase Bank, N.A.
New York, New York
Some Portfolios may not be available in all products.
† Fidelity Institutional AM is a registered trade mark of FMR LLC. Used with permission.
* An affiliate of New York Life Investment Management LLC.
| 1. | Prior to August 28, 2023, the Portfolio's name was MainStay VP MacKay International Equity Portfolio. |
| 2. | Effective on or about May 1, 2024, the MainStay VP MacKay Government Portfolio will be renamed the MainStay VP U.S. Infrastructure Bond Portfolio. |
Not part of the Annual Report
2023 Annual Report
This report is for the general information of New York Life Variable Annuities and NYLIAC Variable Universal Life Insurance Products policyowners. It must be preceded or accompanied by the appropriate product(s) and funds prospectuses if it is given to anyone who is not an owner of a New York Life variable annuity policy or a NYLIAC Variable Universal Life Insurance Product. This report does not offer for sale or solicit orders to purchase securities.
The performance data quoted in this report represents past performance. Past performance is no guarantee of future results. Due to market volatility and other factors, current performance may be lower or higher than the figures shown. The most recent month-end performance summary for your variable annuity or variable life policy is available by calling 800-598-2019 and is updated periodically on newyorklife.com.
The New York Life Variable Annuities and NYLIAC Variable Universal Life Insurance Products are issued by New York Life Insurance and Annuity Corporation (a Delaware Corporation) and distributed by NYLIFE Distributors LLC (Member FINRA/SIPC).
New York Life Insurance Company
New York Life Insurance and Annuity
Corporation (NYLIAC) (A Delaware Corporation)
51 Madison Avenue, Room 551
New York, NY 10010
newyorklife.com
newyorklifeinvestments.com
NYLIFE Distributors LLC, 30 Hudson Street, Jersey City, NJ 07302
New York Life Investment Management LLC is the investment manager to the MainStay VP Funds Trust
©2024 by NYLIFE Distributors LLC. All rights reserved.
You may obtain copies of the Prospectus and the Statement of Additional Information free of charge, upon request, by calling toll-free 800-598-2019 or writing to New York Life Insurance and Annuity Corporation, 51 Madison Avenue, New York, NY 10010.
| Not FDIC Insured | No Bank Guarantee | May Lose Value |
(NYLIAC) NI555
MainStay VP Janus Henderson Balanced Portfolio
Message from the President and Annual Report
December 31, 2023
Special Notice:
Beginning in July 2024, new regulations issued by the Securities and Exchange Commission (SEC) will take effect requiring open-end mutual fund companies and ETFs to (1) overhaul the content of their shareholder reports and (2) mail paper copies of the new tailored shareholder reports to shareholders who have not opted to receive these documents electronically.
If you have not yet elected to receive your shareholder reports electronically, please contact your financial intermediary or visit our website.
| Not FDIC/NCUA Insured | Not a Deposit | May Lose Value | No Bank Guarantee | Not Insured by Any Government Agency |
This page intentionally left blank
Message from the President
Against a backdrop of easing inflationary pressures and continued economic growth, stocks and bonds generally gained ground during the 12-month period ended December 31, 2023, despite high levels of volatility and sharp disparities between the performance of the different market sectors.
Although the war in Ukraine, the outbreak of hostilities in the Middle East and several other notable events affected financial assets, inflation, interest rate, and economic growth trends stood at the forefront of market developments during most of the period. As the reporting period began, high levels of inflation already showed signs of easing in the face of aggressive rate hikes by U.S. Federal Reserve (the “Fed”). From a peak of 9.1% in June 2022, the annualized U.S. inflation rate dropped to 6.4% in January, and 3.4% in December 2023. At the same time, the Fed increased the benchmark federal funds rate from 4.25%–4.50% at the beginning of reporting period, to 5.25%–5.50% as of the end of 2023. Despite the increasing cost of capital and tighter lending environment that resulted from rising rates, economic growth remained surprisingly robust, bolstered by high levels of consumer spending, low levels of unemployment and better-than-expected corporate earnings. With the pace of rate increases slowing from the prior year, investors began hoping for an early shift to a looser monetary policy, with stock prices and bond yields reacting as economic data and statements from the Fed either reinforced or undercut those hopes. Following months of hawkish rhetoric, the Fed finally reversed its stance in December 2023, signaling a positive economic outlook with little chance of a recession and a likelihood of rate cuts in 2024.
The S&P 500® Index, a widely regarded benchmark of U.S. market performance, produced strong gains during the reporting period-– recovering all its losses from 2022 and approached new record territory. A preponderance of the Index’s gains were generated by a relatively small number of mega-cap stocks in the information technology, communication services and consumer discretionary sectors that stood to benefit from rapid developments in generative artificial intelligence (“AI”). Value-oriented, interest-rate sensitive and small-capitalization
shares lagged by significant margins, although market strength widened during the closing weeks of the reporting period. Most overseas equity markets trailed the U.S. market, as developed international economies experienced relatively low growth rates, and weak economic conditions in China undermined emerging markets.
Bonds produced generally positive returns, bolstered by attractive and relatively stable yields. The yield on the 10-year Treasury note hit a high of just under 5% in mid-October 2023, ranging between approximately 3.5% and 4.8% for most of the reporting period. The yield curve remained inverted throughout the year, with the 2-year Treasury yield modestly above the 10-year yield. Corporate bond prices trended moderately higher, generally outperforming government securities. After years of low yields and tight credit spreads, the corporate sector benefited from more attractive valuations and income opportunities. Among corporates, markets generally rewarded longer duration and lower credit quality, although an uptick in default rates posed added risks for high-yield corporate bonds. International bond markets produced mixed returns, with emerging-markets issues advancing over their developed-markets counterparts.
The market volatility of recent years reminds us of the constant need for experienced and steadfast portfolio management in the face of uncertainty. New York Life Investments remains dedicated to providing you, as a valued MainStay VP investor, with the guidance, resources and investment solutions you need to pursue your financial goals.
Thank you for trusting us to help meet your investment needs.
Sincerely,
Kirk C. Lehneis
President
The opinions expressed are as of the date of this report and are subject to change. There is no guarantee that any forecast made will come to pass. This material does not constitute investment advice and is not intended as an endorsement of any specific investment. Past performance is no guarantee of future results.
Not part of the Annual Report
Investors should refer to the Portfolio’s Summary Prospectus and/or Prospectus and consider the Portfolio’s investment objectives, strategies, risks, charges and expenses carefully before investing. The Summary Prospectus and/or Prospectus contain this and other information about the Portfolio. You may obtain copies of the Portfolio’s Summary Prospectus, Prospectus and Statement of Additional Information, which includes information about the MainStay VP Funds Trust's Trustees, free of charge, upon request, by calling toll-free 800-598-2019, by writing to New York Life Insurance and Annuity Corporation, 51 Madison Avenue, Room 251, New York, New York 10010 or by sending an email to MainStayShareholdersServices@nylim.com. These documents are also available at newyorklifeinvestments.com/investment-products/vp. Please read the Portfolio's Summary Prospectus and/or Prospectus carefully before investing. MainStay VP Funds Trust portfolios are separate account options which are purchased through a variable insurance or variable annuity contract.
Investment and Performance Comparison (Unaudited)
Performance data quoted represents past performance. Past performance is no guarantee of future results. Because of market volatility and other factors, current performance may be lower or higher than the figures shown. Investment return and principal value will fluctuate, and as a result, when shares are redeemed, they may be worth more or less than their original cost. The performance table and graph do not reflect any deduction of sales charges, mortality and expense charges, contract charges or administrative charges. Please refer to the Performance Summary appropriate for your policy. For performance information current to the most recent month-end, please call 800-598-2019 or visit www.newyorklife.com.
Performance figures may reflect certain fee waivers and/or expense limitations, without which total returns may have been different. For information on current fee waivers and/or expense limitations (if any), please refer to the Notes to Financial Statements.
| Average Annual Total Returns for the Year-Ended December 31, 2023 |
| Class | Inception
Date | One
Year | Five
Years | Ten
Years | Gross
Expense
Ratio1 |
| Initial Class Shares | 2/17/2012 | 15.52% | 9.76% | 8.05% | 0.57% |
| Service Class Shares | 2/17/2012 | 15.23 | 9.48 | 7.78 | 0.82 |
| 1. | The gross expense ratios presented reflect the Portfolio’s “Total Annual Portfolio Operating Expenses” from the most recent Prospectus and may differ from other expense ratios disclosed in this report. |
| Benchmark Performance* | One
Year | Five
Years | Ten
Years |
| S&P 500® Index1 | 26.29% | 15.69% | 12.03% |
| Bloomberg U.S. Aggregate Bond Index2 | 5.53 | 1.10 | 1.81 |
| Janus Balanced Composite Index3 | 16.62 | 9.26 | 7.59 |
| Morningstar Moderate Allocation Category Average4 | 13.78 | 8.16 | 6.07 |
| * | Returns for indices reflect no deductions for fees, expenses or taxes, except for foreign withholding taxes where applicable. Results assume reinvestment of all dividends and capital gains. An investment cannot be made directly in an index. |
| 1. | The S&P 500® Index is the Portfolio's primary benchmark. S&P 500® is a trademark of The McGraw-Hill Companies, Inc. The S&P 500® Index is widely regarded as the standard index for measuring large-cap U.S. stock market performance. |
| 2. | The Portfolio has selected the Bloomberg U.S. Aggregate Bond Index as a secondary benchmark. The Bloomberg U.S. Aggregate Bond Index is a broad-based benchmark that measures performance of the investment-grade, U.S. dollar denominated, fixed-rate taxable bond market, including Treasuries, government-related and corporate securities, mortgage-backed securities (agency fixed-rate and hybrid adjustable-rate mortgage pass-throughs), asset-backed securities and commercial mortgage-backed securities. |
| 3. | The Portfolio has selected the Janus Balanced Composite Index as an additional benchmark. The Janus Balanced Composite Index consists of the S&P 500® Index (55% weighted) and the Bloomberg U.S. Aggregate Bond Index (45% weighted). |
| 4. | The Morningstar Moderate Allocation Category Average is representative of funds in allocation categories that seek to provide both income and capital appreciation by primarily investing in multiple asset classes, including stocks, bonds, and cash. These moderate strategies seek to balance preservation of capital with appreciation. They typically expect volatility similar to a strategic equity exposure between 50% and 70%. Results are based on average total returns of similar funds with all dividends and capital gain distributions reinvested. |
Cost in Dollars of a $1,000 Investment in MainStay VP Janus Henderson Balanced Portfolio (Unaudited)
The example below is intended to describe the fees and expenses borne by shareholders during the six-month period from July 1, 2023 to December 31, 2023, and the impact of those costs on your investment.
Example
As a shareholder of the Portfolio you incur two types of costs: (1) transaction costs, including exchange fees and sales charges (loads) on purchases (as applicable), and (2) ongoing costs, including management fees, distribution and/or service (12b-1) fees and other Portfolio expenses (as applicable). This example is intended to help you understand your ongoing costs (in dollars) of investing in the Portfolio and to compare these costs with the ongoing costs of investing in other mutual funds. The example is based on an investment of $1,000 made at the beginning of the six-month period and held for the entire period from July 1, 2023 to December 31, 2023. Shares are only sold in connection with variable life and annuity contracts and the example does not reflect any contract level or transactional fees or expenses. If these costs had been included, your costs would have been higher.
This example illustrates your Portfolio’s ongoing costs in two ways:
Actual Expenses
The second and third data columns in the table below provide information about actual account values and actual expenses. You may use the information in these columns, together with the amount you invested, to estimate the expenses that you paid during the six months ended
December 31, 2023. Simply divide your account value by $1,000 (for example, an $8,600 account value divided by $1,000 = 8.6), then multiply the result by the number under the heading entitled “Expenses Paid During Period” to estimate the expenses you paid on your account during this period.
Hypothetical Example for Comparison Purposes
The fourth and fifth data columns in the table below provide information about hypothetical account values and hypothetical expenses based on the Portfolio’s actual expense ratio and an assumed rate of return of 5% per year before expenses, which is not the Portfolio’s actual return. The hypothetical account values and expenses may not be used to estimate the actual ending account balances or expenses you paid for the six-month period shown. You may use this information to compare the ongoing costs of investing in the Portfolio with the ongoing costs of investing in other mutual funds. To do so, compare this 5% hypothetical example with the 5% hypothetical examples that appear in the shareholder reports of the other mutual funds.
Please note that the expenses shown in the table are meant to highlight your ongoing costs only and do not reflect any transactional costs, such as exchange fees or sales charges (loads). Therefore, the fourth and fifth data columns of the table are useful in comparing ongoing costs only and will not help you determine the relative total costs of owning different funds. In addition, if these transactional costs were included, your costs would have been higher.
| Share Class | Beginning
Account
Value
7/1/23 | Ending Account
Value (Based
on Actual
Returns and
Expenses)
12/31/23 | Expenses
Paid
During
Period1 | Ending Account
Value (Based
on Hypothetical
5% Annualized
Return and
Actual Expenses)
12/31/23 | Expenses
Paid
During
Period1 | Net Expense
Ratio
During
Period2 |
| Initial Class Shares | $1,000.00 | $1,057.50 | $2.96 | $1,022.33 | $2.91 | 0.57% |
| Service Class Shares | $1,000.00 | $1,056.10 | $4.25 | $1,021.07 | $4.18 | 0.82% |
| 1. | Expenses are equal to the Portfolio’s annualized expense ratio of each class multiplied by the average account value over the period, divided by 365 and multiplied by 184 (to reflect the six-month period). The table above represents the actual expenses incurred during the six-month period. In addition to the fees and expenses which the Portfolio bears directly, it also indirectly bears a pro rata share of the fees and expenses of the underlying funds in which it invests. Such indirect expenses are not included in the above-reported expense figures. |
| 2. | Expenses are equal to the Portfolio's annualized expense ratio to reflect the six-month period. |
| 6 | MainStay VP Janus Henderson Balanced Portfolio |
Portfolio Composition as of December 31, 2023 (Unaudited)
See Portfolio of Investments beginning on page 11 for specific holdings within these categories. The Portfolio's holdings are subject to change.
Top Ten Holdings and/or Issuers Held as of December 31, 2023 (excluding short-term investments) (Unaudited)
| 1. | U.S. Treasury Bonds, 4.125%-4.75%, due 8/15/43–11/15/53 |
| 2. | Microsoft Corp. |
| 3. | UMBS, 30 Year, 2.50%-6.00%, due 2/1/37–9/1/53 |
| 4. | Apple, Inc. |
| 5. | Alphabet, Inc., Class C |
| 6. | U.S. Treasury Notes, 4.375%-4.50%, due 12/15/26–11/15/33 |
| 7. | NVIDIA Corp. |
| 8. | UMBS Pool, 30 Year, 2.50%-6.50%, due 4/1/40–11/1/53 |
| 9. | Mastercard, Inc., Class A |
| 10. | UnitedHealth Group, Inc. |
Portfolio Management Discussion and Analysis (Unaudited)
Answers to the questions reflect the views of portfolio managers Michael Keough, Jeremiah Buckley, CFA and Greg Wilensky of Janus Henderson Investors US (“Janus Henderson”) the Portfolio’s Subadvisor.
How did MainStay VP Janus Henderson Balanced Portfolio perform relative to its benchmarks and peers during the 12 months ended December 31, 2023?
For the 12 months ended December 31, 2023, MainStay VP Janus Henderson Balanced Portfolio returned 15.52% for Initial Class shares and 15.23% for Service Class shares. Over the same period, both share classes underperformed the 26.29% return of the S&P 500® Index, which is the Portfolio’s primary benchmark, and outperformed the 5.53% return of the Bloomberg U.S. Aggregate Bond Index, which is a secondary benchmark of the Portfolio. For the 12 months ended December 31, 2023, both share classes underperformed the 16.62% return of the Janus Balanced Composite Index, which is an additional benchmark of the Portfolio, and outperformed the 13.78% return of the Morningstar Moderate Allocation Category Average.1
What factors affected the Portfolio’s performance relative to its primary prospectus benchmark during the reporting period?
The Portfolio underperformed the S&P 500® Index primarily due to the Portfolio’s allocation to fixed income, which held back returns against the all-equity Index during a reporting period in which equities posted relatively strong gains. The equity portion of the Portfolio also underperformed the S&P 500® Index, largely due to unfavorable positioning in the consumer discretionary, industrials and communication services sectors.
During the reporting period, which sectors were the strongest positive contributors to relative performance in the equity portion of Portfolio and which sectors were particularly weak?
The health care sector made the strongest positive contribution to the performance of the equity portion of Portfolio relative to the S&P 500® Index, due to strong stock selection. (Contributions take weightings and total returns into account.) Underweight exposure to the lagging energy sector further enhanced relative performance, although the energy position generated a negative total return. Stock selection made financials the third-strongest contributing sector to the equity portion of the Portfolio’s relative returns. Zero weight in the utility and real estate sectors bolstered relative performance as well.
Disappointing stock selection caused the consumer discretionary sector to detract most significantly from the equity portion of the Portfolio’s performance relative to the S&P 500® Index. The industrial sector produced the second-weakest relative returns, due to stock selection and overweight allocation, followed by communication services, based on stock selection and underweight allocation.
During the reporting period, which individual stocks made the strongest positive contributions to the absolute performance of the equity portion of the Portfolio and which individual stocks detracted the most?
Shares in productivity software company Microsoft provided the strongest positive contributions to the absolute performance of the equity portion of the Portfolio. The stock benefited from the developments in, and optimism regarding, artificial intelligence (AI)—particularly Microsoft’s integration of AI in its products, such as the Bing search engine. The potential for increased demand for the company’s cloud business, Azure, also supported the stock.
Graphics semiconductor company NVIDIA provided the second-strongest positive contribution to absolute performance. NVIDIA was another beneficiary of trends in AI, when supply was outpaced by demand for the company’s graphics processor units used in generative AI applications. Nvidia’s graphic processing units, developer tools and partnerships set the standard in AI, fueling excitement about the company’s long-term growth opportunities given the array of applications that its technologies enable.
Consumer technology stock Apple was the third-strongest contributor to the Portfolio’s performance. The stock benefited from better-than-expected iPhone sales, favorable commodity costs, and a higher services contribution to its revenues, with services setting a new, all-time revenue record.
The weakest contribution to absolute performance came from holdings in American variety store Dollar General, which generated a negative total return. The discount retailer struggled amid inventory challenges as well as financial constraints facing core clientele. We closed the Portfolio’s position during the reporting period.
Shares in multinational investment bank and financial services holding company Bank of America declined as well, making the position the second-weakest contributor to absolute performance. The combination of private markets taking growth opportunities, increasing regulation that could lead to more capital requirements, and a slower-than-expected recovery in investment banking and capital markets led us to close the Portfolio’s position.
Holdings in agricultural chemical and seed company Corteva produced the third-weakest contribution to absolute performance, also generating negative total return. The company lowered guidance for the second half of the year as inventory destocking in crop chemicals generally led to lower sales volumes, particularly in Brazil.
| 1. | See "Investment and Performance Comparison" for more information on benchmark and peer group returns. |
| 8 | MainStay VP Janus Henderson Balanced Portfolio |
Did the equity portion of the Portfolio make any significant purchases or sales during the reporting period?
After closing the Portfolio’s position in online retailer Amazon.com earlier in 2023, we re-established a position in the company on the view that e-commerce growth was accelerating, and Amazon’s capabilities—given its investments in distribution, inventories and infrastructure—made it more convenient and compelling for the consumer. A favorable view on the growth outlook for cloud spending and Amazon’s discipline regarding expenses further contributed to the decision to re-introduce the position. The Portfolio also initiated a position in diversified software developer Adobe, believing that the company’s new AI-incorporated product offering, Firefly, will eventually lead to an acceleration in revenue growth. Additionally, Adobe exhibited high-quality execution and strong product development innovation, and we saw an attractive entry point into this growth-oriented name in the latter part of the reporting period.
Among significant sales, we closed the Portfolio’s positions in Dollar General and Bank of America, for the reasons described above.
How did sector weightings change in the equity portion of the Portfolio during the reporting period?
During the reporting period, the equity portion of the Portfolio increased its exposure to the information technology, communication services, financials and energy sectors, while decreasing its exposure to health care, industrials, consumer staples, materials, consumer discretionary and real estate.
How was the equity portion of the Portfolio positioned at the end of the reporting period?
As of December 31, 2023, relative to the S&P 500® Index, the largest overweight position in the equity portion of the Portfolio was in consumer discretionary, followed by health care and then financials. The most significantly underweight positions as of the same date were in energy, industrials and materials. As of December 31, 2023, the Portfolio did not hold stocks in the utilities or real estate sectors.
What was the duration2 strategy of the fixed-income portion of the Portfolio during the reporting period?
We took a dynamic approach to the duration positioning of the fixed-income portion of Portfolio, seeking to increase or reduce duration depending on our conviction regarding expectations for
the future trajectory of interest rates. Entering the reporting period, the fixed-income portion of Portfolio held underweight duration relative to the Bloomberg U.S. Aggregate Bond Index, and continued to do so for the first half of the year. Just after mid-2023, we adopted a neutral yield curve3 stance and positioned the Portfolio for a modestly steeper yield curve, given that the U.S. Federal Reserve (the “Fed”) appeared to be nearing the end of its rate hiking cycle. After the Fed’s December 2023 pivot, when the central bank indicated a likelihood of multiple rate cuts in 2024, we reduced the Portfolio’s duration as rates increased, ending the reporting period with a duration of 6.05 years, or approximately 98% of the Bloomberg U.S. Aggregate Bond Index's duration.
In the first half of the period, the Portfolio’s underweight duration position contributed positively to relative performance as rates continued to rise. The Portfolio’s neutral-to-modestly-underweight stance gave back some earlier gains as rates fell in advance of the Fed’s December pivot, however, for the entire period, duration positioning had a positive impact on relative performance.
What specific factors, risks or market forces prompted significant decisions for the fixed-income portion of the Portfolio during the reporting period?
The shifting outlook for recession, inflation data and Fed policy, yield-curve shifts, instability in the banking sector and corporate fundamentals all played a role in our dynamic adjustment of allocations throughout the reporting period. We actively managed duration, for example, adding at attractive yield levels, positioning for the end of the Fed’s rate hiking cycle, and adjusting for the Fed’s December pivot.
Within the spread4 risk allocation of the fixed-income portion of the Portfolio, we maintained a relatively defensive stance during most of the period, but still held overweight exposure to spread risk versus the Bloomberg U.S. Aggregate Bond Index. The fixed income portion of the Portfolio held overweight exposure to securitized sectors for the year as a whole, as we believed securitized spreads were attractively valued and appropriately reflected the risk of an economic slowdown. We were active in agency and non-agency mortgage-backed securities (MBS) and remained selective and active within commercial mortgage-backed securities (CMBS), with minimal exposure to the troubled office sector.
In the third quarter of 2023, economic data and corporate results came in better than expected, and we added to the Portfolio’s spread risk allocation, including corporate investment-grade
| 2. | Duration is a measure of the price sensitivity of a fixed-income investment to changes in interest rates. Duration is expressed as a number of years and is considered a more accurate sensitivity gauge than average maturity. |
| 3. | The yield curve is a line that plots the yields of various securities of similar quality—typically U.S. Treasury issues—across a range of maturities. The U.S. Treasury yield curve serves as a benchmark for other debt and is used in economic forecasting. |
| 4. | The terms “spread” and “yield spread” may refer to the difference in yield between a security or type of security and comparable U.S. Treasury issues. The terms may also refer to the difference in yield between two specific securities or types of securities at a given time. |
exposure in select issuers with strong fundamentals. On a corporate industry basis, we increased exposure to utilities, believing the sector would likely fare better in a lower-growth environment. We also pursued select opportunities in the new issue market, and sought to capitalize on attractive new issues in banking and industrial names. Within banking, we consolidated exposure in the companies that appeared best positioned to navigate a more challenging lending environment. The fall in rates that occurred late in the reporting period benefited the banking sector, and we modestly trimmed the Portfolio’s corporate positions as the sector outperformed.
During the reporting period, which market segments made the strongest positive contributions to the performance of the fixed-income portion of the Portfolio and which market segments were particularly weak?
Spread risk positioning helped bolster performance due to the fixed-income portion of the Portfolio’s overweight exposure relative to the Bloomberg U.S. Aggregate Bond Index. Notably, positioning in CMBS, asset-backed securities (ABS) and collateralized mortgage obligations (CMOs) proved beneficial.
A small position in SVB Financial Group ("SVB")—which we had materially reduced prior to the bank’s failure and fully exited by mid-March—generated negative returns and weighed on relative results. Positioning in agency MBS also detracted relative to the Bloomberg U.S. Aggregate Bond Index.
Did the fixed-income portion of the Portfolio make any significant purchases or sales during the reporting period?
We believed that securitized credit was generally attractively valued, with valuations reflecting the risk of recession. Accordingly, throughout the reporting period, we added to the fixed-income portion of the Portfolio’s mortgage holdings, including non-agency MBS and CMBS. We also added selectively to corporate credit.
As noted above, we materially reduced the Portfolio’s small position in SVB prior to the bank’s failure and fully exited the position by mid-March. We also reduced the Portfolio’s exposure to Treasury securities during the reporting period.
During the reporting period, how did industry weightings change in the fixed-income portion of the Portfolio?
On a corporate industry basis, the fixed-income portion of the Portfolio added exposure in electric utilities, banking, and
brokerage asset managers and exchanges, while reducing exposure to health care and finance companies.
How was the fixed-income portion of the Portfolio positioned at the end of the reporting period?
As of December 31, 2023, relative to the Bloomberg U.S. Aggregate Bond Index, the fixed-income portion of the Portfolio held underweight allocation to Treasury securities, government-related securities and corporate credit, and an overweight allocation to MBS, asset-backed securities and CMBS. The fixed-income portion of the Portfolio held out-of-Index positions in CMOs, CLOs and cash, as well as a very small out-of-Index position in high-yield corporates.
The opinions expressed are those of the portfolio managers as of the date of this report and are subject to change. There is no guarantee that any forecasts will come to pass. This material does not constitute investment advice and is not intended as an endorsement of any specific investment.
Not all MainStay VP Portfolios and/or share classes are available under all policies.
| 10 | MainStay VP Janus Henderson Balanced Portfolio |
Portfolio of Investments December 31, 2023†^
| | Principal
Amount | Value |
| Long-Term Bonds 37.8% |
| Asset-Backed Securities 2.6% |
| Automobile Asset-Backed Securities 0.3% |
| ACC Auto Trust | |
| Series 2022-A, Class A | | |
| 4.58%, due 7/15/26 (a) | $ 128,695 | $ 127,689 |
| Arivo Acceptance Auto Loan Receivables Trust | |
| Series 2022-1A, Class A | | |
| 3.93%, due 5/15/28 (a) | 210,990 | 207,114 |
| Exeter Automobile Receivables Trust | |
| Series 2021-1A, Class D | | |
| 1.08%, due 11/16/26 | 674,000 | 652,023 |
| JPMorgan Chase Bank NA (a) | |
| Series 2021-1, Class B | | |
| 0.875%, due 9/25/28 | 58,467 | 57,416 |
| Series 2021-2, Class B | | |
| 0.889%, due 12/26/28 | 152,797 | 149,367 |
| LAD Auto Receivables Trust (a) | |
| Series 2021-1A, Class A | | |
| 1.30%, due 8/17/26 | 113,297 | 111,916 |
| Series 2022-1A, Class A | | |
| 5.21%, due 6/15/27 | 666,039 | 662,621 |
| Lendbuzz Securitization Trust (a) | |
| Series 2022-1A, Class A | | |
| 4.22%, due 5/17/27 | 572,562 | 560,313 |
| Series 2023-1A, Class A2 | | |
| 6.92%, due 8/15/28 | 447,959 | 450,315 |
| Santander Bank Auto Credit-Linked Notes (a) | |
| Series 2022-A, Class B | | |
| 5.281%, due 5/15/32 | 599,075 | 593,972 |
| Series 2022-B, Class A2 | | |
| 5.587%, due 8/16/32 | 203,481 | 202,918 |
| Santander Bank NA | |
| Series 2021-1A, Class B | | |
| 1.833%, due 12/15/31 (a) | 85,324 | 83,125 |
| Tesla Auto Lease Trust | |
| Series 2021-B, Class B | | |
| 0.91%, due 9/22/25 (a) | 258,000 | 251,637 |
| Westlake Automobile Receivables Trust | |
| Series 2020-1A, Class D | | |
| 2.80%, due 6/16/25 (a) | 119,565 | 119,279 |
| | | 4,229,705 |
| Credit Card Asset-Backed Security 0.1% |
| Mercury Financial Credit Card Master Trust | |
| Series 2023-1A, Class A | | |
| 8.04%, due 9/20/27 (a) | 1,065,000 | 1,076,644 |
| | Principal
Amount | Value |
| |
| Home Equity Asset-Backed Securities 0.2% |
| Saluda Grade Alternative Mortgage Trust (a)(b) | |
| Series 2023-FIG4, Class A | | |
| 6.718%, due 11/25/53 | $ 1,040,000 | $ 1,056,250 |
| Series 2023-FIG3, Class A | | |
| 7.067%, due 8/25/53 | 1,578,469 | 1,579,191 |
| Towd Point Mortgage Trust | |
| Series 2023-CES2, Class A1A | | |
| 7.294%, due 10/25/63 (a)(b) | 603,610 | 617,591 |
| | | 3,253,032 |
| Other Asset-Backed Securities 2.0% |
| American Tower Trust #1 | |
| 5.49%, due 3/15/28 (a) | 2,081,000 | 2,110,750 |
| Aqua Finance Trust | |
| Series 2021-A, Class A | | |
| 1.54%, due 7/17/46 (a) | 238,861 | 213,376 |
| ARES LX CLO Ltd. | |
| Series 2021-60A, Class A | | |
| 6.777% (3 Month SOFR + 1.382%), due 7/18/34 (a)(c) | 322,000 | 321,661 |
| CBAM Ltd. (a)(c) | |
| Series 2019-11RA, Class A1 | | |
| 6.857% (3 Month SOFR + 1.442%), due 1/20/35 | 1,569,000 | 1,565,073 |
| Series 2019-11RA, Class B | | |
| 7.427% (3 Month SOFR + 2.012%), due 1/20/35 | 400,456 | 398,053 |
| CF Hippolyta Issuer LLC (a) | |
| Series 2021-1A, Class A1 | | |
| 1.53%, due 3/15/61 | 951,872 | 850,797 |
| Series 2021-1A, Class B1 | | |
| 1.98%, due 3/15/61 | 360,015 | 305,338 |
| Series 2022-1A, Class A1 | | |
| 5.97%, due 8/15/62 | 1,257,567 | 1,236,762 |
| Series 2022-1A, Class A2 | | |
| 6.11%, due 8/15/62 | 2,900,123 | 2,832,168 |
| CIFC Funding Ltd. (a)(c) | |
| Series 2021-7A, Class A1 | | |
| 6.804% (3 Month SOFR + 1.392%), due 1/23/35 | 483,000 | 482,982 |
| Series 2021-7A, Class B | | |
| 7.274% (3 Month SOFR + 1.862%), due 1/23/35 | 323,837 | 321,594 |
| CIM Trust (a)(d) | |
| Series 2021-NR1, Class A1 | | |
| 2.569%, due 7/25/55 | 317,907 | 313,410 |
| Series 2021-NR4, Class A1 | | |
| 2.816%, due 10/25/61 | 252,896 | 243,010 |
The notes to the financial statements are an integral part of, and should be read in conjunction with, the financial statements.
11
Portfolio of Investments December 31, 2023†^ (continued)
| | Principal
Amount | Value |
| Asset-Backed Securities (continued) |
| Other Asset-Backed Securities (continued) |
| CP EF Asset Securitization I LLC | |
| Series 2022-1A, Class A | | |
| 5.96%, due 4/15/30 (a) | $ 268,615 | $ 266,666 |
| CP EF Asset Securitization II LLC | |
| Series 2023-1A, Class A | | |
| 7.48%, due 3/15/32 (a) | 734,701 | 737,313 |
| CRB Securitization Trust | |
| Series 2023-1, Class A | | |
| 6.96%, due 10/20/33 (a) | 315,990 | 319,610 |
| CyrusOne Data Centers Issuer I LLC | |
| Series 2023-2A, Class A2 | | |
| 5.56%, due 11/20/48 (a) | 1,402,000 | 1,334,543 |
| Diamond Infrastructure Funding LLC | |
| Series 2021-1A, Class A | | |
| 1.76%, due 4/15/49 (a) | 1,031,000 | 915,152 |
| Domino's Pizza Master Issuer LLC | |
| Series 2018-1A, Class A2I | | |
| 4.116%, due 7/25/48 (a) | 879,700 | 854,664 |
| Elmwood CLO II Ltd. | |
| Series 2019-2A, Class AR | | |
| 6.827% (3 Month SOFR + 1.412%), due 4/20/34 (a)(c) | 485,000 | 484,971 |
| HPS Loan Management Ltd. | |
| Series 2021-16A, Class B | | |
| 7.374% (3 Month SOFR + 1.962%), due 1/23/35 (a)(c) | 310,367 | 309,025 |
| Libra Solutions LLC (a) | |
| Series 2022-1A, Class A | | |
| 4.75%, due 5/15/34 | 125,414 | 125,017 |
| Series 2022-2A, Class A | | |
| 6.85%, due 10/15/34 | 174,545 | 174,439 |
| LL ABS Trust | |
| Series 2022-2A, Class A | | |
| 6.63%, due 5/15/30 (a) | 79,556 | 79,531 |
| Logan CLO II Ltd. | |
| Series 2021-2A, Class A | | |
| 6.827% (3 Month SOFR + 1.412%), due 1/20/35 (a)(c) | 761,109 | 761,074 |
| M&T Equipment Notes (a) | |
| Series 2023-1A, Class A3 | | |
| 5.74%, due 7/15/30 | 331,000 | 333,017 |
| Series 2023-1A, Class A2 | | |
| 6.09%, due 7/15/30 | 602,000 | 603,323 |
| Marlette Funding Trust | |
| Series 2023-2A, Class B | | |
| 6.54%, due 6/15/33 (a) | 338,000 | 340,354 |
| | Principal
Amount | Value |
| |
| Other Asset-Backed Securities (continued) |
| New Economy Assets Phase 1 Sponsor LLC | |
| Series 2021-1, Class B1 | | |
| 2.41%, due 10/20/61 (a) | $ 514,000 | $ 416,713 |
| NRZ Excess Spread-Collateralized Notes (a) | |
| Series 2021-FHT1, Class A | | |
| 3.104%, due 7/25/26 | 313,876 | 291,538 |
| Series 2020-PLS1, Class A | | |
| 3.844%, due 12/25/25 | 172,356 | 164,278 |
| Oak Street Investment Grade Net Lease Fund | |
| Series 2020-1A, Class A1 | | |
| 1.85%, due 11/20/50 (a) | 793,809 | 720,309 |
| Octagon Investment Partners 48 Ltd. | |
| Series 2020-3A, Class AR | | |
| 6.827% (3 Month SOFR + 1.412%), due 10/20/34 (a)(c) | 454,000 | 453,982 |
| Pagaya AI Debt Trust | |
| Series 2022-1, Class A | | |
| 2.03%, due 10/15/29 (a) | 171,465 | 168,866 |
| PRET LLC | |
| Series 2023-RN1, Class A1 | | |
| 8.232%, due 9/25/53 (a)(d) | 1,583,572 | 1,615,696 |
| PRPM LLC (a)(d) | |
| Series 2021-9, Class A1 | | |
| 2.363%, due 10/25/26 | 682,038 | 660,842 |
| Series 2021-10, Class A1 | | |
| 2.487%, due 10/25/26 | 793,387 | 763,734 |
| Series 2022-2, Class A1 | | |
| 5.00%, due 3/25/27 | 1,293,317 | 1,268,249 |
| RAD CLO 21 Ltd. | |
| Series 2023-21A, Class A | | |
| 6.964% (3 Month SOFR + 1.59%), due 1/25/33 (a)(c) | 835,946 | 835,522 |
| Regatta XXIII Funding Ltd. (a)(c) | |
| Series 2021-4A, Class A1 | | |
| 6.827% (3 Month SOFR + 1.412%), due 1/20/35 | 1,413,000 | 1,412,965 |
| Series 2021-4A, Class B | | |
| 7.377% (3 Month SOFR + 1.962%), due 1/20/35 | 343,955 | 343,931 |
| THL Credit Wind River CLO Ltd. | |
| Series 2019-1A, Class AR | | |
| 6.837% (3 Month SOFR + 1.422%), due 7/20/34 (a)(c) | 448,000 | 445,938 |
| Upstart Securitization Trust (a) | |
| Series 2021-4, Class A | | |
| 0.84%, due 9/20/31 | 18,036 | 17,978 |
| Series 2021-5, Class A | | |
| 1.31%, due 11/20/31 | 40,592 | 40,305 |
The notes to the financial statements are an integral part of, and should be read in conjunction with, the financial statements.
| 12 | MainStay VP Janus Henderson Balanced Portfolio |
| | Principal
Amount | Value |
| Asset-Backed Securities (continued) |
| Other Asset-Backed Securities (continued) |
| Upstart Securitization Trust (a) (continued) | |
| Series 2022-1, Class A | | |
| 3.12%, due 3/20/32 | $ 369,359 | $ 364,740 |
| Series 2022-2, Class A | | |
| 4.37%, due 5/20/32 | 390,048 | 388,380 |
| Vantage Data Centers Issuer LLC | |
| Series 2020-1A, Class A2 | | |
| 1.645%, due 9/15/45 (a) | 1,091,000 | 1,008,742 |
| Vantage Data Centers LLC | |
| Series 2020-2A, Class A2 | | |
| 1.992%, due 9/15/45 (a) | 705,000 | 612,895 |
| VCAT LLC | |
| Series 2021-NPL1, Class A1 | | |
| 5.289%, due 12/26/50 (a)(d) | 94,740 | 94,316 |
| Westgate Resorts LLC | |
| Series 2022-1A, Class A | | |
| 1.788%, due 8/20/36 (a) | 197,738 | 189,441 |
| | | 31,113,033 |
Total Asset-Backed Securities
(Cost $40,350,659) | | 39,672,414 |
| Corporate Bonds 9.0% |
| Aerospace & Defense 0.1% |
| L3Harris Technologies, Inc. | | |
| 5.40%, due 7/31/33 | 1,027,000 | 1,067,817 |
| Banks 3.1% |
| Bank of America Corp. (e) | | |
| 5.819%, due 9/15/29 | 2,761,000 | 2,850,108 |
| 5.872%, due 9/15/34 | 2,636,000 | 2,759,286 |
| 6.204%, due 11/10/28 | 1,776,000 | 1,852,618 |
| Series X | | |
| 6.25%, due 9/5/24 (f) | 1,172,000 | 1,161,205 |
| Bank of Montreal | | |
| 3.088% (5 Year Treasury Constant Maturity Rate + 1.40%), due 1/10/37 (c) | 1,270,000 | 1,024,295 |
| Bank of New York Mellon Corp. (The) (e) | | |
| 4.947%, due 4/26/27 | 806,000 | 806,240 |
| 5.834%, due 10/25/33 | 266,000 | 282,003 |
| 6.317%, due 10/25/29 | 704,000 | 747,782 |
| 6.474%, due 10/25/34 (g) | 1,448,000 | 1,603,927 |
| BNP Paribas SA | | |
| 2.591%, due 1/20/28 (a)(e) | 728,000 | 673,434 |
| | Principal
Amount | Value |
| |
| Banks (continued) |
| Citigroup, Inc. (e) | | |
| 3.887%, due 1/10/28 | $ 2,060,000 | $ 1,991,994 |
| Series P | | |
| 5.95%, due 5/15/25 (f) | 584,000 | 571,624 |
| Series M | | |
| 6.30%, due 5/15/24 (f) | 123,000 | 121,282 |
| Goldman Sachs Group, Inc. (The) | | |
| 3.50%, due 4/1/25 | 2,399,000 | 2,344,439 |
| JPMorgan Chase & Co. (e) | | |
| Series FF | | |
| 5.00%, due 8/1/24 (f) | 441,000 | 432,959 |
| 5.299%, due 7/24/29 | 1,374,000 | 1,394,213 |
| 5.35%, due 6/1/34 | 567,000 | 575,071 |
| 6.087%, due 10/23/29 (g) | 1,391,000 | 1,462,515 |
| 6.254%, due 10/23/34 | 2,396,000 | 2,597,233 |
| Mitsubishi UFJ Financial Group, Inc. | | |
| 4.788% (1 Year Treasury Constant Maturity Rate + 1.70%), due 7/18/25 (c) | 931,000 | 926,598 |
| Morgan Stanley | | |
| 1.593%, due 5/4/27 (e) | 685,000 | 631,150 |
| 2.188%, due 4/28/26 (e) | 1,231,000 | 1,182,566 |
| 2.943%, due 1/21/33 (e) | 1,008,000 | 857,464 |
| 3.772%, due 1/24/29 (e) | 134,000 | 127,793 |
| 4.35%, due 9/8/26 | 898,000 | 881,265 |
| 5.05%, due 1/28/27 (e) | 404,000 | 404,390 |
| 5.123%, due 2/1/29 (e) | 907,000 | 911,125 |
| 5.164%, due 4/20/29 (e) | 1,265,000 | 1,272,231 |
| 5.424%, due 7/21/34 (e) | 2,042,000 | 2,072,381 |
| 5.449%, due 7/20/29 (e) | 614,000 | 625,636 |
| National Australia Bank Ltd. | | |
| 2.99%, due 5/21/31 (a) | 1,708,000 | 1,428,690 |
| Nordea Bank Abp | | |
| 5.375%, due 9/22/27 (a) | 1,834,000 | 1,864,403 |
| PNC Financial Services Group, Inc. (The) (e) | | |
| 5.582%, due 6/12/29 | 2,018,000 | 2,061,048 |
| 6.037%, due 10/28/33 | 556,000 | 580,914 |
| 6.875%, due 10/20/34 | 2,133,000 | 2,367,924 |
| Sumitomo Mitsui Financial Group, Inc. | | |
| 5.852%, due 7/13/30 | 472,000 | 493,608 |
| Toronto-Dominion Bank (The) | | |
| 5.523%, due 7/17/28 (g) | 1,363,000 | 1,403,264 |
| Truist Financial Corp. | | |
| 6.047%, due 6/8/27 (e) | 779,000 | 792,721 |
The notes to the financial statements are an integral part of, and should be read in conjunction with, the financial statements.
13
Portfolio of Investments December 31, 2023†^ (continued)
| | Principal
Amount | Value |
| Corporate Bonds (continued) |
| Banks (continued) |
| U.S. Bancorp | | |
| 2.491% (5 Year Treasury Constant Maturity Rate + 0.95%), due 11/3/36 (c)(g) | $ 1,471,000 | $ 1,140,806 |
| 5.775%, due 6/12/29 (e) | 1,244,000 | 1,278,028 |
| | | 48,556,233 |
| Beverages 0.0% ‡ |
| Diageo Capital plc | | |
| 1.375%, due 9/29/25 | 461,000 | 435,181 |
| Biotechnology 0.1% |
| Illumina, Inc. | | |
| 5.80%, due 12/12/25 | 707,000 | 709,419 |
| Royalty Pharma plc | | |
| 3.55%, due 9/2/50 (g) | 899,000 | 638,294 |
| | | 1,347,713 |
| Chemicals 0.3% |
| Celanese US Holdings LLC | | |
| 6.33%, due 7/15/29 | 575,000 | 602,756 |
| 6.35%, due 11/15/28 (g) | 581,000 | 609,304 |
| 6.55%, due 11/15/30 | 1,456,000 | 1,539,177 |
| 6.70%, due 11/15/33 | 1,419,000 | 1,539,045 |
| | | 4,290,282 |
| Commercial Services 0.2% |
| CoStar Group, Inc. | | |
| 2.80%, due 7/15/30 (a) | 711,000 | 604,307 |
| Global Payments, Inc. | | |
| 2.15%, due 1/15/27 | 651,000 | 599,309 |
| 4.80%, due 4/1/26 | 629,000 | 623,515 |
| GXO Logistics, Inc. | | |
| 1.65%, due 7/15/26 | 885,000 | 797,728 |
| 2.65%, due 7/15/31 | 135,000 | 110,694 |
| | | 2,735,553 |
| Computers 0.1% |
| Leidos, Inc. | | |
| 2.30%, due 2/15/31 | 250,000 | 209,251 |
| 5.75%, due 3/15/33 | 832,000 | 867,591 |
| | | 1,076,842 |
| Cosmetics & Personal Care 0.1% |
| Haleon US Capital LLC | | |
| 3.375%, due 3/24/27 | 753,000 | 724,502 |
| 3.375%, due 3/24/29 (g) | 480,000 | 453,961 |
| | | 1,178,463 |
| | Principal
Amount | Value |
| |
| Distribution & Wholesale 0.1% |
| LKQ Corp. | | |
| 5.75%, due 6/15/28 | $ 1,278,000 | $ 1,307,996 |
| 6.25%, due 6/15/33 | 1,199,000 | 1,252,922 |
| | | 2,560,918 |
| Diversified Financial Services 0.8% |
| AerCap Ireland Capital DAC | | |
| 4.625%, due 10/15/27 | 610,000 | 597,292 |
| Air Lease Corp. | | |
| 1.875%, due 8/15/26 (g) | 1,020,000 | 938,208 |
| American Express Co. | | |
| 5.043%, due 5/1/34 (e) | 1,297,000 | 1,294,743 |
| Capital One Financial Corp. (e) | | |
| 6.312%, due 6/8/29 | 546,000 | 560,147 |
| 7.624%, due 10/30/31 | 808,000 | 887,900 |
| Charles Schwab Corp. (The) | | |
| 6.136%, due 8/24/34 (e) | 1,709,000 | 1,801,415 |
| LPL Holdings, Inc. | | |
| 6.75%, due 11/17/28 | 1,921,000 | 2,047,824 |
| Nasdaq, Inc. | | |
| 5.35%, due 6/28/28 | 291,000 | 299,715 |
| 5.55%, due 2/15/34 | 1,947,000 | 2,022,642 |
| 5.95%, due 8/15/53 | 919,000 | 987,122 |
| 6.10%, due 6/28/63 | 390,000 | 421,036 |
| | | 11,858,044 |
| Electric 0.6% |
| American Electric Power Co., Inc. | | |
| 5.625%, due 3/1/33 | 1,325,000 | 1,380,373 |
| Duke Energy Corp. | | |
| 4.30%, due 3/15/28 | 920,000 | 907,025 |
| Duquesne Light Holdings, Inc. | | |
| 2.775%, due 1/7/32 (a) | 1,005,000 | 802,517 |
| Georgia Power Co. | | |
| 4.65%, due 5/16/28 | 681,000 | 686,206 |
| 4.95%, due 5/17/33 (g) | 1,077,000 | 1,085,688 |
| National Grid plc | | |
| 5.602%, due 6/12/28 | 480,000 | 494,528 |
| 5.809%, due 6/12/33 | 1,006,000 | 1,057,065 |
| Xcel Energy, Inc. | | |
| 5.45%, due 8/15/33 | 2,316,000 | 2,388,426 |
| | | 8,801,828 |
| Electronics 0.2% |
| Trimble, Inc. | | |
| 4.75%, due 12/1/24 | 1,238,000 | 1,225,458 |
| 4.90%, due 6/15/28 | 468,000 | 470,230 |
| 6.10%, due 3/15/33 | 1,656,000 | 1,772,253 |
| | | 3,467,941 |
The notes to the financial statements are an integral part of, and should be read in conjunction with, the financial statements.
| 14 | MainStay VP Janus Henderson Balanced Portfolio |
| | Principal
Amount | Value |
| Corporate Bonds (continued) |
| Food 0.3% |
| Albertsons Cos., Inc. | | |
| 6.50%, due 2/15/28 (a) | $ 871,000 | $ 881,407 |
| JBS USA LUX SA | | |
| 3.00%, due 5/15/32 | 795,000 | 647,258 |
| 3.625%, due 1/15/32 | 551,000 | 472,357 |
| 5.50%, due 1/15/30 | 1,130,000 | 1,110,537 |
| Mondelez International, Inc. | | |
| 2.75%, due 4/13/30 (g) | 80,000 | 72,259 |
| Pilgrim's Pride Corp. | | |
| 6.25%, due 7/1/33 | 1,429,000 | 1,470,332 |
| Sysco Corp. | | |
| 5.75%, due 1/17/29 | 551,000 | 573,966 |
| | | 5,228,116 |
| Hand & Machine Tools 0.1% |
| Regal Rexnord Corp. | | |
| 6.05%, due 4/15/28 (a) | 1,026,000 | 1,038,596 |
| Healthcare-Services 0.6% |
| Centene Corp. | | |
| 2.45%, due 7/15/28 | 1,025,000 | 912,865 |
| 3.00%, due 10/15/30 (g) | 1,079,000 | 934,461 |
| 4.25%, due 12/15/27 | 3,132,000 | 3,017,849 |
| HCA, Inc. | | |
| 3.625%, due 3/15/32 | 663,000 | 592,838 |
| 5.20%, due 6/1/28 | 346,000 | 349,550 |
| 5.375%, due 9/1/26 | 220,000 | 221,010 |
| 5.50%, due 6/1/33 (g) | 1,130,000 | 1,147,744 |
| 5.625%, due 9/1/28 | 310,000 | 317,244 |
| 5.875%, due 2/15/26 (g) | 286,000 | 288,432 |
| 5.875%, due 2/1/29 | 459,000 | 473,803 |
| UnitedHealth Group, Inc. | | |
| 5.25%, due 2/15/28 | 598,000 | 618,374 |
| | | 8,874,170 |
| Insurance 0.2% |
| Athene Global Funding (a) | | |
| 2.646%, due 10/4/31 | 1,063,000 | 863,633 |
| 2.717%, due 1/7/29 | 1,235,000 | 1,073,703 |
| Brown & Brown, Inc. | | |
| 4.95%, due 3/17/52 | 1,071,000 | 949,241 |
| | | 2,886,577 |
| Investment Companies 0.2% |
| Blackstone Private Credit Fund | | |
| 7.30%, due 11/27/28 (a) | 1,324,000 | 1,376,336 |
| | Principal
Amount | Value |
| |
| Investment Companies (continued) |
| Blue Owl Credit Income Corp. | | |
| 4.70%, due 2/8/27 | $ 163,000 | $ 153,966 |
| 7.75%, due 9/16/27 | 973,000 | 1,003,207 |
| 7.95%, due 6/13/28 (a) | 558,000 | 578,378 |
| | | 3,111,887 |
| Media 0.4% |
| Charter Communications Operating LLC | | |
| 6.65%, due 2/1/34 | 2,805,000 | 2,957,825 |
| Comcast Corp. | | |
| 4.55%, due 1/15/29 | 867,000 | 870,708 |
| Fox Corp. | | |
| 4.03%, due 1/25/24 | 429,000 | 428,474 |
| 6.50%, due 10/13/33 (g) | 1,309,000 | 1,416,922 |
| | | 5,673,929 |
| Oil & Gas 0.1% |
| EQT Corp. | | |
| 5.70%, due 4/1/28 | 459,000 | 465,801 |
| Southwestern Energy Co. | | |
| 4.75%, due 2/1/32 | 716,000 | 662,452 |
| Viper Energy, Inc. | | |
| 7.375%, due 11/1/31 (a) | 1,269,000 | 1,313,415 |
| | | 2,441,668 |
| Pipelines 0.3% |
| Columbia Pipelines Operating Co. LLC (a) | | |
| 5.927%, due 8/15/30 | 332,000 | 343,293 |
| 6.036%, due 11/15/33 (g) | 799,000 | 836,769 |
| 6.497%, due 8/15/43 | 161,000 | 172,421 |
| 6.544%, due 11/15/53 | 833,000 | 917,141 |
| Enbridge, Inc. | | |
| 5.70%, due 3/8/33 | 709,000 | 736,932 |
| 6.20%, due 11/15/30 (g) | 278,000 | 297,465 |
| Energy Transfer LP | | |
| 4.95%, due 6/15/28 | 116,000 | 115,546 |
| 5.55%, due 2/15/28 (g) | 880,000 | 897,688 |
| Hess Midstream Operations LP | | |
| 5.125%, due 6/15/28 (a) | 670,000 | 646,414 |
| | | 4,963,669 |
| Real Estate 0.2% |
| CBRE Services, Inc. | | |
| 5.95%, due 8/15/34 | 2,507,000 | 2,633,760 |
The notes to the financial statements are an integral part of, and should be read in conjunction with, the financial statements.
15
Portfolio of Investments December 31, 2023†^ (continued)
| | Principal
Amount | Value |
| Corporate Bonds (continued) |
| Real Estate Investment Trusts 0.2% |
| Agree LP | | |
| 2.00%, due 6/15/28 | $ 684,000 | $ 593,130 |
| 2.60%, due 6/15/33 | 513,000 | 406,562 |
| 2.90%, due 10/1/30 | 473,000 | 405,203 |
| Equinix, Inc. | | |
| 2.15%, due 7/15/30 | 623,000 | 527,825 |
| GLP Capital LP | | |
| 5.30%, due 1/15/29 | 86,000 | 85,503 |
| 5.375%, due 4/15/26 | 381,000 | 378,644 |
| Sun Communities Operating LP | | |
| 2.70%, due 7/15/31 (g) | 1,283,000 | 1,069,064 |
| | | 3,465,931 |
| Semiconductors 0.4% |
| Analog Devices, Inc. | | |
| 2.95%, due 4/1/25 | 676,000 | 661,501 |
| Foundry JV Holdco LLC | | |
| 5.875%, due 1/25/34 (a) | 3,338,000 | 3,428,573 |
| Marvell Technology, Inc. | | |
| 1.65%, due 4/15/26 | 793,000 | 737,731 |
| 4.875%, due 6/22/28 | 883,000 | 880,337 |
| 5.75%, due 2/15/29 | 612,000 | 632,317 |
| | | 6,340,459 |
| Software 0.2% |
| MSCI, Inc. (a) | | |
| 3.625%, due 9/1/30 | 1,643,000 | 1,486,577 |
| 3.875%, due 2/15/31 | 1,122,000 | 1,025,150 |
| 4.00%, due 11/15/29 | 104,000 | 97,747 |
| | | 2,609,474 |
| Telecommunications 0.0% ‡ |
| AT&T, Inc. | | |
| 3.65%, due 9/15/59 | 105,000 | 75,253 |
| Toys, Games & Hobbies 0.1% |
| Hasbro, Inc. | | |
| 3.90%, due 11/19/29 | 2,072,000 | 1,926,900 |
| 5.10%, due 5/15/44 | 189,000 | 169,027 |
| | | 2,095,927 |
Total Corporate Bonds
(Cost $139,895,492) | | 138,816,231 |
| | Principal
Amount | Value |
| Foreign Government Bonds 0.1% |
| France 0.1% |
| Electricite de France SA (a) | | |
| 5.70%, due 5/23/28 | $ 557,000 | $ 576,299 |
| 6.25%, due 5/23/33 | 873,000 | 944,749 |
| | | 1,521,048 |
Total Foreign Government Bonds
(Cost $1,432,452) | | 1,521,048 |
| Mortgage-Backed Securities 6.2% |
| Agency (Collateralized Mortgage Obligations) 0.1% |
| FNMA | |
| REMIC, Series 2018-27, Class EA | | |
| 3.00%, due 5/25/48 | 493,407 | 441,171 |
| REMIC, Series 2019-71, Class P | | |
| 3.00%, due 11/25/49 | 711,466 | 637,737 |
| | | 1,078,908 |
| Commercial Mortgage Loans (Collateralized Mortgage Obligations) 2.8% |
| 280 Park Avenue Mortgage Trust | |
| Series 2017-280P, Class A | | |
| 6.542% (1 Month SOFR + 1.18%), due 9/15/34 (a)(c) | 699,152 | 671,541 |
| BBCMS Trust | |
| Series 2015-SRCH, Class A2 | | |
| 4.197%, due 8/10/35 (a) | 875,000 | 801,238 |
| BPR Trust (a) | |
| Series 2023-BRK2, Class A | | |
| 6.899%, due 11/5/28 (b) | 1,329,000 | 1,390,460 |
| Series 2022-OANA, Class A | | |
| 7.26% (1 Month SOFR + 1.898%), due 4/15/37 (c) | 1,896,000 | 1,868,647 |
| BX Commercial Mortgage Trust (a)(c) | |
| Series 2021-VINO, Class A | | |
| 6.129% (1 Month SOFR + 0.767%), due 5/15/38 | 845,772 | 832,243 |
| Series 2019-XL, Class A | | |
| 6.396% (1 Month SOFR + 1.034%), due 10/15/36 | 594,701 | 593,189 |
| Series 2020-VKNG, Class A | | |
| 6.406% (1 Month SOFR + 1.044%), due 10/15/37 | 183,076 | 181,639 |
| Series 2021-VOLT, Class B | | |
| 6.426% (1 Month SOFR + 1.064%), due 9/15/36 | 937,000 | 912,293 |
The notes to the financial statements are an integral part of, and should be read in conjunction with, the financial statements.
| 16 | MainStay VP Janus Henderson Balanced Portfolio |
| | Principal
Amount | Value |
| Mortgage-Backed Securities (continued) |
| Commercial Mortgage Loans (Collateralized Mortgage Obligations) (continued) |
| BX Commercial Mortgage Trust (a)(c) (continued) | |
| Series 2019-XL, Class B | | |
| 6.556% (1 Month SOFR + 1.194%), due 10/15/36 | $ 411,400 | $ 409,308 |
| Series 2021-VOLT, Class D | | |
| 7.126% (1 Month SOFR + 1.764%), due 9/15/36 | 984,000 | 945,702 |
| Series 2023-VLT2, Class A | | |
| 7.643% (1 Month SOFR + 2.281%), due 6/15/40 | 328,000 | 328,269 |
| Series 2023-VLT2, Class B | | |
| 8.491% (1 Month SOFR + 3.129%), due 6/15/40 | 729,000 | 730,093 |
| BX Trust (a) | |
| Series 2019-OC11, Class B | | |
| 3.605%, due 12/9/41 | 284,000 | 253,158 |
| Series 2019-OC11, Class C | | |
| 3.856%, due 12/9/41 | 564,000 | 500,762 |
| Series 2022-FOX2, Class A2 | | |
| 6.111% (1 Month SOFR + 0.749%), due 4/15/39 (c) | 1,009,670 | 979,904 |
| Series 2021-LBA, Class AJV | | |
| 6.276% (1 Month SOFR + 0.914%), due 2/15/36 (c) | 1,118,000 | 1,099,773 |
| Series 2021-LBA, Class AV | | |
| 6.276% (1 Month SOFR + 0.914%), due 2/15/36 (c) | 887,288 | 872,823 |
| Series 2019-MMP, Class C | | |
| 6.856% (1 Month SOFR + 1.494%), due 8/15/36 (c) | 292,536 | 279,494 |
| BXP Trust | |
| Series 2017-GM, Class A | | |
| 3.379%, due 6/13/39 (a) | 396,000 | 368,025 |
| CENT Trust | |
| Series 2023-CITY, Class A | | |
| 7.982% (1 Month SOFR + 2.62%), due 9/15/38 (a)(c) | 1,337,000 | 1,343,700 |
| Cold Storage Trust (a)(c) | |
| Series 2020-ICE5, Class A | | |
| 6.372% (1 Month SOFR + 1.014%), due 11/15/37 | 1,480,384 | 1,473,397 |
| Series 2020-ICE5, Class B | | |
| 6.772% (1 Month SOFR + 1.414%), due 11/15/37 | 657,621 | 650,172 |
| | Principal
Amount | Value |
| |
| Commercial Mortgage Loans (Collateralized Mortgage Obligations) (continued) |
| Cold Storage Trust (a)(c) (continued) | |
| Series 2020-ICE5, Class C | | |
| 7.122% (1 Month SOFR + 1.764%), due 11/15/37 | $ 660,570 | $ 653,088 |
| Credit Suisse Mortgage Capital Certificates (a)(c) | |
| Series 2019-ICE4, Class A | | |
| 6.389% (1 Month SOFR + 1.027%), due 5/15/36 | 1,555,131 | 1,555,161 |
| Series 2019-ICE4, Class C | | |
| 6.839% (1 Month SOFR + 1.477%), due 5/15/36 | 332,174 | 331,205 |
| CSMC Trust | |
| Series 2021-WEHO, Class A | | |
| 9.446% (1 Month SOFR + 4.084%), due 4/15/26 (a)(c) | 660,526 | 645,904 |
| DBCCRE Mortgage Trust (a)(h) | |
| Series 2014-ARCP, Class D | | |
| 4.934%, due 1/10/34 | 151,000 | 149,419 |
| Series 2014-ARCP, Class E | | |
| 4.934%, due 1/10/34 | 699,000 | 690,747 |
| Series 2014-ARCP, Class F | | |
| 4.934%, due 1/10/34 | 128,000 | 126,202 |
| DC Commercial Mortgage Trust | |
| Series 2023-DC, Class A | | |
| 6.314%, due 9/12/40 (a) | 1,114,000 | 1,149,060 |
| Extended Stay America Trust | |
| Series 2021-ESH, Class A | | |
| 6.556% (1 Month SOFR + 1.194%), due 7/15/38 (a)(c) | 504,058 | 499,316 |
| Great Wolf Trust (a)(c) | |
| Series 2019-WOLF, Class A | | |
| 6.71% (1 Month SOFR + 1.148%), due 12/15/36 | 695,000 | 692,360 |
| Series 2019-WOLF, Class B | | |
| 7.01% (1 Month SOFR + 1.448%), due 12/15/36 | 303,000 | 301,082 |
| Series 2019-WOLF, Class C | | |
| 7.309% (1 Month SOFR + 1.747%), due 12/15/36 | 337,000 | 334,227 |
| Hudsons Bay Simon JV Trust (a) | |
| Series 2015-HB7, Class A7 | | |
| 3.914%, due 8/5/34 | 397,301 | 355,565 |
| Series 2015-HB10, Class A10 | | |
| 4.155%, due 8/5/34 | 173,485 | 152,817 |
The notes to the financial statements are an integral part of, and should be read in conjunction with, the financial statements.
17
Portfolio of Investments December 31, 2023†^ (continued)
| | Principal
Amount | Value |
| Mortgage-Backed Securities (continued) |
| Commercial Mortgage Loans (Collateralized Mortgage Obligations) (continued) |
| J.P. Morgan Chase Commercial Mortgage Securities Trust (a) | |
| Series 2020-ACE, Class A | | |
| 3.287%, due 1/10/37 | $ 1,235,000 | $ 1,190,225 |
| Series 2020-ACE, Class B | | |
| 3.64%, due 1/10/37 | 840,000 | 800,145 |
| Life Mortgage Trust (a)(c) | |
| Series 2021-BMR, Class A | | |
| 6.176% (1 Month SOFR + 0.814%), due 3/15/38 | 2,072,101 | 2,026,517 |
| Series 2021-BMR, Class C | | |
| 6.576% (1 Month SOFR + 1.214%), due 3/15/38 | 908,264 | 879,722 |
| Series 2022-BMR2, Class A1 | | |
| 6.657% (1 Month SOFR + 1.295%), due 5/15/39 | 1,231,000 | 1,203,303 |
| Series 2022-BMR2, Class B | | |
| 7.156% (1 Month SOFR + 1.794%), due 5/15/39 | 357,000 | 348,044 |
| Med Trust (a)(c) | |
| Series 2021-MDLN, Class A | | |
| 6.426% (1 Month SOFR + 1.064%), due 11/15/38 | 289,610 | 283,975 |
| Series 2021-MDLN, Class E | | |
| 8.626% (1 Month SOFR + 3.264%), due 11/15/38 | 1,255,972 | 1,220,764 |
| MHC Commercial Mortgage Trust (a)(c) | |
| Series 2021-MHC, Class A | | |
| 6.277% (1 Month SOFR + 0.915%), due 4/15/38 | 1,533,866 | 1,517,509 |
| Series 2021-MHC, Class C | | |
| 6.827% (1 Month SOFR + 1.465%), due 4/15/38 | 866,138 | 853,099 |
| NCMF Trust | |
| Series 2022-MFP, Class A | | |
| 7.104% (1 Month SOFR + 1.742%), due 3/15/39 (a)(c) | 639,000 | 632,819 |
| OPEN Trust | |
| Series 2023-AIR, Class C | | |
| 10.598% (1 Month SOFR + 5.236%), due 10/15/28 (a)(c) | 327,599 | 328,585 |
| SMRT | |
| Series 2022-MINI, Class A | | |
| 6.362% (1 Month SOFR + 1.00%), due 1/15/39 (a)(c) | 1,975,000 | 1,932,865 |
| | Principal
Amount | Value |
| |
| Commercial Mortgage Loans (Collateralized Mortgage Obligations) (continued) |
| SREIT Trust | |
| Series 2021-MFP, Class A | | |
| 6.207% (1 Month SOFR + 0.845%), due 11/15/38 (a)(c) | $ 130,133 | $ 127,971 |
| Trust (The) | |
| Series 2023-MIC, Class A | | |
| 8.437%, due 12/5/38 (a)(h) | 933,823 | 979,399 |
| TYSN Mortgage Trust | |
| Series 2023-CRNR, Class A | | |
| 6.799%, due 12/10/33 (a)(b) | 1,489,099 | 1,549,862 |
| VASA Trust | |
| Series 2021-VASA, Class A | | |
| 6.376% (1 Month SOFR + 1.014%), due 7/15/39 (a)(c) | 525,000 | 474,025 |
| VMC Finance LLC | |
| Series 2021-HT1, Class A | | |
| 7.123% (1 Month SOFR + 1.764%), due 1/18/37 (a)(c) | 595,954 | 585,107 |
| Wells Fargo Commercial Mortgage Trust | |
| Series 2021-SAVE, Class A | | |
| 6.626% (1 Month SOFR + 1.264%), due 2/15/40 (a)(c) | 219,896 | 213,770 |
| | | 42,269,689 |
| Whole Loan (Collateralized Mortgage Obligations) 3.3% |
| A&D Mortgage Trust (a)(d) | |
| Series 2023-NQM2, Class A1 | | |
| 6.132%, due 5/25/68 | 966,958 | 966,194 |
| Series 2023-NQM5, Class A1 | | |
| 7.049%, due 11/25/68 | 476,688 | 485,296 |
| Series 2023-NQM4, Class A1 | | |
| 7.472%, due 9/25/68 | 969,239 | 990,266 |
| Angel Oak Mortgage Trust (a)(b) | |
| Series 2020-3, Class A2 | | |
| 2.41%, due 4/25/65 | 161,754 | 150,871 |
| Series 2019-5, Class A1 | | |
| 2.593%, due 10/25/49 | 71,022 | 68,391 |
| Series 2019-6, Class A1 | | |
| 2.62%, due 11/25/59 | 63,959 | 61,698 |
| Bayview MSR Opportunity Master Fund Trust (a) | |
| Series 2022-2, Class A1 | | |
| 3.00%, due 12/25/51 (b) | 1,730,510 | 1,473,840 |
| Series 2021-5, Class AF | | |
| 5.00% (SOFR 30A + 0.85%), due 11/25/51 (c) | 863,130 | 795,252 |
The notes to the financial statements are an integral part of, and should be read in conjunction with, the financial statements.
| 18 | MainStay VP Janus Henderson Balanced Portfolio |
| | Principal
Amount | Value |
| Mortgage-Backed Securities (continued) |
| Whole Loan (Collateralized Mortgage Obligations) (continued) |
| Chase Mortgage Finance Corp. | |
| Series 2021-CL1, Class M1 | | |
| 6.537% (SOFR 30A + 1.20%), due 2/25/50 (a)(c) | $ 867,043 | $ 837,265 |
| COLT Mortgage Loan Trust (a)(b) | |
| Series 2020-3, Class A1 | | |
| 1.506%, due 4/27/65 | 51,914 | 48,474 |
| Series 2020-2, Class A1 | | |
| 1.853%, due 3/25/65 | 3,048 | 3,028 |
| Connecticut Avenue Securities Trust (a)(c) | |
| Series 2023-R08, Class 1M1 | | |
| 6.837% (SOFR 30A + 1.50%), due 10/25/43 | 768,102 | 769,786 |
| Series 2021-R03, Class 1M2 | | |
| 6.987% (SOFR 30A + 1.65%), due 12/25/41 | 612,000 | 603,402 |
| Series 2023-R06, Class 1M1 | | |
| 7.037% (SOFR 30A + 1.70%), due 7/25/43 | 808,124 | 811,445 |
| Series 2022-R05, Class 2M1 | | |
| 7.237% (SOFR 30A + 1.90%), due 4/25/42 | 534,910 | 537,913 |
| Series 2023-R07, Class 2M1 | | |
| 7.287% (SOFR 30A + 1.95%), due 9/25/43 | 372,353 | 375,830 |
| Series 2022-R04, Class 1M1 | | |
| 7.337% (SOFR 30A + 2.00%), due 3/25/42 | 444,968 | 449,167 |
| Series 2022-R03, Class 1M1 | | |
| 7.437% (SOFR 30A + 2.10%), due 3/25/42 | 1,062,250 | 1,074,671 |
| Series 2019-R07, Class 1M2 | | |
| 7.552% (SOFR 30A + 2.214%), due 10/25/39 | 3,230 | 3,230 |
| Series 2023-R04, Class 1M1 | | |
| 7.637% (SOFR 30A + 2.30%), due 5/25/43 | 869,937 | 888,239 |
| Series 2023-R01, Class 1M1 | | |
| 7.737% (SOFR 30A + 2.40%), due 12/25/42 | 1,432,628 | 1,460,134 |
| Series 2022-R09, Class 2M1 | | |
| 7.837% (SOFR 30A + 2.50%), due 9/25/42 | 1,024,320 | 1,042,132 |
| Series 2023-R03, Class 2M1 | | |
| 7.837% (SOFR 30A + 2.50%), due 4/25/43 | 696,794 | 707,726 |
| | Principal
Amount | Value |
| |
| Whole Loan (Collateralized Mortgage Obligations) (continued) |
| Connecticut Avenue Securities Trust (a)(c) (continued) | |
| Series 2018-R07, Class 1M2 | | |
| 7.852% (SOFR 30A + 2.514%), due 4/25/31 | $ 14,461 | $ 14,485 |
| Series 2022-R02, Class 2M2 | | |
| 8.337% (SOFR 30A + 3.00%), due 1/25/42 | 706,000 | 715,468 |
| Series 2022-R05, Class 2M2 | | |
| 8.337% (SOFR 30A + 3.00%), due 4/25/42 | 521,000 | 530,152 |
| CRSO Trust | |
| Series 2023-BRND | | |
| 7.121%, due 7/10/28 (a) | 1,975,000 | 2,056,170 |
| FHLMC STACR REMIC Trust (a)(c) | |
| Series 2021-DNA7, Class M1 | | |
| 6.187% (SOFR 30A + 0.85%), due 11/25/41 | 536,459 | 533,455 |
| Series 2021-HQA4, Class M1 | | |
| 6.287% (SOFR 30A + 0.95%), due 12/25/41 | 1,118,968 | 1,105,016 |
| Series 2022-DNA2, Class M1A | | |
| 6.637% (SOFR 30A + 1.30%), due 2/25/42 | 214,214 | 214,215 |
| Series 2021-DNA1, Class M2 | | |
| 7.137% (SOFR 30A + 1.80%), due 1/25/51 | 272,160 | 273,756 |
| Series 2023-HQA3, Class A1 | | |
| 7.187% (SOFR 30A + 1.85%), due 11/25/43 | 386,540 | 389,298 |
| Series 2023-HQA3, Class M1 | | |
| 7.187% (SOFR 30A + 1.85%), due 11/25/43 | 665,462 | 669,462 |
| Series 2022-DNA3, Class M1A | | |
| 7.337% (SOFR 30A + 2.00%), due 4/25/42 | 213,254 | 215,192 |
| Series 2020-DNA6, Class M2 | | |
| 7.337% (SOFR 30A + 2.00%), due 12/25/50 | 709,739 | 715,238 |
| Series 2022-HQA1, Class M1A | | |
| 7.437% (SOFR 30A + 2.10%), due 3/25/42 | 1,323,592 | 1,333,811 |
| Series 2022-DNA6, Class M1A | | |
| 7.487% (SOFR 30A + 2.15%), due 9/25/42 | 165,721 | 167,249 |
| Series 2021-HQA1, Class M2 | | |
| 7.587% (SOFR 30A + 2.25%), due 8/25/33 | 2,682,420 | 2,674,748 |
The notes to the financial statements are an integral part of, and should be read in conjunction with, the financial statements.
19
Portfolio of Investments December 31, 2023†^ (continued)
| | Principal
Amount | Value |
| Mortgage-Backed Securities (continued) |
| Whole Loan (Collateralized Mortgage Obligations) (continued) |
| FHLMC STACR REMIC Trust (a)(c) (continued) | |
| Series 2022-HQA3, Class M1A | | |
| 7.637% (SOFR 30A + 2.30%), due 8/25/42 | $ 336,110 | $ 341,714 |
| FHLMC STACR Trust | |
| Series 2019-DNA4, Class M2 | | |
| 7.402% (SOFR 30A + 2.064%), due 10/25/49 (a)(c) | 1,763 | 1,765 |
| FHLMC Structured Agency Credit Risk Debt Notes (a)(c) | |
| Series 2023-HQA2, Class M1A | | |
| 7.337% (SOFR 30A + 2.00%), due 6/25/43 | 97,527 | 98,368 |
| Series 2023-DNA2, Class M1A | | |
| 7.437% (SOFR 30A + 2.10%), due 4/25/43 | 377,755 | 383,649 |
| Series 2021-DNA2, Class M2 | | |
| 7.637% (SOFR 30A + 2.30%), due 8/25/33 | 1,651,996 | 1,667,514 |
| Series 2020-HQA5, Class M2 | | |
| 7.937% (SOFR 30A + 2.60%), due 11/25/50 | 759,853 | 773,610 |
| Series 2022-HQA2, Class M1A | | |
| 7.987% (SOFR 30A + 2.65%), due 7/25/42 | 365,453 | 373,941 |
| Flagstar Mortgage Trust | |
| Series 2021-13IN, Class A2 | | |
| 3.00%, due 12/30/51 (a)(b) | 1,281,936 | 1,091,799 |
| FNMA | |
| Series 2021-R02, Class 2M2 | | |
| 7.337% (SOFR 30A + 2.00%), due 11/25/41 (a)(c) | 1,891,000 | 1,875,034 |
| GCAT Trust (a)(b) | |
| Series 2022-INV1, Class A1 | | |
| 3.00%, due 12/25/51 | 2,296,147 | 1,955,583 |
| Series 2023-INV1, Class A1 | | |
| 6.00%, due 8/25/53 | 1,444,474 | 1,448,594 |
| Imperial Fund Mortgage Trust | |
| Series 2023-NQM1, Class A1 | | |
| 5.941%, due 2/25/68 (a)(d) | 715,237 | 713,441 |
| Mello Mortgage Capital Acceptance (a) | |
| Series 2021-INV4, Class A3 | | |
| 2.50%, due 12/25/51 (b) | 398,592 | 325,911 |
| Series 2022-INV1, Class A2 | | |
| 3.00%, due 3/25/52 (b) | 1,570,857 | 1,337,868 |
| Series 2021-INV2, Class A11 | | |
| 5.00% (SOFR 30A + 0.95%), due 8/25/51 (c) | 625,339 | 576,551 |
| | Principal
Amount | Value |
| |
| Whole Loan (Collateralized Mortgage Obligations) (continued) |
| Mello Mortgage Capital Acceptance (a) (continued) | |
| Series 2021-INV3, Class A11 | | |
| 5.00% (SOFR 30A + 0.95%), due 10/25/51 (c) | $ 771,431 | $ 711,671 |
| New Residential Mortgage Loan Trust | |
| Series 2018-2A, Class A1 | | |
| 4.50%, due 2/25/58 (a)(b) | 121,602 | 117,848 |
| OBX Trust (a)(b) | |
| Series 2021-INV3, Class A3 | | |
| 2.50%, due 10/25/51 | 378,596 | 309,561 |
| Series 2022-INV1, Class A1 | | |
| 3.00%, due 12/25/51 | 1,733,206 | 1,476,137 |
| Series 2022-INV1, Class A18 | | |
| 3.00%, due 12/25/51 | 735,115 | 611,381 |
| Oceanview Mortgage Trust | |
| Series 2022-1, Class A1 | | |
| 3.00%, due 12/25/51 (a)(b) | 928,950 | 791,168 |
| PRPM LLC | |
| Series 2020-4, Class A1 | | |
| 5.951%, due 10/25/25 (a)(d) | 494,774 | 493,174 |
| RCKT Mortgage Trust (a) | |
| Series 2021-3, Class A21 | | |
| 5.00% (SOFR 30A + 0.80%), due 7/25/51 (c) | 556,173 | 511,846 |
| Series 2023-CES1, Class A1A | | |
| 6.515%, due 6/25/43 (b) | 786,929 | 795,917 |
| Series 2023-CES2, Class A1A | | |
| 6.808%, due 9/25/43 (b) | 1,518,648 | 1,540,198 |
| Series 2023-CES3, Class A1A | | |
| 7.113%, due 11/25/43 | 2,174,194 | 2,216,943 |
| Saluda Grade Alternative Mortgage Trust | |
| Series 2023-SEQ3, Class A1 | | |
| 7.162%, due 6/1/53 (a)(b) | 405,562 | 408,385 |
| Seasoned Loans Structured Transaction Trust | |
| Series 2020-2, Class M1 | | |
| 4.75%, due 9/25/60 (a)(b) | 334,364 | 319,947 |
| Sequoia Mortgage Trust (a) | |
| Series 2013-5, Class A1 | | |
| 2.50%, due 5/25/43 (h) | 160,785 | 135,773 |
| Series 2020-2, Class A19 | | |
| 3.50%, due 3/25/50 (b) | 57,066 | 49,190 |
| Spruce Hill Mortgage Loan Trust (a)(b) | |
| Series 2020-SH1, Class A1 | | |
| 2.521%, due 1/28/50 | 1,503 | 1,496 |
| Series 2020-SH1, Class A2 | | |
| 2.624%, due 1/28/50 | 8,540 | 8,500 |
The notes to the financial statements are an integral part of, and should be read in conjunction with, the financial statements.
| 20 | MainStay VP Janus Henderson Balanced Portfolio |
| | Principal
Amount | Value |
| Mortgage-Backed Securities (continued) |
| Whole Loan (Collateralized Mortgage Obligations) (continued) |
| Towd Point Mortgage Trust | |
| Series 2023-CES1, Class A1A | | |
| 6.75%, due 7/25/63 (a)(b) | $ 419,838 | $ 426,493 |
| UWM Mortgage Trust (a) | |
| Series 2021-INV4, Class A3 | | |
| 2.50%, due 12/25/51 (b) | 304,661 | 249,488 |
| Series 2021-INV1, Class A9 | | |
| 5.00% (SOFR 30A + 0.90%), due 8/25/51 (c) | 743,488 | 683,610 |
| | | 51,036,033 |
Total Mortgage-Backed Securities
(Cost $96,594,309) | | 94,384,630 |
| U.S. Government & Federal Agencies 19.9% |
| Federal Home Loan Mortgage Corporation (Mortgage Pass-Through Securities) 2.6% |
| FHLMC Gold Pools, 30 Year | | |
| 4.00%, due 8/1/48 | 143,022 | 138,204 |
| 4.00%, due 9/1/48 | 95,063 | 91,508 |
| FHLMC Gold Pools, Other | | |
| 3.00%, due 6/1/43 | 9,549 | 8,682 |
| 4.50%, due 5/1/44 | 296,710 | 293,396 |
| 4.50%, due 3/1/50 | 438,105 | 417,506 |
| UMBS Pool, 15 Year | | |
| 2.50%, due 12/1/33 | 691,755 | 652,693 |
| 2.50%, due 11/1/34 | 122,188 | 113,700 |
| 2.50%, due 11/1/34 | 186,151 | 173,037 |
| 2.50%, due 6/1/37 | 1,603,997 | 1,483,526 |
| 3.00%, due 5/1/31 | 572,052 | 549,732 |
| 3.00%, due 9/1/32 | 140,082 | 133,777 |
| 3.00%, due 10/1/32 | 49,011 | 46,805 |
| 3.00%, due 1/1/33 | 78,652 | 75,082 |
| 3.00%, due 10/1/34 | 82,376 | 78,126 |
| 3.00%, due 10/1/34 | 177,513 | 168,358 |
| UMBS Pool, 30 Year | | |
| 2.50%, due 8/1/50 | 60,631 | 52,854 |
| 2.50%, due 8/1/50 | 23,301 | 20,312 |
| 2.50%, due 9/1/50 | 112,389 | 97,930 |
| 2.50%, due 6/1/51 | 1,146,860 | 991,417 |
| 2.50%, due 10/1/51 | 2,652,837 | 2,270,834 |
| 2.50%, due 11/1/51 | 850,367 | 733,478 |
| 2.50%, due 1/1/52 | 146,710 | 126,960 |
| 2.50%, due 1/1/52 | 234,437 | 202,998 |
| 2.50%, due 2/1/52 | 349,111 | 300,778 |
| 2.50%, due 3/1/52 | 54,122 | 46,629 |
| 2.50%, due 3/1/52 | 1,855,313 | 1,587,703 |
| | Principal
Amount | Value |
| |
| Federal Home Loan Mortgage Corporation (Mortgage Pass-Through Securities) (continued) |
| UMBS Pool, 30 Year (continued) | | |
| 2.50%, due 5/1/52 | $ 778,561 | $ 666,748 |
| 3.00%, due 1/1/45 | 93,933 | 85,861 |
| 3.00%, due 4/1/47 | 13,373 | 12,023 |
| 3.00%, due 8/1/49 | 45,782 | 41,080 |
| 3.00%, due 12/1/49 | 49,263 | 44,265 |
| 3.00%, due 12/1/49 | 108,471 | 97,398 |
| 3.00%, due 2/1/52 | 195,709 | 175,776 |
| 3.00%, due 2/1/52 | 134,284 | 120,866 |
| 3.00%, due 3/1/52 | 202,645 | 182,180 |
| 3.00%, due 6/1/52 | 75,932 | 68,279 |
| 3.50%, due 7/1/46 | 79,122 | 74,511 |
| 3.50%, due 12/1/47 | 645,594 | 605,852 |
| 3.50%, due 2/1/48 | 151,998 | 142,203 |
| 3.50%, due 3/1/50 | 3,009 | 2,797 |
| 3.50%, due 4/1/52 | 62,595 | 58,555 |
| 3.50%, due 4/1/52 | 59,191 | 55,370 |
| 3.50%, due 4/1/52 | 208,140 | 194,125 |
| 3.50%, due 4/1/52 | 206,629 | 192,715 |
| 3.50%, due 4/1/52 | 188,027 | 175,694 |
| 3.50%, due 6/1/52 | 400,233 | 374,328 |
| 4.00%, due 3/1/47 | 25,774 | 24,847 |
| 4.00%, due 3/1/48 | 102,389 | 99,163 |
| 4.00%, due 4/1/48 | 1,861 | 1,790 |
| 4.00%, due 4/1/48 | 157,907 | 152,778 |
| 4.00%, due 4/1/48 | 16,657 | 16,038 |
| 4.00%, due 5/1/48 | 329,457 | 317,303 |
| 4.00%, due 11/1/48 | 30,058 | 28,908 |
| 4.00%, due 12/1/48 | 375,840 | 359,565 |
| 4.00%, due 7/1/49 | 272,909 | 261,717 |
| 4.00%, due 3/1/50 | 367,087 | 352,755 |
| 4.00%, due 6/1/50 | 592,374 | 570,090 |
| 4.00%, due 10/1/50 | 98,280 | 94,066 |
| 4.00%, due 11/1/50 | 660,306 | 632,727 |
| 4.50%, due 3/1/48 | 101,854 | 99,972 |
| 4.50%, due 12/1/48 | 151,139 | 150,044 |
| 4.50%, due 6/1/49 | 25,032 | 24,729 |
| 4.50%, due 7/1/49 | 206,873 | 203,602 |
| 4.50%, due 7/1/49 | 31,838 | 31,301 |
| 4.50%, due 8/1/49 | 187,108 | 184,091 |
| 4.50%, due 1/1/50 | 35,196 | 34,563 |
| 4.50%, due 1/1/50 | 126,792 | 124,820 |
| 4.50%, due 9/1/50 | 1,054,148 | 1,035,856 |
| 4.50%, due 10/1/50 | 570,242 | 559,303 |
| 4.50%, due 3/1/52 | 17,695 | 17,158 |
| 4.50%, due 8/1/52 | 833,063 | 807,786 |
| 4.50%, due 8/1/52 | 3,705,894 | 3,593,448 |
The notes to the financial statements are an integral part of, and should be read in conjunction with, the financial statements.
21
Portfolio of Investments December 31, 2023†^ (continued)
| | Principal
Amount | Value |
| U.S. Government & Federal Agencies (continued) |
| Federal Home Loan Mortgage Corporation (Mortgage Pass-Through Securities) (continued) |
| UMBS Pool, 30 Year (continued) | | |
| 4.50%, due 8/1/52 | $ 1,594,763 | $ 1,546,822 |
| 4.50%, due 10/1/52 | 525,201 | 514,898 |
| 4.50%, due 5/1/53 | 2,028,899 | 1,988,063 |
| 5.00%, due 9/1/48 | 8,334 | 8,382 |
| 5.00%, due 8/1/52 | 838,229 | 842,528 |
| 5.00%, due 10/1/52 | 22,247 | 22,150 |
| 5.00%, due 10/1/52 | 723,259 | 720,933 |
| 5.00%, due 10/1/52 | 1,110,810 | 1,107,237 |
| 5.00%, due 1/1/53 | 35,863 | 35,637 |
| 5.00%, due 1/1/53 | 41,422 | 41,289 |
| 5.00%, due 3/1/53 | 305,871 | 302,659 |
| 5.00%, due 3/1/53 | 56,766 | 56,180 |
| 5.00%, due 3/1/53 | 152,102 | 151,142 |
| 5.00%, due 3/1/53 | 147,184 | 146,255 |
| 5.00%, due 4/1/53 | 181,427 | 180,843 |
| 5.00%, due 5/1/53 | 902,325 | 897,329 |
| 5.00%, due 5/1/53 | 372,592 | 370,528 |
| 5.00%, due 5/1/53 | 210,169 | 209,005 |
| 5.00%, due 5/1/53 | 40,427 | 40,240 |
| 5.00%, due 6/1/53 | 61,371 | 61,031 |
| 5.00%, due 6/1/53 | 53,729 | 53,154 |
| 5.00%, due 6/1/53 | 144,563 | 143,017 |
| 5.00%, due 6/1/53 | 138,776 | 137,293 |
| 5.00%, due 6/1/53 | 113,119 | 111,910 |
| 5.00%, due 6/1/53 | 142,767 | 141,241 |
| 5.00%, due 6/1/53 | 85,811 | 84,894 |
| 5.00%, due 6/1/53 | 80,007 | 79,152 |
| 5.00%, due 7/1/53 | 173,691 | 171,900 |
| 5.00%, due 7/1/53 | 271,999 | 273,725 |
| 5.50%, due 9/1/52 | 490,766 | 503,412 |
| 5.50%, due 10/1/52 | 25,982 | 26,416 |
| 5.50%, due 5/1/53 | 386,522 | 396,490 |
| 5.50%, due 5/1/53 | 33,267 | 33,637 |
| 5.50%, due 6/1/53 | 73,127 | 73,940 |
| 5.50%, due 6/1/53 | 112,599 | 113,111 |
| 5.50%, due 6/1/53 | 89,620 | 90,044 |
| 5.50%, due 6/1/53 | 137,070 | 137,947 |
| 5.50%, due 6/1/53 | 108,154 | 108,671 |
| 5.50%, due 7/1/53 | 269,321 | 270,545 |
| 5.50%, due 7/1/53 | 404,331 | 409,375 |
| 5.50%, due 7/1/53 | 255,683 | 258,873 |
| 6.00%, due 4/1/40 | 314,166 | 328,377 |
| 6.00%, due 1/1/53 | 870,814 | 885,734 |
| | Principal
Amount | Value |
| |
| Federal Home Loan Mortgage Corporation (Mortgage Pass-Through Securities) (continued) |
| UMBS Pool, 30 Year (continued) | | |
| 6.00%, due 11/1/53 | $ 876,886 | $ 906,389 |
| 6.50%, due 11/1/53 | 1,142,302 | 1,189,951 |
| | | 40,177,420 |
| Federal National Mortgage Association (Mortgage Pass-Through Securities) 6.5% |
| FNMA, Other | | |
| 3.00%, due 2/1/43 | 12,342 | 11,251 |
| 3.00%, due 5/1/43 | 66,290 | 60,432 |
| 3.00%, due 2/1/57 | 767,878 | 675,851 |
| 3.00%, due 6/1/57 | 11,916 | 10,489 |
| 3.50%, due 8/1/56 | 931,712 | 845,202 |
| 4.50%, due 6/1/45 | 106,911 | 105,602 |
| 4.50%, due 7/1/50 | 907,541 | 864,874 |
| 5.00%, due 7/1/44 | 175,847 | 177,398 |
| UMBS, 15 Year | | |
| 2.50%, due 11/1/34 | 176,622 | 164,176 |
| 2.50%, due 12/1/36 | 1,423,827 | 1,318,711 |
| 3.00%, due 10/1/34 | 69,764 | 66,124 |
| 3.00%, due 11/1/34 | 17,451 | 16,565 |
| 3.00%, due 12/1/34 | 16,605 | 15,749 |
| UMBS, 30 Year | | |
| 2.50%, due 8/1/50 | 121,199 | 105,390 |
| 2.50%, due 8/1/50 | 3,750,288 | 3,249,673 |
| 2.50%, due 1/1/52 | 761,369 | 656,283 |
| 2.50%, due 2/1/52 | 3,742,893 | 3,224,697 |
| 2.50%, due 2/1/52 | 3,470,423 | 2,973,192 |
| 2.50%, due 3/1/52 | 570,912 | 491,867 |
| 2.50%, due 3/1/52 | 1,520,851 | 1,310,283 |
| 2.50%, due 3/1/52 | 44,984 | 38,935 |
| 2.50%, due 3/1/52 | 119,572 | 103,017 |
| 2.50%, due 3/1/52 | 106,820 | 92,055 |
| 2.50%, due 3/1/52 | 1,525,920 | 1,314,761 |
| 2.50%, due 3/1/52 | 132,473 | 114,132 |
| 2.50%, due 3/1/52 | 1,462,108 | 1,251,648 |
| 3.00%, due 1/1/43 | 41,540 | 38,179 |
| 3.00%, due 1/1/46 | 2,028 | 1,849 |
| 3.00%, due 2/1/47 | 5,339,132 | 4,907,519 |
| 3.00%, due 3/1/47 | 395,748 | 360,432 |
| 3.00%, due 8/1/49 | 149,046 | 133,757 |
| 3.00%, due 9/1/49 | 714,506 | 640,546 |
| 3.00%, due 9/1/49 | 34,827 | 31,746 |
| 3.00%, due 12/1/51 | 6,647,634 | 5,933,788 |
| 3.00%, due 3/1/52 | 727,725 | 650,198 |
| 3.00%, due 4/1/52 | 615,198 | 553,069 |
| 3.00%, due 4/1/52 | 525,475 | 471,950 |
The notes to the financial statements are an integral part of, and should be read in conjunction with, the financial statements.
| 22 | MainStay VP Janus Henderson Balanced Portfolio |
| | Principal
Amount | Value |
| U.S. Government & Federal Agencies (continued) |
| Federal National Mortgage Association (Mortgage Pass-Through Securities) (continued) |
| UMBS, 30 Year (continued) | | |
| 3.00%, due 4/1/52 | $ 1,293,489 | $ 1,157,448 |
| 3.50%, due 8/1/47 | 65,248 | 61,767 |
| 3.50%, due 12/1/47 | 19,387 | 18,353 |
| 3.50%, due 12/1/47 | 30,339 | 28,623 |
| 3.50%, due 1/1/48 | 172,750 | 162,321 |
| 3.50%, due 3/1/48 | 30,058 | 28,378 |
| 3.50%, due 5/1/49 | 595,059 | 552,210 |
| 3.50%, due 2/1/51 | 775,050 | 721,430 |
| 3.50%, due 1/1/52 | 176,575 | 165,099 |
| 3.50%, due 2/1/52 | 461,282 | 431,341 |
| 3.50%, due 3/1/52 | 2,781,409 | 2,595,527 |
| 3.50%, due 3/1/52 | 316,402 | 295,923 |
| 3.50%, due 4/1/52 | 96,247 | 89,982 |
| 3.50%, due 4/1/52 | 287,276 | 268,735 |
| 3.50%, due 4/1/52 | 530,768 | 495,027 |
| 3.50%, due 4/1/52 | 85,837 | 79,904 |
| 3.50%, due 4/1/52 | 173,459 | 161,779 |
| 3.50%, due 4/1/52 | 396,508 | 370,142 |
| 3.50%, due 5/1/52 | 290,479 | 270,919 |
| 3.50%, due 6/1/52 | 1,681,502 | 1,568,275 |
| 3.50%, due 6/1/52 | 962,027 | 899,402 |
| 3.50%, due 7/1/52 | 248,289 | 231,570 |
| 3.50%, due 7/1/52 | 88,834 | 83,068 |
| 3.50%, due 8/1/52 | 164,659 | 153,572 |
| 4.00%, due 5/1/45 | 41,025 | 39,308 |
| 4.00%, due 10/1/47 | 234,011 | 224,478 |
| 4.00%, due 11/1/47 | 326,072 | 315,224 |
| 4.00%, due 1/1/48 | 386,289 | 374,213 |
| 4.00%, due 1/1/48 | 679,537 | 657,310 |
| 4.00%, due 1/1/48 | 132,132 | 127,274 |
| 4.00%, due 3/1/48 | 118,681 | 114,970 |
| 4.00%, due 7/1/48 | 285,973 | 275,281 |
| 4.00%, due 8/1/48 | 88,370 | 84,978 |
| 4.00%, due 9/1/48 | 211,215 | 203,192 |
| 4.00%, due 10/1/48 | 112,769 | 108,389 |
| 4.00%, due 11/1/48 | 333,711 | 319,239 |
| 4.00%, due 12/1/48 | 52,810 | 50,781 |
| 4.00%, due 2/1/49 | 97,420 | 93,617 |
| 4.00%, due 6/1/49 | 43,535 | 41,790 |
| 4.00%, due 9/1/49 | 205,137 | 196,937 |
| 4.00%, due 11/1/49 | 715,041 | 685,265 |
| 4.00%, due 11/1/49 | 63,060 | 60,528 |
| 4.00%, due 3/1/50 | 217,122 | 208,140 |
| 4.00%, due 3/1/50 | 561,541 | 536,609 |
| 4.00%, due 3/1/50 | 1,042,056 | 1,002,512 |
| | Principal
Amount | Value |
| |
| Federal National Mortgage Association (Mortgage Pass-Through Securities) (continued) |
| UMBS, 30 Year (continued) | | |
| 4.00%, due 4/1/50 | $ 138,147 | $ 132,047 |
| 4.00%, due 8/1/50 | 124,798 | 119,286 |
| 4.00%, due 9/1/50 | 1,185,884 | 1,130,659 |
| 4.00%, due 10/1/50 | 1,137,168 | 1,090,996 |
| 4.00%, due 3/1/51 | 2,932,360 | 2,816,850 |
| 4.00%, due 3/1/51 | 28,581 | 27,431 |
| 4.00%, due 3/1/51 | 56,679 | 54,256 |
| 4.00%, due 8/1/51 | 518,881 | 496,909 |
| 4.00%, due 10/1/51 | 410,444 | 393,826 |
| 4.00%, due 10/1/51 | 2,995,108 | 2,866,058 |
| 4.00%, due 4/1/52 | 440,982 | 421,579 |
| 4.50%, due 11/1/42 | 50,911 | 50,845 |
| 4.50%, due 10/1/44 | 154,102 | 152,952 |
| 4.50%, due 3/1/45 | 241,123 | 239,324 |
| 4.50%, due 2/1/46 | 256,976 | 256,645 |
| 4.50%, due 3/1/48 | 129,496 | 127,676 |
| 4.50%, due 6/1/48 | 246,873 | 242,730 |
| 4.50%, due 8/1/48 | 62,247 | 61,152 |
| 4.50%, due 6/1/49 | 22,245 | 21,877 |
| 4.50%, due 8/1/49 | 31,073 | 30,559 |
| 4.50%, due 1/1/50 | 559,519 | 551,713 |
| 4.50%, due 1/1/50 | 41,891 | 41,092 |
| 4.50%, due 10/1/50 | 688,050 | 677,267 |
| 4.50%, due 12/1/50 | 974,003 | 956,813 |
| 4.50%, due 4/1/52 | 21,057 | 20,418 |
| 4.50%, due 4/1/52 | 41,190 | 39,940 |
| 4.50%, due 4/1/52 | 71,846 | 69,667 |
| 4.50%, due 4/1/52 | 84,907 | 82,741 |
| 4.50%, due 4/1/52 | 32,699 | 31,707 |
| 4.50%, due 4/1/52 | 37,406 | 36,271 |
| 4.50%, due 5/1/52 | 114,001 | 110,541 |
| 4.50%, due 7/1/52 | 462,942 | 448,895 |
| 4.50%, due 8/1/52 | 1,686,927 | 1,635,741 |
| 4.50%, due 11/1/52 | 999,628 | 980,019 |
| 4.50%, due 7/1/53 | 442,972 | 434,834 |
| 4.50%, due 8/1/53 | 388,510 | 380,881 |
| 5.00%, due 5/1/48 | 103,986 | 104,502 |
| 5.00%, due 9/1/52 | 800,598 | 793,075 |
| 5.00%, due 10/1/52 | 161,562 | 161,042 |
| 5.00%, due 10/1/52 | 367,410 | 366,228 |
| 5.00%, due 11/1/52 | 902,371 | 899,468 |
| 5.00%, due 1/1/53 | 221,619 | 220,906 |
| 5.00%, due 1/1/53 | 71,713 | 71,316 |
| 5.00%, due 2/1/53 | 91,050 | 90,757 |
| 5.00%, due 3/1/53 | 193,399 | 191,369 |
| 5.00%, due 3/1/53 | 52,481 | 52,150 |
The notes to the financial statements are an integral part of, and should be read in conjunction with, the financial statements.
23
Portfolio of Investments December 31, 2023†^ (continued)
| | Principal
Amount | Value |
| U.S. Government & Federal Agencies (continued) |
| Federal National Mortgage Association (Mortgage Pass-Through Securities) (continued) |
| UMBS, 30 Year (continued) | | |
| 5.00%, due 4/1/53 | $ 50,361 | $ 49,842 |
| 5.00%, due 4/1/53 | 59,046 | 58,422 |
| 5.00%, due 4/1/53 | 252,643 | 250,039 |
| 5.00%, due 4/1/53 | 101,380 | 100,740 |
| 5.00%, due 5/1/53 | 51,631 | 51,305 |
| 5.00%, due 6/1/53 | 73,473 | 73,066 |
| 5.00%, due 6/1/53 | 63,089 | 62,691 |
| 5.00%, due 6/1/53 | 207,609 | 210,221 |
| 5.00%, due 7/1/53 | 717,385 | 726,410 |
| 5.00%, due 8/1/53 | 63,345 | 63,142 |
| 5.00%, due 8/1/53 | 968,398 | 974,154 |
| 5.50%, due 9/1/52 | 2,108,459 | 2,123,042 |
| 5.50%, due 11/1/52 | 791,802 | 806,119 |
| 5.50%, due 3/1/53 | 16,107 | 16,308 |
| 5.50%, due 4/1/53 | 7,692 | 7,788 |
| 5.50%, due 5/1/53 | 7,438 | 7,531 |
| 5.50%, due 5/1/53 | 14,252 | 14,430 |
| 5.50%, due 6/1/53 | 30,830 | 31,388 |
| 5.50%, due 6/1/53 | 1,964,372 | 1,999,921 |
| 5.50%, due 7/1/53 | 88,407 | 89,510 |
| 5.50%, due 7/1/53 | 53,166 | 54,128 |
| 5.50%, due 7/1/53 | 3,123,332 | 3,140,421 |
| 5.50%, due 9/1/53 | 3,347,827 | 3,403,255 |
| 6.00%, due 2/1/37 | 18,731 | 19,578 |
| UMBS, Single Family, 15 Year (i) | | |
| 3.00%, due 1/25/39 TBA | 1,070,515 | 1,009,253 |
| 3.50%, due 1/25/39 TBA | 4,102,000 | 3,948,656 |
| 4.00%, due 1/25/39 TBA | 4,025,000 | 3,948,902 |
| UMBS, Single Family, 30 Year (i) | | |
| 2.50%, due 1/25/54 TBA | 6,359,176 | 5,409,274 |
| 4.00%, due 1/25/54 TBA | 733,861 | 694,043 |
| 4.50%, due 1/25/54 TBA | 5,757 | 5,580 |
| 5.00%, due 1/25/54 TBA | 692,400 | 684,989 |
| | | 99,809,378 |
| Government National Mortgage Association (Mortgage Pass-Through Securities) 2.0% |
| GNMA I, 30 Year | | |
| 4.00%, due 1/15/45 | 357,669 | 349,076 |
| 4.50%, due 8/15/46 | 398,227 | 393,960 |
| GNMA I, Single Family, 30 Year | | |
| 4.00%, due 7/15/47 | 265,556 | 255,768 |
| 4.00%, due 8/15/47 | 32,841 | 31,800 |
| 4.00%, due 11/15/47 | 20,493 | 19,922 |
| 4.00%, due 12/15/47 | 63,917 | 61,543 |
| | Principal
Amount | Value |
| |
| Government National Mortgage Association (Mortgage Pass-Through Securities) (continued) |
| GNMA II, Single Family, 30 Year | | |
| 2.50%, due 3/20/51 | $ 2,489,785 | $ 2,177,345 |
| 2.50%, due 1/15/54 TBA (i) | 6,748,240 | 5,902,618 |
| 3.00%, due 11/20/46 | 1,975,360 | 1,813,038 |
| 3.00%, due 4/20/51 | 1,918,704 | 1,742,653 |
| 3.00%, due 7/20/51 | 1,285,094 | 1,164,760 |
| 3.00%, due 8/20/51 | 2,932,302 | 2,659,987 |
| 3.50%, due 5/20/49 | 2,634,147 | 2,477,826 |
| 3.50%, due 1/15/54 TBA (i) | 5,935,510 | 5,527,444 |
| 4.00%, due 8/20/47 | 16,473 | 15,844 |
| 4.00%, due 8/20/47 | 44,964 | 43,053 |
| 4.00%, due 8/20/47 | 13,333 | 12,825 |
| 4.00%, due 6/20/48 | 176,337 | 169,596 |
| 4.00%, due 1/15/54 TBA (i) | 3,120,650 | 2,979,253 |
| 4.50%, due 2/20/48 | 36,863 | 36,485 |
| 4.50%, due 5/20/48 | 34,090 | 33,327 |
| 4.50%, due 5/20/48 | 77,275 | 75,736 |
| 4.50%, due 1/15/54 TBA (i) | 1,844,638 | 1,800,256 |
| 5.00%, due 8/20/48 | 206,170 | 207,325 |
| 5.00%, due 1/15/54 TBA (i) | 1,144,836 | 1,136,788 |
| | | 31,088,228 |
| United States Treasury Bonds 6.3% |
| U.S. Treasury Bonds | | |
| 4.125%, due 8/15/53 | 45,745,000 | 46,238,188 |
| 4.375%, due 8/15/43 | 19,504,000 | 19,909,318 |
| 4.75%, due 11/15/43 (g) | 26,440,000 | 28,361,031 |
| 4.75%, due 11/15/53 | 915,000 | 1,026,087 |
| | | 95,534,624 |
| United States Treasury Notes 2.5% |
| U.S. Treasury Notes | | |
| 4.375%, due 12/15/26 | 1,117,000 | 1,127,908 |
| 4.375%, due 11/30/28 | 11,894,000 | 12,170,907 |
| 4.375%, due 11/30/30 | 4,226,000 | 4,345,517 |
| 4.50%, due 11/15/33 | 19,251,700 | 20,211,277 |
| | | 37,855,609 |
Total U.S. Government & Federal Agencies
(Cost $299,053,916) | | 304,465,259 |
Total Long-Term Bonds
(Cost $577,326,828) | | 578,859,582 |
| |
The notes to the financial statements are an integral part of, and should be read in conjunction with, the financial statements.
| 24 | MainStay VP Janus Henderson Balanced Portfolio |
| | Shares | Value |
| |
| Common Stocks 61.2% |
| Aerospace & Defense 0.7% |
| General Dynamics Corp. | 38,852 | $ 10,088,699 |
| Air Freight & Logistics 0.7% |
| United Parcel Service, Inc., Class B | 64,343 | 10,116,650 |
| Banks 1.3% |
| JPMorgan Chase & Co. | 116,663 | 19,844,376 |
| Beverages 1.3% |
| Constellation Brands, Inc., Class A | 32,862 | 7,944,389 |
| Monster Beverage Corp. (j) | 196,399 | 11,314,546 |
| | | 19,258,935 |
| Biotechnology 1.0% |
| AbbVie, Inc. | 72,893 | 11,296,228 |
| Vertex Pharmaceuticals, Inc. (j) | 11,854 | 4,823,274 |
| | | 16,119,502 |
| Broadline Retail 1.6% |
| Amazon.com, Inc. (j) | 164,326 | 24,967,692 |
| Building Products 0.5% |
| Trane Technologies plc | 30,373 | 7,407,975 |
| Capital Markets 2.1% |
| Charles Schwab Corp. (The) | 101,062 | 6,953,066 |
| CME Group, Inc. | 49,261 | 10,374,367 |
| Morgan Stanley | 152,350 | 14,206,637 |
| | | 31,534,070 |
| Chemicals 0.5% |
| Corteva, Inc. | 148,033 | 7,093,741 |
| Communications Equipment 0.2% |
| Cisco Systems, Inc. | 61,985 | 3,131,482 |
| Consumer Finance 1.3% |
| American Express Co. | 109,881 | 20,585,107 |
| Consumer Staples Distribution & Retail 1.4% |
| Costco Wholesale Corp. | 19,047 | 12,572,544 |
| Sysco Corp. | 126,986 | 9,286,486 |
| | | 21,859,030 |
| | Shares | Value |
| |
| Electrical Equipment 0.5% |
| Rockwell Automation, Inc. | 22,596 | $ 7,015,606 |
| Energy Equipment & Services 0.4% |
| Schlumberger NV | 113,512 | 5,907,164 |
| Entertainment 0.3% |
| Netflix, Inc. (j) | 10,977 | 5,344,482 |
| Financial Services 2.3% |
| Mastercard, Inc., Class A | 82,908 | 35,361,091 |
| Food Products 0.4% |
| Hershey Co. (The) | 33,838 | 6,308,757 |
| Health Care Equipment & Supplies 1.9% |
| Abbott Laboratories | 138,306 | 15,223,341 |
| Edwards Lifesciences Corp. (j) | 71,645 | 5,462,931 |
| Stryker Corp. | 27,882 | 8,349,544 |
| | | 29,035,816 |
| Health Care Providers & Services 2.3% |
| HCA Healthcare, Inc. | 18,656 | 5,049,806 |
| UnitedHealth Group, Inc. | 58,049 | 30,561,057 |
| | | 35,610,863 |
| Hotels, Restaurants & Leisure 4.5% |
| Booking Holdings, Inc. (j) | 3,973 | 14,093,105 |
| Chipotle Mexican Grill, Inc. (j) | 2,983 | 6,822,002 |
| Hilton Worldwide Holdings, Inc. | 96,353 | 17,544,918 |
| McDonald's Corp. | 65,419 | 19,397,388 |
| Starbucks Corp. | 112,659 | 10,816,390 |
| | | 68,673,803 |
| Household Products 0.7% |
| Procter & Gamble Co. (The) | 78,813 | 11,549,257 |
| Industrial Conglomerates 0.9% |
| Honeywell International, Inc. | 62,550 | 13,117,361 |
| Insurance 1.7% |
| Marsh & McLennan Cos., Inc. | 37,752 | 7,152,872 |
| Progressive Corp. (The) | 122,622 | 19,531,232 |
| | | 26,684,104 |
| Interactive Media & Services 4.5% |
| Alphabet, Inc., Class C (j) | 297,722 | 41,957,962 |
The notes to the financial statements are an integral part of, and should be read in conjunction with, the financial statements.
25
Portfolio of Investments December 31, 2023†^ (continued)
| | Shares | Value |
| Common Stocks (continued) |
| Interactive Media & Services (continued) |
| Meta Platforms, Inc., Class A (j) | 74,766 | $ 26,464,173 |
| | | 68,422,135 |
| IT Services 1.5% |
| Accenture plc, Class A | 65,723 | 23,062,858 |
| Life Sciences Tools & Services 1.2% |
| Danaher Corp. | 28,052 | 6,489,549 |
| Thermo Fisher Scientific, Inc. | 22,887 | 12,148,191 |
| | | 18,637,740 |
| Machinery 1.0% |
| Deere & Co. | 40,402 | 16,155,548 |
| Media 0.9% |
| Comcast Corp., Class A | 301,081 | 13,202,402 |
| Oil, Gas & Consumable Fuels 1.5% |
| Chevron Corp. | 63,496 | 9,471,063 |
| ConocoPhillips | 113,022 | 13,118,464 |
| | | 22,589,527 |
| Pharmaceuticals 2.3% |
| Eli Lilly & Co. | 25,405 | 14,809,083 |
| Merck & Co., Inc. | 114,263 | 12,456,952 |
| Zoetis, Inc. | 41,352 | 8,161,644 |
| | | 35,427,679 |
| Professional Services 0.7% |
| Automatic Data Processing, Inc. | 43,651 | 10,169,373 |
| Semiconductors & Semiconductor Equipment 5.3% |
| KLA Corp. | 18,410 | 10,701,733 |
| Lam Research Corp. | 27,623 | 21,635,991 |
| NVIDIA Corp. | 75,697 | 37,486,668 |
| Texas Instruments, Inc. | 68,027 | 11,595,883 |
| | | 81,420,275 |
| Software 7.8% |
| Adobe, Inc. (j) | 18,557 | 11,071,106 |
| Cadence Design Systems, Inc. (j) | 17,969 | 4,894,216 |
| Intuit, Inc. | 14,994 | 9,371,700 |
| Microsoft Corp. | 230,179 | 86,556,511 |
| Oracle Corp. | 79,746 | 8,407,621 |
| | | 120,301,154 |
| | Shares | | Value |
| |
| Specialty Retail 1.6% |
| Home Depot, Inc. (The) | 40,037 | | $ 13,874,822 |
| TJX Cos., Inc. (The) | 121,287 | | 11,377,934 |
| | | | 25,252,756 |
| Technology Hardware, Storage & Peripherals 3.3% |
| Apple, Inc. | 259,745 | | 50,008,705 |
| Textiles, Apparel & Luxury Goods 1.1% |
| NIKE, Inc., Class B | 157,092 | | 17,055,478 |
Total Common Stocks
(Cost $597,380,372) | | | 938,321,193 |
| Short-Term Investments 3.0% |
| Affiliated Investment Company 2.8% |
| MainStay U.S. Government Liquidity Fund, 5.235% (k) | 42,339,770 | | 42,339,770 |
| Unaffiliated Investment Company 0.2% |
| Invesco Government & Agency Portfolio, 5.361% (k)(l) | 3,478,050 | | 3,478,050 |
Total Short-Term Investments
(Cost $45,817,820) | | | 45,817,820 |
Total Investments
(Cost $1,220,525,020) | 102.0% | | 1,562,998,595 |
| Other Assets, Less Liabilities | (2.0) | | (30,168,666) |
| Net Assets | 100.0% | | $ 1,532,829,929 |
| † | Percentages indicated are based on Portfolio net assets. |
| ^ | Industry classifications may be different than those used for compliance monitoring purposes. |
| ‡ | Less than one-tenth of a percent. |
| (a) | May be sold to institutional investors only under Rule 144A or securities offered pursuant to Section 4(a)(2) of the Securities Act of 1933, as amended. |
| (b) | Coupon rate may change based on changes of the underlying collateral or prepayments of principal. Rate shown was the rate in effect as of December 31, 2023. |
| (c) | Floating rate—Rate shown was the rate in effect as of December 31, 2023. |
| (d) | Step coupon—Rate shown was the rate in effect as of December 31, 2023. |
| (e) | Fixed to floating rate—Rate shown was the rate in effect as of December 31, 2023. |
| (f) | Security is perpetual and, thus, does not have a predetermined maturity date. The date shown, if applicable, reflects the next call date. |
The notes to the financial statements are an integral part of, and should be read in conjunction with, the financial statements.
| 26 | MainStay VP Janus Henderson Balanced Portfolio |
| (g) | All or a portion of this security was held on loan. As of December 31, 2023, the aggregate market value of securities on loan was $31,704,067; the total market value of collateral held by the Portfolio was $32,820,423. The market value of the collateral held included non-cash collateral in the form of U.S. Treasury securities with a value of $29,342,373. The Portfolio received cash collateral with a value of $3,478,050. (See Note 2(G)) |
| (h) | Collateral strip rate—A bond whose interest was based on the weighted net interest rate of the collateral. The coupon rate adjusts periodically based on a predetermined schedule. Rate shown was the rate in effect as of December 31, 2023. |
| (i) | TBA—Security purchased on a forward commitment basis with an approximate principal amount and maturity date. The actual principal amount and maturity date will be determined upon settlement. As of December 31, 2023, the total net market value was $33,047,056, which represented 2.2% of the Portfolio’s net assets. All or a portion of this security is a part of a mortgage dollar roll agreement. |
| (j) | Non-income producing security. |
| (k) | Current yield as of December 31, 2023. |
| (l) | Represents a security purchased with cash collateral received for securities on loan. |
Investments in Affiliates (in 000's)
Investments in issuers considered to be affiliate(s) of the Portfolio during the year ended December 31, 2023 for purposes of Section 2(a)(3) of the Investment Company Act of 1940, as amended, were as follows:
| Affiliated Investment Companies | Value,
Beginning
of Year | Purchases
at Cost | Proceeds
from
Sales | Net
Realized
Gain/(Loss)
on Sales | Change in
Unrealized
Appreciation/
(Depreciation) | Value,
End of
Year | Dividend
Income | Other
Distributions | Shares
End of
Year |
| MainStay U.S. Government Liquidity Fund | $ 71,693 | $ 287,402 | $ (316,755) | $ — | $ — | $ 42,340 | $ 2,334 | $ — | 42,340 |
| Abbreviation(s): |
| CLO—Collateralized Loan Obligation |
| FHLMC—Federal Home Loan Mortgage Corp. |
| FNMA—Federal National Mortgage Association |
| GNMA—Government National Mortgage Association |
| REMIC—Real Estate Mortgage Investment Conduit |
| SOFR—Secured Overnight Financing Rate |
| STACR—Structured Agency Credit Risk |
| TBA—To Be Announced |
| UMBS—Uniform Mortgage Backed Securities |
The notes to the financial statements are an integral part of, and should be read in conjunction with, the financial statements.
27
Portfolio of Investments December 31, 2023†^ (continued)
The following is a summary of the fair valuations according to the inputs used as of December 31, 2023, for valuing the Portfolio’s assets:
| Description | Quoted
Prices in
Active
Markets for
Identical
Assets
(Level 1) | | Significant
Other
Observable
Inputs
(Level 2) | | Significant
Unobservable
Inputs
(Level 3) | | Total |
| Asset Valuation Inputs | | | | | | | |
| Investments in Securities (a) | | | | | | | |
| Long-Term Bonds | | | | | | | |
| Asset-Backed Securities | $ — | | $ 39,672,414 | | $ — | | $ 39,672,414 |
| Corporate Bonds | — | | 138,816,231 | | — | | 138,816,231 |
| Foreign Government Bonds | — | | 1,521,048 | | — | | 1,521,048 |
| Mortgage-Backed Securities | — | | 94,384,630 | | — | | 94,384,630 |
| U.S. Government & Federal Agencies | — | | 304,465,259 | | — | | 304,465,259 |
| Total Long-Term Bonds | — | | 578,859,582 | | — | | 578,859,582 |
| Common Stocks | 938,321,193 | | — | | — | | 938,321,193 |
| Short-Term Investments | | | | | | | |
| Affiliated Investment Company | 42,339,770 | | — | | — | | 42,339,770 |
| Unaffiliated Investment Company | 3,478,050 | | — | | — | | 3,478,050 |
| Total Short-Term Investments | 45,817,820 | | — | | — | | 45,817,820 |
| Total Investments in Securities | $ 984,139,013 | | $ 578,859,582 | | $ — | | $ 1,562,998,595 |
| (a) | For a complete listing of investments and their industries, see the Portfolio of Investments. |
The notes to the financial statements are an integral part of, and should be read in conjunction with, the financial statements.
| 28 | MainStay VP Janus Henderson Balanced Portfolio |
Statement of Assets and Liabilities as of December 31, 2023
| Assets |
Investment in unaffiliated securities, at value
(identified cost $1,178,185,250) including securities on loan of $31,704,067 | $1,520,658,825 |
Investment in affiliated investment companies, at value
(identified cost $42,339,770) | 42,339,770 |
| Receivables: | |
| Investment securities sold | 10,922,653 |
| Dividends and interest | 5,342,558 |
| Portfolio shares sold | 637,038 |
| Securities lending | 83,333 |
| Other assets | 7,577 |
| Total assets | 1,579,991,754 |
| Liabilities |
| Cash collateral received for securities on loan | 3,478,050 |
| Due to custodian | 5,945 |
| Payables: | |
| Investment securities purchased | 42,117,396 |
| Manager (See Note 3) | 695,707 |
| Portfolio shares redeemed | 519,609 |
| NYLIFE Distributors (See Note 3) | 245,146 |
| Custodian | 52,582 |
| Professional fees | 46,126 |
| Shareholder communication | 29 |
| Accrued expenses | 1,235 |
| Total liabilities | 47,161,825 |
| Net assets | $1,532,829,929 |
| Composition of Net Assets |
| Shares of beneficial interest outstanding (par value of $.001 per share) unlimited number of shares authorized | $ 108,960 |
| Additional paid-in-capital | 1,164,189,197 |
| | 1,164,298,157 |
| Total distributable earnings (loss) | 368,531,772 |
| Net assets | $1,532,829,929 |
| Initial Class | |
| Net assets applicable to outstanding shares | $ 362,919,633 |
| Shares of beneficial interest outstanding | 25,622,846 |
| Net asset value per share outstanding | $ 14.16 |
| Service Class | |
| Net assets applicable to outstanding shares | $1,169,910,296 |
| Shares of beneficial interest outstanding | 83,337,251 |
| Net asset value per share outstanding | $ 14.04 |
The notes to the financial statements are an integral part of, and should be read in conjunction with, the financial statements.
29
Statement of Operations for the year ended December 31, 2023
| Investment Income (Loss) |
| Income | |
| Interest | $ 24,138,944 |
| Dividends-unaffiliated | 13,289,112 |
| Dividends-affiliated | 2,333,571 |
| Securities lending, net | 189,727 |
| Total income | 39,951,354 |
| Expenses | |
| Manager (See Note 3) | 7,864,923 |
| Distribution/Service—Service Class (See Note 3) | 2,740,521 |
| Professional fees | 166,127 |
| Custodian | 132,213 |
| Shareholder communication | 42,879 |
| Trustees | 37,117 |
| Miscellaneous | 52,103 |
| Total expenses | 11,035,883 |
| Net investment income (loss) | 28,915,471 |
| Realized and Unrealized Gain (Loss) |
| Net realized gain (loss) on unaffiliated investments | (888,360) |
| Net change in unrealized appreciation (depreciation) on unaffiliated investments | 178,155,089 |
| Net realized and unrealized gain (loss) | 177,266,729 |
| Net increase (decrease) in net assets resulting from operations | $206,182,200 |
The notes to the financial statements are an integral part of, and should be read in conjunction with, the financial statements.
| 30 | MainStay VP Janus Henderson Balanced Portfolio |
Statements of Changes in Net Assets
for the years ended December 31, 2023 and December 31, 2022
| | 2023 | 2022 |
| Increase (Decrease) in Net Assets |
| Operations: | | |
| Net investment income (loss) | $ 28,915,471 | $ 18,327,740 |
| Net realized gain (loss) | (888,360) | 56,703,333 |
| Net change in unrealized appreciation (depreciation) | 178,155,089 | (356,411,959) |
| Net increase (decrease) in net assets resulting from operations | 206,182,200 | (281,380,886) |
| Distributions to shareholders: | | |
| Initial Class | (18,261,202) | (30,995,228) |
| Service Class | (56,801,991) | (87,814,323) |
| Total distributions to shareholders | (75,063,193) | (118,809,551) |
| Capital share transactions: | | |
| Net proceeds from sales of shares | 166,034,427 | 160,730,282 |
| Net asset value of shares issued to shareholders in reinvestment of distributions | 75,063,193 | 118,809,551 |
| Cost of shares redeemed | (209,187,488) | (215,614,470) |
| Increase (decrease) in net assets derived from capital share transactions | 31,910,132 | 63,925,363 |
| Net increase (decrease) in net assets | 163,029,139 | (336,265,074) |
| Net Assets |
| Beginning of year | 1,369,800,790 | 1,706,065,864 |
| End of year | $1,532,829,929 | $1,369,800,790 |
The notes to the financial statements are an integral part of, and should be read in conjunction with, the financial statements.
31
Financial Highlights selected per share data and ratios
| | Year Ended December 31, |
| Initial Class | 2023 | | 2022 | | 2021 | | 2020 | | 2019 |
| Net asset value at beginning of year | $ 12.95 | | $ 17.04 | | $ 15.21 | | $ 14.04 | | $ 12.31 |
| Net investment income (loss) (a) | 0.30 | | 0.21 | | 0.17 | | 0.22 | | 0.27 |
| Net realized and unrealized gain (loss) | 1.65 | | (3.06) | | 2.42 | | 1.74 | | 2.48 |
| Total from investment operations | 1.95 | | (2.85) | | 2.59 | | 1.96 | | 2.75 |
| Less distributions: | | | | | | | | | |
| From net investment income | (0.20) | | (0.17) | | (0.22) | | (0.27) | | (0.25) |
| From net realized gain on investments | (0.54) | | (1.07) | | (0.54) | | (0.52) | | (0.77) |
| Total distributions | (0.74) | | (1.24) | | (0.76) | | (0.79) | | (1.02) |
| Net asset value at end of year | $ 14.16 | | $ 12.95 | | $ 17.04 | | $ 15.21 | | $ 14.04 |
| Total investment return (b) | 15.52% | | (16.39)% | | 17.35% | | 14.32% | | 22.93% |
| Ratios (to average net assets)/Supplemental Data: | | | | | | | | | |
| Net investment income (loss) | 2.18% | | 1.43% | | 1.03% | | 1.57% | | 2.01% |
| Net expenses (c) | 0.57% | | 0.57% | | 0.57% | | 0.58% | | 0.58% |
| Portfolio turnover rate | 143% | | 197% | | 103%(d) | | 106%(d) | | 98%(d) |
| Net assets at end of year (in 000's) | $ 362,920 | | $ 348,495 | | $ 453,022 | | $ 416,712 | | $ 404,231 |
| (a) | Per share data based on average shares outstanding during the year. |
| (b) | Total return does not reflect any deduction of sales charges, mortality and expense charges, contract charges or administrative charges. For periods of less than one year, total return is not annualized. |
| (c) | In addition to the fees and expenses which the Portfolio bears directly, it also indirectly bears a pro-rata share of the fees and expenses of the underlying funds in which it invests. Such indirect expenses are not included in the above expense ratios. |
| (d) | The portfolio turnover rate not including mortgage dollar rolls were 60%, 95% and 93% for the years ended December 31, 2021, 2020 and 2019, respectively. |
| | Year Ended December 31, |
| Service Class | 2023 | | 2022 | | 2021 | | 2020 | | 2019 |
| Net asset value at beginning of year | $ 12.84 | | $ 16.90 | | $ 15.10 | | $ 13.94 | | $ 12.24 |
| Net investment income (loss) (a) | 0.26 | | 0.17 | | 0.12 | | 0.18 | | 0.24 |
| Net realized and unrealized gain (loss) | 1.65 | | (3.03) | | 2.41 | | 1.74 | | 2.45 |
| Total from investment operations | 1.91 | | (2.86) | | 2.53 | | 1.92 | | 2.69 |
| Less distributions: | | | | | | | | | |
| From net investment income | (0.17) | | (0.13) | | (0.19) | | (0.24) | | (0.22) |
| From net realized gain on investments | (0.54) | | (1.07) | | (0.54) | | (0.52) | | (0.77) |
| Total distributions | (0.71) | | (1.20) | | (0.73) | | (0.76) | | (0.99) |
| Net asset value at end of year | $ 14.04 | | $ 12.84 | | $ 16.90 | | $ 15.10 | | $ 13.94 |
| Total investment return (b) | 15.23% | | (16.60)% | | 17.06% | | 14.03% | | 22.62% |
| Ratios (to average net assets)/Supplemental Data: | | | | | | | | | |
| Net investment income (loss) | 1.93% | | 1.18% | | 0.77% | | 1.31% | | 1.76% |
| Net expenses (c) | 0.82% | | 0.82% | | 0.82% | | 0.83% | | 0.83% |
| Portfolio turnover rate | 143% | | 197% | | 103%(d) | | 106%(d) | | 98%(d) |
| Net assets at end of year (in 000's) | $ 1,169,910 | | $ 1,021,306 | | $ 1,253,044 | | $ 1,042,214 | | $ 919,661 |
| (a) | Per share data based on average shares outstanding during the year. |
| (b) | Total return does not reflect any deduction of sales charges, mortality and expense charges, contract charges or administrative charges. For periods of less than one year, total return is not annualized. |
| (c) | In addition to the fees and expenses which the Portfolio bears directly, it also indirectly bears a pro-rata share of the fees and expenses of the underlying funds in which it invests. Such indirect expenses are not included in the above expense ratios. |
| (d) | The portfolio turnover rate not including mortgage dollar rolls were 60%, 95% and 93% for the years ended December 31, 2021, 2020 and 2019, respectively. |
The notes to the financial statements are an integral part of, and should be read in conjunction with, the financial statements.
| 32 | MainStay VP Janus Henderson Balanced Portfolio |
Notes to Financial Statements
Note 1–Organization and Business
MainStay VP Funds Trust (the “Fund”) was organized as a Delaware statutory trust on February 1, 2011. The Fund is registered under the Investment Company Act of 1940, as amended (the “1940 Act”), as an open-end management investment company. The Fund is comprised of thirty-one separate series (collectively referred to as the “Portfolios”). These financial statements and notes relate to the MainStay VP Janus Henderson Balanced Portfolio (the "Portfolio"), a "diversified” portfolio, as that term is defined in the 1940 Act, as interpreted or modified by regulatory authorities having jurisdiction, from time to time.
Shares of the Portfolio are currently offered to certain separate accounts to fund variable annuity policies and variable universal life insurance policies issued by New York Life Insurance and Annuity Corporation (“NYLIAC”), a wholly-owned subsidiary of New York Life Insurance Company (“New York Life”) and may also be offered to fund variable annuity policies and variable universal life insurance policies issued by other insurance companies. NYLIAC allocates shares of the Portfolio to, among others, certain NYLIAC separate accounts. Shares of the Portfolio are also offered to the MainStay VP Conservative Allocation Portfolio, MainStay VP Moderate Allocation Portfolio, MainStay VP Growth Allocation Portfolio and MainStay VP Equity Allocation Portfolio, which operate as “funds-of-funds," and other variable insurance funds.
The following table lists the Portfolio's share classes that have been registered and commenced operations:
| Class | Commenced Operations |
| Initial Class | February 17, 2012 |
| Service Class | February 17, 2012 |
Shares of the Portfolio are offered and are redeemed at a price equal to their respective net asset value (“NAV”) per share. No sales or redemption charge is applicable to the purchase or redemption of the Portfolio's shares. Under the terms of the Fund’s multiple class plan, adopted pursuant to Rule 18f-3 under the 1940 Act, the classes differ in that, among other things, Service Class shares of the Portfolio pay a combined distribution and service fee of 0.25% of average daily net assets attributable to Service Class shares of the Portfolio to the Distributor (as defined in Note 3(B)) pursuant to a plan adopted in accordance with Rule 12b-1 under the 1940 Act. Contract owners of variable annuity contracts purchased after June 2, 2003, are permitted to invest only in the Service Class shares.
The Portfolio's investment objective is to seek long-term capital growth, consistent with preservation of capital and balanced by current income.
Note 2–Significant Accounting Policies
The Portfolio is an investment company and accordingly follows the investment company accounting and reporting guidance of the Financial Accounting Standards Board (“FASB”) Accounting Standards Codification Topic 946 Financial Services—Investment Companies. The Portfolio prepares its financial statements in accordance with generally accepted
accounting principles (“GAAP”) in the United States of America and follows the significant accounting policies described below.
(A) Securities Valuation. Investments are usually valued as of the close of regular trading on the New York Stock Exchange (the "Exchange") (usually 4:00 p.m. Eastern time) on each day the Portfolio is open for business ("valuation date").
Pursuant to Rule 2a-5 under the 1940 Act, the Board of Trustees of the Fund (the "Board") has designated New York Life Investment Management LLC (“New York Life Investments” or the "Manager") as its Valuation Designee (the "Valuation Designee"). The Valuation Designee is responsible for performing fair valuations relating to all investments in the Portfolio’s portfolio for which market quotations are not readily available; periodically assessing and managing material valuation risks; establishing and applying fair value methodologies; testing fair valuation methodologies; evaluating and overseeing pricing services; ensuring appropriate segregation of valuation and portfolio management functions; providing quarterly, annual and prompt reporting to the Board, as appropriate; identifying potential conflicts of interest; and maintaining appropriate records. The Valuation Designee has established a valuation committee ("Valuation Committee") to assist in carrying out the Valuation Designee’s responsibilities and establish prices of securities for which market quotations are not readily available. The Portfolio's and the Valuation Designee's policies and procedures ("Valuation Procedures") govern the Valuation Designee’s selection and application of methodologies for determining and calculating the fair value of Portfolio investments. The Valuation Designee may value the Portfolio's portfolio securities for which market quotations are not readily available and other Portfolio assets utilizing inputs from pricing services and other third-party sources. The Valuation Committee meets (in person, via electronic mail or via teleconference) on an ad-hoc basis to determine fair valuations and on a quarterly basis to review fair value events with respect to certain securities for which market quotations are not readily available, including valuation risks and back-testing results, and to preview reports to the Board.
The Valuation Committee establishes prices of securities for which market quotations are not readily available based on such methodologies and measurements on a regular basis after considering information that is reasonably available and deemed relevant by the Valuation Committee. The Board shall oversee the Valuation Designee and review fair valuation materials on a prompt, quarterly and annual basis and approve proposed revisions to the Valuation Procedures.
Investments for which market quotations are not readily available are valued at fair value as determined in good faith pursuant to the Valuation Procedures. A market quotation is readily available only when that quotation is a quoted price (unadjusted) in active markets for identical investments that the Portfolio can access at the measurement date, provided that a quotation will not be readily available if it is not reliable. "Fair value" is defined as the price the Portfolio would reasonably expect to receive upon selling an asset or liability in an orderly transaction to an independent buyer in the principal or most advantageous market for the
Notes to Financial Statements (continued)
asset or liability. Fair value measurements are determined within a framework that establishes a three-tier hierarchy that maximizes the use of observable market data and minimizes the use of unobservable inputs to establish a classification of fair value measurements for disclosure purposes. "Inputs" refer broadly to the assumptions that market participants would use in pricing the asset or liability, including assumptions about risk, such as the risk inherent in a particular valuation technique used to measure fair value using a pricing model and/or the risk inherent in the inputs for the valuation technique. Inputs may be observable or unobservable. Observable inputs reflect the assumptions market participants would use in pricing the asset or liability based on market data obtained from sources independent of the Portfolio. Unobservable inputs reflect the Portfolio’s own assumptions about the assumptions market participants would use in pricing the asset or liability based on the information available. The inputs or methodology used for valuing assets or liabilities may not be an indication of the risks associated with investing in those assets or liabilities. The three-tier hierarchy of inputs is summarized below.
| • | Level 1—quoted prices (unadjusted) in active markets for an identical asset or liability |
| • | Level 2—other significant observable inputs (including quoted prices for a similar asset or liability in active markets, interest rates and yield curves, prepayment speeds, credit risk, etc.) |
| • | Level 3—significant unobservable inputs (including the Portfolio's own assumptions about the assumptions that market participants would use in measuring fair value of an asset or liability) |
The level of an asset or liability within the fair value hierarchy is based on the lowest level of an input, both individually and in the aggregate, that is significant to the fair value measurement. The aggregate value by input level of the Portfolio’s assets and liabilities as of December 31, 2023, is included at the end of the Portfolio of Investments.
The Portfolio may use third-party vendor evaluations, whose prices may be derived from one or more of the following standard inputs, among others:
| • Benchmark yields | • Reported trades |
| • Broker/dealer quotes | • Issuer spreads |
| • Two-sided markets | • Benchmark securities |
| • Bids/offers | • Reference data (corporate actions or material event notices) |
| • Industry and economic events | • Comparable bonds |
| • Monthly payment information | |
An asset or liability for which a market quotation is not readily available is valued by methods deemed reasonable in good faith by the Valuation Committee, following the Valuation Procedures to represent fair value. Under these procedures, the Valuation Designee generally uses a market-based approach which may use related or comparable assets or liabilities, recent transactions, market multiples, book values and other relevant information. The Valuation Designee may also use an
income-based valuation approach in which the anticipated future cash flows of the asset or liability are discounted to calculate fair value. Discounts may also be applied due to the nature and/or duration of any restrictions on the disposition of the asset or liability. Fair value represents a good faith approximation of the value of a security. Fair value determinations involve the consideration of a number of subjective factors, an analysis of applicable facts and circumstances and the exercise of judgment. As a result, it is possible that the fair value for a security determined in good faith in accordance with the Valuation Procedures may differ from valuations for the same security determined for other funds using their own valuation procedures. Although the Valuation Procedures are designed to value a security at the price the Portfolio may reasonably expect to receive upon the security's sale in an orderly transaction, there can be no assurance that any fair value determination thereunder would, in fact, approximate the amount that the Portfolio would actually realize upon the sale of the security or the price at which the security would trade if a reliable market price were readily available. During the year ended December 31, 2023, there were no material changes to the fair value methodologies.
Securities which may be valued in this manner include, but are not limited to: (i) a security for which trading has been halted or suspended or otherwise does not have a readily available market quotation on a given day; (ii) a debt security that has recently gone into default and for which there is not a current market quotation; (iii) a security of an issuer that has entered into a restructuring; (iv) a security that has been delisted from a national exchange; (v) a security subject to trading collars for which no or limited trading takes place; and (vi) a security whose principal market has been temporarily closed at a time when, under normal conditions, it would be open. Securities valued in this manner are generally categorized as Level 2 or 3 in the hierarchy.
Equity securities, rights and warrants, if applicable, are valued at the last quoted sales prices as of the close of regular trading on the relevant exchange on each valuation date. Securities that are not traded on the valuation date are valued at the mean of the last quoted bid and ask prices. Prices are normally taken from the principal market in which each security trades. These securities are generally categorized as Level 1 in the hierarchy.
Investments in mutual funds, including money market funds, are valued at their respective NAVs at the close of business each day on the valuation date. These securities are generally categorized as Level 1 in the hierarchy.
Debt securities (other than convertible and municipal bonds) are valued at the evaluated bid prices (evaluated mean prices in the case of convertible and municipal bonds) supplied by a pricing agent or broker selected by the Valuation Designee, in consultation with the Subadvisor. The evaluations are market-based measurements processed through a pricing application and represents the pricing agent’s good faith determination as to what a holder may receive in an orderly transaction under market conditions. The rules-based logic utilizes valuation techniques that reflect participants’ assumptions and vary by asset class and per methodology,
| 34 | MainStay VP Janus Henderson Balanced Portfolio |
maximizing the use of relevant observable data including quoted prices for similar assets, benchmark yield curves and market corroborated inputs. The evaluated bid or mean prices are deemed by the Valuation Designee, in consultation with the Subadvisor, to be representative of market values at the regular close of trading of the Exchange on each valuation date. Debt securities purchased on a delayed delivery basis are marked to market daily until settlement at the forward settlement date. Debt securities, including corporate bonds, U.S. government and federal agency bonds, municipal bonds, foreign bonds, convertible bonds, asset-backed securities and mortgage-backed securities are generally categorized as Level 2 in the hierarchy.
Temporary cash investments acquired in excess of 60 days to maturity at the time of purchase are valued using the latest bid prices or using valuations based on a matrix system (which considers such factors as security prices, yields, maturities and ratings), both as furnished by independent pricing services. Temporary cash investments that mature in 60 days or less at the time of purchase ("Short-Term Investments") are valued using the amortized cost method of valuation, unless the use of such method would be inappropriate. The amortized cost method involves valuing a security at its cost on the date of purchase and thereafter assuming a constant amortization to maturity of the difference between such cost and the value on maturity date. Amortized cost approximates the current fair value of a security. Securities valued using the amortized cost method are not valued using quoted prices in an active market and are generally categorized as Level 2 in the hierarchy.
The information above is not intended to reflect an exhaustive list of the methodologies that may be used to value portfolio investments. The Valuation Procedures permit the use of a variety of valuation methodologies in connection with valuing portfolio investments. The methodology used for a specific type of investment may vary based on the market data available or other considerations. The methodologies summarized above may not represent the specific means by which portfolio investments are valued on any particular business day.
(B) Income Taxes. The Portfolio's policy is to comply with the requirements of the Internal Revenue Code of 1986, as amended (the “Internal Revenue Code”), applicable to regulated investment companies and to distribute all of its taxable income to the shareholders of the Portfolio within the allowable time limits.
The Manager evaluates the Portfolio’s tax positions to determine if the tax positions taken meet the minimum recognition threshold in connection with accounting for uncertainties in income tax positions taken or expected to be taken for the purposes of measuring and recognizing tax liabilities in the financial statements. Recognition of tax benefits of an uncertain tax position is permitted only to the extent the position is “more likely than not” to be sustained assuming examination by taxing authorities. The Manager analyzed the Portfolio's tax positions taken on federal, state and local income tax returns for all open tax years (for up to three tax years) and has concluded that no provisions for federal, state and local income tax are required in the Portfolio's financial statements. The Portfolio's federal, state and local income tax and federal excise tax
returns for tax years for which the applicable statutes of limitations have not expired are subject to examination by the Internal Revenue Service and state and local departments of revenue.
(C) Dividends and Distributions to Shareholders. Dividends and distributions are recorded on the ex-dividend date. The Portfolio intends to declare and pay dividends from net investment income and distributions from net realized capital and currency gains, if any, at least annually. All dividends and distributions are reinvested at NAV in the same class of shares of the Portfolio. Dividends and distributions to shareholders are determined in accordance with federal income tax regulations and may differ from determinations using GAAP.
(D) Security Transactions and Investment Income. The Portfolio records security transactions on the trade date. Realized gains and losses on security transactions are determined using the identified cost method. Dividend income is recognized on the ex-dividend date, net of any foreign tax withheld at the source, and interest income is accrued as earned using the effective interest rate method and includes any realized gains and losses from repayments of principal on mortgage-backed securities. Distributions received from real estate investment trusts may be classified as dividends, capital gains and/or return of capital. Discounts and premiums on securities purchased for the Portfolio are accreted and amortized, respectively, on the effective interest rate method.
Investment income and realized and unrealized gains and losses on investments of the Portfolio are allocated pro rata to the separate classes of shares based upon their relative net assets on the date the income is earned or realized and unrealized gains and losses are incurred.
The Portfolio may place a debt security on non-accrual status and reduce related interest income by ceasing current accruals and writing off all or a portion of any interest receivables when the collection of all or a portion of such interest has become doubtful. A debt security is removed from non-accrual status when the issuer resumes interest payments or when collectability of interest is reasonably assured.
(E) Expenses. Expenses of the Fund are allocated to the individual Portfolios in proportion to the net assets of the respective Portfolios when the expenses are incurred, except where direct allocations of expenses can be made. Expenses (other than fees incurred under the distribution and service plans, further discussed in Note 3(B), which are charged directly to the Service Class shares) are allocated to separate classes of shares pro rata based upon their relative net assets on the date the expenses are incurred. The expenses borne by the Portfolio, including those of related parties to the Portfolio, are shown in the Statement of Operations.
Additionally, the Portfolio may invest in mutual funds, which are subject to management fees and other fees that may cause the costs of investing in mutual funds to be greater than the costs of owning the underlying securities directly. These indirect expenses of mutual funds are not included in the amounts shown as expenses in the Statement of Operations or in the expense ratios included in the Financial Highlights.
Notes to Financial Statements (continued)
(F) Use of Estimates. In preparing financial statements in conformity with GAAP, the Manager makes estimates and assumptions that affect the reported amounts and disclosures in the financial statements. Actual results could differ from those estimates and assumptions.
(G) Securities Lending. In order to realize additional income, the Portfolio may engage in securities lending, subject to the limitations set forth in the 1940 Act and relevant guidance by the staff of the Securities and Exchange Commission (“SEC”). If the Portfolio engages in securities lending, the Portfolio will lend through its custodian, JPMorgan Chase Bank, N.A., ("JPMorgan"), acting as securities lending agent on behalf of the Portfolio. Under the current arrangement, JPMorgan will manage the Portfolio's collateral in accordance with the securities lending agency agreement between the Portfolio and JPMorgan, and indemnify the Portfolio against counterparty risk. The loans will be collateralized by cash (which may be invested in a money market fund) and/or non-cash collateral (which may include U.S. Treasury securities and/or U.S. government agency securities issued or guaranteed by the United States government or its agencies or instrumentalities) at least equal at all times to the market value of the securities loaned. Non-cash collateral held at year end is segregated and cannot be transferred by the Portfolio. The Portfolio bears the risk of delay in recovery of, or loss of rights in, the securities loaned. The Portfolio may also record a realized gain or loss on securities deemed sold due to a borrower’s inability to return securities on loan. The Portfolio bears the risk of any loss on investment of cash collateral. The Portfolio will receive compensation for lending its securities in the form of fees or it will retain a portion of interest earned on the investment of any cash collateral. The Portfolio will also continue to receive interest and dividends on the securities loaned and any gain or loss in the market price of the securities loaned that may occur during the term of the loan will be for the account of the Portfolio. Income earned from securities lending activities, if any, is reflected in the Statement of Operations.
(H) Dollar Rolls. The Portfolio may enter into dollar roll transactions in which it sells mortgage-backed securities ("MBS") from its portfolio to a counterparty from whom it simultaneously agrees to buy a similar security on a delayed delivery basis. The Portfolio generally transfers MBS where the MBS are "to be announced," therefore, the Portfolio accounts for these transactions as purchases and sales.
When accounted for as purchase and sales, the securities sold in connection with the dollar rolls are removed from the portfolio and a realized gain or loss is recognized. The securities the Portfolio has agreed to acquire are included at market value in the Portfolio of Investments and liabilities for such purchase commitments are included as payables for investments purchased. During the roll period, the Portfolio foregoes principal and interest paid on the securities. The Portfolio is compensated by the difference between the current sales price and the forward price for the future as well as by the earnings on the cash proceeds of the initial sale. Dollar rolls may be renewed without physical delivery of the securities subject to the contract. Dollar roll transactions involve certain risks, including the risk that the securities returned to the Portfolio at the
end of the roll period, while substantially similar, could be inferior to what was initially sold to the counterparty.
(I) Securities Risk. The ability of issuers of debt securities held by the Portfolio to meet their obligations may be affected by, among other things, economic or political developments in a specific country, industry or region. Debt securities are also subject to the risks associated with changes in interest rates.
The Portfolio may invest in high-yield debt securities (sometimes called “junk bonds”), which are generally considered speculative because they present a greater risk of loss, including default, than higher rated debt securities. These securities pay investors a premium—a higher interest rate or yield than investment grade debt securities—because of the increased risk of loss. These securities can also be subject to greater price volatility. In times of unusual or adverse market, economic or political conditions, these securities may experience higher than normal default rates.
Investments in the Portfolio are not guaranteed, even though some of the Portfolio’s underlying investments are guaranteed by the U.S. government or its agencies or instrumentalities. The principal risk of mortgage-related and asset-backed securities is that the underlying debt may be prepaid ahead of schedule, if interest rates fall, thereby reducing the value of the Portfolio’s investment. If interest rates rise, less of the debt may be prepaid and the Portfolio may lose money because the Portfolio may be unable to invest in higher yielding assets. The Portfolio is subject to interest-rate risk and can lose principal value when interest rates rise. Bonds are also subject to credit risk, in which the bond issuer may fail to pay interest and principal in a timely manner.
The Portfolio’s investments may include loans which are usually rated below investment grade and are generally considered speculative because they present a greater risk of loss, including default, than higher rated debt securities. These investments pay investors a higher interest rate than investment grade debt securities because of the increased risk of loss. Although certain loans are collateralized, there is no guarantee that the value of the collateral will be sufficient to repay the loan. In a recession or serious credit event, the value of these investments could decline significantly. As a result, the Portfolio’s NAVs could go down and you could lose money.
In addition, loans generally are subject to extended settlement periods that may be longer than seven days. As a result, the Portfolio may be adversely affected by selling other investments at an unfavorable time and/or under unfavorable conditions or engaging in borrowing transactions, such as borrowing against its credit facility, to raise cash to meet redemption obligations or pursue other investment opportunities.
In certain circumstances, loans may not be deemed to be securities. As a result, the Portfolio may not have the protection of anti-fraud provisions of the federal securities laws. In such cases, the Portfolio generally must rely on the contractual provisions in the loan agreement and common-law fraud protections under applicable state law.
| 36 | MainStay VP Janus Henderson Balanced Portfolio |
The Portfolio may invest in foreign securities, both debt and equity securities, which carry certain risks that are in addition to the usual risks inherent in domestic securities. These risks include those resulting from currency fluctuations, future adverse political or economic developments and possible imposition of currency exchange blockages or other foreign governmental laws or restrictions. These risks are likely to be greater in emerging markets than in developed markets. The ability of issuers of securities held by the Portfolio to meet their obligations may be affected by, among other things, economic or political developments in a specific country, industry or region.
(J) Indemnifications. Under the Fund’s organizational documents, its officers and trustees are indemnified against certain liabilities that may arise out of performance of their duties to the Fund. Additionally, in the normal course of business, the Portfolio enters into contracts with third-party service providers that contain a variety of representations and warranties and that may provide general indemnifications. The Portfolio's maximum exposure under these arrangements is unknown, as this would involve future claims that may be made against the Portfolio that have not yet occurred. The Manager believes that the risk of loss in connection with these potential indemnification obligations is remote. However, there can be no assurance that material liabilities related to such obligations will not arise in the future, which could adversely impact the Portfolio.
Note 3–Fees and Related Party Transactions
(A) Manager and Subadvisor. New York Life Investments, a registered investment adviser and an indirect, wholly-owned subsidiary of New York Life, serves as the Portfolio’s Manager pursuant to an Amended and Restated Management Agreement (“Management Agreement”). The Manager provides offices, conducts clerical, recordkeeping and bookkeeping services, and keeps most of the financial and accounting records required to be maintained by the Portfolio. Except for the portion of salaries and expenses that are the responsibility of the Portfolio, the Manager pays the salaries and expenses of all personnel affiliated with the Portfolio and certain operational expenses of the Portfolio. The Portfolio reimburses New York Life Investments in an amount equal to the portion of the compensation of the Chief Compliance Officer attributable to the Portfolio. Janus Henderson Investors US LLC (“Janus” or the “Subadvisor”), a registered investment adviser and wholly-owned subsidiary of Janus Henderson Group plc, doing business as Janus Henderson Investors, serves as the Subadvisor to the Portfolio and is responsible for the day-to-day portfolio management of the Portfolio. Pursuant to the terms of a Subadvisory Agreement between New York Life Investments and Janus, New York Life Investments pays for the services of the Subadvisor.
Pursuant to the Management Agreement, the Fund pays the Manager, on behalf of the Portfolio, a monthly fee for the services performed and the facilities furnished at an annual rate of the Portfolio's average daily net assets as follows: 0.55% up to $1 billion; 0.525% from $1 billion to $2 billion; and 0.515% in excess of $2 billion. During the year ended
December 31, 2023, the effective management fee rate was 0.54% of the Portfolio's average daily net assets.
During the year ended December 31, 2023, New York Life Investments earned fees from the Portfolio in the amount of $7,864,923 and paid the Subadvisor fees in the amount of $3,676,154.
JPMorgan provides sub-administration and sub-accounting services to the Portfolio pursuant to an agreement with New York Life Investments. These services include calculating the daily NAVs of the Portfolio, maintaining the general ledger and sub-ledger accounts for the calculation of the Portfolio's NAVs, and assisting New York Life Investments in conducting various aspects of the Portfolio's administrative operations. For providing these services to the Portfolio, JPMorgan is compensated by New York Life Investments.
Pursuant to an agreement between the Fund and New York Life Investments, New York Life Investments is responsible for providing or procuring certain regulatory reporting services for the Portfolio. The Portfolio will reimburse New York Life Investments for the actual costs incurred by New York Life Investments in connection with providing or procuring these services for the Portfolio.
(B) Distribution and Service Fees. The Fund, on behalf of the Portfolio, has entered into a distribution agreement with NYLIFE Distributors LLC (the “Distributor”), an affiliate of New York Life Investments. The Portfolio has adopted a distribution plan (the “Plan”) in accordance with the provisions of Rule 12b-1 under the 1940 Act. Under the Plan, the Distributor has agreed to provide, through its affiliates or independent third parties, various distribution-related, shareholder and administrative support services to the Service Class shareholders. For its services, the Distributor is entitled to a combined distribution and service fee accrued daily and paid monthly at an annual rate of 0.25% of the average daily net assets attributable to the Service Class shares of the Portfolio.
Note 4-Federal Income Tax
As of December 31, 2023, the cost and unrealized appreciation (depreciation) of the Portfolio’s investment portfolio, including applicable derivative contracts and other financial instruments, as determined on a federal income tax basis, were as follows:
| | Federal Tax
Cost | Gross
Unrealized
Appreciation | Gross
Unrealized
(Depreciation) | Net
Unrealized
Appreciation/
(Depreciation) |
| Investments in Securities | $1,221,891,534 | $362,068,445 | $(20,961,384) | $341,107,061 |
Notes to Financial Statements (continued)
As of December 31, 2023, the components of accumulated gain (loss) on a tax basis were as follows:
Ordinary
Income | Accumulated
Capital
and Other
Gain (Loss) | Other
Temporary
Differences | Unrealized
Appreciation
(Depreciation) | Total
Accumulated
Gain (Loss) |
| $29,169,889 | $(1,745,178) | $— | $341,107,061 | $368,531,772 |
The difference between book-basis and tax-basis unrealized appreciation (depreciation) is primarily due to wash sale and cumulative bond amortization adjustments.
As of December 31, 2023, for federal income tax purposes, capital loss carryforwards of $1,745,178, as shown in the table below, were available to the extent provided by the regulations to offset future realized gains of the Portfolio. Accordingly, no capital gains distributions are expected to be paid to shareholders until net gains have been realized in excess of such amounts.
Capital Loss
Available Through | Short-Term
Capital Loss
Amounts (000’s) | Long-Term
Capital Loss
Amounts (000’s) |
| Unlimited | $1,745 | $— |
During the years ended December 31, 2023 and December 31, 2022, the tax character of distributions paid as reflected in the Statements of Changes in Net Assets was as follows:
| | 2023 | 2022 |
| Distributions paid from: | | |
| Ordinary Income | $18,438,876 | $ 19,906,699 |
| Long-Term Capital Gains | 56,624,317 | 98,902,852 |
| Total | $75,063,193 | $118,809,551 |
Note 5–Custodian
JPMorgan is the custodian of cash and securities held by the Portfolio. Custodial fees are charged to the Portfolio based on the Portfolio's net assets and/or the market value of securities held by the Portfolio and the number of certain transactions incurred by the Portfolio.
Note 6–Line of Credit
The Portfolio and certain other funds managed by New York Life Investments maintain a line of credit with a syndicate of banks in order to secure a source of funds for temporary purposes to meet unanticipated or excessive redemption requests.
Effective July 25, 2023, under the credit agreement (the “Credit Agreement”), the aggregate commitment amount is $600,000,000 with an additional uncommitted amount of $100,000,000. The commitment fee is an annual rate of 0.15% of the average commitment amount payable quarterly, regardless of usage, to JPMorgan, who serves as the agent to the syndicate. The commitment fee is allocated among the Portfolio and certain other funds managed by New York Life Investments based upon their respective net assets and other factors. Interest on any
revolving credit loan is charged based upon the Federal Funds Rate, Daily SOFR + 0.10%, or the Overnight Bank Funding Rate, whichever is higher. The Credit Agreement expires on July 23, 2024, although the Portfolio, certain other funds managed by New York Life Investments and the syndicate of banks may renew the Credit Agreement for an additional year on the same or different terms or enter into a credit agreement with a different syndicate of banks. Prior to July 25, 2023, the aggregate commitment amount and the commitment fee were the same as those under the current Credit Agreement. During the year ended December 31, 2023, there were no borrowings made or outstanding with respect to the Portfolio under the Credit Agreement.
Note 7–Interfund Lending Program
Pursuant to an exemptive order issued by the SEC, the Portfolio, along with certain other funds managed by New York Life Investments, may participate in an interfund lending program. The interfund lending program provides an alternative credit facility that permits the Portfolio and certain other funds managed by New York Life Investments to lend or borrow money for temporary purposes directly to or from one another, subject to the conditions of the exemptive order. During the year ended December 31, 2023, there were no interfund loans made or outstanding with respect to the Portfolio.
Note 8–Purchases and Sales of Securities (in 000’s)
During the year ended December 31, 2023, purchases and sales of U.S. government securities were $649,944 and $714,825, respectively. Purchases and sales of securities, other than U.S. government securities and short-term securities, were $1,421,687 and $1,381,073, respectively.
Note 9–Capital Share Transactions
Transactions in capital shares for the years ended December 31, 2023 and December 31, 2022, were as follows:
| Initial Class | Shares | Amount |
| Year ended December 31, 2023: | | |
| Shares sold | 418,650 | $ 5,760,821 |
| Shares issued to shareholders in reinvestment of distributions | 1,399,369 | 18,261,202 |
| Shares redeemed | (3,101,877) | (42,452,530) |
| Net increase (decrease) | (1,283,858) | $ (18,430,507) |
| Year ended December 31, 2022: | | |
| Shares sold | 486,758 | $ 7,148,243 |
| Shares issued to shareholders in reinvestment of distributions | 2,496,394 | 30,995,228 |
| Shares redeemed | (2,663,843) | (38,681,553) |
| Net increase (decrease) | 319,309 | $ (538,082) |
| |
| 38 | MainStay VP Janus Henderson Balanced Portfolio |
| Service Class | Shares | Amount |
| Year ended December 31, 2023: | | |
| Shares sold | 11,739,443 | $ 160,273,606 |
| Shares issued to shareholders in reinvestment of distributions | 4,389,338 | 56,801,991 |
| Shares redeemed | (12,311,786) | (166,734,958) |
| Net increase (decrease) | 3,816,995 | $ 50,340,639 |
| Year ended December 31, 2022: | | |
| Shares sold | 10,549,192 | $ 153,582,039 |
| Shares issued to shareholders in reinvestment of distributions | 7,128,654 | 87,814,323 |
| Shares redeemed | (12,295,154) | (176,932,917) |
| Net increase (decrease) | 5,382,692 | $ 64,463,445 |
Note 10–Other Matters
As of the date of this report, the Portfolio faces a heightened level of risk associated with current uncertainty, volatility and state of economies, financial markets, rising interest rates, and labor and health conditions around the world. Events such as war, acts of terrorism, recessions, rapid inflation, the imposition of international sanctions, earthquakes, hurricanes, epidemics and pandemics and other unforeseen natural or human disasters may have broad adverse social, political and economic effects on the global economy, which could negatively impact the value of the Portfolio's investments. Developments that disrupt global economies and financial markets may magnify factors that affect the Portfolio's performance.
Note 11–Subsequent Events
In connection with the preparation of the financial statements of the Portfolio as of and for the year ended December 31, 2023, events and transactions subsequent to December 31, 2023, through the date the financial statements were issued, have been evaluated by the Manager for possible adjustment and/or disclosure. No subsequent events requiring financial statement adjustment or disclosure have been identified.
Report of Independent Registered Public Accounting Firm
To the Board of Trustees of MainStay VP Funds Trust and Shareholders of MainStay VP Janus Henderson Balanced Portfolio
Opinion on the Financial Statements
We have audited the accompanying statement of assets and liabilities, including the portfolio of investments, of MainStay VP Janus Henderson Balanced Portfolio (one of the portfolios constituting MainStay VP Funds Trust, referred to hereafter as the “Portfolio”) as of December 31, 2023, the related statement of operations for the year ended December 31, 2023, the statements of changes in net assets for each of the two years in the period ended December 31, 2023, including the related notes, and the financial highlights for each of the five years in the period ended December 31, 2023 (collectively referred to as the “financial statements”). In our opinion, the financial statements present fairly, in all material respects, the financial position of the Portfolio as of December 31, 2023, the results of its operations for the year then ended, the changes in its net assets for each of the two years in the period ended December 31, 2023 and the financial highlights for each of the five years in the period ended December 31, 2023 in conformity with accounting principles generally accepted in the United States of America.
Basis for Opinion
These financial statements are the responsibility of the Portfolio’s management. Our responsibility is to express an opinion on the Portfolio’s financial statements based on our audits. We are a public accounting firm registered with the Public Company Accounting Oversight Board (United States) (PCAOB) and are required to be independent with respect to the Portfolio in accordance with the U.S. federal securities laws and the applicable rules and regulations of the Securities and Exchange Commission and the PCAOB.
We conducted our audits of these financial statements in accordance with the standards of the PCAOB. Those standards require that we plan and perform the audit to obtain reasonable assurance about whether the financial statements are free of material misstatement, whether due to error or fraud.
Our audits included performing procedures to assess the risks of material misstatement of the financial statements, whether due to error or fraud, and performing procedures that respond to those risks. Such procedures included examining, on a test basis, evidence regarding the amounts and disclosures in the financial statements. Our audits also included evaluating the accounting principles used and significant estimates made by management, as well as evaluating the overall presentation of the financial statements. Our procedures included confirmation of securities owned as of December 31, 2023 by correspondence with the custodian, transfer agents, and brokers; when replies were not received from brokers, we performed other auditing procedures. We believe that our audits provide a reasonable basis for our opinion.
/s/PricewaterhouseCoopers LLP
New York, New York
February 26, 2024
We have served as the auditor of one or more investment companies in the MainStay group of funds since 1984.
| 40 | MainStay VP Janus Henderson Balanced Portfolio |
Board Consideration and Approval of Management Agreement and Subadvisory Agreement (Unaudited)
The continuation of the Management Agreement with respect to the MainStay VP Janus Henderson Balanced Portfolio (“Portfolio”) and New York Life Investment Management LLC (“New York Life Investments”) and the Subadvisory Agreement between New York Life Investments and Janus Henderson Investors US LLC (“Janus”) with respect to the Portfolio (together, “Advisory Agreements”) is subject to annual review and approval by the Board of Trustees of MainStay VP Funds Trust (“Board” of the “Trust”) in accordance with Section 15 of the Investment Company Act of 1940, as amended (“1940 Act”). At its December 6–7, 2023 meeting, the Board, including the Trustees who are not an “interested person” (as such term is defined in the 1940 Act) of the Trust (“Independent Trustees”) voting separately, unanimously approved the continuation of each of the Advisory Agreements for a one-year period.
In reaching the decision to approve the continuation of each of the Advisory Agreements, the Board considered information and materials furnished by New York Life Investments and Janus in connection with an annual contract review process undertaken by the Board that took place at meetings of the Board and its Contracts Committee from September 2023 through December 2023, including information and materials furnished by New York Life Investments and Janus in response to requests prepared on behalf of the Board, and in consultation with the Independent Trustees, by independent legal counsel to the Independent Trustees, which encompassed a variety of topics, including those summarized below. Information and materials requested by and furnished to the Board for consideration in connection with the contract review process included, among other items, reports on the Portfolio and “peer funds” prepared by Institutional Shareholder Services Inc. (“ISS”), an independent third-party service provider engaged by the Board to report objectively on the Portfolio’s investment performance, management fee and total expenses. The Board also considered information on the fees charged to other investment advisory clients of New York Life Investments and/or Janus that follow investment strategies similar to those of the Portfolio, if any, and, when applicable, the rationale for differences in the Portfolio’s management and subadvisory fees and the fees charged to those other investment advisory clients. In addition, the Board considered information regarding the legal standards and fiduciary obligations applicable to its consideration of the continuation of each of the Advisory Agreements. The contract review process, including the structure and format for information and materials provided to the Board, has been developed in consultation with the Board. The Independent Trustees also met in executive sessions with their independent legal counsel and, for portions thereof, with senior management of New York Life Investments.
The Board’s deliberations with respect to the continuation of each of the Advisory Agreements reflect a year-long process, and the Board also took into account information furnished to the Board and its Committees throughout the year, as deemed relevant and appropriate by the Trustees, including, among other items, reports on investment performance of the Portfolio and investment-related matters for the Portfolio as well as presentations from New York Life Investments and, generally annually, Janus personnel. In addition, the Board took into account other
information provided by New York Life Investments throughout the year, including, among other items, periodic reports on legal and compliance matters, risk management, portfolio turnover, brokerage commissions and non-advisory services provided to the Portfolio by New York Life Investments, as deemed relevant and appropriate by the Trustees.
In addition to information provided to the Board throughout the year, the Board received information in connection with its June 2023 meeting provided specifically in response to requests prepared on behalf of the Board, and in consultation with the Independent Trustees, by independent legal counsel to the Independent Trustees regarding the Portfolio’s distribution arrangements. In addition, the Board received information regarding the Portfolio’s asset levels, share purchase and redemption activity and the payment of Rule 12b-1 and/or certain other fees by the applicable share classes of the Portfolio, among other information.
In considering the continuation of each of the Advisory Agreements, the Trustees reviewed and evaluated the information and factors they believed to reasonably be necessary and appropriate in light of legal advice furnished to them by independent legal counsel to the Independent Trustees and through the exercise of their own business judgment. Although individual Trustees may have weighed certain factors or information differently and the Board did not consider any single factor or information controlling in reaching its decision, the factors that figured prominently in the Board’s consideration of the continuation of each of the Advisory Agreements are summarized in more detail below and include, among other factors: (i) the nature, extent and quality of the services provided to the Portfolio by New York Life Investments and Janus; (ii) the qualifications of the portfolio managers of the Portfolio and the historical investment performance of the Portfolio, New York Life Investments and Janus; (iii) the costs of the services provided, and profits realized, by New York Life Investments and Janus with respect to their relationships with the Portfolio; (iv) the extent to which economies of scale have been realized or may be realized if the Portfolio grows and the extent to which any economies of scale have been shared, have benefited or may benefit the Portfolio’s shareholders; and (v) the reasonableness of the Portfolio’s management and subadvisory fees and total ordinary operating expenses. Although the Board recognized that comparisons between the Portfolio’s fees and expenses and those of other funds are imprecise given different terms of agreements, variations in fund strategies and other factors, the Board considered the reasonableness of the Portfolio’s management fee and total ordinary operating expenses as compared to the peer funds identified by ISS. Throughout their considerations, the Trustees acknowledged the commitment of New York Life Investments and its affiliates to serve the MainStay Group of Funds, as well as their capacity, experience, resources, financial stability and reputations. The Trustees also acknowledged the entrepreneurial and other risks assumed by New York Life Investments in sponsoring and managing the Portfolio. With respect to the Subadvisory Agreement, the Board took into account New York Life Investments’ recommendation to approve the continuation of the Subadvisory Agreement.
Board Consideration and Approval of Management Agreement and Subadvisory Agreement (Unaudited) (continued)
The Trustees noted that, throughout the year, the Trustees are afforded an opportunity to ask questions of, and request additional information or materials from, New York Life Investments and Janus. The Board’s decision with respect to each of the Advisory Agreements may have also been based, in part, on the Board’s knowledge of New York Life Investments and Janus resulting from, among other things, the Board’s consideration of each of the Advisory Agreements in prior years, the advisory agreements for other funds in the MainStay Group of Funds, the Board’s review throughout the year of the performance and operations of other funds in the MainStay Group of Funds and each Trustee’s business judgment and industry experience. In addition to considering the above-referenced factors, the Board observed that in the marketplace, notably under variable life insurance policies and variable annuity contracts for which the Portfolio serves as an investment option, there are a range of investment options available to investors and that the Portfolio’s shareholders, having had the opportunity to consider other investment options, have invested in the Portfolio.
The factors that figured prominently in the Board’s decision to approve the continuation of each of the Advisory Agreements during the Board’s December 6–7, 2023 meeting are summarized in more detail below.
Nature, Extent and Quality of Services Provided by New York Life Investments and Janus
The Board examined the nature, extent and quality of the services that New York Life Investments provides to the Portfolio. The Board evaluated New York Life Investments’ experience and capabilities in serving as manager of the Portfolio and considered that the Portfolio operates in a “manager-of-managers” structure. The Board also considered New York Life Investments’ responsibilities and services provided pursuant to this structure, including overseeing the services provided by Janus, evaluating the performance of Janus, making recommendations to the Board as to whether the Subadvisory Agreement should be renewed, modified or terminated and periodically reporting to the Board regarding the results of New York Life Investments’ evaluation and monitoring functions. The Board noted that New York Life Investments manages other mutual funds, serves a variety of other investment advisory clients, including other pooled investment vehicles, and has experience overseeing mutual fund service providers, including subadvisors. The Board considered the experience of senior personnel at New York Life Investments providing management and administrative and other non-advisory services to the Portfolio. The Board observed that New York Life Investments devotes significant resources and time to providing management and administrative and other non-advisory services to the Portfolio, including New York Life Investments’ oversight and due diligence reviews of Janus and ongoing analysis of, and interactions with, Janus with respect to, among other things, the Portfolio’s investment performance and risks as well as Janus’ investment capabilities and subadvisory services with respect to the Portfolio.
The Board also considered the range of services that New York Life Investments provides to the Portfolio under the terms of the Management Agreement, including: (i) fund accounting and ongoing supervisory
services provided by New York Life Investments’ Fund Administration and Accounting Group; (ii) investment supervisory and analytical services provided by New York Life Investments’ Investment Consulting Group; (iii) compliance services provided by the Trust’s Chief Compliance Officer as well as New York Life Investments’ compliance department, including supervision and implementation of the Portfolio’s compliance program; (iv) legal services provided by New York Life Investments’ Office of the General Counsel; and (v) risk management monitoring and analysis by compliance and investment personnel. In addition, the Board considered New York Life Investments’ willingness to invest in personnel and other resources, such as cyber security, information security and business continuity planning, that may benefit the Portfolio and noted that New York Life Investments is responsible for compensating the Trust’s officers, except for a portion of the salary of the Trust’s Chief Compliance Officer. The Board recognized that New York Life Investments provides certain other non-advisory services to the Portfolio and has over time provided an increasingly broad array of non-advisory services to the MainStay Group of Funds as a result of regulatory and other developments.
The Board also examined the range, and the nature, extent and quality, of the investment advisory services that Janus provides to the Portfolio and considered the terms of each of the Advisory Agreements. The Board evaluated Janus’ experience and performance in serving as subadvisor to the Portfolio and advising other portfolios and Janus’ track record and experience in providing investment advisory services as well as the experience of investment advisory, senior management and administrative personnel at Janus. The Board considered New York Life Investments’ and Janus’ overall resources, legal and compliance environment, capabilities, reputation, financial condition and history. In addition to information provided in connection with quarterly meetings with the Trust’s Chief Compliance Officer, the Board considered information regarding the compliance policies and procedures of New York Life Investments and Janus and acknowledged their commitment to further developing and strengthening compliance programs that may relate to the Portfolio. The Board also considered Janus’ ability to recruit and retain qualified investment professionals and willingness to invest in personnel and other resources that may benefit the Portfolio. In this regard, the Board considered the qualifications and experience of the Portfolio’s portfolio managers, the number of accounts managed by the portfolio managers and the method for compensating the portfolio managers.
In addition, the Board considered information provided by New York Life Investments and Janus regarding their respective business continuity and disaster recovery plans.
Based on these considerations, among others, the Board concluded that the Portfolio would likely continue to benefit from the nature, extent and quality of these services.
Investment Performance
In evaluating the Portfolio’s investment performance, the Board considered investment performance results over various periods in light of the Portfolio’s investment objective, strategies and risks. The Board
| 42 | MainStay VP Janus Henderson Balanced Portfolio |
considered investment reports on, and analysis of, the Portfolio’s performance provided to the Board throughout the year. These reports include, among other items, information on the Portfolio’s gross and net returns, the Portfolio’s investment performance compared to a relevant investment category and the Portfolio’s benchmarks, the Portfolio’s risk-adjusted investment performance and the Portfolio’s investment performance as compared to peer funds, as appropriate, as well as portfolio attribution information and commentary on the effect of market conditions. The Board also considered information provided by ISS showing the investment performance of the Portfolio as compared to peer funds. In addition, the Board reviewed the methodology used by ISS to construct the group of peer funds for comparative purposes.
The Board also took into account its discussions with senior management at New York Life Investments concerning the Portfolio’s investment performance over various periods as well as discussions between representatives of Janus and the members of the Board’s Investment Committee, which generally occur on an annual basis.
Based on these considerations, among others, the Board concluded that its review of the Portfolio’s investment performance and related information supported a determination to approve the continuation of each of the Advisory Agreements.
Costs of the Services Provided, and Profits and Other Benefits Realized, by New York Life Investments and Janus
The Board considered the costs of the services provided under each of the Advisory Agreements. The Board also considered the profitability of New York Life Investments and its affiliates and Janus due to their relationships with the Portfolio as well as by New York Life Investments and its affiliates due to their relationships with the MainStay Group of Funds. With respect to the profitability of Janus’ relationship with the Portfolio, the Board considered information from New York Life Investments that Janus’ subadvisory fee reflected an arm’s-length negotiation and that this fee is paid by New York Life Investments, not the Portfolio, and the relevance of Janus’ profitability was considered by the Trustees in that context. On this basis, the Board primarily considered the costs and profitability for New York Life Investments and its affiliates with respect to the Portfolio.
In addition, the Board acknowledged the difficulty in obtaining reliable comparative data about mutual fund managers’ profitability because such information generally is not publicly available and may be impacted by numerous factors, including the structure of a fund manager’s organization, the types of funds it manages, the methodology used to allocate certain fixed costs to specific funds and the manager’s capital structure and costs of capital.
In evaluating the costs of the services provided by New York Life Investments and Janus, and profitability of New York Life Investments and its affiliates and Janus due to their relationships with the Portfolio, the Board considered, among other factors, New York Life Investments’ and its affiliates’ and Janus’ continuing investments in, or willingness to invest in, personnel and other resources that may support and further enhance
the management of the Portfolio, and that New York Life Investments is responsible for paying the subadvisory fee for the Portfolio. The Board also considered the financial resources of New York Life Investments and Janus and acknowledged that New York Life Investments and Janus must be in a position to recruit and retain experienced professional personnel and to maintain a strong financial position for New York Life Investments and Janus to continue to provide high-quality services to the Portfolio. The Board recognized that the Portfolio benefits from the allocation of certain fixed costs among the funds in the MainStay Group of Funds, among other expected benefits resulting from its relationship with New York Life Investments.
The Board considered information regarding New York Life Investments’ methodology for calculating profitability and allocating costs provided by New York Life Investments in connection with the fund profitability analysis presented to the Board. The Board concluded that New York Life Investments’ methods for allocating costs and procedures for estimating overall profitability of the relationship with the funds in the MainStay Group of Funds were reasonable. The Board recognized the difficulty in calculating and evaluating a manager’s profitability with respect to the Portfolio and considered that other profitability methodologies may also be reasonable.
The Board also considered certain fall-out benefits that may be realized by New York Life Investments and its affiliates and Janus and its affiliates due to their relationships with the Portfolio, including reputational and other indirect benefits. The Board recognized, for example, the benefits to Janus from legally permitted “soft-dollar” arrangements by which brokers provide research and other services to Janus in exchange for commissions paid by the Portfolio with respect to trades in the Portfolio’s portfolio securities. In this regard, the Board also requested and considered information from New York Life Investments concerning other material business relationships between Janus and its affiliates and New York Life Investments and its affiliates that relates to certain current and future products and represents a potential conflict of interest associated with New York Life Investments’ recommendation to approve the Subadvisory Agreement. In addition, the Board considered its review of the management agreement for a money market fund advised by New York Life Investments and an affiliated subadvisor that serves as an investment option for the Portfolio, including the potential rationale for and costs associated with investments in this money market fund by the Portfolio, if any, and considered information from New York Life Investments that the nature and type of specific investment advisory services provided to this money market fund are distinct from, or in addition to, the investment advisory services provided to the Portfolio. In addition, the Board considered the potential dividend received tax deduction for insurance company affiliates of New York Life Investments from the Portfolio’s securities lending activity.
The Board noted that the Portfolio serves as an investment option primarily under variable contracts issued by affiliates of New York Life Investments that would receive fees under those contracts. The Board observed that, in addition to fees earned by New York Life Investments under the Management Agreement for managing the Portfolio, New York
Board Consideration and Approval of Management Agreement and Subadvisory Agreement (Unaudited) (continued)
Life Investments’ affiliates also earn revenues from serving the Portfolio in various other capacities, including as the Portfolio’s distributor, and insurance companies affiliated with New York Life Investments would be entitled to receive fees from the Portfolio under a distribution and service plan adopted pursuant to Rule 12b-1 under the 1940 Act. The Board considered information about these other revenues and their impact on the profitability of the relationship with the Portfolio to New York Life Investments and its affiliates. The Board noted that, although it assessed the overall profitability of the relationship with the Portfolio to New York Life Investments and its affiliates as part of the contract review process, when considering the reasonableness of the fee paid to New York Life Investments under the Management Agreement, the Board considered the profitability of New York Life Investments’ relationship with the Portfolio on a pre-tax basis and without regard to distribution expenses incurred by New York Life Investments from its own resources.
After evaluating the information deemed relevant by the Trustees, the Board concluded that any profits realized by New York Life Investments and its affiliates due to their relationships with the Portfolio were not excessive, other expected benefits that may accrue to New York Life Investments and its affiliates are reasonable and other expected benefits that may accrue to Janus and its affiliates are consistent with those expected for a subadvisor to a mutual fund. With respect to Janus, the Board considered that any profits realized by Janus due to its relationship with the Portfolio are the result of arm’s-length negotiations between New York Life Investments and Janus, acknowledging that any such profits are based on the subadvisory fee paid to Janus by New York Life Investments, not the Portfolio.
Management and Subadvisory Fees and Total Ordinary Operating Expenses
The Board evaluated the reasonableness of the fee paid under each of the Advisory Agreements and the Portfolio’s total ordinary operating expenses. With respect to the management fee and subadvisory fee, the Board primarily considered the reasonableness of the management fee paid by the Portfolio to New York Life Investments because the subadvisory fee paid to Janus is paid by New York Life Investments, not the Portfolio. The Board also considered the reasonableness of the subadvisory fee paid by New York Life Investments and the amount of the management fee retained by New York Life Investments.
In assessing the reasonableness of the Portfolio’s fees and expenses, the Board primarily considered comparative data provided by ISS on the fees and expenses of similar mutual funds managed by other investment advisers. The Board reviewed the methodology used by ISS to construct the group of peer funds for comparative purposes. In addition, the Board considered information provided by New York Life Investments and Janus on fees charged to other investment advisory clients, including institutional separate accounts and/or other funds, that follow investment strategies similar to those of the Portfolio, if any. The Board considered the contractual management fee schedule for the Portfolio as compared to those for such other investment advisory clients, taking into account the rationale for differences in fee schedules. The Board also took into
account information provided by New York Life Investments about the more extensive scope of services provided to registered investment companies, such as the Portfolio, as compared with other investment advisory clients. Additionally, the Board considered the impact of contractual breakpoints and voluntary waivers on the Portfolio’s net management fee and expenses. The Board also considered that in proposing fees for the Portfolio, New York Life Investments considers the competitive marketplace for mutual funds.
Based on the factors outlined above, among other considerations, the Board concluded that the Portfolio’s management fee and total ordinary operating expenses are within a range that is competitive and support a conclusion that these fees and expenses are reasonable.
Economies of Scale
The Board considered information regarding economies of scale, including whether economies of scale may exist with respect to the Portfolio and whether the Portfolio’s management fee and expense structure permits any economies of scale to be appropriately shared with the Portfolio’s shareholders. The Board also considered a report from New York Life Investments, previously prepared at the request of the Board, that addressed economies of scale, including with respect to the mutual fund business generally, and the various ways in which the benefits of economies of scale may be shared with the funds in the MainStay Group of Funds. Although the Board recognized the difficulty of determining economies of scale with precision, the Board acknowledged that economies of scale may be shared with the Portfolio in a number of ways, including, for example, through the imposition of fee breakpoints, initially setting management fee rates at scale or making additional investments to enhance the services provided to the Portfolio. The Board reviewed information from New York Life Investments showing how the Portfolio’s management fee schedule compared to fee schedules of other funds and accounts managed by New York Life Investments. The Board also reviewed information from ISS showing how the Portfolio’s management fee schedule compared with fees paid for similar services by peer funds at varying asset levels.
Based on this information, the Board concluded that economies of scale are appropriately shared for the benefit of the Portfolio’s shareholders through the Portfolio’s management fee and expense structure and other methods to share benefits from economies of scale.
Conclusion
On the basis of the information and factors summarized above, among other information and factors deemed relevant by the Trustees, and the evaluation thereof, the Board, including the Independent Trustees voting separately, unanimously voted to approve the continuation of each of the Advisory Agreements.
| 44 | MainStay VP Janus Henderson Balanced Portfolio |
Proxy Voting Policies and Procedures and Proxy Voting Record
The Portfolio is required to file with the SEC its proxy voting record for the 12-month period ending June 30 on Form N-PX. A description of the policies and procedures that are used to vote proxies relating to portfolio securities of the Portfolio is available free of charge upon request by calling 800-598-2019 or visiting the SEC's website at www.sec.gov. The most recent Form N-PX or proxy voting record is available free of charge upon request by calling 800-598-2019; visiting https://www.newyorklifeinvestments.com/investment-products/vp; or visiting the SEC’s website at www.sec.gov.
Shareholder Reports and Quarterly Portfolio Disclosure
The Portfolio is required to file its complete schedule of portfolio holdings with the SEC 60 days after its first and third fiscal quarter on Form N-PORT. The Portfolio's holdings report is available free of charge upon request by calling 800-598-2019 or by visiting the SEC’s website at www.sec.gov.
Board of Trustees and Officers (Unaudited)
The Trustees and officers of the Portfolio are listed below. The Board oversees the MainStay Group of Funds (which consists of MainStay Funds and MainStay Funds Trust), MainStay VP Funds Trust, MainStay MacKay DefinedTerm Municipal Opportunities Fund, MainStay CBRE Global Infrastructure Megatrends Term Fund, the Manager and the Subadvisors, and elects the officers of the Portfolios who are responsible for the day-to-day operations of the Portfolio. Information pertaining to the Trustees and officers is set forth below. Each Trustee serves until his or her successor is elected and qualified or until his or her resignation,
death or removal. Under the Board’s retirement policy, unless an exception is made, a Trustee must tender his or her resignation by the end of the calendar year during which he or she reaches the age of 75. Officers are elected annually by the Board. The business address of each Trustee and officer listed below is 51 Madison Avenue, New York, New York 10010. A majority of the Trustees are not “interested persons” (as defined by the 1940 Act and rules adopted by the SEC thereunder) of the Portfolio (“Independent Trustees”).
| | Name and
Year of Birth | Term of Office,
Position(s) Held and
Length of Service | Principal Occupation(s)
During Past Five Years | Number of
Portfolios in
Fund Complex
Overseen by
Trustee | Other Directorships
Held by Trustee |
| | | | | | |
| | Naïm Abou-Jaoudé*
1966 | MainStay VP Funds Trust: Trustee since 2023 | Chief Executive Officer of New York Life Investment Management LLC (since 2023). Chief Executive Officer of Candriam (an affiliate of New York Life Investment Management LLC) (2007 to 2023). | 81 | MainStay Funds: Trustee since 2023 (11 Funds)
MainStay Funds Trust: Trustee since 2023 (37 Funds);
MainStay MacKay DefinedTerm Municipal Opportunities Fund: Trustee since 2023;
MainStay CBRE Global Infrastructure Megatrends Term Fund: Trustee since 2023; and
New York Life Investment Management International (Chair) since 2015 |
| * | This Trustee is considered to be an “interested person” of the MainStay Group of Funds, MainStay VP Funds Trust, MainStay CBRE Global Infrastructure Megatrends Term Fund and MainStay MacKay DefinedTerm Municipal Opportunities Fund, within the meaning of the 1940 Act because of his affiliation with New York Life Investment Management LLC and Candriam, as described in detail above in the column entitled “Principal Occupation(s) During Past Five Years.” |
| | |
| 46 | MainStay VP Janus Henderson Balanced Portfolio |
| | Name and
Year of Birth | Term of Office,
Position(s) Held and
Length of Service | Principal Occupation(s)
During Past Five Years | Number of
Portfolios in
Fund Complex
Overseen by
Trustee | Other Directorships
Held by Trustee |
| | | | | | |
| | David H. Chow
1957 | MainStay VP Funds Trust: Trustee since January 2016, Advisory Board Member (June 2015 to December 2015) | Founder and CEO, DanCourt Management, LLC since 1999 | 81 | MainStay Funds: Trustee since January 2016, Advisory Board Member (June 2015 to December 2015) (11 Funds);
MainStay Funds Trust: Trustee since January 2016, Advisory Board Member (June 2015 to December 2015) (37 Funds);
MainStay MacKay DefinedTerm Municipal Opportunities Fund: Trustee since January 2016, Advisory Board Member (June 2015 to December 2015);
MainStay CBRE Global Infrastructure Megatrends Term Fund: Trustee since 2021;
VanEck Vectors Group of Exchange-Traded Funds: Trustee since 2006 and Independent Chairman of the Board of Trustees from 2008 to 2022 (57 portfolios); and
Berea College of Kentucky: Trustee since 2009, Chair of the Investment Committee since 2018 |
| | Karen Hammond
1956 | MainStay VP Funds Trust: Trustee since December 2021, Advisory Board Member (June 2021 to December 2021)
| Retired, Managing Director, Devonshire Investors (2007 to 2013); Senior Vice President, Fidelity Management & Research Co. (2005 to 2007); Senior Vice President and Corporate Treasurer, FMR Corp. (2003 to 2005); Chief Operating Officer, Fidelity Investments Japan (2001 to 2003) | 81 | MainStay Funds: Trustee since December 2021, Advisory Board Member (June 2021 to December 2021) (11 Funds);
MainStay Funds Trust: Trustee since December 2021, Advisory Board Member (June 2021 to December 2021) (37 Funds);
MainStay MacKay DefinedTerm Municipal Opportunities Fund: Trustee since December 2021, Advisory Board Member (June 2021 to December 2021);
MainStay CBRE Global Infrastructure Megatrends Term Fund: Trustee since December 2021, Advisory Board Member (June 2021 to December 2021);
Two Harbors Investment Corp.: Director since 2018;
Rhode Island State Investment Commission: Member since 2017; and
Blue Cross Blue Shield of Rhode Island: Director since 2019 |
| | Susan B. Kerley
1951 | MainStay VP Funds Trust: Chair since 2017 and Trustee since 2007** | President, Strategic Management Advisors LLC since 1990 | 81 | MainStay Funds: Chair since January 2017 and Trustee since 2007 (11 Funds); MainStay Funds Trust: Chair since January 2017 and Trustee since 1990 (37 Funds)***;
MainStay MacKay DefinedTerm Municipal Opportunities Fund: Chair since January 2017 and Trustee since 2011;
MainStay CBRE Global Infrastructure Megatrends Term Fund: Trustee since June 2021; and
Legg Mason Partners Funds: Trustee since 1991 (45 portfolios) |
Board of Trustees and Officers (Unaudited) (continued)
| | Name and
Year of Birth | Term of Office,
Position(s) Held and
Length of Service | Principal Occupation(s)
During Past Five Years | Number of
Portfolios in
Fund Complex
Overseen by
Trustee | Other Directorships
Held by Trustee |
| | | | | | |
| | Alan R. Latshaw
1951 | MainStay VP Funds Trust: Trustee since 2007** | Retired; Partner, Ernst & Young LLP (2002 to 2003); Partner, Arthur Andersen LLP (1989 to 2002); Consultant to the MainStay Funds Audit and Compliance Committee (2004 to 2006) | 81 | MainStay Funds: Trustee since 2006 (11 Funds);
MainStay Funds Trust: Trustee since 2007 (37 Funds)***;
MainStay MacKay DefinedTerm Municipal Opportunities Fund: Trustee since 2011; and
MainStay CBRE Global Infrastructure Megatrends Term Fund: Trustee since June 2021 |
| | Jacques P. Perold
1958 | MainStay VP Funds Trust: Trustee since January 2016, Advisory Board Member (June 2015 to December 2015) | Founder and Chief Executive Officer, CapShift Advisors LLC (since 2018); President, Fidelity Management & Research Company (2009 to 2014); President and Chief Investment Officer, Geode Capital Management, LLC (2001 to 2009) | 81 | MainStay Funds: Trustee since January 2016, Advisory Board Member (June 2015 to December 2015) (11 Funds);
MainStay Funds Trust: Trustee since January 2016, Advisory Board Member (June 2015 to December 2015) (37 Funds);
MainStay MacKay DefinedTerm Municipal Opportunities Fund: Trustee since January 2016, Advisory Board Member (June 2015 to December 2015);
MainStay CBRE Global Infrastructure Megatrends Term Fund: Trustee since June 2021;
Allstate Corporation: Director since 2015;
Partners in Health: Trustee since 2019; and
MSCI Inc.: Director since 2017 |
| | Richard S. Trutanic
1952 | MainStay VP Funds Trust: Trustee since 2007** | Chairman and Chief Executive Officer, Somerset & Company (financial advisory firm) since 2004; Managing Director, The Carlyle Group (private investment firm) (2002 to 2004); Senior Managing Director, Partner and Board Member, Groupe Arnault S.A. (private investment firm) (1999 to 2002) | 81 | MainStay Funds: Trustee since 1994 (11 Funds);
MainStay Funds Trust: Trustee since 2007 (37 Funds)***;
MainStay MacKay DefinedTerm Municipal Opportunities Fund: Trustee since 2011; and
MainStay CBRE Global Infrastructure Megatrends Term Fund: Trustee since June 2021 |
| ** | Includes prior service as a Director of MainStay VP Series Fund, Inc., the predecessor to MainStay VP Funds Trust. |
| *** | Includes prior service as a Director/Trustee of certain predecessor entities to MainStay Funds Trust. |
| 48 | MainStay VP Janus Henderson Balanced Portfolio |
| | Name and
Year of Birth | Position(s) Held and
Length of Service | Principal Occupation(s)
During Past Five Years | |
| | | | | |
| | Kirk C. Lehneis
1974 | President, MainStay VP Funds Trust (since 2017) | Chief Operating Officer and Senior Managing Director (since 2016), New York Life Investment Management LLC and New York Life Investment Management Holdings LLC; Member of the Board of Managers (since 2017) and Senior Managing Director (since 2018), NYLIFE Distributors LLC; Chairman of the Board and Senior Managing Director, NYLIM Service Company LLC (since 2017); Trustee, President and Principal Executive Officer of IndexIQ Trust, IndexIQ ETF Trust and IndexIQ Active ETF Trust (since 2018); President, MainStay CBRE Global Infrastructure Megatrends Term Fund (since 2021), MainStay MacKay DefinedTerm Municipal Opportunities Fund, MainStay Funds and MainStay Funds Trust (since 2017); Senior Managing Director, Global Product Development (from 2015 to 2016); Managing Director, Product Development (from 2010 to 2015), New York Life Investment Management LLC | |
| | Jack R. Benintende
1964 | Treasurer and Principal Financial and Accounting Officer, MainStay VP Funds Trust (since 2007)** | Managing Director, New York Life Investment Management LLC (since 2007); Treasurer and Principal Financial and Accounting Officer, MainStay CBRE Global Infrastructure Megatrends Term Fund (since 2021), MainStay MacKay DefinedTerm Municipal Opportunities Fund (since 2011), MainStay Funds Trust (since 2009) and MainStay Funds (since 2007); and Assistant Treasurer, New York Life Investment Management Holdings LLC (2008 to 2012) | |
| | J. Kevin Gao
1967 | Secretary and Chief Legal Officer, MainStay VP Funds Trust (since 2010)** | Managing Director and Associate General Counsel, New York Life Investment Management LLC (since 2010); Secretary and Chief Legal Officer, MainStay CBRE Global Infrastructure Megatrends Term Fund (since 2021), MainStay MacKay DefinedTerm Municipal Opportunities Fund (since 2011), MainStay Funds and MainStay Funds Trust (since 2010) | |
| | Kevin M. Gleason
1967 | Vice President and Chief Compliance Officer, MainStay VP Funds Trust (since June 2022) | Vice President and Chief Compliance Officer, IndexIQ Trust, IndexIQ ETF Trust and IndexIQ Active ETF Trust (since June 2022); Vice President and Chief Compliance Officer, MainStay CBRE Global Infrastructure Megatrends Term Fund, MainStay MacKay DefinedTerm Municipal Opportunities Fund (since June 2022); MainStay Funds Trust and MainStay Funds (since June 2022); Senior Vice President, Voya Investment Management and Chief Compliance Officer, Voya Family of Funds (2012 to 2022) | |
| | Scott T. Harrington
1959 | Vice President— Administration, MainStay VP Funds Trust (since 2005)** | Managing Director, New York Life Investment Management LLC (including predecessor advisory organizations) (since 2000); Member of the Board of Directors, New York Life Trust Company (since 2009); Vice President—Administration, MainStay CBRE Global Infrastructure Megatrends Term Fund (since 2021), MainStay MacKay DefinedTerm Municipal Opportunities Fund (since 2011), MainStay Funds Trust and MainStay Funds (since 2009) | |
| * | The officers listed above are considered to be “interested persons” of the MainStay Group of Funds, MainStay VP Funds Trust, MainStay CBRE Global Infrastructure Megatrends Term Fund and MainStay MacKay DefinedTerm Municipal Opportunities Fund within the meaning of the 1940 Act because of their affiliation with the MainStay Group of Funds, New York Life Insurance Company and/or its affiliates, including New York Life Investment Management LLC, New York Life Insurance Company, NYLIM Service Company LLC, NYLIFE Securities LLC and/or NYLIFE Distributors LLC, as described in detail in the column captioned “Principal Occupation(s) During Past Five Years.” Officers are elected annually by the Board. |
| ** | Includes prior service as an Officer of MainStay VP Series Fund, Inc., the predecessor to MainStay VP Funds Trust. |
Officers of the Trust (Who are not Trustees)*
This page intentionally left blank.
MainStay VP Portfolios
MainStay VP offers a wide range of Portfolios. The full array of MainStay VP offerings is listed here, with information about the manager, subadvisors, legal counsel, and independent registered public accounting firm.
Equity
MainStay VP American Century Sustainable Equity Portfolio
MainStay VP Candriam Emerging Markets Equity Portfolio
MainStay VP Epoch U.S. Equity Yield Portfolio
MainStay VP Fidelity Institutional AM® Utilities Portfolio†
MainStay VP Natural Resources Portfolio
MainStay VP PineStone International Equity Portfolio1
MainStay VP S&P 500 Index Portfolio
MainStay VP Small Cap Growth Portfolio
MainStay VP Wellington Growth Portfolio
MainStay VP Wellington Mid Cap Portfolio
MainStay VP Wellington Small Cap Portfolio
MainStay VP Wellington U.S. Equity Portfolio
MainStay VP Winslow Large Cap Growth Portfolio
Mixed Asset
MainStay VP Balanced Portfolio
MainStay VP Income Builder Portfolio
MainStay VP Janus Henderson Balanced Portfolio
MainStay VP MacKay Convertible Portfolio
Income
MainStay VP Bond Portfolio
MainStay VP Floating Rate Portfolio
MainStay VP Indexed Bond Portfolio
MainStay VP MacKay Government Portfolio2
MainStay VP MacKay High Yield Corporate Bond Portfolio
MainStay VP MacKay Strategic Bond Portfolio
MainStay VP PIMCO Real Return Portfolio
Money Market
MainStay VP U.S. Government Money Market Portfolio
Alternative
MainStay VP CBRE Global Infrastructure Portfolio
MainStay VP IQ Hedge Multi-Strategy Portfolio
Asset Allocation
MainStay VP Conservative Allocation Portfolio
MainStay VP Equity Allocation Portfolio
MainStay VP Growth Allocation Portfolio
MainStay VP Moderate Allocation Portfolio
Manager
New York Life Investment Management LLC
New York, New York
Subadvisors
American Century Investment Management, Inc.
Kansas City, Missouri
Brown Advisory LLC
Baltimore, Maryland
Candriam*
Strassen, Luxembourg
CBRE Investment Management Listed Real Assets LLC
Radnor, Pennsylvania
Epoch Investment Partners, Inc.
New York, New York
FIAM LLC
Smithfield, Rhode Island
IndexIQ Advisors LLC*
New York, New York
Janus Henderson Investors US LLC
Denver, Colorado
MacKay Shields LLC*
New York, New York
Newton Investment Management North America, LLC
Boston, Massachusetts
NYL Investors LLC*
New York, New York
Pacific Investment Management Company LLC
Newport Beach, California
PineStone Asset Management Inc.
Montreal, Québec
Segall Bryant & Hamill, LLC
Chicago, Illinois
Wellington Management Company LLP
Boston, Massachusetts
Winslow Capital Management, LLC
Minneapolis, Minnesota
Legal Counsel
Dechert LLP
Washington, District of Columbia
Independent Registered Public Accounting Firm
PricewaterhouseCoopers LLP
New York, New York
Distributor
NYLIFE Distributors LLC*
Jersey City, New Jersey
Custodian
JPMorgan Chase Bank, N.A.
New York, New York
Some Portfolios may not be available in all products.
† Fidelity Institutional AM is a registered trade mark of FMR LLC. Used with permission.
* An affiliate of New York Life Investment Management LLC.
| 1. | Prior to August 28, 2023, the Portfolio's name was MainStay VP MacKay International Equity Portfolio. |
| 2. | Effective on or about May 1, 2024, the MainStay VP MacKay Government Portfolio will be renamed the MainStay VP U.S. Infrastructure Bond Portfolio. |
Not part of the Annual Report
2023 Annual Report
This report is for the general information of New York Life Variable Annuities and NYLIAC Variable Universal Life Insurance Products policyowners. It must be preceded or accompanied by the appropriate product(s) and funds prospectuses if it is given to anyone who is not an owner of a New York Life variable annuity policy or a NYLIAC Variable Universal Life Insurance Product. This report does not offer for sale or solicit orders to purchase securities.
The performance data quoted in this report represents past performance. Past performance is no guarantee of future results. Due to market volatility and other factors, current performance may be lower or higher than the figures shown. The most recent month-end performance summary for your variable annuity or variable life policy is available by calling 800-598-2019 and is updated periodically on newyorklife.com.
The New York Life Variable Annuities and NYLIAC Variable Universal Life Insurance Products are issued by New York Life Insurance and Annuity Corporation (a Delaware Corporation) and distributed by NYLIFE Distributors LLC (Member FINRA/SIPC).
New York Life Insurance Company
New York Life Insurance and Annuity
Corporation (NYLIAC) (A Delaware Corporation)
51 Madison Avenue, Room 551
New York, NY 10010
newyorklife.com
newyorklifeinvestments.com
NYLIFE Distributors LLC, 30 Hudson Street, Jersey City, NJ 07302
New York Life Investment Management LLC is the investment manager to the MainStay VP Funds Trust
©2024 by NYLIFE Distributors LLC. All rights reserved.
You may obtain copies of the Prospectus and the Statement of Additional Information free of charge, upon request, by calling toll-free 800-598-2019 or writing to New York Life Insurance and Annuity Corporation, 51 Madison Avenue, New York, NY 10010.
| Not FDIC Insured | No Bank Guarantee | May Lose Value |
(NYLIAC) NI524
MainStay VP Floating Rate Portfolio
Message from the President and Annual Report
December 31, 2023
Special Notice:
Beginning in July 2024, new regulations issued by the Securities and Exchange Commission (SEC) will take effect requiring open-end mutual fund companies and ETFs to (1) overhaul the content of their shareholder reports and (2) mail paper copies of the new tailored shareholder reports to shareholders who have not opted to receive these documents electronically.
If you have not yet elected to receive your shareholder reports electronically, please contact your financial intermediary or visit our website.
| Not FDIC/NCUA Insured | Not a Deposit | May Lose Value | No Bank Guarantee | Not Insured by Any Government Agency |
This page intentionally left blank
Message from the President
Against a backdrop of easing inflationary pressures and continued economic growth, stocks and bonds generally gained ground during the 12-month period ended December 31, 2023, despite high levels of volatility and sharp disparities between the performance of the different market sectors.
Although the war in Ukraine, the outbreak of hostilities in the Middle East and several other notable events affected financial assets, inflation, interest rate, and economic growth trends stood at the forefront of market developments during most of the period. As the reporting period began, high levels of inflation already showed signs of easing in the face of aggressive rate hikes by U.S. Federal Reserve (the “Fed”). From a peak of 9.1% in June 2022, the annualized U.S. inflation rate dropped to 6.4% in January, and 3.4% in December 2023. At the same time, the Fed increased the benchmark federal funds rate from 4.25%–4.50% at the beginning of reporting period, to 5.25%–5.50% as of the end of 2023. Despite the increasing cost of capital and tighter lending environment that resulted from rising rates, economic growth remained surprisingly robust, bolstered by high levels of consumer spending, low levels of unemployment and better-than-expected corporate earnings. With the pace of rate increases slowing from the prior year, investors began hoping for an early shift to a looser monetary policy, with stock prices and bond yields reacting as economic data and statements from the Fed either reinforced or undercut those hopes. Following months of hawkish rhetoric, the Fed finally reversed its stance in December 2023, signaling a positive economic outlook with little chance of a recession and a likelihood of rate cuts in 2024.
The S&P 500® Index, a widely regarded benchmark of U.S. market performance, produced strong gains during the reporting period-– recovering all its losses from 2022 and approached new record territory. A preponderance of the Index’s gains were generated by a relatively small number of mega-cap stocks in the information technology, communication services and consumer discretionary sectors that stood to benefit from rapid developments in generative artificial intelligence (“AI”). Value-oriented, interest-rate sensitive and small-capitalization
shares lagged by significant margins, although market strength widened during the closing weeks of the reporting period. Most overseas equity markets trailed the U.S. market, as developed international economies experienced relatively low growth rates, and weak economic conditions in China undermined emerging markets.
Bonds produced generally positive returns, bolstered by attractive and relatively stable yields. The yield on the 10-year Treasury note hit a high of just under 5% in mid-October 2023, ranging between approximately 3.5% and 4.8% for most of the reporting period. The yield curve remained inverted throughout the year, with the 2-year Treasury yield modestly above the 10-year yield. Corporate bond prices trended moderately higher, generally outperforming government securities. After years of low yields and tight credit spreads, the corporate sector benefited from more attractive valuations and income opportunities. Among corporates, markets generally rewarded longer duration and lower credit quality, although an uptick in default rates posed added risks for high-yield corporate bonds. International bond markets produced mixed returns, with emerging-markets issues advancing over their developed-markets counterparts.
The market volatility of recent years reminds us of the constant need for experienced and steadfast portfolio management in the face of uncertainty. New York Life Investments remains dedicated to providing you, as a valued MainStay VP investor, with the guidance, resources and investment solutions you need to pursue your financial goals.
Thank you for trusting us to help meet your investment needs.
Sincerely,
Kirk C. Lehneis
President
The opinions expressed are as of the date of this report and are subject to change. There is no guarantee that any forecast made will come to pass. This material does not constitute investment advice and is not intended as an endorsement of any specific investment. Past performance is no guarantee of future results.
Not part of the Annual Report
Investors should refer to the Portfolio’s Summary Prospectus and/or Prospectus and consider the Portfolio’s investment objectives, strategies, risks, charges and expenses carefully before investing. The Summary Prospectus and/or Prospectus contain this and other information about the Portfolio. You may obtain copies of the Portfolio’s Summary Prospectus, Prospectus and Statement of Additional Information, which includes information about the MainStay VP Funds Trust's Trustees, free of charge, upon request, by calling toll-free 800-598-2019, by writing to New York Life Insurance and Annuity Corporation, 51 Madison Avenue, Room 251, New York, New York 10010 or by sending an email to MainStayShareholdersServices@nylim.com. These documents are also available at newyorklifeinvestments.com/investment-products/vp. Please read the Portfolio's Summary Prospectus and/or Prospectus carefully before investing. MainStay VP Funds Trust portfolios are separate account options which are purchased through a variable insurance or variable annuity contract.
Investment and Performance Comparison (Unaudited)
Performance data quoted represents past performance. Past performance is no guarantee of future results. Because of market volatility and other factors, current performance may be lower or higher than the figures shown. Investment return and principal value will fluctuate, and as a result, when shares are redeemed, they may be worth more or less than their original cost. The performance table and graph do not reflect any deduction of sales charges, mortality and expense charges, contract charges or administrative charges. Please refer to the Performance Summary appropriate for your policy. For performance information current to the most recent month-end, please call 800-598-2019 or visit www.newyorklife.com.
Performance figures may reflect certain fee waivers and/or expense limitations, without which total returns may have been different. For information on current fee waivers and/or expense limitations (if any), please refer to the Notes to Financial Statements.
| Average Annual Total Returns for the Year-Ended December 31, 2023 |
| Class | Inception
Date | One
Year | Five
Years | Ten
Years | Gross
Expense
Ratio1 |
| Initial Class Shares | 5/2/2005 | 11.86% | 4.96% | 3.81% | 0.64% |
| Service Class Shares | 5/2/2005 | 11.58 | 4.69 | 3.54 | 0.89 |
| 1. | The gross expense ratios presented reflect the Portfolio’s “Total Annual Portfolio Operating Expenses” from the most recent Prospectus and may differ from other expense ratios disclosed in this report. |
| Benchmark Performance* | One
Year | Five
Years | Ten
Years |
| Morningstar LSTA US Leveraged Loan Index1 | 13.32% | 5.80% | 4.42% |
| Morningstar Bank Loan Category Average2 | 12.19 | 4.42 | 3.35 |
| * | Returns for indices reflect no deductions for fees, expenses or taxes, except for foreign withholding taxes where applicable. Results assume reinvestment of all dividends and capital gains. An investment cannot be made directly in an index. |
| 1. | The Morningstar LSTA US Leveraged Loan Index is the Portfolio's benchmark. The Morningstar LSTA US Leveraged Loan Index is a broad-based index designed to reflect the performance of U.S. dollar facilities in the leveraged loan market. |
| 2. | The Morningstar Bank Loan Category Average is representative of funds that invest in floating-rate bank loans instead of bonds. In exchange for their credit risk, these loans offer high interest payments that typically float above a common short-term benchmark. Results are based on average total returns of similar funds with all dividends and capital gain distributions reinvested. |
Cost in Dollars of a $1,000 Investment in MainStay VP Floating Rate Portfolio (Unaudited)
The example below is intended to describe the fees and expenses borne by shareholders during the six-month period from July 1, 2023 to December 31, 2023, and the impact of those costs on your investment.
Example
As a shareholder of the Portfolio you incur two types of costs: (1) transaction costs, including exchange fees and sales charges (loads) on purchases (as applicable), and (2) ongoing costs, including management fees, distribution and/or service (12b-1) fees and other Portfolio expenses (as applicable). This example is intended to help you understand your ongoing costs (in dollars) of investing in the Portfolio and to compare these costs with the ongoing costs of investing in other mutual funds. The example is based on an investment of $1,000 made at the beginning of the six-month period and held for the entire period from July 1, 2023 to December 31, 2023. Shares are only sold in connection with variable life and annuity contracts and the example does not reflect any contract level or transactional fees or expenses. If these costs had been included, your costs would have been higher.
This example illustrates your Portfolio’s ongoing costs in two ways:
Actual Expenses
The second and third data columns in the table below provide information about actual account values and actual expenses. You may use the information in these columns, together with the amount you invested, to estimate the expenses that you paid during the six months ended
December 31, 2023. Simply divide your account value by $1,000 (for example, an $8,600 account value divided by $1,000 = 8.6), then multiply the result by the number under the heading entitled “Expenses Paid During Period” to estimate the expenses you paid on your account during this period.
Hypothetical Example for Comparison Purposes
The fourth and fifth data columns in the table below provide information about hypothetical account values and hypothetical expenses based on the Portfolio’s actual expense ratio and an assumed rate of return of 5% per year before expenses, which is not the Portfolio’s actual return. The hypothetical account values and expenses may not be used to estimate the actual ending account balances or expenses you paid for the six-month period shown. You may use this information to compare the ongoing costs of investing in the Portfolio with the ongoing costs of investing in other mutual funds. To do so, compare this 5% hypothetical example with the 5% hypothetical examples that appear in the shareholder reports of the other mutual funds.
Please note that the expenses shown in the table are meant to highlight your ongoing costs only and do not reflect any transactional costs, such as exchange fees or sales charges (loads). Therefore, the fourth and fifth data columns of the table are useful in comparing ongoing costs only and will not help you determine the relative total costs of owning different funds. In addition, if these transactional costs were included, your costs would have been higher.
| Share Class | Beginning
Account
Value
7/1/23 | Ending Account
Value (Based
on Actual
Returns and
Expenses)
12/31/23 | Expenses
Paid
During
Period1 | Ending Account
Value (Based
on Hypothetical
5% Annualized
Return and
Actual Expenses)
12/31/23 | Expenses
Paid
During
Period1 | Net Expense
Ratio
During
Period2 |
| Initial Class Shares | $1,000.00 | $1,057.10 | $3.32 | $1,021.98 | $3.26 | 0.64% |
| Service Class Shares | $1,000.00 | $1,055.80 | $4.61 | $1,020.72 | $4.53 | 0.89% |
| 1. | Expenses are equal to the Portfolio’s annualized expense ratio of each class multiplied by the average account value over the period, divided by 365 and multiplied by 184 (to reflect the six-month period). The table above represents the actual expenses incurred during the six-month period. In addition to the fees and expenses which the Portfolio bears directly, it also indirectly bears a pro rata share of the fees and expenses of the underlying funds in which it invests. Such indirect expenses are not included in the above-reported expense figures. |
| 2. | Expenses are equal to the Portfolio's annualized expense ratio to reflect the six-month period. |
| 6 | MainStay VP Floating Rate Portfolio |
Industry Composition as of December 31, 2023 (Unaudited)
| Finance | 6.2% |
| Electronics | 5.8 |
| Chemicals, Plastics & Rubber | 5.4 |
| Services: Business | 4.9 |
| Healthcare, Education & Childcare | 4.2 |
| Insurance | 4.1 |
| Software | 3.7 |
| Hotels, Motels, Inns & Gaming | 3.6 |
| Aerospace & Defense | 3.5 |
| Telecommunications | 3.0 |
| Containers, Packaging & Glass | 3.0 |
| Manufacturing | 3.0 |
| High Tech Industries | 2.7 |
| Diversified/Conglomerate Manufacturing | 2.2 |
| Media | 2.1 |
| Other Asset-Backed Securities | 2.1 |
| Buildings & Real Estate | 2.0 |
| Oil & Gas | 1.8 |
| Diversified/Conglomerate Service | 1.8 |
| Utilities | 1.8 |
| Automobile | 1.6 |
| Entertainment | 1.6 |
| Healthcare | 1.6 |
| Broadcasting & Entertainment | 1.5 |
| Personal & Nondurable Consumer Products | 1.5 |
| Beverage, Food & Tobacco | 1.4 |
| Mining, Steel, Iron & Non-Precious Metals | 1.4 |
| Personal, Food & Miscellaneous Services | 1.4 |
| Leisure, Amusement, Motion Pictures & Entertainment | 1.3 |
| Healthcare & Pharmaceuticals | 0.9 |
| Commercial Services | 0.8 |
| Retail Store | 0.7 |
| Retail | 0.7 |
| Chemicals | 0.6 |
| Personal & Nondurable Consumer Products (Manufacturing Only) | 0.6 |
| Banking | 0.6 |
| Energy (Electricity) | 0.5 |
| Auto Manufacturers | 0.5 |
| Machinery (Non-Agriculture, Non-Construct & Non-Electronic) | 0.4 |
| Capital Equipment | 0.4 |
| Packaging & Containers | 0.4 |
| Real Estate | 0.3 |
| Printing & Publishing | 0.3% |
| Cargo Transport | 0.3 |
| Water | 0.3 |
| Packaging | 0.3 |
| Hotel, Gaming & Leisure | 0.3 |
| Diversified Financial Services | 0.3 |
| Affiliated Investment Company | 0.2 |
| Pharmaceuticals | 0.2 |
| Consumer Durables | 0.2 |
| Electric | 0.2 |
| Real Estate Investment Trusts | 0.2 |
| Animal Food | 0.1 |
| Services: Consumer | 0.1 |
| Ecological | 0.1 |
| Personal Transportation | 0.1 |
| Healthcare-Services | 0.1 |
| Machinery-Diversified | 0.1 |
| Food | 0.1 |
| Airlines | 0.1 |
| Environmental Control | 0.1 |
| Internet | 0.1 |
| Engineering & Construction | 0.1 |
| Technology Hardware, Storage & Peripherals | 0.1 |
| Lodging | 0.0‡ |
| Iron & Steel | 0.0‡ |
| Distribution & Wholesale | 0.0‡ |
| Oil & Gas Services | 0.0‡ |
| Healthcare-Products | 0.0‡ |
| Health Care Providers & Services | 0.0‡ |
| Communications Equipment | 0.0‡ |
| Machinery | 0.0‡ |
| Specialty Retail | 0.0‡ |
| Health Care Equipment & Supplies | 0.0‡ |
| Independent Power and Renewable Electricity Producers | 0.0‡ |
| Automobile Components | 0.0‡ |
| Household Durables | 0.0‡ |
| Financial Services | 0.0‡ |
| Capital Markets | 0.0‡ |
| Short-Term Investments | 8.0 |
| Other Assets, Less Liabilities | 0.4 |
| | 100.0% |
| ‡ | Less than one-tenth of a percent. |
See Portfolio of Investments beginning on page 11 for specific holdings within these categories. The Portfolio's holdings are subject to change.
Top Ten Holdings and/or Issuers Held as of December 31, 2023 (excluding short-term investments) (Unaudited)
| 1. | EMRLD Borrower LP, 8.356%, due 5/31/30 |
| 2. | UKG, Inc., 8.764%-10.764%, due 5/4/26–5/3/27 |
| 3. | Asurion LLC, 8.72%-10.72%, due 12/23/26–1/20/29 |
| 4. | AmWINS Group, Inc., TBD - 7.72%, due 2/19/28 |
| 5. | GTCR W. Merger Sub LLC, TBD, due 9/20/30 |
| 6. | Univision Communications, Inc., 6.625%-9.598%, due 6/1/27–6/24/29 |
| 7. | Gates Global LLC, 7.956%-8.356%, due 3/31/27–11/16/29 |
| 8. | TransDigm, Inc., 7.125%-8.598%, due 8/24/28–12/1/31 |
| 9. | Chariot Buyer LLC, 8.706%, due 11/3/28 |
| 10. | Nouryon Finance BV, 9.441%-9.467%, due 4/3/28 |
| 8 | MainStay VP Floating Rate Portfolio |
Portfolio Management Discussion and Analysis (Unaudited)
Answers to the questions reflect the views of portfolio managers Mark A. Campellone and Arthur S. Torrey of NYL Investors LLC, the Portfolio’s Subadvisor.
How did MainStay VP Floating Rate Portfolio perform relative to its benchmark and peers during the 12 months ended December 31, 2023?
For the 12 months ended December 31, 2023, MainStay VP Floating Rate Portfolio returned 11.86% for Initial Class shares and 11.58% for Service Class shares. Over the same period, both share classes underperformed the 13.32% return of the Morningstar LSTA US Leveraged Loan Index (“the Index”), which is the Portfolio’s benchmark. For the 12 months ended December 31, 2023, both share classes underperformed the 12.19% return of the Morningstar Bank Loan Category Average.1
During the reporting period, were there any market events that materially impacted the Portfolio’s performance or liquidity?
The wider market in risk assets during the reporting period was impacted by volatility from concerns regarding inflation, changes in interest rate expectations and potential economic slowdown in the United States. The U.S. banking crisis, together with geopolitical risks in central Europe and the Middle East also played a role. The market for floating-rate loans was insulated from—but not immune to—these broader performance trends. Despite these challenges, the floating-rate segment reported positive returns for the reporting period.
What factors affected the Portfolio’s performance relative to its primary prospectus benchmark during the reporting period?
The Portfolio has historically been focused on maintaining a larger position in higher-rated credit loans rated BB, and a smaller position in lower-credit-quality loans rated CCC and below.2 For the 12 months ended December 31, 2023, CCC outperformed BB. The Portfolio’s overweight exposure to higher-rated credit loans was a headwind to performance compared to the Index.
What was the Portfolio’s duration3 strategy during the reporting period?
Floating-rate loans are, by their nature, a low-duration asset. Loans earn a stated spread4 over a floating reference rate, which is tied to the London InterBank Offered Rate (“LIBOR”)5 or the Secured Overnight Financing Rate (“SOFR”).6 Issuers can generally borrow under a 30- to 90-day range with LIBOR or SOFR. The weighted-average time to interest rate reset on the Portfolio’s assets was generally less than 40 days during the reporting period.
What specific factors, risks or market forces prompted significant decisions for the Portfolio during the reporting period?
Expectations around lower-rated credit performance led to the Portfolio increasing its exposure in BBB7 and higher rated credit positions. The Portfolio realized a very modest decrease in its overweight position in BB-rated credits. We decreased relative B-rated8 credit exposure, positioning the Portfolio with more underweight exposure.
During the reporting period, which market segments were the strongest positive contributors to the Portfolio’s absolute performance and which market segments were particularly weak?
The strongest contributions to the Portfolio’s absolute performance were from underweight exposure in the software industry and overweight exposure in the hotels, restaurants & leisure industry. (Contributions take weightings and total returns into account). Of industries where the Portfolio had exposure, underweight positions in technology hardware, storage & peripherals, biotechnology, and household products were the weakest contributors to absolute performance.
| 1. | See "Investment and Performance Comparison" for more information on benchmark and peer group returns. |
| 2. | An obligation rated ‘BB’ by Standard & Poor’s (“S&P”) is deemed by S&P to be less vulnerable to nonpayment than other speculative issues. In the opinion of S&P, however, the obligor faces major ongoing uncertainties or exposure to adverse business, financial or economic conditions which could lead to the obligor’s inadequate capacity to meet its financial commitment on the obligation. An obligation rated ‘CCC’ by S&P is deemed by S&P to be currently vulnerable to nonpayment and is dependent upon favorable business, financial and economic conditions for the obligor to meet its financial commitment on the obligation. It is the opinion of S&P that in the event of adverse business, financial or economic conditions, the obligor is not likely to have the capacity to meet its financial commitment on the obligation. When applied to Portfolio holdings, ratings are based solely on the creditworthiness of the bonds in the Portfolio and are not meant to represent the security or safety of the Portfolio. |
| 3. | Duration is a measure of the price sensitivity of a fixed-income investment to changes in interest rates. Duration is expressed as a number of years and is considered a more accurate sensitivity gauge than average maturity. |
| 4. | The terms “spread” and “yield spread” may refer to the difference in yield between a security or type of security and comparable U.S. Treasury issues. The terms may also refer to the difference in yield between two specific securities or types of securities at a given time. |
| 5. | LIBOR is a composite of interest rates at which banks borrow from one another in the London market. |
| 6. | SOFR is a secured, interbank overnight interest rate established as an alternative to LIBOR. |
| 7. | An obligation rated ‘BBB’ by S&P is deemed by S&P to exhibit adequate protection parameters. In the opinion of S&P, however, adverse economic conditions or changing circumstances are more likely to lead to a weakened capacity of the obligor to meet its financial commitment on the obligation. When applied to Portfolio holdings, ratings are based solely on the creditworthiness of the bonds in the Portfolio and are not meant to represent the security or safety of the Portfolio. |
| 8. | An obligation rated ‘B’ by S&P is deemed by S&P to be more vulnerable to nonpayment than obligations rated ‘BB’, but in the opinion of S&P, the obligor currently has the capacity to meet its financial commitment on the obligation. It is the opinion of S&P that adverse business, financial, or economic conditions will likely impair the obligor's capacity or willingness to meet its financial commitment on the obligation. When applied to Portfolio holdings, ratings are based solely on the creditworthiness of the bonds in the Portfolio and are not meant to represent the security or safety of the Portfolio. |
Did the Portfolio make any significant purchases or sales during the reporting period?
Some of the Portfolio’s largest purchases during the reporting period included loans issued by Power Solutions and Copeland, reflecting our favorable view of the relative value, business prospects and management teams of these issuers. Some of the largest sales during the same period were partial positions in loans issued by Power Solutions and Nestle Skin Health, based on relative value and liquidity.
How did the Portfolio’s sector weightings change during the reporting period?
During the reporting period, the Portfolio’s largest weighting increases were in the N/A SNP (no S&P industry classification available), construction materials and chemicals industries. Conversely, the Portfolio’s largest weighting reductions were in the media, specialty retail and electric utilities industries.
How was the Portfolio positioned at the end of the reporting period?
As of December 31, 2023, we remain cautiously optimistic about the performance of the floating-rate market. We have maintained the Portfolio’s largest overweight sector positions in N/A SNP, containers & packaging, construction materials, and hotels, restaurants & leisure, as we expect these sectors to continue to outperform in the current environment. The Portfolio also maintains its most significantly underweight sector positions in software, capital markets, and specialty retail. We continue to look for opportunities to add exposure in these underweight sectors, subject to our underwriting criteria.
From a ratings perspective, the Portfolio very modestly decreased its overweight position in credit rated BB, while also decreasing exposure to credit rated B. Going forward, we may consider increasing B credit rated exposure to a less underweight position.
As of the end of the reporting period, we are looking to maintain lower cash balances, with additional purchases subject to market conditions and flows into or out of the Portfolio.
The opinions expressed are those of the portfolio managers as of the date of this report and are subject to change. There is no guarantee that any forecasts will come to pass. This material does not constitute investment advice and is not intended as an endorsement of any specific investment.
Not all MainStay VP Portfolios and/or share classes are available under all policies.
| 10 | MainStay VP Floating Rate Portfolio |
Portfolio of Investments December 31, 2023†^
| | Principal
Amount | Value |
| Long-Term Bonds 91.3% |
| Asset-Backed Securities 2.1% |
| Other Asset-Backed Securities 2.1% |
| AIMCO CLO 20 Ltd. (a)(b) | |
| Series 2023-20A, Class B1 | | |
| 7.565% (3 Month SOFR + 2.20%), due 10/16/36 | $ 1,000,000 | $ 998,596 |
| Series 2023-20A, Class D | | |
| 9.365% (3 Month SOFR + 4.00%), due 10/16/36 | 848,215 | 846,895 |
| Ballyrock CLO 21 Ltd. (a)(b) | |
| Series 2022-21A, Class A2A | | |
| 8.216% (3 Month SOFR + 2.80%), due 10/20/35 | 900,000 | 904,719 |
| Series 2022-21A, Class C | | |
| 10.736% (3 Month SOFR + 5.32%), due 10/20/35 | 1,000,000 | 1,011,051 |
| Danby Park CLO Ltd. (a)(b) | |
| Series 2022-1A, Class B | | |
| 8.362% (3 Month SOFR + 2.95%), due 10/21/35 | 1,000,000 | 1,006,278 |
| Series 2022-1A, Class D | | |
| 10.742% (3 Month SOFR + 5.33%), due 10/21/35 | 1,000,000 | 1,012,089 |
| Empower CLO Ltd. (a)(b) | |
| Series 2023-2A, Class B | | |
| 8.09% (3 Month SOFR + 2.75%), due 7/15/36 | 1,250,000 | 1,257,323 |
| Series 2023-2A, Class D | | |
| 10.74% (3 Month SOFR + 5.40%), due 7/15/36 | 1,250,000 | 1,247,581 |
| Galaxy 32 CLO Ltd. (a)(b) | |
| Series 2023-32A, Class B | | |
| 7.674% (3 Month SOFR + 2.30%), due 10/20/36 | 1,000,000 | 995,517 |
| Series 2023-32A, Class D | | |
| 9.674% (3 Month SOFR + 4.30%), due 10/20/36 | 1,000,000 | 971,950 |
| Neuberger Berman Loan Advisers CLO 51 Ltd. (a)(b) | |
| Series 2022-51A, Class B | | |
| 8.462% (3 Month SOFR + 3.05%), due 10/23/35 | 750,000 | 754,087 |
| Series 2022-51A, Class D | | |
| 11.112% (3 Month SOFR + 5.70%), due 10/23/35 | 750,000 | 757,598 |
| OHA Credit Funding 16 Ltd. (a)(b) | |
| Series 2023-16A, Class B | | |
| 7.606% (3 Month SOFR + 2.25%), due 10/20/36 | 1,000,000 | 999,889 |
| Series 2023-16A, Class D | | |
| 9.356% (3 Month SOFR + 4.00%), due 10/20/36 | 1,000,000 | 995,279 |
| | Principal
Amount | Value |
| |
| Other Asset-Backed Securities (continued) |
| Palmer Square CLO Ltd. | |
| Series 2021-4A, Class D | | |
| 8.605% (3 Month SOFR + 3.212%), due 10/15/34 (a)(b) | $ 1,575,000 | $ 1,565,923 |
| Sixth Street CLO XXI Ltd. (a)(b) | |
| Series 2022-21A, Class B | | |
| 8.394% (3 Month SOFR + 3.00%), due 10/15/35 | 1,500,000 | 1,509,244 |
| Series 2022-21A, Class D | | |
| 10.494% (3 Month SOFR + 5.10%), due 10/15/35 | 1,071,000 | 1,082,229 |
Total Asset-Backed Securities
(Cost $17,783,684) | | 17,916,248 |
| Corporate Bonds 4.7% |
| Aerospace & Defense 0.1% |
| Howmet Aerospace, Inc. | | |
| 6.875%, due 5/1/25 | 200,000 | 202,593 |
| Spirit AeroSystems, Inc. | | |
| 9.375%, due 11/30/29 (a) | 250,000 | 273,569 |
| TransDigm, Inc. | | |
| 7.125%, due 12/1/31 (a) | 500,000 | 523,957 |
| | | 1,000,119 |
| Airlines 0.1% |
| United Airlines, Inc. (a) | | |
| 4.375%, due 4/15/26 | 200,000 | 194,881 |
| 4.625%, due 4/15/29 | 600,000 | 561,141 |
| | | 756,022 |
| Auto Manufacturers 0.5% |
| Ford Motor Co. | | |
| 6.10%, due 8/19/32 | 2,100,000 | 2,116,865 |
| Ford Motor Credit Co. LLC | | |
| 7.35%, due 11/4/27 | 2,000,000 | 2,109,098 |
| | | 4,225,963 |
| Chemicals 0.4% |
| ASP Unifrax Holdings, Inc. | | |
| 5.25%, due 9/30/28 (a) | 330,000 | 238,294 |
| INEOS Quattro Finance 2 plc | | |
| 9.625%, due 3/15/29 (a) | 1,000,000 | 1,064,461 |
| Olympus Water US Holding Corp. | | |
| 9.75%, due 11/15/28 (a) | 1,500,000 | 1,592,090 |
| SCIL IV LLC | | |
| 5.375%, due 11/1/26 (a) | 350,000 | 335,976 |
| WR Grace Holdings LLC | | |
| 5.625%, due 8/15/29 (a) | 300,000 | 263,987 |
| | | 3,494,808 |
| Commercial Services 0.5% |
| Avis Budget Car Rental LLC | | |
| 8.00%, due 2/15/31 (a) | 1,500,000 | 1,497,937 |
The notes to the financial statements are an integral part of, and should be read in conjunction with, the financial statements.
11
Portfolio of Investments December 31, 2023†^ (continued)
| | Principal
Amount | Value |
| Corporate Bonds (continued) |
| Commercial Services (continued) |
| Herc Holdings, Inc. | | |
| 5.50%, due 7/15/27 (a) | $ 850,000 | $ 839,219 |
| Prime Security Services Borrower LLC | | |
| 6.25%, due 1/15/28 (a) | 1,000,000 | 994,169 |
| Sotheby's/Bidfair Holdings, Inc. | | |
| 5.875%, due 6/1/29 (a) | 900,000 | 778,374 |
| | | 4,109,699 |
| Distribution & Wholesale 0.0% ‡ |
| OPENLANE, Inc. | | |
| 5.125%, due 6/1/25 (a) | 350,000 | 343,875 |
| Diversified Financial Services 0.3% |
| GGAM Finance Ltd. (a) | | |
| 7.75%, due 5/15/26 | 1,125,000 | 1,141,873 |
| 8.00%, due 2/15/27 | 750,000 | 768,780 |
| NFP Corp. | | |
| 8.50%, due 10/1/31 (a) | 670,000 | 726,213 |
| | | 2,636,866 |
| Electric 0.2% |
| Vistra Operations Co. LLC | | |
| 5.00%, due 7/31/27 (a) | 1,500,000 | 1,460,402 |
| Engineering & Construction 0.1% |
| Brand Industrial Services, Inc. | | |
| 10.375%, due 8/1/30 (a) | 1,000,000 | 1,057,530 |
| Entertainment 0.3% |
| Caesars Entertainment, Inc. | | |
| 7.00%, due 2/15/30 (a) | 1,410,000 | 1,445,866 |
| Light & Wonder International, Inc. | | |
| 7.00%, due 5/15/28 (a) | 900,000 | 909,159 |
| | | 2,355,025 |
| Environmental Control 0.1% |
| GFL Environmental, Inc. | | |
| 4.75%, due 6/15/29 (a) | 1,000,000 | 941,960 |
| Food 0.1% |
| Post Holdings, Inc. | | |
| 5.50%, due 12/15/29 (a) | 240,000 | 231,256 |
| US Foods, Inc. | | |
| 7.25%, due 1/15/32 (a) | 250,000 | 260,678 |
| | | 491,934 |
| Healthcare-Products 0.0% ‡ |
| Medline Borrower LP | | |
| 5.25%, due 10/1/29 (a) | 200,000 | 188,515 |
| | Principal
Amount | Value |
| |
| Healthcare-Services 0.1% |
| Acadia Healthcare Co., Inc. | | |
| 5.00%, due 4/15/29 (a) | $ 120,000 | $ 115,200 |
| Fortrea Holdings, Inc. | | |
| 7.50%, due 7/1/30 (a) | 360,000 | 369,710 |
| | | 484,910 |
| Internet 0.1% |
| Gen Digital, Inc. | | |
| 6.75%, due 9/30/27 (a) | 560,000 | 569,704 |
| Iron & Steel 0.0% ‡ |
| Carpenter Technology Corp. | | |
| 6.375%, due 7/15/28 | 310,000 | 308,837 |
| Lodging 0.0% ‡ |
| Boyd Gaming Corp. | | |
| 4.75%, due 12/1/27 | 400,000 | 384,840 |
| Machinery-Diversified 0.1% |
| GrafTech Finance, Inc. | | |
| 4.625%, due 12/15/28 (a) | 220,000 | 145,840 |
| GrafTech Global Enterprises, Inc. | | |
| 9.875%, due 12/15/28 (a) | 900,000 | 694,125 |
| | | 839,965 |
| Media 0.3% |
| Radiate Holdco LLC | | |
| 4.50%, due 9/15/26 (a) | 370,000 | 282,200 |
| Univision Communications, Inc. (a) | | |
| 6.625%, due 6/1/27 | 600,000 | 598,364 |
| 8.00%, due 8/15/28 | 1,600,000 | 1,650,592 |
| | | 2,531,156 |
| Oil & Gas 0.1% |
| Civitas Resources, Inc. | | |
| 8.625%, due 11/1/30 (a) | 1,130,000 | 1,198,616 |
| Oil & Gas Services 0.0% ‡ |
| USA Compression Partners LP | | |
| 6.875%, due 4/1/26 | 360,000 | 358,482 |
| Packaging & Containers 0.4% |
| Ardagh Metal Packaging Finance USA LLC | | |
| 4.00%, due 9/1/29 (a) | 400,000 | 338,591 |
| Ardagh Packaging Finance plc | | |
| 5.25%, due 4/30/25 (a) | 1,000,000 | 972,522 |
| Clydesdale Acquisition Holdings, Inc. | | |
| 8.75%, due 4/15/30 (a) | 100,000 | 93,237 |
| Mauser Packaging Solutions Holding Co. | | |
| 7.875%, due 8/15/26 (a) | 1,500,000 | 1,526,521 |
The notes to the financial statements are an integral part of, and should be read in conjunction with, the financial statements.
| 12 | MainStay VP Floating Rate Portfolio |
| | Principal
Amount | Value |
| Corporate Bonds (continued) |
| Packaging & Containers (continued) |
| Trident TPI Holdings, Inc. | | |
| 12.75%, due 12/31/28 (a) | $ 790,000 | $ 845,300 |
| | | 3,776,171 |
| Pharmaceuticals 0.1% |
| Bausch Health Cos., Inc. | | |
| 5.50%, due 11/1/25 (a) | 300,000 | 274,431 |
| Organon & Co. | | |
| 5.125%, due 4/30/31 (a) | 600,000 | 512,907 |
| | | 787,338 |
| Real Estate 0.1% |
| Realogy Group LLC | | |
| 5.75%, due 1/15/29 (a) | 1,330,000 | 1,033,628 |
| Real Estate Investment Trusts 0.2% |
| Iron Mountain, Inc. | | |
| 5.00%, due 7/15/28 (a) | 350,000 | 336,276 |
| RHP Hotel Properties LP | | |
| 4.75%, due 10/15/27 | 300,000 | 289,766 |
| 7.25%, due 7/15/28 (a) | 900,000 | 935,718 |
| | | 1,561,760 |
| Retail 0.3% |
| 1011778 BC ULC | | |
| 4.00%, due 10/15/30 (a) | 1,040,000 | 932,775 |
| IRB Holding Corp. | | |
| 7.00%, due 6/15/25 (a) | 580,000 | 580,000 |
| LBM Acquisition LLC | | |
| 6.25%, due 1/15/29 (a) | 1,000,000 | 892,950 |
| | | 2,405,725 |
| Software 0.1% |
| Clarivate Science Holdings Corp. (a) | | |
| 3.875%, due 7/1/28 | 300,000 | 282,868 |
| 4.875%, due 7/1/29 | 300,000 | 281,500 |
| | | 564,368 |
| Telecommunications 0.1% |
| Frontier Communications Holdings LLC | | |
| 5.875%, due 10/15/27 (a) | 280,000 | 270,508 |
| Level 3 Financing, Inc. | | |
| 10.50%, due 5/15/30 (a) | 368,000 | 356,844 |
| Telesat Canada | | |
| 4.875%, due 6/1/27 (a) | 600,000 | 354,584 |
| | | 981,936 |
Total Corporate Bonds
(Cost $41,934,834) | | 40,850,154 |
| | Principal
Amount | Value |
| Loan Assignments 84.5% |
| Aerospace & Defense 3.4% |
| Amentum Government Services Holdings LLC (b) | |
| First Lien Tranche Term Loan 3 | |
| 9.358% (1 Month SOFR + 4.00%), due 2/15/29 | $ 2,790,833 | $ 2,787,345 |
| First Lien Tranche Term Loan 1 | |
| 9.47% (1 Month SOFR + 4.00%), due 1/29/27 | 1,089,271 | 1,088,249 |
| Arcline FM Holdings LLC | |
| First Lien Initial Term Loan | |
| 10.36% (3 Month SOFR + 4.75%), due 6/23/28 (b) | 2,862,679 | 2,857,311 |
| Asplundh Tree Expert LLC | |
| Amendment No. 1 Term Loan | |
| 7.206% (1 Month SOFR + 1.75%), due 9/7/27 (b) | 2,584,437 | 2,585,332 |
| Barnes Group, Inc. | |
| Initial Term Loan | |
| 8.456% (1 Month SOFR + 3.00%), due 9/3/30 (b) | 798,000 | 799,330 |
| Cobham Ultra SeniorCo. SARL | |
| USD Facility Term Loan B | |
| 9.363% (6 Month SOFR + 3.50%), due 8/3/29 (b) | 987,562 | 972,255 |
| Dynasty Acquisition Co., Inc. (b) | |
| 2023 Specified Refinancing Term Loan B1 | |
| 9.356% (1 Month SOFR + 4.00%), due 8/24/28 | 2,642,791 | 2,647,878 |
| 2023 Specified Refinancing Term Loan B2 | |
| 9.356% (1 Month SOFR + 4.00%), due 8/24/28 | 1,132,625 | 1,134,805 |
| Russell Investments U.S. Institutional Holdco, Inc. | |
| 2025 Term Loan | |
| 8.956% (1 Month SOFR + 3.50%), due 5/30/25 (b) | 4,263,344 | 3,978,233 |
| SkyMiles IP Ltd. | |
| Initial Term Loan | |
| 9.166% (3 Month SOFR + 3.75%), due 10/20/27 (b) | 2,148,571 | 2,198,405 |
| TransDigm, Inc. | |
| Tranche Term Loan I | |
| 8.598% (3 Month SOFR + 3.25%), due 8/24/28 (b) | 4,188,374 | 4,204,516 |
| United AirLines, Inc. | |
| Term Loan B | |
| 9.22% (1 Month SOFR + 3.75%), due 4/21/28 (b) | 2,167,286 | 2,171,891 |
| WestJet Airlines Ltd. | |
| Term Loan | |
| 8.455% (1 Month SOFR + 3.00%), due 12/11/26 (b) | 1,940,229 | 1,934,468 |
| | | 29,360,018 |
The notes to the financial statements are an integral part of, and should be read in conjunction with, the financial statements.
13
Portfolio of Investments December 31, 2023†^ (continued)
| | Principal
Amount | Value |
| Loan Assignments (continued) |
| Animal Food 0.1% |
| Alltech, Inc. | |
| Term Loan B | |
| 9.47% (1 Month SOFR + 4.00%), due 10/13/28 (b) | $ 522,667 | $ 514,827 |
| Automobile 1.6% |
| American Auto Auction Group LLC | |
| First Lien Tranche Term Loan B | |
| 10.498% (3 Month SOFR + 5.00%), due 12/30/27 (b) | 1,470,000 | 1,441,824 |
| Autokiniton U.S. Holdings, Inc. | |
| Closing Date Term Loan B | |
| 9.97% (1 Month SOFR + 4.50%), due 4/6/28 (b) | 1,991,134 | 1,997,356 |
| Belron Finance 2019 LLC | |
| Dollar Second Incremental Term Loan | |
| 7.902% (3 Month SOFR + 2.25%), due 10/30/26 (b) | 1,200,000 | 1,200,750 |
| Belron Finance U.S. LLC (b) | |
| First Incremental Term Loan | |
| 7.883% (3 Month SOFR + 2.25%), due 11/13/25 | 950,000 | 950,594 |
| Dollar Fourth Incremental Term Loan | |
| 7.995% (3 Month SOFR + 2.50%), due 4/18/29 | 497,500 | 498,033 |
| Belron Group SA | |
| Dollar Third Incremental Term Loan | |
| 8.067% (3 Month SOFR + 2.425%), due 4/13/28 (b) | 940,894 | 941,364 |
| Clarios Global LP | |
| First Lien 2023 Term Loan | |
| 9.106% (1 Month SOFR + 3.75%), due 5/6/30 (b) | 3,420,000 | 3,422,565 |
| First Brand Group LLC | |
| First Lien 2021 Term Loan | |
| 10.881% (6 Month SOFR + 5.00%), due 3/30/27 (b) | 664,957 | 658,862 |
| Wand Newco 3, Inc. | |
| First Lien Tranche Term Loan B1 | |
| 8.22% (1 Month SOFR + 2.75%), due 2/5/26 (b) | 2,586,288 | 2,589,343 |
| | | 13,700,691 |
| Banking 0.6% |
| Apollo Commercial Real Estate Finance, Inc. | |
| Term Loan B1 | |
| 8.97% (1 Month SOFR + 3.50%), due 3/11/28 (b) | 139,876 | 136,379 |
| Edelman Financial Engines Center LLC (The) | |
| First Lien 2021 Initial Term Loan | |
| 8.97% (1 Month SOFR + 3.50%), due 4/7/28 (b) | 1,620,206 | 1,618,406 |
| | Principal
Amount | Value |
| |
| Banking (continued) |
| Jane Street Group LLC | |
| Dollar Term Loan | |
| 8.22% (1 Month SOFR + 2.75%), due 1/26/28 (b) | $ 3,720,338 | $ 3,735,841 |
| | | 5,490,626 |
| Beverage, Food & Tobacco 1.4% |
| 8th Avenue Food & Provisions, Inc. | |
| First Lien Term Loan | |
| 9.22% (1 Month SOFR + 3.75%), due 10/1/25 (b) | 1,997,160 | 1,913,944 |
| CHG PPC Parent LLC | |
| First Lien 2021-1 U.S. Term Loan | |
| 8.47% (1 Month SOFR + 3.00%), due 12/8/28 (b) | 1,296,771 | 1,296,771 |
| Froneri International Ltd. | |
| First Lien Facility Term Loan B2 | |
| 7.706% (1 Month SOFR + 2.25%), due 1/29/27 (b) | 1,433,025 | 1,433,697 |
| H-Food Holdings LLC | |
| Initial Term Loan | |
| 9.337% (3 Month SOFR + 3.688%), due 5/23/25 (b) | 2,203,940 | 1,767,628 |
| Naked Juice LLC | |
| First Lien Initial Term Loan | |
| 8.698% (3 Month SOFR + 3.25%), due 1/24/29 (b) | 729,446 | 704,485 |
| Pegasus BidCo BV | |
| Initial Dollar Term Loan | |
| 9.63% (3 Month SOFR + 4.25%), due 7/12/29 (b) | 1,584,000 | 1,582,681 |
| Sotheby's | |
| 2021 Second Refinancing Term Loan | |
| 10.155% (3 Month SOFR + 4.50%), due 1/15/27 (b) | 2,239,607 | 2,206,947 |
| United Natural Foods, Inc. | |
| Initial Term Loan | |
| 8.72% (1 Month SOFR + 3.25%), due 10/22/25 (b) | 866,415 | 864,397 |
| | | 11,770,550 |
| Broadcasting & Entertainment 1.5% |
| Altice France SA | |
| USD Term Loan B14 | |
| 10.894% (3 Month SOFR + 5.50%), due 8/15/28 (b) | 2,985,458 | 2,672,916 |
| Clear Channel Outdoor Holdings, Inc. | |
| Term Loan B | |
| 9.145% (3 Month SOFR + 3.50%), due 8/21/26 (b) | 1,193,304 | 1,179,581 |
The notes to the financial statements are an integral part of, and should be read in conjunction with, the financial statements.
| 14 | MainStay VP Floating Rate Portfolio |
| | Principal
Amount | Value |
| Loan Assignments (continued) |
| Broadcasting & Entertainment (continued) |
| CMG Media Corp. | |
| First Lien 2021 Term Loan B | |
| 8.948% (3 Month SOFR + 3.50%), due 12/17/26 (b) | $ 2,721,811 | $ 2,514,273 |
| Gray Television, Inc. (b) | |
| Term Loan E | |
| 7.957% (1 Month SOFR + 2.50%), due 1/2/26 | 506,446 | 505,602 |
| Term Loan D | |
| 8.457% (1 Month SOFR + 3.00%), due 12/1/28 | 1,568,000 | 1,553,626 |
| Nexstar Media, Inc. | |
| Term Loan B4 | |
| 7.97% (1 Month SOFR + 2.50%), due 9/18/26 (b) | 1,719,214 | 1,719,393 |
| Univision Communications, Inc. (b) | |
| First Lien Initial Term Loan | |
| 8.72% (1 Month SOFR + 3.25%), due 1/31/29 | 2,043,600 | 2,035,299 |
| First Lien 2022 Incremental Term Loan | |
| 9.598% (3 Month SOFR + 4.25%), due 6/24/29 | 664,875 | 665,499 |
| | | 12,846,189 |
| Buildings & Real Estate 2.0% |
| Allspring Buyer LLC | |
| Initial Term Loan | |
| 8.887% (3 Month SOFR + 3.25%), due 11/1/28 (b) | 1,568,831 | 1,561,476 |
| Beacon Roofing Supply, Inc. | |
| 2028 Term Loan | |
| 7.97% (1 Month SOFR + 2.50%), due 5/19/28 (b) | 1,462,500 | 1,466,488 |
| Core & Main LP | |
| Tranche Term Loan B 7.955% - 8.056% | |
| (1 Month SOFR + 2.50%, 6 Month SOFR + 2.50%), due 7/27/28 (b) | 2,480,784 | 2,476,909 |
| Cornerstone Building Brands, Inc. (b) | |
| Tranche Term Loan B | |
| 8.712% (1 Month SOFR + 3.25%), due 4/12/28 | 2,450,614 | 2,445,253 |
| Initial Term Loan | |
| 10.987% (1 Month SOFR + 5.625%), due 8/1/28 | 1,188,000 | 1,194,930 |
| Cushman & Wakefield U.S. Borrower LLC (b) | |
| Replacement Term Loan | |
| 8.22% (1 Month SOFR + 2.75%), due 8/21/25 | 149,512 | 149,138 |
| 2023-1 Refinancing Term Loan | |
| 8.706% (1 Month SOFR + 3.25%), due 1/31/30 | 1,521,385 | 1,506,171 |
| | Principal
Amount | Value |
| |
| Buildings & Real Estate (continued) |
| Cushman & Wakefield U.S. Borrower LLC (b) (continued) | |
| 2023-2 Refinancing Term Loan | |
| 9.356% (1 Month SOFR + 4.00%), due 1/31/30 | $ 833,333 | $ 831,250 |
| SRS Distribution, Inc. (b) | |
| 2022 Refinancing Term Loan | |
| 8.956% (1 Month SOFR + 3.50%), due 6/2/28 | 589,500 | 588,468 |
| 2021 Refinancing Term Loan | |
| 8.97% (1 Month SOFR + 3.50%), due 6/2/28 | 2,033,200 | 2,031,167 |
| VC GB Holdings I Corp. | |
| First Lien Initial Term Loan | |
| 8.61% (3 Month SOFR + 3.00%), due 7/21/28 (b) | 490,000 | 486,427 |
| Wilsonart LLC | |
| Tranche Term Loan E | |
| 8.698% (3 Month SOFR + 3.25%), due 12/31/26 (b) | 2,865,153 | 2,868,287 |
| | | 17,605,964 |
| Capital Equipment 0.4% |
| AZZ, Inc. | |
| Initial Term Loan | |
| 9.106% (1 Month SOFR + 3.75%), due 5/13/29 (b) | 792,500 | 795,307 |
| CPM Holdings, Inc. | |
| Initial Term Loan | |
| 9.843% (1 Month SOFR + 4.50%), due 9/28/28 (b) | 2,500,000 | 2,506,250 |
| | | 3,301,557 |
| Cargo Transport 0.3% |
| Genesee & Wyoming, Inc. | |
| Initial Term Loan | |
| 7.448% (3 Month SOFR + 2.00%), due 12/30/26 (b) | 2,415,972 | 2,420,251 |
| Chemicals 0.2% |
| LSF11 A5 Holdco LLC (b) | |
| Term Loan | |
| 8.97% (1 Month SOFR + 3.50%), due 10/15/28 | 1,310,000 | 1,307,544 |
| Fourth Amendment Incremental Term Loan | |
| 9.706% (1 Month SOFR + 4.25%), due 10/15/28 | 447,750 | 448,496 |
| | | 1,756,040 |
| Chemicals, Plastics & Rubber 5.4% |
| Aruba Investments Holdings LLC (b) | |
| First Lien Initial Dollar Term Loan | |
| 9.456% (1 Month SOFR + 4.00%), due 11/24/27 | 518,721 | 512,021 |
The notes to the financial statements are an integral part of, and should be read in conjunction with, the financial statements.
15
Portfolio of Investments December 31, 2023†^ (continued)
| | Principal
Amount | Value |
| Loan Assignments (continued) |
| Chemicals, Plastics & Rubber (continued) |
| Aruba Investments Holdings LLC (b) (continued) | |
| First Lien 2022 Incremental Term Loan | |
| 10.106% (1 Month SOFR + 4.75%), due 11/24/27 (c)(d) | $ 1,485,000 | $ 1,462,725 |
| Axalta Coating Systems Dutch Holding B BV | |
| Dollar Facility Term Loan B5 | |
| 7.848% (3 Month SOFR + 2.50%), due 12/20/29 (b) | 2,232,219 | 2,236,962 |
| Bakelite U.S. Holdco, Inc. | |
| Term Loan | |
| 9.498% (3 Month SOFR + 4.00%), due 5/29/29 (b) | 1,773,000 | 1,763,027 |
| Clydesdale Acquisition Holdings, Inc. | |
| First Lien Term Loan B | |
| 9.631% (1 Month SOFR + 4.175%), due 4/13/29 (b) | 2,955,000 | 2,966,841 |
| Entegris, Inc. | |
| Tranche Term Loan B 7.848% - 7.856% | |
| (1 Month SOFR + 2.50%, 3 Month SOFR + 2.50%), due 7/6/29 (b) | 1,377,258 | 1,380,701 |
| Herens Holdco SARL | |
| USD Facility Term Loan B | |
| 9.373% (3 Month SOFR + 3.925%), due 7/3/28 (b) | 1,157,733 | 1,046,302 |
| Ineos Quattro Holdings U.K. Ltd. | |
| 2030 Tranche Dollar Term Loan B | |
| 9.206% (1 Month SOFR + 3.75%), due 3/14/30 (b) | 1,492,500 | 1,447,725 |
| Ineos U.S. Finance LLC (b) | |
| 2030 Dollar Term Loan | |
| 8.956% (1 Month SOFR + 3.50%), due 2/18/30 | 995,000 | 995,000 |
| 2027-II Dollar Term Loan | |
| 9.206% (1 Month SOFR + 3.75%), due 11/8/27 | 1,412,051 | 1,413,523 |
| INEOS US Petrochem LLC | |
| USD Term Loan | |
| 9.706% (1 Month SOFR + 4.25%), due 4/2/29 (b) | 1,896,350 | 1,853,682 |
| Innophos Holdings, Inc. | |
| Initial Term Loan | |
| 8.72% (1 Month SOFR + 3.25%), due 2/5/27 (b) | 1,443,750 | 1,414,425 |
| Jazz Pharmaceuticals plc | |
| Initial Dollar Term Loan | |
| 8.97% (1 Month SOFR + 3.50%), due 5/5/28 (b) | 2,634,677 | 2,645,380 |
| Koppers, Inc. | |
| Term Loan B | |
| 8.96% (1 Month SOFR + 3.50%), due 4/10/30 (b) | 3,491,250 | 3,504,342 |
| | Principal
Amount | Value |
| |
| Chemicals, Plastics & Rubber (continued) |
| Nouryon Finance BV (b) | |
| 2023 Term Loan | |
| 9.441% (1 Month SOFR + 4.00%), due 4/3/28 | $ 1,243,750 | $ 1,246,548 |
| Extended Dollar Term Loan | |
| 9.467% (3 Month SOFR + 4.00%), due 4/3/28 | 3,413,310 | 3,421,843 |
| Olympus Water U.S. Holding Corp. | |
| Initial Dollar Term Loan | |
| 9.36% (3 Month SOFR + 3.75%), due 11/9/28 (b) | 1,225,000 | 1,221,386 |
| Oxea Holding Vier GmbH | |
| Tranche Term Loan B2 | |
| 9.014% (3 Month SOFR + 3.50%), due 10/14/24 (b) | 1,676,433 | 1,619,853 |
| PMHC II, Inc. | |
| Initial Term Loan | |
| 9.807% (3 Month SOFR + 4.25%), due 4/23/29 (b) | 2,962,500 | 2,827,336 |
| SCIH Salt Holdings, Inc. | |
| First Lien Incremental Term Loan B1 | |
| 9.47% (1 Month SOFR + 4.00%), due 3/16/27 (b) | 2,664,022 | 2,663,606 |
| Sparta U.S. Holdco LLC | |
| First Lien Initial Term Loan | |
| 8.705% (1 Month SOFR + 3.25%), due 8/2/28 (b) | 882,000 | 879,427 |
| Tricorbraun Holdings, Inc. | |
| First Lien Closing Date Initial Term Loan | |
| 8.72% (1 Month SOFR + 3.25%), due 3/3/28 (b) | 2,595,462 | 2,574,914 |
| Tronox Finance LLC | |
| First Lien Refinancing Term Loan 7.97% - 8.11% | |
| (1 Month SOFR + 2.50%, 3 Month SOFR + 2.50%), due 3/10/28 (b) | 1,219,316 | 1,217,283 |
| W. R. Grace Holdings LLC | |
| Initial Term Loan | |
| 9.36% (3 Month SOFR + 3.75%), due 9/22/28 (b) | 1,470,000 | 1,472,143 |
| Windsor Holdings III LLC | |
| Dollar Term Loan B | |
| 9.841% (1 Month SOFR + 4.50%), due 8/1/30 (b) | 2,493,750 | 2,507,109 |
| | | 46,294,104 |
| Commercial Services 0.3% |
| Prime Security Services Borrower LLC | |
| First Lien 2023 Refinancing Term Loan B1 | |
| 7.841% (1 Month SOFR + 2.50%), due 10/13/30 (b) | 2,500,000 | 2,504,515 |
The notes to the financial statements are an integral part of, and should be read in conjunction with, the financial statements.
| 16 | MainStay VP Floating Rate Portfolio |
| | Principal
Amount | Value |
| Loan Assignments (continued) |
| Consumer Durables 0.2% |
| SWF Holdings I Corp. | |
| First Lien Initial Term Loan | |
| 9.47% (1 Month SOFR + 4.00%), due 10/6/28 (b) | $ 2,063,250 | $ 1,833,198 |
| Containers, Packaging & Glass 3.0% |
| Alliance Laundry Systems LLC | |
| Initial Term Loan B | |
| 8.994% (3 Month SOFR + 3.50%), due 10/8/27 (b) | 1,630,286 | 1,633,682 |
| Altium Packaging LLC | |
| First Lien 2021 Term Loan | |
| 8.22% (1 Month SOFR + 2.75%), due 2/3/28 (b) | 2,028,610 | 2,028,927 |
| Anchor Glass Container Corp. | |
| First Lien August 2023 Extended Term Loan 10.827% - 10.896% | |
| (3 Month SOFR + 5.00%, 6 Month SOFR + 5.00%), due 12/7/25 (b) | 2,070,944 | 1,692,997 |
| Berlin Packaging LLC (b) | |
| Tranche Initial Term Loan B4 8.594% - 8.728% | |
| (1 Month SOFR + 3.25%, 3 Month SOFR + 3.25%), due 3/11/28 | 1,945,007 | 1,936,325 |
| Tranche Term Loan B5 9.207% - 9.36% | |
| (1 Month SOFR + 3.75%, 3 Month SOFR + 3.75%), due 3/11/28 | 1,055,700 | 1,055,832 |
| Charter Next Generation, Inc. | |
| First Lien 2021 Initial Term Loan | |
| 9.22% (1 Month SOFR + 3.75%), due 12/1/27 (b) | 2,820,191 | 2,825,919 |
| Flint Group Packaging Inks North America Holdings LLC (b) | |
| USD Facility Term Loan B | |
| 10.674% (3 Month SOFR + 5.00%), due 12/31/26 | 711,096 | 648,875 |
| USD PIK Holdco Term Loan | |
| 12.674% (6.90% PIK) (3 Month SOFR + 0.362%), due 12/31/27 (e) | 346,742 | 251,821 |
| Second Lien USD PIK Holdco Term Loan | |
| 12.674% (6.90% PIK) (3 Month SOFR + 0.362%), due 12/31/27 (e) | 462,398 | 46,240 |
| Graham Packaging Co., Inc. | |
| 2021 Initial Term Loan | |
| 8.47% (1 Month SOFR + 3.00%), due 8/4/27 (b) | 3,184,160 | 3,186,303 |
| Mauser Packaging Solutions Holding Co. | |
| Initial Term Loan | |
| 9.343% (1 Month SOFR + 4.00%), due 8/14/26 (b) | 182,417 | 182,898 |
| | Principal
Amount | Value |
| |
| Containers, Packaging & Glass (continued) |
| Pactiv Evergreen, Inc. (b) | |
| Tranche U.S. Term Loan B2 | |
| 8.72% (1 Month SOFR + 3.25%), due 2/5/26 | $ 622,200 | $ 624,088 |
| Tranche U.S. Term Loan B3 | |
| 8.72% (1 Month SOFR + 3.25%), due 9/24/28 | 487,500 | 488,442 |
| Pretium PKG Holdings, Inc. (b) | |
| Second Lien Initial Term Loan 12.186% - 12.194% | |
| (1 Month SOFR + 6.75%), due 10/1/29 (c) | 750,000 | 289,375 |
| First Lien Third Amendment Tranche Initial Term Loan A1 | |
| 9.995% (3 Month SOFR + 4.60%), due 10/2/28 | 1,581,746 | 1,233,762 |
| First Lien Third Amendment Tranche Term Loan A | |
| 10.395% (3 Month SOFR + 5.00%), due 10/2/28 | 423,485 | 413,956 |
| ProAmpac PG Borrower LLC | |
| 2023-1 Term Loan 9.868% - 9.887% | |
| (3 Month SOFR + 4.50%), due 9/15/28 (b) | 1,666,667 | 1,666,667 |
| Reynolds Consumer Products LLC | |
| Initial Term Loan | |
| 7.206% (1 Month SOFR + 1.75%), due 2/4/27 (b) | 1,117,917 | 1,119,060 |
| RLG Holdings LLC | |
| First Lien Closing Date Initial Term Loan | |
| 9.72% (1 Month SOFR + 4.25%), due 7/7/28 (b) | 784,000 | 735,163 |
| Trident TPI Holdings, Inc. (b) | |
| Tranche Initial Term Loan B3 | |
| 9.61% (3 Month SOFR + 4.00%), due 9/15/28 | 503,051 | 501,291 |
| Tranche Initial Term Loan B5 | |
| 9.848% (3 Month SOFR + 4.50%), due 9/15/28 | 2,658,595 | 2,658,595 |
| Tranche Initial Term Loan B4 | |
| 10.598% (3 Month SOFR + 5.25%), due 9/15/28 | 396,000 | 396,742 |
| | | 25,616,960 |
| Diversified/Conglomerate Manufacturing 2.2% |
| Allied Universal Holdco LLC | |
| Initial U.S. Dollar Term Loan | |
| 9.206% (1 Month SOFR + 3.75%), due 5/12/28 (b) | 4,218,690 | 4,185,071 |
| Filtration Group Corp. (b) | |
| 2021 Incremental Term Loan | |
| 8.97% (1 Month SOFR + 3.50%), due 10/21/28 | 782,000 | 782,760 |
| 2023 Extended Dollar Term Loan | |
| 9.72% (1 Month SOFR + 4.25%), due 10/21/28 | 2,713,808 | 2,724,549 |
The notes to the financial statements are an integral part of, and should be read in conjunction with, the financial statements.
17
Portfolio of Investments December 31, 2023†^ (continued)
| | Principal
Amount | Value |
| Loan Assignments (continued) |
| Diversified/Conglomerate Manufacturing (continued) |
| Gardner Denver, Inc. | |
| 2020 GDI Tranche Dollar Term Loan B2 | |
| 7.206% (1 Month SOFR + 1.75%), due 3/1/27 (b) | $ 1,938,231 | $ 1,941,866 |
| GYP Holdings III Corp. | |
| First Lien 2023 Refinancing Term Loan | |
| 8.356% (1 Month SOFR + 3.00%), due 5/12/30 (b) | 1,367,027 | 1,370,444 |
| Ingersoll-Rand Services Co. | |
| 2020 Spinco Tranche Dollar Term Loan B1 | |
| 7.206% (1 Month SOFR + 1.75%), due 3/1/27 (b) | 159,843 | 160,143 |
| Iron Mountain Information Management LLC | |
| Incremental Term Loan B | |
| 7.22% (1 Month LIBOR + 1.75%), due 1/2/26 (b) | 1,767,188 | 1,763,874 |
| LTI Holdings, Inc. (b) | |
| First Lien Initial Term Loan | |
| 8.97% (1 Month SOFR + 3.50%), due 9/6/25 | 1,041,014 | 1,002,627 |
| First Lien First Amendment Additional Term Loan | |
| 10.22% (1 Month SOFR + 4.75%), due 7/24/26 | 983,412 | 949,812 |
| QUIKRETE Holdings, Inc. (b) | |
| First Lien Initial Term Loan | |
| 8.095% (1 Month SOFR + 2.625%), due 2/1/27 | 2,243,321 | 2,248,088 |
| First Lien Fourth Amendment Term Loan | |
| 8.22% (1 Month SOFR + 2.75%), due 3/19/29 | 1,473,750 | 1,477,987 |
| Red Ventures LLC | |
| First Lien Term Loan B4 | |
| 8.356% (1 Month SOFR + 3.00%), due 3/3/30 (b) | 533,845 | 531,843 |
| | | 19,139,064 |
| Diversified/Conglomerate Service 1.8% |
| Applied Systems, Inc. (b) | |
| First Lien 2026 Term Loan | |
| 9.848% (3 Month SOFR + 4.50%), due 9/18/26 | 2,517,175 | 2,525,716 |
| Second Lien 2021 Term Loan | |
| 12.098% (3 Month SOFR + 6.75%), due 9/17/27 | 445,140 | 447,087 |
| Blackhawk Network Holdings, Inc. | |
| First Lien Term Loan | |
| 8.138% (3 Month SOFR + 2.75%), due 6/15/25 (b) | 1,916,723 | 1,913,527 |
| Brightview Landscapes LLC | |
| 2022 Initial Term Loan | |
| 8.383% (3 Month SOFR + 3.00%), due 4/20/29 (b) | 666,321 | 666,113 |
| | Principal
Amount | Value |
| |
| Diversified/Conglomerate Service (continued) |
| Element Materials Technology Group U.S. Holdings, Inc. (b) | |
| First Lien Delayed Draw Term Loan B | |
| 9.698% (3 Month SOFR + 4.25%), due 6/22/29 | $ 218,842 | $ 216,289 |
| Initial Delayed Draw Term Loan | |
| 9.698% (3 Month SOFR + 4.25%), due 7/6/29 | 474,158 | 468,626 |
| Genesys Cloud Services Holdings I LLC | |
| 2020 Initial Dollar Term Loan | |
| 9.47% (1 Month SOFR + 4.00%), due 12/1/27 (b) | 2,389,718 | 2,396,813 |
| MKS Instruments, Inc. | |
| 2023-1 Dollar Term Loan B | |
| 7.841% (1 Month SOFR + 2.50%), due 8/17/29 (b) | 3,305,638 | 3,307,998 |
| TruGreen LP | |
| First Lien Second Refinancing Term Loan | |
| 9.456% (1 Month SOFR + 4.00%), due 11/2/27 (b) | 2,651,329 | 2,558,533 |
| Verscend Holding Corp. | |
| Term Loan B1 | |
| 9.47% (1 Month SOFR + 4.00%), due 8/27/25 (b) | 1,030,673 | 1,030,190 |
| | | 15,530,892 |
| Ecological 0.1% |
| GFL Environmental, Inc. | |
| 2023 Refinancing Term Loan A | |
| 7.912% (3 Month SOFR + 2.50%), due 5/31/27 (b) | 1,136,545 | 1,139,387 |
| Electronics 5.8% |
| Camelot U.S. Acquisition LLC (b) | |
| Initial Term Loan | |
| 8.47% (1 Month SOFR + 3.00%), due 10/30/26 | 1,445,433 | 1,446,517 |
| Amendment No. 2 Incremental Term Loan | |
| 8.47% (1 Month SOFR + 3.00%), due 10/30/26 | 964,687 | 964,515 |
| Castle U.S. Holding Corp. (b) | |
| Initial Dollar Term Loan | |
| 9.40% (3 Month SOFR + 3.75%), due 1/29/27 | 348,803 | 244,423 |
| Dollar Term Loan B2 | |
| 9.65% (3 Month SOFR + 4.00%), due 1/29/27 | 2,442,708 | 1,697,682 |
| Commscope, Inc. | |
| Initial Term Loan | |
| 8.72% (1 Month SOFR + 3.25%), due 4/6/26 (b) | 4,128,019 | 3,677,375 |
The notes to the financial statements are an integral part of, and should be read in conjunction with, the financial statements.
| 18 | MainStay VP Floating Rate Portfolio |
| | Principal
Amount | Value |
| Loan Assignments (continued) |
| Electronics (continued) |
| CoreLogic, Inc. | |
| First Lien Initial Term Loan | |
| 8.97% (1 Month SOFR + 3.50%), due 6/2/28 (b) | $ 4,398,750 | $ 4,267,887 |
| DCert Buyer, Inc. | |
| First Lien Initial Term Loan | |
| 9.356% (1 Month SOFR + 4.00%), due 10/16/26 (b) | 2,409,887 | 2,384,657 |
| ECi Macola/MAX Holding LLC | |
| First Lien Initial Term Loan | |
| 9.36% (3 Month SOFR + 3.75%), due 11/9/27 (b) | 1,940,000 | 1,938,060 |
| Epicor Software Corp. (b) | |
| Term Loan C | |
| 8.72% (1 Month SOFR + 3.25%), due 7/30/27 | 3,001,380 | 3,009,225 |
| Term Loan D | |
| 9.106% (1 Month SOFR + 3.75%), due 7/30/27 | 1,250,000 | 1,260,312 |
| Flexera Software LLC | |
| First Lien Term Loan B1 | |
| 9.22% (1 Month SOFR + 3.75%), due 3/3/28 (b) | 2,322,758 | 2,318,693 |
| Gainwell Acquisition Corp. | |
| First Lien Term Loan B | |
| 9.448% (3 Month SOFR + 4.00%), due 10/1/27 (b) | 1,500,322 | 1,455,313 |
| Go Daddy Operating Co. LLC | |
| Amendment No. 6 Term Loan | |
| 7.856% (1 Month SOFR + 2.50%), due 11/9/29 (b) | 1,150,102 | 1,153,080 |
| Helios Software Holdings, Inc. | |
| 2021 Initial Dollar Term Loan | |
| 9.248% (3 Month SOFR + 3.75%), due 3/11/28 (b) | 350,752 | 349,612 |
| ION Trading Finance Ltd. | |
| 2021 Initial Dollar Term Loan | |
| 10.198% (3 Month SOFR + 4.75%), due 4/1/28 (b) | 975,000 | 974,391 |
| MH Sub I LLC | |
| First Lien 2023 May Incremental Term Loan | |
| 9.606% (1 Month SOFR + 4.25%), due 5/3/28 (b) | 3,506,594 | 3,442,161 |
| Project Alpha Intermediate Holding, Inc. | |
| Initial Term Loan | |
| 10.106% (1 Month SOFR + 4.75%), due 10/28/30 (b) | 3,500,000 | 3,516,408 |
| Proofpoint, Inc. | |
| First Lien Initial Term Loan | |
| 8.72% (1 Month SOFR + 3.25%), due 8/31/28 (b) | 2,450,000 | 2,448,050 |
| | Principal
Amount | Value |
| |
| Electronics (continued) |
| Rocket Software, Inc. | |
| Extended Dollar Term Loan | |
| 10.106% (1 Month SOFR + 4.75%), due 11/28/28 (b) | $ 2,319,936 | $ 2,275,147 |
| Sharp Services LLC (b) | |
| First Lien Initial Term Loan | |
| 9.448% (3 Month SOFR + 4.00%), due 12/31/28 | 1,768,500 | 1,770,711 |
| First Lien Tranche Term Loan B | |
| 9.848% (3 Month SOFR + 4.50%), due 12/31/28 | 1,000,000 | 1,000,000 |
| Sophos Holdings LLC | |
| First Lien Dollar Tranche Term Loan | |
| 8.974% (1 Month SOFR + 3.50%), due 3/5/27 (b) | 1,979,742 | 1,982,492 |
| SS&C Technologies Holdings, Inc. (b) | |
| Term Loan B3 | |
| 7.22% (1 Month SOFR + 1.75%), due 4/16/25 | 506,960 | 507,033 |
| Term Loan B4 | |
| 7.22% (1 Month SOFR + 1.75%), due 4/16/25 | 478,683 | 478,897 |
| Term Loan B5 | |
| 7.22% (1 Month SOFR + 1.75%), due 4/16/25 | 1,761,861 | 1,762,963 |
| Vertiv Group Corp. | |
| Term Loan B1 | |
| 7.974% (1 Month SOFR + 2.50%), due 3/2/27 (b) | 1,925,586 | 1,931,845 |
| VS Buyer LLC | |
| Initial Term Loan | |
| 8.706% (1 Month SOFR + 3.25%), due 2/28/27 (b) | 962,500 | 963,703 |
| WEX, Inc. | |
| Term Loan B | |
| 7.72% (1 Month SOFR + 2.25%), due 3/31/28 (b) | 972,500 | 974,526 |
| | | 50,195,678 |
| Energy (Electricity) 0.5% |
| Covanta Holding Corp. (b) | |
| Initial Term Loan B | |
| 7.856% (1 Month SOFR + 2.50%), due 11/30/28 | 548,420 | 547,636 |
| Initial Term Loan C | |
| 7.856% (1 Month SOFR + 2.50%), due 11/30/28 | 41,812 | 41,752 |
| 2023 Incremental Term Loan B | |
| 8.36% (1 Month SOFR + 3.00%), due 11/30/28 | 3,711,628 | 3,713,176 |
The notes to the financial statements are an integral part of, and should be read in conjunction with, the financial statements.
19
Portfolio of Investments December 31, 2023†^ (continued)
| | Principal
Amount | Value |
| Loan Assignments (continued) |
| Energy (Electricity) (continued) |
| Covanta Holding Corp. (b) (continued) | |
| 2023 Incremental Term Loan C | |
| 8.36% (1 Month SOFR + 3.00%), due 11/30/28 | $ 279,069 | $ 279,186 |
| | | 4,581,750 |
| Entertainment 1.3% |
| Alterra Mountain Co. | |
| Term Loan B2 | |
| 8.97% (1 Month SOFR + 3.50%), due 8/17/28 (b) | 2,337,669 | 2,339,130 |
| Fertitta Entertainment LLC | |
| Initial Term Loan B | |
| 9.356% (1 Month SOFR + 4.00%), due 1/27/29 (b) | 4,180,550 | 4,178,857 |
| Formula One Management Ltd. | |
| First Lien Facility Term Loan B | |
| 7.598% (3 Month SOFR + 2.25%), due 1/15/30 (b) | 861,538 | 862,884 |
| J&J Ventures Gaming LLC | |
| Initial Term Loan | |
| 9.61% (3 Month SOFR + 4.00%), due 4/26/28 (b) | 3,910,000 | 3,868,456 |
| | | 11,249,327 |
| Finance 6.2% |
| AAdvantage Loyality IP Ltd. | |
| Initial Term Loan | |
| 10.427% (3 Month SOFR + 4.75%), due 4/20/28 (b) | 3,060,000 | 3,142,238 |
| Acuris Finance U.S., Inc. | |
| Initial Dollar Term Loan | |
| 9.498% (3 Month SOFR + 4.00%), due 2/16/28 (b) | 2,269,531 | 2,264,566 |
| ADMI Corp. (b) | |
| Amendment No.4 Refinancing Term Loan | |
| 8.845% (1 Month SOFR + 3.375%), due 12/23/27 | 1,462,500 | 1,373,532 |
| Amendment No. 5 Incremental Term Loan | |
| 9.22% (1 Month SOFR + 3.75%), due 12/23/27 | 735,000 | 695,187 |
| Ahlstrom-Munksjo Holding 3 Oy | |
| USD Facility Term Loan B | |
| 9.61% (3 Month SOFR + 4.00%), due 2/4/28 (b) | 780,223 | 776,322 |
| AlixPartners LLP | |
| Initial Dollar Term Loan | |
| 8.22% (1 Month SOFR + 2.75%), due 2/4/28 (b) | 1,458,749 | 1,461,484 |
| | Principal
Amount | Value |
| |
| Finance (continued) |
| Blackstone Mortgage Trust, Inc. | |
| Term Loan B4 | |
| 8.856% (1 Month SOFR + 3.50%), due 5/9/29 (b) | $ 313,948 | $ 310,023 |
| Blue Tree Holdings, Inc. | |
| Term Loan | |
| 8.11% (3 Month SOFR + 2.50%), due 3/4/28 (b) | 486,250 | 482,603 |
| Boxer Parent Co., Inc. | |
| USD Term Loan | |
| TBD, due 12/2/28 | 3,220,631 | 3,242,170 |
| Covia Holdings LLC | |
| Initial Term Loan | |
| 9.676% (3 Month SOFR + 4.00%), due 7/31/26 (b) | 709,736 | 703,881 |
| CPC Acquisition Corp. | |
| First Lien Initial Term Loan | |
| 9.36% (3 Month SOFR + 3.75%), due 12/29/27 (b) | 1,738,715 | 1,393,145 |
| Deerfield Dakota Holding LLC | |
| First Lien Initial Dollar Term Loan | |
| 9.098% (3 Month SOFR + 3.75%), due 4/9/27 (b) | 1,459,872 | 1,446,186 |
| Endurance International Group Holdings, Inc. | |
| Initial Term Loan | |
| 9.422% (6 Month SOFR + 3.50%), due 2/10/28 (b) | 3,806,941 | 3,715,339 |
| GTCR W. Merger Sub LLC | |
| USD Term Loan B | |
| TBD, due 9/20/30 | 5,000,000 | 5,010,050 |
| LBM Acquisition LLC | |
| First Lien Initial Term Loan | |
| 9.206% (1 Month SOFR + 3.75%), due 12/17/27 (b) | 834,581 | 824,496 |
| LSF11 Trinity Bidco, Inc. | |
| Term Loan | |
| 9.358% (1 Month SOFR + 4.00%), due 6/14/30 (b) | 3,687,054 | 3,705,489 |
| Minimax Viking GmbH | |
| Facility Term Loan B1D | |
| 8.22% (1 Month SOFR + 2.75%), due 7/31/28 (b) | 2,128,162 | 2,132,152 |
| Onex TSG Intermediate Corp. | |
| Initial Term Loan | |
| 10.395% (3 Month SOFR + 4.75%), due 2/28/28 (b) | 975,000 | 955,500 |
| Park River Holdings, Inc. | |
| First Lien Initial Term Loan | |
| 8.907% (3 Month SOFR + 3.25%), due 12/28/27 (b) | 1,299,981 | 1,265,044 |
The notes to the financial statements are an integral part of, and should be read in conjunction with, the financial statements.
| 20 | MainStay VP Floating Rate Portfolio |
| | Principal
Amount | Value |
| Loan Assignments (continued) |
| Finance (continued) |
| Peraton Corp. | |
| First Lien Term Loan B | |
| 9.206% (1 Month SOFR + 3.75%), due 2/1/28 (b) | $ 3,351,675 | $ 3,355,027 |
| Pluto Acquisition I, Inc. | |
| First Lien 2021 Term Loan | |
| 9.65% (3 Month SOFR + 4.00%), due 6/22/26 (b) | 2,047,500 | 1,576,575 |
| Potters Industries LLC | |
| Initial Term Loan | |
| 9.448% (3 Month SOFR + 4.00%), due 12/14/27 (b) | 778,000 | 779,621 |
| RealPage, Inc. | |
| First Lien Initial Term Loan | |
| 8.47% (1 Month SOFR + 3.00%), due 4/24/28 (b) | 2,330,210 | 2,312,316 |
| RealTruck Group, Inc. | |
| Initial Term Loan | |
| 8.97% (1 Month SOFR + 3.50%), due 1/31/28 (b) | 1,050,300 | 1,035,531 |
| Triton Water Holdings, Inc. | |
| First Lien Initial Term Loan | |
| 8.86% (3 Month SOFR + 3.25%), due 3/31/28 (b) | 2,161,753 | 2,139,234 |
| WCG Purchaser Corp. | |
| First Lien Initial Term Loan | |
| 9.47% (1 Month SOFR + 4.00%), due 1/8/27 (b) | 2,215,114 | 2,217,882 |
| WildBrain Ltd. | |
| Initial Term Loan | |
| 9.713% (1 Month SOFR + 4.25%), due 3/24/28 (b) | 3,544,762 | 3,438,420 |
| WIN Waste Innovations Holdings, Inc. | |
| Initial Term Loan | |
| 8.22% (1 Month SOFR + 2.75%), due 3/24/28 (b) | 2,184,000 | 2,047,500 |
| | | 53,801,513 |
| Healthcare 1.6% |
| AHP Health Partners, Inc. | |
| Initial Term Loan | |
| 8.97% (1 Month SOFR + 3.50%), due 8/24/28 (b) | 1,332,794 | 1,335,710 |
| Chariot Buyer LLC | |
| First Lien Initial Term Loan | |
| 8.706% (1 Month SOFR + 3.25%), due 11/3/28 (b) | 4,704,000 | 4,687,202 |
| CHG Healthcare Services, Inc. | |
| First Lien Initial Term Loan | |
| 8.72% (1 Month SOFR + 3.25%), due 9/29/28 (b) | 1,270,750 | 1,271,103 |
| | Principal
Amount | Value |
| |
| Healthcare (continued) |
| ICU Medical, Inc. | |
| Tranche Term Loan B | |
| 7.998% (3 Month SOFR + 2.50%), due 1/8/29 (b) | $ 836,981 | $ 834,628 |
| LSCS Holdings, Inc. | |
| First Lien Initial Term Loan | |
| 9.97% (1 Month SOFR + 4.50%), due 12/16/28 (b) | 686,000 | 674,852 |
| Medical Solutions Holdings, Inc. | |
| First Lien Initial Term Loan | |
| 8.706% (1 Month SOFR + 3.25%), due 11/1/28 (b) | 505,699 | 464,990 |
| Medline Borrower LP | |
| Initial Dollar Term Loan | |
| 8.47% (1 Month SOFR + 3.00%), due 10/23/28 (b) | 3,053,174 | 3,062,716 |
| U.S. Anesthesia Partners, Inc. | |
| First Lien Initial Term Loan | |
| 9.707% (1 Month SOFR + 4.25%), due 10/1/28 (b) | 1,930,140 | 1,759,874 |
| | | 14,091,075 |
| Healthcare & Pharmaceuticals 0.9% |
| Bausch & Lomb Corp. | |
| Initial Term Loan | |
| 8.71% (1 Month SOFR + 3.25%), due 5/10/27 (b) | 1,975,000 | 1,949,696 |
| Bausch Health Cos., Inc. | |
| Second Amendment Term Loan | |
| 10.706% (1 Month SOFR + 5.25%), due 2/1/27 (b) | 1,387,500 | 1,126,477 |
| Embecta Corp. | |
| First Lien Initial Term Loan | |
| 8.356% (1 Month SOFR + 3.00%), due 3/30/29 (b) | 1,103,685 | 1,081,784 |
| Envision Healthcare Corp. (c)(f) | |
| Second Out Term Loan | |
| TBD, due 3/31/27 (d) | 1,064,041 | 159,606 |
| 2018 Third Out Term Loan | |
| TBD, due 3/31/27 | 499,477 | 2,497 |
| Owens & Minor, Inc. | |
| Term Loan B1 9.198% - 9.206% | |
| (1 Month SOFR + 3.75%, 3 Month SOFR + 3.75%), due 3/29/29 (b) | 861,667 | 862,026 |
| Pediatric Associates Holding Co. LLC | |
| Amendment No. 1 Incremental Term Loan | |
| 8.72% (1 Month SOFR + 3.25%), due 12/29/28 (b) | 1,572,948 | 1,517,895 |
| Physician Partners LLC | |
| Initial Term Loan | |
| 9.533% (3 Month SOFR + 4.00%), due 12/23/28 (b) | 1,105,312 | 1,041,757 |
| | | 7,741,738 |
The notes to the financial statements are an integral part of, and should be read in conjunction with, the financial statements.
21
Portfolio of Investments December 31, 2023†^ (continued)
| | Principal
Amount | Value |
| Loan Assignments (continued) |
| Healthcare, Education & Childcare 4.2% |
| Agiliti Health, Inc. | |
| Term Loan | |
| 8.395% (3 Month SOFR + 3.00%), due 5/1/30 (b) | $ 3,748,812 | $ 3,744,126 |
| Amneal Pharmaceuticals LLC | |
| Initial Term Loan | |
| 10.856% (1 Month SOFR + 5.50%), due 5/4/28 (b) | 3,086,157 | 3,029,579 |
| athenahealth Group, Inc. | |
| Initial Term Loan | |
| 8.606% (1 Month SOFR + 3.25%), due 2/15/29 (b) | 4,390,570 | 4,370,449 |
| Auris Luxembourg III SARL | |
| Facility Term Loan B2 9.598% - 9.619% | |
| (6 Month SOFR + 3.75%), due 2/27/26 (b) | 1,126,292 | 1,112,213 |
| Carestream Dental Technology Parent Ltd. (b) | |
| First Lien Initial Term Loan | |
| 8.86% (3 Month LIBOR + 3.25%), due 9/1/24 | 689,648 | 562,063 |
| First Lien Tranche Term Loan B | |
| 9.948% (3 Month SOFR + 4.50%), due 9/1/24 | 229,335 | 189,201 |
| Carestream Health, Inc. | |
| Term Loan | |
| 12.948% (3 Month SOFR + 7.50%), due 9/30/27 (b) | 1,716,005 | 1,321,324 |
| Ecovyst Catalyst Technologies LLC | |
| Initial Term Loan | |
| 7.983% (3 Month SOFR + 2.50%), due 6/9/28 (b) | 1,755,000 | 1,755,626 |
| Elanco Animal Health, Inc. | |
| Term Loan | |
| 7.193% (1 Month SOFR + 1.75%), due 8/1/27 (b) | 1,436,456 | 1,424,051 |
| FC Compassus LLC | |
| Term Loan B1 | |
| 9.895% (3 Month SOFR + 4.25%), due 12/31/26 (b)(c) | 2,009,719 | 1,967,850 |
| Grifols Worldwide Operations Ltd. | |
| Dollar Tranche Term Loan B | |
| 7.538% (3 Month SOFR + 2.00%), due 11/15/27 (b) | 923,152 | 921,854 |
| Insulet Corp. | |
| Term Loan B | |
| 8.72% (1 Month SOFR + 3.25%), due 5/4/28 (b) | 1,859,924 | 1,865,154 |
| Journey Personal Care Corp. | |
| Initial Term Loan | |
| 9.72% (3 Month LIBOR + 4.25%), due 3/1/28 (b) | 977,500 | 962,023 |
| | Principal
Amount | Value |
| |
| Healthcare, Education & Childcare (continued) |
| Mallinckrodt International Finance SA | |
| Second Out Term Loan | |
| 14.865% (1 Month SOFR + 9.50%), due 11/14/28 (b) | $ 444,788 | $ 476,480 |
| National Mentor Holdings, Inc. (b) | |
| First Lien Initial Term Loan 9.198% - 9.206% | |
| (1 Month SOFR + 3.75%, 3 Month SOFR + 3.75%), due 3/2/28 | 1,534,644 | 1,377,891 |
| First Lien Initial Term Loan C | |
| 9.198% (3 Month SOFR + 3.75%), due 3/2/28 | 49,563 | 44,500 |
| Organon & Co. | |
| Dollar Term Loan | |
| 8.472% (1 Month SOFR + 3.00%), due 6/2/28 (b) | 2,326,377 | 2,329,285 |
| Petco Health and Wellness Co., Inc. | |
| First Lien Initial Term Loan | |
| 8.86% (3 Month SOFR + 3.25%), due 3/3/28 (b) | 1,876,765 | 1,772,662 |
| Raptor Acquisition Corp. | |
| First Lien Term Loan B | |
| 9.633% (3 Month SOFR + 4.00%), due 11/1/26 (b) | 1,231,250 | 1,234,712 |
| Select Medical Corp. | |
| Tranche Term Loan B1 | |
| 8.356% (1 Month SOFR + 3.00%), due 3/6/27 (b) | 2,038,149 | 2,036,238 |
| Sound Inpatient Physicians, Inc. | |
| First Lien Initial Term Loan | |
| 8.645% (3 Month SOFR + 3.00%), due 6/27/25 (b)(c) | 472,500 | 143,286 |
| Sunshine Luxembourg VII SARL | |
| Facility Term Loan B3 | |
| 8.948% (3 Month SOFR + 3.50%), due 10/1/26 (b) | 3,355,560 | 3,370,241 |
| | | 36,010,808 |
| High Tech Industries 2.7% |
| Altar BidCo, Inc. | |
| First Lien Initial Term Loan 8.262% - 8.313% | |
| (1 Year SOFR + 3.10%), due 2/1/29 (b) | 1,846,875 | 1,840,873 |
| AP Gaming I LLC | |
| Term Loan B | |
| 9.456% (1 Month SOFR + 4.00%), due 2/15/29 (b) | 2,865,625 | 2,870,101 |
| Central Parent LLC | |
| First Lien 2023 Refinancing Term Loan | |
| 9.348% (3 Month SOFR + 4.00%), due 7/6/29 (b) | 1,000,000 | 1,003,269 |
The notes to the financial statements are an integral part of, and should be read in conjunction with, the financial statements.
| 22 | MainStay VP Floating Rate Portfolio |
| | Principal
Amount | Value |
| Loan Assignments (continued) |
| High Tech Industries (continued) |
| Hanesbands, Inc. | |
| Tranche Initial Term Loan B | |
| 9.106% (1 Month SOFR + 3.75%), due 3/8/30 (b) | $ 1,488,750 | $ 1,485,028 |
| NAB Holdings LLC | |
| Initial Term Loan | |
| 8.248% (3 Month SOFR + 2.75%), due 11/23/28 (b) | 1,764,000 | 1,765,469 |
| Nielsen Consumer, Inc. | |
| Fifth Amendment Dollar Incremental Term Loan | |
| 11.606% (1 Month SOFR + 6.25%), due 3/6/28 (b) | 1,658,333 | 1,618,948 |
| Open Text Corp. | |
| 2023 Replacement Term Loan | |
| 8.206% (1 Month SOFR + 2.75%), due 1/31/30 (b) | 3,876,318 | 3,877,702 |
| Scientific Games Holdings LP | |
| First Lien Initial Dollar Term Loan | |
| 8.664% (3 Month SOFR + 3.25%), due 4/4/29 (b) | 1,709,135 | 1,707,236 |
| Star Parent, Inc. | |
| Term Loan | |
| 9.348% (3 Month SOFR + 4.00%), due 9/27/30 (b) | 4,500,000 | 4,458,375 |
| Trans Union LLC | |
| 2021 Incremental Term Loan B6 | |
| 7.72% (1 Month SOFR + 2.25%), due 12/1/28 (b) | 2,502,851 | 2,509,109 |
| | | 23,136,110 |
| Hotel, Gaming & Leisure 0.3% |
| Flutter Entertainment plc | |
| 2028 Third Amendment Term Loan B | |
| 8.902% (3 Month SOFR + 3.25%), due 7/22/28 (b) | 897,281 | 898,902 |
| Hilton Domestic Operating Co., Inc. | |
| Term Loan B4 | |
| 7.457% (1 Month SOFR + 2.00%), due 11/8/30 (b) | 235,804 | 236,393 |
| Ontario Gaming GTA LP | |
| First Lien Term Loan B | |
| 9.598% (3 Month SOFR + 4.25%), due 8/1/30 (b) | 1,000,000 | 1,003,281 |
| | | 2,138,576 |
| Hotels, Motels, Inns & Gaming 3.6% |
| Aimbridge Acquisition Co., Inc. | |
| First Lien 2019 Initial Term Loan | |
| 9.22% (1 Month SOFR + 3.75%), due 2/2/26 (b) | 1,398,900 | 1,300,103 |
| | Principal
Amount | Value |
| |
| Hotels, Motels, Inns & Gaming (continued) |
| Caesars Entertainment, Inc. | |
| 2023 Incremental Term Loan B | |
| 8.706% (1 Month SOFR + 3.25%), due 2/6/30 (b) | $ 2,084,250 | $ 2,087,973 |
| Entain plc (b) | |
| USD Facility Term Loan B | |
| 7.948% (3 Month SOFR + 2.50%), due 3/29/27 | 1,253,571 | 1,255,138 |
| USD Facility Term Loan B2 | |
| 8.948% (3 Month SOFR + 3.50%), due 10/31/29 | 1,584,009 | 1,585,197 |
| Everi Holdings, Inc. | |
| Term Loan B | |
| 7.97% (1 Month SOFR + 2.50%), due 8/3/28 (b) | 1,440,881 | 1,444,033 |
| Four Seasons Holdings, Inc. | |
| First Lien 2023 Repricing Term Loan | |
| 7.956% (1 Month SOFR + 2.50%), due 11/30/29 (b) | 1,413,583 | 1,417,470 |
| Golden Entertainment, Inc. | |
| First Lien 2023 Refinancing Term Loan B1 | |
| 8.206% (1 Month SOFR + 2.75%), due 5/28/30 (b) | 870,625 | 869,537 |
| Light & Wonder International, Inc. | |
| Initial Term Loan B | |
| 8.465% (1 Month SOFR + 3.00%), due 4/14/29 (b) | 3,693,750 | 3,698,367 |
| Oceankey U.S. II Corp. | |
| Initial Term Loan | |
| 8.956% (1 Month SOFR + 3.50%), due 12/15/28 (b) | 1,972,424 | 1,925,579 |
| PCI Gaming Authority | |
| Facility Term Loan B | |
| 7.97% (1 Month SOFR + 2.50%), due 5/29/26 (b) | 2,449,126 | 2,455,249 |
| Penn Entertainment, Inc. | |
| Facility Term Loan B | |
| 8.205% (1 Month SOFR + 2.75%), due 5/3/29 (b) | 492,500 | 492,993 |
| Station Casinos LLC | |
| Facility Term Loan B1 | |
| 7.706% (1 Month SOFR + 2.25%), due 2/8/27 (b) | 1,597,891 | 1,599,177 |
| Travel + Leisure Co. | |
| Term Loan B | |
| TBD, due 12/14/29 | 1,500,000 | 1,501,875 |
| Term Loan B | |
| 7.895% (3 Month SOFR + 2.25%), due 5/30/25 (b) | 1,907,179 | 1,909,563 |
| UFC Holdings LLC | |
| First Lien Term Loan B3 | |
| 8.399% (3 Month SOFR + 2.75%), due 4/29/26 (b) | 3,971,682 | 3,980,122 |
The notes to the financial statements are an integral part of, and should be read in conjunction with, the financial statements.
23
Portfolio of Investments December 31, 2023†^ (continued)
| | Principal
Amount | Value |
| Loan Assignments (continued) |
| Hotels, Motels, Inns & Gaming (continued) |
| Whatabrands LLC | |
| Initial Term Loan B | |
| 8.47% (1 Month SOFR + 3.00%), due 8/3/28 (b) | $ 1,960,000 | $ 1,958,775 |
| Wyndham Hotels & Resorts, Inc. | |
| 2023 Term Loan B | |
| 7.706% (1 Month SOFR + 2.25%), due 5/24/30 (b) | 1,783,939 | 1,787,385 |
| | | 31,268,536 |
| Insurance 4.1% |
| Acrisure LLC (b) | |
| First Lien 2020 Term Loan | |
| 9.15% (3 Month LIBOR + 3.50%), due 2/15/27 | 1,953,387 | 1,946,412 |
| First Lien 2021-2 Additional Term Loan | |
| 9.90% (3 Month LIBOR + 4.25%), due 2/15/27 | 1,029,000 | 1,029,857 |
| Alliant Holdings Intermediate LLC | |
| New Term Loan B6 | |
| 8.865% (1 Month SOFR + 3.50%), due 11/6/30 (b) | 1,606,088 | 1,611,665 |
| AmWINS Group, Inc. | |
| February 2023 Incremental Term Loan | |
| TBD, due 2/19/28 | 3,465,000 | 3,470,568 |
| Term Loan | |
| 7.72% (1 Month SOFR + 2.25%), due 2/19/28 (b) | 1,940,029 | 1,940,029 |
| AssuredPartners, Inc. (b) | |
| 2020 February Refinancing Term Loan | |
| 8.97% (1 Month SOFR + 3.50%), due 2/12/27 | 3,092,654 | 3,096,520 |
| 2023 Term Loan | |
| 9.22% (1 Month SOFR + 3.75%), due 2/12/27 | 395,010 | 396,096 |
| Asurion LLC (b) | |
| New Term Loan B8 | |
| 8.72% (1 Month SOFR + 3.25%), due 12/23/26 | 970,000 | 966,882 |
| New Term Loan B9 | |
| 8.72% (1 Month SOFR + 3.25%), due 7/31/27 | 486,250 | 482,082 |
| New Term Loan B11 | |
| 9.706% (1 Month SOFR + 4.25%), due 8/19/28 | 1,413,902 | 1,407,539 |
| Second Lien New Term Loan B3 | |
| 10.72% (1 Month SOFR + 5.25%), due 1/31/28 | 300,000 | 285,000 |
| Second Lien New Term Loan B4 | |
| 10.72% (1 Month SOFR + 5.25%), due 1/20/29 | 2,500,000 | 2,353,573 |
| | Principal
Amount | Value |
| |
| Insurance (continued) |
| Broadstreet Partners, Inc. (b) | |
| 2020 Initial Term Loan | |
| 8.47% (1 Month SOFR + 3.00%), due 1/27/27 | $ 2,464,341 | $ 2,461,839 |
| Tranche Term Loan B2 | |
| 8.72% (1 Month SOFR + 3.25%), due 1/27/27 | 684,250 | 683,573 |
| Initial Term Loan B | |
| 9.098% (1 Month SOFR + 3.75%), due 1/27/29 | 498,750 | 499,339 |
| Hub International Ltd. (b) | |
| 2022 Incremental Term Loan | |
| 9.369% (3 Month SOFR + 4.00%), due 11/10/29 | 356,400 | 357,551 |
| 2023 Refinancing Term Loan | |
| 9.662% (3 Month SOFR + 4.25%), due 6/20/30 | 2,394,000 | 2,403,476 |
| NFP Corp. | |
| Closing Date Term Loan | |
| 8.72% (1 Month SOFR + 3.25%), due 2/16/27 (b) | 1,890,016 | 1,898,678 |
| Ryan Specialty Group LLC | |
| Initial Term Loan | |
| 8.456% (1 Month SOFR + 3.00%), due 9/1/27 (b) | 967,500 | 965,686 |
| Sedgwick Claims Management Services, Inc. | |
| 2023 Term Loan | |
| 9.106% (1 Month SOFR + 3.75%), due 2/24/28 (b) | 3,830,894 | 3,840,471 |
| USI, Inc. | |
| Term Loan | |
| 8.348%, due 11/22/29 | 2,821,500 | 2,826,204 |
| | | 34,923,040 |
| Leisure, Amusement, Motion Pictures & Entertainment 1.3% |
| Bombardier Recreational Products, Inc. | |
| 2023 Replacement Term Loan | |
| 8.106% (1 Month SOFR + 2.75%), due 12/13/29 (b) | $ 2,962,613 | 2,960,761 |
| Creative Artists Agency LLC | |
| Term Loan B | |
| 8.856% (1 Month SOFR + 3.50%), due 11/27/28 (b) | 3,374,509 | 3,385,756 |
| Lions Gate Capital Holdings LLC | |
| Term Loan B | |
| 7.706% (1 Month SOFR + 2.25%), due 3/24/25 (b) | 988,228 | 984,699 |
| Marriott Ownership Resorts, Inc. | |
| 2019 Refinancing Term Loan | |
| 7.206% (1 Month SOFR + 1.75%), due 8/29/25 (b) | 1,313,765 | 1,313,436 |
The notes to the financial statements are an integral part of, and should be read in conjunction with, the financial statements.
| 24 | MainStay VP Floating Rate Portfolio |
| | Principal
Amount | Value |
| Loan Assignments (continued) |
| Leisure, Amusement, Motion Pictures & Entertainment (continued) |
| William Morris Endeavor Entertainment LLC (IMG Worldwide Holdings LLC) | |
| First Lien Term Loan B1 | |
| 8.22% (1 Month SOFR + 2.75%), due 5/18/25 (b) | $ 2,108,400 | $ 2,107,346 |
| | | 10,751,998 |
| Machinery (Non-Agriculture, Non-Construct & Non-Electronic) 0.4% |
| Advanced Drainage Systems, Inc. | |
| Initial Term Loan | |
| 7.693% (1 Month SOFR + 2.25%), due 7/31/26 (b) | 452,143 | 455,421 |
| Columbus McKinnon Corp. | |
| Initial Term Loan | |
| 8.389% (3 Month SOFR + 2.75%), due 5/14/28 (b) | 1,220,852 | 1,222,378 |
| Husky Injection Molding Systems Ltd. | |
| Initial Term Loan | |
| 8.47% (1 Month SOFR + 3.00%), due 3/28/25 (b) | 1,767,183 | 1,764,154 |
| | | 3,441,953 |
| Manufacturing 3.0% |
| ASP Blade Holdings, Inc. | |
| Initial Term Loan | |
| 9.61% (3 Month SOFR + 4.00%), due 10/13/28 (b) | 1,471,765 | 1,310,177 |
| Chart Industries, Inc. | |
| Amendment No. 5 Term Loan | |
| 8.691% (1 Month SOFR + 3.25%), due 3/15/30 (b) | 1,952,570 | 1,957,452 |
| Coherent Corp. | |
| Initial Term Loan B | |
| 8.22% (1 Month SOFR + 2.75%), due 7/2/29 (b) | 2,438,292 | 2,442,357 |
| CP Atlas Buyer, Inc. | |
| Term Loan B | |
| 9.206% (1 Month SOFR + 3.75%), due 11/23/27 (b) | 2,298,349 | 2,256,691 |
| CPG International LLC | |
| Closing Date Term Loan | |
| 7.956% (1 Month SOFR + 2.50%), due 4/28/29 (b) | 1,234,375 | 1,233,758 |
| EMRLD Borrower LP | |
| Initial Term Loan B | |
| 8.356% (1 Month SOFR + 3.00%), due 5/31/30 (b) | 6,193,766 | 6,207,039 |
| FCG Acquisitions, Inc. | |
| First Lien Initial Term Loan | |
| 9.22% (1 Month SOFR + 3.75%), due 3/31/28 (b) | 1,469,940 | 1,469,205 |
| | Principal
Amount | Value |
| |
| Manufacturing (continued) |
| LSF12 Badger Bidco LLC | |
| Initial Term Loan | |
| 11.356% (1 Month SOFR + 6.00%), due 8/30/30 (b) | $ 1,250,000 | $ 1,246,875 |
| Madison IAQ LLC | |
| Term Loan | |
| 8.721% (1 Month LIBOR + 3.25%), due 6/21/28 (b) | 2,306,900 | 2,295,077 |
| Pro Mach Group, Inc. | |
| First Lien Closing Date Initial Term Loan | |
| 9.47% (1 Month SOFR + 4.00%), due 8/31/28 (b) | 2,757,036 | 2,762,550 |
| Standard Building Solutions, Inc. | |
| Initial Term Loan | |
| 7.721% (1 Month SOFR + 2.25%), due 9/22/28 (b) | 1,036,704 | 1,038,092 |
| Summit Materials LLC | |
| Incremental Cov-Lite Term Loan B | |
| TBD, due 11/30/28 | 1,000,000 | 1,001,250 |
| Zurn LLC | |
| First Lien Term Loan B | |
| 7.47% (1 Month SOFR + 2.00%), due 10/4/28 (b) | 742,398 | 744,975 |
| | | 25,965,498 |
| Media 1.8% |
| Apple Bidco LLC (b) | |
| First Lien Initial Term Loan | |
| 8.22% (1 Month SOFR + 2.75%), due 9/22/28 | 2,322,600 | 2,317,518 |
| First Lien Amendment No. 3 Term Loan | |
| 8.856% (1 Month SOFR + 3.50%), due 9/22/28 | 742,514 | 744,834 |
| Cogeco Communications Finance LP | |
| Incremental Term Loan | |
| 7.97% (1 Month SOFR + 2.50%), due 9/1/28 (b) | 2,740,643 | 2,697,821 |
| Diamond Sports Group LLC | |
| Second Lien Term Loan | |
| 10.708% (1 Month SOFR + 5.25%), due 8/24/26 (b)(f)(g) | 2,898,312 | 123,178 |
| Directv Financing LLC | |
| Closing Date Term Loan | |
| 10.65% (3 Month SOFR + 5.00%), due 8/2/27 (b) | 2,427,535 | 2,429,962 |
| Mission Broadcasting, Inc. | |
| Term Loan B4 | |
| 7.97% (1 Month SOFR + 2.50%), due 6/2/28 (b) | 585,000 | 584,123 |
| Radiate Holdco LLC | |
| Amendment No. 6 Term Loan B | |
| 8.72% (1 Month SOFR + 3.25%), due 9/25/26 (b) | 2,023,346 | 1,618,396 |
The notes to the financial statements are an integral part of, and should be read in conjunction with, the financial statements.
25
Portfolio of Investments December 31, 2023†^ (continued)
| | Principal
Amount | Value |
| Loan Assignments (continued) |
| Media (continued) |
| Sinclair Television Group, Inc. | |
| Term Loan B4 | |
| 9.206% (1 Month SOFR + 3.75%), due 4/21/29 (b) | $ 1,970,000 | $ 1,598,777 |
| Virgin Media Bristol LLC | |
| Facility Term Loan Y | |
| 8.79% (6 Month SOFR + 3.25%), due 3/31/31 (b) | 3,666,667 | 3,649,096 |
| | | 15,763,705 |
| Mining, Steel, Iron & Non-Precious Metals 1.4% |
| American Rock Salt Co. LLC | |
| First Lien Initial Term Loan | |
| 9.47% (1 Month SOFR + 4.00%), due 6/9/28 (b) | 1,225,714 | 1,152,171 |
| Arsenal AIC Parent LLC | |
| Term Loan B | |
| 9.856% (1 Month SOFR + 4.50%), due 8/18/30 (b) | 1,710,000 | 1,714,275 |
| Gates Global LLC (b) | |
| Initial Dollar Term Loan B3 | |
| 7.956% (1 Month SOFR + 2.50%), due 3/31/27 | 2,869,775 | 2,872,384 |
| Initial Dollar Term Loan B4 | |
| 8.356% (1 Month SOFR + 3.00%), due 11/16/29 | 1,975,000 | 1,979,937 |
| MRC Global (U.S.), Inc. | |
| 2018 Refinancing Term Loan | |
| 8.47% (1 Month LIBOR + 3.00%), due 9/20/24 (b) | 1,035,027 | 1,035,027 |
| U.S. Silica Co. | |
| Term Loan | |
| 10.106% (1 Month SOFR + 4.75%), due 3/25/30 (b) | 2,896,614 | 2,898,062 |
| | | 11,651,856 |
| Oil & Gas 1.7% |
| Buckeye Partners LP (b) | |
| 2021 Tranche Term Loan B1 | |
| 7.706% (1 Month SOFR + 2.25%), due 11/1/26 | 865,414 | 866,994 |
| 2023 Tranche Term Loan B2 | |
| 7.856% (1 Month SOFR + 2.50%), due 11/22/30 | 458,333 | 459,479 |
| ChampionX Corp. | |
| Term Loan B2 | |
| 8.206% (1 Month SOFR + 2.75%), due 6/7/29 (b) | 1,485,028 | 1,488,741 |
| DT Midstream, Inc. | |
| Initial Term Loan | |
| 7.47% (1 Month SOFR + 2.00%), due 6/26/28 (b) | 319,462 | 320,461 |
| | Principal
Amount | Value |
| |
| Oil & Gas (continued) |
| Fleet Midco I Ltd. | |
| Facility Term Loan B | |
| 8.47% (1 Month LIBOR + 3.00%), due 10/7/26 (b) | $ 1,196,875 | $ 1,196,875 |
| GIP III Stetson I LP | |
| 2023 Initial Term Loan | |
| 9.706% (1 Month SOFR + 4.25%), due 10/31/28 (b) | 1,226,489 | 1,226,488 |
| GIP Pilot Acquisition Partners LP | |
| Initial Term Loan | |
| 8.388% (3 Month SOFR + 3.00%), due 10/4/30 (b) | 1,363,636 | 1,363,636 |
| Medallion Midland Acquisition LP | |
| 2023 Repricing Term Loan | |
| 8.864% (3 Month SOFR + 3.50%), due 10/18/28 (b) | 1,559,819 | 1,563,719 |
| Murphy Oil USA, Inc. | |
| Tranche Term Loan B | |
| 7.205% (1 Month SOFR + 1.75%), due 1/31/28 (b) | $ 438,750 | 439,847 |
| NorthRiver Midstream Finance LP | |
| First Lien Initial Term Loan B | |
| 8.395% (3 Month SOFR + 3.00%), due 8/16/30 (b) | 432,598 | 433,139 |
| Oryx Midstream Services Permian Basin LLC | |
| 2023 Incremental Term Loan | |
| 8.71% (1 Month SOFR + 3.25%), due 10/5/28 (b) | 1,960,157 | 1,963,097 |
| Prairie ECI Acquiror LP | |
| Initial Term Loan | |
| 10.206% (1 Month SOFR + 4.75%), due 3/11/26 (b) | 1,182,320 | 1,182,185 |
| TransMontaigne Operating Co. LP | |
| Tranche Term Loan B | |
| 8.97% (1 Month SOFR + 3.50%), due 11/17/28 (b) | 494,949 | 492,990 |
| Traverse Midstream Partners LLC | |
| Advance Term Loan | |
| 9.24% (3 Month SOFR + 3.75%), due 2/16/28 (b) | 1,059,501 | 1,058,507 |
| Veritas U.S., Inc. | |
| Dollar 2021 Term Loan B | |
| 10.47% (1 Month SOFR + 5.00%), due 9/1/25 (b) | 1,169,849 | 964,541 |
| | | 15,020,699 |
| Packaging 0.3% |
| LABL, Inc. | |
| Initial Dollar Term Loan | |
| 10.456% (1 Month SOFR + 5.00%), due 10/29/28 (b) | 1,470,000 | 1,406,974 |
The notes to the financial statements are an integral part of, and should be read in conjunction with, the financial statements.
| 26 | MainStay VP Floating Rate Portfolio |
| | Principal
Amount | Value |
| Loan Assignments (continued) |
| Packaging (continued) |
| Plastipak Holdings, Inc. | |
| 2021 Tranche Term Loan B | |
| 7.956% (1 Month SOFR + 2.50%), due 12/1/28 (b) | $ 950,588 | $ 949,909 |
| | | 2,356,883 |
| Personal & Nondurable Consumer Products 1.5% |
| ABG Intermediate Holdings 2 LLC | |
| First Lien Tranche Term Loan B1 | |
| 8.956% (1 Month SOFR + 3.50%), due 12/21/28 (b) | 2,839,275 | 2,848,148 |
| Foundation Building Materials, Inc. | |
| First Lien Initial Term Loan | |
| 8.895% (3 Month SOFR + 3.25%), due 1/31/28 (b) | 1,721,098 | 1,712,850 |
| Hunter Douglas Holding BV | |
| Tranche Term Loan B1 | |
| 8.88% (3 Month SOFR + 3.50%), due 2/26/29 (b) | 2,955,000 | 2,941,147 |
| Leslie's Poolmart, Inc. | |
| Initial Term Loan | |
| 8.22% (1 Month SOFR + 2.75%), due 3/9/28 (b) | 1,945,000 | 1,913,934 |
| Michaels Cos., Inc. (The) | |
| Term Loan B | |
| 9.86% (3 Month SOFR + 4.25%), due 4/15/28 (b) | 3,120,000 | 2,589,600 |
| Perrigo Co. plc | |
| Initial Term Loan B | |
| 7.706% (1 Month SOFR + 2.25%), due 4/20/29 (b) | 992,462 | 988,431 |
| Prestige Brands, Inc. | |
| Term Loan B5 | |
| 7.47% (1 Month SOFR + 2.00%), due 7/3/28 (b) | 315,000 | 315,731 |
| | | 13,309,841 |
| Personal & Nondurable Consumer Products (Manufacturing Only) 0.6% |
| American Builders & Contractors Supply Co., Inc. | |
| Restatement Effective Date Term Loan | |
| 7.456% (1 Month SOFR + 2.00%), due 1/15/27 (b) | 1,665,953 | 1,668,414 |
| Hercules Achievement, Inc. | |
| First Lien Third Amendment Extended Term Loan | |
| 10.47% (1 Month SOFR + 5.00%), due 12/15/26 (b) | 1,881,088 | 1,868,156 |
| SRAM LLC | |
| Initial Term Loan 8.22% - 10.25% | |
| (1 Month SOFR + 2.75%, 3 Month SOFR + 1.75%), due 5/18/28 (b) | 1,990,909 | 1,987,590 |
| | | 5,524,160 |
| | Principal
Amount | Value |
| |
| Personal Transportation 0.1% |
| Uber Technologies, Inc. | |
| 2023 Refinancing Term Loan | |
| 8.135% (3 Month SOFR + 2.75%), due 3/3/30 (b) | $ 1,199,057 | $ 1,201,388 |
| Personal, Food & Miscellaneous Services 1.4% |
| 1011778 B.C. Unlimited Liability Co. | |
| Term Loan B5 | |
| 7.606% (1 Month SOFR + 2.25%), due 9/23/30 (b) | 2,110,185 | 2,109,432 |
| Aramark Intermediate HoldCo Corp. (b) | |
| U.S. Term Loan B5 | |
| 7.97% (1 Month SOFR + 2.50%), due 4/6/28 | 1,402,972 | 1,402,847 |
| U.S. Term Loan B6 | |
| 7.97% (1 Month SOFR + 2.50%), due 6/22/30 | 1,430,788 | 1,432,354 |
| Hayward Industries, Inc. | |
| First Lien Refinancing Term Loan | |
| 8.22% (1 Month SOFR + 2.75%), due 5/30/28 (b) | 1,737,634 | 1,734,593 |
| Hillman Group, Inc. (The) | |
| Initial Term Loan | |
| 8.22% (1 Month SOFR + 2.75%), due 7/14/28 (b) | 486,431 | 486,778 |
| IRB Holding Corp. | |
| 2022 Replacement Term Loan B | |
| 8.456% (1 Month SOFR + 3.00%), due 12/15/27 (b) | 3,657,794 | 3,659,871 |
| KFC Holding Co. | |
| 2021 Term Loan B | |
| 7.223% (1 Month SOFR + 1.75%), due 3/15/28 (b) | 1,434,492 | 1,433,468 |
| | | 12,259,343 |
| Pharmaceuticals 0.1% |
| Padagis LLC | |
| Term Loan B | |
| 10.434% (3 Month SOFR + 4.75%), due 7/6/28 (b) | 1,129,412 | 1,089,882 |
| Printing & Publishing 0.3% |
| Getty Images, Inc. | |
| Initial Dollar Term Loan | |
| 9.948% (3 Month SOFR + 4.50%), due 2/19/26 (b) | 931,631 | 934,542 |
| Severin Acquisition LLC | |
| First Lien Initial Term Loan | |
| 8.633% (3 Month SOFR + 3.25%), due 8/1/27 (b) | 1,914,868 | 1,917,262 |
| | | 2,851,804 |
The notes to the financial statements are an integral part of, and should be read in conjunction with, the financial statements.
27
Portfolio of Investments December 31, 2023†^ (continued)
| | Principal
Amount | Value |
| Loan Assignments (continued) |
| Real Estate 0.2% |
| RHP Hotel Properties LP | |
| Tranche Term Loan B | |
| 8.106% (1 Month SOFR + 2.75%), due 5/18/30 (b) | $ 1,323,333 | $ 1,323,885 |
| Retail 0.4% |
| Great Outdoors Group LLC | |
| Term Loan B2 | |
| 9.22% (1 Month SOFR + 3.75%), due 3/6/28 (b) | 3,795,539 | 3,792,149 |
| Retail Store 0.7% |
| Harbor Freight Tools USA, Inc. | |
| 2021 Initial Term Loan | |
| 8.22% (1 Month SOFR + 2.75%), due 10/19/27 (b) | 2,716,195 | 2,710,640 |
| PetSmart LLC | |
| Initial Term Loan | |
| 9.206% (1 Month SOFR + 3.75%), due 2/11/28 (b) | 1,616,596 | 1,596,389 |
| White Cap Supply Holdings LLC | |
| Initial Closing Date Term Loan | |
| 9.106% (1 Month SOFR + 3.75%), due 10/19/27 (b) | 1,942,875 | 1,946,518 |
| | | 6,253,547 |
| Services: Business 4.9% |
| Ascensus Group Holdings, Inc. | |
| First Lien Initial Term Loan | |
| 8.97% (1 Month SOFR + 3.50%), due 8/2/28 (b) | 4,097,811 | 4,086,288 |
| Brown Group Holdings LLC (b) | |
| Incremental Facility Term Loan B2 9.106% - 9.138% | |
| (1 Month SOFR + 3.75%, 3 Month SOFR + 3.75%), due 7/2/29 | 1,032,988 | 1,035,755 |
| Initial Term Loan | |
| 8.206% (1 Month SOFR + 2.75%), due 6/7/28 | 1,139,852 | 1,139,751 |
| Charlotte Buyer, Inc. | |
| First Lien Initial Term Loan B | |
| 10.607% (1 Month SOFR + 5.25%), due 2/11/28 (b) | 1,460,667 | 1,465,361 |
| ConnectWise LLC | |
| Initial Term Loan | |
| 8.97% (1 Month SOFR + 3.50%), due 9/29/28 (b) | 1,372,000 | 1,363,768 |
| Dun & Bradstreet Corp. (The) (b) | |
| Refinancing Term Loan | |
| 8.205% (1 Month SOFR + 2.75%), due 2/6/26 | 2,785,156 | 2,789,072 |
| | Principal
Amount | Value |
| |
| Services: Business (continued) |
| Dun & Bradstreet Corp. (The) (b) (continued) | |
| 2022 Incremental Term Loan B2 | |
| 8.355% (1 Month SOFR + 3.00%), due 1/18/29 | $ 294,750 | $ 295,241 |
| Electron Bidco, Inc. | |
| First Lien Initial Term Loan | |
| 8.47% (1 Month SOFR + 3.00%), due 11/1/28 (b) | 3,607,425 | 3,612,497 |
| Fortrea Holdings, Inc. | |
| Initial Term Loan B | |
| 9.106% (1 Month SOFR + 3.75%), due 7/1/30 (b) | 1,243,750 | 1,241,029 |
| GIP II Blue Holding LP | |
| Initial Term Loan | |
| 9.97% (1 Month SOFR + 4.50%), due 9/29/28 (b) | 2,022,405 | 2,029,989 |
| Hunter Holdco 3 Ltd. | |
| First Lien Initial Dollar Term Loan | |
| 9.698% (3 Month SOFR + 4.25%), due 8/19/28 (b) | 3,033,000 | 3,017,835 |
| ICON plc (b) | |
| Lux Term Loan | |
| 7.86% (3 Month SOFR + 2.25%), due 7/3/28 | 1,179,845 | 1,183,451 |
| U.S. Term Loan | |
| 7.86% (3 Month SOFR + 2.25%), due 7/3/28 | 293,959 | 294,858 |
| Mitchell International, Inc. (b) | |
| First Lien Initial Term Loan | |
| 9.40% (3 Month SOFR + 3.75%), due 10/15/28 | 1,965,000 | 1,963,035 |
| Second Lien Initial Term Loan | |
| 12.15% (3 Month SOFR + 6.50%), due 10/15/29 | 1,200,000 | 1,175,000 |
| MPH Acquisition Holdings LLC | |
| Initial Term Loan | |
| 9.90% (3 Month SOFR + 4.25%), due 9/1/28 (b) | 2,443,750 | 2,347,310 |
| Nielsen Consumer, Inc. | |
| 2021 Refinancing Dollar Term Loan | |
| 9.106% (1 Month SOFR + 3.75%), due 3/6/28 (b) | 1,458,919 | 1,393,267 |
| Orbit Private Holdings I Ltd. | |
| First Lien Initial Dollar Term Loan | |
| 9.934% (6 Month SOFR + 4.50%), due 12/11/28 (b) | 494,949 | 495,568 |
| Parexel International, Inc. | |
| First Lien Initial Term Loan | |
| 8.72% (1 Month SOFR + 3.25%), due 11/15/28 (b) | 2,463,674 | 2,472,913 |
The notes to the financial statements are an integral part of, and should be read in conjunction with, the financial statements.
| 28 | MainStay VP Floating Rate Portfolio |
| | Principal
Amount | Value |
| Loan Assignments (continued) |
| Services: Business (continued) |
| PECF USS Intermediate Holding III Corp. | |
| Initial Term Loan | |
| 9.895% (3 Month SOFR + 4.25%), due 12/15/28 (b) | $ 2,449,907 | $ 1,895,615 |
| Polaris Newco LLC | |
| First Lien Dollar Term Loan | |
| 9.47% (1 Month SOFR + 4.00%), due 6/2/28 (b) | 2,436,307 | 2,400,474 |
| Project Boost Purchaser LLC | |
| 2021 Tranche Term Loan 2 | |
| 8.97% (1 Month SOFR + 3.50%), due 5/30/26 (b) | 1,132,765 | 1,131,821 |
| Prometric Holdings, Inc. | |
| First Lien Initial Term Loan | |
| 10.72% (1 Month SOFR + 5.25%), due 1/31/28 (b) | 1,617,647 | 1,614,412 |
| Ryan LLC | |
| Closing Date Initial Term Loan | |
| 9.856% (1 Month SOFR + 4.50%), due 11/14/30 (b) | 814,286 | 816,321 |
| Vizient, Inc. | |
| Term Loan B7 | |
| 7.706% (1 Month SOFR + 2.25%), due 5/16/29 (b) | 738,750 | 739,674 |
| | | 42,000,305 |
| Services: Consumer 0.1% |
| West Technology Group LLC | |
| Term Loan B3 | |
| 9.633% (3 Month SOFR + 4.00%), due 4/10/27 (b) | 406,838 | 386,496 |
| Software 3.6% |
| AppLovin Corp. | |
| Amendment No. 6 New Term Loan | |
| 8.556% (1 Month SOFR + 3.10%), due 10/25/28 (b) | 1,179,000 | 1,179,737 |
| Cloud Software Group, Inc. | |
| First Lien Dollar Term Loan B | |
| 9.948% (3 Month SOFR + 4.50%), due 3/30/29 (b) | 2,086,723 | 2,039,771 |
| Cloudera, Inc. | |
| Delayed Term Loan | |
| 9.198% (1 Month SOFR + 3.75%), due 10/8/28 (b) | 1,500,000 | 1,483,751 |
| Cornerstone OnDemand, Inc. | |
| First Lien Initial Term Loan | |
| 9.22% (1 Month SOFR + 3.75%), due 10/16/28 (b) | 1,842,187 | 1,784,619 |
| | Principal
Amount | Value |
| |
| Software (continued) |
| Gen Digital, Inc. | |
| Tranche Initial Term Loan B | |
| 7.456% (1 Month SOFR + 2.00%), due 9/12/29 (b) | $ 3,911,841 | $ 3,912,542 |
| Informatica LLC | |
| Initial Term Loan | |
| 8.22% (1 Month SOFR + 2.75%), due 10/27/28 (b) | 1,915,776 | 1,918,170 |
| ISolved, Inc. | |
| Closing Date Term Loan | |
| 9.484% (6 Month SOFR + 4.00%), due 10/15/30 (b) | 588,235 | 588,235 |
| Magenta Buyer LLC | |
| First Lien Initial Term Loan | |
| 10.645% (3 Month SOFR + 5.00%), due 7/27/28 (b) | 686,000 | 476,770 |
| McAfee Corp. | |
| Tranche Term Loan B1 | |
| 9.193% (1 Month SOFR + 3.75%), due 3/1/29 (b) | 3,932,557 | 3,903,063 |
| Mitnick Corp. Purchaser, Inc. | |
| Initial Term Loan | |
| 9.983% (3 Month SOFR + 4.50%), due 5/2/29 (b) | 1,975,000 | 1,862,672 |
| Precisely Software, Inc. | |
| First Lien Third Incremental Term Loan | |
| 9.64% (3 Month SOFR + 4.00%), due 4/24/28 (b) | 1,629,167 | 1,611,518 |
| Quartz AcquireCo LLC | |
| Term Loan | |
| 8.856% (1 Month SOFR + 3.50%), due 6/28/30 (b) | 1,246,875 | 1,249,992 |
| Quest Software U.S. Holdins, Inc. | |
| First Lien Initial Term Loan | |
| 9.783% (3 Month SOFR + 4.25%), due 2/1/29 (b) | 2,777,344 | 2,122,932 |
| Sophia LP | |
| First Lien Term Loan B | |
| 8.956% (1 Month SOFR + 3.50%), due 10/7/27 (b) | 666,325 | 667,158 |
| Sovos Compliance LLC | |
| First Lien Initial Term Loan | |
| 9.97% (1 Month SOFR + 4.50%), due 8/11/28 (b) | 490,368 | 484,852 |
| UKG, Inc. (b) | |
| First Lien 2021-2 Incremental Term Loan | |
| 8.764% (3 Month SOFR + 3.25%), due 5/4/26 | 3,823,532 | 3,830,051 |
| First Lien Initial Term Loan | |
| 9.233% (3 Month SOFR + 3.75%), due 5/4/26 | 1,675,625 | 1,679,115 |
The notes to the financial statements are an integral part of, and should be read in conjunction with, the financial statements.
29
Portfolio of Investments December 31, 2023†^ (continued)
| | Principal
Amount | Value |
| Loan Assignments (continued) |
| Software (continued) |
| UKG, Inc. (b) (continued) | |
| Second Lien 2021 Incremental Term Loan | |
| 10.764% (3 Month SOFR + 5.25%), due 5/3/27 | $ 200,000 | $ 200,083 |
| | | 30,995,031 |
| Telecommunications 2.9% |
| Avaya, Inc. | |
| Initial Term Loan | |
| 13.856% (7.00% PIK) (1 Month SOFR + 8.50%), due 8/1/28 (b)(e) | 121,994 | 106,806 |
| Azalea TopCo, Inc. | |
| First Lien Initial Term Loan | |
| 8.97% (1 Month SOFR + 3.50%), due 7/24/26 (b) | 2,393,750 | 2,366,820 |
| Cablevision Lightpath LLC | |
| Initial Term Loan | |
| 8.726% (1 Month SOFR + 3.25%), due 11/30/27 (b) | 1,462,312 | 1,456,828 |
| Connect Finco SARL | |
| Amendement No.1 Refinancing Term Loan | |
| 8.856% (1 Month SOFR + 3.50%), due 12/11/26 (b) | 3,879,495 | 3,876,803 |
| CSC Holdings LLC | |
| September 2019 Initial Term Loan | |
| 7.976% (1 Month LIBOR + 2.50%), due 4/15/27 (b) | 3,561,852 | 3,361,497 |
| Cyxtera DC Holdings, Inc. (b) | |
| First Lien Initial Term Loan | |
| 10.50% (3 Month SOFR + 2.00%), due 5/1/24 (c)(g) | 942,500 | 578,224 |
| Initial Term Loan | |
| 13.974% (1 Month SOFR + 8.50%), due 1/5/24 | 1,064,353 | 1,065,018 |
| Frontier Communications Holdings LLC | |
| Term Loan B | |
| 9.22% (1 Month SOFR + 3.75%), due 10/8/27 (b) | 2,090,875 | 2,060,557 |
| Gogo Intermediate Holdings LLC | |
| Initial Term Loan | |
| 9.22% (1 Month SOFR + 3.75%), due 4/30/28 (b) | 2,513,305 | 2,514,652 |
| Iridium Satellite LLC | |
| Term Loan B3 | |
| 7.856% (1 Month SOFR + 2.50%), due 9/20/30 (b) | 500,000 | 500,938 |
| Lumen Technologies, Inc. | |
| Term Loan B | |
| 7.72% (1 Month SOFR + 2.25%), due 3/15/27 (b) | 2,129,632 | 1,437,502 |
| | Principal
Amount | Value |
| |
| Telecommunications (continued) |
| Redstone HoldCo 2 LP | |
| First Lien Initial Term Loan | |
| 10.22% (1 Month SOFR + 4.75%), due 4/27/28 (b) | $ 915,766 | $ 687,110 |
| SBA Senior Finance II LLC | |
| Initial Term Loan | |
| 7.21% (1 Month SOFR + 1.75%), due 4/11/25 (b) | 1,734,695 | 1,736,382 |
| Telesat Canada | |
| Term Loan B5 | |
| 8.40% (3 Month SOFR + 2.75%), due 12/7/26 (b) | 1,220,447 | 780,069 |
| Zayo Group Holdings, Inc. | |
| Initial Dollar Term Loan | |
| 8.47% (1 Month SOFR + 3.00%), due 3/9/27 (b) | 3,348,136 | 2,866,841 |
| | | 25,396,047 |
| Utilities 1.8% |
| Astoria Energy LLC | |
| 2020 Advance Term Loan B | |
| 8.97% (1 Month SOFR + 3.50%), due 12/10/27 (b) | 622,732 | 624,202 |
| Brookfield WEC Holdings, Inc. (b) | |
| First Lien 2021 Initial Term Loan | |
| 8.22% (1 Month SOFR + 2.75%), due 8/1/25 | 1,861,861 | 1,865,451 |
| Initial Term Loan | |
| 9.106% (1 Month SOFR + 3.75%), due 8/1/25 | 1,152,083 | 1,155,273 |
| Calpine Corp. | |
| 2019 Term Loan | |
| 7.47% (1 Month SOFR + 2.00%), due 4/5/26 (b) | 3,008,250 | 3,012,762 |
| Constellation Renewables LLC | |
| Term Loan | |
| 8.15% (3 Month SOFR + 2.50%), due 12/15/27 (b) | 1,312,749 | 1,311,108 |
| Edgewater Generation LLC | |
| Term Loan | |
| 9.22% (1 Month SOFR + 3.75%), due 12/13/25 (b) | 2,999,395 | 2,939,407 |
| Granite Generation LLC | |
| Term Loan | |
| 9.22% (1 Month SOFR + 3.75%), due 11/9/26 (b) | 2,900,001 | 2,888,320 |
| Hamilton Projects Acquiror LLC | |
| Term Loan | |
| 9.97% (1 Month SOFR + 4.50%), due 6/17/27 (b) | 1,926,861 | 1,932,366 |
| | | 15,728,889 |
The notes to the financial statements are an integral part of, and should be read in conjunction with, the financial statements.
| 30 | MainStay VP Floating Rate Portfolio |
| | Principal
Amount | Value |
| Loan Assignments (continued) |
| Water 0.3% |
| Osmosis Buyer Ltd. | |
| 2022 Refinanciang Term Loan B | |
| 9.093% (1 Month SOFR + 3.75%), due 7/31/28 (b) | $ 2,364,000 | $ 2,362,523 |
Total Loan Assignments
(Cost $742,618,955) | | 729,390,866 |
Total Long-Term Bonds
(Cost $802,337,473) | | 788,157,268 |
| |
| | Shares | |
| |
| Affiliated Investment Company 0.2% |
| Fixed Income Fund 0.2% | | |
| MainStay MacKay High Yield Corporate Bond Fund Class I | 436,571 | 2,255,018 |
Total Affiliated Investment Company
(Cost $2,445,688) | | 2,255,018 |
| Common Stocks 0.1% |
| Automobile Components 0.0% ‡ |
| Millennium Corporate Trust (c)(d)(h) | 1,243 | — |
| Millennium Industries Corp. (c)(d)(h) | 1,324 | — |
| | | — |
| Communications Equipment 0.0% ‡ |
| Avaya, Inc. (c)(h) | 12,043 | 78,280 |
| Financial Services 0.0% ‡ |
| New Topco Shares, Class A (c)(d)(h) | 405,109 | — |
| Health Care Equipment & Supplies 0.0% ‡ |
| Carestream Equity (c)(d)(h) | 3,656 | 37 |
| Health Care Providers & Services 0.0% ‡ |
| Mallinckrodt International Corp. (c)(d)(h) | 5,706 | 216,828 |
| Household Durables 0.0% ‡ |
| SSB Equipment Co., Inc. (c)(d)(h) | 735 | — |
| Independent Power and Renewable Electricity Producers 0.0% ‡ |
| Sempra Texas Holdings Corp. (c)(d)(h) | 94,456 | — |
| Machinery 0.0% ‡ |
| Ameriforge Group, Inc. (c)(d)(h) | 45,694 | 44,323 |
| Specialty Retail 0.0% ‡ |
| Serta Simmons Bedding, Inc. (c)(h) | 735 | 4,318 |
| | Shares | | Value |
| |
| Technology Hardware, Storage & Peripherals 0.1% |
| Diebold Nixdorf, Inc. (h) | 8,023 | | $ 232,266 |
Total Common Stocks
(Cost $2,248,714) | | | 576,052 |
| |
| | Number of
Rights | | |
| |
| Rights 0.0% ‡ |
| Independent Power and Renewable Electricity Producers 0.0% ‡ |
| Vistra Corp. Expires 12/31/46 (c)(d)(h) | 57,684 | | 86,353 |
Total Rights
(Cost $47,301) | | | 86,353 |
| |
| | Number of
Warrants | | |
| |
| Warrants 0.0% ‡ |
| Capital Markets 0.0% ‡ |
| THAIHOT Investment Co. Ltd. | | | |
| Expires 10/13/27 (c)(d)(h)(i) | 22 | | 0 |
Total Warrants
(Cost $0) | | | 0 |
| |
| | Principal
Amount | | |
| |
| Short-Term Investments 8.0% |
| U.S. Treasury Debt 8.0% |
| U.S. Treasury Bills (j) | | | |
| 5.248%, due 1/16/24 | $ 29,843,000 | | 29,781,984 |
| 5.282%, due 1/23/24 | 1,362,000 | | 1,357,814 |
| 5.289%, due 1/9/24 | 3,088,000 | | 3,084,851 |
| 5.292%, due 1/2/24 | 28,406,000 | | 28,406,000 |
| 5.293%, due 1/18/24 | 1,500,000 | | 1,496,479 |
| 5.306%, due 2/6/24 | 5,013,000 | | 4,987,269 |
Total Short-Term Investments
(Cost $69,104,733) | | | 69,114,397 |
Total Investments
(Cost $876,183,909) | 99.6% | | 860,189,088 |
| Other Assets, Less Liabilities | 0.4 | | 3,187,676 |
| Net Assets | 100.0% | | $ 863,376,764 |
| † | Percentages indicated are based on Portfolio net assets. |
| ^ | Industry classifications may be different than those used for compliance monitoring purposes. |
| ‡ | Less than one-tenth of a percent. |
| (a) | May be sold to institutional investors only under Rule 144A or securities offered pursuant to Section 4(a)(2) of the Securities Act of 1933, as amended. |
| (b) | Floating rate—Rate shown was the rate in effect as of December 31, 2023. |
| (c) | Illiquid security—As of December 31, 2023, the total market value deemed illiquid under procedures approved by the Board of Trustees was $5,033,702, which represented 0.6% of the Portfolio’s net assets. (Unaudited) |
The notes to the financial statements are an integral part of, and should be read in conjunction with, the financial statements.
31
Portfolio of Investments December 31, 2023†^ (continued)
| (d) | Security in which significant unobservable inputs (Level 3) were used in determining fair value. |
| (e) | PIK ("Payment-in-Kind")—issuer may pay interest or dividends with additional securities and/or in cash. |
| (f) | Issue in non-accrual status. |
| (g) | Issue in default. |
| (h) | Non-income producing security. |
| (i) | Less than $1. |
| (j) | Interest rate shown represents yield to maturity. |
Investments in Affiliates (in 000's)
Investments in issuers considered to be affiliate(s) of the Portfolio during the year ended December 31, 2023 for purposes of Section 2(a)(3) of the Investment Company Act of 1940, as amended, were as follows:
| Affiliated Investment Companies | Value,
Beginning
of Year | Purchases
at Cost | Proceeds
from
Sales | Net
Realized
Gain/(Loss)
on Sales | Change in
Unrealized
Appreciation/
(Depreciation) | Value,
End of
Year | Dividend
Income | Other
Distributions | Shares
End of
Year |
| MainStay MacKay High Yield Corporate Bond Fund Class I | $ 2,142 | $ — | $ — | $ — | $ 113 | $ 2,255 | $ 131 | $ — | 437 |
| Abbreviation(s): |
| CLO—Collateralized Loan Obligation |
| LIBOR—London Interbank Offered Rate |
| SOFR—Secured Overnight Financing Rate |
| TBD—To Be Determined |
| USD—United States Dollar |
The notes to the financial statements are an integral part of, and should be read in conjunction with, the financial statements.
| 32 | MainStay VP Floating Rate Portfolio |
The following is a summary of the fair valuations according to the inputs used as of December 31, 2023, for valuing the Portfolio’s assets:
| Description | Quoted
Prices in
Active
Markets for
Identical
Assets
(Level 1) | | Significant
Other
Observable
Inputs
(Level 2) | | Significant
Unobservable
Inputs
(Level 3) | | Total |
| Asset Valuation Inputs | | | | | | | |
| Investments in Securities (a) | | | | | | | |
| Long-Term Bonds | | | | | | | |
| Asset-Backed Securities | $ — | | $ 17,916,248 | | $ — | | $ 17,916,248 |
| Corporate Bonds | — | | 40,850,154 | | — | | 40,850,154 |
| Loan Assignments | — | | 727,768,535 | | 1,622,331 | | 729,390,866 |
| Total Long-Term Bonds | — | | 786,534,937 | | 1,622,331 | | 788,157,268 |
| Affiliated Investment Company | | | | | | | |
| Fixed Income Fund | 2,255,018 | | — | | — | | 2,255,018 |
| Common Stocks | 232,266 | | 82,598 | | 261,188 | | 576,052 |
| Rights | — | | — | | 86,353 | | 86,353 |
| Warrants (b) | — | | — | | 0 | | 0 |
| Short-Term Investments | | | | | | | |
| U.S. Treasury Debt | — | | 69,114,397 | | — | | 69,114,397 |
| Total Investments in Securities | $ 2,487,284 | | $ 855,731,932 | | $ 1,969,872 | | $ 860,189,088 |
| (a) | For a complete listing of investments and their industries, see the Portfolio of Investments. |
| (b) | Less than $1. |
The notes to the financial statements are an integral part of, and should be read in conjunction with, the financial statements.
33
Statement of Assets and Liabilities as of December 31, 2023
| Assets |
Investment in unaffiliated securities, at value
(identified cost $873,738,221) | $857,934,070 |
Investment in affiliated investment companies, at value
(identified cost $2,445,688) | 2,255,018 |
| Cash | 8,162,648 |
| Unrealized appreciation on unfunded commitments (See Note 5) | 214 |
| Receivables: | |
| Interest | 4,152,695 |
| Investment securities sold | 1,472,497 |
| Portfolio shares sold | 1,121,073 |
| Other assets | 3,828 |
| Total assets | 875,102,043 |
| Liabilities |
| Payables: | |
| Investment securities purchased | 10,551,107 |
| Portfolio shares redeemed | 538,672 |
| Manager (See Note 3) | 433,915 |
| NYLIFE Distributors (See Note 3) | 133,742 |
| Professional fees | 51,786 |
| Custodian | 15,967 |
| Shareholder communication | 29 |
| Accrued expenses | 61 |
| Total liabilities | 11,725,279 |
| Net assets | $863,376,764 |
| Composition of Net Assets |
| Shares of beneficial interest outstanding (par value of $.001 per share) unlimited number of shares authorized | $ 100,492 |
| Additional paid-in-capital | 939,722,076 |
| | 939,822,568 |
| Total distributable earnings (loss) | (76,445,804) |
| Net assets | $863,376,764 |
| Initial Class | |
| Net assets applicable to outstanding shares | $225,591,842 |
| Shares of beneficial interest outstanding | 26,272,521 |
| Net asset value per share outstanding | $ 8.59 |
| Service Class | |
| Net assets applicable to outstanding shares | $637,784,922 |
| Shares of beneficial interest outstanding | 74,219,464 |
| Net asset value per share outstanding | $ 8.59 |
The notes to the financial statements are an integral part of, and should be read in conjunction with, the financial statements.
| 34 | MainStay VP Floating Rate Portfolio |
Statement of Operations for the year ended December 31, 2023
| Investment Income (Loss) |
| Income | |
| Interest | $ 74,833,628 |
| Dividends-affiliated | 130,733 |
| Total income | 74,964,361 |
| Expenses | |
| Manager (See Note 3) | 5,023,423 |
| Distribution/Service—Service Class (See Note 3) | 1,497,177 |
| Professional fees | 154,144 |
| Custodian | 39,319 |
| Shareholder communication | 31,805 |
| Trustees | 21,689 |
| Miscellaneous | 57,935 |
| Total expenses | 6,825,492 |
| Net investment income (loss) | 68,138,869 |
| Realized and Unrealized Gain (Loss) |
| Net realized gain (loss) on unaffiliated investments | (13,269,188) |
| Net change in unrealized appreciation (depreciation) on: | |
| Unaffiliated investments | 37,417,118 |
| Affiliated investments | 112,897 |
| Unfunded commitments | 63,624 |
| Net change in unrealized appreciation (depreciation) | 37,593,639 |
| Net realized and unrealized gain (loss) | 24,324,451 |
| Net increase (decrease) in net assets resulting from operations | $ 92,463,320 |
The notes to the financial statements are an integral part of, and should be read in conjunction with, the financial statements.
35
Statements of Changes in Net Assets
for the years ended December 31, 2023 and December 31, 2022
| | 2023 | 2022 |
| Increase (Decrease) in Net Assets |
| Operations: | | |
| Net investment income (loss) | $ 68,138,869 | $ 38,693,702 |
| Net realized gain (loss) | (13,269,188) | (5,194,020) |
| Net change in unrealized appreciation (depreciation) | 37,593,639 | (45,313,026) |
| Net increase (decrease) in net assets resulting from operations | 92,463,320 | (11,813,344) |
| Distributions to shareholders: | | |
| Initial Class | (19,710,895) | (13,236,901) |
| Service Class | (48,172,988) | (25,226,121) |
| Total distributions to shareholders | (67,883,883) | (38,463,022) |
| Capital share transactions: | | |
| Net proceeds from sales of shares | 145,778,567 | 199,338,625 |
| Net asset value of shares issued to shareholders in reinvestment of distributions | 67,883,883 | 38,463,022 |
| Cost of shares redeemed | (212,263,440) | (183,816,446) |
| Increase (decrease) in net assets derived from capital share transactions | 1,399,010 | 53,985,201 |
| Net increase (decrease) in net assets | 25,978,447 | 3,708,835 |
| Net Assets |
| Beginning of year | 837,398,317 | 833,689,482 |
| End of year | $ 863,376,764 | $ 837,398,317 |
The notes to the financial statements are an integral part of, and should be read in conjunction with, the financial statements.
| 36 | MainStay VP Floating Rate Portfolio |
Financial Highlights selected per share data and ratios
| | Year Ended December 31, |
| Initial Class | 2023 | | 2022 | | 2021 | | 2020 | | 2019 |
| Net asset value at beginning of year | $ 8.34 | | $ 8.86 | | $ 8.81 | | $ 8.93 | | $ 8.66 |
| Net investment income (loss) (a) | 0.70 | | 0.41 | | 0.28 | | 0.32 | | 0.44 |
| Net realized and unrealized gain (loss) | 0.25 | | (0.52) | | 0.05 | | (0.12) | | 0.27 |
| Total from investment operations | 0.95 | | (0.11) | | 0.33 | | 0.20 | | 0.71 |
| Less distributions: | | | | | | | | | |
| From net investment income | (0.70) | | (0.41) | | (0.28) | | (0.32) | | (0.44) |
| Net asset value at end of year | $ 8.59 | | $ 8.34 | | $ 8.86 | | $ 8.81 | | $ 8.93 |
| Total investment return (b) | 11.86% | | (1.25)% | | 3.76% | | 2.45% | | 8.48% |
| Ratios (to average net assets)/Supplemental Data: | | | | | | | | | |
| Net investment income (loss) | 8.30% | | 4.80% | | 3.23% | | 3.81% | | 4.98% |
| Net expenses (c) | 0.64% | | 0.64% | | 0.64% | | 0.65% | | 0.65% |
| Portfolio turnover rate | 20% | | 14% | | 29% | | 19% | | 35% |
| Net assets at end of year (in 000's) | $ 225,592 | | $ 275,041 | | $ 299,907 | | $ 142,403 | | $ 205,596 |
| (a) | Per share data based on average shares outstanding during the year. |
| (b) | Total return does not reflect any deduction of sales charges, mortality and expense charges, contract charges or administrative charges. For periods of less than one year, total return is not annualized. |
| (c) | In addition to the fees and expenses which the Portfolio bears directly, it also indirectly bears a pro-rata share of the fees and expenses of the underlying funds in which it invests. Such indirect expenses are not included in the above expense ratios. |
| | Year Ended December 31, |
| Service Class | 2023 | | 2022 | | 2021 | | 2020 | | 2019 |
| Net asset value at beginning of year | $ 8.34 | | $ 8.87 | | $ 8.82 | | $ 8.94 | | $ 8.67 |
| Net investment income (loss) (a) | 0.69 | | 0.39 | | 0.26 | | 0.30 | | 0.42 |
| Net realized and unrealized gain (loss) | 0.24 | | (0.53) | | 0.05 | | (0.12) | | 0.27 |
| Total from investment operations | 0.93 | | (0.14) | | 0.31 | | 0.18 | | 0.69 |
| Less distributions: | | | | | | | | | |
| From net investment income | (0.68) | | (0.39) | | (0.26) | | (0.30) | | (0.42) |
| Net asset value at end of year | $ 8.59 | | $ 8.34 | | $ 8.87 | | $ 8.82 | | $ 8.94 |
| Total investment return (b) | 11.58% | | (1.49)% | | 3.50% | | 2.20% | | 8.19% |
| Ratios (to average net assets)/Supplemental Data: | | | | | | | | | |
| Net investment income (loss) | 8.08% | | 4.59% | | 2.96% | | 3.50% | | 4.73% |
| Net expenses (c) | 0.89% | | 0.89% | | 0.89% | | 0.90% | | 0.90% |
| Portfolio turnover rate | 20% | | 14% | | 29% | | 19% | | 35% |
| Net assets at end of year (in 000's) | $ 637,785 | | $ 562,357 | | $ 533,782 | | $ 496,645 | | $ 579,419 |
| (a) | Per share data based on average shares outstanding during the year. |
| (b) | Total return does not reflect any deduction of sales charges, mortality and expense charges, contract charges or administrative charges. For periods of less than one year, total return is not annualized. |
| (c) | In addition to the fees and expenses which the Portfolio bears directly, it also indirectly bears a pro-rata share of the fees and expenses of the underlying funds in which it invests. Such indirect expenses are not included in the above expense ratios. |
The notes to the financial statements are an integral part of, and should be read in conjunction with, the financial statements.
37
Notes to Financial Statements
Note 1–Organization and Business
MainStay VP Funds Trust (the “Fund”) was organized as a Delaware statutory trust on February 1, 2011. The Fund is registered under the Investment Company Act of 1940, as amended (the “1940 Act”), as an open-end management investment company. The Fund is comprised of thirty-one separate series (collectively referred to as the “Portfolios”). These financial statements and notes relate to the MainStay VP Floating Rate Portfolio (the "Portfolio"), a "non-diversified” portfolio, as that term is defined in the 1940 Act, as interpreted or modified by regulatory authorities having jurisdiction, from time to time. However, due to its principal investment strategies and investment processes, the Portfolio has historically operated as a "diversified" portfolio. Therefore, the Portfolio will not operate as "non-diversified" portfolio without first obtaining shareholder approval.
Shares of the Portfolio are currently offered to certain separate accounts to fund variable annuity policies and variable universal life insurance policies issued by New York Life Insurance and Annuity Corporation (“NYLIAC”), a wholly-owned subsidiary of New York Life Insurance Company (“New York Life”) and may also be offered to fund variable annuity policies and variable universal life insurance policies issued by other insurance companies. NYLIAC allocates shares of the Portfolio to, among others, certain NYLIAC separate accounts. Shares of the Portfolio are also offered to the MainStay VP Conservative Allocation Portfolio, MainStay VP Moderate Allocation Portfolio, MainStay VP Growth Allocation Portfolio and MainStay VP Equity Allocation Portfolio, which operate as “funds-of-funds," and other variable insurance funds.
The following table lists the Portfolio's share classes that have been registered and commenced operations:
| Class | Commenced Operations |
| Initial Class | May 2, 2005 |
| Service Class | May 2, 2005 |
Shares of the Portfolio are offered and are redeemed at a price equal to their respective net asset value (“NAV”) per share. No sales or redemption charge is applicable to the purchase or redemption of the Portfolio's shares. Under the terms of the Fund’s multiple class plan, adopted pursuant to Rule 18f-3 under the 1940 Act, the classes differ in that, among other things, Service Class shares of the Portfolio pay a combined distribution and service fee of 0.25% of average daily net assets attributable to Service Class shares of the Portfolio to the Distributor (as defined in Note 3(B)) pursuant to a plan adopted in accordance with Rule 12b-1 under the 1940 Act. Contract owners of variable annuity contracts purchased after June 2, 2003, are permitted to invest only in the Service Class shares.
The Portfolio's investment objective is to seek high current income.
Note 2–Significant Accounting Policies
The Portfolio is an investment company and accordingly follows the investment company accounting and reporting guidance of the Financial Accounting Standards Board (“FASB”) Accounting Standards Codification Topic 946 Financial Services—Investment Companies. The Portfolio prepares its financial statements in accordance with generally accepted accounting principles (“GAAP”) in the United States of America and follows the significant accounting policies described below.
(A) Securities Valuation. Investments are usually valued as of the close of regular trading on the New York Stock Exchange (the "Exchange") (usually 4:00 p.m. Eastern time) on each day the Portfolio is open for business ("valuation date").
Pursuant to Rule 2a-5 under the 1940 Act, the Board of Trustees of the Fund (the "Board") has designated New York Life Investment Management LLC (“New York Life Investments” or the "Manager") as its Valuation Designee (the "Valuation Designee"). The Valuation Designee is responsible for performing fair valuations relating to all investments in the Portfolio’s portfolio for which market quotations are not readily available; periodically assessing and managing material valuation risks; establishing and applying fair value methodologies; testing fair valuation methodologies; evaluating and overseeing pricing services; ensuring appropriate segregation of valuation and portfolio management functions; providing quarterly, annual and prompt reporting to the Board, as appropriate; identifying potential conflicts of interest; and maintaining appropriate records. The Valuation Designee has established a valuation committee ("Valuation Committee") to assist in carrying out the Valuation Designee’s responsibilities and establish prices of securities for which market quotations are not readily available. The Portfolio's and the Valuation Designee's policies and procedures ("Valuation Procedures") govern the Valuation Designee’s selection and application of methodologies for determining and calculating the fair value of Portfolio investments. The Valuation Designee may value the Portfolio's portfolio securities for which market quotations are not readily available and other Portfolio assets utilizing inputs from pricing services and other third-party sources. The Valuation Committee meets (in person, via electronic mail or via teleconference) on an ad-hoc basis to determine fair valuations and on a quarterly basis to review fair value events with respect to certain securities for which market quotations are not readily available, including valuation risks and back-testing results, and to preview reports to the Board.
The Valuation Committee establishes prices of securities for which market quotations are not readily available based on such methodologies and measurements on a regular basis after considering information that is reasonably available and deemed relevant by the Valuation Committee. The Board shall oversee the Valuation Designee and review fair valuation materials on a prompt, quarterly and annual basis and approve proposed revisions to the Valuation Procedures.
Investments for which market quotations are not readily available are valued at fair value as determined in good faith pursuant to the Valuation
| 38 | MainStay VP Floating Rate Portfolio |
Procedures. A market quotation is readily available only when that quotation is a quoted price (unadjusted) in active markets for identical investments that the Portfolio can access at the measurement date, provided that a quotation will not be readily available if it is not reliable. "Fair value" is defined as the price the Portfolio would reasonably expect to receive upon selling an asset or liability in an orderly transaction to an independent buyer in the principal or most advantageous market for the asset or liability. Fair value measurements are determined within a framework that establishes a three-tier hierarchy that maximizes the use of observable market data and minimizes the use of unobservable inputs to establish a classification of fair value measurements for disclosure purposes. "Inputs" refer broadly to the assumptions that market participants would use in pricing the asset or liability, including assumptions about risk, such as the risk inherent in a particular valuation technique used to measure fair value using a pricing model and/or the risk inherent in the inputs for the valuation technique. Inputs may be observable or unobservable. Observable inputs reflect the assumptions market participants would use in pricing the asset or liability based on market data obtained from sources independent of the Portfolio. Unobservable inputs reflect the Portfolio’s own assumptions about the assumptions market participants would use in pricing the asset or liability based on the information available. The inputs or methodology used for valuing assets or liabilities may not be an indication of the risks associated with investing in those assets or liabilities. The three-tier hierarchy of inputs is summarized below.
| • | Level 1—quoted prices (unadjusted) in active markets for an identical asset or liability |
| • | Level 2—other significant observable inputs (including quoted prices for a similar asset or liability in active markets, interest rates and yield curves, prepayment speeds, credit risk, etc.) |
| • | Level 3—significant unobservable inputs (including the Portfolio's own assumptions about the assumptions that market participants would use in measuring fair value of an asset or liability) |
The level of an asset or liability within the fair value hierarchy is based on the lowest level of an input, both individually and in the aggregate, that is significant to the fair value measurement. The aggregate value by input level of the Portfolio’s assets and liabilities as of December 31, 2023, is included at the end of the Portfolio of Investments.
The Portfolio may use third-party vendor evaluations, whose prices may be derived from one or more of the following standard inputs, among others:
| • Benchmark yields | • Reported trades |
| • Broker/dealer quotes | • Issuer spreads |
| • Two-sided markets | • Benchmark securities |
| • Bids/offers | • Reference data (corporate actions or material event notices) |
| • Industry and economic events | • Comparable bonds |
| • Monthly payment information | |
An asset or liability for which a market quotation is not readily available is valued by methods deemed reasonable in good faith by the Valuation Committee, following the Valuation Procedures to represent fair value. Under these procedures, the Valuation Designee generally uses a market-based approach which may use related or comparable assets or liabilities, recent transactions, market multiples, book values and other relevant information. The Valuation Designee may also use an income-based valuation approach in which the anticipated future cash flows of the asset or liability are discounted to calculate fair value. Discounts may also be applied due to the nature and/or duration of any restrictions on the disposition of the asset or liability. Fair value represents a good faith approximation of the value of a security. Fair value determinations involve the consideration of a number of subjective factors, an analysis of applicable facts and circumstances and the exercise of judgment. As a result, it is possible that the fair value for a security determined in good faith in accordance with the Valuation Procedures may differ from valuations for the same security determined for other funds using their own valuation procedures. Although the Valuation Procedures are designed to value a security at the price the Portfolio may reasonably expect to receive upon the security's sale in an orderly transaction, there can be no assurance that any fair value determination thereunder would, in fact, approximate the amount that the Portfolio would actually realize upon the sale of the security or the price at which the security would trade if a reliable market price were readily available. During the year ended December 31, 2023, there were no material changes to the fair value methodologies.
Securities which may be valued in this manner include, but are not limited to: (i) a security for which trading has been halted or suspended or otherwise does not have a readily available market quotation on a given day; (ii) a debt security that has recently gone into default and for which there is not a current market quotation; (iii) a security of an issuer that has entered into a restructuring; (iv) a security that has been delisted from a national exchange; (v) a security subject to trading collars for which no or limited trading takes place; and (vi) a security whose principal market has been temporarily closed at a time when, under normal conditions, it would be open. Securities valued in this manner are generally categorized as Level 2 or 3 in the hierarchy.
Equity securities, rights and warrants, if applicable, are valued at the last quoted sales prices as of the close of regular trading on the relevant exchange on each valuation date. Securities that are not traded on the valuation date are valued at the mean of the last quoted bid and ask prices. Prices are normally taken from the principal market in which each security trades. These securities are generally categorized as Level 1 in the hierarchy.
Investments in mutual funds, including money market funds, are valued at their respective NAVs at the close of business each day on the valuation date. These securities are generally categorized as Level 1 in the hierarchy.
Debt securities (other than convertible and municipal bonds) are valued at the evaluated bid prices (evaluated mean prices in the case of convertible
Notes to Financial Statements (continued)
and municipal bonds) supplied by a pricing agent or broker selected by the Valuation Designee, in consultation with the Subadvisor. The evaluations are market-based measurements processed through a pricing application and represents the pricing agent’s good faith determination as to what a holder may receive in an orderly transaction under market conditions. The rules-based logic utilizes valuation techniques that reflect participants’ assumptions and vary by asset class and per methodology, maximizing the use of relevant observable data including quoted prices for similar assets, benchmark yield curves and market corroborated inputs. The evaluated bid or mean prices are deemed by the Valuation Designee, in consultation with the Subadvisor, to be representative of market values at the regular close of trading of the Exchange on each valuation date. Debt securities purchased on a delayed delivery basis are marked to market daily until settlement at the forward settlement date. Debt securities, including corporate bonds, U.S. government and federal agency bonds, municipal bonds, foreign bonds, convertible bonds, asset-backed securities and mortgage-backed securities are generally categorized as Level 2 in the hierarchy.
Loan assignments, participations and commitments are valued at the average of bid quotations obtained from the engaged independent pricing service and are generally categorized as Level 2 in the hierarchy. Certain loan assignments, participations and commitments may be valued by utilizing significant unobservable inputs obtained from the pricing service and are generally categorized as Level 3 in the hierarchy.
Temporary cash investments acquired in excess of 60 days to maturity at the time of purchase are valued using the latest bid prices or using valuations based on a matrix system (which considers such factors as security prices, yields, maturities and ratings), both as furnished by independent pricing services. Temporary cash investments that mature in 60 days or less at the time of purchase ("Short-Term Investments") are valued using the amortized cost method of valuation, unless the use of such method would be inappropriate. The amortized cost method involves valuing a security at its cost on the date of purchase and thereafter assuming a constant amortization to maturity of the difference between such cost and the value on maturity date. Amortized cost approximates the current fair value of a security. Securities valued using the amortized cost method are not valued using quoted prices in an active market and are generally categorized as Level 2 in the hierarchy.
The information above is not intended to reflect an exhaustive list of the methodologies that may be used to value portfolio investments. The Valuation Procedures permit the use of a variety of valuation methodologies in connection with valuing portfolio investments. The methodology used for a specific type of investment may vary based on the market data available or other considerations. The methodologies summarized above may not represent the specific means by which portfolio investments are valued on any particular business day.
A portfolio investment may be classified as an illiquid investment under the Portfolio's written liquidity risk management program and related procedures (“Liquidity Program”). Illiquidity of an investment might prevent the sale of such investment at a time when the Manager or the
Subadvisor might wish to sell, and these investments could have the effect of decreasing the overall level of the Portfolio's liquidity. Further, the lack of an established secondary market may make it more difficult to value illiquid investments, requiring the Portfolio to rely on judgments that may be somewhat subjective in measuring value, which could vary materially from the amount that the Portfolio could realize upon disposition. Difficulty in selling illiquid investments may result in a loss or may be costly to the Portfolio. An illiquid investment is any investment that the Manager or Subadvisor reasonably expects cannot be sold or disposed of in current market conditions in seven calendar days or less without the sale or disposition significantly changing the market value of the investment. The liquidity classification of each investment will be made using information obtained after reasonable inquiry and taking into account, among other things, relevant market, trading and investment-specific considerations in accordance with the Liquidity Program. Illiquid investments are often fair valued in accordance with the Portfolio's procedures described above. The liquidity of the Portfolio's investments was determined as of December 31, 2023, and can change at any time.
(B) Income Taxes. The Portfolio's policy is to comply with the requirements of the Internal Revenue Code of 1986, as amended (the “Internal Revenue Code”), applicable to regulated investment companies and to distribute all of its taxable income to the shareholders of the Portfolio within the allowable time limits.
The Manager evaluates the Portfolio’s tax positions to determine if the tax positions taken meet the minimum recognition threshold in connection with accounting for uncertainties in income tax positions taken or expected to be taken for the purposes of measuring and recognizing tax liabilities in the financial statements. Recognition of tax benefits of an uncertain tax position is permitted only to the extent the position is “more likely than not” to be sustained assuming examination by taxing authorities. The Manager analyzed the Portfolio's tax positions taken on federal, state and local income tax returns for all open tax years (for up to three tax years) and has concluded that no provisions for federal, state and local income tax are required in the Portfolio's financial statements. The Portfolio's federal, state and local income tax and federal excise tax returns for tax years for which the applicable statutes of limitations have not expired are subject to examination by the Internal Revenue Service and state and local departments of revenue.
(C) Dividends and Distributions to Shareholders. Dividends and distributions are recorded on the ex-dividend date. The Portfolio intends to declare dividends from net investment income, if any, daily and intends to pay them at least monthly and distributions from net realized capital and currency gains, if any, at least annually. All dividends and distributions are reinvested at NAV in the same class of shares of the Portfolio. Dividends and distributions to shareholders are determined in accordance with federal income tax regulations and may differ from determinations using GAAP.
| 40 | MainStay VP Floating Rate Portfolio |
(D) Security Transactions and Investment Income. The Portfolio records security transactions on the trade date. Realized gains and losses on security transactions are determined using the identified cost method. Dividend income is recognized on the ex-dividend date, net of any foreign tax withheld at the source, and interest income is accrued as earned using the effective interest rate method. Distributions received from real estate investment trusts may be classified as dividends, capital gains and/or return of capital. Discounts and premiums on securities purchased for the Portfolio are accreted and amortized, respectively, on the effective interest rate method.
Investment income and realized and unrealized gains and losses on investments of the Portfolio are allocated pro rata to the separate classes of shares based upon their relative net assets on the date the income is earned or realized and unrealized gains and losses are incurred.
The Portfolio may place a debt security on non-accrual status and reduce related interest income by ceasing current accruals and writing off all or a portion of any interest receivables when the collection of all or a portion of such interest has become doubtful. A debt security is removed from non-accrual status when the issuer resumes interest payments or when collectability of interest is reasonably assured.
(E) Expenses. Expenses of the Fund are allocated to the individual Portfolios in proportion to the net assets of the respective Portfolios when the expenses are incurred, except where direct allocations of expenses can be made. Expenses (other than fees incurred under the distribution and service plans, further discussed in Note 3(B), which are charged directly to the Service Class shares) are allocated to separate classes of shares pro rata based upon their relative net assets on the date the expenses are incurred. The expenses borne by the Portfolio, including those of related parties to the Portfolio, are shown in the Statement of Operations.
Additionally, the Portfolio may invest in mutual funds, which are subject to management fees and other fees that may cause the costs of investing in mutual funds to be greater than the costs of owning the underlying securities directly. These indirect expenses of mutual funds are not included in the amounts shown as expenses in the Statement of Operations or in the expense ratios included in the Financial Highlights.
(F) Use of Estimates. In preparing financial statements in conformity with GAAP, the Manager makes estimates and assumptions that affect the reported amounts and disclosures in the financial statements. Actual results could differ from those estimates and assumptions.
(G) Loan Assignments, Participations and Commitments. The Portfolio may invest in loan assignments and participations ("loans"). Commitments are agreements to make money available to a borrower in a specified amount, at a specified rate and within a specified time. The Portfolio records an investment when the borrower withdraws money on a commitment or when a funded loan is purchased (trade date) and records interest as earned. These loans pay interest at rates that are periodically reset by reference to a base lending rate plus a spread. These base lending rates are generally the prime rate offered by a designated U.S.
bank, the Secured Overnight Financing Rate ("SOFR") or an alternative reference rate.
The loans in which the Portfolio may invest are generally readily marketable, but may be subject to some restrictions on resale. For example, the Portfolio may be contractually obligated to receive approval from the agent bank and/or borrower prior to the sale of these investments. If the Portfolio purchases an assignment from a lender, the Portfolio will generally have direct contractual rights against the borrower in favor of the lender. If the Portfolio purchases a participation interest either from a lender or a participant, the Portfolio typically will have established a direct contractual relationship with the seller of the participation interest, but not with the borrower. Consequently, the Portfolio is subject to the credit risk of the lender or participant who sold the participation interest to the Portfolio, in addition to the usual credit risk of the borrower. In the event that the borrower, selling participant or intermediate participants become insolvent or enter into bankruptcy, the Portfolio may incur certain costs and delays in realizing payment, or may suffer a loss of principal and/or interest.
Unfunded commitments represent the remaining obligation of the Portfolio to the borrower. At any point in time, up to the maturity date of the issue, the borrower may demand the unfunded portion. Unfunded amounts, if any, are marked to market and any unrealized gains or losses are recorded in the Statement of Assets and Liabilities.
(H) Rights and Warrants. Rights are certificates that permit the holder to purchase a certain number of shares, or a fractional share, of a new stock from the issuer at a specific price. Warrants are instruments that entitle the holder to buy an equity security at a specific price for a specific period of time. These investments can provide a greater potential for profit or loss than an equivalent investment in the underlying security. Prices of these investments do not necessarily move in tandem with the prices of the underlying securities.
There is risk involved in the purchase of rights and warrants in that these investments are speculative investments. The Portfolio could also lose the entire value of its investment in warrants if such warrants are not exercised by the date of its expiration. The Portfolio is exposed to risk until the sale or exercise of each right or warrant is completed.
(I) Debt Securities Risk. The ability of issuers of debt securities held by the Portfolio to meet their obligations may be affected by, among other things, economic or political developments in a specific country, industry or region. Debt securities are also subject to the risks associated with changes in interest rates.
The Portfolio’s principal investments include floating rate loans, which are usually rated below investment grade and are generally considered speculative because they present a greater risk of loss, including default, than higher rated debt securities. These investments pay investors a higher interest rate than investment grade debt securities because of the increased risk of loss. Although certain floating rate loans are collateralized, there is no guarantee that the value of the collateral will be sufficient to repay the loan. In a recession or serious credit event, the
Notes to Financial Statements (continued)
value of these investments could decline significantly. As a result, the Portfolio’s NAVs could decrease and you could lose money.
In addition, floating rate loans generally are subject to extended settlement periods that may be longer than seven days. As a result, the Portfolio may be adversely affected by selling other investments at an unfavorable time and/or under unfavorable conditions or engaging in borrowing transactions, such as borrowing against its credit facility, to raise cash to meet redemption obligations or pursue other investment opportunities.
In certain circumstances, floating rate loans may not be deemed to be securities. As a result, the Portfolio may not have the protection of the anti-fraud provisions of the federal securities laws. In such cases, the Portfolio generally must rely on the contractual provisions in the loan agreement and common-law fraud protections under applicable state law.
The Portfolio may invest in foreign debt securities, which carry certain risks that are in addition to the usual risks inherent in domestic debt securities. These risks include those resulting from currency fluctuations, future adverse political or economic developments and possible imposition of currency exchange blockages or other foreign governmental laws or restrictions. These risks are likely to be greater in emerging markets than in developed markets. The ability of issuers of debt securities held by the Portfolio to meet their obligations may be affected by, among other things, economic or political developments in a specific country, industry or region.
(J) LIBOR Replacement Risk. The Portfolio may invest in certain debt securities, derivatives or other financial instruments that have relied or continue to rely on LIBOR, as a “benchmark” or “reference rate” for various interest rate calculations. As of January 1, 2022, the United Kingdom Financial Conduct Authority ("FCA"), which regulates LIBOR, ceased its active encouragement of banks to provide the quotations needed to sustain most LIBOR rates due to the absence of an active market for interbank unsecured lending and other reasons. In connection with supervisory guidance from U.S. regulators, certain U.S. regulated entities have generally ceased to enter into certain new LIBOR contracts after January 1, 2022. On March 15, 2022, the Adjustable Interest Rate (LIBOR) Act was signed into law. This law provides a statutory fallback mechanism on a nationwide basis to replace LIBOR with a benchmark rate that is selected by the Board of Governors of the Federal Reserve System and based on SOFR (which measures the cost of overnight borrowings through repurchase agreement transactions collateralized with U.S. Treasury securities) for tough legacy contracts. On February 27, 2023, the Federal Reserve System’s final rule in connection with this law became effective, establishing benchmark replacements based on SOFR and Term SOFR (a forward-looking measurement of market expectations of SOFR implied from certain derivatives markets) for applicable tough legacy contracts governed by U.S. law. In addition, the FCA has announced that it will require the publication of synthetic LIBOR for the one-month, three-month and six-month U.S. Dollar LIBOR settings after June 30, 2023 through at least September 30, 2024. Certain of the Portfolio's investments may involve individual tough legacy contracts
which may be subject to the Adjustable Interest Rate (LIBOR) Act or synthetic LIBOR and no assurances can be given that these measures will have had the intended effects. Although the transition process away from LIBOR for many instruments has been completed, some LIBOR use is continuing and there are potential effects related to the transition away from LIBOR or continued use of LIBOR on the Portfolio.
The elimination of LIBOR or changes to other reference rates or any other changes or reforms to the determination or supervision of reference rates could have an adverse impact on the market for, or value of, any securities or payments linked to those reference rates, which may adversely affect the Portfolio's performance and/or net asset value. It could also lead to a reduction in the interest rates on, and the value of, some LIBOR-based investments and reduce the effectiveness of hedges mitigating risk in connection with LIBOR-based investments. Uncertainty and risk also remain regarding the willingness and ability of issuers and lenders to include enhanced provisions in new and existing contracts or instruments. Consequently, the transition away from LIBOR to other reference rates may lead to increased volatility and illiquidity in markets that are tied to LIBOR, fluctuations in values of LIBOR-related investments or investments in issuers that utilize LIBOR, increased difficulty in borrowing or refinancing and diminished effectiveness of hedging strategies, adversely affecting the Portfolio's performance. Furthermore, the risks associated with the expected discontinuation of LIBOR and transition may be exacerbated if the work necessary to effect an orderly transition to an alternative reference rate is not completed in a timely manner. The usefulness of LIBOR as a benchmark could deteriorate anytime during this transition period. Any such effects of the transition process, including unforeseen effects, could result in losses to the Portfolio.
(K) Indemnifications. Under the Fund’s organizational documents, its officers and trustees are indemnified against certain liabilities that may arise out of performance of their duties to the Fund. Additionally, in the normal course of business, the Portfolio enters into contracts with third-party service providers that contain a variety of representations and warranties and that may provide general indemnifications. The Portfolio's maximum exposure under these arrangements is unknown, as this would involve future claims that may be made against the Portfolio that have not yet occurred. The Manager believes that the risk of loss in connection with these potential indemnification obligations is remote. However, there can be no assurance that material liabilities related to such obligations will not arise in the future, which could adversely impact the Portfolio.
Note 3–Fees and Related Party Transactions
(A) Manager and Subadvisor. New York Life Investments, a registered investment adviser and an indirect, wholly-owned subsidiary of New York Life, serves as the Portfolio's Manager pursuant to an Amended and Restated Management Agreement ("Management Agreement"). The Manager provides offices, conducts clerical, recordkeeping and bookkeeping services and keeps most of the financial and accounting records required to be maintained by the Portfolio. Except for the portion
| 42 | MainStay VP Floating Rate Portfolio |
of salaries and expenses that are the responsibility of the Portfolio, the Manager pays the salaries and expenses of all personnel affiliated with the Portfolio and certain operational expenses of the Portfolio. The Portfolio reimburses New York Life Investments in an amount equal to the portion of the compensation of the Chief Compliance Officer attributable to the Portfolio. NYL Investors LLC ("NYL Investors" or ''Subadvisor''), a registered investment adviser and a direct, wholly-owned subsidiary of New York Life, serves as the Subadvisor to the Portfolio and is responsible for the day-to-day portfolio management of the Portfolio. Pursuant to the terms of a Subadvisory Agreement between New York Life Investments and NYL Investors, New York Life Investments pays for the services of the Subadvisor.
Pursuant to the Management Agreement, the Fund pays the Manager, on behalf of the Portfolio, a monthly fee for the services performed and the facilities furnished at an annual rate of the Portfolio's average daily net assets as follows: 0.60% up to $1 billion; 0.575% from $1 billion to $3 billion; and 0.565% in excess of $3 billion. During the year ended December 31, 2023, the effective management fee rate was 0.60% of the Portfolio's average daily net assets.
During the year ended December 31, 2023, New York Life Investments earned fees from the Portfolio in the amount of $5,023,423 and paid the Subadvisor fees in the amount of $2,511,711.
JPMorgan Chase Bank, N.A. ("JPMorgan") provides sub-administration and sub-accounting services to the Portfolio pursuant to an agreement with New York Life Investments. These services include calculating the daily NAVs of the Portfolio, maintaining the general ledger and sub-ledger accounts for the calculation of the Portfolio's NAVs, and assisting New York Life Investments in conducting various aspects of the Portfolio's administrative operations. For providing these services to the Portfolio, JPMorgan is compensated by New York Life Investments.
Pursuant to an agreement between the Fund and New York Life Investments, New York Life Investments is responsible for providing or procuring certain regulatory reporting services for the Portfolio. The Portfolio will reimburse New York Life Investments for the actual costs incurred by New York Life Investments in connection with providing or procuring these services for the Portfolio.
(B) Distribution and Service Fees. The Fund, on behalf of the Portfolio, has entered into a distribution agreement with NYLIFE Distributors LLC (the “Distributor”), an affiliate of New York Life Investments. The Portfolio has adopted a distribution plan (the “Plan”) in accordance with the provisions of Rule 12b-1 under the 1940 Act. Under the Plan, the Distributor has agreed to provide, through its affiliates or independent third parties, various distribution-related, shareholder and administrative support services to the Service Class shareholders. For its services, the Distributor is entitled to a combined distribution and service fee accrued daily and paid monthly at an annual rate of 0.25% of the average daily net assets attributable to the Service Class shares of the Portfolio.
Note 4-Federal Income Tax
As of December 31, 2023, the cost and unrealized appreciation (depreciation) of the Portfolio’s investment portfolio, including applicable derivative contracts and other financial instruments, as determined on a federal income tax basis, were as follows:
| | Federal Tax
Cost | Gross
Unrealized
Appreciation | Gross
Unrealized
(Depreciation) | Net
Unrealized
Appreciation/
(Depreciation) |
| Investments in Securities | $876,239,071 | $5,084,987 | $(21,134,970) | $(16,049,983) |
As of December 31, 2023, the components of accumulated gain (loss) on a tax basis were as follows:
Ordinary
Income | Accumulated
Capital
and Other
Gain (Loss) | Other
Temporary
Differences | Unrealized
Appreciation
(Depreciation) | Total
Accumulated
Gain (Loss) |
| $2,083,696 | $(62,479,731) | $— | $(16,049,769) | $(76,445,804) |
The difference between book-basis and tax-basis unrealized appreciation (depreciation) is primarily due to cumulative bond amortization adjustments.
As of December 31, 2023, for federal income tax purposes, capital loss carryforwards of $62,479,731, as shown in the table below, were available to the extent provided by the regulations to offset future realized gains of the Portfolio. Accordingly, no capital gains distributions are expected to be paid to shareholders until net gains have been realized in excess of such amounts.
Capital Loss
Available Through | Short-Term
Capital Loss
Amounts (000’s) | Long-Term
Capital Loss
Amounts (000’s) |
| Unlimited | $4,658 | $57,822 |
During the years ended December 31, 2023 and December 31, 2022, the tax character of distributions paid as reflected in the Statements of Changes in Net Assets was as follows:
| | 2023 | 2022 |
| Distributions paid from: | | |
| Ordinary Income | $67,883,883 | $38,463,022 |
Note 5–Commitments and Contingencies
As of December 31, 2023, the Portfolio had unfunded commitments pursuant to the following loan agreements:
| Borrower | Unfunded
Commitments | Unrealized
Appreciation/
(Depreciation) |
Ryan LLC,
Delayed Draw Term Loan
2.25%, due 11/14/30 | $85,929 | $214 |
Commitments are available until maturity date.
Notes to Financial Statements (continued)
Note 6–Custodian
JPMorgan is the custodian of cash and securities held by the Portfolio. Custodial fees are charged to the Portfolio based on the Portfolio's net assets and/or the market value of securities held by the Portfolio and the number of certain transactions incurred by the Portfolio.
Note 7–Line of Credit
The Portfolio and certain other funds managed by New York Life Investments maintain a line of credit with a syndicate of banks in order to secure a source of funds for temporary purposes to meet unanticipated or excessive redemption requests.
Effective July 25, 2023, under the credit agreement (the “Credit Agreement”), the aggregate commitment amount is $600,000,000 with an additional uncommitted amount of $100,000,000. The commitment fee is an annual rate of 0.15% of the average commitment amount payable quarterly, regardless of usage, to JPMorgan, who serves as the agent to the syndicate. The commitment fee is allocated among the Portfolio and certain other funds managed by New York Life Investments based upon their respective net assets and other factors. Interest on any revolving credit loan is charged based upon the Federal Funds Rate, Daily SOFR + 0.10%, or the Overnight Bank Funding Rate, whichever is higher. The Credit Agreement expires on July 23, 2024, although the Portfolio, certain other funds managed by New York Life Investments and the syndicate of banks may renew the Credit Agreement for an additional year on the same or different terms or enter into a credit agreement with a different syndicate of banks. Prior to July 25, 2023, the aggregate commitment amount and the commitment fee were the same as those under the current Credit Agreement. During the year ended December 31, 2023, there were no borrowings made or outstanding with respect to the Portfolio under the Credit Agreement.
Note 8–Interfund Lending Program
Pursuant to an exemptive order issued by the SEC, the Portfolio, along with certain other funds managed by New York Life Investments, may participate in an interfund lending program. The interfund lending program provides an alternative credit facility that permits the Portfolio and certain other funds managed by New York Life Investments to lend or borrow money for temporary purposes directly to or from one another, subject to the conditions of the exemptive order. During the year ended December 31, 2023, there were no interfund loans made or outstanding with respect to the Portfolio.
Note 9–Purchases and Sales of Securities (in 000’s)
During the year ended December 31, 2023, purchases and sales of securities, other than short-term securities, were $159,674 and $179,160, respectively.
Note 10–Capital Share Transactions
Transactions in capital shares for the years ended December 31, 2023 and December 31, 2022, were as follows:
| Initial Class | Shares | Amount |
| Year ended December 31, 2023: | | |
| Shares sold | 1,190,046 | $ 10,107,544 |
| Shares issued to shareholders in reinvestment of distributions | 2,323,880 | 19,710,895 |
| Shares redeemed | (10,230,674) | (86,313,893) |
| Net increase (decrease) | (6,716,748) | $ (56,495,454) |
| Year ended December 31, 2022: | | |
| Shares sold | 4,045,382 | $ 33,987,205 |
| Shares issued to shareholders in reinvestment of distributions | 1,567,085 | 13,236,901 |
| Shares redeemed | (6,486,710) | (55,381,284) |
| Net increase (decrease) | (874,243) | $ (8,157,178) |
| |
| Service Class | Shares | Amount |
| Year ended December 31, 2023: | | |
| Shares sold | 15,985,471 | $ 135,671,023 |
| Shares issued to shareholders in reinvestment of distributions | 5,673,044 | 48,172,988 |
| Shares redeemed | (14,837,542) | (125,949,547) |
| Net increase (decrease) | 6,820,973 | $ 57,894,464 |
| Year ended December 31, 2022: | | |
| Shares sold | 19,272,966 | $ 165,351,420 |
| Shares issued to shareholders in reinvestment of distributions | 2,987,184 | 25,226,121 |
| Shares redeemed | (15,071,415) | (128,435,162) |
| Net increase (decrease) | 7,188,735 | $ 62,142,379 |
Note 11–Other Matters
As of the date of this report, the Portfolio faces a heightened level of risk associated with current uncertainty, volatility and state of economies, financial markets, rising interest rates, and labor and health conditions around the world. Events such as war, acts of terrorism, recessions, rapid inflation, the imposition of international sanctions, earthquakes, hurricanes, epidemics and pandemics and other unforeseen natural or human disasters may have broad adverse social, political and economic effects on the global economy, which could negatively impact the value of the Portfolio's investments. Developments that disrupt global economies and financial markets may magnify factors that affect the Portfolio's performance.
Note 12–Subsequent Events
In connection with the preparation of the financial statements of the Portfolio as of and for the year ended December 31, 2023, events and transactions subsequent to December 31, 2023, through the date the financial statements were issued, have been evaluated by the Manager
| 44 | MainStay VP Floating Rate Portfolio |
for possible adjustment and/or disclosure. No subsequent events requiring financial statement adjustment or disclosure have been identified.
Report of Independent Registered Public Accounting Firm
To the Board of Trustees of MainStay VP Funds Trust and Shareholders of MainStay VP Floating Rate Portfolio
Opinion on the Financial Statements
We have audited the accompanying statement of assets and liabilities, including the portfolio of investments, of MainStay VP Floating Rate Portfolio (one of the portfolios constituting MainStay VP Funds Trust, referred to hereafter as the “Portfolio”) as of December 31, 2023, the related statement of operations for the year ended December 31, 2023, the statements of changes in net assets for each of the two years in the period ended December 31, 2023, including the related notes, and the financial highlights for each of the five years in the period ended December 31, 2023 (collectively referred to as the “financial statements”). In our opinion, the financial statements present fairly, in all material respects, the financial position of the Portfolio as of December 31, 2023, the results of its operations for the year then ended, the changes in its net assets for each of the two years in the period ended December 31, 2023 and the financial highlights for each of the five years in the period ended December 31, 2023 in conformity with accounting principles generally accepted in the United States of America.
Basis for Opinion
These financial statements are the responsibility of the Portfolio’s management. Our responsibility is to express an opinion on the Portfolio’s financial statements based on our audits. We are a public accounting firm registered with the Public Company Accounting Oversight Board (United States) (PCAOB) and are required to be independent with respect to the Portfolio in accordance with the U.S. federal securities laws and the applicable rules and regulations of the Securities and Exchange Commission and the PCAOB.
We conducted our audits of these financial statements in accordance with the standards of the PCAOB. Those standards require that we plan and perform the audit to obtain reasonable assurance about whether the financial statements are free of material misstatement, whether due to error or fraud.
Our audits included performing procedures to assess the risks of material misstatement of the financial statements, whether due to error or fraud, and performing procedures that respond to those risks. Such procedures included examining, on a test basis, evidence regarding the amounts and disclosures in the financial statements. Our audits also included evaluating the accounting principles used and significant estimates made by management, as well as evaluating the overall presentation of the financial statements. Our procedures included confirmation of securities owned as of December 31, 2023 by correspondence with the custodians, transfer agent and agent banks; when replies were not received from agent banks, we performed other auditing procedures. We believe that our audits provide a reasonable basis for our opinion.
/s/PricewaterhouseCoopers LLP
New York, New York
February 26, 2024
We have served as the auditor of one or more investment companies in the MainStay group of funds since 1984.
| 46 | MainStay VP Floating Rate Portfolio |
Board Consideration and Approval of Management Agreement and Subadvisory Agreement (Unaudited)
The continuation of the Management Agreement with respect to the MainStay VP Floating Rate Portfolio (“Portfolio”) and New York Life Investment Management LLC (“New York Life Investments”) and the Subadvisory Agreement between New York Life Investments and NYL Investors LLC (“NYL Investors”) with respect to the Portfolio (together, “Advisory Agreements”) is subject to annual review and approval by the Board of Trustees of MainStay VP Funds Trust (“Board” of the “Trust”) in accordance with Section 15 of the Investment Company Act of 1940, as amended (“1940 Act”). At its December 6–7, 2023 meeting, the Board, including the Trustees who are not an “interested person” (as such term is defined in the 1940 Act) of the Trust (“Independent Trustees”) voting separately, unanimously approved the continuation of each of the Advisory Agreements for a one-year period.
In reaching the decision to approve the continuation of each of the Advisory Agreements, the Board considered information and materials furnished by New York Life Investments and NYL Investors in connection with an annual contract review process undertaken by the Board that took place at meetings of the Board and its Contracts Committee from September 2023 through December 2023, including information and materials furnished by New York Life Investments and NYL Investors in response to requests prepared on behalf of the Board, and in consultation with the Independent Trustees, by independent legal counsel to the Independent Trustees, which encompassed a variety of topics, including those summarized below. Information and materials requested by and furnished to the Board for consideration in connection with the contract review process included, among other items, reports on the Portfolio and “peer funds” prepared by Institutional Shareholder Services Inc. (“ISS”), an independent third-party service provider engaged by the Board to report objectively on the Portfolio’s investment performance, management fee and total expenses. The Board also considered information on the fees charged to other investment advisory clients of New York Life Investments and/or NYL Investors that follow investment strategies similar to those of the Portfolio, if any, and, when applicable, the rationale for differences in the Portfolio’s management and subadvisory fees and the fees charged to those other investment advisory clients. In addition, the Board considered information regarding the legal standards and fiduciary obligations applicable to its consideration of the continuation of each of the Advisory Agreements. The contract review process, including the structure and format for information and materials provided to the Board, has been developed in consultation with the Board. The Independent Trustees also met in executive sessions with their independent legal counsel and, for portions thereof, with senior management of New York Life Investments.
The Board’s deliberations with respect to the continuation of each of the Advisory Agreements reflect a year-long process, and the Board also took into account information furnished to the Board and its Committees throughout the year, as deemed relevant and appropriate by the Trustees, including, among other items, reports on investment performance of the Portfolio and investment-related matters for the Portfolio as well as presentations from New York Life Investments and, generally annually, NYL Investors personnel. In addition, the Board took into account other
information provided by New York Life Investments throughout the year, including, among other items, periodic reports on legal and compliance matters, risk management, portfolio turnover, brokerage commissions and non-advisory services provided to the Portfolio by New York Life Investments, as deemed relevant and appropriate by the Trustees.
In addition to information provided to the Board throughout the year, the Board received information in connection with its June 2023 meeting provided specifically in response to requests prepared on behalf of the Board, and in consultation with the Independent Trustees, by independent legal counsel to the Independent Trustees regarding the Portfolio’s distribution arrangements. In addition, the Board received information regarding the Portfolio’s asset levels, share purchase and redemption activity and the payment of Rule 12b-1 and/or certain other fees by applicable share classes of the Portfolio, among other information.
In considering the continuation of each of the Advisory Agreements, the Trustees reviewed and evaluated the information and factors they believed to reasonably be necessary and appropriate in light of legal advice furnished to them by independent legal counsel to the Independent Trustees and through the exercise of their own business judgment. Although individual Trustees may have weighed certain factors or information differently and the Board did not consider any single factor or information controlling in reaching its decision, the factors that figured prominently in the Board’s consideration of the continuation of each of the Advisory Agreements are summarized in more detail below and include, among other factors: (i) the nature, extent and quality of the services provided to the Portfolio by New York Life Investments and NYL Investors; (ii) the qualifications of the portfolio managers of the Portfolio and the historical investment performance of the Portfolio, New York Life Investments and NYL Investors; (iii) the costs of the services provided, and profits realized, by New York Life Investments and NYL Investors with respect to their relationships with the Portfolio; (iv) the extent to which economies of scale have been realized or may be realized if the Portfolio grows and the extent to which any economies of scale have been shared, have benefited or may benefit the Portfolio’s shareholders; and (v) the reasonableness of the Portfolio’s management and subadvisory fees and total ordinary operating expenses. Although the Board recognized that comparisons between the Portfolio’s fees and expenses and those of other funds are imprecise given different terms of agreements, variations in fund strategies and other factors, the Board considered the reasonableness of the Portfolio’s management fee and total ordinary operating expenses as compared to the peer funds identified by ISS. Throughout their considerations, the Trustees acknowledged the commitment of New York Life Investments and its affiliates to serve the MainStay Group of Funds, as well as their capacity, experience, resources, financial stability and reputations. The Trustees also acknowledged the entrepreneurial and other risks assumed by New York Life Investments in sponsoring and managing the Portfolio. With respect to the Subadvisory Agreement, the Board took into account New York Life Investments’ recommendation to approve the continuation of the Subadvisory Agreement.
Board Consideration and Approval of Management Agreement and Subadvisory Agreement (Unaudited) (continued)
The Trustees noted that, throughout the year, the Trustees are afforded an opportunity to ask questions of, and request additional information or materials from, New York Life Investments and NYL Investors. The Board’s decision with respect to each of the Advisory Agreements may have also been based, in part, on the Board’s knowledge of New York Life Investments and NYL Investors resulting from, among other things, the Board’s consideration of each of the Advisory Agreements in prior years, the advisory agreements for other funds in the MainStay Group of Funds, the Board’s review throughout the year of the performance and operations of other funds in the MainStay Group of Funds and each Trustee’s business judgment and industry experience. In addition to considering the above-referenced factors, the Board observed that in the marketplace, notably under variable life insurance policies and variable annuity contracts for which the Portfolio serves as an investment option, there are a range of investment options available to investors and that the Portfolio’s shareholders, having had the opportunity to consider other investment options, have invested in the Portfolio.
The factors that figured prominently in the Board’s decision to approve the continuation of each of the Advisory Agreements during the Board’s December 6–7, 2023 meeting are summarized in more detail below.
Nature, Extent and Quality of Services Provided by New York Life Investments and NYL Investors
The Board examined the nature, extent and quality of the services that New York Life Investments provides to the Portfolio. The Board evaluated New York Life Investments’ experience and capabilities in serving as manager of the Portfolio and considered that the Portfolio operates in a “manager-of-managers” structure. The Board also considered New York Life Investments’ responsibilities and services provided pursuant to this structure, including overseeing the services provided by NYL Investors, evaluating the performance of NYL Investors, making recommendations to the Board as to whether the Subadvisory Agreement should be renewed, modified or terminated and periodically reporting to the Board regarding the results of New York Life Investments’ evaluation and monitoring functions. The Board noted that New York Life Investments manages other mutual funds, serves a variety of other investment advisory clients, including other pooled investment vehicles, and has experience overseeing mutual fund service providers, including subadvisors. The Board considered the experience of senior personnel at New York Life Investments providing management and administrative and other non-advisory services to the Portfolio. The Board observed that New York Life Investments devotes significant resources and time to providing management and administrative and other non-advisory services to the Portfolio, including New York Life Investments’ oversight and due diligence reviews of NYL Investors and ongoing analysis of, and interactions with, NYL Investors with respect to, among other things, the Portfolio’s investment performance and risks as well as NYL Investors’ investment capabilities and subadvisory services with respect to the Portfolio.
The Board also considered the range of services that New York Life Investments provides to the Portfolio under the terms of the Management Agreement, including: (i) fund accounting and ongoing supervisory services provided by New York Life Investments’ Fund Administration and Accounting Group; (ii) investment supervisory and analytical services provided by New York Life Investments’ Investment Consulting Group; (iii) compliance services provided by the Trust’s Chief Compliance Officer as well as New York Life Investments’ compliance department, including supervision and implementation of the Portfolio’s compliance program; (iv) legal services provided by New York Life Investments’ Office of the General Counsel; and (v) risk management monitoring and analysis by compliance and investment personnel. In addition, the Board considered New York Life Investments’ willingness to invest in personnel and other resources, such as cyber security, information security and business continuity planning, that may benefit the Portfolio and noted that New York Life Investments is responsible for compensating the Trust’s officers, except for a portion of the salary of the Trust’s Chief Compliance Officer. The Board recognized that New York Life Investments provides certain other non-advisory services to the Portfolio and has over time provided an increasingly broad array of non-advisory services to the MainStay Group of Funds as a result of regulatory and other developments.
The Board also examined the range, and the nature, extent and quality, of the investment advisory services that NYL Investors provides to the Portfolio and considered the terms of each of the Advisory Agreements. The Board evaluated NYL Investors’ experience and performance in serving as subadvisor to the Portfolio and advising other portfolios and NYL Investors’ track record and experience in providing investment advisory services as well as the experience of investment advisory, senior management and administrative personnel at NYL Investors. The Board considered New York Life Investments’ and NYL Investors’ overall resources, legal and compliance environment, capabilities, reputation, financial condition and history. In addition to information provided in connection with quarterly meetings with the Trust’s Chief Compliance Officer, the Board considered information regarding the compliance policies and procedures of New York Life Investments and NYL Investors and acknowledged their commitment to further developing and strengthening compliance programs that may relate to the Portfolio. The Board also considered NYL Investors’ ability to recruit and retain qualified investment professionals and willingness to invest in personnel and other resources that may benefit the Portfolio. In this regard, the Board considered the qualifications and experience of the Portfolio’s portfolio managers, the number of accounts managed by the portfolio managers and the method for compensating the portfolio managers.
In addition, the Board considered information provided by New York Life Investments and NYL Investors regarding their respective business continuity and disaster recovery plans.
Based on these considerations, among others, the Board concluded that the Portfolio would likely continue to benefit from the nature, extent and quality of these services.
| 48 | MainStay VP Floating Rate Portfolio |
Investment Performance
In evaluating the Portfolio’s investment performance, the Board considered investment performance results over various periods in light of the Portfolio’s investment objective, strategies and risks. The Board considered investment reports on, and analysis of, the Portfolio’s performance provided to the Board throughout the year. These reports include, among other items, information on the Portfolio’s gross and net returns, the Portfolio’s investment performance compared to a relevant investment category and the Portfolio’s benchmark, the Portfolio’s risk-adjusted investment performance and the Portfolio’s investment performance as compared to peer funds, as appropriate, as well as portfolio attribution information and commentary on the effect of market conditions. The Board also considered information provided by ISS showing the investment performance of the Portfolio as compared to peer funds. In addition, the Board reviewed the methodology used by ISS to construct the group of peer funds for comparative purposes.
The Board also took into account its discussions with senior management at New York Life Investments concerning the Portfolio’s investment performance over various periods as well as discussions between representatives of NYL Investors and the members of the Board’s Investment Committee, which generally occur on an annual basis.
Based on these considerations, among others, the Board concluded that its review of the Portfolio’s investment performance and related information supported a determination to approve the continuation of each of the Advisory Agreements.
Costs of the Services Provided, and Profits and Other Benefits Realized, by New York Life Investments and NYL Investors
The Board considered the costs of the services provided under each of the Advisory Agreements. The Board also considered the profitability of New York Life Investments and its affiliates, including NYL Investors, due to their relationships with the Portfolio as well as by New York Life Investments and its affiliates due to their relationships with the MainStay Group of Funds. Because NYL Investors is an affiliate of New York Life Investments whose subadvisory fee is paid by New York Life Investments, not the Portfolio, the Board considered cost and profitability information for New York Life Investments and NYL Investors in the aggregate.
In addition, the Board acknowledged the difficulty in obtaining reliable comparative data about mutual fund managers’ profitability because such information generally is not publicly available and may be impacted by numerous factors, including the structure of a fund manager’s organization, the types of funds it manages, the methodology used to allocate certain fixed costs to specific funds and the manager’s capital structure and costs of capital.
In evaluating the costs of the services provided by New York Life Investments and NYL Investors, and profitability of New York Life Investments and its affiliates, including NYL Investors due to their relationships with the Portfolio, the Board considered, among other
factors, New York Life Investments’ and its affiliates’, including NYL Investors’, continuing investments in, or willingness to invest in, personnel and other resources that may support and further enhance the management of the Portfolio, and that New York Life Investments is responsible for paying the subadvisory fee for the Portfolio. The Board also considered the financial resources of New York Life Investments and NYL Investors and acknowledged that New York Life Investments and NYL Investors must be in a position to recruit and retain experienced professional personnel and to maintain a strong financial position for New York Life Investments and NYL Investors to continue to provide high-quality services to the Portfolio. The Board recognized that the Portfolio benefits from the allocation of certain fixed costs among the funds in the MainStay Group of Funds, among other expected benefits resulting from its relationship with New York Life Investments.
The Board considered information regarding New York Life Investments’ methodology for calculating profitability and allocating costs provided by New York Life Investments in connection with the fund profitability analysis presented to the Board. The Board concluded that New York Life Investments’ methods for allocating costs and procedures for estimating overall profitability of the relationship with the funds in the MainStay Group of Funds were reasonable. The Board recognized the difficulty in calculating and evaluating a manager’s profitability with respect to the Portfolio and considered that other profitability methodologies may also be reasonable.
The Board also considered certain fall-out benefits that may be realized by New York Life Investments and its affiliates, including NYL Investors, due to their relationships with the Portfolio, including reputational and other indirect benefits. In addition, the Board considered its review of the management agreement for a money market fund advised by New York Life Investments and an affiliated subadvisor that serves as an investment option for the Portfolio, including the potential rationale for and costs associated with investments in this money market fund by the Portfolio, if any, and considered information from New York Life Investments that the nature and type of specific investment advisory services provided to this money market fund are distinct from, or in addition to, the investment advisory services provided to the Portfolio. In addition, the Board considered the potential dividend received tax deduction for insurance company affiliates of New York Life Investments from the Portfolio’s securities lending activity.
The Board noted that the Portfolio serves as an investment option primarily under variable contracts issued by affiliates of New York Life Investments that would receive fees under those contracts. The Board observed that, in addition to fees earned by New York Life Investments under the Management Agreement for managing the Portfolio, New York Life Investments’ affiliates also earn revenues from serving the Portfolio in various other capacities, including as the Portfolio’s distributor, and insurance companies affiliated with New York Life Investments would be entitled to receive fees from the Portfolio under a distribution and service plan adopted pursuant to Rule 12b-1 under the 1940 Act. The Board considered information about these other revenues and their impact on the profitability of the relationship with the Portfolio to New York Life
Board Consideration and Approval of Management Agreement and Subadvisory Agreement (Unaudited) (continued)
Investments and its affiliates. The Board noted that, although it assessed the overall profitability of the relationship with the Portfolio to New York Life Investments and its affiliates as part of the contract review process, when considering the reasonableness of the fee paid to New York Life Investments under the Management Agreement, the Board considered the profitability of New York Life Investments’ relationship with the Portfolio on a pre-tax basis and without regard to distribution expenses incurred by New York Life Investments from its own resources.
After evaluating the information deemed relevant by the Trustees, the Board concluded that any profits realized by New York Life Investments and its affiliates, including NYL Investors, due to their relationships with the Portfolio were not excessive and other expected benefits that may accrue to New York Life Investments and its affiliates, including NYL Investors, are reasonable.
Management and Subadvisory Fees and Total Ordinary Operating Expenses
The Board evaluated the reasonableness of the fee paid under each of the Advisory Agreements and the Portfolio’s total ordinary operating expenses. With respect to the management fee and subadvisory fee, the Board primarily considered the reasonableness of the management fee paid by the Portfolio to New York Life Investments because the subadvisory fee paid to NYL Investors is paid by New York Life Investments, not the Portfolio. The Board also considered the reasonableness of the subadvisory fee paid by New York Life Investments and the amount of the management fee retained by New York Life Investments.
In assessing the reasonableness of the Portfolio’s fees and expenses, the Board primarily considered comparative data provided by ISS on the fees and expenses of similar mutual funds managed by other investment advisers. The Board reviewed the methodology used by ISS to construct the group of peer funds for comparative purposes. In addition, the Board considered information provided by New York Life Investments and NYL Investors on fees charged to other investment advisory clients, including institutional separate accounts and/or other funds, that follow investment strategies similar to those of the Portfolio, if any. The Board considered the contractual management fee schedule for the Portfolio as compared to those for such other investment advisory clients, taking into account the rationale for differences in fee schedules. The Board also took into account information provided by New York Life Investments about the more extensive scope of services provided to registered investment companies, such as the Portfolio, as compared with other investment advisory clients. Additionally, the Board considered the impact of contractual breakpoints and voluntary waivers on the Portfolio’s net management fee and expenses.
The Board also considered that in proposing fees for the Portfolio, New York Life Investments considers the competitive marketplace for mutual funds.
Based on the factors outlined above, among other considerations, the Board concluded that the Portfolio’s management fee and total ordinary operating expenses are within a range that is competitive and support a conclusion that these fees and expenses are reasonable.
Economies of Scale
The Board considered information regarding economies of scale, including whether economies of scale may exist with respect to the Portfolio and whether the Portfolio’s management fee and expense structure permits any economies of scale to be appropriately shared with the Portfolio’s shareholders. The Board also considered a report from New York Life Investments, previously prepared at the request of the Board, that addressed economies of scale, including with respect to the mutual fund business generally, and the various ways in which the benefits of economies of scale may be shared with the funds in the MainStay Group of Funds. Although the Board recognized the difficulty of determining economies of scale with precision, the Board acknowledged that economies of scale may be shared with the Portfolio in a number of ways, including, for example, through the imposition of fee breakpoints, initially setting management fee rates at scale or making additional investments to enhance the services provided to the Portfolio. The Board reviewed information from New York Life Investments showing how the Portfolio’s management fee schedule compared to fee schedules of other funds and accounts managed by New York Life Investments. The Board also reviewed information from ISS showing how the Portfolio’s management fee schedule compared with fees paid for similar services by peer funds at varying asset levels.
Based on this information, the Board concluded that economies of scale are appropriately shared for the benefit of the Portfolio’s shareholders through the Portfolio’s management fee and expense structure and other methods to share benefits from economies of scale.
Conclusion
On the basis of the information and factors summarized above, among other information and factors deemed relevant by the Trustees, and the evaluation thereof, the Board, including the Independent Trustees voting separately, unanimously voted to approve the continuation of each of the Advisory Agreements.
| 50 | MainStay VP Floating Rate Portfolio |
Proxy Voting Policies and Procedures and Proxy Voting Record
The Portfolio is required to file with the SEC its proxy voting record for the 12-month period ending June 30 on Form N-PX. A description of the policies and procedures that are used to vote proxies relating to portfolio securities of the Portfolio is available free of charge upon request by calling 800-598-2019 or visiting the SEC's website at www.sec.gov. The most recent Form N-PX or proxy voting record is available free of charge upon request by calling 800-598-2019; visiting https://www.newyorklifeinvestments.com/investment-products/vp; or visiting the SEC’s website at www.sec.gov.
Shareholder Reports and Quarterly Portfolio Disclosure
The Portfolio is required to file its complete schedule of portfolio holdings with the SEC 60 days after its first and third fiscal quarter on Form N-PORT. The Portfolio's holdings report is available free of charge upon request by calling 800-598-2019 or by visiting the SEC’s website at www.sec.gov.
Board of Trustees and Officers (Unaudited)
The Trustees and officers of the Portfolio are listed below. The Board oversees the MainStay Group of Funds (which consists of MainStay Funds and MainStay Funds Trust), MainStay VP Funds Trust, MainStay MacKay DefinedTerm Municipal Opportunities Fund, MainStay CBRE Global Infrastructure Megatrends Term Fund, the Manager and the Subadvisors, and elects the officers of the Portfolios who are responsible for the day-to-day operations of the Portfolio. Information pertaining to the Trustees and officers is set forth below. Each Trustee serves until his or her successor is elected and qualified or until his or her resignation,
death or removal. Under the Board’s retirement policy, unless an exception is made, a Trustee must tender his or her resignation by the end of the calendar year during which he or she reaches the age of 75. Officers are elected annually by the Board. The business address of each Trustee and officer listed below is 51 Madison Avenue, New York, New York 10010. A majority of the Trustees are not “interested persons” (as defined by the 1940 Act and rules adopted by the SEC thereunder) of the Portfolio (“Independent Trustees”).
| | Name and
Year of Birth | Term of Office,
Position(s) Held and
Length of Service | Principal Occupation(s)
During Past Five Years | Number of
Portfolios in
Fund Complex
Overseen by
Trustee | Other Directorships
Held by Trustee |
| | | | | | |
| | Naïm Abou-Jaoudé*
1966 | MainStay VP Funds Trust: Trustee since 2023 | Chief Executive Officer of New York Life Investment Management LLC (since 2023). Chief Executive Officer of Candriam (an affiliate of New York Life Investment Management LLC) (2007 to 2023). | 81 | MainStay Funds: Trustee since 2023 (11 Funds)
MainStay Funds Trust: Trustee since 2023 (37 Funds);
MainStay MacKay DefinedTerm Municipal Opportunities Fund: Trustee since 2023;
MainStay CBRE Global Infrastructure Megatrends Term Fund: Trustee since 2023; and
New York Life Investment Management International (Chair) since 2015 |
| * | This Trustee is considered to be an “interested person” of the MainStay Group of Funds, MainStay VP Funds Trust, MainStay CBRE Global Infrastructure Megatrends Term Fund and MainStay MacKay DefinedTerm Municipal Opportunities Fund, within the meaning of the 1940 Act because of his affiliation with New York Life Investment Management LLC and Candriam, as described in detail above in the column entitled “Principal Occupation(s) During Past Five Years.” |
| | |
| 52 | MainStay VP Floating Rate Portfolio |
| | Name and
Year of Birth | Term of Office,
Position(s) Held and
Length of Service | Principal Occupation(s)
During Past Five Years | Number of
Portfolios in
Fund Complex
Overseen by
Trustee | Other Directorships
Held by Trustee |
| | | | | | |
| | David H. Chow
1957 | MainStay VP Funds Trust: Trustee since January 2016, Advisory Board Member (June 2015 to December 2015) | Founder and CEO, DanCourt Management, LLC since 1999 | 81 | MainStay Funds: Trustee since January 2016, Advisory Board Member (June 2015 to December 2015) (11 Funds);
MainStay Funds Trust: Trustee since January 2016, Advisory Board Member (June 2015 to December 2015) (37 Funds);
MainStay MacKay DefinedTerm Municipal Opportunities Fund: Trustee since January 2016, Advisory Board Member (June 2015 to December 2015);
MainStay CBRE Global Infrastructure Megatrends Term Fund: Trustee since 2021;
VanEck Vectors Group of Exchange-Traded Funds: Trustee since 2006 and Independent Chairman of the Board of Trustees from 2008 to 2022 (57 portfolios); and
Berea College of Kentucky: Trustee since 2009, Chair of the Investment Committee since 2018 |
| | Karen Hammond
1956 | MainStay VP Funds Trust: Trustee since December 2021, Advisory Board Member (June 2021 to December 2021)
| Retired, Managing Director, Devonshire Investors (2007 to 2013); Senior Vice President, Fidelity Management & Research Co. (2005 to 2007); Senior Vice President and Corporate Treasurer, FMR Corp. (2003 to 2005); Chief Operating Officer, Fidelity Investments Japan (2001 to 2003) | 81 | MainStay Funds: Trustee since December 2021, Advisory Board Member (June 2021 to December 2021) (11 Funds);
MainStay Funds Trust: Trustee since December 2021, Advisory Board Member (June 2021 to December 2021) (37 Funds);
MainStay MacKay DefinedTerm Municipal Opportunities Fund: Trustee since December 2021, Advisory Board Member (June 2021 to December 2021);
MainStay CBRE Global Infrastructure Megatrends Term Fund: Trustee since December 2021, Advisory Board Member (June 2021 to December 2021);
Two Harbors Investment Corp.: Director since 2018;
Rhode Island State Investment Commission: Member since 2017; and
Blue Cross Blue Shield of Rhode Island: Director since 2019 |
| | Susan B. Kerley
1951 | MainStay VP Funds Trust: Chair since 2017 and Trustee since 2007** | President, Strategic Management Advisors LLC since 1990 | 81 | MainStay Funds: Chair since January 2017 and Trustee since 2007 (11 Funds); MainStay Funds Trust: Chair since January 2017 and Trustee since 1990 (37 Funds)***;
MainStay MacKay DefinedTerm Municipal Opportunities Fund: Chair since January 2017 and Trustee since 2011;
MainStay CBRE Global Infrastructure Megatrends Term Fund: Trustee since June 2021; and
Legg Mason Partners Funds: Trustee since 1991 (45 portfolios) |
Board of Trustees and Officers (Unaudited) (continued)
| | Name and
Year of Birth | Term of Office,
Position(s) Held and
Length of Service | Principal Occupation(s)
During Past Five Years | Number of
Portfolios in
Fund Complex
Overseen by
Trustee | Other Directorships
Held by Trustee |
| | | | | | |
| | Alan R. Latshaw
1951 | MainStay VP Funds Trust: Trustee since 2007** | Retired; Partner, Ernst & Young LLP (2002 to 2003); Partner, Arthur Andersen LLP (1989 to 2002); Consultant to the MainStay Funds Audit and Compliance Committee (2004 to 2006) | 81 | MainStay Funds: Trustee since 2006 (11 Funds);
MainStay Funds Trust: Trustee since 2007 (37 Funds)***;
MainStay MacKay DefinedTerm Municipal Opportunities Fund: Trustee since 2011; and
MainStay CBRE Global Infrastructure Megatrends Term Fund: Trustee since June 2021 |
| | Jacques P. Perold
1958 | MainStay VP Funds Trust: Trustee since January 2016, Advisory Board Member (June 2015 to December 2015) | Founder and Chief Executive Officer, CapShift Advisors LLC (since 2018); President, Fidelity Management & Research Company (2009 to 2014); President and Chief Investment Officer, Geode Capital Management, LLC (2001 to 2009) | 81 | MainStay Funds: Trustee since January 2016, Advisory Board Member (June 2015 to December 2015) (11 Funds);
MainStay Funds Trust: Trustee since January 2016, Advisory Board Member (June 2015 to December 2015) (37 Funds);
MainStay MacKay DefinedTerm Municipal Opportunities Fund: Trustee since January 2016, Advisory Board Member (June 2015 to December 2015);
MainStay CBRE Global Infrastructure Megatrends Term Fund: Trustee since June 2021;
Allstate Corporation: Director since 2015;
Partners in Health: Trustee since 2019; and
MSCI Inc.: Director since 2017 |
| | Richard S. Trutanic
1952 | MainStay VP Funds Trust: Trustee since 2007** | Chairman and Chief Executive Officer, Somerset & Company (financial advisory firm) since 2004; Managing Director, The Carlyle Group (private investment firm) (2002 to 2004); Senior Managing Director, Partner and Board Member, Groupe Arnault S.A. (private investment firm) (1999 to 2002) | 81 | MainStay Funds: Trustee since 1994 (11 Funds);
MainStay Funds Trust: Trustee since 2007 (37 Funds)***;
MainStay MacKay DefinedTerm Municipal Opportunities Fund: Trustee since 2011; and
MainStay CBRE Global Infrastructure Megatrends Term Fund: Trustee since June 2021 |
| ** | Includes prior service as a Director of MainStay VP Series Fund, Inc., the predecessor to MainStay VP Funds Trust. |
| *** | Includes prior service as a Director/Trustee of certain predecessor entities to MainStay Funds Trust. |
| 54 | MainStay VP Floating Rate Portfolio |
| | Name and
Year of Birth | Position(s) Held and
Length of Service | Principal Occupation(s)
During Past Five Years | |
| | | | | |
| | Kirk C. Lehneis
1974 | President, MainStay VP Funds Trust (since 2017) | Chief Operating Officer and Senior Managing Director (since 2016), New York Life Investment Management LLC and New York Life Investment Management Holdings LLC; Member of the Board of Managers (since 2017) and Senior Managing Director (since 2018), NYLIFE Distributors LLC; Chairman of the Board and Senior Managing Director, NYLIM Service Company LLC (since 2017); Trustee, President and Principal Executive Officer of IndexIQ Trust, IndexIQ ETF Trust and IndexIQ Active ETF Trust (since 2018); President, MainStay CBRE Global Infrastructure Megatrends Term Fund (since 2021), MainStay MacKay DefinedTerm Municipal Opportunities Fund, MainStay Funds and MainStay Funds Trust (since 2017); Senior Managing Director, Global Product Development (from 2015 to 2016); Managing Director, Product Development (from 2010 to 2015), New York Life Investment Management LLC | |
| | Jack R. Benintende
1964 | Treasurer and Principal Financial and Accounting Officer, MainStay VP Funds Trust (since 2007)** | Managing Director, New York Life Investment Management LLC (since 2007); Treasurer and Principal Financial and Accounting Officer, MainStay CBRE Global Infrastructure Megatrends Term Fund (since 2021), MainStay MacKay DefinedTerm Municipal Opportunities Fund (since 2011), MainStay Funds Trust (since 2009) and MainStay Funds (since 2007); and Assistant Treasurer, New York Life Investment Management Holdings LLC (2008 to 2012) | |
| | J. Kevin Gao
1967 | Secretary and Chief Legal Officer, MainStay VP Funds Trust (since 2010)** | Managing Director and Associate General Counsel, New York Life Investment Management LLC (since 2010); Secretary and Chief Legal Officer, MainStay CBRE Global Infrastructure Megatrends Term Fund (since 2021), MainStay MacKay DefinedTerm Municipal Opportunities Fund (since 2011), MainStay Funds and MainStay Funds Trust (since 2010) | |
| | Kevin M. Gleason
1967 | Vice President and Chief Compliance Officer, MainStay VP Funds Trust (since June 2022) | Vice President and Chief Compliance Officer, IndexIQ Trust, IndexIQ ETF Trust and IndexIQ Active ETF Trust (since June 2022); Vice President and Chief Compliance Officer, MainStay CBRE Global Infrastructure Megatrends Term Fund, MainStay MacKay DefinedTerm Municipal Opportunities Fund (since June 2022); MainStay Funds Trust and MainStay Funds (since June 2022); Senior Vice President, Voya Investment Management and Chief Compliance Officer, Voya Family of Funds (2012 to 2022) | |
| | Scott T. Harrington
1959 | Vice President— Administration, MainStay VP Funds Trust (since 2005)** | Managing Director, New York Life Investment Management LLC (including predecessor advisory organizations) (since 2000); Member of the Board of Directors, New York Life Trust Company (since 2009); Vice President—Administration, MainStay CBRE Global Infrastructure Megatrends Term Fund (since 2021), MainStay MacKay DefinedTerm Municipal Opportunities Fund (since 2011), MainStay Funds Trust and MainStay Funds (since 2009) | |
| * | The officers listed above are considered to be “interested persons” of the MainStay Group of Funds, MainStay VP Funds Trust, MainStay CBRE Global Infrastructure Megatrends Term Fund and MainStay MacKay DefinedTerm Municipal Opportunities Fund within the meaning of the 1940 Act because of their affiliation with the MainStay Group of Funds, New York Life Insurance Company and/or its affiliates, including New York Life Investment Management LLC, New York Life Insurance Company, NYLIM Service Company LLC, NYLIFE Securities LLC and/or NYLIFE Distributors LLC, as described in detail in the column captioned “Principal Occupation(s) During Past Five Years.” Officers are elected annually by the Board. |
| ** | Includes prior service as an Officer of MainStay VP Series Fund, Inc., the predecessor to MainStay VP Funds Trust. |
Officers of the Trust (Who are not Trustees)*
This page intentionally left blank.
This page intentionally left blank.
This page intentionally left blank.
MainStay VP Portfolios
MainStay VP offers a wide range of Portfolios. The full array of MainStay VP offerings is listed here, with information about the manager, subadvisors, legal counsel, and independent registered public accounting firm.
Equity
MainStay VP American Century Sustainable Equity Portfolio
MainStay VP Candriam Emerging Markets Equity Portfolio
MainStay VP Epoch U.S. Equity Yield Portfolio
MainStay VP Fidelity Institutional AM® Utilities Portfolio†
MainStay VP Natural Resources Portfolio
MainStay VP PineStone International Equity Portfolio1
MainStay VP S&P 500 Index Portfolio
MainStay VP Small Cap Growth Portfolio
MainStay VP Wellington Growth Portfolio
MainStay VP Wellington Mid Cap Portfolio
MainStay VP Wellington Small Cap Portfolio
MainStay VP Wellington U.S. Equity Portfolio
MainStay VP Winslow Large Cap Growth Portfolio
Mixed Asset
MainStay VP Balanced Portfolio
MainStay VP Income Builder Portfolio
MainStay VP Janus Henderson Balanced Portfolio
MainStay VP MacKay Convertible Portfolio
Income
MainStay VP Bond Portfolio
MainStay VP Floating Rate Portfolio
MainStay VP Indexed Bond Portfolio
MainStay VP MacKay Government Portfolio2
MainStay VP MacKay High Yield Corporate Bond Portfolio
MainStay VP MacKay Strategic Bond Portfolio
MainStay VP PIMCO Real Return Portfolio
Money Market
MainStay VP U.S. Government Money Market Portfolio
Alternative
MainStay VP CBRE Global Infrastructure Portfolio
MainStay VP IQ Hedge Multi-Strategy Portfolio
Asset Allocation
MainStay VP Conservative Allocation Portfolio
MainStay VP Equity Allocation Portfolio
MainStay VP Growth Allocation Portfolio
MainStay VP Moderate Allocation Portfolio
Manager
New York Life Investment Management LLC
New York, New York
Subadvisors
American Century Investment Management, Inc.
Kansas City, Missouri
Brown Advisory LLC
Baltimore, Maryland
Candriam*
Strassen, Luxembourg
CBRE Investment Management Listed Real Assets LLC
Radnor, Pennsylvania
Epoch Investment Partners, Inc.
New York, New York
FIAM LLC
Smithfield, Rhode Island
IndexIQ Advisors LLC*
New York, New York
Janus Henderson Investors US LLC
Denver, Colorado
MacKay Shields LLC*
New York, New York
Newton Investment Management North America, LLC
Boston, Massachusetts
NYL Investors LLC*
New York, New York
Pacific Investment Management Company LLC
Newport Beach, California
PineStone Asset Management Inc.
Montreal, Québec
Segall Bryant & Hamill, LLC
Chicago, Illinois
Wellington Management Company LLP
Boston, Massachusetts
Winslow Capital Management, LLC
Minneapolis, Minnesota
Legal Counsel
Dechert LLP
Washington, District of Columbia
Independent Registered Public Accounting Firm
PricewaterhouseCoopers LLP
New York, New York
Distributor
NYLIFE Distributors LLC*
Jersey City, New Jersey
Custodian
JPMorgan Chase Bank, N.A.
New York, New York
Some Portfolios may not be available in all products.
† Fidelity Institutional AM is a registered trade mark of FMR LLC. Used with permission.
* An affiliate of New York Life Investment Management LLC.
| 1. | Prior to August 28, 2023, the Portfolio's name was MainStay VP MacKay International Equity Portfolio. |
| 2. | Effective on or about May 1, 2024, the MainStay VP MacKay Government Portfolio will be renamed the MainStay VP U.S. Infrastructure Bond Portfolio. |
Not part of the Annual Report
2023 Annual Report
This report is for the general information of New York Life Variable Annuities and NYLIAC Variable Universal Life Insurance Products policyowners. It must be preceded or accompanied by the appropriate product(s) and funds prospectuses if it is given to anyone who is not an owner of a New York Life variable annuity policy or a NYLIAC Variable Universal Life Insurance Product. This report does not offer for sale or solicit orders to purchase securities.
The performance data quoted in this report represents past performance. Past performance is no guarantee of future results. Due to market volatility and other factors, current performance may be lower or higher than the figures shown. The most recent month-end performance summary for your variable annuity or variable life policy is available by calling 800-598-2019 and is updated periodically on newyorklife.com.
The New York Life Variable Annuities and NYLIAC Variable Universal Life Insurance Products are issued by New York Life Insurance and Annuity Corporation (a Delaware Corporation) and distributed by NYLIFE Distributors LLC (Member FINRA/SIPC).
New York Life Insurance Company
New York Life Insurance and Annuity
Corporation (NYLIAC) (A Delaware Corporation)
51 Madison Avenue, Room 551
New York, NY 10010
newyorklife.com
newyorklifeinvestments.com
NYLIFE Distributors LLC, 30 Hudson Street, Jersey City, NJ 07302
New York Life Investment Management LLC is the investment manager to the MainStay VP Funds Trust
©2024 by NYLIFE Distributors LLC. All rights reserved.
You may obtain copies of the Prospectus and the Statement of Additional Information free of charge, upon request, by calling toll-free 800-598-2019 or writing to New York Life Insurance and Annuity Corporation, 51 Madison Avenue, New York, NY 10010.
| Not FDIC Insured | No Bank Guarantee | May Lose Value |
(NYLIAC) NI518
MainStay VP MacKay High Yield Corporate Bond Portfolio
Message from the President and Annual Report
December 31, 2023
Special Notice:
Beginning in July 2024, new regulations issued by the Securities and Exchange Commission (SEC) will take effect requiring open-end mutual fund companies and ETFs to (1) overhaul the content of their shareholder reports and (2) mail paper copies of the new tailored shareholder reports to shareholders who have not opted to receive these documents electronically.
If you have not yet elected to receive your shareholder reports electronically, please contact your financial intermediary or visit our website.
| Not FDIC/NCUA Insured | Not a Deposit | May Lose Value | No Bank Guarantee | Not Insured by Any Government Agency |
This page intentionally left blank
Message from the President
Against a backdrop of easing inflationary pressures and continued economic growth, stocks and bonds generally gained ground during the 12-month period ended December 31, 2023, despite high levels of volatility and sharp disparities between the performance of the different market sectors.
Although the war in Ukraine, the outbreak of hostilities in the Middle East and several other notable events affected financial assets, inflation, interest rate, and economic growth trends stood at the forefront of market developments during most of the period. As the reporting period began, high levels of inflation already showed signs of easing in the face of aggressive rate hikes by U.S. Federal Reserve (the “Fed”). From a peak of 9.1% in June 2022, the annualized U.S. inflation rate dropped to 6.4% in January, and 3.4% in December 2023. At the same time, the Fed increased the benchmark federal funds rate from 4.25%–4.50% at the beginning of reporting period, to 5.25%–5.50% as of the end of 2023. Despite the increasing cost of capital and tighter lending environment that resulted from rising rates, economic growth remained surprisingly robust, bolstered by high levels of consumer spending, low levels of unemployment and better-than-expected corporate earnings. With the pace of rate increases slowing from the prior year, investors began hoping for an early shift to a looser monetary policy, with stock prices and bond yields reacting as economic data and statements from the Fed either reinforced or undercut those hopes. Following months of hawkish rhetoric, the Fed finally reversed its stance in December 2023, signaling a positive economic outlook with little chance of a recession and a likelihood of rate cuts in 2024.
The S&P 500® Index, a widely regarded benchmark of U.S. market performance, produced strong gains during the reporting period-– recovering all its losses from 2022 and approached new record territory. A preponderance of the Index’s gains were generated by a relatively small number of mega-cap stocks in the information technology, communication services and consumer discretionary sectors that stood to benefit from rapid developments in generative artificial intelligence (“AI”). Value-oriented, interest-rate sensitive and small-capitalization
shares lagged by significant margins, although market strength widened during the closing weeks of the reporting period. Most overseas equity markets trailed the U.S. market, as developed international economies experienced relatively low growth rates, and weak economic conditions in China undermined emerging markets.
Bonds produced generally positive returns, bolstered by attractive and relatively stable yields. The yield on the 10-year Treasury note hit a high of just under 5% in mid-October 2023, ranging between approximately 3.5% and 4.8% for most of the reporting period. The yield curve remained inverted throughout the year, with the 2-year Treasury yield modestly above the 10-year yield. Corporate bond prices trended moderately higher, generally outperforming government securities. After years of low yields and tight credit spreads, the corporate sector benefited from more attractive valuations and income opportunities. Among corporates, markets generally rewarded longer duration and lower credit quality, although an uptick in default rates posed added risks for high-yield corporate bonds. International bond markets produced mixed returns, with emerging-markets issues advancing over their developed-markets counterparts.
The market volatility of recent years reminds us of the constant need for experienced and steadfast portfolio management in the face of uncertainty. New York Life Investments remains dedicated to providing you, as a valued MainStay VP investor, with the guidance, resources and investment solutions you need to pursue your financial goals.
Thank you for trusting us to help meet your investment needs.
Sincerely,
Kirk C. Lehneis
President
The opinions expressed are as of the date of this report and are subject to change. There is no guarantee that any forecast made will come to pass. This material does not constitute investment advice and is not intended as an endorsement of any specific investment. Past performance is no guarantee of future results.
Not part of the Annual Report
Investors should refer to the Portfolio’s Summary Prospectus and/or Prospectus and consider the Portfolio’s investment objectives, strategies, risks, charges and expenses carefully before investing. The Summary Prospectus and/or Prospectus contain this and other information about the Portfolio. You may obtain copies of the Portfolio’s Summary Prospectus, Prospectus and Statement of Additional Information, which includes information about the MainStay VP Funds Trust's Trustees, free of charge, upon request, by calling toll-free 800-598-2019, by writing to New York Life Insurance and Annuity Corporation, 51 Madison Avenue, Room 251, New York, New York 10010 or by sending an email to MainStayShareholdersServices@nylim.com. These documents are also available at newyorklifeinvestments.com/investment-products/vp. Please read the Portfolio's Summary Prospectus and/or Prospectus carefully before investing. MainStay VP Funds Trust portfolios are separate account options which are purchased through a variable insurance or variable annuity contract.
Investment and Performance Comparison (Unaudited)
Performance data quoted represents past performance. Past performance is no guarantee of future results. Because of market volatility and other factors, current performance may be lower or higher than the figures shown. Investment return and principal value will fluctuate, and as a result, when shares are redeemed, they may be worth more or less than their original cost. The performance table and graph do not reflect any deduction of sales charges, mortality and expense charges, contract charges or administrative charges. Please refer to the Performance Summary appropriate for your policy. For performance information current to the most recent month-end, please call 800-598-2019 or visit www.newyorklife.com.
Performance figures may reflect certain fee waivers and/or expense limitations, without which total returns may have been different. For information on current fee waivers and/or expense limitations (if any), please refer to the Notes to Financial Statements.
| Average Annual Total Returns for the Year-Ended December 31, 2023 |
| Class | Inception
Date | One
Year | Five
Years | Ten
Years | Gross
Expense
Ratio1 |
| Initial Class Shares | 5/1/1995 | 11.87% | 5.31% | 4.73% | 0.58% |
| Service Class Shares | 6/4/2003 | 11.59 | 5.04 | 4.47 | 0.83 |
| 1. | The gross expense ratios presented reflect the Portfolio’s “Total Annual Portfolio Operating Expenses” from the most recent Prospectus and may differ from other expense ratios disclosed in this report. |
| Benchmark Performance* | One
Year | Five
Years | Ten
Years |
| ICE BofA U.S. High Yield Constrained Index1 | 13.47% | 5.19% | 4.51% |
| Morningstar High Yield Bond Category Average2 | 12.08 | 4.70 | 3.68 |
| * | Returns for indices reflect no deductions for fees, expenses or taxes, except for foreign withholding taxes where applicable. Results assume reinvestment of all dividends and capital gains. An investment cannot be made directly in an index. |
| 1. | The ICE BofA U.S. High Yield Constrained Index is the Portfolio's primary broad-based securities market index for comparison purposes. The ICE BofA U.S. High Yield Constrained Index is a market value-weighted index of all domestic and Yankee high-yield bonds, including deferred interest bonds and payment-in-kind securities. Issuers included in the ICE BofA U.S. High Yield Constrained Index have maturities of one year or more and have a credit rating lower than BBB-/Baa3, but are not in default. No single issuer may constitute greater than 2% of the ICE BofA U.S. High Yield Constrained Index. |
| 2. | The Morningstar High Yield Bond Category Average is representative of funds that concentrate on lower-quality bonds, which are riskier than those of higher-quality companies. These funds primarily invest in U.S. high-income debt securities where at least 65% or more of bond assets are not rated or are rated by a major agency such as Standard & Poor’s or Moody’s at the level of BB and below. Results are based on average total returns of similar funds with all dividends and capital gain distributions reinvested. |
Cost in Dollars of a $1,000 Investment in MainStay VP MacKay High Yield Corporate Bond Portfolio (Unaudited)
The example below is intended to describe the fees and expenses borne by shareholders during the six-month period from July 1, 2023 to December 31, 2023, and the impact of those costs on your investment.
Example
As a shareholder of the Portfolio you incur two types of costs: (1) transaction costs, including exchange fees and sales charges (loads) on purchases (as applicable), and (2) ongoing costs, including management fees, distribution and/or service (12b-1) fees and other Portfolio expenses (as applicable). This example is intended to help you understand your ongoing costs (in dollars) of investing in the Portfolio and to compare these costs with the ongoing costs of investing in other mutual funds. The example is based on an investment of $1,000 made at the beginning of the six-month period and held for the entire period from July 1, 2023 to December 31, 2023. Shares are only sold in connection with variable life and annuity contracts and the example does not reflect any contract level or transactional fees or expenses. If these costs had been included, your costs would have been higher.
This example illustrates your Portfolio’s ongoing costs in two ways:
Actual Expenses
The second and third data columns in the table below provide information about actual account values and actual expenses. You may use the information in these columns, together with the amount you invested, to estimate the expenses that you paid during the six months ended
December 31, 2023. Simply divide your account value by $1,000 (for example, an $8,600 account value divided by $1,000 = 8.6), then multiply the result by the number under the heading entitled “Expenses Paid During Period” to estimate the expenses you paid on your account during this period.
Hypothetical Example for Comparison Purposes
The fourth and fifth data columns in the table below provide information about hypothetical account values and hypothetical expenses based on the Portfolio’s actual expense ratio and an assumed rate of return of 5% per year before expenses, which is not the Portfolio’s actual return. The hypothetical account values and expenses may not be used to estimate the actual ending account balances or expenses you paid for the six-month period shown. You may use this information to compare the ongoing costs of investing in the Portfolio with the ongoing costs of investing in other mutual funds. To do so, compare this 5% hypothetical example with the 5% hypothetical examples that appear in the shareholder reports of the other mutual funds.
Please note that the expenses shown in the table are meant to highlight your ongoing costs only and do not reflect any transactional costs, such as exchange fees or sales charges (loads). Therefore, the fourth and fifth data columns of the table are useful in comparing ongoing costs only and will not help you determine the relative total costs of owning different funds. In addition, if these transactional costs were included, your costs would have been higher.
| Share Class | Beginning
Account
Value
7/1/23 | Ending Account
Value (Based
on Actual
Returns and
Expenses)
12/31/23 | Expenses
Paid
During
Period1 | Ending Account
Value (Based
on Hypothetical
5% Annualized
Return and
Actual Expenses)
12/31/23 | Expenses
Paid
During
Period1 | Net Expense
Ratio
During
Period2 |
| Initial Class Shares | $1,000.00 | $1,064.50 | $3.02 | $1,022.28 | $2.96 | 0.58% |
| Service Class Shares | $1,000.00 | $1,063.20 | $4.32 | $1,021.02 | $4.23 | 0.83% |
| 1. | Expenses are equal to the Portfolio’s annualized expense ratio of each class multiplied by the average account value over the period, divided by 365 and multiplied by 184 (to reflect the six-month period). The table above represents the actual expenses incurred during the six-month period. In addition to the fees and expenses which the Portfolio bears directly, it also indirectly bears a pro rata share of the fees and expenses of the underlying funds in which it invests. Such indirect expenses are not included in the above-reported expense figures. |
| 2. | Expenses are equal to the Portfolio's annualized expense ratio to reflect the six-month period. |
| 6 | MainStay VP MacKay High Yield Corporate Bond Portfolio |
Portfolio Composition as of December 31, 2023 (Unaudited)
‡ Less than one-tenth of percent.
See Portfolio of Investments beginning on page 9 for specific holdings within these categories. The Portfolio's holdings are subject to change.
Top Ten Holdings and/or Issuers Held as of December 31, 2023 (excluding short-term investments) (Unaudited)
| 1. | CCO Holdings LLC, 4.25%-5.375%, due 5/1/27–1/15/34 |
| 2. | TransDigm, Inc., 4.625%-7.50%, due 3/15/26–12/1/31 |
| 3. | HCA, Inc., 5.375%-8.36%, due 4/15/24–11/6/33 |
| 4. | Yum! Brands, Inc., 3.625%-6.875%, due 1/15/30–11/15/37 |
| 5. | Carnival Corp., 4.00%-9.875%, due 3/1/27–5/1/29 |
| 6. | Sprint Capital Corp., 6.875%, due 11/15/28 |
| 7. | Churchill Downs, Inc., 4.75%-6.75%, due 4/1/27–5/1/31 |
| 8. | IHO Verwaltungs GmbH, 4.75%-6.375%, due 9/15/26–5/15/29 |
| 9. | VICI Properties LP, 3.875%-5.75%, due 5/1/24–2/15/29 |
| 10. | MSCI, Inc., 3.25%-4.00%, due 11/15/29–8/15/33 |
Portfolio Management Discussion and Analysis (Unaudited)
Answers to the questions reflect the views of portfolio manager Andrew Susser of MacKay Shields LLC, the Portfolio’s Subadvisor.
How did MainStay VP MacKay High Yield Corporate Bond Portfolio perform relative to its benchmark and peers during the 12 months ended December 31, 2023?
For the 12 months ended December 31, 2023, MainStay VP MacKay High Yield Corporate Bond Portfolio returned 11.87% for Initial Class shares and 11.59% for Service Class shares. Over the same period, both share classes underperformed the 13.47% return of the ICE BofA U.S. High Yield Constrained Index (“the Index”), which is the Portfolio’s benchmark, and the 12.08% return of the Morningstar High Yield Bond Category Average.1
What factors affected the Portfolio’s relative performance during the reporting period?
Markets were influenced by the strong return of riskier credits, which was particularly pronounced in the fourth quarter of 2023, this, coupled with the volatility in interest rates, had a big impact on returns during the period. Riskier CCC-rated credits2 were up about 9% in the quarter and distressed credits were up 12%. The yield on the 5-year Treasury note tightened by 75 basis points (from approximately 4.72% at the beginning of the quarter to approximately 3.85% by the end). (A basis point is one one-hundredth of a percentage point.) Although the Portfolio’s credit selection was strong throughout the reporting period, underweight exposure to higher performing riskier credits relative to the Index, resulted in the Portfolio’s underperformance.
What was the Portfolio’s duration3 strategy during the reporting period?
The Portfolio’s duration is the result of our bottom-up fundamental analysis and is residual of the investment process. However, the Portfolio had a lower duration relative to the Index throughout the reporting period. As of the end of the reporting period, the Portfolio’s duration was approximately a half year below the duration of the Index.
What specific factors, risks or market forces prompted significant decisions for the Portfolio during the reporting period?
During the reporting period, there were no material changes to the sector weightings in the Portfolio. Throughout the reporting period, we continued to favor higher quality companies with good balance sheets and a duration below that of the Index.
During the reporting period, which market segments were the strongest positive contributors to the Portfolio’s absolute performance and which market segments were particularly weak?
The sectors that made the strongest contributions to the Portfolio’s absolute performance during the reporting period included energy, basic industry and retail (Contributions take weightings and total returns into account.) Positions in real estate, transportation and consumer goods, although positive in return, were the weakest contributors.
Did the Portfolio make any significant purchases or sales during the reporting period?
During the reporting period, the Portfolio initiated positions in offshore oil & gas driller Transocean, Inc. and electronic gaming company Light and Wonder International. During the same period, we closed the Portfolio’s positions in travel management company Carlson Travel, packaged food provider Treehouse Foods and midstream energy company Cheniere. Cheniere had recently been upgraded to investment grade.
How did the Portfolio’s sector weightings change during the reporting period?
During the reporting period, there were no material changes to the sector weightings in the Portfolio. On the margin, we slightly increased the Portfolio’s exposure to the automotive, capital goods and services sectors, while trimming holdings in financials, real estate and telecommunications.
How was the Portfolio positioned at the end of the reporting period?
As of December 31, 2023, the Portfolio held overweight positions relative to the Index in the energy, materials and health care sectors, and underweight positions in telecommunications, technology and services.
| 1. | See "Investment and Performance Comparison" for more information on benchmark and peer group returns. |
| 2. | An obligation rated `CCC' by Standard & Poors ("S&P") is deemed by S&P to be currently vulnerable to nonpayment and is dependent upon favorable business, financial and economic conditions for the obligor to meet its financial commitment on the obligation. It is the opinion of S&P that in the event of adverse business, financial or economic conditions, the obligor is not likely to have the capacity to meet its financial commitment on the obligation. When applied to Fund holdings, ratings are based solely on the creditworthiness of the bonds in the portfolio and are not meant to represent the security or safety of the Fund. |
| 3. | Duration is a measure of the price sensitivity of a fixed-income investment to changes in interest rates. Duration is expressed as a number of years and is considered a more accurate sensitivity gauge than average maturity. |
The opinions expressed are those of the portfolio manager as of the date of this report and are subject to change. There is no guarantee that any forecasts will come to pass. This material does not constitute investment advice and is not intended as an endorsement of any specific investment.
Not all MainStay VP Portfolios and/or share classes are available under all policies.
| 8 | MainStay VP MacKay High Yield Corporate Bond Portfolio |
Portfolio of Investments December 31, 2023†^
| | Principal
Amount | Value |
| Long-Term Bonds 92.3% |
| Convertible Bonds 1.1% |
| Energy-Alternate Sources 0.1% |
| NextEra Energy Partners LP (a) | | |
| (zero coupon), due 11/15/25 | $ 2,000,000 | $ 1,757,000 |
| 2.50%, due 6/15/26 | 1,750,000 | 1,576,750 |
| | | 3,333,750 |
| Media 0.4% |
| DISH Network Corp. | | |
| 2.375%, due 3/15/24 | 7,490,000 | 7,443,188 |
| 3.375%, due 8/15/26 | 6,570,000 | 3,514,950 |
| | | 10,958,138 |
| Oil & Gas 0.4% |
| Gulfport Energy Operating Corp. | | |
| 10.00% (10.00% Cash or 15.00% PIK), due 12/29/49 (b)(c) | 1,134,000 | 10,789,204 |
| Oil & Gas Services 0.2% |
| Forum Energy Technologies, Inc. | | |
| 9.00% (6.25% Cash and 2.75% PIK), due 8/4/25 (c) | 4,829,915 | 4,720,638 |
Total Convertible Bonds
(Cost $22,965,643) | | 29,801,730 |
| Corporate Bonds 86.3% |
| Advertising 1.2% |
| Lamar Media Corp. | | |
| 3.625%, due 1/15/31 | 10,265,000 | 9,120,453 |
| 3.75%, due 2/15/28 | 6,320,000 | 5,928,300 |
| 4.00%, due 2/15/30 | 6,400,000 | 5,865,516 |
| 4.875%, due 1/15/29 | 2,570,000 | 2,480,870 |
| Outfront Media Capital LLC (a) | | |
| 4.25%, due 1/15/29 | 1,650,000 | 1,488,911 |
| 5.00%, due 8/15/27 | 6,070,000 | 5,867,242 |
| | | 30,751,292 |
| Aerospace & Defense 2.1% |
| F-Brasile SpA | | |
| Series XR | | |
| 7.375%, due 8/15/26 (a) | 5,587,000 | 5,460,481 |
| Rolls-Royce plc | | |
| 5.75%, due 10/15/27 (a) | 2,500,000 | 2,504,295 |
| TransDigm, Inc. | | |
| 4.625%, due 1/15/29 | 5,180,000 | 4,863,372 |
| 4.875%, due 5/1/29 | 4,155,000 | 3,883,613 |
| 6.25%, due 3/15/26 (a) | 23,850,000 | 23,808,794 |
| | Principal
Amount | Value |
| |
| Aerospace & Defense (continued) |
| TransDigm, Inc. (continued) | | |
| 6.75%, due 8/15/28 (a) | $ 5,350,000 | $ 5,473,489 |
| 6.875%, due 12/15/30 (a) | 2,500,000 | 2,575,000 |
| 7.125%, due 12/1/31 (a) | 2,900,000 | 3,038,953 |
| 7.50%, due 3/15/27 | 2,780,000 | 2,794,070 |
| | | 54,402,067 |
| Airlines 0.5% |
| American Airlines, Inc. (a) | | |
| 5.50%, due 4/20/26 | 2,612,500 | 2,593,655 |
| 5.75%, due 4/20/29 | 3,750,000 | 3,655,359 |
| Delta Air Lines, Inc. (a) | | |
| 4.50%, due 10/20/25 | 1,714,029 | 1,687,985 |
| 7.00%, due 5/1/25 | 713,000 | 725,415 |
| Mileage Plus Holdings LLC | | |
| 6.50%, due 6/20/27 (a) | 3,976,001 | 3,987,289 |
| | | 12,649,703 |
| Auto Manufacturers 0.8% |
| Ford Motor Credit Co. LLC | | |
| 4.389%, due 1/8/26 | 750,000 | 729,295 |
| 6.95%, due 6/10/26 | 1,575,000 | 1,615,673 |
| 7.20%, due 6/10/30 | 1,055,000 | 1,123,624 |
| 7.35%, due 3/6/30 | 2,000,000 | 2,148,602 |
| JB Poindexter & Co., Inc. | | |
| 8.75%, due 12/15/31 (a) | 10,965,000 | 11,184,300 |
| PM General Purchaser LLC | | |
| 9.50%, due 10/1/28 (a) | 3,775,000 | 3,828,169 |
| | | 20,629,663 |
| Auto Parts & Equipment 2.0% |
| Adient Global Holdings Ltd. (a) | | |
| 4.875%, due 8/15/26 | 2,800,000 | 2,738,015 |
| 7.00%, due 4/15/28 | 1,000,000 | 1,033,637 |
| 8.25%, due 4/15/31 | 1,300,000 | 1,376,543 |
| IHO Verwaltungs GmbH (a)(c) | | |
| 4.75% (4.75% Cash or 5.50% PIK), due 9/15/26 | 7,973,000 | 7,634,148 |
| 6.00% (6.00% Cash or 6.75% PIK), due 5/15/27 | 11,976,000 | 11,668,506 |
| 6.375% (6.375% Cash or 7.125% PIK), due 5/15/29 | 11,645,000 | 11,427,974 |
| Real Hero Merger Sub 2, Inc. | | |
| 6.25%, due 2/1/29 (a) | 9,125,000 | 7,866,991 |
| Tenneco, Inc. | | |
| 8.00%, due 11/17/28 (a) | 6,095,000 | 5,203,606 |
The notes to the financial statements are an integral part of, and should be read in conjunction with, the financial statements.
9
Portfolio of Investments December 31, 2023†^ (continued)
| | Principal
Amount | Value |
| Corporate Bonds (continued) |
| Auto Parts & Equipment (continued) |
| ZF North America Capital, Inc. (a) | | |
| 6.875%, due 4/14/28 | $ 1,650,000 | $ 1,709,844 |
| 7.125%, due 4/14/30 | 2,250,000 | 2,398,037 |
| | | 53,057,301 |
| Beverages 0.1% |
| Primo Water Holdings, Inc. | | |
| 4.375%, due 4/30/29 (a) | 1,500,000 | 1,382,089 |
| Building Materials 1.5% |
| Builders FirstSource, Inc. | | |
| 6.375%, due 6/15/32 (a) | 3,000,000 | 3,063,525 |
| Emerald Debt Merger Sub LLC | | |
| 6.625%, due 12/15/30 (a) | 7,000,000 | 7,149,590 |
| James Hardie International Finance DAC | | |
| 5.00%, due 1/15/28 (a) | 8,011,000 | 7,749,315 |
| Knife River Corp. | | |
| 7.75%, due 5/1/31 (a) | 3,490,000 | 3,715,942 |
| New Enterprise Stone & Lime Co., Inc. | | |
| 5.25%, due 7/15/28 (a) | 2,500,000 | 2,384,775 |
| PGT Innovations, Inc. | | |
| 4.375%, due 10/1/29 (a) | 4,360,000 | 4,344,448 |
| Summit Materials LLC (a) | | |
| 5.25%, due 1/15/29 | 4,380,000 | 4,237,650 |
| 6.50%, due 3/15/27 | 5,635,000 | 5,627,725 |
| 7.25%, due 1/15/31 | 2,405,000 | 2,534,158 |
| | | 40,807,128 |
| Chemicals 3.1% |
| ASP Unifrax Holdings, Inc. (a) | | |
| 5.25%, due 9/30/28 | 5,505,000 | 3,975,183 |
| 7.50%, due 9/30/29 | 5,990,000 | 3,047,083 |
| Avient Corp. (a) | | |
| 5.75%, due 5/15/25 | 2,000,000 | 2,000,058 |
| 7.125%, due 8/1/30 | 3,405,000 | 3,542,082 |
| CVR Partners LP | | |
| 6.125%, due 6/15/28 (a) | 1,700,000 | 1,585,964 |
| GPD Cos., Inc. | | |
| 10.125%, due 4/1/26 (a) | 9,575,000 | 8,850,843 |
| Innophos Holdings, Inc. | | |
| 9.375%, due 2/15/28 (a) | 7,096,000 | 6,443,594 |
| Iris Holdings, Inc. | | |
| 8.75% (8.75% Cash or 9.50% PIK), due 2/15/26 (a)(c) | 5,105,000 | 4,313,418 |
| Mativ Holdings, Inc. | | |
| 6.875%, due 10/1/26 (a) | 3,000,000 | 2,877,695 |
| | Principal
Amount | Value |
| |
| Chemicals (continued) |
| NOVA Chemicals Corp. (a) | | |
| 4.875%, due 6/1/24 | $ 1,238,000 | $ 1,227,180 |
| 5.25%, due 6/1/27 | 4,870,000 | 4,565,668 |
| 8.50%, due 11/15/28 | 2,985,000 | 3,130,250 |
| Olympus Water US Holding Corp. (a) | | |
| 7.125%, due 10/1/27 | 1,955,000 | 1,957,190 |
| 9.75%, due 11/15/28 | 7,825,000 | 8,305,400 |
| SCIH Salt Holdings, Inc. (a) | | |
| 4.875%, due 5/1/28 | 6,000,000 | 5,611,898 |
| 6.625%, due 5/1/29 | 6,435,000 | 6,005,283 |
| SCIL IV LLC | | |
| 5.375%, due 11/1/26 (a) | 3,700,000 | 3,551,748 |
| SK Invictus Intermediate II SARL | | |
| 5.00%, due 10/30/29 (a) | 10,450,000 | 9,065,375 |
| WR Grace Holdings LLC | | |
| 7.375%, due 3/1/31 (a) | 1,360,000 | 1,360,415 |
| | | 81,416,327 |
| Coal 0.1% |
| Coronado Finance Pty. Ltd. | | |
| 10.75%, due 5/15/26 (a) | 2,430,000 | 2,531,605 |
| Warrior Met Coal, Inc. | | |
| 7.875%, due 12/1/28 (a) | 1,337,000 | 1,327,018 |
| | | 3,858,623 |
| Commercial Services 2.2% |
| AMN Healthcare, Inc. | | |
| 4.625%, due 10/1/27 (a) | 2,430,000 | 2,299,387 |
| Gartner, Inc. | | |
| 3.75%, due 10/1/30 (a) | 3,500,000 | 3,093,899 |
| Graham Holdings Co. | | |
| 5.75%, due 6/1/26 (a) | 11,107,000 | 11,040,183 |
| Korn Ferry | | |
| 4.625%, due 12/15/27 (a) | 4,000,000 | 3,854,734 |
| MPH Acquisition Holdings LLC | | |
| 5.75%, due 11/1/28 (a) | 2,185,000 | 1,775,066 |
| NESCO Holdings II, Inc. | | |
| 5.50%, due 4/15/29 (a) | 7,995,000 | 7,392,097 |
| Service Corp. International | | |
| 3.375%, due 8/15/30 | 902,000 | 786,631 |
| 4.00%, due 5/15/31 | 6,650,000 | 5,955,075 |
| TriNet Group, Inc. | | |
| 7.125%, due 8/15/31 (a) | 1,750,000 | 1,792,161 |
| United Rentals North America, Inc. | | |
| 3.75%, due 1/15/32 | 2,000,000 | 1,769,593 |
| 3.875%, due 2/15/31 | 3,500,000 | 3,180,100 |
| 4.875%, due 1/15/28 | 1,000,000 | 976,240 |
| 5.50%, due 5/15/27 | 500,000 | 501,104 |
The notes to the financial statements are an integral part of, and should be read in conjunction with, the financial statements.
| 10 | MainStay VP MacKay High Yield Corporate Bond Portfolio |
| | Principal
Amount | Value |
| Corporate Bonds (continued) |
| Commercial Services (continued) |
| Williams Scotsman, Inc. (a) | | |
| 4.625%, due 8/15/28 | $ 4,270,000 | $ 4,033,129 |
| 6.125%, due 6/15/25 | 4,705,000 | 4,714,269 |
| 7.375%, due 10/1/31 | 1,500,000 | 1,573,136 |
| WW International, Inc. | | |
| 4.50%, due 4/15/29 (a) | 4,750,000 | 3,114,808 |
| | | 57,851,612 |
| Computers 0.2% |
| McAfee Corp. | | |
| 7.375%, due 2/15/30 (a) | 4,310,000 | 3,936,114 |
| Cosmetics & Personal Care 0.4% |
| Edgewell Personal Care Co. (a) | | |
| 4.125%, due 4/1/29 | 6,780,000 | 6,169,800 |
| 5.50%, due 6/1/28 | 4,000,000 | 3,925,000 |
| | | 10,094,800 |
| Distribution & Wholesale 0.8% |
| Dealer Tire LLC | | |
| 8.00%, due 2/1/28 (a) | 5,540,000 | 5,484,600 |
| G-III Apparel Group Ltd. | | |
| 7.875%, due 8/15/25 (a) | 5,450,000 | 5,475,654 |
| H&E Equipment Services, Inc. | | |
| 3.875%, due 12/15/28 (a) | 3,120,000 | 2,837,064 |
| Ritchie Bros Holdings, Inc. (a) | | |
| 6.75%, due 3/15/28 | 1,000,000 | 1,029,572 |
| 7.75%, due 3/15/31 | 6,565,000 | 6,999,012 |
| | | 21,825,902 |
| Diversified Financial Services 2.1% |
| AG TTMT Escrow Issuer LLC | | |
| 8.625%, due 9/30/27 (a) | 6,787,000 | 7,135,804 |
| Aretec Group, Inc. (a) | | |
| 7.50%, due 4/1/29 | 4,580,000 | 4,122,599 |
| 10.00%, due 8/15/30 | 2,500,000 | 2,656,625 |
| Credit Acceptance Corp. | | |
| 6.625%, due 3/15/26 | 9,465,000 | 9,442,402 |
| Enact Holdings, Inc. | | |
| 6.50%, due 8/15/25 (a) | 4,595,000 | 4,580,757 |
| Jefferies Finance LLC | | |
| 5.00%, due 8/15/28 (a) | 10,185,000 | 9,116,382 |
| LPL Holdings, Inc. (a) | | |
| 4.00%, due 3/15/29 | 6,000,000 | 5,552,500 |
| 4.375%, due 5/15/31 | 3,375,000 | 3,056,166 |
| 4.625%, due 11/15/27 | 3,865,000 | 3,732,944 |
| | Principal
Amount | Value |
| |
| Diversified Financial Services (continued) |
| Osaic Holdings, Inc. | | |
| 10.75%, due 8/1/27 (a) | $ 1,000,000 | $ 1,015,000 |
| PennyMac Financial Services, Inc. (a) | | |
| 4.25%, due 2/15/29 | 2,700,000 | 2,430,226 |
| 5.75%, due 9/15/31 | 1,500,000 | 1,388,222 |
| StoneX Group, Inc. | | |
| 8.625%, due 6/15/25 (a) | 1,298,000 | 1,311,266 |
| | | 55,540,893 |
| Electric 2.4% |
| Clearway Energy Operating LLC | | |
| 4.75%, due 3/15/28 (a) | 4,050,000 | 3,901,826 |
| DPL, Inc. | | |
| 4.125%, due 7/1/25 | 5,815,000 | 5,669,625 |
| Keystone Power Pass-Through Holders LLC | | |
| 13.00%, due 6/1/24 (a)(b) | 2,738,582 | 1,780,078 |
| Leeward Renewable Energy Operations LLC | | |
| 4.25%, due 7/1/29 (a) | 3,650,000 | 3,179,117 |
| NextEra Energy Operating Partners LP | | |
| 3.875%, due 10/15/26 (a) | 4,000,000 | 3,808,480 |
| NRG Energy, Inc. | | |
| 6.625%, due 1/15/27 | 2,555,000 | 2,560,496 |
| Pattern Energy Operations LP | | |
| 4.50%, due 8/15/28 (a) | 4,205,000 | 3,977,339 |
| PG&E Corp. | | |
| 5.00%, due 7/1/28 | 4,770,000 | 4,641,121 |
| 5.25%, due 7/1/30 | 3,840,000 | 3,703,855 |
| Talen Energy Supply LLC | | |
| 8.625%, due 6/1/30 (a) | 12,345,000 | 13,116,962 |
| TransAlta Corp. | | |
| 7.75%, due 11/15/29 | 3,300,000 | 3,504,880 |
| Vistra Corp. (a)(d)(e) | | |
| 7.00% (5 Year Treasury Constant Maturity Rate + 5.74%), due 12/15/26 | 3,000,000 | 2,955,000 |
| 8.00% (5 Year Treasury Constant Maturity Rate + 6.93%), due 10/15/26 | 7,800,000 | 7,765,998 |
| Vistra Operations Co. LLC | | |
| 5.00%, due 7/31/27 (a) | 3,300,000 | 3,212,885 |
| | | 63,777,662 |
The notes to the financial statements are an integral part of, and should be read in conjunction with, the financial statements.
11
Portfolio of Investments December 31, 2023†^ (continued)
| | Principal
Amount | Value |
| Corporate Bonds (continued) |
| Electrical Components & Equipment 0.3% |
| WESCO Distribution, Inc. (a) | | |
| 7.125%, due 6/15/25 | $ 4,535,000 | $ 4,568,115 |
| 7.25%, due 6/15/28 | 2,500,000 | 2,569,562 |
| | | 7,137,677 |
| Engineering & Construction 0.5% |
| Great Lakes Dredge & Dock Corp. | | |
| 5.25%, due 6/1/29 (a) | 4,100,000 | 3,485,865 |
| Railworks Holdings LP | | |
| 8.25%, due 11/15/28 (a) | 2,800,000 | 2,772,000 |
| TopBuild Corp. | | |
| 4.125%, due 2/15/32 (a) | 2,575,000 | 2,290,674 |
| Weekley Homes LLC | | |
| 4.875%, due 9/15/28 (a) | 5,800,000 | 5,403,845 |
| | | 13,952,384 |
| Entertainment 3.5% |
| Affinity Interactive | | |
| 6.875%, due 12/15/27 (a) | 3,939,000 | 3,510,569 |
| Boyne USA, Inc. | | |
| 4.75%, due 5/15/29 (a) | 3,845,000 | 3,615,817 |
| Caesars Entertainment, Inc. | | |
| 7.00%, due 2/15/30 (a) | 3,500,000 | 3,589,030 |
| CCM Merger, Inc. | | |
| 6.375%, due 5/1/26 (a) | 2,170,000 | 2,115,750 |
| Churchill Downs, Inc. (a) | | |
| 4.75%, due 1/15/28 | 13,847,000 | 13,270,907 |
| 5.50%, due 4/1/27 | 9,376,000 | 9,277,644 |
| 5.75%, due 4/1/30 | 6,190,000 | 6,035,197 |
| 6.75%, due 5/1/31 | 3,340,000 | 3,389,884 |
| International Game Technology plc | | |
| 6.25%, due 1/15/27 (a) | 7,225,000 | 7,332,248 |
| Jacobs Entertainment, Inc. (a) | | |
| 6.75%, due 2/15/29 | 6,470,000 | 6,081,800 |
| 6.75%, due 2/15/29 | 2,325,000 | 2,185,500 |
| Light & Wonder International, Inc. | | |
| 7.50%, due 9/1/31 (a) | 4,400,000 | 4,589,446 |
| Live Nation Entertainment, Inc. (a) | | |
| 3.75%, due 1/15/28 | 1,000,000 | 932,593 |
| 6.50%, due 5/15/27 | 6,435,000 | 6,547,754 |
| Merlin Entertainments Ltd. | | |
| 5.75%, due 6/15/26 (a) | 10,940,000 | 10,828,024 |
| Midwest Gaming Borrower LLC | | |
| 4.875%, due 5/1/29 (a) | 2,280,000 | 2,120,400 |
| Motion Bondco DAC | | |
| 6.625%, due 11/15/27 (a) | 4,500,000 | 4,161,616 |
| | Principal
Amount | Value |
| |
| Entertainment (continued) |
| Vail Resorts, Inc. | | |
| 6.25%, due 5/15/25 (a) | $ 2,800,000 | $ 2,786,000 |
| | | 92,370,179 |
| Food 0.9% |
| B&G Foods, Inc. | | |
| 5.25%, due 4/1/25 | 1,649,000 | 1,623,696 |
| 8.00%, due 9/15/28 (a) | 3,250,000 | 3,412,640 |
| Land O'Lakes Capital Trust I | | |
| 7.45%, due 3/15/28 (a) | 5,130,000 | 4,888,428 |
| Simmons Foods, Inc. | | |
| 4.625%, due 3/1/29 (a) | 8,500,000 | 7,354,022 |
| United Natural Foods, Inc. | | |
| 6.75%, due 10/15/28 (a) | 6,590,000 | 5,334,869 |
| | | 22,613,655 |
| Forest Products & Paper 1.4% |
| Mercer International, Inc. | | |
| 5.125%, due 2/1/29 | 14,470,000 | 12,428,996 |
| 5.50%, due 1/15/26 | 3,415,000 | 3,269,694 |
| 12.875%, due 10/1/28 (a) | 4,235,000 | 4,629,075 |
| Smurfit Kappa Treasury Funding DAC | | |
| 7.50%, due 11/20/25 | 15,843,000 | 16,255,997 |
| | | 36,583,762 |
| Gas 0.3% |
| AmeriGas Partners LP | | |
| 5.75%, due 5/20/27 | 2,485,000 | 2,416,718 |
| 5.875%, due 8/20/26 | 6,385,000 | 6,322,066 |
| | | 8,738,784 |
| Hand & Machine Tools 0.4% |
| Regal Rexnord Corp. (a) | | |
| 6.05%, due 2/15/26 | 1,750,000 | 1,769,343 |
| 6.05%, due 4/15/28 | 1,750,000 | 1,771,484 |
| 6.30%, due 2/15/30 | 1,550,000 | 1,590,162 |
| 6.40%, due 4/15/33 | 1,000,000 | 1,042,269 |
| Werner FinCo. LP (a) | | |
| 11.50%, due 6/15/28 | 1,000,000 | 1,038,727 |
| 14.50% (8.75% Cash and 5.75% PIK), due 10/15/28 (b)(c) | 4,323,312 | 3,588,349 |
| | | 10,800,334 |
| Healthcare-Products 1.6% |
| Bausch & Lomb Escrow Corp. | | |
| 8.375%, due 10/1/28 (a) | 8,485,000 | 8,951,166 |
| Garden Spinco Corp. | | |
| 8.625%, due 7/20/30 (a) | 4,350,000 | 4,646,393 |
The notes to the financial statements are an integral part of, and should be read in conjunction with, the financial statements.
| 12 | MainStay VP MacKay High Yield Corporate Bond Portfolio |
| | Principal
Amount | Value |
| Corporate Bonds (continued) |
| Healthcare-Products (continued) |
| Hologic, Inc. (a) | | |
| 3.25%, due 2/15/29 | $ 8,500,000 | $ 7,706,265 |
| 4.625%, due 2/1/28 | 2,000,000 | 1,919,824 |
| Teleflex, Inc. | | |
| 4.25%, due 6/1/28 (a) | 9,615,000 | 9,112,952 |
| 4.625%, due 11/15/27 | 3,500,000 | 3,402,201 |
| Varex Imaging Corp. | | |
| 7.875%, due 10/15/27 (a) | 5,237,000 | 5,265,884 |
| | | 41,004,685 |
| Healthcare-Services 4.8% |
| Acadia Healthcare Co., Inc. (a) | | |
| 5.00%, due 4/15/29 | 1,750,000 | 1,679,998 |
| 5.50%, due 7/1/28 | 1,850,000 | 1,821,970 |
| Catalent Pharma Solutions, Inc. (a) | | |
| 3.125%, due 2/15/29 | 5,995,000 | 5,246,344 |
| 3.50%, due 4/1/30 | 1,150,000 | 1,000,429 |
| 5.00%, due 7/15/27 | 4,500,000 | 4,347,775 |
| CHS/Community Health Systems, Inc. | | |
| 5.25%, due 5/15/30 (a) | 2,500,000 | 2,090,866 |
| DaVita, Inc. (a) | | |
| 3.75%, due 2/15/31 | 2,700,000 | 2,217,646 |
| 4.625%, due 6/1/30 | 4,000,000 | 3,489,579 |
| Encompass Health Corp. | | |
| 4.50%, due 2/1/28 | 5,500,000 | 5,262,175 |
| 4.625%, due 4/1/31 | 3,875,000 | 3,565,711 |
| 4.75%, due 2/1/30 | 7,650,000 | 7,204,238 |
| HCA, Inc. | | |
| 5.375%, due 2/1/25 | 6,530,000 | 6,520,404 |
| 5.875%, due 2/15/26 | 7,600,000 | 7,664,638 |
| 7.50%, due 11/6/33 | 10,500,000 | 11,815,012 |
| 7.58%, due 9/15/25 | 3,507,000 | 3,613,586 |
| 7.69%, due 6/15/25 | 9,035,000 | 9,330,637 |
| 8.36%, due 4/15/24 | 4,450,000 | 4,475,951 |
| HealthEquity, Inc. | | |
| 4.50%, due 10/1/29 (a) | 2,650,000 | 2,460,549 |
| IQVIA, Inc. (a) | | |
| 5.00%, due 10/15/26 | 8,997,000 | 8,911,045 |
| 6.50%, due 5/15/30 | 2,000,000 | 2,050,216 |
| LifePoint Health, Inc. (a) | | |
| 5.375%, due 1/15/29 | 4,900,000 | 3,623,345 |
| 11.00%, due 10/15/30 | 5,025,000 | 5,292,089 |
| ModivCare Escrow Issuer, Inc. | | |
| 5.00%, due 10/1/29 (a) | 255,000 | 208,422 |
| ModivCare, Inc. | | |
| 5.875%, due 11/15/25 (a) | 3,000,000 | 2,962,500 |
| | Principal
Amount | Value |
| |
| Healthcare-Services (continued) |
| Molina Healthcare, Inc. | | |
| 3.875%, due 11/15/30 (a) | $ 1,500,000 | $ 1,348,352 |
| RegionalCare Hospital Partners Holdings, Inc. | | |
| 9.75%, due 12/1/26 (a) | 12,915,000 | 12,812,717 |
| Select Medical Corp. | | |
| 6.25%, due 8/15/26 (a) | 2,000,000 | 2,009,948 |
| Tenet Healthcare Corp. | | |
| 6.75%, due 5/15/31 (a) | 3,000,000 | 3,066,150 |
| | | 126,092,292 |
| Holding Companies-Diversified 0.7% |
| Benteler International AG | | |
| 10.50%, due 5/15/28 (a) | 9,735,000 | 10,255,141 |
| Stena International SA | | |
| 6.125%, due 2/1/25 (a) | 9,525,000 | 9,469,879 |
| | | 19,725,020 |
| Home Builders 1.8% |
| Adams Homes, Inc. | | |
| 7.50%, due 2/15/25 (a) | 1,500,000 | 1,482,600 |
| Brookfield Residential Properties, Inc. | | |
| 6.25%, due 9/15/27 (a) | 4,450,000 | 4,311,545 |
| Century Communities, Inc. | | |
| 3.875%, due 8/15/29 (a) | 4,370,000 | 3,955,617 |
| 6.75%, due 6/1/27 | 6,775,000 | 6,848,136 |
| Installed Building Products, Inc. | | |
| 5.75%, due 2/1/28 (a) | 6,945,000 | 6,736,650 |
| M/I Homes, Inc. | | |
| 3.95%, due 2/15/30 | 1,695,000 | 1,508,550 |
| 4.95%, due 2/1/28 | 3,000,000 | 2,887,070 |
| Meritage Homes Corp. | | |
| 3.875%, due 4/15/29 (a) | 2,923,000 | 2,686,076 |
| Shea Homes LP | | |
| 4.75%, due 2/15/28 | 7,300,000 | 6,862,000 |
| 4.75%, due 4/1/29 | 1,628,000 | 1,497,760 |
| STL Holding Co. LLC | | |
| 7.50%, due 2/15/26 (a) | 2,700,000 | 2,622,240 |
| Winnebago Industries, Inc. | | |
| 6.25%, due 7/15/28 (a) | 6,785,000 | 6,666,263 |
| | | 48,064,507 |
| Household Products & Wares 0.2% |
| Central Garden & Pet Co. | | |
| 4.125%, due 10/15/30 | 2,020,000 | 1,837,264 |
| 4.125%, due 4/30/31 (a) | 4,323,000 | 3,820,542 |
| | | 5,657,806 |
The notes to the financial statements are an integral part of, and should be read in conjunction with, the financial statements.
13
Portfolio of Investments December 31, 2023†^ (continued)
| | Principal
Amount | Value |
| Corporate Bonds (continued) |
| Housewares 0.5% |
| Scotts Miracle-Gro Co. (The) | | |
| 4.00%, due 4/1/31 | $ 6,500,000 | $ 5,514,635 |
| 4.375%, due 2/1/32 | 3,235,000 | 2,733,640 |
| 4.50%, due 10/15/29 | 6,400,000 | 5,686,465 |
| | | 13,934,740 |
| Insurance 0.9% |
| BroadStreet Partners, Inc. | | |
| 5.875%, due 4/15/29 (a) | 5,500,000 | 5,133,971 |
| Fairfax Financial Holdings Ltd. | | |
| 8.30%, due 4/15/26 | 4,273,000 | 4,513,454 |
| Fidelity & Guaranty Life Holdings, Inc. | | |
| 5.50%, due 5/1/25 (a) | 1,000,000 | 987,626 |
| MGIC Investment Corp. | | |
| 5.25%, due 8/15/28 | 6,708,000 | 6,529,681 |
| NMI Holdings, Inc. | | |
| 7.375%, due 6/1/25 (a) | 3,245,000 | 3,250,387 |
| Ryan Specialty LLC | | |
| 4.375%, due 2/1/30 (a) | 1,000,000 | 927,500 |
| USI, Inc. | | |
| 7.50%, due 1/15/32 (a) | 2,710,000 | 2,774,498 |
| | | 24,117,117 |
| Internet 1.4% |
| Cars.com, Inc. | | |
| 6.375%, due 11/1/28 (a) | 5,860,000 | 5,650,270 |
| Gen Digital, Inc. | | |
| 6.75%, due 9/30/27 (a) | 4,100,000 | 4,171,049 |
| Netflix, Inc. | | |
| 5.75%, due 3/1/24 | 1,859,000 | 1,856,602 |
| 5.875%, due 11/15/28 | 6,500,000 | 6,843,089 |
| Uber Technologies, Inc. | | |
| 7.50%, due 9/15/27 (a) | 6,065,000 | 6,281,096 |
| VeriSign, Inc. | | |
| 4.75%, due 7/15/27 | 6,000,000 | 5,943,382 |
| 5.25%, due 4/1/25 | 6,809,000 | 6,811,562 |
| | | 37,557,050 |
| Investment Companies 0.6% |
| Compass Group Diversified Holdings LLC (a) | | |
| 5.00%, due 1/15/32 | 1,810,000 | 1,630,333 |
| 5.25%, due 4/15/29 | 8,150,000 | 7,698,659 |
| Icahn Enterprises LP | | |
| 5.25%, due 5/15/27 | 4,000,000 | 3,592,896 |
| 6.25%, due 5/15/26 | 4,000,000 | 3,816,443 |
| | | 16,738,331 |
| | Principal
Amount | Value |
| |
| Iron & Steel 1.4% |
| Allegheny Ludlum LLC | | |
| 6.95%, due 12/15/25 | $ 7,400,000 | $ 7,455,500 |
| Big River Steel LLC | | |
| 6.625%, due 1/31/29 (a) | 7,595,000 | 7,743,710 |
| Mineral Resources Ltd. (a) | | |
| 8.125%, due 5/1/27 | 12,500,000 | 12,698,633 |
| 8.50%, due 5/1/30 | 3,375,000 | 3,517,851 |
| 9.25%, due 10/1/28 | 5,480,000 | 5,829,459 |
| | | 37,245,153 |
| Leisure Time 2.0% |
| Carnival Corp. (a) | | |
| 4.00%, due 8/1/28 | 8,500,000 | 7,902,772 |
| 5.75%, due 3/1/27 | 13,600,000 | 13,265,896 |
| 6.00%, due 5/1/29 | 7,280,000 | 7,004,856 |
| 9.875%, due 8/1/27 | 7,000,000 | 7,348,964 |
| Carnival Holdings Bermuda Ltd. | | |
| 10.375%, due 5/1/28 (a) | 5,500,000 | 5,986,304 |
| Royal Caribbean Cruises Ltd. (a) | | |
| 5.375%, due 7/15/27 | 2,000,000 | 1,979,843 |
| 5.50%, due 4/1/28 | 5,000,000 | 4,936,294 |
| 7.25%, due 1/15/30 | 3,450,000 | 3,603,111 |
| | | 52,028,040 |
| Lodging 1.8% |
| Boyd Gaming Corp. | | |
| 4.75%, due 12/1/27 | 11,630,000 | 11,189,231 |
| 4.75%, due 6/15/31 (a) | 13,995,000 | 12,844,944 |
| Hilton Domestic Operating Co., Inc. | | |
| 4.00%, due 5/1/31 (a) | 10,490,000 | 9,608,057 |
| 4.875%, due 1/15/30 | 9,020,000 | 8,741,795 |
| 5.75%, due 5/1/28 (a) | 2,200,000 | 2,200,834 |
| Marriott International, Inc. | | |
| Series GG | | |
| 3.50%, due 10/15/32 | 3,030,000 | 2,701,411 |
| Station Casinos LLC | | |
| 4.50%, due 2/15/28 (a) | 1,500,000 | 1,414,243 |
| | | 48,700,515 |
| Machinery—Construction & Mining 0.3% |
| Terex Corp. | | |
| 5.00%, due 5/15/29 (a) | 2,150,000 | 2,026,375 |
| Vertiv Group Corp. | | |
| 4.125%, due 11/15/28 (a) | 6,755,000 | 6,337,672 |
| | | 8,364,047 |
The notes to the financial statements are an integral part of, and should be read in conjunction with, the financial statements.
| 14 | MainStay VP MacKay High Yield Corporate Bond Portfolio |
| | Principal
Amount | Value |
| Corporate Bonds (continued) |
| Machinery-Diversified 0.7% |
| Briggs & Stratton Corp. Escrow Claim Shares | | |
| 6.875%, due 12/15/20 (f)(g)(h) | $ 5,030,000 | $ — |
| Chart Industries, Inc. | | |
| 7.50%, due 1/1/30 (a) | 3,000,000 | 3,135,741 |
| Maxim Crane Works Holdings Capital LLC | | |
| 11.50%, due 9/1/28 (a) | 3,540,000 | 3,668,290 |
| TK Elevator Holdco GmbH | | |
| 7.625%, due 7/15/28 (a) | 3,053,000 | 2,998,935 |
| TK Elevator U.S. Newco, Inc. | | |
| 5.25%, due 7/15/27 (a) | 9,040,000 | 8,880,507 |
| | | 18,683,473 |
| Media 6.7% |
| Block Communications, Inc. | | |
| 4.875%, due 3/1/28 (a) | 4,175,000 | 3,653,125 |
| Cable One, Inc. | | |
| 4.00%, due 11/15/30 (a) | 9,500,000 | 7,691,563 |
| CCO Holdings LLC | | |
| 4.25%, due 2/1/31 (a) | 12,120,000 | 10,592,034 |
| 4.25%, due 1/15/34 (a) | 7,265,000 | 5,903,735 |
| 4.50%, due 8/15/30 (a) | 13,555,000 | 12,219,618 |
| 4.50%, due 5/1/32 | 11,250,000 | 9,635,226 |
| 4.75%, due 3/1/30 (a) | 7,715,000 | 7,049,696 |
| 5.00%, due 2/1/28 (a) | 8,550,000 | 8,180,491 |
| 5.125%, due 5/1/27 (a) | 12,000,000 | 11,594,035 |
| 5.375%, due 6/1/29 (a) | 4,780,000 | 4,505,563 |
| CSC Holdings LLC (a) | | |
| 5.50%, due 4/15/27 | 1,000,000 | 924,297 |
| 5.75%, due 1/15/30 | 6,250,000 | 3,890,625 |
| 6.50%, due 2/1/29 | 3,090,000 | 2,727,234 |
| 7.50%, due 4/1/28 | 2,250,000 | 1,683,203 |
| 11.25%, due 5/15/28 | 3,405,000 | 3,508,376 |
| Directv Financing LLC | | |
| 5.875%, due 8/15/27 (a) | 12,255,000 | 11,514,515 |
| DISH DBS Corp. | | |
| 7.75%, due 7/1/26 | 5,600,000 | 3,900,456 |
| LCPR Senior Secured Financing DAC (a) | | |
| 5.125%, due 7/15/29 | 4,255,000 | 3,706,681 |
| 6.75%, due 10/15/27 | 13,896,000 | 13,610,576 |
| News Corp. (a) | | |
| 3.875%, due 5/15/29 | 10,070,000 | 9,259,060 |
| 5.125%, due 2/15/32 | 3,885,000 | 3,688,460 |
| Scripps Escrow II, Inc. | | |
| 3.875%, due 1/15/29 (a) | 4,805,000 | 4,249,686 |
| | Principal
Amount | Value |
| |
| Media (continued) |
| Sirius XM Radio, Inc. | | |
| 4.00%, due 7/15/28 (a) | $ 2,750,000 | $ 2,543,318 |
| Sterling Entertainment Enterprises LLC | | |
| 10.25%, due 1/15/25 (b)(f)(h) | 7,000,000 | 6,380,500 |
| Videotron Ltd. (a) | | |
| 5.125%, due 4/15/27 | 3,835,000 | 3,777,475 |
| 5.375%, due 6/15/24 | 9,580,000 | 9,532,100 |
| Virgin Media Finance plc | | |
| 5.00%, due 7/15/30 (a) | 6,035,000 | 5,320,830 |
| VZ Secured Financing BV | | |
| 5.00%, due 1/15/32 (a) | 5,285,000 | 4,511,918 |
| | | 175,754,396 |
| Metal Fabricate & Hardware 0.2% |
| Advanced Drainage Systems, Inc. (a) | | |
| 5.00%, due 9/30/27 | 2,275,000 | 2,195,375 |
| 6.375%, due 6/15/30 | 3,030,000 | 3,052,706 |
| | | 5,248,081 |
| Mining 1.4% |
| Century Aluminum Co. | | |
| 7.50%, due 4/1/28 (a) | 9,235,000 | 8,937,736 |
| Compass Minerals International, Inc. | | |
| 6.75%, due 12/1/27 (a) | 7,990,000 | 7,910,100 |
| Eldorado Gold Corp. | | |
| 6.25%, due 9/1/29 (a) | 3,050,000 | 2,875,808 |
| First Quantum Minerals Ltd. (a) | | |
| 6.875%, due 3/1/26 | 430,000 | 384,908 |
| 6.875%, due 10/15/27 | 4,615,000 | 3,922,035 |
| 7.50%, due 4/1/25 | 3,415,000 | 3,256,186 |
| 8.625%, due 6/1/31 | 1,525,000 | 1,292,437 |
| IAMGOLD Corp. | | |
| 5.75%, due 10/15/28 (a) | 9,760,000 | 8,393,181 |
| | | 36,972,391 |
| Miscellaneous—Manufacturing 1.0% |
| Amsted Industries, Inc. (a) | | |
| 4.625%, due 5/15/30 | 2,615,000 | 2,393,300 |
| 5.625%, due 7/1/27 | 7,240,000 | 7,214,066 |
| Calderys Financing LLC | | |
| 11.25%, due 6/1/28 (a) | 2,260,000 | 2,367,102 |
| Enpro, Inc. | | |
| 5.75%, due 10/15/26 | 4,240,000 | 4,196,824 |
| Hillenbrand, Inc. | | |
| 5.75%, due 6/15/25 | 2,000,000 | 1,997,500 |
| LSB Industries, Inc. | | |
| 6.25%, due 10/15/28 (a) | 4,735,000 | 4,490,692 |
The notes to the financial statements are an integral part of, and should be read in conjunction with, the financial statements.
15
Portfolio of Investments December 31, 2023†^ (continued)
| | Principal
Amount | Value |
| Corporate Bonds (continued) |
| Miscellaneous—Manufacturing (continued) |
| Trinity Industries, Inc. | | |
| 7.75%, due 7/15/28 (a) | $ 3,230,000 | $ 3,336,852 |
| | | 25,996,336 |
| Office Furnishings 0.2% |
| Interface, Inc. | | |
| 5.50%, due 12/1/28 (a) | 4,445,000 | 4,108,439 |
| Oil & Gas 6.6% |
| Ascent Resources Utica Holdings LLC (a) | | |
| 7.00%, due 11/1/26 | 3,400,000 | 3,421,485 |
| 9.00%, due 11/1/27 | 2,684,000 | 3,381,840 |
| California Resources Corp. | | |
| 7.125%, due 2/1/26 (a) | 3,000,000 | 3,042,554 |
| Civitas Resources, Inc. | | |
| 5.00%, due 10/15/26 (a) | 1,350,000 | 1,309,234 |
| Comstock Resources, Inc. | | |
| 6.75%, due 3/1/29 (a) | 3,120,000 | 2,853,262 |
| Diamond Foreign Asset Co. | | |
| 8.50%, due 10/1/30 (a) | 5,365,000 | 5,486,260 |
| Encino Acquisition Partners Holdings LLC | | |
| 8.50%, due 5/1/28 (a) | 10,805,000 | 10,642,925 |
| Gulfport Energy Corp. | | |
| 8.00%, due 5/17/26 | 394,094 | 398,370 |
| Gulfport Energy Operating Corp. | | |
| 8.00%, due 5/17/26 (a) | 8,284,024 | 8,373,906 |
| HF Sinclair Corp. (a) | | |
| 5.00%, due 2/1/28 | 2,845,000 | 2,759,096 |
| 6.375%, due 4/15/27 | 1,565,000 | 1,577,274 |
| Hilcorp Energy I LP (a) | | |
| 5.75%, due 2/1/29 | 1,610,000 | 1,554,770 |
| 6.00%, due 4/15/30 | 2,400,000 | 2,327,548 |
| Marathon Oil Corp. | | |
| 4.40%, due 7/15/27 | 3,000,000 | 2,925,884 |
| Matador Resources Co. | | |
| 5.875%, due 9/15/26 | 7,250,000 | 7,189,813 |
| Moss Creek Resources Holdings, Inc. | | |
| 7.50%, due 1/15/26 (a) | 1,765,000 | 1,761,604 |
| Noble Finance II LLC | | |
| 8.00%, due 4/15/30 (a) | 1,685,000 | 1,753,332 |
| Occidental Petroleum Corp. | | |
| 5.55%, due 3/15/26 | 10,200,000 | 10,273,746 |
| 6.45%, due 9/15/36 | 3,100,000 | 3,279,804 |
| Parkland Corp. (a) | | |
| 4.50%, due 10/1/29 | 5,000,000 | 4,582,350 |
| | Principal
Amount | Value |
| |
| Oil & Gas (continued) |
| Parkland Corp. (a) (continued) | | |
| 4.625%, due 5/1/30 | $ 4,390,000 | $ 4,038,800 |
| 5.875%, due 7/15/27 | 3,630,000 | 3,615,343 |
| Permian Resources Operating LLC (a) | | |
| 5.375%, due 1/15/26 | 5,700,000 | 5,624,094 |
| 6.875%, due 4/1/27 | 5,958,000 | 5,953,916 |
| 7.75%, due 2/15/26 | 5,640,000 | 5,737,741 |
| Range Resources Corp. | | |
| 4.75%, due 2/15/30 (a) | 1,000,000 | 924,390 |
| 8.25%, due 1/15/29 | 1,615,000 | 1,671,481 |
| Rockcliff Energy II LLC | | |
| 5.50%, due 10/15/29 (a) | 11,110,000 | 10,500,209 |
| Southwestern Energy Co. | | |
| 5.375%, due 3/15/30 | 2,580,000 | 2,519,247 |
| 5.70%, due 1/23/25 (i) | 1,008,000 | 1,003,985 |
| 8.375%, due 9/15/28 | 1,600,000 | 1,655,331 |
| Sunoco LP | | |
| 6.00%, due 4/15/27 | 2,000,000 | 2,001,712 |
| Talos Production, Inc. | | |
| 12.00%, due 1/15/26 | 19,985,000 | 20,559,569 |
| Transocean Aquila Ltd. | | |
| 8.00%, due 9/30/28 (a) | 2,630,000 | 2,669,362 |
| Transocean Poseidon Ltd. | | |
| 6.875%, due 2/1/27 (a) | 6,867,000 | 6,832,894 |
| Transocean Titan Financing Ltd. | | |
| 8.375%, due 2/1/28 (a) | 2,500,000 | 2,593,719 |
| Transocean, Inc. | | |
| 8.75%, due 2/15/30 (a) | 8,098,750 | 8,461,254 |
| Vital Energy, Inc. | | |
| 7.75%, due 7/31/29 (a) | 3,930,000 | 3,757,487 |
| 10.125%, due 1/15/28 | 4,645,000 | 4,773,011 |
| | | 173,788,602 |
| Oil & Gas Services 0.9% |
| Bristow Group, Inc. | | |
| 6.875%, due 3/1/28 (a) | 8,135,000 | 7,810,225 |
| Nine Energy Service, Inc. | | |
| 13.00%, due 2/1/28 | 7,825,000 | 6,905,563 |
| Oceaneering International, Inc. | | |
| 6.00%, due 2/1/28 (a) | 2,965,000 | 2,873,915 |
| Weatherford International Ltd. (a) | | |
| 6.50%, due 9/15/28 | 3,741,000 | 3,871,258 |
| 8.625%, due 4/30/30 | 3,240,000 | 3,382,751 |
| | | 24,843,712 |
The notes to the financial statements are an integral part of, and should be read in conjunction with, the financial statements.
| 16 | MainStay VP MacKay High Yield Corporate Bond Portfolio |
| | Principal
Amount | Value |
| Corporate Bonds (continued) |
| Packaging & Containers 0.3% |
| Cascades USA, Inc. (a) | | |
| 5.125%, due 1/15/26 | $ 2,810,000 | $ 2,732,725 |
| 5.375%, due 1/15/28 | 5,200,000 | 5,031,000 |
| | | 7,763,725 |
| Pharmaceuticals 2.9% |
| 1375209 BC Ltd. | | |
| 9.00%, due 1/30/28 (a) | 3,396,000 | 3,311,440 |
| 180 Medical, Inc. | | |
| 3.875%, due 10/15/29 (a) | 3,270,000 | 2,945,453 |
| Bausch Health Cos., Inc. (a) | | |
| 7.00%, due 1/15/28 | 1,750,000 | 760,568 |
| 11.00%, due 9/30/28 | 4,000,000 | 2,907,920 |
| 14.00%, due 10/15/30 | 347,000 | 193,042 |
| BellRing Brands, Inc. | | |
| 7.00%, due 3/15/30 (a) | 5,300,000 | 5,485,341 |
| Grifols SA | | |
| 4.75%, due 10/15/28 (a) | 2,000,000 | 1,813,740 |
| Jazz Securities DAC | | |
| 4.375%, due 1/15/29 (a) | 8,790,000 | 8,187,136 |
| Organon & Co. (a) | | |
| 4.125%, due 4/30/28 | 7,000,000 | 6,443,233 |
| 5.125%, due 4/30/31 | 5,260,000 | 4,496,483 |
| Owens & Minor, Inc. (a) | | |
| 4.50%, due 3/31/29 | 6,310,000 | 5,565,862 |
| 6.625%, due 4/1/30 | 9,835,000 | 9,390,584 |
| Par Pharmaceutical, Inc. | | |
| 8.50%, due 4/1/27 (a)(g)(j) | 15,476,000 | 9,904,640 |
| Prestige Brands, Inc. (a) | | |
| 3.75%, due 4/1/31 | 10,940,000 | 9,563,372 |
| 5.125%, due 1/15/28 | 4,895,000 | 4,753,681 |
| | | 75,722,495 |
| Pipelines 4.4% |
| ANR Pipeline Co. | | |
| 7.375%, due 2/15/24 | 395,000 | 395,452 |
| Antero Midstream Partners LP | | |
| 5.75%, due 1/15/28 (a) | 1,265,000 | 1,252,392 |
| CNX Midstream Partners LP | | |
| 4.75%, due 4/15/30 (a) | 2,285,000 | 2,051,890 |
| DT Midstream, Inc. | | |
| 4.375%, due 6/15/31 (a) | 1,975,000 | 1,781,517 |
| Energy Transfer LP | | |
| 4.40%, due 3/15/27 | 3,978,000 | 3,888,960 |
| 8.00%, due 4/1/29 (a) | 2,150,000 | 2,237,290 |
| EnLink Midstream LLC | | |
| 6.50%, due 9/1/30 (a) | 1,675,000 | 1,710,126 |
| | Principal
Amount | Value |
| |
| Pipelines (continued) |
| EQM Midstream Partners LP | | |
| 5.50%, due 7/15/28 | $ 720,000 | $ 713,399 |
| 6.00%, due 7/1/25 (a) | 1,092,000 | 1,091,498 |
| 6.50%, due 7/1/27 (a) | 1,850,000 | 1,883,729 |
| 7.50%, due 6/1/30 (a) | 1,480,000 | 1,591,028 |
| FTAI Infra Escrow Holdings LLC | | |
| 10.50%, due 6/1/27 (a) | 8,115,000 | 8,418,028 |
| Genesis Energy LP | | |
| 6.25%, due 5/15/26 | 3,596,000 | 3,591,744 |
| 7.75%, due 2/1/28 | 4,250,000 | 4,264,816 |
| 8.00%, due 1/15/27 | 9,870,000 | 10,033,595 |
| 8.25%, due 1/15/29 | 2,230,000 | 2,294,770 |
| Harvest Midstream I LP | | |
| 7.50%, due 9/1/28 (a) | 6,965,000 | 6,923,765 |
| Hess Midstream Operations LP (a) | | |
| 4.25%, due 2/15/30 | 1,500,000 | 1,380,000 |
| 5.625%, due 2/15/26 | 3,300,000 | 3,275,844 |
| ITT Holdings LLC | | |
| 6.50%, due 8/1/29 (a) | 6,160,000 | 5,449,382 |
| MPLX LP | | |
| 4.875%, due 12/1/24 | 2,500,000 | 2,485,737 |
| New Fortress Energy, Inc. | | |
| 6.50%, due 9/30/26 (a) | 5,060,000 | 4,859,639 |
| NGPL PipeCo LLC | | |
| 4.875%, due 8/15/27 (a) | 1,000,000 | 981,280 |
| Northwest Pipeline LLC | | |
| 7.125%, due 12/1/25 | 2,195,000 | 2,249,430 |
| Plains All American Pipeline LP | | |
| Series B | | |
| 9.751% (3 Month SOFR + 4.372%), due 1/29/24 (d)(e) | 14,265,000 | 13,783,556 |
| Rockies Express Pipeline LLC | | |
| 4.80%, due 5/15/30 (a) | 1,500,000 | 1,372,500 |
| Summit Midstream Holdings LLC | | |
| 9.00%, due 10/15/26 (a)(i) | 3,720,000 | 3,690,313 |
| Tallgrass Energy Partners LP | | |
| 6.00%, due 3/1/27 (a) | 2,750,000 | 2,689,170 |
| TransMontaigne Partners LP | | |
| 6.125%, due 2/15/26 | 8,330,000 | 7,517,825 |
| Venture Global LNG, Inc. (a) | | |
| 8.125%, due 6/1/28 | 6,000,000 | 6,059,382 |
| 9.50%, due 2/1/29 | 4,975,000 | 5,264,381 |
| Western Midstream Operating LP | | |
| 4.65%, due 7/1/26 | 2,000,000 | 1,964,948 |
| | | 117,147,386 |
The notes to the financial statements are an integral part of, and should be read in conjunction with, the financial statements.
17
Portfolio of Investments December 31, 2023†^ (continued)
| | Principal
Amount | Value |
| Corporate Bonds (continued) |
| Real Estate Investment Trusts 2.4% |
| CTR Partnership LP | | |
| 3.875%, due 6/30/28 (a) | $ 3,680,000 | $ 3,359,248 |
| GLP Capital LP | | |
| 5.30%, due 1/15/29 | 5,700,000 | 5,667,041 |
| 5.375%, due 4/15/26 | 956,000 | 950,089 |
| MPT Operating Partnership LP | | |
| 4.625%, due 8/1/29 | 5,100,000 | 3,667,210 |
| 5.00%, due 10/15/27 | 9,866,000 | 8,058,913 |
| 5.25%, due 8/1/26 | 1,500,000 | 1,340,907 |
| RHP Hotel Properties LP | | |
| 4.50%, due 2/15/29 (a) | 2,081,000 | 1,935,415 |
| 4.75%, due 10/15/27 | 7,325,000 | 7,075,110 |
| 7.25%, due 7/15/28 (a) | 2,215,000 | 2,302,906 |
| VICI Properties LP (a) | | |
| 3.875%, due 2/15/29 | 2,500,000 | 2,296,577 |
| 4.625%, due 6/15/25 | 2,800,000 | 2,750,300 |
| 5.625%, due 5/1/24 | 17,465,000 | 17,408,167 |
| 5.75%, due 2/1/27 | 6,525,000 | 6,544,360 |
| | | 63,356,243 |
| Retail 6.1% |
| 1011778 BC ULC (a) | | |
| 3.875%, due 1/15/28 | 6,165,000 | 5,824,219 |
| 4.00%, due 10/15/30 | 14,205,000 | 12,740,450 |
| Asbury Automotive Group, Inc. | | |
| 4.50%, due 3/1/28 | 4,631,000 | 4,398,290 |
| 4.625%, due 11/15/29 (a) | 3,945,000 | 3,651,495 |
| 4.75%, due 3/1/30 | 5,212,000 | 4,865,268 |
| 5.00%, due 2/15/32 (a) | 2,350,000 | 2,135,688 |
| CEC Entertainment LLC | | |
| 6.75%, due 5/1/26 (a) | 4,700,000 | 4,587,567 |
| Dave & Buster's, Inc. | | |
| 7.625%, due 11/1/25 (a) | 3,005,000 | 3,042,563 |
| Group 1 Automotive, Inc. | | |
| 4.00%, due 8/15/28 (a) | 4,165,000 | 3,862,483 |
| Ken Garff Automotive LLC | | |
| 4.875%, due 9/15/28 (a) | 7,000,000 | 6,624,737 |
| KFC Holding Co. | | |
| 4.75%, due 6/1/27 (a) | 5,135,000 | 5,056,948 |
| LCM Investments Holdings II LLC (a) | | |
| 4.875%, due 5/1/29 | 12,530,000 | 11,639,301 |
| 8.25%, due 8/1/31 | 2,665,000 | 2,781,472 |
| Murphy Oil USA, Inc. | | |
| 4.75%, due 9/15/29 | 3,000,000 | 2,842,500 |
| 5.625%, due 5/1/27 | 2,994,000 | 2,967,914 |
| NMG Holding Co., Inc. | | |
| 7.125%, due 4/1/26 (a) | 22,850,000 | 21,957,634 |
| | Principal
Amount | Value |
| |
| Retail (continued) |
| Papa John's International, Inc. | | |
| 3.875%, due 9/15/29 (a) | $ 4,930,000 | $ 4,360,890 |
| Patrick Industries, Inc. (a) | | |
| 4.75%, due 5/1/29 | 1,795,000 | 1,634,555 |
| 7.50%, due 10/15/27 | 5,615,000 | 5,629,037 |
| PetSmart, Inc. | | |
| 7.75%, due 2/15/29 (a) | 4,285,000 | 4,168,525 |
| Sonic Automotive, Inc. (a) | | |
| 4.625%, due 11/15/29 | 3,500,000 | 3,185,040 |
| 4.875%, due 11/15/31 | 3,210,000 | 2,861,241 |
| Yum! Brands, Inc. | | |
| 3.625%, due 3/15/31 | 11,385,000 | 10,266,926 |
| 4.625%, due 1/31/32 | 10,950,000 | 10,239,341 |
| 4.75%, due 1/15/30 (a) | 9,687,000 | 9,389,803 |
| 5.375%, due 4/1/32 | 8,235,000 | 8,090,869 |
| 6.875%, due 11/15/37 | 2,000,000 | 2,196,160 |
| | | 161,000,916 |
| Software 4.0% |
| ACI Worldwide, Inc. | | |
| 5.75%, due 8/15/26 (a) | 4,405,000 | 4,375,465 |
| Camelot Finance SA | | |
| 4.50%, due 11/1/26 (a) | 4,480,000 | 4,374,362 |
| Central Parent LLC | | |
| 8.00%, due 6/15/29 (a) | 4,750,000 | 4,957,860 |
| Clarivate Science Holdings Corp. (a) | | |
| 3.875%, due 7/1/28 | 8,835,000 | 8,330,470 |
| 4.875%, due 7/1/29 | 16,500,000 | 15,482,513 |
| Fair Isaac Corp. | | |
| 5.25%, due 5/15/26 (a) | 3,219,000 | 3,196,081 |
| MSCI, Inc. (a) | | |
| 3.25%, due 8/15/33 | 2,900,000 | 2,423,782 |
| 3.625%, due 9/1/30 | 4,000,000 | 3,619,177 |
| 3.625%, due 11/1/31 | 2,800,000 | 2,464,388 |
| 3.875%, due 2/15/31 | 10,120,000 | 9,246,449 |
| 4.00%, due 11/15/29 | 8,000,000 | 7,519,022 |
| Open Text Corp. (a) | | |
| 3.875%, due 2/15/28 | 4,560,000 | 4,237,208 |
| 3.875%, due 12/1/29 | 2,500,000 | 2,242,085 |
| 6.90%, due 12/1/27 | 3,150,000 | 3,274,901 |
| Open Text Holdings, Inc. (a) | | |
| 4.125%, due 2/15/30 | 8,499,000 | 7,692,230 |
| 4.125%, due 12/1/31 | 1,500,000 | 1,325,801 |
| PTC, Inc. (a) | | |
| 3.625%, due 2/15/25 | 1,500,000 | 1,466,397 |
| 4.00%, due 2/15/28 | 9,236,000 | 8,752,865 |
| SS&C Technologies, Inc. | | |
| 5.50%, due 9/30/27 (a) | 5,885,000 | 5,801,037 |
The notes to the financial statements are an integral part of, and should be read in conjunction with, the financial statements.
| 18 | MainStay VP MacKay High Yield Corporate Bond Portfolio |
| | Principal
Amount | Value |
| Corporate Bonds (continued) |
| Software (continued) |
| Veritas US, Inc. | | |
| 7.50%, due 9/1/25 (a) | $ 4,390,000 | $ 3,624,254 |
| | | 104,406,347 |
| Telecommunications 2.8% |
| Connect Finco SARL | | |
| 6.75%, due 10/1/26 (a) | 14,105,000 | 14,020,508 |
| Frontier Communications Holdings LLC | | |
| 5.875%, due 10/15/27 (a) | 2,500,000 | 2,415,253 |
| Level 3 Financing, Inc. | | |
| 3.75%, due 7/15/29 (a) | 1,500,000 | 637,500 |
| Sprint Capital Corp. | | |
| 6.875%, due 11/15/28 | 31,815,000 | 34,472,539 |
| T-Mobile USA, Inc. | | |
| 3.375%, due 4/15/29 | 2,500,000 | 2,322,758 |
| 4.75%, due 2/1/28 | 11,450,000 | 11,408,443 |
| 5.375%, due 4/15/27 | 8,875,000 | 8,905,486 |
| | | 74,182,487 |
| Transportation 0.9% |
| GN Bondco LLC | | |
| 9.50%, due 10/15/31 (a) | 5,220,000 | 5,096,234 |
| Seaspan Corp. | | |
| 5.50%, due 8/1/29 (a) | 6,765,000 | 5,659,460 |
| Watco Cos. LLC | | |
| 6.50%, due 6/15/27 (a) | 12,665,000 | 12,665,000 |
| | | 23,420,694 |
Total Corporate Bonds
(Cost $2,358,247,646) | | 2,275,802,977 |
| Loan Assignments 4.9% |
| Automobile 0.3% |
| Dealer Tire Financial LLC | |
| Term Loan B2 | |
| 9.856% (1 Month SOFR + 4.50%), due 12/14/27 (d) | 3,960,000 | 3,969,900 |
| Tenneco, Inc. | |
| First Lien Term Loan B 10.448% - 10.469% | |
| (3 Month SOFR + 5.00%), due 11/17/28 (d) | 5,550,000 | 4,873,211 |
| | | 8,843,111 |
| | Principal
Amount | Value |
| |
| Beverage, Food & Tobacco 0.1% |
| United Natural Foods, Inc. | |
| Initial Term Loan | |
| 8.72% (1 Month SOFR + 3.25%), due 10/22/25 (d) | $ 3,434,215 | $ 3,426,213 |
| Cargo Transport 0.2% |
| Forward Air Corp.-Cov-Lite | |
| Senior Secured Term Loan B | |
| 9.856%, due 9/20/30 | 5,900,000 | 5,590,250 |
| Chemicals, Plastics & Rubber 0.4% |
| Innophos Holdings, Inc. | |
| Initial Term Loan | |
| 8.72% (1 Month SOFR + 3.25%), due 2/5/27 (d) | 1,828,750 | 1,791,604 |
| Jazz Pharmaceuticals plc | |
| Initial Dollar Term Loan | |
| 8.97% (1 Month SOFR + 3.50%), due 5/5/28 (d) | 8,136,855 | 8,169,907 |
| | | 9,961,511 |
| Energy (Electricity) 0.1% |
| Talen Energy Supply LLC | |
| Initial Term Loan B | |
| 9.869% (3 Month SOFR + 4.50%), due 5/17/30 (d) | 2,383,025 | 2,392,333 |
| Finance 0.6% |
| AAdvantage Loyality IP Ltd. | |
| Initial Term Loan | |
| 10.427% (3 Month SOFR + 4.75%), due 4/20/28 (d) | 1,800,000 | 1,848,375 |
| Mativ Holdings, Inc. | |
| Term Loan B | |
| 9.22% (1 Month SOFR + 3.75%), due 4/20/28 (d) | 2,270,705 | 2,253,675 |
| Osaic Holdings, Inc. | |
| Term Loan B2 | |
| 9.856% (1 Month SOFR + 4.50%), due 8/17/28 (d) | 2,750,000 | 2,755,844 |
| RealTruck Group, Inc. (d) | |
| Initial Term Loan | |
| 8.97% (1 Month SOFR + 3.50%), due 1/31/28 | 3,314,787 | 3,268,175 |
| Second Amendment Incremental Term Loan | |
| 10.47% (1 Month SOFR + 5.00%), due 1/31/28 | 2,550,000 | 2,508,562 |
The notes to the financial statements are an integral part of, and should be read in conjunction with, the financial statements.
19
Portfolio of Investments December 31, 2023†^ (continued)
| | Principal
Amount | Value |
| Loan Assignments (continued) |
| Finance (continued) |
| Superannuation and Investments Finco Pty. Ltd. | |
| Initial U.S. Term Loan | |
| 9.22% (1 Month SOFR + 3.75%), due 12/1/28 (d) | $ 2,646,000 | $ 2,646,000 |
| | | 15,280,631 |
| Healthcare, Education & Childcare 0.3% |
| Endo Luxembourg Finance Co. I SARL | |
| 2021 Term Loan | |
| 14.50% (1 Month PRIME + 6.00%), due 3/27/28 (d) | 5,100,000 | 3,315,000 |
| LifePoint Health, Inc. | |
| 2023 Refinancing Term Loan | |
| 11.168% (3 Month SOFR + 5.50%), due 11/16/28 (d) | 4,250,000 | 4,231,406 |
| | | 7,546,406 |
| High Tech Industries 0.2% |
| Open Text Corp. | |
| 2023 Replacement Term Loan | |
| 8.206% (1 Month SOFR + 2.75%), due 1/31/30 (d) | 4,845,398 | 4,847,127 |
| Insurance 0.1% |
| USI, Inc. | |
| Term Loan | |
| 8.348% (1 Month SOFR + 3.00%), due 11/22/29 (d) | 3,400,000 | 3,405,668 |
| Leisure, Amusement, Motion Pictures & Entertainment 0.3% |
| Carnival Corp. (d) | |
| Initial Advance Term Loan | |
| 8.357% (1 Month SOFR + 3.00%), due 8/9/27 | 4,477,500 | 4,481,230 |
| 2021 Incremental Advance Term Loan B | |
| 8.72% (1 Month SOFR + 3.25%), due 10/18/28 | 3,332,000 | 3,336,165 |
| | | 7,817,395 |
| Media 0.3% |
| Directv Financing LLC | |
| Closing Date Term Loan | |
| 10.65% (3 Month SOFR + 5.00%), due 8/2/27 (d) | 7,208,586 | 7,215,795 |
| | Principal
Amount | Value |
| |
| Mining, Steel, Iron & Non-Precious Metals 0.2% |
| American Rock Salt Co. LLC | |
| First Lien Initial Term Loan | |
| 9.47% (1 Month SOFR + 4.00%), due 6/9/28 (d) | $ 4,707,928 | $ 4,425,453 |
| Oil & Gas 0.5% |
| New Fortress Energy, Inc. | |
| Initial Term Loan | |
| 10.39% (3 Month SOFR + 5.00%), due 10/30/28 (d) | 5,600,000 | 5,509,000 |
| PetroQuest Energy LLC (b)(f) | |
| Term Loan | |
| 15.00%, due 11/8/25 | 7,145,883 | 3,430,024 |
| 2020 Term Loan | |
| 15.00% (15.00% PIK) (1 Month LIBOR + 6.50%), due 9/19/26 (c)(d) | 697,151 | 697,150 |
| Term Loan | |
| 15.00% (1 Month LIBOR + 6.50%), due 1/1/28 (d) | 908,373 | 908,373 |
| TransMontaigne Operating Co. LP | |
| Tranche Term Loan B | |
| 8.97% (1 Month SOFR + 3.50%), due 11/17/28 (d) | 3,332,000 | 3,318,812 |
| | | 13,863,359 |
| Personal, Food & Miscellaneous Services 0.0% ‡ |
| WW International, Inc. | |
| Initial Term Loan | |
| 8.97% (1 Month SOFR + 3.50%), due 4/13/28 (d) | 1,550,000 | 1,092,750 |
| Retail 0.9% |
| Great Outdoors Group LLC | |
| Term Loan B2 | |
| 9.22% (1 Month SOFR + 3.75%), due 3/6/28 (d) | 23,689,638 | 23,668,483 |
| Services Business 0.1% |
| GIP II Blue Holding LP | |
| Initial Term Loan | |
| 9.97% (1 Month SOFR + 4.50%), due 9/29/28 (d) | 2,221,173 | 2,229,503 |
The notes to the financial statements are an integral part of, and should be read in conjunction with, the financial statements.
| 20 | MainStay VP MacKay High Yield Corporate Bond Portfolio |
| | Principal
Amount | Value |
| Loan Assignments (continued) |
| Software 0.2% |
| Cloud Software Group, Inc. (d) | |
| First Lien Term Loan A | |
| 9.948% (3 Month SOFR + 4.50%), due 9/29/28 | $ 2,974,763 | $ 2,899,650 |
| First Lien Dollar Term Loan B | |
| 9.948% (3 Month SOFR + 4.50%), due 3/30/29 | 2,977,470 | 2,910,477 |
| | | 5,810,127 |
| Utilities 0.1% |
| PG&E Corp. | |
| Term Loan | |
| 7.856% (1 Month SOFR + 2.50%), due 6/23/27 (d) | 2,250,000 | 2,249,437 |
Total Loan Assignments
(Cost $132,101,584) | | 129,665,552 |
Total Long-Term Bonds
(Cost $2,513,314,873) | | 2,435,270,259 |
| |
| | Shares | |
| |
| Common Stocks 1.7% |
| Consumer Staples Distribution & Retail 0.0% ‡ |
| ASG Warrant Corp. (b)(f)(k) | 3,368 | — |
| Distributors 0.1% |
| ATD New Holdings, Inc. (k) | 44,740 | 1,288,512 |
| Electric Utilities 0.0% ‡ |
| Keycon Power Holdings LLC (b)(f)(k) | 11,280 | 113 |
| Electrical Equipment 0.1% |
| Energy Technologies, Inc. (b)(f)(k) | 4,822 | 1,388,736 |
| Energy Equipment & Services 0.1% |
| Forum Energy Technologies, Inc. (k) | 161,661 | 3,584,024 |
| Nine Energy Service, Inc. (k) | 35,103 | 94,076 |
| | | 3,678,100 |
| Independent Power and Renewable Electricity Producers 0.2% |
| GenOn Energy, Inc. (h) | 115,826 | 5,212,170 |
| Oil, Gas & Consumable Fuels 1.2% |
| Chord Energy Corp. | 13,354 | 2,219,836 |
| | Shares | | Value |
| |
| Oil, Gas & Consumable Fuels (continued) |
| Gulfport Energy Corp. (k) | 162,930 | | $ 21,702,276 |
| PetroQuest Energy, Inc. (b)(f)(k) | 82,247 | | — |
| Talos Energy, Inc. (k) | 550,880 | | 7,839,022 |
| | | | 31,761,134 |
Total Common Stocks
(Cost $69,247,918) | | | 43,328,765 |
| Preferred Stock 0.4% |
| Electrical Equipment 0.4% |
Energy Technologies Ltd. (b)(f)(k)
| 10,741 | | 9,666,900 |
Total Preferred Stock
(Cost $10,297,701) | | | 9,666,900 |
| |
| | Number of
Warrants | | |
| |
| Warrants 0.0% ‡ |
| Hotels, Restaurants & Leisure 0.0% ‡ |
| CWT Travel Holdings, Inc. (f)(k) | | | |
| Expires 11/19/26 | 44,246 | | — |
| Expires 11/19/28 | 46,574 | | — |
| | | | — |
| Oil, Gas & Consumable Fuels 0.0% ‡ |
| California Resources Corp. | | | |
| Expires 10/27/24 (k) | 9,742 | | 188,800 |
Total Warrants
(Cost $8,174,223) | | | 188,800 |
Total Investments
(Cost $2,601,034,715) | 94.4% | | 2,488,454,724 |
| Other Assets, Less Liabilities | 5.6 | | 148,825,144 |
| Net Assets | 100.0% | | $ 2,637,279,868 |
| † | Percentages indicated are based on Portfolio net assets. |
| ^ | Industry classifications may be different than those used for compliance monitoring purposes. |
| ‡ | Less than one-tenth of a percent. |
| (a) | May be sold to institutional investors only under Rule 144A or securities offered pursuant to Section 4(a)(2) of the Securities Act of 1933, as amended. |
| (b) | Illiquid security—As of December 31, 2023, the total market value deemed illiquid under procedures approved by the Board of Trustees was $38,629,427, which represented 1.5% of the Portfolio’s net assets. (Unaudited) |
The notes to the financial statements are an integral part of, and should be read in conjunction with, the financial statements.
21
Portfolio of Investments December 31, 2023†^ (continued)
| (c) | PIK ("Payment-in-Kind")—issuer may pay interest or dividends with additional securities and/or in cash. |
| (d) | Floating rate—Rate shown was the rate in effect as of December 31, 2023. |
| (e) | Security is perpetual and, thus, does not have a predetermined maturity date. The date shown, if applicable, reflects the next call date. |
| (f) | Security in which significant unobservable inputs (Level 3) were used in determining fair value. |
| (g) | Issue in non-accrual status. |
| (h) | Restricted security. (See Note 5) |
| (i) | Step coupon—Rate shown was the rate in effect as of December 31, 2023. |
| (j) | Issue in default. |
| (k) | Non-income producing security. |
| Abbreviation(s): |
| LIBOR—London Interbank Offered Rate |
| SOFR—Secured Overnight Financing Rate |
The following is a summary of the fair valuations according to the inputs used as of December 31, 2023, for valuing the Portfolio’s assets:
| Description | Quoted
Prices in
Active
Markets for
Identical
Assets
(Level 1) | | Significant
Other
Observable
Inputs
(Level 2) | | Significant
Unobservable
Inputs
(Level 3) | | Total |
| Asset Valuation Inputs | | | | | | | |
| Investments in Securities (a) | | | | | | | |
| Long-Term Bonds | | | | | | | |
| Convertible Bonds | $ — | | $ 29,801,730 | | $ — | | $ 29,801,730 |
| Corporate Bonds | — | | 2,269,422,477 | | 6,380,500 | | 2,275,802,977 |
| Loan Assignments | — | | 124,630,005 | | 5,035,547 | | 129,665,552 |
| Total Long-Term Bonds | — | | 2,423,854,212 | | 11,416,047 | | 2,435,270,259 |
| Common Stocks | 35,439,234 | | 6,500,682 | | 1,388,849 | | 43,328,765 |
| Preferred Stock | — | | — | | 9,666,900 | | 9,666,900 |
| Warrants | 188,800 | | — | | — | | 188,800 |
| Total Investments in Securities | $ 35,628,034 | | $ 2,430,354,894 | | $ 22,471,796 | | $ 2,488,454,724 |
| (a) | For a complete listing of investments and their industries, see the Portfolio of Investments. |
The notes to the financial statements are an integral part of, and should be read in conjunction with, the financial statements.
| 22 | MainStay VP MacKay High Yield Corporate Bond Portfolio |
Statement of Assets and Liabilities as of December 31, 2023
| Assets |
Investment in securities, at value
(identified cost $2,601,034,715) | $2,488,454,724 |
| Cash | 115,284,772 |
| Receivables: | |
| Interest | 43,107,450 |
| Portfolio shares sold | 526,328 |
| Other assets | 510,647 |
| Total assets | 2,647,883,921 |
| Liabilities |
| Payables: | |
| Investment securities purchased | 6,958,346 |
| Portfolio shares redeemed | 1,795,406 |
| Manager (See Note 3) | 1,234,554 |
| NYLIFE Distributors (See Note 3) | 468,769 |
| Professional fees | 74,668 |
| Shareholder communication | 31,613 |
| Custodian | 28,710 |
| Accrued expenses | 11,987 |
| Total liabilities | 10,604,053 |
| Net assets | $2,637,279,868 |
| Composition of Net Assets |
| Shares of beneficial interest outstanding (par value of $.001 per share) unlimited number of shares authorized | $ 295,163 |
| Additional paid-in-capital | 2,797,707,540 |
| | 2,798,002,703 |
| Total distributable earnings (loss) | (160,722,835) |
| Net assets | $2,637,279,868 |
| Initial Class | |
| Net assets applicable to outstanding shares | $ 404,005,671 |
| Shares of beneficial interest outstanding | 44,517,549 |
| Net asset value per share outstanding | $ 9.08 |
| Service Class | |
| Net assets applicable to outstanding shares | $2,233,274,197 |
| Shares of beneficial interest outstanding | 250,645,936 |
| Net asset value per share outstanding | $ 8.91 |
The notes to the financial statements are an integral part of, and should be read in conjunction with, the financial statements.
23
Statement of Operations for the year ended December 31, 2023
| Investment Income (Loss) |
| Income | |
| Interest | $168,252,230 |
| Dividends | 6,040,565 |
| Total income | 174,292,795 |
| Expenses | |
| Manager (See Note 3) | 14,662,612 |
| Distribution/Service—Service Class (See Note 3) | 5,519,496 |
| Professional fees | 273,441 |
| Shareholder communication | 96,704 |
| Trustees | 68,704 |
| Custodian | 67,639 |
| Miscellaneous | 91,561 |
| Total expenses | 20,780,157 |
| Net investment income (loss) | 153,512,638 |
| Realized and Unrealized Gain (Loss) |
| Net realized gain (loss) on investments | (56,454,736) |
| Net change in unrealized appreciation (depreciation) on investments | 190,921,470 |
| Net realized and unrealized gain (loss) | 134,466,734 |
| Net increase (decrease) in net assets resulting from operations | $287,979,372 |
The notes to the financial statements are an integral part of, and should be read in conjunction with, the financial statements.
| 24 | MainStay VP MacKay High Yield Corporate Bond Portfolio |
Statements of Changes in Net Assets
for the years ended December 31, 2023 and December 31, 2022
| | 2023 | 2022 |
| Increase (Decrease) in Net Assets |
| Operations: | | |
| Net investment income (loss) | $ 153,512,638 | $ 146,111,580 |
| Net realized gain (loss) | (56,454,736) | (27,833,550) |
| Net change in unrealized appreciation (depreciation) | 190,921,470 | (393,576,205) |
| Net increase (decrease) in net assets resulting from operations | 287,979,372 | (275,298,175) |
| Distributions to shareholders: | | |
| Initial Class | (23,513,967) | (24,718,944) |
| Service Class | (123,530,101) | (121,925,643) |
| Total distributions to shareholders | (147,044,068) | (146,644,587) |
| Capital share transactions: | | |
| Net proceeds from sales of shares | 157,785,599 | 170,826,531 |
| Net asset value of shares issued to shareholders in reinvestment of distributions | 147,044,068 | 146,644,587 |
| Cost of shares redeemed | (463,040,044) | (612,645,987) |
| Increase (decrease) in net assets derived from capital share transactions | (158,210,377) | (295,174,869) |
| Net increase (decrease) in net assets | (17,275,073) | (717,117,631) |
| Net Assets |
| Beginning of year | 2,654,554,941 | 3,371,672,572 |
| End of year | $2,637,279,868 | $2,654,554,941 |
The notes to the financial statements are an integral part of, and should be read in conjunction with, the financial statements.
25
Financial Highlights selected per share data and ratios
| | Year Ended December 31, |
| Initial Class | 2023 | | 2022 | | 2021 | | 2020 | | 2019 |
| Net asset value at beginning of year | $ 8.62 | | $ 9.94 | | $ 9.89 | | $ 9.96 | | $ 9.32 |
| Net investment income (loss) (a) | 0.54 | | 0.47 | | 0.47 | | 0.54 | | 0.58 |
| Net realized and unrealized gain (loss) | 0.45 | | (1.29) | | 0.08 | | (0.04) | | 0.64 |
| Total from investment operations | 0.99 | | (0.82) | | 0.55 | | 0.50 | | 1.22 |
| Less distributions: | | | | | | | | | |
| From net investment income | (0.53) | | (0.50) | | (0.50) | | (0.57) | | (0.58) |
| Net asset value at end of year | $ 9.08 | | $ 8.62 | | $ 9.94 | | $ 9.89 | | $ 9.96 |
| Total investment return (b) | 11.87% | | (8.06)% | | 5.51% | | 5.40% | | 13.22% |
| Ratios (to average net assets)/Supplemental Data: | | | | | | | | | |
| Net investment income (loss) | 6.03% | | 5.15% | | 4.66% | | 5.56% | | 5.84% |
| Net expenses | 0.58% | | 0.58% | | 0.58% | | 0.59%(c) | | 0.59%(c) |
| Portfolio turnover rate | 18% | | 12% | | 35% | | 39% | | 28% |
| Net assets at end of year (in 000's) | $ 404,006 | | $ 444,733 | | $ 592,890 | | $ 461,075 | | $ 471,775 |
| (a) | Per share data based on average shares outstanding during the year. |
| (b) | Total return does not reflect any deduction of sales charges, mortality and expense charges, contract charges or administrative charges. For periods of less than one year, total return is not annualized. |
| (c) | In addition to the fees and expenses which the Portfolio bears directly, it also indirectly bears a pro-rata share of the fees and expenses of the underlying funds in which it invests. Such indirect expenses are not included in the above expense ratios. |
| | Year Ended December 31, |
| Service Class | 2023 | | 2022 | | 2021 | | 2020 | | 2019 |
| Net asset value at beginning of year | $ 8.47 | | $ 9.77 | | $ 9.74 | | $ 9.81 | | $ 9.19 |
| Net investment income (loss) (a) | 0.51 | | 0.44 | | 0.44 | | 0.50 | | 0.55 |
| Net realized and unrealized gain (loss) | 0.44 | | (1.26) | | 0.06 | | (0.02) | | 0.62 |
| Total from investment operations | 0.95 | | (0.82) | | 0.50 | | 0.48 | | 1.17 |
| Less distributions: | | | | | | | | | |
| From net investment income | (0.51) | | (0.48) | | (0.47) | | (0.55) | | (0.55) |
| Net asset value at end of year | $ 8.91 | | $ 8.47 | | $ 9.77 | | $ 9.74 | | $ 9.81 |
| Total investment return (b) | 11.59% | | (8.29)% | | 5.25% | | 5.14% | | 12.94% |
| Ratios (to average net assets)/Supplemental Data: | | | | | | | | | |
| Net investment income (loss) | 5.80% | | 4.91% | | 4.43% | | 5.31% | | 5.60% |
| Net expenses | 0.83% | | 0.83% | | 0.83% | | 0.84%(c) | | 0.84%(c) |
| Portfolio turnover rate | 18% | | 12% | | 35% | | 39% | | 28% |
| Net assets at end of year (in 000's) | $ 2,233,274 | | $ 2,209,821 | | $ 2,778,783 | | $ 2,614,734 | | $ 2,557,069 |
| (a) | Per share data based on average shares outstanding during the year. |
| (b) | Total return does not reflect any deduction of sales charges, mortality and expense charges, contract charges or administrative charges. For periods of less than one year, total return is not annualized. |
| (c) | In addition to the fees and expenses which the Portfolio bears directly, it also indirectly bears a pro-rata share of the fees and expenses of the underlying funds in which it invests. Such indirect expenses are not included in the above expense ratios. |
The notes to the financial statements are an integral part of, and should be read in conjunction with, the financial statements.
| 26 | MainStay VP MacKay High Yield Corporate Bond Portfolio |
Notes to Financial Statements
Note 1–Organization and Business
MainStay VP Funds Trust (the “Fund”) was organized as a Delaware statutory trust on February 1, 2011. The Fund is registered under the Investment Company Act of 1940, as amended (the “1940 Act”), as an open-end management investment company. The Fund is comprised of thirty-one separate series (collectively referred to as the “Portfolios”). These financial statements and notes relate to the MainStay VP MacKay High Yield Corporate Bond Portfolio (the "Portfolio"), a "diversified” portfolio, as that term is defined in the 1940 Act, as interpreted or modified by regulatory authorities having jurisdiction, from time to time.
Shares of the Portfolio are currently offered to certain separate accounts to fund variable annuity policies and variable universal life insurance policies issued by New York Life Insurance and Annuity Corporation (“NYLIAC”), a wholly-owned subsidiary of New York Life Insurance Company (“New York Life”) and may also be offered to fund variable annuity policies and variable universal life insurance policies issued by other insurance companies. NYLIAC allocates shares of the Portfolio to, among others, certain NYLIAC separate accounts. Shares of the Portfolio are also offered to the MainStay VP Conservative Allocation Portfolio, MainStay VP Moderate Allocation Portfolio, MainStay VP Growth Allocation Portfolio and MainStay VP Equity Allocation Portfolio, which operate as “funds-of-funds," and other variable insurance funds.
The following table lists the Portfolio's share classes that have been registered and commenced operations:
| Class | Commenced Operations |
| Initial Class | May 1, 1995 |
| Service Class | June 4, 2003 |
Shares of the Portfolio are offered and are redeemed at a price equal to their respective net asset value (“NAV”) per share. No sales or redemption charge is applicable to the purchase or redemption of the Portfolio's shares. Under the terms of the Fund’s multiple class plan, adopted pursuant to Rule 18f-3 under the 1940 Act, the classes differ in that, among other things, Service Class shares of the Portfolio pay a combined distribution and service fee of 0.25% of average daily net assets attributable to Service Class shares of the Portfolio to the Distributor (as defined in Note 3(B)) pursuant to a plan adopted in accordance with Rule 12b-1 under the 1940 Act. Contract owners of variable annuity contracts purchased after June 2, 2003, are permitted to invest only in the Service Class shares.
The Portfolio's investment objective is to seek maximum current income through investment in a diversified portfolio of high-yield debt securities. Capital appreciation is a secondary objective.
Note 2–Significant Accounting Policies
The Portfolio is an investment company and accordingly follows the investment company accounting and reporting guidance of the Financial Accounting Standards Board (“FASB”) Accounting Standards Codification Topic 946 Financial Services—Investment Companies. The Portfolio
prepares its financial statements in accordance with generally accepted accounting principles (“GAAP”) in the United States of America and follows the significant accounting policies described below.
(A) Securities Valuation. Investments are usually valued as of the close of regular trading on the New York Stock Exchange (the "Exchange") (usually 4:00 p.m. Eastern time) on each day the Portfolio is open for business ("valuation date").
Pursuant to Rule 2a-5 under the 1940 Act, the Board of Trustees of the Fund (the "Board") has designated New York Life Investment Management LLC (“New York Life Investments” or the "Manager") as its Valuation Designee (the "Valuation Designee"). The Valuation Designee is responsible for performing fair valuations relating to all investments in the Portfolio’s portfolio for which market quotations are not readily available; periodically assessing and managing material valuation risks; establishing and applying fair value methodologies; testing fair valuation methodologies; evaluating and overseeing pricing services; ensuring appropriate segregation of valuation and portfolio management functions; providing quarterly, annual and prompt reporting to the Board, as appropriate; identifying potential conflicts of interest; and maintaining appropriate records. The Valuation Designee has established a valuation committee ("Valuation Committee") to assist in carrying out the Valuation Designee’s responsibilities and establish prices of securities for which market quotations are not readily available. The Portfolio's and the Valuation Designee's policies and procedures ("Valuation Procedures") govern the Valuation Designee’s selection and application of methodologies for determining and calculating the fair value of Portfolio investments. The Valuation Designee may value the Portfolio's portfolio securities for which market quotations are not readily available and other Portfolio assets utilizing inputs from pricing services and other third-party sources. The Valuation Committee meets (in person, via electronic mail or via teleconference) on an ad-hoc basis to determine fair valuations and on a quarterly basis to review fair value events with respect to certain securities for which market quotations are not readily available, including valuation risks and back-testing results, and to preview reports to the Board.
The Valuation Committee establishes prices of securities for which market quotations are not readily available based on such methodologies and measurements on a regular basis after considering information that is reasonably available and deemed relevant by the Valuation Committee. The Board shall oversee the Valuation Designee and review fair valuation materials on a prompt, quarterly and annual basis and approve proposed revisions to the Valuation Procedures.
Investments for which market quotations are not readily available are valued at fair value as determined in good faith pursuant to the Valuation Procedures. A market quotation is readily available only when that quotation is a quoted price (unadjusted) in active markets for identical investments that the Portfolio can access at the measurement date, provided that a quotation will not be readily available if it is not reliable. "Fair value" is defined as the price the Portfolio would reasonably expect to receive upon selling an asset or liability in an orderly transaction to an
Notes to Financial Statements (continued)
independent buyer in the principal or most advantageous market for the asset or liability. Fair value measurements are determined within a framework that establishes a three-tier hierarchy that maximizes the use of observable market data and minimizes the use of unobservable inputs to establish a classification of fair value measurements for disclosure purposes. "Inputs" refer broadly to the assumptions that market participants would use in pricing the asset or liability, including assumptions about risk, such as the risk inherent in a particular valuation technique used to measure fair value using a pricing model and/or the risk inherent in the inputs for the valuation technique. Inputs may be observable or unobservable. Observable inputs reflect the assumptions market participants would use in pricing the asset or liability based on market data obtained from sources independent of the Portfolio. Unobservable inputs reflect the Portfolio’s own assumptions about the assumptions market participants would use in pricing the asset or liability based on the information available. The inputs or methodology used for valuing assets or liabilities may not be an indication of the risks associated with investing in those assets or liabilities. The three-tier hierarchy of inputs is summarized below.
| • | Level 1—quoted prices (unadjusted) in active markets for an identical asset or liability |
| • | Level 2—other significant observable inputs (including quoted prices for a similar asset or liability in active markets, interest rates and yield curves, prepayment speeds, credit risk, etc.) |
| • | Level 3—significant unobservable inputs (including the Portfolio's own assumptions about the assumptions that market participants would use in measuring fair value of an asset or liability) |
The level of an asset or liability within the fair value hierarchy is based on the lowest level of an input, both individually and in the aggregate, that is significant to the fair value measurement. The aggregate value by input level of the Portfolio’s assets and liabilities as of December 31, 2023, is included at the end of the Portfolio of Investments.
The Portfolio may use third-party vendor evaluations, whose prices may be derived from one or more of the following standard inputs, among others:
| • Benchmark yields | • Reported trades |
| • Broker/dealer quotes | • Issuer spreads |
| • Two-sided markets | • Benchmark securities |
| • Bids/offers | • Reference data (corporate actions or material event notices) |
| • Industry and economic events | • Comparable bonds |
| • Monthly payment information | |
An asset or liability for which a market quotation is not readily available is valued by methods deemed reasonable in good faith by the Valuation Committee, following the Valuation Procedures to represent fair value. Under these procedures, the Valuation Designee generally uses a market-based approach which may use related or comparable assets or liabilities, recent transactions, market multiples, book values and other
relevant information. The Valuation Designee may also use an income-based valuation approach in which the anticipated future cash flows of the asset or liability are discounted to calculate fair value. Discounts may also be applied due to the nature and/or duration of any restrictions on the disposition of the asset or liability. Fair value represents a good faith approximation of the value of a security. Fair value determinations involve the consideration of a number of subjective factors, an analysis of applicable facts and circumstances and the exercise of judgment. As a result, it is possible that the fair value for a security determined in good faith in accordance with the Valuation Procedures may differ from valuations for the same security determined for other funds using their own valuation procedures. Although the Valuation Procedures are designed to value a security at the price the Portfolio may reasonably expect to receive upon the security's sale in an orderly transaction, there can be no assurance that any fair value determination thereunder would, in fact, approximate the amount that the Portfolio would actually realize upon the sale of the security or the price at which the security would trade if a reliable market price were readily available. During the year ended December 31, 2023, there were no material changes to the fair value methodologies.
Securities which may be valued in this manner include, but are not limited to: (i) a security for which trading has been halted or suspended or otherwise does not have a readily available market quotation on a given day; (ii) a debt security that has recently gone into default and for which there is not a current market quotation; (iii) a security of an issuer that has entered into a restructuring; (iv) a security that has been delisted from a national exchange; (v) a security subject to trading collars for which no or limited trading takes place; and (vi) a security whose principal market has been temporarily closed at a time when, under normal conditions, it would be open. Securities valued in this manner are generally categorized as Level 2 or 3 in the hierarchy.
Equity securities, rights and warrants, if applicable, are valued at the last quoted sales prices as of the close of regular trading on the relevant exchange on each valuation date. Securities that are not traded on the valuation date are valued at the mean of the last quoted bid and ask prices. Prices are normally taken from the principal market in which each security trades. These securities are generally categorized as Level 1 in the hierarchy.
Debt securities (other than convertible and municipal bonds) are valued at the evaluated bid prices (evaluated mean prices in the case of convertible and municipal bonds) supplied by a pricing agent or broker selected by the Valuation Designee, in consultation with the Subadvisor. The evaluations are market-based measurements processed through a pricing application and represents the pricing agent’s good faith determination as to what a holder may receive in an orderly transaction under market conditions. The rules-based logic utilizes valuation techniques that reflect participants’ assumptions and vary by asset class and per methodology, maximizing the use of relevant observable data including quoted prices for similar assets, benchmark yield curves and market corroborated inputs. The evaluated bid or mean prices are deemed by the Valuation Designee, in consultation with the Subadvisor, to be representative of
| 28 | MainStay VP MacKay High Yield Corporate Bond Portfolio |
market values at the regular close of trading of the Exchange on each valuation date. Debt securities purchased on a delayed delivery basis are marked to market daily until settlement at the forward settlement date. Debt securities, including corporate bonds, U.S. government and federal agency bonds, municipal bonds, foreign bonds, convertible bonds, asset-backed securities and mortgage-backed securities are generally categorized as Level 2 in the hierarchy.
Loan assignments, participations and commitments are valued at the average of bid quotations obtained from the engaged independent pricing service and are generally categorized as Level 2 in the hierarchy. Certain loan assignments, participations and commitments may be valued by utilizing significant unobservable inputs obtained from the pricing service and are generally categorized as Level 3 in the hierarchy.
The information above is not intended to reflect an exhaustive list of the methodologies that may be used to value portfolio investments. The Valuation Procedures permit the use of a variety of valuation methodologies in connection with valuing portfolio investments. The methodology used for a specific type of investment may vary based on the market data available or other considerations. The methodologies summarized above may not represent the specific means by which portfolio investments are valued on any particular business day.
A portfolio investment may be classified as an illiquid investment under the Portfolio's written liquidity risk management program and related procedures (“Liquidity Program”). Illiquidity of an investment might prevent the sale of such investment at a time when the Manager or the Subadvisor might wish to sell, and these investments could have the effect of decreasing the overall level of the Portfolio's liquidity. Further, the lack of an established secondary market may make it more difficult to value illiquid investments, requiring the Portfolio to rely on judgments that may be somewhat subjective in measuring value, which could vary materially from the amount that the Portfolio could realize upon disposition. Difficulty in selling illiquid investments may result in a loss or may be costly to the Portfolio. An illiquid investment is any investment that the Manager or Subadvisor reasonably expects cannot be sold or disposed of in current market conditions in seven calendar days or less without the sale or disposition significantly changing the market value of the investment. The liquidity classification of each investment will be made using information obtained after reasonable inquiry and taking into account, among other things, relevant market, trading and investment-specific considerations in accordance with the Liquidity Program. Illiquid investments are often fair valued in accordance with the Portfolio's procedures described above. The liquidity of the Portfolio's investments was determined as of December 31, 2023, and can change at any time.
(B) Income Taxes. The Portfolio's policy is to comply with the requirements of the Internal Revenue Code of 1986, as amended (the “Internal Revenue Code”), applicable to regulated investment companies and to distribute all of its taxable income to the shareholders of the Portfolio within the allowable time limits.
The Manager evaluates the Portfolio’s tax positions to determine if the tax positions taken meet the minimum recognition threshold in connection with accounting for uncertainties in income tax positions taken or expected to be taken for the purposes of measuring and recognizing tax liabilities in the financial statements. Recognition of tax benefits of an uncertain tax position is permitted only to the extent the position is “more likely than not” to be sustained assuming examination by taxing authorities. The Manager analyzed the Portfolio's tax positions taken on federal, state and local income tax returns for all open tax years (for up to three tax years) and has concluded that no provisions for federal, state and local income tax are required in the Portfolio's financial statements. The Portfolio's federal, state and local income tax and federal excise tax returns for tax years for which the applicable statutes of limitations have not expired are subject to examination by the Internal Revenue Service and state and local departments of revenue.
(C) Dividends and Distributions to Shareholders. Dividends and distributions are recorded on the ex-dividend date. The Portfolio intends to declare and pay dividends from net investment income and distributions from net realized capital and currency gains, if any, at least annually. All dividends and distributions are reinvested at NAV in the same class of shares of the Portfolio. Dividends and distributions to shareholders are determined in accordance with federal income tax regulations and may differ from determinations using GAAP.
(D) Security Transactions and Investment Income. The Portfolio records security transactions on the trade date. Realized gains and losses on security transactions are determined using the identified cost method. Dividend income is recognized on the ex-dividend date; and interest income is accrued as earned using the effective interest rate method. Discounts and premiums on securities purchased for the Portfolio are accreted and amortized, respectively, on the effective interest rate method. Income from payment-in-kind securities is accreted daily based on the effective interest method. Investment income and realized and unrealized gains and losses on investments of the Portfolio are allocated pro rata to the separate classes of shares based upon their relative net assets on the date the income is earned or realized and unrealized gains and losses are incurred.
Investment income and realized and unrealized gains and losses on investments of the Portfolio are allocated pro rata to the separate classes of shares based upon their relative net assets on the date the income is earned or realized and unrealized gains and losses are incurred.
The Portfolio may place a debt security on non-accrual status and reduce related interest income by ceasing current accruals and writing off all or a portion of any interest receivables when the collection of all or a portion of such interest has become doubtful. A debt security is removed from non-accrual status when the issuer resumes interest payments or when collectability of interest is reasonably assured.
(E) Expenses. Expenses of the Fund are allocated to the individual Portfolios in proportion to the net assets of the respective Portfolios when the expenses are incurred, except where direct allocations of expenses
Notes to Financial Statements (continued)
can be made. Expenses (other than fees incurred under the distribution and service plans, further discussed in Note 3(B), which are charged directly to the Service Class shares) are allocated to separate classes of shares pro rata based upon their relative net assets on the date the expenses are incurred. The expenses borne by the Portfolio, including those of related parties to the Portfolio, are shown in the Statement of Operations.
(F) Use of Estimates. In preparing financial statements in conformity with GAAP, the Manager makes estimates and assumptions that affect the reported amounts and disclosures in the financial statements. Actual results could differ from those estimates and assumptions.
(G) Loan Assignments, Participations and Commitments. The Portfolio may invest in loan assignments and participations ("loans"). Commitments are agreements to make money available to a borrower in a specified amount, at a specified rate and within a specified time. The Portfolio records an investment when the borrower withdraws money on a commitment or when a funded loan is purchased (trade date) and records interest as earned. These loans pay interest at rates that are periodically reset by reference to a base lending rate plus a spread. These base lending rates are generally the prime rate offered by a designated U.S. bank, the Secured Overnight Financing Rate ("SOFR") or an alternative reference rate.
The loans in which the Portfolio may invest are generally readily marketable, but may be subject to some restrictions on resale. For example, the Portfolio may be contractually obligated to receive approval from the agent bank and/or borrower prior to the sale of these investments. If the Portfolio purchases an assignment from a lender, the Portfolio will generally have direct contractual rights against the borrower in favor of the lender. If the Portfolio purchases a participation interest either from a lender or a participant, the Portfolio typically will have established a direct contractual relationship with the seller of the participation interest, but not with the borrower. Consequently, the Portfolio is subject to the credit risk of the lender or participant who sold the participation interest to the Portfolio, in addition to the usual credit risk of the borrower. In the event that the borrower, selling participant or intermediate participants become insolvent or enter into bankruptcy, the Portfolio may incur certain costs and delays in realizing payment, or may suffer a loss of principal and/or interest.
Unfunded commitments represent the remaining obligation of the Portfolio to the borrower. At any point in time, up to the maturity date of the issue, the borrower may demand the unfunded portion. Unfunded amounts, if any, are marked to market and any unrealized gains or losses are recorded in the Statement of Assets and Liabilities.
(H) Rights and Warrants. Rights are certificates that permit the holder to purchase a certain number of shares, or a fractional share, of a new stock from the issuer at a specific price. Warrants are instruments that entitle the holder to buy an equity security at a specific price for a specific period of time. These investments can provide a greater potential for profit or loss than an equivalent investment in the underlying security.
Prices of these investments do not necessarily move in tandem with the prices of the underlying securities.
There is risk involved in the purchase of rights and warrants in that these investments are speculative investments. The Portfolio could also lose the entire value of its investment in warrants if such warrants are not exercised by the date of its expiration. The Portfolio is exposed to risk until the sale or exercise of each right or warrant is completed.
(I) Debt Securities Risk. The ability of issuers of debt securities held by the Portfolio to meet their obligations may be affected by, among other things, economic or political developments in a specific country, industry or region. Debt securities are also subject to the risks associated with changes in interest rates. The Portfolio primarily invests in high-yield debt securities (commonly referred to as “junk bonds”), which are considered speculative because they present a greater risk of loss, including default, than higher rated debt securities. These securities pay investors a premium—a higher interest rate or yield than investment grade debt securities—because of the increased risk of loss. These securities can also be subject to greater price volatility. In times of unusual or adverse market, economic or political conditions, these securities may experience higher than normal default rates.
The loans in which the Portfolio invests are usually rated below investment grade, or if unrated, determined by the Subadvisor to be of comparable quality (commonly referred to as “junk bonds”) and are generally considered speculative because they present a greater risk of loss, including default, than higher quality debt securities. Moreover, such securities may, under certain circumstances, be particularly susceptible to liquidity and valuation risks.
Although certain loans are collateralized, there is no guarantee that the value of the collateral will be sufficient to repay the loan. In a recession or serious credit event, the value of these investments could decline significantly. As a result, the Portfolio’s NAVs could go down and you could lose money.
In addition, loans generally are subject to extended settlement periods that may be longer than seven days. As a result, the Portfolio may be adversely affected by selling other investments at an unfavorable time and/or under unfavorable conditions or engaging in borrowing transactions, such as borrowing against its credit facility, to raise cash to meet redemption obligations or pursue other investment opportunities.
In certain circumstances, loans may not be deemed to be securities. As a result, the Portfolio may not have the protection of the anti-fraud provisions of the federal securities laws. In such cases, the Portfolio generally must rely on the contractual provisions in the loan agreement and common-law fraud protections under applicable state law.
(J) LIBOR Replacement Risk. The Portfolio may invest in certain debt securities, derivatives or other financial instruments that have relied or continue to rely on LIBOR, as a “benchmark” or “reference rate” for various interest rate calculations. As of January 1, 2022, the United Kingdom Financial Conduct Authority ("FCA"), which regulates LIBOR,
| 30 | MainStay VP MacKay High Yield Corporate Bond Portfolio |
ceased its active encouragement of banks to provide the quotations needed to sustain most LIBOR rates due to the absence of an active market for interbank unsecured lending and other reasons. In connection with supervisory guidance from U.S. regulators, certain U.S. regulated entities have generally ceased to enter into certain new LIBOR contracts after January 1, 2022. On March 15, 2022, the Adjustable Interest Rate (LIBOR) Act was signed into law. This law provides a statutory fallback mechanism on a nationwide basis to replace LIBOR with a benchmark rate that is selected by the Board of Governors of the Federal Reserve System and based on SOFR (which measures the cost of overnight borrowings through repurchase agreement transactions collateralized with U.S. Treasury securities) for tough legacy contracts. On February 27, 2023, the Federal Reserve System’s final rule in connection with this law became effective, establishing benchmark replacements based on SOFR and Term SOFR (a forward-looking measurement of market expectations of SOFR implied from certain derivatives markets) for applicable tough legacy contracts governed by U.S. law. In addition, the FCA has announced that it will require the publication of synthetic LIBOR for the one-month, three-month and six-month U.S. Dollar LIBOR settings after June 30, 2023 through at least September 30, 2024. Certain of the Portfolio's investments may involve individual tough legacy contracts which may be subject to the Adjustable Interest Rate (LIBOR) Act or synthetic LIBOR and no assurances can be given that these measures will have had the intended effects. Although the transition process away from LIBOR for many instruments has been completed, some LIBOR use is continuing and there are potential effects related to the transition away from LIBOR or continued use of LIBOR on the Portfolio.
The elimination of LIBOR or changes to other reference rates or any other changes or reforms to the determination or supervision of reference rates could have an adverse impact on the market for, or value of, any securities or payments linked to those reference rates, which may adversely affect the Portfolio's performance and/or net asset value. It could also lead to a reduction in the interest rates on, and the value of, some LIBOR-based investments and reduce the effectiveness of hedges mitigating risk in connection with LIBOR-based investments. Uncertainty and risk also remain regarding the willingness and ability of issuers and lenders to include enhanced provisions in new and existing contracts or instruments. Consequently, the transition away from LIBOR to other reference rates may lead to increased volatility and illiquidity in markets that are tied to LIBOR, fluctuations in values of LIBOR-related investments or investments in issuers that utilize LIBOR, increased difficulty in borrowing or refinancing and diminished effectiveness of hedging strategies, adversely affecting the Portfolio's performance. Furthermore, the risks associated with the expected discontinuation of LIBOR and transition may be exacerbated if the work necessary to effect an orderly transition to an alternative reference rate is not completed in a timely manner. The usefulness of LIBOR as a benchmark could deteriorate anytime during this transition period. Any such effects of the transition process, including unforeseen effects, could result in losses to the Portfolio.
(K) Indemnifications. Under the Fund’s organizational documents, its officers and trustees are indemnified against certain liabilities that may arise out of performance of their duties to the Fund. Additionally, in the normal course of business, the Portfolio enters into contracts with third-party service providers that contain a variety of representations and warranties and that may provide general indemnifications. The Portfolio's maximum exposure under these arrangements is unknown, as this would involve future claims that may be made against the Portfolio that have not yet occurred. The Manager believes that the risk of loss in connection with these potential indemnification obligations is remote. However, there can be no assurance that material liabilities related to such obligations will not arise in the future, which could adversely impact the Portfolio.
Note 3–Fees and Related Party Transactions
(A) Manager and Subadvisor. New York Life Investments, a registered investment adviser and an indirect, wholly-owned subsidiary of New York Life, serves as the Portfolio's Manager, pursuant to an Amended and Restated Management Agreement ("Management Agreement"). The Manager provides offices, conducts clerical, recordkeeping and bookkeeping services and keeps most of the financial and accounting records required to be maintained by the Portfolio. Except for the portion of salaries and expenses that are the responsibility of the Portfolio, the Manager pays the salaries and expenses of all personnel affiliated with the Portfolio and certain operational expenses of the Portfolio. The Portfolio reimburses New York Life Investments in an amount equal to the portion of the compensation of the Chief Compliance Officer attributable to the Portfolio. MacKay Shields LLC ("MacKay Shields" or the "Subadvisor"), a registered investment adviser and an indirect, wholly-owned subsidiary of New York Life, serves as the Subadvisor to the Portfolio and is responsible for the day-to-day portfolio management of the Portfolio. Pursuant to the terms of an Amended and Restated Subadvisory Agreement between New York Life Investments and MacKay Shields, New York Life Investments pays for the services of the Subadvisor.
Pursuant to the Management Agreement, the Fund pays the Manager, on behalf of the Portfolio, a monthly fee for the services performed and the facilities furnished at an annual rate of the Portfolio's average daily net assets as follows: 0.57% up to $1 billion; 0.55% from $1 billion to $5 billion; and 0.525% in excess of $5 billion. During the year ended December 31, 2023, the effective management fee rate was 0.56% of the Portfolio's average daily net assets.
During the year ended December 31, 2023, New York Life Investments earned fees from the Portfolio in the amount of $14,662,612 and paid the Subadvisor fees in the amount of $7,331,306.
JPMorgan Chase Bank, N.A. ("JPMorgan") provides sub-administration and sub-accounting services to the Portfolio pursuant to an agreement with New York Life Investments. These services include calculating the daily NAVs of the Portfolio, maintaining the general ledger and sub-ledger accounts for the calculation of the Portfolio's NAVs, and assisting New York Life Investments in conducting various aspects of the Portfolio's
Notes to Financial Statements (continued)
administrative operations. For providing these services to the Portfolio, JPMorgan is compensated by New York Life Investments.
Pursuant to an agreement between the Fund and New York Life Investments, New York Life Investments is responsible for providing or procuring certain regulatory reporting services for the Portfolio. The Portfolio will reimburse New York Life Investments for the actual costs incurred by New York Life Investments in connection with providing or procuring these services for the Portfolio.
(B) Distribution and Service Fees. The Fund, on behalf of the Portfolio, has entered into a distribution agreement with NYLIFE Distributors LLC (the “Distributor”), an affiliate of New York Life Investments. The Portfolio has adopted a distribution plan (the “Plan”) in accordance with the provisions of Rule 12b-1 under the 1940 Act. Under the Plan, the Distributor has agreed to provide, through its affiliates or independent third parties, various distribution-related, shareholder and administrative support services to the Service Class shareholders. For its services, the Distributor is entitled to a combined distribution and service fee accrued daily and paid monthly at an annual rate of 0.25% of the average daily net assets attributable to the Service Class shares of the Portfolio.
Note 4-Federal Income Tax
As of December 31, 2023, the cost and unrealized appreciation (depreciation) of the Portfolio’s investment portfolio, including applicable derivative contracts and other financial instruments, as determined on a federal income tax basis, were as follows:
| | Federal Tax
Cost | Gross
Unrealized
Appreciation | Gross
Unrealized
(Depreciation) | Net
Unrealized
Appreciation/
(Depreciation) |
| Investments in Securities | $2,601,676,414 | $54,333,333 | $(167,555,023) | $(113,221,690) |
As of December 31, 2023, the components of accumulated gain (loss) on a tax basis were as follows:
Ordinary
Income | Accumulated
Capital
and Other
Gain (Loss) | Other
Temporary
Differences | Unrealized
Appreciation
(Depreciation) | Total
Accumulated
Gain (Loss) |
| $154,867,478 | $(201,019,889) | $(1,348,734) | $(113,221,690) | $(160,722,835) |
The difference between book-basis and tax-basis unrealized appreciation (depreciation) is primarily due to cumulative bond amortization adjustments.
As of December 31, 2023, for federal income tax purposes, capital loss carryforwards of $201,019,889, as shown in the table below, were available to the extent provided by the regulations to offset future realized gains of the Portfolio. Accordingly, no capital gains distributions are expected to be paid to shareholders until net gains have been realized in excess of such amounts.
Capital Loss
Available Through | Short-Term
Capital Loss
Amounts (000’s) | Long-Term
Capital Loss
Amounts (000’s) |
| Unlimited | $13,618 | $187,402 |
During the years ended December 31, 2023 and December 31, 2022, the tax character of distributions paid as reflected in the Statements of Changes in Net Assets was as follows:
| | 2023 | 2022 |
| Distributions paid from: | | |
| Ordinary Income | $147,044,068 | $146,644,587 |
Note 5–Restricted Securities
Restricted securities are subject to legal or contractual restrictions on resale. Private placement securities are generally considered to be restricted except for those securities traded between qualified institutional investors under the provisions of Rule 144A of the Securities Act of 1933, as amended. Disposal of restricted securities may involve time consuming negotiations and expenses, and prompt sale at an acceptable price may be difficult to achieve.
As of December 31, 2023, restricted securities held by the Portfolio were as follows:
| Security | Date(s) of
Acquisition | Principal
Amount/
Shares | Cost | 12/31/23
Value | Percent of
Net Assets |
| Briggs & Stratton Corp. Escrow Claim Shares |
Corporate Bond
6.875%, due 12/15/20 | 2/26/21 | $ 5,030,000 | $ 5,170,425 | $ — | 0.0% |
| GenOn Energy, Inc. |
| Common Stock | 12/14/18 | 115,826 | 12,970,154 | 5,212,170 | 0.2 |
| Sterling Entertainment Enterprises LLC |
Corporate Bond
10.25%, due 1/15/25 | 12/28/17 | $ 7,000,000 | 6,979,380 | 6,380,500 | 0.2 |
| Total | | | $ 25,119,959 | $ 11,592,670 | 0.4% |
| 32 | MainStay VP MacKay High Yield Corporate Bond Portfolio |
Note 6–Custodian
JPMorgan is the custodian of cash and securities held by the Portfolio. Custodial fees are charged to the Portfolio based on the Portfolio's net assets and/or the market value of securities held by the Portfolio and the number of certain transactions incurred by the Portfolio.
Note 7–Line of Credit
The Portfolio and certain other funds managed by New York Life Investments maintain a line of credit with a syndicate of banks in order to secure a source of funds for temporary purposes to meet unanticipated or excessive redemption requests.
Effective July 25, 2023, under the credit agreement (the “Credit Agreement”), the aggregate commitment amount is $600,000,000 with an additional uncommitted amount of $100,000,000. The commitment fee is an annual rate of 0.15% of the average commitment amount payable quarterly, regardless of usage, to JPMorgan, who serves as the agent to the syndicate. The commitment fee is allocated among the Portfolio and certain other funds managed by New York Life Investments based upon their respective net assets and other factors. Interest on any revolving credit loan is charged based upon the Federal Funds Rate, Daily SOFR + 0.10%, or the Overnight Bank Funding Rate, whichever is higher. The Credit Agreement expires on July 23, 2024, although the Portfolio, certain other funds managed by New York Life Investments and the syndicate of banks may renew the Credit Agreement for an additional year on the same or different terms or enter into a credit agreement with a different syndicate of banks. Prior to July 25, 2023, the aggregate commitment amount and the commitment fee were the same as those under the current Credit Agreement. During the year ended December 31, 2023, there were no borrowings made or outstanding with respect to the Portfolio under the Credit Agreement.
Note 8–Interfund Lending Program
Pursuant to an exemptive order issued by the SEC, the Portfolio, along with certain other funds managed by New York Life Investments, may participate in an interfund lending program. The interfund lending program provides an alternative credit facility that permits the Portfolio and certain other funds managed by New York Life Investments to lend or borrow money for temporary purposes directly to or from one another, subject to the conditions of the exemptive order. During the year ended December 31, 2023, there were no interfund loans made or outstanding with respect to the Portfolio.
Note 9–Purchases and Sales of Securities (in 000’s)
During the year ended December 31, 2023, purchases and sales of securities, other than short-term securities, were $450,430 and $618,475, respectively.
Note 10–Capital Share Transactions
Transactions in capital shares for the years ended December 31, 2023 and December 31, 2022, were as follows:
| Initial Class | Shares | Amount |
| Year ended December 31, 2023: | | |
| Shares sold | 2,543,277 | $ 22,581,222 |
| Shares issued to shareholders in reinvestment of distributions | 2,755,812 | 23,513,967 |
| Shares redeemed | (12,386,994) | (109,896,288) |
| Net increase (decrease) | (7,087,905) | $ (63,801,099) |
| Year ended December 31, 2022: | | |
| Shares sold | 7,121,288 | $ 65,542,215 |
| Shares issued to shareholders in reinvestment of distributions | 2,967,745 | 24,718,944 |
| Shares redeemed | (18,114,997) | (165,203,247) |
| Net increase (decrease) | (8,025,964) | $ (74,942,088) |
| |
| Service Class | Shares | Amount |
| Year ended December 31, 2023: | | |
| Shares sold | 15,363,866 | $ 135,204,377 |
| Shares issued to shareholders in reinvestment of distributions | 14,737,721 | 123,530,101 |
| Shares redeemed | (40,427,375) | (353,143,756) |
| Net increase (decrease) | (10,325,788) | $ (94,409,278) |
| Year ended December 31, 2022: | | |
| Shares sold | 11,574,208 | $ 105,284,316 |
| Shares issued to shareholders in reinvestment of distributions | 14,890,045 | 121,925,643 |
| Shares redeemed | (49,817,798) | (447,442,740) |
| Net increase (decrease) | (23,353,545) | $(220,232,781) |
Note 11–Other Matters
As of the date of this report, the Portfolio faces a heightened level of risk associated with current uncertainty, volatility and state of economies, financial markets, rising interest rates, and labor and health conditions around the world. Events such as war, acts of terrorism, recessions, rapid inflation, the imposition of international sanctions, earthquakes, hurricanes, epidemics and pandemics and other unforeseen natural or human disasters may have broad adverse social, political and economic effects on the global economy, which could negatively impact the value of the Portfolio's investments. Developments that disrupt global economies and financial markets may magnify factors that affect the Portfolio's performance.
Note 12–Subsequent Events
In connection with the preparation of the financial statements of the Portfolio as of and for the year ended December 31, 2023, events and transactions subsequent to December 31, 2023, through the date the financial statements were issued, have been evaluated by the Manager
Notes to Financial Statements (continued)
for possible adjustment and/or disclosure. No subsequent events requiring financial statement adjustment or disclosure have been identified.
| 34 | MainStay VP MacKay High Yield Corporate Bond Portfolio |
Report of Independent Registered Public Accounting Firm
To the Board of Trustees of MainStay VP Funds Trust and Shareholders of MainStay VP MacKay High Yield Corporate Bond Portfolio
Opinion on the Financial Statements
We have audited the accompanying statement of assets and liabilities, including the portfolio of investments, of MainStay VP MacKay High Yield Corporate Bond Portfolio (one of the portfolios constituting MainStay VP Funds Trust, referred to hereafter as the “Portfolio”) as of December 31, 2023, the related statement of operations for the year ended December 31, 2023, the statements of changes in net assets for each of the two years in the period ended December 31, 2023, including the related notes, and the financial highlights for each of the five years in the period ended December 31, 2023 (collectively referred to as the “financial statements”). In our opinion, the financial statements present fairly, in all material respects, the financial position of the Portfolio as of December 31, 2023, the results of its operations for the year then ended, the changes in its net assets for each of the two years in the period ended December 31, 2023 and the financial highlights for each of the five years in the period ended December 31, 2023 in conformity with accounting principles generally accepted in the United States of America.
Basis for Opinion
These financial statements are the responsibility of the Portfolio’s management. Our responsibility is to express an opinion on the Portfolio’s financial statements based on our audits. We are a public accounting firm registered with the Public Company Accounting Oversight Board (United States) (PCAOB) and are required to be independent with respect to the Portfolio in accordance with the U.S. federal securities laws and the applicable rules and regulations of the Securities and Exchange Commission and the PCAOB.
We conducted our audits of these financial statements in accordance with the standards of the PCAOB. Those standards require that we plan and perform the audit to obtain reasonable assurance about whether the financial statements are free of material misstatement, whether due to error or fraud.
Our audits included performing procedures to assess the risks of material misstatement of the financial statements, whether due to error or fraud, and performing procedures that respond to those risks. Such procedures included examining, on a test basis, evidence regarding the amounts and disclosures in the financial statements. Our audits also included evaluating the accounting principles used and significant estimates made by management, as well as evaluating the overall presentation of the financial statements. Our procedures included confirmation of securities owned as of December 31, 2023 by correspondence with the custodians, agent banks and brokers; when replies were not received from brokers, we performed other auditing procedures. We believe that our audits provide a reasonable basis for our opinion.
/s/PricewaterhouseCoopers LLP
New York, New York
February 26, 2024
We have served as the auditor of one or more investment companies in the MainStay group of funds since 1984.
Board Consideration and Approval of Management Agreement and Subadvisory Agreement (Unaudited)
The continuation of the Management Agreement with respect to the MainStay VP MacKay High Yield Corporate Bond Portfolio (“Portfolio”) and New York Life Investment Management LLC (“New York Life Investments”) and the Subadvisory Agreement between New York Life Investments and MacKay Shields LLC (“MacKay”) with respect to the Portfolio (together, “Advisory Agreements”) is subject to annual review and approval by the Board of Trustees of MainStay VP Funds Trust (“Board” of the “Trust”) in accordance with Section 15 of the Investment Company Act of 1940, as amended (“1940 Act”). At its December 6–7, 2023 meeting, the Board, including the Trustees who are not an “interested person” (as such term is defined in the 1940 Act) of the Trust (“Independent Trustees”) voting separately, unanimously approved the continuation of each of the Advisory Agreements for a one-year period.
In reaching the decision to approve the continuation of each of the Advisory Agreements, the Board considered information and materials furnished by New York Life Investments and MacKay in connection with an annual contract review process undertaken by the Board that took place at meetings of the Board and its Contracts Committee from September 2023 through December 2023, including information and materials furnished by New York Life Investments and MacKay in response to requests prepared on behalf of the Board, and in consultation with the Independent Trustees, by independent legal counsel to the Independent Trustees, which encompassed a variety of topics, including those summarized below. Information and materials requested by and furnished to the Board for consideration in connection with the contract review process included, among other items, reports on the Portfolio and “peer funds” prepared by Institutional Shareholder Services Inc. (“ISS”), an independent third-party service provider engaged by the Board to report objectively on the Portfolio’s investment performance, management fee and total expenses. The Board also considered information on the fees charged to other investment advisory clients of New York Life Investments and/or MacKay that follow investment strategies similar to those of the Portfolio, if any, and, when applicable, the rationale for differences in the Portfolio’s management and subadvisory fees and the fees charged to those other investment advisory clients. In addition, the Board considered information regarding the legal standards and fiduciary obligations applicable to its consideration of the continuation of each of the Advisory Agreements. The contract review process, including the structure and format for information and materials provided to the Board, has been developed in consultation with the Board. The Independent Trustees also met in executive sessions with their independent legal counsel and, for portions thereof, with senior management of New York Life Investments.
The Board’s deliberations with respect to the continuation of each of the Advisory Agreements reflect a year-long process, and the Board also took into account information furnished to the Board and its Committees throughout the year, as deemed relevant and appropriate by the Trustees, including, among other items, reports on investment performance of the Portfolio and investment-related matters for the Portfolio as well as presentations from New York Life Investments and, generally annually, MacKay personnel. In addition, the Board took into account
other information provided by New York Life Investments throughout the year, including, among other items, periodic reports on legal and compliance matters, risk management, portfolio turnover, brokerage commissions and non-advisory services provided to the Portfolio by New York Life Investments, as deemed relevant and appropriate by the Trustees.
In addition to information provided to the Board throughout the year, the Board received information in connection with its June 2023 meeting provided specifically in response to requests prepared on behalf of the Board, and in consultation with the Independent Trustees, by independent legal counsel to the Independent Trustees regarding the Portfolio’s distribution arrangements. In addition, the Board received information regarding the Portfolio’s asset levels, share purchase and redemption activity and the payment of Rule 12b-1 and/or certain other fees by applicable share classes of the Portfolio, among other information.
In considering the continuation of each of the Advisory Agreements, the Trustees reviewed and evaluated the information and factors they believed to reasonably be necessary and appropriate in light of legal advice furnished to them by independent legal counsel to the Independent Trustees and through the exercise of their own business judgment. Although individual Trustees may have weighed certain factors or information differently and the Board did not consider any single factor or information controlling in reaching its decision, the factors that figured prominently in the Board’s consideration of the continuation of each of the Advisory Agreements are summarized in more detail below and include, among other factors: (i) the nature, extent and quality of the services provided to the Portfolio by New York Life Investments and MacKay; (ii) the qualifications of the portfolio manager of the Portfolio and the historical investment performance of the Portfolio, New York Life Investments and MacKay; (iii) the costs of the services provided, and profits realized, by New York Life Investments and MacKay with respect to their relationships with the Portfolio; (iv) the extent to which economies of scale have been realized or may be realized if the Portfolio grows and the extent to which any economies of scale have been shared, have benefited or may benefit the Portfolio’s shareholders; and (v) the reasonableness of the Portfolio’s management and subadvisory fees and total ordinary operating expenses. Although the Board recognized that comparisons between the Portfolio’s fees and expenses and those of other funds are imprecise given different terms of agreements, variations in fund strategies and other factors, the Board considered the reasonableness of the Portfolio’s management fee and total ordinary operating expenses as compared to the peer funds identified by ISS. Throughout their considerations, the Trustees acknowledged the commitment of New York Life Investments and its affiliates to serve the MainStay Group of Funds, as well as their capacity, experience, resources, financial stability and reputations. The Trustees also acknowledged the entrepreneurial and other risks assumed by New York Life Investments in sponsoring and managing the Portfolio. With respect to the Subadvisory Agreement, the Board took into account New York Life Investments’ recommendation to approve the continuation of the Subadvisory Agreement.
| 36 | MainStay VP MacKay High Yield Corporate Bond Portfolio |
The Trustees noted that, throughout the year, the Trustees are afforded an opportunity to ask questions of, and request additional information or materials from, New York Life Investments and MacKay. The Board’s decision with respect to each of the Advisory Agreements may have also been based, in part, on the Board’s knowledge of New York Life Investments and MacKay resulting from, among other things, the Board’s consideration of each of the Advisory Agreements in prior years, the advisory agreements for other funds in the MainStay Group of Funds, the Board’s review throughout the year of the performance and operations of other funds in the MainStay Group of Funds and each Trustee’s business judgment and industry experience. In addition to considering the above-referenced factors, the Board observed that in the marketplace, notably under variable life insurance policies and variable annuity contracts for which the Portfolio serves as an investment option, there are a range of investment options available to investors and that the Portfolio’s shareholders, having had the opportunity to consider other investment options, have invested in the Portfolio.
The factors that figured prominently in the Board’s decision to approve the continuation of each of the Advisory Agreements during the Board’s December 6–7, 2023 meeting are summarized in more detail below.
Nature, Extent and Quality of Services Provided by New York Life Investments and MacKay
The Board examined the nature, extent and quality of the services that New York Life Investments provides to the Portfolio. The Board evaluated New York Life Investments’ experience and capabilities in serving as manager of the Portfolio and considered that the Portfolio operates in a “manager-of-managers” structure. The Board also considered New York Life Investments’ responsibilities and services provided pursuant to this structure, including overseeing the services provided by MacKay, evaluating the performance of MacKay, making recommendations to the Board as to whether the Subadvisory Agreement should be renewed, modified or terminated and periodically reporting to the Board regarding the results of New York Life Investments’ evaluation and monitoring functions. The Board noted that New York Life Investments manages other mutual funds, serves a variety of other investment advisory clients, including other pooled investment vehicles, and has experience overseeing mutual fund service providers, including subadvisors. The Board considered the experience of senior personnel at New York Life Investments providing management and administrative and other non-advisory services to the Portfolio. The Board observed that New York Life Investments devotes significant resources and time to providing management and administrative and other non-advisory services to the Portfolio, including New York Life Investments’ oversight and due diligence reviews of MacKay and ongoing analysis of, and interactions with, MacKay with respect to, among other things, the Portfolio’s investment performance and risks as well as MacKay’s investment capabilities and subadvisory services with respect to the Portfolio.
The Board also considered the range of services that New York Life Investments provides to the Portfolio under the terms of the Management Agreement, including: (i) fund accounting and ongoing supervisory
services provided by New York Life Investments’ Fund Administration and Accounting Group; (ii) investment supervisory and analytical services provided by New York Life Investments’ Investment Consulting Group; (iii) compliance services provided by the Trust’s Chief Compliance Officer as well as New York Life Investments’ compliance department, including supervision and implementation of the Portfolio’s compliance program; (iv) legal services provided by New York Life Investments’ Office of the General Counsel; and (v) risk management monitoring and analysis by compliance and investment personnel. In addition, the Board considered New York Life Investments’ willingness to invest in personnel and other resources, such as cyber security, information security and business continuity planning, that may benefit the Portfolio and noted that New York Life Investments is responsible for compensating the Trust’s officers, except for a portion of the salary of the Trust’s Chief Compliance Officer. The Board recognized that New York Life Investments provides certain other non-advisory services to the Portfolio and has over time provided an increasingly broad array of non-advisory services to the MainStay Group of Funds as a result of regulatory and other developments.
The Board also examined the range, and the nature, extent and quality, of the investment advisory services that MacKay provides to the Portfolio and considered the terms of each of the Advisory Agreements. The Board evaluated MacKay’s experience and performance in serving as subadvisor to the Portfolio and advising other portfolios and MacKay’s track record and experience in providing investment advisory services as well as the experience of investment advisory, senior management and administrative personnel at MacKay. The Board considered New York Life Investments’ and MacKay’s overall resources, legal and compliance environment, capabilities, reputation, financial condition and history. In addition to information provided in connection with quarterly meetings with the Trust’s Chief Compliance Officer, the Board considered information regarding the compliance policies and procedures of New York Life Investments and MacKay and acknowledged their commitment to further developing and strengthening compliance programs that may relate to the Portfolio. The Board also considered MacKay’s ability to recruit and retain qualified investment professionals and willingness to invest in personnel and other resources that may benefit the Portfolio. In this regard, the Board considered the qualifications and experience of the Portfolio’s portfolio manager, the number of accounts managed by the portfolio manager and the method for compensating the portfolio manager.
In addition, the Board considered information provided by New York Life Investments and MacKay regarding their respective business continuity and disaster recovery plans.
Based on these considerations, among others, the Board concluded that the Portfolio would likely continue to benefit from the nature, extent and quality of these services.
Investment Performance
In evaluating the Portfolio’s investment performance, the Board considered investment performance results over various periods in light of the Portfolio’s investment objective, strategies and risks. The Board
Board Consideration and Approval of Management Agreement and Subadvisory Agreement (Unaudited) (continued)
considered investment reports on, and analysis of, the Portfolio’s performance provided to the Board throughout the year. These reports include, among other items, information on the Portfolio’s gross and net returns, the Portfolio’s investment performance compared to a relevant investment category and the Portfolio’s benchmark, the Portfolio’s risk-adjusted investment performance and the Portfolio’s investment performance as compared to peer funds, as appropriate, as well as portfolio attribution information and commentary on the effect of market conditions. The Board also considered information provided by ISS showing the investment performance of the Portfolio as compared to peer funds. In addition, the Board reviewed the methodology used by ISS to construct the group of peer funds for comparative purposes.
The Board also took into account its discussions with senior management at New York Life Investments concerning the Portfolio’s investment performance over various periods as well as discussions between a representative of MacKay and the members of the Board’s Investment Committee, which generally occur on an annual basis.
Based on these considerations, among others, the Board concluded that its review of the Portfolio’s investment performance and related information supported a determination to approve the continuation of each of the Advisory Agreements.
Costs of the Services Provided, and Profits and Other Benefits Realized, by New York Life Investments and MacKay
The Board considered the costs of the services provided under each of the Advisory Agreements. The Board also considered the profitability of New York Life Investments and its affiliates, including MacKay, due to their relationships with the Portfolio as well as by New York Life Investments and its affiliates due to their relationships with the MainStay Group of Funds. Because MacKay is an affiliate of New York Life Investments whose subadvisory fee is paid by New York Life Investments, not the Portfolio, the Board considered cost and profitability information for New York Life Investments and MacKay in the aggregate.
In addition, the Board acknowledged the difficulty in obtaining reliable comparative data about mutual fund managers’ profitability because such information generally is not publicly available and may be impacted by numerous factors, including the structure of a fund manager’s organization, the types of funds it manages, the methodology used to allocate certain fixed costs to specific funds and the manager’s capital structure and costs of capital.
In evaluating the costs of the services provided by New York Life Investments and MacKay, and profitability of New York Life Investments and its affiliates, including MacKay due to their relationships with the Portfolio, the Board considered, among other factors, New York Life Investments’ and its affiliates’, including MacKay’s, continuing investments in, or willingness to invest in, personnel and other resources that may support and further enhance the management of the Portfolio, and that New York Life Investments is responsible for paying the subadvisory fee for the Portfolio. The Board also considered the financial resources of New York Life Investments and MacKay and acknowledged
that New York Life Investments and MacKay must be in a position to recruit and retain experienced professional personnel and to maintain a strong financial position for New York Life Investments and MacKay to continue to provide high-quality services to the Portfolio. The Board recognized that the Portfolio benefits from the allocation of certain fixed costs among the funds in the MainStay Group of Funds, among other expected benefits resulting from its relationship with New York Life Investments.
The Board considered information regarding New York Life Investments’ methodology for calculating profitability and allocating costs provided by New York Life Investments in connection with the fund profitability analysis presented to the Board. The Board concluded that New York Life Investments’ methods for allocating costs and procedures for estimating overall profitability of the relationship with the funds in the MainStay Group of Funds were reasonable. The Board recognized the difficulty in calculating and evaluating a manager’s profitability with respect to the Portfolio and considered that other profitability methodologies may also be reasonable.
The Board also considered certain fall-out benefits that may be realized by New York Life Investments and its affiliates, including MacKay, due to their relationships with the Portfolio, including reputational and other indirect benefits. The Board recognized, for example, the benefits to MacKay from legally permitted “soft-dollar” arrangements by which brokers provide research and other services to MacKay in exchange for commissions paid by the Portfolio with respect to trades in the Portfolio’s portfolio securities. In addition, the Board considered its review of the management agreement for a money market fund advised by New York Life Investments and an affiliated subadvisor that serves as an investment option for the Portfolio, including the potential rationale for and costs associated with investments in this money market fund by the Portfolio, if any, and considered information from New York Life Investments that the nature and type of specific investment advisory services provided to this money market fund are distinct from, or in addition to, the investment advisory services provided to the Portfolio. In addition, the Board considered the potential dividend received tax deduction for insurance company affiliates of New York Life Investments from the Portfolio’s securities lending activity.
The Board noted that the Portfolio serves as an investment option primarily under variable contracts issued by affiliates of New York Life Investments that would receive fees under those contracts. The Board observed that, in addition to fees earned by New York Life Investments under the Management Agreement for managing the Portfolio, New York Life Investments’ affiliates also earn revenues from serving the Portfolio in various other capacities, including as the Portfolio’s distributor, and insurance companies affiliated with New York Life Investments would be entitled to receive fees from the Portfolio under a distribution and service plan adopted pursuant to Rule 12b-1 under the 1940 Act. The Board considered information about these other revenues and their impact on the profitability of the relationship with the Portfolio to New York Life Investments and its affiliates. The Board noted that, although it assessed the overall profitability of the relationship with the Portfolio to New York
| 38 | MainStay VP MacKay High Yield Corporate Bond Portfolio |
Life Investments and its affiliates as part of the contract review process, when considering the reasonableness of the fee paid to New York Life Investments under the Management Agreement, the Board considered the profitability of New York Life Investments’ relationship with the Portfolio on a pre-tax basis and without regard to distribution expenses incurred by New York Life Investments from its own resources.
After evaluating the information deemed relevant by the Trustees, the Board concluded that any profits realized by New York Life Investments and its affiliates, including MacKay, due to their relationships with the Portfolio were not excessive and other expected benefits that may accrue to New York Life Investments and its affiliates, including MacKay, are reasonable.
Management and Subadvisory Fees and Total Ordinary Operating Expenses
The Board evaluated the reasonableness of the fee paid under each of the Advisory Agreements and the Portfolio’s total ordinary operating expenses. With respect to the management fee and subadvisory fee, the Board primarily considered the reasonableness of the management fee paid by the Portfolio to New York Life Investments because the subadvisory fee paid to MacKay is paid by New York Life Investments, not the Portfolio. The Board also considered the reasonableness of the subadvisory fee paid by New York Life Investments and the amount of the management fee retained by New York Life Investments.
In assessing the reasonableness of the Portfolio’s fees and expenses, the Board primarily considered comparative data provided by ISS on the fees and expenses of similar mutual funds managed by other investment advisers. The Board reviewed the methodology used by ISS to construct the group of peer funds for comparative purposes. In addition, the Board considered information provided by New York Life Investments and MacKay on fees charged to other investment advisory clients, including institutional separate accounts and/or other funds, that follow investment strategies similar to those of the Portfolio, if any. The Board considered the contractual management fee schedule for the Portfolio as compared to those for such other investment advisory clients, taking into account the rationale for differences in fee schedules. The Board also took into account information provided by New York Life Investments about the more extensive scope of services provided to registered investment companies, such as the Portfolio, as compared with other investment advisory clients. Additionally, the Board considered the impact of contractual breakpoints and voluntary waivers on the Portfolio’s net management fee and expenses. The Board also considered that in proposing fees for the Portfolio, New York Life Investments considers the competitive marketplace for mutual funds.
Based on the factors outlined above, among other considerations, the Board concluded that the Portfolio’s management fee and total ordinary operating expenses are within a range that is competitive and support a conclusion that these fees and expenses are reasonable.
Economies of Scale
The Board considered information regarding economies of scale, including whether economies of scale may exist with respect to the Portfolio and whether the Portfolio’s management fee and expense structure permits any economies of scale to be appropriately shared with the Portfolio’s shareholders. The Board also considered a report from New York Life Investments, previously prepared at the request of the Board, that addressed economies of scale, including with respect to the mutual fund business generally, and the various ways in which the benefits of economies of scale may be shared with the funds in the MainStay Group of Funds. Although the Board recognized the difficulty of determining economies of scale with precision, the Board acknowledged that economies of scale may be shared with the Portfolio in a number of ways, including, for example, through the imposition of fee breakpoints, initially setting management fee rates at scale or making additional investments to enhance the services provided to the Portfolio. The Board reviewed information from New York Life Investments showing how the Portfolio’s management fee schedule compared to fee schedules of other funds and accounts managed by New York Life Investments. The Board also reviewed information from ISS showing how the Portfolio’s management fee schedule compared with fees paid for similar services by peer funds at varying asset levels.
Based on this information, the Board concluded that economies of scale are appropriately shared for the benefit of the Portfolio’s shareholders through the Portfolio’s management fee and expense structure and other methods to share benefits from economies of scale.
Conclusion
On the basis of the information and factors summarized above, among other information and factors deemed relevant by the Trustees, and the evaluation thereof, the Board, including the Independent Trustees voting separately, unanimously voted to approve the continuation of each of the Advisory Agreements.
Proxy Voting Policies and Procedures and Proxy Voting Record
The Portfolio is required to file with the SEC its proxy voting record for the 12-month period ending June 30 on Form N-PX. A description of the policies and procedures that are used to vote proxies relating to portfolio securities of the Portfolio is available free of charge upon request by calling 800-598-2019 or visiting the SEC's website at www.sec.gov. The most recent Form N-PX or proxy voting record is available free of charge upon request by calling 800-598-2019; visiting https://www.newyorklifeinvestments.com/investment-products/vp; or visiting the SEC’s website at www.sec.gov.
Shareholder Reports and Quarterly Portfolio Disclosure
The Portfolio is required to file its complete schedule of portfolio holdings with the SEC 60 days after its first and third fiscal quarter on Form N-PORT. The Portfolio's holdings report is available free of charge upon request by calling 800-598-2019 or by visiting the SEC’s website at www.sec.gov.
| 40 | MainStay VP MacKay High Yield Corporate Bond Portfolio |
Board of Trustees and Officers (Unaudited)
The Trustees and officers of the Portfolio are listed below. The Board oversees the MainStay Group of Funds (which consists of MainStay Funds and MainStay Funds Trust), MainStay VP Funds Trust, MainStay MacKay DefinedTerm Municipal Opportunities Fund, MainStay CBRE Global Infrastructure Megatrends Term Fund, the Manager and the Subadvisors, and elects the officers of the Portfolios who are responsible for the day-to-day operations of the Portfolio. Information pertaining to the Trustees and officers is set forth below. Each Trustee serves until his or her successor is elected and qualified or until his or her resignation,
death or removal. Under the Board’s retirement policy, unless an exception is made, a Trustee must tender his or her resignation by the end of the calendar year during which he or she reaches the age of 75. Officers are elected annually by the Board. The business address of each Trustee and officer listed below is 51 Madison Avenue, New York, New York 10010. A majority of the Trustees are not “interested persons” (as defined by the 1940 Act and rules adopted by the SEC thereunder) of the Portfolio (“Independent Trustees”).
| | Name and
Year of Birth | Term of Office,
Position(s) Held and
Length of Service | Principal Occupation(s)
During Past Five Years | Number of
Portfolios in
Fund Complex
Overseen by
Trustee | Other Directorships
Held by Trustee |
| | | | | | |
| | Naïm Abou-Jaoudé*
1966 | MainStay VP Funds Trust: Trustee since 2023 | Chief Executive Officer of New York Life Investment Management LLC (since 2023). Chief Executive Officer of Candriam (an affiliate of New York Life Investment Management LLC) (2007 to 2023). | 81 | MainStay Funds: Trustee since 2023 (11 Funds)
MainStay Funds Trust: Trustee since 2023 (37 Funds);
MainStay MacKay DefinedTerm Municipal Opportunities Fund: Trustee since 2023;
MainStay CBRE Global Infrastructure Megatrends Term Fund: Trustee since 2023; and
New York Life Investment Management International (Chair) since 2015 |
| * | This Trustee is considered to be an “interested person” of the MainStay Group of Funds, MainStay VP Funds Trust, MainStay CBRE Global Infrastructure Megatrends Term Fund and MainStay MacKay DefinedTerm Municipal Opportunities Fund, within the meaning of the 1940 Act because of his affiliation with New York Life Investment Management LLC and Candriam, as described in detail above in the column entitled “Principal Occupation(s) During Past Five Years.” |
| | |
Board of Trustees and Officers (Unaudited) (continued)
| | Name and
Year of Birth | Term of Office,
Position(s) Held and
Length of Service | Principal Occupation(s)
During Past Five Years | Number of
Portfolios in
Fund Complex
Overseen by
Trustee | Other Directorships
Held by Trustee |
| | | | | | |
| | David H. Chow
1957 | MainStay VP Funds Trust: Trustee since January 2016, Advisory Board Member (June 2015 to December 2015) | Founder and CEO, DanCourt Management, LLC since 1999 | 81 | MainStay Funds: Trustee since January 2016, Advisory Board Member (June 2015 to December 2015) (11 Funds);
MainStay Funds Trust: Trustee since January 2016, Advisory Board Member (June 2015 to December 2015) (37 Funds);
MainStay MacKay DefinedTerm Municipal Opportunities Fund: Trustee since January 2016, Advisory Board Member (June 2015 to December 2015);
MainStay CBRE Global Infrastructure Megatrends Term Fund: Trustee since 2021;
VanEck Vectors Group of Exchange-Traded Funds: Trustee since 2006 and Independent Chairman of the Board of Trustees from 2008 to 2022 (57 portfolios); and
Berea College of Kentucky: Trustee since 2009, Chair of the Investment Committee since 2018 |
| | Karen Hammond
1956 | MainStay VP Funds Trust: Trustee since December 2021, Advisory Board Member (June 2021 to December 2021)
| Retired, Managing Director, Devonshire Investors (2007 to 2013); Senior Vice President, Fidelity Management & Research Co. (2005 to 2007); Senior Vice President and Corporate Treasurer, FMR Corp. (2003 to 2005); Chief Operating Officer, Fidelity Investments Japan (2001 to 2003) | 81 | MainStay Funds: Trustee since December 2021, Advisory Board Member (June 2021 to December 2021) (11 Funds);
MainStay Funds Trust: Trustee since December 2021, Advisory Board Member (June 2021 to December 2021) (37 Funds);
MainStay MacKay DefinedTerm Municipal Opportunities Fund: Trustee since December 2021, Advisory Board Member (June 2021 to December 2021);
MainStay CBRE Global Infrastructure Megatrends Term Fund: Trustee since December 2021, Advisory Board Member (June 2021 to December 2021);
Two Harbors Investment Corp.: Director since 2018;
Rhode Island State Investment Commission: Member since 2017; and
Blue Cross Blue Shield of Rhode Island: Director since 2019 |
| | Susan B. Kerley
1951 | MainStay VP Funds Trust: Chair since 2017 and Trustee since 2007** | President, Strategic Management Advisors LLC since 1990 | 81 | MainStay Funds: Chair since January 2017 and Trustee since 2007 (11 Funds); MainStay Funds Trust: Chair since January 2017 and Trustee since 1990 (37 Funds)***;
MainStay MacKay DefinedTerm Municipal Opportunities Fund: Chair since January 2017 and Trustee since 2011;
MainStay CBRE Global Infrastructure Megatrends Term Fund: Trustee since June 2021; and
Legg Mason Partners Funds: Trustee since 1991 (45 portfolios) |
| 42 | MainStay VP MacKay High Yield Corporate Bond Portfolio |
| | Name and
Year of Birth | Term of Office,
Position(s) Held and
Length of Service | Principal Occupation(s)
During Past Five Years | Number of
Portfolios in
Fund Complex
Overseen by
Trustee | Other Directorships
Held by Trustee |
| | | | | | |
| | Alan R. Latshaw
1951 | MainStay VP Funds Trust: Trustee since 2007** | Retired; Partner, Ernst & Young LLP (2002 to 2003); Partner, Arthur Andersen LLP (1989 to 2002); Consultant to the MainStay Funds Audit and Compliance Committee (2004 to 2006) | 81 | MainStay Funds: Trustee since 2006 (11 Funds);
MainStay Funds Trust: Trustee since 2007 (37 Funds)***;
MainStay MacKay DefinedTerm Municipal Opportunities Fund: Trustee since 2011; and
MainStay CBRE Global Infrastructure Megatrends Term Fund: Trustee since June 2021 |
| | Jacques P. Perold
1958 | MainStay VP Funds Trust: Trustee since January 2016, Advisory Board Member (June 2015 to December 2015) | Founder and Chief Executive Officer, CapShift Advisors LLC (since 2018); President, Fidelity Management & Research Company (2009 to 2014); President and Chief Investment Officer, Geode Capital Management, LLC (2001 to 2009) | 81 | MainStay Funds: Trustee since January 2016, Advisory Board Member (June 2015 to December 2015) (11 Funds);
MainStay Funds Trust: Trustee since January 2016, Advisory Board Member (June 2015 to December 2015) (37 Funds);
MainStay MacKay DefinedTerm Municipal Opportunities Fund: Trustee since January 2016, Advisory Board Member (June 2015 to December 2015);
MainStay CBRE Global Infrastructure Megatrends Term Fund: Trustee since June 2021;
Allstate Corporation: Director since 2015;
Partners in Health: Trustee since 2019; and
MSCI Inc.: Director since 2017 |
| | Richard S. Trutanic
1952 | MainStay VP Funds Trust: Trustee since 2007** | Chairman and Chief Executive Officer, Somerset & Company (financial advisory firm) since 2004; Managing Director, The Carlyle Group (private investment firm) (2002 to 2004); Senior Managing Director, Partner and Board Member, Groupe Arnault S.A. (private investment firm) (1999 to 2002) | 81 | MainStay Funds: Trustee since 1994 (11 Funds);
MainStay Funds Trust: Trustee since 2007 (37 Funds)***;
MainStay MacKay DefinedTerm Municipal Opportunities Fund: Trustee since 2011; and
MainStay CBRE Global Infrastructure Megatrends Term Fund: Trustee since June 2021 |
| ** | Includes prior service as a Director of MainStay VP Series Fund, Inc., the predecessor to MainStay VP Funds Trust. |
| *** | Includes prior service as a Director/Trustee of certain predecessor entities to MainStay Funds Trust. |
Board of Trustees and Officers (Unaudited) (continued)
| | Name and
Year of Birth | Position(s) Held and
Length of Service | Principal Occupation(s)
During Past Five Years | |
| | | | | |
| | Kirk C. Lehneis
1974 | President, MainStay VP Funds Trust (since 2017) | Chief Operating Officer and Senior Managing Director (since 2016), New York Life Investment Management LLC and New York Life Investment Management Holdings LLC; Member of the Board of Managers (since 2017) and Senior Managing Director (since 2018), NYLIFE Distributors LLC; Chairman of the Board and Senior Managing Director, NYLIM Service Company LLC (since 2017); Trustee, President and Principal Executive Officer of IndexIQ Trust, IndexIQ ETF Trust and IndexIQ Active ETF Trust (since 2018); President, MainStay CBRE Global Infrastructure Megatrends Term Fund (since 2021), MainStay MacKay DefinedTerm Municipal Opportunities Fund, MainStay Funds and MainStay Funds Trust (since 2017); Senior Managing Director, Global Product Development (from 2015 to 2016); Managing Director, Product Development (from 2010 to 2015), New York Life Investment Management LLC | |
| | Jack R. Benintende
1964 | Treasurer and Principal Financial and Accounting Officer, MainStay VP Funds Trust (since 2007)** | Managing Director, New York Life Investment Management LLC (since 2007); Treasurer and Principal Financial and Accounting Officer, MainStay CBRE Global Infrastructure Megatrends Term Fund (since 2021), MainStay MacKay DefinedTerm Municipal Opportunities Fund (since 2011), MainStay Funds Trust (since 2009) and MainStay Funds (since 2007); and Assistant Treasurer, New York Life Investment Management Holdings LLC (2008 to 2012) | |
| | J. Kevin Gao
1967 | Secretary and Chief Legal Officer, MainStay VP Funds Trust (since 2010)** | Managing Director and Associate General Counsel, New York Life Investment Management LLC (since 2010); Secretary and Chief Legal Officer, MainStay CBRE Global Infrastructure Megatrends Term Fund (since 2021), MainStay MacKay DefinedTerm Municipal Opportunities Fund (since 2011), MainStay Funds and MainStay Funds Trust (since 2010) | |
| | Kevin M. Gleason
1967 | Vice President and Chief Compliance Officer, MainStay VP Funds Trust (since June 2022) | Vice President and Chief Compliance Officer, IndexIQ Trust, IndexIQ ETF Trust and IndexIQ Active ETF Trust (since June 2022); Vice President and Chief Compliance Officer, MainStay CBRE Global Infrastructure Megatrends Term Fund, MainStay MacKay DefinedTerm Municipal Opportunities Fund (since June 2022); MainStay Funds Trust and MainStay Funds (since June 2022); Senior Vice President, Voya Investment Management and Chief Compliance Officer, Voya Family of Funds (2012 to 2022) | |
| | Scott T. Harrington
1959 | Vice President— Administration, MainStay VP Funds Trust (since 2005)** | Managing Director, New York Life Investment Management LLC (including predecessor advisory organizations) (since 2000); Member of the Board of Directors, New York Life Trust Company (since 2009); Vice President—Administration, MainStay CBRE Global Infrastructure Megatrends Term Fund (since 2021), MainStay MacKay DefinedTerm Municipal Opportunities Fund (since 2011), MainStay Funds Trust and MainStay Funds (since 2009) | |
| * | The officers listed above are considered to be “interested persons” of the MainStay Group of Funds, MainStay VP Funds Trust, MainStay CBRE Global Infrastructure Megatrends Term Fund and MainStay MacKay DefinedTerm Municipal Opportunities Fund within the meaning of the 1940 Act because of their affiliation with the MainStay Group of Funds, New York Life Insurance Company and/or its affiliates, including New York Life Investment Management LLC, New York Life Insurance Company, NYLIM Service Company LLC, NYLIFE Securities LLC and/or NYLIFE Distributors LLC, as described in detail in the column captioned “Principal Occupation(s) During Past Five Years.” Officers are elected annually by the Board. |
| ** | Includes prior service as an Officer of MainStay VP Series Fund, Inc., the predecessor to MainStay VP Funds Trust. |
Officers of the Trust (Who are not Trustees)*
| 44 | MainStay VP MacKay High Yield Corporate Bond Portfolio |
This page intentionally left blank
This page intentionally left blank.
MainStay VP Portfolios
MainStay VP offers a wide range of Portfolios. The full array of MainStay VP offerings is listed here, with information about the manager, subadvisors, legal counsel, and independent registered public accounting firm.
Equity
MainStay VP American Century Sustainable Equity Portfolio
MainStay VP Candriam Emerging Markets Equity Portfolio
MainStay VP Epoch U.S. Equity Yield Portfolio
MainStay VP Fidelity Institutional AM® Utilities Portfolio†
MainStay VP Natural Resources Portfolio
MainStay VP PineStone International Equity Portfolio1
MainStay VP S&P 500 Index Portfolio
MainStay VP Small Cap Growth Portfolio
MainStay VP Wellington Growth Portfolio
MainStay VP Wellington Mid Cap Portfolio
MainStay VP Wellington Small Cap Portfolio
MainStay VP Wellington U.S. Equity Portfolio
MainStay VP Winslow Large Cap Growth Portfolio
Mixed Asset
MainStay VP Balanced Portfolio
MainStay VP Income Builder Portfolio
MainStay VP Janus Henderson Balanced Portfolio
MainStay VP MacKay Convertible Portfolio
Income
MainStay VP Bond Portfolio
MainStay VP Floating Rate Portfolio
MainStay VP Indexed Bond Portfolio
MainStay VP MacKay Government Portfolio2
MainStay VP MacKay High Yield Corporate Bond Portfolio
MainStay VP MacKay Strategic Bond Portfolio
MainStay VP PIMCO Real Return Portfolio
Money Market
MainStay VP U.S. Government Money Market Portfolio
Alternative
MainStay VP CBRE Global Infrastructure Portfolio
MainStay VP IQ Hedge Multi-Strategy Portfolio
Asset Allocation
MainStay VP Conservative Allocation Portfolio
MainStay VP Equity Allocation Portfolio
MainStay VP Growth Allocation Portfolio
MainStay VP Moderate Allocation Portfolio
Manager
New York Life Investment Management LLC
New York, New York
Subadvisors
American Century Investment Management, Inc.
Kansas City, Missouri
Brown Advisory LLC
Baltimore, Maryland
Candriam*
Strassen, Luxembourg
CBRE Investment Management Listed Real Assets LLC
Radnor, Pennsylvania
Epoch Investment Partners, Inc.
New York, New York
FIAM LLC
Smithfield, Rhode Island
IndexIQ Advisors LLC*
New York, New York
Janus Henderson Investors US LLC
Denver, Colorado
MacKay Shields LLC*
New York, New York
Newton Investment Management North America, LLC
Boston, Massachusetts
NYL Investors LLC*
New York, New York
Pacific Investment Management Company LLC
Newport Beach, California
PineStone Asset Management Inc.
Montreal, Québec
Segall Bryant & Hamill, LLC
Chicago, Illinois
Wellington Management Company LLP
Boston, Massachusetts
Winslow Capital Management, LLC
Minneapolis, Minnesota
Legal Counsel
Dechert LLP
Washington, District of Columbia
Independent Registered Public Accounting Firm
PricewaterhouseCoopers LLP
New York, New York
Distributor
NYLIFE Distributors LLC*
Jersey City, New Jersey
Custodian
JPMorgan Chase Bank, N.A.
New York, New York
Some Portfolios may not be available in all products.
† Fidelity Institutional AM is a registered trade mark of FMR LLC. Used with permission.
* An affiliate of New York Life Investment Management LLC.
| 1. | Prior to August 28, 2023, the Portfolio's name was MainStay VP MacKay International Equity Portfolio. |
| 2. | Effective on or about May 1, 2024, the MainStay VP MacKay Government Portfolio will be renamed the MainStay VP U.S. Infrastructure Bond Portfolio. |
Not part of the Annual Report
2023 Annual Report
This report is for the general information of New York Life Variable Annuities and NYLIAC Variable Universal Life Insurance Products policyowners. It must be preceded or accompanied by the appropriate product(s) and funds prospectuses if it is given to anyone who is not an owner of a New York Life variable annuity policy or a NYLIAC Variable Universal Life Insurance Product. This report does not offer for sale or solicit orders to purchase securities.
The performance data quoted in this report represents past performance. Past performance is no guarantee of future results. Due to market volatility and other factors, current performance may be lower or higher than the figures shown. The most recent month-end performance summary for your variable annuity or variable life policy is available by calling 800-598-2019 and is updated periodically on newyorklife.com.
The New York Life Variable Annuities and NYLIAC Variable Universal Life Insurance Products are issued by New York Life Insurance and Annuity Corporation (a Delaware Corporation) and distributed by NYLIFE Distributors LLC (Member FINRA/SIPC).
New York Life Insurance Company
New York Life Insurance and Annuity
Corporation (NYLIAC) (A Delaware Corporation)
51 Madison Avenue, Room 551
New York, NY 10010
newyorklife.com
newyorklifeinvestments.com
NYLIFE Distributors LLC, 30 Hudson Street, Jersey City, NJ 07302
New York Life Investment Management LLC is the investment manager to the MainStay VP Funds Trust
©2024 by NYLIFE Distributors LLC. All rights reserved.
You may obtain copies of the Prospectus and the Statement of Additional Information free of charge, upon request, by calling toll-free 800-598-2019 or writing to New York Life Insurance and Annuity Corporation, 51 Madison Avenue, New York, NY 10010.
| Not FDIC Insured | No Bank Guarantee | May Lose Value |
(NYLIAC) NI520
MainStay VP Income Builder Portfolio
Message from the President and Annual Report
December 31, 2023
Special Notice:
Beginning in July 2024, new regulations issued by the Securities and Exchange Commission (SEC) will take effect requiring open-end mutual fund companies and ETFs to (1) overhaul the content of their shareholder reports and (2) mail paper copies of the new tailored shareholder reports to shareholders who have not opted to receive these documents electronically.
If you have not yet elected to receive your shareholder reports electronically, please contact your financial intermediary or visit our website.
| Not FDIC/NCUA Insured | Not a Deposit | May Lose Value | No Bank Guarantee | Not Insured by Any Government Agency |
This page intentionally left blank
Message from the President
Against a backdrop of easing inflationary pressures and continued economic growth, stocks and bonds generally gained ground during the 12-month period ended December 31, 2023, despite high levels of volatility and sharp disparities between the performance of the different market sectors.
Although the war in Ukraine, the outbreak of hostilities in the Middle East and several other notable events affected financial assets, inflation, interest rate, and economic growth trends stood at the forefront of market developments during most of the period. As the reporting period began, high levels of inflation already showed signs of easing in the face of aggressive rate hikes by U.S. Federal Reserve (the “Fed”). From a peak of 9.1% in June 2022, the annualized U.S. inflation rate dropped to 6.4% in January, and 3.4% in December 2023. At the same time, the Fed increased the benchmark federal funds rate from 4.25%–4.50% at the beginning of reporting period, to 5.25%–5.50% as of the end of 2023. Despite the increasing cost of capital and tighter lending environment that resulted from rising rates, economic growth remained surprisingly robust, bolstered by high levels of consumer spending, low levels of unemployment and better-than-expected corporate earnings. With the pace of rate increases slowing from the prior year, investors began hoping for an early shift to a looser monetary policy, with stock prices and bond yields reacting as economic data and statements from the Fed either reinforced or undercut those hopes. Following months of hawkish rhetoric, the Fed finally reversed its stance in December 2023, signaling a positive economic outlook with little chance of a recession and a likelihood of rate cuts in 2024.
The S&P 500® Index, a widely regarded benchmark of U.S. market performance, produced strong gains during the reporting period-– recovering all its losses from 2022 and approached new record territory. A preponderance of the Index’s gains were generated by a relatively small number of mega-cap stocks in the information technology, communication services and consumer discretionary sectors that stood to benefit from rapid developments in generative artificial intelligence (“AI”). Value-oriented, interest-rate sensitive and small-capitalization
shares lagged by significant margins, although market strength widened during the closing weeks of the reporting period. Most overseas equity markets trailed the U.S. market, as developed international economies experienced relatively low growth rates, and weak economic conditions in China undermined emerging markets.
Bonds produced generally positive returns, bolstered by attractive and relatively stable yields. The yield on the 10-year Treasury note hit a high of just under 5% in mid-October 2023, ranging between approximately 3.5% and 4.8% for most of the reporting period. The yield curve remained inverted throughout the year, with the 2-year Treasury yield modestly above the 10-year yield. Corporate bond prices trended moderately higher, generally outperforming government securities. After years of low yields and tight credit spreads, the corporate sector benefited from more attractive valuations and income opportunities. Among corporates, markets generally rewarded longer duration and lower credit quality, although an uptick in default rates posed added risks for high-yield corporate bonds. International bond markets produced mixed returns, with emerging-markets issues advancing over their developed-markets counterparts.
The market volatility of recent years reminds us of the constant need for experienced and steadfast portfolio management in the face of uncertainty. New York Life Investments remains dedicated to providing you, as a valued MainStay VP investor, with the guidance, resources and investment solutions you need to pursue your financial goals.
Thank you for trusting us to help meet your investment needs.
Sincerely,
Kirk C. Lehneis
President
The opinions expressed are as of the date of this report and are subject to change. There is no guarantee that any forecast made will come to pass. This material does not constitute investment advice and is not intended as an endorsement of any specific investment. Past performance is no guarantee of future results.
Not part of the Annual Report
Investors should refer to the Portfolio’s Summary Prospectus and/or Prospectus and consider the Portfolio’s investment objectives, strategies, risks, charges and expenses carefully before investing. The Summary Prospectus and/or Prospectus contain this and other information about the Portfolio. You may obtain copies of the Portfolio’s Summary Prospectus, Prospectus and Statement of Additional Information, which includes information about the MainStay VP Funds Trust's Trustees, free of charge, upon request, by calling toll-free 800-598-2019, by writing to New York Life Insurance and Annuity Corporation, 51 Madison Avenue, Room 251, New York, New York 10010 or by sending an email to MainStayShareholdersServices@nylim.com. These documents are also available at newyorklifeinvestments.com/investment-products/vp. Please read the Portfolio's Summary Prospectus and/or Prospectus carefully before investing. MainStay VP Funds Trust portfolios are separate account options which are purchased through a variable insurance or variable annuity contract.
Investment and Performance Comparison (Unaudited)
Performance data quoted represents past performance. Past performance is no guarantee of future results. Because of market volatility and other factors, current performance may be lower or higher than the figures shown. Investment return and principal value will fluctuate, and as a result, when shares are redeemed, they may be worth more or less than their original cost. The performance table and graph do not reflect any deduction of sales charges, mortality and expense charges, contract charges or administrative charges. Please refer to the Performance Summary appropriate for your policy. For performance information current to the most recent month-end, please call 800-598-2019 or visit www.newyorklife.com.
Performance figures may reflect certain fee waivers and/or expense limitations, without which total returns may have been different. For information on current fee waivers and/or expense limitations (if any), please refer to the Notes to Financial Statements.
| Average Annual Total Returns for the Year-Ended December 31, 2023 |
| Class | Inception
Date | One
Year | Five
Years | Ten
Years | Gross
Expense
Ratio1 |
| Initial Class Shares | 1/29/1993 | 10.05% | 6.04% | 5.01% | 0.62% |
| Service Class Shares | 6/4/2003 | 9.78 | 5.78 | 4.75 | 0.87 |
| 1. | The gross expense ratios presented reflect the Portfolio’s “Total Annual Portfolio Operating Expenses” from the most recent Prospectus and may differ from other expense ratios disclosed in this report. |
| Benchmark Performance* | One
Year | Five
Years | Ten
Years |
| MSCI World Index (Net)1 | 23.79% | 12.80% | 8.60% |
| Bloomberg U.S. Aggregate Bond Index2 | 5.53 | 1.10 | 1.81 |
| Blended Benchmark Index3 | 16.27 | 8.31 | 6.08 |
| Morningstar World Allocation Category Average4 | 10.72 | 6.09 | 4.02 |
| * | Returns for indices reflect no deductions for fees, expenses or taxes, except for foreign withholding taxes where applicable. Results assume reinvestment of all dividends and capital gains. An investment cannot be made directly in an index. |
| 1. | The MSCI World Index (Net) is the Portfolio's primary broad-based securities market index for comparison purposes. The MSCI World Index (Net) is a free float-adjusted market capitalization weighted index that is designed to measure the equity market performance of developed markets. |
| 2. | The Portfolio has selected the Bloomberg U.S. Aggregate Bond Index as a secondary benchmark. The Bloomberg U.S. Aggregate Bond Index is a broad-based benchmark that measures the investment grade, U.S. dollar-denominated, fixed-rate taxable bond market, including Treasuries, government-related and corporate securities, mortgage-backed securities (agency fixed-rate and hybrid adjustable rate mortgage pass-throughs), asset-backed securities, and commercial mortgage-backed securities. |
| 3. | The Portfolio has selected the Blended Benchmark Index as an additional benchmark. The Blended Benchmark Index consists of the MSCI World Index (Net) and the Bloomberg U.S. Aggregate Bond Index, weighted 60% and 40%, respectively. |
| 4. | The Morningstar World Allocation Category Average is representative of funds that seek to provide both capital appreciation and income by investing in three major areas: stocks, bonds, and cash. While these funds do explore the whole world, most of them focus on the U.S., Canada, Japan, and the larger markets in Europe. It is rare for such funds to invest more than 10% of their assets in emerging markets. These funds typically have at least 10% of assets in bonds, less than 70% of assets in stocks, and at least 40% of assets in non-U.S. stocks or bonds. Results are based on average total returns of similar funds with all dividends and capital gain distributions reinvested. |
Cost in Dollars of a $1,000 Investment in MainStay VP Income Builder Portfolio (Unaudited)
The example below is intended to describe the fees and expenses borne by shareholders during the six-month period from July 1, 2023 to December 31, 2023, and the impact of those costs on your investment.
Example
As a shareholder of the Portfolio you incur two types of costs: (1) transaction costs, including exchange fees and sales charges (loads) on purchases (as applicable), and (2) ongoing costs, including management fees, distribution and/or service (12b-1) fees and other Portfolio expenses (as applicable). This example is intended to help you understand your ongoing costs (in dollars) of investing in the Portfolio and to compare these costs with the ongoing costs of investing in other mutual funds. The example is based on an investment of $1,000 made at the beginning of the six-month period and held for the entire period from July 1, 2023 to December 31, 2023. Shares are only sold in connection with variable life and annuity contracts and the example does not reflect any contract level or transactional fees or expenses. If these costs had been included, your costs would have been higher.
This example illustrates your Portfolio’s ongoing costs in two ways:
Actual Expenses
The second and third data columns in the table below provide information about actual account values and actual expenses. You may use the information in these columns, together with the amount you invested, to estimate the expenses that you paid during the six months ended
December 31, 2023. Simply divide your account value by $1,000 (for example, an $8,600 account value divided by $1,000 = 8.6), then multiply the result by the number under the heading entitled “Expenses Paid During Period” to estimate the expenses you paid on your account during this period.
Hypothetical Example for Comparison Purposes
The fourth and fifth data columns in the table below provide information about hypothetical account values and hypothetical expenses based on the Portfolio’s actual expense ratio and an assumed rate of return of 5% per year before expenses, which is not the Portfolio’s actual return. The hypothetical account values and expenses may not be used to estimate the actual ending account balances or expenses you paid for the six-month period shown. You may use this information to compare the ongoing costs of investing in the Portfolio with the ongoing costs of investing in other mutual funds. To do so, compare this 5% hypothetical example with the 5% hypothetical examples that appear in the shareholder reports of the other mutual funds.
Please note that the expenses shown in the table are meant to highlight your ongoing costs only and do not reflect any transactional costs, such as exchange fees or sales charges (loads). Therefore, the fourth and fifth data columns of the table are useful in comparing ongoing costs only and will not help you determine the relative total costs of owning different funds. In addition, if these transactional costs were included, your costs would have been higher.
| Share Class | Beginning
Account
Value
7/1/23 | Ending Account
Value (Based
on Actual
Returns and
Expenses)
12/31/23 | Expenses
Paid
During
Period1 | Ending Account
Value (Based
on Hypothetical
5% Annualized
Return and
Actual Expenses)
12/31/23 | Expenses
Paid
During
Period1 | Net Expense
Ratio
During
Period2 |
| Initial Class Shares | $1,000.00 | $1,051.90 | $3.21 | $1,022.08 | $3.16 | 0.62% |
| Service Class Shares | $1,000.00 | $1,050.60 | $4.50 | $1,020.82 | $4.43 | 0.87% |
| 1. | Expenses are equal to the Portfolio’s annualized expense ratio of each class multiplied by the average account value over the period, divided by 365 and multiplied by 184 (to reflect the six-month period). The table above represents the actual expenses incurred during the six-month period. In addition to the fees and expenses which the Portfolio bears directly, it also indirectly bears a pro rata share of the fees and expenses of the underlying funds in which it invests. Such indirect expenses are not included in the above-reported expense figures. |
| 2. | Expenses are equal to the Portfolio's annualized expense ratio to reflect the six-month period. |
| 6 | MainStay VP Income Builder Portfolio |
Portfolio Composition as of December 31, 2023 (Unaudited)
See Portfolio of Investments beginning on page 12 for specific holdings within these categories. The Portfolio's holdings are subject to change.
Top Ten Holdings and/or Issuers Held as of December 31, 2023 (excluding short-term investments) (Unaudited)
| 1. | GNMA, (zero coupon)-7.83%, due 4/20/48–10/16/63 |
| 2. | FHLMC STACR REMIC Trust, 7.437%-12.837%, due 8/25/33–1/25/51 |
| 3. | UMBS, 30 Year, 2.50%-6.50%, due 8/1/48–12/1/53 |
| 4. | FHLMC, (zero coupon)-4.50%, due 1/15/41–1/25/55 |
| 5. | U.S. Treasury Bonds, 4.75%, due 11/15/43–11/15/53 |
| 6. | Broadcom, Inc. |
| 7. | Microsoft Corp. |
| 8. | UMBS Pool, 30 Year, 3.50%-6.50%, due 7/1/50–12/1/53 |
| 9. | Bank of America Corp. |
| 10. | International Business Machines Corp. |
Portfolio Management Discussion and Analysis (Unaudited)
Answers to the questions reflect the views of Jae S. Yoon, CFA, and Jonathan Swaney of New York Life Investment Management LLC, the Portfolio’s Manager; Neil Moriarty III, Shu-Yang Tan, Tom Musmanno, CFA and Michael DePalma of MacKay Shields LLC (“MacKay Shields”), the Subadvisor for the fixed-income portion of the Portfolio; and William W. Priest, CFA, Michael A. Welhoelter, CFA, John Tobin, PhD, CFA, and Kera Van Valen, CFA, of Epoch Investment Partners, Inc. (“Epoch”), the Subadvisor for the equity portion of the Portfolio.
How did MainStay VP Income Builder Portfolio perform relative to its benchmarks and peers during the 12 months ended December 31, 2023?
For the 12 months ended December 31, 2023, MainStay VP Income Builder Portfolio returned 10.05% for Initial Class shares and 9.78% for Service Class shares. Over the same period, both share classes underperformed the 23.79% return of the MSCI World Index (Net), which is the Portfolio’s primary benchmark; outperformed the 5.53% return of the Bloomberg U.S. Aggregate Bond Index, which is the Portfolio’s secondary benchmark; and underperformed the 16.27% return of the Blended Benchmark Index, which is an additional benchmark of the Portfolio. For the 12 months ended December 31, 2023, both share classes underperformed the 10.72% return of the Morningstar World Allocation Category Average.1
During the reporting period, were there any market events that materially impacted the Portfolio’s performance or liquidity?
U.S. equities staged a remarkable recovery in 2023, as policy actions and a strong labor market gradually reduced the odds of a recession, ending the year with the U.S. Federal Reserve (the “Fed”) finally signaling the pivot on interest rates that had been anticipated for the prior two years. The economic backdrop and uncertainties that had plagued the markets through a challenging 2022 remained in place at the start of the reporting period: inflation at multi-decade highs, central bankers adamantly hawkish, elevated geopolitical tensions driving a trend of deglobalizing trade and forecasts for a near-term recession almost ubiquitous. Despite these pressures, investors began 2023 optimistic that sluggish disinflation would lead to a dovish policy pivot, fueling a steep rally in January. However, swift hawkish pushback from the Fed drove markets lower in February, making it clear that equities would remain heavily influenced by long-standing uncertainties regarding the trajectory for inflation and interest rates.
The market’s response to the high-profile collapse of a few regional banks in March drove this point home forcefully. Markets dipped briefly on the news, but rather than sparking lasting economic fears, the episode ultimately fueled broad expectations for an early dovish pivot by the Fed. Those hopes reignited risk-on sentiment and drove markets higher. Rising broad market indexes painted a misleading picture, however, as market leadership proved extraordinarily narrow. Many of the mega-cap technology titans that frequently led markets in recent years once again emerged as market darlings, with Apple, Microsoft, Alphabet, Amazon.com, NVIDIA, Meta Platforms and Tesla collectively earning the name “The Magnificent 7.” The concentrated rally was led by the fact that the aforementioned stocks were central players in the mainstream arrival of generative artificial
intelligence (“AI”). AI’s headlining emergence further galvanized bullish sentiment, with market caps soaring for the Magnificent 7, together with several other companies perceived as early movers in the space.
The rally powered through most of the summer, sustained by remarkably resilient consumer spending alongside a thriving economy, continued disinflation and a pause in rate hikes. However, sentiment shifted once again in August, as markets began to digest the Fed's hawkish messaging and "higher-for-longer" stance on rates. Surging bond yields accompanied declining equities through late October, before sentiment abruptly reversed again on another bout of peak-Fed and soft-landing hopes. The Fed’s revised December forecast of 75 basis points of easing in 2024 drove the equity market even higher, with investors pricing in more rate cuts than the Fed suggested. (A basis point is one one-hundredth of a percentage point.) Markets ended the year having recouped nearly all the ground lost in 2022.
On the fixed-income side, although volatility was prevalent throughout the reporting period, in our opinion no single event adversely impacted the Portfolio’s performance or liquidity significantly during the reporting period.
What factors affected the relative performance of the equity portion of the Portfolio during the reporting period?
The reporting period saw sentiment swing several times as investors grappled with the forward trajectory for interest rates and global growth. The strength and narrowness of market leadership heavily pressured the equity portion of the Portfolio’s performance relative to the MSCI World Index (Net). Underperformance was significantly concentrated in the first half of 2023, largely due to the surge in mega-cap tech stocks, many of which do not pay a dividend and so are outside of the Portfolio’s investable universe. By nature of being a more defensive, income-oriented strategy and, therefore, having a value tilt, the sector/industry exposures within the Portfolio also gave rise to relative performance headwinds; utilities, a sector in which the Portfolio tends to hold an overweight position, was the weakest sector within the MSCI World Index (Net), and information technology, a sector in which the Portfolio tends to hold an underweight position, was the strongest. From a factor perspective, negative exposure to market sensitivity and size were headwinds to relative return. The Portfolio continued to find companies with strong, growing cash flows and capital allocation policies that emphasize returning excess free cash flow to shareholders. Dividend growth remained central to the Portfolio’s investment strategy, with most holdings increasing their dividend in 2023. The Portfolio participated in the market rallies and
| 1. | See page 5 for more information on benchmark and peer group returns. |
| 8 | MainStay VP Income Builder Portfolio |
provided downside protection during the two broader market downturns.
Which market segments were the strongest positive contributors to relative performance in the equity portion of the Portfolio, and which market segments detracted the most?
During the reporting period, the energy sector made the strongest contribution to returns relative to the MSCI World Index (Net), due to positive stock selection. (Contributions take weightings and total returns into account.) Stock selection in real estate also contributed positively. Information technology was the largest detractor, due to stock selection and an underweight allocation to the best performing sector in the MSCI World Index (Net). Communication services was the next-most significant detractor, driven by stock selection, followed by consumer discretionary, as a result of stock selection and an underweight allocation.
During the reporting period, which individual stocks made the strongest positive contributions to absolute performance in the equity portion of the Portfolio and which stocks detracted the most?
The strongest positive contributors to the absolute performance of the equity portion of the Portfolio included communications semiconductor manufacturer Broadcom, enterprise software company Microsoft and consumer electronics maker Apple.
Broadcom designs and manufactures digital and analog semiconductors focused on connectivity. It also develops and maintains software for mainframe applications. Shares outperformed based on continued support for, and backlog of, enterprise network upgrades. The stock also benefited from growing AI-related workloads and the completion of the company’s acquisition of cloud computing and virtualization company VMWare, which led Broadcom’s management to provide positive forward guidance for 2024. Broadcom returns cash to shareholders via an attractive dividend, with a target of paying out 50% of free cash flow. The balance of cash generation is used to fund debt reduction, share repurchases and/or accretive mergers and acquisitions.
Microsoft shares rose on the company’s strong position in generative AI. The company is at the forefront of AI adoption through its investment in, and integration of, models developed by OpenAI. Shared plans for integration, pricing and a better board structure all helped drive Microsoft’s shares higher. Management is dedicated to shareholder returns through continued improvements to its dividend and share repurchase plans.
Apple shares outperformed as the company benefited from being one of a handful of favored mega-cap tech names to which investors flocked in an uncertain economic environment. Underlying financial performance was solid, despite softness in iPhone sales prior to the iPhone 15 launch. Mac sales were pressured on difficult post-pandemic comparisons. Apple returns cash to shareholders through dividends and share repurchases.
The weakest contributors to the absolute performance of the equity portion of the Portfolio included positions in regional bank KeyCorp, pharmaceutical company Pfizer and tobacco producer British American Tobacco.
KeyCorp operates branches in 15 states in the Northeast, Midwest, and Northwest United States. Shares declined during the reporting period, along with those of banking industry peers, as the failures of Silicon Valley Bank and Signature Bank caused a crisis of confidence that reverberated through the entire sector. Although we believe the company will continue to generate strong earnings power, as higher capital standards for the industry are expected to be imposed by regulators, we anticipate that KeyCorp will need to build capital by retaining a greater proportion of earnings, holding dividends flat and deferring share repurchases for several years. We exited the Portfolio’s position to reallocate funds toward other companies in the sector that offered stronger potential for capital returns over the medium term.
Pfizer develops and markets drugs and vaccines in several therapeutic areas. Shares lagged in 2023, underperforming peers in the pharmaceutical industry as the company adjusted to life without the strong tailwind from its COVID-19 franchise drugs. The impact was compounded in December, when preliminary guidance for 2024 suggested COVID-19-related sales below market expectations. During the reporting period, Pfizer also reported that its entry in the GLP-1 class failed in a key clinical trial. Despite these near-term stumbles, we expect that ongoing revenues and earnings from the COVID-19 franchise will remain substantial, with other pipeline opportunities to offset the GLP-1 disappointment. Pfizer raised its dividend in December in line with other dividend increases in recent years, demonstrating management's confidence in, and commitment to, the company’s attractive and well-covered dividend policy.
British American Tobacco holds 30% market share in its top 40 markets. The company has also invested to develop a robust portfolio of next-generation, reduced-risk products. Sentiment toward the company’s stock came under pressure during the reporting period, due to modest share losses to lower-price competitors, suboptimal execution in the state of California after menthol products were banned earlier in the year, continued fears regarding regulation of U.S. vaping products and the company's abrupt replacement of its CEO in May. Long term, British American Tobacco's top-line growth, coupled with disciplined cost controls, allow it to generate strong cash flows and consistently return cash to shareholders through a growing dividend.
Did the equity portion of the Portfolio make any significant purchases or sales during the reporting period?
During the reporting period, the equity portion of the Portfolio initiated multiple positions, including IT service provider Dell and communications and media company Rogers Communications. Dell provides products serving the infrastructure marketplace, including servers and data storage, and serves the consumer and
commercial space with PC hardware and peripherals. Growth is driven by an increase in data storage, processing and computing needs, and the company captures market share through attractive technology and pricing. Dell targets distributing 40-60% of adjusted free cash flow back to shareholders, which is achieved through a combination of a growing dividend and periodic share repurchases. Additional cash generation is directed to slight debt reduction and tuck-in mergers and acquisitions to broaden the company’s addressable market.
Rogers provides wireless, fixed line telephone, internet, cable TV and IT services in Canada. The company recently completed the acquisition of Shaw Communications wireline assets. We believe growth will come from market expansion driven by immigration into Canada, increased package sizes and market share gains in the Shaw footprint from bundled deals. Rogers returns cash through its dividend, debt reduction and periodic share repurchases.
A number of positions were closed during the reporting period, including equipment manufacturer Hubbell and tire manufacturer Bridgestone. Hubbell produces highly engineered utility solutions and electrical products for a broad range of applications that enable utility, commercial, and industrial customers to operate critical infrastructure safely, reliably and efficiently. The company has continued to generate robust cash flow in recent periods; however, in our view, share price appreciation has constrained the company's shareholder yield potential. We exited the Portfolio’s position to reallocate capital toward what we believe are more attractive opportunities. Bridgestone generates cash as a result of new car sales and replacement tires, which are largely tied to mileage driven. Growth is related to pricing, market share gains, global vehicle sales and miles driven, with near-term growth benefiting from investments in technology to increase the range of electric vehicles and a focus on larger-size tires. The position was closed to fund other opportunities.
How did sector weightings in the equity portion of the Portfolio change during the reporting period?
During the reporting period, the most significant sector allocation changes to the equity portion of the Portfolio included decreased exposures to financials and energy, and increased exposures to information technology and industrials. The most significant country allocation changes were increases in the United States and South Korea, and reductions in Germany and China. The Portfolio’s sector and country allocations are a result of our bottom-up fundamental investment process and reflect the companies and securities that we confidently believe can collect and distribute sustainable, growing shareholder value.
How was the equity portion of the Portfolio positioned at the end of the reporting period?
Relative to the MSCI World Index (Net), as of December 31, 2023, the most substantially overweight sector positions in the equity portion of the Portfolio were in utilities and consumer staples. As of the same date, the most substantially underweight sector positions relative to the Index were in consumer discretionary and information technology. These relative weightings were the result of individual stock selections rather than a top-down macroeconomic view.
What factors affected the relative performance of the fixed-income portion of the Portfolio during the reporting period?
During the reporting period, security selection and overweight exposure to securitized products, high-yield corporates, and emerging-markets credit made positive contributions to the fixed-income portion of the Portfolio’s outperformance relative to the Bloomberg U.S. Aggregate Bond Index, as spread product,2 in general, outperformed.
During the reporting period, how was the Portfolio’s performance materially affected by investments in derivatives?
The fixed-income portion of the Portfolio used U.S. Treasury futures to hedge its duration.3 This position did not materially impact returns during the reporting period.
What was the duration strategy of the fixed-income portion of the Portfolio during the reporting period?
Although the fixed-income portion of the Portfolio maintained a longer duration position than the Bloomberg U.S. Aggregate Bond Index, it was reduced during the reporting period. The longer duration was a slight drag on relative performance during the year. As of the end of the reporting period, the Fund’s duration was 6.3 years, relative to 6.1 years for the Index.
What specific factors, risks or market forces prompted significant decisions for the fixed-income portion of the Portfolio during the reporting period?
During the reporting period, we lowered the fixed-income portion of the Portfolio’s risk profile by reducing its weight in high-yield corporate bonds due to tighter valuations, and we increased the Portfolio’s weight in residential mortgage-backed securities (“RMBS”) as those spreads to U.S. Treasury securities had widened out. Additionally, we reduced the Portfolio’s exposure to regional banks in favor of G-SIBs (globally systematically important banks), due to stronger capital ratios and balance sheet liquidity, in addition to the fact that regional banks have a
| 2. | The terms “spread” and “yield spread” may refer to the difference in yield between a security or type of security and comparable U.S. Treasury issues. The terms may also refer to the difference in yield between two specific securities or types of securities at a given time. The term “spread product” refers to asset classes that typically trade at a spread to comparable U.S. Treasury securities. |
| 3. | Duration is a measure of the price sensitivity of a fixed-income investment to changes in interest rates. Duration is expressed as a number of years and is considered a more accurate sensitivity gauge than average maturity. |
| 10 | MainStay VP Income Builder Portfolio |
disproportionate exposure to commercial real estate, which remained a risk.
During the reporting period, which market segments were the strongest positive contributors to the absolute performance of the fixed-income portion of the Portfolio and which market segments were particularly weak?
During the reporting period, the market segments making the strongest contributions to the fixed-income portion of the Portfolio’s absolute returns included credit risk transfer bonds, investment-grade corporate bonds and asset-backed securities. The market segments that contributed the least on an absolute basis included collateralized mortgage obligations, U.S. Treasury securities and preferred securities.
Did the fixed-income portion of the Portfolio make any significant purchases or sales during the reporting period?
During the reporting period, the fixed-income portion of the Portfolio added exposure to Georgia Power, a fully regulated utility, because we saw attractive value on a risk-adjusted basis. Georgia Power benefits from stable and predictable cash flow generation and strong relationships with its regulators. The Portfolio also initiated a position in Charter Communications, based on attractive valuation. We consider Charter a core high yield holding as one of the largest cable and telecommunications providers in the United States, with solid fundamentals and relatively non-cyclical operations.
During the same period, we sold the Portfolio’s position in Howmet Aerospace for relative value reasons as valuations became full. Although Howmet is a strong high-yield credit rated BB+4 on an improving trajectory, in our opinion, the valuation already fully reflected any potential future improvement. At the time of sale, Howmet traded in line with, or better than, many low-BBB-rated5 investment-grade corporates. We also sold the Portfolio’s position in QVC following a periodic credit review of the issuer. In light of worsening earnings trends, coupled with our cautious outlook on cyclical consumer spending, we concluded that a stress event may materialize for the issuer in 2024, and was likely in 2025.
How did sector weightings change in the fixed-income portion of the Portfolio during the reporting period?
During the reporting period, the fixed-income portion of the Portfolio increased its exposure to residential and agency mortgage-backed securities. During the same period, the Portfolio reduced its exposure to Treasuries, as well as investment-grade and high-yield corporate bonds.
How was the fixed-income portion of the Portfolio positioned at the end of the reporting period?
As of December 31, 2023, relative to the Bloomberg U.S. Aggregate Bond Index, the fixed-income portion of the Portfolio held overweight exposure to high-yield and investment-grade corporate bonds, as well as securitized assets. As of the same date, the Portfolio held underweight exposure to U.S. Treasury securities.
| 4. | An obligation rated ‘BB’ by Standard & Poor’s (“S&P”) is deemed by S&P to be less vulnerable to nonpayment than other speculative issues. In the opinion of S&P, however, the obligor faces major ongoing uncertainties or exposure to adverse business, financial or economic conditions which could lead to the obligor’s inadequate capacity to meet its financial commitment on the obligation. When applied to Fund holdings, ratings are based solely on the creditworthiness of the bonds in the portfolio and are not meant to represent the security or safety of the Fund. Ratings from ‘AA’ to ‘CCC’ may be modified by the addition of a plus (+) or minus (–) sign to show relative standing within the major rating categories. |
| 5. | An obligation rated ‘BBB’ by S&P is deemed by S&P to exhibit adequate protection parameters. In the opinion of S&P, however, adverse economic conditions or changing circumstances are more likely to lead to a weakened capacity of the obligor to meet its financial commitment on the obligation. When applied to Fund holdings, ratings are based solely on the creditworthiness of the bonds in the portfolio and are not meant to represent the security or safety of the Fund. |
The opinions expressed are those of the portfolio managers as of the date of this report and are subject to change. There is no guarantee that any forecasts will come to pass. This material does not constitute investment advice and is not intended as an endorsement of any specific investment.
Not all MainStay VP Portfolios and/or share classes are available under all policies.
Portfolio of Investments December 31, 2023†^
| | Principal
Amount | Value |
| Long-Term Bonds 40.4% |
| Asset-Backed Securities 3.1% |
| Automobile Asset-Backed Securities 1.7% |
| American Credit Acceptance Receivables Trust (a) | | |
| Series 2021-2, Class D | | |
| 1.34%, due 7/13/27 | $ 400,000 | $ 389,526 |
| Series 2021-3, Class D | | |
| 1.34%, due 11/15/27 | 940,000 | 909,065 |
| Series 2021-2, Class E | | |
| 2.54%, due 7/13/27 | 900,000 | 866,607 |
| Avis Budget Rental Car Funding AESOP LLC | | |
| Series 2021-1A, Class A | | |
| 1.38%, due 8/20/27 (a) | 570,000 | 518,405 |
| CPS Auto Receivables Trust | | |
| Series 2021-C, Class E | | |
| 3.21%, due 9/15/28 (a) | 260,000 | 244,358 |
| Drive Auto Receivables Trust | | |
| Series 2021-2, Class D | | |
| 1.39%, due 3/15/29 | 800,000 | 759,246 |
| Exeter Automobile Receivables Trust | | |
| Series 2021-3A, Class E | | |
| 3.04%, due 12/15/28 (a) | 855,000 | 778,705 |
| Flagship Credit Auto Trust (a) | | |
| Series 2021-1, Class D | | |
| 1.27%, due 3/15/27 | 575,000 | 534,671 |
| Series 2020-3, Class D | | |
| 2.50%, due 9/15/26 | 280,000 | 266,794 |
| Series 2022-2, Class D | | |
| 5.80%, due 4/17/28 | 655,000 | 607,839 |
| GLS Auto Receivables Issuer Trust (a) | | |
| Series 2021-2A, Class E | | |
| 2.87%, due 5/15/28 | 795,000 | 741,270 |
| Series 2019-4A, Class D | | |
| 4.09%, due 8/17/26 | 535,000 | 528,500 |
| Hertz Vehicle Financing III LP | | |
| Series 2021-2A, Class D | | |
| 4.34%, due 12/27/27 (a) | 1,295,000 | 1,157,498 |
| Hertz Vehicle Financing LLC | | |
| Series 2021-1A, Class B | | |
| 1.56%, due 12/26/25 (a) | 520,000 | 500,901 |
| | | 8,803,385 |
| Home Equity Asset-Backed Securities 0.0% ‡ |
| J.P. Morgan Mortgage Acquisition Trust | | |
| Series 2007-HE1, Class AF1 | | |
| 4.414% (1 Month SOFR + 0.214%), due 3/25/47 (b) | 115,637 | 69,872 |
| | Principal
Amount | Value |
| |
| Home Equity Asset-Backed Securities (continued) ‡ |
| Mastr Asset-Backed Securities Trust | | |
| Series 2006-HE4, Class A1 | | |
| 5.57% (1 Month SOFR + 0.214%), due 11/25/36 (b) | $ 184,490 | $ 57,700 |
| | | 127,572 |
| Other Asset-Backed Securities 1.4% |
| American Airlines Pass-Through Trust | | |
| Series 2016-2, Class A | | |
| 3.65%, due 6/15/28 | 509,247 | 454,838 |
| Series 2019-1, Class B | | |
| 3.85%, due 2/15/28 | 372,644 | 332,971 |
| British Airways Pass-Through Trust | | |
| Series 2021-1, Class A | | |
| 2.90%, due 3/15/35 (United Kingdom) (a) | 776,880 | 663,921 |
| CF Hippolyta Issuer LLC (a) | | |
| Series 2021-1A, Class A1 | | |
| 1.53%, due 3/15/61 | 612,591 | 547,543 |
| Series 2020-1, Class A1 | | |
| 1.69%, due 7/15/60 | 499,196 | 461,341 |
| Series 2020-1, Class A2 | | |
| 1.99%, due 7/15/60 | 481,437 | 410,234 |
| CVS Pass-Through Trust | | |
| 5.789%, due 1/10/26 (a) | 10,998 | 11,002 |
| DB Master Finance LLC | | |
| Series 2021-1A, Class A23 | | |
| 2.791%, due 11/20/51 (a) | 739,900 | 610,499 |
| Home Partners of America Trust (a) | | |
| Series 2021-2, Class A | | |
| 1.901%, due 12/17/26 | 270,800 | 244,742 |
| Series 2021-2, Class B | | |
| 2.302%, due 12/17/26 | 250,182 | 226,388 |
| Navient Private Education Refi Loan Trust (a) | | |
| Series 2021-BA, Class A | | |
| 0.94%, due 7/15/69 | 383,475 | 333,487 |
| Series 2020-EA, Class A | | |
| 1.69%, due 5/15/69 | 279,957 | 253,521 |
| New Economy Assets Phase 1 Sponsor LLC (a) | | |
| Series 2021-1, Class A1 | | |
| 1.91%, due 10/20/61 | 665,000 | 581,934 |
| Series 2021-1, Class B1 | | |
| 2.41%, due 10/20/61 | 755,000 | 612,098 |
| Taco Bell Funding LLC | | |
| Series 2021-1A, Class A23 | | |
| 2.542%, due 8/25/51 (a) | 648,450 | 524,955 |
The notes to the financial statements are an integral part of, and should be read in conjunction with, the financial statements.
| 12 | MainStay VP Income Builder Portfolio |
| | Principal
Amount | Value |
| Asset-Backed Securities (continued) |
| Other Asset-Backed Securities (continued) |
| U.S. Airways Pass-Through Trust | | |
| Series 2012-1, Class A | | |
| 5.90%, due 10/1/24 | $ 367,052 | $ 367,077 |
| United Airlines Pass-Through Trust | | |
| Series 2020-1, Class A | | |
| 5.875%, due 10/15/27 | 549,936 | 556,771 |
| | | 7,193,322 |
Total Asset-Backed Securities
(Cost $17,308,822) | | 16,124,279 |
| Corporate Bonds 15.1% |
| Agriculture 0.1% |
| BAT Capital Corp. | | |
| 3.734%, due 9/25/40 (United Kingdom) | 605,000 | 444,739 |
| Airlines 0.5% |
| American Airlines, Inc. (a) | | |
| 5.50%, due 4/20/26 | 500,000 | 496,393 |
| 5.75%, due 4/20/29 | 360,000 | 350,914 |
| Delta Air Lines, Inc. (a) | | |
| 4.50%, due 10/20/25 | 311,003 | 306,277 |
| 4.75%, due 10/20/28 | 900,000 | 885,140 |
| Mileage Plus Holdings LLC | | |
| 6.50%, due 6/20/27 (a) | 556,500 | 558,081 |
| | | 2,596,805 |
| Apparel 0.1% |
| Tapestry, Inc. | | |
| 7.85%, due 11/27/33 | 345,000 | 368,074 |
| Auto Manufacturers 1.0% |
| Ford Motor Credit Co. LLC | | |
| 2.30%, due 2/10/25 | 230,000 | 221,184 |
| 2.70%, due 8/10/26 | 595,000 | 551,082 |
| 4.125%, due 8/17/27 | 485,000 | 459,142 |
| 6.80%, due 5/12/28 | 365,000 | 381,224 |
| General Motors Financial Co., Inc. | | |
| 2.35%, due 1/8/31 | 344,000 | 284,374 |
| 2.70%, due 6/10/31 | 850,000 | 712,689 |
| 4.30%, due 4/6/29 | 470,000 | 452,739 |
| Nissan Motor Acceptance Co. LLC (a) | | |
| 1.125%, due 9/16/24 | 810,000 | 781,263 |
| 1.85%, due 9/16/26 | 1,350,000 | 1,213,803 |
| | | 5,057,500 |
| | Principal
Amount | Value |
| |
| Banks 5.4% |
| Banco Santander SA | | |
| 5.294%, due 8/18/27 (Spain) | $ 600,000 | $ 601,808 |
| Bank of America Corp. (c) | | |
| 2.087%, due 6/14/29 | 345,000 | 304,055 |
| 2.496%, due 2/13/31 | 650,000 | 558,166 |
| 2.572%, due 10/20/32 | 510,000 | 422,827 |
| 2.687%, due 4/22/32 | 465,000 | 392,660 |
| 3.384%, due 4/2/26 | 465,000 | 452,240 |
| Series MM | | |
| 4.30%, due 1/28/25 (d) | 631,000 | 594,807 |
| Barclays plc (United Kingdom) (b)(d) | | |
| 4.375% (5 Year Treasury Constant Maturity Rate + 3.41%), due 3/15/28 | 835,000 | 649,134 |
| 8.00% (5 Year Treasury Constant Maturity Rate + 5.431%), due 3/15/29 | 680,000 | 667,360 |
| BNP Paribas SA (France) (a) | | |
| 3.052%, due 1/13/31 (c) | 565,000 | 496,340 |
| 4.625% (5 Year Treasury Constant Maturity Rate + 3.196%), due 1/12/27 (b)(d) | 625,000 | 546,116 |
| 4.625% (5 Year Treasury Constant Maturity Rate + 3.34%), due 2/25/31 (b)(d) | 885,000 | 712,847 |
| 7.75% (5 Year Treasury Constant Maturity Rate + 4.899%), due 8/16/29 (b)(d) | 230,000 | 234,777 |
| BPCE SA (France) (a) | | |
| 2.045%, due 10/19/27 (c)(e) | 530,000 | 481,008 |
| 5.125%, due 1/18/28 | 185,000 | 184,561 |
| 6.714%, due 10/19/29 (c) | 250,000 | 263,226 |
| Citigroup, Inc. | | |
| 3.668%, due 7/24/28 (c) | 430,000 | 409,803 |
| 3.98%, due 3/20/30 (c) | 565,000 | 536,142 |
| Series Y | | |
| 4.15% (5 Year Treasury Constant Maturity Rate + 3.00%), due 11/15/26 (b)(d) | 740,000 | 635,095 |
| 6.625%, due 6/15/32 | 190,000 | 206,770 |
| Citizens Bank NA | | |
| 6.064%, due 10/24/25 (c) | 475,000 | 463,395 |
| Citizens Financial Group, Inc. | | |
| 2.638%, due 9/30/32 | 540,000 | 416,917 |
| Credit Agricole SA | | |
| 4.75% (5 Year Treasury Constant Maturity Rate + 3.237%), due 3/23/29 (France) (a)(b)(d) | 1,000,000 | 848,299 |
The notes to the financial statements are an integral part of, and should be read in conjunction with, the financial statements.
13
Portfolio of Investments December 31, 2023†^ (continued)
| | Principal
Amount | Value |
| Corporate Bonds (continued) |
| Banks (continued) |
| Deutsche Bank AG (Germany) | | |
| 3.035%, due 5/28/32 (c) | $ 255,000 | $ 213,023 |
| 6.654% (SOFR + 1.219%), due 11/16/27 (b) | 820,000 | 794,295 |
| First Horizon Bank | | |
| 5.75%, due 5/1/30 | 815,000 | 768,401 |
| First Horizon Corp. | | |
| 4.00%, due 5/26/25 | 775,000 | 749,527 |
| Freedom Mortgage Corp. | | |
| 7.625%, due 5/1/26 (a) | 355,000 | 350,367 |
| Goldman Sachs Group, Inc. (The) | | |
| 1.431%, due 3/9/27 (c)(e) | 535,000 | 493,317 |
| 1.948%, due 10/21/27 (c) | 610,000 | 558,041 |
| 1.992%, due 1/27/32 (c) | 480,000 | 387,835 |
| 6.75%, due 10/1/37 | 159,000 | 175,017 |
| HSBC Holdings plc | | |
| 3.973%, due 5/22/30 (United Kingdom) (c) | 600,000 | 560,395 |
| Intesa Sanpaolo SpA | | |
| 7.00%, due 11/21/25 (Italy) (a) | 200,000 | 204,880 |
| JPMorgan Chase & Co. | | |
| 2.182%, due 6/1/28 (c) | 835,000 | 763,738 |
| Lloyds Banking Group plc (United Kingdom) | | |
| 4.582%, due 12/10/25 | 508,000 | 497,151 |
| 4.65%, due 3/24/26 (e) | 1,075,000 | 1,054,040 |
| 4.976% (1 Year Treasury Constant Maturity Rate + 2.30%), due 8/11/33 (b) | 365,000 | 355,477 |
| Macquarie Group Ltd. | | |
| 2.871%, due 1/14/33 (Australia) (a)(c) | 820,000 | 674,077 |
| Mizuho Financial Group, Inc. | | |
| 3.261% (1 Year Treasury Constant Maturity Rate + 1.25%), due 5/22/30 (Japan) (b) | 345,000 | 314,334 |
| Morgan Stanley (c) | | |
| 2.484%, due 9/16/36 | 885,000 | 701,440 |
| 2.511%, due 10/20/32 | 645,000 | 534,085 |
| NatWest Group plc | | |
| 3.073% (1 Year Treasury Constant Maturity Rate + 2.55%), due 5/22/28 (United Kingdom) (b) | 1,580,000 | 1,467,272 |
| Santander Holdings USA, Inc. | | |
| 6.499%, due 3/9/29 (c) | 340,000 | 351,245 |
| | Principal
Amount | Value |
| |
| Banks (continued) |
| Societe Generale SA (France) (a)(b)(d) | | |
| 4.75% (5 Year Treasury Constant Maturity Rate + 3.931%), due 5/26/26 | $ 395,000 | $ 346,493 |
| 5.375% (5 Year Treasury Constant Maturity Rate + 4.514%), due 11/18/30 | 1,040,000 | 850,858 |
| 10.00% (5 Year Treasury Constant Maturity Rate + 5.448%), due 11/14/28 | 395,000 | 422,063 |
| Standard Chartered plc | | |
| 1.822% (1 Year Treasury Constant Maturity Rate + 0.95%), due 11/23/25 (United Kingdom) (a)(b) | 1,060,000 | 1,020,773 |
| UBS Group AG (Switzerland) (a) | | |
| 3.091%, due 5/14/32 (c) | 500,000 | 425,833 |
| 4.375% (5 Year Treasury Constant Maturity Rate + 3.313%), due 2/10/31 (b)(d) | 1,005,000 | 793,728 |
| 4.751% (1 Year Treasury Constant Maturity Rate + 1.75%), due 5/12/28 (b) | 160,000 | 157,566 |
| 6.442%, due 8/11/28 (c) | 245,000 | 254,432 |
| Wells Fargo & Co. (c) | | |
| 3.35%, due 3/2/33 | 390,000 | 340,632 |
| 5.557%, due 7/25/34 | 190,000 | 193,441 |
| Westpac Banking Corp. | | |
| 3.02% (5 Year Treasury Constant Maturity Rate + 1.53%), due 11/18/36 (Australia) (b) | 533,000 | 433,272 |
| | | 28,285,401 |
| Beverages 0.1% |
| Anheuser-Busch Cos. LLC | | |
| 4.70%, due 2/1/36 (Belgium) | 475,000 | 473,450 |
| Biotechnology 0.0% ‡ |
| Amgen, Inc. | | |
| 5.75%, due 3/2/63 | 250,000 | 262,286 |
| Chemicals 0.2% |
| Braskem Netherlands Finance BV | | |
| 4.50%, due 1/10/28 (Brazil) (a) | 745,000 | 609,810 |
| Huntsman International LLC | | |
| 4.50%, due 5/1/29 | 731,000 | 704,165 |
| | | 1,313,975 |
The notes to the financial statements are an integral part of, and should be read in conjunction with, the financial statements.
| 14 | MainStay VP Income Builder Portfolio |
| | Principal
Amount | Value |
| Corporate Bonds (continued) |
| Commercial Services 0.1% |
| Ashtead Capital, Inc. | | |
| 4.00%, due 5/1/28 (United Kingdom) (a) | $ 380,000 | $ 357,541 |
| California Institute of Technology | | |
| 3.65%, due 9/1/2119 | 385,000 | 274,180 |
| | | 631,721 |
| Computers 0.3% |
| Dell International LLC | | |
| 3.375%, due 12/15/41 | 885,000 | 667,308 |
| 5.30%, due 10/1/29 | 318,000 | 327,477 |
| 8.10%, due 7/15/36 | 527,000 | 648,157 |
| | | 1,642,942 |
| Diversified Financial Services 1.6% |
| AerCap Ireland Capital DAC | | |
| 2.45%, due 10/29/26 (Ireland) | 665,000 | 615,738 |
| Air Lease Corp. | | |
| 2.30%, due 2/1/25 | 820,000 | 791,107 |
| 4.25%, due 9/15/24 | 420,000 | 415,274 |
| Aircastle Ltd. | | |
| 5.25% (5 Year Treasury Constant Maturity Rate + 4.41%), due 6/15/26 (a)(b)(d) | 565,000 | 484,381 |
| Ally Financial, Inc. | | |
| 3.875%, due 5/21/24 | 310,000 | 307,320 |
| 6.992%, due 6/13/29 (c) | 265,000 | 273,681 |
| 8.00%, due 11/1/31 | 640,000 | 701,120 |
| American Express Co. | | |
| 5.625%, due 7/28/34 (c) | 275,000 | 284,162 |
| Aviation Capital Group LLC | | |
| 1.95%, due 1/30/26 (a) | 520,000 | 481,957 |
| Avolon Holdings Funding Ltd. (Ireland) (a) | | |
| 2.125%, due 2/21/26 | 645,000 | 597,670 |
| 2.875%, due 2/15/25 | 1,040,000 | 1,003,116 |
| Banco BTG Pactual SA | | |
| 2.75%, due 1/11/26 (Brazil) (a) | 505,000 | 475,937 |
| Capital One Financial Corp. | | |
| 6.312%, due 6/8/29 (c) | 515,000 | 528,344 |
| Nomura Holdings, Inc. | | |
| 5.099%, due 7/3/25 (Japan) | 770,000 | 764,777 |
| OneMain Finance Corp. | | |
| 3.50%, due 1/15/27 | 375,000 | 347,041 |
| | | 8,071,625 |
| | Principal
Amount | Value |
| |
| Electric 1.5% |
| AEP Texas, Inc. | | |
| 4.70%, due 5/15/32 | $ 475,000 | $ 463,872 |
| Alabama Power Co. | | |
| 3.00%, due 3/15/52 | 335,000 | 234,117 |
| Arizona Public Service Co. | | |
| 2.20%, due 12/15/31 | 750,000 | 609,321 |
| Calpine Corp. | | |
| 5.125%, due 3/15/28 (a)(e) | 290,000 | 278,046 |
| Duke Energy Ohio, Inc. | | |
| 4.30%, due 2/1/49 | 565,000 | 480,855 |
| Duke Energy Progress LLC | | |
| 5.35%, due 3/15/53 | 250,000 | 253,246 |
| Duquesne Light Holdings, Inc. | | |
| 3.616%, due 8/1/27 (a) | 865,000 | 808,105 |
| Entergy Louisiana LLC | | |
| 4.00%, due 3/15/33 | 790,000 | 735,982 |
| Jersey Central Power & Light Co. | | |
| 2.75%, due 3/1/32 (a) | 700,000 | 590,787 |
| National Rural Utilities Cooperative Finance Corp. | | |
| 5.80%, due 1/15/33 | 460,000 | 487,134 |
| Nevada Power Co. | | |
| Series GG | | |
| 5.90%, due 5/1/53 | 230,000 | 245,951 |
| Ohio Power Co. | | |
| Series R | | |
| 2.90%, due 10/1/51 | 420,000 | 284,425 |
| Public Service Co. of Oklahoma | | |
| 5.25%, due 1/15/33 | 200,000 | 201,389 |
| Sempra | | |
| 5.50%, due 8/1/33 (e) | 535,000 | 554,505 |
| Southern California Edison Co. | | |
| 4.00%, due 4/1/47 | 520,000 | 423,880 |
| 5.70%, due 3/1/53 | 370,000 | 389,438 |
| Virginia Electric and Power Co. | | |
| 2.95%, due 11/15/51 | 435,000 | 295,863 |
| 5.45%, due 4/1/53 | 225,000 | 231,665 |
| WEC Energy Group, Inc. | | |
| 7.754% (3 Month SOFR + 2.374%), due 5/15/67 (b) | 480,000 | 429,362 |
| | | 7,997,943 |
| Entertainment 0.1% |
| Warnermedia Holdings, Inc. | | |
| 4.279%, due 3/15/32 | 565,000 | 517,090 |
The notes to the financial statements are an integral part of, and should be read in conjunction with, the financial statements.
15
Portfolio of Investments December 31, 2023†^ (continued)
| | Principal
Amount | Value |
| Corporate Bonds (continued) |
| Food 0.3% |
| J M Smucker Co. (The) | | |
| 6.50%, due 11/15/53 | $ 185,000 | $ 213,349 |
| JBS USA LUX SA | | |
| 5.75%, due 4/1/33 | 810,000 | 802,375 |
| Smithfield Foods, Inc. | | |
| 4.25%, due 2/1/27 (a) | 500,000 | 478,748 |
| | | 1,494,472 |
| Gas 0.3% |
| Brooklyn Union Gas Co. (The) | | |
| 6.388%, due 9/15/33 (a) | 425,000 | 443,667 |
| National Fuel Gas Co. | | |
| 2.95%, due 3/1/31 | 450,000 | 376,691 |
| Southern California Gas Co. | | |
| Series VV | | |
| 4.30%, due 1/15/49 | 325,000 | 275,562 |
| Southern Co. Gas Capital Corp. | | |
| Series 21A | | |
| 3.15%, due 9/30/51 | 830,000 | 557,770 |
| | | 1,653,690 |
| Insurance 0.5% |
| Peachtree Corners Funding Trust | | |
| 3.976%, due 2/15/25 (a) | 425,000 | 417,929 |
| Protective Life Corp. | | |
| 8.45%, due 10/15/39 | 725,000 | 909,795 |
| Reliance Standard Life Global Funding II | | |
| 2.50%, due 10/30/24 (a) | 950,000 | 924,610 |
| Willis North America, Inc. | | |
| 3.875%, due 9/15/49 | 185,000 | 142,958 |
| | | 2,395,292 |
| Lodging 0.2% |
| Las Vegas Sands Corp. | | |
| 3.20%, due 8/8/24 | 555,000 | 544,226 |
| Sands China Ltd. | | |
| 5.375%, due 8/8/25 (Macao) (f) | 460,000 | 453,635 |
| | | 997,861 |
| Media 0.1% |
| DISH DBS Corp. | | |
| 5.75%, due 12/1/28 (a) | 495,000 | 394,812 |
| Miscellaneous—Manufacturing 0.2% |
| Textron Financial Corp. | | |
| 7.376% (3 Month SOFR + 1.997%), due 2/15/42 (a)(b) | 1,045,000 | 821,407 |
| | Principal
Amount | Value |
| |
| Oil & Gas 0.0% ‡ |
| Gazprom PJSC Via Gaz Capital SA | | |
| 7.288%, due 8/16/37 (Russia) (a)(g) | $ 325,000 | $ 251,875 |
| Packaging & Containers 0.1% |
| Berry Global, Inc. | | |
| 4.875%, due 7/15/26 (a) | 84,000 | 82,547 |
| Owens-Brockway Glass Container, Inc. | | |
| 6.625%, due 5/13/27 (a) | 320,000 | 320,040 |
| | | 402,587 |
| Pharmaceuticals 0.2% |
| Teva Pharmaceutical Finance Netherlands III BV (Israel) | | |
| 3.15%, due 10/1/26 | 360,000 | 333,324 |
| 4.75%, due 5/9/27 | 545,000 | 521,837 |
| | | 855,161 |
| Pipelines 1.1% |
| Cheniere Corpus Christi Holdings LLC | | |
| 2.742%, due 12/31/39 | 670,000 | 533,781 |
| Columbia Pipelines Operating Co. LLC | | |
| 6.544%, due 11/15/53 (a) | 360,000 | 396,363 |
| DT Midstream, Inc. | | |
| 4.30%, due 4/15/32 (a) | 500,000 | 448,780 |
| Enbridge, Inc. | | |
| 5.70%, due 3/8/33 (Canada) | 365,000 | 379,380 |
| Energy Transfer LP | | |
| 5.35%, due 5/15/45 | 415,000 | 385,427 |
| EnLink Midstream LLC | | |
| 5.625%, due 1/15/28 (a) | 260,000 | 257,058 |
| Flex Intermediate Holdco LLC | | |
| 3.363%, due 6/30/31 (a) | 865,000 | 708,027 |
| MPLX LP | | |
| 2.65%, due 8/15/30 | 730,000 | 629,933 |
| Targa Resources Corp. | | |
| 4.20%, due 2/1/33 | 335,000 | 308,010 |
| Transcontinental Gas Pipe Line Co. LLC | | |
| 4.60%, due 3/15/48 | 840,000 | 756,357 |
| Venture Global LNG, Inc. | | |
| 9.875%, due 2/1/32 (a) | 315,000 | 328,116 |
| Western Midstream Operating LP | | |
| 5.25%, due 2/1/50 (f) | 630,000 | 564,833 |
| | | 5,696,065 |
| Real Estate Investment Trusts 0.6% |
| American Tower Corp. | | |
| 3.60%, due 1/15/28 | 375,000 | 357,184 |
| Digital Realty Trust LP | | |
| 3.70%, due 8/15/27 | 660,000 | 636,468 |
The notes to the financial statements are an integral part of, and should be read in conjunction with, the financial statements.
| 16 | MainStay VP Income Builder Portfolio |
| | Principal
Amount | Value |
| Corporate Bonds (continued) |
| Real Estate Investment Trusts (continued) |
| GLP Capital LP | | |
| 3.35%, due 9/1/24 | $ 505,000 | $ 498,367 |
| Invitation Homes Operating Partnership LP | | |
| 2.00%, due 8/15/31 | 680,000 | 541,118 |
| Starwood Property Trust, Inc. (a) | | |
| 3.75%, due 12/31/24 | 710,000 | 696,638 |
| 4.375%, due 1/15/27 | 415,000 | 391,108 |
| | | 3,120,883 |
| Retail 0.1% |
| AutoNation, Inc. | | |
| 4.75%, due 6/1/30 | 373,000 | 360,259 |
| Nordstrom, Inc. | | |
| 4.25%, due 8/1/31 (e) | 465,000 | 386,871 |
| | | 747,130 |
| Telecommunications 0.3% |
| Altice France SA | | |
| 5.125%, due 7/15/29 (France) (a) | 865,000 | 672,987 |
| AT&T, Inc. | | |
| 3.50%, due 9/15/53 | 680,000 | 493,481 |
| T-Mobile USA, Inc. | | |
| 2.625%, due 2/15/29 | 300,000 | 270,082 |
| | | 1,436,550 |
| Trucking & Leasing 0.1% |
| Penske Truck Leasing Co. LP | | |
| 6.05%, due 8/1/28 (a) | 410,000 | 424,960 |
Total Corporate Bonds
(Cost $86,025,120) | | 78,356,296 |
| Foreign Government Bonds 0.3% |
| Chile 0.2% |
| Empresa Nacional del Petroleo | | |
| 3.45%, due 9/16/31 (a) | 980,000 | 823,653 |
| Colombia 0.1% |
| Colombia Government Bond | | |
| 3.25%, due 4/22/32 | 725,000 | 575,417 |
| 4.50%, due 1/28/26 | 235,000 | 230,972 |
| | | 806,389 |
Total Foreign Government Bonds
(Cost $1,932,830) | | 1,630,042 |
| | Principal
Amount | Value |
| Loan Assignments 0.1% |
| Diversified/Conglomerate Service 0.1% |
| TruGreen LP (b) | | |
| First Lien Second Refinancing Term Loan | | |
| 9.456% (1 Month SOFR + 4.00%), due 11/2/27 | $ 312,119 | $ 301,195 |
| Second Lien Initial Term Loan | | |
| 14.145% (3 Month SOFR + 8.50%), due 11/2/28 | 250,000 | 185,000 |
| | | 486,195 |
Total Loan Assignments
(Cost $556,761) | | 486,195 |
| Mortgage-Backed Securities 15.9% |
| Agency (Collateralized Mortgage Obligations) 8.1% |
| FHLMC | | |
| REMIC, Series 5326, Class QO | | |
| (zero coupon), due 9/25/50 | 802,221 | 569,552 |
| REMIC, Series 5021, Class SA | | |
| (zero coupon) (SOFR 30A + 3.55%), due 10/25/50 (b)(h) | 1,236,273 | 38,094 |
| REMIC, Series 5187, Class SA | | |
| (zero coupon) (SOFR 30A + 1.80%), due 1/25/52 (b)(h) | 936,048 | 2,164 |
| REMIC, Series 5200, Class SA | | |
| (zero coupon) (SOFR 30A + 3.50%), due 2/25/52 (b)(h) | 179,963 | 5,703 |
| REMIC, Series 5326 | | |
| (zero coupon), due 8/25/53 | 252,376 | 202,545 |
| REMIC, Series 5351, Class DO | | |
| (zero coupon), due 9/25/53 | 480,600 | 379,082 |
| REMIC, Series 5351, Class EO | | |
| (zero coupon), due 10/25/53 | 934,856 | 735,591 |
| REMIC, Series 5315, Class OQ | | |
| (zero coupon), due 1/25/55 | 393,812 | 318,753 |
| REMIC, Series 5328, Class JY | | |
| 0.25%, due 9/25/50 | 750,427 | 501,070 |
| REMIC, Series 4993, Class KS | | |
| 0.598% (SOFR 30A + 5.936%), due 7/25/50 (b)(h) | 1,519,729 | 232,640 |
| REMIC, Series 4994, Class TS | | |
| 0.648% (SOFR 30A + 5.986%), due 7/25/50 (b)(h) | 818,610 | 117,352 |
| REMIC, Series 4831, Class SA | | |
| 0.747% (SOFR 30A + 6.086%), due 10/15/48 (b)(h) | 692,136 | 90,735 |
The notes to the financial statements are an integral part of, and should be read in conjunction with, the financial statements.
17
Portfolio of Investments December 31, 2023†^ (continued)
| | Principal
Amount | Value |
| Mortgage-Backed Securities (continued) |
| Agency (Collateralized Mortgage Obligations) (continued) |
| FHLMC (continued) | | |
| REMIC, Series 5092, Class XA | | |
| 1.00%, due 1/15/41 | $ 570,315 | $ 477,832 |
| REMIC, Series 4988, Class BA | | |
| 1.50%, due 6/25/50 | 201,332 | 144,769 |
| REMIC, Series 4120, Class ZA | | |
| 3.00%, due 10/15/42 | 405,233 | 363,260 |
| REMIC, Series 5204, Class KA | | |
| 3.00%, due 5/25/49 | 929,379 | 856,277 |
| REMIC, Series 5070, Class PI | | |
| 3.00%, due 8/25/50 (h) | 844,866 | 147,405 |
| REMIC, Series 5011, Class MI | | |
| 3.00%, due 9/25/50 (h) | 807,564 | 126,049 |
| REMIC, Series 5023, Class LI | | |
| 3.00%, due 10/25/50 (h) | 570,720 | 91,174 |
| REMIC, Series 5094, Class IP | | |
| 3.00%, due 4/25/51 (h) | 623,933 | 96,749 |
| REMIC, Series 5160 | | |
| 3.00%, due 10/25/51 (h) | 670,990 | 76,781 |
| REMIC, Series 4710, Class WZ | | |
| 3.50%, due 8/15/47 | 505,340 | 457,370 |
| REMIC, Series 4725, Class WZ | | |
| 3.50%, due 11/15/47 | 899,367 | 812,246 |
| REMIC, Series 5040 | | |
| 3.50%, due 11/25/50 (h) | 481,836 | 75,271 |
| REMIC, Series 5304, Class UB | | |
| 4.00%, due 2/25/52 | 648,150 | 608,035 |
| REMIC, Series 5268, Class B | | |
| 4.50%, due 10/25/52 | 801,651 | 776,248 |
| FHLMC, Strips | | |
| REMIC, Series 272 | | |
| (zero coupon), due 8/15/42 | 537,009 | 414,483 |
| REMIC, Series 311 | | |
| (zero coupon), due 8/15/43 | 283,327 | 217,152 |
| REMIC, Series 402 | | |
| (zero coupon), due 9/25/53 | 577,313 | 470,683 |
| REMIC, Series 311, Class S1 | | |
| 0.497% (SOFR 30A + 5.836%), due 8/15/43 (b)(h) | 789,095 | 93,892 |
| REMIC, Series 389, Class C35 | | |
| 2.00%, due 6/15/52 (h) | 1,324,899 | 162,878 |
| FNMA | | |
| REMIC, Series 2022-5, Class SN | | |
| (zero coupon) (SOFR 30A + 1.80%), due 2/25/52 (b)(h) | 552,929 | 2,945 |
| | Principal
Amount | Value |
| |
| Agency (Collateralized Mortgage Obligations) (continued) |
| FNMA (continued) | | |
| REMIC, Series 2022-3, Class YS | | |
| (zero coupon) (SOFR 30A + 2.55%), due 2/25/52 (b)(h) | $ 3,873,005 | $ 39,430 |
| REMIC, Series 2023-24, Class OQ | | |
| (zero coupon), due 7/25/54 | 515,427 | 420,466 |
| REMIC, Series 2022-10, Class SA | | |
| 0.413% (SOFR 30A + 5.75%), due 2/25/52 (b)(h) | 852,779 | 124,182 |
| REMIC, Series 2021-40, Class SI | | |
| 0.498% (SOFR 30A + 5.836%), due 9/25/47 (b)(h) | 961,735 | 107,981 |
| REMIC, Series 2016-57, Class SN | | |
| 0.598% (SOFR 30A + 5.936%), due 6/25/46 (b)(h) | 793,042 | 92,263 |
| REMIC, Series 2020-70, Class SD | | |
| 0.798% (SOFR 30A + 6.136%), due 10/25/50 (b)(h) | 1,078,810 | 156,417 |
| REMIC, Series 2020-47, Class BD | | |
| 1.50%, due 7/25/50 | 172,568 | 123,311 |
| REMIC, Series 2020-70, Class AD | | |
| 1.50%, due 10/25/50 | 1,035,222 | 821,307 |
| REMIC, Series 2021-3, Class TI | | |
| 2.50%, due 2/25/51 (h) | 1,229,039 | 197,536 |
| REMIC, Series 2021-12, Class JI | | |
| 2.50%, due 3/25/51 (h) | 550,124 | 87,021 |
| REMIC, Series 2021-10, Class LI | | |
| 2.50%, due 3/25/51 (h) | 375,043 | 53,073 |
| REMIC, Series 2021-34, Class MI | | |
| 2.50%, due 3/25/51 (h) | 1,598,862 | 178,922 |
| REMIC, Series 2021-54, Class HI | | |
| 2.50%, due 6/25/51 (h) | 257,950 | 34,178 |
| REMIC, Series 2013-77, Class CY | | |
| 3.00%, due 7/25/43 | 494,872 | 431,571 |
| REMIC, Series 2021-53, Class GI | | |
| 3.00%, due 7/25/48 (h) | 2,068,843 | 304,867 |
| REMIC, Series 2019-13, Class PE | | |
| 3.00%, due 3/25/49 | 274,915 | 247,836 |
| REMIC, Series 2021-85, Class BI | | |
| 3.00%, due 12/25/51 (h) | 1,436,183 | 233,049 |
| REMIC, Series 2021-12, Class GC | | |
| 3.50%, due 7/25/50 | 642,231 | 586,514 |
| REMIC, Series 2021-8, Class ID | | |
| 3.50%, due 3/25/51 (h) | 977,291 | 192,527 |
| REMIC, Series 2020-10, Class DA | | |
| 3.50%, due 3/25/60 | 561,891 | 496,368 |
The notes to the financial statements are an integral part of, and should be read in conjunction with, the financial statements.
| 18 | MainStay VP Income Builder Portfolio |
| | Principal
Amount | Value |
| Mortgage-Backed Securities (continued) |
| Agency (Collateralized Mortgage Obligations) (continued) |
| FNMA, Strips (h) | | |
| REMIC, Series 426, Class C32 | | |
| 1.50%, due 2/25/52 | $ 2,266,704 | $ 213,003 |
| REMIC, Series 427, Class C77 | | |
| 2.50%, due 9/25/51 | 1,531,878 | 219,848 |
| REMIC, Series 429, Class C5 | | |
| 3.00%, due 10/25/52 | 2,124,074 | 366,695 |
| GNMA | | |
| REMIC, Series 2019-136, Class YS | | |
| (zero coupon) (1 Month SOFR + 2.716%), due 11/20/49 (b)(h) | 422,420 | 6,279 |
| REMIC, Series 2020-1, Class YS | | |
| (zero coupon) (1 Month SOFR + 2.716%), due 1/20/50 (b)(h) | 1,404,649 | 21,333 |
| REMIC, Series 2023-101, Class KO | | |
| (zero coupon), due 1/20/51 | 1,149,675 | 785,334 |
| REMIC, Series 2021-77, Class SN | | |
| (zero coupon) (1 Month SOFR + 2.486%), due 5/20/51 (b)(h) | 3,015,407 | 43,943 |
| REMIC, Series 2021-97, Class SA | | |
| (zero coupon) (SOFR 30A + 2.60%), due 6/20/51 (b)(h) | 2,639,175 | 35,686 |
| REMIC, Series 2021-136, Class SB | | |
| (zero coupon) (SOFR 30A + 3.20%), due 8/20/51 (b)(h) | 7,427,902 | 149,962 |
| REMIC, Series 2021-158, Class SB | | |
| (zero coupon) (SOFR 30A + 3.70%), due 9/20/51 (b)(h) | 1,498,843 | 56,040 |
| REMIC, Series 2021-205, Class DS | | |
| (zero coupon) (SOFR 30A + 3.20%), due 11/20/51 (b)(h) | 3,135,879 | 54,365 |
| REMIC, Series 2022-19, Class SG | | |
| (zero coupon) (SOFR 30A + 2.45%), due 1/20/52 (b)(h) | 2,431,907 | 23,760 |
| REMIC, Series 2022-24, Class SC | | |
| (zero coupon) (SOFR 30A + 2.37%), due 2/20/52 (b)(h) | 12,362,484 | 99,905 |
| REMIC, Series 2023-66, Class OQ | | |
| (zero coupon), due 7/20/52 | 697,973 | 540,756 |
| REMIC, Series 2023-53 | | |
| (zero coupon), due 4/20/53 | 323,750 | 237,334 |
| REMIC, Series 2023-80, Class SA | | |
| (zero coupon) (SOFR 30A + 5.25%), due 6/20/53 (b)(h) | 2,979,847 | 133,092 |
| REMIC, Series 2023-114, Class MO | | |
| (zero coupon), due 8/20/53 | 419,678 | 340,755 |
| | Principal
Amount | Value |
| |
| Agency (Collateralized Mortgage Obligations) (continued) |
| GNMA (continued) | | |
| REMIC, Series 2023-60, Class ES | | |
| 0.525% (SOFR 30A + 11.20%), due 4/20/53 (b) | $ 757,188 | $ 690,689 |
| REMIC, Series 2019-115, Class SA | | |
| 0.578% (1 Month SOFR + 5.936%), due 9/20/49 (b)(h) | 1,110,582 | 123,432 |
| REMIC, Series 2020-34, Class SC | | |
| 0.578% (1 Month SOFR + 5.936%), due 3/20/50 (b)(h) | 1,032,145 | 134,980 |
| REMIC, Series 2023-47, Class KS | | |
| 0.628% (1 Month SOFR + 5.986%), due 4/20/48 (b)(h) | 2,994,626 | 349,125 |
| REMIC, Series 2020-146, Class SA | | |
| 0.828% (1 Month SOFR + 6.186%), due 10/20/50 (b)(h) | 990,772 | 148,959 |
| REMIC, Series 2020-175, Class CS | | |
| 0.828% (1 Month SOFR + 6.186%), due 11/20/50 (b)(h) | 1,080,063 | 154,842 |
| REMIC, Series 2021-179, Class SA | | |
| 0.828% (1 Month SOFR + 6.186%), due 11/20/50 (b)(h) | 1,439,098 | 200,033 |
| REMIC, Series 2020-167, Class SN | | |
| 0.828% (1 Month SOFR + 6.186%), due 11/20/50 (b)(h) | 485,102 | 68,430 |
| REMIC, Series 2020-189, Class SU | | |
| 0.828% (1 Month SOFR + 6.186%), due 12/20/50 (b)(h) | 641,285 | 93,011 |
| REMIC, Series 2021-46, Class QS | | |
| 0.828% (1 Month SOFR + 6.186%), due 3/20/51 (b)(h) | 584,117 | 80,984 |
| REMIC, Series 2021-57, Class SA | | |
| 0.828% (1 Month SOFR + 6.186%), due 3/20/51 (b)(h) | 1,109,490 | 157,887 |
| REMIC, Series 2021-57, Class SD | | |
| 0.828% (1 Month SOFR + 6.186%), due 3/20/51 (b)(h) | 1,415,201 | 181,348 |
| REMIC, Series 2021-46, Class TS | | |
| 0.828% (1 Month SOFR + 6.186%), due 3/20/51 (b)(h) | 712,258 | 99,588 |
| REMIC, Series 2021-96, Class SN | | |
| 0.828% (1 Month SOFR + 6.186%), due 6/20/51 (b)(h) | 1,247,535 | 160,880 |
| REMIC, Series 2021-122, Class HS | | |
| 0.828% (1 Month SOFR + 6.186%), due 7/20/51 (b)(h) | 1,175,413 | 172,044 |
The notes to the financial statements are an integral part of, and should be read in conjunction with, the financial statements.
19
Portfolio of Investments December 31, 2023†^ (continued)
| | Principal
Amount | Value |
| Mortgage-Backed Securities (continued) |
| Agency (Collateralized Mortgage Obligations) (continued) |
| GNMA (continued) | | |
| REMIC, Series 2022-137, Class S | | |
| 0.828% (1 Month SOFR + 6.186%), due 7/20/51 (b)(h) | $ 1,305,682 | $ 193,077 |
| REMIC, Series 2021-135, Class GS | | |
| 0.828% (1 Month SOFR + 6.186%), due 8/20/51 (b)(h) | 1,966,362 | 261,483 |
| REMIC, Series 2021-96, Class JS | | |
| 0.878% (1 Month SOFR + 6.236%), due 6/20/51 (b)(h) | 1,031,287 | 122,566 |
| REMIC, Series 2020-97, Class HB | | |
| 1.00%, due 7/20/50 | 315,752 | 232,637 |
| REMIC, Series 2020-146, Class YK | | |
| 1.00%, due 10/20/50 | 614,480 | 471,446 |
| REMIC, Series 2020-166, Class CA | | |
| 1.00%, due 11/20/50 | 683,460 | 509,598 |
| REMIC, Series 2023-86, Class SE | | |
| 1.312% (SOFR 30A + 6.65%), due 9/20/50 (b)(h) | 876,890 | 125,912 |
| REMIC, Series 2020-165, Class UD | | |
| 1.50%, due 11/20/50 | 263,970 | 204,764 |
| REMIC, Series 2023-66, Class MP | | |
| 1.625% (SOFR 30A + 12.30%), due 5/20/53 (b) | 722,448 | 707,281 |
| REMIC, Series 2021-41, Class FS | | |
| 2.00% (SOFR 30A + 0.20%), due 10/20/50 (b)(h) | 1,623,322 | 172,913 |
| REMIC, Series 2020-166, Class IC | | |
| 2.00%, due 11/20/50 (h) | 332,877 | 33,723 |
| REMIC, Series 2020-188 | | |
| 2.00%, due 12/20/50 (h) | 1,542,248 | 157,630 |
| REMIC, Series 2020-185, Class BI | | |
| 2.00%, due 12/20/50 (h) | 724,989 | 80,613 |
| REMIC, Series 2021-30, Class HI | | |
| 2.00%, due 2/20/51 (h) | 2,148,428 | 221,583 |
| REMIC, Series 2022-10, Class IC | | |
| 2.00%, due 11/20/51 (h) | 1,050,801 | 125,465 |
| REMIC, Series 2021-97, Class IN | | |
| 2.50%, due 8/20/49 (h) | 2,129,515 | 219,379 |
| REMIC, Series 2019-159, Class P | | |
| 2.50%, due 9/20/49 | 548,979 | 476,747 |
| REMIC, Series 2022-1, Class IA | | |
| 2.50%, due 6/20/50 (h) | 255,702 | 34,068 |
| REMIC, Series 2020-122, Class IW | | |
| 2.50%, due 7/20/50 (h) | 915,705 | 119,830 |
| REMIC, Series 2020-151, Class TI | | |
| 2.50%, due 10/20/50 (h) | 852,917 | 110,754 |
| | Principal
Amount | Value |
| |
| Agency (Collateralized Mortgage Obligations) (continued) |
| GNMA (continued) | | |
| REMIC, Series 2020-173, Class EI | | |
| 2.50%, due 11/20/50 (h) | $ 952,459 | $ 129,110 |
| REMIC, Series 2020-188, Class DI | | |
| 2.50%, due 12/20/50 (h) | 2,089,891 | 285,943 |
| REMIC, Series 2021-1, Class PI | | |
| 2.50%, due 12/20/50 (h) | 623,588 | 79,729 |
| REMIC, Series 2021-83, Class FM | | |
| 2.50% (SOFR 30A + 0.51%), due 5/20/51 (b) | 1,406,606 | 1,160,984 |
| REMIC, Series 2021-140, Class GF | | |
| 2.50% (1 Month SOFR + 0.764%), due 8/20/51 (b) | 518,258 | 427,940 |
| REMIC, Series 2021-188 | | |
| 2.50%, due 10/20/51 (h) | 1,663,426 | 242,687 |
| REMIC, Series 2022-83 | | |
| 2.50%, due 11/20/51 (h) | 1,348,422 | 177,086 |
| REMIC, Series 2021-1, Class IT | | |
| 3.00%, due 1/20/51 (h) | 1,363,439 | 217,756 |
| REMIC, Series 2021-44, Class IQ | | |
| 3.00%, due 3/20/51 (h) | 1,387,667 | 220,293 |
| REMIC, Series 2021-74, Class HI | | |
| 3.00%, due 4/20/51 (h) | 175,573 | 25,155 |
| REMIC, Series 2021-97, Class FA | | |
| 3.00% (SOFR 30A + 0.40%), due 6/20/51 (b) | 387,343 | 334,957 |
| REMIC, Series 2021-98, Class IN | | |
| 3.00%, due 6/20/51 (h) | 627,996 | 108,726 |
| REMIC, Series 2021-98, Class KI | | |
| 3.00%, due 6/20/51 (h) | 1,603,497 | 254,294 |
| REMIC, Series 2022-189, Class AT | | |
| 3.00%, due 7/20/51 | 531,050 | 458,199 |
| REMIC, Series 2022-207 | | |
| 3.00%, due 8/20/51 (h) | 855,529 | 134,802 |
| REMIC, Series 2021-139, Class IA | | |
| 3.00%, due 8/20/51 (h) | 2,066,883 | 319,424 |
| REMIC, Series 2021-158, Class NI | | |
| 3.00%, due 9/20/51 (h) | 1,674,523 | 248,068 |
| REMIC, Series 2021-177, Class IM | | |
| 3.00%, due 10/20/51 (h) | 1,394,780 | 186,330 |
| REMIC, Series 2023-19, Class CI | | |
| 3.00%, due 11/20/51 (h) | 1,298,474 | 198,278 |
| REMIC, Series 2022-207, Class NA | | |
| 3.00%, due 1/20/52 | 2,202,864 | 1,907,061 |
| REMIC, Series 2022-206, Class CN | | |
| 3.00%, due 2/20/52 | 1,585,505 | 1,360,798 |
The notes to the financial statements are an integral part of, and should be read in conjunction with, the financial statements.
| 20 | MainStay VP Income Builder Portfolio |
| | Principal
Amount | Value |
| Mortgage-Backed Securities (continued) |
| Agency (Collateralized Mortgage Obligations) (continued) |
| GNMA (continued) | | |
| REMIC, Series 2019-92, Class GF | | |
| 3.50% (1 Month SOFR + 0.804%), due 7/20/49 (b) | $ 335,285 | $ 298,862 |
| REMIC, Series 2019-97, Class FG | | |
| 3.50% (1 Month SOFR + 0.804%), due 8/20/49 (b) | 701,794 | 625,592 |
| REMIC, Series 2019-110, Class FG | | |
| 3.50% (1 Month SOFR + 0.764%), due 9/20/49 (b) | 243,448 | 215,791 |
| REMIC, Series 2019-128, Class KF | | |
| 3.50% (1 Month SOFR + 0.764%), due 10/20/49 (b) | 374,236 | 332,554 |
| REMIC, Series 2019-128, Class YF | | |
| 3.50% (1 Month SOFR + 0.764%), due 10/20/49 (b) | 482,984 | 430,279 |
| REMIC, Series 2020-5, Class FA | | |
| 3.50% (1 Month SOFR + 0.814%), due 1/20/50 (b) | 752,077 | 669,174 |
| REMIC, Series 2023-63, Class MA | | |
| 3.50%, due 5/20/50 | 618,419 | 568,339 |
| REMIC, Series 2021-125, Class AF | | |
| 3.50% (SOFR 30A + 0.25%), due 7/20/51 (b) | 739,849 | 659,358 |
| REMIC, Series 2021-146, Class IN | | |
| 3.50%, due 8/20/51 (h) | 1,110,194 | 191,344 |
| REMIC, Series 2023-1, Class HD | | |
| 3.50%, due 1/20/52 | 617,935 | 568,606 |
| REMIC, Series 2022-69, Class FA | | |
| 4.50% (SOFR 30A + 0.75%), due 4/20/52 (b) | 421,568 | 396,977 |
| REMIC, Series 2023-81, Class LA | | |
| 5.00%, due 6/20/52 | 482,976 | 484,421 |
| REMIC, Series 2023-38, Class WT | | |
| 6.727%, due 12/20/51 (i) | 305,930 | 328,116 |
| REMIC, Series 2023-59, Class YC | | |
| 6.952%, due 9/20/51 (i) | 676,523 | 743,340 |
| REMIC, Series 2023-55, Class CG | | |
| 7.505%, due 7/20/51 (i) | 755,073 | 837,037 |
| REMIC, Series 2023-55, Class LB | | |
| 7.83%, due 11/20/51 (i) | 863,521 | 1,000,754 |
| | | 42,147,554 |
| | Principal
Amount | Value |
| |
| Commercial Mortgage Loans (Collateralized Mortgage Obligations) 2.8% |
| Bayview Commercial Asset Trust | | |
| Series 2006-4A, Class A1 | | |
| 5.815% (1 Month SOFR + 0.459%), due 12/25/36 (a)(b) | $ 21,349 | $ 19,920 |
| BBCMS Mortgage Trust (a)(b) | | |
| Series 2018-TALL, Class C | | |
| 6.68% (1 Month SOFR + 1.318%), due 3/15/37 | 320,000 | 259,914 |
| Series 2018-TALL, Class D | | |
| 7.008% (1 Month SOFR + 1.646%), due 3/15/37 | 360,000 | 269,174 |
| Benchmark Mortgage Trust | | |
| Series 2020-B19, Class A2 | | |
| 1.691%, due 9/15/53 | 935,000 | 855,777 |
| BX Commercial Mortgage Trust (a)(j) | | |
| Series 2020-VIV2, Class C | | |
| 3.542%, due 3/9/44 | 365,000 | 311,773 |
| Series 2020-VIV3, Class B | | |
| 3.544%, due 3/9/44 | 450,059 | 393,810 |
| Series 2020-VIVA, Class D | | |
| 3.549%, due 3/11/44 | 340,000 | 283,663 |
| BX Trust (a) | | |
| Series 2019-OC11, Class C | | |
| 3.856%, due 12/9/41 | 205,000 | 182,015 |
| Series 2019-OC11, Class D | | |
| 3.944%, due 12/9/41 (j) | 450,000 | 391,664 |
| Series 2021-ARIA, Class E | | |
| 7.721% (1 Month SOFR + 2.359%), due 10/15/36 (b) | 970,000 | 916,427 |
| Series 2022-PSB, Class B | | |
| 8.311% (1 Month SOFR + 2.949%), due 8/15/39 (b) | 633,324 | 633,090 |
| Series 2022-PSB, Class C | | |
| 9.059% (1 Month SOFR + 3.697%), due 8/15/39 (b) | 168,296 | 168,331 |
| BXHPP Trust | | |
| Series 2021-FILM, Class B | | |
| 6.376% (1 Month SOFR + 1.014%), due 8/15/36 (a)(b) | 535,000 | 490,943 |
| DROP Mortgage Trust | | |
| Series 2021-FILE, Class A | | |
| 6.626% (1 Month SOFR + 1.264%), due 10/15/43 (a)(b) | 295,000 | 272,506 |
| Extended Stay America Trust | | |
| Series 2021-ESH, Class D | | |
| 7.726% (1 Month SOFR + 2.364%), due 7/15/38 (a)(b) | 588,067 | 577,727 |
The notes to the financial statements are an integral part of, and should be read in conjunction with, the financial statements.
21
Portfolio of Investments December 31, 2023†^ (continued)
| | Principal
Amount | Value |
| Mortgage-Backed Securities (continued) |
| Commercial Mortgage Loans (Collateralized Mortgage Obligations) (continued) |
| GNMA (h)(j) | | |
| REMIC, Series 2021-164 | | |
| 0.949%, due 10/16/63 | $ 1,907,952 | $ 132,184 |
| REMIC, Series 2021-108 | | |
| 0.967%, due 6/16/61 | 4,174,830 | 292,451 |
| REMIC, Series 2020-168, Class IA | | |
| 0.978%, due 12/16/62 | 1,445,706 | 100,652 |
| REMIC, Series 2021-47 | | |
| 0.992%, due 3/16/61 | 3,371,936 | 234,601 |
| Hudson Yards Mortgage Trust | | |
| Series 2019-30HY, Class A | | |
| 3.228%, due 7/10/39 (a) | 665,000 | 588,254 |
| Morgan Stanley Bank of America Merrill Lynch Trust | | |
| Series 2017-C34, Class A4 | | |
| 3.536%, due 11/15/52 | 320,000 | 298,231 |
| Series 2016-C28, Class A4 | | |
| 3.544%, due 1/15/49 | 200,000 | 190,907 |
| Morgan Stanley Capital I Trust | | |
| Series 2015-UBS8, Class A4 | | |
| 3.809%, due 12/15/48 | 395,000 | 380,133 |
| Multifamily Connecticut Avenue Securities Trust (a)(b) | | |
| Series 2019-01, Class M10 | | |
| 8.702% (SOFR 30A + 3.364%), due 10/25/49 | 949,495 | 923,341 |
| Series 2020-01, Class M10 | | |
| 9.202% (SOFR 30A + 3.864%), due 3/25/50 | 1,052,040 | 1,014,108 |
| Series 2023-01, Class M10 | | |
| 11.837% (SOFR 30A + 6.50%), due 11/25/53 | 1,040,000 | 1,055,874 |
| Series 2020-01, Class CE | | |
| 12.952% (SOFR 30A + 7.614%), due 3/25/50 | 180,000 | 175,899 |
| One Bryant Park Trust | | |
| Series 2019-OBP, Class A | | |
| 2.516%, due 9/15/54 (a) | 1,140,000 | 965,162 |
| ORL Trust (a)(b) | | |
| Series 2023-GLKS, Class C | | |
| 9.013% (1 Month SOFR + 3.651%), due 10/19/36 | 395,000 | 394,630 |
| Series 2023-GLKS, Class D | | |
| 9.663% (1 Month SOFR + 4.301%), due 10/19/36 | 320,000 | 319,701 |
| | Principal
Amount | Value |
| |
| Commercial Mortgage Loans (Collateralized Mortgage Obligations) (continued) |
| SLG Office Trust (a) | | |
| Series 2021-OVA, Class A | | |
| 2.585%, due 7/15/41 | $ 325,000 | $ 268,493 |
| Series 2021-OVA, Class F | | |
| 2.851%, due 7/15/41 | 355,000 | 251,250 |
| Wells Fargo Commercial Mortgage Trust | | |
| Series 2018-AUS, Class A | | |
| 4.058%, due 8/17/36 (a)(j) | 705,000 | 643,532 |
| | | 14,256,137 |
| Whole Loan (Collateralized Mortgage Obligations) 5.0% |
| CIM Trust | | |
| Series 2021-J2, Class AS | | |
| 0.21%, due 4/25/51 (a)(h)(i) | 17,974,593 | 198,905 |
| Connecticut Avenue Securities Trust (a)(b) | | |
| Series 2022-R01, Class 1M2 | | |
| 7.237% (SOFR 30A + 1.90%), due 12/25/41 | 235,000 | 235,367 |
| Series 2021-R03, Class 1B1 | | |
| 8.087% (SOFR 30A + 2.75%), due 12/25/41 | 545,000 | 546,353 |
| Series 2021-R01, Class 1B1 | | |
| 8.437% (SOFR 30A + 3.10%), due 10/25/41 | 1,290,000 | 1,300,412 |
| Series 2022-R02, Class 2B1 | | |
| 9.837% (SOFR 30A + 4.50%), due 1/25/42 | 905,000 | 931,672 |
| Series 2021-R01, Class 1B2 | | |
| 11.337% (SOFR 30A + 6.00%), due 10/25/41 | 1,020,000 | 1,042,652 |
| Series 2022-R01, Class 1B2 | | |
| 11.337% (SOFR 30A + 6.00%), due 12/25/41 | 215,000 | 219,266 |
| FHLMC STACR REMIC Trust (a)(b) | | |
| Series 2021-HQA3, Class M2 | | |
| 7.437% (SOFR 30A + 2.10%), due 9/25/41 | 1,210,000 | 1,193,716 |
| Series 2021-HQA4, Class M2 | | |
| 7.687% (SOFR 30A + 2.35%), due 12/25/41 | 700,000 | 689,865 |
| Series 2022-DNA1, Class M2 | | |
| 7.837% (SOFR 30A + 2.50%), due 1/25/42 | 925,000 | 923,287 |
| Series 2021-HQA1, Class B1 | | |
| 8.337% (SOFR 30A + 3.00%), due 8/25/33 | 1,385,000 | 1,402,353 |
The notes to the financial statements are an integral part of, and should be read in conjunction with, the financial statements.
| 22 | MainStay VP Income Builder Portfolio |
| | Principal
Amount | Value |
| Mortgage-Backed Securities (continued) |
| Whole Loan (Collateralized Mortgage Obligations) (continued) |
FHLMC STACR REMIC Trust (a)(b)
(continued) | | |
| Series 2021-DNA5, Class B1 | | |
| 8.387% (SOFR 30A + 3.05%), due 1/25/34 | $ 1,730,000 | $ 1,745,747 |
| Series 2021-HQA2, Class B1 | | |
| 8.487% (SOFR 30A + 3.15%), due 12/25/33 | 635,000 | 636,588 |
| Series 2021-HQA3, Class B1 | | |
| 8.687% (SOFR 30A + 3.35%), due 9/25/41 | 1,035,000 | 1,032,436 |
| Series 2021-DNA6, Class B1 | | |
| 8.737% (SOFR 30A + 3.40%), due 10/25/41 | 340,000 | 345,486 |
| Series 2022-DNA1, Class B1 | | |
| 8.737% (SOFR 30A + 3.40%), due 1/25/42 | 250,000 | 248,993 |
| Series 2021-DNA7, Class B1 | | |
| 8.987% (SOFR 30A + 3.65%), due 11/25/41 | 955,000 | 972,670 |
| Series 2021-HQA4, Class B1 | | |
| 9.087% (SOFR 30A + 3.75%), due 12/25/41 | 190,000 | 189,645 |
| Series 2021-DNA1, Class B2 | | |
| 10.087% (SOFR 30A + 4.75%), due 1/25/51 | 945,000 | 961,889 |
| Series 2020-DNA2, Class B2 | | |
| 10.252% (SOFR 30A + 4.914%), due 2/25/50 | 260,000 | 268,701 |
| Series 2020-HQA1, Class B2 | | |
| 10.552% (SOFR 30A + 5.214%), due 1/25/50 | 665,000 | 681,386 |
| Series 2022-HQA1, Class M2 | | |
| 10.587% (SOFR 30A + 5.25%), due 3/25/42 | 155,000 | 165,292 |
| Series 2022-HQA3, Class M2 | | |
| 10.687% (SOFR 30A + 5.35%), due 8/25/42 | 1,575,000 | 1,670,839 |
| Series 2021-HQA2, Class B2 | | |
| 10.787% (SOFR 30A + 5.45%), due 12/25/33 | 245,000 | 252,396 |
| Series 2022-DNA6, Class M2 | | |
| 11.087% (SOFR 30A + 5.75%), due 9/25/42 | 675,000 | 750,457 |
| Series 2021-HQA4, Class B2 | | |
| 12.337% (SOFR 30A + 7.00%), due 12/25/41 | 140,000 | 142,592 |
| | Principal
Amount | Value |
| |
| Whole Loan (Collateralized Mortgage Obligations) (continued) |
FHLMC STACR REMIC Trust (a)(b)
(continued) | | |
| Series 2022-HQA1, Class B1 | | |
| 12.337% (SOFR 30A + 7.00%), due 3/25/42 | $ 710,000 | $ 767,814 |
| Series 2021-DNA6, Class B2 | | |
| 12.837% (SOFR 30A + 7.50%), due 10/25/41 | 300,000 | 314,791 |
| FHLMC STACR Trust | | |
| Series 2019-HQA3, Class B2 | | |
| 12.952% (SOFR 30A + 7.614%), due 9/25/49 (a)(b) | 450,000 | 491,242 |
| FHLMC Structured Agency Credit Risk Debt Notes (a)(b) | | |
| Series 2020-HQA5, Class B1 | | |
| 9.337% (SOFR 30A + 4.00%), due 11/25/50 | 305,000 | 330,642 |
| Series 2022-HQA2, Class M2 | | |
| 11.337% (SOFR 30A + 6.00%), due 7/25/42 | 940,000 | 1,014,701 |
| Flagstar Mortgage Trust | | |
| Series 2021-6INV, Class A18 | | |
| 2.50%, due 8/25/51 (a)(i) | 403,695 | 322,010 |
| HarborView Mortgage Loan Trust | | |
| Series 2007-3, Class 2A1A | | |
| 5.87% (1 Month SOFR + 0.514%), due 5/19/37 (b) | 400,289 | 372,046 |
| J.P. Morgan Mortgage Trust | | |
| Series 2021-LTV2, Class A1 | | |
| 2.519%, due 5/25/52 (a)(i) | 304,940 | 250,437 |
| New Residential Mortgage Loan Trust (a) | | |
| Series 2019-5A, Class B7 | | |
| 4.317%, due 8/25/59 (j) | 1,176,800 | 703,581 |
| Series 2019-2A, Class B6 | | |
| 4.825%, due 12/25/57 (i) | 462,967 | 300,684 |
| OBX Trust | | |
| Series 2022-NQM1, Class A1 | | |
| 2.305%, due 11/25/61 (a)(i) | 465,793 | 399,346 |
| Onslow Bay Mortgage Loan Trust | | |
| Series 2021-NQM4, Class A1 | | |
| 1.957%, due 10/25/61 (a)(i) | 1,264,216 | 1,031,954 |
| Sequoia Mortgage Trust | | |
| Series 2021-4, Class A1 | | |
| 0.166%, due 6/25/51 (a)(h)(j) | 14,639,218 | 121,533 |
The notes to the financial statements are an integral part of, and should be read in conjunction with, the financial statements.
23
Portfolio of Investments December 31, 2023†^ (continued)
| | Principal
Amount | Value |
| Mortgage-Backed Securities (continued) |
| Whole Loan (Collateralized Mortgage Obligations) (continued) |
| STACR Trust | | |
| Series 2018-HRP2, Class B1 | | |
| 9.652% (SOFR 30A + 4.314%), due 2/25/47 (a)(b) | $ 925,000 | $ 1,011,176 |
| | | 26,180,922 |
Total Mortgage-Backed Securities
(Cost $82,945,032) | | 82,584,613 |
| Municipal Bond 0.1% |
| California 0.1% |
| Regents of the University of California Medical Center, Pooled, Revenue Bonds | | |
| Series N | | |
| 3.006%, due 5/15/50 | 1,065,000 | 756,365 |
Total Municipal Bond
(Cost $1,065,000) | | 756,365 |
| U.S. Government & Federal Agencies 5.8% |
| Federal Home Loan Mortgage Corporation (Mortgage Pass-Through Securities) 1.3% |
| FHLMC Gold Pools, 30 Year | | |
| 3.50%, due 1/1/48 | 505,301 | 472,215 |
| UMBS Pool, 30 Year | | |
| 3.50%, due 7/1/50 | 443,190 | 412,391 |
| 4.50%, due 10/1/52 | 194,393 | 188,495 |
| 5.50%, due 7/1/53 | 1,107,096 | 1,111,571 |
| 6.00%, due 10/1/53 | 1,048,303 | 1,069,080 |
| 6.00%, due 10/1/53 | 563,423 | 573,860 |
| 6.00%, due 11/1/53 | 49,923 | 50,990 |
| 6.50%, due 10/1/53 | 1,490,502 | 1,527,428 |
| 6.50%, due 11/1/53 | 937,188 | 960,353 |
| 6.50%, due 12/1/53 | 125,000 | 128,517 |
| | | 6,494,900 |
| Federal National Mortgage Association (Mortgage Pass-Through Securities) 2.4% |
| FNMA, Other | | |
| 6.00%, due 4/1/37 | 3,884 | 3,974 |
| UMBS, 30 Year | | |
| 2.50%, due 6/1/51 | 1,798,151 | 1,548,822 |
| 3.00%, due 6/1/51 | 325,117 | 288,008 |
| 3.00%, due 11/1/51 | 690,507 | 611,102 |
| 3.00%, due 3/1/52 | 577,284 | 510,546 |
| 3.50%, due 7/1/52 | 108,312 | 99,385 |
| | Principal
Amount | Value |
| |
| Federal National Mortgage Association (Mortgage Pass-Through Securities) (continued) |
| UMBS, 30 Year (continued) | | |
| 4.00%, due 8/1/48 | $ 625,580 | $ 601,565 |
| 4.00%, due 2/1/49 | 95,562 | 91,718 |
| 4.00%, due 6/1/52 | 326,466 | 308,809 |
| 4.00%, due 6/1/52 | 556,670 | 526,561 |
| 4.00%, due 7/1/52 | 701,894 | 664,342 |
| 5.00%, due 11/1/52 | 2,233,221 | 2,210,175 |
| 5.50%, due 2/1/53 | 189,882 | 190,715 |
| 5.50%, due 8/1/53 | 504,354 | 508,575 |
| 6.00%, due 8/1/53 | 465,710 | 473,218 |
| 6.00%, due 9/1/53 | 528,607 | 537,995 |
| 6.00%, due 9/1/53 | 2,112,169 | 2,144,620 |
| 6.00%, due 11/1/53 | 49,897 | 50,902 |
| 6.50%, due 9/1/53 | 608,071 | 623,100 |
| 6.50%, due 10/1/53 | 463,844 | 478,595 |
| 6.50%, due 12/1/53 | 70,000 | 71,970 |
| | | 12,544,697 |
| United States Treasury Bonds 1.4% |
| U.S. Treasury Bonds | | |
| 4.75%, due 11/15/43 (e) | 5,485,000 | 5,883,520 |
| 4.75%, due 11/15/53 | 1,360,000 | 1,525,112 |
| | | 7,408,632 |
| United States Treasury Notes 0.7% |
| U.S. Treasury Notes | | |
| 4.625%, due 10/15/26 | 1,900,000 | 1,928,203 |
| 4.875%, due 10/31/28 | 1,330,000 | 1,388,292 |
| 5.00%, due 10/31/25 | 275,000 | 278,137 |
| | | 3,594,632 |
Total U.S. Government & Federal Agencies
(Cost $29,586,236) | | 30,042,861 |
Total Long-Term Bonds
(Cost $219,419,801) | | 209,980,651 |
| |
| | Shares | |
| |
| Common Stocks 55.2% |
| Aerospace & Defense 1.7% |
| BAE Systems plc (United Kingdom) | 186,254 | 2,636,423 |
| General Dynamics Corp. | 7,055 | 1,831,972 |
| Lockheed Martin Corp. | 4,553 | 2,063,602 |
| RTX Corp. | 26,234 | 2,207,329 |
| | | 8,739,326 |
The notes to the financial statements are an integral part of, and should be read in conjunction with, the financial statements.
| 24 | MainStay VP Income Builder Portfolio |
| | Shares | Value |
| Common Stocks (continued) |
| Air Freight & Logistics 1.3% |
| Deutsche Post AG (Registered) (Germany) | 64,706 | $ 3,204,091 |
| Hyundai Glovis Co. Ltd. (Republic of Korea) (k) | 12,965 | 1,922,636 |
| United Parcel Service, Inc., Class B | 10,300 | 1,619,469 |
| | | 6,746,196 |
| Automobile Components 0.3% |
| Cie Generale des Etablissements Michelin SCA (France) | 49,834 | 1,785,762 |
| Automobiles 0.3% |
| Toyota Motor Corp. (Japan) | 88,400 | 1,624,115 |
| Banks 3.8% |
| Bank of America Corp. | 92,812 | 3,124,980 |
| BAWAG Group AG (Austria) (a) | 31,887 | 1,688,975 |
| Columbia Banking System, Inc. | 75,244 | 2,007,510 |
| JPMorgan Chase & Co. | 23,656 | 4,023,886 |
| PNC Financial Services Group, Inc. (The) | 11,992 | 1,856,961 |
| Regions Financial Corp. | 96,858 | 1,877,108 |
| Royal Bank of Canada (Canada) | 16,226 | 1,640,907 |
| Truist Financial Corp. | 47,617 | 1,758,020 |
| U.S. Bancorp | 44,881 | 1,942,450 |
| | | 19,920,797 |
| Beverages 1.8% |
| Coca-Cola Co. (The) | 35,629 | 2,099,617 |
| Coca-Cola Europacific Partners plc (United Kingdom) | 79,684 | 5,318,110 |
| PepsiCo, Inc. | 12,050 | 2,046,572 |
| | | 9,464,299 |
| Biotechnology 0.7% |
| AbbVie, Inc. | 24,048 | 3,726,719 |
| Capital Markets 1.0% |
| BlackRock, Inc. | 2,063 | 1,674,744 |
| Lazard Ltd., Class A | 53,976 | 1,878,365 |
| Schroders plc (United Kingdom) | 297,841 | 1,632,085 |
| | | 5,185,194 |
| Chemicals 2.1% |
| Air Products and Chemicals, Inc. | 7,268 | 1,989,979 |
| Dow, Inc. | 35,300 | 1,935,852 |
| Linde plc | 7,913 | 3,249,948 |
| LyondellBasell Industries NV, Class A | 21,571 | 2,050,971 |
| | Shares | Value |
| |
| Chemicals (continued) |
| Nutrien Ltd. (Canada) (e) | 32,486 | $ 1,829,936 |
| | | 11,056,686 |
| Commercial Services & Supplies 0.0% ‡ |
| Quad/Graphics, Inc. (k) | 6 | 33 |
| Communications Equipment 0.9% |
| Cisco Systems, Inc. | 97,069 | 4,903,925 |
| Construction & Engineering 0.3% |
| Vinci SA (France) | 13,862 | 1,739,946 |
| Consumer Staples Distribution & Retail 0.7% |
| Walmart, Inc. | 23,948 | 3,775,402 |
| Diversified Telecommunication Services 2.5% |
| AT&T, Inc. | 96,107 | 1,612,675 |
| BCE, Inc. (Canada) | 40,051 | 1,576,892 |
| Deutsche Telekom AG (Registered) (Germany) | 185,670 | 4,458,106 |
| Orange SA (France) | 177,261 | 2,016,362 |
| TELUS Corp. (Canada) | 85,325 | 1,518,406 |
| Verizon Communications, Inc. | 41,236 | 1,554,597 |
| | | 12,737,038 |
| Electric Utilities 2.2% |
| American Electric Power Co., Inc. | 30,758 | 2,498,165 |
| Duke Energy Corp. | 16,464 | 1,597,666 |
| Entergy Corp. | 16,558 | 1,675,504 |
| Evergy, Inc. | 29,325 | 1,530,765 |
| NextEra Energy, Inc. | 41,032 | 2,492,284 |
| Pinnacle West Capital Corp. | 22,976 | 1,650,596 |
| | | 11,444,980 |
| Electrical Equipment 1.0% |
| Eaton Corp. plc | 13,164 | 3,170,154 |
| Emerson Electric Co. | 22,606 | 2,200,242 |
| | | 5,370,396 |
| Food Products 1.0% |
| Mondelez International, Inc., Class A | 21,821 | 1,580,495 |
| Nestle SA (Registered) | 17,199 | 1,994,025 |
| Orkla ASA (Norway) | 209,051 | 1,622,219 |
| | | 5,196,739 |
| Gas Utilities 0.5% |
| Snam SpA (Italy) | 454,011 | 2,333,111 |
The notes to the financial statements are an integral part of, and should be read in conjunction with, the financial statements.
25
Portfolio of Investments December 31, 2023†^ (continued)
| | Shares | Value |
| Common Stocks (continued) |
| Health Care Equipment & Supplies 0.6% |
| Medtronic plc | 36,139 | $ 2,977,131 |
| Health Care Providers & Services 1.1% |
| CVS Health Corp. | 21,846 | 1,724,960 |
| UnitedHealth Group, Inc. | 7,077 | 3,725,828 |
| | | 5,450,788 |
| Hotels, Restaurants & Leisure 1.8% |
| McDonald's Corp. | 7,612 | 2,257,034 |
| Restaurant Brands International, Inc. (Canada) | 59,740 | 4,667,486 |
| Vail Resorts, Inc. | 11,503 | 2,455,546 |
| | | 9,380,066 |
| Household Durables 0.3% |
| Garmin Ltd. | 13,666 | 1,756,628 |
| Industrial Conglomerates 0.9% |
| Honeywell International, Inc. | 7,411 | 1,554,161 |
| Siemens AG (Registered) (Germany) | 16,498 | 3,094,747 |
| | | 4,648,908 |
| Insurance 2.7% |
| Allianz SE (Registered) (Germany) | 6,870 | 1,834,982 |
| AXA SA (France) | 66,808 | 2,174,967 |
| Manulife Financial Corp. (Canada) | 142,399 | 3,146,630 |
| MetLife, Inc. | 49,120 | 3,248,306 |
| Muenchener Rueckversicherungs-Gesellschaft AG (Registered) (Germany) | 4,712 | 1,951,200 |
| Travelers Cos., Inc. (The) | 8,080 | 1,539,159 |
| | | 13,895,244 |
| IT Services 1.1% |
| International Business Machines Corp. | 35,747 | 5,846,422 |
| Leisure Products 0.3% |
| Hasbro, Inc. | 32,708 | 1,670,070 |
| Machinery 0.7% |
| Cummins, Inc. | 14,060 | 3,368,354 |
| Media 0.8% |
| Comcast Corp., Class A | 51,714 | 2,267,659 |
| Omnicom Group, Inc. | 23,405 | 2,024,766 |
| | | 4,292,425 |
| | Shares | Value |
| |
| Multi-Utilities 0.6% |
| NiSource, Inc. | 66,488 | $ 1,765,256 |
| WEC Energy Group, Inc. | 17,259 | 1,452,690 |
| | | 3,217,946 |
| Oil, Gas & Consumable Fuels 2.0% |
| Chevron Corp. | 10,928 | 1,630,021 |
| Enterprise Products Partners LP | 52,920 | 1,394,442 |
| MPLX LP | 39,178 | 1,438,616 |
| TotalEnergies SE (France) | 67,268 | 4,574,447 |
| Williams Cos., Inc. (The) | 43,854 | 1,527,435 |
| | | 10,564,961 |
| Personal Care Products 0.3% |
| Unilever plc (United Kingdom) | 29,714 | 1,439,248 |
| Pharmaceuticals 5.5% |
| Astellas Pharma, Inc. (Japan) | 160,300 | 1,916,779 |
| AstraZeneca plc, Sponsored ADR (United Kingdom) | 63,463 | 4,274,233 |
| Bristol-Myers Squibb Co. | 29,196 | 1,498,047 |
| Eli Lilly & Co. | 5,886 | 3,431,067 |
| GSK plc | 82,077 | 1,517,191 |
| Johnson & Johnson | 12,458 | 1,952,667 |
| Merck & Co., Inc. | 26,145 | 2,850,328 |
| Novartis AG (Registered) (Switzerland) | 40,807 | 4,117,817 |
| Pfizer, Inc. | 49,026 | 1,411,458 |
| Roche Holding AG | 5,342 | 1,552,962 |
| Sanofi SA | 39,201 | 3,884,449 |
| | | 28,406,998 |
| Professional Services 0.4% |
| Paychex, Inc. | 15,449 | 1,840,130 |
| Retail REITs 0.4% |
| Realty Income Corp. | 31,987 | 1,836,694 |
| Semiconductors & Semiconductor Equipment 4.6% |
| Analog Devices, Inc. | 27,983 | 5,556,305 |
| Broadcom, Inc. | 6,213 | 6,935,261 |
| KLA Corp. | 8,039 | 4,673,071 |
| Taiwan Semiconductor Manufacturing Co. Ltd., Sponsored ADR (Taiwan) | 36,003 | 3,744,312 |
| Texas Instruments, Inc. | 18,768 | 3,199,193 |
| | | 24,108,142 |
| Software 1.3% |
| Microsoft Corp. | 18,093 | 6,803,692 |
The notes to the financial statements are an integral part of, and should be read in conjunction with, the financial statements.
| 26 | MainStay VP Income Builder Portfolio |
| | Shares | Value |
| Common Stocks (continued) |
| Specialized REITs 1.2% |
| Iron Mountain, Inc. | 60,129 | $ 4,207,827 |
| VICI Properties, Inc. | 64,245 | 2,048,131 |
| | | 6,255,958 |
| Specialty Retail 0.8% |
| Best Buy Co., Inc. | 21,032 | 1,646,385 |
| Home Depot, Inc. (The) | 6,587 | 2,282,725 |
| | | 3,929,110 |
| Technology Hardware, Storage & Peripherals 2.8% |
| Apple, Inc. | 24,328 | 4,683,870 |
| Dell Technologies, Inc., Class C | 31,006 | 2,371,959 |
| Hewlett Packard Enterprise Co. | 97,387 | 1,653,631 |
| NetApp, Inc. | 27,614 | 2,434,450 |
| Samsung Electronics Co. Ltd., GDR (Republic of Korea) | 2,155 | 3,228,190 |
| | | 14,372,100 |
| Tobacco 1.5% |
| British American Tobacco plc (United Kingdom) | 69,803 | 2,042,407 |
| Imperial Brands plc (United Kingdom) | 90,791 | 2,090,604 |
| Philip Morris International, Inc. | 36,317 | 3,416,703 |
| | | 7,549,714 |
| Trading Companies & Distributors 0.7% |
| MSC Industrial Direct Co., Inc., Class A | 36,796 | 3,725,963 |
| Wireless Telecommunication Services 0.7% |
| Rogers Communications, Inc., Class B (Canada) | 38,179 | 1,787,286 |
| SK Telecom Co. Ltd. (Republic of Korea) | 46,547 | 1,808,485 |
| | | 3,595,771 |
Total Common Stocks
(Cost $253,110,842) | | 286,683,127 |
| Short-Term Investments 2.8% |
| Affiliated Investment Company 2.3% |
| MainStay U.S. Government Liquidity Fund, 5.235% (l) | 12,142,456 | 12,142,456 |
| Unaffiliated Investment Company 0.4% |
| Invesco Government & Agency Portfolio, 5.361% (l)(m) | 2,298,070 | 2,298,070 |
| |
| | Principal
Amount | | Value |
| |
| U.S. Treasury Debt 0.1% |
| U.S. Treasury Bills | | | |
| 5.29%, due 3/14/24 (n) | $ 260,000 | | $ 257,302 |
Total Short-Term Investments
(Cost $14,697,774) | | | 14,697,828 |
Total Investments
(Cost $487,228,417) | 98.4% | | 511,361,606 |
| Other Assets, Less Liabilities | 1.6 | | 8,340,876 |
| Net Assets | 100.0% | | $ 519,702,482 |
| † | Percentages indicated are based on Portfolio net assets. |
| ^ | Industry classifications may be different than those used for compliance monitoring purposes. |
| ‡ | Less than one-tenth of a percent. |
| (a) | May be sold to institutional investors only under Rule 144A or securities offered pursuant to Section 4(a)(2) of the Securities Act of 1933, as amended. |
| (b) | Floating rate—Rate shown was the rate in effect as of December 31, 2023. |
| (c) | Fixed to floating rate—Rate shown was the rate in effect as of December 31, 2023. |
| (d) | Security is perpetual and, thus, does not have a predetermined maturity date. The date shown, if applicable, reflects the next call date. |
| (e) | All or a portion of this security was held on loan. As of December 31, 2023, the aggregate market value of securities on loan was $8,121,558; the total market value of collateral held by the Portfolio was $8,383,514. The market value of the collateral held included non-cash collateral in the form of U.S. Treasury securities with a value of $6,085,444. The Portfolio received cash collateral with a value of $2,298,070. (See Note 2(L)) |
| (f) | Step coupon—Rate shown was the rate in effect as of December 31, 2023. |
| (g) | Illiquid security—As of December 31, 2023, the total market value deemed illiquid under procedures approved by the Board of Trustees was $251,875, which represented less than one-tenth of a percent of the Portfolio’s net assets. (Unaudited) |
| (h) | Collateralized Mortgage Obligation Interest Only Strip—Pays a fixed or variable rate of interest based on mortgage loans or mortgage pass-through securities. The principal amount of the underlying pool represents the notional amount on which the current interest was calculated. The value of these stripped securities may be particularly sensitive to changes in prevailing interest rates and are typically more sensitive to changes in prepayment rates than traditional mortgage-backed securities. |
| (i) | Coupon rate may change based on changes of the underlying collateral or prepayments of principal. Rate shown was the rate in effect as of December 31, 2023. |
The notes to the financial statements are an integral part of, and should be read in conjunction with, the financial statements.
27
Portfolio of Investments December 31, 2023†^ (continued)
| (j) | Collateral strip rate—A bond whose interest was based on the weighted net interest rate of the collateral. The coupon rate adjusts periodically based on a predetermined schedule. Rate shown was the rate in effect as of December 31, 2023. |
| (k) | Non-income producing security. |
| (l) | Current yield as of December 31, 2023. |
| (m) | Represents a security purchased with cash collateral received for securities on loan. |
| (n) | Interest rate shown represents yield to maturity. |
Investments in Affiliates (in 000's)
Investments in issuers considered to be affiliate(s) of the Portfolio during the year ended December 31, 2023 for purposes of Section 2(a)(3) of the Investment Company Act of 1940, as amended, were as follows:
| Affiliated Investment Companies | Value,
Beginning
of Year | Purchases
at Cost | Proceeds
from
Sales | Net
Realized
Gain/(Loss)
on Sales | Change in
Unrealized
Appreciation/
(Depreciation) | Value,
End of
Year | Dividend
Income | Other
Distributions | Shares
End of
Year |
| MainStay U.S. Government Liquidity Fund | $ 6,070 | $ 146,387 | $ (140,315) | $ — | $ — | $ 12,142 | $ 292 | $ — | 12,142 |
Foreign Currency Forward Contracts
As of December 31, 2023, the Portfolio held the following foreign currency forward contracts1:
| Currency Purchased | Currency Sold | Counterparty | Settlement
Date | Unrealized
Appreciation
(Depreciation) |
| AUD | 9,875,000 | USD | 6,283,711 | JPMorgan Chase Bank N.A. | 2/1/24 | $ 452,503 |
| GBP | 133,000 | USD | 161,614 | JPMorgan Chase Bank N.A. | 2/1/24 | 7,944 |
| JPY | 3,368,551,000 | USD | 22,624,324 | JPMorgan Chase Bank N.A. | 2/1/24 | 1,378,684 |
| Total Unrealized Appreciation | 1,839,131 |
| USD | 2,859,798 | EUR | 2,684,147 | JPMorgan Chase Bank N.A. | 2/1/24 | (107,065) |
| Total Unrealized Depreciation | (107,065) |
| Net Unrealized Appreciation | $ 1,732,066 |
| 1. | Foreign Currency Forward Contracts are subject to limitations such that they cannot be “sold or repurchased,” although the Portfolio would be able to exit the transaction through other means, such as through the execution of an offsetting transaction. |
Futures Contracts
As of December 31, 2023, the Portfolio held the following futures contracts1:
| Type | Number of
Contracts | Expiration
Date | Value at
Trade Date | Current
Notional
Amount | Unrealized
Appreciation
(Depreciation)2 |
| Long Contracts | | | | | |
| E-Mini Energy Select Sector Index | 49 | March 2024 | $ 4,187,875 | $ 4,342,870 | $ 154,995 |
| E-Mini Health Care Select Sector Index | 47 | March 2024 | 6,319,244 | 6,543,810 | 224,566 |
| E-Mini Utilities Select Sector Index | 81 | March 2024 | 5,207,991 | 5,224,500 | 16,509 |
| S&P 500 E-Mini Index | 118 | March 2024 | 27,380,071 | 28,438,000 | 1,057,929 |
| S&P Midcap 400 E-Mini Index | 10 | March 2024 | 2,649,420 | 2,809,500 | 160,080 |
| U.S. Treasury 5 Year Notes | 66 | March 2024 | 7,085,591 | 7,179,047 | 93,456 |
| U.S. Treasury 10 Year Notes | 147 | March 2024 | 16,308,763 | 16,594,922 | 286,159 |
| U.S. Treasury 10 Year Ultra Bonds | 31 | March 2024 | 3,504,281 | 3,658,484 | 154,203 |
| U.S. Treasury Long Bonds | 61 | March 2024 | 7,055,699 | 7,621,187 | 565,488 |
The notes to the financial statements are an integral part of, and should be read in conjunction with, the financial statements.
| 28 | MainStay VP Income Builder Portfolio |
| Type | Number of
Contracts | Expiration
Date | Value at
Trade Date | Current
Notional
Amount | Unrealized
Appreciation
(Depreciation)2 |
| U.S. Treasury Ultra Bonds | 81 | March 2024 | $ 9,955,266 | $ 10,821,094 | $ 865,828 |
| Yen Denominated Nikkei 225 Index | 298 | March 2024 | 35,286,988 | 35,152,376 | (134,612) |
| Total Long Contracts | | | | | 3,444,601 |
| Short Contracts | | | | | |
| Euro STOXX 50 Index | (333) | March 2024 | (16,761,658) | (16,700,765) | 60,893 |
| FTSE 100 Index | (71) | March 2024 | (6,856,591) | (7,019,644) | (163,053) |
| S&P E-Mini Commercial Service Equity Index | (76) | March 2024 | (7,050,748) | (7,305,500) | (254,752) |
| U.S. Treasury 2 Year Notes | (7) | March 2024 | (1,431,289) | (1,441,399) | (10,110) |
| Total Short Contracts | | | | | (367,022) |
| Net Unrealized Appreciation | | | | | $ 3,077,579 |
| 1. | As of December 31, 2023, cash in the amount of $7,209,731 was on deposit with a broker or futures commission merchant for futures transactions. |
| 2. | Represents the difference between the value of the contracts at the time they were opened and the value as of December 31, 2023. |
| Abbreviation(s): |
| ADR—American Depositary Receipt |
| AUD—Australia Dollar |
| EUR—Euro |
| FHLMC—Federal Home Loan Mortgage Corp. |
| FNMA—Federal National Mortgage Association |
| FTSE—Financial Times Stock Exchange |
| GBP—British Pound Sterling |
| GDR—Global Depositary Receipt |
| GNMA—Government National Mortgage Association |
| JPY—Japanese Yen |
| REIT—Real Estate Investment Trust |
| REMIC—Real Estate Mortgage Investment Conduit |
| SOFR—Secured Overnight Financing Rate |
| STACR—Structured Agency Credit Risk |
| UMBS—Uniform Mortgage Backed Securities |
| USD—United States Dollar |
The notes to the financial statements are an integral part of, and should be read in conjunction with, the financial statements.
29
Portfolio of Investments December 31, 2023†^ (continued)
The following is a summary of the fair valuations according to the inputs used as of December 31, 2023, for valuing the Portfolio’s assets and liabilities:
| Description | Quoted
Prices in
Active
Markets for
Identical
Assets
(Level 1) | | Significant
Other
Observable
Inputs
(Level 2) | | Significant
Unobservable
Inputs
(Level 3) | | Total |
| Asset Valuation Inputs | | | | | | | |
| Investments in Securities (a) | | | | | | | |
| Long-Term Bonds | | | | | | | |
| Asset-Backed Securities | $ — | | $ 16,124,279 | | $ — | | $ 16,124,279 |
| Corporate Bonds | — | | 78,356,296 | | — | | 78,356,296 |
| Foreign Government Bonds | — | | 1,630,042 | | — | | 1,630,042 |
| Loan Assignments | — | | 486,195 | | — | | 486,195 |
| Mortgage-Backed Securities | — | | 82,584,613 | | — | | 82,584,613 |
| Municipal Bond | — | | 756,365 | | — | | 756,365 |
| U.S. Government & Federal Agencies | — | | 30,042,861 | | — | | 30,042,861 |
| Total Long-Term Bonds | — | | 209,980,651 | | — | | 209,980,651 |
| Common Stocks | | | | | | | |
| Air Freight & Logistics | 4,823,560 | | 1,922,636 | | — | | 6,746,196 |
| Wireless Telecommunication Services | 1,787,286 | | 1,808,485 | | — | | 3,595,771 |
| All Other Industries | 276,341,160 | | — | | — | | 276,341,160 |
| Total Common Stocks | 282,952,006 | | 3,731,121 | | — | | 286,683,127 |
| Short-Term Investments | | | | | | | |
| Affiliated Investment Company | 12,142,456 | | — | | — | | 12,142,456 |
| Unaffiliated Investment Company | 2,298,070 | | — | | — | | 2,298,070 |
| U.S. Treasury Debt | — | | 257,302 | | — | | 257,302 |
| Total Short-Term Investments | 14,440,526 | | 257,302 | | — | | 14,697,828 |
| Total Investments in Securities | 297,392,532 | | 213,969,074 | | — | | 511,361,606 |
| Other Financial Instruments (b) | | | | | | | |
| Foreign Currency Forward Contracts | — | | 1,839,131 | | — | | 1,839,131 |
| Futures Contracts | 3,640,106 | | — | | — | | 3,640,106 |
| Total Other Financial Instruments | 3,640,106 | | 1,839,131 | | — | | 5,479,237 |
| Total Investments in Securities and Other Financial Instruments | $ 301,032,638 | | $ 215,808,205 | | $ — | | $ 516,840,843 |
| Liability Valuation Inputs | | | | | | | |
| Other Financial Instruments (b) | | | | | | | |
| Foreign Currency Forward Contracts | $ — | | $ (107,065) | | $ — | | $ (107,065) |
| Futures Contracts | (562,527) | | — | | — | | (562,527) |
| Total Other Financial Instruments | $ (562,527) | | $ (107,065) | | $ — | | $ (669,592) |
| (a) | For a complete listing of investments and their industries, see the Portfolio of Investments. |
| (b) | The value listed for these securities reflects unrealized appreciation (depreciation) as shown on the Portfolio of Investments. |
The notes to the financial statements are an integral part of, and should be read in conjunction with, the financial statements.
| 30 | MainStay VP Income Builder Portfolio |
Statement of Assets and Liabilities as of December 31, 2023
| Assets |
Investment in unaffiliated securities, at value
(identified cost $475,085,961) including securities on loan of $8,121,558 | $499,219,150 |
Investment in affiliated investment companies, at value
(identified cost $12,142,456) | 12,142,456 |
| Cash | 31,091 |
Cash denominated in foreign currencies
(identified cost $53,010) | 53,023 |
| Cash collateral on deposit at broker for futures contracts | 7,209,731 |
| Receivables: | |
| Investment securities sold | 3,140,160 |
| Dividends and interest | 2,431,769 |
| Portfolio shares sold | 520,508 |
| Securities lending | 17,141 |
| Unrealized appreciation on foreign currency forward contracts | 1,839,131 |
| Other assets | 29,119 |
| Total assets | 526,633,279 |
| Liabilities |
| Cash collateral received for securities on loan | 2,298,070 |
| Payables: | |
| Investment securities purchased | 3,542,237 |
| Variation margin on futures contracts | 289,820 |
| Portfolio shares redeemed | 284,770 |
| Manager (See Note 3) | 247,696 |
| NYLIFE Distributors (See Note 3) | 78,543 |
| Professional fees | 41,225 |
| Custodian | 35,813 |
| Shareholder communication | 2,704 |
| Accrued expenses | 2,854 |
| Unrealized depreciation on foreign currency forward contracts | 107,065 |
| Total liabilities | 6,930,797 |
| Net assets | $519,702,482 |
| Composition of Net Assets |
| Shares of beneficial interest outstanding (par value of $.001 per share) unlimited number of shares authorized | $ 35,952 |
| Additional paid-in-capital | 536,592,461 |
| | 536,628,413 |
| Total distributable earnings (loss) | (16,925,931) |
| Net assets | $519,702,482 |
| Initial Class | |
| Net assets applicable to outstanding shares | $144,150,431 |
| Shares of beneficial interest outstanding | 9,893,623 |
| Net asset value per share outstanding | $ 14.57 |
| Service Class | |
| Net assets applicable to outstanding shares | $375,552,051 |
| Shares of beneficial interest outstanding | 26,058,565 |
| Net asset value per share outstanding | $ 14.41 |
The notes to the financial statements are an integral part of, and should be read in conjunction with, the financial statements.
31
Statement of Operations for the year ended December 31, 2023
| Investment Income (Loss) |
| Income | |
| Interest | $ 10,581,358 |
| Dividends-unaffiliated (net of foreign tax withholding of $444,602) | 9,410,734 |
| Dividends-affiliated | 292,367 |
| Securities lending, net | 77,669 |
| Total income | 20,362,128 |
| Expenses | |
| Manager (See Note 3) | 2,947,854 |
| Distribution/Service—Service Class (See Note 3) | 932,646 |
| Professional fees | 119,549 |
| Custodian | 80,120 |
| Trustees | 13,554 |
| Shareholder communication | 5,577 |
| Miscellaneous | 25,685 |
| Total expenses | 4,124,985 |
| Net investment income (loss) | 16,237,143 |
| Realized and Unrealized Gain (Loss) |
| Net realized gain (loss) on: | |
| Unaffiliated investment transactions | (6,460,256) |
| Futures transactions | (1,408,449) |
| Foreign currency transactions | (125,253) |
| Foreign currency forward transactions | (3,414,386) |
| Net realized gain (loss) | (11,408,344) |
| Net change in unrealized appreciation (depreciation) on: | |
| Unaffiliated investments | 39,833,219 |
| Futures contracts | 3,402,965 |
| Foreign currency forward contracts | 1,055,996 |
| Translation of other assets and liabilities in foreign currencies | (329,858) |
| Net change in unrealized appreciation (depreciation) | 43,962,322 |
| Net realized and unrealized gain (loss) | 32,553,978 |
| Net increase (decrease) in net assets resulting from operations | $ 48,791,121 |
The notes to the financial statements are an integral part of, and should be read in conjunction with, the financial statements.
| 32 | MainStay VP Income Builder Portfolio |
Statements of Changes in Net Assets
for the years ended December 31, 2023 and December 31, 2022
| | 2023 | 2022 |
| Increase (Decrease) in Net Assets |
| Operations: | | |
| Net investment income (loss) | $ 16,237,143 | $ 14,927,789 |
| Net realized gain (loss) | (11,408,344) | (36,987,033) |
| Net change in unrealized appreciation (depreciation) | 43,962,322 | (72,100,871) |
| Net increase (decrease) in net assets resulting from operations | 48,791,121 | (94,160,115) |
| Distributions to shareholders: | | |
| Initial Class | (3,886,538) | (18,520,336) |
| Service Class | (9,476,787) | (44,926,426) |
| | (13,363,325) | (63,446,762) |
| Distributions to shareholders from return of capital: | | |
| Initial Class | (826,081) | (1,897,990) |
| Service Class | (2,014,286) | (4,604,122) |
| | (2,840,367) | (6,502,112) |
| Total distributions to shareholders | (16,203,692) | (69,948,874) |
| Capital share transactions: | | |
| Net proceeds from sales of shares | 31,660,834 | 44,815,527 |
| Net asset value of shares issued to shareholders in reinvestment of distributions | 16,203,692 | 69,948,874 |
| Cost of shares redeemed | (104,798,961) | (105,661,713) |
| Increase (decrease) in net assets derived from capital share transactions | (56,934,435) | 9,102,688 |
| Net increase (decrease) in net assets | (24,347,006) | (155,006,301) |
| Net Assets |
| Beginning of year | 544,049,488 | 699,055,789 |
| End of year | $ 519,702,482 | $ 544,049,488 |
The notes to the financial statements are an integral part of, and should be read in conjunction with, the financial statements.
33
Financial Highlights selected per share data and ratios
| | Year Ended December 31, |
| Initial Class | 2023 | | 2022 | | 2021 | | 2020 | | 2019 |
| Net asset value at beginning of year | $ 13.69 | | $ 18.23 | | $ 17.37 | | $ 17.14 | | $ 15.23 |
| Net investment income (loss) (a) | 0.46 | | 0.42 | | 0.42 | | 0.41 | | 0.49 |
| Net realized and unrealized gain (loss) | 0.88 | | (3.02) | | 1.37 | | 0.87 | | 2.22 |
| Total from investment operations | 1.34 | | (2.60) | | 1.79 | | 1.28 | | 2.71 |
| Less distributions: | | | | | | | | | |
| From net investment income | (0.38) | | (0.26) | | (0.39) | | (0.42) | | (0.68) |
| From net realized gain on investments | — | | (1.51) | | (0.54) | | (0.63) | | (0.12) |
| Return of capital | (0.08) | | (0.17) | | — | | — | | — |
| Total distributions | (0.46) | | (1.94) | | (0.93) | | (1.05) | | (0.80) |
| Net asset value at end of year | $ 14.57 | | $ 13.69 | | $ 18.23 | | $ 17.37 | | $ 17.14 |
| Total investment return (b) | 10.05% | | (13.52)% | | 10.52% | | 7.98% | | 18.07% |
| Ratios (to average net assets)/Supplemental Data: | | | | | | | | | |
| Net investment income (loss) | 3.32% | | 2.70% | | 2.31% | | 2.50% | | 3.00% |
| Net expenses (c) | 0.62% | | 0.62% | | 0.61% | | 0.62% | | 0.63% |
| Portfolio turnover rate | 56% | | 58% | | 67%(d) | | 68%(d) | | 59%(d) |
| Net assets at end of year (in 000's) | $ 144,150 | | $ 158,020 | | $ 198,243 | | $ 192,022 | | $ 193,252 |
| (a) | Per share data based on average shares outstanding during the year. |
| (b) | Total return does not reflect any deduction of sales charges, mortality and expense charges, contract charges or administrative charges. For periods of less than one year, total return is not annualized. |
| (c) | In addition to the fees and expenses which the Portfolio bears directly, it also indirectly bears a pro-rata share of the fees and expenses of the underlying funds in which it invests. Such indirect expenses are not included in the above expense ratios. |
| (d) | The portfolio turnover rates not including mortgage dollar rolls were 67%, 67%, and 52% for the years ended December 31, 2021, 2020, and 2019, respectively. |
| | Year Ended December 31, |
| Service Class | 2023 | | 2022 | | 2021 | | 2020 | | 2019 |
| Net asset value at beginning of year | $ 13.54 | | $ 18.06 | | $ 17.22 | | $ 16.99 | | $ 15.11 |
| Net investment income (loss) (a) | 0.42 | | 0.38 | | 0.37 | | 0.37 | | 0.45 |
| Net realized and unrealized gain (loss) | 0.88 | | (3.00) | | 1.36 | | 0.86 | | 2.19 |
| Total from investment operations | 1.30 | | (2.62) | | 1.73 | | 1.23 | | 2.64 |
| Less distributions: | | | | | | | | | |
| From net investment income | (0.36) | | (0.22) | | (0.35) | | (0.37) | | (0.64) |
| From net realized gain on investments | — | | (1.51) | | (0.54) | | (0.63) | | (0.12) |
| Return of capital | (0.07) | | (0.17) | | — | | — | | — |
| Total distributions | (0.43) | | (1.90) | | (0.89) | | (1.00) | | (0.76) |
| Net asset value at end of year | $ 14.41 | | $ 13.54 | | $ 18.06 | | $ 17.22 | | $ 16.99 |
| Total investment return (b) | 9.78% | | (13.73)% | | 10.24% | | 7.71% | | 17.78% |
| Ratios (to average net assets)/Supplemental Data: | | | | | | | | | |
| Net investment income (loss) | 3.07% | | 2.45% | | 2.06% | | 2.25% | | 2.74% |
| Net expenses (c) | 0.87% | | 0.87% | | 0.86% | | 0.87% | | 0.88% |
| Portfolio turnover rate | 56% | | 58% | | 67%(d) | | 68%(d) | | 59%(d) |
| Net assets at end of year (in 000's) | $ 375,552 | | $ 386,030 | | $ 500,812 | | $ 473,118 | | $ 433,515 |
| (a) | Per share data based on average shares outstanding during the year. |
| (b) | Total return does not reflect any deduction of sales charges, mortality and expense charges, contract charges or administrative charges. For periods of less than one year, total return is not annualized. |
| (c) | In addition to the fees and expenses which the Portfolio bears directly, it also indirectly bears a pro-rata share of the fees and expenses of the underlying funds in which it invests. Such indirect expenses are not included in the above expense ratios. |
| (d) | The portfolio turnover rates not including mortgage dollar rolls were 67%, 67%, and 52% for the years ended December 31, 2021, 2020, and 2019, respectively. |
The notes to the financial statements are an integral part of, and should be read in conjunction with, the financial statements.
| 34 | MainStay VP Income Builder Portfolio |
Notes to Financial Statements
Note 1–Organization and Business
MainStay VP Funds Trust (the “Fund”) was organized as a Delaware statutory trust on February 1, 2011. The Fund is registered under the Investment Company Act of 1940, as amended (the “1940 Act”), as an open-end management investment company. The Fund is comprised of thirty-one separate series (collectively referred to as the “Portfolios”). These financial statements and notes relate to the MainStay VP Income Builder Portfolio (the "Portfolio"), a "diversified” portfolio, as that term is defined in the 1940 Act, as interpreted or modified by regulatory authorities having jurisdiction, from time to time.
Shares of the Portfolio are currently offered to certain separate accounts to fund variable annuity policies and variable universal life insurance policies issued by New York Life Insurance and Annuity Corporation (“NYLIAC”), a wholly-owned subsidiary of New York Life Insurance Company (“New York Life”) and may also be offered to fund variable annuity policies and variable universal life insurance policies issued by other insurance companies. NYLIAC allocates shares of the Portfolio to, among others, certain NYLIAC separate accounts. Shares of the Portfolio are also offered to the MainStay VP Conservative Allocation Portfolio, MainStay VP Moderate Allocation Portfolio, MainStay VP Growth Allocation Portfolio and MainStay VP Equity Allocation Portfolio, which operate as “funds-of-funds," and other variable insurance funds.
The following table lists the Portfolio's share classes that have been registered and commenced operations:
| Class | Commenced Operations |
| Initial Class | January 29, 1993 |
| Service Class | June 4, 2003 |
Shares of the Portfolio are offered and are redeemed at a price equal to their respective net asset value (“NAV”) per share. No sales or redemption charge is applicable to the purchase or redemption of the Portfolio's shares. Under the terms of the Fund’s multiple class plan, adopted pursuant to Rule 18f-3 under the 1940 Act, the classes differ in that, among other things, Service Class shares of the Portfolio pay a combined distribution and service fee of 0.25% of average daily net assets attributable to Service Class shares of the Portfolio to the Distributor (as defined in Note 3(B)) pursuant to a plan adopted in accordance with Rule 12b-1 under the 1940 Act. Contract owners of variable annuity contracts purchased after June 2, 2003, are permitted to invest only in the Service Class shares.
The Portfolio's investment objective is to seek current income consistent with reasonable opportunity for future growth of capital and income.
Note 2–Significant Accounting Policies
The Portfolio is an investment company and accordingly follows the investment company accounting and reporting guidance of the Financial Accounting Standards Board (“FASB”) Accounting Standards Codification Topic 946 Financial Services—Investment Companies. The Portfolio prepares its financial statements in accordance with generally accepted
accounting principles (“GAAP”) in the United States of America and follows the significant accounting policies described below.
(A) Securities Valuation. Investments are usually valued as of the close of regular trading on the New York Stock Exchange (the "Exchange") (usually 4:00 p.m. Eastern time) on each day the Portfolio is open for business ("valuation date").
Pursuant to Rule 2a-5 under the 1940 Act, the Board of Trustees of the Fund (the "Board") has designated New York Life Investment Management LLC (“New York Life Investments” or the "Manager") as its Valuation Designee (the "Valuation Designee"). The Valuation Designee is responsible for performing fair valuations relating to all investments in the Portfolio’s portfolio for which market quotations are not readily available; periodically assessing and managing material valuation risks; establishing and applying fair value methodologies; testing fair valuation methodologies; evaluating and overseeing pricing services; ensuring appropriate segregation of valuation and portfolio management functions; providing quarterly, annual and prompt reporting to the Board, as appropriate; identifying potential conflicts of interest; and maintaining appropriate records. The Valuation Designee has established a valuation committee ("Valuation Committee") to assist in carrying out the Valuation Designee’s responsibilities and establish prices of securities for which market quotations are not readily available. The Portfolio's and the Valuation Designee's policies and procedures ("Valuation Procedures") govern the Valuation Designee’s selection and application of methodologies for determining and calculating the fair value of Portfolio investments. The Valuation Designee may value the Portfolio's portfolio securities for which market quotations are not readily available and other Portfolio assets utilizing inputs from pricing services and other third-party sources. The Valuation Committee meets (in person, via electronic mail or via teleconference) on an ad-hoc basis to determine fair valuations and on a quarterly basis to review fair value events with respect to certain securities for which market quotations are not readily available, including valuation risks and back-testing results, and to preview reports to the Board.
The Valuation Committee establishes prices of securities for which market quotations are not readily available based on such methodologies and measurements on a regular basis after considering information that is reasonably available and deemed relevant by the Valuation Committee. The Board shall oversee the Valuation Designee and review fair valuation materials on a prompt, quarterly and annual basis and approve proposed revisions to the Valuation Procedures.
Investments for which market quotations are not readily available are valued at fair value as determined in good faith pursuant to the Valuation Procedures. A market quotation is readily available only when that quotation is a quoted price (unadjusted) in active markets for identical investments that the Portfolio can access at the measurement date, provided that a quotation will not be readily available if it is not reliable. "Fair value" is defined as the price the Portfolio would reasonably expect to receive upon selling an asset or liability in an orderly transaction to an independent buyer in the principal or most advantageous market for the
Notes to Financial Statements (continued)
asset or liability. Fair value measurements are determined within a framework that establishes a three-tier hierarchy that maximizes the use of observable market data and minimizes the use of unobservable inputs to establish a classification of fair value measurements for disclosure purposes. "Inputs" refer broadly to the assumptions that market participants would use in pricing the asset or liability, including assumptions about risk, such as the risk inherent in a particular valuation technique used to measure fair value using a pricing model and/or the risk inherent in the inputs for the valuation technique. Inputs may be observable or unobservable. Observable inputs reflect the assumptions market participants would use in pricing the asset or liability based on market data obtained from sources independent of the Portfolio. Unobservable inputs reflect the Portfolio’s own assumptions about the assumptions market participants would use in pricing the asset or liability based on the information available. The inputs or methodology used for valuing assets or liabilities may not be an indication of the risks associated with investing in those assets or liabilities. The three-tier hierarchy of inputs is summarized below.
| • | Level 1—quoted prices (unadjusted) in active markets for an identical asset or liability |
| • | Level 2—other significant observable inputs (including quoted prices for a similar asset or liability in active markets, interest rates and yield curves, prepayment speeds, credit risk, etc.) |
| • | Level 3—significant unobservable inputs (including the Portfolio's own assumptions about the assumptions that market participants would use in measuring fair value of an asset or liability) |
The level of an asset or liability within the fair value hierarchy is based on the lowest level of an input, both individually and in the aggregate, that is significant to the fair value measurement. The aggregate value by input level of the Portfolio’s assets and liabilities as of December 31, 2023, is included at the end of the Portfolio of Investments.
The Portfolio may use third-party vendor evaluations, whose prices may be derived from one or more of the following standard inputs, among others:
| • Benchmark yields | • Reported trades |
| • Broker/dealer quotes | • Issuer spreads |
| • Two-sided markets | • Benchmark securities |
| • Bids/offers | • Reference data (corporate actions or material event notices) |
| • Industry and economic events | • Comparable bonds |
| • Monthly payment information | |
An asset or liability for which a market quotation is not readily available is valued by methods deemed reasonable in good faith by the Valuation Committee, following the Valuation Procedures to represent fair value. Under these procedures, the Valuation Designee generally uses a market-based approach which may use related or comparable assets or liabilities, recent transactions, market multiples, book values and other relevant information. The Valuation Designee may also use an
income-based valuation approach in which the anticipated future cash flows of the asset or liability are discounted to calculate fair value. Discounts may also be applied due to the nature and/or duration of any restrictions on the disposition of the asset or liability. Fair value represents a good faith approximation of the value of a security. Fair value determinations involve the consideration of a number of subjective factors, an analysis of applicable facts and circumstances and the exercise of judgment. As a result, it is possible that the fair value for a security determined in good faith in accordance with the Valuation Procedures may differ from valuations for the same security determined for other funds using their own valuation procedures. Although the Valuation Procedures are designed to value a security at the price the Portfolio may reasonably expect to receive upon the security's sale in an orderly transaction, there can be no assurance that any fair value determination thereunder would, in fact, approximate the amount that the Portfolio would actually realize upon the sale of the security or the price at which the security would trade if a reliable market price were readily available. During the year ended December 31, 2023, there were no material changes to the fair value methodologies.
Securities which may be valued in this manner include, but are not limited to: (i) a security for which trading has been halted or suspended or otherwise does not have a readily available market quotation on a given day; (ii) a debt security that has recently gone into default and for which there is not a current market quotation; (iii) a security of an issuer that has entered into a restructuring; (iv) a security that has been delisted from a national exchange; (v) a security subject to trading collars for which no or limited trading takes place; and (vi) a security whose principal market has been temporarily closed at a time when, under normal conditions, it would be open. Securities valued in this manner are generally categorized as Level 2 or 3 in the hierarchy.
Certain securities held by the Portfolio may principally trade in foreign markets. Events may occur between the time the foreign markets close and the time at which the Portfolio's NAVs are calculated. These events may include, but are not limited to, situations relating to a single issuer in a market sector, significant fluctuations in U.S. or foreign markets, natural disasters, armed conflicts, governmental actions or other developments not tied directly to the securities markets. Should the Valuation Designee conclude that such events may have affected the accuracy of the last price of such securities reported on the local foreign market, the Valuation Designee may, pursuant to the Valuation Procedures, adjust the value of the local price to reflect the estimated impact on the price of such securities as a result of such events. In this instance, securities are generally categorized as Level 3 in the hierarchy. Additionally, certain foreign equity securities are also fair valued whenever the movement of a particular index exceeds certain thresholds. In such cases, the securities are fair valued by applying factors provided by a third-party vendor in accordance with the Valuation Procedures and are generally categorized as Level 2 in the hierarchy.
If the principal market of certain foreign equity securities is closed in observance of a local foreign holiday, these securities are valued using the last closing price of regular trading on the relevant exchange and fair
| 36 | MainStay VP Income Builder Portfolio |
valued by applying factors provided by a third-party vendor in accordance with the Valuation Procedures. These securities are generally categorized as Level 2 in the hierarchy.
Equity securities, rights and warrants, if applicable, are valued at the last quoted sales prices as of the close of regular trading on the relevant exchange on each valuation date. Securities that are not traded on the valuation date are valued at the mean of the last quoted bid and ask prices. Prices are normally taken from the principal market in which each security trades. These securities are generally categorized as Level 1 in the hierarchy.
Investments in mutual funds, including money market funds, are valued at their respective NAVs at the close of business each day on the valuation date. These securities are generally categorized as Level 1 in the hierarchy.
Futures contracts are valued at the last posted settlement price on the market where such futures are primarily traded. These securities are generally categorized as Level 1 in the hierarchy.
Debt securities (other than convertible and municipal bonds) are valued at the evaluated bid prices (evaluated mean prices in the case of convertible and municipal bonds) supplied by a pricing agent or broker selected by the Valuation Designee, in consultation with the Subadvisors. The evaluations are market-based measurements processed through a pricing application and represents the pricing agent’s good faith determination as to what a holder may receive in an orderly transaction under market conditions. The rules-based logic utilizes valuation techniques that reflect participants’ assumptions and vary by asset class and per methodology, maximizing the use of relevant observable data including quoted prices for similar assets, benchmark yield curves and market corroborated inputs. The evaluated bid or mean prices are deemed by the Valuation Designee, in consultation with the Subadvisors, to be representative of market values at the regular close of trading of the Exchange on each valuation date. Debt securities purchased on a delayed delivery basis are marked to market daily until settlement at the forward settlement date. Debt securities, including corporate bonds, U.S. government and federal agency bonds, municipal bonds, foreign bonds, convertible bonds, asset-backed securities and mortgage-backed securities are generally categorized as Level 2 in the hierarchy.
Foreign currency forward contracts are valued at their fair market values measured on the basis of the mean between the last current bid and ask prices based on dealer or exchange quotations and are generally categorized as Level 2 in the hierarchy.
Loan assignments, participations and commitments are valued at the average of bid quotations obtained from the engaged independent pricing service and are generally categorized as Level 2 in the hierarchy. Certain loan assignments, participations and commitments may be valued by utilizing significant unobservable inputs obtained from the pricing service and are generally categorized as Level 3 in the hierarchy.
Temporary cash investments acquired in excess of 60 days to maturity at the time of purchase are valued using the latest bid prices or using
valuations based on a matrix system (which considers such factors as security prices, yields, maturities and ratings), both as furnished by independent pricing services. Temporary cash investments that mature in 60 days or less at the time of purchase ("Short-Term Investments") are valued using the amortized cost method of valuation, unless the use of such method would be inappropriate. The amortized cost method involves valuing a security at its cost on the date of purchase and thereafter assuming a constant amortization to maturity of the difference between such cost and the value on maturity date. Amortized cost approximates the current fair value of a security. Securities valued using the amortized cost method are not valued using quoted prices in an active market and are generally categorized as Level 2 in the hierarchy.
The information above is not intended to reflect an exhaustive list of the methodologies that may be used to value portfolio investments. The Valuation Procedures permit the use of a variety of valuation methodologies in connection with valuing portfolio investments. The methodology used for a specific type of investment may vary based on the market data available or other considerations. The methodologies summarized above may not represent the specific means by which portfolio investments are valued on any particular business day.
A portfolio investment may be classified as an illiquid investment under the Portfolio's written liquidity risk management program and related procedures (“Liquidity Program”). Illiquidity of an investment might prevent the sale of such investment at a time when the Manager or the Subadvisors might wish to sell, and these investments could have the effect of decreasing the overall level of the Portfolio's liquidity. Further, the lack of an established secondary market may make it more difficult to value illiquid investments, requiring the Portfolio to rely on judgments that may be somewhat subjective in measuring value, which could vary materially from the amount that the Portfolio could realize upon disposition. Difficulty in selling illiquid investments may result in a loss or may be costly to the Portfolio. An illiquid investment is any investment that the Manager or Subadvisors reasonably expects cannot be sold or disposed of in current market conditions in seven calendar days or less without the sale or disposition significantly changing the market value of the investment. The liquidity classification of each investment will be made using information obtained after reasonable inquiry and taking into account, among other things, relevant market, trading and investment-specific considerations in accordance with the Liquidity Program. Illiquid investments are often fair valued in accordance with the Portfolio's procedures described above. The liquidity of the Portfolio's investments was determined as of December 31, 2023, and can change at any time.
(B) Income Taxes. The Portfolio's policy is to comply with the requirements of the Internal Revenue Code of 1986, as amended (the “Internal Revenue Code”), applicable to regulated investment companies and to distribute all of its taxable income to the shareholders of the Portfolio within the allowable time limits.
The Manager evaluates the Portfolio’s tax positions to determine if the tax positions taken meet the minimum recognition threshold in connection
Notes to Financial Statements (continued)
with accounting for uncertainties in income tax positions taken or expected to be taken for the purposes of measuring and recognizing tax liabilities in the financial statements. Recognition of tax benefits of an uncertain tax position is permitted only to the extent the position is “more likely than not” to be sustained assuming examination by taxing authorities. The Manager analyzed the Portfolio's tax positions taken on federal, state and local income tax returns for all open tax years (for up to three tax years) and has concluded that no provisions for federal, state and local income tax are required in the Portfolio's financial statements. The Portfolio's federal, state and local income tax and federal excise tax returns for tax years for which the applicable statutes of limitations have not expired are subject to examination by the Internal Revenue Service and state and local departments of revenue.
(C) Foreign Taxes. The Portfolio may be subject to foreign taxes on income and other transaction-based taxes imposed by certain countries in which it invests. A portion of the taxes on gains on investments or currency purchases/repatriation may be reclaimable. The Portfolio will accrue such taxes and reclaims as applicable, based upon its current interpretation of tax rules and regulations that exist in the markets in which it invests.
The Portfolio may be subject to taxation on realized capital gains, repatriation proceeds and other transaction-based taxes imposed by certain countries in which it invests. The Portfolio will accrue such taxes as applicable based upon its current interpretation of tax rules and regulations that exist in the market in which it invests. Capital gains taxes relating to positions still held are reflected as a liability in the Statement of Assets and Liabilities, as well as an adjustment to the Portfolio's net unrealized appreciation (depreciation). Taxes related to capital gains realized, if any, are reflected as part of net realized gain (loss) in the Statement of Operations. Changes in tax liabilities related to capital gains taxes on unrealized investment gains, if any, are reflected as part of the change in net unrealized appreciation (depreciation) on investments in the Statement of Operations. Transaction-based charges are generally assessed as a percentage of the transaction amount.
(D) Dividends and Distributions to Shareholders. Dividends and distributions are recorded on the ex-dividend date. The Portfolio intends to declare and pay dividends from net investment income, if any, at least quarterly and distributions from net realized capital and currency gains, if any, at least annually. All dividends and distributions are reinvested at NAV in the same class of shares of the Portfolio. Dividends and distributions to shareholders are determined in accordance with federal income tax regulations and may differ from determinations using GAAP.
(E) Security Transactions and Investment Income. The Portfolio records security transactions on the trade date. Realized gains and losses on security transactions are determined using the identified cost method. Dividend income is recognized on the ex-dividend date, net of any foreign tax withheld at the source, and interest income is accrued as earned using the effective interest rate method and includes any realized gains and losses from repayments of principal on mortgage-backed securities. Distributions received from real estate investment trusts may be classified
as dividends, capital gains and/or return of capital. Discounts and premiums on securities purchased for the Portfolio are accreted and amortized, respectively, on the effective interest rate method.
Investment income and realized and unrealized gains and losses on investments of the Portfolio are allocated pro rata to the separate classes of shares based upon their relative net assets on the date the income is earned or realized and unrealized gains and losses are incurred.
The Portfolio may place a debt security on non-accrual status and reduce related interest income by ceasing current accruals and writing off all or a portion of any interest receivables when the collection of all or a portion of such interest has become doubtful. A debt security is removed from non-accrual status when the issuer resumes interest payments or when collectability of interest is reasonably assured.
(F) Expenses. Expenses of the Fund are allocated to the individual Portfolios in proportion to the net assets of the respective Portfolios when the expenses are incurred, except where direct allocations of expenses can be made. Expenses (other than fees incurred under the distribution and service plans, further discussed in Note 3(B), which are charged directly to the Service Class shares) are allocated to separate classes of shares pro rata based upon their relative net assets on the date the expenses are incurred. The expenses borne by the Portfolio, including those of related parties to the Portfolio, are shown in the Statement of Operations.
Additionally, the Portfolio may invest in mutual funds, which are subject to management fees and other fees that may cause the costs of investing in mutual funds to be greater than the costs of owning the underlying securities directly. These indirect expenses of mutual funds are not included in the amounts shown as expenses in the Statement of Operations or in the expense ratios included in the Financial Highlights.
(G) Use of Estimates. In preparing financial statements in conformity with GAAP, the Manager makes estimates and assumptions that affect the reported amounts and disclosures in the financial statements. Actual results could differ from those estimates and assumptions.
(H) Futures Contracts. A futures contract is an agreement to purchase or sell a specified quantity of an underlying instrument at a specified future date and price, or to make or receive a cash payment based on the value of a financial instrument (e.g., foreign currency, interest rate, security or securities index). The Portfolio is subject to risks such as market price risk, leverage risk, liquidity risk, counterparty risk, operational risk, legal risk and/or interest rate risk in the normal course of investing in these contracts. Upon entering into a futures contract, the Portfolio is required to pledge to the broker or futures commission merchant an amount of cash and/or U.S. government securities equal to a certain percentage of the collateral amount, known as the “initial margin.” During the period the futures contract is open, changes in the value of the contract are recognized as unrealized appreciation or depreciation by marking to market such contract on a daily basis to reflect the market value of the contract at the end of each day’s trading. The Portfolio agrees to receive from or pay to the broker or futures
| 38 | MainStay VP Income Builder Portfolio |
commission merchant an amount of cash equal to the daily fluctuation in the value of the contract. Such receipts or payments are known as “variation margin.” When the futures contract is closed, the Portfolio records a realized gain or loss equal to the difference between the proceeds from (or cost of) the closing transaction and the Portfolio's basis in the contract.
The use of futures contracts involves, to varying degrees, elements of market risk in excess of the amount recognized in the Statement of Assets and Liabilities. The contract or notional amounts and variation margin reflect the extent of the Portfolio's involvement in open futures positions. There are several risks associated with the use of futures contracts as hedging techniques. There can be no assurance that a liquid market will exist at the time when the Portfolio seeks to close out a futures contract. If no liquid market exists, the Portfolio would remain obligated to meet margin requirements until the position is closed. Futures contracts may involve a small initial investment relative to the risk assumed, which could result in losses greater than if the Portfolio did not invest in futures contracts. Futures contracts may be more volatile than direct investments in the instrument underlying the futures and may not correlate to the underlying instrument, causing a given hedge not to achieve its objectives. The Portfolio's activities in futures contracts have minimal counterparty risk as they are conducted through regulated exchanges that guarantee the futures against default by the counterparty. In the event of a bankruptcy or insolvency of a futures commission merchant that holds margin on behalf of the Portfolio, the Portfolio may not be entitled to the return of the entire margin owed to the Portfolio, potentially resulting in a loss. The Portfolio may invest in futures contracts to seek enhanced returns or to reduce the risk of loss by hedging certain of its holdings. The Portfolio's investment in futures contracts and other derivatives may increase the volatility of the Portfolio's NAVs and may result in a loss to the Portfolio.
(I) Loan Assignments, Participations and Commitments. The Portfolio may invest in loan assignments and participations ("loans"). Commitments are agreements to make money available to a borrower in a specified amount, at a specified rate and within a specified time. The Portfolio records an investment when the borrower withdraws money on a commitment or when a funded loan is purchased (trade date) and records interest as earned. These loans pay interest at rates that are periodically reset by reference to a base lending rate plus a spread. These base lending rates are generally the prime rate offered by a designated U.S. bank, the Secured Overnight Financing Rate ("SOFR") or an alternative reference rate.
The loans in which the Portfolio may invest are generally readily marketable, but may be subject to some restrictions on resale. For example, the Portfolio may be contractually obligated to receive approval from the agent bank and/or borrower prior to the sale of these investments. If the Portfolio purchases an assignment from a lender, the Portfolio will generally have direct contractual rights against the borrower in favor of the lender. If the Portfolio purchases a participation interest either from a lender or a participant, the Portfolio typically will have
established a direct contractual relationship with the seller of the participation interest, but not with the borrower. Consequently, the Portfolio is subject to the credit risk of the lender or participant who sold the participation interest to the Portfolio, in addition to the usual credit risk of the borrower. In the event that the borrower, selling participant or intermediate participants become insolvent or enter into bankruptcy, the Portfolio may incur certain costs and delays in realizing payment, or may suffer a loss of principal and/or interest.
Unfunded commitments represent the remaining obligation of the Portfolio to the borrower. At any point in time, up to the maturity date of the issue, the borrower may demand the unfunded portion. Unfunded amounts, if any, are marked to market and any unrealized gains or losses are recorded in the Statement of Assets and Liabilities.
(J) Foreign Currency Forward Contracts. The Portfolio may enter into foreign currency forward contracts, which are agreements to buy or sell foreign currencies on a specified future date at a specified rate. The Portfolio is subject to foreign currency exchange rate risk in the normal course of investing in these transactions. During the period the forward contract is open, changes in the value of the contract are recognized as unrealized appreciation or depreciation by marking to market such contract on a daily basis to reflect the market value of the contract at the end of each day’s trading. Cash movement occurs on the settlement date. When the forward contract is closed, the Portfolio records a realized gain or loss equal to the difference between the proceeds from (or cost of) the closing transaction and the Portfolio's basis in the contract. The Portfolio may purchase and sell foreign currency forward contracts for purposes of seeking to enhance portfolio returns and manage portfolio risk more efficiently. Foreign currency forward contracts may also be used to gain exposure to a particular currency or to hedge against the risk of loss due to changing currency exchange rates. Foreign currency forward contracts to purchase or sell a foreign currency may also be used in anticipation of future purchases or sales of securities denominated in foreign currency, even if the specific investments have not yet been selected.
The use of foreign currency forward contracts involves, to varying degrees, elements of risk in excess of the amount recognized in the Statement of Assets and Liabilities, including counterparty risk, market risk, leverage risk, operational risk, legal risk and liquidity risk. Counterparty risk is heightened for these instruments because foreign currency forward contracts are not exchange-traded and therefore no clearinghouse or exchange stands ready to meet the obligations under such contracts. Thus, the Portfolio faces the risk that its counterparties under such contracts may not perform their obligations. Market risk is the risk that the value of a foreign currency forward contract will depreciate due to unfavorable changes in exchange rates. Liquidity risk arises because the secondary market for foreign currency forward contracts may have less liquidity relative to markets for other securities and financial instruments. Liquidity risk also can arise when forward currency contracts create margin or settlement payment obligations for the Portfolio. Leverage risk is the risk that a foreign currency forward contract can magnify the Portfolio's gains and losses. Operational risk refers to
Notes to Financial Statements (continued)
risk related to potential operational issues (including documentation issues, settlement issues, systems failures, inadequate controls and human error), and legal risk refers to insufficient documentation, insufficient capacity or authority of the counterparty, or legality or enforceability of a foreign currency forward contract. Risks also arise from the possible movements in the foreign exchange rates underlying these instruments. While the Portfolio may enter into forward contracts to reduce currency exchange risks, changes in currency exchange rates may result in poorer overall performance for the Portfolio than if it had not engaged in such transactions. Exchange rate movements can be large, depending on the currency, and can last for extended periods of time, affecting the value of the Portfolio's assets. Moreover, there may be an imperfect correlation between the Portfolio's holdings of securities denominated in a particular currency and forward contracts entered into by the Portfolio. Such imperfect correlation may prevent the Portfolio from achieving the intended hedge or expose the Portfolio to the risk of currency exchange loss. The unrealized appreciation (depreciation) on forward contracts also reflects the Portfolio's exposure at the valuation date to credit loss in the event of a counterparty’s failure to perform its obligations.
(K) Foreign Currency Transactions. The Portfolio's books and records are maintained in U.S. dollars. Prices of securities denominated in foreign currency amounts are translated into U.S. dollars at the mean between the buying and selling rates last quoted by any major U.S. bank at the following dates:
(i) market value of investment securities, other assets and liabilities— at the valuation date; and
(ii) purchases and sales of investment securities, income and expenses—at the date of such transactions.
The assets and liabilities that are denominated in foreign currency amounts are presented at the exchange rates and market values at the close of the period. The realized and unrealized changes in net assets arising from fluctuations in exchange rates and market prices of securities are not separately presented.
Net realized gain (loss) on foreign currency transactions represents net currency gains or losses realized as a result of differences between the amounts of securities sale proceeds or purchase cost, dividends, interest and withholding taxes as recorded on the Portfolio's books, and the U.S. dollar equivalent amount actually received or paid. Net currency gains or losses from valuing such foreign currency denominated assets and liabilities, other than investments at valuation date exchange rates, are reflected in unrealized foreign exchange gains or losses.
(L) Securities Lending. In order to realize additional income, the Portfolio may engage in securities lending, subject to the limitations set forth in the 1940 Act and relevant guidance by the staff of the Securities and Exchange Commission (“SEC”). If the Portfolio engages in securities lending, the Portfolio will lend through its custodian, JPMorgan Chase Bank, N.A., ("JPMorgan"), acting as securities lending agent on behalf of the Portfolio. Under the current arrangement, JPMorgan will manage the
Portfolio's collateral in accordance with the securities lending agency agreement between the Portfolio and JPMorgan, and indemnify the Portfolio against counterparty risk. The loans will be collateralized by cash (which may be invested in a money market fund) and/or non-cash collateral (which may include U.S. Treasury securities and/or U.S. government agency securities issued or guaranteed by the United States government or its agencies or instrumentalities) at least equal at all times to the market value of the securities loaned. Non-cash collateral held at year end is segregated and cannot be transferred by the Portfolio. The Portfolio bears the risk of delay in recovery of, or loss of rights in, the securities loaned. The Portfolio may also record a realized gain or loss on securities deemed sold due to a borrower’s inability to return securities on loan. The Portfolio bears the risk of any loss on investment of cash collateral. The Portfolio will receive compensation for lending its securities in the form of fees or it will retain a portion of interest earned on the investment of any cash collateral. The Portfolio will also continue to receive interest and dividends on the securities loaned and any gain or loss in the market price of the securities loaned that may occur during the term of the loan will be for the account of the Portfolio. Income earned from securities lending activities, if any, is reflected in the Statement of Operations.
(M) Debt Securities Risk. The ability of issuers of debt securities held by the Portfolio to meet their obligations may be affected by, among other things, economic or political developments in a specific country, industry or region. Debt securities are also subject to the risks associated with changes in interest rates.
The Portfolio may invest in high-yield debt securities (sometimes called “junk bonds”), which are generally considered speculative because they present a greater risk of loss, including default, than higher quality debt securities. These securities pay investors a premium—a higher interest rate or yield than investment grade debt securities—because of the increased risk of loss. These securities can also be subject to greater price volatility. In times of unusual or adverse market, economic or political conditions, these securities may experience higher than normal default rates.
The Portfolio may invest in foreign securities, which carry certain risks that are in addition to the usual risks inherent in domestic securities. Foreign regulatory regimes and securities markets can have less stringent investor protections and disclosure standards and less liquid trading markets than U.S. regulatory regimes and securities markets, and can experience political, social and economic developments that may affect the value of investments in foreign securities. These risks include those resulting from currency fluctuations, future adverse political or economic developments and possible imposition of currency exchange blockages or other foreign governmental laws or restrictions. Economic sanctions and other similar governmental actions or developments could, among other things, effectively restrict or eliminate the Portfolio’s ability to purchase or sell certain foreign securities or groups of foreign securities, and thus may make the Portfolio’s investments in such securities less liquid or more difficult to value. These risks are likely to be greater in emerging
| 40 | MainStay VP Income Builder Portfolio |
markets than in developed markets. The ability of issuers of securities held by the Portfolio to meet their obligations may be affected by, among other things, economic or political developments in a specific country, industry or region.
The Portfolio may invest in loans which are usually rated below investment grade and are generally considered speculative because they present a greater risk of loss, including default, than higher rated debt securities. These investments pay investors a higher interest rate than investment grade debt securities because of the increased risk of loss. Although certain loans are collateralized, there is no guarantee that the value of the collateral will be sufficient to repay the loan. In a recession or serious credit event, the value of these investments could decline significantly. As a result, the Portfolio’s NAVs could go down and you could lose money.
In addition, loans generally are subject to extended settlement periods that may be longer than seven days. As a result, the Portfolio may be adversely affected by selling other investments at an unfavorable time and/or under unfavorable conditions or engaging in borrowing transactions, such as borrowing against its credit facility, to raise cash to meet redemption obligations or pursue other investment opportunities.
In certain circumstances, loans may not be deemed to be securities. As a result, the Portfolio may not have the protection of anti-fraud provisions of the federal securities laws. In such cases, the Portfolio generally must rely on the contractual provisions in the loan agreement and common-law fraud protections under applicable state law.
(N) Counterparty Credit Risk. In order to better define its contractual rights and to secure rights that will help the Portfolio mitigate its counterparty risk, the Portfolio may enter into an International Swaps and Derivatives Association, Inc. Master Agreement (“ISDA Master Agreement”) or similar agreement with its counterparties. An ISDA Master Agreement is a bilateral agreement between the Portfolio and a counterparty that governs certain OTC derivatives and typically contains collateral posting terms and netting provisions. Under an ISDA Master Agreement, the Portfolio may, under certain circumstances, offset with the counterparty certain derivative financial instruments’ payables and/ or receivables with collateral held and/or posted and create one single net payment. The provisions of the ISDA Master Agreement typically permit a single net payment in the event of default including the bankruptcy or insolvency of the counterparty. Bankruptcy or insolvency laws of a particular jurisdiction may restrict or prohibit the right of offset in bankruptcy, insolvency or other events. In addition, certain ISDA Master Agreements may contain provisions for early termination of OTC derivative transactions in the event the net assets of the Portfolio decline below specific levels or if the Portfolio fails to meet the terms of its ISDA Master Agreements. The result would cause the Portfolio to accelerate payment of any net liability owed to the counterparty.
For financial reporting purposes, the Portfolio does not offset derivative assets and derivative liabilities that are subject to netting arrangements, if any, in the Statement of Assets and Liabilities.
(O) Indemnifications. Under the Fund’s organizational documents, its officers and trustees are indemnified against certain liabilities that may arise out of performance of their duties to the Fund. Additionally, in the normal course of business, the Portfolio enters into contracts with third-party service providers that contain a variety of representations and warranties and that may provide general indemnifications. The Portfolio's maximum exposure under these arrangements is unknown, as this would involve future claims that may be made against the Portfolio that have not yet occurred. The Manager believes that the risk of loss in connection with these potential indemnification obligations is remote. However, there can be no assurance that material liabilities related to such obligations will not arise in the future, which could adversely impact the Portfolio.
(P) Quantitative Disclosure of Derivative Holdings. The following tables show additional disclosures related to the Portfolio's derivative and hedging activities, including how such activities are accounted for and their effect on the Portfolio's financial positions, performance and cash flows.
The Portfolio entered into Treasury futures contracts in order to hedge against anticipated changes in interest rates that might otherwise have an adverse effect upon the value of the Portfolio’s securities. The Portfolio also entered into domestic and foreign equity index futures contracts to increase the equity sensitivity to the Portfolio.
The Portfolio entered into foreign currency forward contracts to gain exposure to a particular currency or to hedge against the risk of loss due to changing currency exchange rates. These derivatives are not accounted for as hedging instruments.
Fair value of derivative instruments as of December 31, 2023:
| Asset Derivatives | Foreign
Exchange
Contracts
Risk | Equity
Contracts
Risk | Interest
Rate
Contracts
Risk | Total |
| Futures Contracts - Net Assets—Net unrealized appreciation on futures contracts (a) | $ — | $1,674,972 | $1,965,134 | $3,640,106 |
| Forward Contracts - Unrealized appreciation on foreign currency forward contracts | 1,839,131 | — | — | 1,839,131 |
| Total Fair Value | $1,839,131 | $1,674,972 | $1,965,134 | $5,479,237 |
| (a) | Includes cumulative appreciation (depreciation) of futures contracts as reported in the Portfolio of Investments. Only current day’s variation margin is reported within the Statement of Assets and Liabilities. |
Notes to Financial Statements (continued)
| Liability Derivatives | Foreign
Exchange
Contracts
Risk | Equity
Contracts
Risk | Interest
Rate
Contracts
Risk | Total |
| Futures Contracts - Net Assets—Net unrealized depreciation on futures contracts (a) | $ — | $(552,417) | $(10,110) | $(562,527) |
| Forward Contracts - Unrealized depreciation on foreign currency forward contracts | (107,065) | — | — | (107,065) |
| Total Fair Value | $(107,065) | $(552,417) | $(10,110) | $(669,592) |
| (a) | Includes cumulative appreciation (depreciation) of futures contracts as reported in the Portfolio of Investments. Only current day’s variation margin is reported within the Statement of Assets and Liabilities. |
The effect of derivative instruments on the Statement of Operations for the year ended December 31, 2023:
| Net Realized Gain (Loss) from: | Foreign
Exchange
Contracts
Risk | Equity
Contracts
Risk | Interest
Rate
Contracts
Risk | Total |
| Futures Transactions | $ — | $1,132,159 | $(2,540,608) | $(1,408,449) |
| Forward Transactions | (3,414,386) | — | — | (3,414,386) |
| Total Net Realized Gain (Loss) | $(3,414,386) | $1,132,159 | $(2,540,608) | $(4,822,835) |
| Net Change in Unrealized Appreciation (Depreciation) | Foreign
Exchange
Contracts
Risk | Equity
Contracts
Risk | Interest
Rate
Contracts
Risk | Total |
| Futures Contracts | $ — | $1,234,793 | $2,168,172 | $3,402,965 |
| Forward Contracts | 1,055,996 | — | — | 1,055,996 |
| Total Net Change in Unrealized Appreciation (Depreciation) | $1,055,996 | $1,234,793 | $2,168,172 | $4,458,961 |
| Average Notional Amount | Total |
| Futures Contracts Long | $139,484,017 |
| Futures Contracts Short | $ (31,535,608) |
| Forward Contracts Long | $ 31,061,188 |
| Forward Contracts Short | $ (9,510,540) |
Note 3–Fees and Related Party Transactions
(A) Manager and Subadvisors. New York Life Investments, a registered investment adviser and an indirect, wholly-owned subsidiary of New York Life, serves as the Portfolio's Manager, pursuant to an Amended and Restated Management Agreement ("Management Agreement"). The Manager provides offices, conducts clerical, recordkeeping and bookkeeping services and keeps most of the financial and accounting records required to be maintained by the Portfolio. Except for the portion of salaries and expenses that are the responsibility of the Portfolio, the Manager pays the salaries and expenses of all personnel affiliated with the Portfolio and certain operational expenses of the Portfolio. The Portfolio reimburses New York Life Investments in an amount equal to the portion of the compensation of the Chief Compliance Officer attributable to the Portfolio. Pursuant to the terms of an Amended and Restated Subadvisory Agreement with New York Life Investments, MacKay Shields LLC ("MacKay Shields" or "Subadvisor"), a registered investment adviser and an indirect, wholly-owned subsidiary of New York Life, serves as a Subadvisor to the Portfolio and is responsible for the day-to-day portfolio management of the fixed-income portion of the Portfolio. Pursuant to the terms of an Amended and Restated Subadvisory Agreement with New York Life Investments, Epoch Investment Partners, Inc. (“Epoch” or “Subadvisor” and, together with MacKay Shields, the “Subadvisors”), a registered investment adviser, also serves as a Subadvisor to the Portfolio and is responsible for the day-to-day portfolio management of the equity portion of the Portfolio. Asset allocation decisions for the Portfolio are made by a committee chaired by New York Life Investments in collaboration with MacKay Shields. New York Life Investments pays for the services of the Subadvisors.
Pursuant to the Management Agreement, the Fund pays the Manager, on behalf of the Portfolio, a monthly fee for the services performed and the facilities furnished at an annual rate of the Portfolio's average daily net assets as follows: 0.57% up to $1 billion; and 0.55% in excess of $1 billion. During the year ended December 31, 2023, the effective management fee rate was 0.57% of the Portfolio's average daily net assets.
During the year ended December 31, 2023, New York Life Investments earned fees from the Portfolio in the amount of $2,947,854 and paid MacKay Shields and Epoch fees in the amount of $659,074 and $814,803, respectively.
JPMorgan provides sub-administration and sub-accounting services to the Portfolio pursuant to an agreement with New York Life Investments. These services include calculating the daily NAVs of the Portfolio, maintaining the general ledger and sub-ledger accounts for the calculation of the Portfolio's NAVs, and assisting New York Life
| 42 | MainStay VP Income Builder Portfolio |
Investments in conducting various aspects of the Portfolio's administrative operations. For providing these services to the Portfolio, JPMorgan is compensated by New York Life Investments.
Pursuant to an agreement between the Fund and New York Life Investments, New York Life Investments is responsible for providing or procuring certain regulatory reporting services for the Portfolio. The Portfolio will reimburse New York Life Investments for the actual costs incurred by New York Life Investments in connection with providing or procuring these services for the Portfolio.
(B) Distribution and Service Fees. The Fund, on behalf of the Portfolio, has entered into a distribution agreement with NYLIFE Distributors LLC (the “Distributor”), an affiliate of New York Life Investments. The Portfolio has adopted a distribution plan (the “Plan”) in accordance with the provisions of Rule 12b-1 under the 1940 Act. Under the Plan, the Distributor has agreed to provide, through its affiliates or independent third parties, various distribution-related, shareholder and administrative support services to the Service Class shareholders. For its services, the Distributor is entitled to a combined distribution and service fee accrued daily and paid monthly at an annual rate of 0.25% of the average daily net assets attributable to the Service Class shares of the Portfolio.
Note 4-Federal Income Tax
As of December 31, 2023, the cost and unrealized appreciation (depreciation) of the Portfolio’s investment portfolio, including applicable derivative contracts and other financial instruments, as determined on a federal income tax basis, were as follows:
| | Federal Tax
Cost | Gross
Unrealized
Appreciation | Gross
Unrealized
(Depreciation) | Net
Unrealized
Appreciation/
(Depreciation) |
| Investments in Securities | $489,557,629 | $44,613,917 | $(22,846,284) | $21,767,633 |
As of December 31, 2023, the components of accumulated gain (loss) on a tax basis were as follows:
Ordinary
Income | Accumulated
Capital
and Other
Gain (Loss) | Other
Temporary
Differences | Unrealized
Appreciation
(Depreciation) | Total
Accumulated
Gain (Loss) |
| $— | $(37,541,956) | $59,406 | $20,556,619 | $(16,925,931) |
The difference between book-basis and tax-basis unrealized appreciation (depreciation) is primarily due to wash sales, mark to market of forwards and partnership adjustments.
| | Total
Distributable
Earnings (Loss) | Additional
Paid-In
Capital |
| | $(469,268) | $469,268 |
The reclassifications for the Portfolio are primarily due to return of capital.
As of December 31, 2023, for federal income tax purposes, capital loss carryforwards of $37,505,611, as shown in the table below, were available to the extent provided by the regulations to offset future realized gains of the Portfolio. Accordingly, no capital gains distributions are expected to be paid to shareholders until net gains have been realized in excess of such amounts.
Capital Loss
Available Through | Short-Term
Capital Loss
Amounts (000’s) | Long-Term
Capital Loss
Amounts (000’s) |
| Unlimited | $21,194 | $16,312 |
During the years ended December 31, 2023 and December 31, 2022, the tax character of distributions paid as reflected in the Statements of Changes in Net Assets was as follows:
| | 2023 | 2022 |
| Distributions paid from: | | |
| Ordinary Income | $13,363,325 | $16,814,864 |
| Long-Term Capital Gains | — | 46,631,898 |
| Return of Capital | 2,840,367 | 6,502,112 |
| Total | $16,203,692 | $69,948,874 |
Note 5–Custodian
JPMorgan is the custodian of cash and securities held by the Portfolio. Custodial fees are charged to the Portfolio based on the Portfolio's net assets and/or the market value of securities held by the Portfolio and the number of certain transactions incurred by the Portfolio.
Note 6–Line of Credit
The Portfolio and certain other funds managed by New York Life Investments maintain a line of credit with a syndicate of banks in order to secure a source of funds for temporary purposes to meet unanticipated or excessive redemption requests.
Effective July 25, 2023, under the credit agreement (the “Credit Agreement”), the aggregate commitment amount is $600,000,000 with an additional uncommitted amount of $100,000,000. The commitment fee is an annual rate of 0.15% of the average commitment amount payable quarterly, regardless of usage, to JPMorgan, who serves as the agent to the syndicate. The commitment fee is allocated among the Portfolio and certain other funds managed by New York Life Investments based upon their respective net assets and other factors. Interest on any revolving credit loan is charged based upon the Federal Funds Rate, Daily SOFR + 0.10%, or the Overnight Bank Funding Rate, whichever is higher. The Credit Agreement expires on July 23, 2024, although the Portfolio, certain other funds managed by New York Life Investments and the syndicate of banks may renew the Credit Agreement for an additional year on the same or different terms or enter into a credit agreement with a different syndicate of banks. Prior to July 25, 2023, the aggregate commitment amount and the commitment fee were the same as those under the current Credit Agreement. During the year ended December
Notes to Financial Statements (continued)
31, 2023, there were no borrowings made or outstanding with respect to the Portfolio under the Credit Agreement.
Note 7–Interfund Lending Program
Pursuant to an exemptive order issued by the SEC, the Portfolio, along with certain other funds managed by New York Life Investments, may participate in an interfund lending program. The interfund lending program provides an alternative credit facility that permits the Portfolio and certain other funds managed by New York Life Investments to lend or borrow money for temporary purposes directly to or from one another, subject to the conditions of the exemptive order. During the year ended December 31, 2023, there were no interfund loans made or outstanding with respect to the Portfolio.
Note 8–Purchases and Sales of Securities (in 000’s)
During the year ended December 31, 2023, purchases and sales of U.S. government securities were $84,131 and $97,504, respectively. Purchases and sales of securities, other than U.S. government securities and short-term securities, were $197,248 and $243,780, respectively.
Note 9–Capital Share Transactions
Transactions in capital shares for the years ended December 31, 2023 and December 31, 2022, were as follows:
| Initial Class | Shares | Amount |
| Year ended December 31, 2023: | | |
| Shares sold | 161,726 | $ 2,247,369 |
| Shares issued to shareholders in reinvestment of distributions | 337,238 | 4,712,619 |
| Shares redeemed | (2,151,511) | (30,087,211) |
| Net increase (decrease) | (1,652,547) | $(23,127,223) |
| Year ended December 31, 2022: | | |
| Shares sold | 219,018 | $ 3,428,090 |
| Shares issued to shareholders in reinvestment of distributions | 1,559,961 | 20,418,326 |
| Shares redeemed | (1,110,037) | (17,170,397) |
| Net increase (decrease) | 668,942 | $ 6,676,019 |
| |
| Service Class | Shares | Amount |
| Year ended December 31, 2023: | | |
| Shares sold | 2,133,800 | $ 29,413,465 |
| Shares issued to shareholders in reinvestment of distributions | 831,184 | 11,491,073 |
| Shares redeemed | (5,418,948) | (74,711,750) |
| Net increase (decrease) | (2,453,964) | $(33,807,212) |
| Year ended December 31, 2022: | | |
| Shares sold | 2,643,387 | $ 41,387,437 |
| Shares issued to shareholders in reinvestment of distributions | 3,830,832 | 49,530,548 |
| Shares redeemed | (5,696,211) | (88,491,316) |
| Net increase (decrease) | 778,008 | $ 2,426,669 |
Note 10–Other Matters
As of the date of this report, the Portfolio faces a heightened level of risk associated with current uncertainty, volatility and state of economies, financial markets, rising interest rates, and labor and health conditions around the world. Events such as war, acts of terrorism, recessions, rapid inflation, the imposition of international sanctions, earthquakes, hurricanes, epidemics and pandemics and other unforeseen natural or human disasters may have broad adverse social, political and economic effects on the global economy, which could negatively impact the value of the Portfolio's investments. Developments that disrupt global economies and financial markets may magnify factors that affect the Portfolio's performance.
Note 11–Subsequent Events
In connection with the preparation of the financial statements of the Portfolio as of and for the year ended December 31, 2023, events and transactions subsequent to December 31, 2023, through the date the financial statements were issued, have been evaluated by the Manager for possible adjustment and/or disclosure. No subsequent events requiring financial statement adjustment or disclosure have been identified.
| 44 | MainStay VP Income Builder Portfolio |
Report of Independent Registered Public Accounting Firm
To the Board of Trustees of MainStay VP Funds Trust and Shareholders of MainStay VP Income Builder Portfolio
Opinion on the Financial Statements
We have audited the accompanying statement of assets and liabilities, including the portfolio of investments, of MainStay VP Income Builder Portfolio (one of the portfolios constituting MainStay VP Funds Trust, referred to hereafter as the “Portfolio”) as of December 31, 2023, the related statement of operations for the year ended December 31, 2023, the statements of changes in net assets for each of the two years in the period ended December 31, 2023, including the related notes, and the financial highlights for each of the five years in the period ended December 31, 2023 (collectively referred to as the “financial statements”). In our opinion, the financial statements present fairly, in all material respects, the financial position of the Portfolio as of December 31, 2023, the results of its operations for the year then ended, the changes in its net assets for each of the two years in the period ended December 31, 2023 and the financial highlights for each of the five years in the period ended December 31, 2023 in conformity with accounting principles generally accepted in the United States of America.
Basis for Opinion
These financial statements are the responsibility of the Portfolio’s management. Our responsibility is to express an opinion on the Portfolio’s financial statements based on our audits. We are a public accounting firm registered with the Public Company Accounting Oversight Board (United States) (PCAOB) and are required to be independent with respect to the Portfolio in accordance with the U.S. federal securities laws and the applicable rules and regulations of the Securities and Exchange Commission and the PCAOB.
We conducted our audits of these financial statements in accordance with the standards of the PCAOB. Those standards require that we plan and perform the audit to obtain reasonable assurance about whether the financial statements are free of material misstatement, whether due to error or fraud.
Our audits included performing procedures to assess the risks of material misstatement of the financial statements, whether due to error or fraud, and performing procedures that respond to those risks. Such procedures included examining, on a test basis, evidence regarding the amounts and disclosures in the financial statements. Our audits also included evaluating the accounting principles used and significant estimates made by management, as well as evaluating the overall presentation of the financial statements. Our procedures included confirmation of securities owned as of December 31, 2023 by correspondence with the custodian, transfer agents, agent banks and brokers; when replies were not received from brokers, we performed other auditing procedures. We believe that our audits provide a reasonable basis for our opinion.
/s/PricewaterhouseCoopers LLP
New York, New York
February 26, 2024
We have served as the auditor of one or more investment companies in the MainStay group of funds since 1984.
Board Consideration and Approval of Management Agreement and Subadvisory
Agreements (Unaudited)
The continuation of the Management Agreement with respect to the MainStay VP Income Builder Portfolio (“Portfolio”) and New York Life Investment Management LLC (“New York Life Investments”) and the Subadvisory Agreements between New York Life Investments and each of MacKay Shields LLC (“MacKay”) and Epoch Investment Partners, Inc. (“Epoch”) with respect to the Portfolio (together, “Advisory Agreements”) is subject to annual review and approval by the Board of Trustees of MainStay VP Funds Trust (“Board” of the “Trust”) in accordance with Section 15 of the Investment Company Act of 1940, as amended (“1940 Act”). At its December 6–7, 2023 meeting, the Board, including the Trustees who are not an “interested person” (as such term is defined in the 1940 Act) of the Trust (“Independent Trustees”) voting separately, unanimously approved the continuation of each of the Advisory Agreements for a one-year period.
In reaching the decision to approve the continuation of each of the Advisory Agreements, the Board considered information and materials furnished by New York Life Investments, MacKay and Epoch in connection with an annual contract review process undertaken by the Board that took place at meetings of the Board and its Contracts Committee from September 2023 through December 2023, including information and materials furnished by New York Life Investments, MacKay and Epoch in response to requests prepared on behalf of the Board, and in consultation with the Independent Trustees, by independent legal counsel to the Independent Trustees, which encompassed a variety of topics, including those summarized below. Information and materials requested by and furnished to the Board for consideration in connection with the contract review process included, among other items, reports on the Portfolio and “peer funds” prepared by Institutional Shareholder Services Inc. (“ISS”), an independent third-party service provider engaged by the Board to report objectively on the Portfolio’s investment performance, management fee and total expenses. The Board also considered information on the fees charged to other investment advisory clients of New York Life Investments, MacKay and/or Epoch that follow investment strategies similar to those of the Portfolio, if any, and, when applicable, the rationale for differences in the Portfolio’s management and subadvisory fees and the fees charged to those other investment advisory clients. In addition, the Board considered information regarding the legal standards and fiduciary obligations applicable to its consideration of the continuation of each of the Advisory Agreements. The contract review process, including the structure and format for information and materials provided to the Board, has been developed in consultation with the Board. The Independent Trustees also met in executive sessions with their independent legal counsel and, for portions thereof, with senior management of New York Life Investments.
The Board’s deliberations with respect to the continuation of each of the Advisory Agreements reflect a year-long process, and the Board also took into account information furnished to the Board and its Committees throughout the year, as deemed relevant and appropriate by the Trustees, including, among other items, reports on investment performance of the Portfolio and investment-related matters for the Portfolio as well as presentations from New York Life Investments and, generally
annually, MacKay and Epoch personnel. In addition, the Board took into account other information provided by New York Life Investments throughout the year, including, among other items, periodic reports on legal and compliance matters, risk management, portfolio turnover, brokerage commissions and non-advisory services provided to the Portfolio by New York Life Investments, as deemed relevant and appropriate by the Trustees.
In addition to information provided to the Board throughout the year, the Board received information in connection with its June 2023 meeting provided specifically in response to requests prepared on behalf of the Board, and in consultation with the Independent Trustees, by independent legal counsel to the Independent Trustees regarding the Portfolio’s distribution arrangements. In addition, the Board received information regarding the Portfolio’s asset levels, share purchase and redemption activity and the payment of Rule 12b-1 and/or certain other fees by applicable share classes of the Portfolio, among other information.
In considering the continuation of each of the Advisory Agreements, the Trustees reviewed and evaluated the information and factors they believed to reasonably be necessary and appropriate in light of legal advice furnished to them by independent legal counsel to the Independent Trustees and through the exercise of their own business judgment. Although individual Trustees may have weighed certain factors or information differently and the Board did not consider any single factor or information controlling in reaching its decision, the factors that figured prominently in the Board’s consideration of the continuation of each of the Advisory Agreements are summarized in more detail below and include, among other factors: (i) the nature, extent and quality of the services provided to the Portfolio by New York Life Investments, MacKay and Epoch; (ii) the qualifications of the portfolio managers of the Portfolio and the historical investment performance of the Portfolio, New York Life Investments, MacKay and Epoch; (iii) the costs of the services provided, and profits realized, by New York Life Investments, MacKay and Epoch with respect to their relationships with the Portfolio; (iv) the extent to which economies of scale have been realized or may be realized if the Portfolio grows and the extent to which any economies of scale have been shared, have benefited or may benefit the Portfolio’s shareholders; and (v) the reasonableness of the Portfolio’s management and subadvisory fees and total ordinary operating expenses. Although the Board recognized that comparisons between the Portfolio’s fees and expenses and those of other funds are imprecise given different terms of agreements, variations in fund strategies and other factors, the Board considered the reasonableness of the Portfolio’s management fee and total ordinary operating expenses as compared to the peer funds identified by ISS. Throughout their considerations, the Trustees acknowledged the commitment of New York Life Investments and its affiliates to serve the MainStay Group of Funds, as well as their capacity, experience, resources, financial stability and reputations. The Trustees also acknowledged the entrepreneurial and other risks assumed by New York Life Investments in sponsoring and managing the Portfolio. With
| 46 | MainStay VP Income Builder Portfolio |
respect to the Subadvisory Agreements, the Board took into account New York Life Investments’ recommendation to approve the continuation of the Subadvisory Agreements.
The Trustees noted that, throughout the year, the Trustees are afforded an opportunity to ask questions of, and request additional information or materials from, New York Life Investments, MacKay and Epoch. The Board’s decision with respect to each of the Advisory Agreements may have also been based, in part, on the Board’s knowledge of New York Life Investments, MacKay and Epoch, resulting from, among other things, the Board’s consideration of each of the Advisory Agreements in prior years, the advisory agreements for other funds in the MainStay Group of Funds, the Board’s review throughout the year of the performance and operations of other funds in the MainStay Group of Funds and each Trustee’s business judgment and industry experience. In addition to considering the above-referenced factors, the Board observed that in the marketplace, notably under variable life insurance policies and variable annuity contracts for which the Portfolio serves as an investment option, there are a range of investment options available to investors and that the Portfolio’s shareholders, having had the opportunity to consider other investment options, have invested in the Portfolio.
The factors that figured prominently in the Board’s decision to approve the continuation of each of the Advisory Agreements during the Board’s December 6–7, 2023 meeting are summarized in more detail below.
Nature, Extent and Quality of Services Provided by New York Life Investments, MacKay and Epoch
The Board examined the nature, extent and quality of the services that New York Life Investments provides to the Portfolio. The Board evaluated New York Life Investments’ experience and capabilities in serving as manager of the Portfolio and considered that the Portfolio operates in a “manager-of-managers” structure. The Board also considered New York Life Investments’ responsibilities and services provided pursuant to this structure, including overseeing the services provided by MacKay and Epoch, evaluating the performance of MacKay and Epoch, making recommendations to the Board as to whether the Subadvisory Agreements should be renewed, modified or terminated and periodically reporting to the Board regarding the results of New York Life Investments’ evaluation and monitoring functions. The Board noted that New York Life Investments manages other mutual funds, serves a variety of other investment advisory clients, including other pooled investment vehicles, and has experience overseeing mutual fund service providers, including subadvisors. The Board considered the experience of senior personnel at New York Life Investments providing management and administrative and other non-advisory services to the Portfolio. The Board observed that New York Life Investments devotes significant resources and time to providing management and administrative and other non-advisory services to the Portfolio, including New York Life Investments’ oversight and due diligence reviews of MacKay and Epoch and ongoing analysis of, and interactions with, MacKay and Epoch with respect to, among other
things, the Portfolio’s investment performance and risks as well as MacKay’s and Epoch’s investment capabilities and subadvisory services with respect to the Portfolio.
The Board also considered the range of services that New York Life Investments provides to the Portfolio under the terms of the Management Agreement, including: (i) fund accounting and ongoing supervisory services provided by New York Life Investments’ Fund Administration and Accounting Group; (ii) investment supervisory and analytical services provided by New York Life Investments’ Investment Consulting Group; (iii) compliance services provided by the Trust’s Chief Compliance Officer as well as New York Life Investments’ compliance department, including supervision and implementation of the Portfolio’s compliance program; (iv) legal services provided by New York Life Investments’ Office of the General Counsel; and (v) risk management monitoring and analysis by compliance and investment personnel. In addition, the Board considered New York Life Investments’ willingness to invest in personnel and other resources, such as cyber security, information security and business continuity planning, that may benefit the Portfolio and noted that New York Life Investments is responsible for compensating the Trust’s officers, except for a portion of the salary of the Trust’s Chief Compliance Officer. The Board recognized that New York Life Investments provides certain other non-advisory services to the Portfolio and has over time provided an increasingly broad array of non-advisory services to the MainStay Group of Funds as a result of regulatory and other developments.
The Board also examined the range, and the nature, extent and quality, of the investment advisory services that MacKay and Epoch provide to the Portfolio and considered the terms of each of the Advisory Agreements. The Board evaluated MacKay’s and Epoch’s experience and performance in serving as subadvisors to the Portfolio and advising other portfolios and MacKay’s and Epoch’s track record and experience in providing investment advisory services as well as the experience of investment advisory, senior management and administrative personnel at MacKay and Epoch. The Board considered New York Life Investments’, MacKay’s and Epoch’s overall resources, legal and compliance environment, capabilities, reputation, financial condition and history. In addition to information provided in connection with quarterly meetings with the Trust’s Chief Compliance Officer, the Board considered information regarding the compliance policies and procedures of New York Life Investments, MacKay and Epoch and acknowledged their commitment to further developing and strengthening compliance programs that may relate to the Portfolio. The Board also considered MacKay’s and Epoch’s ability to recruit and retain qualified investment professionals and willingness to invest in personnel and other resources that may benefit the Portfolio. In this regard, the Board considered the qualifications and experience of the Portfolio’s portfolio managers, the number of accounts managed by the portfolio managers and the method for compensating the portfolio managers.
In addition, the Board considered information provided by New York Life Investments, MacKay and Epoch regarding their respective business continuity and disaster recovery plans.
Board Consideration and Approval of Management Agreement and Subadvisory
Agreements (Unaudited) (continued)
Based on these considerations, among others, the Board concluded that the Portfolio would likely continue to benefit from the nature, extent and quality of these services.
Investment Performance
In evaluating the Portfolio’s investment performance, the Board considered investment performance results over various periods in light of the Portfolio’s investment objective, strategies and risks. The Board considered investment reports on, and analysis of, the Portfolio’s performance provided to the Board throughout the year. These reports include, among other items, information on the Portfolio’s gross and net returns, the Portfolio’s investment performance compared to a relevant investment category and the Portfolio’s benchmarks, the Portfolio’s risk-adjusted investment performance and the Portfolio’s investment performance as compared to peer funds, as appropriate, as well as portfolio attribution information and commentary on the effect of market conditions. The Board also considered information provided by ISS showing the investment performance of the Portfolio as compared to peer funds. In addition, the Board reviewed the methodology used by ISS to construct the group of peer funds for comparative purposes.
The Board also took into account its discussions with senior management at New York Life Investments concerning the Portfolio’s investment performance over various periods as well as discussions between representatives of MacKay and Epoch and the members of the Board’s Investment Committee, which generally occur on an annual basis.
Based on these considerations, among others, the Board concluded that its review of the Portfolio’s investment performance and related information supported a determination to approve the continuation of each of the Advisory Agreements.
Costs of the Services Provided, and Profits and Other Benefits Realized, by New York Life Investments, MacKay and Epoch
The Board considered the costs of the services provided under each of the Advisory Agreements. The Board also considered the profitability of New York Life Investments and its affiliates, including MacKay, and Epoch due to their relationships with the Portfolio as well as by New York Life Investments and its affiliates, including MacKay, due to their relationships with the MainStay Group of Funds. Because MacKay is an affiliate of New York Life Investments whose subadvisory fee is paid by New York Life Investments, not the Portfolio, the Board considered cost and profitability information for New York Life Investments and MacKay in the aggregate. With respect to the profitability of Epoch’s relationship with the Portfolio, the Board considered information from New York Life Investments that Epoch’s subadvisory fee reflected an arm’s-length negotiation and that this fee is paid by New York Life Investments, not the Portfolio, and the relevance of Epoch’s profitability was considered by the Trustees in that context. On this basis, the Board primarily considered the costs and profitability for New York Life Investments and its affiliates with respect to the Portfolio.
In addition, the Board acknowledged the difficulty in obtaining reliable comparative data about mutual fund managers’ profitability because such information generally is not publicly available and may be impacted by numerous factors, including the structure of a fund manager’s organization, the types of funds it manages, the methodology used to allocate certain fixed costs to specific funds and the manager’s capital structure and costs of capital.
In evaluating the costs of the services provided by New York Life Investments, MacKay and Epoch and profitability of New York Life Investments and its affiliates, including MacKay, and Epoch due to their relationships with the Portfolio, the Board considered, among other factors, New York Life Investments’ and its affiliates’, including MacKay’s, and Epoch’s continuing investments in, or willingness to invest in, personnel and other resources that may support and further enhance the management of the Portfolio, and that New York Life Investments is responsible for paying the subadvisory fees for the Portfolio. The Board also considered the financial resources of New York Life Investments, MacKay and Epoch and acknowledged that New York Life Investments, MacKay and Epoch must be in a position to recruit and retain experienced professional personnel and to maintain a strong financial position for New York Life Investments, MacKay and Epoch to continue to provide high-quality services to the Portfolio. The Board recognized that the Portfolio benefits from the allocation of certain fixed costs among the funds in the MainStay Group of Funds, among other expected benefits resulting from its relationship with New York Life Investments.
The Board considered information regarding New York Life Investments’ methodology for calculating profitability and allocating costs provided by New York Life Investments in connection with the fund profitability analysis presented to the Board. The Board concluded that New York Life Investments’ methods for allocating costs and procedures for estimating overall profitability of the relationship with the funds in the MainStay Group of Funds were reasonable. The Board recognized the difficulty in calculating and evaluating a manager’s profitability with respect to the Portfolio and considered that other profitability methodologies may also be reasonable.
The Board also considered certain fall-out benefits that may be realized by New York Life Investments and its affiliates, including MacKay, and Epoch and its affiliates due to their relationships with the Portfolio, including reputational and other indirect benefits. The Board recognized, for example, the benefits to MacKay and Epoch from legally permitted “soft-dollar” arrangements by which brokers provide research and other services to MacKay and Epoch in exchange for commissions paid by the Portfolio with respect to trades in the Portfolio’s portfolio securities. In this regard, the Board also requested and considered information from New York Life Investments concerning other material business relationships between Epoch and its affiliates and New York Life Investments and its affiliates and considered the existence of a strategic partnership between New York Life Investments and Epoch that relates to certain current and future products and represents a potential conflict of interest associated with New York Life Investments’ recommendation to approve the Subadvisory Agreement. In addition, the Board considered its review of
| 48 | MainStay VP Income Builder Portfolio |
the management agreement for a money market fund advised by New York Life Investments and an affiliated subadvisor that serves as an investment option for the Portfolio, including the potential rationale for and costs associated with investments in this money market fund by the Portfolio, if any, and considered information from New York Life Investments that the nature and type of specific investment advisory services provided to this money market fund are distinct from, or in addition to, the investment advisory services provided to the Portfolio. In addition, the Board considered the potential dividend received tax deduction for insurance company affiliates of New York Life Investments from the Portfolio’s securities lending activity.
The Board noted that the Portfolio serves as an investment option primarily under variable contracts issued by affiliates of New York Life Investments that would receive fees under those contracts. The Board observed that, in addition to fees earned by New York Life Investments under the Management Agreement for managing the Portfolio, New York Life Investments’ affiliates also earn revenues from serving the Portfolio in various other capacities, including as the Portfolio’s distributor, and insurance companies affiliated with New York Life Investments would be entitled to receive fees from the Portfolio under a distribution and service plan adopted pursuant to Rule 12b-1 under the 1940 Act. The Board considered information about these other revenues and their impact on the profitability of the relationship with the Portfolio to New York Life Investments and its affiliates. The Board noted that, although it assessed the overall profitability of the relationship with the Portfolio to New York Life Investments and its affiliates as part of the contract review process, when considering the reasonableness of the fee paid to New York Life Investments under the Management Agreement, the Board considered the profitability of New York Life Investments’ relationship with the Portfolio on a pre-tax basis and without regard to distribution expenses incurred by New York Life Investments from its own resources.
After evaluating the information deemed relevant by the Trustees, the Board concluded that any profits realized by New York Life Investments and its affiliates, including MacKay, due to their relationships with the Portfolio were not excessive, and other expected benefits that may accrue to New York Life Investments and its affiliates, including MacKay, are reasonable, and other expected benefits that may accrue to New York Life Investments and its affiliates are reasonable and other expected benefits that may accrue to Epoch and its affiliates are consistent with those expected for a subadvisor to a mutual fund. With respect to Epoch, the Board considered that any profits realized by Epoch due to its relationship with the Portfolio are the result of arm’s-length negotiations between New York Life Investments and Epoch, acknowledging that any such profits are based on the subadvisory fee paid to Epoch by New York Life Investments, not the Portfolio.
Management and Subadvisory Fees and Total Ordinary Operating Expenses
The Board evaluated the reasonableness of the fee paid under each of the Advisory Agreements and the Portfolio’s total ordinary operating expenses. With respect to the management fee and subadvisory fees,
the Board primarily considered the reasonableness of the management fee paid by the Portfolio to New York Life Investments because the subadvisory fees paid to MacKay and Epoch are paid by New York Life Investments, not the Portfolio. The Board also considered the reasonableness of the subadvisory fees paid by New York Life Investments and the amount of the management fee retained by New York Life Investments.
In assessing the reasonableness of the Portfolio’s fees and expenses, the Board primarily considered comparative data provided by ISS on the fees and expenses of similar mutual funds managed by other investment advisers. The Board reviewed the methodology used by ISS to construct the group of peer funds for comparative purposes. In addition, the Board considered information provided by New York Life Investments, MacKay and Epoch on fees charged to other investment advisory clients, including institutional separate accounts and/or other funds, that follow investment strategies similar to those of the Portfolio, if any. The Board considered the contractual management fee schedule for the Portfolio as compared to those for such other investment advisory clients, taking into account the rationale for differences in fee schedules. The Board also took into account information provided by New York Life Investments about the more extensive scope of services provided to registered investment companies, such as the Portfolio, as compared with other investment advisory clients. Additionally, the Board considered the impact of contractual breakpoints and voluntary waivers on the Portfolio’s net management fee and expenses. The Board also considered that in proposing fees for the Portfolio, New York Life Investments considers the competitive marketplace for mutual funds.
Based on the factors outlined above, among other considerations, the Board concluded that the Portfolio’s management fee and total ordinary operating expenses are within a range that is competitive and support a conclusion that these fees and expenses are reasonable.
Economies of Scale
The Board considered information regarding economies of scale, including whether economies of scale may exist with respect to the Portfolio and whether the Portfolio’s management fee and expense structure permits any economies of scale to be appropriately shared with the Portfolio’s shareholders. The Board also considered a report from New York Life Investments, previously prepared at the request of the Board, that addressed economies of scale, including with respect to the mutual fund business generally, and the various ways in which the benefits of economies of scale may be shared with the funds in the MainStay Group of Funds. Although the Board recognized the difficulty of determining economies of scale with precision, the Board acknowledged that economies of scale may be shared with the Portfolio in a number of ways, including, for example, through the imposition of fee breakpoints, initially setting management fee rates at scale or making additional investments to enhance the services provided to the Portfolio. The Board reviewed information from New York Life Investments showing how the Portfolio’s management fee schedule compared to fee schedules of other funds and accounts managed by New York Life Investments. The Board
Board Consideration and Approval of Management Agreement and Subadvisory
Agreements (Unaudited) (continued)
also reviewed information from ISS showing how the Portfolio’s management fee schedule compared with fees paid for similar services by peer funds at varying asset levels.
Based on this information, the Board concluded that economies of scale are appropriately shared for the benefit of the Portfolio’s shareholders through the Portfolio’s management fee and expense structure and other methods to share benefits from economies of scale.
Conclusion
On the basis of the information and factors summarized above, among other information and factors deemed relevant by the Trustees, and the evaluation thereof, the Board, including the Independent Trustees voting separately, unanimously voted to approve the continuation of each of the Advisory Agreements.
| 50 | MainStay VP Income Builder Portfolio |
Proxy Voting Policies and Procedures and Proxy Voting Record
The Portfolio is required to file with the SEC its proxy voting record for the 12-month period ending June 30 on Form N-PX. A description of the policies and procedures that are used to vote proxies relating to portfolio securities of the Portfolio is available free of charge upon request by calling 800-598-2019 or visiting the SEC's website at www.sec.gov. The most recent Form N-PX or proxy voting record is available free of charge upon request by calling 800-598-2019; visiting https://www.newyorklifeinvestments.com/investment-products/vp; or visiting the SEC’s website at www.sec.gov.
Shareholder Reports and Quarterly Portfolio Disclosure
The Portfolio is required to file its complete schedule of portfolio holdings with the SEC 60 days after its first and third fiscal quarter on Form N-PORT. The Portfolio's holdings report is available free of charge upon request by calling 800-598-2019 or by visiting the SEC’s website at www.sec.gov.
Board of Trustees and Officers (Unaudited)
The Trustees and officers of the Portfolio are listed below. The Board oversees the MainStay Group of Funds (which consists of MainStay Funds and MainStay Funds Trust), MainStay VP Funds Trust, MainStay MacKay DefinedTerm Municipal Opportunities Fund, MainStay CBRE Global Infrastructure Megatrends Term Fund, the Manager and the Subadvisors, and elects the officers of the Portfolios who are responsible for the day-to-day operations of the Portfolio. Information pertaining to the Trustees and officers is set forth below. Each Trustee serves until his or her successor is elected and qualified or until his or her resignation,
death or removal. Under the Board’s retirement policy, unless an exception is made, a Trustee must tender his or her resignation by the end of the calendar year during which he or she reaches the age of 75. Officers are elected annually by the Board. The business address of each Trustee and officer listed below is 51 Madison Avenue, New York, New York 10010. A majority of the Trustees are not “interested persons” (as defined by the 1940 Act and rules adopted by the SEC thereunder) of the Portfolio (“Independent Trustees”).
| | Name and
Year of Birth | Term of Office,
Position(s) Held and
Length of Service | Principal Occupation(s)
During Past Five Years | Number of
Portfolios in
Fund Complex
Overseen by
Trustee | Other Directorships
Held by Trustee |
| | | | | | |
| | Naïm Abou-Jaoudé*
1966 | MainStay VP Funds Trust: Trustee since 2023 | Chief Executive Officer of New York Life Investment Management LLC (since 2023). Chief Executive Officer of Candriam (an affiliate of New York Life Investment Management LLC) (2007 to 2023). | 81 | MainStay Funds: Trustee since 2023 (11 Funds)
MainStay Funds Trust: Trustee since 2023 (37 Funds);
MainStay MacKay DefinedTerm Municipal Opportunities Fund: Trustee since 2023;
MainStay CBRE Global Infrastructure Megatrends Term Fund: Trustee since 2023; and
New York Life Investment Management International (Chair) since 2015 |
| * | This Trustee is considered to be an “interested person” of the MainStay Group of Funds, MainStay VP Funds Trust, MainStay CBRE Global Infrastructure Megatrends Term Fund and MainStay MacKay DefinedTerm Municipal Opportunities Fund, within the meaning of the 1940 Act because of his affiliation with New York Life Investment Management LLC and Candriam, as described in detail above in the column entitled “Principal Occupation(s) During Past Five Years.” |
| | |
| 52 | MainStay VP Income Builder Portfolio |
| | Name and
Year of Birth | Term of Office,
Position(s) Held and
Length of Service | Principal Occupation(s)
During Past Five Years | Number of
Portfolios in
Fund Complex
Overseen by
Trustee | Other Directorships
Held by Trustee |
| | | | | | |
| | David H. Chow
1957 | MainStay VP Funds Trust: Trustee since January 2016, Advisory Board Member (June 2015 to December 2015) | Founder and CEO, DanCourt Management, LLC since 1999 | 81 | MainStay Funds: Trustee since January 2016, Advisory Board Member (June 2015 to December 2015) (11 Funds);
MainStay Funds Trust: Trustee since January 2016, Advisory Board Member (June 2015 to December 2015) (37 Funds);
MainStay MacKay DefinedTerm Municipal Opportunities Fund: Trustee since January 2016, Advisory Board Member (June 2015 to December 2015);
MainStay CBRE Global Infrastructure Megatrends Term Fund: Trustee since 2021;
VanEck Vectors Group of Exchange-Traded Funds: Trustee since 2006 and Independent Chairman of the Board of Trustees from 2008 to 2022 (57 portfolios); and
Berea College of Kentucky: Trustee since 2009, Chair of the Investment Committee since 2018 |
| | Karen Hammond
1956 | MainStay VP Funds Trust: Trustee since December 2021, Advisory Board Member (June 2021 to December 2021)
| Retired, Managing Director, Devonshire Investors (2007 to 2013); Senior Vice President, Fidelity Management & Research Co. (2005 to 2007); Senior Vice President and Corporate Treasurer, FMR Corp. (2003 to 2005); Chief Operating Officer, Fidelity Investments Japan (2001 to 2003) | 81 | MainStay Funds: Trustee since December 2021, Advisory Board Member (June 2021 to December 2021) (11 Funds);
MainStay Funds Trust: Trustee since December 2021, Advisory Board Member (June 2021 to December 2021) (37 Funds);
MainStay MacKay DefinedTerm Municipal Opportunities Fund: Trustee since December 2021, Advisory Board Member (June 2021 to December 2021);
MainStay CBRE Global Infrastructure Megatrends Term Fund: Trustee since December 2021, Advisory Board Member (June 2021 to December 2021);
Two Harbors Investment Corp.: Director since 2018;
Rhode Island State Investment Commission: Member since 2017; and
Blue Cross Blue Shield of Rhode Island: Director since 2019 |
| | Susan B. Kerley
1951 | MainStay VP Funds Trust: Chair since 2017 and Trustee since 2007** | President, Strategic Management Advisors LLC since 1990 | 81 | MainStay Funds: Chair since January 2017 and Trustee since 2007 (11 Funds); MainStay Funds Trust: Chair since January 2017 and Trustee since 1990 (37 Funds)***;
MainStay MacKay DefinedTerm Municipal Opportunities Fund: Chair since January 2017 and Trustee since 2011;
MainStay CBRE Global Infrastructure Megatrends Term Fund: Trustee since June 2021; and
Legg Mason Partners Funds: Trustee since 1991 (45 portfolios) |
Board of Trustees and Officers (Unaudited) (continued)
| | Name and
Year of Birth | Term of Office,
Position(s) Held and
Length of Service | Principal Occupation(s)
During Past Five Years | Number of
Portfolios in
Fund Complex
Overseen by
Trustee | Other Directorships
Held by Trustee |
| | | | | | |
| | Alan R. Latshaw
1951 | MainStay VP Funds Trust: Trustee since 2007** | Retired; Partner, Ernst & Young LLP (2002 to 2003); Partner, Arthur Andersen LLP (1989 to 2002); Consultant to the MainStay Funds Audit and Compliance Committee (2004 to 2006) | 81 | MainStay Funds: Trustee since 2006 (11 Funds);
MainStay Funds Trust: Trustee since 2007 (37 Funds)***;
MainStay MacKay DefinedTerm Municipal Opportunities Fund: Trustee since 2011; and
MainStay CBRE Global Infrastructure Megatrends Term Fund: Trustee since June 2021 |
| | Jacques P. Perold
1958 | MainStay VP Funds Trust: Trustee since January 2016, Advisory Board Member (June 2015 to December 2015) | Founder and Chief Executive Officer, CapShift Advisors LLC (since 2018); President, Fidelity Management & Research Company (2009 to 2014); President and Chief Investment Officer, Geode Capital Management, LLC (2001 to 2009) | 81 | MainStay Funds: Trustee since January 2016, Advisory Board Member (June 2015 to December 2015) (11 Funds);
MainStay Funds Trust: Trustee since January 2016, Advisory Board Member (June 2015 to December 2015) (37 Funds);
MainStay MacKay DefinedTerm Municipal Opportunities Fund: Trustee since January 2016, Advisory Board Member (June 2015 to December 2015);
MainStay CBRE Global Infrastructure Megatrends Term Fund: Trustee since June 2021;
Allstate Corporation: Director since 2015;
Partners in Health: Trustee since 2019; and
MSCI Inc.: Director since 2017 |
| | Richard S. Trutanic
1952 | MainStay VP Funds Trust: Trustee since 2007** | Chairman and Chief Executive Officer, Somerset & Company (financial advisory firm) since 2004; Managing Director, The Carlyle Group (private investment firm) (2002 to 2004); Senior Managing Director, Partner and Board Member, Groupe Arnault S.A. (private investment firm) (1999 to 2002) | 81 | MainStay Funds: Trustee since 1994 (11 Funds);
MainStay Funds Trust: Trustee since 2007 (37 Funds)***;
MainStay MacKay DefinedTerm Municipal Opportunities Fund: Trustee since 2011; and
MainStay CBRE Global Infrastructure Megatrends Term Fund: Trustee since June 2021 |
| ** | Includes prior service as a Director of MainStay VP Series Fund, Inc., the predecessor to MainStay VP Funds Trust. |
| *** | Includes prior service as a Director/Trustee of certain predecessor entities to MainStay Funds Trust. |
| 54 | MainStay VP Income Builder Portfolio |
| | Name and
Year of Birth | Position(s) Held and
Length of Service | Principal Occupation(s)
During Past Five Years | |
| | | | | |
| | Kirk C. Lehneis
1974 | President, MainStay VP Funds Trust (since 2017) | Chief Operating Officer and Senior Managing Director (since 2016), New York Life Investment Management LLC and New York Life Investment Management Holdings LLC; Member of the Board of Managers (since 2017) and Senior Managing Director (since 2018), NYLIFE Distributors LLC; Chairman of the Board and Senior Managing Director, NYLIM Service Company LLC (since 2017); Trustee, President and Principal Executive Officer of IndexIQ Trust, IndexIQ ETF Trust and IndexIQ Active ETF Trust (since 2018); President, MainStay CBRE Global Infrastructure Megatrends Term Fund (since 2021), MainStay MacKay DefinedTerm Municipal Opportunities Fund, MainStay Funds and MainStay Funds Trust (since 2017); Senior Managing Director, Global Product Development (from 2015 to 2016); Managing Director, Product Development (from 2010 to 2015), New York Life Investment Management LLC | |
| | Jack R. Benintende
1964 | Treasurer and Principal Financial and Accounting Officer, MainStay VP Funds Trust (since 2007)** | Managing Director, New York Life Investment Management LLC (since 2007); Treasurer and Principal Financial and Accounting Officer, MainStay CBRE Global Infrastructure Megatrends Term Fund (since 2021), MainStay MacKay DefinedTerm Municipal Opportunities Fund (since 2011), MainStay Funds Trust (since 2009) and MainStay Funds (since 2007); and Assistant Treasurer, New York Life Investment Management Holdings LLC (2008 to 2012) | |
| | J. Kevin Gao
1967 | Secretary and Chief Legal Officer, MainStay VP Funds Trust (since 2010)** | Managing Director and Associate General Counsel, New York Life Investment Management LLC (since 2010); Secretary and Chief Legal Officer, MainStay CBRE Global Infrastructure Megatrends Term Fund (since 2021), MainStay MacKay DefinedTerm Municipal Opportunities Fund (since 2011), MainStay Funds and MainStay Funds Trust (since 2010) | |
| | Kevin M. Gleason
1967 | Vice President and Chief Compliance Officer, MainStay VP Funds Trust (since June 2022) | Vice President and Chief Compliance Officer, IndexIQ Trust, IndexIQ ETF Trust and IndexIQ Active ETF Trust (since June 2022); Vice President and Chief Compliance Officer, MainStay CBRE Global Infrastructure Megatrends Term Fund, MainStay MacKay DefinedTerm Municipal Opportunities Fund (since June 2022); MainStay Funds Trust and MainStay Funds (since June 2022); Senior Vice President, Voya Investment Management and Chief Compliance Officer, Voya Family of Funds (2012 to 2022) | |
| | Scott T. Harrington
1959 | Vice President— Administration, MainStay VP Funds Trust (since 2005)** | Managing Director, New York Life Investment Management LLC (including predecessor advisory organizations) (since 2000); Member of the Board of Directors, New York Life Trust Company (since 2009); Vice President—Administration, MainStay CBRE Global Infrastructure Megatrends Term Fund (since 2021), MainStay MacKay DefinedTerm Municipal Opportunities Fund (since 2011), MainStay Funds Trust and MainStay Funds (since 2009) | |
| * | The officers listed above are considered to be “interested persons” of the MainStay Group of Funds, MainStay VP Funds Trust, MainStay CBRE Global Infrastructure Megatrends Term Fund and MainStay MacKay DefinedTerm Municipal Opportunities Fund within the meaning of the 1940 Act because of their affiliation with the MainStay Group of Funds, New York Life Insurance Company and/or its affiliates, including New York Life Investment Management LLC, New York Life Insurance Company, NYLIM Service Company LLC, NYLIFE Securities LLC and/or NYLIFE Distributors LLC, as described in detail in the column captioned “Principal Occupation(s) During Past Five Years.” Officers are elected annually by the Board. |
| ** | Includes prior service as an Officer of MainStay VP Series Fund, Inc., the predecessor to MainStay VP Funds Trust. |
Officers of the Trust (Who are not Trustees)*
This page intentionally left blank.
This page intentionally left blank.
This page intentionally left blank.
MainStay VP Portfolios
MainStay VP offers a wide range of Portfolios. The full array of MainStay VP offerings is listed here, with information about the manager, subadvisors, legal counsel, and independent registered public accounting firm.
Equity
MainStay VP American Century Sustainable Equity Portfolio
MainStay VP Candriam Emerging Markets Equity Portfolio
MainStay VP Epoch U.S. Equity Yield Portfolio
MainStay VP Fidelity Institutional AM® Utilities Portfolio†
MainStay VP Natural Resources Portfolio
MainStay VP PineStone International Equity Portfolio1
MainStay VP S&P 500 Index Portfolio
MainStay VP Small Cap Growth Portfolio
MainStay VP Wellington Growth Portfolio
MainStay VP Wellington Mid Cap Portfolio
MainStay VP Wellington Small Cap Portfolio
MainStay VP Wellington U.S. Equity Portfolio
MainStay VP Winslow Large Cap Growth Portfolio
Mixed Asset
MainStay VP Balanced Portfolio
MainStay VP Income Builder Portfolio
MainStay VP Janus Henderson Balanced Portfolio
MainStay VP MacKay Convertible Portfolio
Income
MainStay VP Bond Portfolio
MainStay VP Floating Rate Portfolio
MainStay VP Indexed Bond Portfolio
MainStay VP MacKay Government Portfolio2
MainStay VP MacKay High Yield Corporate Bond Portfolio
MainStay VP MacKay Strategic Bond Portfolio
MainStay VP PIMCO Real Return Portfolio
Money Market
MainStay VP U.S. Government Money Market Portfolio
Alternative
MainStay VP CBRE Global Infrastructure Portfolio
MainStay VP IQ Hedge Multi-Strategy Portfolio
Asset Allocation
MainStay VP Conservative Allocation Portfolio
MainStay VP Equity Allocation Portfolio
MainStay VP Growth Allocation Portfolio
MainStay VP Moderate Allocation Portfolio
Manager
New York Life Investment Management LLC
New York, New York
Subadvisors
American Century Investment Management, Inc.
Kansas City, Missouri
Brown Advisory LLC
Baltimore, Maryland
Candriam*
Strassen, Luxembourg
CBRE Investment Management Listed Real Assets LLC
Radnor, Pennsylvania
Epoch Investment Partners, Inc.
New York, New York
FIAM LLC
Smithfield, Rhode Island
IndexIQ Advisors LLC*
New York, New York
Janus Henderson Investors US LLC
Denver, Colorado
MacKay Shields LLC*
New York, New York
Newton Investment Management North America, LLC
Boston, Massachusetts
NYL Investors LLC*
New York, New York
Pacific Investment Management Company LLC
Newport Beach, California
PineStone Asset Management Inc.
Montreal, Québec
Segall Bryant & Hamill, LLC
Chicago, Illinois
Wellington Management Company LLP
Boston, Massachusetts
Winslow Capital Management, LLC
Minneapolis, Minnesota
Legal Counsel
Dechert LLP
Washington, District of Columbia
Independent Registered Public Accounting Firm
PricewaterhouseCoopers LLP
New York, New York
Distributor
NYLIFE Distributors LLC*
Jersey City, New Jersey
Custodian
JPMorgan Chase Bank, N.A.
New York, New York
Some Portfolios may not be available in all products.
† Fidelity Institutional AM is a registered trade mark of FMR LLC. Used with permission.
* An affiliate of New York Life Investment Management LLC.
| 1. | Prior to August 28, 2023, the Portfolio's name was MainStay VP MacKay International Equity Portfolio. |
| 2. | Effective on or about May 1, 2024, the MainStay VP MacKay Government Portfolio will be renamed the MainStay VP U.S. Infrastructure Bond Portfolio. |
Not part of the Annual Report
2023 Annual Report
This report is for the general information of New York Life Variable Annuities and NYLIAC Variable Universal Life Insurance Products policyowners. It must be preceded or accompanied by the appropriate product(s) and funds prospectuses if it is given to anyone who is not an owner of a New York Life variable annuity policy or a NYLIAC Variable Universal Life Insurance Product. This report does not offer for sale or solicit orders to purchase securities.
The performance data quoted in this report represents past performance. Past performance is no guarantee of future results. Due to market volatility and other factors, current performance may be lower or higher than the figures shown. The most recent month-end performance summary for your variable annuity or variable life policy is available by calling 800-598-2019 and is updated periodically on newyorklife.com.
The New York Life Variable Annuities and NYLIAC Variable Universal Life Insurance Products are issued by New York Life Insurance and Annuity Corporation (a Delaware Corporation) and distributed by NYLIFE Distributors LLC (Member FINRA/SIPC).
New York Life Insurance Company
New York Life Insurance and Annuity
Corporation (NYLIAC) (A Delaware Corporation)
51 Madison Avenue, Room 551
New York, NY 10010
newyorklife.com
newyorklifeinvestments.com
NYLIFE Distributors LLC, 30 Hudson Street, Jersey City, NJ 07302
New York Life Investment Management LLC is the investment manager to the MainStay VP Funds Trust
©2024 by NYLIFE Distributors LLC. All rights reserved.
You may obtain copies of the Prospectus and the Statement of Additional Information free of charge, upon request, by calling toll-free 800-598-2019 or writing to New York Life Insurance and Annuity Corporation, 51 Madison Avenue, New York, NY 10010.
| Not FDIC Insured | No Bank Guarantee | May Lose Value |
(NYLIAC) NI522
MainStay VP MacKay Strategic Bond Portfolio
Message from the President and Annual Report
December 31, 2023
Special Notice:
Beginning in July 2024, new regulations issued by the Securities and Exchange Commission (SEC) will take effect requiring open-end mutual fund companies and ETFs to (1) overhaul the content of their shareholder reports and (2) mail paper copies of the new tailored shareholder reports to shareholders who have not opted to receive these documents electronically.
If you have not yet elected to receive your shareholder reports electronically, please contact your financial intermediary or visit our website.
| Not FDIC/NCUA Insured | Not a Deposit | May Lose Value | No Bank Guarantee | Not Insured by Any Government Agency |
This page intentionally left blank
Message from the President
Against a backdrop of easing inflationary pressures and continued economic growth, stocks and bonds generally gained ground during the 12-month period ended December 31, 2023, despite high levels of volatility and sharp disparities between the performance of the different market sectors.
Although the war in Ukraine, the outbreak of hostilities in the Middle East and several other notable events affected financial assets, inflation, interest rate, and economic growth trends stood at the forefront of market developments during most of the period. As the reporting period began, high levels of inflation already showed signs of easing in the face of aggressive rate hikes by U.S. Federal Reserve (the “Fed”). From a peak of 9.1% in June 2022, the annualized U.S. inflation rate dropped to 6.4% in January, and 3.4% in December 2023. At the same time, the Fed increased the benchmark federal funds rate from 4.25%–4.50% at the beginning of reporting period, to 5.25%–5.50% as of the end of 2023. Despite the increasing cost of capital and tighter lending environment that resulted from rising rates, economic growth remained surprisingly robust, bolstered by high levels of consumer spending, low levels of unemployment and better-than-expected corporate earnings. With the pace of rate increases slowing from the prior year, investors began hoping for an early shift to a looser monetary policy, with stock prices and bond yields reacting as economic data and statements from the Fed either reinforced or undercut those hopes. Following months of hawkish rhetoric, the Fed finally reversed its stance in December 2023, signaling a positive economic outlook with little chance of a recession and a likelihood of rate cuts in 2024.
The S&P 500® Index, a widely regarded benchmark of U.S. market performance, produced strong gains during the reporting period-– recovering all its losses from 2022 and approached new record territory. A preponderance of the Index’s gains were generated by a relatively small number of mega-cap stocks in the information technology, communication services and consumer discretionary sectors that stood to benefit from rapid developments in generative artificial intelligence (“AI”). Value-oriented, interest-rate sensitive and small-capitalization
shares lagged by significant margins, although market strength widened during the closing weeks of the reporting period. Most overseas equity markets trailed the U.S. market, as developed international economies experienced relatively low growth rates, and weak economic conditions in China undermined emerging markets.
Bonds produced generally positive returns, bolstered by attractive and relatively stable yields. The yield on the 10-year Treasury note hit a high of just under 5% in mid-October 2023, ranging between approximately 3.5% and 4.8% for most of the reporting period. The yield curve remained inverted throughout the year, with the 2-year Treasury yield modestly above the 10-year yield. Corporate bond prices trended moderately higher, generally outperforming government securities. After years of low yields and tight credit spreads, the corporate sector benefited from more attractive valuations and income opportunities. Among corporates, markets generally rewarded longer duration and lower credit quality, although an uptick in default rates posed added risks for high-yield corporate bonds. International bond markets produced mixed returns, with emerging-markets issues advancing over their developed-markets counterparts.
The market volatility of recent years reminds us of the constant need for experienced and steadfast portfolio management in the face of uncertainty. New York Life Investments remains dedicated to providing you, as a valued MainStay VP investor, with the guidance, resources and investment solutions you need to pursue your financial goals.
Thank you for trusting us to help meet your investment needs.
Sincerely,
Kirk C. Lehneis
President
The opinions expressed are as of the date of this report and are subject to change. There is no guarantee that any forecast made will come to pass. This material does not constitute investment advice and is not intended as an endorsement of any specific investment. Past performance is no guarantee of future results.
Not part of the Annual Report
Investors should refer to the Portfolio’s Summary Prospectus and/or Prospectus and consider the Portfolio’s investment objectives, strategies, risks, charges and expenses carefully before investing. The Summary Prospectus and/or Prospectus contain this and other information about the Portfolio. You may obtain copies of the Portfolio’s Summary Prospectus, Prospectus and Statement of Additional Information, which includes information about the MainStay VP Funds Trust's Trustees, free of charge, upon request, by calling toll-free 800-598-2019, by writing to New York Life Insurance and Annuity Corporation, 51 Madison Avenue, Room 251, New York, New York 10010 or by sending an email to MainStayShareholdersServices@nylim.com. These documents are also available at newyorklifeinvestments.com/investment-products/vp. Please read the Portfolio's Summary Prospectus and/or Prospectus carefully before investing. MainStay VP Funds Trust portfolios are separate account options which are purchased through a variable insurance or variable annuity contract.
Investment and Performance Comparison (Unaudited)
Performance data quoted represents past performance. Past performance is no guarantee of future results. Because of market volatility and other factors, current performance may be lower or higher than the figures shown. Investment return and principal value will fluctuate, and as a result, when shares are redeemed, they may be worth more or less than their original cost. The performance table and graph do not reflect any deduction of sales charges, mortality and expense charges, contract charges or administrative charges. Please refer to the Performance Summary appropriate for your policy. For performance information current to the most recent month-end, please call 800-598-2019 or visit www.newyorklife.com.
Performance figures may reflect certain fee waivers and/or expense limitations, without which total returns may have been different. For information on current fee waivers and/or expense limitations (if any), please refer to the Notes to Financial Statements.
| Average Annual Total Returns for the Year-Ended December 31, 2023 |
| Class | Inception
Date | One
Year | Five
Years | Ten
Years | Gross
Expense
Ratio1 |
| Initial Class Shares | 4/29/2011 | 10.19% | 3.44% | 2.74% | 0.62% |
| Service Class Shares | 4/29/2011 | 9.92 | 3.18 | 2.49 | 0.87 |
| 1. | The gross expense ratios presented reflect the Portfolio’s “Total Annual Portfolio Operating Expenses” from the most recent Prospectus and may differ from other expense ratios disclosed in this report. |
| Benchmark Performance* | One
Year | Five
Years | Ten
Years |
| Bloomberg U.S. Aggregate Bond Index1 | 5.53% | 1.10% | 1.81% |
| ICE BofA U.S. Dollar 3-Month Deposit Offered Rate Constant Maturity Index2 | 5.12 | 2.02 | 1.44 |
| Morningstar Nontraditional Bond Category Average3 | 6.95 | 2.56 | 2.18 |
| * | Returns for indices reflect no deductions for fees, expenses or taxes, except for foreign withholding taxes where applicable. Results assume reinvestment of all dividends and capital gains. An investment cannot be made directly in an index. |
| 1. | The Bloomberg U.S. Aggregate Bond Index is the Portfolio's primary benchmark. The Bloomberg U.S. Aggregate Bond Index is a broad-based benchmark that measures performance of the investment-grade, U.S. dollar denominated, fixed-rate taxable bond market, including Treasuries, government-related and corporate securities, mortgage-backed securities (agency fixed-rate and hybrid adjustable-rate mortgage pass-throughs), asset-backed securities and commercial mortgage-backed securities. |
| 2. | The Portfolio has selected the ICE BofA U.S. Dollar 3-Month Deposit Offered Rate Constant Maturity Index as a secondary benchmark. The ICE BofA U.S. Dollar 3-Month Deposit Offered Rate Constant Maturity Index is unmanaged and tracks the performance of a synthetic asset paying a deposit offered rate to a stated maturity. The index is based on the assumed purchase at par of a synthetic instrument having exactly its stated maturity and with a coupon equal to that day’s fixing rate. That issue is assumed to be sold the following business day (priced at a yield equal to the current day fixing rate) and rolled into a new instrument. |
| 3. | The Portfolio has selected the Morningstar Nontraditional Bond Category Average as an additional benchmark. The Morningstar Nontraditional Bond Category Average contains funds that pursue strategies divergent in one or more ways from conventional practice in the broader bond-fund universe. Morningstar category averages are equal-weighted returns based on constituents of the category at the end of the period. |
Cost in Dollars of a $1,000 Investment in MainStay VP MacKay Strategic Bond Portfolio (Unaudited)
The example below is intended to describe the fees and expenses borne by shareholders during the six-month period from July 1, 2023 to December 31, 2023, and the impact of those costs on your investment.
Example
As a shareholder of the Portfolio you incur two types of costs: (1) transaction costs, including exchange fees and sales charges (loads) on purchases (as applicable), and (2) ongoing costs, including management fees, distribution and/or service (12b-1) fees and other Portfolio expenses (as applicable). This example is intended to help you understand your ongoing costs (in dollars) of investing in the Portfolio and to compare these costs with the ongoing costs of investing in other mutual funds. The example is based on an investment of $1,000 made at the beginning of the six-month period and held for the entire period from July 1, 2023 to December 31, 2023. Shares are only sold in connection with variable life and annuity contracts and the example does not reflect any contract level or transactional fees or expenses. If these costs had been included, your costs would have been higher.
This example illustrates your Portfolio’s ongoing costs in two ways:
Actual Expenses
The second and third data columns in the table below provide information about actual account values and actual expenses. You may use the information in these columns, together with the amount you invested, to estimate the expenses that you paid during the six months ended
December 31, 2023. Simply divide your account value by $1,000 (for example, an $8,600 account value divided by $1,000 = 8.6), then multiply the result by the number under the heading entitled “Expenses Paid During Period” to estimate the expenses you paid on your account during this period.
Hypothetical Example for Comparison Purposes
The fourth and fifth data columns in the table below provide information about hypothetical account values and hypothetical expenses based on the Portfolio’s actual expense ratio and an assumed rate of return of 5% per year before expenses, which is not the Portfolio’s actual return. The hypothetical account values and expenses may not be used to estimate the actual ending account balances or expenses you paid for the six-month period shown. You may use this information to compare the ongoing costs of investing in the Portfolio with the ongoing costs of investing in other mutual funds. To do so, compare this 5% hypothetical example with the 5% hypothetical examples that appear in the shareholder reports of the other mutual funds.
Please note that the expenses shown in the table are meant to highlight your ongoing costs only and do not reflect any transactional costs, such as exchange fees or sales charges (loads). Therefore, the fourth and fifth data columns of the table are useful in comparing ongoing costs only and will not help you determine the relative total costs of owning different funds. In addition, if these transactional costs were included, your costs would have been higher.
| Share Class | Beginning
Account
Value
7/1/23 | Ending Account
Value (Based
on Actual
Returns and
Expenses)
12/31/23 | Expenses
Paid
During
Period1 | Ending Account
Value (Based
on Hypothetical
5% Annualized
Return and
Actual Expenses)
12/31/23 | Expenses
Paid
During
Period1 | Net Expense
Ratio
During
Period2, 3 |
| Initial Class Shares | $1,000.00 | $1,060.60 | $3.22 | $1,022.08 | $3.16 | 0.62% |
| Service Class Shares | $1,000.00 | $1,059.20 | $4.52 | $1,020.82 | $4.43 | 0.87% |
| 1. | Expenses are equal to the Portfolio’s annualized expense ratio of each class multiplied by the average account value over the period, divided by 365 and multiplied by 184 (to reflect the six-month period). The table above represents the actual expenses incurred during the six-month period. In addition to the fees and expenses which the Portfolio bears directly, it also indirectly bears a pro rata share of the fees and expenses of the underlying funds in which it invests. Such indirect expenses are not included in the above-reported expense figures. |
| 2. | Expenses are equal to the Portfolio's annualized expense ratio to reflect the six-month period. |
| 3. | Expenses are inclusive of dividends and interest on investments sold short. |
| 6 | MainStay VP MacKay Strategic Bond Portfolio |
Portfolio Composition as of December 31, 2023 (Unaudited)
See Portfolio of Investments beginning on page 10 for specific holdings within these categories. The Portfolio's holdings are subject to change.
Top Ten Holdings and/or Issuers Held as of December 31, 2023 (excluding short-term investments) (Unaudited)
| 1. | GNMA, (zero coupon)-3.50%, due 8/20/49–10/16/63 |
| 2. | UMBS Pool, 30 Year, 5.50%-6.50%, due 7/1/53–12/1/53 |
| 3. | UMBS, 30 Year, 4.00%-6.50%, due 6/1/52–12/1/53 |
| 4. | FHLMC, (zero coupon)-3.50%, due 1/15/33–8/15/56 |
| 5. | FNMA, (zero coupon)-9.552%, due 3/25/31–3/25/60 |
| 6. | Citigroup, Inc., 2.52%-6.30%, due 5/15/24–11/3/32 |
| 7. | CF Hippolyta Issuer LLC, 1.69%-2.28%, due 7/15/60–3/15/61 |
| 8. | Connecticut Avenue Securities Trust, 8.437%-11.337%, due 10/25/41 |
| 9. | FHLMC STACR REMIC Trust, 7.437%-8.687%, due 9/25/41 |
| 10. | FHLMC Structured Agency Credit Risk Debt Notes, 8.737%-11.337%, due 8/25/33–11/25/50 |
Portfolio Management Discussion and Analysis (Unaudited)
Answers to the questions reflect the views of portfolio managers Shu-Yang Tan, CFA, Matt Jacob, Michael DePalma, Tom Musmanno, CFA, Neil Moriarty III and Lesya Paisley, CFA, of MacKay Shields LLC, the Portfolio’s Subadvisor.
How did MainStay VP MacKay Strategic Bond Portfolio perform relative to its benchmarks and peers during the 12 months ended December 31, 2023?
For the 12 months ended December 31, 2023, MainStay VP MacKay Strategic Bond Portfolio returned 10.19% for Initial Class shares and 9.92% for Service Class shares. Over the same period, both share classes outperformed the 5.53% return of the Bloomberg U.S. Aggregate Bond Index, which is the Portfolio’s primary benchmark, and the 5.12% return of the ICE BofA U.S. Dollar 3-Month Deposit Offered Rate Constant Maturity Index, which is the Portfolio’s secondary benchmark. For the 12 months ended December 31, 2023, both share classes also outperformed the 6.95% return of the Morningstar Nontraditional Bond Category Average.1
During the reporting period, were there any market events that materially impacted the Portfolio’s performance or liquidity?
Although volatility was prevalent throughout the reporting period, there was no single event that adversely impacted the Portfolio’s performance or liquidity during the reporting period. The markets, in general, were impacted by the U.S. Federal Reserve’s interest rate policy, as well as a rally in “risk” assets.
What factors affected the Portfolio’s relative performance during the reporting period?
During the reporting period, security selection and overweight exposure to securitized products, high-yield corporates and emerging market credit made positive contributions to the Portfolio’s performance relative to the Bloomberg U.S. Aggregate Bond Index, as spread2 product, in general, outperformed the market. (Contributions take weightings and total returns into account.)
What was the Portfolio’s duration strategy during the reporting period?
The Portfolio does not track a fixed-income index and can demonstrate a low correlation to the Bloomberg U.S. Aggregate Bond Index. The average duration of the Portfolio will normally vary from 0 to 7 years. At the end of the reporting period, the Portfolio held a shorter duration relative to the Index. The
Portfolio’s effective duration was 4.5 years compared to 6.1 years for the Bloomberg U.S. Aggregate Bond Index.
What specific factors, risks or market forces prompted significant decisions for the Portfolio during the reporting period?
During the reporting period, we lowered the Portfolio’s risk profile by reducing its weight in high-yield corporate bonds, due to full valuations, and increased the Portfolio’s weight in residential mortgage-backed securities (“RMBS”), as those spreads to U.S. Treasury securities had widened out. Additionally we reduced the Portfolio’s exposure to regional banks in favor of G-SIBs (globally systematically important banks), based on stronger capital ratios and balance sheet liquidity, in addition to the fact that regional banks have a disproportionate exposure to commercial real estate, which remained a risk.
During the reporting period, which market segments were the strongest positive contributors to the Portfolio’s absolute performance and which market segments were particularly weak?
During the reporting period, the market segments making the strongest contributions to the Portfolio’s absolute returns included credit risk transfer bonds, investment-grade corporate bonds and asset-backed securities. The market segments that contributed the least on an absolute basis included collateralized mortgage obligations, U.S. Treasury securities and preferred securities.
Did the Portfolio make any significant purchases or sales during the reporting period?
During the reporting period, the Portfolio added exposure to Georgia Power, a fully regulated utility, because we saw attractive value on a risk-adjusted basis. Georgia Power benefited from stable and predictable cash flow generation and strong relationships with its regulators. The Portfolio also purchased a position in Charter Communications based on attractive valuation. We considered Charter a core high-yield holding as one of the largest cable and telecommunications providers in the United States, with solid fundamentals and relatively non-cyclical operations.
| 1. | See "Investment and Performance Comparison" for more information on benchmark and peer group returns. |
| 2. | The terms “spread” and “yield spread” may refer to the difference in yield between a security or type of security and comparable U.S. Treasury issues. The terms may also refer to the difference in yield between two specific securities or types of securities at a given time. The term “spread product” refers to asset classes that typically trade at a spread to comparable U.S. Treasury securities. |
| 8 | MainStay VP MacKay Strategic Bond Portfolio |
During the same period, we sold the Portfolio’s position in Howmet Aerospace for relative value reasons as valuations became full. Although Howmet is a strong high-yield credit rated BB+3 on an improving trajectory, in our opinion, the valuation already fully reflected any potential future improvement. We also sold the Portfolio’s QVC holdings following a periodic credit review of the issuer. We concluded that in light of worsening earnings trends, coupled with our cautious outlook on cyclical consumer spending, a stress event may materialize for the issuer in 2024, and is likely in 2025.
How did the Portfolio’s sector weightings change during the reporting period?
During the reporting period, the Portfolio increased its exposure to residential mortgages and, to a lesser degree, asset-backed securities. During the same period, the Portfolio reduced its exposure to agency mortgages, high-yield corporate bonds and CMBS.
How was the Portfolio positioned at the end of the reporting period?
As of December 31, 2023, relative to the Bloomberg U.S. Aggregate Bond Index, the Portfolio held overweight exposure to high-yield and investment-grade corporate bonds, as well as securitized assets. As of the same date, the Portfolio held underweight exposure to U.S. Treasury securities.
| 3. | An obligation rated ‘BB’ by Standard & Poor’s (“S&P”) is deemed by S&P to be less vulnerable to nonpayment than other speculative issues. In the opinion of S&P, however, the obligor faces major ongoing uncertainties or exposure to adverse business, financial or economic conditions which could lead to the obligor’s inadequate capacity to meet its financial commitment on the obligation. When applied to Fund holdings, ratings are based solely on the creditworthiness of the bonds in the portfolio and are not meant to represent the security or safety of the Fund. Ratings from ‘AA’ to ‘CCC’ may be modified by the addition of a plus (+) or minus (–) sign to show relative standing within the major rating categories. |
The opinions expressed are those of the portfolio managers as of the date of this report and are subject to change. There is no guarantee that any forecasts will come to pass. This material does not constitute investment advice and is not intended as an endorsement of any specific investment.
Not all MainStay VP Portfolios and/or share classes are available under all policies.
Portfolio of Investments December 31, 2023†^
| | Principal
Amount | Value |
| Long-Term Bonds 98.3% |
| Asset-Backed Securities 14.9% |
| Automobile Asset-Backed Securities 10.5% |
| American Credit Acceptance Receivables Trust (a) | |
| Series 2021-2, Class D | | |
| 1.34%, due 7/13/27 | $ 1,915,000 | $ 1,864,854 |
| Series 2021-4, Class D | | |
| 1.82%, due 2/14/28 | 2,230,000 | 2,152,267 |
| Series 2022-1, Class D | | |
| 2.46%, due 3/13/28 | 3,265,000 | 3,140,760 |
| Series 2021-2, Class E | | |
| 2.54%, due 7/13/27 | 2,240,000 | 2,156,888 |
| Series 2021-4, Class E | | |
| 3.12%, due 2/14/28 | 1,600,000 | 1,531,058 |
| Avis Budget Rental Car Funding AESOP LLC | |
| Series 2021-1A, Class A | | |
| 1.38%, due 8/20/27 (a) | 1,345,000 | 1,223,254 |
| CPS Auto Receivables Trust | |
| Series 2021-C, Class E | | |
| 3.21%, due 9/15/28 (a) | 1,560,000 | 1,466,148 |
| Drive Auto Receivables Trust | |
| Series 2021-1, Class D | | |
| 1.45%, due 1/16/29 | 3,135,000 | 3,007,198 |
| DT Auto Owner Trust (a) | |
| Series 2021-3A, Class D | | |
| 1.31%, due 5/17/27 | 2,330,000 | 2,166,539 |
| Series 2021-4A, Class D | | |
| 1.99%, due 9/15/27 | 1,375,000 | 1,274,969 |
| Series 2021-3A, Class E | | |
| 2.65%, due 9/15/28 | 905,000 | 842,738 |
| Series 2020-3A, Class E | | |
| 3.62%, due 10/15/27 | 2,150,000 | 2,081,865 |
| Exeter Automobile Receivables Trust | |
| Series 2021-2A, Class D | | |
| 1.40%, due 4/15/27 | 1,710,000 | 1,614,503 |
| Series 2021-1A, Class E | | |
| 2.21%, due 2/15/28 (a) | 1,500,000 | 1,399,668 |
| Series 2021-3A, Class E | | |
| 3.04%, due 12/15/28 (a) | 3,825,000 | 3,483,680 |
| Flagship Credit Auto Trust (a) | |
| Series 2021-4, Class C | | |
| 1.96%, due 12/15/27 | 1,340,000 | 1,262,724 |
| Series 2021-4, Class D | | |
| 2.26%, due 12/15/27 | 3,765,000 | 3,428,316 |
| Series 2020-1, Class D | | |
| 2.48%, due 3/16/26 | 1,000,000 | 976,011 |
| Series 2020-1, Class E | | |
| 3.52%, due 6/15/27 | 2,460,000 | 2,283,891 |
| | Principal
Amount | Value |
| |
| Automobile Asset-Backed Securities (continued) |
| Flagship Credit Auto Trust (a) (continued) | |
| Series 2022-1, Class D | | |
| 3.64%, due 3/15/28 | $ 715,000 | $ 662,424 |
| Series 2019-2, Class E | | |
| 4.52%, due 12/15/26 | 1,258,000 | 1,227,381 |
| Series 2020-3, Class E | | |
| 4.98%, due 12/15/27 | 1,295,000 | 1,217,986 |
| Series 2022-2, Class D | | |
| 5.80%, due 4/17/28 | 1,995,000 | 1,851,356 |
| Ford Credit Auto Owner Trust | |
| Series 2023-2, Class B | | |
| 5.92%, due 2/15/36 (a) | 1,405,000 | 1,440,408 |
| GLS Auto Receivables Issuer Trust (a) | |
| Series 2021-3A, Class D | | |
| 1.48%, due 7/15/27 | 3,630,000 | 3,386,410 |
| Series 2021-4A, Class D | | |
| 2.48%, due 10/15/27 | 2,285,000 | 2,137,313 |
| Series 2021-2A, Class E | | |
| 2.87%, due 5/15/28 | 2,410,000 | 2,247,122 |
| Series 2021-1A, Class E | | |
| 3.14%, due 1/18/28 | 1,140,000 | 1,088,641 |
| Series 2021-3A, Class E | | |
| 3.20%, due 10/16/28 | 2,780,000 | 2,562,785 |
| Series 2020-1A, Class D | | |
| 3.68%, due 11/16/26 | 1,430,000 | 1,404,423 |
| Hertz Vehicle Financing III LP (a) | |
| Series 2021-2A, Class C | | |
| 2.52%, due 12/27/27 | 5,027,000 | 4,504,569 |
| Series 2021-2A, Class D | | |
| 4.34%, due 12/27/27 | 3,289,000 | 2,939,778 |
| Hertz Vehicle Financing LLC | |
| Series 2021-1A, Class C | | |
| 2.05%, due 12/26/25 (a) | 1,155,000 | 1,111,621 |
| Santander Bank Auto Credit-Linked Notes | |
| Series 2023-B, Class F | | |
| 12.24%, due 12/15/33 (a) | 1,115,000 | 1,115,960 |
| Santander Drive Auto Receivables Trust | |
| Series 2021-3, Class D | | |
| 1.33%, due 9/15/27 | 1,625,000 | 1,552,439 |
| Series 2021-4, Class D | | |
| 1.67%, due 10/15/27 | 3,260,000 | 3,082,204 |
| | | 70,890,151 |
| Credit Card Asset-Backed Security 0.1% |
| Golden Credit Card Trust | |
| Series 2021-1A, Class C | | |
| 1.74%, due 8/15/28 (a) | 540,000 | 487,979 |
The notes to the financial statements are an integral part of, and should be read in conjunction with, the financial statements.
| 10 | MainStay VP MacKay Strategic Bond Portfolio |
| | Principal
Amount | Value |
| Asset-Backed Securities (continued) |
| Home Equity Asset-Backed Securities 0.1% |
| First NLC Trust | |
| Series 2007-1, Class A1 | | |
| 5.54% (1 Month SOFR + 0.184%), due 8/25/37 (a)(b) | $ 52,510 | $ 25,636 |
| J.P. Morgan Mortgage Acquisition Trust | |
| Series 2007-HE1, Class AF1 | | |
| 4.414% (1 Month SOFR + 0.214%), due 3/25/47 (b) | 18,203 | 10,999 |
| Mastr Asset-Backed Securities Trust | |
| Series 2006-HE4, Class A1 | | |
| 5.57% (1 Month SOFR + 0.214%), due 11/25/36 (b) | 15,057 | 4,709 |
| Morgan Stanley ABS Capital I, Inc. Trust (b) | |
| Series 2007-HE4, Class A2A | | |
| 5.58% (1 Month SOFR + 0.224%), due 2/25/37 | 16,174 | 5,118 |
| Series 2007-HE7, Class M1 | | |
| 7.47% (1 Month SOFR + 2.114%), due 7/25/37 | 930,000 | 692,957 |
| | | 739,419 |
| Other Asset-Backed Securities 4.2% |
| American Airlines Pass-Through Trust | |
| Series 2016-2, Class A | | |
| 3.65%, due 6/15/28 | 1,351,023 | 1,206,675 |
| Series 2019-1, Class B | | |
| 3.85%, due 2/15/28 | 1,096,601 | 979,851 |
| Series 2021-1, Class B | | |
| 3.95%, due 7/11/30 | 1,365,000 | 1,211,534 |
| Series 2015-2, Class A | | |
| 4.00%, due 9/22/27 | 322,355 | 294,511 |
| Auxilior Term Funding LLC | |
| Series 2023-1A, Class D | | |
| 7.27%, due 12/16/30 (a) | 955,000 | 970,402 |
| CF Hippolyta Issuer LLC (a) | |
| Series 2020-1, Class A1 | | |
| 1.69%, due 7/15/60 | 1,358,173 | 1,255,181 |
| Series 2021-1A, Class B1 | | |
| 1.98%, due 3/15/61 | 5,579,289 | 4,731,942 |
| Series 2020-1, Class A2 | | |
| 1.99%, due 7/15/60 | 1,304,258 | 1,111,361 |
| Series 2020-1, Class B1 | | |
| 2.28%, due 7/15/60 | 1,300,608 | 1,190,184 |
| DB Master Finance LLC | |
| Series 2021-1A, Class A23 | | |
| 2.791%, due 11/20/51 (a) | 1,504,300 | 1,241,213 |
| | Principal
Amount | Value |
| |
| Other Asset-Backed Securities (continued) |
| FirstKey Homes Trust | |
| Series 2021-SFR1, Class B | | |
| 1.788%, due 8/17/38 (a) | $ 1,735,000 | $ 1,567,027 |
| Home Partners of America Trust | |
| Series 2021-2, Class B | | |
| 2.302%, due 12/17/26 (a) | 750,546 | 679,165 |
| Navient Private Education Refi Loan Trust (a) | |
| Series 2020-GA, Class B | | |
| 2.50%, due 9/16/69 | 1,485,000 | 1,141,978 |
| Series 2020-HA, Class B | | |
| 2.78%, due 1/15/69 | 840,000 | 686,399 |
| New Economy Assets Phase 1 Sponsor LLC | |
| Series 2021-1, Class B1 | | |
| 2.41%, due 10/20/61 (a) | 3,775,000 | 3,060,491 |
| PFS Financing Corp. | |
| Series 2022-D, Class B | | |
| 4.90%, due 8/15/27 (a) | 1,790,000 | 1,753,646 |
| Sierra Timeshare Receivables Funding LLC | |
| Series 2023-2A, Class C | | |
| 7.30%, due 4/20/40 (a) | 712,142 | 728,159 |
| Taco Bell Funding LLC | |
| Series 2021-1A, Class A23 | | |
| 2.542%, due 8/25/51 (a) | 1,454,100 | 1,177,172 |
| Tricon American Homes | |
| Series 2020-SFR1, Class C | | |
| 2.249%, due 7/17/38 (a) | 1,780,000 | 1,628,430 |
| U.S. Airways Pass-Through Trust | |
| Series 2012-1, Class A | | |
| 5.90%, due 10/1/24 | 638,602 | 638,647 |
| United Airlines Pass-Through Trust | |
| Series 2020-1, Class A | | |
| 5.875%, due 10/15/27 | 1,442,773 | 1,460,706 |
| | | 28,714,674 |
Total Asset-Backed Securities
(Cost $106,017,315) | | 100,832,223 |
| Corporate Bonds 34.4% |
| Agriculture 0.2% |
| BAT Capital Corp. | | |
| 3.734%, due 9/25/40 | 1,160,000 | 852,722 |
| BAT International Finance plc | | |
| 4.448%, due 3/16/28 | 650,000 | 639,251 |
| | | 1,491,973 |
| Airlines 1.3% |
| American Airlines, Inc. (a) | | |
| 5.50%, due 4/20/26 | 1,366,667 | 1,356,808 |
The notes to the financial statements are an integral part of, and should be read in conjunction with, the financial statements.
11
Portfolio of Investments December 31, 2023†^ (continued)
| | Principal
Amount | Value |
| Corporate Bonds (continued) |
| Airlines (continued) |
| American Airlines, Inc. (a) (continued) | | |
| 5.75%, due 4/20/29 | $ 3,255,000 | $ 3,172,852 |
| Delta Air Lines, Inc. (a) | | |
| 4.50%, due 10/20/25 | 787,009 | 775,051 |
| 4.75%, due 10/20/28 | 2,245,000 | 2,207,932 |
| Mileage Plus Holdings LLC | | |
| 6.50%, due 6/20/27 (a) | 1,435,000 | 1,439,074 |
| | | 8,951,717 |
| Apparel 0.2% |
| Tapestry, Inc. | | |
| 7.85%, due 11/27/33 | 1,040,000 | 1,109,557 |
| Auto Manufacturers 2.3% |
| Ford Motor Credit Co. LLC | | |
| 2.30%, due 2/10/25 | 1,085,000 | 1,043,413 |
| 4.125%, due 8/17/27 | 1,380,000 | 1,306,423 |
| 6.80%, due 5/12/28 | 2,175,000 | 2,271,680 |
| 6.95%, due 3/6/26 | 1,150,000 | 1,178,122 |
| 7.20%, due 6/10/30 | 965,000 | 1,027,770 |
| General Motors Financial Co., Inc. | | |
| 2.35%, due 1/8/31 | 908,000 | 750,614 |
| 2.70%, due 6/10/31 | 2,255,000 | 1,890,722 |
| 4.30%, due 4/6/29 | 1,400,000 | 1,348,583 |
| Nissan Motor Acceptance Co. LLC | | |
| 1.85%, due 9/16/26 (a) | 5,030,000 | 4,522,541 |
| | | 15,339,868 |
| Banks 12.3% |
| Banco Santander SA | | |
| 4.175% (1 Year Treasury Constant Maturity Rate + 2.00%), due 3/24/28 (b) | 3,000,000 | 2,887,022 |
| Bank of America Corp. | | |
| 2.087%, due 6/14/29 (c) | 920,000 | 810,813 |
| 2.687%, due 4/22/32 (c) | 2,520,000 | 2,127,965 |
| 3.384%, due 4/2/26 (c) | 2,185,000 | 2,125,040 |
| Series MM | | |
| 4.30%, due 1/28/25 (c)(d) | 1,741,000 | 1,641,139 |
| 8.57%, due 11/15/24 | 455,000 | 467,704 |
| Barclays plc | | |
| 4.375% (5 Year Treasury Constant Maturity Rate + 3.41%), due 3/15/28 (b)(d) | 2,340,000 | 1,819,129 |
| 5.20%, due 5/12/26 | 1,725,000 | 1,713,817 |
| | Principal
Amount | Value |
| |
| Banks (continued) |
| Barclays plc (continued) | | |
| 8.00% (5 Year Treasury Constant Maturity Rate + 5.431%), due 3/15/29 (b)(d) | $ 1,000,000 | $ 981,412 |
| BNP Paribas SA (a) | | |
| 3.052%, due 1/13/31 (c) | 1,720,000 | 1,510,981 |
| 4.625% (5 Year Treasury Constant Maturity Rate + 3.196%), due 1/12/27 (b)(d) | 1,600,000 | 1,398,057 |
| 4.625% (5 Year Treasury Constant Maturity Rate + 3.34%), due 2/25/31 (b)(d) | 2,250,000 | 1,812,323 |
| 7.75% (5 Year Treasury Constant Maturity Rate + 4.899%), due 8/16/29 (b)(d) | 705,000 | 719,643 |
| BPCE SA (a) | | |
| 2.045%, due 10/19/27 (c) | 1,370,000 | 1,243,361 |
| 5.125%, due 1/18/28 | 585,000 | 583,612 |
| 6.714%, due 10/19/29 (c) | 700,000 | 737,033 |
| Citigroup, Inc. | | |
| 2.52%, due 11/3/32 (c) | 1,465,000 | 1,207,622 |
| Series Y | | |
| 4.15% (5 Year Treasury Constant Maturity Rate + 3.00%), due 11/15/26 (b)(d) | 1,915,000 | 1,643,523 |
| 5.50%, due 9/13/25 | 2,710,000 | 2,722,341 |
| Series M | | |
| 6.30%, due 5/15/24 (c)(d) | 3,975,000 | 3,919,480 |
| Credit Agricole SA | | |
| 4.75% (5 Year Treasury Constant Maturity Rate + 3.237%), due 3/23/29 (a)(b)(d) | 2,965,000 | 2,515,206 |
| Deutsche Bank AG | | |
| 3.035%, due 5/28/32 (c) | 640,000 | 534,647 |
| 4.875% (USISDA05 + 2.553%), due 12/1/32 (b) | 4,285,000 | 3,995,037 |
| Fifth Third Bank NA | | |
| 3.85%, due 3/15/26 | 1,375,000 | 1,322,106 |
| First Horizon Bank | | |
| 5.75%, due 5/1/30 | 1,795,000 | 1,692,367 |
| Goldman Sachs Group, Inc. (The) | | |
| 1.948%, due 10/21/27 (c) | 1,555,000 | 1,422,546 |
| Series V | | |
| 4.125% (5 Year Treasury Constant Maturity Rate + 2.949%), due 11/10/26 (b)(d) | 1,035,000 | 921,720 |
| 6.75%, due 10/1/37 | 1,828,000 | 2,012,145 |
The notes to the financial statements are an integral part of, and should be read in conjunction with, the financial statements.
| 12 | MainStay VP MacKay Strategic Bond Portfolio |
| | Principal
Amount | Value |
| Corporate Bonds (continued) |
| Banks (continued) |
| Intesa Sanpaolo SpA | | |
| 4.198% (1 Year Treasury Constant Maturity Rate + 2.60%), due 6/1/32 (a)(b)(e) | $ 2,515,000 | $ 2,073,789 |
| Lloyds Banking Group plc | | |
| 4.582%, due 12/10/25 | 2,500,000 | 2,446,611 |
| 4.976% (1 Year Treasury Constant Maturity Rate + 2.30%), due 8/11/33 (b) | 1,095,000 | 1,066,432 |
| Macquarie Group Ltd. | | |
| 2.871%, due 1/14/33 (a)(c) | 2,065,000 | 1,697,524 |
| Morgan Stanley | | |
| 2.484%, due 9/16/36 (c) | 2,895,000 | 2,294,541 |
| 5.00%, due 11/24/25 | 2,190,000 | 2,186,760 |
| NatWest Group plc (b) | | |
| 3.073% (1 Year Treasury Constant Maturity Rate + 2.55%), due 5/22/28 | 2,685,000 | 2,493,434 |
| 4.60% (5 Year Treasury Constant Maturity Rate + 3.10%), due 6/28/31 (d) | 2,740,000 | 2,056,164 |
| 5.847% (1 Year Treasury Constant Maturity Rate + 1.35%), due 3/2/27 | 1,665,000 | 1,678,936 |
| Santander Holdings USA, Inc. | | |
| 6.499%, due 3/9/29 (c) | 1,270,000 | 1,312,005 |
| Societe Generale SA (a)(b)(d) | | |
| 4.75% (5 Year Treasury Constant Maturity Rate + 3.931%), due 5/26/26 | 1,540,000 | 1,350,884 |
| 5.375% (5 Year Treasury Constant Maturity Rate + 4.514%), due 11/18/30 | 1,745,000 | 1,427,642 |
| Synchrony Bank | | |
| 5.40%, due 8/22/25 | 1,970,000 | 1,940,417 |
| UBS Group AG (a) | | |
| 3.091%, due 5/14/32 (c) | 895,000 | 762,241 |
| 4.375% (5 Year Treasury Constant Maturity Rate + 3.313%), due 2/10/31 (b)(d) | 2,715,000 | 2,144,250 |
| 4.751% (1 Year Treasury Constant Maturity Rate + 1.75%), due 5/12/28 (b) | 590,000 | 581,026 |
| 6.442%, due 8/11/28 (c) | 830,000 | 861,954 |
| Wells Fargo & Co. | | |
| 3.00%, due 10/23/26 (e) | 1,640,000 | 1,556,974 |
| 3.35%, due 3/2/33 (c) | 1,510,000 | 1,318,859 |
| | Principal
Amount | Value |
| |
| Banks (continued) |
| Wells Fargo & Co. (continued) | | |
| 5.557%, due 7/25/34 (c) | $ 395,000 | $ 402,153 |
| Series U | | |
| 5.875% (3 Month LIBOR + 3.99%), due 6/15/25 (b)(d) | 595,000 | 588,798 |
| Series S | | |
| 5.90% (3 Month LIBOR + 3.11%), due 6/15/24 (b)(d) | 2,725,000 | 2,696,272 |
| Westpac Banking Corp. | | |
| 3.02% (5 Year Treasury Constant Maturity Rate + 1.53%), due 11/18/36 (b) | 1,825,000 | 1,483,528 |
| | | 82,908,985 |
| Building Materials 0.4% |
| CEMEX Materials LLC | | |
| 7.70%, due 7/21/25 (a) | 2,645,000 | 2,697,900 |
| Chemicals 0.9% |
| Alpek SAB de CV | | |
| 3.25%, due 2/25/31 (a) | 3,185,000 | 2,728,363 |
| Braskem Netherlands Finance BV (a) | | |
| 4.50%, due 1/10/28 | 1,015,000 | 830,815 |
| 8.50%, due 1/12/31 | 610,000 | 567,300 |
| Sasol Financing USA LLC | | |
| 5.875%, due 3/27/24 | 2,080,000 | 2,067,260 |
| | | 6,193,738 |
| Commercial Services 0.4% |
| Ashtead Capital, Inc. | | |
| 4.25%, due 11/1/29 (a) | 1,960,000 | 1,830,165 |
| California Institute of Technology | | |
| 3.65%, due 9/1/2119 | 1,144,000 | 814,706 |
| | | 2,644,871 |
| Computers 0.1% |
| Dell International LLC | | |
| 8.10%, due 7/15/36 | 670,000 | 824,033 |
| Diversified Financial Services 2.9% |
| AerCap Ireland Capital DAC | | |
| 3.00%, due 10/29/28 | 2,200,000 | 2,008,575 |
| Air Lease Corp. | | |
| 2.30%, due 2/1/25 | 1,820,000 | 1,755,873 |
| Aircastle Ltd. | | |
| 5.25% (5 Year Treasury Constant Maturity Rate + 4.41%), due 6/15/26 (a)(b)(d) | 1,740,000 | 1,491,722 |
The notes to the financial statements are an integral part of, and should be read in conjunction with, the financial statements.
13
Portfolio of Investments December 31, 2023†^ (continued)
| | Principal
Amount | Value |
| Corporate Bonds (continued) |
| Diversified Financial Services (continued) |
| Ally Financial, Inc. | | |
| 5.75%, due 11/20/25 | $ 3,570,000 | $ 3,547,758 |
| 8.00%, due 11/1/31 | 2,010,000 | 2,201,955 |
| Avolon Holdings Funding Ltd. | | |
| 3.25%, due 2/15/27 (a) | 2,340,000 | 2,164,127 |
| Banco BTG Pactual SA | | |
| 2.75%, due 1/11/26 (a) | 1,545,000 | 1,456,084 |
| Capital One Financial Corp. | | |
| 6.312%, due 6/8/29 (c) | 1,875,000 | 1,923,581 |
| Nomura Holdings, Inc. | | |
| 5.099%, due 7/3/25 | 1,985,000 | 1,971,537 |
| OneMain Finance Corp. | | |
| 3.50%, due 1/15/27 | 1,175,000 | 1,087,397 |
| | | 19,608,609 |
| Electric 2.2% |
| AEP Texas, Inc. | | |
| 4.70%, due 5/15/32 | 1,460,000 | 1,425,797 |
| American Electric Power Co., Inc. | | |
| 5.625%, due 3/1/33 | 1,850,000 | 1,927,312 |
| Calpine Corp. | | |
| 5.125%, due 3/15/28 (a) | 1,260,000 | 1,208,061 |
| Dominion Energy, Inc. | | |
| Series C | | |
| 4.35% (5 Year Treasury Constant Maturity Rate + 3.195%), due 1/15/27 (b)(d) | 1,045,000 | 926,617 |
| FirstEnergy Transmission LLC | | |
| 4.35%, due 1/15/25 (a) | 1,675,000 | 1,647,945 |
| Pacific Gas and Electric Co. | | |
| 3.50%, due 8/1/50 | 2,460,000 | 1,698,324 |
| Sempra | | |
| 4.125% (5 Year Treasury Constant Maturity Rate + 2.868%), due 4/1/52 (b) | 2,935,000 | 2,518,725 |
| Virginia Electric and Power Co. | | |
| 5.70%, due 8/15/53 | 1,585,000 | 1,679,488 |
| WEC Energy Group, Inc. | | |
| 7.754% (3 Month SOFR + 2.374%), due 5/15/67 (b) | 1,860,340 | 1,664,080 |
| | | 14,696,349 |
| Electronics 0.3% |
| Arrow Electronics, Inc. | | |
| 6.125%, due 3/1/26 (e) | 1,830,000 | 1,832,220 |
| | Principal
Amount | Value |
| |
| Environmental Control 0.1% |
| Covanta Holding Corp. | | |
| 4.875%, due 12/1/29 (a) | $ 1,025,000 | $ 895,532 |
| Food 0.7% |
| JBS USA LUX SA | | |
| 5.75%, due 4/1/33 | 2,290,000 | 2,268,443 |
| Minerva Luxembourg SA | | |
| 8.875%, due 9/13/33 (a) | 1,075,000 | 1,136,591 |
| Smithfield Foods, Inc. | | |
| 3.00%, due 10/15/30 (a) | 2,005,000 | 1,645,949 |
| | | 5,050,983 |
| Gas 1.0% |
| Brooklyn Union Gas Co. (The) | | |
| 6.388%, due 9/15/33 (a) | 1,300,000 | 1,357,100 |
| National Fuel Gas Co. | | |
| 2.95%, due 3/1/31 | 1,195,000 | 1,000,324 |
| 5.50%, due 10/1/26 | 2,120,000 | 2,123,144 |
| Piedmont Natural Gas Co., Inc. | | |
| 5.05%, due 5/15/52 | 1,330,000 | 1,233,924 |
| Southern Co. Gas Capital Corp. | | |
| Series 21A | | |
| 3.15%, due 9/30/51 | 2,010,000 | 1,350,744 |
| | | 7,065,236 |
| Household Products & Wares 0.4% |
| Kronos Acquisition Holdings, Inc. | | |
| 5.00%, due 12/31/26 (a) | 2,890,000 | 2,817,750 |
| Insurance 1.1% |
| Lincoln National Corp. | | |
| 7.988% (3 Month SOFR + 2.619%), due 5/17/66 (b) | 6,418,000 | 4,520,583 |
| NMI Holdings, Inc. | | |
| 7.375%, due 6/1/25 (a) | 870,000 | 871,444 |
| Protective Life Corp. | | |
| 8.45%, due 10/15/39 | 1,564,000 | 1,962,646 |
| | | 7,354,673 |
| Media 0.2% |
| DISH DBS Corp. | | |
| 5.75%, due 12/1/28 (a) | 1,445,000 | 1,152,532 |
| Miscellaneous—Manufacturing 0.4% |
| Textron Financial Corp. | | |
| 7.376% (3 Month SOFR + 1.997%), due 2/15/42 (a)(b) | 3,055,000 | 2,401,338 |
The notes to the financial statements are an integral part of, and should be read in conjunction with, the financial statements.
| 14 | MainStay VP MacKay Strategic Bond Portfolio |
| | Principal
Amount | Value |
| Corporate Bonds (continued) |
| Oil & Gas 0.1% |
| Gazprom PJSC Via Gaz Capital SA | | |
| 7.288%, due 8/16/37 (a)(f) | $ 920,000 | $ 713,000 |
| Packaging & Containers 0.2% |
| Berry Global, Inc. | | |
| 4.875%, due 7/15/26 (a) | 166,000 | 163,129 |
| Owens-Brockway Glass Container, Inc. | | |
| 6.625%, due 5/13/27 (a) | 943,000 | 943,118 |
| | | 1,106,247 |
| Pharmaceuticals 0.6% |
| Bayer US Finance LLC | | |
| 6.875%, due 11/21/53 (a)(e) | 1,020,000 | 1,086,300 |
| Teva Pharmaceutical Finance Netherlands III BV | | |
| 3.15%, due 10/1/26 | 10,000 | 9,259 |
| 4.75%, due 5/9/27 | 2,855,000 | 2,733,662 |
| 7.875%, due 9/15/29 | 10,000 | 10,778 |
| | | 3,839,999 |
| Pipelines 4.0% |
| Cheniere Corpus Christi Holdings LLC | | |
| 2.742%, due 12/31/39 | 1,825,000 | 1,453,956 |
| CNX Midstream Partners LP | | |
| 4.75%, due 4/15/30 (a) | 2,715,000 | 2,438,022 |
| DCP Midstream Operating LP | | |
| 3.25%, due 2/15/32 | 2,490,000 | 2,159,111 |
| DT Midstream, Inc. | | |
| 4.30%, due 4/15/32 (a) | 1,660,000 | 1,489,950 |
| Enbridge, Inc. | | |
| 5.70%, due 3/8/33 | 1,085,000 | 1,127,746 |
| 5.969%, due 3/8/26 | 2,440,000 | 2,440,463 |
| Energy Transfer LP | | |
| Series H | | |
| 6.50% (5 Year Treasury Constant Maturity Rate + 5.694%), due 11/15/26 (b)(d) | 3,435,000 | 3,264,212 |
| EnLink Midstream LLC | | |
| 5.625%, due 1/15/28 (a) | 785,000 | 776,116 |
| Flex Intermediate Holdco LLC | | |
| 3.363%, due 6/30/31 (a) | 2,310,000 | 1,890,799 |
| MPLX LP | | |
| 4.00%, due 3/15/28 | 2,500,000 | 2,410,043 |
| 4.125%, due 3/1/27 | 1,780,000 | 1,742,413 |
| Plains All American Pipeline LP | | |
| 3.80%, due 9/15/30 (e) | 1,330,000 | 1,223,857 |
| | Principal
Amount | Value |
| |
| Pipelines (continued) |
| Sabine Pass Liquefaction LLC | | |
| 5.75%, due 5/15/24 | $ 411,000 | $ 410,762 |
| Targa Resources Corp. | | |
| 4.20%, due 2/1/33 | 935,000 | 859,670 |
| Venture Global LNG, Inc. | | |
| 9.875%, due 2/1/32 (a) | 980,000 | 1,020,806 |
| Western Midstream Operating LP | | |
| 5.25%, due 2/1/50 (g) | 2,100,000 | 1,882,777 |
| Williams Cos., Inc. (The) | | |
| 3.50%, due 10/15/51 | 1,000,000 | 729,898 |
| | | 27,320,601 |
| Real Estate Investment Trusts 0.8% |
| Iron Mountain, Inc. | | |
| 4.875%, due 9/15/29 (a) | 2,254,000 | 2,134,726 |
| Starwood Property Trust, Inc. | | |
| 3.625%, due 7/15/26 (a) | 3,409,000 | 3,229,278 |
| | | 5,364,004 |
| Retail 0.4% |
| AutoNation, Inc. | | |
| 4.75%, due 6/1/30 | 1,116,000 | 1,077,879 |
| Nordstrom, Inc. | | |
| 4.25%, due 8/1/31 (e) | 1,675,000 | 1,393,566 |
| | | 2,471,445 |
| Semiconductors 0.4% |
| Broadcom, Inc. (a) | | |
| 3.469%, due 4/15/34 | 2,470,000 | 2,148,912 |
| 3.75%, due 2/15/51 | 910,000 | 715,407 |
| | | 2,864,319 |
| Telecommunications 0.5% |
| Altice France SA | | |
| 5.125%, due 7/15/29 (a)(e) | 3,495,000 | 2,719,177 |
| AT&T, Inc. | | |
| 3.50%, due 9/15/53 | 1,405,000 | 1,019,619 |
| | | 3,738,796 |
Total Corporate Bonds
(Cost $253,232,840) | | 232,456,275 |
| Foreign Government Bonds 2.2% |
| Brazil 0.1% |
| Brazil Government Bond | | |
| 3.75%, due 9/12/31 | 565,000 | 503,547 |
The notes to the financial statements are an integral part of, and should be read in conjunction with, the financial statements.
15
Portfolio of Investments December 31, 2023†^ (continued)
| | Principal
Amount | Value |
| Foreign Government Bonds (continued) |
| Chile 0.5% |
| Empresa Nacional del Petroleo | | |
| 3.45%, due 9/16/31 (a) | $ 4,005,000 | $ 3,366,049 |
| Colombia 0.3% |
| Colombia Government Bond | | |
| 3.25%, due 4/22/32 | 2,065,000 | 1,638,947 |
| 4.50%, due 1/28/26 | 650,000 | 638,859 |
| | | 2,277,806 |
| Mexico 1.3% |
| Comision Federal de Electricidad (a) | | |
| 3.875%, due 7/26/33 | 2,315,000 | 1,874,963 |
| 4.677%, due 2/9/51 | 2,765,000 | 1,958,141 |
| Petroleos Mexicanos | | |
| 6.50%, due 3/13/27 | 3,570,000 | 3,327,707 |
| 6.75%, due 9/21/47 | 1,945,000 | 1,272,645 |
| | | 8,433,456 |
Total Foreign Government Bonds
(Cost $17,915,057) | | 14,580,858 |
| Loan Assignments 0.2% |
| Diversified/Conglomerate Service 0.2% |
| TruGreen LP (b) | |
| First Lien Second Refinancing Term Loan | |
| 9.456% (1 Month SOFR + 4.00%), due 11/2/27 | 934,454 | 901,748 |
| Second Lien Initial Term Loan | |
| 14.145% (3 Month SOFR + 8.50%), due 11/2/28 | 645,000 | 477,300 |
| | | 1,379,048 |
Total Loan Assignments
(Cost $1,564,966) | | 1,379,048 |
| Mortgage-Backed Securities 38.4% |
| Agency (Collateralized Mortgage Obligations) 9.0% |
| FHLMC | |
| REMIC, Series 4660 | | |
| (zero coupon), due 1/15/33 | 1,930,827 | 1,519,391 |
| REMIC, Series 5326, Class QO | | |
| (zero coupon), due 9/25/50 | 2,445,325 | 1,736,103 |
| REMIC, Series 5021, Class SA | | |
| (zero coupon) (SOFR 30A + 3.55%), due 10/25/50 (b)(h) | 3,737,240 | 115,157 |
| | Principal
Amount | Value |
| |
| Agency (Collateralized Mortgage Obligations) (continued) |
| FHLMC (continued) | |
| REMIC, Series 5164, Class SA | | |
| (zero coupon) (SOFR 30A + 3.75%), due 11/25/51 (b)(h) | $ 8,837,614 | $ 350,231 |
| REMIC, Series 5200, Class SA | | |
| (zero coupon) (SOFR 30A + 3.50%), due 2/25/52 (b)(h) | 3,097,942 | 98,182 |
| REMIC, Series 5326 | | |
| (zero coupon), due 8/25/53 | 758,171 | 608,473 |
| REMIC, Series 5351, Class EO | | |
| (zero coupon), due 10/25/53 | 2,913,965 | 2,292,854 |
| REMIC, Series 5357, Class OE | | |
| (zero coupon), due 11/25/53 | 1,347,844 | 1,084,297 |
| REMIC, Series 5363 | | |
| (zero coupon), due 12/25/53 | 1,434,215 | 1,207,323 |
| REMIC, Series 4839, Class WO | | |
| (zero coupon), due 8/15/56 | 1,128,607 | 811,518 |
| REMIC, Series 4993, Class KS | | |
| 0.598% (SOFR 30A + 5.936%), due 7/25/50 (b)(h) | 4,833,921 | 739,977 |
| REMIC, Series 5038, Class IB | | |
| 2.50%, due 10/25/50 (h) | 984,558 | 148,089 |
| REMIC, Series 5149, Class LI | | |
| 2.50%, due 10/25/51 (h) | 4,950,213 | 608,817 |
| REMIC, Series 5205, Class KI | | |
| 3.00%, due 12/25/48 (h) | 2,164,270 | 222,702 |
| REMIC, Series 5152, Class BI | | |
| 3.00%, due 7/25/50 (h) | 3,520,730 | 586,112 |
| REMIC, Series 5070, Class PI | | |
| 3.00%, due 8/25/50 (h) | 2,665,943 | 465,132 |
| REMIC, Series 5023, Class LI | | |
| 3.00%, due 10/25/50 (h) | 1,593,259 | 254,529 |
| REMIC, Series 5167, Class GI | | |
| 3.00%, due 11/25/51 (h) | 4,282,935 | 673,295 |
| REMIC, Series 5191 | | |
| 3.50%, due 9/25/50 (h) | 2,231,532 | 401,980 |
| REMIC, Series 5036 | | |
| 3.50%, due 11/25/50 (h) | 2,717,535 | 527,433 |
| REMIC, Series 5040 | | |
| 3.50%, due 11/25/50 (h) | 1,474,225 | 230,299 |
| FHLMC, Strips | |
| REMIC, Series 311 | | |
| (zero coupon), due 8/15/43 | 795,589 | 609,767 |
| REMIC, Series 311, Class S1 | | |
| 0.497% (SOFR 30A + 5.836%), due 8/15/43 (b)(h) | 2,356,730 | 280,419 |
| REMIC, Series 389, Class C35 | | |
| 2.00%, due 6/15/52 (h) | 3,749,184 | 460,909 |
The notes to the financial statements are an integral part of, and should be read in conjunction with, the financial statements.
| 16 | MainStay VP MacKay Strategic Bond Portfolio |
| | Principal
Amount | Value |
| Mortgage-Backed Securities (continued) |
| Agency (Collateralized Mortgage Obligations) (continued) |
| FNMA | |
| REMIC, Series 2021-81, Class SA | | |
| (zero coupon) (SOFR 30A + 2.60%), due 12/25/51 (b)(h) | $ 13,102,777 | $ 161,928 |
| REMIC, Series 2022-3, Class YS | | |
| (zero coupon) (SOFR 30A + 2.55%), due 2/25/52 (b)(h) | 10,405,152 | 105,933 |
| REMIC, Series 2022-5, Class SN | | |
| (zero coupon) (SOFR 30A + 1.80%), due 2/25/52 (b)(h) | 1,727,332 | 9,200 |
| REMIC, Series 2023-41 | | |
| (zero coupon), due 9/25/53 | 1,186,691 | 919,765 |
| REMIC, Series 2023-45 | | |
| (zero coupon), due 10/25/53 | 1,487,743 | 1,144,714 |
| REMIC, Series 2023-51 | | |
| (zero coupon), due 11/25/53 | 1,455,525 | 1,204,558 |
| REMIC, Series 2022-10, Class SA | | |
| 0.413% (SOFR 30A + 5.75%), due 2/25/52 (b)(h) | 2,458,265 | 357,974 |
| REMIC, Series 2021-40, Class SI | | |
| 0.498% (SOFR 30A + 5.836%), due 9/25/47 (b)(h) | 3,027,052 | 339,868 |
| REMIC, Series 2016-57, Class SN | | |
| 0.598% (SOFR 30A + 5.936%), due 6/25/46 (b)(h) | 2,320,676 | 269,990 |
| REMIC, Series 2019-32, Class SB | | |
| 0.598% (SOFR 30A + 5.936%), due 6/25/49 (b)(h) | 2,390,315 | 270,480 |
| REMIC, Series 2020-23, Class PS | | |
| 0.598% (SOFR 30A + 5.936%), due 2/25/50 (b)(h) | 2,757,388 | 359,053 |
| REMIC, Series 2016-19, Class SD | | |
| 0.648% (SOFR 30A + 5.986%), due 4/25/46 (b)(h) | 4,716,788 | 423,397 |
| REMIC, Series 2021-10, Class LI | | |
| 2.50%, due 3/25/51 (h) | 1,596,719 | 225,954 |
| REMIC, Series 2021-12, Class JI | | |
| 2.50%, due 3/25/51 (h) | 1,982,007 | 313,522 |
| REMIC, Series 2021-95, Class KI | | |
| 2.50%, due 4/25/51 (h) | 5,775,251 | 766,937 |
| REMIC, Series 2021-54, Class HI | | |
| 2.50%, due 6/25/51 (h) | 795,711 | 105,432 |
| REMIC, Series 2021-85, Class BI | | |
| 3.00%, due 12/25/51 (h) | 4,041,932 | 655,883 |
| REMIC, Series 2021-8, Class ID | | |
| 3.50%, due 3/25/51 (h) | 2,634,573 | 519,012 |
| | Principal
Amount | Value |
| |
| Agency (Collateralized Mortgage Obligations) (continued) |
| FNMA (continued) | |
| REMIC, Series 2020-10, Class DA | | |
| 3.50%, due 3/25/60 | $ 1,316,565 | $ 1,163,038 |
| FNMA, Strips (h) | |
| REMIC, Series 426, Class C32 | | |
| 1.50%, due 2/25/52 | 6,859,732 | 644,612 |
| REMIC, Series 427, Class C77 | | |
| 2.50%, due 9/25/51 | 4,609,351 | 661,513 |
| GNMA | |
| REMIC, Series 2019-136, Class YS | | |
| (zero coupon) (1 Month SOFR + 2.716%), due 11/20/49 (b)(h) | 667,334 | 9,919 |
| REMIC, Series 2020-1, Class YS | | |
| (zero coupon) (1 Month SOFR + 2.716%), due 1/20/50 (b)(h) | 3,941,404 | 59,860 |
| REMIC, Series 2020-129, Class SB | | |
| (zero coupon) (1 Month SOFR + 3.086%), due 9/20/50 (b)(h) | 5,458,189 | 99,292 |
| REMIC, Series 2021-97, Class SD | | |
| (zero coupon) (SOFR 30A + 2.60%), due 6/20/51 (b)(h) | 12,351,569 | 180,999 |
| REMIC, Series 2021-158, Class SB | | |
| (zero coupon) (SOFR 30A + 3.70%), due 9/20/51 (b)(h) | 4,632,788 | 173,214 |
| REMIC, Series 2021-205, Class DS | | |
| (zero coupon) (SOFR 30A + 3.20%), due 11/20/51 (b)(h) | 9,212,997 | 159,721 |
| REMIC, Series 2021-214, Class SA | | |
| (zero coupon) (SOFR 30A + 1.70%), due 12/20/51 (b)(h) | 42,797,361 | 220,492 |
| REMIC, Series 2022-19, Class SG | | |
| (zero coupon) (SOFR 30A + 2.45%), due 1/20/52 (b)(h) | 7,241,118 | 70,747 |
| REMIC, Series 2022-24, Class SC | | |
| (zero coupon) (SOFR 30A + 2.37%), due 2/20/52 (b)(h) | 36,545,811 | 295,338 |
| REMIC, Series 2023-66, Class OQ | | |
| (zero coupon), due 7/20/52 | 1,447,821 | 1,121,703 |
| REMIC, Series 2023-53 | | |
| (zero coupon), due 4/20/53 | 937,424 | 687,205 |
| REMIC, Series 2023-80, Class SA | | |
| (zero coupon) (SOFR 30A + 5.25%), due 6/20/53 (b)(h) | 9,157,337 | 409,003 |
| REMIC, Series 2023-101, Class EO | | |
| (zero coupon), due 7/20/53 | 1,316,888 | 1,091,478 |
| REMIC, Series 2020-183, Class HT | | |
| 0.432% (SOFR 30A + 5.77%), due 12/20/50 (b)(h) | 4,413,330 | 415,327 |
The notes to the financial statements are an integral part of, and should be read in conjunction with, the financial statements.
17
Portfolio of Investments December 31, 2023†^ (continued)
| | Principal
Amount | Value |
| Mortgage-Backed Securities (continued) |
| Agency (Collateralized Mortgage Obligations) (continued) |
| GNMA (continued) | |
| REMIC, Series 2023-60, Class ES | | |
| 0.525% (SOFR 30A + 11.20%), due 4/20/53 (b) | $ 2,238,018 | $ 2,041,466 |
| REMIC, Series 2022-190, Class HS | | |
| 0.578% (1 Month SOFR + 5.936%), due 2/20/50 (b)(h) | 8,927,134 | 1,034,286 |
| REMIC, Series 2020-34, Class SC | | |
| 0.578% (1 Month SOFR + 5.936%), due 3/20/50 (b)(h) | 2,970,784 | 388,507 |
| REMIC, Series 2020-146, Class SA | | |
| 0.828% (1 Month SOFR + 6.186%), due 10/20/50 (b)(h) | 2,907,347 | 437,110 |
| REMIC, Series 2020-167, Class SN | | |
| 0.828% (1 Month SOFR + 6.186%), due 11/20/50 (b)(h) | 1,431,252 | 201,895 |
| REMIC, Series 2021-179, Class SA | | |
| 0.828% (1 Month SOFR + 6.186%), due 11/20/50 (b)(h) | 4,346,588 | 604,172 |
| REMIC, Series 2020-189, Class SU | | |
| 0.828% (1 Month SOFR + 6.186%), due 12/20/50 (b)(h) | 953,741 | 138,330 |
| REMIC, Series 2021-46, Class TS | | |
| 0.828% (1 Month SOFR + 6.186%), due 3/20/51 (b)(h) | 2,058,083 | 287,761 |
| REMIC, Series 2021-57, Class SA | | |
| 0.828% (1 Month SOFR + 6.186%), due 3/20/51 (b)(h) | 3,330,403 | 473,936 |
| REMIC, Series 2021-96, Class NS | | |
| 0.828% (1 Month SOFR + 6.186%), due 6/20/51 (b)(h) | 5,353,164 | 732,639 |
| REMIC, Series 2021-96, Class SN | | |
| 0.828% (1 Month SOFR + 6.186%), due 6/20/51 (b)(h) | 3,745,294 | 482,987 |
| REMIC, Series 2021-97, Class SM | | |
| 0.828% (1 Month SOFR + 6.186%), due 6/20/51 (b)(h) | 3,938,162 | 567,178 |
| REMIC, Series 2021-122, Class HS | | |
| 0.828% (1 Month SOFR + 6.186%), due 7/20/51 (b)(h) | 3,473,729 | 508,446 |
| REMIC, Series 2022-137, Class S | | |
| 0.828% (1 Month SOFR + 6.186%), due 7/20/51 (b)(h) | 3,763,937 | 556,591 |
| REMIC, Series 2021-96, Class JS | | |
| 0.878% (1 Month SOFR + 6.236%), due 6/20/51 (b)(h) | 3,527,893 | 419,283 |
| | Principal
Amount | Value |
| |
| Agency (Collateralized Mortgage Obligations) (continued) |
| GNMA (continued) | |
| REMIC, Series 2020-166, Class CA | | |
| 1.00%, due 11/20/50 | $ 2,992,352 | $ 2,231,141 |
| REMIC, Series 2023-86, Class SE | | |
| 1.312% (SOFR 30A + 6.65%), due 9/20/50 (b)(h) | 2,640,099 | 379,089 |
| REMIC, Series 2023-66, Class MP | | |
| 1.625% (SOFR 30A + 12.30%), due 5/20/53 (b) | 2,162,560 | 2,117,159 |
| REMIC, Series 2021-41, Class FS | | |
| 2.00% (SOFR 30A + 0.20%), due 10/20/50 (b)(h) | 4,426,927 | 471,546 |
| REMIC, Series 2020-166, Class IC | | |
| 2.00%, due 11/20/50 (h) | 1,912,272 | 193,730 |
| REMIC, Series 2020-176, Class AI | | |
| 2.00%, due 11/20/50 (h) | 11,872,387 | 1,172,266 |
| REMIC, Series 2020-185, Class BI | | |
| 2.00%, due 12/20/50 (h) | 2,182,180 | 242,641 |
| REMIC, Series 2020-188 | | |
| 2.00%, due 12/20/50 (h) | 4,096,379 | 418,681 |
| REMIC, Series 2021-57, Class AI | | |
| 2.00%, due 2/20/51 (h) | 4,296,347 | 428,651 |
| REMIC, Series 2021-49, Class YI | | |
| 2.00%, due 3/20/51 (h) | 584,366 | 63,067 |
| REMIC, Series 2021-205, Class GA | | |
| 2.00%, due 11/20/51 | 794,693 | 652,206 |
| REMIC, Series 2022-10, Class IC | | |
| 2.00%, due 11/20/51 (h) | 3,161,347 | 377,463 |
| REMIC, Series 2021-97, Class IN | | |
| 2.50%, due 8/20/49 (h) | 5,175,805 | 533,203 |
| REMIC, Series 2019-159, Class P | | |
| 2.50%, due 9/20/49 | 1,525,974 | 1,325,196 |
| REMIC, Series 2022-1, Class IA | | |
| 2.50%, due 6/20/50 (h) | 804,299 | 107,160 |
| REMIC, Series 2020-122, Class IW | | |
| 2.50%, due 7/20/50 (h) | 2,689,571 | 351,960 |
| REMIC, Series 2020-151, Class TI | | |
| 2.50%, due 10/20/50 (h) | 2,510,751 | 326,029 |
| REMIC, Series 2021-56, Class FE | | |
| 2.50% (SOFR 30A + 0.20%), due 10/20/50 (b)(h) | 4,894,721 | 571,473 |
| REMIC, Series 2020-173, Class EI | | |
| 2.50%, due 11/20/50 (h) | 2,795,929 | 379,000 |
| REMIC, Series 2021-1, Class PI | | |
| 2.50%, due 12/20/50 (h) | 1,430,094 | 182,846 |
| REMIC, Series 2021-137, Class HI | | |
| 2.50%, due 8/20/51 (h) | 3,096,474 | 423,930 |
The notes to the financial statements are an integral part of, and should be read in conjunction with, the financial statements.
| 18 | MainStay VP MacKay Strategic Bond Portfolio |
| | Principal
Amount | Value |
| Mortgage-Backed Securities (continued) |
| Agency (Collateralized Mortgage Obligations) (continued) |
| GNMA (continued) | |
| REMIC, Series 2021-149, Class CI | | |
| 2.50%, due 8/20/51 (h) | $ 3,949,896 | $ 509,187 |
| REMIC, Series 2021-177, Class CI | | |
| 2.50%, due 10/20/51 (h) | 2,921,281 | 382,106 |
| REMIC, Series 2022-83 | | |
| 2.50%, due 11/20/51 (h) | 4,252,390 | 558,460 |
| REMIC, Series 2021-44, Class IQ | | |
| 3.00%, due 3/20/51 (h) | 5,280,071 | 838,214 |
| REMIC, Series 2021-74, Class HI | | |
| 3.00%, due 4/20/51 (h) | 530,375 | 75,989 |
| REMIC, Series 2021-97, Class FA | | |
| 3.00% (SOFR 30A + 0.40%), due 6/20/51 (b) | 975,953 | 843,959 |
| REMIC, Series 2021-98, Class IN | | |
| 3.00%, due 6/20/51 (h) | 1,772,913 | 306,947 |
| REMIC, Series 2022-207 | | |
| 3.00%, due 8/20/51 (h) | 2,764,710 | 435,623 |
| REMIC, Series 2021-158, Class NI | | |
| 3.00%, due 9/20/51 (h) | 4,568,869 | 676,843 |
| REMIC, Series 2021-177, Class IM | | |
| 3.00%, due 10/20/51 (h) | 3,728,355 | 498,075 |
| REMIC, Series 2023-19, Class CI | | |
| 3.00%, due 11/20/51 (h) | 3,600,315 | 549,770 |
| REMIC, Series 2023-63, Class MA | | |
| 3.50%, due 5/20/50 | 1,612,645 | 1,482,054 |
| REMIC, Series 2021-146, Class IN | | |
| 3.50%, due 8/20/51 (h) | 3,240,672 | 558,537 |
| | | 61,188,838 |
| Commercial Mortgage Loans (Collateralized Mortgage Obligations) 10.2% |
| BAMLL Commercial Mortgage Securities Trust (a)(b) | |
| Series 2022-DKLX, Class E | | |
| 9.489% (1 Month SOFR + 4.127%), due 1/15/39 | 1,335,000 | 1,286,515 |
| Series 2022-DKLX, Class F | | |
| 10.319% (1 Month SOFR + 4.957%), due 1/15/39 | 1,850,000 | 1,773,192 |
| Bayview Commercial Asset Trust (a)(b) | |
| Series 2005-3A, Class A1 | | |
| 5.79% (1 Month SOFR + 0.594%), due 11/25/35 | 789,562 | 724,188 |
| Series 2007-4A, Class A1 | | |
| 6.145% (1 Month SOFR + 0.789%), due 9/25/37 | 831,154 | 761,308 |
| | Principal
Amount | Value |
| |
| Commercial Mortgage Loans (Collateralized Mortgage Obligations) (continued) |
| BBCMS Mortgage Trust (a)(b) | |
| Series 2018-TALL, Class B | | |
| 6.53% (1 Month SOFR + 1.168%), due 3/15/37 | $ 590,000 | $ 516,250 |
| Series 2018-TALL, Class C | | |
| 6.68% (1 Month SOFR + 1.318%), due 3/15/37 | 2,515,000 | 2,042,759 |
| Series 2018-TALL, Class D | | |
| 7.008% (1 Month SOFR + 1.646%), due 3/15/37 | 1,425,000 | 1,065,479 |
| BX Commercial Mortgage Trust (a)(i) | |
| Series 2020-VIV2, Class C | | |
| 3.542%, due 3/9/44 | 1,050,000 | 896,880 |
| Series 2020-VIV3, Class B | | |
| 3.544%, due 3/9/44 | 1,160,000 | 1,015,021 |
| Series 2020-VIVA, Class D | | |
| 3.549%, due 3/11/44 | 865,000 | 721,672 |
| BX Trust (a) | |
| Series 2019-OC11, Class B | | |
| 3.605%, due 12/9/41 | 300,000 | 267,420 |
| Series 2019-OC11, Class D | | |
| 3.944%, due 12/9/41 (i) | 1,085,000 | 944,346 |
| Series 2019-OC11, Class E | | |
| 3.944%, due 12/9/41 (i) | 2,265,000 | 1,917,235 |
| Series 2023-LIFE, Class C | | |
| 5.884%, due 2/15/28 | 500,000 | 480,728 |
| Series 2018-GW, Class C | | |
| 6.879% (1 Month SOFR + 1.517%), due 5/15/35 (b) | 1,145,000 | 1,124,773 |
| Series 2021-LBA, Class DV | | |
| 7.076% (1 Month SOFR + 1.714%), due 2/15/36 (b) | 1,818,862 | 1,739,961 |
| Series 2021-RISE, Class D | | |
| 7.226% (1 Month SOFR + 1.864%), due 11/15/36 (b) | 2,838,219 | 2,779,437 |
| Series 2021-ARIA, Class E | | |
| 7.721% (1 Month SOFR + 2.359%), due 10/15/36 (b) | 3,700,000 | 3,495,650 |
| Series 2022-PSB, Class C | | |
| 9.059% (1 Month SOFR + 3.697%), due 8/15/39 (b) | 885,768 | 885,953 |
| BXHPP Trust (a)(b) | |
| Series 2021-FILM, Class C | | |
| 6.576% (1 Month SOFR + 1.214%), due 8/15/36 | 1,275,000 | 1,142,772 |
The notes to the financial statements are an integral part of, and should be read in conjunction with, the financial statements.
19
Portfolio of Investments December 31, 2023†^ (continued)
| | Principal
Amount | Value |
| Mortgage-Backed Securities (continued) |
| Commercial Mortgage Loans (Collateralized Mortgage Obligations) (continued) |
| BXHPP Trust (a)(b) (continued) | |
| Series 2021-FILM, Class D | | |
| 6.976% (1 Month SOFR + 1.614%), due 8/15/36 | $ 1,675,000 | $ 1,452,374 |
| BXSC Commercial Mortgage Trust | |
| Series 2022-WSS, Class D | | |
| 8.55% (1 Month SOFR + 3.188%), due 3/15/35 (a)(b) | 1,995,000 | 1,957,459 |
| COMM Mortgage Trust | |
| Series 2012-CR4, Class AM | | |
| 3.251%, due 10/15/45 | 1,705,000 | 1,440,570 |
| CSMC WEST Trust | |
| Series 2020-WEST, Class A | | |
| 3.04%, due 2/15/35 (a) | 2,657,500 | 1,979,723 |
| DROP Mortgage Trust | |
| Series 2021-FILE, Class A | | |
| 6.626% (1 Month SOFR + 1.264%), due 10/15/43 (a)(b) | 1,775,000 | 1,639,656 |
| Extended Stay America Trust | |
| Series 2021-ESH, Class D | | |
| 7.726% (1 Month SOFR + 2.364%), due 7/15/38 (a)(b) | 3,949,385 | 3,879,940 |
| GNMA (h)(i) | |
| REMIC, Series 2020-177 | | |
| 0.817%, due 6/16/62 | 5,511,294 | 319,241 |
| REMIC, Series 2021-164 | | |
| 0.949%, due 10/16/63 | 5,956,534 | 412,673 |
| REMIC, Series 2021-108 | | |
| 0.967%, due 6/16/61 | 12,769,513 | 894,517 |
| REMIC, Series 2020-168, Class IA | | |
| 0.978%, due 12/16/62 | 4,435,892 | 308,832 |
| REMIC, Series 2021-47 | | |
| 0.992%, due 3/16/61 | 10,356,999 | 720,583 |
| Hudson Yards Mortgage Trust | |
| Series 2019-30HY, Class A | | |
| 3.228%, due 7/10/39 (a) | 795,000 | 703,252 |
| Manhattan West Mortgage Trust | |
| Series 2020-1MW, Class A | | |
| 2.13%, due 9/10/39 (a) | 1,660,000 | 1,466,404 |
| Morgan Stanley Bank of America Merrill Lynch Trust | |
| Series 2017-C34, Class A4 | | |
| 3.536%, due 11/15/52 | 800,000 | 745,578 |
| Multifamily Connecticut Avenue Securities Trust (a)(b) | |
| Series 2019-01, Class M10 | | |
| 8.702% (SOFR 30A + 3.364%), due 10/25/49 | 2,989,664 | 2,907,312 |
| | Principal
Amount | Value |
| |
| Commercial Mortgage Loans (Collateralized Mortgage Obligations) (continued) |
Multifamily Connecticut Avenue Securities Trust (a)(b)
(continued) | |
| Series 2020-01, Class M10 | | |
| 9.202% (SOFR 30A + 3.864%), due 3/25/50 | $ 3,200,992 | $ 3,085,582 |
| Series 2019-01, Class B10 | | |
| 10.952% (SOFR 30A + 5.614%), due 10/25/49 | 1,500,000 | 1,436,908 |
| Series 2023-01, Class M10 | | |
| 11.837% (SOFR 30A + 6.50%), due 11/25/53 | 3,105,000 | 3,152,394 |
| Series 2020-01, Class CE | | |
| 12.952% (SOFR 30A + 7.614%), due 3/25/50 | 640,000 | 625,417 |
| One Bryant Park Trust | |
| Series 2019-OBP, Class A | | |
| 2.516%, due 9/15/54 (a) | 3,435,000 | 2,908,185 |
| One Market Plaza Trust | |
| Series 2017-1MKT, Class A | | |
| 3.614%, due 2/10/32 (a) | 2,430,000 | 2,211,300 |
| ORL Trust (a)(b) | |
| Series 2023-GLKS, Class C | | |
| 9.013% (1 Month SOFR + 3.651%), due 10/19/36 | 660,000 | 659,383 |
| Series 2023-GLKS, Class D | | |
| 9.663% (1 Month SOFR + 4.301%), due 10/19/36 | 1,115,000 | 1,113,957 |
| SLG Office Trust | |
| Series 2021-OVA, Class F | | |
| 2.851%, due 7/15/41 (a) | 2,130,000 | 1,507,498 |
| SMRT | |
| Series 2022-MINI, Class D | | |
| 7.312% (1 Month SOFR + 1.95%), due 1/15/39 (a)(b) | 3,505,000 | 3,333,479 |
| Wells Fargo Commercial Mortgage Trust | |
| Series 2018-AUS, Class A | | |
| 4.058%, due 8/17/36 (a)(i) | 2,520,000 | 2,300,287 |
| | | 68,744,043 |
| Whole Loan (Collateralized Mortgage Obligations) 19.2% |
| American Home Mortgage Investment Trust | |
| Series 2005-4, Class 3A1 | | |
| 6.07% (1 Month SOFR + 0.714%), due 11/25/45 (b) | 1,132,786 | 784,545 |
| CIM Trust | |
| Series 2021-J2, Class AS | | |
| 0.21%, due 4/25/51 (a)(h)(j) | 50,615,456 | 560,106 |
The notes to the financial statements are an integral part of, and should be read in conjunction with, the financial statements.
| 20 | MainStay VP MacKay Strategic Bond Portfolio |
| | Principal
Amount | Value |
| Mortgage-Backed Securities (continued) |
| Whole Loan (Collateralized Mortgage Obligations) (continued) |
| Connecticut Avenue Securities Trust (a)(b) | |
| Series 2021-R03, Class 1M2 | | |
| 6.987% (SOFR 30A + 1.65%), due 12/25/41 | $ 1,215,000 | $ 1,197,931 |
| Series 2020-R02, Class 2M2 | | |
| 7.452% (SOFR 30A + 2.114%), due 1/25/40 | 1,145,934 | 1,154,635 |
| Series 2021-R03, Class 1B1 | | |
| 8.087% (SOFR 30A + 2.75%), due 12/25/41 | 2,595,000 | 2,601,443 |
| Series 2021-R01, Class 1B1 | | |
| 8.437% (SOFR 30A + 3.10%), due 10/25/41 | 4,745,000 | 4,783,297 |
| Series 2022-R01, Class 1B1 | | |
| 8.487% (SOFR 30A + 3.15%), due 12/25/41 | 2,425,000 | 2,442,307 |
| Series 2022-R02, Class 2B1 | | |
| 9.837% (SOFR 30A + 4.50%), due 1/25/42 | 3,700,000 | 3,809,044 |
| Series 2021-R03, Class 1B2 | | |
| 10.837% (SOFR 30A + 5.50%), due 12/25/41 | 1,410,000 | 1,421,466 |
| Series 2022-R08, Class 1B1 | | |
| 10.937% (SOFR 30A + 5.60%), due 7/25/42 | 1,085,000 | 1,175,260 |
| Series 2021-R01, Class 1B2 | | |
| 11.337% (SOFR 30A + 6.00%), due 10/25/41 | 3,170,000 | 3,240,398 |
| Series 2022-R01, Class 1B2 | | |
| 11.337% (SOFR 30A + 6.00%), due 12/25/41 | 1,785,000 | 1,820,418 |
| Series 2020-SBT1, Class 1B1 | | |
| 12.202% (SOFR 30A + 6.864%), due 2/25/40 | 1,900,000 | 1,994,214 |
| Series 2022-R04, Class 1B2 | | |
| 14.837% (SOFR 30A + 9.50%), due 3/25/42 | 965,000 | 1,075,207 |
| FHLMC STACR REMIC Trust (a)(b) | |
| Series 2021-DNA6, Class M2 | | |
| 6.837% (SOFR 30A + 1.50%), due 10/25/41 | 1,120,000 | 1,110,201 |
| Series 2021-HQA2, Class M2 | | |
| 7.387% (SOFR 30A + 2.05%), due 12/25/33 | 3,810,000 | 3,752,390 |
| Series 2021-HQA3, Class M2 | | |
| 7.437% (SOFR 30A + 2.10%), due 9/25/41 | 4,820,000 | 4,755,135 |
| | Principal
Amount | Value |
| |
| Whole Loan (Collateralized Mortgage Obligations) (continued) |
| FHLMC STACR REMIC Trust (a)(b) (continued) | |
| Series 2021-HQA4, Class M2 | | |
| 7.687% (SOFR 30A + 2.35%), due 12/25/41 | $ 2,650,000 | $ 2,611,630 |
| Series 2022-DNA1, Class M2 | | |
| 7.837% (SOFR 30A + 2.50%), due 1/25/42 | 710,000 | 708,685 |
| Series 2021-DNA1, Class B1 | | |
| 7.987% (SOFR 30A + 2.65%), due 1/25/51 | 2,795,000 | 2,830,818 |
| Series 2021-HQA1, Class B1 | | |
| 8.337% (SOFR 30A + 3.00%), due 8/25/33 | 4,325,000 | 4,379,188 |
| Series 2020-DNA6, Class B1 | | |
| 8.337% (SOFR 30A + 3.00%), due 12/25/50 | 750,000 | 776,177 |
| Series 2021-DNA5, Class B1 | | |
| 8.387% (SOFR 30A + 3.05%), due 1/25/34 | 4,450,000 | 4,490,505 |
| Series 2021-HQA2, Class B1 | | |
| 8.487% (SOFR 30A + 3.15%), due 12/25/33 | 3,090,000 | 3,097,728 |
| Series 2021-HQA3, Class B1 | | |
| 8.687% (SOFR 30A + 3.35%), due 9/25/41 | 3,140,000 | 3,132,221 |
| Series 2021-DNA6, Class B1 | | |
| 8.737% (SOFR 30A + 3.40%), due 10/25/41 | 3,145,000 | 3,195,742 |
| Series 2022-DNA1, Class B1 | | |
| 8.737% (SOFR 30A + 3.40%), due 1/25/42 | 4,075,000 | 4,058,588 |
| Series 2021-DNA3, Class B1 | | |
| 8.837% (SOFR 30A + 3.50%), due 10/25/33 | 1,490,000 | 1,551,514 |
| Series 2021-DNA7, Class B1 | | |
| 8.987% (SOFR 30A + 3.65%), due 11/25/41 | 3,170,000 | 3,228,655 |
| Series 2021-HQA4, Class B1 | | |
| 9.087% (SOFR 30A + 3.75%), due 12/25/41 | 1,300,000 | 1,297,569 |
| Series 2022-DNA3, Class M2 | | |
| 9.687% (SOFR 30A + 4.35%), due 4/25/42 | 670,000 | 704,053 |
| Series 2021-DNA1, Class B2 | | |
| 10.087% (SOFR 30A + 4.75%), due 1/25/51 | 2,855,500 | 2,906,535 |
The notes to the financial statements are an integral part of, and should be read in conjunction with, the financial statements.
21
Portfolio of Investments December 31, 2023†^ (continued)
| | Principal
Amount | Value |
| Mortgage-Backed Securities (continued) |
| Whole Loan (Collateralized Mortgage Obligations) (continued) |
| FHLMC STACR REMIC Trust (a)(b) (continued) | |
| Series 2020-DNA2, Class B2 | | |
| 10.252% (SOFR 30A + 4.914%), due 2/25/50 | $ 780,000 | $ 806,103 |
| Series 2021-HQA1, Class B2 | | |
| 10.337% (SOFR 30A + 5.00%), due 8/25/33 | 1,145,000 | 1,151,960 |
| Series 2020-HQA1, Class B2 | | |
| 10.552% (SOFR 30A + 5.214%), due 1/25/50 | 2,011,000 | 2,060,554 |
| Series 2022-HQA1, Class M2 | | |
| 10.587% (SOFR 30A + 5.25%), due 3/25/42 | 1,042,833 | 1,112,077 |
| Series 2022-HQA3, Class M2 | | |
| 10.687% (SOFR 30A + 5.35%), due 8/25/42 | 2,385,000 | 2,530,127 |
| Series 2020-DNA1, Class B2 | | |
| 10.702% (SOFR 30A + 5.364%), due 1/25/50 | 750,000 | 789,556 |
| Series 2021-HQA2, Class B2 | | |
| 10.787% (SOFR 30A + 5.45%), due 12/25/33 | 745,000 | 767,490 |
| Series 2021-DNA5, Class B2 | | |
| 10.837% (SOFR 30A + 5.50%), due 1/25/34 | 2,170,000 | 2,295,848 |
| Series 2022-DNA6, Class M2 | | |
| 11.087% (SOFR 30A + 5.75%), due 9/25/42 | 2,165,000 | 2,407,022 |
| Series 2021-DNA3, Class B2 | | |
| 11.587% (SOFR 30A + 6.25%), due 10/25/33 | 2,030,000 | 2,286,616 |
| Series 2021-HQA4, Class B2 | | |
| 12.337% (SOFR 30A + 7.00%), due 12/25/41 | 920,000 | 937,034 |
| Series 2022-HQA1, Class B1 | | |
| 12.337% (SOFR 30A + 7.00%), due 3/25/42 | 2,255,000 | 2,438,621 |
| Series 2021-DNA6, Class B2 | | |
| 12.837% (SOFR 30A + 7.50%), due 10/25/41 | 900,000 | 944,372 |
| FHLMC STACR Trust (a)(b) | |
| Series 2019-HQA3, Class B2 | | |
| 12.952% (SOFR 30A + 7.614%), due 9/25/49 | 1,365,000 | 1,490,102 |
| Series 2018-HQA2, Class B2 | | |
| 16.452% (SOFR 30A + 11.114%), due 10/25/48 | 2,795,000 | 3,449,628 |
| | Principal
Amount | Value |
| |
| Whole Loan (Collateralized Mortgage Obligations) (continued) |
| FHLMC Structured Agency Credit Risk Debt Notes (a)(b) | |
| Series 2021-DNA2, Class B1 | | |
| 8.737% (SOFR 30A + 3.40%), due 8/25/33 | $ 1,765,000 | $ 1,833,520 |
| Series 2020-HQA5, Class B1 | | |
| 9.337% (SOFR 30A + 4.00%), due 11/25/50 | 825,000 | 894,359 |
| Series 2021-DNA2, Class B2 | | |
| 11.337% (SOFR 30A + 6.00%), due 8/25/33 | 1,270,000 | 1,415,657 |
| Series 2022-HQA2, Class M2 | | |
| 11.337% (SOFR 30A + 6.00%), due 7/25/42 | 3,378,000 | 3,646,446 |
| FNMA | |
| Series 2018-C06, Class 2B1 | | |
| 9.552% (SOFR 30A + 4.214%), due 3/25/31 (b) | 2,530,000 | 2,739,785 |
| FNMA Connecticut Avenue Securities | |
| Series 2021-R02, Class 2B2 | | |
| 11.537% (SOFR 30A + 6.20%), due 11/25/41 (a)(b) | 1,615,000 | 1,660,840 |
| Galton Funding Mortgage Trust | |
| Series 2018-2, Class A51 | | |
| 4.50%, due 10/25/58 (a)(j) | 387,096 | 365,126 |
| GreenPoint Mortgage Funding Trust | |
| Series 2007-AR3, Class A1 | | |
| 5.91% (1 Month SOFR + 0.554%), due 6/25/37 (b) | 446,145 | 386,748 |
| HarborView Mortgage Loan Trust | |
| Series 2007-3, Class 2A1A | | |
| 5.87% (1 Month SOFR + 0.514%), due 5/19/37 (b) | 1,255,747 | 1,167,147 |
| MASTR Alternative Loan Trust | |
| Series 2005-5, Class 3A1 | | |
| 5.75%, due 8/25/35 | 1,526,438 | 774,592 |
| New Residential Mortgage Loan Trust (a)(j) | |
| Series 2019-4A, Class B6 | | |
| 4.611%, due 12/25/58 | 3,120,093 | 1,916,140 |
| Series 2019-2A, Class B6 | | |
| 4.825%, due 12/25/57 | 1,148,514 | 745,927 |
| OBX Trust | |
| Series 2022-NQM1, Class A1 | | |
| 2.305%, due 11/25/61 (a)(j) | 1,164,483 | 998,364 |
| Onslow Bay Mortgage Loan Trust | |
| Series 2021-NQM4, Class A1 | | |
| 1.957%, due 10/25/61 (a)(j) | 4,040,160 | 3,297,901 |
The notes to the financial statements are an integral part of, and should be read in conjunction with, the financial statements.
| 22 | MainStay VP MacKay Strategic Bond Portfolio |
| | Principal
Amount | Value |
| Mortgage-Backed Securities (continued) |
| Whole Loan (Collateralized Mortgage Obligations) (continued) |
| Sequoia Mortgage Trust (a) | |
| Series 2021-4, Class A1 | | |
| 0.166%, due 6/25/51 (h)(i) | $ 36,218,726 | $ 300,684 |
| Series 2018-7, Class B3 | | |
| 4.256%, due 9/25/48 (j) | 1,459,832 | 1,251,752 |
| STACR Trust | |
| Series 2018-HRP2, Class B1 | | |
| 9.652% (SOFR 30A + 4.314%), due 2/25/47 (a)(b) | 3,480,000 | 3,804,208 |
| WaMu Mortgage Pass-Through Certificates Trust | |
| Series 2006-AR9, Class 2A | | |
| 6.06% (12 Month Monthly Treasury Average Index + 1.048%), due 8/25/46 (b) | 736,818 | 592,581 |
| | | 129,906,492 |
Total Mortgage-Backed Securities
(Cost $258,589,774) | | 259,839,373 |
| Municipal Bond 0.3% |
| California 0.3% |
Regents of the University of California Medical Center, Pooled
Revenue Bonds | | |
| Series N | | |
| 3.006%, due 5/15/50 | 3,030,000 | 2,151,911 |
Total Municipal Bond
(Cost $3,030,000) | | 2,151,911 |
| U.S. Government & Federal Agencies 7.9% |
| Federal Home Loan Mortgage Corporation (Mortgage Pass-Through Securities) 3.9% |
| UMBS Pool, 30 Year | | |
| 5.50%, due 7/1/53 | 4,021,010 | 4,037,266 |
| 6.00%, due 9/1/53 | 3,009,926 | 3,056,169 |
| 6.00%, due 10/1/53 | 1,517,288 | 1,545,396 |
| 6.00%, due 11/1/53 | 524,194 | 535,399 |
| 6.50%, due 10/1/53 | 4,447,309 | 4,557,487 |
| 6.50%, due 11/1/53 | 8,007,806 | 8,205,735 |
| 6.50%, due 12/1/53 | 4,005,000 | 4,117,687 |
| | | 26,055,139 |
| Federal National Mortgage Association (Mortgage Pass-Through Securities) 3.5% |
| UMBS, 30 Year | | |
| 4.00%, due 6/1/52 | 4,842,424 | 4,580,525 |
| | Principal
Amount | | Value |
| |
| Federal National Mortgage Association (Mortgage Pass-Through Securities) (continued) |
| UMBS, 30 Year (continued) | | | |
| 4.00%, due 7/1/52 | $ 1,877,367 | | $ 1,776,925 |
| 5.00%, due 11/1/52 | 3,822,422 | | 3,782,977 |
| 5.00%, due 3/1/53 | 689,678 | | 682,557 |
| 5.50%, due 6/1/53 | 331,609 | | 333,166 |
| 5.50%, due 8/1/53 | 1,299,683 | | 1,310,558 |
| 6.00%, due 8/1/53 | 1,367,404 | | 1,389,449 |
| 6.00%, due 9/1/53 | 607,651 | | 618,443 |
| 6.00%, due 9/1/53 | 5,716,421 | | 5,804,247 |
| 6.00%, due 11/1/53 | 474,018 | | 483,569 |
| 6.50%, due 10/1/53 | 663,347 | | 684,442 |
| 6.50%, due 12/1/53 | 2,400,000 | | 2,467,528 |
| | | | 23,914,386 |
| United States Treasury Notes 0.5% |
| U.S. Treasury Notes | | | |
| 4.50%, due 11/15/33 | 890,000 | | 934,361 |
| 4.625%, due 10/15/26 | 2,745,000 | | 2,785,746 |
| | | | 3,720,107 |
Total U.S. Government & Federal Agencies
(Cost $53,087,979) | | | 53,689,632 |
Total Long-Term Bonds
(Cost $693,437,931) | | | 664,929,320 |
| |
| | Shares | | |
| |
| Short-Term Investments 1.1% |
| Affiliated Investment Company 0.8% |
| MainStay U.S. Government Liquidity Fund, 5.235% (k) | 5,192,770 | | 5,192,770 |
| Unaffiliated Investment Company 0.3% |
| Invesco Government & Agency Portfolio, 5.361% (k)(l) | 2,374,556 | | 2,374,556 |
Total Short-Term Investments
(Cost $7,567,326) | | | 7,567,326 |
Total Investments
(Cost $701,005,257) | 99.4% | | 672,496,646 |
| Other Assets, Less Liabilities | 0.6 | | 3,927,231 |
| Net Assets | 100.0% | | $ 676,423,877 |
The notes to the financial statements are an integral part of, and should be read in conjunction with, the financial statements.
23
Portfolio of Investments December 31, 2023†^ (continued)
| † | Percentages indicated are based on Portfolio net assets. |
| ^ | Industry classifications may be different than those used for compliance monitoring purposes. |
| (a) | May be sold to institutional investors only under Rule 144A or securities offered pursuant to Section 4(a)(2) of the Securities Act of 1933, as amended. |
| (b) | Floating rate—Rate shown was the rate in effect as of December 31, 2023. |
| (c) | Fixed to floating rate—Rate shown was the rate in effect as of December 31, 2023. |
| (d) | Security is perpetual and, thus, does not have a predetermined maturity date. The date shown, if applicable, reflects the next call date. |
| (e) | All or a portion of this security was held on loan. As of December 31, 2023, the aggregate market value of securities on loan was $2,316,387. The Portfolio received cash collateral with a value of $2,374,556. (See Note 2(J)) |
| (f) | Illiquid security—As of December 31, 2023, the total market value deemed illiquid under procedures approved by the Board of Trustees was $713,000, which represented 0.1% of the Portfolio’s net assets. (Unaudited) |
| (g) | Step coupon—Rate shown was the rate in effect as of December 31, 2023. |
| (h) | Collateralized Mortgage Obligation Interest Only Strip—Pays a fixed or variable rate of interest based on mortgage loans or mortgage pass-through securities. The principal amount of the underlying pool represents the notional amount on which the current interest was calculated. The value of these stripped securities may be particularly sensitive to changes in prevailing interest rates and are typically more sensitive to changes in prepayment rates than traditional mortgage-backed securities. |
| (i) | Collateral strip rate—A bond whose interest was based on the weighted net interest rate of the collateral. The coupon rate adjusts periodically based on a predetermined schedule. Rate shown was the rate in effect as of December 31, 2023. |
| (j) | Coupon rate may change based on changes of the underlying collateral or prepayments of principal. Rate shown was the rate in effect as of December 31, 2023. |
| (k) | Current yield as of December 31, 2023. |
| (l) | Represents a security purchased with cash collateral received for securities on loan. |
Investments in Affiliates (in 000's)
Investments in issuers considered to be affiliate(s) of the Portfolio during the year ended December 31, 2023 for purposes of Section 2(a)(3) of the Investment Company Act of 1940, as amended, were as follows:
| Affiliated Investment Companies | Value,
Beginning
of Year | Purchases
at Cost | Proceeds
from
Sales | Net
Realized
Gain/(Loss)
on Sales | Change in
Unrealized
Appreciation/
(Depreciation) | Value,
End of
Year | Dividend
Income | Other
Distributions | Shares
End of
Year |
| MainStay U.S. Government Liquidity Fund | $ 7,729 | $ 172,504 | $ (175,040) | $ — | $ — | $ 5,193 | $ 276 | $ — | 5,193 |
The notes to the financial statements are an integral part of, and should be read in conjunction with, the financial statements.
| 24 | MainStay VP MacKay Strategic Bond Portfolio |
Futures Contracts
As of December 31, 2023, the Portfolio held the following futures contracts1:
| Type | Number of
Contracts | Expiration
Date | Value at
Trade Date | Current
Notional
Amount | Unrealized
Appreciation
(Depreciation)2 |
| Long Contracts | | | | | |
| U.S. Treasury 10 Year Notes | 3 | March 2024 | $ 331,085 | $ 338,672 | $ 7,587 |
| U.S. Treasury 10 Year Ultra Bonds | 698 | March 2024 | 78,782,879 | 82,374,906 | 3,592,027 |
| U.S. Treasury Long Bonds | 59 | March 2024 | 6,821,148 | 7,371,312 | 550,164 |
| U.S. Treasury Ultra Bonds | 50 | March 2024 | 6,076,304 | 6,679,688 | 603,384 |
| Net Unrealized Appreciation | | | | | $ 4,753,162 |
| 1. | As of December 31, 2023, cash in the amount of $2,934,993 was on deposit with a broker or futures commission merchant for futures transactions. |
| 2. | Represents the difference between the value of the contracts at the time they were opened and the value as of December 31, 2023. |
| Abbreviation(s): |
| FHLMC—Federal Home Loan Mortgage Corp. |
| FNMA—Federal National Mortgage Association |
| GNMA—Government National Mortgage Association |
| LIBOR—London Interbank Offered Rate |
| REMIC—Real Estate Mortgage Investment Conduit |
| SOFR—Secured Overnight Financing Rate |
| STACR—Structured Agency Credit Risk |
| UMBS—Uniform Mortgage Backed Securities |
| USISDA—U.S. International Swaps and Derivatives Association |
The notes to the financial statements are an integral part of, and should be read in conjunction with, the financial statements.
25
Portfolio of Investments December 31, 2023†^ (continued)
The following is a summary of the fair valuations according to the inputs used as of December 31, 2023, for valuing the Portfolio’s assets:
| Description | Quoted
Prices in
Active
Markets for
Identical
Assets
(Level 1) | | Significant
Other
Observable
Inputs
(Level 2) | | Significant
Unobservable
Inputs
(Level 3) | | Total |
| Asset Valuation Inputs | | | | | | | |
| Investments in Securities (a) | | | | | | | |
| Long-Term Bonds | | | | | | | |
| Asset-Backed Securities | $ — | | $ 100,832,223 | | $ — | | $ 100,832,223 |
| Corporate Bonds | — | | 232,456,275 | | — | | 232,456,275 |
| Foreign Government Bonds | — | | 14,580,858 | | — | | 14,580,858 |
| Loan Assignments | — | | 1,379,048 | | — | | 1,379,048 |
| Mortgage-Backed Securities | — | | 259,839,373 | | — | | 259,839,373 |
| Municipal Bond | — | | 2,151,911 | | — | | 2,151,911 |
| U.S. Government & Federal Agencies | — | | 53,689,632 | | — | | 53,689,632 |
| Total Long-Term Bonds | — | | 664,929,320 | | — | | 664,929,320 |
| Short-Term Investments | | | | | | | |
| Affiliated Investment Company | 5,192,770 | | — | | — | | 5,192,770 |
| Unaffiliated Investment Company | 2,374,556 | | — | | — | | 2,374,556 |
| Total Short-Term Investments | 7,567,326 | | — | | — | | 7,567,326 |
| Total Investments in Securities | 7,567,326 | | 664,929,320 | | — | | 672,496,646 |
| Other Financial Instruments | | | | | | | |
| Futures Contracts (b) | 4,753,162 | | — | | — | | 4,753,162 |
| Total Investments in Securities and Other Financial Instruments | $ 12,320,488 | | $ 664,929,320 | | $ — | | $ 677,249,808 |
| (a) | For a complete listing of investments and their industries, see the Portfolio of Investments. |
| (b) | The value listed for these securities reflects unrealized appreciation (depreciation) as shown on the Portfolio of Investments. |
The notes to the financial statements are an integral part of, and should be read in conjunction with, the financial statements.
| 26 | MainStay VP MacKay Strategic Bond Portfolio |
Statement of Assets and Liabilities as of December 31, 2023
| Assets |
Investment in unaffiliated securities, at value
(identified cost $695,812,487) including securities on loan of $2,316,387 | $667,303,876 |
Investment in affiliated investment companies, at value
(identified cost $5,192,770) | 5,192,770 |
| Cash | 139,806 |
Cash denominated in foreign currencies
(identified cost $585) | 602 |
| Cash collateral on deposit at broker for futures contracts | 2,934,993 |
| Receivables: | |
| Interest | 4,349,958 |
| Investment securities sold | 2,770,895 |
| Portfolio shares sold | 146,833 |
| Securities lending | 1,322 |
| Other assets | 4,752 |
| Total assets | 682,845,807 |
| Liabilities |
| Cash collateral received for securities on loan | 2,374,556 |
| Payables: | |
| Investment securities purchased | 2,787,140 |
| Portfolio shares redeemed | 593,880 |
| Manager (See Note 3) | 335,004 |
| NYLIFE Distributors (See Note 3) | 137,163 |
| Variation margin on futures contracts | 102,968 |
| Professional fees | 40,386 |
| Custodian | 25,308 |
| Shareholder communication | 16,966 |
| Accrued expenses | 8,559 |
| Total liabilities | 6,421,930 |
| Net assets | $676,423,877 |
| Composition of Net Assets |
| Shares of beneficial interest outstanding (par value of $.001 per share) unlimited number of shares authorized | $ 71,058 |
| Additional paid-in-capital | 747,956,022 |
| | 748,027,080 |
| Total distributable earnings (loss) | (71,603,203) |
| Net assets | $676,423,877 |
| Initial Class | |
| Net assets applicable to outstanding shares | $ 26,163,491 |
| Shares of beneficial interest outstanding | 2,739,453 |
| Net asset value per share outstanding | $ 9.55 |
| Service Class | |
| Net assets applicable to outstanding shares | $650,260,386 |
| Shares of beneficial interest outstanding | 68,318,481 |
| Net asset value per share outstanding | $ 9.52 |
The notes to the financial statements are an integral part of, and should be read in conjunction with, the financial statements.
27
Statement of Operations for the year ended December 31, 2023
| Investment Income (Loss) |
| Income | |
| Interest | $ 37,793,438 |
| Dividends-affiliated | 276,400 |
| Securities lending, net | 19,440 |
| Other | 63,925 |
| Total income | 38,153,203 |
| Expenses | |
| Manager (See Note 3) | 4,090,231 |
| Distribution/Service—Service Class (See Note 3) | 1,686,172 |
| Professional fees | 117,096 |
| Custodian | 57,935 |
| Trustees | 18,395 |
| Shareholder communication | 675 |
| Miscellaneous | 20,352 |
| Total expenses | 5,990,856 |
| Net investment income (loss) | 32,162,347 |
| Realized and Unrealized Gain (Loss) |
| Net realized gain (loss) on: | |
| Unaffiliated investment transactions | (33,620,789) |
| Futures transactions | 963,108 |
| Swap transactions | 454,364 |
| Net realized gain (loss) | (32,203,317) |
| Net change in unrealized appreciation (depreciation) on: | |
| Unaffiliated investments | 60,667,862 |
| Futures contracts | 4,834,477 |
| Swap contracts | (450,108) |
| Translation of other assets and liabilities in foreign currencies | 17 |
| Net change in unrealized appreciation (depreciation) | 65,052,248 |
| Net realized and unrealized gain (loss) | 32,848,931 |
| Net increase (decrease) in net assets resulting from operations | $ 65,011,278 |
The notes to the financial statements are an integral part of, and should be read in conjunction with, the financial statements.
| 28 | MainStay VP MacKay Strategic Bond Portfolio |
Statements of Changes in Net Assets
for the years ended December 31, 2023 and December 31, 2022
| | 2023 | 2022 |
| Increase (Decrease) in Net Assets |
| Operations: | | |
| Net investment income (loss) | $ 32,162,347 | $ 26,576,158 |
| Net realized gain (loss) | (32,203,317) | 6,455,834 |
| Net change in unrealized appreciation (depreciation) | 65,052,248 | (101,796,224) |
| Net increase (decrease) in net assets resulting from operations | 65,011,278 | (68,764,232) |
| Distributions to shareholders: | | |
| Initial Class | (1,206,905) | (806,220) |
| Service Class | (31,460,221) | (25,435,101) |
| | (32,667,126) | (26,241,321) |
| Distributions to shareholders from return of capital: | | |
| Initial Class | — | (8,594) |
| Service Class | — | (271,136) |
| | — | (279,730) |
| Total distributions to shareholders | (32,667,126) | (26,521,051) |
| Capital share transactions: | | |
| Net proceeds from sales of shares | 33,996,571 | 18,852,102 |
| Net asset value of shares issued to shareholders in reinvestment of distributions | 32,667,126 | 26,521,051 |
| Cost of shares redeemed | (145,778,845) | (184,274,909) |
| Increase (decrease) in net assets derived from capital share transactions | (79,115,148) | (138,901,756) |
| Net increase (decrease) in net assets | (46,770,996) | (234,187,039) |
| Net Assets |
| Beginning of year | 723,194,873 | 957,381,912 |
| End of year | $ 676,423,877 | $ 723,194,873 |
The notes to the financial statements are an integral part of, and should be read in conjunction with, the financial statements.
29
Financial Highlights selected per share data and ratios
| | Year Ended December 31, |
| Initial Class | 2023 | | 2022 | | 2021 | | 2020 | | 2019 |
| Net asset value at beginning of year | $ 9.11 | | $ 10.19 | | $ 10.25 | | $ 9.92 | | $ 9.60 |
| Net investment income (loss) (a) | 0.45 | | 0.34 | | 0.29 | | 0.28 | | 0.29 |
| Net realized and unrealized gain (loss) | 0.46 | | (1.08) | | (0.10) | | 0.32 | | 0.38 |
| Total from investment operations | 0.91 | | (0.74) | | 0.19 | | 0.60 | | 0.67 |
| Less distributions: | | | | | | | | | |
| From net investment income | (0.47) | | (0.34) | | (0.25) | | (0.26) | | (0.35) |
| Return of capital | — | | (0.00)‡ | | — | | (0.01) | | — |
| Total distributions | (0.47) | | (0.34) | | (0.25) | | (0.27) | | (0.35) |
| Net asset value at end of year | $ 9.55 | | $ 9.11 | | $ 10.19 | | $ 10.25 | | $ 9.92 |
| Total investment return (b) | 10.19% | | (7.24)% | | 1.96% | | 6.12% | | 7.06% |
| Ratios (to average net assets)/Supplemental Data: | | | | | | | | | |
| Net investment income (loss) | 4.86% | | 3.54% | | 2.80% | | 2.84% | | 2.96% |
| Net expenses (c)(d) | 0.62% | | 0.62% | | 0.62%(d) | | 0.70%(d) | | 0.76%(d) |
| Portfolio turnover rate | 70% | | 60% | | 62% | | 52%(e) | | 51%(e) |
| Net assets at end of year (in 000's) | $ 26,163 | | $ 21,924 | | $ 24,820 | | $ 22,538 | | $ 49,296 |
| ‡ | Less than one cent per share. |
| (a) | Per share data based on average shares outstanding during the year. |
| (b) | Total return does not reflect any deduction of sales charges, mortality and expense charges, contract charges or administrative charges. For periods of less than one year, total return is not annualized. |
| (c) | In addition to the fees and expenses which the Portfolio bears directly, it also indirectly bears a pro-rata share of the fees and expenses of the underlying funds in which it invests. Such indirect expenses are not included in the above expense ratios. |
| (d) | The expense ratios presented below show the impact of short sales expense: |
| Year Ended | | Net Expenses
(excluding short
sale expenses) | | Short Sales
Expenses |
| December 31, 2021 | | 0.61% | | 0.01% |
| December 31, 2020 | | 0.62% | | 0.08% |
| December 31, 2019 | | 0.61% | | 0.15% |
| (e) | The portfolio turnover rate not including mortgage dollar rolls was 51% and 45% for the years ended December 31, 2020 and 2019, respectively. |
The notes to the financial statements are an integral part of, and should be read in conjunction with, the financial statements.
| 30 | MainStay VP MacKay Strategic Bond Portfolio |
Financial Highlights selected per share data and ratios
| | Year Ended December 31, |
| Service Class | 2023 | | 2022 | | 2021 | | 2020 | | 2019 |
| Net asset value at beginning of year | $ 9.08 | | $ 10.16 | | $ 10.21 | | $ 9.89 | | $ 9.57 |
| Net investment income (loss) (a) | 0.43 | | 0.31 | | 0.26 | | 0.26 | | 0.26 |
| Net realized and unrealized gain (loss) | 0.45 | | (1.07) | | (0.08) | | 0.30 | | 0.39 |
| Total from investment operations | 0.88 | | (0.76) | | 0.18 | | 0.56 | | 0.65 |
| Less distributions: | | | | | | | | | |
| From net investment income | (0.44) | | (0.32) | | (0.23) | | (0.23) | | (0.33) |
| Return of capital | — | | (0.00)‡ | | — | | (0.01) | | — |
| Total distributions | (0.44) | | (0.32) | | (0.23) | | (0.24) | | (0.33) |
| Net asset value at end of year | $ 9.52 | | $ 9.08 | | $ 10.16 | | $ 10.21 | | $ 9.89 |
| Total investment return (b) | 9.92% | | (7.47)% | | 1.71% | | 5.86% | | 6.80% |
| Ratios (to average net assets)/Supplemental Data: | | | | | | | | | |
| Net investment income (loss) | 4.60% | | 3.26% | | 2.53% | | 2.59% | | 2.66% |
| Net expenses (c)(d) | 0.87% | | 0.87% | | 0.87%(d) | | 0.93%(d) | | 1.01%(d) |
| Portfolio turnover rate | 70% | | 60% | | 62% | | 52%(e) | | 51%(e) |
| Net assets at end of year (in 000's) | $ 650,260 | | $ 701,271 | | $ 932,562 | | $ 969,321 | | $ 990,736 |
| ‡ | Less than one cent per share. |
| (a) | Per share data based on average shares outstanding during the year. |
| (b) | Total return does not reflect any deduction of sales charges, mortality and expense charges, contract charges or administrative charges. For periods of less than one year, total return is not annualized. |
| (c) | In addition to the fees and expenses which the Portfolio bears directly, it also indirectly bears a pro-rata share of the fees and expenses of the underlying funds in which it invests. Such indirect expenses are not included in the above expense ratios. |
| (d) | The expense ratios presented below show the impact of short sales expense: |
| Year Ended | | Net Expenses
(excluding short
sale expenses) | | Short Sales
Expenses |
| December 31, 2021 | | 0.86% | | 0.01% |
| December 31, 2020 | | 0.86% | | 0.07% |
| December 31, 2019 | | 0.86% | | 0.15% |
| (e) | The portfolio turnover rate not including mortgage dollar rolls was 51% and 45% for the years ended December 31, 2020 and 2019, respectively. |
The notes to the financial statements are an integral part of, and should be read in conjunction with, the financial statements.
31
Notes to Financial Statements
Note 1–Organization and Business
MainStay VP Funds Trust (the “Fund”) was organized as a Delaware statutory trust on February 1, 2011. The Fund is registered under the Investment Company Act of 1940, as amended (the “1940 Act”), as an open-end management investment company. The Fund is comprised of thirty-one separate series (collectively referred to as the “Portfolios”). These financial statements and notes relate to the MainStay VP MacKay Strategic Bond Portfolio (the "Portfolio"), a "diversified” portfolio, as that term is defined in the 1940 Act, as interpreted or modified by regulatory authorities having jurisdiction, from time to time.
Shares of the Portfolio are currently offered to certain separate accounts to fund variable annuity policies and variable universal life insurance policies issued by New York Life Insurance and Annuity Corporation (“NYLIAC”), a wholly-owned subsidiary of New York Life Insurance Company (“New York Life”) and may also be offered to fund variable annuity policies and variable universal life insurance policies issued by other insurance companies. NYLIAC allocates shares of the Portfolio to, among others, certain NYLIAC separate accounts. Shares of the Portfolio are also offered to the MainStay VP Conservative Allocation Portfolio, MainStay VP Moderate Allocation Portfolio, MainStay VP Growth Allocation Portfolio and MainStay VP Equity Allocation Portfolio, which operate as “funds-of-funds," and other variable insurance funds.
The following table lists the Portfolio's share classes that have been registered and commenced operations:
| Class | Commenced Operations |
| Initial Class | April 29, 2011 |
| Service Class | April 29, 2011 |
Shares of the Portfolio are offered and are redeemed at a price equal to their respective net asset value (“NAV”) per share. No sales or redemption charge is applicable to the purchase or redemption of the Portfolio's shares. Under the terms of the Fund’s multiple class plan, adopted pursuant to Rule 18f-3 under the 1940 Act, the classes differ in that, among other things, Service Class shares of the Portfolio pay a combined distribution and service fee of 0.25% of average daily net assets attributable to Service Class shares of the Portfolio to the Distributor (as defined in Note 3(B)) pursuant to a plan adopted in accordance with Rule 12b-1 under the 1940 Act. Contract owners of variable annuity contracts purchased after June 2, 2003, are permitted to invest only in the Service Class shares.
The Portfolio's investment objective is to seek total return by investing primarily in domestic and foreign debt securities.
Note 2–Significant Accounting Policies
The Portfolio is an investment company and accordingly follows the investment company accounting and reporting guidance of the Financial Accounting Standards Board (“FASB”) Accounting Standards Codification Topic 946 Financial Services—Investment Companies. The Portfolio prepares its financial statements in accordance with generally accepted
accounting principles (“GAAP”) in the United States of America and follows the significant accounting policies described below.
(A) Securities Valuation. Investments are usually valued as of the close of regular trading on the New York Stock Exchange (the "Exchange") (usually 4:00 p.m. Eastern time) on each day the Portfolio is open for business ("valuation date").
Pursuant to Rule 2a-5 under the 1940 Act, the Board of Trustees of the Fund (the "Board") has designated New York Life Investment Management LLC (“New York Life Investments” or the "Manager") as its Valuation Designee (the "Valuation Designee"). The Valuation Designee is responsible for performing fair valuations relating to all investments in the Portfolio’s portfolio for which market quotations are not readily available; periodically assessing and managing material valuation risks; establishing and applying fair value methodologies; testing fair valuation methodologies; evaluating and overseeing pricing services; ensuring appropriate segregation of valuation and portfolio management functions; providing quarterly, annual and prompt reporting to the Board, as appropriate; identifying potential conflicts of interest; and maintaining appropriate records. The Valuation Designee has established a valuation committee ("Valuation Committee") to assist in carrying out the Valuation Designee’s responsibilities and establish prices of securities for which market quotations are not readily available. The Portfolio's and the Valuation Designee's policies and procedures ("Valuation Procedures") govern the Valuation Designee’s selection and application of methodologies for determining and calculating the fair value of Portfolio investments. The Valuation Designee may value the Portfolio's portfolio securities for which market quotations are not readily available and other Portfolio assets utilizing inputs from pricing services and other third-party sources. The Valuation Committee meets (in person, via electronic mail or via teleconference) on an ad-hoc basis to determine fair valuations and on a quarterly basis to review fair value events with respect to certain securities for which market quotations are not readily available, including valuation risks and back-testing results, and to preview reports to the Board.
The Valuation Committee establishes prices of securities for which market quotations are not readily available based on such methodologies and measurements on a regular basis after considering information that is reasonably available and deemed relevant by the Valuation Committee. The Board shall oversee the Valuation Designee and review fair valuation materials on a prompt, quarterly and annual basis and approve proposed revisions to the Valuation Procedures.
Investments for which market quotations are not readily available are valued at fair value as determined in good faith pursuant to the Valuation Procedures. A market quotation is readily available only when that quotation is a quoted price (unadjusted) in active markets for identical investments that the Portfolio can access at the measurement date, provided that a quotation will not be readily available if it is not reliable. "Fair value" is defined as the price the Portfolio would reasonably expect to receive upon selling an asset or liability in an orderly transaction to an independent buyer in the principal or most advantageous market for the
| 32 | MainStay VP MacKay Strategic Bond Portfolio |
asset or liability. Fair value measurements are determined within a framework that establishes a three-tier hierarchy that maximizes the use of observable market data and minimizes the use of unobservable inputs to establish a classification of fair value measurements for disclosure purposes. "Inputs" refer broadly to the assumptions that market participants would use in pricing the asset or liability, including assumptions about risk, such as the risk inherent in a particular valuation technique used to measure fair value using a pricing model and/or the risk inherent in the inputs for the valuation technique. Inputs may be observable or unobservable. Observable inputs reflect the assumptions market participants would use in pricing the asset or liability based on market data obtained from sources independent of the Portfolio. Unobservable inputs reflect the Portfolio’s own assumptions about the assumptions market participants would use in pricing the asset or liability based on the information available. The inputs or methodology used for valuing assets or liabilities may not be an indication of the risks associated with investing in those assets or liabilities. The three-tier hierarchy of inputs is summarized below.
| • | Level 1—quoted prices (unadjusted) in active markets for an identical asset or liability |
| • | Level 2—other significant observable inputs (including quoted prices for a similar asset or liability in active markets, interest rates and yield curves, prepayment speeds, credit risk, etc.) |
| • | Level 3—significant unobservable inputs (including the Portfolio's own assumptions about the assumptions that market participants would use in measuring fair value of an asset or liability) |
The level of an asset or liability within the fair value hierarchy is based on the lowest level of an input, both individually and in the aggregate, that is significant to the fair value measurement. The aggregate value by input level of the Portfolio’s assets and liabilities as of December 31, 2023, is included at the end of the Portfolio of Investments.
The Portfolio may use third-party vendor evaluations, whose prices may be derived from one or more of the following standard inputs, among others:
| • Benchmark yields | • Reported trades |
| • Broker/dealer quotes | • Issuer spreads |
| • Two-sided markets | • Benchmark securities |
| • Bids/offers | • Reference data (corporate actions or material event notices) |
| • Industry and economic events | • Comparable bonds |
| • Monthly payment information | |
An asset or liability for which a market quotation is not readily available is valued by methods deemed reasonable in good faith by the Valuation Committee, following the Valuation Procedures to represent fair value. Under these procedures, the Valuation Designee generally uses a market-based approach which may use related or comparable assets or liabilities, recent transactions, market multiples, book values and other relevant information. The Valuation Designee may also use an
income-based valuation approach in which the anticipated future cash flows of the asset or liability are discounted to calculate fair value. Discounts may also be applied due to the nature and/or duration of any restrictions on the disposition of the asset or liability. Fair value represents a good faith approximation of the value of a security. Fair value determinations involve the consideration of a number of subjective factors, an analysis of applicable facts and circumstances and the exercise of judgment. As a result, it is possible that the fair value for a security determined in good faith in accordance with the Valuation Procedures may differ from valuations for the same security determined for other funds using their own valuation procedures. Although the Valuation Procedures are designed to value a security at the price the Portfolio may reasonably expect to receive upon the security's sale in an orderly transaction, there can be no assurance that any fair value determination thereunder would, in fact, approximate the amount that the Portfolio would actually realize upon the sale of the security or the price at which the security would trade if a reliable market price were readily available. During the year ended December 31, 2023, there were no material changes to the fair value methodologies.
Securities which may be valued in this manner include, but are not limited to: (i) a security for which trading has been halted or suspended or otherwise does not have a readily available market quotation on a given day; (ii) a debt security that has recently gone into default and for which there is not a current market quotation; (iii) a security of an issuer that has entered into a restructuring; (iv) a security that has been delisted from a national exchange; (v) a security subject to trading collars for which no or limited trading takes place; and (vi) a security whose principal market has been temporarily closed at a time when, under normal conditions, it would be open. Securities valued in this manner are generally categorized as Level 2 or 3 in the hierarchy.
Investments in mutual funds, including money market funds, are valued at their respective NAVs at the close of business each day on the valuation date. These securities are generally categorized as Level 1 in the hierarchy.
Futures contracts are valued at the last posted settlement price on the market where such futures are primarily traded. These securities are generally categorized as Level 1 in the hierarchy.
Debt securities (other than convertible and municipal bonds) are valued at the evaluated bid prices (evaluated mean prices in the case of convertible and municipal bonds) supplied by a pricing agent or broker selected by the Valuation Designee, in consultation with the Subadvisor. The evaluations are market-based measurements processed through a pricing application and represents the pricing agent’s good faith determination as to what a holder may receive in an orderly transaction under market conditions. The rules-based logic utilizes valuation techniques that reflect participants’ assumptions and vary by asset class and per methodology, maximizing the use of relevant observable data including quoted prices for similar assets, benchmark yield curves and market corroborated inputs. The evaluated bid or mean prices are deemed by the Valuation Designee, in consultation with the Subadvisor, to be representative of
Notes to Financial Statements (continued)
market values at the regular close of trading of the Exchange on each valuation date. Debt securities purchased on a delayed delivery basis are marked to market daily until settlement at the forward settlement date. Debt securities, including corporate bonds, U.S. government and federal agency bonds, municipal bonds, foreign bonds, convertible bonds, asset-backed securities and mortgage-backed securities are generally categorized as Level 2 in the hierarchy.
Loan assignments, participations and commitments are valued at the average of bid quotations obtained from the engaged independent pricing service and are generally categorized as Level 2 in the hierarchy. Certain loan assignments, participations and commitments may be valued by utilizing significant unobservable inputs obtained from the pricing service and are generally categorized as Level 3 in the hierarchy.
Temporary cash investments acquired in excess of 60 days to maturity at the time of purchase are valued using the latest bid prices or using valuations based on a matrix system (which considers such factors as security prices, yields, maturities and ratings), both as furnished by independent pricing services. Temporary cash investments that mature in 60 days or less at the time of purchase ("Short-Term Investments") are valued using the amortized cost method of valuation, unless the use of such method would be inappropriate. The amortized cost method involves valuing a security at its cost on the date of purchase and thereafter assuming a constant amortization to maturity of the difference between such cost and the value on maturity date. Amortized cost approximates the current fair value of a security. Securities valued using the amortized cost method are not valued using quoted prices in an active market and are generally categorized as Level 2 in the hierarchy.
The information above is not intended to reflect an exhaustive list of the methodologies that may be used to value portfolio investments. The Valuation Procedures permit the use of a variety of valuation methodologies in connection with valuing portfolio investments. The methodology used for a specific type of investment may vary based on the market data available or other considerations. The methodologies summarized above may not represent the specific means by which portfolio investments are valued on any particular business day.
A portfolio investment may be classified as an illiquid investment under the Portfolio's written liquidity risk management program and related procedures (“Liquidity Program”). Illiquidity of an investment might prevent the sale of such investment at a time when the Manager or the Subadvisor might wish to sell, and these investments could have the effect of decreasing the overall level of the Portfolio's liquidity. Further, the lack of an established secondary market may make it more difficult to value illiquid investments, requiring the Portfolio to rely on judgments that may be somewhat subjective in measuring value, which could vary materially from the amount that the Portfolio could realize upon disposition. Difficulty in selling illiquid investments may result in a loss or may be costly to the Portfolio. An illiquid investment is any investment that the Manager or Subadvisor reasonably expects cannot be sold or disposed of in current market conditions in seven calendar days or less without the sale or disposition significantly changing the market value of
the investment. The liquidity classification of each investment will be made using information obtained after reasonable inquiry and taking into account, among other things, relevant market, trading and investment-specific considerations in accordance with the Liquidity Program. Illiquid investments are often fair valued in accordance with the Portfolio's procedures described above. The liquidity of the Portfolio's investments was determined as of December 31, 2023, and can change at any time.
(B) Income Taxes. The Portfolio's policy is to comply with the requirements of the Internal Revenue Code of 1986, as amended (the “Internal Revenue Code”), applicable to regulated investment companies and to distribute all of its taxable income to the shareholders of the Portfolio within the allowable time limits.
The Manager evaluates the Portfolio’s tax positions to determine if the tax positions taken meet the minimum recognition threshold in connection with accounting for uncertainties in income tax positions taken or expected to be taken for the purposes of measuring and recognizing tax liabilities in the financial statements. Recognition of tax benefits of an uncertain tax position is permitted only to the extent the position is “more likely than not” to be sustained assuming examination by taxing authorities. The Manager analyzed the Portfolio's tax positions taken on federal, state and local income tax returns for all open tax years (for up to three tax years) and has concluded that no provisions for federal, state and local income tax are required in the Portfolio's financial statements. The Portfolio's federal, state and local income tax and federal excise tax returns for tax years for which the applicable statutes of limitations have not expired are subject to examination by the Internal Revenue Service and state and local departments of revenue.
(C) Dividends and Distributions to Shareholders. Dividends and distributions are recorded on the ex-dividend date. The Portfolio intends to declare and pay dividends from net investment income, if any, at least quarterly and distributions from net realized capital and currency gains, if any, at least annually. All dividends and distributions are reinvested at NAV in the same class of shares of the Portfolio. Dividends and distributions to shareholders are determined in accordance with federal income tax regulations and may differ from determinations using GAAP.
(D) Security Transactions and Investment Income. The Portfolio records security transactions on the trade date. Realized gains and losses on security transactions are determined using the identified cost method. Dividend income is recognized on the ex-dividend date, net of any foreign tax withheld at the source, and interest income is accrued as earned using the effective interest rate method and includes any realized gains and losses from repayments of principal on mortgage-backed securities. Distributions received from real estate investment trusts may be classified as dividends, capital gains and/or return of capital. Discounts and premiums on securities purchased for the Portfolio are accreted and amortized, respectively, on the effective interest rate method.
Investment income and realized and unrealized gains and losses on investments of the Portfolio are allocated pro rata to the separate classes
| 34 | MainStay VP MacKay Strategic Bond Portfolio |
of shares based upon their relative net assets on the date the income is earned or realized and unrealized gains and losses are incurred.
The Portfolio may place a debt security on non-accrual status and reduce related interest income by ceasing current accruals and writing off all or a portion of any interest receivables when the collection of all or a portion of such interest has become doubtful. A debt security is removed from non-accrual status when the issuer resumes interest payments or when collectability of interest is reasonably assured.
(E) Expenses. Expenses of the Fund are allocated to the individual Portfolios in proportion to the net assets of the respective Portfolios when the expenses are incurred, except where direct allocations of expenses can be made. Expenses (other than fees incurred under the distribution and service plans, further discussed in Note 3(B), which are charged directly to the Service Class shares) are allocated to separate classes of shares pro rata based upon their relative net assets on the date the expenses are incurred. The expenses borne by the Portfolio, including those of related parties to the Portfolio, are shown in the Statement of Operations.
Additionally, the Portfolio may invest in mutual funds, which are subject to management fees and other fees that may cause the costs of investing in mutual funds to be greater than the costs of owning the underlying securities directly. These indirect expenses of mutual funds are not included in the amounts shown as expenses in the Statement of Operations or in the expense ratios included in the Financial Highlights.
(F) Use of Estimates. In preparing financial statements in conformity with GAAP, the Manager makes estimates and assumptions that affect the reported amounts and disclosures in the financial statements. Actual results could differ from those estimates and assumptions.
(G) Futures Contracts. A futures contract is an agreement to purchase or sell a specified quantity of an underlying instrument at a specified future date and price, or to make or receive a cash payment based on the value of a financial instrument (e.g., foreign currency, interest rate, security or securities index). The Portfolio is subject to risks such as market price risk, leverage risk, liquidity risk, counterparty risk, operational risk, legal risk and/or interest rate risk in the normal course of investing in these contracts. Upon entering into a futures contract, the Portfolio is required to pledge to the broker or futures commission merchant an amount of cash and/or U.S. government securities equal to a certain percentage of the collateral amount, known as the “initial margin.” During the period the futures contract is open, changes in the value of the contract are recognized as unrealized appreciation or depreciation by marking to market such contract on a daily basis to reflect the market value of the contract at the end of each day’s trading. The Portfolio agrees to receive from or pay to the broker or futures commission merchant an amount of cash equal to the daily fluctuation in the value of the contract. Such receipts or payments are known as “variation margin.” When the futures contract is closed, the Portfolio records a realized gain or loss equal to the difference between the
proceeds from (or cost of) the closing transaction and the Portfolio's basis in the contract.
The use of futures contracts involves, to varying degrees, elements of market risk in excess of the amount recognized in the Statement of Assets and Liabilities. The contract or notional amounts and variation margin reflect the extent of the Portfolio's involvement in open futures positions. There are several risks associated with the use of futures contracts as hedging techniques. There can be no assurance that a liquid market will exist at the time when the Portfolio seeks to close out a futures contract. If no liquid market exists, the Portfolio would remain obligated to meet margin requirements until the position is closed. Futures contracts may involve a small initial investment relative to the risk assumed, which could result in losses greater than if the Portfolio did not invest in futures contracts. Futures contracts may be more volatile than direct investments in the instrument underlying the futures and may not correlate to the underlying instrument, causing a given hedge not to achieve its objectives. The Portfolio's activities in futures contracts have minimal counterparty risk as they are conducted through regulated exchanges that guarantee the futures against default by the counterparty. In the event of a bankruptcy or insolvency of a futures commission merchant that holds margin on behalf of the Portfolio, the Portfolio may not be entitled to the return of the entire margin owed to the Portfolio, potentially resulting in a loss. The Portfolio may invest in futures contracts to seek enhanced returns or to reduce the risk of loss by hedging certain of its holdings. The Portfolio's investment in futures contracts and other derivatives may increase the volatility of the Portfolio's NAVs and may result in a loss to the Portfolio.
(H) Loan Assignments, Participations and Commitments. The Portfolio may invest in loan assignments and participations ("loans"). Commitments are agreements to make money available to a borrower in a specified amount, at a specified rate and within a specified time. The Portfolio records an investment when the borrower withdraws money on a commitment or when a funded loan is purchased (trade date) and records interest as earned. These loans pay interest at rates that are periodically reset by reference to a base lending rate plus a spread. These base lending rates are generally the prime rate offered by a designated U.S. bank, the Secured Overnight Financing Rate ("SOFR") or an alternative reference rate.
The loans in which the Portfolio may invest are generally readily marketable, but may be subject to some restrictions on resale. For example, the Portfolio may be contractually obligated to receive approval from the agent bank and/or borrower prior to the sale of these investments. If the Portfolio purchases an assignment from a lender, the Portfolio will generally have direct contractual rights against the borrower in favor of the lender. If the Portfolio purchases a participation interest either from a lender or a participant, the Portfolio typically will have established a direct contractual relationship with the seller of the participation interest, but not with the borrower. Consequently, the Portfolio is subject to the credit risk of the lender or participant who sold the participation interest to the Portfolio, in addition to the usual credit
Notes to Financial Statements (continued)
risk of the borrower. In the event that the borrower, selling participant or intermediate participants become insolvent or enter into bankruptcy, the Portfolio may incur certain costs and delays in realizing payment, or may suffer a loss of principal and/or interest.
Unfunded commitments represent the remaining obligation of the Portfolio to the borrower. At any point in time, up to the maturity date of the issue, the borrower may demand the unfunded portion. Unfunded amounts, if any, are marked to market and any unrealized gains or losses are recorded in the Statement of Assets and Liabilities.
(I) Swap Contracts. The Portfolio may enter into credit default, interest rate, equity, index and currency exchange rate swap contracts (“swaps”). In a typical swap transaction, two parties agree to exchange the future returns (or differentials in rates of future returns) earned or realized at periodic intervals on a particular investment or instrument based on a notional principal amount. Generally, the Portfolio will enter into a swap on a net basis, which means that the two payment streams under the swap are netted, with the Portfolio receiving or paying (as the case may be) only the net amount of the two payment streams. Therefore, the Portfolio's current obligation under a swap generally will be equal to the net amount to be paid or received under the swap, based on the relative value of notional positions attributable to each counterparty to the swap. The payments may be adjusted for transaction costs, interest payments, the amount of interest paid on the investment or instrument or other factors. Collateral, in the form of cash or securities, may be required to be held in segregated accounts with the custodian bank or broker in accordance with the terms of the swap. Swap agreements are privately negotiated in the over the counter (“OTC”) market and may be executed in a multilateral or other trade facilities platform, such as a registered commodities exchange (“centrally cleared swaps”).
Certain standardized swaps, including certain credit default and interest rate swaps, are subject to mandatory clearing and exchange-trading, and more types of standardized swaps are expected to be subject to mandatory clearing and exchange-trading in the future. The counterparty risk for exchange-traded and cleared derivatives is expected to be generally lower than for uncleared derivatives, but cleared contracts are not risk-free. In a cleared derivative transaction, the Portfolio typically enters into the transaction with a financial institution counterparty, and performance of the transaction is effectively guaranteed by a central clearinghouse, thereby reducing or eliminating the Portfolio's exposure to the credit risk of its original counterparty. The Portfolio will be required to post specified levels of margin with the clearinghouse or at the instruction of the clearinghouse; the margin required by a clearinghouse may be greater than the margin the Portfolio would be required to post in an uncleared transaction.
Swaps are marked to market daily based upon quotations from pricing agents, brokers, or market makers and the change in value, if any, is recorded as unrealized appreciation or depreciation. Any payments made or received upon entering into a swap would be amortized or accreted over the life of the swap and recorded as a realized gain or loss. Early termination of a swap is recorded as a realized gain or loss. Daily
changes in valuation of centrally cleared swaps, if any, are recorded as a receivable or payable for the change in value as appropriate on the Statement of Assets and Liabilities.
The Portfolio bears the risk of loss of the amount expected to be received under a swap in the event of the default or bankruptcy of the swap counterparty. The Portfolio may be able to eliminate its exposure under a swap either by assignment or other disposition, or by entering into an offsetting swap with the same party or a similar credit-worthy party. Swaps are not actively traded on financial markets. Entering into swaps involves elements of credit, market, leverage, liquidity, operational, counterparty and legal/documentation risk in excess of the amounts recognized on the Statement of Assets and Liabilities. Such risks involve the possibilities that there will be no liquid market for these swaps, that the counterparty to the swaps may default on its obligation to perform or disagree as to the meaning of the contractual terms in the swaps and that there may be unfavorable changes in interest rates, the price of the index or the security underlying these transactions, among other risks.
(J) Securities Lending. In order to realize additional income, the Portfolio may engage in securities lending, subject to the limitations set forth in the 1940 Act and relevant guidance by the staff of the Securities and Exchange Commission (“SEC”). If the Portfolio engages in securities lending, the Portfolio will lend through its custodian, JPMorgan Chase Bank, N.A., ("JPMorgan"), acting as securities lending agent on behalf of the Portfolio. Under the current arrangement, JPMorgan will manage the Portfolio's collateral in accordance with the securities lending agency agreement between the Portfolio and JPMorgan, and indemnify the Portfolio against counterparty risk. The loans will be collateralized by cash (which may be invested in a money market fund) and/or non-cash collateral (which may include U.S. Treasury securities and/or U.S. government agency securities issued or guaranteed by the United States government or its agencies or instrumentalities) at least equal at all times to the market value of the securities loaned. Non-cash collateral held at year end is segregated and cannot be transferred by the Portfolio. The Portfolio bears the risk of delay in recovery of, or loss of rights in, the securities loaned. The Portfolio may also record a realized gain or loss on securities deemed sold due to a borrower’s inability to return securities on loan. The Portfolio bears the risk of any loss on investment of cash collateral. The Portfolio will receive compensation for lending its securities in the form of fees or it will retain a portion of interest earned on the investment of any cash collateral. The Portfolio will also continue to receive interest and dividends on the securities loaned and any gain or loss in the market price of the securities loaned that may occur during the term of the loan will be for the account of the Portfolio. Income earned from securities lending activities, if any, is reflected in the Statement of Operations.
(K) Dollar Rolls. The Portfolio may enter into dollar roll transactions in which it sells mortgage-backed securities ("MBS") from its portfolio to a counterparty from whom it simultaneously agrees to buy a similar security on a delayed delivery basis. The Portfolio generally transfers MBS where
| 36 | MainStay VP MacKay Strategic Bond Portfolio |
the MBS are "to be announced," therefore, the Portfolio accounts for these transactions as purchases and sales.
When accounted for as purchase and sales, the securities sold in connection with the dollar rolls are removed from the portfolio and a realized gain or loss is recognized. The securities the Portfolio has agreed to acquire are included at market value in the Portfolio of Investments and liabilities for such purchase commitments are included as payables for investments purchased. During the roll period, the Portfolio foregoes principal and interest paid on the securities. The Portfolio is compensated by the difference between the current sales price and the forward price for the future as well as by the earnings on the cash proceeds of the initial sale. Dollar rolls may be renewed without physical delivery of the securities subject to the contract. Dollar roll transactions involve certain risks, including the risk that the securities returned to the Portfolio at the end of the roll period, while substantially similar, could be inferior to what was initially sold to the counterparty.
(L) Debt and Foreign Securities Risk. The ability of issuers of debt securities held by the Portfolio to meet their obligations may be affected by, among other things, economic or political developments in a specific country, industry or region. Debt securities are also subject to the risks associated with changes in interest rates. The Portfolio primarily invests in high yield debt securities (commonly referred to as “junk bonds”), which are considered speculative because they present a greater risk of loss, including default, than higher rated debt securities. These securities pay investors a premium—a higher interest rate or yield than investment grade debt securities—because of the increased risk of loss. These securities can also be subject to greater price volatility. In times of unusual or adverse market, economic or political conditions, these securities may experience higher than normal default rates.
Investments in the Portfolio are not guaranteed, even though some of the Portfolio’s underlying investments are guaranteed by the U.S. government or its agencies or instrumentalities. The principal risk of mortgage-related and asset-backed securities is that the underlying debt may be prepaid ahead of schedule, if interest rates fall, thereby reducing the value of the Portfolio’s investment. If interest rates rise, less of the debt may be prepaid and the Portfolio may lose money because the Portfolio may be unable to invest in higher yielding assets. The Portfolio is subject to interest-rate risk and can lose principal value when interest rates rise. Bonds are also subject to credit risk, in which the bond issuer may fail to pay interest and principal in a timely manner.
The Portfolio may invest in loans which are usually rated below investment grade and are generally considered speculative because they present a greater risk of loss, including default, than higher rated debt securities. These investments pay investors a higher interest rate than investment grade debt securities because of the increased risk of loss. Although certain loans are collateralized, there is no guarantee that the value of the collateral will be sufficient to repay the loan. In a recession or serious credit event, the value of these investments could decline significantly. As a result of these and other events, the Portfolio’s NAVs could go down and you could lose money.
In addition, loans generally are subject to the extended settlement periods that may be longer than seven days. As a result, the Portfolio may be adversely affected by selling other investments at an unfavorable time and/or under unfavorable conditions or engaging in borrowing transactions, such as borrowing against its credit facility, to raise cash to meet redemption obligations or pursue other investment opportunities.
In certain circumstances, loans may not be deemed to be securities. As a result, the Portfolio may not have the protection of anti-fraud provisions of the federal securities laws. In such cases, the Portfolio generally must rely on the contractual provisions in the loan agreement and common-law fraud protections under applicable state law.
The ability of issuers of debt securities held by the Portfolio to meet their obligations may be affected by, among other things, economic or political developments in a specific country, industry or region. Debt securities are also subject to the risks associated with changes in interest rates. The Portfolio may invest in foreign securities, which carry certain risks that are in addition to the usual risks inherent in domestic securities. Foreign regulatory regimes and securities markets can have less stringent investor protections and disclosure standards and less liquid trading markets than U.S. regulatory regimes and securities markets, and can experience political, social and economic developments that may affect the value of investments in foreign securities. These risks include those resulting from currency fluctuations, future adverse political or economic developments and possible imposition of currency exchange blockages or other foreign governmental laws or restrictions. Economic sanctions and other similar governmental actions or developments could, among other things, effectively restrict or eliminate the Fund’s ability to purchase or sell certain foreign securities or groups of foreign securities, and thus may make the Fund’s investments in such securities less liquid or more difficult to value. These risks are likely to be greater in emerging markets than in developed markets. The ability of issuers of debt securities held by the Portfolio to meet their obligations may be affected by, among other things, economic or political developments in a specific country, industry or region.
(M) Counterparty Credit Risk. In order to better define its contractual rights and to secure rights that will help the Portfolio mitigate its counterparty risk, the Portfolio may enter into an International Swaps and Derivatives Association, Inc. Master Agreement (“ISDA Master Agreement”) or similar agreement with its counterparties. An ISDA Master Agreement is a bilateral agreement between the Portfolio and a counterparty that governs certain OTC derivatives and typically contains collateral posting terms and netting provisions. Under an ISDA Master Agreement, the Portfolio may, under certain circumstances, offset with the counterparty certain derivative financial instruments’ payables and/ or receivables with collateral held and/or posted and create one single net payment. The provisions of the ISDA Master Agreement typically permit a single net payment in the event of default including the bankruptcy or insolvency of the counterparty. Bankruptcy or insolvency laws of a particular jurisdiction may restrict or prohibit the right of offset in bankruptcy, insolvency or other events. In addition, certain ISDA Master
Notes to Financial Statements (continued)
Agreements may contain provisions for early termination of OTC derivative transactions in the event the net assets of the Portfolio decline below specific levels or if the Portfolio fails to meet the terms of its ISDA Master Agreements. The result would cause the Portfolio to accelerate payment of any net liability owed to the counterparty.
For financial reporting purposes, the Portfolio does not offset derivative assets and derivative liabilities that are subject to netting arrangements, if any, in the Statement of Assets and Liabilities.
(N) LIBOR Replacement Risk. The Portfolio may invest in certain debt securities, derivatives or other financial instruments that have relied or continue to rely on LIBOR, as a “benchmark” or “reference rate” for various interest rate calculations. As of January 1, 2022, the United Kingdom Financial Conduct Authority ("FCA"), which regulates LIBOR, ceased its active encouragement of banks to provide the quotations needed to sustain most LIBOR rates due to the absence of an active market for interbank unsecured lending and other reasons. In connection with supervisory guidance from U.S. regulators, certain U.S. regulated entities have generally ceased to enter into certain new LIBOR contracts after January 1, 2022. On March 15, 2022, the Adjustable Interest Rate (LIBOR) Act was signed into law. This law provides a statutory fallback mechanism on a nationwide basis to replace LIBOR with a benchmark rate that is selected by the Board of Governors of the Federal Reserve System and based on SOFR (which measures the cost of overnight borrowings through repurchase agreement transactions collateralized with U.S. Treasury securities) for tough legacy contracts. On February 27, 2023, the Federal Reserve System’s final rule in connection with this law became effective, establishing benchmark replacements based on SOFR and Term SOFR (a forward-looking measurement of market expectations of SOFR implied from certain derivatives markets) for applicable tough legacy contracts governed by U.S. law. In addition, the FCA has announced that it will require the publication of synthetic LIBOR for the one-month, three-month and six-month U.S. Dollar LIBOR settings after June 30, 2023 through at least September 30, 2024. Certain of the Portfolio's investments may involve individual tough legacy contracts which may be subject to the Adjustable Interest Rate (LIBOR) Act or synthetic LIBOR and no assurances can be given that these measures will have had the intended effects. Although the transition process away from LIBOR for many instruments has been completed, some LIBOR use is continuing and there are potential effects related to the transition away from LIBOR or continued use of LIBOR on the Portfolio.
The elimination of LIBOR or changes to other reference rates or any other changes or reforms to the determination or supervision of reference rates could have an adverse impact on the market for, or value of, any securities or payments linked to those reference rates, which may adversely affect the Portfolio's performance and/or net asset value. It could also lead to a reduction in the interest rates on, and the value of, some LIBOR-based investments and reduce the effectiveness of hedges mitigating risk in connection with LIBOR-based investments. Uncertainty and risk also remain regarding the willingness and ability of issuers and lenders to include enhanced provisions in new and existing contracts or
instruments. Consequently, the transition away from LIBOR to other reference rates may lead to increased volatility and illiquidity in markets that are tied to LIBOR, fluctuations in values of LIBOR-related investments or investments in issuers that utilize LIBOR, increased difficulty in borrowing or refinancing and diminished effectiveness of hedging strategies, adversely affecting the Portfolio's performance. Furthermore, the risks associated with the expected discontinuation of LIBOR and transition may be exacerbated if the work necessary to effect an orderly transition to an alternative reference rate is not completed in a timely manner. The usefulness of LIBOR as a benchmark could deteriorate anytime during this transition period. Any such effects of the transition process, including unforeseen effects, could result in losses to the Portfolio.
(O) Indemnifications. Under the Fund’s organizational documents, its officers and trustees are indemnified against certain liabilities that may arise out of performance of their duties to the Fund. Additionally, in the normal course of business, the Portfolio enters into contracts with third-party service providers that contain a variety of representations and warranties and that may provide general indemnifications. The Portfolio's maximum exposure under these arrangements is unknown, as this would involve future claims that may be made against the Portfolio that have not yet occurred. The Manager believes that the risk of loss in connection with these potential indemnification obligations is remote. However, there can be no assurance that material liabilities related to such obligations will not arise in the future, which could adversely impact the Portfolio.
(P) Quantitative Disclosure of Derivative Holdings. The following tables show additional disclosures related to the Portfolio's derivative and hedging activities, including how such activities are accounted for and their effect on the Portfolio's financial positions, performance and cash flows. These derivatives are not accounted for as hedging instruments.
The Portfolio entered into futures contracts in order to help manage the duration and yield curve of the portfolio while minimizing the exposure to wider bid/ask spreads in traditional bonds.
Fair value of derivative instruments as of December 31, 2023:
| Asset Derivatives | Interest
Rate
Contracts
Risk | Total |
| Futures Contracts - Net Assets—Net unrealized appreciation on futures contracts (a) | $4,753,162 | $4,753,162 |
| Total Fair Value | $4,753,162 | $4,753,162 |
| (a) | Includes cumulative appreciation (depreciation) of futures contracts as reported in the Portfolio of Investments. Only current day’s variation margin is reported within the Statement of Assets and Liabilities. |
| 38 | MainStay VP MacKay Strategic Bond Portfolio |
The effect of derivative instruments on the Statement of Operations for the year ended December 31, 2023:
| Net Realized Gain (Loss) from: | Interest
Rate
Contracts
Risk | Total |
| Futures Transactions | $ 963,108 | $ 963,108 |
| Swap Transactions | 454,364 | 454,364 |
| Total Net Realized Gain (Loss) | $1,417,472 | $1,417,472 |
| Net Change in Unrealized Appreciation (Depreciation) | Interest
Rate
Contracts
Risk | Total |
| Futures Contracts | $4,834,477 | $4,834,477 |
| Swap Contracts | (450,108) | (450,108) |
| Total Net Change in Unrealized Appreciation (Depreciation) | $4,384,369 | $4,384,369 |
| Average Notional Amount | Total |
| Futures Contracts Long | $ 102,186,767 |
| Futures Contracts Short (a) | $(211,521,445) |
| Swap Contracts Long (b) | $ 100,000,000 |
| (a) | Positions were open ten months during the reporting period. |
| (b) | Positions were open for two months during the reporting period. |
Note 3–Fees and Related Party Transactions
(A) Manager and Subadvisor. New York Life Investments, a registered investment adviser and an indirect, wholly-owned subsidiary of New York Life, serves as the Portfolio's Manager, pursuant to an Amended and Restated Management Agreement ("Management Agreement"). The Manager provides offices, conducts clerical, recordkeeping and bookkeeping services and keeps most of the financial and accounting records required to be maintained by the Portfolio. Except for the portion of salaries and expenses that are the responsibility of the Portfolio, the Manager pays the salaries and expenses of all personnel affiliated with the Portfolio and certain operational expenses of the Portfolio. The Portfolio reimburses New York Life Investments in an amount equal to the portion of the compensation of the Chief Compliance Officer attributable to the Portfolio. MacKay Shields LLC ("MacKay Shields" or the "Subadvisor"), a registered investment adviser and an indirect, wholly-owned subsidiary of New York Life, serves as the Subadvisor to the Portfolio and is responsible for the day-to-day portfolio management of the Portfolio. Pursuant to the terms of an Amended and Restated Subadvisory Agreement between New York Life Investments and MacKay Shields, New York Life Investments pays for the services of the Subadvisor.
Pursuant to the Management Agreement, the Fund pays the Manager, on behalf of the Portfolio, a monthly fee for the services performed and the facilities furnished at an annual rate of the Portfolio's average daily net assets as follows: 0.60% up to $500 million; 0.55% from $500 million to
$1 billion; 0.50% from $1 billion to $5 billion; and 0.475% in excess of $5 billion. During the year ended December 31, 2023, the effective management fee rate was 0.59% of the Portfolio's average daily net assets.
During the year ended December 31, 2023, New York Life Investments earned fees from the Portfolio in the amount of $4,090,231 and paid the Subadvisor fees in the amount of $2,045,113.
JPMorgan provides sub-administration and sub-accounting services to the Portfolio pursuant to an agreement with New York Life Investments. These services include calculating the daily NAVs of the Portfolio, maintaining the general ledger and sub-ledger accounts for the calculation of the Portfolio's NAVs, and assisting New York Life Investments in conducting various aspects of the Portfolio's administrative operations. For providing these services to the Portfolio, JPMorgan is compensated by New York Life Investments.
Pursuant to an agreement between the Fund and New York Life Investments, New York Life Investments is responsible for providing or procuring certain regulatory reporting services for the Portfolio. The Portfolio will reimburse New York Life Investments for the actual costs incurred by New York Life Investments in connection with providing or procuring these services for the Portfolio.
(B) Distribution and Service Fees. The Fund, on behalf of the Portfolio, has entered into a distribution agreement with NYLIFE Distributors LLC (the “Distributor”), an affiliate of New York Life Investments. The Portfolio has adopted a distribution plan (the “Plan”) in accordance with the provisions of Rule 12b-1 under the 1940 Act. Under the Plan, the Distributor has agreed to provide, through its affiliates or independent third parties, various distribution-related, shareholder and administrative support services to the Service Class shareholders. For its services, the Distributor is entitled to a combined distribution and service fee accrued daily and paid monthly at an annual rate of 0.25% of the average daily net assets attributable to the Service Class shares of the Portfolio.
Note 4-Federal Income Tax
As of December 31, 2023, the cost and unrealized appreciation (depreciation) of the Portfolio’s investment portfolio, including applicable derivative contracts and other financial instruments, as determined on a federal income tax basis, were as follows:
| | Federal Tax
Cost | Gross
Unrealized
Appreciation | Gross
Unrealized
(Depreciation) | Net
Unrealized
Appreciation/
(Depreciation) |
| Investments in Securities | $701,395,700 | $10,360,443 | $(39,259,497) | $(28,899,054) |
Notes to Financial Statements (continued)
As of December 31, 2023, the components of accumulated gain (loss) on a tax basis were as follows:
Ordinary
Income | Accumulated
Capital
and Other
Gain (Loss) | Other
Temporary
Differences | Unrealized
Appreciation
(Depreciation) | Total
Accumulated
Gain (Loss) |
| $115,284 | $(42,819,450) | $— | $(28,899,037) | $(71,603,203) |
The difference between book-basis and tax-basis unrealized appreciation (depreciation) is primarily due to cumulative Bond Amortization Adjustment and mark to market of futures contracts.
The following table discloses the current year reclassifications between total distributable earnings (loss) and additional paid-in capital arising from permanent differences; net assets as of December 31, 2023 were not affected.
| | Total
Distributable
Earnings (Loss) | Additional
Paid-In
Capital |
| | $(279,730) | $279,730 |
The reclassifications for the Portfolio are primarily due to characterization of distributions.
As of December 31, 2023, for federal income tax purposes, capital loss carryforwards of $42,819,450, as shown in the table below, were available to the extent provided by the regulations to offset future realized gains of the Portfolio. Accordingly, no capital gains distributions are expected to be paid to shareholders until net gains have been realized in excess of such amounts.
Capital Loss
Available Through | Short-Term
Capital Loss
Amounts (000’s) | Long-Term
Capital Loss
Amounts (000’s) |
| Unlimited | $— | $42,819 |
During the years ended December 31, 2023 and December 31, 2022, the tax character of distributions paid as reflected in the Statements of Changes in Net Assets was as follows:
| | 2023 | 2022 |
| Distributions paid from: | | |
| Ordinary Income | $32,667,126 | $26,241,321 |
| Return of Capital | — | 279,730 |
| Total | $32,667,126 | $26,521,051 |
Note 5–Custodian
JPMorgan is the custodian of cash and securities held by the Portfolio. Custodial fees are charged to the Portfolio based on the Portfolio's net assets and/or the market value of securities held by the Portfolio and the number of certain transactions incurred by the Portfolio.
Note 6–Line of Credit
The Portfolio and certain other funds managed by New York Life Investments maintain a line of credit with a syndicate of banks in order to secure a source of funds for temporary purposes to meet unanticipated or excessive redemption requests.
Effective July 25, 2023, under the credit agreement (the “Credit Agreement”), the aggregate commitment amount is $600,000,000 with an additional uncommitted amount of $100,000,000. The commitment fee is an annual rate of 0.15% of the average commitment amount payable quarterly, regardless of usage, to JPMorgan, who serves as the agent to the syndicate. The commitment fee is allocated among the Portfolio and certain other funds managed by New York Life Investments based upon their respective net assets and other factors. Interest on any revolving credit loan is charged based upon the Federal Funds Rate, Daily SOFR + 0.10%, or the Overnight Bank Funding Rate, whichever is higher. The Credit Agreement expires on July 23, 2024, although the Portfolio, certain other funds managed by New York Life Investments and the syndicate of banks may renew the Credit Agreement for an additional year on the same or different terms or enter into a credit agreement with a different syndicate of banks. Prior to July 25, 2023, the aggregate commitment amount and the commitment fee were the same as those under the current Credit Agreement. During the year ended December 31, 2023, there were no borrowings made or outstanding with respect to the Portfolio under the Credit Agreement.
Note 7–Interfund Lending Program
Pursuant to an exemptive order issued by the SEC, the Portfolio, along with certain other funds managed by New York Life Investments, may participate in an interfund lending program. The interfund lending program provides an alternative credit facility that permits the Portfolio and certain other funds managed by New York Life Investments to lend or borrow money for temporary purposes directly to or from one another, subject to the conditions of the exemptive order. During the year ended December 31, 2023, there were no interfund loans made or outstanding with respect to the Portfolio.
Note 8–Purchases and Sales of Securities (in 000’s)
During the year ended December 31, 2023, purchases and sales of U.S. government securities were $104,388 and $130,679, respectively. Purchases and sales of securities, other than U.S. government securities and short-term securities, were $379,197 and $422,112, respectively.
| 40 | MainStay VP MacKay Strategic Bond Portfolio |
Note 9–Capital Share Transactions
Transactions in capital shares for the years ended December 31, 2023 and December 31, 2022, were as follows:
| Initial Class | Shares | Amount |
| Year ended December 31, 2023: | | |
| Shares sold | 333,886 | $ 3,104,371 |
| Shares issued to shareholders in reinvestment of distributions | 130,069 | 1,206,905 |
| Shares redeemed | (130,832) | (1,216,543) |
| Net increase (decrease) | 333,123 | $ 3,094,733 |
| Year ended December 31, 2022: | | |
| Shares sold | 89,545 | $ 852,271 |
| Shares issued to shareholders in reinvestment of distributions | 88,439 | 814,814 |
| Shares redeemed | (206,737) | (1,972,794) |
| Net increase (decrease) | (28,753) | $ (305,709) |
| |
| Service Class | Shares | Amount |
| Year ended December 31, 2023: | | |
| Shares sold | 3,331,140 | $ 30,892,200 |
| Shares issued to shareholders in reinvestment of distributions | 3,404,406 | 31,460,221 |
| Shares redeemed | (15,640,912) | (144,562,302) |
| Net increase (decrease) | (8,905,366) | $ (82,209,881) |
| Year ended December 31, 2022: | | |
| Shares sold | 1,908,507 | $ 17,999,831 |
| Shares issued to shareholders in reinvestment of distributions | 2,796,524 | 25,706,237 |
| Shares redeemed | (19,275,558) | (182,302,115) |
| Net increase (decrease) | (14,570,527) | $(138,596,047) |
Note 10–Other Matters
As of the date of this report, the Portfolio faces a heightened level of risk associated with current uncertainty, volatility and state of economies, financial markets, rising interest rates, and labor and health conditions around the world. Events such as war, acts of terrorism, recessions, rapid inflation, the imposition of international sanctions, earthquakes, hurricanes, epidemics and pandemics and other unforeseen natural or human disasters may have broad adverse social, political and economic effects on the global economy, which could negatively impact the value of the Portfolio's investments. Developments that disrupt global economies and financial markets may magnify factors that affect the Portfolio's performance.
Note 11–Subsequent Events
In connection with the preparation of the financial statements of the Portfolio as of and for the year ended December 31, 2023, events and transactions subsequent to December 31, 2023, through the date the financial statements were issued, have been evaluated by the Manager
for possible adjustment and/or disclosure. No subsequent events requiring financial statement adjustment or disclosure have been identified.
Report of Independent Registered Public Accounting Firm
To the Board of Trustees of MainStay VP Funds Trust and Shareholders of MainStay VP MacKay Strategic Bond Portfolio
Opinion on the Financial Statements
We have audited the accompanying statement of assets and liabilities, including the portfolio of investments, of MainStay VP MacKay Strategic Bond Portfolio (one of the portfolios constituting MainStay VP Funds Trust, referred to hereafter as the “Portfolio”) as of December 31, 2023, the related statement of operations for the year ended December 31, 2023, the statements of changes in net assets for each of the two years in the period ended December 31, 2023, including the related notes, and the financial highlights for each of the five years in the period ended December 31, 2023 (collectively referred to as the “financial statements”). In our opinion, the financial statements present fairly, in all material respects, the financial position of the Portfolio as of December 31, 2023, the results of its operations for the year then ended, the changes in its net assets for each of the two years in the period ended December 31, 2023 and the financial highlights for each of the five years in the period ended December 31, 2023 in conformity with accounting principles generally accepted in the United States of America.
Basis for Opinion
These financial statements are the responsibility of the Portfolio’s management. Our responsibility is to express an opinion on the Portfolio’s financial statements based on our audits. We are a public accounting firm registered with the Public Company Accounting Oversight Board (United States) (PCAOB) and are required to be independent with respect to the Portfolio in accordance with the U.S. federal securities laws and the applicable rules and regulations of the Securities and Exchange Commission and the PCAOB.
We conducted our audits of these financial statements in accordance with the standards of the PCAOB. Those standards require that we plan and perform the audit to obtain reasonable assurance about whether the financial statements are free of material misstatement, whether due to error or fraud.
Our audits included performing procedures to assess the risks of material misstatement of the financial statements, whether due to error or fraud, and performing procedures that respond to those risks. Such procedures included examining, on a test basis, evidence regarding the amounts and disclosures in the financial statements. Our audits also included evaluating the accounting principles used and significant estimates made by management, as well as evaluating the overall presentation of the financial statements. Our procedures included confirmation of securities owned as of December 31, 2023 by correspondence with the custodian, transfer agents, agent banks and brokers; when replies were not received from brokers, we performed other auditing procedures. We believe that our audits provide a reasonable basis for our opinion.
/s/PricewaterhouseCoopers LLP
New York, New York
February 26, 2024
We have served as the auditor of one or more investment companies in the MainStay group of funds since 1984.
| 42 | MainStay VP MacKay Strategic Bond Portfolio |
Board Consideration and Approval of Management Agreement and Subadvisory Agreement (Unaudited)
The continuation of the Management Agreement with respect to the MainStay VP MacKay Strategic Bond Portfolio (“Portfolio”) and New York Life Investment Management LLC (“New York Life Investments”) and the Subadvisory Agreement between New York Life Investments and MacKay Shields LLC (“MacKay”) with respect to the Portfolio (together, “Advisory Agreements”) is subject to annual review and approval by the Board of Trustees of MainStay VP Funds Trust (“Board” of the “Trust”) in accordance with Section 15 of the Investment Company Act of 1940, as amended (“1940 Act”). At its December 6–7, 2023 meeting, the Board, including the Trustees who are not an “interested person” (as such term is defined in the 1940 Act) of the Trust (“Independent Trustees”) voting separately, unanimously approved the continuation of each of the Advisory Agreements for a one-year period.
In reaching the decision to approve the continuation of each of the Advisory Agreements, the Board considered information and materials furnished by New York Life Investments and MacKay in connection with an annual contract review process undertaken by the Board that took place at meetings of the Board and its Contracts Committee from September 2023 through December 2023, including information and materials furnished by New York Life Investments and MacKay in response to requests prepared on behalf of the Board, and in consultation with the Independent Trustees, by independent legal counsel to the Independent Trustees, which encompassed a variety of topics, including those summarized below. Information and materials requested by and furnished to the Board for consideration in connection with the contract review process included, among other items, reports on the Portfolio and “peer funds” prepared by Institutional Shareholder Services Inc. (“ISS”), an independent third-party service provider engaged by the Board to report objectively on the Portfolio’s investment performance, management fee and total expenses. The Board also considered information on the fees charged to other investment advisory clients of New York Life Investments and/or MacKay that follow investment strategies similar to those of the Portfolio, if any, and, when applicable, the rationale for differences in the Portfolio’s management and subadvisory fees and the fees charged to those other investment advisory clients. In addition, the Board considered information regarding the legal standards and fiduciary obligations applicable to its consideration of the continuation of each of the Advisory Agreements. The contract review process, including the structure and format for information and materials provided to the Board, has been developed in consultation with the Board. The Independent Trustees also met in executive sessions with their independent legal counsel and, for portions thereof, with senior management of New York Life Investments.
The Board’s deliberations with respect to the continuation of each of the Advisory Agreements reflect a year-long process, and the Board also took into account information furnished to the Board and its Committees throughout the year, as deemed relevant and appropriate by the Trustees, including, among other items, reports on investment performance of the Portfolio and investment-related matters for the Portfolio as well as presentations from New York Life Investments and, generally annually, MacKay personnel. In addition, the Board took into account other
information provided by New York Life Investments throughout the year, including, among other items, periodic reports on legal and compliance matters, risk management, portfolio turnover, brokerage commissions and non-advisory services provided to the Portfolio by New York Life Investments, as deemed relevant and appropriate by the Trustees.
In addition to information provided to the Board throughout the year, the Board received information in connection with its June 2023 meeting provided specifically in response to requests prepared on behalf of the Board, and in consultation with the Independent Trustees, by independent legal counsel to the Independent Trustees regarding the Portfolio’s distribution arrangements. In addition, the Board received information regarding the Portfolio’s asset levels, share purchase and redemption activity and the payment of Rule 12b-1 and/or certain other fees by the applicable share classes of the Portfolio, among other information.
In considering the continuation of each of the Advisory Agreements, the Trustees reviewed and evaluated the information and factors they believed to reasonably be necessary and appropriate in light of legal advice furnished to them by independent legal counsel to the Independent Trustees and through the exercise of their own business judgment. Although individual Trustees may have weighed certain factors or information differently and the Board did not consider any single factor or information controlling in reaching its decision, the factors that figured prominently in the Board’s consideration of the continuation of each of the Advisory Agreements are summarized in more detail below and include, among other factors: (i) the nature, extent and quality of the services provided to the Portfolio by New York Life Investments and MacKay; (ii) the qualifications of the portfolio managers of the Portfolio and the historical investment performance of the Portfolio, New York Life Investments and MacKay; (iii) the costs of the services provided, and profits realized, by New York Life Investments and MacKay with respect to their relationships with the Portfolio; (iv) the extent to which economies of scale have been realized or may be realized if the Portfolio grows and the extent to which any economies of scale have been shared, have benefited or may benefit the Portfolio’s shareholders; and (v) the reasonableness of the Portfolio’s management and subadvisory fees and total ordinary operating expenses. Although the Board recognized that comparisons between the Portfolio’s fees and expenses and those of other funds are imprecise given different terms of agreements, variations in fund strategies and other factors, the Board considered the reasonableness of the Portfolio’s management fee and total ordinary operating expenses as compared to the peer funds identified by ISS. Throughout their considerations, the Trustees acknowledged the commitment of New York Life Investments and its affiliates to serve the MainStay Group of Funds, as well as their capacity, experience, resources, financial stability and reputations. The Trustees also acknowledged the entrepreneurial and other risks assumed by New York Life Investments in sponsoring and managing the Portfolio. With respect to the Subadvisory Agreement, the Board took into account New York Life Investments’ recommendation to approve the continuation of the Subadvisory Agreement.
Board Consideration and Approval of Management Agreement and Subadvisory Agreement (Unaudited) (continued)
The Trustees noted that, throughout the year, the Trustees are afforded an opportunity to ask questions of, and request additional information or materials from, New York Life Investments and MacKay. The Board’s decision with respect to each of the Advisory Agreements may have also been based, in part, on the Board’s knowledge of New York Life Investments and MacKay resulting from, among other things, the Board’s consideration of each of the Advisory Agreements in prior years, the advisory agreements for other funds in the MainStay Group of Funds, the Board’s review throughout the year of the performance and operations of other funds in the MainStay Group of Funds and each Trustee’s business judgment and industry experience. In addition to considering the above-referenced factors, the Board observed that in the marketplace, notably under variable life insurance policies and variable annuity contracts for which the Portfolio serves as an investment option, there are a range of investment options available to investors and that the Portfolio’s shareholders, having had the opportunity to consider other investment options, have invested in the Portfolio.
The factors that figured prominently in the Board’s decision to approve the continuation of each of the Advisory Agreements during the Board’s December 6–7, 2023 meeting are summarized in more detail below.
Nature, Extent and Quality of Services Provided by New York Life Investments and MacKay
The Board examined the nature, extent and quality of the services that New York Life Investments provides to the Portfolio. The Board evaluated New York Life Investments’ experience and capabilities in serving as manager of the Portfolio and considered that the Portfolio operates in a “manager-of-managers” structure. The Board also considered New York Life Investments’ responsibilities and services provided pursuant to this structure, including overseeing the services provided by MacKay, evaluating the performance of MacKay, making recommendations to the Board as to whether the Subadvisory Agreement should be renewed, modified or terminated and periodically reporting to the Board regarding the results of New York Life Investments’ evaluation and monitoring functions. The Board noted that New York Life Investments manages other mutual funds, serves a variety of other investment advisory clients, including other pooled investment vehicles, and has experience overseeing mutual fund service providers, including subadvisors. The Board considered the experience of senior personnel at New York Life Investments providing management and administrative and other non-advisory services to the Portfolio. The Board observed that New York Life Investments devotes significant resources and time to providing management and administrative and other non-advisory services to the Portfolio, including New York Life Investments’ oversight and due diligence reviews of MacKay and ongoing analysis of, and interactions with, MacKay with respect to, among other things, the Portfolio’s investment performance and risks as well as MacKay’s investment capabilities and subadvisory services with respect to the Portfolio.
The Board also considered the range of services that New York Life Investments provides to the Portfolio under the terms of the Management Agreement, including: (i) fund accounting and ongoing supervisory
services provided by New York Life Investments’ Fund Administration and Accounting Group; (ii) investment supervisory and analytical services provided by New York Life Investments’ Investment Consulting Group; (iii) compliance services provided by the Trust’s Chief Compliance Officer as well as New York Life Investments’ compliance department, including supervision and implementation of the Portfolio’s compliance program; (iv) legal services provided by New York Life Investments’ Office of the General Counsel; and (v) risk management monitoring and analysis by compliance and investment personnel. In addition, the Board considered New York Life Investments’ willingness to invest in personnel and other resources, such as cyber security, information security and business continuity planning, that may benefit the Portfolio and noted that New York Life Investments is responsible for compensating the Trust’s officers, except for a portion of the salary of the Trust’s Chief Compliance Officer. The Board recognized that New York Life Investments provides certain other non-advisory services to the Portfolio and has over time provided an increasingly broad array of non-advisory services to the MainStay Group of Funds as a result of regulatory and other developments.
The Board also examined the range, and the nature, extent and quality, of the investment advisory services that MacKay provides to the Portfolio and considered the terms of each of the Advisory Agreements. The Board evaluated MacKay’s experience and performance in serving as subadvisor to the Portfolio and advising other portfolios and MacKay’s track record and experience in providing investment advisory services as well as the experience of investment advisory, senior management and administrative personnel at MacKay. The Board considered New York Life Investments’ and MacKay’s overall resources, legal and compliance environment, capabilities, reputation, financial condition and history. In addition to information provided in connection with quarterly meetings with the Trust’s Chief Compliance Officer, the Board considered information regarding the compliance policies and procedures of New York Life Investments and MacKay and acknowledged their commitment to further developing and strengthening compliance programs that may relate to the Portfolio. The Board also considered MacKay’s ability to recruit and retain qualified investment professionals and willingness to invest in personnel and other resources that may benefit the Portfolio. In this regard, the Board considered the qualifications and experience of the Portfolio’s portfolio managers, the number of accounts managed by the portfolio managers and the method for compensating the portfolio managers.
In addition, the Board considered information provided by New York Life Investments and MacKay regarding their respective business continuity and disaster recovery plans.
Based on these considerations, among others, the Board concluded that the Portfolio would likely continue to benefit from the nature, extent and quality of these services.
Investment Performance
In evaluating the Portfolio’s investment performance, the Board considered investment performance results over various periods in light of the Portfolio’s investment objective, strategies and risks. The Board
| 44 | MainStay VP MacKay Strategic Bond Portfolio |
considered investment reports on, and analysis of, the Portfolio’s performance provided to the Board throughout the year. These reports include, among other items, information on the Portfolio’s gross and net returns, the Portfolio’s investment performance compared to a relevant investment category and the Portfolio’s benchmarks, the Portfolio’s risk-adjusted investment performance and the Portfolio’s investment performance as compared to peer funds, as appropriate, as well as portfolio attribution information and commentary on the effect of market conditions. The Board also considered information provided by ISS showing the investment performance of the Portfolio as compared to peer funds. In addition, the Board reviewed the methodology used by ISS to construct the group of peer funds for comparative purposes.
The Board also took into account its discussions with senior management at New York Life Investments concerning the Portfolio’s investment performance over various periods as well as discussions between representative of MacKay and the members of the Board’s Investment Committee, which generally occur on an annual basis.
Based on these considerations, among others, the Board concluded that its review of the Portfolio’s investment performance and related information supported a determination to approve the continuation of each of the Advisory Agreements.
Costs of the Services Provided, and Profits and Other Benefits Realized, by New York Life Investments and MacKay
The Board considered the costs of the services provided under each of the Advisory Agreements. The Board also considered the profitability of New York Life Investments and its affiliates, including MacKay, due to their relationships with the Portfolio as well as by New York Life Investments and its affiliates due to their relationships with the MainStay Group of Funds. Because MacKay is an affiliate of New York Life Investments whose subadvisory fee is paid by New York Life Investments, not the Portfolio, the Board considered cost and profitability information for New York Life Investments and MacKay in the aggregate.
In addition, the Board acknowledged the difficulty in obtaining reliable comparative data about mutual fund managers’ profitability because such information generally is not publicly available and may be impacted by numerous factors, including the structure of a fund manager’s organization, the types of funds it manages, the methodology used to allocate certain fixed costs to specific funds and the manager’s capital structure and costs of capital.
In evaluating the costs of the services provided by New York Life Investments and MacKay, and profitability of New York Life Investments and its affiliates, including MacKay due to their relationships with the Portfolio, the Board considered, among other factors, New York Life Investments’ and its affiliates’, including MacKay’s, continuing investments in, or willingness to invest in, personnel and other resources that may support and further enhance the management of the Portfolio, and that New York Life Investments is responsible for paying the subadvisory fee for the Portfolio. The Board also considered the financial resources of New York Life Investments and MacKay and acknowledged
that New York Life Investments and MacKay must be in a position to recruit and retain experienced professional personnel and to maintain a strong financial position for New York Life Investments and MacKay to continue to provide high-quality services to the Portfolio. The Board recognized that the Portfolio benefits from the allocation of certain fixed costs among the funds in the MainStay Group of Funds, among other expected benefits resulting from its relationship with New York Life Investments.
The Board considered information regarding New York Life Investments’ methodology for calculating profitability and allocating costs provided by New York Life Investments in connection with the fund profitability analysis presented to the Board. The Board concluded that New York Life Investments’ methods for allocating costs and procedures for estimating overall profitability of the relationship with the funds in the MainStay Group of Funds were reasonable. The Board recognized the difficulty in calculating and evaluating a manager’s profitability with respect to the Portfolio and considered that other profitability methodologies may also be reasonable.
The Board also considered certain fall-out benefits that may be realized by New York Life Investments and its affiliates, including MacKay, due to their relationships with the Portfolio, including reputational and other indirect benefits. The Board recognized, for example, the benefits to MacKay from legally permitted “soft-dollar” arrangements by which brokers provide research and other services to MacKay in exchange for commissions paid by the Portfolio with respect to trades in the Portfolio’s portfolio securities. In addition, the Board considered its review of the management agreement for a money market fund advised by New York Life Investments and an affiliated subadvisor that serves as an investment option for the Portfolio, including the potential rationale for and costs associated with investments in this money market fund by the Portfolio, if any, and considered information from New York Life Investments that the nature and type of specific investment advisory services provided to this money market fund are distinct from, or in addition to, the investment advisory services provided to the Portfolio. In addition, the Board considered the potential dividend received tax deduction for insurance company affiliates of New York Life Investments from the Portfolio’s securities lending activity.
The Board noted that the Portfolio serves as an investment option primarily under variable contracts issued by affiliates of New York Life Investments that would receive fees under those contracts. The Board observed that, in addition to fees earned by New York Life Investments under the Management Agreement for managing the Portfolio, New York Life Investments’ affiliates also earn revenues from serving the Portfolio in various other capacities, including as the Portfolio’s distributor, and insurance companies affiliated with New York Life Investments would be entitled to receive fees from the Portfolio under a distribution and service plan adopted pursuant to Rule 12b-1 under the 1940 Act. The Board considered information about these other revenues and their impact on the profitability of the relationship with the Portfolio to New York Life Investments and its affiliates. The Board noted that, although it assessed the overall profitability of the relationship with the Portfolio to New York
Board Consideration and Approval of Management Agreement and Subadvisory Agreement (Unaudited) (continued)
Life Investments and its affiliates as part of the contract review process, when considering the reasonableness of the fee paid to New York Life Investments under the Management Agreement, the Board considered the profitability of New York Life Investments’ relationship with the Portfolio on a pre-tax basis and without regard to distribution expenses incurred by New York Life Investments from its own resources.
After evaluating the information deemed relevant by the Trustees, the Board concluded that any profits realized by New York Life Investments and its affiliates, including MacKay, due to their relationships with the Portfolio were not excessive and other expected benefits that may accrue to New York Life Investments and its affiliates, including MacKay, are reasonable.
Management and Subadvisory Fees and Total Ordinary Operating Expenses
The Board evaluated the reasonableness of the fee paid under each of the Advisory Agreements and the Portfolio’s total ordinary operating expenses. With respect to the management fee and subadvisory fee, the Board primarily considered the reasonableness of the management fee paid by the Portfolio to New York Life Investments because the subadvisory fee paid to MacKay is paid by New York Life Investments, not the Portfolio. The Board also considered the reasonableness of the subadvisory fee paid by New York Life Investments and the amount of the management fee retained by New York Life Investments.
In assessing the reasonableness of the Portfolio’s fees and expenses, the Board primarily considered comparative data provided by ISS on the fees and expenses of similar mutual funds managed by other investment advisers. The Board reviewed the methodology used by ISS to construct the group of peer funds for comparative purposes. In addition, the Board considered information provided by New York Life Investments and MacKay on fees charged to other investment advisory clients, including institutional separate accounts and/or other funds, that follow investment strategies similar to those of the Portfolio, if any. The Board considered the contractual management fee schedule for the Portfolio as compared to those for such other investment advisory clients, taking into account the rationale for differences in fee schedules. The Board also took into account information provided by New York Life Investments about the more extensive scope of services provided to registered investment companies, such as the Portfolio, as compared with other investment advisory clients. Additionally, the Board considered the impact of contractual breakpoints and voluntary waivers on the Portfolio’s net management fee and expenses. The Board also considered that in proposing fees for the Portfolio, New York Life Investments considers the competitive marketplace for mutual funds.
Based on the factors outlined above, among other considerations, the Board concluded that the Portfolio’s management fee and total ordinary operating expenses are within a range that is competitive and support a conclusion that these fees and expenses are reasonable.
Economies of Scale
The Board considered information regarding economies of scale, including whether economies of scale may exist with respect to the Portfolio and whether the Portfolio’s management fee and expense structure permits any economies of scale to be appropriately shared with the Portfolio’s shareholders. The Board also considered a report from New York Life Investments, previously prepared at the request of the Board, that addressed economies of scale, including with respect to the mutual fund business generally, and the various ways in which the benefits of economies of scale may be shared with the funds in the MainStay Group of Funds. Although the Board recognized the difficulty of determining economies of scale with precision, the Board acknowledged that economies of scale may be shared with the Portfolio in a number of ways, including, for example, through the imposition of fee breakpoints, initially setting management fee rates at scale or making additional investments to enhance the services provided to the Portfolio. The Board reviewed information from New York Life Investments showing how the Portfolio’s management fee schedule compared to fee schedules of other funds and accounts managed by New York Life Investments. The Board also reviewed information from ISS showing how the Portfolio’s management fee schedule compared with fees paid for similar services by peer funds at varying asset levels.
Based on this information, the Board concluded that economies of scale are appropriately shared for the benefit of the Portfolio’s shareholders through the Portfolio’s management fee and expense structure and other methods to share benefits from economies of scale.
Conclusion
On the basis of the information and factors summarized above, among other information and factors deemed relevant by the Trustees, and the evaluation thereof, the Board, including the Independent Trustees voting separately, unanimously voted to approve the continuation of each of the Advisory Agreements.
| 46 | MainStay VP MacKay Strategic Bond Portfolio |
Proxy Voting Policies and Procedures and Proxy Voting Record
The Portfolio is required to file with the SEC its proxy voting record for the 12-month period ending June 30 on Form N-PX. A description of the policies and procedures that are used to vote proxies relating to portfolio securities of the Portfolio is available free of charge upon request by calling 800-598-2019 or visiting the SEC's website at www.sec.gov. The most recent Form N-PX or proxy voting record is available free of charge upon request by calling 800-598-2019; visiting https://www.newyorklifeinvestments.com/investment-products/vp; or visiting the SEC’s website at www.sec.gov.
Shareholder Reports and Quarterly Portfolio Disclosure
The Portfolio is required to file its complete schedule of portfolio holdings with the SEC 60 days after its first and third fiscal quarter on Form N-PORT. The Portfolio's holdings report is available free of charge upon request by calling 800-598-2019 or by visiting the SEC’s website at www.sec.gov.
Board of Trustees and Officers (Unaudited)
The Trustees and officers of the Portfolio are listed below. The Board oversees the MainStay Group of Funds (which consists of MainStay Funds and MainStay Funds Trust), MainStay VP Funds Trust, MainStay MacKay DefinedTerm Municipal Opportunities Fund, MainStay CBRE Global Infrastructure Megatrends Term Fund, the Manager and the Subadvisors, and elects the officers of the Portfolios who are responsible for the day-to-day operations of the Portfolio. Information pertaining to the Trustees and officers is set forth below. Each Trustee serves until his or her successor is elected and qualified or until his or her resignation,
death or removal. Under the Board’s retirement policy, unless an exception is made, a Trustee must tender his or her resignation by the end of the calendar year during which he or she reaches the age of 75. Officers are elected annually by the Board. The business address of each Trustee and officer listed below is 51 Madison Avenue, New York, New York 10010. A majority of the Trustees are not “interested persons” (as defined by the 1940 Act and rules adopted by the SEC thereunder) of the Portfolio (“Independent Trustees”).
| | Name and
Year of Birth | Term of Office,
Position(s) Held and
Length of Service | Principal Occupation(s)
During Past Five Years | Number of
Portfolios in
Fund Complex
Overseen by
Trustee | Other Directorships
Held by Trustee |
| | | | | | |
| | Naïm Abou-Jaoudé*
1966 | MainStay VP Funds Trust: Trustee since 2023 | Chief Executive Officer of New York Life Investment Management LLC (since 2023). Chief Executive Officer of Candriam (an affiliate of New York Life Investment Management LLC) (2007 to 2023). | 81 | MainStay Funds: Trustee since 2023 (11 Funds)
MainStay Funds Trust: Trustee since 2023 (37 Funds);
MainStay MacKay DefinedTerm Municipal Opportunities Fund: Trustee since 2023;
MainStay CBRE Global Infrastructure Megatrends Term Fund: Trustee since 2023; and
New York Life Investment Management International (Chair) since 2015 |
| * | This Trustee is considered to be an “interested person” of the MainStay Group of Funds, MainStay VP Funds Trust, MainStay CBRE Global Infrastructure Megatrends Term Fund and MainStay MacKay DefinedTerm Municipal Opportunities Fund, within the meaning of the 1940 Act because of his affiliation with New York Life Investment Management LLC and Candriam, as described in detail above in the column entitled “Principal Occupation(s) During Past Five Years.” |
| | |
| 48 | MainStay VP MacKay Strategic Bond Portfolio |
| | Name and
Year of Birth | Term of Office,
Position(s) Held and
Length of Service | Principal Occupation(s)
During Past Five Years | Number of
Portfolios in
Fund Complex
Overseen by
Trustee | Other Directorships
Held by Trustee |
| | | | | | |
| | David H. Chow
1957 | MainStay VP Funds Trust: Trustee since January 2016, Advisory Board Member (June 2015 to December 2015) | Founder and CEO, DanCourt Management, LLC since 1999 | 81 | MainStay Funds: Trustee since January 2016, Advisory Board Member (June 2015 to December 2015) (11 Funds);
MainStay Funds Trust: Trustee since January 2016, Advisory Board Member (June 2015 to December 2015) (37 Funds);
MainStay MacKay DefinedTerm Municipal Opportunities Fund: Trustee since January 2016, Advisory Board Member (June 2015 to December 2015);
MainStay CBRE Global Infrastructure Megatrends Term Fund: Trustee since 2021;
VanEck Vectors Group of Exchange-Traded Funds: Trustee since 2006 and Independent Chairman of the Board of Trustees from 2008 to 2022 (57 portfolios); and
Berea College of Kentucky: Trustee since 2009, Chair of the Investment Committee since 2018 |
| | Karen Hammond
1956 | MainStay VP Funds Trust: Trustee since December 2021, Advisory Board Member (June 2021 to December 2021)
| Retired, Managing Director, Devonshire Investors (2007 to 2013); Senior Vice President, Fidelity Management & Research Co. (2005 to 2007); Senior Vice President and Corporate Treasurer, FMR Corp. (2003 to 2005); Chief Operating Officer, Fidelity Investments Japan (2001 to 2003) | 81 | MainStay Funds: Trustee since December 2021, Advisory Board Member (June 2021 to December 2021) (11 Funds);
MainStay Funds Trust: Trustee since December 2021, Advisory Board Member (June 2021 to December 2021) (37 Funds);
MainStay MacKay DefinedTerm Municipal Opportunities Fund: Trustee since December 2021, Advisory Board Member (June 2021 to December 2021);
MainStay CBRE Global Infrastructure Megatrends Term Fund: Trustee since December 2021, Advisory Board Member (June 2021 to December 2021);
Two Harbors Investment Corp.: Director since 2018;
Rhode Island State Investment Commission: Member since 2017; and
Blue Cross Blue Shield of Rhode Island: Director since 2019 |
| | Susan B. Kerley
1951 | MainStay VP Funds Trust: Chair since 2017 and Trustee since 2007** | President, Strategic Management Advisors LLC since 1990 | 81 | MainStay Funds: Chair since January 2017 and Trustee since 2007 (11 Funds); MainStay Funds Trust: Chair since January 2017 and Trustee since 1990 (37 Funds)***;
MainStay MacKay DefinedTerm Municipal Opportunities Fund: Chair since January 2017 and Trustee since 2011;
MainStay CBRE Global Infrastructure Megatrends Term Fund: Trustee since June 2021; and
Legg Mason Partners Funds: Trustee since 1991 (45 portfolios) |
Board of Trustees and Officers (Unaudited) (continued)
| | Name and
Year of Birth | Term of Office,
Position(s) Held and
Length of Service | Principal Occupation(s)
During Past Five Years | Number of
Portfolios in
Fund Complex
Overseen by
Trustee | Other Directorships
Held by Trustee |
| | | | | | |
| | Alan R. Latshaw
1951 | MainStay VP Funds Trust: Trustee since 2007** | Retired; Partner, Ernst & Young LLP (2002 to 2003); Partner, Arthur Andersen LLP (1989 to 2002); Consultant to the MainStay Funds Audit and Compliance Committee (2004 to 2006) | 81 | MainStay Funds: Trustee since 2006 (11 Funds);
MainStay Funds Trust: Trustee since 2007 (37 Funds)***;
MainStay MacKay DefinedTerm Municipal Opportunities Fund: Trustee since 2011; and
MainStay CBRE Global Infrastructure Megatrends Term Fund: Trustee since June 2021 |
| | Jacques P. Perold
1958 | MainStay VP Funds Trust: Trustee since January 2016, Advisory Board Member (June 2015 to December 2015) | Founder and Chief Executive Officer, CapShift Advisors LLC (since 2018); President, Fidelity Management & Research Company (2009 to 2014); President and Chief Investment Officer, Geode Capital Management, LLC (2001 to 2009) | 81 | MainStay Funds: Trustee since January 2016, Advisory Board Member (June 2015 to December 2015) (11 Funds);
MainStay Funds Trust: Trustee since January 2016, Advisory Board Member (June 2015 to December 2015) (37 Funds);
MainStay MacKay DefinedTerm Municipal Opportunities Fund: Trustee since January 2016, Advisory Board Member (June 2015 to December 2015);
MainStay CBRE Global Infrastructure Megatrends Term Fund: Trustee since June 2021;
Allstate Corporation: Director since 2015;
Partners in Health: Trustee since 2019; and
MSCI Inc.: Director since 2017 |
| | Richard S. Trutanic
1952 | MainStay VP Funds Trust: Trustee since 2007** | Chairman and Chief Executive Officer, Somerset & Company (financial advisory firm) since 2004; Managing Director, The Carlyle Group (private investment firm) (2002 to 2004); Senior Managing Director, Partner and Board Member, Groupe Arnault S.A. (private investment firm) (1999 to 2002) | 81 | MainStay Funds: Trustee since 1994 (11 Funds);
MainStay Funds Trust: Trustee since 2007 (37 Funds)***;
MainStay MacKay DefinedTerm Municipal Opportunities Fund: Trustee since 2011; and
MainStay CBRE Global Infrastructure Megatrends Term Fund: Trustee since June 2021 |
| ** | Includes prior service as a Director of MainStay VP Series Fund, Inc., the predecessor to MainStay VP Funds Trust. |
| *** | Includes prior service as a Director/Trustee of certain predecessor entities to MainStay Funds Trust. |
| 50 | MainStay VP MacKay Strategic Bond Portfolio |
| | Name and
Year of Birth | Position(s) Held and
Length of Service | Principal Occupation(s)
During Past Five Years | |
| | | | | |
| | Kirk C. Lehneis
1974 | President, MainStay VP Funds Trust (since 2017) | Chief Operating Officer and Senior Managing Director (since 2016), New York Life Investment Management LLC and New York Life Investment Management Holdings LLC; Member of the Board of Managers (since 2017) and Senior Managing Director (since 2018), NYLIFE Distributors LLC; Chairman of the Board and Senior Managing Director, NYLIM Service Company LLC (since 2017); Trustee, President and Principal Executive Officer of IndexIQ Trust, IndexIQ ETF Trust and IndexIQ Active ETF Trust (since 2018); President, MainStay CBRE Global Infrastructure Megatrends Term Fund (since 2021), MainStay MacKay DefinedTerm Municipal Opportunities Fund, MainStay Funds and MainStay Funds Trust (since 2017); Senior Managing Director, Global Product Development (from 2015 to 2016); Managing Director, Product Development (from 2010 to 2015), New York Life Investment Management LLC | |
| | Jack R. Benintende
1964 | Treasurer and Principal Financial and Accounting Officer, MainStay VP Funds Trust (since 2007)** | Managing Director, New York Life Investment Management LLC (since 2007); Treasurer and Principal Financial and Accounting Officer, MainStay CBRE Global Infrastructure Megatrends Term Fund (since 2021), MainStay MacKay DefinedTerm Municipal Opportunities Fund (since 2011), MainStay Funds Trust (since 2009) and MainStay Funds (since 2007); and Assistant Treasurer, New York Life Investment Management Holdings LLC (2008 to 2012) | |
| | J. Kevin Gao
1967 | Secretary and Chief Legal Officer, MainStay VP Funds Trust (since 2010)** | Managing Director and Associate General Counsel, New York Life Investment Management LLC (since 2010); Secretary and Chief Legal Officer, MainStay CBRE Global Infrastructure Megatrends Term Fund (since 2021), MainStay MacKay DefinedTerm Municipal Opportunities Fund (since 2011), MainStay Funds and MainStay Funds Trust (since 2010) | |
| | Kevin M. Gleason
1967 | Vice President and Chief Compliance Officer, MainStay VP Funds Trust (since June 2022) | Vice President and Chief Compliance Officer, IndexIQ Trust, IndexIQ ETF Trust and IndexIQ Active ETF Trust (since June 2022); Vice President and Chief Compliance Officer, MainStay CBRE Global Infrastructure Megatrends Term Fund, MainStay MacKay DefinedTerm Municipal Opportunities Fund (since June 2022); MainStay Funds Trust and MainStay Funds (since June 2022); Senior Vice President, Voya Investment Management and Chief Compliance Officer, Voya Family of Funds (2012 to 2022) | |
| | Scott T. Harrington
1959 | Vice President— Administration, MainStay VP Funds Trust (since 2005)** | Managing Director, New York Life Investment Management LLC (including predecessor advisory organizations) (since 2000); Member of the Board of Directors, New York Life Trust Company (since 2009); Vice President—Administration, MainStay CBRE Global Infrastructure Megatrends Term Fund (since 2021), MainStay MacKay DefinedTerm Municipal Opportunities Fund (since 2011), MainStay Funds Trust and MainStay Funds (since 2009) | |
| * | The officers listed above are considered to be “interested persons” of the MainStay Group of Funds, MainStay VP Funds Trust, MainStay CBRE Global Infrastructure Megatrends Term Fund and MainStay MacKay DefinedTerm Municipal Opportunities Fund within the meaning of the 1940 Act because of their affiliation with the MainStay Group of Funds, New York Life Insurance Company and/or its affiliates, including New York Life Investment Management LLC, New York Life Insurance Company, NYLIM Service Company LLC, NYLIFE Securities LLC and/or NYLIFE Distributors LLC, as described in detail in the column captioned “Principal Occupation(s) During Past Five Years.” Officers are elected annually by the Board. |
| ** | Includes prior service as an Officer of MainStay VP Series Fund, Inc., the predecessor to MainStay VP Funds Trust. |
Officers of the Trust (Who are not Trustees)*
This page intentionally left blank.
This page intentionally left blank.
This page intentionally left blank.
MainStay VP Portfolios
MainStay VP offers a wide range of Portfolios. The full array of MainStay VP offerings is listed here, with information about the manager, subadvisors, legal counsel, and independent registered public accounting firm.
Equity
MainStay VP American Century Sustainable Equity Portfolio
MainStay VP Candriam Emerging Markets Equity Portfolio
MainStay VP Epoch U.S. Equity Yield Portfolio
MainStay VP Fidelity Institutional AM® Utilities Portfolio†
MainStay VP Natural Resources Portfolio
MainStay VP PineStone International Equity Portfolio1
MainStay VP S&P 500 Index Portfolio
MainStay VP Small Cap Growth Portfolio
MainStay VP Wellington Growth Portfolio
MainStay VP Wellington Mid Cap Portfolio
MainStay VP Wellington Small Cap Portfolio
MainStay VP Wellington U.S. Equity Portfolio
MainStay VP Winslow Large Cap Growth Portfolio
Mixed Asset
MainStay VP Balanced Portfolio
MainStay VP Income Builder Portfolio
MainStay VP Janus Henderson Balanced Portfolio
MainStay VP MacKay Convertible Portfolio
Income
MainStay VP Bond Portfolio
MainStay VP Floating Rate Portfolio
MainStay VP Indexed Bond Portfolio
MainStay VP MacKay Government Portfolio2
MainStay VP MacKay High Yield Corporate Bond Portfolio
MainStay VP MacKay Strategic Bond Portfolio
MainStay VP PIMCO Real Return Portfolio
Money Market
MainStay VP U.S. Government Money Market Portfolio
Alternative
MainStay VP CBRE Global Infrastructure Portfolio
MainStay VP IQ Hedge Multi-Strategy Portfolio
Asset Allocation
MainStay VP Conservative Allocation Portfolio
MainStay VP Equity Allocation Portfolio
MainStay VP Growth Allocation Portfolio
MainStay VP Moderate Allocation Portfolio
Manager
New York Life Investment Management LLC
New York, New York
Subadvisors
American Century Investment Management, Inc.
Kansas City, Missouri
Brown Advisory LLC
Baltimore, Maryland
Candriam*
Strassen, Luxembourg
CBRE Investment Management Listed Real Assets LLC
Radnor, Pennsylvania
Epoch Investment Partners, Inc.
New York, New York
FIAM LLC
Smithfield, Rhode Island
IndexIQ Advisors LLC*
New York, New York
Janus Henderson Investors US LLC
Denver, Colorado
MacKay Shields LLC*
New York, New York
Newton Investment Management North America, LLC
Boston, Massachusetts
NYL Investors LLC*
New York, New York
Pacific Investment Management Company LLC
Newport Beach, California
PineStone Asset Management Inc.
Montreal, Québec
Segall Bryant & Hamill, LLC
Chicago, Illinois
Wellington Management Company LLP
Boston, Massachusetts
Winslow Capital Management, LLC
Minneapolis, Minnesota
Legal Counsel
Dechert LLP
Washington, District of Columbia
Independent Registered Public Accounting Firm
PricewaterhouseCoopers LLP
New York, New York
Distributor
NYLIFE Distributors LLC*
Jersey City, New Jersey
Custodian
JPMorgan Chase Bank, N.A.
New York, New York
Some Portfolios may not be available in all products.
† Fidelity Institutional AM is a registered trade mark of FMR LLC. Used with permission.
* An affiliate of New York Life Investment Management LLC.
| 1. | Prior to August 28, 2023, the Portfolio's name was MainStay VP MacKay International Equity Portfolio. |
| 2. | Effective on or about May 1, 2024, the MainStay VP MacKay Government Portfolio will be renamed the MainStay VP U.S. Infrastructure Bond Portfolio. |
Not part of the Annual Report
2023 Annual Report
This report is for the general information of New York Life Variable Annuities and NYLIAC Variable Universal Life Insurance Products policyowners. It must be preceded or accompanied by the appropriate product(s) and funds prospectuses if it is given to anyone who is not an owner of a New York Life variable annuity policy or a NYLIAC Variable Universal Life Insurance Product. This report does not offer for sale or solicit orders to purchase securities.
The performance data quoted in this report represents past performance. Past performance is no guarantee of future results. Due to market volatility and other factors, current performance may be lower or higher than the figures shown. The most recent month-end performance summary for your variable annuity or variable life policy is available by calling 800-598-2019 and is updated periodically on newyorklife.com.
The New York Life Variable Annuities and NYLIAC Variable Universal Life Insurance Products are issued by New York Life Insurance and Annuity Corporation (a Delaware Corporation) and distributed by NYLIFE Distributors LLC (Member FINRA/SIPC).
New York Life Insurance Company
New York Life Insurance and Annuity
Corporation (NYLIAC) (A Delaware Corporation)
51 Madison Avenue, Room 551
New York, NY 10010
newyorklife.com
newyorklifeinvestments.com
NYLIFE Distributors LLC, 30 Hudson Street, Jersey City, NJ 07302
New York Life Investment Management LLC is the investment manager to the MainStay VP Funds Trust
©2024 by NYLIFE Distributors LLC. All rights reserved.
You may obtain copies of the Prospectus and the Statement of Additional Information free of charge, upon request, by calling toll-free 800-598-2019 or writing to New York Life Insurance and Annuity Corporation, 51 Madison Avenue, New York, NY 10010.
| Not FDIC Insured | No Bank Guarantee | May Lose Value |
(NYLIAC) NI532
MainStay VP Allocation Portfolios
Message from the President and Annual Report
December 31, 2023
| MainStay VP Conservative Allocation Portfolio |
| MainStay VP Moderate Allocation Portfolio |
| MainStay VP Growth Allocation Portfolio |
| MainStay VP Equity Allocation Portfolio |
Special Notice:
Beginning in July 2024, new regulations issued by the Securities and Exchange Commission (SEC) will take effect requiring open-end mutual fund companies and ETFs to (1) overhaul the content of their shareholder reports and (2) mail paper copies of the new tailored shareholder reports to shareholders who have not opted to receive these documents electronically.
If you have not yet elected to receive your shareholder reports electronically, please contact your financial intermediary or visit our website.
| Not FDIC/NCUA Insured | Not a Deposit | May Lose Value | No Bank Guarantee | Not Insured by Any Government Agency |
This page intentionally left blank
Message from the President
Against a backdrop of easing inflationary pressures and continued economic growth, stocks and bonds generally gained ground during the 12-month period ended December 31, 2023, despite high levels of volatility and sharp disparities between the performance of the different market sectors.
Although the war in Ukraine, the outbreak of hostilities in the Middle East and several other notable events affected financial assets, inflation, interest rate, and economic growth trends stood at the forefront of market developments during most of the period. As the reporting period began, high levels of inflation already showed signs of easing in the face of aggressive rate hikes by U.S. Federal Reserve (the “Fed”). From a peak of 9.1% in June 2022, the annualized U.S. inflation rate dropped to 6.4% in January, and 3.4% in December 2023. At the same time, the Fed increased the benchmark federal funds rate from 4.25%–4.50% at the beginning of reporting period, to 5.25%–5.50% as of the end of 2023. Despite the increasing cost of capital and tighter lending environment that resulted from rising rates, economic growth remained surprisingly robust, bolstered by high levels of consumer spending, low levels of unemployment and better-than-expected corporate earnings. With the pace of rate increases slowing from the prior year, investors began hoping for an early shift to a looser monetary policy, with stock prices and bond yields reacting as economic data and statements from the Fed either reinforced or undercut those hopes. Following months of hawkish rhetoric, the Fed finally reversed its stance in December 2023, signaling a positive economic outlook with little chance of a recession and a likelihood of rate cuts in 2024.
The S&P 500® Index, a widely regarded benchmark of U.S. market performance, produced strong gains during the reporting period-– recovering all its losses from 2022 and approached new record territory. A preponderance of the Index’s gains were generated by a relatively small number of mega-cap stocks in the information technology, communication services and consumer discretionary sectors that stood to benefit from rapid developments in generative artificial intelligence (“AI”). Value-oriented, interest-rate sensitive and small-capitalization
shares lagged by significant margins, although market strength widened during the closing weeks of the reporting period. Most overseas equity markets trailed the U.S. market, as developed international economies experienced relatively low growth rates, and weak economic conditions in China undermined emerging markets.
Bonds produced generally positive returns, bolstered by attractive and relatively stable yields. The yield on the 10-year Treasury note hit a high of just under 5% in mid-October 2023, ranging between approximately 3.5% and 4.8% for most of the reporting period. The yield curve remained inverted throughout the year, with the 2-year Treasury yield modestly above the 10-year yield. Corporate bond prices trended moderately higher, generally outperforming government securities. After years of low yields and tight credit spreads, the corporate sector benefited from more attractive valuations and income opportunities. Among corporates, markets generally rewarded longer duration and lower credit quality, although an uptick in default rates posed added risks for high-yield corporate bonds. International bond markets produced mixed returns, with emerging-markets issues advancing over their developed-markets counterparts.
The market volatility of recent years reminds us of the constant need for experienced and steadfast portfolio management in the face of uncertainty. New York Life Investments remains dedicated to providing you, as a valued MainStay VP investor, with the guidance, resources and investment solutions you need to pursue your financial goals.
Thank you for trusting us to help meet your investment needs.
Sincerely,
Kirk C. Lehneis
President
The opinions expressed are as of the date of this report and are subject to change. There is no guarantee that any forecast made will come to pass. This material does not constitute investment advice and is not intended as an endorsement of any specific investment. Past performance is no guarantee of future results.
Not part of the Annual Report
Investors should refer to the Portfolio’s Summary Prospectus and/or Prospectus and consider the Portfolio’s investment objectives, strategies, risks, charges and expenses carefully before investing. The Summary Prospectus and/or Prospectus contain this and other information about the Portfolio. You may obtain copies of the Portfolio’s Summary Prospectus, Prospectus and Statement of Additional Information, which includes information about the MainStay VP Funds Trust's Trustees, free of charge, upon request, by calling toll-free 800-598-2019, by writing to New York Life Insurance and Annuity Corporation, 51 Madison Avenue, Room 251, New York, New York 10010 or by sending an email to MainStayShareholdersServices@nylim.com. These documents are also available at newyorklifeinvestments.com/investment-products/vp. Please read the Portfolio's Summary Prospectus and/or Prospectus carefully before investing. MainStay VP Funds Trust portfolios are separate account options which are purchased through a variable insurance or variable annuity contract.
MainStay VP Conservative Allocation Portfolio
Investment and Performance Comparison (Unaudited)
Performance data quoted represents past performance. Past performance is no guarantee of future results. Because of market volatility and other factors, current performance may be lower or higher than the figures shown. Investment return and principal value will fluctuate, and as a result, when shares are redeemed, they may be worth more or less than their original cost. The performance table and graph do not reflect any deduction of sales charges, mortality and expense charges, contract charges or administrative charges. Please refer to the Performance Summary appropriate for your policy. For performance information current to the most recent month-end, please call 800-598-2019 or visit www.newyorklife.com.
Performance figures may reflect certain fee waivers and/or expense limitations, without which total returns may have been different. For information on current fee waivers and/or expense limitations (if any), please refer to the Notes to Financial Statements.
| Average Annual Total Returns for the Year-Ended December 31, 2023 |
| Class | Inception
Date | One
Year | Five
Years | Ten
Years | Gross
Expense
Ratio1 |
| Initial Class Shares | 2/13/2006 | 10.29% | 5.65% | 4.08% | 0.50% |
| Service Class Shares | 2/13/2006 | 10.02 | 5.38 | 3.82 | 0.75 |
| 1. | The gross expense ratios presented reflect the Portfolio’s “Total Annual Portfolio Operating Expenses” from the most recent Prospectus and may differ from other expense ratios disclosed in this report. |
The footnotes on the next page are an integral part of the table and graph and should be carefully read in conjunction with them.
| Benchmark Performance* | One
Year | Five
Years | Ten
Years |
| Bloomberg U.S. Aggregate Bond Index1 | 5.53% | 1.10% | 1.81% |
| S&P 500® Index2 | 26.29 | 15.69 | 12.03 |
| MSCI EAFE® Index (Net)3 | 18.24 | 8.16 | 4.28 |
| Conservative Allocation Composite Index4 | 12.79 | 6.34 | 5.29 |
| Morningstar Moderately Conservative Allocation Category Average5 | 10.43 | 5.40 | 4.16 |
| * | Returns for indices reflect no deductions for fees, expenses or taxes, except for foreign withholding taxes where applicable. Results assume reinvestment of all dividends and capital gains. An investment cannot be made directly in an index. |
| 1. | The Portfolio has selected the Bloomberg U.S. Aggregate Bond Index as its primary benchmark as a replacement for the S&P 500® Index because it believes that the Bloomberg U.S. Aggregate Bond Index is more reflective of its principal investment strategies. The Bloomberg U.S. Aggregate Bond Index is a broad-based benchmark that measures the performance of the investment grade, U.S. dollar-denominated, fixed-rate taxable bond market, including Treasuries, government-related and corporate securities, mortgage-backed securities (agency fixed-rate and hybrid adjustable rate mortgage pass-throughs), asset-backed securities, and commercial mortgage-backed securities. |
| 2. | The S&P 500® Index is the Portfolio's secondary benchmark. S&P 500® is a trademark of The McGraw-Hill Companies, Inc. The S&P 500® Index is widely regarded as the standard index for measuring large-cap U.S. stock market performance. |
| 3. | The Portfolio has selected the MSCI EAFE® Index (Net) as an additional benchmark. The MSCI EAFE® Index (Net) consists of international stocks representing the developed world outside of North America. |
| 4. | The Portfolio has selected the Conservative Allocation Composite Index as an additional benchmark. Effective February 28, 2014, the Conservative Allocation Composite Index consists of the S&P 500® Index, the MSCI EAFE® Index (Net) and the Bloomberg U.S. Aggregate Bond Index weighted 30%, 10% and 60%, respectively. Prior to February 28, 2014, the Conservative Allocation Composite Index consisted of the S&P 500® Index, the MSCI EAFE® Index (Net) and the Bloomberg U.S. Aggregate Bond Index weighted 35%, 5% and 60%, respectively. |
| 5. | The Morningstar Moderately Conservative Allocation Category Average is representative of funds in allocation categories that seek to provide both income and capital appreciation by primarily investing in multiple asset classes, including stocks, bonds, and cash. These moderately conservative strategies prioritize preservation of capital over appreciation. They typically expect volatility similar to a strategic equity exposure between 30% and 50%. Results are based on average total returns of similar funds with all dividends and capital gain distributions reinvested. |
The footnotes on the preceding page are an integral part of the table and graph and should be carefully read in conjunction with them.
| 6 | MainStay VP Conservative Allocation Portfolio |
Cost in Dollars of a $1,000 Investment in MainStay VP Conservative Allocation Portfolio (Unaudited)
The example below is intended to describe the fees and expenses borne by shareholders during the six-month period from July 1, 2023 to December 31, 2023, and the impact of those costs on your investment.
Example
As a shareholder of the Portfolio you incur two types of costs: (1) transaction costs, including exchange fees and sales charges (loads) on purchases (as applicable), and (2) ongoing costs, including management fees, distribution and/or service (12b-1) fees and other Portfolio expenses (as applicable). This example is intended to help you understand your ongoing costs (in dollars) of investing in the Portfolio and to compare these costs with the ongoing costs of investing in other mutual funds. The example is based on an investment of $1,000 made at the beginning of the six-month period and held for the entire period from July 1, 2023 to December 31, 2023. Shares are only sold in connection with variable life and annuity contracts and the example does not reflect any contract level or transactional fees or expenses. If these costs had been included, your costs would have been higher.
This example illustrates your Portfolio’s ongoing costs in two ways:
Actual Expenses
The second and third data columns in the table below provide information about actual account values and actual expenses. You may use the information in these columns, together with the amount you invested, to estimate the expenses that you paid during the six months ended
December 31, 2023. Simply divide your account value by $1,000 (for example, an $8,600 account value divided by $1,000 = 8.6), then multiply the result by the number under the heading entitled “Expenses Paid During Period” to estimate the expenses you paid on your account during this period.
Hypothetical Example for Comparison Purposes
The fourth and fifth data columns in the table below provide information about hypothetical account values and hypothetical expenses based on the Portfolio’s actual expense ratio and an assumed rate of return of 5% per year before expenses, which is not the Portfolio’s actual return. The hypothetical account values and expenses may not be used to estimate the actual ending account balances or expenses you paid for the six-month period shown. You may use this information to compare the ongoing costs of investing in the Portfolio with the ongoing costs of investing in other mutual funds. To do so, compare this 5% hypothetical example with the 5% hypothetical examples that appear in the shareholder reports of the other mutual funds.
Please note that the expenses shown in the table are meant to highlight your ongoing costs only and do not reflect any transactional costs, such as exchange fees or sales charges (loads). Therefore, the fourth and fifth data columns of the table are useful in comparing ongoing costs only and will not help you determine the relative total costs of owning different funds. In addition, if these transactional costs were included, your costs would have been higher.
| Share Class | Beginning
Account
Value
7/1/23 | Ending Account
Value (Based
on Actual
Returns and
Expenses)
12/31/23 | Expenses
Paid
During
Period1 | Ending Account
Value (Based
on Hypothetical
5% Annualized
Return and
Actual Expenses)
12/31/23 | Expenses
Paid
During
Period1 | Net Expense
Ratio
During
Period2 |
| Initial Class Shares | $1,000.00 | $1,050.10 | $0.16 | $1,025.05 | $0.15 | 0.03% |
| Service Class Shares | $1,000.00 | $1,048.80 | $1.45 | $1,023.79 | $1.43 | 0.28% |
| 1. | Expenses are equal to the Portfolio’s annualized expense ratio of each class multiplied by the average account value over the period, divided by 365 and multiplied by 184 (to reflect the six-month period). The table above represents the actual expenses incurred during the six-month period. In addition to the fees and expenses which the Portfolio bears directly, it also indirectly bears a pro rata share of the fees and expenses of the underlying Portfolios/Funds in which it invests. Such indirect expenses are not included in the above-reported expense figures. |
| 2. | Expenses are equal to the Portfolio's annualized expense ratio to reflect the six-month period. |
Asset Diversification as of December 31, 2023 (Unaudited)
| Equity Funds | 37.0% |
| Fixed Income Funds | 53.1 |
| Short-Term Investment | 9.5 |
| Other Assets, Less Liabilities | 0.4 |
See Portfolio of Investments beginning on page 13 for specific holdings within these categories. The Portfolio’s holdings are subject to change.
| 8 | MainStay VP Conservative Allocation Portfolio |
Portfolio Management Discussion and Analysis (Unaudited)
Answers to the questions reflect the views of Jae S. Yoon, CFA, Jonathan Swaney, Poul Kristensen, CFA, and Amit Soni, CFA, of New York Life Investments,1 the Portfolio’s Manager.
How did MainStay VP Conservative Allocation Portfolio perform relative to its benchmarks and peers during the 12 months ended December 31, 2023?
For the 12 months ended December 31, 2023, MainStay VP Conservative Allocation Portfolio returned 10.29% for Initial Class shares and 10.02% for Service Class shares. Over the same period, both share classes outperformed the 5.53% return of the Bloomberg U.S. Aggregate Bond Index, which is the Portfolio’s primary benchmark, and underperformed the 26.29% return of the S&P 500® Index, which is a secondary benchmark of the Portfolio. For the 12 months ended December 31, 2023, both share classes underperformed the 18.24% return of the MSCI EAFE® Index (Net) and the 12.79% return of the Conservative Allocation Composite Index, which are additional benchmarks of the Portfolio. Over the same period, both share classes underperformed the 10.43% return of the Morningstar Moderately Conservative Allocation Category Average.2
What factors affected the Portfolio’s relative performance during the reporting period?
The Portfolio is a “fund of funds,” meaning that it seeks to achieve its investment objective by investing primarily in mutual funds and exchange-traded funds (“ETFs”) managed by New York Life Investments or its affiliates (the “Underlying Portfolios/Funds”). The Portfolio will generally invest in Underlying Portfolios of MainStay VP Funds Trust unless such Portfolio in a particular asset class (or subasset class) is deemed by the portfolio managers to be unavailable. The Underlying Portfolios/Funds may invest in U.S. equities, international equities and fixed-income instruments, making comparisons to any single index generally less suitable than a weighted combination of indices, which is a more useful yardstick by which to measure performance. The Portfolio’s management internally maintains a blend of indices that are taken into consideration when managing the Portfolio. During the reporting period, the Portfolio substantially underperformed this internally maintained blend of indices, primarily due to active positioning at the asset class level.
Management of the Portfolio’s stock/bond blend itself was not the primary issue affecting the Portfolio’s relative performance, as returns generated in the process of controlling that mix were only marginally negative. We held the Portfolio’s stock/bond allocation near neutral for much of the reporting period, but with a small bias toward holding underweight exposure to equities. That proved a liability through the spring and early summer of 2023, as a handful of mega-cap technology-related equities drove the market higher.
Rather, the most significant factor undermining relative performance related to positioning within asset classes, primarily
equities, with the Portfolio’s exposure to small-cap stocks detracting substantially from returns. Throughout the reporting period, relative valuations in the small-cap asset class were much more attractive than has been the historical norm; however, small companies are significantly more sensitive to changes in bank financing conditions than are large companies that can issue bonds. Fast-rising costs on bank loans, coupled with concerns about future credit availability in the wake of the bank crisis that occurred in the early spring of 2023, weighed heavily on that end of the capitalization spectrum. We promptly restored the Portfolio’s small-cap allocation to neutral as the nature and scope of the crisis became clear.
Relative returns also suffered from efforts to avoid undue exposure to a small group of market-leading, mega-cap, technology-related companies. Recently dubbed ‘the Magnificent 7’ (Alphabet, Amazon, Apple, Meta Platforms, Microsoft, NVIDIA, and Tesla), these firms are richly valued, implying rapid earnings growth in the coming years. We remain skeptical that such growth is likely to be achieved by these companies, which are already among the largest enterprises in the world, with dominant positions in their respective industries. Accordingly, we shifted Portfolio assets out of capitalization-weighted large-cap index products, favoring other options—most notably, an equally weighted version of the S&P 500®. During the reporting period, however, ongoing enthusiasm for the commercial potential of artificial intelligence (“AI”), and the degree to which the Magnificent 7 are expected to benefit from such developments, helped these companies maintain their leadership positions. During the reporting period, the Bloomberg Magnificent 7 Price Return Index returned approximately 107%, compared to the more modest 14% return for the equally weighted S&P 500®.
Tilts favoring defensive sectors, particularly health care, and low volatility stocks, further detracted from the Portfolio’s active returns. Basically, any skew in the Portfolio away from the sole winners of the reporting period—mega-cap tech-oriented companies—was a drag on relative results.
The Portfolio realized some positive results within equities. Tactical trading in gold miners, for example, proved helpful. The Portfolio also benefited from a bias favoring an emerging-markets equity strategy that excluded China, reflecting our concerns regarding China’s ongoing property market turmoil, high debt levels, regulatory overreach and simmering tensions with the West.
The fixed-income portion of the Portfolio neither contributed positively to, nor detracted from, active return. (Contributions take weightings and total returns into account.) The Portfolio gave up a little ground due to underweight exposure to bank loans. We expected that defaults would rise considerably in the bank loan space as economic activity slowed, but the anticipated slowdown
| 1. | “New York Life Investments” is a service mark used by New York Life Investment Management Holdings LLC and its subsidiary New York Life Investment Management LLC. |
| 2. | See "Investment and Performance Comparison" for more information on benchmark and peer group returns. |
failed to materialize during the reporting period. That shortfall was offset through duration3 management, as we extended the Portfolio’s duration during the fall as yields rose, and then reduced duration as yields declined into year-end.
During the reporting period, how was the Portfolio’s performance materially affected by investments in derivatives?
Total return swaps were used to express most of the Portfolio’s asset class policy views. Therefore, the swaps can be seen as detracting from the Portfolio’s relative performance over the course of the reporting period.
How did you allocate the Portfolio’s assets during the reporting period and why?
Stock/bond blend: We held equity exposure within the Portfolio relatively close to neutral during the reporting period. We are generally reluctant to position the Portfolio with underweight equity exposure, as stocks tend to perform well over time and anticipating drawdowns is challenging. Conversely, we are happy to lean into equities when we believe they are well-supported fundamentally or when a correction has run further than we believe appropriate. Nevertheless, we shifted the Portfolio’s equity position to slightly underweight following a sharp rally in January 2023, and enlarged the underweight posture a little further late in the spring when the banking sector turmoil appeared to increase the likelihood of a recession. As the recession failed to materialize, we gradually removed the underweight equity exposure during the summer and into the fall, eventually moving to a slightly overweight equity position, before pulling back to neutral during the subsequent rally in stocks.
Duration: After an extended period of holding a short duration position, we shifted the Portfolio to a neutral position in the spring of 2023, in expectation of an impending recession. We extended the Portfolio’s duration further in the summer and fall as yields rose, presumably in response to heavy new Treasury issuance, “higher for longer” monetary policy prospects, stubborn inflationary pressures, and rising yields abroad. Reflecting our view that yields would come back down as inflation continued to cool and an inflection in Fed policy came into sight, we increased the Portfolio’s duration to slightly more than six months long by the end of October. The yield on the 10-year Treasury note did indeed fall back, dropping from roughly 5% to 4%, and we trimmed the Portfolio’s duration as it did so, ending the reporting period very close to neutral.
Equity style: Growth stocks, by definition, exhibit richer valuations than value stock. As a consequence, growth stock prices are relatively reliant on distant profits, and are often more sensitive to
elevated inflation and higher interest rates than their value-oriented counterparts. Accordingly, given the high-rate environment that prevailed during the reporting period, we persistently tilted the Portfolio to emphasize value stocks that offered more substantial near-term cash flows. In particular, we focused on defensive, lower-volatility sectors, including utilities, consumer staples and—most of all—health care. This position undermined results in 2023, as market performance was dominated by the aforementioned Magnificent 7—growth-oriented technology-related stocks, swept by a wave of excitement over the prospects for generative AI.
Equity size: The Portfolio held overweight exposure to small-cap stocks during the first half of the reporting period. We based our thesis on several prevailing characteristics of the asset class: attractive valuations, insulation from economic weakness abroad, less sensitivity to dollar strength and disproportionate exposure to domestic demand–which thus far remains robust. That position proved unconstructive during the spring of 2023, as small companies tend to be heavily dependent on bank financing, and banks aggressively tightened lending standards in the wake of the banking crisis in March and April. Accordingly, we unwound the Portfolio’s small-cap bias. However, it is important to note that the proceeds did not flow to large blend index exposure, where the Magnificent 7 dominate. Rather, the redirected assets went to an equally weighted version of the S&P 500®, where those seven names comprise less than 2% of the index.
Geographic exposure: During the reporting period, European equities appeared vulnerable. We expected that persistently high wage growth would compel the European Central Bank to maintain its restrictive monetary policies for an extended period of time while European export-heavy economies wrestled with declining global trade volumes. In addition, Europe appear particularly exposed to potential energy price spikes amid elevated geopolitical tensions. On the other hand, the Bank of Japan remained engaged in accommodative policy, Japanese exports benefited from a weak yen, and shareholder governance was increasingly prioritized by Japanese companies, largely in the form of share buybacks. Given these divergent conditions, we tilted the Portfolio away from European markets in favor of Japanese stocks, while holding net exposure to non-U.S. stocks close to neutral. With prospects for Chinese equities looking somewhat dim, we tilted the Portfolio toward other faster-growing economies within the emerging-markets complex.
Energy and natural resources: The Portfolio maintained exposure to upstream energy producers and oilfield/gas field service providers as a commodity play to provide an additional inflation hedge. These holdings also positioned the Portfolio to take advantage of opportunities for domestic producers to benefit as
| 3. | Duration is a measure of the price sensitivity of a fixed-income investment to changes in interest rates. Duration is expressed as a number of years and is considered a more accurate sensitivity gauge than average maturity. |
| 10 | MainStay VP Conservative Allocation Portfolio |
Western nations revisit energy policy to source supplies from stable and friendly jurisdictions rather than autocratic petrostates that present national security risks. The Portfolio’s small, but volatile, energy position had a disproportionate impact on the Portfolio’s short-term performance month by month, but little impact on overall performance for the entire year. The Portfolio also added exposure to uranium miners during the reporting period. With numerous reactors planned, under construction, or being put back into service after an earlier shutoff, we expect nuclear energy production to grow significantly in the years ahead, driving the need for additional uranium production and creating opportunities for miners and processors.
How did the Portfolio’s allocations change over the course of the reporting period?
In one of the more substantial changes in allocations undertaken during the reporting period, we reduced the Portfolio’s exposure to small-cap stocks, expressed via total return swaps. We took this action in response to the banking crisis that unfolded in the spring of 2023. Other changes included a reduction in the Portfolio’s holdings of MainStay VP Floating Rate Portfolio, thereby decreasing exposure to lower-credit-quality fixed-income instruments ahead of an expected recession. We unwound the Portfolio’s swap exposure to the S&P 500 Health Care Sector in favor of other defensive positions, including Invesco S&P 500 Low Volatility ETF. We unwound swap exposure to VanEck Gold Miners ETF, taking gains and exiting a profitable trade on a high note. Lastly, we used swaps to tilt the Portfolio away from baskets of specific stocks that were either heavily dependent on floating-rate loans (such as Uber, United Airlines and Carnival) or that generated insufficient operating income to retire debt as it came due (so-called ‘zombie’ companies, such as Royal Caribbean, Wynn Resorts and Rivian). We believed these firms were especially vulnerable in an environment of fast-rising interest rates and tightening lending standards.
New or increased allocations included, first and foremost, the establishment and growth of an allocation to Invesco S&P 500® Equal Weight ETF, funded in part from cash. We adopted this position to remove the Portfolio’s underweight exposure to equities without significantly increasing its exposure to the Magnificent 7. We increased the Portfolio’s exposure to iShares 20+ Year Treasury Bond ETF, which we used to extend the Portfolio’s duration as bond yields rose. We also initiated a new Portfolio position in iShares MSCI Japan ETF (via a swap) because we saw valuations as attractive, export conditions as favorable and the Japanese yen as likely to appreciate should the Bank of
Japan abandon its existing yield curve4 control policy. Another notable addition involved the establishment of exposure to Global X Uranium ETF, which invests primarily in uranium mining firms. Climate change concerns, net-zero commitments and the limitations of renewable energy are driving a reconsideration of nuclear energy, for which fuel supply is rather limited. We foresee a supply/demand imbalance developing that is likely to support businesses involved with extracting and processing uranium. We also opened a position in a swap providing access to the IQ CBRE NextGen Real Estate ETF, providing a toehold in the digital infrastructure space.
At the Underlying Fund level, the Portfolio took advantage of a few new investment options, adopting a position in IQ MacKay ESG High Income ETF, funded from MainStay VP MacKay High Yield Corporate Bond Portfolio. Other holdings in newly available Underlying Equity Funds included MainStay PineStone U.S. Equity Fund, IQ Candriam U.S. Mid Cap Equity ETF and MainStay Fiera SMID Growth Fund. Departing the Portfolio was IQ U.S. Large Cap ETF, which was liquidated in December.
During the reporting period, which Underlying Equity Portfolios/Funds had the highest total returns and which had the lowest total returns?
The Portfolio’s top-performing Underlying Equity Funds that were held for the entire reporting period included MainStay VP Winslow Large Cap Growth Portfolio, MainStay VP Wellington Growth Portfolio and IQ Candriam U.S. Equity ETF. The worst-performing positions (all of which produced positive returns) included Invesco S&P 500 Low Volatility ETF, MainStay VP PineStone International Equity Portfolio (previously MainStay VP MacKay International Equity Portfolio) and MainStay VP Candriam Emerging Markets Equity Portfolio.
Which Underlying Equity Portfolios/Funds were the strongest positive contributors to the Portfolio’s performance and which Underlying Equity Portfolios/Funds were particularly weak?
The strongest positive contributions to performance came from MainStay VP Winslow Large Cap Growth Portfolio, MainStay VP Wellington Growth Portfolio and IQ Candriam U.S. Equity ETF. The direct Portfolio holdings that contributed least to returns included MainStay VP PineStone International Equity Portfolio (previously MainStay VP MacKay International Equity Portfolio), MainStay Epoch Capital Growth Fund and IQ CBRE NextGen Real Estate ETF. The Portfolio experienced losses from some swap positions in
| 4. | The yield curve is a line that plots the yields of various securities of similar quality—typically U.S. Treasury issues—across a range of maturities. The U.S. Treasury yield curve serves as a benchmark for other debt and is used in economic forecasting. |
which we paid the return to the Russell 2000 Index, the Russell 1000 Growth Index and the MSCI EAFE Index.
What factors and risks affected the Portfolio’s Underlying Fixed-Income Portfolio/Fund investments during the reporting period?
As discussed above, interest rates were driven by high, but moderating, inflation and tight monetary policy, with rising expectations that monetary policy would be relaxed in 2024. Spreads5 were influenced by the resilience of the economy and expectations of a more accommodative policy environment ahead.
During the reporting period, which fixed-income market segments were the strongest positive contributors to the Portfolio’s performance and which segments were particularly weak?
Lower quality securities—from bank loans to high yield bonds—generally fared best. They enjoyed positive carry compared to higher quality debt, spreads were mostly stable, and default rates were not yet elevated.
Which Underlying Fixed-Income Portfolios/Funds made the strongest positive contributions to the Portfolio’s performance, and which Underlying Fixed-Income Portfolios/Funds were the greatest detractors?
The largest contributors to the Portfolio’s absolute returns came from positions in MainStay VP Indexed Bond Portfolio, MainStay VP Floating Rate Portfolio and cash holdings. No fixed-income position produced negative returns. The smallest positive contributions to Portfolio performance came from MainStay MacKay U.S. Infrastructure Bond Fund, MainStay VP PIMCO Real Return Portfolio and MainStay Short Term Bond Fund.
| 5. | The terms “spread” and “yield spread” may refer to the difference in yield between a security or type of security and comparable U.S. Treasury issues. The terms may also refer to the difference in yield between two specific securities or types of securities at a given time. |
The opinions expressed are those of the portfolio managers as of the date of this report and are subject to change. There is no guarantee that any forecasts will come to pass. This material does not constitute investment advice and is not intended as an endorsement of any specific investment.
Not all MainStay VP Portfolios and/or share classes are available under all policies.
| 12 | MainStay VP Conservative Allocation Portfolio |
Portfolio of Investments December 31, 2023†^
| | Shares | Value |
| Affiliated Investment Companies 90.1% |
| Equity Funds 37.0% |
| IQ 500 International ETF | 232,228 | $ 7,612,736 |
| IQ Candriam International Equity ETF | 274,352 | 7,668,138 |
| IQ Candriam U.S. Large Cap Equity ETF | 238,097 | 9,997,693 |
| IQ Candriam U.S. Mid Cap Equity ETF | 213,752 | 6,436,693 |
| IQ CBRE NextGen Real Estate ETF (a) | 510,713 | 10,433,867 |
| IQ FTSE International Equity Currency Neutral ETF | 369,645 | 9,193,071 |
| IQ U.S. Small Cap ETF | 102,553 | 3,697,036 |
| MainStay Epoch Capital Growth Fund Class I | 119,225 | 1,664,819 |
| MainStay Epoch International Choice Fund Class I | 117,117 | 4,667,147 |
| MainStay Fiera SMID Growth Fund Class R6 | 400,762 | 6,649,612 |
| MainStay PineStone U.S. Equity Fund Class R6 | 527,955 | 9,159,962 |
| MainStay VP American Century Sustainable Equity Portfolio Initial Class | 904,113 | 8,083,134 |
| MainStay VP Candriam Emerging Markets Equity Portfolio Initial Class | 998,384 | 6,944,459 |
| MainStay VP Epoch U.S. Equity Yield Portfolio Initial Class | 408,446 | 6,771,507 |
| MainStay VP PineStone International Equity Portfolio Initial Class | 426,211 | 4,572,345 |
| MainStay VP S&P 500 Index Portfolio Initial Class | 81,430 | 6,950,988 |
| MainStay VP Small Cap Growth Portfolio Initial Class | 529,847 | 5,711,118 |
| MainStay VP Wellington Growth Portfolio Initial Class | 419,074 | 10,244,060 |
| MainStay VP Wellington Mid Cap Portfolio Initial Class | 762,936 | 6,429,181 |
| MainStay VP Wellington Small Cap Portfolio Initial Class | 542,856 | 4,709,387 |
| MainStay VP Wellington U.S. Equity Portfolio Initial Class | 171,192 | 4,502,679 |
| MainStay VP Winslow Large Cap Growth Portfolio Initial Class | 399,585 | 10,430,853 |
| MainStay WMC Enduring Capital Fund Class R6 | 121,779 | 4,215,000 |
| MainStay WMC International Research Equity Fund Class I | 644,467 | 4,678,182 |
| MainStay WMC Value Fund Class R6 | 202,744 | 6,094,504 |
Total Equity Funds
(Cost $160,111,852) | | 167,518,171 |
| | Shares | | Value |
| |
| Fixed Income Funds 53.1% |
| IQ MacKay ESG Core Plus Bond ETF (a) | 1,405,849 | | $ 29,621,237 |
| IQ Mackay ESG High Income ETF (a) | 283,809 | | 7,537,967 |
| MainStay MacKay Short Duration High Yield Fund Class I | 1,992,889 | | 18,896,373 |
| MainStay Mackay U.S. Infrastructure Bond Fund Class R6 | 798,153 | | 6,061,651 |
| MainStay Short Term Bond Fund Class I (a) | 986,097 | | 8,999,414 |
| MainStay VP Bond Portfolio Initial Class (a) | 1,208,615 | | 14,947,305 |
| MainStay VP Floating Rate Portfolio Initial Class (a) | 2,886,572 | | 24,783,815 |
| MainStay VP Indexed Bond Portfolio Initial Class (a) | 13,518,735 | | 117,998,280 |
| MainStay VP MacKay High Yield Corporate Bond Portfolio Initial Class | 828,921 | | 7,522,457 |
| MainStay VP PIMCO Real Return Portfolio Initial Class | 582,773 | | 4,530,888 |
Total Fixed Income Funds
(Cost $267,482,305) | | | 240,899,387 |
Total Affiliated Investment Companies
(Cost $427,594,157) | | | 408,417,558 |
| Short-Term Investment 9.5% |
| Affiliated Investment Company 9.5% |
| MainStay U.S. Government Liquidity Fund, 5.235% (b) | 43,091,435 | | 43,091,435 |
Total Short-Term Investment
(Cost $43,091,435) | 9.5% | | 43,091,435 |
Total Investments
(Cost $470,685,592) | 99.6% | | 451,508,993 |
| Other Assets, Less Liabilities | 0.4 | | 1,965,653 |
| Net Assets | 100.0% | | $ 453,474,646 |
| † | Percentages indicated are based on Portfolio net assets. |
| ^ | Industry classifications may be different than those used for compliance monitoring purposes. |
| (a) | As of December 31, 2023, the Portfolio's ownership exceeds 5% of the outstanding shares of the Underlying Portfolio's share class. |
| (b) | Current yield as of December 31, 2023. |
The notes to the financial statements are an integral part of, and should be read in conjunction with, the financial statements.
13
Portfolio of Investments December 31, 2023†^ (continued)
Investments in Affiliates (in 000's)
Investments in issuers considered to be affiliate(s) of the Portfolio during the year ended December 31, 2023 for purposes of Section 2(a)(3) of the Investment Company Act of 1940, as amended, were as follows:
| Affiliated Investment Companies | Value,
Beginning
of Year | Purchases
at Cost | Proceeds
from
Sales | Net
Realized
Gain/(Loss)
on Sales | Change in
Unrealized
Appreciation/
(Depreciation) | Value,
End of
Year | Dividend
Income | Other
Distributions | Shares
End of
Year |
| IQ 500 International ETF | $ 8,664 | $ 190 | $ (2,468) | $ 215 | $ 1,012 | $ 7,613 | $ 312 | $ — | 232 |
| IQ Candriam International Equity ETF | 8,631 | 140 | (2,097) | 460 | 535 | 7,669 | 245 | — | 274 |
| IQ Candriam U.S. Large Cap Equity ETF | 13,462 | 109 | (7,003) | 1,871 | 1,559 | 9,998 | 152 | — | 238 |
| IQ Candriam U.S. Mid Cap Equity ETF | — | 6,913 | (899) | 20 | 403 | 6,437 | 40 | — | 214 |
| IQ CBRE NextGen Real Estate ETF | — | 9,992 | (194) | 3 | 633 | 10,434 | 64 | — | 511 |
| IQ FTSE International Equity Currency Neutral ETF | 10,112 | 69 | (2,495) | 355 | 1,152 | 9,193 | 248 | — | 370 |
| IQ MacKay ESG Core Plus Bond ETF | 30,115 | 2,099 | (3,222) | (500) | 1,129 | 29,621 | 1,388 | — | 1,406 |
| IQ Mackay ESG High Income ETF | — | 7,962 | (650) | (4) | 230 | 7,538 | 359 | 6 | 284 |
| IQ U.S. Large Cap ETF | 10,544 | — | (11,180) | 2,762 | (2,126) | — | 127 | — | — |
| IQ U.S. Small Cap ETF | 5,732 | 1,198 | (3,711) | 831 | (353) | 3,697 | 64 | — | 103 |
| MainStay Epoch Capital Growth Fund Class I | 1,798 | 10 | (584) | (59) | 500 | 1,665 | 9 | —(a) | 119 |
| MainStay Epoch International Choice Fund Class I | 5,146 | 119 | (1,426) | 91 | 737 | 4,667 | 79 | — | 117 |
| MainStay Fiera SMID Growth Fund Class R6 | — | 6,247 | (12) | —(a) | 415 | 6,650 | — | 161 | 401 |
| MainStay MacKay Short Duration High Yield Fund Class I | 21,988 | 1,192 | (5,035) | (189) | 940 | 18,896 | 1,189 | — | 1,993 |
| MainStay Mackay U.S. Infrastructure Bond Fund Class R6 | — | 5,886 | — | — | 176 | 6,062 | 25 | — | 798 |
| MainStay PineStone U.S. Equity Fund Class R6 | — | 9,469 | (889) | 36 | 544 | 9,160 | 28 | 9 | 528 |
| MainStay Short Term Bond Fund Class I | — | 10,003 | (997) | (14) | 7 | 8,999 | 308 | — | 986 |
| MainStay U.S. Government Liquidity Fund | 50,554 | 110,096 | (117,559) | — | — | 43,091 | 2,217 | — | 43,091 |
| MainStay VP American Century Sustainable Equity Portfolio Initial Class | 11,908 | 3,105 | (6,240) | 1,312 | (2,002) | 8,083 | 114 | 2,913 | 904 |
| MainStay VP Bond Portfolio Initial Class | 28,504 | 737 | (14,570) | (3,103) | 3,379 | 14,947 | 734 | — | 1,209 |
| MainStay VP Candriam Emerging Markets Equity Portfolio Initial Class | 7,756 | 212 | (1,452) | (342) | 770 | 6,944 | 120 | — | 998 |
| MainStay VP Epoch U.S. Equity Yield Portfolio Initial Class | 10,918 | 777 | (4,908) | 341 | (356) | 6,772 | 205 | 491 | 408 |
| MainStay VP Floating Rate Portfolio Initial Class | 39,427 | 2,765 | (18,306) | (832) | 1,730 | 24,784 | 2,453 | — | 2,887 |
| MainStay VP Indexed Bond Portfolio Initial Class | 130,714 | 3,189 | (19,284) | (2,649) | 6,028 | 117,998 | 2,887 | — | 13,519 |
| MainStay VP MacKay High Yield Corporate Bond Portfolio Initial Class | 17,222 | 427 | (10,926) | (821) | 1,620 | 7,522 | 427 | — | 829 |
| MainStay VP PIMCO Real Return Portfolio Initial Class | 4,942 | 549 | (739) | (44) | (177) | 4,531 | 392 | — | 583 |
| MainStay VP PineStone International Equity Portfolio Initial Class (b) | 5,125 | 218 | (984) | (573) | 786 | 4,572 | — | — | 426 |
| MainStay VP S&P 500 Index Portfolio Initial Class | 7,718 | 193 | (2,490) | 415 | 1,115 | 6,951 | 92 | 102 | 81 |
| MainStay VP Small Cap Growth Portfolio Initial Class | 7,726 | 510 | (3,488) | (1,399) | 2,362 | 5,711 | — | 18 | 530 |
| MainStay VP Wellington Growth Portfolio Initial Class | 13,421 | 111 | (7,463) | (6,714) | 10,889 | 10,244 | — | — | 419 |
| MainStay VP Wellington Mid Cap Portfolio Initial Class | 8,619 | 416 | (3,549) | (2,372) | 3,315 | 6,429 | 7 | — | 763 |
| MainStay VP Wellington Small Cap Portfolio Initial Class | 6,680 | 994 | (3,631) | (1,242) | 1,908 | 4,709 | 35 | — | 543 |
| MainStay VP Wellington U.S. Equity Portfolio Initial Class | 6,274 | 299 | (3,280) | (1,172) | 2,382 | 4,503 | 48 | — | 171 |
| MainStay VP Winslow Large Cap Growth Portfolio Initial Class | 13,076 | 679 | (7,433) | (806) | 4,915 | 10,431 | — | 393 | 400 |
| MainStay WMC Enduring Capital Fund Class R6 | 6,120 | 292 | (2,979) | (100) | 882 | 4,215 | 44 | — | 122 |
The notes to the financial statements are an integral part of, and should be read in conjunction with, the financial statements.
| 14 | MainStay VP Conservative Allocation Portfolio |
| Affiliated Investment Companies | Value,
Beginning
of Year | Purchases
at Cost | Proceeds
from
Sales | Net
Realized
Gain/(Loss)
on Sales | Change in
Unrealized
Appreciation/
(Depreciation) | Value,
End of
Year | Dividend
Income | Other
Distributions | Shares
End of
Year |
| MainStay WMC International Research Equity Fund Class I | $ 5,237 | $ 137 | $ (1,237) | $ (70) | $ 611 | $ 4,678 | $ 96 | $ — | 644 |
| MainStay WMC Value Fund Class R6 | 10,306 | 436 | (5,012) | (452) | 817 | 6,095 | 113 | 200 | 203 |
| | $508,439 | $187,740 | $(278,392) | $(14,745) | $ 48,467 | $451,509 | $14,621 | $4,293 | |
| | |
| (a) | Less than $500. |
| (b) | Prior to August 28, 2023, known as MainStay VP MacKay International Equity Portfolio Initial Class. |
Swap Contracts
Open OTC total return equity swap contracts as of December 31, 2023 were as follows1:
Swap
Counterparty | Reference Obligation | Floating Rate2 | Termination
Date(s) | Payment
Frequency
Paid/
Received | Notional
Amount
Long/
(Short)
(000)3 | Unrealized
Appreciation/
(Depreciation)4 |
| Citibank NA | Citi Leveraged Loan Basket | 1 day FEDF minus 0.20% | 12/3/24 | Daily | (6,403) | $ — |
| Citibank NA | Citi Zombie Company Basket | 1 day FEDF minus 0.50% | 12/3/24 | Daily | (8,341) | — |
| JPMorgan Chase Bank NA | Global X Uranium ETF | 1 day FEDF plus 0.50% | 10/8/24 - 11/12/24 | Daily | 11,501 | — |
| Citibank NA | Invesco S&P 500 Low Volatility ETF | 1 day FEDF plus 0.55% | 12/3/24 | Daily | 10,584 | — |
| Citibank NA | iShares 20+ Year Treasury Bond ETF | 1 day FEDF plus 0.60% | 12/3/24 | Daily | 16,225 | — |
| Citibank NA | iShares MSCI China ETF | 1 day FEDF minus 0.56% | 12/3/24 | Daily | (2,219) | — |
| Citibank NA | iShares MSCI EAFE ETF | 1 day FEDF minus 1.25% | 12/3/24 | Daily | (18,426) | — |
| Citibank NA | iShares MSCI Emerging Markets ETF | 1 day FEDF minus 0.54% | 12/3/24 | Daily | (2,795) | — |
| Citibank NA | iShares MSCI Emerging Markets ex China ETF | 1 day FEDF plus 0.55% | 12/3/24 | Daily | 2,463 | — |
| JPMorgan Chase Bank NA | iShares MSCI Japan ETF | 1 day FEDF plus 0.15% | 4/24/24 - 5/7/24 | Daily | 13,579 | — |
| JPMorgan Chase Bank NA | Russell 2000 Total Return Index | 1 day FEDF minus 0.15% - plus 0.05% | 4/9/24 - 5/7/24 | Daily | (20,998) | — |
| JPMorgan Chase Bank NA | S&P 500 Equal Weight | 1 day FEDF plus 0.30% - 0.51% | 5/7/24 | Daily | 21,190 | — |
| Citibank NA | S&P 500 Total Return Index | 1 day FEDF plus 0.05% | 12/3/24 | Daily | (12,053) | — |
| Citibank NA | S&P 600 Total Return Index | 1 day FEDF plus 0.45% | 12/3/24 | Daily | 24,260 | — |
| Citibank NA | S&P Midcap 400 Total Return Index | 1 day FEDF plus 0.35% | 12/3/24 | Daily | 3,311 | — |
| JPMorgan Chase Bank NA | VanEck Oil Services ETF | 1 day FEDF plus 0.15% | 11/5/24 | Daily | 4,698 | — |
| Citibank NA | Vanguard FTSE Europe ETF | 1 day FEDF minus 0.50% | 12/3/24 | Daily | (4,634) | — |
| | | | | | | $ — |
The following table represents the basket holdings underlying the total return swap with Citi Leveraged Loan Basket as of December 31, 2023.
| Security Description | Shares | Notional Value | Unrealized Appreciation/
Depreciation | Percent of
Basket Net Assets |
| AerCap Holdings NV | (2,058) | (267,880) | — | 4.18 |
| Apollo Commercial Real Estate Finance Inc | (392) | (50,973) | — | 0.80 |
| Atlantica Sustainable Infrastructure PLC | (247) | (32,139) | — | 0.50 |
| Brandywine Realty Trust | (422) | (54,878) | — | 0.86 |
| Carnival Corp | (6,982) | (908,596) | — | 14.19 |
| Chart Industries Inc | (1,946) | (253,211) | — | 3.95 |
| Coherent Corp | (1,015) | (132,062) | — | 2.06 |
| CommScope Holding Co Inc | (122) | (15,857) | — | 0.25 |
The notes to the financial statements are an integral part of, and should be read in conjunction with, the financial statements.
15
Portfolio of Investments December 31, 2023†^ (continued)
| Security Description | Shares | Notional Value | Unrealized Appreciation/
Depreciation | Percent of
Basket Net Assets |
| Crane NXT Co | (1,398) | (181,983) | — | 2.84 |
| Cushman & Wakefield PLC | (475) | (61,818) | — | 0.97 |
| Delta Air Lines Inc | (4,420) | (575,234) | — | 8.98 |
| Designer Brands Inc | (315) | (41,049) | — | 0.64 |
| DigitalBridge Group Inc | (626) | (81,437) | — | 1.27 |
| Elanco Animal Health Inc | (2,389) | (310,849) | — | 4.85 |
| Entegris Inc | (3,055) | (397,516) | — | 6.21 |
| Fidelity National Information Services Inc | (4,170) | (542,668) | — | 8.48 |
| Hanesbrands Inc | (974) | (126,806) | — | 1.98 |
| JetBlue Airways Corp | (713) | (92,748) | — | 1.45 |
| Lumen Technologies Inc | (1,246) | (162,149) | — | 2.53 |
| MKS Instruments Inc | (1,040) | (135,346) | — | 2.11 |
| Oatly Group AB | (97) | (12,674) | — | 0.20 |
| Opendoor Technologies Inc | (1,621) | (210,972) | — | 3.30 |
| Par Pacific Holdings Inc | (582) | (75,805) | — | 1.18 |
| PureCycle Technologies Inc | (189) | (24,650) | — | 0.39 |
| Scorpio Tankers Inc | (1,300) | (169,153) | — | 2.64 |
| Topgolf Callaway Brands Corp | (408) | (53,158) | — | 0.83 |
| Uber Technologies Inc | (7,480) | (973,474) | — | 15.20 |
| United Airlines Holdings Inc | (3,520) | (458,062) | — | 7.15 |
The following table represents the basket holdings underlying the total return swap with Citi Zombie Company Basket as of December 31, 2023.
| Security Description | Shares | Notional Value | Unrealized Appreciation/
Depreciation | Percent of
Basket Net Assets |
| Alteryx Inc | (918) | (112,279) | — | 1.35 |
| AppLovin Corp | (1,829) | (223,843) | — | 2.68 |
| Array Technologies Inc | (1,429) | (174,868) | — | 2.10 |
| Asana Inc | (789) | (96,566) | — | 1.16 |
| BILL Holdings Inc | (2,981) | (364,768) | — | 4.37 |
| BioCryst Pharmaceuticals Inc | (313) | (38,314) | — | 0.46 |
| Bloom Energy Corp | (710) | (86,871) | — | 1.04 |
| Bridgebio Pharma Inc | (2,491) | (304,754) | — | 3.65 |
| Carnival Corp | (5,157) | (631,005) | — | 7.57 |
| Children's Place Inc/The | (284) | (34,730) | — | 0.42 |
| Cinemark Holdings Inc | (708) | (86,655) | — | 1.04 |
| Coeur Mining Inc | (300) | (36,679) | — | 0.44 |
| Cytokinetics Inc | (2,002) | (245,020) | — | 2.94 |
| DigitalBridge Group Inc | (696) | (85,181) | — | 1.02 |
| Emergent BioSolutions Inc | (89) | (10,899) | — | 0.13 |
| Enviva Inc | (16) | (1,978) | — | 0.02 |
| Exact Sciences Corp | (2,317) | (283,530) | — | 3.40 |
| Fastly Inc | (1,206) | (147,569) | — | 1.77 |
| Gap Inc/The | (3,714) | (454,425) | — | 5.45 |
| Guardant Health Inc | (955) | (116,867) | — | 1.40 |
| IAC Inc | (715) | (87,480) | — | 1.05 |
| Infinera Corp | (215) | (26,319) | — | 0.32 |
| Insmed Inc | (696) | (85,126) | — | 1.02 |
| JetBlue Airways Corp | (805) | (98,441) | — | 1.18 |
| Kyndryl Holdings Inc | (574) | (70,196) | — | 0.84 |
| Lyft Inc | (3,756) | (459,611) | — | 5.51 |
| NeoGenomics Inc | (487) | (59,542) | — | 0.71 |
| Oscar Health Inc | (1,236) | (151,289) | — | 1.81 |
| Pacific Biosciences of California Inc | (583) | (71,314) | — | 0.86 |
| Peloton Interactive Inc | (1,010) | (123,629) | — | 1.48 |
| Q2 Holdings Inc | (680) | (83,245) | — | 1.00 |
| Redfin Corp | (501) | (61,321) | — | 0.74 |
| Revance Therapeutics Inc | (165) | (20,209) | — | 0.24 |
| RingCentral Inc | (1,333) | (163,119) | — | 1.96 |
The notes to the financial statements are an integral part of, and should be read in conjunction with, the financial statements.
| 16 | MainStay VP Conservative Allocation Portfolio |
| Security Description | Shares | Notional Value | Unrealized Appreciation/
Depreciation | Percent of
Basket Net Assets |
| Rivian Automotive Inc | (3,891) | (476,119) | — | 5.71 |
| Royal Caribbean Cruises Ltd | (5,804) | (710,147) | — | 8.51 |
| Scotts Miracle-Gro Co/The | (915) | (112,002) | — | 1.34 |
| Spirit AeroSystems Holdings Inc | (750) | (91,781) | — | 1.10 |
| Spirit Airlines Inc | (430) | (52,610) | — | 0.63 |
| Sweetgreen Inc | (444) | (54,369) | — | 0.65 |
| TG Therapeutics Inc | (1,329) | (162,571) | — | 1.95 |
| Twist Bioscience Corp | (1,021) | (124,975) | — | 1.50 |
| Vistra Corp | (2,702) | (330,676) | — | 3.96 |
| Warner Bros Discovery Inc | (2,252) | (275,595) | — | 3.30 |
| Wix.com Ltd | (1,428) | (174,724) | — | 2.10 |
| Wolfspeed Inc | (1,699) | (207,917) | — | 2.49 |
| WW International Inc | (710) | (86,859) | — | 1.04 |
| Wynn Resorts Ltd | (2,650) | (324,195) | — | 3.89 |
| Xerox Holdings Corp | (481) | (58,856) | — | 0.71 |
| 1. | As of December 31, 2023, cash in the amount $1,100,000 was pledged to brokers for OTC swap contracts. |
| 2. | Portfolio pays the floating rate and receives the total return of the reference entity. |
| 3. | Notional amounts reflected as a positive value indicate a long position held by the Portfolio or Index and a negative value indicates a short position. |
| 4. | Reflects the value at reset date as of December 31, 2023. |
| Abbreviation(s): |
| EAFE—Europe, Australasia and Far East |
| ETF—Exchange-Traded Fund |
| FEDF—Federal Funds Rate |
| FTSE—Financial Times Stock Exchange |
| MSCI—Morgan Stanley Capital International |
The following is a summary of the fair valuations according to the inputs used as of December 31, 2023, for valuing the Portfolio’s assets:
| Description | Quoted
Prices in
Active
Markets for
Identical
Assets
(Level 1) | | Significant
Other
Observable
Inputs
(Level 2) | | Significant
Unobservable
Inputs
(Level 3) | | Total |
| Asset Valuation Inputs | | | | | | | |
| Investments in Securities (a) | | | | | | | |
| Affiliated Investment Companies | | | | | | | |
| Equity Funds | $ 167,518,171 | | $ — | | $ — | | $ 167,518,171 |
| Fixed Income Funds | 240,899,387 | | — | | — | | 240,899,387 |
| Total Affiliated Investment Companies | 408,417,558 | | — | | — | | 408,417,558 |
| Short-Term Investment | | | | | | | |
| Affiliated Investment Company | 43,091,435 | | — | | — | | 43,091,435 |
| Total Investments in Securities | $ 451,508,993 | | $ — | | $ — | | $ 451,508,993 |
| (a) | For a complete listing of investments, see the Portfolio of Investments. |
The notes to the financial statements are an integral part of, and should be read in conjunction with, the financial statements.
17
Statement of Assets and Liabilities as of December 31, 2023
| Assets |
Investment in affiliated investment companies, at value
(identified cost $470,685,592) | $451,508,993 |
| Cash collateral on deposit at broker for swap contracts | 1,100,000 |
| Receivables: | |
| Dividends and interest on OTC swaps contracts | 559,592 |
| Dividends | 507,460 |
| Portfolio shares sold | 197,104 |
| Other assets | 9,233 |
| Total assets | 453,882,382 |
| Liabilities |
| Payables: | |
| Portfolio shares redeemed | 267,783 |
| NYLIFE Distributors (See Note 3) | 92,452 |
| Professional fees | 20,222 |
| Custodian | 19,308 |
| Shareholder communication | 6,316 |
| Accrued expenses | 1,655 |
| Total liabilities | 407,736 |
| Net assets | $453,474,646 |
| Composition of Net Assets |
| Shares of beneficial interest outstanding (par value of $.001 per share) unlimited number of shares authorized | $ 46,167 |
| Additional paid-in-capital | 502,917,078 |
| | 502,963,245 |
| Total distributable earnings (loss) | (49,488,599) |
| Net assets | $453,474,646 |
| Initial Class | |
| Net assets applicable to outstanding shares | $ 13,958,507 |
| Shares of beneficial interest outstanding | 1,404,271 |
| Net asset value per share outstanding | $ 9.94 |
| Service Class | |
| Net assets applicable to outstanding shares | $439,516,139 |
| Shares of beneficial interest outstanding | 44,763,010 |
| Net asset value per share outstanding | $ 9.82 |
The notes to the financial statements are an integral part of, and should be read in conjunction with, the financial statements.
| 18 | MainStay VP Conservative Allocation Portfolio |
Statement of Operations for the year ended December 31, 2023
| Investment Income (Loss) |
| Income | |
| Dividend distributions from affiliated investment companies | $ 14,621,427 |
| Expenses | |
| Distribution/Service—Service Class (See Note 3) | 1,154,083 |
| Professional fees | 65,447 |
| Custodian | 38,354 |
| Trustees | 12,587 |
| Shareholder communication | 2,671 |
| Miscellaneous | 12,850 |
| Total expenses | 1,285,992 |
| Net investment income (loss) | 13,335,435 |
| Realized and Unrealized Gain (Loss) |
| Net realized gain (loss) on: | |
| Affiliated investment company transactions | (14,745,273) |
| Realized capital gain distributions from affiliated investment companies | 4,292,653 |
| Swap transactions | (6,550,999) |
| Net realized gain (loss) | (17,003,619) |
Net change in unrealized appreciation (depreciation) on:
Affiliated investments companies | 48,466,879 |
| Net realized and unrealized gain (loss) | 31,463,260 |
| Net increase (decrease) in net assets resulting from operations | $ 44,798,695 |
The notes to the financial statements are an integral part of, and should be read in conjunction with, the financial statements.
19
Statements of Changes in Net Assets
for the years ended December 31, 2023 and December 31, 2022
| | 2023 | 2022 |
| Increase (Decrease) in Net Assets |
| Operations: | | |
| Net investment income (loss) | $ 13,335,435 | $ 11,725,991 |
| Net realized gain (loss) | (17,003,619) | 15,991,904 |
| Net change in unrealized appreciation (depreciation) | 48,466,879 | (109,330,812) |
| Net increase (decrease) in net assets resulting from operations | 44,798,695 | (81,612,917) |
| Distributions to shareholders: | | |
| Initial Class | (870,951) | (1,966,692) |
| Service Class | (26,986,947) | (74,201,160) |
| Total distributions to shareholders | (27,857,898) | (76,167,852) |
| Capital share transactions: | | |
| Net proceeds from sales of shares | 23,791,487 | 36,820,287 |
| Net asset value of shares issued to shareholders in reinvestment of distributions | 27,857,898 | 76,167,852 |
| Cost of shares redeemed | (124,906,198) | (133,464,320) |
| Increase (decrease) in net assets derived from capital share transactions | (73,256,813) | (20,476,181) |
| Net increase (decrease) in net assets | (56,316,016) | (178,256,950) |
| Net Assets |
| Beginning of year | 509,790,662 | 688,047,612 |
| End of year | $ 453,474,646 | $ 509,790,662 |
The notes to the financial statements are an integral part of, and should be read in conjunction with, the financial statements.
| 20 | MainStay VP Conservative Allocation Portfolio |
Financial Highlights selected per share data and ratios
| | Year Ended December 31, |
| Initial Class | 2023 | | 2022 | | 2021 | | 2020 | | 2019 |
| Net asset value at beginning of year | $ 9.64 | | $ 12.91 | | $ 12.44 | | $ 11.70 | | $ 10.77 |
| Net investment income (loss) (a) | 0.31 | | 0.26 | | 0.27 | | 0.21 | | 0.20 |
| Net realized and unrealized gain (loss) | 0.63 | | (1.89) | | 0.61 | | 0.97 | | 1.38 |
| Total from investment operations | 0.94 | | (1.63) | | 0.88 | | 1.18 | | 1.58 |
| Less distributions: | | | | | | | | | |
| From net investment income | (0.30) | | (0.53) | | (0.25) | | (0.25) | | (0.34) |
| From net realized gain on investments | (0.34) | | (1.11) | | (0.16) | | (0.19) | | (0.31) |
| Total distributions | (0.64) | | (1.64) | | (0.41) | | (0.44) | | (0.65) |
| Net asset value at end of year | $ 9.94 | | $ 9.64 | | $ 12.91 | | $ 12.44 | | $ 11.70 |
| Total investment return (b) | 10.29% | | (12.05)% | | 7.13% | | 10.28% | | 14.83% |
| Ratios (to average net assets)/Supplemental Data: | | | | | | | | | |
| Net investment income (loss) | 3.12% | | 2.31% | | 2.12% | | 1.76% | | 1.75% |
| Net expenses (c) | 0.03% | | 0.03% | | 0.03% | | 0.04% | | 0.03% |
| Portfolio turnover rate | 18% | | 26% | | 25% | | 29% | | 42% |
| Net assets at end of year (in 000's) | $ 13,959 | | $ 13,487 | | $ 17,168 | | $ 16,707 | | $ 16,327 |
| (a) | Per share data based on average shares outstanding during the year. |
| (b) | Total return does not reflect any deduction of sales charges, mortality and expense charges, contract charges or administrative charges. For periods of less than one year, total return is not annualized. |
| (c) | In addition to the fees and expenses which the Portfolio bears directly, it also indirectly bears a pro-rata share of the fees and expenses of the underlying funds in which it invests. Such indirect expenses are not included in the above expense ratios. |
| | Year Ended December 31, |
| Service Class | 2023 | | 2022 | | 2021 | | 2020 | | 2019 |
| Net asset value at beginning of year | $ 9.52 | | $ 12.77 | | $ 12.30 | | $ 11.57 | | $ 10.66 |
| Net investment income (loss) (a) | 0.27 | | 0.23 | | 0.23 | | 0.17 | | 0.17 |
| Net realized and unrealized gain (loss) | 0.64 | | (1.88) | | 0.61 | | 0.97 | | 1.35 |
| Total from investment operations | 0.91 | | (1.65) | | 0.84 | | 1.14 | | 1.52 |
| Less distributions: | | | | | | | | | |
| From net investment income | (0.27) | | (0.49) | | (0.21) | | (0.22) | | (0.30) |
| From net realized gain on investments | (0.34) | | (1.11) | | (0.16) | | (0.19) | | (0.31) |
| Total distributions | (0.61) | | (1.60) | | (0.37) | | (0.41) | | (0.61) |
| Net asset value at end of year | $ 9.82 | | $ 9.52 | | $ 12.77 | | $ 12.30 | | $ 11.57 |
| Total investment return (b) | 10.02% | | (12.27)% | | 6.86% | | 10.01% | | 14.55% |
| Ratios (to average net assets)/Supplemental Data: | | | | | | | | | |
| Net investment income (loss) | 2.80% | | 2.03% | | 1.83% | | 1.50% | | 1.47% |
| Net expenses (c) | 0.28% | | 0.28% | | 0.28% | | 0.29% | | 0.28% |
| Portfolio turnover rate | 18% | | 26% | | 25% | | 29% | | 42% |
| Net assets at end of year (in 000's) | $ 439,516 | | $ 496,304 | | $ 670,879 | | $ 686,344 | | $ 716,077 |
| (a) | Per share data based on average shares outstanding during the year. |
| (b) | Total return does not reflect any deduction of sales charges, mortality and expense charges, contract charges or administrative charges. For periods of less than one year, total return is not annualized. |
| (c) | In addition to the fees and expenses which the Portfolio bears directly, it also indirectly bears a pro-rata share of the fees and expenses of the underlying funds in which it invests. Such indirect expenses are not included in the above expense ratios. |
The notes to the financial statements are an integral part of, and should be read in conjunction with, the financial statements.
21
MainStay VP Moderate Allocation Portfolio
Investment and Performance Comparison (Unaudited)
Performance data quoted represents past performance. Past performance is no guarantee of future results. Because of market volatility and other factors, current performance may be lower or higher than the figures shown. Investment return and principal value will fluctuate, and as a result, when shares are redeemed, they may be worth more or less than their original cost. The performance table and graph do not reflect any deduction of sales charges, mortality and expense charges, contract charges or administrative charges. Please refer to the Performance Summary appropriate for your policy. For performance information current to the most recent month-end, please call 800-598-2019 or visit www.newyorklife.com.
Performance figures may reflect certain fee waivers and/or expense limitations, without which total returns may have been different. For information on current fee waivers and/or expense limitations (if any), please refer to the Notes to Financial Statements.
| Average Annual Total Returns for the Year-Ended December 31, 2023 |
| Class | Inception
Date | One
Year | Five
Years | Ten
Years | Gross
Expense
Ratio1 |
| Initial Class Shares | 2/13/2006 | 13.01% | 7.47% | 5.16% | 0.52% |
| Service Class Shares | 2/13/2006 | 12.73 | 7.20 | 4.90 | 0.77 |
| 1. | The gross expense ratios presented reflect the Portfolio’s “Total Annual Portfolio Operating Expenses” from the most recent Prospectus and may differ from other expense ratios disclosed in this report. |
The footnotes on the next page are an integral part of the table and graph and should be carefully read in conjunction with them.
| 22 | MainStay VP Moderate Allocation Portfolio |
| Benchmark Performance* | One
Year | Five
Years | Ten
Years |
| S&P 500® Index1 | 26.29% | 15.69% | 12.03% |
| MSCI EAFE® Index (Net)2 | 18.24 | 8.16 | 4.28 |
| Bloomberg U.S. Aggregate Bond Index3 | 5.53 | 1.10 | 1.81 |
| Moderate Allocation Composite Index4 | 16.54 | 8.89 | 6.95 |
| Morningstar Moderate Allocation Category Average5 | 13.78 | 8.16 | 6.07 |
| * | Returns for indices reflect no deductions for fees, expenses or taxes, except for foreign withholding taxes where applicable. Results assume reinvestment of all dividends and capital gains. An investment cannot be made directly in an index. |
| 1. | The S&P 500® Index is the Portfolio's primary benchmark. S&P 500® is a trademark of The McGraw-Hill Companies, Inc. The S&P 500® Index is widely regarded as the standard index for measuring large-cap U.S. stock market performance. |
| 2. | The MSCI EAFE® Index (Net) is the Portfolio's secondary benchmark. The MSCI EAFE® Index (Net) consists of international stocks representing the developed world outside of North America. |
| 3. | The Portfolio has selected the Bloomberg U.S. Aggregate Bond Index as an additional benchmark. The Bloomberg U.S. Aggregate Bond Index is a broad-based benchmark that measures the performance of the investment grade, U.S. dollar-denominated, fixed-rate taxable bond market, including Treasuries, government-related and corporate securities, mortgage-backed securities (agency fixed-rate and hybrid adjustable rate mortgage pass-throughs), asset-backed securities, and commercial mortgage-backed securities. |
| 4. | The Portfolio has selected the Moderate Allocation Composite Index as an additional benchmark. Effective February 28, 2014, the Moderate Allocation Composite Index consists of the S&P 500® Index, the MSCI EAFE® Index (Net) and the Bloomberg U.S. Aggregate Bond Index weighted 45%, 15% and 40%, respectively. Prior to February 28, 2014, the Moderate Allocation Composite Index consisted of the S&P 500® Index, the MSCI EAFE® Index (Net) and the Bloomberg U.S. Aggregate Bond Index weighted 50%, 10% and 40%, respectively. |
| 5. | The Morningstar Moderate Allocation Category Average is representative of funds in allocation categories that seek to provide both income and capital appreciation by primarily investing in multiple asset classes, including stocks, bonds, and cash. These moderate strategies seek to balance preservation of capital with appreciation. They typically expect volatility similar to a strategic equity exposure between 50% and 70%. Results are based on average total returns of similar funds with all dividends and capital gain distributions reinvested. |
The footnotes on the preceding page are an integral part of the table and graph and should be carefully read in conjunction with them.
Cost in Dollars of a $1,000 Investment in MainStay VP Moderate Allocation Portfolio (Unaudited)
The example below is intended to describe the fees and expenses borne by shareholders during the six-month period from July 1, 2023 to December 31, 2023, and the impact of those costs on your investment.
Example
As a shareholder of the Portfolio you incur two types of costs: (1) transaction costs, including exchange fees and sales charges (loads) on purchases (as applicable), and (2) ongoing costs, including management fees, distribution and/or service (12b-1) fees and other Portfolio expenses (as applicable). This example is intended to help you understand your ongoing costs (in dollars) of investing in the Portfolio and to compare these costs with the ongoing costs of investing in other mutual funds. The example is based on an investment of $1,000 made at the beginning of the six-month period and held for the entire period from July 1, 2023 to December 31, 2023. Shares are only sold in connection with variable life and annuity contracts and the example does not reflect any contract level or transactional fees or expenses. If these costs had been included, your costs would have been higher.
This example illustrates your Portfolio’s ongoing costs in two ways:
Actual Expenses
The second and third data columns in the table below provide information about actual account values and actual expenses. You may use the information in these columns, together with the amount you invested, to estimate the expenses that you paid during the six months ended
December 31, 2023. Simply divide your account value by $1,000 (for example, an $8,600 account value divided by $1,000 = 8.6), then multiply the result by the number under the heading entitled “Expenses Paid During Period” to estimate the expenses you paid on your account during this period.
Hypothetical Example for Comparison Purposes
The fourth and fifth data columns in the table below provide information about hypothetical account values and hypothetical expenses based on the Portfolio’s actual expense ratio and an assumed rate of return of 5% per year before expenses, which is not the Portfolio’s actual return. The hypothetical account values and expenses may not be used to estimate the actual ending account balances or expenses you paid for the six-month period shown. You may use this information to compare the ongoing costs of investing in the Portfolio with the ongoing costs of investing in other mutual funds. To do so, compare this 5% hypothetical example with the 5% hypothetical examples that appear in the shareholder reports of the other mutual funds.
Please note that the expenses shown in the table are meant to highlight your ongoing costs only and do not reflect any transactional costs, such as exchange fees or sales charges (loads). Therefore, the fourth and fifth data columns of the table are useful in comparing ongoing costs only and will not help you determine the relative total costs of owning different funds. In addition, if these transactional costs were included, your costs would have been higher.
| Share Class | Beginning
Account
Value
7/1/23 | Ending Account
Value (Based
on Actual
Returns and
Expenses)
12/31/23 | Expenses
Paid
During
Period1 | Ending Account
Value (Based
on Hypothetical
5% Annualized
Return and
Actual Expenses)
12/31/23 | Expenses
Paid
During
Period1 | Net Expense
Ratio
During
Period2 |
| Initial Class Shares | $1,000.00 | $1,056.70 | $0.10 | $1,025.10 | $0.10 | 0.02% |
| Service Class Shares | $1,000.00 | $1,055.40 | $1.40 | $1,023.84 | $1.38 | 0.27% |
| 1. | Expenses are equal to the Portfolio’s annualized expense ratio of each class multiplied by the average account value over the period, divided by 365 and multiplied by 184 (to reflect the six-month period). The table above represents the actual expenses incurred during the six-month period. In addition to the fees and expenses which the Portfolio bears directly, it also indirectly bears a pro rata share of the fees and expenses of the underlying Portfolios/Funds in which it invests. Such indirect expenses are not included in the above-reported expense figures. |
| 2. | Expenses are equal to the Portfolio's annualized expense ratio to reflect the six-month period. |
| 24 | MainStay VP Moderate Allocation Portfolio |
Asset Diversification as of December 31, 2023 (Unaudited)
| Equity Funds | 57.3% |
| Fixed Income Funds | 32.9 |
| Short-Term Investment | 9.4 |
| Other Assets, Less Liabilities | 0.4 |
See Portfolio of Investments beginning on page 30 for specific holdings within these categories. The Portfolio’s holdings are subject to change.
Portfolio Management Discussion and Analysis (Unaudited)
Answers to the questions reflect the views of portfolio managers Jae S. Yoon, CFA, Jonathan Swaney, Poul Kristensen, CFA, and Amit Soni, CFA, of New York Life Investments,1 the Portfolio’s Manager.
How did MainStay VP Moderate Allocation Portfolio perform relative to its benchmarks and peers during the 12 months ended December 31, 2023?
For the 12 months ended December 31, 2023, MainStay VP Moderate Allocation Portfolio returned 13.01% for Initial Class shares and 12.73% for Service Class shares. Over the same period, both share classes underperformed the 26.29% return of the S& P 500® Index, which is the Portfolio’s primary benchmark, and the 18.24% return of the MSCI EAFE® Index (Net), which is a secondary benchmark of the Portfolio. For the 12 months ended December 31, 2023, both share classes outperformed the 5.53% return of the Bloomberg U.S. Aggregate Bond Index and underperformed the 16.54% return of the Moderate Allocation Composite Index, which are additional benchmarks of the Portfolio. Over the same period, both share classes underperformed the 13.78% return of the Morningstar Moderate Allocation Category Average.2
What factors affected the Portfolio’s relative performance during the reporting period?
The Portfolio is a “fund of funds,” meaning that it seeks to achieve its investment objective by investing primarily in mutual funds and exchange-traded funds (“ETFs”) managed by New York Life Investments or its affiliates (the “Underlying Portfolios/Funds”). The Portfolio will generally invest in Underlying Portfolios of MainStay VP Funds Trust unless such Portfolio in a particular asset class (or subasset class) is deemed by the portfolio managers to be unavailable. The Underlying Portfolios/Funds may invest in U.S. equities, international equities and fixed-income instruments, making comparisons to any single index generally less suitable than a weighted combination of indices, which is a more useful yardstick by which to measure performance. The Portfolio’s management internally maintains a blend of indices that are taken into consideration when managing the Portfolio. During the reporting period, the Portfolio substantially underperformed this internally maintained blend of indices, primarily due to active positioning at the asset class level.
Management of the Portfolio’s stock/bond blend itself was not the primary issue affecting the Portfolio’s relative performance, as returns generated in the process of controlling that mix were only marginally negative. We held the Portfolio’s stock/bond allocation near neutral for much of the reporting period, but with a small bias toward holding underweight exposure to equities. That proved a liability through the spring and early summer of 2023, as a handful of mega-cap technology-related equities drove the market higher.
Rather, the most significant factor undermining relative performance related to positioning within asset classes, primarily
equities, with the Portfolio’s exposure to small-cap stocks detracting substantially from returns. Throughout the reporting period, relative valuations in the small-cap asset class were much more attractive than has been the historical norm; however small companies are significantly more sensitive to changes in bank financing conditions than are large companies that can issue bonds. Fast-rising costs on bank loans, coupled with concerns about future credit availability in the wake of the bank crisis that occurred in the early spring of 2023, weighed heavily on that end of the capitalization spectrum. We promptly restored the Portfolio’s small-cap allocation to neutral as the nature and scope of the crisis became clear.
Relative returns also suffered from efforts to avoid undue exposure to a small group of market-leading, mega-cap, technology-related companies. Recently dubbed ‘the Magnificent 7’ (Alphabet, Amazon, Apple, Meta Platforms, Microsoft, NVIDIA, and Tesla), these firms are richly valued, implying rapid earnings growth in the coming years. We remain skeptical that such growth is likely to be achieved by these companies, which are already among the largest enterprises in the world, with dominant positions in their respective industries. Accordingly, we shifted Portfolio assets out of capitalization-weighted large-cap index products, favoring other options—most notably, an equally weighted version of the S&P 500®. During the reporting period, however, ongoing enthusiasm for the commercial potential of artificial intelligence (“AI”), and the degree to which the Magnificent 7 are expected to benefit from such developments, helped these companies maintain their leadership positions. During the reporting period, the Bloomberg Magnificent 7 Price Return Index returned approximately 107%, compared to the more modest 14% return for the equally weighted S&P 500®.
Tilts favoring defensive sectors, particularly health care, and low volatility stocks, further detracted from the Portfolio’s active returns. Basically, any skew in the Portfolio away from the sole winners of the reporting period—mega-cap tech-oriented companies—was a drag on relative results.
The Portfolio realized some positive results within equities. Tactical trading in gold miners, for example, proved helpful. The Portfolio also benefited from a bias favoring an emerging-markets equity strategy that excluded China, reflecting our concerns regarding China’s ongoing property market turmoil, high debt levels, regulatory overreach and simmering tensions with the West,
The fixed-income portion of the Portfolio neither contributed positively to, nor detracted from, active return. (Contributions take weightings and total returns into account.) The Portfolio gave up a little ground due to underweight exposure to bank loans. We expected that defaults would rise considerably in the bank loan space as economic activity slowed, but the anticipated slowdown
| 1. | “New York Life Investments” is a service mark used by New York Life Investment Management Holdings LLC and its subsidiary New York Life Investment Management LLC. |
| 2. | See "Investment and Performance Comparison" for more information on benchmark and peer group returns. |
| 26 | MainStay VP Moderate Allocation Portfolio |
failed to materialize during the reporting period. That shortfall was offset through duration3 management, as we extended the Portfolio’s duration during the fall as yields rose, and then reduced duration as yields declined into year-end.
During the reporting period, how was the Portfolio’s performance materially affected by investments in derivatives?
Total return swaps were used to express most of the Portfolio’s asset class policy views. Therefore, the swaps can be seen as detracting from the Portfolio’s relative performance over the course of the reporting period.
How did you allocate the Portfolio’s assets during the reporting period and why?
Stock/bond blend: We held equity exposure within the Portfolio relatively close to neutral during the reporting period. We are generally reluctant to position the Portfolio with underweight equity exposure, as stocks tend to perform well over time and anticipating drawdowns is challenging. Conversely, we are happy to lean into equities when we believe they are well-supported fundamentally or when a correction has run further than we believe appropriate. Nevertheless, we shifted the Portfolio’s equity position to slightly underweight following a sharp rally in January 2023, and enlarged the underweight posture a little further late in the spring when the banking sector turmoil appeared to increase the likelihood of a recession. As the recession failed to materialize, we gradually removed the underweight equity exposure over the course of the summer and into the fall, eventually moving to a slightly overweight equity position, before pulling back to neutral during the subsequent rally in stocks.
Duration: After an extended period of holding a short duration position, we shifted the Portfolio to a neutral position in the spring of 2023, in expectation of an impending recession. We extended the Portfolio’s duration further in the summer and fall as yields rose, presumably in response to heavy new Treasury issuance, “higher for longer” monetary policy prospects, stubborn inflationary pressures, and rising yields abroad. Reflecting our view that yields would come back down as inflation continued to cool and an inflection in Fed policy came into sight, we increased the Portfolio’s duration to slightly more than six months long by the end of October. The yield on the 10-year Treasury note did indeed fall back, dropping from roughly 5% to 4%, and we trimmed the Portfolio’s duration as it did so, ending the reporting period very close to neutral.
Equity style: Growth stocks, by definition, exhibit richer valuations than value stock. As a consequence, growth stock prices are relatively reliant on distant profits, and are often more sensitive to
elevated inflation and higher interest rates than their value-oriented counterparts. Accordingly, given the high-rate environment that prevailed during the reporting period, we persistently tilted the Portfolio to emphasize value stocks that offered more substantial near-term cash flows. In particular, we focused on defensive, lower-volatility sectors, including utilities, consumer staples and—most of all—health care. This position undermined results in 2023, as market performance was dominated by the aforementioned Magnificent 7—growth-oriented technology-related stocks, swept by a wave of excitement over the prospects for generative AI.
Equity size: The Portfolio held overweight exposure to small-cap stocks during the first half of the reporting period. We based our thesis on several prevailing characteristics of the asset class: attractive valuations, insulation from economic weakness abroad, less sensitivity to dollar strength and disproportionate exposure to domestic demand–which thus far remains robust. That position proved unconstructive during the spring of 2023, as small companies tend to be heavily dependent on bank financing, and banks aggressively tightened lending standards in the wake of the banking crisis in March and April. Accordingly, we unwound the Portfolio’s small-cap bias. However, it is important to note that the proceeds did not flow to large blend index exposure, where the Magnificent 7 dominate. Rather, the redirected assets went to an equally weighted version of the S&P 500®, where those seven names comprise less than 2% of the index.
Geographic exposure: During the reporting period, European equities appeared vulnerable. We expected that persistently high wage growth would compel the European Central Bank to maintain its restrictive monetary policies for an extended period of time while European export-heavy economies wrestled with declining global trade volumes. In addition, Europe appear particularly exposed to potential energy price spikes amid elevated geopolitical tensions. On the other hand, the Bank of Japan remained engaged in accommodative policy, Japanese exports benefited from a weak yen, and shareholder governance was increasingly prioritized by Japanese companies, largely in the form of share buybacks. Given these divergent conditions, we tilted the Portfolio away from European markets in favor of Japanese stocks, while holding net exposure to non-U.S. stocks close to neutral. With prospects for Chinese equities looking somewhat dim, we tilted the Portfolio toward other faster-growing economies within the emerging-markets complex.
Energy and natural resources: The Portfolio maintained exposure to upstream energy producers and oilfield/gas field service providers as a commodity play to provide an additional inflation hedge. These holdings also positioned the Portfolio to take advantage of opportunities for domestic producers to benefit as
| 3. | Duration is a measure of the price sensitivity of a fixed-income investment to changes in interest rates. Duration is expressed as a number of years and is considered a more accurate sensitivity gauge than average maturity. |
Western nations revisit energy policy to source supplies from stable and friendly jurisdictions rather than autocratic petrostates that present national security risks. The Portfolio’s small, but volatile, energy position had a disproportionate impact on the Portfolio’s short-term performance month by month, but little impact on overall performance for the entire year. The Portfolio also added exposure to uranium miners during the reporting period. With numerous reactors planned, under construction, or being put back into service after an earlier shutoff, we expect nuclear energy production to grow significantly in the years ahead, driving the need for additional uranium production and creating opportunities for miners and processors.
How did the Portfolio’s allocations change over the course of the reporting period?
In one of the more substantial changes in allocations undertaken during the reporting period, we reduced the Portfolio’s exposure to small-cap stocks, expressed via total return swaps. We took this action in response to the banking crisis that unfolded in the spring of 2023. Other changes included a reduction in the Portfolio’s holdings of MainStay VP Floating Rate Portfolio, thereby decreasing exposure to lower-credit-quality fixed-income instruments ahead of an expected recession. We unwound the Portfolio’s swap exposure to the S&P 500 Health Care Sector in favor of other defensive positions, including Invesco S&P 500 Low Volatility ETF. We unwound swap exposure to VanEck Gold Miners ETF, taking gains and exiting a profitable trade on a high note. Lastly, we used swaps to tilt the Portfolio away from baskets of specific stocks that were either heavily dependent on floating-rate loans (such as Uber, United Airlines and Carnival) or that generated insufficient operating income to retire debt as it came due (so-called ‘zombie’ companies, such as Royal Caribbean, Wynn Resorts and Rivian). We believed these firms were especially vulnerable in an environment of fast-rising interest rates and tightening lending standards.
New or increased allocations included, first and foremost, the establishment and growth of an allocation to Invesco S&P 500® Equal Weight ETF, funded in part from cash. We adopted this position to remove the Portfolio’s underweight exposure to equities without significantly increasing its exposure to the Magnificent 7. We increased the Portfolio’s exposure to iShares 20+ Year Treasury Bond ETF, which we used to extend the Portfolio’s duration as bond yields rose. We also initiated a new Portfolio position in iShares MSCI Japan ETF (via a swap) because we saw valuations as attractive, export conditions as favorable and the Japanese yen as likely to appreciate should the Bank of
Japan abandon its existing yield curve4 control policy. Another notable addition involved the establishment of exposure to Global X Uranium ETF, which invests primarily in uranium mining firms. Climate change concerns, net-zero commitments and the limitations of renewable energy are driving a reconsideration of nuclear energy, for which fuel supply is rather limited. We foresee a supply/demand imbalance developing that is likely to support businesses involved with extracting and processing uranium. We also opened a position in a swap providing access to the IQ CBRE NextGen Real Estate ETF, providing a toehold in the digital infrastructure space.
At the Underlying Fund level, the Portfolio took advantage of a few new investment options, adopting a position in IQ MacKay ESG High Income ETF, funded from MainStay VP MacKay High Yield Corporate Bond Portfolio. Other holdings in newly available Underlying Equity Funds included MainStay PineStone U.S. Equity Fund, IQ Candriam U.S. Mid Cap Equity ETF and MainStay Fiera SMID Growth Fund. Departing the Portfolio was IQ U.S. Large Cap ETF, which was liquidated in December.
During the reporting period, which Underlying Equity Portfolios/Funds had the highest total returns and which had the lowest total returns?
The Portfolio’s top-performing Underlying Equity Funds that were held for the entire reporting period included MainStay VP Winslow Large Cap Growth Portfolio, MainStay VP Wellington Growth Portfolio and IQ Candriam U.S. Equity ETF. The worst-performing positions (all of which produced positive returns) included Invesco S&P 500 Low Volatility ETF, MainStay VP PineStone International Equity Portfolio (previously MainStay VP MacKay International Equity Portfolio) and MainStay VP Candriam Emerging Markets Equity Portfolio.
Which Underlying Equity Portfolios/Funds were the strongest positive contributors to the Portfolio’s performance and which Underlying Equity Portfolios/Funds were particularly weak?
The strongest positive contributions to performance came from MainStay VP Winslow Large Cap Growth Portfolio, MainStay VP Wellington Growth Portfolio and IQ Candriam U.S. Equity ETF. The direct Portfolio holdings that contributed least to returns included MainStay VP PineStone International Equity Portfolio (previously MainStay VP MacKay International Equity Portfolio), MainStay Epoch Capital Growth Fund and IQ CBRE NextGen Real Estate ETF. The Portfolio experienced losses from some swap positions in
| 4. | The yield curve is a line that plots the yields of various securities of similar quality—typically U.S. Treasury issues—across a range of maturities. The U.S. Treasury yield curve serves as a benchmark for other debt and is used in economic forecasting. |
| 28 | MainStay VP Moderate Allocation Portfolio |
which we paid the return to the Russell 2000 Index, the Russell 1000 Growth Index and the MSCI EAFE Index.
What factors and risks affected the Portfolio’s Underlying Fixed-Income Portfolio/Fund investments during the reporting period?
As discussed above, interest rates were driven by high, but moderating, inflation and tight monetary policy, with rising expectations that monetary policy would be relaxed in 2024. Spreads5 were influenced by the resilience of the economy and expectations of a more accommodative policy environment ahead.
During the reporting period, which fixed-income market segments were the strongest positive contributors to the Portfolio’s performance and which segments were particularly weak?
Lower quality securities—from bank loans to high yield bonds—generally fared best. They enjoyed positive carry compared to higher quality debt, spreads were mostly stable, and default rates were not yet elevated.
Which Underlying Fixed-Income Portfolios/Funds made the strongest positive contributions to the Portfolio’s performance, and which Underlying Fixed-Income Portfolios/Funds were the greatest detractors?
The largest contributions to the Portfolio’s absolute returns came from positions in MainStay VP Indexed Bond Portfolio, cash holdings and MainStay VP Floating Rate Portfolio. No fixed-income position produced negative returns. The smallest positive contributions to Portfolio performance came from MainStay MacKay U.S. Infrastructure Bond Fund, MainStay VP PIMCO Real Return Portfolio and MainStay Short Term Bond Fund.
| 5. | The terms “spread” and “yield spread” may refer to the difference in yield between a security or type of security and comparable U.S. Treasury issues. The terms may also refer to the difference in yield between two specific securities or types of securities at a given time. |
The opinions expressed are those of the portfolio managers as of the date of this report and are subject to change. There is no guarantee that any forecasts will come to pass. This material does not constitute investment advice and is not intended as an endorsement of any specific investment.
Not all MainStay VP Portfolios and/or share classes are available under all policies.
Portfolio of Investments December 31, 2023†^
| | Shares | Value |
| Affiliated Investment Companies 90.2% |
| Equity Funds 57.3% |
| IQ 500 International ETF (a) | 588,454 | $ 19,290,287 |
| IQ Candriam International Equity ETF (a) | 695,350 | 19,435,033 |
| IQ Candriam U.S. Large Cap Equity ETF (a) | 714,186 | 29,988,670 |
| IQ Candriam U.S. Mid Cap Equity ETF (a) | 540,702 | 16,282,105 |
| IQ CBRE NextGen Real Estate ETF (a) | 878,410 | 17,945,916 |
| IQ FTSE International Equity Currency Neutral ETF | 633,576 | 15,757,035 |
| IQ U.S. Small Cap ETF | 210,756 | 7,597,754 |
| MainStay Epoch Capital Growth Fund Class I | 204,725 | 2,858,725 |
| MainStay Epoch International Choice Fund Class I (a) | 360,764 | 14,376,529 |
| MainStay Fiera SMID Growth Fund Class R6 (a) | 1,025,216 | 17,010,796 |
| MainStay PineStone U.S. Equity Fund Class R6 (a) | 1,549,854 | 26,889,815 |
| MainStay VP American Century Sustainable Equity Portfolio Initial Class (a) | 2,948,053 | 26,356,770 |
| MainStay VP Candriam Emerging Markets Equity Portfolio Initial Class (a) | 2,852,216 | 19,839,160 |
| MainStay VP Epoch U.S. Equity Yield Portfolio Initial Class | 1,321,350 | 21,906,261 |
| MainStay VP PineStone International Equity Portfolio Initial Class (a) | 1,334,136 | 14,312,478 |
| MainStay VP S&P 500 Index Portfolio Initial Class | 140,807 | 12,019,442 |
| MainStay VP Small Cap Growth Portfolio Initial Class | 1,284,247 | 13,842,646 |
| MainStay VP Wellington Growth Portfolio Initial Class (a) | 1,252,265 | 30,610,982 |
| MainStay VP Wellington Mid Cap Portfolio Initial Class (a) | 1,946,466 | 16,402,672 |
| MainStay VP Wellington Small Cap Portfolio Initial Class (a) | 1,242,094 | 10,775,415 |
| MainStay VP Wellington U.S. Equity Portfolio Initial Class | 614,698 | 16,167,774 |
| MainStay VP Winslow Large Cap Growth Portfolio Initial Class (a) | 1,196,264 | 31,227,515 |
| MainStay WMC Enduring Capital Fund Class R6 (a) | 355,570 | 12,306,990 |
| MainStay WMC International Research Equity Fund Class I (a) | 1,985,055 | 14,409,516 |
| MainStay WMC Value Fund Class R6 (a) | 651,968 | 19,598,210 |
Total Equity Funds
(Cost $435,570,742) | | 447,208,496 |
| | Shares | | Value |
| |
| Fixed Income Funds 32.9% |
| IQ MacKay ESG Core Plus Bond ETF (a) | 1,627,458 | | $ 34,290,540 |
| IQ Mackay ESG High Income ETF (a) | 339,039 | | 9,004,876 |
| MainStay MacKay Short Duration High Yield Fund Class I | 2,191,472 | | 20,779,317 |
| MainStay Mackay U.S. Infrastructure Bond Fund Class R6 | 1,352,838 | | 10,274,262 |
| MainStay Short Term Bond Fund Class I (a) | 1,690,144 | | 15,424,761 |
| MainStay VP Bond Portfolio Initial Class | 570,411 | | 7,054,450 |
| MainStay VP Floating Rate Portfolio Initial Class (a) | 2,698,621 | | 23,170,093 |
| MainStay VP Indexed Bond Portfolio Initial Class (a) | 13,777,312 | | 120,255,265 |
| MainStay VP MacKay High Yield Corporate Bond Portfolio Initial Class | 990,221 | | 8,986,256 |
| MainStay VP PIMCO Real Return Portfolio Initial Class (a) | 999,266 | | 7,768,996 |
Total Fixed Income Funds
(Cost $280,470,424) | | | 257,008,816 |
Total Affiliated Investment Companies
(Cost $716,041,166) | | | 704,217,312 |
| Short-Term Investment 9.4% |
| Affiliated Investment Company 9.4% |
| MainStay U.S. Government Liquidity Fund, 5.235% (a)(b) | 73,467,114 | | 73,467,114 |
Total Short-Term Investment
(Cost $73,467,114) | 9.4% | | 73,467,114 |
Total Investments
(Cost $789,508,280) | 99.6% | | 777,684,426 |
| Other Assets, Less Liabilities | 0.4 | | 3,396,861 |
| Net Assets | 100.0% | | $ 781,081,287 |
| † | Percentages indicated are based on Portfolio net assets. |
| ^ | Industry classifications may be different than those used for compliance monitoring purposes. |
| (a) | As of December 31, 2023, the Portfolio's ownership exceeds 5% of the outstanding shares of the Underlying Portfolio's share class. |
| (b) | Current yield as of December 31, 2023. |
The notes to the financial statements are an integral part of, and should be read in conjunction with, the financial statements.
| 30 | MainStay VP Moderate Allocation Portfolio |
Investments in Affiliates (in 000's)
Investments in issuers considered to be affiliate(s) of the Portfolio during the year ended December 31, 2023 for purposes of Section 2(a)(3) of the Investment Company Act of 1940, as amended, were as follows:
| Affiliated Investment Companies | Value,
Beginning
of Year | Purchases
at Cost | Proceeds
from
Sales | Net
Realized
Gain/(Loss)
on Sales | Change in
Unrealized
Appreciation/
(Depreciation) | Value,
End of
Year | Dividend
Income | Other
Distributions | Shares
End of
Year |
| IQ 500 International ETF | $ 20,603 | $ 551 | $ (4,840) | $ 413 | $ 2,563 | $ 19,290 | $ 786 | $ — | 588 |
| IQ Candriam International Equity ETF | 20,524 | 504 | (4,013) | 947 | 1,473 | 19,435 | 608 | — | 695 |
| IQ Candriam U.S. Large Cap Equity ETF | 36,306 | 123 | (15,992) | 4,093 | 5,459 | 29,989 | 430 | — | 714 |
| IQ Candriam U.S. Mid Cap Equity ETF | — | 15,957 | (583) | (14) | 922 | 16,282 | 100 | — | 541 |
| IQ CBRE NextGen Real Estate ETF | — | 17,149 | (296) | 4 | 1,089 | 17,946 | 110 | — | 878 |
| IQ FTSE International Equity Currency Neutral ETF | 16,242 | 156 | (3,119) | 324 | 2,154 | 15,757 | 416 | — | 634 |
| IQ MacKay ESG Core Plus Bond ETF | 28,762 | 7,645 | (2,881) | (452) | 1,217 | 34,291 | 1,415 | — | 1,627 |
| IQ Mackay ESG High Income ETF | — | 9,317 | (581) | (5) | 274 | 9,005 | 423 | 6 | 339 |
| IQ U.S. Large Cap ETF | 29,044 | 267 | (31,116) | 8,117 | (6,312) | — | 375 | — | — |
| IQ U.S. Small Cap ETF | 10,212 | 2,237 | (5,778) | (508) | 1,435 | 7,598 | 127 | — | 211 |
| MainStay Epoch Capital Growth Fund Class I | 2,888 | 16 | (783) | (72) | 810 | 2,859 | 16 | 1 | 205 |
| MainStay Epoch International Choice Fund Class I | 14,905 | 464 | (3,431) | 149 | 2,290 | 14,377 | 244 | — | 361 |
| MainStay Fiera SMID Growth Fund Class R6 | — | 16,160 | (221) | (6) | 1,078 | 17,011 | — | 396 | 1,025 |
| MainStay MacKay Short Duration High Yield Fund Class I | 22,722 | 1,759 | (4,508) | (248) | 1,054 | 20,779 | 1,282 | — | 2,191 |
| MainStay Mackay U.S. Infrastructure Bond Fund Class R6 | — | 9,979 | — | — | 295 | 10,274 | 42 | — | 1,353 |
| MainStay PineStone U.S. Equity Fund Class R6 | — | 25,578 | — | — | 1,312 | 26,890 | 64 | 20 | 1,550 |
| MainStay Short Term Bond Fund Class I | — | 16,840 | (1,407) | (20) | 12 | 15,425 | 522 | — | 1,690 |
| MainStay U.S. Government Liquidity Fund | 82,310 | 161,200 | (170,043) | — | — | 73,467 | 3,809 | — | 73,467 |
| MainStay VP American Century Sustainable Equity Portfolio Initial Class | 33,749 | 9,288 | (14,302) | 1,726 | (4,104) | 26,357 | 350 | 8,937 | 2,948 |
| MainStay VP Bond Portfolio Initial Class | 27,135 | 1,793 | (21,817) | (3,919) | 3,862 | 7,054 | 739 | — | 570 |
| MainStay VP Candriam Emerging Markets Equity Portfolio Initial Class | 20,762 | 733 | (2,809) | (1,190) | 2,343 | 19,839 | 340 | — | 2,852 |
| MainStay VP Epoch U.S. Equity Yield Portfolio Initial Class | 30,211 | 2,269 | (10,501) | 1,107 | (1,180) | 21,906 | 623 | 1,491 | 1,321 |
| MainStay VP Floating Rate Portfolio Initial Class | 42,220 | 3,218 | (23,144) | (1,229) | 2,105 | 23,170 | 2,434 | — | 2,699 |
| MainStay VP Indexed Bond Portfolio Initial Class | 124,844 | 8,348 | (16,290) | (4,703) | 8,056 | 120,255 | 2,910 | — | 13,777 |
| MainStay VP MacKay High Yield Corporate Bond Portfolio Initial Class | 19,280 | 932 | (12,146) | (1,066) | 1,986 | 8,986 | 505 | — | 990 |
| MainStay VP PIMCO Real Return Portfolio Initial Class | 8,281 | 1,003 | (1,143) | (61) | (311) | 7,769 | 664 | — | 999 |
| MainStay VP PineStone International Equity Portfolio Initial Class (a) | 14,856 | 1,053 | (2,215) | (1,080) | 1,698 | 14,312 | — | — | 1,334 |
| MainStay VP S&P 500 Index Portfolio Initial Class | 12,369 | 378 | (3,287) | 725 | 1,834 | 12,019 | 163 | 180 | 141 |
| MainStay VP Small Cap Growth Portfolio Initial Class | 16,604 | 657 | (5,610) | (2,561) | 4,753 | 13,843 | — | 46 | 1,284 |
| MainStay VP Wellington Growth Portfolio Initial Class | 36,156 | 262 | (17,453) | (13,678) | 25,324 | 30,611 | — | — | 1,252 |
| MainStay VP Wellington Mid Cap Portfolio Initial Class | 19,598 | 447 | (5,926) | (4,844) | 7,128 | 16,403 | 18 | — | 1,946 |
| MainStay VP Wellington Small Cap Portfolio Initial Class | 13,342 | 1,803 | (5,801) | (2,278) | 3,708 | 10,774 | 79 | — | 1,242 |
| MainStay VP Wellington U.S. Equity Portfolio Initial Class | 19,349 | 433 | (7,514) | (2,695) | 6,595 | 16,168 | 162 | — | 615 |
| MainStay VP Winslow Large Cap Growth Portfolio Initial Class | 35,054 | 1,935 | (17,239) | (1,271) | 12,749 | 31,228 | — | 1,141 | 1,196 |
The notes to the financial statements are an integral part of, and should be read in conjunction with, the financial statements.
31
Portfolio of Investments December 31, 2023†^ (continued)
| Affiliated Investment Companies | Value,
Beginning
of Year | Purchases
at Cost | Proceeds
from
Sales | Net
Realized
Gain/(Loss)
on Sales | Change in
Unrealized
Appreciation/
(Depreciation) | Value,
End of
Year | Dividend
Income | Other
Distributions | Shares
End of
Year |
| MainStay WMC Enduring Capital Fund Class R6 | $ 15,971 | $ 514 | $ (6,339) | $ (202) | $ 2,363 | $ 12,307 | $ 125 | $ — | 356 |
| MainStay WMC International Research Equity Fund Class I | 15,147 | 426 | (2,748) | (775) | 2,360 | 14,410 | 294 | — | 1,985 |
| MainStay WMC Value Fund Class R6 | 28,256 | 927 | (10,666) | (2,600) | 3,681 | 19,598 | 335 | 592 | 652 |
| | $ 817,702 | $322,321 | $(436,542) | $(27,872) | $102,075 | $ 777,684 | $20,510 | $12,810 | |
| | |
| (a) | Prior to August 28, 2023, known as MainStay VP MacKay International Equity Portfolio Initial Class. |
Swap Contracts
Open OTC total return equity swap contracts as of December 31, 2023 were as follows1:
Swap
Counterparty | Reference Obligation | Floating Rate2 | Termination
Date(s) | Payment
Frequency
Paid/
Received | Notional
Amount
Long/
(Short)
(000)3 | Unrealized
Appreciation/
(Depreciation)4 |
| Citibank NA | Citi Leveraged Loan Basket | 1 day FEDF minus 0.20% | 12/3/24 | Daily | (10,641) | $ — |
| Citibank NA | Citi Zombie Company Basket | 1 day FEDF minus 0.50% | 12/3/24 | Daily | (14,098) | — |
| JPMorgan Chase Bank NA | Global X Uranium ETF | 1 day FEDF plus 0.50% | 10/8/24 - 11/12/24 | Daily | 19,571 | — |
| Citibank NA | Invesco S&P 500 Low Volatility ETF | 1 day FEDF plus 0.55% | 12/3/24 | Daily | 17,868 | — |
| Citibank NA | iShares 20+ Year Treasury Bond ETF | 1 day FEDF plus 0.60% | 12/3/24 | Daily | 27,796 | — |
| Citibank NA | iShares MSCI China ETF | 1 day FEDF minus 0.56% | 12/3/24 | Daily | (7,606) | — |
| Citibank NA | iShares MSCI EAFE ETF | 1 day FEDF minus 1.25% | 12/3/24 | Daily | (31,579) | — |
| Citibank NA | iShares MSCI Emerging Markets ETF | 1 day FEDF minus 0.54% | 12/3/24 | Daily | (4,428) | — |
| Citibank NA | iShares MSCI Emerging Markets ex China ETF | 1 day FEDF plus 0.55% | 12/3/24 | Daily | 8,143 | — |
| JPMorgan Chase Bank NA | iShares MSCI Japan ETF | 1 day FEDF plus 0.15% | 4/24/24 - 5/7/24 | Daily | 23,275 | — |
| JPMorgan Chase Bank NA | Russell 2000 Total Return Index | 1 day FEDF minus 0.15% - plus 0.05% | 4/9/24 - 5/7/24 | Daily | (37,822) | — |
| JPMorgan Chase Bank NA | S&P 500 Equal Weight | 1 day FEDF plus 0.30% - 0.51% | 5/7/24 | Daily | 36,309 | — |
| Citibank NA | S&P 500 Total Return Index | 1 day FEDF plus 0.05% | 12/3/24 | Daily | (20,645) | — |
| Citibank NA | S&P 600 Total Return Index | 1 day FEDF plus 0.45% | 12/3/24 | Daily | 41,578 | — |
| Citibank NA | S&P Midcap 400 Total Return Index | 1 day FEDF plus 0.35% | 12/3/24 | Daily | 7,533 | — |
| JPMorgan Chase Bank NA | VanEck Oil Services ETF | 1 day FEDF plus 0.15% | 11/5/24 | Daily | 8,050 | — |
| Citibank NA | Vanguard FTSE Europe ETF | 1 day FEDF minus 0.50% | 12/3/24 | Daily | (7,943) | — |
| | | | | | | $ — |
The following table represents the basket holdings underlying the total return swap with Citi Leveraged Loan Basket as of December 31, 2023.
| Security Description | Shares | Notional Value | Unrealized Appreciation/
Depreciation | Percent of
Basket Net Assets |
| AerCap Holdings NV | (3,421) | (445,175) | — | 4.18 |
| Apollo Commercial Real Estate Finance Inc | (651) | (84,710) | — | 0.80 |
| Atlantica Sustainable Infrastructure PLC | (410) | (53,409) | — | 0.50 |
| Brandywine Realty Trust | (701) | (91,199) | — | 0.86 |
| Carnival Corp | (11,602) | (1,509,944) | — | 14.19 |
| Chart Industries Inc | (3,233) | (420,797) | — | 3.95 |
| Coherent Corp | (1,686) | (219,466) | — | 2.06 |
The notes to the financial statements are an integral part of, and should be read in conjunction with, the financial statements.
| 32 | MainStay VP Moderate Allocation Portfolio |
| Security Description | Shares | Notional Value | Unrealized Appreciation/
Depreciation | Percent of
Basket Net Assets |
| CommScope Holding Co Inc | (202) | (26,352) | — | 0.25 |
| Crane NXT Co | (2,324) | (302,427) | — | 2.84 |
| Cushman & Wakefield PLC | (789) | (102,731) | — | 0.97 |
| Delta Air Lines Inc | (7,346) | (955,949) | — | 8.98 |
| Designer Brands Inc | (524) | (68,217) | — | 0.64 |
| DigitalBridge Group Inc | (1,040) | (135,336) | — | 1.27 |
| Elanco Animal Health Inc | (3,969) | (516,582) | — | 4.85 |
| Entegris Inc | (5,076) | (660,609) | — | 6.21 |
| Fidelity National Information Services Inc | (6,930) | (901,829) | — | 8.48 |
| Hanesbrands Inc | (1,619) | (210,732) | — | 1.98 |
| JetBlue Airways Corp | (1,184) | (154,133) | — | 1.45 |
| Lumen Technologies Inc | (2,071) | (269,467) | — | 2.53 |
| MKS Instruments Inc | (1,728) | (224,924) | — | 2.11 |
| Oatly Group AB | (162) | (21,062) | — | 0.20 |
| Opendoor Technologies Inc | (2,694) | (350,602) | — | 3.30 |
| Par Pacific Holdings Inc | (968) | (125,976) | — | 1.18 |
| PureCycle Technologies Inc | (315) | (40,964) | — | 0.39 |
| Scorpio Tankers Inc | (2,160) | (281,106) | — | 2.64 |
| Topgolf Callaway Brands Corp | (679) | (88,340) | — | 0.83 |
| Uber Technologies Inc | (12,431) | (1,617,761) | — | 15.20 |
| United Airlines Holdings Inc | (5,849) | (761,227) | — | 7.15 |
The following table represents the basket holdings underlying the total return swap with Citi Zombie Company Basket as of December 31, 2023.
| Security Description | Shares | Notional Value | Unrealized Appreciation/
Depreciation | Percent of
Basket Net Assets |
| Alteryx Inc | (1,551) | (189,773) | — | 1.35 |
| AppLovin Corp | (3,092) | (378,337) | — | 2.68 |
| Array Technologies Inc | (2,416) | (295,561) | — | 2.10 |
| Asana Inc | (1,334) | (163,216) | — | 1.16 |
| BILL Holdings Inc | (5,039) | (616,528) | — | 4.37 |
| BioCryst Pharmaceuticals Inc | (529) | (64,757) | — | 0.46 |
| Bloom Energy Corp | (1,200) | (146,829) | — | 1.04 |
| Bridgebio Pharma Inc | (4,210) | (515,093) | — | 3.65 |
| Carnival Corp | (8,716) | (1,066,519) | — | 7.57 |
| Children's Place Inc/The | (480) | (58,700) | — | 0.42 |
| Cinemark Holdings Inc | (1,197) | (146,464) | — | 1.04 |
| Coeur Mining Inc | (507) | (61,994) | — | 0.44 |
| Cytokinetics Inc | (3,385) | (414,130) | — | 2.94 |
| DigitalBridge Group Inc | (1,177) | (143,973) | — | 1.02 |
| Emergent BioSolutions Inc | (151) | (18,422) | — | 0.13 |
| Enviva Inc | (27) | (3,343) | — | 0.02 |
| Exact Sciences Corp | (3,916) | (479,221) | — | 3.40 |
| Fastly Inc | (2,038) | (249,419) | — | 1.77 |
| Gap Inc/The | (6,277) | (768,064) | — | 5.45 |
| Guardant Health Inc | (1,614) | (197,527) | — | 1.40 |
| IAC Inc | (1,208) | (147,858) | — | 1.05 |
| Infinera Corp | (364) | (44,485) | — | 0.32 |
| Insmed Inc | (1,176) | (143,879) | — | 1.02 |
| JetBlue Airways Corp | (1,360) | (166,385) | — | 1.18 |
| Kyndryl Holdings Inc | (970) | (118,644) | — | 0.84 |
| Lyft Inc | (6,349) | (776,830) | — | 5.51 |
| NeoGenomics Inc | (822) | (100,637) | — | 0.71 |
| Oscar Health Inc | (2,090) | (255,707) | — | 1.81 |
| Pacific Biosciences of California Inc | (985) | (120,534) | — | 0.86 |
| Peloton Interactive Inc | (1,708) | (208,957) | — | 1.48 |
| Q2 Holdings Inc | (1,150) | (140,700) | — | 1.00 |
| Redfin Corp | (847) | (103,643) | — | 0.74 |
| Revance Therapeutics Inc | (279) | (34,158) | — | 0.24 |
The notes to the financial statements are an integral part of, and should be read in conjunction with, the financial statements.
33
Portfolio of Investments December 31, 2023†^ (continued)
| Security Description | Shares | Notional Value | Unrealized Appreciation/
Depreciation | Percent of
Basket Net Assets |
| RingCentral Inc | (2,253) | (275,703) | — | 1.96 |
| Rivian Automotive Inc | (6,577) | (804,733) | — | 5.71 |
| Royal Caribbean Cruises Ltd | (9,809) | (1,200,285) | — | 8.51 |
| Scotts Miracle-Gro Co/The | (1,547) | (189,305) | — | 1.34 |
| Spirit AeroSystems Holdings Inc | (1,268) | (155,128) | — | 1.10 |
| Spirit Airlines Inc | (727) | (88,921) | — | 0.63 |
| Sweetgreen Inc | (751) | (91,894) | — | 0.65 |
| TG Therapeutics Inc | (2,246) | (274,776) | — | 1.95 |
| Twist Bioscience Corp | (1,726) | (211,232) | — | 1.50 |
| Vistra Corp | (4,568) | (558,905) | — | 3.96 |
| Warner Bros Discovery Inc | (3,807) | (465,808) | — | 3.30 |
| Wix.com Ltd | (2,414) | (295,317) | — | 2.10 |
| Wolfspeed Inc | (2,872) | (351,419) | — | 2.49 |
| WW International Inc | (1,200) | (146,809) | — | 1.04 |
| Wynn Resorts Ltd | (4,478) | (547,952) | — | 3.89 |
| Xerox Holdings Corp | (813) | (99,479) | — | 0.71 |
| 1. | As of December 31, 2023, cash in the amount $1,000,000 was pledged to brokers for OTC swap contracts. |
| 2. | Portfolio pays the floating rate and receives the total return of the reference entity. |
| 3. | Notional amounts reflected as a positive value indicate a long position held by the Portfolio or Index and a negative value indicates a short position. |
| 4. | Reflects the value at reset date as of December 31, 2023. |
| Abbreviation(s): |
| EAFE—Europe, Australasia and Far East |
| ETF—Exchange-Traded Fund |
| FEDF—Federal Funds Rate |
| FTSE—Financial Times Stock Exchange |
| MSCI—Morgan Stanley Capital International |
The following is a summary of the fair valuations according to the inputs used as of December 31, 2023, for valuing the Portfolio’s assets:
| Description | Quoted
Prices in
Active
Markets for
Identical
Assets
(Level 1) | | Significant
Other
Observable
Inputs
(Level 2) | | Significant
Unobservable
Inputs
(Level 3) | | Total |
| Asset Valuation Inputs | | | | | | | |
| Investments in Securities (a) | | | | | | | |
| Affiliated Investment Companies | | | | | | | |
| Equity Funds | $ 447,208,496 | | $ — | | $ — | | $ 447,208,496 |
| Fixed Income Funds | 257,008,816 | | — | | — | | 257,008,816 |
| Total Affiliated Investment Companies | 704,217,312 | | — | | — | | 704,217,312 |
| Short-Term Investment | | | | | | | |
| Affiliated Investment Company | 73,467,114 | | — | | — | | 73,467,114 |
| Total Investments in Securities | $ 777,684,426 | | $ — | | $ — | | $ 777,684,426 |
| (a) | For a complete listing of investments, see the Portfolio of Investments. |
The notes to the financial statements are an integral part of, and should be read in conjunction with, the financial statements.
| 34 | MainStay VP Moderate Allocation Portfolio |
Statement of Assets and Liabilities as of December 31, 2023
| Assets |
Investment in affiliated investment companies, at value
(identified cost $789,508,280) | $777,684,426 |
| Cash | 1,000,000 |
| Cash collateral on deposit at broker for swap contracts | 1,000,000 |
| Receivables: | |
| Dividends and interest on OTC swaps contracts | 1,283,821 |
| Dividends | 867,814 |
| Portfolio shares sold | 91,793 |
| Other assets | 12,207 |
| Total assets | 781,940,061 |
| Liabilities |
| Payables: | |
| Portfolio shares redeemed | 652,749 |
| NYLIFE Distributors (See Note 3) | 154,255 |
| Custodian | 23,208 |
| Professional fees | 21,995 |
| Shareholder communication | 4,838 |
| Accrued expenses | 1,729 |
| Total liabilities | 858,774 |
| Net assets | $781,081,287 |
| Composition of Net Assets |
| Shares of beneficial interest outstanding (par value of $.001 per share) unlimited number of shares authorized | $ 82,291 |
| Additional paid-in-capital | 849,085,535 |
| | 849,167,826 |
| Total distributable earnings (loss) | (68,086,539) |
| Net assets | $781,081,287 |
| Initial Class | |
| Net assets applicable to outstanding shares | $ 46,889,449 |
| Shares of beneficial interest outstanding | 4,890,175 |
| Net asset value per share outstanding | $ 9.59 |
| Service Class | |
| Net assets applicable to outstanding shares | $734,191,838 |
| Shares of beneficial interest outstanding | 77,400,582 |
| Net asset value per share outstanding | $ 9.49 |
The notes to the financial statements are an integral part of, and should be read in conjunction with, the financial statements.
35
Statement of Operations for the year ended December 31, 2023
| Investment Income (Loss) |
| Income | |
| Dividend distributions from affiliated investment companies | $ 20,510,335 |
| Expenses | |
| Distribution/Service—Service Class (See Note 3) | 1,880,954 |
| Professional fees | 82,754 |
| Custodian | 45,753 |
| Trustees | 20,853 |
| Shareholder communication | 5,713 |
| Miscellaneous | 22,495 |
| Total expenses | 2,058,522 |
| Net investment income (loss) | 18,451,813 |
| Realized and Unrealized Gain (Loss) |
| Net realized gain (loss) on: | |
| Affiliated investment company transactions | (27,871,758) |
| Realized capital gain distributions from affiliated investment companies | 12,810,040 |
| Swap transactions | (10,759,266) |
| Net realized gain (loss) | (25,820,984) |
Net change in unrealized appreciation (depreciation) on:
Affiliated investments companies | 102,074,677 |
| Net realized and unrealized gain (loss) | 76,253,693 |
| Net increase (decrease) in net assets resulting from operations | $ 94,705,506 |
The notes to the financial statements are an integral part of, and should be read in conjunction with, the financial statements.
| 36 | MainStay VP Moderate Allocation Portfolio |
Statements of Changes in Net Assets
for the years ended December 31, 2023 and December 31, 2022
| | 2023 | 2022 |
| Increase (Decrease) in Net Assets |
| Operations: | | |
| Net investment income (loss) | $ 18,451,813 | $ 14,965,942 |
| Net realized gain (loss) | (25,820,984) | 41,896,923 |
| Net change in unrealized appreciation (depreciation) | 102,074,677 | (203,014,624) |
| Net increase (decrease) in net assets resulting from operations | 94,705,506 | (146,151,759) |
| Distributions to shareholders: | | |
| Initial Class | (3,448,370) | (7,194,477) |
| Service Class | (54,805,347) | (127,271,222) |
| Total distributions to shareholders | (58,253,717) | (134,465,699) |
| Capital share transactions: | | |
| Net proceeds from sales of shares | 39,724,561 | 44,680,512 |
| Net asset value of shares issued to shareholders in reinvestment of distributions | 58,253,717 | 134,465,699 |
| Cost of shares redeemed | (173,149,082) | (153,174,796) |
| Increase (decrease) in net assets derived from capital share transactions | (75,170,804) | 25,971,415 |
| Net increase (decrease) in net assets | (38,719,015) | (254,646,043) |
| Net Assets |
| Beginning of year | 819,800,302 | 1,074,446,345 |
| End of year | $ 781,081,287 | $ 819,800,302 |
The notes to the financial statements are an integral part of, and should be read in conjunction with, the financial statements.
37
Financial Highlights selected per share data and ratios
| | Year Ended December 31, |
| Initial Class | 2023 | | 2022 | | 2021 | | 2020 | | 2019 |
| Net asset value at beginning of year | $ 9.22 | | $ 12.84 | | $ 11.99 | | $ 11.32 | | $ 10.33 |
| Net investment income (loss) (a) | 0.25 | | 0.21 | | 0.23 | | 0.20 | | 0.23 |
| Net realized and unrealized gain (loss) | 0.88 | | (2.06) | | 1.11 | | 1.07 | | 1.60 |
| Total from investment operations | 1.13 | | (1.85) | | 1.34 | | 1.27 | | 1.83 |
| Less distributions: | | | | | | | | | |
| From net investment income | (0.31) | | (0.43) | | (0.15) | | (0.29) | | (0.36) |
| From net realized gain on investments | (0.45) | | (1.34) | | (0.34) | | (0.31) | | (0.48) |
| Total distributions | (0.76) | | (1.77) | | (0.49) | | (0.60) | | (0.84) |
| Net asset value at end of year | $ 9.59 | | $ 9.22 | | $ 12.84 | | $ 11.99 | | $ 11.32 |
| Total investment return (b) | 13.01% | | (13.69)% | | 11.37% | | 11.57% | | 18.29% |
| Ratios (to average net assets)/Supplemental Data: | | | | | | | | | |
| Net investment income (loss) | 2.59% | | 1.91% | | 1.81% | | 1.83% | | 2.04% |
| Net expenses (c) | 0.02% | | 0.02% | | 0.02% | | 0.03% | | 0.03% |
| Portfolio turnover rate | 23% | | 31% | | 27% | | 31% | | 40% |
| Net assets at end of year (in 000's) | $ 46,889 | | $ 43,783 | | $ 53,604 | | $ 48,025 | | $ 45,283 |
| (a) | Per share data based on average shares outstanding during the year. |
| (b) | Total return does not reflect any deduction of sales charges, mortality and expense charges, contract charges or administrative charges. For periods of less than one year, total return is not annualized. |
| (c) | In addition to the fees and expenses which the Portfolio bears directly, it also indirectly bears a pro-rata share of the fees and expenses of the underlying funds in which it invests. Such indirect expenses are not included in the above expense ratios. |
| | Year Ended December 31, |
| Service Class | 2023 | | 2022 | | 2021 | | 2020 | | 2019 |
| Net asset value at beginning of year | $ 9.12 | | $ 12.72 | | $ 11.88 | | $ 11.22 | | $ 10.23 |
| Net investment income (loss) (a) | 0.22 | | 0.18 | | 0.19 | | 0.17 | | 0.20 |
| Net realized and unrealized gain (loss) | 0.88 | | (2.05) | | 1.11 | | 1.06 | | 1.60 |
| Total from investment operations | 1.10 | | (1.87) | | 1.30 | | 1.23 | | 1.80 |
| Less distributions: | | | | | | | | | |
| From net investment income | (0.28) | | (0.39) | | (0.12) | | (0.26) | | (0.33) |
| From net realized gain on investments | (0.45) | | (1.34) | | (0.34) | | (0.31) | | (0.48) |
| Total distributions | (0.73) | | (1.73) | | (0.46) | | (0.57) | | (0.81) |
| Net asset value at end of year | $ 9.49 | | $ 9.12 | | $ 12.72 | | $ 11.88 | | $ 11.22 |
| Total investment return (b) | 12.73% | | (13.91)% | | 11.10% | | 11.29% | | 18.00% |
| Ratios (to average net assets)/Supplemental Data: | | | | | | | | | |
| Net investment income (loss) | 2.30% | | 1.63% | | 1.51% | | 1.52% | | 1.76% |
| Net expenses (c) | 0.27% | | 0.27% | | 0.27% | | 0.28% | | 0.27% |
| Portfolio turnover rate | 23% | | 31% | | 27% | | 31% | | 40% |
| Net assets at end of year (in 000's) | $ 734,192 | | $ 776,017 | | $ 1,020,842 | | $ 1,037,900 | | $ 1,102,149 |
| (a) | Per share data based on average shares outstanding during the year. |
| (b) | Total return does not reflect any deduction of sales charges, mortality and expense charges, contract charges or administrative charges. For periods of less than one year, total return is not annualized. |
| (c) | In addition to the fees and expenses which the Portfolio bears directly, it also indirectly bears a pro-rata share of the fees and expenses of the underlying funds in which it invests. Such indirect expenses are not included in the above expense ratios. |
The notes to the financial statements are an integral part of, and should be read in conjunction with, the financial statements.
| 38 | MainStay VP Moderate Allocation Portfolio |
MainStay VP Growth Allocation Portfolio
Investment and Performance Comparison (Unaudited)
Performance data quoted represents past performance. Past performance is no guarantee of future results. Because of market volatility and other factors, current performance may be lower or higher than the figures shown. Investment return and principal value will fluctuate, and as a result, when shares are redeemed, they may be worth more or less than their original cost. The performance table and graph do not reflect any deduction of sales charges, mortality and expense charges, contract charges or administrative charges. Please refer to the Performance Summary appropriate for your policy. For performance information current to the most recent month-end, please call 800-598-2019 or visit www.newyorklife.com.
Performance figures may reflect certain fee waivers and/or expense limitations, without which total returns may have been different. For information on current fee waivers and/or expense limitations (if any), please refer to the Notes to Financial Statements.
| Average Annual Total Returns for the Year-Ended December 31, 2023 |
| Class | Inception
Date | One
Year | Five
Years | Ten
Years | Gross
Expense
Ratio1 |
| Initial Class Shares | 2/13/2006 | 15.49% | 9.47% | 6.22% | 0.58% |
| Service Class Shares | 2/13/2006 | 15.20 | 9.20 | 5.96 | 0.83 |
| 1. | The gross expense ratios presented reflect the Portfolio’s “Total Annual Portfolio Operating Expenses” from the most recent Prospectus and may differ from other expense ratios disclosed in this report. |
The footnotes on the next page are an integral part of the table and graph and should be carefully read in conjunction with them.
| Benchmark Performance* | One
Year | Five
Years | Ten
Years |
| S&P 500® Index1 | 26.29% | 15.69% | 12.03% |
| MSCI EAFE® Index (Net)2 | 18.24 | 8.16 | 4.28 |
| Bloomberg U.S. Aggregate Bond Index3 | 5.53 | 1.10 | 1.81 |
| Growth Allocation Composite Index4 | 20.36 | 11.39 | 8.56 |
| Morningstar Moderately Aggressive Allocation Category Average5 | 15.36 | 9.17 | 6.58 |
| * | Returns for indices reflect no deductions for fees, expenses or taxes, except for foreign withholding taxes where applicable. Results assume reinvestment of all dividends and capital gains. An investment cannot be made directly in an index. |
| 1. | The S&P 500® Index is the Portfolio's primary benchmark. S&P 500® is a trademark of The McGraw-Hill Companies, Inc. The S&P 500® Index is widely regarded as the standard index for measuring large-cap U.S. stock market performance. |
| 2. | The MSCI EAFE® Index (Net) is the Portfolio's secondary benchmark. The MSCI EAFE® Index (Net) consists of international stocks representing the developed world outside of North America. |
| 3. | The Portfolio has selected the Bloomberg U.S. Aggregate Bond Index as an additional benchmark. The Bloomberg U.S. Aggregate Bond Index is a broad-based benchmark that measures the performance of the investment grade, U.S. dollar-denominated, fixed-rate taxable bond market, including Treasuries, government-related and corporate securities, mortgage-backed securities (agency fixed-rate and hybrid adjustable rate mortgage pass-throughs), asset-backed securities, and commercial mortgage-backed securities. |
| 4. | The Portfolio has selected the Growth Allocation Composite Index as an additional benchmark. Effective February 28, 2014, the Growth Allocation Composite Index consists of the S&P 500® Index, the MSCI EAFE® Index (Net) and the Bloomberg U.S. Aggregate Bond Index weighted 60%, 20% and 20%, respectively. Prior to February 28, 2014, the Growth Allocation Composite Index consisted of the S&P 500® Index, the MSCI EAFE® Index (Net) and the Bloomberg U.S. Aggregate Bond Index weighted 65%, 15% and 20%, respectively. |
| 5. | The Morningstar Moderately Aggressive Allocation Category Average is representative of funds in allocation categories that seek to provide both income and capital appreciation by primarily investing in multiple asset classes, including stocks, bonds, and cash. These moderately aggressive strategies prioritize capital appreciation over preservation. They typically expect volatility similar to a strategic equity exposure between 70% and 85%. Results are based on average total returns of similar funds with all dividends and capital gain distributions reinvested. |
The footnotes on the preceding page are an integral part of the table and graph and should be carefully read in conjunction with them.
| 40 | MainStay VP Growth Allocation Portfolio |
Cost in Dollars of a $1,000 Investment in MainStay VP Growth Allocation Portfolio (Unaudited)
The example below is intended to describe the fees and expenses borne by shareholders during the six-month period from July 1, 2023 to December 31, 2023, and the impact of those costs on your investment.
Example
As a shareholder of the Portfolio you incur two types of costs: (1) transaction costs, including exchange fees and sales charges (loads) on purchases (as applicable), and (2) ongoing costs, including management fees, distribution and/or service (12b-1) fees and other Portfolio expenses (as applicable). This example is intended to help you understand your ongoing costs (in dollars) of investing in the Portfolio and to compare these costs with the ongoing costs of investing in other mutual funds. The example is based on an investment of $1,000 made at the beginning of the six-month period and held for the entire period from July 1, 2023 to December 31, 2023. Shares are only sold in connection with variable life and annuity contracts and the example does not reflect any contract level or transactional fees or expenses. If these costs had been included, your costs would have been higher.
This example illustrates your Portfolio’s ongoing costs in two ways:
Actual Expenses
The second and third data columns in the table below provide information about actual account values and actual expenses. You may use the information in these columns, together with the amount you invested, to estimate the expenses that you paid during the six months ended
December 31, 2023. Simply divide your account value by $1,000 (for example, an $8,600 account value divided by $1,000 = 8.6), then multiply the result by the number under the heading entitled “Expenses Paid During Period” to estimate the expenses you paid on your account during this period.
Hypothetical Example for Comparison Purposes
The fourth and fifth data columns in the table below provide information about hypothetical account values and hypothetical expenses based on the Portfolio’s actual expense ratio and an assumed rate of return of 5% per year before expenses, which is not the Portfolio’s actual return. The hypothetical account values and expenses may not be used to estimate the actual ending account balances or expenses you paid for the six-month period shown. You may use this information to compare the ongoing costs of investing in the Portfolio with the ongoing costs of investing in other mutual funds. To do so, compare this 5% hypothetical example with the 5% hypothetical examples that appear in the shareholder reports of the other mutual funds.
Please note that the expenses shown in the table are meant to highlight your ongoing costs only and do not reflect any transactional costs, such as exchange fees or sales charges (loads). Therefore, the fourth and fifth data columns of the table are useful in comparing ongoing costs only and will not help you determine the relative total costs of owning different funds. In addition, if these transactional costs were included, your costs would have been higher.
| Share Class | Beginning
Account
Value
7/1/23 | Ending Account
Value (Based
on Actual
Returns and
Expenses)
12/31/23 | Expenses
Paid
During
Period1 | Ending Account
Value (Based
on Hypothetical
5% Annualized
Return and
Actual Expenses)
12/31/23 | Expenses
Paid
During
Period1 | Net Expense
Ratio
During
Period2 |
| Initial Class Shares | $1,000.00 | $1,064.60 | $0.10 | $1,025.10 | $0.10 | 0.02% |
| Service Class Shares | $1,000.00 | $1,063.30 | $1.40 | $1,023.84 | $1.38 | 0.27% |
| 1. | Expenses are equal to the Portfolio’s annualized expense ratio of each class multiplied by the average account value over the period, divided by 365 and multiplied by 184 (to reflect the six-month period). The table above represents the actual expenses incurred during the six-month period. In addition to the fees and expenses which the Portfolio bears directly, it also indirectly bears a pro rata share of the fees and expenses of the underlying Portfolios/Funds in which it invests. Such indirect expenses are not included in the above-reported expense figures. |
| 2. | Expenses are equal to the Portfolio's annualized expense ratio to reflect the six-month period. |
Asset Diversification as of December 31, 2023 (Unaudited)
| Equity Funds | 77.5% |
| Fixed Income Funds | 12.8 |
| Short-Term Investment | 9.2 |
| Other Assets, Less Liabilities | 0.5 |
See Portfolio of Investments beginning on page 47 for specific holdings within these categories. The Portfolio’s holdings are subject to change.
| 42 | MainStay VP Growth Allocation Portfolio |
Portfolio Management Discussion and Analysis (Unaudited)
Answers to the questions reflect the views of portfolio managers Jae S. Yoon, CFA, Jonathan Swaney, Poul Kristensen, CFA, and Amit Soni, CFA, of New York Life Investments,1 the Portfolio’s Manager.
How did MainStay VP Growth Allocation Portfolio perform relative to its benchmarks and peers during the 12 months ended December 31, 2023?
For the 12 months ended December 31, 2023, MainStay VP Growth Allocation Portfolio returned 15.49% for Initial Class shares and 15.20% for Service Class shares. Over the same period, both share classes underperformed the 26.29% return of the S&P 500® Index, which is the Portfolio’s primary benchmark, and the 18.24% return of the MSCI EAFE® Index (Net), which is a secondary benchmark of the Portfolio. For the 12 months ended December 31, 2023, both share classes outperformed the 5.53% return of the Bloomberg U.S. Aggregate Bond Index and underperformed the 20.36% return of the Growth Allocation Composite Index, which are additional benchmarks of the Portfolio. Over the same period, Initial Class shares outperformed, and Service Class shares underperformed, the 15.36% return of the Morningstar Moderately Aggressive Allocation Category Average.2
What factors affected the Portfolio’s relative performance during the reporting period?
The Portfolio is a “fund of funds,” meaning that it seeks to achieve its investment objective by investing primarily in mutual funds and exchange-traded funds (“ETFs”) managed by New York Life Investments or its affiliates (the “Underlying Portfolios/Funds”). The Portfolio will generally invest in Underlying Portfolios of MainStay VP Funds Trust unless such Portfolio in a particular asset class (or subasset class) is deemed by the portfolio managers to be unavailable. The Underlying Portfolios/Funds may invest in U.S. equities, international equities and fixed-income instruments, making comparisons to any single index generally less suitable than a weighted combination of indices, which is a more useful yardstick by which to measure performance. The Portfolio’s management internally maintains a blend of indices that are taken into consideration when managing the Portfolio. During the reporting period, the Portfolio substantially underperformed this internally maintained blend of indices, primarily due to active positioning at the asset class level.
Management of the Portfolio’s stock/bond blend itself was not the primary issue affecting the Portfolio’s relative performance, as returns generated in the process of controlling that mix were only marginally negative. We held the Portfolio’s stock/bond allocation near neutral for much of the reporting period, but with a small bias toward holding underweight exposure to equities. That proved a liability through the spring and early summer of 2023, as a handful of mega-cap technology-related equities drove the market higher.
Rather, the most significant factor undermining relative performance related to positioning within asset classes, primarily equities, with the Portfolio’s exposure to small-cap stocks detracting substantially from returns. Throughout the reporting period, relative valuations in the small-cap asset class were much more attractive than has been the historical norm; however, small companies are significantly more sensitive to changes in bank financing conditions than are large companies that can issue bonds. Fast-rising costs on bank loans, coupled with concerns about future credit availability in the wake of the bank crisis that occurred in the early spring of 2023, weighed heavily on that end of the capitalization spectrum. We promptly restored the Portfolio’s small-cap allocation to neutral as the nature and scope of the crisis became clear.
Relative returns also suffered from efforts to avoid undue exposure to a small group of market-leading, mega-cap, technology-related companies. Recently dubbed ‘the Magnificent 7’ (Alphabet, Amazon, Apple, Meta Platforms, Microsoft, NVIDIA, and Tesla), these firms are richly valued, implying rapid earnings growth in the coming years. We remain skeptical that such growth is likely to be achieved by these companies, which are already among the largest enterprises in the world, with dominant positions in their respective industries. Accordingly, we shifted Portfolio assets out of capitalization-weighted large-cap index products, favoring other options—most notably, an equally weighted version of the S&P 500®. During the reporting period, however, ongoing enthusiasm for the commercial potential of artificial intelligence (“AI”), and the degree to which the Magnificent 7 are expected to benefit from such developments, helped these companies maintain their leadership positions. During the reporting period, the Bloomberg Magnificent 7 Price Return Index returned approximately 107%, compared to the more modest 14% return for the equally weighted S&P 500®.
Tilts favoring defensive sectors, particularly health care, and low volatility stocks, further detracted from the Portfolio’s active returns. Basically, any skew in the Portfolio away from the sole winners of the reporting period—mega-cap tech-oriented companies—was a drag on relative results.
The Portfolio realized some positive results within equities. Tactical trading in gold miners, for example, proved helpful. The Portfolio also benefited from a bias favoring an emerging-markets equity strategy that excluded China, reflecting our concerns regarding China’s ongoing property market turmoil, high debt levels, regulatory overreach and simmering tensions with the West,
The fixed-income portion of the Portfolio neither contributed positively to, nor detracted from, active return. (Contributions take weightings and total returns into account.) The Portfolio gave up a little ground due to underweight exposure to bank loans. We
| 1. | “New York Life Investments” is a service mark used by New York Life Investment Management Holdings LLC and its subsidiary New York Life Investment Management LLC. |
| 2. | See "Investment and Performance Comparison" for more information on benchmark and peer group returns. |
expected that defaults would rise considerably in the bank loan space as economic activity slowed, but the anticipated slowdown failed to materialize during the reporting period. That shortfall was offset through duration3 management, as we extended the Portfolio’s duration during the fall as yields rose, and then reduced duration as yields declined into year-end.
During the reporting period, how was the Portfolio’s performance materially affected by investments in derivatives?
Total return swaps were used to express most of the Portfolio’s asset class policy views. Therefore, the swaps can be seen as detracting from the Portfolio’s relative performance over the course of the reporting period.
How did you allocate the Portfolio’s assets during the reporting period and why?
Stock/bond blend: We held equity exposure within the Portfolio relatively close to neutral during the reporting period. We are generally reluctant to position the Portfolio with underweight equity exposure, as stocks tend to perform well over time and anticipating drawdowns is challenging. Conversely, we are happy to lean into equities when we believe they are well-supported fundamentally or when a correction has run further than we believe appropriate. Nevertheless, we shifted the Portfolio’s equity position to slightly underweight following a sharp rally in January 2023, and enlarged the underweight posture a little further late in the spring when the banking sector turmoil appeared to increase the likelihood of a recession. As the recession failed to materialize, we gradually removed the underweight equity exposure over the course of the summer and into the fall, eventually moving to a slightly overweight equity position, before pulling back to neutral during the subsequent rally in stocks.
Duration: After an extended period of holding a short duration position, we shifted the Portfolio to a neutral position in the spring of 2023, in expectation of an impending recession. We extended the Portfolio’s duration further in the summer and fall as yields rose, presumably in response to heavy new Treasury issuance, “higher for longer” monetary policy prospects, stubborn inflationary pressures, and rising yields abroad. Reflecting our view that yields would come back down as inflation continued to cool and an inflection in Fed policy came into sight, we increased the Portfolio’s duration to slightly more than six months long by the end of October. The yield on the 10-year Treasury note did indeed fall back, dropping from roughly 5% to 4%, and we trimmed the Portfolio’s duration as it did so, ending the reporting period very close to neutral.
Equity style: Growth stocks, by definition, exhibit richer valuations than value stock. As a consequence, growth stock prices are relatively reliant on distant profits, and are often more sensitive to elevated inflation and higher interest rates than their value-oriented counterparts. Accordingly, given the high-rate environment that prevailed during the reporting period, we persistently tilted the Portfolio to emphasize value stocks that offered more substantial near-term cash flows. In particular, we focused on defensive, lower-volatility sectors, including utilities, consumer staples and—most of all—health care. This position undermined results in 2023, as market performance was dominated by the aforementioned Magnificent 7—growth-oriented technology-related stocks, swept by a wave of excitement over the prospects for generative AI.
Equity size: The Portfolio held overweight exposure to small-cap stocks during the first half of the reporting period. We based our thesis on several prevailing characteristics of the asset class: attractive valuations, insulation from economic weakness abroad, less sensitivity to dollar strength and disproportionate exposure to domestic demand–which thus far remains robust. That position proved unconstructive during the spring of 2023, as small companies tend to be heavily dependent on bank financing, and banks aggressively tightened lending standards in the wake of the banking crisis that occurred in March and April. Accordingly, we unwound the Portfolio’s small-cap bias. However, it is important to note that the proceeds did not flow to large blend index exposure, where the Magnificent 7 dominate. Rather, the redirected assets went to an equally weighted version of the S&P 500®, where those seven names comprise less than 2% of the index.
Geographic exposure: During the reporting period, European equities appeared vulnerable. We expected that persistently high wage growth would compel the European Central Bank to maintain its restrictive monetary policies for an extended period of time while European export-heavy economies wrestled with declining global trade volumes. In addition, Europe appear particularly exposed to potential energy price spikes amid elevated geopolitical tensions. On the other hand, the Bank of Japan remained engaged in accommodative policy, Japanese exports benefited from a weak yen, and shareholder governance was increasingly prioritized by Japanese companies, largely in the form of share buybacks. Given these divergent conditions, we tilted the Portfolio away from European markets in favor of Japanese stocks, while holding net exposure to non-U.S. stocks close to neutral. With prospects for Chinese equities looking somewhat dim, we tilted the Portfolio toward other faster-growing economies within the emerging-markets complex.
| 3. | Duration is a measure of the price sensitivity of a fixed-income investment to changes in interest rates. Duration is expressed as a number of years and is considered a more accurate sensitivity gauge than average maturity. |
| 44 | MainStay VP Growth Allocation Portfolio |
Energy and natural resources: The Portfolio maintained exposure to upstream energy producers and oilfield/gas field service providers as a commodity play to provide an additional inflation hedge. These holdings also positioned the Portfolio to take advantage of opportunities for domestic producers to benefit as Western nations revisit energy policy to source supplies from stable and friendly jurisdictions rather than autocratic petrostates that present national security risks. The Portfolio’s small, but volatile, energy position had a disproportionate impact on the Portfolio’s short-term performance month by month, but little impact on overall performance for the entire year. The Portfolio also added exposure to uranium miners during the reporting period. With numerous reactors planned, under construction, or being put back into service after an earlier shutoff, we expect nuclear energy production to grow significantly in the years ahead, driving the need for additional uranium production and creating opportunities for miners and processors.
How did the Portfolio’s allocations change over the course of the reporting period?
In one of the more substantial changes in allocations undertaken during the reporting period, we reduced the Portfolio’s exposure to small-cap stocks, expressed via total return swaps. We took this action in response to the banking crisis that unfolded in the spring of 2023. Other changes included a reduction in the Portfolio’s holdings of MainStay VP Floating Rate Portfolio, thereby decreasing exposure to lower-credit-quality fixed-income instruments ahead of an expected recession. We unwound the Portfolio’s swap exposure to the S&P 500 Health Care Sector in favor of other defensive positions, including Invesco S&P 500 Low Volatility ETF. We unwound swap exposure to VanEck Gold Miners ETF, taking gains and exiting a profitable trade on a high note. Lastly, we used swaps to tilt the Portfolio away from baskets of specific stocks that were either heavily dependent on floating-rate loans (such as Uber, United Airlines and Carnival) or that generated insufficient operating income to retire debt as it came due (so-called ‘zombie’ companies, such as Royal Caribbean, Wynn Resorts and Rivian). We believed these firms were especially vulnerable in an environment of fast-rising interest rates and tightening lending standards.
New or increased allocations included, first and foremost, the establishment and growth of an allocation to Invesco S&P 500® Equal Weight ETF, funded in part from cash. We adopted this position to remove the Portfolio’s underweight exposure to equities without significantly increasing its exposure to the Magnificent 7. We increased the Portfolio’s exposure to iShares 20+ Year Treasury Bond ETF, which we used to extend the Portfolio’s duration as bond yields rose. We also initiated a new Portfolio position in iShares MSCI Japan ETF (via a swap) because
we saw valuations as attractive, export conditions as favorable and the Japanese yen as likely to appreciate should the Bank of Japan abandon its existing yield curve4 control policy. Another notable addition involved the establishment of exposure to Global X Uranium ETF, which invests primarily in uranium mining firms. Climate change concerns, net-zero commitments and the limitations of renewable energy are driving a reconsideration of nuclear energy, for which fuel supply is rather limited. We foresee a supply/demand imbalance developing that is likely to support businesses involved with extracting and processing uranium. We also opened a position in a swap providing access to the IQ CBRE NextGen Real Estate ETF, providing a toehold in the digital infrastructure space.
At the Underlying Fund level, the Portfolio took advantage of a few new investment options, adopting a position in IQ MacKay ESG High Income ETF, funded from MainStay VP MacKay High Yield Corporate Bond Portfolio. Other holdings in newly available Underlying Equity Funds included MainStay PineStone U.S. Equity Fund, IQ Candriam U.S. Mid Cap Equity ETF and MainStay Fiera SMID Growth Fund. Departing the Portfolio was IQ U.S. Large Cap ETF, which was liquidated in December.
During the reporting period, which Underlying Equity Portfolios/Funds had the highest total returns and which had the lowest total returns?
The Portfolio’s top-performing Underlying Equity Funds that were held for the entire reporting period included MainStay VP Winslow Large Cap Growth Portfolio, MainStay VP Wellington Growth Portfolio and IQ Candriam U.S. Equity ETF. The worst-performing positions (all of which produced positive returns) included Invesco S&P 500 Low Volatility ETF, MainStay VP PineStone International Equity Portfolio (previously MainStay VP MacKay International Equity Portfolio) and MainStay VP Candriam Emerging Markets Equity Portfolio.
Which Underlying Equity Portfolios/Funds were the strongest positive contributors to the Portfolio’s performance and which Underlying Equity Portfolios/Funds were particularly weak?
The strongest positive contributions to performance came from MainStay VP Winslow Large Cap Growth Portfolio, MainStay VP Wellington Growth Portfolio and IQ Candriam U.S. Equity ETF. The direct Portfolio holdings that contributed least to returns included MainStay Epoch Capital Growth Fund, IQ CBRE NextGen Real Estate ETF and MainStay VP PineStone International Equity Portfolio (previously MainStay VP MacKay International Equity Portfolio). The Portfolio experienced losses from some swap positions in which we paid the return to the Russell 2000 Index, the Russell 1000 Growth Index and the MSCI EAFE Index.
| 4. | The yield curve is a line that plots the yields of various securities of similar quality—typically U.S. Treasury issues—across a range of maturities. The U.S. Treasury yield curve serves as a benchmark for other debt and is used in economic forecasting. |
What factors and risks affected the Portfolio’s Underlying Fixed-Income Portfolio/Fund investments during the reporting period?
As discussed above, interest rates were driven by high, but moderating, inflation and tight monetary policy, with rising expectations that monetary policy would be relaxed in 2024. Spreads5 were influenced by the resilience of the economy and expectations of a more accommodative policy environment ahead.
During the reporting period, which fixed-income market segments were the strongest positive contributors to the Portfolio’s performance and which segments were particularly weak?
Lower quality securities—from bank loans to high yield bonds—generally fared best. They enjoyed positive carry compared to higher quality debt, spreads were mostly stable, and default rates were not yet elevated.
Which Underlying Fixed-Income Portfolios/Funds made the strongest positive contributions to the Portfolio’s performance, and which Underlying Fixed-Income Portfolios/Funds were the greatest detractors?
The largest contributors to the Portfolio’s absolute returns came from cash holdings and positions in MainStay VP Floating Rate Portfolio and MainStay MacKay Short Duration High Yield Fund. No fixed-income position produced negative returns. The smallest positive contributions to Portfolio performance came from MainStay VP Bond Portfolio, MainStay MacKay U.S. Infrastructure Bond Fund and IQ MacKay ESG Core Plus Bond ETF.
| 5. | The terms “spread” and “yield spread” may refer to the difference in yield between a security or type of security and comparable U.S. Treasury issues. The terms may also refer to the difference in yield between two specific securities or types of securities at a given time. |
The opinions expressed are those of the portfolio managers as of the date of this report and are subject to change. There is no guarantee that any forecasts will come to pass. This material does not constitute investment advice and is not intended as an endorsement of any specific investment.
Not all MainStay VP Portfolios and/or share classes are available under all policies.
| 46 | MainStay VP Growth Allocation Portfolio |
Portfolio of Investments December 31, 2023†^
| | Shares | Value |
| Affiliated Investment Companies 90.3% |
| Equity Funds 77.5% |
| IQ 500 International ETF (a) | 1,212,946 | $ 39,761,947 |
| IQ Candriam International Equity ETF (a) | 1,433,410 | 40,063,809 |
| IQ Candriam U.S. Large Cap Equity ETF (a) | 1,321,883 | 55,505,867 |
| IQ Candriam U.S. Mid Cap Equity ETF (a) | 1,414,665 | 42,599,666 |
| IQ CBRE NextGen Real Estate ETF (a) | 1,367,279 | 27,933,510 |
| IQ FTSE International Equity Currency Neutral ETF (a) | 985,910 | 24,519,582 |
| IQ U.S. Small Cap ETF (a) | 944,386 | 34,045,115 |
| MainStay Epoch Capital Growth Fund Class I | 315,529 | 4,405,953 |
| MainStay Epoch International Choice Fund Class I (a) | 810,438 | 32,296,111 |
| MainStay Fiera SMID Growth Fund Class R6 (a) | 2,635,250 | 43,725,119 |
| MainStay PineStone U.S. Equity Fund Class R6 (a) | 3,001,881 | 52,082,327 |
| MainStay VP American Century Sustainable Equity Portfolio Initial Class (a) | 5,617,117 | 50,219,269 |
| MainStay VP Candriam Emerging Markets Equity Portfolio Initial Class (a) | 6,278,633 | 43,672,286 |
| MainStay VP Epoch U.S. Equity Yield Portfolio Initial Class (a) | 2,731,032 | 45,276,959 |
| MainStay VP PineStone International Equity Portfolio Initial Class (a) | 3,038,508 | 32,596,808 |
| MainStay VP S&P 500 Index Portfolio Initial Class | 218,322 | 18,636,259 |
| MainStay VP Small Cap Growth Portfolio Initial Class (a) | 3,737,241 | 40,282,976 |
| MainStay VP Wellington Growth Portfolio Initial Class (a) | 2,304,450 | 56,331,116 |
| MainStay VP Wellington Mid Cap Portfolio Initial Class (a) | 5,069,491 | 42,720,097 |
| MainStay VP Wellington Small Cap Portfolio Initial Class (a) | 4,337,330 | 37,627,205 |
| MainStay VP Wellington U.S. Equity Portfolio Initial Class | 1,050,493 | 27,630,072 |
| MainStay VP Winslow Large Cap Growth Portfolio Initial Class (a) | 2,180,817 | 56,928,476 |
| MainStay WMC Enduring Capital Fund Class R6 (a) | 719,180 | 24,892,251 |
| MainStay WMC International Research Equity Fund Class I (a) | 4,460,784 | 32,380,830 |
| | Shares | | Value |
| |
| Equity Funds (continued) |
| MainStay WMC Value Fund Class R6 (a) | 1,427,913 | | $ 42,923,200 |
Total Equity Funds
(Cost $920,055,778) | | | 949,056,810 |
| Fixed Income Funds 12.8% |
| IQ MacKay ESG Core Plus Bond ETF | 253,456 | | 5,340,318 |
| IQ Mackay ESG High Income ETF (a) | 549,887 | | 14,604,999 |
| MainStay MacKay Short Duration High Yield Fund Class I | 3,332,654 | | 31,599,892 |
| MainStay Mackay U.S. Infrastructure Bond Fund Class R6 | 254,490 | | 1,932,753 |
| MainStay Short Term Bond Fund Class I (a) | 2,637,999 | | 24,075,166 |
| MainStay VP Bond Portfolio Initial Class | 2,681 | | 33,157 |
| MainStay VP Floating Rate Portfolio Initial Class (a) | 4,212,028 | | 36,164,055 |
| MainStay VP Indexed Bond Portfolio Initial Class (a) | 1,954,898 | | 17,063,330 |
| MainStay VP MacKay High Yield Corporate Bond Portfolio Initial Class | 1,606,030 | | 14,574,718 |
| MainStay VP PIMCO Real Return Portfolio Initial Class (a) | 1,559,229 | | 12,122,537 |
Total Fixed Income Funds
(Cost $157,100,318) | | | 157,510,925 |
Total Affiliated Investment Companies
(Cost $1,077,156,096) | | | 1,106,567,735 |
| Short-Term Investment 9.2% |
| Affiliated Investment Company 9.2% |
| MainStay U.S. Government Liquidity Fund, 5.235% (a)(b) | 112,555,559 | | 112,555,559 |
Total Short-Term Investment
(Cost $112,555,559) | 9.2% | | 112,555,559 |
Total Investments
(Cost $1,189,711,655) | 99.5% | | 1,219,123,294 |
| Other Assets, Less Liabilities | 0.5 | | 5,807,320 |
| Net Assets | 100.0% | | $ 1,224,930,614 |
| † | Percentages indicated are based on Portfolio net assets. |
| ^ | Industry classifications may be different than those used for compliance monitoring purposes. |
| (a) | As of December 31, 2023, the Portfolio's ownership exceeds 5% of the outstanding shares of the Underlying Portfolio's share class. |
The notes to the financial statements are an integral part of, and should be read in conjunction with, the financial statements.
47
Portfolio of Investments December 31, 2023†^ (continued)
| (b) | Current yield as of December 31, 2023. |
Investments in Affiliates (in 000's)
Investments in issuers considered to be affiliate(s) of the Portfolio during the year ended December 31, 2023 for purposes of Section 2(a)(3) of the Investment Company Act of 1940, as amended, were as follows:
| Affiliated Investment Companies | Value,
Beginning
of Year | Purchases
at Cost | Proceeds
from
Sales | Net
Realized
Gain/(Loss)
on Sales | Change in
Unrealized
Appreciation/
(Depreciation) | Value,
End of
Year | Dividend
Income | Other
Distributions | Shares
End of
Year |
| IQ 500 International ETF | $ 42,946 | $ 1,831 | $ (11,200) | $ 971 | $ 5,214 | $ 39,762 | $ 1,619 | $ — | 1,213 |
| IQ Candriam International Equity ETF | 42,781 | 1,168 | (8,901) | 2,210 | 2,806 | 40,064 | 1,255 | — | 1,433 |
| IQ Candriam U.S. Large Cap Equity ETF | 67,442 | 717 | (30,279) | 6,136 | 11,490 | 55,506 | 796 | — | 1,322 |
| IQ Candriam U.S. Mid Cap Equity ETF | — | 40,648 | (588) | 43 | 2,497 | 42,600 | 258 | — | 1,415 |
| IQ CBRE NextGen Real Estate ETF | — | 26,773 | (543) | 9 | 1,695 | 27,934 | 172 | — | 1,367 |
| IQ FTSE International Equity Currency Neutral ETF | 25,561 | 184 | (5,102) | 428 | 3,449 | 24,520 | 650 | — | 986 |
| IQ MacKay ESG Core Plus Bond ETF | 4,114 | 1,602 | (513) | 12 | 125 | 5,340 | 207 | — | 253 |
| IQ Mackay ESG High Income ETF | — | 15,133 | (963) | (9) | 444 | 14,605 | 686 | 11 | 550 |
| IQ U.S. Large Cap ETF | 59,698 | — | (63,396) | 15,585 | (11,887) | — | 775 | — | — |
| IQ U.S. Small Cap ETF | 44,173 | 3,157 | (17,668) | 2,311 | 2,072 | 34,045 | 555 | — | 944 |
| MainStay Epoch Capital Growth Fund Class I | 4,545 | 26 | (1,317) | (119) | 1,271 | 4,406 | 25 | 1 | 316 |
| MainStay Epoch International Choice Fund Class I | 33,905 | 1,028 | (8,155) | 257 | 5,261 | 32,296 | 547 | — | 810 |
| MainStay Fiera SMID Growth Fund Class R6 | — | 40,655 | (163) | 2 | 3,231 | 43,725 | — | 1,071 | 2,635 |
| MainStay MacKay Short Duration High Yield Fund Class I | 34,581 | 3,152 | (7,354) | (380) | 1,601 | 31,600 | 1,934 | — | 3,333 |
| MainStay Mackay U.S. Infrastructure Bond Fund Class R6 | — | 1,869 | — | — | 64 | 1,933 | 9 | — | 254 |
| MainStay PineStone U.S. Equity Fund Class R6 | — | 49,704 | — | — | 2,378 | 52,082 | 119 | 37 | 3,002 |
| MainStay Short Term Bond Fund Class I | — | 26,411 | (2,323) | (33) | 20 | 24,075 | 813 | — | 2,638 |
| MainStay U.S. Government Liquidity Fund | 126,767 | 274,644 | (288,855) | — | — | 112,556 | 5,908 | — | 112,556 |
| MainStay VP American Century Sustainable Equity Portfolio Initial Class | 63,735 | 18,039 | (27,104) | 148 | (4,599) | 50,219 | 661 | 16,846 | 5,617 |
| MainStay VP Bond Portfolio Initial Class | 3,901 | 270 | (4,063) | 59 | (134) | 33 | 104 | — | 3 |
| MainStay VP Candriam Emerging Markets Equity Portfolio Initial Class | 45,742 | 2,037 | (6,664) | (2,850) | 5,407 | 43,672 | 740 | — | 6,279 |
| MainStay VP Epoch U.S. Equity Yield Portfolio Initial Class | 61,208 | 5,249 | (21,034) | 2,427 | (2,573) | 45,277 | 1,276 | 3,056 | 2,731 |
| MainStay VP Floating Rate Portfolio Initial Class | 66,439 | 5,550 | (37,203) | (1,972) | 3,350 | 36,164 | 3,799 | — | 4,212 |
| MainStay VP Indexed Bond Portfolio Initial Class | 17,856 | 1,389 | (2,668) | 128 | 358 | 17,063 | 411 | — | 1,955 |
| MainStay VP MacKay High Yield Corporate Bond Portfolio Initial Class | 31,527 | 1,741 | (20,197) | (1,759) | 3,263 | 14,575 | 815 | — | 1,606 |
| MainStay VP PIMCO Real Return Portfolio Initial Class | 12,031 | 2,490 | (1,817) | 31 | (612) | 12,123 | 1,033 | — | 1,559 |
| MainStay VP PineStone International Equity Portfolio Initial Class (a) | 33,805 | 2,489 | (5,127) | (1,470) | 2,900 | 32,597 | — | — | 3,039 |
| MainStay VP S&P 500 Index Portfolio Initial Class | 19,459 | 581 | (5,409) | 818 | 3,187 | 18,636 | 264 | 291 | 218 |
| MainStay VP Small Cap Growth Portfolio Initial Class | 50,198 | 566 | (16,941) | (5,356) | 11,816 | 40,283 | — | 137 | 3,737 |
| MainStay VP Wellington Growth Portfolio Initial Class | 67,510 | 567 | (33,338) | (22,124) | 43,716 | 56,331 | — | — | 2,304 |
The notes to the financial statements are an integral part of, and should be read in conjunction with, the financial statements.
| 48 | MainStay VP Growth Allocation Portfolio |
| Affiliated Investment Companies | Value,
Beginning
of Year | Purchases
at Cost | Proceeds
from
Sales | Net
Realized
Gain/(Loss)
on Sales | Change in
Unrealized
Appreciation/
(Depreciation) | Value,
End of
Year | Dividend
Income | Other
Distributions | Shares
End of
Year |
| MainStay VP Wellington Mid Cap Portfolio Initial Class | $ 53,177 | $ 1,175 | $ (17,704) | $ (14,788) | $ 20,860 | $ 42,720 | $ 47 | $ — | 5,069 |
| MainStay VP Wellington Small Cap Portfolio Initial Class | 46,945 | 4,000 | (18,459) | (10,735) | 15,876 | 37,627 | 289 | — | 4,337 |
| MainStay VP Wellington U.S. Equity Portfolio Initial Class | 33,350 | 829 | (13,287) | (4,408) | 11,146 | 27,630 | 276 | — | 1,050 |
| MainStay VP Winslow Large Cap Growth Portfolio Initial Class | 66,245 | 3,010 | (33,591) | (3,984) | 25,248 | 56,928 | — | 2,061 | 2,181 |
| MainStay WMC Enduring Capital Fund Class R6 | 32,025 | 268 | (11,788) | (311) | 4,698 | 24,892 | 256 | — | 719 |
| MainStay WMC International Research Equity Fund Class I | 34,436 | 887 | (6,528) | (2,274) | 5,860 | 32,381 | 661 | — | 4,461 |
| MainStay WMC Value Fund Class R6 | 59,234 | 2,174 | (20,809) | (3,144) | 5,468 | 42,923 | 728 | 1,284 | 1,428 |
| | $1,285,336 | $542,013 | $ (751,051) | $(44,141) | $186,966 | $1,219,123 | $ 27,688 | $24,795 | |
| | |
| (a) | Prior to August 28, 2023, known as MainStay VP MacKay International Equity Portfolio Initial Class. |
Swap Contracts
Open OTC total return equity swap contracts as of December 31, 2023 were as follows1:
Swap
Counterparty | Reference Obligation | Floating Rate2 | Termination
Date(s) | Payment
Frequency
Paid/
Received | Notional
Amount
Long/
(Short)
(000)3 | Unrealized
Appreciation/
(Depreciation)4 |
| Citibank NA | Citi Leveraged Loan Basket | 1 day FEDF minus 0.20% | 12/3/24 | Daily | (16,562) | $ — |
| Citibank NA | Citi Zombie Company Basket | 1 day FEDF minus 0.50% | 12/3/24 | Daily | (21,972) | — |
| JPMorgan Chase Bank NA | Global X Uranium ETF | 1 day FEDF plus 0.50% | 10/8/24 - 11/12/24 | Daily | 30,445 | — |
| Citibank NA | Invesco S&P 500 Low Volatility ETF | 1 day FEDF plus 0.55% | 12/3/24 | Daily | 27,839 | — |
| Citibank NA | iShares 20+ Year Treasury Bond ETF | 1 day FEDF plus 0.60% | 12/3/24 | Daily | 43,356 | — |
| Citibank NA | iShares MSCI China ETF | 1 day FEDF minus 0.56% | 12/3/24 | Daily | (11,872) | — |
| Citibank NA | iShares MSCI EAFE ETF | 1 day FEDF minus 1.25% | 12/3/24 | Daily | (49,289) | — |
| Citibank NA | iShares MSCI Emerging Markets ETF | 1 day FEDF minus 0.54% | 12/3/24 | Daily | (6,812) | — |
| Citibank NA | iShares MSCI Emerging Markets ex China ETF | 1 day FEDF plus 0.55% | 12/3/24 | Daily | 12,655 | — |
| JPMorgan Chase Bank NA | iShares MSCI Japan ETF | 1 day FEDF plus 0.15% | 4/24/24 - 5/7/24 | Daily | 36,327 | — |
| JPMorgan Chase Bank NA | Russell 2000 Total Return Index | 1 day FEDF minus 0.15% - plus 0.05% | 4/9/24 - 5/7/24 | Daily | (56,160) | — |
| Citibank NA | S&P 500 Energy Total | 1 day FEDF plus 0.45% | 12/3/24 | Daily | 1,448 | — |
| JPMorgan Chase Bank NA | S&P 500 Equal Weight | 1 day FEDF plus 0.30% - 0.51% | 5/7/24 | Daily | 56,673 | — |
| Citibank NA | S&P 500 Total Return Index | 1 day FEDF plus 0.05% | 12/3/24 | Daily | (45,349) | — |
| Citibank NA | S&P 600 Total Return Index | 1 day FEDF plus 0.45% | 12/3/24 | Daily | 64,894 | — |
| Citibank NA | S&P Midcap 400 Total Return Index | 1 day FEDF plus 0.35% | 12/3/24 | Daily | 13,210 | — |
| JPMorgan Chase Bank NA | VanEck Oil Services ETF | 1 day FEDF plus 0.15% | 11/5/24 | Daily | 12,564 | — |
| Citibank NA | Vanguard FTSE Europe ETF | 1 day FEDF minus 0.50% | 12/3/24 | Daily | (12,397) | — |
| | | | | | | $ — |
The notes to the financial statements are an integral part of, and should be read in conjunction with, the financial statements.
49
Portfolio of Investments December 31, 2023†^ (continued)
The following table represents the basket holdings underlying the total return swap with Citi Leveraged Loan Basket as of December 31, 2023.
| Security Description | Shares | Notional Value | Unrealized Appreciation/
Depreciation | Percent of
Basket Net Assets |
| AerCap Holdings NV | (5,324) | (692,872) | — | 4.18 |
| Apollo Commercial Real Estate Finance Inc | (1,013) | (131,843) | — | 0.80 |
| Atlantica Sustainable Infrastructure PLC | (639) | (83,127) | — | 0.50 |
| Brandywine Realty Trust | (1,091) | (141,943) | — | 0.86 |
| Carnival Corp | (18,058) | (2,350,084) | — | 14.19 |
| Chart Industries Inc | (5,033) | (654,930) | — | 3.95 |
| Coherent Corp | (2,625) | (341,578) | — | 2.06 |
| CommScope Holding Co Inc | (315) | (41,014) | — | 0.25 |
| Crane NXT Co | (3,617) | (470,699) | — | 2.84 |
| Cushman & Wakefield PLC | (1,229) | (159,892) | — | 0.97 |
| Delta Air Lines Inc | (11,433) | (1,487,844) | — | 8.98 |
| Designer Brands Inc | (816) | (106,173) | — | 0.64 |
| DigitalBridge Group Inc | (1,619) | (210,637) | — | 1.27 |
| Elanco Animal Health Inc | (6,178) | (804,010) | — | 4.85 |
| Entegris Inc | (7,901) | (1,028,175) | — | 6.21 |
| Fidelity National Information Services Inc | (10,785) | (1,403,612) | — | 8.48 |
| Hanesbrands Inc | (2,520) | (327,984) | — | 1.98 |
| JetBlue Airways Corp | (1,843) | (239,894) | — | 1.45 |
| Lumen Technologies Inc | (3,223) | (419,400) | — | 2.53 |
| MKS Instruments Inc | (2,690) | (350,073) | — | 2.11 |
| Oatly Group AB | (252) | (32,781) | — | 0.20 |
| Opendoor Technologies Inc | (4,193) | (545,679) | — | 3.30 |
| Par Pacific Holdings Inc | (1,507) | (196,070) | — | 1.18 |
| PureCycle Technologies Inc | (490) | (63,757) | — | 0.39 |
| Scorpio Tankers Inc | (3,362) | (437,515) | — | 2.64 |
| Topgolf Callaway Brands Corp | (1,057) | (137,493) | — | 0.83 |
| Uber Technologies Inc | (19,348) | (2,517,891) | — | 15.20 |
| United Airlines Holdings Inc | (9,104) | (1,184,777) | — | 7.15 |
The following table represents the basket holdings underlying the total return swap with Citi Zombie Company Basket as of December 31, 2023.
| Security Description | Shares | Notional Value | Unrealized Appreciation/
Depreciation | Percent of
Basket Net Assets |
| Alteryx Inc | (2,417) | (295,760) | — | 1.35 |
| AppLovin Corp | (4,819) | (589,637) | — | 2.68 |
| Array Technologies Inc | (3,765) | (460,630) | — | 2.10 |
| Asana Inc | (2,079) | (254,371) | — | 1.16 |
| BILL Holdings Inc | (7,853) | (960,855) | — | 4.37 |
| BioCryst Pharmaceuticals Inc | (825) | (100,924) | — | 0.46 |
| Bloom Energy Corp | (1,870) | (228,833) | — | 1.04 |
| Bridgebio Pharma Inc | (6,561) | (802,770) | — | 3.65 |
| Carnival Corp | (13,584) | (1,662,163) | — | 7.57 |
| Children's Place Inc/The | (748) | (91,484) | — | 0.42 |
| Cinemark Holdings Inc | (1,866) | (228,263) | — | 1.04 |
| Coeur Mining Inc | (790) | (96,617) | — | 0.44 |
| Cytokinetics Inc | (5,275) | (645,419) | — | 2.94 |
| DigitalBridge Group Inc | (1,834) | (224,381) | — | 1.02 |
| Emergent BioSolutions Inc | (235) | (28,710) | — | 0.13 |
| Enviva Inc | (43) | (5,209) | — | 0.02 |
| Exact Sciences Corp | (6,104) | (746,863) | — | 3.40 |
| Fastly Inc | (3,177) | (388,718) | — | 1.77 |
| Gap Inc/The | (9,783) | (1,197,024) | — | 5.45 |
| Guardant Health Inc | (2,516) | (307,845) | — | 1.40 |
| IAC Inc | (1,883) | (230,435) | — | 1.05 |
| Infinera Corp | (567) | (69,329) | — | 0.32 |
| Insmed Inc | (1,833) | (224,235) | — | 1.02 |
| JetBlue Airways Corp | (2,119) | (259,310) | — | 1.18 |
| Kyndryl Holdings Inc | (1,511) | (184,906) | — | 0.84 |
The notes to the financial statements are an integral part of, and should be read in conjunction with, the financial statements.
| 50 | MainStay VP Growth Allocation Portfolio |
| Security Description | Shares | Notional Value | Unrealized Appreciation/
Depreciation | Percent of
Basket Net Assets |
| Lyft Inc | (9,894) | (1,210,685) | — | 5.51 |
| NeoGenomics Inc | (1,282) | (156,842) | — | 0.71 |
| Oscar Health Inc | (3,257) | (398,518) | — | 1.81 |
| Pacific Biosciences of California Inc | (1,535) | (187,851) | — | 0.86 |
| Peloton Interactive Inc | (2,661) | (325,659) | — | 1.48 |
| Q2 Holdings Inc | (1,792) | (219,280) | — | 1.00 |
| Redfin Corp | (1,320) | (161,528) | — | 0.74 |
| Revance Therapeutics Inc | (435) | (53,235) | — | 0.24 |
| RingCentral Inc | (3,512) | (429,681) | — | 1.96 |
| Rivian Automotive Inc | (10,250) | (1,254,171) | — | 5.71 |
| Royal Caribbean Cruises Ltd | (15,288) | (1,870,637) | — | 8.51 |
| Scotts Miracle-Gro Co/The | (2,411) | (295,030) | — | 1.34 |
| Spirit AeroSystems Holdings Inc | (1,976) | (241,765) | — | 1.10 |
| Spirit Airlines Inc | (1,133) | (138,582) | — | 0.63 |
| Sweetgreen Inc | (1,170) | (143,216) | — | 0.65 |
| TG Therapeutics Inc | (3,500) | (428,236) | — | 1.95 |
| Twist Bioscience Corp | (2,690) | (329,203) | — | 1.50 |
| Vistra Corp | (7,119) | (871,050) | — | 3.96 |
| Warner Bros Discovery Inc | (5,933) | (725,959) | — | 3.30 |
| Wix.com Ltd | (3,761) | (460,250) | — | 2.10 |
| Wolfspeed Inc | (4,476) | (547,685) | — | 2.49 |
| WW International Inc | (1,870) | (228,801) | — | 1.04 |
| Wynn Resorts Ltd | (6,979) | (853,981) | — | 3.89 |
| Xerox Holdings Corp | (1,267) | (155,037) | — | 0.71 |
| 1. | As of December 31, 2023, cash in the amount $100,000 was due to brokers for OTC swap contracts. |
| 2. | Portfolio pays the floating rate and receives the total return of the reference entity. |
| 3. | Notional amounts reflected as a positive value indicate a long position held by the Portfolio or Index and a negative value indicates a short position. |
| 4. | Reflects the value at reset date as of December 31, 2023. |
| Abbreviation(s): |
| EAFE—Europe, Australasia and Far East |
| ETF—Exchange-Traded Fund |
| FEDF—Federal Funds Rate |
| FTSE—Financial Times Stock Exchange |
| MSCI—Morgan Stanley Capital International |
The notes to the financial statements are an integral part of, and should be read in conjunction with, the financial statements.
51
Portfolio of Investments December 31, 2023†^ (continued)
The following is a summary of the fair valuations according to the inputs used as of December 31, 2023, for valuing the Portfolio’s assets:
| Description | Quoted
Prices in
Active
Markets for
Identical
Assets
(Level 1) | | Significant
Other
Observable
Inputs
(Level 2) | | Significant
Unobservable
Inputs
(Level 3) | | Total |
| Asset Valuation Inputs | | | | | | | |
| Investments in Securities (a) | | | | | | | |
| Affiliated Investment Companies | | | | | | | |
| Equity Funds | $ 949,056,810 | | $ — | | $ — | | $ 949,056,810 |
| Fixed Income Funds | 157,510,925 | | — | | — | | 157,510,925 |
| Total Affiliated Investment Companies | 1,106,567,735 | | — | | — | | 1,106,567,735 |
| Short-Term Investment | | | | | | | |
| Affiliated Investment Company | 112,555,559 | | — | | — | | 112,555,559 |
| Total Investments in Securities | $ 1,219,123,294 | | $ — | | $ — | | $ 1,219,123,294 |
| (a) | For a complete listing of investments, see the Portfolio of Investments. |
The notes to the financial statements are an integral part of, and should be read in conjunction with, the financial statements.
| 52 | MainStay VP Growth Allocation Portfolio |
Statement of Assets and Liabilities as of December 31, 2023
| Assets |
Investment in affiliated investment companies, at value
(identified cost $1,189,711,655) | $1,219,123,294 |
| Cash | 2,900,000 |
| Receivables: | |
| Dividends and interest on OTC swaps contracts | 2,335,732 |
| Dividends | 1,347,983 |
| Portfolio shares sold | 82,261 |
| Other assets | 19,851 |
| Total assets | 1,225,809,121 |
| Liabilities |
| Cash collateral due to broker for swaps contracts | 100,000 |
| Payables: | |
| Portfolio shares redeemed | 470,668 |
| NYLIFE Distributors (See Note 3) | 236,894 |
| Custodian | 31,852 |
| Professional fees | 24,973 |
| Shareholder communication | 12,339 |
| Accrued expenses | 1,781 |
| Total liabilities | 878,507 |
| Net assets | $1,224,930,614 |
| Composition of Net Assets |
| Shares of beneficial interest outstanding (par value of $.001 per share) unlimited number of shares authorized | $ 127,082 |
| Additional paid-in-capital | 1,282,770,302 |
| | 1,282,897,384 |
| Total distributable earnings (loss) | (57,966,770) |
| Net assets | $1,224,930,614 |
| Initial Class | |
| Net assets applicable to outstanding shares | $ 95,509,939 |
| Shares of beneficial interest outstanding | 9,784,758 |
| Net asset value per share outstanding | $ 9.76 |
| Service Class | |
| Net assets applicable to outstanding shares | $1,129,420,675 |
| Shares of beneficial interest outstanding | 117,296,971 |
| Net asset value per share outstanding | $ 9.63 |
The notes to the financial statements are an integral part of, and should be read in conjunction with, the financial statements.
53
Statement of Operations for the year ended December 31, 2023
| Investment Income (Loss) |
| Income | |
| Dividend distributions from affiliated investment companies | $ 27,687,718 |
| Expenses | |
| Distribution/Service—Service Class (See Note 3) | 2,882,416 |
| Professional fees | 101,896 |
| Custodian | 56,136 |
| Trustees | 32,493 |
| Shareholder communication | 7,465 |
| Miscellaneous | 34,938 |
| Total expenses | 3,115,344 |
| Net investment income (loss) | 24,572,374 |
| Realized and Unrealized Gain (Loss) |
| Net realized gain (loss) on: | |
| Affiliated investment company transactions | (44,140,653) |
| Realized capital gain distributions from affiliated investment companies | 24,794,545 |
| Swap transactions | (16,421,018) |
| Net realized gain (loss) | (35,767,126) |
Net change in unrealized appreciation (depreciation) on:
Affiliated investments companies | 186,965,793 |
| Net realized and unrealized gain (loss) | 151,198,667 |
| Net increase (decrease) in net assets resulting from operations | $175,771,041 |
The notes to the financial statements are an integral part of, and should be read in conjunction with, the financial statements.
| 54 | MainStay VP Growth Allocation Portfolio |
Statements of Changes in Net Assets
for the years ended December 31, 2023 and December 31, 2022
| | 2023 | 2022 |
| Increase (Decrease) in Net Assets |
| Operations: | | |
| Net investment income (loss) | $ 24,572,374 | $ 18,584,745 |
| Net realized gain (loss) | (35,767,126) | 107,969,094 |
| Net change in unrealized appreciation (depreciation) | 186,965,793 | (377,385,911) |
| Net increase (decrease) in net assets resulting from operations | 175,771,041 | (250,832,072) |
| Distributions to shareholders: | | |
| Initial Class | (9,842,480) | (15,428,348) |
| Service Class | (117,566,790) | (216,661,264) |
| Total distributions to shareholders | (127,409,270) | (232,089,612) |
| Capital share transactions: | | |
| Net proceeds from sales of shares | 30,880,642 | 26,427,493 |
| Net asset value of shares issued to shareholders in reinvestment of distributions | 127,409,270 | 232,089,612 |
| Cost of shares redeemed | (269,093,776) | (251,331,929) |
| Increase (decrease) in net assets derived from capital share transactions | (110,803,864) | 7,185,176 |
| Net increase (decrease) in net assets | (62,442,093) | (475,736,508) |
| Net Assets |
| Beginning of year | 1,287,372,707 | 1,763,109,215 |
| End of year | $1,224,930,614 | $1,287,372,707 |
The notes to the financial statements are an integral part of, and should be read in conjunction with, the financial statements.
55
Financial Highlights selected per share data and ratios
| | Year Ended December 31, |
| Initial Class | 2023 | | 2022 | | 2021 | | 2020 | | 2019 |
| Net asset value at beginning of year | $ 9.50 | | $ 13.62 | | $ 12.19 | | $ 11.51 | | $ 10.57 |
| Net investment income (loss) (a) | 0.22 | | 0.18 | | 0.20 | | 0.21 | | 0.26 |
| Net realized and unrealized gain (loss) | 1.14 | | (2.28) | | 1.72 | | 1.21 | | 1.91 |
| Total from investment operations | 1.36 | | (2.10) | | 1.92 | | 1.42 | | 2.17 |
| Less distributions: | | | | | | | | | |
| From net investment income | (0.41) | | (0.42) | | (0.33) | | (0.34) | | (0.39) |
| From net realized gain on investments | (0.69) | | (1.60) | | (0.16) | | (0.40) | | (0.84) |
| Total distributions | (1.10) | | (2.02) | | (0.49) | | (0.74) | | (1.23) |
| Net asset value at end of year | $ 9.76 | | $ 9.50 | | $ 13.62 | | $ 12.19 | | $ 11.51 |
| Total investment return (b) | 15.49% | | (14.43)% | | 16.01% | | 12.94% | | 21.42% |
| Ratios (to average net assets)/Supplemental Data: | | | | | | | | | |
| Net investment income (loss) | 2.25% | | 1.55% | | 1.53% | | 1.87% | | 2.22% |
| Net expenses (c) | 0.02% | | 0.02% | | 0.02% | | 0.03% | | 0.02% |
| Portfolio turnover rate | 24% | | 32% | | 24% | | 32% | | 41% |
| Net assets at end of year (in 000's) | $ 95,510 | | $ 88,026 | | $ 108,059 | | $ 98,314 | | $ 91,615 |
| (a) | Per share data based on average shares outstanding during the year. |
| (b) | Total return does not reflect any deduction of sales charges, mortality and expense charges, contract charges or administrative charges. For periods of less than one year, total return is not annualized. |
| (c) | In addition to the fees and expenses which the Portfolio bears directly, it also indirectly bears a pro-rata share of the fees and expenses of the underlying funds in which it invests. Such indirect expenses are not included in the above expense ratios. |
| | Year Ended December 31, |
| Service Class | 2023 | | 2022 | | 2021 | | 2020 | | 2019 |
| Net asset value at beginning of year | $ 9.38 | | $ 13.46 | | $ 12.05 | | $ 11.38 | | $ 10.47 |
| Net investment income (loss) (a) | 0.19 | | 0.14 | | 0.16 | | 0.17 | | 0.22 |
| Net realized and unrealized gain (loss) | 1.13 | | (2.24) | | 1.71 | | 1.21 | | 1.88 |
| Total from investment operations | 1.32 | | (2.10) | | 1.87 | | 1.38 | | 2.10 |
| Less distributions: | | | | | | | | | |
| From net investment income | (0.38) | | (0.38) | | (0.30) | | (0.31) | | (0.35) |
| From net realized gain on investments | (0.69) | | (1.60) | | (0.16) | | (0.40) | | (0.84) |
| Total distributions | (1.07) | | (1.98) | | (0.46) | | (0.71) | | (1.19) |
| Net asset value at end of year | $ 9.63 | | $ 9.38 | | $ 13.46 | | $ 12.05 | | $ 11.38 |
| Total investment return (b) | 15.20% | | (14.64)% | | 15.72% | | 12.65% | | 21.12% |
| Ratios (to average net assets)/Supplemental Data: | | | | | | | | | |
| Net investment income (loss) | 1.95% | | 1.26% | | 1.24% | | 1.55% | | 1.90% |
| Net expenses (c) | 0.27% | | 0.27% | | 0.27% | | 0.28% | | 0.27% |
| Portfolio turnover rate | 24% | | 32% | | 24% | | 32% | | 41% |
| Net assets at end of year (in 000's) | $ 1,129,421 | | $ 1,199,347 | | $ 1,655,050 | | $ 1,711,623 | | $ 1,868,634 |
| (a) | Per share data based on average shares outstanding during the year. |
| (b) | Total return does not reflect any deduction of sales charges, mortality and expense charges, contract charges or administrative charges. For periods of less than one year, total return is not annualized. |
| (c) | In addition to the fees and expenses which the Portfolio bears directly, it also indirectly bears a pro-rata share of the fees and expenses of the underlying funds in which it invests. Such indirect expenses are not included in the above expense ratios. |
The notes to the financial statements are an integral part of, and should be read in conjunction with, the financial statements.
| 56 | MainStay VP Growth Allocation Portfolio |
MainStay VP Equity Allocation Portfolio
Investment and Performance Comparison (Unaudited)
Performance data quoted represents past performance. Past performance is no guarantee of future results. Because of market volatility and other factors, current performance may be lower or higher than the figures shown. Investment return and principal value will fluctuate, and as a result, when shares are redeemed, they may be worth more or less than their original cost. The performance table and graph do not reflect any deduction of sales charges, mortality and expense charges, contract charges or administrative charges. Please refer to the Performance Summary appropriate for your policy. For performance information current to the most recent month-end, please call 800-598-2019 or visit www.newyorklife.com.
Performance figures may reflect certain fee waivers and/or expense limitations, without which total returns may have been different. For information on current fee waivers and/or expense limitations (if any), please refer to the Notes to Financial Statements.
| Average Annual Total Returns for the Year-Ended December 31, 2023 |
| Class | Inception
Date | One
Year | Five
Years | Ten
Years | Gross
Expense
Ratio1 |
| Initial Class Shares | 2/13/2006 | 17.40% | 10.73% | 6.89% | 0.60% |
| Service Class Shares | 2/13/2006 | 17.10 | 10.45 | 6.62 | 0.85 |
| 1. | The gross expense ratios presented reflect the Portfolio’s “Total Annual Portfolio Operating Expenses” from the most recent Prospectus and may differ from other expense ratios disclosed in this report. |
| Benchmark Performance* | One
Year | Five
Years | Ten
Years |
| S&P 500® Index1 | 26.29% | 15.69% | 12.03% |
| MSCI EAFE® Index (Net)2 | 18.24 | 8.16 | 4.28 |
| Equity Allocation Composite Index3 | 24.28 | 13.83 | 10.10 |
| Morningstar Aggressive Allocation Category Average4 | 17.66 | 10.39 | 7.09 |
| * | Returns for indices reflect no deductions for fees, expenses or taxes, except for foreign withholding taxes where applicable. Results assume reinvestment of all dividends and capital gains. An investment cannot be made directly in an index. |
| 1. | The S&P 500® Index is the Portfolio's primary benchmark. S&P 500® is a trademark of The McGraw-Hill Companies, Inc. The S&P 500® Index is widely regarded as the standard index for measuring large-cap U.S. stock market performance. |
| 2. | The MSCI EAFE® Index (Net) is the Portfolio's secondary benchmark. The MSCI EAFE® Index (Net) consists of international stocks representing the developed world outside of North America. |
| 3. | The Portfolio has selected the Equity Allocation Composite Index as an additional benchmark. Effective February 28, 2014, the Equity Allocation Composite Index consists of the S&P 500® Index and the MSCI EAFE® Index (Net) weighted 75% and 25%, respectively. Prior to February 28, 2014, the Equity Allocation Composite Index consisted of the S&P 500® Index and the MSCI EAFE® Index (Net) weighted 80% and 20%, respectively. |
| 4. | The Morningstar Aggressive Allocation Category Average is representative of funds in allocation categories that seek to provide both income and capital appreciation by primarily investing in multiple asset classes, including stocks, bonds, and cash. These aggressive strategies typically allocate at least 10% to equities of foreign companies and prioritize capital appreciation over preservation. They typically expect volatility similar to a strategic equity exposure of more than 85%. Results are based on average total returns of similar funds with all dividends and capital gain distributions reinvested. |
Cost in Dollars of a $1,000 Investment in MainStay VP Equity Allocation Portfolio (Unaudited)
The example below is intended to describe the fees and expenses borne by shareholders during the six-month period from July 1, 2023 to December 31, 2023, and the impact of those costs on your investment.
Example
As a shareholder of the Portfolio you incur two types of costs: (1) transaction costs, including exchange fees and sales charges (loads) on purchases (as applicable), and (2) ongoing costs, including management fees, distribution and/or service (12b-1) fees and other Portfolio expenses (as applicable). This example is intended to help you understand your ongoing costs (in dollars) of investing in the Portfolio and to compare these costs with the ongoing costs of investing in other mutual funds. The example is based on an investment of $1,000 made at the beginning of the six-month period and held for the entire period from July 1, 2023 to December 31, 2023. Shares are only sold in connection with variable life and annuity contracts and the example does not reflect any contract level or transactional fees or expenses. If these costs had been included, your costs would have been higher.
This example illustrates your Portfolio’s ongoing costs in two ways:
Actual Expenses
The second and third data columns in the table below provide information about actual account values and actual expenses. You may use the information in these columns, together with the amount you invested, to estimate the expenses that you paid during the six months ended
December 31, 2023. Simply divide your account value by $1,000 (for example, an $8,600 account value divided by $1,000 = 8.6), then multiply the result by the number under the heading entitled “Expenses Paid During Period” to estimate the expenses you paid on your account during this period.
Hypothetical Example for Comparison Purposes
The fourth and fifth data columns in the table below provide information about hypothetical account values and hypothetical expenses based on the Portfolio’s actual expense ratio and an assumed rate of return of 5% per year before expenses, which is not the Portfolio’s actual return. The hypothetical account values and expenses may not be used to estimate the actual ending account balances or expenses you paid for the six-month period shown. You may use this information to compare the ongoing costs of investing in the Portfolio with the ongoing costs of investing in other mutual funds. To do so, compare this 5% hypothetical example with the 5% hypothetical examples that appear in the shareholder reports of the other mutual funds.
Please note that the expenses shown in the table are meant to highlight your ongoing costs only and do not reflect any transactional costs, such as exchange fees or sales charges (loads). Therefore, the fourth and fifth data columns of the table are useful in comparing ongoing costs only and will not help you determine the relative total costs of owning different funds. In addition, if these transactional costs were included, your costs would have been higher.
| Share Class | Beginning
Account
Value
7/1/23 | Ending Account
Value (Based
on Actual
Returns and
Expenses)
12/31/23 | Expenses
Paid
During
Period1 | Ending Account
Value (Based
on Hypothetical
5% Annualized
Return and
Actual Expenses)
12/31/23 | Expenses
Paid
During
Period1 | Net Expense
Ratio
During
Period2 |
| Initial Class Shares | $1,000.00 | $1,070.20 | $0.16 | $1,025.05 | $0.15 | 0.03% |
| Service Class Shares | $1,000.00 | $1,068.80 | $1.46 | $1,023.79 | $1.43 | 0.28% |
| 1. | Expenses are equal to the Portfolio’s annualized expense ratio of each class multiplied by the average account value over the period, divided by 365 and multiplied by 184 (to reflect the six-month period). The table above represents the actual expenses incurred during the six-month period. In addition to the fees and expenses which the Portfolio bears directly, it also indirectly bears a pro rata share of the fees and expenses of the underlying Portfolios/Funds in which it invests. Such indirect expenses are not included in the above-reported expense figures. |
| 2. | Expenses are equal to the Portfolio's annualized expense ratio to reflect the six-month period. |
| 58 | MainStay VP Equity Allocation Portfolio |
Asset Diversification as of December 31, 2023 (Unaudited)
| Equity Funds | 97.6% |
| Short-Term Investment | 2.2 |
| Other Assets, Less Liabilities | 0.2 |
See Portfolio of Investments beginning on page 63 for specific holdings within these categories. The Portfolio’s holdings are subject to change.
Portfolio Management Discussion and Analysis (Unaudited)
Answers to the questions reflect the views of portfolio managers Jae S. Yoon, CFA, Jonathan Swaney, Poul Kristensen, CFA, and Amit Soni, CFA, of New York Life Investments,1 the Portfolio’s Manager.
How did MainStay VP Equity Allocation Portfolio perform relative to its benchmarks and peers during the 12 months ended December 31, 2023?
For the 12 months ended December 31, 2023, MainStay VP Equity Allocation Portfolio returned 17.40% for Initial Class shares and 17.10% for Service Class shares. Over the same period, both share classes underperformed the 26.29% return of the S&P 500® Index, which is the Portfolio’s primary benchmark, and the 18.24% return of the MSCI EAFE® Index (Net), which is a secondary benchmark of the Portfolio. For the 12 months ended December 31, 2023, both share classes also underperformed the 24.28% return of the Equity Allocation Composite Index and the 17.66% return of Morningstar Aggressive Allocation Category Average.2
What factors affected the Portfolio’s relative performance during the reporting period?
The Portfolio is a “fund of funds,” meaning that it seeks to achieve its investment objective by investing primarily in mutual funds and exchange-traded funds (“ETFs”) managed by New York Life Investments or its affiliates (the “Underlying Portfolios/Funds”). The Portfolio will generally invest in Underlying Portfolios of MainStay VP Funds Trust unless such Portfolio in a particular asset class (or subasset class) is deemed by the portfolio managers to be unavailable. The Underlying Portfolios/Funds may invest in U.S. equities and international equities, making comparisons to any single index generally less suitable than a weighted combination of indices, which is a more useful yardstick by which to measure performance. The Portfolio’s management internally maintains a blend of indices that are taken into consideration when managing the Portfolio. During the reporting period, the Portfolio substantially underperformed this internally maintained blend of indices, primarily due to active positioning at the asset class level.
The Portfolio’s exposure to small-cap stocks detracted significantly from returns. Throughout the reporting period, relative valuations in the small-cap asset class were much more attractive than has been the historical norm; however small companies are significantly more sensitive to changes in bank financing conditions than are large companies that can issue bonds. Fast-rising costs on bank loans, coupled with concerns about future credit availability in the wake of the bank crisis that occurred in the early spring of 2023, weighed heavily on that end of the capitalization spectrum. We promptly restored the Portfolio’s small-cap allocation to neutral as the nature and scope of the crisis became clear.
Relative returns also suffered from efforts to avoid undue exposure to a small group of market-leading, mega-cap,
technology-related companies. Recently dubbed ‘the Magnificent 7’ (Alphabet, Amazon, Apple, Meta Platforms, Microsoft, NVIDIA, and Tesla), these firms are richly valued, implying rapid earnings growth in the coming years. We remain skeptical that such growth is likely to be achieved by these companies, which are already among the largest enterprises in the world, with dominant positions in their respective industries. Accordingly, we shifted Portfolio assets out of capitalization-weighted large-cap index products, favoring other options—most notably, an equally weighted version of the S&P 500®. During the reporting period, however, ongoing enthusiasm for the commercial potential of artificial intelligence (“AI”), and the degree to which the Magnificent 7 are expected to benefit from such developments, helped these companis maintain their leadership positions. During the reporting period, the Bloomberg Magnificent 7 Price Return Index returned approximately 107%, compared to a the more modest 14% return for the equally weighted S&P 500®.
Tilts favoring defensive sectors, particularly health care, and low volatility stocks, further detracted from the Portfolio’s active returns. Basically, any skew in the Portfolio away from the sole winners of the reporting period—mega-cap tech-oriented companies—was a drag on relative results.
The Portfolio realized some positive results within equities. Tactical trading in gold miners, for example, proved helpful. The Portfolio also benefited from a bias favoring an emerging-markets equity strategy that excluded China, reflecting our concerns regarding China’s ongoing property market turmoil, high debt levels, regulatory overreach and simmering tensions with the West.
During the reporting period, how was the Portfolio’s performance materially affected by investments in derivatives?
Total return swaps were used to express most of the Portfolio’s asset class policy views. Therefore, the swaps can be seen as detracting from the Portfolio’s relative performance over the course of the reporting period.
How did you allocate the Portfolio’s assets during the reporting period and why?
Equity style: Growth stocks, by definition, exhibit richer valuations than value stock. As a consequence, growth stock prices are relatively reliant on distant profits, and are often more sensitive to elevated inflation and higher interest rates than their value-oriented counterparts. Accordingly, given the high-rate environment that prevailed during the reporting period, we persistently tilted the Portfolio to emphasize value stocks that offered more substantial near-term cash flows. In particular, we focused on defensive, lower-volatility sectors, including utilities,
| 1. | “New York Life Investments” is a service mark used by New York Life Investment Management Holdings LLC and its subsidiary New York Life Investment Management LLC. |
| 2. | See "Investment and Performance Comparison" for more information on benchmark and peer group returns. |
| 60 | MainStay VP Equity Allocation Portfolio |
consumer staples and—most of all—health care. This position undermined results in 2023, as market performance was dominated by the aforementioned Magnificent 7—growth-oriented technology-related stocks, swept by a wave of excitement over the prospects for generative AI.
Equity size: The Portfolio held overweight exposure to small-cap stocks early in the reporting period. We based our thesis on several prevailing characteristics of the asset class: attractive valuations, insulation from economic weakness abroad, less sensitivity to dollar strength and disproportionate exposure to domestic demand–which thus far remains robust. That position proved unconstructive during the spring of 2023, as small companies tend to be heavily dependent on bank financing, and banks aggressively tightened lending standards in the wake of the banking crisis that occurred in March and April. Accordingly, we unwound the Portfolio’s small-cap bias. However, it is important to note that the proceeds did not flow to large blend index exposure, where the Magnificent 7 dominate. Rather, the redirected assets went to an equally weighted version of the S&P 500®, where those seven names comprise less than 2% of the index.
Geographic exposure: During the reporting period, European equities appeared vulnerable. We expected that persistently high wage growth would compel the European Central Bank to maintain its restrictive monetary policies for an extended period of time while European export-heavy economies wrestled with declining global trade volumes. In addition, Europe appear particularly exposed to potential energy price spikes amid elevated geopolitical tensions. On the other hand, the Bank of Japan remained engaged in accommodative policy, Japanese exports benefited from a weak yen, and shareholder governance was increasingly prioritized by Japanese companies, largely in the form of share buybacks. Given these divergent conditions, we tilted the Portfolio away from European markets in favor of Japanese stocks, while holding net exposure to non-U.S. stocks close to neutral. With prospects for Chinese equities looking somewhat dim, we tilted the Portfolio toward other faster-growing economies within the emerging-markets complex.
Energy and natural resources: The Portfolio maintained exposure to upstream energy producers and oilfield/gas field service providers as a commodity play to provide an additional inflation hedge. These holdings also positioned the Portfolio to take advantage of opportunities for domestic producers to benefit as Western nations revisit energy policy to source supplies from stable and friendly jurisdictions rather than autocratic petrostates that present national security risks. The Portfolio’s small, but volatile, energy position had a disproportionate impact on the Portfolio’s short-term performance month by month, but little impact on overall performance for the entire year. The Portfolio
also added exposure to uranium miners during the reporting period. With numerous reactors planned, under construction, or being put back into service after an earlier shutoff, we expect nuclear energy production to grow significantly in the years ahead, driving the need for additional uranium production and creating opportunities for miners and processors.
How did the Portfolio’s allocations change over the course of the reporting period?
In one of the more substantial changes in allocations undertaken during the reporting period, we reduced the Portfolio’s exposure to small-cap stocks, expressed via total return swaps. We took this action in response to the banking crisis that unfolded in the spring of 2023. We unwound the Portfolio’s swap exposure to the S&P 500 Health Care Sector in favor of other defensive positions, including Invesco S&P 500 Low Volatility ETF. We unwound swap exposure to VanEck Gold Miners ETF, taking gains and exiting a profitable trade on a high note. Lastly, we used swaps to tilt the Portfolio away from baskets of specific stocks that were either heavily dependent on floating-rate loans (such as Uber, United Airlines and Carnival) or that generated insufficient operating income to retire debt as it came due (so-called ‘zombie’ companies, such as Royal Caribbean, Wynn Resorts and Rivian). We believed these firms were especially vulnerable in an environment of fast-rising interest rates and tightening lending standards.
New or increased allocations included, first and foremost, the establishment and growth of an allocation to Invesco S&P 500® Equal Weight ETF, funded in part from cash. We adopted this position to remove the Portfolio’s underweight exposure to equities without significantly increasing its exposure to the Magnificent 7. We also initiated a new Portfolio position in iShares MSCI Japan ETF (via a swap because we saw valuations as attractive, export conditions as favorable and the Japanese yen as likely to appreciate should the Bank of Japan abandon its existing yield curve3 control policy. Another notable addition involved the establishment of exposure to Global X Uranium ETF, which invests primarily in uranium mining firms. Climate change concerns, net-zero commitments and the limitations of renewable energy are driving a reconsideration of nuclear energy, for which fuel supply is rather limited. We foresee a supply/demand imbalance developing that is likely to support businesses involved with extracting and processing uranium. We also opened a position in a swap providing access to the IQ CBRE NextGen Real Estate ETF, providing a toehold in the digital infrastructure space.
At the Underlying Fund level, the Portfolio took advantage of a few new investment options, adopting positions in MainStay PineStone U.S. Equity Fund, IQ Candriam U.S. Mid Cap Equity ETF and
| 3. | The yield curve is a line that plots the yields of various securities of similar quality—typically U.S. Treasury issues—across a range of maturities. The U.S. Treasury yield curve serves as a benchmark for other debt and is used in economic forecasting. |
MainStay Fiera SMID Growth Fund. Departing the Portfolio was IQ U.S. Large Cap ETF, which was liquidated in December.
During the reporting period, which Underlying Equity Portfolios/Funds had the highest total returns and which had the lowest total returns?
The Portfolio’s top-performing positions that were held for the entire reporting period included MainStay VP Winslow Large Cap Growth Portfolio, MainStay VP Wellington Growth Portfolio and IQ Candriam U.S. Equity ETF. The worst-performing positions (all of which produced positive returns) included Invesco S&P 500 Low Volatility ETF, MainStay VP PineStone International Equity Portfolio (previously MainStay VP MacKay International Equity Portfolio) and MainStay VP Candriam Emerging Markets Equity Portfolio.
Which Underlying Equity Portfolios/Funds were the strongest positive contributors to the Portfolio’s performance and which Underlying Equity Portfolios/Funds were particularly weak?
The strongest positive contributions to performance came from MainStay VP Winslow Large Cap Growth Portfolio, MainStay VP Wellington Growth Portfolio and IQ Candriam U.S. Equity ETF. (Contributions take weightings and total returns into account.) The direct Portfolio holdings that contributed least to returns included MainStay Epoch Capital Growth Fund, IQ CBRE NextGen Real Estate ETF and MainStay VP PineStone International Equity Portfolio (previously MainStay VP MacKay International Equity Portfolio). The Portfolio experienced losses from some swap positions in which we paid the return to the Russell 2000 Index, the Russell 1000 Growth Index and the MSCI EAFE Index.
The opinions expressed are those of the portfolio managers as of the date of this report and are subject to change. There is no guarantee that any forecasts will come to pass. This material does not constitute investment advice and is not intended as an endorsement of any specific investment.
Not all MainStay VP Portfolios and/or share classes are available under all policies.
| 62 | MainStay VP Equity Allocation Portfolio |
Portfolio of Investments December 31, 2023†^
| | Shares | Value |
| Affiliated Investment Companies 97.6% |
| Equity Funds 97.6% |
| IQ 500 International ETF (a) | 1,030,928 | $ 33,795,160 |
| IQ Candriam International Equity ETF (a) | 1,218,172 | 34,047,907 |
| IQ Candriam U.S. Large Cap Equity ETF (a) | 1,181,486 | 49,610,597 |
| IQ Candriam U.S. Mid Cap Equity ETF (a) | 1,263,618 | 38,051,202 |
| IQ CBRE NextGen Real Estate ETF (a) | 969,235 | 19,801,471 |
| IQ FTSE International Equity Currency Neutral ETF | 690,323 | 17,168,333 |
| IQ U.S. Small Cap ETF (a) | 856,600 | 30,880,430 |
| MainStay Epoch Capital Growth Fund Class I | 232,067 | 3,240,514 |
| MainStay Epoch International Choice Fund Class I (a) | 720,181 | 28,699,368 |
| MainStay Fiera SMID Growth Fund Class R6 (a) | 2,347,655 | 38,953,224 |
| MainStay PineStone U.S. Equity Fund Class R6 (a) | 2,222,577 | 38,561,482 |
| MainStay VP American Century Sustainable Equity Portfolio Initial Class (a) | 5,180,693 | 46,317,467 |
| MainStay VP Candriam Emerging Markets Equity Portfolio Initial Class (a) | 6,238,396 | 43,392,411 |
| MainStay VP Epoch U.S. Equity Yield Portfolio Initial Class (a) | 2,539,107 | 42,095,096 |
| MainStay VP PineStone International Equity Portfolio Initial Class (a) | 2,677,219 | 28,720,935 |
| MainStay VP S&P 500 Index Portfolio Initial Class | 160,450 | 13,696,226 |
| MainStay VP Small Cap Growth Portfolio Initial Class (a) | 3,417,336 | 36,834,786 |
| MainStay VP Wellington Growth Portfolio Initial Class (a) | 2,078,563 | 50,809,422 |
| MainStay VP Wellington Mid Cap Portfolio Initial Class (a) | 4,611,164 | 38,857,819 |
| | Shares | | Value |
| |
| Equity Funds (continued) |
| MainStay VP Wellington Small Cap Portfolio Initial Class (a) | 3,907,819 | | $ 33,901,110 |
| MainStay VP Wellington U.S. Equity Portfolio Initial Class | 988,504 | | 25,999,621 |
| MainStay VP Winslow Large Cap Growth Portfolio Initial Class (a) | 1,959,386 | | 51,148,209 |
| MainStay WMC Enduring Capital Fund Class R6 (a) | 663,550 | | 22,966,807 |
| MainStay WMC International Research Equity Fund Class I (a) | 3,962,932 | | 28,766,924 |
| MainStay WMC Value Fund Class R6 (a) | 1,334,565 | | 40,117,153 |
Total Affiliated Investment Companies
(Cost $838,825,704) | | | 836,433,674 |
| Short-Term Investment 2.2% |
| Affiliated Investment Company 2.2% |
| MainStay U.S. Government Liquidity Fund, 5.235% (b) | 19,067,920 | | 19,067,920 |
Total Short-Term Investment
(Cost $19,067,920) | 2.2% | | 19,067,920 |
Total Investments
(Cost $857,893,624) | 99.8% | | 855,501,594 |
| Other Assets, Less Liabilities | 0.2 | | 1,444,317 |
| Net Assets | 100.0% | | $ 856,945,911 |
| † | Percentages indicated are based on Portfolio net assets. |
| ^ | Industry classifications may be different than those used for compliance monitoring purposes. |
| (a) | As of December 31, 2023, the Portfolio's ownership exceeds 5% of the outstanding shares of the Underlying Portfolio's share class. |
| (b) | Current yield as of December 31, 2023. |
The notes to the financial statements are an integral part of, and should be read in conjunction with, the financial statements.
63
Portfolio of Investments December 31, 2023†^ (continued)
Investments in Affiliates (in 000's)
Investments in issuers considered to be affiliate(s) of the Portfolio during the year ended December 31, 2023 for purposes of Section 2(a)(3) of the Investment Company Act of 1940, as amended, were as follows:
| Affiliated Investment Companies | Value,
Beginning
of Year | Purchases
at Cost | Proceeds
from
Sales | Net
Realized
Gain/(Loss)
on Sales | Change in
Unrealized
Appreciation/
(Depreciation) | Value,
End of
Year | Dividend
Income | Other
Distributions | Shares
End of
Year |
| IQ 500 International ETF | $ 34,730 | $ 1,613 | $ (7,616) | $ 1,054 | $ 4,014 | $ 33,795 | $ 1,368 | $ — | 1,031 |
| IQ Candriam International Equity ETF | 34,598 | 1,529 | (6,202) | 1,245 | 2,878 | 34,048 | 1,044 | — | 1,218 |
| IQ Candriam U.S. Large Cap Equity ETF | 56,355 | 756 | (22,577) | 5,685 | 9,393 | 49,612 | 688 | — | 1,181 |
| IQ Candriam U.S. Mid Cap Equity ETF | — | 35,646 | (301) | 5 | 2,702 | 38,052 | 249 | — | 1,264 |
| IQ CBRE NextGen Real Estate ETF | — | 18,639 | (40) | 1 | 1,202 | 19,802 | 122 | — | 969 |
| IQ FTSE International Equity Currency Neutral ETF | 17,024 | 345 | (2,827) | 191 | 2,435 | 17,168 | 448 | — | 690 |
| IQ U.S. Large Cap ETF | 50,884 | — | (54,103) | 13,295 | (10,076) | — | 687 | — | — |
| IQ U.S. Small Cap ETF | 38,632 | 3,139 | (14,700) | (1,063) | 4,872 | 30,880 | 497 | — | 857 |
| MainStay Epoch Capital Growth Fund Class I | 3,031 | 19 | (605) | (62) | 858 | 3,241 | 18 | 1 | 232 |
| MainStay Epoch International Choice Fund Class I | 28,668 | 1,309 | (6,004) | 1,065 | 3,661 | 28,699 | 482 | — | 720 |
| MainStay Fiera SMID Growth Fund Class R6 | — | 36,154 | — | — | 2,799 | 38,953 | — | 835 | 2,348 |
| MainStay PineStone U.S. Equity Fund Class R6 | — | 36,873 | — | — | 1,688 | 38,561 | 82 | 26 | 2,223 |
| MainStay U.S. Government Liquidity Fund | 28,276 | 168,049 | (177,257) | — | — | 19,068 | 1,249 | — | 19,068 |
| MainStay VP American Century Sustainable Equity Portfolio Initial Class | 53,955 | 16,290 | (19,449) | (740) | (3,739) | 46,317 | 600 | 15,300 | 5,181 |
| MainStay VP Candriam Emerging Markets Equity Portfolio Initial Class | 43,485 | 2,802 | (5,324) | (1,851) | 4,280 | 43,392 | 734 | — | 6,238 |
| MainStay VP Epoch U.S. Equity Yield Portfolio Initial Class | 52,113 | 5,448 | (15,280) | 953 | (1,139) | 42,095 | 1,167 | 2,795 | 2,539 |
| MainStay VP PineStone International Equity Portfolio Initial Class (a) | 28,578 | 2,327 | (3,385) | (2,187) | 3,388 | 28,721 | — | — | 2,677 |
| MainStay VP S&P 500 Index Portfolio Initial Class | 12,948 | 419 | (2,422) | 278 | 2,473 | 13,696 | 187 | 206 | 160 |
| MainStay VP Small Cap Growth Portfolio Initial Class | 43,165 | 923 | (12,914) | (3,717) | 9,378 | 36,835 | — | 126 | 3,417 |
| MainStay VP Wellington Growth Portfolio Initial Class | 56,440 | 581 | (24,720) | (18,946) | 37,454 | 50,809 | — | — | 2,079 |
| MainStay VP Wellington Mid Cap Portfolio Initial Class | 45,490 | 1,459 | (13,424) | (11,389) | 16,722 | 38,858 | 43 | — | 4,611 |
| MainStay VP Wellington Small Cap Portfolio Initial Class | 40,757 | 3,702 | (14,974) | (4,759) | 9,175 | 33,901 | 263 | — | 3,908 |
| MainStay VP Wellington U.S. Equity Portfolio Initial Class | 28,318 | 767 | (9,027) | (2,996) | 8,938 | 26,000 | 256 | — | 989 |
| MainStay VP Winslow Large Cap Growth Portfolio Initial Class | 55,437 | 2,793 | (25,347) | (3,818) | 22,083 | 51,148 | — | 1,838 | 1,959 |
| MainStay WMC Enduring Capital Fund Class R6 | 26,912 | 621 | (8,461) | (192) | 4,087 | 22,967 | 237 | — | 664 |
| MainStay WMC International Research Equity Fund Class I | 29,109 | 995 | (4,399) | (1,591) | 4,653 | 28,767 | 582 | — | 3,963 |
| MainStay WMC Value Fund Class R6 | 50,562 | 2,501 | (14,999) | (5,946) | 7,999 | 40,117 | 669 | 1,182 | 1,335 |
| | $ 859,467 | $345,699 | $(466,357) | $(35,485) | $152,178 | $ 855,502 | $ 11,672 | $22,309 | |
| | |
| (a) | Prior to August 28, 2023, known as MainStay VP MacKay International Equity Portfolio Initial Class. |
The notes to the financial statements are an integral part of, and should be read in conjunction with, the financial statements.
| 64 | MainStay VP Equity Allocation Portfolio |
Swap Contracts
Open OTC total return equity swap contracts as of December 31, 2023 were as follows1:
Swap
Counterparty | Reference Obligation | Floating Rate2 | Termination
Date(s) | Payment
Frequency
Paid/
Received | Notional
Amount
Long/
(Short)
(000)3 | Unrealized
Appreciation/
(Depreciation)4 |
| Citibank NA | Citi Leveraged Loan Basket | 1 day FEDF minus 0.20% | 12/3/24 | Daily | (11,245) | $ — |
| Citibank NA | Citi Zombie Company Basket | 1 day FEDF minus 0.50% | 12/3/24 | Daily | (15,127) | — |
| JPMorgan Chase Bank NA | Global X Uranium ETF | 1 day FEDF plus 0.50% | 10/8/24 - 11/12/24 | Daily | 21,093 | — |
| Citibank NA | Invesco S&P 500 Low Volatility ETF | 1 day FEDF plus 0.55% | 12/3/24 | Daily | 19,135 | — |
| Citibank NA | iShares MSCI China ETF | 1 day FEDF minus 0.56% | 12/3/24 | Daily | (8,293) | — |
| Citibank NA | iShares MSCI EAFE ETF | 1 day FEDF minus 1.25% | 12/3/24 | Daily | (34,427) | — |
| Citibank NA | iShares MSCI Emerging Markets ETF | 1 day FEDF minus 0.54% | 12/3/24 | Daily | (4,407) | — |
| Citibank NA | iShares MSCI Emerging Markets ex China ETF | 1 day FEDF plus 0.55% | 12/3/24 | Daily | 8,778 | — |
| JPMorgan Chase Bank NA | iShares MSCI Japan ETF | 1 day FEDF plus 0.15% | 4/24/24 - 5/7/24 | Daily | 25,376 | — |
| JPMorgan Chase Bank NA | J.P. Morgan IDEX Pure Size Short | 1 day FEDF plus 0.00% - 0.02% | 6/20/24 | Daily | (5,097) | — |
| JPMorgan Chase Bank NA | Russell 2000 Total Return Index | 1 day FEDF minus 0.15% - plus 0.05% | 4/9/24 - 5/7/24 | Daily | (38,017) | — |
| Citibank NA | S&P 500 Energy Total | 1 day FEDF plus 0.45% | 12/3/24 | Daily | 3,261 | — |
| JPMorgan Chase Bank NA | S&P 500 Equal Weight | 1 day FEDF plus 0.30% - 0.51% | 5/7/24 | Daily | 39,576 | — |
| Citibank NA | S&P 500 Total Return Index | 1 day FEDF plus 0.05% | 12/3/24 | Daily | (27,895) | — |
| Citibank NA | S&P 600 Total Return Index | 1 day FEDF plus 0.45% | 12/3/24 | Daily | 45,325 | — |
| Citibank NA | S&P Midcap 400 Total Return Index | 1 day FEDF plus 0.35% | 12/3/24 | Daily | 7,330 | — |
| JPMorgan Chase Bank NA | VanEck Oil Services ETF | 1 day FEDF plus 0.15% | 11/5/24 | Daily | 8,775 | — |
| Citibank NA | Vanguard FTSE Europe ETF | 1 day FEDF minus 0.50% | 12/3/24 | Daily | (8,659) | — |
| | | | | | | $ — |
The following table represents the basket holdings underlying the total return swap with Citi Leveraged Loan Basket as of December 31, 2023.
| Security Description | Shares | Notional Value | Unrealized Appreciation/
Depreciation | Percent of
Basket Net Assets |
| AerCap Holdings NV | (3,615) | (470,443) | — | 4.18 |
| Apollo Commercial Real Estate Finance Inc | (688) | (89,518) | — | 0.80 |
| Atlantica Sustainable Infrastructure PLC | (434) | (56,441) | — | 0.50 |
| Brandywine Realty Trust | (741) | (96,376) | — | 0.86 |
| Carnival Corp | (12,261) | (1,595,647) | — | 14.19 |
| Chart Industries Inc | (3,417) | (444,681) | — | 3.95 |
| Coherent Corp | (1,782) | (231,923) | — | 2.06 |
| CommScope Holding Co Inc | (214) | (27,847) | — | 0.25 |
| Crane NXT Co | (2,456) | (319,593) | — | 2.84 |
| Cushman & Wakefield PLC | (834) | (108,563) | — | 0.97 |
| Delta Air Lines Inc | (7,762) | (1,010,208) | — | 8.98 |
| Designer Brands Inc | (554) | (72,089) | — | 0.64 |
| DigitalBridge Group Inc | (1,099) | (143,017) | — | 1.27 |
| Elanco Animal Health Inc | (4,195) | (545,903) | — | 4.85 |
| Entegris Inc | (5,364) | (698,105) | — | 6.21 |
| Fidelity National Information Services Inc | (7,323) | (953,017) | — | 8.48 |
| Hanesbrands Inc | (1,711) | (222,693) | — | 1.98 |
| JetBlue Airways Corp | (1,252) | (162,882) | — | 1.45 |
| Lumen Technologies Inc | (2,188) | (284,762) | — | 2.53 |
| MKS Instruments Inc | (1,826) | (237,691) | — | 2.11 |
The notes to the financial statements are an integral part of, and should be read in conjunction with, the financial statements.
65
Portfolio of Investments December 31, 2023†^ (continued)
| Security Description | Shares | Notional Value | Unrealized Appreciation/
Depreciation | Percent of
Basket Net Assets |
| Oatly Group AB | (171) | (22,257) | — | 0.20 |
| Opendoor Technologies Inc | (2,847) | (370,502) | — | 3.30 |
| Par Pacific Holdings Inc | (1,023) | (133,127) | — | 1.18 |
| PureCycle Technologies Inc | (333) | (43,289) | — | 0.39 |
| Scorpio Tankers Inc | (2,283) | (297,062) | — | 2.64 |
| Topgolf Callaway Brands Corp | (717) | (93,354) | — | 0.83 |
| Uber Technologies Inc | (13,136) | (1,709,584) | — | 15.20 |
| United Airlines Holdings Inc | (6,181) | (804,434) | — | 7.15 |
The following table represents the basket holdings underlying the total return swap with Citi Zombie Company Basket as of December 31, 2023.
| Security Description | Shares | Notional Value | Unrealized Appreciation/
Depreciation | Percent of
Basket Net Assets |
| Alteryx Inc | (1,664) | (203,631) | — | 1.35 |
| AppLovin Corp | (3,318) | (405,967) | — | 2.68 |
| Array Technologies Inc | (2,592) | (317,145) | — | 2.10 |
| Asana Inc | (1,431) | (175,135) | — | 1.16 |
| BILL Holdings Inc | (5,407) | (661,551) | — | 4.37 |
| BioCryst Pharmaceuticals Inc | (568) | (69,486) | — | 0.46 |
| Bloom Energy Corp | (1,288) | (157,552) | — | 1.04 |
| Bridgebio Pharma Inc | (4,517) | (552,709) | — | 3.65 |
| Carnival Corp | (9,353) | (1,144,404) | — | 7.57 |
| Children's Place Inc/The | (515) | (62,987) | — | 0.42 |
| Cinemark Holdings Inc | (1,284) | (157,160) | — | 1.04 |
| Coeur Mining Inc | (544) | (66,521) | — | 0.44 |
| Cytokinetics Inc | (3,632) | (444,373) | — | 2.94 |
| DigitalBridge Group Inc | (1,263) | (154,487) | — | 1.02 |
| Emergent BioSolutions Inc | (162) | (19,767) | — | 0.13 |
| Enviva Inc | (29) | (3,587) | — | 0.02 |
| Exact Sciences Corp | (4,202) | (514,217) | — | 3.40 |
| Fastly Inc | (2,187) | (267,634) | — | 1.77 |
| Gap Inc/The | (6,735) | (824,154) | — | 5.45 |
| Guardant Health Inc | (1,732) | (211,952) | — | 1.40 |
| IAC Inc | (1,297) | (158,655) | — | 1.05 |
| Infinera Corp | (390) | (47,733) | — | 0.32 |
| Insmed Inc | (1,262) | (154,386) | — | 1.02 |
| JetBlue Airways Corp | (1,459) | (178,536) | — | 1.18 |
| Kyndryl Holdings Inc | (1,040) | (127,308) | — | 0.84 |
| Lyft Inc | (6,812) | (833,560) | — | 5.51 |
| NeoGenomics Inc | (883) | (107,986) | — | 0.71 |
| Oscar Health Inc | (2,242) | (274,381) | — | 1.81 |
| Pacific Biosciences of California Inc | (1,057) | (129,336) | — | 0.86 |
| Peloton Interactive Inc | (1,832) | (224,217) | — | 1.48 |
| Q2 Holdings Inc | (1,234) | (150,975) | — | 1.00 |
| Redfin Corp | (909) | (111,212) | — | 0.74 |
| Revance Therapeutics Inc | (300) | (36,652) | — | 0.24 |
| RingCentral Inc | (2,418) | (295,837) | — | 1.96 |
| Rivian Automotive Inc | (7,057) | (863,501) | — | 5.71 |
| Royal Caribbean Cruises Ltd | (10,526) | (1,287,939) | — | 8.51 |
| Scotts Miracle-Gro Co/The | (1,660) | (203,129) | — | 1.34 |
| Spirit AeroSystems Holdings Inc | (1,360) | (166,456) | — | 1.10 |
| Spirit Airlines Inc | (780) | (95,414) | — | 0.63 |
| Sweetgreen Inc | (806) | (98,605) | — | 0.65 |
| TG Therapeutics Inc | (2,410) | (294,842) | — | 1.95 |
| Twist Bioscience Corp | (1,852) | (226,657) | — | 1.50 |
| Vistra Corp | (4,901) | (599,721) | — | 3.96 |
| Warner Bros Discovery Inc | (4,085) | (499,825) | — | 3.30 |
| Wix.com Ltd | (2,590) | (316,883) | — | 2.10 |
| Wolfspeed Inc | (3,082) | (377,082) | — | 2.49 |
The notes to the financial statements are an integral part of, and should be read in conjunction with, the financial statements.
| 66 | MainStay VP Equity Allocation Portfolio |
| Security Description | Shares | Notional Value | Unrealized Appreciation/
Depreciation | Percent of
Basket Net Assets |
| WW International Inc | (1,287) | (157,530) | — | 1.04 |
| Wynn Resorts Ltd | (4,805) | (587,968) | — | 3.89 |
| Xerox Holdings Corp | (872) | (106,743) | — | 0.71 |
| 1. | As of December 31, 2023, cash in the amount $2,650,000 was pledged to brokers for OTC swap contracts. |
| 2. | Portfolio pays the floating rate and receives the total return of the reference entity. |
| 3. | Notional amounts reflected as a positive value indicate a long position held by the Portfolio or Index and a negative value indicates a short position. |
| 4. | Reflects the value at reset date as of December 31, 2023. |
| Abbreviation(s): |
| EAFE—Europe, Australasia and Far East |
| ETF—Exchange-Traded Fund |
| FEDF—Federal Funds Rate |
| FTSE—Financial Times Stock Exchange |
| MSCI—Morgan Stanley Capital International |
The following is a summary of the fair valuations according to the inputs used as of December 31, 2023, for valuing the Portfolio’s assets:
| Description | Quoted
Prices in
Active
Markets for
Identical
Assets
(Level 1) | | Significant
Other
Observable
Inputs
(Level 2) | | Significant
Unobservable
Inputs
(Level 3) | | Total |
| Asset Valuation Inputs | | | | | | | |
| Investments in Securities (a) | | | | | | | |
| Affiliated Investment Companies | | | | | | | |
| Equity Funds | $ 836,433,674 | | $ — | | $ — | | $ 836,433,674 |
| Short-Term Investment | | | | | | | |
| Affiliated Investment Company | 19,067,920 | | — | | — | | 19,067,920 |
| Total Investments in Securities | $ 855,501,594 | | $ — | | $ — | | $ 855,501,594 |
| (a) | For a complete listing of investments, see the Portfolio of Investments. |
The notes to the financial statements are an integral part of, and should be read in conjunction with, the financial statements.
67
Statement of Assets and Liabilities as of December 31, 2023
| Assets |
Investment in affiliated investment companies, at value
(identified cost $857,893,624) | $855,501,594 |
| Cash collateral on deposit at broker for swap contracts | 2,650,000 |
| Receivables: | |
| Dividends | 731,116 |
| Portfolio shares sold | 73,219 |
| Other assets | 5,381 |
| Total assets | 858,961,310 |
| Liabilities |
| Payables: | |
| Dividends and interest on OTC swaps contracts | 1,111,994 |
| Portfolio shares redeemed | 695,027 |
| NYLIFE Distributors (See Note 3) | 159,422 |
| Custodian | 24,021 |
| Professional fees | 22,103 |
| Shareholder communication | 372 |
| Accrued expenses | 2,460 |
| Total liabilities | 2,015,399 |
| Net assets | $856,945,911 |
| Composition of Net Assets |
| Shares of beneficial interest outstanding (par value of $.001 per share) unlimited number of shares authorized | $ 92,735 |
| Additional paid-in-capital | 916,803,124 |
| | 916,895,859 |
| Total distributable earnings (loss) | (59,949,948) |
| Net assets | $856,945,911 |
| Initial Class | |
| Net assets applicable to outstanding shares | $ 98,050,781 |
| Shares of beneficial interest outstanding | 10,458,982 |
| Net asset value per share outstanding | $ 9.37 |
| Service Class | |
| Net assets applicable to outstanding shares | $758,895,130 |
| Shares of beneficial interest outstanding | 82,275,990 |
| Net asset value per share outstanding | $ 9.22 |
The notes to the financial statements are an integral part of, and should be read in conjunction with, the financial statements.
| 68 | MainStay VP Equity Allocation Portfolio |
Statement of Operations for the year ended December 31, 2023
| Investment Income (Loss) |
| Income | |
| Dividend distributions from affiliated investment companies | $ 11,672,394 |
| Expenses | |
| Distribution/Service—Service Class (See Note 3) | 1,907,640 |
| Professional fees | 84,703 |
| Custodian | 47,362 |
| Trustees | 22,054 |
| Shareholder communication | 14,691 |
| Miscellaneous | 25,282 |
| Total expenses | 2,101,732 |
| Net investment income (loss) | 9,570,662 |
| Realized and Unrealized Gain (Loss) |
| Net realized gain (loss) on: | |
| Affiliated investment company transactions | (35,485,215) |
| Realized capital gain distributions from affiliated investment companies | 22,309,006 |
| Swap transactions | (13,129,194) |
| Net realized gain (loss) | (26,305,403) |
Net change in unrealized appreciation (depreciation) on:
Affiliated investments companies | 152,178,178 |
| Net realized and unrealized gain (loss) | 125,872,775 |
| Net increase (decrease) in net assets resulting from operations | $135,443,437 |
The notes to the financial statements are an integral part of, and should be read in conjunction with, the financial statements.
69
Statements of Changes in Net Assets
for the years ended December 31, 2023 and December 31, 2022
| | 2023 | 2022 |
| Increase (Decrease) in Net Assets |
| Operations: | | |
| Net investment income (loss) | $ 9,570,662 | $ 8,458,183 |
| Net realized gain (loss) | (26,305,403) | 117,518,501 |
| Net change in unrealized appreciation (depreciation) | 152,178,178 | (328,806,143) |
| Net increase (decrease) in net assets resulting from operations | 135,443,437 | (202,829,459) |
| Distributions to shareholders: | | |
| Initial Class | (13,605,752) | (16,509,845) |
| Service Class | (109,771,556) | (152,373,206) |
| Total distributions to shareholders | (123,377,308) | (168,883,051) |
| Capital share transactions: | | |
| Net proceeds from sales of shares | 18,978,897 | 19,615,742 |
| Net asset value of shares issued to shareholders in reinvestment of distributions | 123,377,308 | 168,883,051 |
| Cost of shares redeemed | (159,284,223) | (120,792,336) |
| Increase (decrease) in net assets derived from capital share transactions | (16,928,018) | 67,706,457 |
| Net increase (decrease) in net assets | (4,861,889) | (304,006,053) |
| Net Assets |
| Beginning of year | 861,807,800 | 1,165,813,853 |
| End of year | $ 856,945,911 | $ 861,807,800 |
The notes to the financial statements are an integral part of, and should be read in conjunction with, the financial statements.
| 70 | MainStay VP Equity Allocation Portfolio |
Financial Highlights selected per share data and ratios
| | Year Ended December 31, |
| Initial Class | 2023 | | 2022 | | 2021 | | 2020 | | 2019 |
| Net asset value at beginning of year | $ 9.43 | | $ 14.39 | | $ 12.62 | | $ 11.80 | | $ 10.50 |
| Net investment income (loss) (a) | 0.13 | | 0.13 | | 0.18 | | 0.18 | | 0.21 |
| Net realized and unrealized gain (loss) | 1.34 | | (2.83) | | 2.33 | | 1.49 | | 2.25 |
| Total from investment operations | 1.47 | | (2.70) | | 2.51 | | 1.67 | | 2.46 |
| Less distributions: | | | | | | | | | |
| From net investment income | (0.55) | | (0.40) | | (0.27) | | (0.27) | | (0.36) |
| From net realized gain on investments | (0.98) | | (1.86) | | (0.47) | | (0.58) | | (0.80) |
| Total distributions | (1.53) | | (2.26) | | (0.74) | | (0.85) | | (1.16) |
| Net asset value at end of year | $ 9.37 | | $ 9.43 | | $ 14.39 | | $ 12.62 | | $ 11.80 |
| Total investment return (b) | 17.40% | | (17.64)% | | 20.16% | | 15.02% | | 24.58% |
| Ratios (to average net assets)/Supplemental Data: | | | | | | | | | |
| Net investment income (loss) | 1.38% | | 1.14% | | 1.26% | | 1.64% | | 1.80% |
| Net expenses (c) | 0.02% | | 0.02% | | 0.02% | | 0.03% | | 0.03% |
| Portfolio turnover rate | 22% | | 23% | | 22% | | 26% | | 38% |
| Net assets at end of year (in 000's) | $ 98,051 | | $ 86,162 | | $ 107,062 | | $ 92,647 | | $ 83,143 |
| (a) | Per share data based on average shares outstanding during the year. |
| (b) | Total return does not reflect any deduction of sales charges, mortality and expense charges, contract charges or administrative charges. For periods of less than one year, total return is not annualized. |
| (c) | In addition to the fees and expenses which the Portfolio bears directly, it also indirectly bears a pro-rata share of the fees and expenses of the underlying funds in which it invests. Such indirect expenses are not included in the above expense ratios. |
| | Year Ended December 31, |
| Service Class | 2023 | | 2022 | | 2021 | | 2020 | | 2019 |
| Net asset value at beginning of year | $ 9.30 | | $ 14.21 | | $ 12.47 | | $ 11.67 | | $ 10.39 |
| Net investment income (loss) (a) | 0.10 | | 0.10 | | 0.13 | | 0.15 | | 0.17 |
| Net realized and unrealized gain (loss) | 1.32 | | (2.79) | | 2.32 | | 1.47 | | 2.24 |
| Total from investment operations | 1.42 | | (2.69) | | 2.45 | | 1.62 | | 2.41 |
| Less distributions: | | | | | | | | | |
| From net investment income | (0.52) | | (0.36) | | (0.24) | | (0.24) | | (0.33) |
| From net realized gain on investments | (0.98) | | (1.86) | | (0.47) | | (0.58) | | (0.80) |
| Total distributions | (1.50) | | (2.22) | | (0.71) | | (0.82) | | (1.13) |
| Net asset value at end of year | $ 9.22 | | $ 9.30 | | $ 14.21 | | $ 12.47 | | $ 11.67 |
| Total investment return (b) | 17.10% | | (17.85)% | | 19.86% | | 14.74% | | 24.27% |
| Ratios (to average net assets)/Supplemental Data: | | | | | | | | | |
| Net investment income (loss) | 1.09% | | 0.86% | | 0.97% | | 1.34% | | 1.49% |
| Net expenses (c) | 0.27% | | 0.27% | | 0.27% | | 0.28% | | 0.28% |
| Portfolio turnover rate | 22% | | 23% | | 22% | | 26% | | 38% |
| Net assets at end of year (in 000's) | $ 758,895 | | $ 775,646 | | $ 1,058,752 | | $ 1,041,818 | | $ 1,033,813 |
| (a) | Per share data based on average shares outstanding during the year. |
| (b) | Total return does not reflect any deduction of sales charges, mortality and expense charges, contract charges or administrative charges. For periods of less than one year, total return is not annualized. |
| (c) | In addition to the fees and expenses which the Portfolio bears directly, it also indirectly bears a pro-rata share of the fees and expenses of the underlying funds in which it invests. Such indirect expenses are not included in the above expense ratios. |
The notes to the financial statements are an integral part of, and should be read in conjunction with, the financial statements.
71
Notes to Financial Statements
Note 1–Organization and Business
MainStay VP Funds Trust (the “Fund”) was organized as a Delaware statutory trust on February 1, 2011. The Fund is registered under the Investment Company Act of 1940, as amended (the “1940 Act”), as an open-end management investment company. The Fund is comprised of thirty-one separate series (collectively referred to as the “Portfolios” and each individually, referred to as a "Portfolio"). These financial statements and notes relate to the MainStay VP Conservative Allocation Portfolio, MainStay VP Moderate Allocation Portfolio, MainStay VP Growth Allocation Portfolio and MainStay VP Equity Allocation Portfolio (collectively referred to as the “Allocation Portfolios” and each individually referred to as an “Allocation Portfolio”). Each is a "diversified” portfolio, as that term is defined in the 1940 Act, as interpreted or modified by regulatory authorities having jurisdiction, from time to time.
Shares of the Allocation Portfolios are currently offered to certain separate accounts to fund variable annuity policies and variable universal life insurance policies issued by New York Life Insurance and Annuity Corporation (“NYLIAC”), a wholly-owned subsidiary of New York Life Insurance Company (“New York Life”) and may also be offered to fund variable annuity policies and variable universal life insurance policies issued by other insurance companies. NYLIAC allocates shares of the Allocation Portfolios to, among others, certain NYLIAC separate accounts. The separate accounts are used to fund flexible premium deferred variable annuity contracts and variable life insurance policies.
The following table lists each Portfolio's share classes that have been registered and commenced operations:
| Fund | Share Classes Commenced Operations1 |
| MainStay VP Conservative Allocation Portfolio | Initial Class, Service Class |
MainStay VP Moderate
Allocation Portfolio | Initial Class, Service Class |
MainStay VP Growth
Allocation Portfolio | Initial Class, Service Class |
MainStay VP Equity
Allocation Portfolio | Initial Class, Service Class |
| 1. | For each VP Allocation Portfolio, Initial Class and Service Class shares were registered for sale as of February 13, 2006. |
Shares of the Allocation Portfolios are offered and are redeemed at a price equal to their respective net asset value (“NAV”) per share. No sales or redemption charge is applicable to the purchase or redemption of the Allocation Portfolios' shares. Under the terms of the Fund’s multiple class plan, adopted pursuant to Rule 18f-3 under the 1940 Act, the classes differ in that, among other things, Service Class shares of the Allocation Portfolios pay a combined distribution and service fee of 0.25% of average daily net assets attributable to Service Class shares of the Allocation Portfolios to the Distributor (as defined in Note 3(B)) pursuant to a plan adopted in accordance with Rule 12b-1 under the 1940 Act. Contract owners of variable annuity contracts purchased after June 2, 2003, are permitted to invest only in the Service Class shares.
The investment objective for each of the Allocation Portfolios is as follows:
The MainStay VP Conservative Allocation Portfolio seeks current income and, secondarily, long-term growth of capital.
The MainStay VP Moderate Allocation Portfolio seeks long-term growth of capital and, secondarily, current income.
The MainStay VP Growth Allocation Portfolio seeks long-term growth of capital and, secondarily, current income.
The MainStay VP Equity Allocation Portfolio seeks long-term growth of capital.
The Allocation Portfolios are "fund-of-funds" that seek to achieve their investment objectives by investing in mutual funds and exchange-traded funds ("ETFs") managed by New York Life Investment Management LLC ("New York Life Investments" or "Manager") or its affiliates (the “Underlying Portfolios/Funds”).
Note 2–Significant Accounting Policies
The Allocation Portfolios are investment companies and accordingly follow the investment company accounting and reporting guidance of the Financial Accounting Standards Board (“FASB”) Accounting Standards Codification Topic 946 Financial Services—Investment Companies. The Allocation Portfolios prepare their financial statements in accordance with generally accepted accounting principles (“GAAP”) in the United States of America and follow the significant accounting policies described below.
(A) Securities Valuation. Investments are usually valued as of the close of regular trading on the New York Stock Exchange (the "Exchange") (usually 4:00 p.m. Eastern time) on each day the Allocation Portfolios are open for business ("valuation date").
Pursuant to Rule 2a-5 under the 1940 Act, the Board of Trustees of the Fund (the "Board") has designated New York Life Investment Management LLC (“New York Life Investments” or the "Manager") as its Valuation Designee (the "Valuation Designee"). The Valuation Designee is responsible for performing fair valuations relating to all investments in each Allocation Portfolio’s portfolio for which market quotations are not readily available; periodically assessing and managing material valuation risks; establishing and applying fair value methodologies; testing fair valuation methodologies; evaluating and overseeing pricing services; ensuring appropriate segregation of valuation and portfolio management functions; providing quarterly, annual and prompt reporting to the Board, as appropriate; identifying potential conflicts of interest; and maintaining appropriate records. The Valuation Designee has established a valuation committee ("Valuation Committee") to assist in carrying out the Valuation Designee’s responsibilities and establish prices of securities for which market quotations are not readily available. The Allocation Portfolios' and the Valuation Designee's policies and procedures ("Valuation Procedures") govern the Valuation Designee’s selection and application of methodologies for determining and calculating the fair value of Allocation Portfolio investments. The Valuation Designee may value the Allocation Portfolios' portfolio securities for which market quotations are not readily available and other Allocation Portfolio assets utilizing inputs from pricing services and other third-party sources. The Valuation Committee meets
| 72 | MainStay VP Asset Allocation Portfolios |
(in person, via electronic mail or via teleconference) on an ad-hoc basis to determine fair valuations and on a quarterly basis to review fair value events with respect to certain securities for which market quotations are not readily available, including valuation risks and back-testing results, and to preview reports to the Board.
The Valuation Committee establishes prices of securities for which market quotations are not readily available based on such methodologies and measurements on a regular basis after considering information that is reasonably available and deemed relevant by the Valuation Committee. The Board shall oversee the Valuation Designee and review fair valuation materials on a prompt, quarterly and annual basis and approve proposed revisions to the Valuation Procedures.
Investments for which market quotations are not readily available are valued at fair value as determined in good faith pursuant to the Valuation Procedures. A market quotation is readily available only when that quotation is a quoted price (unadjusted) in active markets for identical investments that each Allocation Portfolio can access at the measurement date, provided that a quotation will not be readily available if it is not reliable. "Fair value" is defined as the price the Allocation Portfolio would reasonably expect to receive upon selling an asset or liability in an orderly transaction to an independent buyer in the principal or most advantageous market for the asset or liability. Fair value measurements are determined within a framework that establishes a three-tier hierarchy that maximizes the use of observable market data and minimizes the use of unobservable inputs to establish a classification of fair value measurements for disclosure purposes. "Inputs" refer broadly to the assumptions that market participants would use in pricing the asset or liability, including assumptions about risk, such as the risk inherent in a particular valuation technique used to measure fair value using a pricing model and/or the risk inherent in the inputs for the valuation technique. Inputs may be observable or unobservable. Observable inputs reflect the assumptions market participants would use in pricing the asset or liability based on market data obtained from sources independent of each Allocation Portfolio. Unobservable inputs reflect each Allocation Portfolio’s own assumptions about the assumptions market participants would use in pricing the asset or liability based on the information available. The inputs or methodology used for valuing assets or liabilities may not be an indication of the risks associated with investing in those assets or liabilities. The three-tier hierarchy of inputs is summarized below.
| • | Level 1—quoted prices (unadjusted) in active markets for an identical asset or liability |
| • | Level 2—other significant observable inputs (including quoted prices for a similar asset or liability in active markets, interest rates and yield curves, prepayment speeds, credit risk, etc.) |
| • | Level 3—significant unobservable inputs (including each Allocation Portfolio's own assumptions about the assumptions that market participants would use in measuring fair value of an asset or liability) |
The level of an asset or liability within the fair value hierarchy is based on the lowest level of an input, both individually and in the aggregate, that is significant to the fair value measurement. The aggregate value by input level of each Allocation Portfolio’s assets and liabilities as of December 31, 2023, is included at the end of the Portfolio of Investments.
Investments in Underlying Portfolios/Funds are valued at their respective NAVs at the close of business each day, except for investment in ETFs. Investments in ETFs are valued at the last quoted sales price as of the close of regular trading on the relevant exchange on each valuation date. These securities are generally categorized as Level 1 in the hierarchy.
Securities held by the Underlying Portfolios/Funds are valued using policies consistent with those used by the Underlying Portfolios/Funds. Equity securities, including shares of ETFs, are generally valued at the last quoted sales price as of the close of regular trading on the relevant exchange on each valuation date.
Total return swap contracts, which are arrangements to exchange a market-linked return for a periodic payment, are based on a notional principal amount. To the extent that the total return of the security, index or other financial measure underlying the transaction exceeds or falls short of the offsetting interest rate obligation, the Allocation Portfolios will receive a payment from or make a payment to the counterparty. Total return swap contracts are marked to market daily based upon quotations from market makers and these securities are generally categorized as Level 2 in the hierarchy.
Temporary cash investments acquired in excess of 60 days to maturity at the time of purchase are valued using the latest bid prices or using valuations based on a matrix system (which considers such factors as security prices, yields, maturities and ratings), both as furnished by independent pricing services. Temporary cash investments that mature in 60 days or less at the time of purchase ("Short-Term Investments") are valued using the amortized cost method of valuation, unless the use of such method would be inappropriate. The amortized cost method involves valuing a security at its cost on the date of purchase and thereafter assuming a constant amortization to maturity of the difference between such cost and the value on maturity date. Amortized cost approximates the current fair value of a security. Securities valued using the amortized cost method are not valued using quoted prices in an active market and are generally categorized as Level 2 in the hierarchy.
The information above is not intended to reflect an exhaustive list of the methodologies that may be used to value portfolio investments. The Valuation Procedures permit the use of a variety of valuation methodologies in connection with valuing portfolio investments. The methodology used for a specific type of investment may vary based on the market data available or other considerations. The methodologies summarized above may not represent the specific means by which portfolio investments are valued on any particular business day.
(B) Income Taxes. The Allocation Portfolios' policy is to comply with the requirements of the Internal Revenue Code of 1986, as amended (the “Internal Revenue Code”), applicable to regulated investment companies and to distribute all of its taxable income to the shareholders of each Allocation Portfolio within the allowable time limits.
The Manager evaluates each Allocation Portfolio’s tax positions to determine if the tax positions taken meet the minimum recognition threshold in connection with accounting for uncertainties in income tax positions taken or expected to be taken for the purposes of measuring and recognizing tax liabilities in the financial statements. Recognition of tax benefits of an uncertain tax position is permitted only to the extent the position is “more likely than not” to be sustained assuming examination
Notes to Financial Statements (continued)
by taxing authorities. The Manager analyzed the Allocation Portfolios' tax positions taken on federal, state and local income tax returns for all open tax years (for up to three tax years) and has concluded that no provisions for federal, state and local income tax are required in the Allocation Portfolios' financial statements. The Allocation Portfolios' federal, state and local income tax and federal excise tax returns for tax years for which the applicable statutes of limitations have not expired are subject to examination by the Internal Revenue Service and state and local departments of revenue.
(C) Dividends and Distributions to Shareholders. Dividends and distributions are recorded on the ex-dividend date. The Allocation Portfolios intend to declare and pay dividends from net investment income and distributions from net realized capital and currency gains, if any, at least annually. All dividends and distributions are reinvested at NAV in the same class of shares of the respective Allocation Portfolio. Dividends and distributions to shareholders are determined in accordance with federal income tax regulations and may differ from determinations using GAAP.
(D) Security Transactions and Investment Income. The Allocation Portfolios record security transactions on the trade date. Realized gains and losses on security transactions are determined using the identified cost method. Dividends and distributions received by the Allocation Portfolios from the Underlying Portfolios are recorded on the ex-dividend date. Distributions received from real estate investment trusts may be classified as dividends, capital gains and/or return of capital.
Investment income and realized and unrealized gains and losses on investments of the Allocation Portfolios are allocated pro rata to the separate classes of shares based upon their relative net assets on the date the income is earned or realized and unrealized gains and losses are incurred.
(E) Expenses. Expenses of the Fund are allocated to the individual Portfolios in proportion to the net assets of the respective Allocation Portfolios when the expenses are incurred, except where direct allocations of expenses can be made. Expenses (other than fees incurred under the distribution and service plans, further discussed in Note 3(B), which are charged directly to the Service Class shares) are allocated to separate classes of shares pro rata based upon their relative net assets on the date the expenses are incurred. The expenses borne by the Allocation Portfolios, including those of related parties to the Allocation Portfolios, are shown in the Statement of Operations.
Additionally, the Allocation Portfolios may invest in ETFs and mutual funds, which are subject to management fees and other fees that may cause the costs of investing in ETFs and mutual funds to be greater than the costs of owning the underlying securities directly. These indirect expenses of ETFs and mutual funds are not included in the amounts shown as expenses in the Statement of Operations or in the expense ratios included in the Financial Highlights. In addition, the Allocation Portfolios bear a pro rata share of the fees and expenses of the Underlying Portfolios/Funds in which they invest. Because the Underlying Portfolios/Funds have varied expense and fee levels and the Allocation Portfolios may own different pro-portions of the Underlying
Portfolios/Funds at different times, the amount of fees and expenses incurred indirectly by each Allocation Portfolio may vary.
(F) Use of Estimates. In preparing financial statements in conformity with GAAP, the Manager makes estimates and assumptions that affect the reported amounts and disclosures in the financial statements. Actual results could differ from those estimates and assumptions.
(G) Swap Contracts. The Allocation Portfolios may enter into credit default, interest rate, equity, index and currency exchange rate swap contracts (“swaps”). In a typical swap transaction, two parties agree to exchange the future returns (or differentials in rates of future returns) earned or realized at periodic intervals on a particular investment or instrument based on a notional principal amount. Generally, the Allocation Portfolios will enter into a swap on a net basis, which means that the two payment streams under the swap are netted, with the Allocation Portfolios receiving or paying (as the case may be) only the net amount of the two payment streams. Therefore, the Allocation Portfolios' current obligation under a swap generally will be equal to the net amount to be paid or received under the swap, based on the relative value of notional positions attributable to each counterparty to the swap. The payments may be adjusted for transaction costs, interest payments, the amount of interest paid on the investment or instrument or other factors. Collateral, in the form of cash or securities, may be required to be held in segregated accounts with the custodian bank or broker in accordance with the terms of the swap. Swap agreements are privately negotiated in the over the counter (“OTC”) market and may be executed in a multilateral or other trade facilities platform, such as a registered commodities exchange (“centrally cleared swaps”).
Certain standardized swaps, including certain credit default and interest rate swaps, are subject to mandatory clearing and exchange-trading, and more types of standardized swaps are expected to be subject to mandatory clearing and exchange-trading in the future. The counterparty risk for exchange-traded and cleared derivatives is expected to be generally lower than for uncleared derivatives, but cleared contracts are not risk-free. In a cleared derivative transaction, the Allocation Portfolios typically enters into the transaction with a financial institution counterparty, and performance of the transaction is effectively guaranteed by a central clearinghouse, thereby reducing or eliminating the Allocation Portfolios' exposure to the credit risk of its original counterparty. The Allocation Portfolios will be required to post specified levels of margin with the clearinghouse or at the instruction of the clearinghouse; the margin required by a clearinghouse may be greater than the margin the Allocation Portfolios would be required to post in an uncleared transaction.
Swaps are marked to market daily based upon quotations from pricing agents, brokers, or market makers and the change in value, if any, is recorded as unrealized appreciation or depreciation. Any payments made or received upon entering into a swap would be amortized or accreted over the life of the swap and recorded as a realized gain or loss. Early termination of a swap is recorded as a realized gain or loss. Daily changes in valuation of centrally cleared swaps, if any, are recorded as a receivable or payable for the change in value as appropriate on the Statement of Assets and Liabilities.
| 74 | MainStay VP Asset Allocation Portfolios |
The Allocation Portfolios bears the risk of loss of the amount expected to be received under a swap in the event of the default or bankruptcy of the swap counterparty. The Allocation Portfolios may be able to eliminate its exposure under a swap either by assignment or other disposition, or by entering into an offsetting swap with the same party or a similar credit-worthy party. Swaps are not actively traded on financial markets. Entering into swaps involves elements of credit, market, leverage, liquidity, operational, counterparty and legal/documentation risk in excess of the amounts recognized on the Statement of Assets and Liabilities. Such risks involve the possibilities that there will be no liquid market for these swaps, that the counterparty to the swaps may default on its obligation to perform or disagree as to the meaning of the contractual terms in the swaps and that there may be unfavorable changes in interest rates, the price of the index or the security underlying these transactions, among other risks.
Equity Swaps (Total Return Swaps). Total return swap contracts are agreements between counterparties to exchange cash flow, one based on a market-linked return of an individual asset or group of assets (such as an index), and the other on a fixed or floating rate. As a total return swap, an equity swap may be structured in different ways. For example, when the Allocation Portfolios enter into a “long” equity swap, the counterparty may agree to pay the Allocation Portfolios the amount, if any, by which the notional amount of the equity swap would have increased in value had it been invested in a particular referenced security or securities, plus the dividends that would have been received on those securities. In return, the Allocation Portfolios will generally agree to pay the counterparty interest on the notional amount of the equity swap plus the amount, if any, by which that notional amount would have decreased in value had it been invested in such referenced security or securities, plus, in certain instances, commissions or trading spreads on the notional amounts. Therefore, the Allocation Portfolios' return on the equity swap generally should equal the gain or loss on the notional amount, plus dividends on the referenced security or securities less the interest paid by the Allocation Portfolios on the notional amount. Alternatively, when the Allocation Portfolios enter into a “short” equity swap, the counterparty will generally agree to pay the Allocation Portfolios the amount, if any, by which the notional amount of the equity swap would have decreased in value had the Allocation Portfolios sold a particular referenced security or securities short, less the dividend expense that the Allocation Portfolios would have incurred on the referenced security or securities, as adjusted for interest payments or other economic factors. In this situation, the Allocation Portfolios will generally be obligated to pay the amount, if any, by which the notional amount of the swap would have increased in value had it been invested directly in the referenced security or securities.
Equity swaps generally do not involve the delivery of securities or other referenced assets. Accordingly, the risk of loss with respect to equity swaps is normally limited to the net amount of payments that the Allocation Portfolios are contractually obligated to make. If the other party to an equity swap defaults, the Allocation Portfolios' risk of loss consists of the net amount of payments that the Allocation Portfolios are contractually entitled to receive, if any. The Allocation Portfolios will segregate cash or liquid assets, enter into offsetting transactions or use other measures permitted by applicable law to “cover” the Allocation Portfolios' current obligations. The Allocation Portfolios and New York Life Investments, however, believe these transactions do not constitute senior
securities under the 1940 Act and, accordingly, will not treat them as being subject to the Allocation Portfolios' borrowing restrictions.
Equity swaps are derivatives and their value can be very volatile. The Allocation Portfolios may engage in total return swaps to gain exposure to emerging markets securities, along with offsetting long total return swap positions to maintain appropriate currency balances and risk exposures across all swap positions. To the extent that the Manager does not accurately analyze and predict future market trends, the values or assets or economic factors, the Allocation Portfolios may suffer a loss, which may be substantial.
(H) Indemnifications. Under the Fund’s organizational documents, its officers and trustees are indemnified against certain liabilities that may arise out of performance of their duties to the Fund. Additionally, in the normal course of business, the Allocation Portfolios enter into contracts with third-party service providers that contain a variety of representations and warranties and that may provide general indemnifications. The Allocation Portfolios' maximum exposure under these arrangements is unknown, as this would involve future claims that may be made against the Allocation Portfolios that have not yet occurred. The Manager believes that the risk of loss in connection with these potential indemnification obligations is remote. However, there can be no assurance that material liabilities related to such obligations will not arise in the future, which could adversely impact the Allocation Portfolios.
(I) Quantitative Disclosure of Derivative Holdings. The following tables show additional disclosures related to the Allocation Portfolios' derivative and hedging activities, including how such activities are accounted for and their effect on the Allocation Portfolios' financial positions, performance and cash flows.
The Allocation Portfolios entered into total return swap contracts to seek to enhance returns or reduce the risk of loss by hedging certain of the Allocation Portfolios' holdings.
MainStay VP Conservative Allocation Portfolio
The effect of derivative instruments on the Statement of Operations for the year ended December 31, 2023:
| Net Realized Gain (Loss) from: | Equity
Contracts
Risk | Total |
| Swap Transactions | $(6,550,999) | $(6,550,999) |
| Total Net Realized Gain (Loss) | $(6,550,999) | $(6,550,999) |
| Average Notional Amount | Total |
| Swap Contracts Long | $ 93,532,494 |
| Swap Contracts Short | $(67,748,971) |
Notes to Financial Statements (continued)
MainStay VP Moderate Allocation Portfolio
The effect of derivative instruments on the Statement of Operations for the year ended December 31, 2023:
| Net Realized Gain (Loss) from: | Equity
Contracts
Risk | Total |
| Swap Transactions | $(10,759,266) | $(10,759,266) |
| Total Net Realized Gain (Loss) | $(10,759,266) | $(10,759,266) |
| Average Notional Amount | Total |
| Swap Contracts Long | $ 158,066,588 |
| Swap Contracts Short | $(114,525,315) |
MainStay VP Growth Allocation Portfolio
The effect of derivative instruments on the Statement of Operations for the year ended December 31, 2023:
| Net Realized Gain (Loss) from: | Equity
Contracts
Risk | Total |
| Swap Transactions | $(16,421,018) | $(16,421,018) |
| Total Net Realized Gain (Loss) | $(16,421,018) | $(16,421,018) |
| Average Notional Amount | Total |
| Swap Contracts Long | $ 250,082,081 |
| Swap Contracts Short | $(182,926,304) |
MainStay VP Equity Allocation Portfolio
The effect of derivative instruments on the Statement of Operations for the year ended December 31, 2023:
| Net Realized Gain (Loss) from: | Equity
Contracts
Risk | Total |
| Swap Transactions | $(13,129,194) | $(13,129,194) |
| Total Net Realized Gain (Loss) | $(13,129,194) | $(13,129,194) |
| Average Notional Amount | Total |
| Swap Contracts Long | $ 152,278,515 |
| Swap Contracts Short | $(127,175,182) |
Note 3–Fees and Related Party Transactions
(A) Manager. New York Life Investments, a registered investment adviser and an indirect, wholly-owned subsidiary of New York Life, serves as the Allocation Portfolios' Manager pursuant to an Amended and Restated Management Agreement (“Management Agreement”) and is responsible for the day-to-day portfolio management of the Allocation Portfolios. The Manager provides offices, conducts clerical, recordkeeping and bookkeeping services, and keeps most of the financial and accounting records required to be maintained by the Allocation Portfolios. Except for the portion of salaries and expenses that are the responsibility
of the Allocation Portfolios, the Manager pays the salaries and expenses of all personnel affiliated with the Allocation Portfolios and certain operational expenses of the Allocation Portfolios. The Allocation Portfolios reimburse New York Life Investments in an amount equal to the portion of the compensation of the Chief Compliance Officer attributable to the Allocation Portfolios.
The Allocation Portfolios do not pay any fees to the Manager in return for the services performed under the Management Agreement. The Allocation Portfolios do, however, indirectly pay a proportionate share of the management fees paid to the managers of the Underlying Funds in which the Allocation Portfolios invest.
JPMorgan Chase Bank, N.A. ("JPMorgan") provides sub-administration and sub-accounting services to the Allocation Portfolios pursuant to an agreement with New York Life Investments. These services include calculating the daily NAVs of the Allocation Portfolios, maintaining the general ledger and sub-ledger accounts for the calculation of the Allocation Portfolios' respective NAVs, and assisting New York Life Investments in conducting various aspects of the Allocation Portfolios' administrative operations. For providing these services to the Allocation Portfolios, JPMorgan is compensated by New York Life Investments.
Pursuant to an agreement between the Fund and New York Life Investments, New York Life Investments is responsible for providing or procuring certain regulatory reporting services for the Allocation Portfolios. The Allocation Portfolios will reimburse New York Life Investments for the actual costs incurred by New York Life Investments in connection with providing or procuring these services for the Allocation Portfolios.
(B) Distribution and Service Fees. The Fund, on behalf of the Allocation Portfolios, has entered into a distribution agreement with NYLIFE Distributors LLC (the “Distributor”), an affiliate of New York Life Investments. The Allocation Portfolios have adopted a distribution plan (the “Plan”) in accordance with the provisions of Rule 12b-1 under the 1940 Act. Under the Plan, the Distributor has agreed to provide, through its affiliates or independent third parties, various distribution-related, shareholder and administrative support services to the Service Class shareholders. For its services, the Distributor is entitled to a combined distribution and service fee accrued daily and paid monthly at an annual rate of 0.25% of the average daily net assets attributable to the Service Class shares of the respective Allocation Portfolio.
| 76 | MainStay VP Asset Allocation Portfolios |
Note 4-Federal Income Tax
As of December 31, 2023, the cost and unrealized appreciation (depreciation) of each Allocation Portfolio’s investment portfolio, including applicable derivative contracts and other financial instruments, as determined on a federal income tax basis, were as follows:
| MainStay VP Conservative Allocation Portfolio |
| | Federal Tax
Cost | Gross
Unrealized
Appreciation | Gross
Unrealized
(Depreciation) | Net
Unrealized
Appreciation/
(Depreciation) |
| Investments in Securities | $475,205,615 | $13,268,558 | $(37,977,210) | $(24,708,652) |
| MainStay VP Moderate Allocation Portfolio |
| | Federal Tax
Cost | Gross
Unrealized
Appreciation | Gross
Unrealized
(Depreciation) | Net
Unrealized
Appreciation/
(Depreciation) |
| Investments in Securities | $799,543,552 | $31,557,790 | $(55,768,197) | $(24,210,407) |
| MainStay VP Growth Allocation Portfolio |
| | Federal Tax
Cost | Gross
Unrealized
Appreciation | Gross
Unrealized
(Depreciation) | Net
Unrealized
Appreciation/
(Depreciation) |
| Investments in Securities | $1,213,857,620 | $34,393,088 | $(31,930,471) | $2,462,617 |
| MainStay VP Equity Allocation Portfolio |
| | Federal Tax
Cost | Gross
Unrealized
Appreciation | Gross
Unrealized
(Depreciation) | Net
Unrealized
Appreciation/
(Depreciation) |
| Investments in Securities | $868,178,061 | $44,151,063 | $(58,756,947) | $(14,605,884) |
As of December 31, 2023, the components of accumulated gain (loss) on a tax basis were as follows:
| Fund | Ordinary
Income | Accumulated
Capital
and Other
Gain (Loss) | Other
Temporary
Differences | Unrealized
Appreciation
(Depreciation) | Total
Accumulated
Gain (Loss) |
| MainStay VP Conservative Allocation Portfolio | $5,652,321 | $ (8,862,165) | $(22,582,133) | $(23,696,622) | $(49,488,599) |
| MainStay VP Moderate Allocation Portfolio | 6,285,647 | (11,584,615) | (40,928,445) | (21,859,126) | (68,086,539) |
| MainStay VP Growth Allocation Portfolio | 6,394,384 | (15,177,758) | (54,449,070) | 5,265,674 | (57,966,770) |
| MainStay VP Equity Allocation Portfolio | — | (14,112,480) | (33,161,001) | (12,676,467) | (59,949,948) |
The difference between book-basis and tax-basis unrealized appreciation (depreciation) is primarily due to wash sale adjustments and straddle loss deferrals. The other temporary differences are primarily due to loss deferrals from related party transactions.
The following table discloses the current year reclassifications between total distributable earnings (loss) and additional paid-in capital arising from permanent differences; net assets as of December 31, 2023 were not affected.
| Fund | Total
Distributable
Earnings (Loss) | Additional
Paid-In
Capital |
| MainStay VP Conservative Allocation Portfolio | $ — | $ — |
| MainStay VP Moderate Allocation Portfolio | — | — |
| MainStay VP Growth Allocation Portfolio | — | — |
| MainStay VP Equity Allocation Portfolio | 1,405,397 | (1,405,397) |
The reclassifications for the Portfolio are primarily due to net operating losses.
As of December 31, 2023, for federal income tax purposes, capital loss carryforwards of $7,850,135, as shown in the table below, were available to the extent provided by the regulations to offset future realized gains of the MainStay VP Conservative Allocation Portfolio. Accordingly, no capital gains distributions are expected to be paid to shareholders until net gains have been realized in excess of such amounts.
Capital Loss
Available Through | Short-Term
Capital Loss
Amounts (000’s) | Long-Term
Capital Loss
Amounts (000’s) |
| Unlimited | $— | $7,850 |
As of December 31, 2023, for federal income tax purposes, capital loss carryforwards of $9,233,334, as shown in the table below, were available to the extent provided by the regulations to offset future realized gains of the MainStay VP Moderate Allocation Portfolio. Accordingly, no capital
Notes to Financial Statements (continued)
gains distributions are expected to be paid to shareholders until net gains have been realized in excess of such amounts.
Capital Loss
Available Through | Short-Term
Capital Loss
Amounts (000’s) | Long-Term
Capital Loss
Amounts (000’s) |
| Unlimited | $— | $9,233 |
As of December 31, 2023, for federal income tax purposes, capital loss carryforwards of $12,374,701, as shown in the table below, were available to the extent provided by the regulations to offset future realized gains of the MainStay VP Growth Allocation Portfolio. Accordingly, no capital gains distributions are expected to be paid to shareholders until net gains have been realized in excess of such amounts.
Capital Loss
Available Through | Short-Term
Capital Loss
Amounts (000’s) | Long-Term
Capital Loss
Amounts (000’s) |
| Unlimited | $— | $12,375 |
As of December 31, 2023, for federal income tax purposes, capital loss carryforwards of $12,183,063, as shown in the table below, were available to the extent provided by the regulations to offset future realized gains of the MainStay VP Equity Allocation Portfolio. Accordingly, no capital gains distributions are expected to be paid to shareholders until net gains have been realized in excess of such amounts.
Capital Loss
Available Through | Short-Term
Capital Loss
Amounts (000’s) | Long-Term
Capital Loss
Amounts (000’s) |
| Unlimited | $— | $12,183 |
During the years ended December 31, 2023 and December 31, 2022, the tax character of distributions paid as reflected in the Statements of Changes in Net Assets was as follows:
| | 2023 | | 2022 |
| Fund | Ordinary
Income | Long-Term
Capital Gains | Total | | Ordinary
Income | Long-Term
Capital Gains | Total |
| MainStay VP Conservative Allocation Portfolio | $16,565,678 | $11,292,220 | $ 27,857,898 | | $38,778,554 | $ 37,389,298 | $ 76,167,852 |
| MainStay VP Moderate Allocation Portfolio | 31,672,946 | 26,580,771 | 58,253,717 | | 60,632,330 | 73,833,369 | 134,465,699 |
| MainStay VP Growth Allocation Portfolio | 62,031,594 | 65,377,676 | 127,409,270 | | 90,433,602 | 141,656,010 | 232,089,612 |
| MainStay VP Equity Allocation Portfolio | 54,897,083 | 68,480,225 | 123,377,308 | | 54,259,646 | 114,623,405 | 168,883,051 |
Note 5–Custodian
JPMorgan is the custodian of cash and securities held by the Allocation Portfolios. Custodial fees are charged to each Allocation Portfolio based on each Allocation Portfolio's net assets and/or the market value of securities held by each Allocation Portfolio and the number of certain transactions incurred by each Allocation Portfolio.
Note 6–Line of Credit
The Allocation Portfolios and certain other funds managed by New York Life Investments maintain a line of credit with a syndicate of banks in order to secure a source of funds for temporary purposes to meet unanticipated or excessive redemption requests.
Effective July 25, 2023, under the credit agreement (the “Credit Agreement”), the aggregate commitment amount is $600,000,000 with an additional uncommitted amount of $100,000,000. The commitment fee is an annual rate of 0.15% of the average commitment amount payable quarterly, regardless of usage, to JPMorgan, who serves as the agent to the syndicate. The commitment fee is allocated among the Allocation Portfolios and certain other funds managed by New York Life Investments based upon their respective net assets and other factors.
Interest on any revolving credit loan is charged based upon the Federal Funds Rate, Daily SOFR + 0.10%, or the Overnight Bank Funding Rate, whichever is higher. The Credit Agreement expires on July 23, 2024, although the Allocation Portfolios, certain other funds managed by New York Life Investments and the syndicate of banks may renew the Credit Agreement for an additional year on the same or different terms or enter into a credit agreement with a different syndicate of banks. Prior to July 25, 2023, the aggregate commitment amount and the commitment fee were the same as those under the current Credit Agreement. During the year ended December 31, 2023, there were no borrowings made or outstanding with respect to the Allocation Portfolios under the Credit Agreement.
Note 7–Interfund Lending Program
Pursuant to an exemptive order issued by the SEC, the Allocation Portfolios, along with certain other funds managed by New York Life Investments, may participate in an interfund lending program. The interfund lending program provides an alternative credit facility that permits the Allocation Portfolios and certain other funds managed by New York Life Investments to lend or borrow money for temporary purposes directly to or from one another, subject to the conditions of the exemptive
| 78 | MainStay VP Asset Allocation Portfolios |
order. During the year ended December 31, 2023, there were no interfund loans made or outstanding with respect to the Allocation Portfolios.
Note 8–Purchases and Sales of Securities (in 000’s)
During the year ended December 31, 2023, purchases and sales of securities were as follows:
| Fund | Purchases | Sales |
| MainStay VP Conservative Allocation Portfolio | $ 77,644 | $160,833 |
| MainStay VP Moderate Allocation Portfolio | 161,119 | 266,498 |
| MainStay VP Growth Allocation Portfolio | 267,367 | 462,194 |
| MainStay VP Equity Allocation Portfolio | 177,650 | 289,100 |
Note 9–Capital Share Transactions
Transactions in capital shares for the years ended December 31, 2023 and December 31, 2022, were as follows:
MainStay VP Conservative Allocation Portfolio
| Initial Class | Shares | Amount |
| Year ended December 31, 2023: | | |
| Shares sold | 97,138 | $ 966,706 |
| Shares issued to shareholders in reinvestment of distributions | 94,860 | 870,951 |
| Shares redeemed | (186,696) | (1,839,680) |
| Net increase (decrease) | 5,302 | $ (2,023) |
| Year ended December 31, 2022: | | |
| Shares sold | 66,953 | $ 761,710 |
| Shares issued to shareholders in reinvestment of distributions | 213,286 | 1,966,692 |
| Shares redeemed | (210,688) | (2,472,033) |
| Net increase (decrease) | 69,551 | $ 256,369 |
| |
| Service Class | Shares | Amount |
| Year ended December 31, 2023: | | |
| Shares sold | 2,339,997 | $ 22,824,781 |
| Shares issued to shareholders in reinvestment of distributions | 2,973,998 | 26,986,947 |
| Shares redeemed | (12,667,193) | (123,066,518) |
| Net increase (decrease) | (7,353,198) | $ (73,254,790) |
| Year ended December 31, 2022: | | |
| Shares sold | 3,229,695 | $ 36,058,577 |
| Shares issued to shareholders in reinvestment of distributions | 8,142,074 | 74,201,160 |
| Shares redeemed | (11,801,655) | (130,992,287) |
| Net increase (decrease) | (429,886) | $ (20,732,550) |
MainStay VP Moderate Allocation Portfolio
| Initial Class | Shares | Amount |
| Year ended December 31, 2023: | | |
| Shares sold | 157,854 | $ 1,510,821 |
| Shares issued to shareholders in reinvestment of distributions | 392,395 | 3,448,370 |
| Shares redeemed | (409,830) | (3,910,568) |
| Net increase (decrease) | 140,419 | $ 1,048,623 |
| Year ended December 31, 2022: | | |
| Shares sold | 177,636 | $ 2,077,596 |
| Shares issued to shareholders in reinvestment of distributions | 823,223 | 7,194,477 |
| Shares redeemed | (424,835) | (4,547,952) |
| Net increase (decrease) | 576,024 | $ 4,724,121 |
| |
| Service Class | Shares | Amount |
| Year ended December 31, 2023: | | |
| Shares sold | 4,058,373 | $ 38,213,740 |
| Shares issued to shareholders in reinvestment of distributions | 6,300,624 | 54,805,347 |
| Shares redeemed | (18,032,931) | (169,238,514) |
| Net increase (decrease) | (7,673,934) | $ (76,219,427) |
| Year ended December 31, 2022: | | |
| Shares sold | 3,891,896 | $ 42,602,916 |
| Shares issued to shareholders in reinvestment of distributions | 14,708,845 | 127,271,222 |
| Shares redeemed | (13,786,867) | (148,626,844) |
| Net increase (decrease) | 4,813,874 | $ 21,247,294 |
MainStay VP Growth Allocation Portfolio
| Initial Class | Shares | Amount |
| Year ended December 31, 2023: | | |
| Shares sold | 212,317 | $ 2,110,658 |
| Shares issued to shareholders in reinvestment of distributions | 1,110,000 | 9,842,480 |
| Shares redeemed | (801,533) | (7,829,485) |
| Net increase (decrease) | 520,784 | $ 4,123,653 |
| Year ended December 31, 2022: | | |
| Shares sold | 306,566 | $ 3,636,507 |
| Shares issued to shareholders in reinvestment of distributions | 1,729,015 | 15,428,348 |
| Shares redeemed | (704,896) | (8,497,093) |
| Net increase (decrease) | 1,330,685 | $ 10,567,762 |
| |
Notes to Financial Statements (continued)
| Service Class | Shares | Amount |
| Year ended December 31, 2023: | | |
| Shares sold | 2,961,702 | $ 28,769,984 |
| Shares issued to shareholders in reinvestment of distributions | 13,433,595 | 117,566,790 |
| Shares redeemed | (26,951,268) | (261,264,291) |
| Net increase (decrease) | (10,555,971) | $(114,927,517) |
| Year ended December 31, 2022: | | |
| Shares sold | 2,009,708 | $ 22,790,986 |
| Shares issued to shareholders in reinvestment of distributions | 24,581,213 | 216,661,264 |
| Shares redeemed | (21,669,058) | (242,834,836) |
| Net increase (decrease) | 4,921,863 | $ (3,382,586) |
MainStay VP Equity Allocation Portfolio
| Initial Class | Shares | Amount |
| Year ended December 31, 2023: | | |
| Shares sold | 248,142 | $ 2,414,486 |
| Shares issued to shareholders in reinvestment of distributions | 1,608,511 | 13,605,752 |
| Shares redeemed | (533,110) | (5,246,093) |
| Net increase (decrease) | 1,323,543 | $ 10,774,145 |
| Year ended December 31, 2022: | | |
| Shares sold | 217,177 | $ 2,501,367 |
| Shares issued to shareholders in reinvestment of distributions | 1,875,309 | 16,509,845 |
| Shares redeemed | (396,277) | (4,648,111) |
| Net increase (decrease) | 1,696,209 | $ 14,363,101 |
| |
| Service Class | Shares | Amount |
| Year ended December 31, 2023: | | |
| Shares sold | 1,754,839 | $ 16,564,411 |
| Shares issued to shareholders in reinvestment of distributions | 13,182,764 | 109,771,556 |
| Shares redeemed | (16,086,250) | (154,038,130) |
| Net increase (decrease) | (1,148,647) | $ (27,702,163) |
| Year ended December 31, 2022: | | |
| Shares sold | 1,506,192 | $ 17,114,375 |
| Shares issued to shareholders in reinvestment of distributions | 17,547,845 | 152,373,206 |
| Shares redeemed | (10,123,962) | (116,144,225) |
| Net increase (decrease) | 8,930,075 | $ 53,343,356 |
Note 10–Other Matters
As of the date of this report, the Funds face a heightened level of risk associated with current uncertainty, volatility and state of economies, financial markets, rising interest rates, and labor and health conditions around the world. Events such as war, acts of terrorism, recessions, rapid inflation, the imposition of international sanctions, earthquakes, hurricanes, epidemics and pandemics and other unforeseen natural or human disasters may have broad adverse social, political and economic effects on the global economy, which could negatively impact the value of
the Funds' investments. Developments that disrupt global economies and financial markets may magnify factors that affect the Funds' performance.
Note 11–Subsequent Events
In connection with the preparation of the financial statements of the Allocation Portfolios as of and for the year ended December 31, 2023, events and transactions subsequent to December 31, 2023, through the date the financial statements were issued, have been evaluated by the Manager for possible adjustment and/or disclosure. No subsequent events requiring financial statement adjustment or disclosure have been identified.
| 80 | MainStay VP Asset Allocation Portfolios |
Report of Independent Registered Public Accounting Firm
To the Board of Trustees of MainStay VP Funds Trust and Shareholders of
MainStay VP Conservative Allocation Portfolio, MainStay VP Moderate Allocation Portfolio, MainStay VP Growth Allocation Portfolio and MainStay VP Equity Allocation Portfolio
Opinions on the Financial Statements
We have audited the accompanying statements of assets and liabilities, including the portfolios of investments, of MainStay VP Conservative Allocation Portfolio, MainStay VP Moderate Allocation Portfolio, MainStay VP Growth Allocation Portfolio and MainStay VP Equity Allocation Portfolio (four of the portfolios constituting MainStay VP Funds Trust, hereafter collectively referred to as the "Portfolios") as of December 31, 2023, the related statements of operations for the year ended December 31, 2023, the statements of changes in net assets for each of the two years in the period ended December 31, 2023, including the related notes, and the financial highlights for each of the five years in the period ended December 31, 2023 (collectively referred to as the “financial statements”). In our opinion, the financial statements present fairly, in all material respects, the financial position of each of the Portfolios as of December 31, 2023, the results of each of their operations for the year then ended, the changes in each of their net assets for each of the two years in the period ended December 31, 2023 and each of the financial highlights for each of the five years in the period ended December 31, 2023 in conformity with accounting principles generally accepted in the United States of America.
Basis for Opinions
These financial statements are the responsibility of the Portfolios’ management. Our responsibility is to express an opinion on the Portfolios’ financial statements based on our audits. We are a public accounting firm registered with the Public Company Accounting Oversight Board (United States) (PCAOB) and are required to be independent with respect to the Portfolios in accordance with the U.S. federal securities laws and the applicable rules and regulations of the Securities and Exchange Commission and the PCAOB.
We conducted our audits of these financial statements in accordance with the standards of the PCAOB. Those standards require that we plan and perform the audit to obtain reasonable assurance about whether the financial statements are free of material misstatement, whether due to error or fraud.
Our audits included performing procedures to assess the risks of material misstatement of the financial statements, whether due to error or fraud, and performing procedures that respond to those risks. Such procedures included examining, on a test basis, evidence regarding the amounts and disclosures in the financial statements. Our audits also included evaluating the accounting principles used and significant estimates made by management, as well as evaluating the overall presentation of the financial statements. Our procedures included confirmation of securities owned as of December 31, 2023 by correspondence with the custodian, transfer agent and brokers. We believe that our audits provide a reasonable basis for our opinions.
/s/PricewaterhouseCoopers LLP
New York, New York
February 26, 2024
We have served as the auditor of one or more investment companies in the MainStay group of funds since 1984.
Board Consideration and Approval of Management Agreement (Unaudited)
The continuation of the Management Agreement with respect to the MainStay VP Conservative Allocation Portfolio, MainStay VP Moderate Allocation Portfolio, MainStay VP Growth Allocation Portfolio and MainStay VP Equity Allocation Portfolio (“Portfolios”) and New York Life Investment Management LLC (“New York Life Investments”) is subject to annual review and approval by the Board of Trustees of MainStay VP Funds Trust (“Board” of the “Trust”) in accordance with Section 15 of the Investment Company Act of 1940, as amended (“1940 Act”). At its December 6–7, 2023 meeting, the Board, including the Trustees who are not an “interested person” (as such term is defined in the 1940 Act) of the Trust (“Independent Trustees”) voting separately, unanimously approved the continuation of the Management Agreement for a one-year period.
In reaching the decision to approve the continuation of the Management Agreement , the Board considered information and materials furnished by New York Life Investments in connection with an annual contract review process undertaken by the Board that took place at meetings of the Board and its Contracts Committee from September 2023 through December 2023, including information and materials furnished by New York Life Investments in response to requests prepared on behalf of the Board, and in consultation with the Independent Trustees, by independent legal counsel to the Independent Trustees, which encompassed a variety of topics, including those summarized below. Information and materials requested by and furnished to the Board for consideration in connection with the contract review process included, among other items, reports on each Portfolio and “peer funds” prepared by Institutional Shareholder Services Inc. (“ISS”), an independent third-party service provider engaged by the Board to report objectively on each Portfolio’s investment performance, management fee and total expenses. The Board also considered information on the fees charged to other investment advisory clients of New York Life Investments that follow investment strategies similar to those of each Portfolio, if any, and, when applicable, the rationale for differences in each Portfolio’s management fee and the fees charged to those other investment advisory clients. In addition, the Board considered information regarding the legal standards and fiduciary obligations applicable to its consideration of the continuation of the Management Agreement. The contract review process, including the structure and format for information and materials provided to the Board, has been developed in consultation with the Board. The Independent Trustees also met in executive sessions with their independent legal counsel and, for portions thereof, with senior management of New York Life Investments.
The Board’s deliberations with respect to the continuation of the Management Agreement reflect a year-long process, and the Board also took into account information furnished to the Board and its Committees throughout the year, as deemed relevant and appropriate by the Trustees, including, among other items, reports on investment performance of each Portfolio and investment-related matters for each Portfolio as well as presentations from New York Life Investments personnel. In addition, the Board took into account other information provided by New York Life Investments throughout the year, including, among other items, periodic reports on legal and compliance matters, risk management, portfolio
turnover, brokerage commissions and non-advisory services provided to each Portfolio by New York Life Investments, as deemed relevant and appropriate by the Trustees.
In addition to information provided to the Board throughout the year, the Board received information in connection with its June 2023 meeting provided specifically in response to requests prepared on behalf of the Board, and in consultation with the Independent Trustees, by independent legal counsel to the Independent Trustees regarding each Portfolio’s distribution arrangements. In addition, the Board received information regarding each Portfolio’s asset levels, share purchase and redemption activity and the payment of Rule 12b-1 and/or certain other fees by applicable share classes of each Portfolio, among other information.
In considering the continuation of the Management Agreement, the Trustees reviewed and evaluated the information and factors they believed to reasonably be necessary and appropriate in light of legal advice furnished to them by independent legal counsel to the Independent Trustees and through the exercise of their own business judgment. Although individual Trustees may have weighed certain factors or information differently and the Board did not consider any single factor or information controlling in reaching its decision, the factors that figured prominently in the Board’s consideration of the continuation of the Management Agreement are summarized in more detail below and include, among other factors: (i) the nature, extent and quality of the services provided to each Portfolio by New York Life Investments; (ii) the qualifications of the portfolio managers of each Portfolio and the historical investment performance of each Portfolio and New York Life Investments; (iii) the costs of the services provided, and profits realized, by New York Life Investments with respect to its relationships with each Portfolio; (iv) the extent to which economies of scale have been realized or may be realized if each Portfolio grows and the extent to which any economies of scale have been shared, have benefited or may benefit each Portfolio’s shareholders; and (v) the reasonableness of each Portfolio’s management fee and total ordinary operating expenses. Although the Board recognized that comparisons between each Portfolio’s fees and expenses and those of other funds are imprecise given different terms of agreements, variations in fund strategies and other factors, the Board considered the reasonableness of each Portfolio’s management fee and total ordinary operating expenses as compared to the peer funds identified by ISS. Throughout their considerations, the Trustees acknowledged the commitment of New York Life Investments and its affiliates to serve the MainStay Group of Funds, as well as their capacity, experience, resources, financial stability and reputations. The Trustees also acknowledged the entrepreneurial and other risks assumed by New York Life Investments in sponsoring and managing each Portfolio.
The Trustees noted that, throughout the year, the Trustees are afforded an opportunity to ask questions of, and request additional information or materials from, New York Life Investments. The Board’s decision with respect to the Management Agreement may have also been based, in part, on the Board’s knowledge of New York Life Investments resulting from, among other things, the Board’s consideration of the Management Agreement in prior years, the advisory agreements for other funds in the
| 82 | MainStay VP Asset Allocation Portfolios |
MainStay Group of Funds, the Board’s review throughout the year of the performance and operations of other funds in the MainStay Group of Funds and each Trustee’s business judgment and industry experience. In addition to considering the above-referenced factors, the Board observed that in the marketplace, notably under variable life insurance policies and variable annuity contracts for which each Portfolio serves as an investment option, there are a range of investment options available to investors and that each Portfolio’s shareholders, having had the opportunity to consider other investment options, have invested in each Portfolio.
The factors that figured prominently in the Board’s decision to approve the continuation of the Management Agreement during the Board’s December 6–7, 2023 meeting are summarized in more detail below. The Board considered on a Portfolio-by-Portfolio basis the factors and information deemed relevant and appropriate by the Trustees to evaluate the continuation of the Management Agreement, and the Board’s decision was made separately with respect to each Portfolio.
Nature, Extent and Quality of Services Provided by New York Life Investments
The Board examined the nature, extent and quality of the services that New York Life Investments provides to each Portfolio. The Board evaluated New York Life Investments’ experience and capabilities in serving as manager of each Portfolio. The Board noted that New York Life Investments manages other mutual funds, serves a variety of other investment advisory clients, including other pooled investment vehicles, and has experience overseeing mutual fund service providers. The Board considered the experience of senior personnel at New York Life Investments providing management and administrative and other non-advisory services to the Portfolios. The Board observed that New York Life Investments devotes significant resources and time to providing management and administrative and other non-advisory services to the Portfolios.
The Board also considered the range of services that New York Life Investments provides to the Portfolios under the terms of the Management Agreement, including: (i) fund accounting and ongoing supervisory services provided by New York Life Investments’ Fund Administration and Accounting Group; (ii) investment supervisory and analytical services provided by New York Life Investments’ Investment Consulting Group; (iii) compliance services provided by the Trust’s Chief Compliance Officer as well as New York Life Investments’ compliance department, including supervision and implementation of the Portfolios’ compliance program; (iv) legal services provided by New York Life Investments’ Office of the General Counsel; and (v) risk management monitoring and analysis by compliance and investment personnel. In addition, the Board considered New York Life Investments’ willingness to invest in personnel and other resources, such as cyber security, information security and business continuity planning, that may benefit the Portfolios and noted that New York Life Investments is responsible for compensating the Trust’s officers, except for a portion of the salary of the Trust’s Chief Compliance Officer. The Board recognized that New York Life
Investments provides certain other non-advisory services to the Portfolios and has over time provided an increasingly broad array of non-advisory services to the MainStay Group of Funds as a result of regulatory and other developments.
The Board also examined the range, and the nature, extent and quality, of the investment advisory services that New York Life Investments provides to the Portfolios and considered the terms of the Management Agreement. The Board evaluated New York Life Investments’ experience and performance in serving as investment adviser to the Portfolios and advising other portfolios and New York Life Investments’ track record and experience in providing investment advisory services as well as the experience of investment advisory, senior management and administrative personnel at New York Life Investments. The Board considered New York Life Investments’ overall resources, legal and compliance environment, capabilities, reputation, financial condition and history. In addition to information provided in connection with quarterly meetings with the Trust’s Chief Compliance Officer, the Board considered information regarding the compliance policies and procedures of New York Life Investments and acknowledged New York Life Investments’ commitment to further developing and strengthening compliance programs that may relate to the Portfolios. The Board also considered New York Life Investments’ ability to recruit and retain qualified investment professionals and willingness to invest in personnel and other resources that may benefit each Portfolio. In this regard, the Board considered the qualifications and experience of the Portfolios’ portfolio managers, the number of accounts managed by the portfolio managers and the method for compensating the portfolio managers.
Because the Portfolios invest substantially all their assets in other funds advised by New York Life Investments or its affiliates, the Board considered information from New York Life Investments regarding the investment rationale and process for the allocation among and selection of the underlying funds in which the Portfolios invest.
In addition, the Board considered information provided by New York Life Investments regarding its business continuity and disaster recovery plans.
Based on these considerations, among others, the Board concluded that each Portfolio would likely continue to benefit from the nature, extent and quality of these services.
Investment Performance
In evaluating each Portfolio’s investment performance, the Board considered investment performance results over various periods in light of each Portfolio’s investment objective, strategies and risks. The Board considered investment reports on, and analysis of, each Portfolio’s performance provided to the Board throughout the year. These reports include, among other items, information on each Portfolio’s gross and net returns, each Portfolio’s investment performance compared to a relevant investment category and each Portfolio’s benchmarks, each Portfolio’s risk-adjusted investment performance and each Portfolio’s investment performance as compared to peer funds, as appropriate, as well as
Board Consideration and Approval of Management Agreement (Unaudited) (continued)
portfolio attribution information and commentary on the effect of market conditions. The Board also considered information provided by ISS showing the investment performance of each Portfolio as compared to peer funds. In addition, the Board reviewed the methodology used by ISS to construct the group of peer funds for comparative purposes.
The Board also took into account its and the Board’s Investment Committee’s discussions with senior management at New York Life Investments concerning each Portfolio’s investment performance over various periods.
Based on these considerations, among others, the Board concluded that its review of each Portfolio’s investment performance and related information supported a determination to approve the continuation of the Management Agreement.
Costs of the Services Provided, and Profits and Other Benefits Realized, by New York Life Investments
The Board considered the costs of the services provided under the Management Agreement. The Board also considered the profitability of New York Life Investments and its affiliates due to their relationships with each Portfolio as well as by New York Life Investments and its affiliates due to their relationships with the MainStay Group of Funds.
The Board noted that the Portfolios do not pay a management fee for the allocation and other management services provided by New York Life Investments under the Management Agreement but that shareholders of the Portfolios indirectly pay their pro rata share of the fees and expenses of the underlying funds in which the Portfolios invest. The Board considered that the Portfolios’ investments in underlying funds managed by New York Life Investments or its affiliates indirectly benefit New York Life Investments or its affiliates. The Board noted that it considers the profits realized by New York Life Investments and its affiliates with respect to the underlying MainStay Funds as part of the annual contract review process for those funds.
In addition, the Board acknowledged the difficulty in obtaining reliable comparative data about mutual fund managers’ profitability because such information generally is not publicly available and may be impacted by numerous factors, including the structure of a fund manager’s organization, the types of funds it manages, the methodology used to allocate certain fixed costs to specific funds and the manager’s capital structure and costs of capital.
In evaluating the costs of the services provided by New York Life Investments, and profitability of New York Life Investments and its affiliates due to their relationships with each Portfolio, the Board considered, among other factors, New York Life Investments’ and its affiliates’ continuing investments in, or willingness to invest in, personnel and other resources that may support and further enhance the management of the Portfolios. The Board also considered the financial resources of New York Life Investments and acknowledged that New York Life Investments must be in a position to recruit and retain experienced professional personnel and to maintain a strong financial position for New
York Life Investments to continue to provide high-quality services to the Portfolios. The Board recognized that the Portfolios benefit from the allocation of certain fixed costs among the funds in the MainStay Group of Funds, among other expected benefits resulting from its relationship with New York Life Investments.
The Board considered information regarding New York Life Investments’ methodology for calculating profitability and allocating costs provided by New York Life Investments in connection with the fund profitability analysis presented to the Board. The Board concluded that New York Life Investments’ methods for allocating costs and procedures for estimating overall profitability of the relationship with the funds in the MainStay Group of Funds were reasonable. The Board recognized the difficulty in calculating and evaluating a manager’s profitability with respect to each Portfolio and considered that other profitability methodologies may also be reasonable.
The Board also considered certain fall-out benefits that may be realized by New York Life Investments and its affiliates due to their relationships with the Portfolios, including reputational and other indirect benefits. In addition, the Board considered its review of the management agreement for a money market fund advised by New York Life Investments and an affiliated subadvisor that serves as an investment option for the Portfolios, including the potential rationale for and costs associated with investments in this money market fund by the Portfolios, if any, and considered information from New York Life Investments that the nature and type of specific investment advisory services provided to this money market fund are distinct from, or in addition to, the investment advisory services provided to the Portfolios. In addition, the Board considered the potential dividend received tax deduction for insurance company affiliates of New York Life Investments from each Portfolio’s securities lending activity.
The Board noted that the Portfolios serve as investment options primarily under variable contracts issued by affiliates of New York Life Investments that would receive fees under those contracts. The Board observed that, in addition to fees earned by New York Life Investments under the Management Agreement for managing the Portfolios, New York Life Investments’ affiliates also earn revenues from serving the Portfolios in various other capacities, including as the Portfolios’ distributor, and insurance companies affiliated with New York Life Investments would be entitled to receive fees from each Portfolio under a distribution and service plan adopted pursuant to Rule 12b-1 under the 1940 Act. The Board considered information about these other revenues and their impact on the profitability of the relationship with the Portfolios to New York Life Investments and its affiliates. The Board noted that, although it assessed the overall profitability of the relationship with the Portfolios to New York Life Investments and its affiliates as part of the contract review process, when considering the reasonableness of the fee paid to New York Life Investments under the Management Agreement, the Board considered the profitability of New York Life Investments’ relationship with the Portfolios on a pre-tax basis and without regard to distribution expenses incurred by New York Life Investments from its own resources.
| 84 | MainStay VP Asset Allocation Portfolios |
After evaluating the information deemed relevant by the Trustees, the Board concluded that any profits realized by New York Life Investments and its affiliates due to their relationships with the Portfolios were not excessive.
Management Fee and Total Ordinary Operating Expenses
The Board evaluated the reasonableness of the fees paid under the Management Agreement and each Portfolio’s total ordinary operating expenses.
In assessing the reasonableness of each Portfolio’s fees and expenses, the Board primarily considered comparative data provided by ISS on the fees and expenses of similar mutual funds managed by other investment advisers. The Board reviewed the methodology used by ISS to construct the group of peer funds for comparative purposes. Because the Portfolios do not pay a management fee to New York Life Investments, the Board considered the reasonableness of the overall fees and expenses the Portfolios indirectly pay by investing in underlying funds that charge a management fee. The Board considered New York Life Investments’ process for monitoring and addressing potential conflicts of interest in the selection of underlying funds. In addition, the Board considered information provided by New York Life Investments on fees charged to other investment advisory clients, including institutional separate accounts and/or other funds, that follow investment strategies similar to those of each Portfolio, if any. The Board considered the contractual management fee schedule for each Portfolio as compared to those for such other investment advisory clients, taking into account the rationale for differences in fee schedules. The Board also took into account information provided by New York Life Investments about the more extensive scope of services provided to registered investment companies, such as the Portfolios, as compared with other investment advisory clients. Additionally, the Board considered the impact of voluntary waivers on each Portfolio’s net management fee and expenses. The Board also considered that in proposing fees for each Portfolio, New York Life Investments considers the competitive marketplace for mutual funds.
Because the Portfolios invest substantially all their assets in other funds advised by New York Life Investments or its affiliates, the Board also considered information provided by New York Life Investments regarding the fees and expenses associated with the Portfolios’ investments in other funds, including New York Life Investments’ finding that the applicable Portfolio’s fees and expenses do not duplicate the fees and expenses of the corresponding acquired fund (when required by Rule 12d1-4 under the 1940 Act).
Based on the factors outlined above, among other considerations, the Board concluded that each Portfolio’s management fee and total ordinary operating expenses are within a range that is competitive and support a conclusion that these fees and expenses are reasonable.
Economies of Scale
The Board considered information regarding economies of scale, including whether economies of scale may exist with respect to each Portfolio and whether each Portfolio’s management fee and expense structure permits any economies of scale to be appropriately shared with the Portfolio’s shareholders. The Board also considered a report from New York Life Investments, previously prepared at the request of the Board, that addressed economies of scale, including with respect to the mutual fund business generally, and the various ways in which the benefits of economies of scale may be shared with the funds in the MainStay Group of Funds. Although the Board recognized the difficulty of determining economies of scale with precision, the Board acknowledged that economies of scale may be shared with each Portfolio in a number of ways, including, for example, through the imposition of fee breakpoints, initially setting management fee rates at scale or making additional investments to enhance the services provided to the Portfolio. The Board reviewed information from New York Life Investments showing how each Portfolio’s management fee schedule compared to fee schedules of other funds and accounts managed by New York Life Investments. The Board also reviewed information from ISS showing how each Portfolio’s management fee schedule compared with fees paid for similar services by peer funds at varying asset levels. The Board noted that the Portfolios do not pay a management fee and that the Board separately considers economies of scale as part of its review of the management agreements of underlying MainStay Funds in which the Portfolios invest and the benefit of any breakpoints in the management fee schedules for the underlying MainStay Funds would pass through to shareholders of the Portfolios at the specified levels of underlying MainStay Fund assets.
Based on this information, the Board concluded that economies of scale are appropriately shared for the benefit of each Portfolio’s shareholders through each Portfolio’s management fee and expense structure and other methods to share benefits from economies of scale.
Conclusion
On the basis of the information and factors summarized above, among other information and factors deemed relevant by the Trustees, and the evaluation thereof, the Board, including the Independent Trustees voting separately, unanimously voted to approve the continuation of the Management Agreement.
Proxy Voting Policies and Procedures and Proxy Voting Record
Each VP Allocation Fund is required to file with the SEC its proxy voting record for the 12-month period ending June 30 on Form N-PX. A description of the policies and procedures that are used to vote proxies relating to portfolio securities of the Fund is available free of charge upon request by calling 800-624-6782 or visiting the SEC's website at www.sec.gov. The most recent Form N-PX or proxy voting record is available free of charge upon request by calling 800-598-2019; visiting https://www.newyorklifeinvestments.com/investment-products/vp; or visiting the SEC’s website at www.sec.gov.
Shareholder Reports and Quarterly Portfolio Disclosure
Each VP Allocation Fund is required to file its complete schedule of portfolio holdings with the SEC 60 days after its first and third fiscal quarter on Form N-PORT. The Allocation Portfolios' holdings report is available free of charge upon request by calling 800-624-6782 or by visiting the SEC’s website at www.sec.gov.
| 86 | MainStay VP Asset Allocation Portfolios |
Board of Trustees and Officers (Unaudited)
The Trustees and officers of the Portfolio are listed below. The Board oversees the MainStay Group of Funds (which consists of MainStay Funds and MainStay Funds Trust), MainStay VP Funds Trust, MainStay MacKay DefinedTerm Municipal Opportunities Fund, MainStay CBRE Global Infrastructure Megatrends Term Fund, the Manager and the Subadvisors, and elects the officers of the Portfolios who are responsible for the day-to-day operations of the Portfolio. Information pertaining to the Trustees and officers is set forth below. Each Trustee serves until his or her successor is elected and qualified or until his or her resignation,
death or removal. Under the Board’s retirement policy, unless an exception is made, a Trustee must tender his or her resignation by the end of the calendar year during which he or she reaches the age of 75. Officers are elected annually by the Board. The business address of each Trustee and officer listed below is 51 Madison Avenue, New York, New York 10010. A majority of the Trustees are not “interested persons” (as defined by the 1940 Act and rules adopted by the SEC thereunder) of the Portfolio (“Independent Trustees”).
| | Name and
Year of Birth | Term of Office,
Position(s) Held and
Length of Service | Principal Occupation(s)
During Past Five Years | Number of
Portfolios in
Fund Complex
Overseen by
Trustee | Other Directorships
Held by Trustee |
| | | | | | |
| | Naïm Abou-Jaoudé*
1966 | MainStay VP Funds Trust: Trustee since 2023 | Chief Executive Officer of New York Life Investment Management LLC (since 2023). Chief Executive Officer of Candriam (an affiliate of New York Life Investment Management LLC) (2007 to 2023). | 81 | MainStay Funds: Trustee since 2023 (11 Funds)
MainStay Funds Trust: Trustee since 2023 (37 Funds);
MainStay MacKay DefinedTerm Municipal Opportunities Fund: Trustee since 2023;
MainStay CBRE Global Infrastructure Megatrends Term Fund: Trustee since 2023; and
New York Life Investment Management International (Chair) since 2015 |
| * | This Trustee is considered to be an “interested person” of the MainStay Group of Funds, MainStay VP Funds Trust, MainStay CBRE Global Infrastructure Megatrends Term Fund and MainStay MacKay DefinedTerm Municipal Opportunities Fund, within the meaning of the 1940 Act because of his affiliation with New York Life Investment Management LLC and Candriam, as described in detail above in the column entitled “Principal Occupation(s) During Past Five Years.” |
| | |
Board of Trustees and Officers (Unaudited) (continued)
| | Name and
Year of Birth | Term of Office,
Position(s) Held and
Length of Service | Principal Occupation(s)
During Past Five Years | Number of
Portfolios in
Fund Complex
Overseen by
Trustee | Other Directorships
Held by Trustee |
| | | | | | |
| | David H. Chow
1957 | MainStay VP Funds Trust: Trustee since January 2016, Advisory Board Member (June 2015 to December 2015) | Founder and CEO, DanCourt Management, LLC since 1999 | 81 | MainStay Funds: Trustee since January 2016, Advisory Board Member (June 2015 to December 2015) (11 Funds);
MainStay Funds Trust: Trustee since January 2016, Advisory Board Member (June 2015 to December 2015) (37 Funds);
MainStay MacKay DefinedTerm Municipal Opportunities Fund: Trustee since January 2016, Advisory Board Member (June 2015 to December 2015);
MainStay CBRE Global Infrastructure Megatrends Term Fund: Trustee since 2021;
VanEck Vectors Group of Exchange-Traded Funds: Trustee since 2006 and Independent Chairman of the Board of Trustees from 2008 to 2022 (57 portfolios); and
Berea College of Kentucky: Trustee since 2009, Chair of the Investment Committee since 2018 |
| | Karen Hammond
1956 | MainStay VP Funds Trust: Trustee since December 2021, Advisory Board Member (June 2021 to December 2021)
| Retired, Managing Director, Devonshire Investors (2007 to 2013); Senior Vice President, Fidelity Management & Research Co. (2005 to 2007); Senior Vice President and Corporate Treasurer, FMR Corp. (2003 to 2005); Chief Operating Officer, Fidelity Investments Japan (2001 to 2003) | 81 | MainStay Funds: Trustee since December 2021, Advisory Board Member (June 2021 to December 2021) (11 Funds);
MainStay Funds Trust: Trustee since December 2021, Advisory Board Member (June 2021 to December 2021) (37 Funds);
MainStay MacKay DefinedTerm Municipal Opportunities Fund: Trustee since December 2021, Advisory Board Member (June 2021 to December 2021);
MainStay CBRE Global Infrastructure Megatrends Term Fund: Trustee since December 2021, Advisory Board Member (June 2021 to December 2021);
Two Harbors Investment Corp.: Director since 2018;
Rhode Island State Investment Commission: Member since 2017; and
Blue Cross Blue Shield of Rhode Island: Director since 2019 |
| | Susan B. Kerley
1951 | MainStay VP Funds Trust: Chair since 2017 and Trustee since 2007** | President, Strategic Management Advisors LLC since 1990 | 81 | MainStay Funds: Chair since January 2017 and Trustee since 2007 (11 Funds); MainStay Funds Trust: Chair since January 2017 and Trustee since 1990 (37 Funds)***;
MainStay MacKay DefinedTerm Municipal Opportunities Fund: Chair since January 2017 and Trustee since 2011;
MainStay CBRE Global Infrastructure Megatrends Term Fund: Trustee since June 2021; and
Legg Mason Partners Funds: Trustee since 1991 (45 portfolios) |
| 88 | MainStay VP Asset Allocation Portfolios |
| | Name and
Year of Birth | Term of Office,
Position(s) Held and
Length of Service | Principal Occupation(s)
During Past Five Years | Number of
Portfolios in
Fund Complex
Overseen by
Trustee | Other Directorships
Held by Trustee |
| | | | | | |
| | Alan R. Latshaw
1951 | MainStay VP Funds Trust: Trustee since 2007** | Retired; Partner, Ernst & Young LLP (2002 to 2003); Partner, Arthur Andersen LLP (1989 to 2002); Consultant to the MainStay Funds Audit and Compliance Committee (2004 to 2006) | 81 | MainStay Funds: Trustee since 2006 (11 Funds);
MainStay Funds Trust: Trustee since 2007 (37 Funds)***;
MainStay MacKay DefinedTerm Municipal Opportunities Fund: Trustee since 2011; and
MainStay CBRE Global Infrastructure Megatrends Term Fund: Trustee since June 2021 |
| | Jacques P. Perold
1958 | MainStay VP Funds Trust: Trustee since January 2016, Advisory Board Member (June 2015 to December 2015) | Founder and Chief Executive Officer, CapShift Advisors LLC (since 2018); President, Fidelity Management & Research Company (2009 to 2014); President and Chief Investment Officer, Geode Capital Management, LLC (2001 to 2009) | 81 | MainStay Funds: Trustee since January 2016, Advisory Board Member (June 2015 to December 2015) (11 Funds);
MainStay Funds Trust: Trustee since January 2016, Advisory Board Member (June 2015 to December 2015) (37 Funds);
MainStay MacKay DefinedTerm Municipal Opportunities Fund: Trustee since January 2016, Advisory Board Member (June 2015 to December 2015);
MainStay CBRE Global Infrastructure Megatrends Term Fund: Trustee since June 2021;
Allstate Corporation: Director since 2015;
Partners in Health: Trustee since 2019; and
MSCI Inc.: Director since 2017 |
| | Richard S. Trutanic
1952 | MainStay VP Funds Trust: Trustee since 2007** | Chairman and Chief Executive Officer, Somerset & Company (financial advisory firm) since 2004; Managing Director, The Carlyle Group (private investment firm) (2002 to 2004); Senior Managing Director, Partner and Board Member, Groupe Arnault S.A. (private investment firm) (1999 to 2002) | 81 | MainStay Funds: Trustee since 1994 (11 Funds);
MainStay Funds Trust: Trustee since 2007 (37 Funds)***;
MainStay MacKay DefinedTerm Municipal Opportunities Fund: Trustee since 2011; and
MainStay CBRE Global Infrastructure Megatrends Term Fund: Trustee since June 2021 |
| ** | Includes prior service as a Director of MainStay VP Series Fund, Inc., the predecessor to MainStay VP Funds Trust. |
| *** | Includes prior service as a Director/Trustee of certain predecessor entities to MainStay Funds Trust. |
Board of Trustees and Officers (Unaudited) (continued)
| | Name and
Year of Birth | Position(s) Held and
Length of Service | Principal Occupation(s)
During Past Five Years | |
| | | | | |
| | Kirk C. Lehneis
1974 | President, MainStay VP Funds Trust (since 2017) | Chief Operating Officer and Senior Managing Director (since 2016), New York Life Investment Management LLC and New York Life Investment Management Holdings LLC; Member of the Board of Managers (since 2017) and Senior Managing Director (since 2018), NYLIFE Distributors LLC; Chairman of the Board and Senior Managing Director, NYLIM Service Company LLC (since 2017); Trustee, President and Principal Executive Officer of IndexIQ Trust, IndexIQ ETF Trust and IndexIQ Active ETF Trust (since 2018); President, MainStay CBRE Global Infrastructure Megatrends Term Fund (since 2021), MainStay MacKay DefinedTerm Municipal Opportunities Fund, MainStay Funds and MainStay Funds Trust (since 2017); Senior Managing Director, Global Product Development (from 2015 to 2016); Managing Director, Product Development (from 2010 to 2015), New York Life Investment Management LLC | |
| | Jack R. Benintende
1964 | Treasurer and Principal Financial and Accounting Officer, MainStay VP Funds Trust (since 2007)** | Managing Director, New York Life Investment Management LLC (since 2007); Treasurer and Principal Financial and Accounting Officer, MainStay CBRE Global Infrastructure Megatrends Term Fund (since 2021), MainStay MacKay DefinedTerm Municipal Opportunities Fund (since 2011), MainStay Funds Trust (since 2009) and MainStay Funds (since 2007); and Assistant Treasurer, New York Life Investment Management Holdings LLC (2008 to 2012) | |
| | J. Kevin Gao
1967 | Secretary and Chief Legal Officer, MainStay VP Funds Trust (since 2010)** | Managing Director and Associate General Counsel, New York Life Investment Management LLC (since 2010); Secretary and Chief Legal Officer, MainStay CBRE Global Infrastructure Megatrends Term Fund (since 2021), MainStay MacKay DefinedTerm Municipal Opportunities Fund (since 2011), MainStay Funds and MainStay Funds Trust (since 2010) | |
| | Kevin M. Gleason
1967 | Vice President and Chief Compliance Officer, MainStay VP Funds Trust (since June 2022) | Vice President and Chief Compliance Officer, IndexIQ Trust, IndexIQ ETF Trust and IndexIQ Active ETF Trust (since June 2022); Vice President and Chief Compliance Officer, MainStay CBRE Global Infrastructure Megatrends Term Fund, MainStay MacKay DefinedTerm Municipal Opportunities Fund (since June 2022); MainStay Funds Trust and MainStay Funds (since June 2022); Senior Vice President, Voya Investment Management and Chief Compliance Officer, Voya Family of Funds (2012 to 2022) | |
| | Scott T. Harrington
1959 | Vice President— Administration, MainStay VP Funds Trust (since 2005)** | Managing Director, New York Life Investment Management LLC (including predecessor advisory organizations) (since 2000); Member of the Board of Directors, New York Life Trust Company (since 2009); Vice President—Administration, MainStay CBRE Global Infrastructure Megatrends Term Fund (since 2021), MainStay MacKay DefinedTerm Municipal Opportunities Fund (since 2011), MainStay Funds Trust and MainStay Funds (since 2009) | |
| * | The officers listed above are considered to be “interested persons” of the MainStay Group of Funds, MainStay VP Funds Trust, MainStay CBRE Global Infrastructure Megatrends Term Fund and MainStay MacKay DefinedTerm Municipal Opportunities Fund within the meaning of the 1940 Act because of their affiliation with the MainStay Group of Funds, New York Life Insurance Company and/or its affiliates, including New York Life Investment Management LLC, New York Life Insurance Company, NYLIM Service Company LLC, NYLIFE Securities LLC and/or NYLIFE Distributors LLC, as described in detail in the column captioned “Principal Occupation(s) During Past Five Years.” Officers are elected annually by the Board. |
| ** | Includes prior service as an Officer of MainStay VP Series Fund, Inc., the predecessor to MainStay VP Funds Trust. |
Officers of the Trust (Who are not Trustees)*
| 90 | MainStay VP Asset Allocation Portfolios |
MainStay VP Portfolios
MainStay VP offers a wide range of Portfolios. The full array of MainStay VP offerings is listed here, with information about the manager, subadvisors, legal counsel, and independent registered public accounting firm.
Equity
MainStay VP American Century Sustainable Equity Portfolio
MainStay VP Candriam Emerging Markets Equity Portfolio
MainStay VP Epoch U.S. Equity Yield Portfolio
MainStay VP Fidelity Institutional AM® Utilities Portfolio†
MainStay VP Natural Resources Portfolio
MainStay VP PineStone International Equity Portfolio1
MainStay VP S&P 500 Index Portfolio
MainStay VP Small Cap Growth Portfolio
MainStay VP Wellington Growth Portfolio
MainStay VP Wellington Mid Cap Portfolio
MainStay VP Wellington Small Cap Portfolio
MainStay VP Wellington U.S. Equity Portfolio
MainStay VP Winslow Large Cap Growth Portfolio
Mixed Asset
MainStay VP Balanced Portfolio
MainStay VP Income Builder Portfolio
MainStay VP Janus Henderson Balanced Portfolio
MainStay VP MacKay Convertible Portfolio
Income
MainStay VP Bond Portfolio
MainStay VP Floating Rate Portfolio
MainStay VP Indexed Bond Portfolio
MainStay VP MacKay Government Portfolio2
MainStay VP MacKay High Yield Corporate Bond Portfolio
MainStay VP MacKay Strategic Bond Portfolio
MainStay VP PIMCO Real Return Portfolio
Money Market
MainStay VP U.S. Government Money Market Portfolio
Alternative
MainStay VP CBRE Global Infrastructure Portfolio
MainStay VP IQ Hedge Multi-Strategy Portfolio
Asset Allocation
MainStay VP Conservative Allocation Portfolio
MainStay VP Equity Allocation Portfolio
MainStay VP Growth Allocation Portfolio
MainStay VP Moderate Allocation Portfolio
Manager
New York Life Investment Management LLC
New York, New York
Subadvisors
American Century Investment Management, Inc.
Kansas City, Missouri
Brown Advisory LLC
Baltimore, Maryland
Candriam*
Strassen, Luxembourg
CBRE Investment Management Listed Real Assets LLC
Radnor, Pennsylvania
Epoch Investment Partners, Inc.
New York, New York
FIAM LLC
Smithfield, Rhode Island
IndexIQ Advisors LLC*
New York, New York
Janus Henderson Investors US LLC
Denver, Colorado
MacKay Shields LLC*
New York, New York
Newton Investment Management North America, LLC
Boston, Massachusetts
NYL Investors LLC*
New York, New York
Pacific Investment Management Company LLC
Newport Beach, California
PineStone Asset Management Inc.
Montreal, Québec
Segall Bryant & Hamill, LLC
Chicago, Illinois
Wellington Management Company LLP
Boston, Massachusetts
Winslow Capital Management, LLC
Minneapolis, Minnesota
Legal Counsel
Dechert LLP
Washington, District of Columbia
Independent Registered Public Accounting Firm
PricewaterhouseCoopers LLP
New York, New York
Distributor
NYLIFE Distributors LLC*
Jersey City, New Jersey
Custodian
JPMorgan Chase Bank, N.A.
New York, New York
Some Portfolios may not be available in all products.
† Fidelity Institutional AM is a registered trade mark of FMR LLC. Used with permission.
* An affiliate of New York Life Investment Management LLC.
| 1. | Prior to August 28, 2023, the Portfolio's name was MainStay VP MacKay International Equity Portfolio. |
| 2. | Effective on or about May 1, 2024, the MainStay VP MacKay Government Portfolio will be renamed the MainStay VP U.S. Infrastructure Bond Portfolio. |
Not part of the Annual Report
2023 Annual Report
This report is for the general information of New York Life Variable Annuities and NYLIAC Variable Universal Life Insurance Products policyowners. It must be preceded or accompanied by the appropriate product(s) and funds prospectuses if it is given to anyone who is not an owner of a New York Life variable annuity policy or a NYLIAC Variable Universal Life Insurance Product. This report does not offer for sale or solicit orders to purchase securities.
The performance data quoted in this report represents past performance. Past performance is no guarantee of future results. Due to market volatility and other factors, current performance may be lower or higher than the figures shown. The most recent month-end performance summary for your variable annuity or variable life policy is available by calling 800-598-2019 and is updated periodically on newyorklife.com.
The New York Life Variable Annuities and NYLIAC Variable Universal Life Insurance Products are issued by New York Life Insurance and Annuity Corporation (a Delaware Corporation) and distributed by NYLIFE Distributors LLC (Member FINRA/SIPC).
New York Life Insurance Company
New York Life Insurance and Annuity
Corporation (NYLIAC) (A Delaware Corporation)
51 Madison Avenue, Room 551
New York, NY 10010
newyorklife.com
newyorklifeinvestments.com
NYLIFE Distributors LLC, 30 Hudson Street, Jersey City, NJ 07302
New York Life Investment Management LLC is the investment manager to the MainStay VP Funds Trust
©2024 by NYLIFE Distributors LLC. All rights reserved.
You may obtain copies of the Prospectus and the Statement of Additional Information free of charge, upon request, by calling toll-free 800-598-2019 or writing to New York Life Insurance and Annuity Corporation, 51 Madison Avenue, New York, NY 10010.
| Not FDIC Insured | No Bank Guarantee | May Lose Value |
(NYLIAC) NI507
MainStay VP PIMCO Real Return Portfolio
Message from the President and Annual Report
December 31, 2023
Special Notice:
Beginning in July 2024, new regulations issued by the Securities and Exchange Commission (SEC) will take effect requiring open-end mutual fund companies and ETFs to (1) overhaul the content of their shareholder reports and (2) mail paper copies of the new tailored shareholder reports to shareholders who have not opted to receive these documents electronically.
If you have not yet elected to receive your shareholder reports electronically, please contact your financial intermediary or visit our website.
| Not FDIC/NCUA Insured | Not a Deposit | May Lose Value | No Bank Guarantee | Not Insured by Any Government Agency |
This page intentionally left blank
Message from the President
Against a backdrop of easing inflationary pressures and continued economic growth, stocks and bonds generally gained ground during the 12-month period ended December 31, 2023, despite high levels of volatility and sharp disparities between the performance of the different market sectors.
Although the war in Ukraine, the outbreak of hostilities in the Middle East and several other notable events affected financial assets, inflation, interest rate, and economic growth trends stood at the forefront of market developments during most of the period. As the reporting period began, high levels of inflation already showed signs of easing in the face of aggressive rate hikes by U.S. Federal Reserve (the “Fed”). From a peak of 9.1% in June 2022, the annualized U.S. inflation rate dropped to 6.4% in January, and 3.4% in December 2023. At the same time, the Fed increased the benchmark federal funds rate from 4.25%–4.50% at the beginning of reporting period, to 5.25%–5.50% as of the end of 2023. Despite the increasing cost of capital and tighter lending environment that resulted from rising rates, economic growth remained surprisingly robust, bolstered by high levels of consumer spending, low levels of unemployment and better-than-expected corporate earnings. With the pace of rate increases slowing from the prior year, investors began hoping for an early shift to a looser monetary policy, with stock prices and bond yields reacting as economic data and statements from the Fed either reinforced or undercut those hopes. Following months of hawkish rhetoric, the Fed finally reversed its stance in December 2023, signaling a positive economic outlook with little chance of a recession and a likelihood of rate cuts in 2024.
The S&P 500® Index, a widely regarded benchmark of U.S. market performance, produced strong gains during the reporting period-– recovering all its losses from 2022 and approached new record territory. A preponderance of the Index’s gains were generated by a relatively small number of mega-cap stocks in the information technology, communication services and consumer discretionary sectors that stood to benefit from rapid developments in generative artificial intelligence (“AI”). Value-oriented, interest-rate sensitive and small-capitalization
shares lagged by significant margins, although market strength widened during the closing weeks of the reporting period. Most overseas equity markets trailed the U.S. market, as developed international economies experienced relatively low growth rates, and weak economic conditions in China undermined emerging markets.
Bonds produced generally positive returns, bolstered by attractive and relatively stable yields. The yield on the 10-year Treasury note hit a high of just under 5% in mid-October 2023, ranging between approximately 3.5% and 4.8% for most of the reporting period. The yield curve remained inverted throughout the year, with the 2-year Treasury yield modestly above the 10-year yield. Corporate bond prices trended moderately higher, generally outperforming government securities. After years of low yields and tight credit spreads, the corporate sector benefited from more attractive valuations and income opportunities. Among corporates, markets generally rewarded longer duration and lower credit quality, although an uptick in default rates posed added risks for high-yield corporate bonds. International bond markets produced mixed returns, with emerging-markets issues advancing over their developed-markets counterparts.
The market volatility of recent years reminds us of the constant need for experienced and steadfast portfolio management in the face of uncertainty. New York Life Investments remains dedicated to providing you, as a valued MainStay VP investor, with the guidance, resources and investment solutions you need to pursue your financial goals.
Thank you for trusting us to help meet your investment needs.
Sincerely,
Kirk C. Lehneis
President
The opinions expressed are as of the date of this report and are subject to change. There is no guarantee that any forecast made will come to pass. This material does not constitute investment advice and is not intended as an endorsement of any specific investment. Past performance is no guarantee of future results.
Not part of the Annual Report
Investors should refer to the Portfolio’s Summary Prospectus and/or Prospectus and consider the Portfolio’s investment objectives, strategies, risks, charges and expenses carefully before investing. The Summary Prospectus and/or Prospectus contain this and other information about the Portfolio. You may obtain copies of the Portfolio’s Summary Prospectus, Prospectus and Statement of Additional Information, which includes information about the MainStay VP Funds Trust's Trustees, free of charge, upon request, by calling toll-free 800-598-2019, by writing to New York Life Insurance and Annuity Corporation, 51 Madison Avenue, Room 251, New York, New York 10010 or by sending an email to MainStayShareholdersServices@nylim.com. These documents are also available at newyorklifeinvestments.com/investment-products/vp. Please read the Portfolio's Summary Prospectus and/or Prospectus carefully before investing. MainStay VP Funds Trust portfolios are separate account options which are purchased through a variable insurance or variable annuity contract.
Investment and Performance Comparison (Unaudited)
Performance data quoted represents past performance. Past performance is no guarantee of future results. Because of market volatility and other factors, current performance may be lower or higher than the figures shown. Investment return and principal value will fluctuate, and as a result, when shares are redeemed, they may be worth more or less than their original cost. The performance table and graph do not reflect any deduction of sales charges, mortality and expense charges, contract charges or administrative charges. Please refer to the Performance Summary appropriate for your policy. For performance information current to the most recent month-end, please call 800-598-2019 or visit www.newyorklife.com.
Performance figures may reflect certain fee waivers and/or expense limitations, without which total returns may have been different. For information on current fee waivers and/or expense limitations (if any), please refer to the Notes to Financial Statements.
| Average Annual Total Returns for the Year-Ended December 31, 2023 |
| Class | Inception
Date | One
Year | Five
Years | Ten
Years | Gross
Expense
Ratio1 |
| Initial Class Shares | 2/17/2012 | 3.72% | 3.34% | 2.27% | 0.76% |
| Service Class Shares | 2/17/2012 | 3.46 | 3.08 | 2.01 | 1.01 |
| 1. | The gross expense ratios presented reflect the Portfolio’s “Total Annual Portfolio Operating Expenses” from the most recent Prospectus and may differ from other expense ratios disclosed in this report. |
| Benchmark Performance* | One
Year | Five
Years | Ten
Years |
| Bloomberg U.S. TIPS Index1 | 3.90% | 3.15% | 2.42% |
| Morningstar Inflation-Protected Bond Category Average2 | 2.82 | 2.93 | 1.98 |
| * | Returns for indices reflect no deductions for fees, expenses or taxes, except for foreign withholding taxes where applicable. Results assume reinvestment of all dividends and capital gains. An investment cannot be made directly in an index. |
| 1. | The Bloomberg U.S. TIPS Index is the primary benchmark. The Bloomberg U.S. TIPS Index includes all publicly issued U.S. Treasury Inflation-Protected Securities (“TIPS”) that have at least one year remaining to maturity and are rated investment grade. |
| 2. | The Morningstar Inflation-Protected Bond Category Average is representative of funds that invest primarily in debt securities that adjust their principal values in line with the rate of inflation. These bonds can be issued by any organization, but the U.S. Treasury is currently the largest issuer for these types of securities. Results are based on average total returns of similar funds with all dividends and capital gain distributions reinvested. |
Cost in Dollars of a $1,000 Investment in MainStay VP PIMCO Real Return Portfolio (Unaudited)
The example below is intended to describe the fees and expenses borne by shareholders during the six-month period from July 1, 2023 to December 31, 2023, and the impact of those costs on your investment.
Example
As a shareholder of the Portfolio you incur two types of costs: (1) transaction costs, including exchange fees and sales charges (loads) on purchases (as applicable), and (2) ongoing costs, including management fees, distribution and/or service (12b-1) fees and other Portfolio expenses (as applicable). This example is intended to help you understand your ongoing costs (in dollars) of investing in the Portfolio and to compare these costs with the ongoing costs of investing in other mutual funds. The example is based on an investment of $1,000 made at the beginning of the six-month period and held for the entire period from July 1, 2023 to December 31, 2023. Shares are only sold in connection with variable life and annuity contracts and the example does not reflect any contract level or transactional fees or expenses. If these costs had been included, your costs would have been higher.
This example illustrates your Portfolio’s ongoing costs in two ways:
Actual Expenses
The second and third data columns in the table below provide information about actual account values and actual expenses. You may use the information in these columns, together with the amount you invested, to estimate the expenses that you paid during the six months ended
December 31, 2023. Simply divide your account value by $1,000 (for example, an $8,600 account value divided by $1,000 = 8.6), then multiply the result by the number under the heading entitled “Expenses Paid During Period” to estimate the expenses you paid on your account during this period.
Hypothetical Example for Comparison Purposes
The fourth and fifth data columns in the table below provide information about hypothetical account values and hypothetical expenses based on the Portfolio’s actual expense ratio and an assumed rate of return of 5% per year before expenses, which is not the Portfolio’s actual return. The hypothetical account values and expenses may not be used to estimate the actual ending account balances or expenses you paid for the six-month period shown. You may use this information to compare the ongoing costs of investing in the Portfolio with the ongoing costs of investing in other mutual funds. To do so, compare this 5% hypothetical example with the 5% hypothetical examples that appear in the shareholder reports of the other mutual funds.
Please note that the expenses shown in the table are meant to highlight your ongoing costs only and do not reflect any transactional costs, such as exchange fees or sales charges (loads). Therefore, the fourth and fifth data columns of the table are useful in comparing ongoing costs only and will not help you determine the relative total costs of owning different funds. In addition, if these transactional costs were included, your costs would have been higher.
| Share Class | Beginning
Account
Value
7/1/23 | Ending Account
Value (Based
on Actual
Returns and
Expenses)
12/31/23 | Expenses
Paid
During
Period1 | Ending Account
Value (Based
on Hypothetical
5% Annualized
Return and
Actual Expenses)
12/31/23 | Expenses
Paid
During
Period1 | Net Expense
Ratio
During
Period2 |
| Initial Class Shares | $1,000.00 | $1,022.10 | $3.72 | $1,021.53 | $3.72 | 0.73% |
| Service Class Shares | $1,000.00 | $1,020.80 | $4.99 | $1,020.26 | $4.99 | 0.98% |
| 1. | Expenses are equal to the Portfolio’s annualized expense ratio of each class multiplied by the average account value over the period, divided by 365 and multiplied by 184 (to reflect the six-month period). The table above represents the actual expenses incurred during the six-month period. In addition to the fees and expenses which the Portfolio bears directly, it also indirectly bears a pro rata share of the fees and expenses of the underlying funds in which it invests. Such indirect expenses are not included in the above-reported expense figures. |
| 2. | Expenses are equal to the Portfolio's annualized expense ratio to reflect the six-month period. |
| 6 | MainStay VP PIMCO Real Return Portfolio |
Portfolio Composition as of December 31, 2023 (Unaudited)
See Portfolio of Investments beginning on page 10 for specific holdings within these categories. The Portfolio's holdings are subject to change.
Top Ten Holdings and/or Issuers Held as of December 31, 2023 (excluding short-term investments) (Unaudited)
| 1. | U.S. Treasury Inflation Linked Notes, 0.125%-1.625%, due 4/15/24–1/15/33 |
| 2. | U.S. Treasury Inflation Linked Bonds, 0.125%-3.375%, due 1/15/25–2/15/53 |
| 3. | UMBS, Single Family, 30 Year, 4.00%-6.00%, due 1/25/54–2/25/54 |
| 4. | Italy Buoni Poliennali Del Tesoro, 0.40%-1.40%, due 5/26/25–5/15/30 |
| 5. | Japan Government CPI Linked Bond, 0.10%, due 3/10/28–3/10/29 |
| 6. | France Government Bond, 0.10%-0.25%, due 7/25/24–7/25/38 |
| 7. | GNMA, 6.238%-6.464%, due 4/20/67–7/20/73 |
| 8. | Nykredit Realkredit A/S, 0.50%-2.50%, due 10/1/43–10/1/53 |
| 9. | VMC Finance LLC, 7.238%, due 2/18/39 |
| 10. | Jyske Realkredit A/S, 0.50%-2.50%, due 10/1/43–10/1/53 |
Portfolio Management Discussion and Analysis (Unaudited)
Answers to the questions reflect the views of portfolio managers Stephen A. Rodosky and Daniel He of Pacific Investment Management Company LLC, the Portfolio’s Subadvisor.
How did MainStay VP PIMCO Real Return Portfolio perform relative to its benchmark and peers during the 12 months ended December 31, 2023?
For the 12 months ended December 31, 2023, MainStay VP PIMCO Real Return Portfolio returned 3.72% for Initial Class shares and 3.46% for Service Class shares. Over the same period, both share classes underperformed the 3.90% return of the Bloomberg U.S. TIPS Index (“the Index”), which is the Portfolio’s benchmark. For the 12 months ended December 31, 2023, both share classes outperformed the 2.82% return of the Morningstar Inflation-Protected Bond Category Average.1
What factors affected the Portfolio’s relative performance during the reporting period?
The following strategies detracted from the Portfolio’s relative performance during the reporting period:
| • | Short exposure to Japanese interest rates and long exposure to the Japanese yen, as Japanese interest rates broadly moved lower over the reporting period. |
The following strategies made positive contributions to the Portfolio’s relative performance during the same period (Contributions take weightings and total returns into account.):
| • | Out-of-Index holdings of non-agency mortgage positions, as mortgage spreads2 tightened, |
| • | Nominal U.S. interest-rate strategies, including duration3 positioning, yield curve4 strategies and security selection, and, |
| • | Overweight U.S. breakeven inflation positioning, as inflation expectations rose in the United States. |
During the reporting period, how was the Portfolio’s performance materially affected by investments in derivatives?
Derivatives are used in the Portfolio to gain or decrease exposure to securities, markets or sectors; as a substitute for exposure that may not otherwise be accessible using cash bonds; for purposes of liquidity; or to take advantage of anticipated changes in market volatility.
U.S. and Eurozone breakeven inflation positioning, which was partially achieved using swaps, options and futures, contributed positively to U.S. and Eurozone breakeven performance. Yield curve strategies within Eurozone and Japanese nominal interest rates—partially facilitated through the use of swaps, options and
futures—detracted from performance, largely offsetting a positive contribution from overall U.S. and Eurozone nominal duration positioning. Finally, currency exposure, through the use of currency forwards, detracted from performance overall.
What was the Portfolio’s duration strategy during the reporting period?
Relative to the Index, the Portfolio reduced its underweight exposure to headline duration, shifting to an overweight position of 0.08 years at the end of the reporting period. The Portfolio maintained overweight exposure to real duration (nominal interest rates minus the inflation rate), primarily sourced in U.S. real rates, as long-term inflation expectations were still well anchored. The Portfolio reduced real duration exposure in the Eurozone to an underweight position, as inflation expectations were at rich levels relative to the United States. Throughout the reporting period, the Portfolio held modestly overweight exposure to Japanese breakeven inflation, which initially lagged the global recovery.
Overall, breakeven inflation strategies posted positive performance over the reporting period. Nominal duration strategies, particularly overweight U.S. and underweight Eurozone strategies also contributed positively. The Portfolio’s overall duration increased during the reporting period, standing at 6.66 years as of December 31, 2023.
What specific factors, risks or market forces prompted significant decisions for the Portfolio during the reporting period?
The Portfolio remained defensively positioned, as recessionary risks remained elevated. Additionally, the Portfolio tactically shifted overweight and underweight positions throughout the reporting period to take advantage of the volatile interest rate and inflationary environment. Most of the key strategies described above remained intact.
Throughout most of the reporting period, the Portfolio maintained an underweight position in duration, mainly sourced in Eurozone and Japanese rates. The Portfolio continued to be selective within curves and securities depending on prevailing valuations and market dislocations. The Portfolio eliminated the peak underweight posture to Japanese nominal rates, given the reduced probability of a Bank of Japan policy adjustment in the near-term. The Portfolio maintained overweight exposure to U.S. breakevens, as long-term inflation expectations remained well anchored, and held underweight exposure to Eurozone breakevens, given the richness and relative value in the
| 1. | See "Investment and Performance Comparison" for more information on benchmark and peer group returns. |
| 2. | The terms “spread” and “yield spread” may refer to the difference in yield between a security or type of security and comparable U.S. Treasury issues. The terms may also refer to the difference in yield between two specific securities or types of securities at a given time. |
| 3. | Duration is a measure of the price sensitivity of a fixed-income investment to changes in interest rates. Duration is expressed as a number of years and is considered a more accurate sensitivity gauge than average maturity. |
| 4. | The yield curve is a line that plots the yields of various securities of similar quality—typically U.S. Treasury issues—across a range of maturities. The U.S. Treasury yield curve serves as a benchmark for other debt and is used in economic forecasting. |
| 8 | MainStay VP PIMCO Real Return Portfolio |
United States. The Portfolio maintained modest exposure to Japanese inflation-linked bonds, given the lag in global recovery and the asymmetric payoff potential.
During the reporting period, which market segments were the strongest positive contributors to the Portfolio’s absolute performance and which market segments were particularly weak?
Within real duration, a long position in U.S. Treasury Inflation-Protected Securities (TIPS) added to performance as rates across the real yield curve declined. Out-of-Index exposures to spread sectors, such as non-agency mortgage-backed securities (“MBS”), added to performance. Exposure to the 5-7-year portion of the real yield curve in Japan contributed positively to performance as the real curve shifted down. Overweight nominal duration positions, specifically in the United States, detracted from absolute performance amid rising global interest rates. Tactical curve positioning in Japanese nominal rates detracted from absolute performance, given the Portfolio’s short exposure to the intermediate portion of the Japanese yield curve, as rates fell over that segment. Lastly, currency strategies, namely exposure to the Japanese yen, detracted from absolute performance.
Did the Portfolio make any significant purchases or sales during the reporting period?
As mentioned above, the Portfolio added overall duration relative to the Bloomberg U.S. TIPS Index over the reporting period. The Portfolio held overweight exposure to U.S. nominal duration and underweight exposure to Eurozone nominal duration, given significant rate differentials. Also mentioned above, the Portfolio eliminated the tactical short to Japanese nominal duration, given the reduced probability of central bank action. The Portfolio maintained overweight exposure to U.S. breakeven inflation, benefiting from elevated inflation expectations amid hawkish Fed rhetoric. The Portfolio moved to an underweight position in Eurozone breakeven inflation and maintained a modest overweight to Japanese breakeven inflation. Lastly, the Portfolio continued to hold tactical exposures to mortgages and corporate credit.
How was the Portfolio positioned at the end of the reporting period?
As of December 31, 2023, the Portfolio held overweight exposure to duration overall, and favored U.S. rates over those of other developed markets. The Portfolio continued to hold overweight exposure to U.S. and Japanese breakeven inflation. The Portfolio
also continued to hold out-of-Index exposure to MBS and modest exposure to corporate securities.
The opinions expressed are those of the portfolio managers as of the date of this report and are subject to change. There is no guarantee that any forecasts will come to pass. This material does not constitute investment advice and is not intended as an endorsement of any specific investment.
Not all MainStay VP Portfolios and/or share classes are available under all policies.
Portfolio of Investments December 31, 2023†^
| | Principal
Amount | Value |
| Long-Term Bonds 109.0% |
| Asset-Backed Securities 8.4% |
| Home Equity Asset-Backed Securities 1.5% |
| Argent Securities Trust | |
| Series 2006-W4, Class A2C | | |
| 5.79% (1 Month SOFR + 0.434%), due 5/25/36 (a) | $ 279,422 | $ 66,320 |
| Credit Suisse First Boston Mortgage Securities Corp. | |
| Series 2001-HE17, Class A1 | | |
| 5.077% (1 Month SOFR + 0.734%), due 1/25/32 (a) | 413,397 | 396,205 |
| Credit-Based Asset Servicing and Securitization LLC | |
| Series 2007-CB6, Class A3 | | |
| 5.69% (1 Month SOFR + 0.334%), due 7/25/37 (a)(b) | 764,727 | 484,262 |
| CWABS Asset-Backed Certificates Trust | |
| Series 2007-8, Class 1A1 | | |
| 5.66% (1 Month SOFR + 0.304%), due 11/25/37 (a) | 1,185,287 | 1,092,862 |
| First Franklin Mortgage Loan Trust | |
| Series 2006-FF17, Class A2 | | |
| 5.59% (1 Month SOFR + 0.234%), due 12/25/36 (a) | 374,000 | 323,292 |
| GSAA Home Equity Trust | |
| Series 2006-17, Class A3A | | |
| 5.95% (1 Month SOFR + 0.594%), due 11/25/36 (a) | 965,832 | 310,932 |
| Home Equity Asset Trust | |
| Series 2005-8, Class M2 | | |
| 6.145% (1 Month SOFR + 0.789%), due 2/25/36 (a) | 184,428 | 177,564 |
| Lehman XS Trust | |
| Series 2007-20N, Class A1 | | |
| 7.77% (1 Month SOFR + 2.414%), due 12/25/37 (a) | 24,309 | 23,111 |
| Long Beach Mortgage Loan Trust | |
| Series 2006-7, Class 2A2 | | |
| 5.71% (1 Month SOFR + 0.354%), due 8/25/36 (a) | 217,173 | 84,468 |
| Mastr Asset-Backed Securities Trust | |
| Series 2006-WMC4, Class A5 | | |
| 5.62% (1 Month SOFR + 0.264%), due 10/25/36 (a) | 109,839 | 35,658 |
| Morgan Stanley ABS Capital I, Inc. Trust | |
| Series 2005-WMC1, Class M3 | | |
| 6.25% (1 Month SOFR + 0.894%), due 1/25/35 (a) | 95,433 | 92,896 |
| | Principal
Amount | Value |
| |
| Home Equity Asset-Backed Securities (continued) |
| New Century Home Equity Loan Trust | |
| Series 2004-4, Class M1 | | |
| 6.235% (1 Month SOFR + 0.879%), due 2/25/35 (a) | $ 47,341 | $ 45,586 |
| Option One Mortgage Loan Trust | |
| Series 2006-1, Class M1 | | |
| 6.01% (1 Month SOFR + 0.654%), due 1/25/36 (a) | 1,200,000 | 1,086,765 |
| Popular ABS Mortgage Pass-Through Trust | |
| Series 2006-A, Class M2 | | |
| 6.34% (1 Month SOFR + 0.984%), due 2/25/36 (a) | 1,238,000 | 1,127,373 |
| RASC Trust (a) | |
| Series 2006-EMX4, Class A4 | | |
| 5.93% (1 Month SOFR + 0.344%), due 6/25/36 | 365,328 | 350,742 |
| Series 2005-EMX1, Class M2 | | |
| 6.565% (1 Month SOFR + 1.209%), due 3/25/35 | 631,322 | 617,045 |
| Saxon Asset Securities Trust | |
| Series 2007-3, Class 1A | | |
| 5.78% (1 Month SOFR + 0.424%), due 9/25/37 (a) | 81,059 | 76,124 |
| Securitized Asset-Backed Receivables LLC Trust (a) | |
| Series 2006-HE2, Class A2C | | |
| 5.77% (1 Month SOFR + 0.414%), due 7/25/36 | 324,589 | 126,757 |
| Series 2006-HE1, Class A2C | | |
| 5.79% (1 Month SOFR + 0.434%), due 7/25/36 | 522,759 | 177,011 |
| Soundview Home Loan Trust (a) | |
| Series 2007-OPT2, Class 2A3 | | |
| 5.65% (1 Month SOFR + 0.294%), due 7/25/37 | 147,555 | 126,619 |
| Series 2007-OPT1, Class 1A1 | | |
| 5.67% (1 Month SOFR + 0.314%), due 6/25/37 | 249,172 | 173,899 |
| | | 6,995,491 |
| Other Asset-Backed Securities 6.9% |
| ACAS CLO Ltd. | |
| Series 2015-1A, Class AR3 | | |
| 6.547% (3 Month SOFR + 1.152%), due 10/18/28 (a)(b) | 324,979 | 324,576 |
| Anchorage Capital CLO 6 Ltd. | |
| Series 2015-6A, Class ARR | | |
| 6.705% (3 Month SOFR + 1.312%), due 7/15/30 (a)(b) | 334,196 | 334,183 |
The notes to the financial statements are an integral part of, and should be read in conjunction with, the financial statements.
| 10 | MainStay VP PIMCO Real Return Portfolio |
| | Principal
Amount | Value |
| Asset-Backed Securities (continued) |
| Other Asset-Backed Securities (continued) |
| Anchorage Capital CLO 9 Ltd. | |
| Series 2016-9A, Class AR2 | | |
| 6.795% (3 Month SOFR + 1.402%), due 7/15/32 (a)(b) | $ 300,000 | $ 299,701 |
| Anchorage Capital CLO 11 Ltd. | |
| Series 2019-11A, Class AR | | |
| 6.814% (3 Month SOFR + 1.402%), due 7/22/32 (a)(b) | 300,000 | 299,622 |
| Anchorage Capital Europe CLO 1 DAC | |
| Series 1A, Class A1R | | |
| 4.745% (3 Month EURIBOR + 0.78%), due 1/15/31 (a)(b) | EUR 1,095,178 | 1,191,266 |
| Apidos CLO XXVI | |
| Series 2017-26A, Class A1AR | | |
| 6.557% (3 Month SOFR + 1.162%), due 7/18/29 (a)(b) | $ 646,213 | 645,649 |
| ARES European CLO VI DAC | |
| Series 2013-6A, Class ARR | | |
| 4.575% (3 Month EURIBOR + 0.61%), due 4/15/30 (a)(b) | EUR 575,205 | 627,721 |
| ARES European CLO X DAC | |
| Series 10A, Class AR | | |
| 4.745% (3 Month EURIBOR + 0.78%), due 10/15/31 (a)(b) | 1,085,718 | 1,186,353 |
| ARES XL CLO Ltd. | |
| Series 2016-40A, Class A1RR | | |
| 6.525% (3 Month SOFR + 1.132%), due 1/15/29 (a)(b) | $ 643,294 | 642,334 |
| Atlas Senior Loan Fund Ltd. | |
| Series 2017-8A, Class A | | |
| 6.805% (3 Month SOFR + 1.412%), due 1/16/30 (a)(b) | 561,040 | 561,017 |
| Atlas Static Senior Loan Fund I Ltd. | |
| Series 2022-1A, Class AR | | |
| 7.101% (3 Month SOFR + 1.75%), due 7/15/30 (a)(b) | 410,000 | 409,976 |
| Bain Capital Euro CLO DAC | |
| Series 2020-1A, Class A | | |
| 5.102% (3 Month EURIBOR + 1.10%), due 1/24/33 (a)(b) | EUR 500,000 | 547,006 |
| Benefit Street Partners CLO XII Ltd. | |
| Series 2017-12A, Class A1R | | |
| 6.605% (3 Month SOFR + 1.212%), due 10/15/30 (a)(b) | $ 391,928 | 391,485 |
| | Principal
Amount | Value |
| |
| Other Asset-Backed Securities (continued) |
| Benefit Street Partners CLO XVI Ltd. | |
| Series 2018-16A, Class A1R | | |
| 6.694% (3 Month SOFR + 1.292%), due 1/17/32 (a)(b) | $ 300,000 | $ 299,855 |
| Black Diamond CLO DAC | |
| Series 2017-2A, Class A1 | | |
| 4.853% (3 Month EURIBOR + 0.86%), due 1/20/32 (a)(b) | EUR 604,651 | 662,326 |
| BlueMountain Fuji EUR CLO V DAC | |
| Series 5A, Class A | | |
| 4.875% (3 Month EURIBOR + 0.91%), due 1/15/33 (a)(b) | 1,100,000 | 1,195,622 |
| Carlyle Global Market Strategies CLO Ltd. | |
| Series 2013-1A, Class A1RR | | |
| 6.589% (3 Month SOFR + 1.212%), due 8/14/30 (a)(b) | $ 396,469 | 396,275 |
| Carlyle Global Market Strategies Euro CLO Ltd. | |
| Series 2014-2A, Class AR1 | | |
| 4.752% (3 Month EURIBOR + 0.75%), due 11/15/31 (a)(b) | EUR 998,134 | 1,083,163 |
| Carlyle U.S. CLO Ltd. | |
| Series 2017-1A, Class A1R | | |
| 6.677% (3 Month SOFR + 1.262%), due 4/20/31 (a)(b) | $ 636,738 | 636,555 |
| CIFC Funding Ltd. (a)(b) | |
| Series 2017-4A, Class A1R | | |
| 6.61% (3 Month SOFR + 1.212%), due 10/24/30 | 337,490 | 337,322 |
| Series 2018-3A, Class A | | |
| 6.757% (3 Month SOFR + 1.362%), due 7/18/31 | 499,914 | 499,906 |
| Crestline Denali CLO XV Ltd. | |
| Series 2017-1A, Class AR | | |
| 6.707% (3 Month SOFR + 1.292%), due 4/20/30 (a)(b) | 178,768 | 178,811 |
| Cumulus Static CLO DAC | |
| Series 2023-1A, Class A | | |
| 5.499% (3 Month EURIBOR + 1.50%), due 4/25/33 (a)(b) | EUR 1,000,000 | 1,102,254 |
| Dryden 52 Euro CLO DAC | |
| Series 2017-52A, Class AR | | |
| 4.862% (3 Month EURIBOR + 0.86%), due 5/15/34 (a)(b) | 499,101 | 541,267 |
| Elmwood CLO 24 Ltd. | |
| Series 2023-3A, Class A1 | | |
| 7.044% (3 Month SOFR + 1.70%), due 12/11/33 (a)(b) | $ 1,000,000 | 998,690 |
The notes to the financial statements are an integral part of, and should be read in conjunction with, the financial statements.
11
Portfolio of Investments December 31, 2023†^ (continued)
| | Principal
Amount | Value |
| Asset-Backed Securities (continued) |
| Other Asset-Backed Securities (continued) |
| Gallatin CLO VIII Ltd. | |
| Series 2017-1A, Class A1R | | |
| 6.745% (3 Month SOFR + 1.352%), due 7/15/31 (a)(b) | $ 397,612 | $ 396,408 |
| HalseyPoint CLO 3 Ltd. | |
| Series 2020-3A, Class A1A | | |
| 7.102% (3 Month SOFR + 1.712%), due 11/30/32 (a)(b) | 500,000 | 500,196 |
| Invesco Euro CLO I DAC | |
| Series 1A, Class A1R | | |
| 4.615% (3 Month EURIBOR + 0.65%), due 7/15/31 (a)(b) | EUR 500,000 | 542,864 |
| LCM 30 Ltd. | |
| Series 30A, Class AR | | |
| 6.757% (3 Month SOFR + 1.342%), due 4/20/31 (a)(b) | $ 1,350,000 | 1,336,524 |
| LCM Loan Income Fund I Ltd. | |
| Series 1A, Class A | | |
| 6.707% (3 Month SOFR + 1.292%), due 4/20/31 (a)(b) | 963,504 | 960,953 |
| LCM XIII LP | |
| Series 13A, Class AR3 | | |
| 6.528% (3 Month SOFR + 1.132%), due 7/19/27 (a)(b) | 295,408 | 295,370 |
| LCM XV LP | |
| Series 15A, Class AR2 | | |
| 6.677% (3 Month SOFR + 1.262%), due 7/20/30 (a)(b) | 232,840 | 232,727 |
| LCM XXV Ltd. | |
| Series 25A, Class AR | | |
| 6.516% (3 Month SOFR + 1.10%), due 7/20/30 (a)(b) | 936,147 | 934,135 |
| Lockwood Grove CLO Ltd. | |
| Series 2014-1A, Class A1RR | | |
| 6.81% (3 Month SOFR + 1.432%), due 1/25/30 (a)(b) | 176,400 | 176,393 |
| Madison Park Euro Funding IX DAC | |
| Series 9A, Class AR | | |
| 4.845% (3 Month EURIBOR + 0.88%), due 7/15/35 (a)(b) | EUR 500,000 | 540,992 |
| Magnetite XVIII Ltd. | |
| Series 2016-18A, Class AR2 | | |
| 6.521% (3 Month SOFR + 1.142%), due 11/15/28 (a)(b) | $ 216,929 | 216,739 |
| | Principal
Amount | Value |
| |
| Other Asset-Backed Securities (continued) |
| Man GLG Euro CLO II DAC | |
| Series 2A, Class A1R | | |
| 4.835% (3 Month EURIBOR + 0.87%), due 1/15/30 (a)(b) | EUR 65,565 | $ 72,114 |
| MidOcean Credit CLO II | |
| Series 2013-2A, Class ARR | | |
| 6.682% (3 Month SOFR + 1.292%), due 1/29/30 (a)(b) | $ 84,998 | 84,944 |
| Neuberger Berman Loan Advisers NBLA CLO 53 Ltd. | |
| Series 2023-53A, Class A | | |
| 6.957% (3 Month SOFR + 1.59%), due 10/24/32 (a)(b) | 700,000 | 699,939 |
| OCP Euro CLO DAC | |
| Series 2017-2A, Class A | | |
| 4.785% (3 Month EURIBOR + 0.82%), due 1/15/32 (a)(b) | EUR 750,815 | 822,582 |
| OSD CLO Ltd. | |
| Series 2021-23A, Class A | | |
| 6.534% (3 Month SOFR + 1.132%), due 4/17/31 (a)(b) | $ 1,150,838 | 1,146,938 |
| OZLM VIII Ltd. | |
| Series 2014-8A, Class A1R3 | | |
| 6.644% (3 Month SOFR + 1.242%), due 10/17/29 (a)(b) | 222,472 | 222,250 |
| OZLM XI Ltd. | |
| Series 2015-11A, Class A1R | | |
| 6.902% (3 Month SOFR + 1.512%), due 10/30/30 (a)(b) | 584,371 | 584,102 |
| OZLM XXIV Ltd. | |
| Series 2019-24A, Class A1AR | | |
| 6.837% (3 Month SOFR + 1.422%), due 7/20/32 (a)(b) | 200,000 | 198,913 |
| Palmer Square European Loan Funding DAC | |
| Series 2023-3A, Class A | | |
| 5.46% (3 Month EURIBOR + 1.50%), due 5/15/33 (a)(b) | EUR 500,000 | 551,934 |
| Palmer Square Loan Funding Ltd. (a)(b) | |
| Series 2021-4A, Class A1 | | |
| 6.455% (3 Month SOFR + 1.062%), due 10/15/29 | $ 330,103 | 329,188 |
| Series 2021-3A, Class A1 | | |
| 6.477% (3 Month SOFR + 1.062%), due 7/20/29 | 750,812 | 749,403 |
| Rad CLO 5 Ltd. | |
| Series 2019-5A, Class AR | | |
| 6.78% (3 Month SOFR + 1.382%), due 7/24/32 (a)(b) | 1,700,000 | 1,699,986 |
The notes to the financial statements are an integral part of, and should be read in conjunction with, the financial statements.
| 12 | MainStay VP PIMCO Real Return Portfolio |
| | Principal
Amount | Value |
| Asset-Backed Securities (continued) |
| Other Asset-Backed Securities (continued) |
| Romark CLO Ltd. | |
| Series 2017-1A, Class A1R | | |
| 6.704% (3 Month SOFR + 1.292%), due 10/23/30 (a)(b) | $ 326,001 | $ 325,904 |
| Saranac CLO VI Ltd. | |
| Series 2018-6A, Class A1R | | |
| 6.781% (3 Month SOFR + 1.402%), due 8/13/31 (a)(b) | 285,496 | 285,333 |
| SLM Student Loan Trust | |
| Series 2004-3A, Class A6B | | |
| 6.146% (SOFR 90A + 0.812%), due 10/25/64 (a)(b) | 282,282 | 272,904 |
| Sound Point CLO IX Ltd. | |
| Series 2015-2A, Class ARRR | | |
| 6.887% (3 Month SOFR + 1.472%), due 7/20/32 (a)(b) | 500,000 | 496,010 |
| Sound Point CLO XV Ltd. | |
| Series 2017-1A, Class ARR | | |
| 6.574% (3 Month SOFR + 1.162%), due 1/23/29 (a)(b) | 166,811 | 166,774 |
| THL Credit Wind River CLO Ltd. | |
| Series 2019-3A, Class AR | | |
| 6.735% (3 Month SOFR + 1.342%), due 7/15/31 (a)(b) | 300,000 | 297,926 |
| Toro European CLO DAC (a)(b) | |
| Series 5A, Class A | | |
| 4.705% (3 Month EURIBOR + 0.74%), due 10/15/30 | EUR 370,891 | 405,278 |
| Series 5A, Class ANV | | |
| 4.705% (3 Month EURIBOR + 0.74%), due 10/15/30 | 519,248 | 567,390 |
| Venture 36 CLO Ltd. | |
| Series 2019-36A, Class A1AR | | |
| 6.807% (3 Month SOFR + 1.392%), due 4/20/32 (a)(b) | $ 600,000 | 592,070 |
| Venture XXIV CLO Ltd. | |
| Series 2016-24A, Class ARR | | |
| 6.577% (3 Month SOFR + 1.162%), due 10/20/28 (a)(b) | 188,452 | 188,124 |
| Venture XXV CLO Ltd. | |
| Series 2016-25A, Class ARR | | |
| 6.697% (3 Month SOFR + 1.282%), due 4/20/29 (a)(b) | 86,802 | 86,779 |
| Vibrant CLO VI Ltd. | |
| Series 2017-6A, Class AR | | |
| 6.582% (3 Month SOFR + 1.212%), due 6/20/29 (a)(b) | 178,047 | 177,891 |
| | Principal
Amount | Value |
| |
| Other Asset-Backed Securities (continued) |
| Vibrant CLO XI Ltd. | |
| Series 2019-11A, Class A1R1 | | |
| 6.797% (3 Month SOFR + 1.382%), due 7/20/32 (a)(b) | $ 400,000 | $ 399,352 |
| VOYA CLO | |
| Series 2017-2A, Class A1R | | |
| 6.635% (3 Month SOFR + 1.242%), due 6/7/30 (a)(b) | 211,058 | 210,916 |
| Wellfleet CLO Ltd. | |
| Series 2015-1A, Class AR4 | | |
| 6.567% (3 Month SOFR + 1.152%), due 7/20/29 (a)(b) | 151,593 | 151,409 |
| | | 33,312,589 |
Total Asset-Backed Securities
(Cost $41,373,054) | | 40,308,080 |
| Corporate Bonds 1.6% |
| Banks 0.7% |
| Bank of America Corp. | | |
| Series FF | | |
| 5.875%, due 3/15/28 (c)(d) | 190,000 | 181,898 |
| Lloyds Banking Group plc | | |
| Series Reg S | | |
| 4.947% (5 Year EURIBOR ICE Swap Rate + 5.29%), due 6/27/25 (a)(d) | EUR 200,000 | 214,991 |
| Nykredit Realkredit A/S | | |
| Series Reg S | | |
| 0.50%, due 10/1/43 | DKK 9,852,441 | 1,178,902 |
| Series Reg S | | |
| 1.00%, due 10/1/50 | 5,231,342 | 606,206 |
| Series Reg S | | |
| 1.00%, due 10/1/53 | 495,766 | 53,301 |
| Series Reg S | | |
| 1.50%, due 10/1/53 | 320,466 | 36,495 |
| Series Reg S | | |
| 1.50%, due 10/1/53 | 7,801,754 | 936,703 |
| Series Reg S | | |
| 1.50%, due 10/1/53 | 99,701 | 10,121 |
| Series Reg S | | |
| 2.00%, due 10/1/53 | 299,110 | 33,498 |
| Series Reg S | | |
| 2.00%, due 10/1/53 | 493,993 | 60,097 |
| Series Reg S | | |
| 2.50%, due 10/1/47 | 1,601 | 219 |
The notes to the financial statements are an integral part of, and should be read in conjunction with, the financial statements.
13
Portfolio of Investments December 31, 2023†^ (continued)
| | Principal
Amount | Value |
| Corporate Bonds (continued) |
| Banks (continued) |
| UBS Group AG | | |
| Series Reg S | | |
| 7.75%, due 3/1/29 (c) | EUR 100,000 | $ 127,155 |
| | | 3,439,586 |
| Diversified Financial Services 0.9% |
| Avolon Holdings Funding Ltd. | | |
| 2.528%, due 11/18/27 (b) | $ 66,000 | 58,465 |
| Jyske Realkredit A/S | | |
| Series CCE | | |
| 0.50%, due 10/1/43 | DKK 2,272,941 | 270,961 |
| Series Reg S | | |
| 1.00%, due 10/1/50 | 5,547,424 | 640,369 |
| Series CCE | | |
| 1.00%, due 10/1/53 | 3,891,935 | 419,060 |
| Series CCE | | |
| 1.50%, due 10/1/53 | 1,612,857 | 193,943 |
| Series CCE | | |
| 1.50%, due 10/1/53 | 1,981,706 | 225,164 |
| Series 111E | | |
| 2.50%, due 10/1/47 | 4,185 | 572 |
| Nordea Kredit Realkreditaktieselskab | | |
| 0.50%, due 10/1/43 | 859,765 | 103,283 |
| 1.00%, due 10/1/53 | 89,923 | 10,301 |
| 1.50%, due 10/1/53 | 10,597,645 | 1,204,117 |
| 1.50%, due 10/1/53 | 34,134 | 4,107 |
| 1.50%, due 10/1/53 | 500,000 | 50,794 |
| Series Reg S | | |
| 2.00%, due 10/1/53 (b) | 399,715 | 48,716 |
| 2.50%, due 10/1/47 | 1,847 | 253 |
| Realkredit Danmark A/S | | |
| Series Reg S | | |
| 1.00%, due 10/1/50 | 4,797,328 | 553,781 |
| Series Reg S | | |
| 1.00%, due 10/1/53 | 5,943 | 639 |
| Series Reg S | | |
| 1.00%, due 10/1/53 | 1,408,698 | 161,362 |
| Series Reg S | | |
| 1.50%, due 10/1/53 | 797,951 | 95,864 |
| Series Reg S | | |
| 1.50%, due 10/1/53 | 1,488,768 | 169,156 |
| Series Reg S | | |
| 2.00%, due 10/1/53 | 1,691,548 | 188,438 |
| | Principal
Amount | Value |
| |
| Diversified Financial Services (continued) |
| Realkredit Danmark A/S (continued) | | |
| Series Reg S | | |
| 2.50%, due 4/1/47 | DKK 8,463 | $ 1,151 |
| | | 4,400,496 |
Total Corporate Bonds
(Cost $10,242,815) | | 7,840,082 |
| Foreign Government Bonds 7.0% |
| Canada 0.2% |
| Canadian Government Real Return Bond | | |
| 4.25%, due 12/1/26 (e) | CAD 1,083,510 | 886,449 |
| France 1.7% |
| France Government Bond (e) | | |
| Series Reg S | | |
| 0.10%, due 3/1/26 (b) | EUR 3,661,441 | 4,002,355 |
| Series Reg S | | |
| 0.10%, due 7/25/31 (b) | 828,058 | 901,017 |
| Series Reg S | | |
| 0.10%, due 7/25/38 (b) | 1,626,072 | 1,682,276 |
| Series Reg S | | |
| 0.25%, due 7/25/24 | 1,636,622 | 1,793,390 |
| | | 8,379,038 |
| Italy 3.2% |
| Italy Buoni Poliennali Del Tesoro (b)(e) | | |
| Series Reg S | | |
| 0.40%, due 5/15/30 | 2,758,666 | 2,845,083 |
| Series Reg S | | |
| 1.40%, due 5/26/25 | 11,493,560 | 12,473,020 |
| | | 15,318,103 |
| Japan 1.8% |
| Japan Government CPI Linked Bond (e) | | |
| 0.10%, due 3/10/28 | JPY 464,579,210 | 3,464,575 |
| 0.10%, due 3/10/29 | 686,164,860 | 5,131,637 |
| | | 8,596,212 |
| Peru 0.1% |
| Peru Government Bond | | |
| 5.94%, due 2/12/29 | PEN 1,000,000 | 270,301 |
| 6.15%, due 8/12/32 | 900,000 | 237,410 |
| | | 507,711 |
Total Foreign Government Bonds
(Cost $36,370,559) | | 33,687,513 |
The notes to the financial statements are an integral part of, and should be read in conjunction with, the financial statements.
| 14 | MainStay VP PIMCO Real Return Portfolio |
| | Principal
Amount | Value |
| Mortgage-Backed Securities 3.6% |
| Agency (Collateralized Mortgage Obligations) 1.5% |
| FHLMC (a) | |
| REMIC, Series 4779, Class WF | | |
| 5.197% (SOFR 30A + 0.464%), due 7/15/44 | $ 122,895 | $ 119,841 |
| REMIC, Series 4694, Class FA | | |
| 5.853% (SOFR 30A + 0.514%), due 6/15/47 | 821,035 | 795,622 |
| FHLMC, Strips | |
| REMIC, Series 278, Class F1 | | |
| 5.903% (SOFR 30A + 0.564%), due 9/15/42 (a) | 138,424 | 135,058 |
| GNMA (a) | |
| REMIC, Series 2023-H20, Class FA | | |
| 6.238% (SOFR 30A + 0.90%), due 7/20/73 | 5,045,386 | 5,014,945 |
| REMIC, Series 2018-H15, Class FG | | |
| 6.246% (12 Month SOFR + 0.865%), due 8/20/68 | 317,432 | 311,171 |
| REMIC, Series 2023-H11, Class FC | | |
| 6.438% (SOFR 30A + 1.10%), due 5/20/73 | 508,527 | 510,049 |
| REMIC, Series 2017-H10, Class FB | | |
| 6.464% (12 Month SOFR + 1.465%), due 4/20/67 | 184,760 | 185,109 |
| | | 7,071,795 |
| Collateralized Debt Obligations (Commercial Real Estate Collateralized Debt Obligations) 1.1% |
| Arbor Realty Commercial Real Estate Notes Ltd. (a)(b) | |
| Series 2022-FL1, Class A | | |
| 6.788% (SOFR 30A + 1.45%), due 1/15/37 | 1,400,000 | 1,391,287 |
| Series 2021-FL4, Class A | | |
| 6.826% (1 Month SOFR + 1.464%), due 11/15/36 | 600,000 | 595,909 |
| LoanCore Issuer Ltd. | |
| Series 2022-CRE7, Class A | | |
| 6.888% (SOFR 30A + 1.55%), due 1/17/37 (a)(b) | 600,000 | 592,841 |
| VMC Finance LLC | |
| Series 2022-FL5, Class A | | |
| 7.238% (SOFR 30A + 1.90%), due 2/18/39 (a)(b) | 2,500,000 | 2,467,535 |
| | | 5,047,572 |
| | Principal
Amount | Value |
| |
| Commercial Mortgage Loans (Collateralized Mortgage Obligation) 0.3% |
| GS Mortgage Securities Corp. Trust | |
| Series 2022-GTWY, Class A | | |
| 8.762% (1 Month SOFR + 3.40%), due 8/15/39 (a)(b) | $ 1,300,000 | $ 1,307,534 |
| Whole Loan (Collateralized Mortgage Obligations) 0.7% |
| Alternative Loan Trust | |
| Series 2005-29CB, Class A4 | | |
| 5.00%, due 7/25/35 | 25,127 | 14,271 |
| Series 2007-1T1, Class 1A1 | | |
| 6.00%, due 3/25/37 | 525,483 | 197,977 |
| CHL Mortgage Pass-Through Trust | |
| Series 2007-1, Class A1 | | |
| 6.00%, due 3/25/37 | 25,285 | 12,096 |
| Citigroup Mortgage Loan Trust | |
| Series 2007-AR4, Class 1A1A | | |
| 4.203%, due 3/25/37 (f) | 155,798 | 133,231 |
| Citigroup Mortgage Loan Trust, Inc. | |
| Series 2004-NCM2, Class 1CB1 | | |
| 5.50%, due 8/25/34 | 117,785 | 103,719 |
| Eurosail-UK plc (a) | |
| Series 2007-3A, Class A3C | | |
| 6.269% (SONIA3M IR + 1.069%), due 6/13/45 (b) | GBP 17,255 | 21,765 |
| Series 2007-3X, Class A3A | | |
| 6.269% (SONIA3M IR + 1.069%), due 6/13/45 | 64,715 | 82,014 |
| Series 2007-3X, Class A3C | | |
| 6.269% (SONIA3M IR + 1.069%), due 6/13/45 | 17,254 | 21,765 |
| GreenPoint Mortgage Funding Trust | |
| Series 2006-AR4, Class A6A | | |
| 5.83% (1 Month SOFR + 0.474%), due 9/25/46 (a) | $ 57,710 | 50,812 |
| IndyMac INDX Mortgage Loan Trust (a) | |
| Series 2005-AR12, Class 2A1A | | |
| 5.95% (1 Month SOFR + 0.594%), due 7/25/35 | 86,190 | 78,021 |
| Series 2005-AR14, Class 1A1A | | |
| 6.03% (1 Month SOFR + 0.674%), due 7/25/35 | 643,634 | 460,046 |
| Merrill Lynch Mortgage Investors Trust | |
| Series 2005-A4, Class 1A | | |
| 4.822%, due 7/25/35 (f) | 137,209 | 62,989 |
| New Residential Mortgage Loan Trust (b)(g) | |
| Series 2019-RPL3, Class A1 | | |
| 2.75%, due 7/25/59 | 168,089 | 158,137 |
The notes to the financial statements are an integral part of, and should be read in conjunction with, the financial statements.
15
Portfolio of Investments December 31, 2023†^ (continued)
| | Principal
Amount | Value |
| Mortgage-Backed Securities (continued) |
| Whole Loan (Collateralized Mortgage Obligations) (continued) |
| New Residential Mortgage Loan Trust (b)(g) (continued) | |
| Series 2018-3A, Class A1 | | |
| 4.50%, due 5/25/58 | $ 99,379 | $ 95,959 |
| OBX Trust | |
| Series 2018-1, Class A2 | | |
| 6.12% (1 Month SOFR + 0.764%), due 6/25/57 (a)(b) | 21,650 | 20,607 |
| Opteum Mortgage Acceptance Corp. Asset-Backed Pass-Through Certificates | |
| Series 2005-2, Class M7 | | |
| 7.27% (1 Month SOFR + 1.914%), due 4/25/35 (a) | 100,000 | 95,759 |
| RALI Trust | |
| Series 2006-QH1, Class A1 | | |
| 5.85% (1 Month SOFR + 0.494%), due 12/25/36 (a) | 720,427 | 617,566 |
| Residential Asset Securitization Trust | |
| Series 2006-A10, Class A5 | | |
| 6.50%, due 9/25/36 | 219,072 | 73,925 |
| Residential Mortgage Securities 32 plc | |
| Series 32A, Class A | | |
| 6.445% (SONIA3M IR + 1.25%), due 6/20/70 (a)(b) | GBP 107,032 | 136,687 |
| Thornburg Mortgage Securities Trust | |
| Series 2004-2, Class A1 | | |
| 6.09% (1 Month SOFR + 0.734%), due 6/25/44 (a) | $ 345,380 | 314,186 |
| Towd Point Mortgage Funding Granite 4 plc | |
| Series 2019-GR4A, Class A1 | | |
| 6.384% (SONIA3M IR + 1.144%), due 10/20/51 (a)(b) | GBP 399,138 | 509,344 |
| Washington Mutual Mortgage Pass-Through Certificates WMALT Trust | |
| Series 2007-HY1, Class A2A | | |
| 5.79% (1 Month SOFR + 0.434%), due 2/25/37 (a) | $ 352,029 | 266,298 |
| Series 2006-5, Class 2CB1 | | |
| 6.00%, due 7/25/36 | 31,550 | 20,905 |
| | | 3,548,079 |
Total Mortgage-Backed Securities
(Cost $17,687,928) | | 16,974,980 |
| | Principal
Amount | Value |
| U.S. Government & Federal Agencies 88.4% |
| Federal Home Loan Mortgage Corporation (Mortgage Pass-Through Securities) 0.1% |
| UMBS Pool, 30 Year | | |
| 2.00%, due 3/1/52 | $ 182,181 | $ 148,870 |
| 3.00%, due 1/1/52 | 386,824 | 342,302 |
| | | 491,172 |
| Federal National Mortgage Association (Mortgage Pass-Through Securities) 7.9% |
| FNMA (a) | | |
| 5.075% (11th District Cost of Funds Index + 1.927%), due 12/1/36 | 36,302 | 35,917 |
| 6.211% (12 Month Monthly Treasury Average Index + 1.199%), due 6/1/43 | 98,462 | 95,284 |
| 6.377% (1 Year Treasury Constant Maturity Rate + 2.36%), due 11/1/34 | 120,666 | 124,000 |
| UMBS, 30 Year | | |
| 3.50%, due 7/1/52 | 279,549 | 256,506 |
| 4.00%, due 8/1/52 | 445,198 | 421,096 |
| 4.50%, due 7/1/52 | 561,083 | 544,059 |
| 4.50%, due 3/1/53 | 487,233 | 472,449 |
| UMBS, Single Family, 30 Year (h) | | |
| 4.00%, due 1/25/54 TBA | 10,000,000 | 9,457,422 |
| 4.50%, due 1/25/54 TBA | 7,000,000 | 6,785,078 |
| 5.00%, due 1/25/54 TBA | 9,000,000 | 8,903,672 |
| 6.00%, due 2/25/54 TBA | 10,800,000 | 10,965,796 |
| | | 38,061,279 |
| United States Treasury Inflation - Indexed Notes 80.4% |
| U.S. Treasury Inflation Linked Bonds (e) | | |
| 0.125%, due 2/15/51 | 5,802,393 | 3,587,737 |
| 0.125%, due 2/15/52 (i) | 1,989,432 | 1,218,144 |
| 0.25%, due 2/15/50 | 3,566,226 | 2,322,333 |
| 0.625%, due 2/15/43 | 2,382,032 | 1,859,465 |
| 0.75%, due 2/15/42 (i) | 7,121,220 | 5,768,414 |
| 0.75%, due 2/15/45 | 10,112,774 | 7,900,674 |
| 0.875%, due 2/15/47 | 13,947,620 | 10,982,523 |
| 1.00%, due 2/15/46 | 7,777,955 | 6,357,737 |
| 1.00%, due 2/15/48 | 4,751,127 | 3,830,272 |
| 1.00%, due 2/15/49 | 7,275,005 | 5,850,720 |
| 1.375%, due 2/15/44 (i) | 14,376,325 | 12,841,323 |
| 1.50%, due 2/15/53 (i) | 2,380,592 | 2,155,643 |
| 1.75%, due 1/15/28 | 15,015,171 | 14,921,443 |
| 2.00%, due 1/15/26 | 7,189,642 | 7,133,084 |
| 2.125%, due 2/15/40 | 4,925,241 | 5,056,094 |
The notes to the financial statements are an integral part of, and should be read in conjunction with, the financial statements.
| 16 | MainStay VP PIMCO Real Return Portfolio |
| | Principal
Amount | Value |
| U.S. Government & Federal Agencies (continued) |
| United States Treasury Inflation - Indexed Notes (continued) |
U.S. Treasury Inflation Linked Bonds (e)
(continued) | | |
| 2.125%, due 2/15/41 | $ 6,785,909 | $ 6,965,418 |
| 2.375%, due 1/15/25 | 14,836,971 | 14,720,457 |
| 2.375%, due 1/15/27 (i) | 30,513 | 30,783 |
| 2.50%, due 1/15/29 | 7,494,747 | 7,746,891 |
| 3.375%, due 4/15/32 (i) | 566,809 | 634,027 |
| U.S. Treasury Inflation Linked Notes (e) | | |
| 0.125%, due 10/15/24 | 8,634,168 | 8,445,970 |
| 0.125%, due 4/15/25 | 3,335,164 | 3,216,014 |
| 0.125%, due 10/15/25 (i) | 10,316,199 | 9,919,398 |
| 0.125%, due 4/15/26 (i) | 4,986,100 | 4,745,758 |
| 0.125%, due 7/15/26 | 11,051,452 | 10,529,734 |
| 0.125%, due 10/15/26 | 2,589,662 | 2,459,001 |
| 0.125%, due 4/15/27 | 12,640,404 | 11,876,950 |
| 0.125%, due 1/15/30 (i) | 2,702,598 | 2,449,258 |
| 0.125%, due 7/15/30 | 18,024,150 | 16,281,244 |
| 0.125%, due 1/15/31 | 19,430,600 | 17,341,200 |
| 0.125%, due 7/15/31 | 15,267,602 | 13,571,205 |
| 0.125%, due 1/15/32 | 23,752,074 | 20,857,689 |
| 0.25%, due 1/15/25 | 7,274,344 | 7,060,713 |
| 0.25%, due 7/15/29 | 20,495,882 | 18,939,713 |
| 0.375%, due 7/15/25 | 12,974,000 | 12,569,542 |
| 0.375%, due 1/15/27 | 5,069,286 | 4,817,040 |
| 0.375%, due 7/15/27 | 2,666,451 | 2,533,522 |
| 0.50%, due 4/15/24 | 9,539,696 | 9,419,332 |
| 0.50%, due 1/15/28 | 4,754,784 | 4,498,895 |
| 0.625%, due 1/15/26 (i) | 5,477,216 | 5,284,486 |
| 0.625%, due 7/15/32 (j) | 38,968,624 | 35,594,797 |
| 0.75%, due 7/15/28 | 15,823,787 | 15,142,170 |
| 0.875%, due 1/15/29 | 14,000,429 | 13,397,146 |
| 1.125%, due 1/15/33 | 3,098,640 | 2,930,997 |
| 1.625%, due 10/15/27 | 10,490,163 | 10,409,866 |
| | | 386,174,822 |
Total U.S. Government & Federal Agencies
(Cost $469,102,719) | | 424,727,273 |
Total Long-Term Bonds
(Cost $574,777,075) | | 523,537,928 |
| |
| | Shares | Value |
| |
| Short-Term Investments 58.4% |
| Affiliated Investment Company 0.2% |
| MainStay U.S. Government Liquidity Fund, 5.235% (k) | 1,122,983 | $ 1,122,983 |
| |
| | Principal
Amount | |
| |
| Commercial Paper 0.3% |
| AT&T, Inc. | | |
| 6.032%, due 3/19/24 | $ 1,300,000 | 1,283,626 |
| Repurchase Agreements 57.8% |
BNP Paribas S.A.
5.47%, dated 12/29/23
due 1/3/24
Proceeds at Maturity $60,245,735
(Collateralized by United States Treasury Inflation Protected Bond with a rate of 2.75% and maturity date of 05/31/2029, with a Principal Amount of $64,860,400 and a Market Value of $61,455,942) | 60,200,000 | 60,200,000 |
BNP Paribas S.A.
5.51%, dated 12/29/23
due 1/3/24
Proceeds at Maturity $36,828,162
(Collateralized by United States Treasury Inflation Protected Bond with a rate of 2.13% and maturity date of 05/15/2025, with a Principal Amount of $38,680,100 and a Market Value of $37,557,105) | 36,800,000 | 36,800,000 |
BofA Securities, Inc.
5.49%, dated 12/29/23
due 1/3/24
Proceeds at Maturity $60,245,903
(Collateralized by United States Treasury Inflation Protected Bond with a rate of 0.75% and maturity date of 04/30/2026, with a Principal Amount of $66,294,000 and a Market Value of $61,441,383) | 60,200,000 | 60,200,000 |
The notes to the financial statements are an integral part of, and should be read in conjunction with, the financial statements.
17
Portfolio of Investments December 31, 2023†^ (continued)
| | Principal
Amount | | Value |
| Short-Term Investments (continued) |
| Repurchase Agreements (continued) |
Deutsche Bank Securities Inc.
5.48%, dated 12/29/23
due 1/3/24
Proceeds at Maturity $60,245,819
(Collateralized by United States Treasury Bond with a rate of 3.75% and maturity date of 08/15/2041, with a Principal Amount of $63,555,000 and a Market Value of $61,591,950) | $ 60,200,000 | | $ 60,200,000 |
Deutsche Bank Securities Inc.
5.51%, dated 12/29/23
due 1/3/24
Proceeds at Maturity $60,246,070
(Collateralized by United States Treasury Bond with a rate of 1.38% and maturity date of 02/15/2044, with a Principal Amount of $68,204,860 and a Market Value of $61,901,218) | 60,200,000 | | 60,200,000 |
Total Repurchase Agreements
(Cost $277,600,000) | | | 277,600,000 |
| Treasury Debt 0.1% |
| Hungary Treasury Bill | | | |
| 10.678%, due 1/4/24 (l) | HUF 233,000,000 | | 671,637 |
Total Short-Term Investments
(Cost $280,682,562) | | | 280,678,246 |
Total Investments
(Cost $855,459,637) | 167.4% | | 804,216,174 |
| Other Assets, Less Liabilities | (67.4) | | (323,695,386) |
| Net Assets | 100.0% | | $ 480,520,788 |
| † | Percentages indicated are based on Portfolio net assets. |
| ^ | Industry classifications may be different than those used for compliance monitoring purposes. |
| (a) | Floating rate—Rate shown was the rate in effect as of December 31, 2023. |
| (b) | May be sold to institutional investors only under Rule 144A or securities offered pursuant to Section 4(a)(2) of the Securities Act of 1933, as amended. |
| (c) | Fixed to floating rate—Rate shown was the rate in effect as of December 31, 2023. |
| (d) | Security is perpetual and, thus, does not have a predetermined maturity date. The date shown, if applicable, reflects the next call date. |
| (e) | Treasury Inflation Protected Security—Pays a fixed rate of interest on a principal amount that is continuously adjusted for inflation based on the Consumer Price Index-Urban Consumers. |
| (f) | Collateral strip rate—A bond whose interest was based on the weighted net interest rate of the collateral. The coupon rate adjusts periodically based on a predetermined schedule. Rate shown was the rate in effect as of December 31, 2023. |
| (g) | Coupon rate may change based on changes of the underlying collateral or prepayments of principal. Rate shown was the rate in effect as of December 31, 2023. |
| (h) | TBA—Security purchased on a forward commitment basis with an approximate principal amount and maturity date. The actual principal amount and maturity date will be determined upon settlement. As of December 31, 2023, the total net market value was $36,111,968, which represented 7.5% of the Portfolio’s net assets. All or a portion of this security is a part of a mortgage dollar roll agreement. |
| (i) | Security, or a portion thereof, was maintained in a segregated account at the Portfolio’s custodian as collateral for future, swap, foreign currency forward contracts and repurchase agreement. |
| (j) | Delayed delivery security. |
| (k) | Current yield as of December 31, 2023. |
| (l) | Interest rate shown represents yield to maturity. |
Investments in Affiliates (in 000's)
Investments in issuers considered to be affiliate(s) of the Portfolio during the year ended December 31, 2023 for purposes of Section 2(a)(3) of the Investment Company Act of 1940, as amended, were as follows:
| Affiliated Investment Companies | Value,
Beginning
of Year | Purchases
at Cost | Proceeds
from
Sales | Net
Realized
Gain/(Loss)
on Sales | Change in
Unrealized
Appreciation/
(Depreciation) | Value,
End of
Year | Dividend
Income | Other
Distributions | Shares
End of
Year |
| MainStay U.S. Government Liquidity Fund | $ 4,226 | $ 75,984 | $ (79,087) | $ — | $ — | $ 1,123 | $ 43 | $ — | 1,123 |
The notes to the financial statements are an integral part of, and should be read in conjunction with, the financial statements.
| 18 | MainStay VP PIMCO Real Return Portfolio |
Foreign Currency Forward Contracts
As of December 31, 2023, the Portfolio held the following foreign currency forward contracts1:
| Currency Purchased | Currency Sold | Counterparty | Settlement
Date | Unrealized
Appreciation
(Depreciation) |
| DKK | 4,870,000 | USD | 715,289 | BNP Paribas S.A. | 1/9/24 | $ 6,117 |
| DKK | 2,025,000 | USD | 298,255 | BNP Paribas S.A. | 1/9/24 | 1,714 |
| NZD | 255,861 | USD | 155,897 | Bank of America N.A. | 1/9/24 | 5,847 |
| Total Unrealized Appreciation | 13,678 |
| USD | 809,177 | CAD | 1,095,000 | Barclays Capital | 1/9/24 | (17,287) |
| USD | 4,368,217 | DKK | 29,774,485 | Barclays Capital | 1/9/24 | (42,361) |
| USD | 3,309,491 | DKK | 22,436,516 | BNP Paribas S.A. | 1/9/24 | (14,093) |
| USD | 448,497 | DKK | 3,060,000 | Morgan Stanley & Co. International | 1/9/24 | (4,790) |
| USD | 1,116,572 | EUR | 1,023,000 | Barclays Capital | 1/9/24 | (13,029) |
| USD | 829,864 | EUR | 768,000 | BNP Paribas S.A. | 1/9/24 | (18,165) |
| USD | 32,924,194 | EUR | 29,955,000 | Morgan Stanley & Co. International | 1/9/24 | (152,255) |
| USD | 1,065,483 | EUR | 985,000 | Morgan Stanley & Co. International | 1/9/24 | (22,158) |
| USD | 3,445 | GBP | 2,725 | Barclays Capital | 1/9/24 | (29) |
| USD | 746,366 | GBP | 591,275 | BNP Paribas S.A. | 1/9/24 | (7,327) |
| USD | 35,195 | HUF | 12,327,115 | BNP Paribas S.A. | 1/4/24 | (334) |
| USD | 35,195 | HUF | 12,345,769 | BNP Paribas S.A. | 1/4/24 | (387) |
| USD | 106,792 | HUF | 37,482,924 | BNP Paribas S.A. | 1/4/24 | (1,239) |
| USD | 35,195 | HUF | 12,327,115 | JPMorgan Chase Bank N.A. | 1/4/24 | (333) |
| USD | 165,953 | HUF | 58,349,075 | JPMorgan Chase Bank N.A. | 1/4/24 | (2,218) |
| USD | 9,690 | HUF | 3,412,334 | JPMorgan Chase Bank N.A. | 1/4/24 | (145) |
| USD | 80,974 | HUF | 28,336,851 | JPMorgan Chase Bank N.A. | 1/4/24 | (697) |
| USD | 80,974 | HUF | 28,324,705 | JPMorgan Chase Bank N.A. | 1/4/24 | (662) |
| USD | 113,208 | HUF | 39,870,726 | JPMorgan Chase Bank N.A. | 1/4/24 | (1,705) |
| USD | 1 | HUF | 352 | Morgan Stanley & Co. International | 1/4/24 | — |
| USD | 4,081,167 | JPY | 602,253,733 | Bank of America N.A. | 1/9/24 | (194,178) |
| USD | 2,395,065 | JPY | 351,162,514 | BNP Paribas S.A. | 1/9/24 | (97,806) |
| USD | 1,551,767 | JPY | 228,775,301 | Morgan Stanley & Co. International | 1/9/24 | (72,288) |
| USD | 80,119 | JPY | 11,800,000 | Morgan Stanley & Co. International | 1/9/24 | (3,649) |
| USD | 196,119 | JPY | 27,900,000 | Morgan Stanley & Co. International | 1/9/24 | (1,941) |
| USD | 741,702 | PEN | 2,817,356 | Bank of America N.A.* | 3/20/24 | (18,040) |
| Total Unrealized Depreciation | (687,116) |
| Net Unrealized Depreciation | $ (673,438) |
| * | Non-deliverable forward. |
| 1. | Foreign Currency Forward Contracts are subject to limitations such that they cannot be “sold or repurchased,” although the Portfolio would be able to exit the transaction through other means, such as through the execution of an offsetting transaction. |
Futures Contracts
As of December 31, 2023, the Portfolio held the following futures contracts1:
| Type | Number of
Contracts | Expiration
Date | Value at
Trade Date | Current
Notional
Amount | Unrealized
Appreciation
(Depreciation)2 |
| Long Contracts | | | | | |
| Euro-Bobl | 1 | March 2024 | $ 131,723 | $ 131,679 | $ (44) |
| Euro-Bund | 102 | March 2024 | 14,991,536 | 15,451,370 | 459,834 |
| U.S. Treasury 2 Year Notes | 12 | March 2024 | 2,447,454 | 2,470,969 | 23,515 |
| U.S. Treasury 5 Year Notes | 307 | March 2024 | 32,814,105 | 33,393,445 | 579,340 |
| U.S. Treasury 10 Year Ultra Bonds | 262 | March 2024 | 29,695,893 | 30,920,094 | 1,224,201 |
| Total Long Contracts | | | | | 2,286,846 |
| Short Contracts | | | | | |
| Euro-BTP | (58) | March 2024 | (6,771,147) | (6,828,704) | (57,557) |
| Euro-BTP | (30) | March 2024 | (3,818,301) | (3,946,069) | (127,768) |
The notes to the financial statements are an integral part of, and should be read in conjunction with, the financial statements.
19
Portfolio of Investments December 31, 2023†^ (continued)
| Type | Number of
Contracts | Expiration
Date | Value at
Trade Date | Current
Notional
Amount | Unrealized
Appreciation
(Depreciation)2 |
| Euro-Buxl | (32) | March 2024 | $ (4,609,474) | $ (5,006,457) | $ (396,983) |
| Euro-OAT | (31) | March 2024 | (4,375,402) | (4,500,594) | (125,192) |
| Euro-Schatz | (566) | March 2024 | (66,181,336) | (66,573,120) | (391,784) |
| U.S. Treasury 10 Year Notes | (492) | March 2024 | (53,821,370) | (55,542,187) | (1,720,817) |
| U.S. Treasury Long Bonds | (18) | March 2024 | (2,088,817) | (2,248,875) | (160,058) |
| U.S. Treasury Ultra Bonds | (121) | March 2024 | (14,930,880) | (16,164,844) | (1,233,964) |
| Total Short Contracts | | | | | (4,214,123) |
| Net Unrealized Depreciation | | | | | $ (1,927,277) |
| 1. | As of December 31, 2023, cash in the amount of $1,031,000 was on deposit with a broker or futures commission merchant for futures transactions. |
| 2. | Represents the difference between the value of the contracts at the time they were opened and the value as of December 31, 2023. |
As of December 31, 2023, the Portfolio held the following options agreements:
Written Inflation-Capped Options
| Description | Counterparty | Initial
Index | Floating Rate | Expiration
Date | Number of
Contracts | Notional
Amount | Premiums Paid
(Received) | | Market
Value |
| Call-Cap-OTC USA Non-Revised Consumer Price Index- Urban (CPI-U), American Style -Call | JPMorgan Chase Bank N.A. | $ 238.643 | Maximum of [0, Final Index/Initial Index - (1 + 4.00%10)] | 5/16/24 | 300,000 | $ 300,000 | $ (77) | | $ (84,979) |
Written Options on Futures Contracts
| Description | Counterparty | Strike
Price | Expiration
Date | Number of
Contracts | Notional
Amount | Premiums Paid
(Received) | | Market
Value |
| Call-3 Month Euro Euribor | ICE Clear Europe | $ 96.75 | 4/12/24 | (173) | EUR (432,500) | $ (117,959) | | $ (116,977) |
As of December 31, 2023, the Portfolio held the following swaptions agreements:
Written Swaptions
| Description | Counterparty | Strike
Price | Expiration
Date | Number of
Contracts | Notional
Amount | Premiums Paid
(Received) | | Market
Value |
| Put-2-Year Interest Rate Swap | Barclays Capital | $ 3.15 | 10/6/25 | (22,700,000) | EUR (22,700,000) | $ (262,860) | | $ (94,782) |
| Description | Counterparty | Strike
Price | Expiration
Date | Number of
Contracts | Notional
Amount | Premiums Paid
(Received) | | Market
Value |
| Call-2-Year Interest Rate Swap | Barclays Capital | $ 3.15 | 10/6/25 | (22,700,000) | EUR (22,700,000) | $ (262,860) | | $ (592,256) |
| Call-2-Year Interest Rate Swap | Morgan Stanley Capital Services LLC | 4.76 | 1/16/24 | (17,300,000) | $ (17,300,000) | (79,580) | | (243,357) |
| Call-2-Year Interest Rate Swap | BNP Paribas S.A. | 4.70 | 2/13/24 | (17,600,000) | (17,600,000) | (76,824) | | (260,497) |
| Call-2-Year Interest Rate Swap | Barclays Capital | 3.90 | 3/20/24 | (19,600,000) | (19,600,000) | (93,590) | | (109,174) |
| | | | | | | $ (512,854) | | $(1,205,284) |
The notes to the financial statements are an integral part of, and should be read in conjunction with, the financial statements.
| 20 | MainStay VP PIMCO Real Return Portfolio |
Swap Contracts
As of December 31, 2023, the Portfolio held the following centrally cleared interest rate swap agreements1:
Notional
Amount | Currency | Expiration
Date | Payments
made by Portfolio | Payments
Received by Portfolio | Payment Frequency
Paid/Received | Upfront
Premiums
Paid/
(Received) | | Value | | Unrealized
Appreciation/
(Depreciation) |
| $ 27,100,000 | USD | 10/31/25 | 1 day SOFR | Fixed 4.61% | Annually/Annually | $ — | | $ 203,482 | | $ 203,482 |
| 53,300,000 | USD | 12/20/25 | Fixed 4.25% | 1 day SOFR | Annually/Annually | 68,136 | | (151,049) | | (219,185) |
| 9,800,000 | USD | 12/22/25 | Fixed 4.87% | 1 day SOFR | Annually/Annually | — | | (142,065) | | (142,065) |
| 9,800,000 | USD | 3/22/26 | 1 day SOFR | Fixed 3.90% | Annually/Annually | — | | 16,374 | | 16,374 |
| 14,000,000 | JPY | 9/20/27 | Fixed 0.30% | 1 day TONAR + 0.06% | Semi-Annually/Semi-Annually | (1,754) | | 445 | | 2,199 |
| 50,000,000 | JPY | 3/20/28 | Fixed 0.30% | 1 day TONAR + 0.06% | Semi-Annually/Semi-Annually | (6,870) | | 2,414 | | 9,284 |
| 420,000,000 | JPY | 9/14/28 | Fixed 0.55% | 1 day TONAR | Annually/Annually | (4,584) | | (14,640) | | (10,056) |
| 106,980,000 | JPY | 3/20/29 | Fixed 0.45% | 1 day TONAR + 0.06% | Semi-Annually/Semi-Annually | (25,484) | | 3,806 | | 29,290 |
| 386,000,000 | JPY | 12/15/31 | Fixed 0.50% | 1 day TONAR | Annually/Annually | 413 | | 46,213 | | 45,800 |
| 5,900,000 | EUR | 8/15/32 | 6 month EURIBOR | Fixed 2.88% | Semi-Annually/Annually | — | | 209,319 | | 209,319 |
| 15,800,000 | USD | 2/13/34 | 1 day SOFR | Fixed 3.09% | Annually/Annually | (122,180) | | (466,022) | | (343,842) |
| 30,870,000 | EUR | 3/20/34 | 6 month EURIBOR | Fixed 3.00% | Semi-Annually/Annually | (586,618) | | 1,629,758 | | 2,216,376 |
| 1,400,000 | EUR | 11/4/52 | Fixed 0.19% | 6 month EURIBOR | Annually/Semi-Annually | — | | 688,991 | | 688,991 |
| 7,000,000 | USD | 2/13/54 | Fixed 2.87% | 1 day SOFR | Annually/Annually | 134,233 | | 557,059 | | 422,826 |
| 11,590,000 | EUR | 3/20/54 | Fixed 2.75% | 6 month EURIBOR | Annually/Semi-Annually | 395,637 | | (1,204,966) | | (1,600,603) |
| | | | | | | $ (149,071) | | $ 1,379,119 | | $ 1,528,190 |
As of December 31, 2023, the Portfolio held the following centrally cleared inflation swap agreements1:
Notional
Amount | Currency | Expiration
Date | Payments
Made by Portfolio | Payments
Received by Portfolio | Payment
Frequency
Paid/
Received | Upfront
Premiums
Paid/
(Received) | Value | Unrealized
Appreciation/
(Depreciation) |
| $ 2,800,000 | EUR | 3/15/24 | Fixed 1.03% | 1 Month FRCPI | At Maturity | $ (2,636) | $ 263,604 | $ 266,240 |
| 2,000,000 | USD | 9/8/24 | 1 Month USD-CPI | Fixed 2.51% | At Maturity | — | 2,123 | 2,123 |
| 1,700,000 | USD | 9/12/24 | 1 Month USD-CPI | Fixed 2.56% | At Maturity | — | 2,823 | 2,823 |
| 1,200,000 | USD | 9/12/24 | 1 Month USD-CPI | Fixed 2.565% | At Maturity | — | 2,051 | 2,051 |
| 200,000 | EUR | 9/15/24 | 1 Month EUR-CPI | Fixed 3.52% | At Maturity | (158) | (1,282) | (1,124) |
| 1,200,000 | EUR | 9/15/24 | 1 Month EUR-CPI | Fixed 3.72% | At Maturity | (806) | (2,338) | (1,532) |
| 5,400,000 | USD | 2/26/26 | Fixed 2.314% | 1 Month USD-CPI | At Maturity | 84,391 | 532,245 | 447,854 |
| 2,700,000 | USD | 3/5/26 | Fixed 2.419% | 1 Month USD-CPI | At Maturity | 34,949 | 250,924 | 215,975 |
| 2,200,000 | USD | 5/13/26 | Fixed 2.768% | 1 Month USD-CPI | At Maturity | 5,720 | 156,925 | 151,205 |
| 1,000,000 | USD | 5/14/26 | Fixed 2.813% | 1 Month USD-CPI | At Maturity | 1,348 | 68,908 | 67,560 |
| 1,250,000 | USD | 5/25/26 | Fixed 2.703% | 1 Month USD-CPI | At Maturity | 4,742 | 91,743 | 87,001 |
| 500,000 | USD | 6/1/26 | Fixed 2.69% | 1 Month USD-CPI | At Maturity | 1,919 | 36,684 | 34,765 |
| 500,000 | EUR | 5/15/27 | Fixed 3.13% | 1 Month EUR-CPI | At Maturity | — | 5,515 | 5,515 |
| 800,000 | EUR | 6/15/27 | 1 Month EUR-CPI | Fixed 1.36% | At Maturity | 2,143 | (129,827) | (131,970) |
| 1,000,000 | EUR | 3/15/28 | 1 Month EUR-CPI | Fixed 1.535% | At Maturity | 16,965 | (148,072) | (165,037) |
| 770,000 | USD | 5/9/28 | 1 Month USD-CPI | Fixed 2.36% | At Maturity | (5,851) | (64,588) | (58,737) |
| 510,000 | USD | 5/9/28 | 1 Month USD-CPI | Fixed 2.353% | At Maturity | (4,159) | (43,183) | (39,024) |
| 300,000 | USD | 8/26/28 | Fixed 2.573% | 1 Month USD-CPI | At Maturity | — | 17,724 | 17,724 |
| 500,000 | USD | 9/10/28 | Fixed 2.645% | 1 Month USD-CPI | At Maturity | — | 25,707 | 25,707 |
| 2,600,000 | USD | 11/4/29 | 1 Month USD-CPI | Fixed 1.76% | At Maturity | (156,723) | (392,696) | (235,973) |
| 2,200,000 | USD | 5/19/30 | 1 Month USD-CPI | Fixed 1.28% | At Maturity | (219,849) | (434,218) | (214,369) |
| 4,500,000 | EUR | 3/15/31 | 1 Month EUR-CPI | Fixed 1.38% | At Maturity | (113,521) | (953,593) | (840,072) |
| 800,000 | EUR | 5/15/32 | Fixed 2.60% | 1 Month EUR-CPI | At Maturity | 6,531 | 15,368 | 8,837 |
| 800,000 | EUR | 5/15/32 | Fixed 2.60% | 1 Month EUR-CPI | At Maturity | 394 | 15,368 | 14,974 |
| 800,000 | EUR | 6/15/32 | Fixed 2.72% | 1 Month EUR-CPI | At Maturity | 1,314 | (9,398) | (10,712) |
| 1,000,000 | EUR | 6/15/32 | Fixed 2.72% | 1 Month EUR-CPI | At Maturity | (8,117) | (11,748) | (3,631) |
| 700,000 | EUR | 6/15/32 | Fixed 2.57% | 1 Month EUR-CPI | At Maturity | — | 3,904 | 3,904 |
| 800,000 | EUR | 7/15/32 | Fixed 2.47% | 1 Month EUR-CPI | At Maturity | — | 13,047 | 13,047 |
| 200,000 | EUR | 3/15/33 | Fixed 1.71% | 1 Month EUR-CPI | At Maturity | (9,472) | 31,545 | 41,017 |
The notes to the financial statements are an integral part of, and should be read in conjunction with, the financial statements.
21
Portfolio of Investments December 31, 2023†^ (continued)
Notional
Amount | Currency | Expiration
Date | Payments
Made by Portfolio | Payments
Received by Portfolio | Payment
Frequency
Paid/
Received | Upfront
Premiums
Paid/
(Received) | | Value | | Unrealized
Appreciation/
(Depreciation) |
| $ 700,000 | EUR | 11/15/33 | 1 Month EUR-CPI | Fixed 2.356% | At Maturity | $ — | | $ 16,660 | | $ 16,660 |
| 1,000,000 | EUR | 11/15/33 | 1 Month EUR-CPI | Fixed 2.39% | At Maturity | 967 | | 27,495 | | 26,528 |
| 1,000,000 | EUR | 11/15/33 | 1 Month EUR-CPI | Fixed 2.356% | At Maturity | (2,612) | | 23,800 | | 26,412 |
| 900,000 | EUR | 11/15/33 | 1 Month EUR-CPI | Fixed 2.363% | At Maturity | — | | 22,055 | | 22,055 |
| 1,680,000 | EUR | 5/15/37 | 1 Month EUR-CPI | Fixed 2.488% | At Maturity | — | | (47,689) | | (47,689) |
| 400,000 | EUR | 3/15/52 | 1 Month EUR-CPI | Fixed 2.59% | At Maturity | (9,852) | | (14,507) | | (4,655) |
| 100,000 | EUR | 3/15/52 | 1 Month EUR-CPI | Fixed 2.58% | At Maturity | — | | (3,991) | | (3,991) |
| 100,000 | EUR | 3/15/52 | 1 Month EUR-CPI | Fixed 2.58% | At Maturity | 113 | | (3,991) | | (4,104) |
| 100,000 | EUR | 4/15/52 | 1 Month EUR-CPI | Fixed 2.55% | At Maturity | 122 | | (3,583) | | (3,705) |
| 1,000,000 | EUR | 4/15/53 | 1 Month EUR-CPI | Fixed 2.7% | At Maturity | 6,530 | | 88,423 | | 81,893 |
| 400,000 | EUR | 9/15/53 | 1 Month EUR-CPI | Fixed 2.763% | At Maturity | — | | 44,497 | | 44,497 |
| 300,000 | EUR | 9/15/53 | 1 Month EUR-CPI | Fixed 2.763% | At Maturity | 836 | | 33,373 | | 32,537 |
| 200,000 | EUR | 9/15/53 | 1 Month EUR-CPI | Fixed 2.763% | At Maturity | 1,769 | | 22,249 | | 20,480 |
| 100,000 | EUR | 10/15/53 | 1 Month EUR-CPI | Fixed 2.736% | At Maturity | — | | 10,325 | | 10,325 |
| 300,000 | EUR | 10/15/53 | 1 Month EUR-CPI | Fixed 2.736% | At Maturity | 3,901 | | 30,975 | | 27,074 |
| 300,000 | EUR | 10/15/53 | 1 Month EUR-CPI | Fixed 2.682% | At Maturity | — | | 25,036 | | 25,036 |
| 300,000 | EUR | 11/15/53 | Fixed 2.62% | 1 Month EUR-CPI | At Maturity | — | | (18,777) | | (18,777) |
| 300,000 | EUR | 11/15/53 | Fixed 2.548% | 1 Month EUR-CPI | At Maturity | (925) | | (11,092) | | (10,167) |
| | | | | | | $ (360,027) | | $ (413,477) | | $ (53,450) |
Open OTC debt total return swap agreements as of December 31, 2023 were as follows2:
Swap
Counterparty | Reference Obligation | Floating Rate3 | Termination
Date(s) | Payment
Frequency
Paid/
Received | Notional
Amount
Long/
(Short)
(000)4 | Unrealized
Appreciation/
(Depreciation) |
| Morgan Stanley Capital Services LLC | U.S. Treasury Inflation Linked Notes, 0.125%, 01/15/2030 | 1 day SOFR + 0.15% | 2/23/24 | Daily | $ 15,000 | $ (104,764) |
| Morgan Stanley Capital Services LLC | U.S. Treasury Inflation Linked Notes, 0.125%, 04/15/2025 | 1 day SOFR | 1/16/24 | Daily | 5,000 | 13,119 |
| Morgan Stanley Capital Services LLC | U.S. Treasury Inflation Linked Notes, 0.125%, 07/15/2031 | 1 day SOFR | 1/16/24 | Daily | 10,000 | 542,753 |
| Morgan Stanley Capital Services LLC | U.S. Treasury Inflation Linked Notes, 0.125%, 07/15/2031 | 1 day SOFR + 0.15% | 2/23/24 | Daily | 10,000 | (93,405) |
| Morgan Stanley Capital Services LLC | U.S. Treasury Inflation Linked Notes, 0.125%, 10/15/2024 | 1 day SOFR | 1/16/24 | Daily | 5,000 | (848) |
| Morgan Stanley Capital Services LLC | U.S. Treasury Inflation Linked Notes, 0.125%, 10/15/2026 | 1 day SOFR | 1/16/24 | Daily | 25,000 | 411,615 |
| Morgan Stanley Capital Services LLC | U.S. Treasury Inflation Linked Notes, 0.25%, 01/15/2025 | 1 day SOFR | 1/16/24 | Daily | 5,000 | 2,006 |
| Morgan Stanley Capital Services LLC | U.S. Treasury Inflation Linked Notes, 0.375%, 01/15/2027 | 1 day SOFR | 1/16/24 | Daily | 10,000 | 218,780 |
| Morgan Stanley Capital Services LLC | U.S. Treasury Inflation Linked Notes, 0.375%, 07/15/2027 | 1 day SOFR | 1/16/24 | Daily | 10,000 | 265,947 |
| Morgan Stanley Capital Services LLC | U.S. Treasury Inflation Linked Notes, 0.50%, 01/15/2028 | 1 day SOFR + 5.57% | 1/9/24 | Daily | 15,000 | 328,861 |
| Morgan Stanley Capital Services LLC | U.S. Treasury Inflation Linked Notes, 0.625%, 01/15/2026 | 1 day SOFR | 1/9/24 | Daily | 5,000 | 50,414 |
| | | | | | | $ 1,634,478 |
| 1. | As of December 31, 2023, cash in the amount of $828,000 was on deposit with a broker for centrally cleared swap agreements. |
| 2. | As of December 31, 2023, cash in the amount $1,290,000 was due to broker for OTC debt total return swap agreements. |
| 3. | Portfolio pays or receives the floating rate and receives or pays the total return of the referenced entity. |
| 4. | Notional amounts reflected as a positive value indicate a long position held by the Portfolio or Index and a negative value indicates a short position. |
The notes to the financial statements are an integral part of, and should be read in conjunction with, the financial statements.
| 22 | MainStay VP PIMCO Real Return Portfolio |
| Abbreviation(s): |
| BTP—Buoni del Tesoro Poliennali (Eurex Exchange index) |
| CAD—Canada Dollar |
| CLO—Collateralized Loan Obligation |
| CPI—Consumer Price Index |
| DKK—Denmark Krone |
| EUR—Euro |
| EURIBOR—Euro Interbank Offered Rate |
| FHLMC—Federal Home Loan Mortgage Corp. |
| FNMA—Federal National Mortgage Association |
| FRCPI—France Consumer Price Index |
| GBP—British Pound Sterling |
| GNMA—Government National Mortgage Association |
| HUF—Hungarian Forint |
| JPY—Japanese Yen |
| NZD—New Zealand Dollar |
| PEN—Peru Nuevo Sol |
| REMIC—Real Estate Mortgage Investment Conduit |
| SOFR—Secured Overnight Financing Rate |
| SONIA—Sterling Overnight Interbank Average Rate |
| SONIA3M IR—Sterling Overnight Interbank Average 3 Month Index Rate |
| TBA—To Be Announced |
| TONAR—Tokyo Overnight Average Rate |
| UMBS—Uniform Mortgage Backed Securities |
| USD—United States Dollar |
The notes to the financial statements are an integral part of, and should be read in conjunction with, the financial statements.
23
Portfolio of Investments December 31, 2023†^ (continued)
The following is a summary of the fair valuations according to the inputs used as of December 31, 2023, for valuing the Portfolio’s assets and liabilities:
| Description | Quoted
Prices in
Active
Markets for
Identical
Assets
(Level 1) | | Significant
Other
Observable
Inputs
(Level 2) | | Significant
Unobservable
Inputs
(Level 3) | | Total |
| Asset Valuation Inputs | | | | | | | |
| Investments in Securities (a) | | | | | | | |
| Long-Term Bonds | | | | | | | |
| Asset-Backed Securities | $ — | | $ 40,308,080 | | $ — | | $ 40,308,080 |
| Corporate Bonds | — | | 7,840,082 | | — | | 7,840,082 |
| Foreign Government Bonds | — | | 33,687,513 | | — | | 33,687,513 |
| Mortgage-Backed Securities | — | | 16,974,980 | | — | | 16,974,980 |
| U.S. Government & Federal Agencies | — | | 424,727,273 | | — | | 424,727,273 |
| Total Long-Term Bonds | — | | 523,537,928 | | — | | 523,537,928 |
| Short-Term Investments | | | | | | | |
| Affiliated Investment Company | 1,122,983 | | — | | — | | 1,122,983 |
| Commercial Paper | — | | 1,283,626 | | — | | 1,283,626 |
| Repurchase Agreements | — | | 277,600,000 | | — | | 277,600,000 |
| Treasury Debt | — | | 671,637 | | — | | 671,637 |
| Total Short-Term Investments | 1,122,983 | | 279,555,263 | | — | | 280,678,246 |
| Total Investments in Securities | 1,122,983 | | 803,093,191 | | — | | 804,216,174 |
| Other Financial Instruments (b) | | | | | | | |
| Foreign Currency Forward Contracts | — | | 13,678 | | — | | 13,678 |
| Futures Contracts | 2,286,890 | | — | | — | | 2,286,890 |
| Interest Rate Swap Contracts | — | | 3,843,941 | | — | | 3,843,941 |
| Inflation Swap Contracts | — | | 1,741,819 | | — | | 1,741,819 |
| OTC Debt Total Return Swap Contracts | — | | 1,833,495 | | — | | 1,833,495 |
| Total Other Financial Instruments | 2,286,890 | | 7,432,933 | | — | | 9,719,823 |
| Total Investments in Securities and Other Financial Instruments | $ 3,409,873 | | $ 810,526,124 | | $ — | | $ 813,935,997 |
| Liability Valuation Inputs | | | | | | | |
| Other Financial Instruments | | | | | | | |
| Foreign Currency Forward Contracts (b) | $ — | | $ (687,116) | | $ — | | $ (687,116) |
| Futures Contracts (b) | (4,214,167) | | — | | — | | (4,214,167) |
| Written Options | — | | (1,502,022) | | — | | (1,502,022) |
| Interest Rate Swap Contracts (b) | — | | (2,315,751) | | — | | (2,315,751) |
| Inflation Swap Contracts (b) | — | | (1,795,269) | | — | | (1,795,269) |
| OTC Debt Total Return Swap Contracts (b) | — | | (199,017) | | — | | (199,017) |
| Total Other Financial Instruments | $ (4,214,167) | | $ (6,499,175) | | $ — | | $ (10,713,342) |
| (a) | For a complete listing of investments and their industries, see the Portfolio of Investments. |
| (b) | The value listed for these securities reflects unrealized appreciation (depreciation) as shown on the Portfolio of Investments. |
The notes to the financial statements are an integral part of, and should be read in conjunction with, the financial statements.
| 24 | MainStay VP PIMCO Real Return Portfolio |
Sale-Buyback Transactions:
| Counterparty | Borrowing
Rate (a) | Borrowing
Date | Maturity
Date | Amount
Borrowed (a) | | Payable for
Sale-Buyback
Transcations (b) |
| BNP Paribas S.A. | 5.53% | 12/19/2023 | 1/10/2024 | $ 10,046,379 | | $ 10,030,748 |
| BNP Paribas S.A. | 5.57 | 12/22/2023 | 1/3/2024 | 14,761,756 | | 14,759,419 |
| BNP Paribas S.A. | 5.57 | 12/22/2023 | 1/3/2024 | 6,220,073 | | 6,219,003 |
| BNP Paribas S.A. | 5.57 | 12/22/2023 | 1/3/2024 | 14,747,340 | | 14,744,749 |
| BNP Paribas S.A. | 5.57 | 12/22/2023 | 1/3/2024 | 7,508,813 | | 7,507,632 |
| BNP Paribas S.A. | 5.57 | 12/22/2023 | 1/3/2024 | 4,453,502 | | 4,452,787 |
| BNP Paribas S.A. | 5.57 | 12/22/2023 | 1/3/2024 | 5,869,482 | | 5,868,535 |
| BNP Paribas S.A. | 5.57 | 12/22/2023 | 1/3/2024 | 5,594,012 | | 5,592,884 |
| BNP Paribas S.A. | 5.57 | 12/22/2023 | 1/3/2024 | 1,058,377 | | 1,058,146 |
| BNP Paribas S.A. | 5.57 | 12/22/2023 | 1/3/2024 | 11,972,070 | | 11,969,806 |
| BNP Paribas S.A. | 5.57 | 12/22/2023 | 1/3/2024 | 7,246,334 | | 7,244,767 |
| BNP Paribas S.A. | 5.57 | 12/22/2023 | 1/3/2024 | 5,389,588 | | 5,388,529 |
| BNP Paribas S.A. | 5.57 | 12/22/2023 | 1/3/2024 | 10,192,049 | | 10,189,972 |
| BNP Paribas S.A. | 5.57 | 12/22/2023 | 1/3/2024 | 3,066,240 | | 3,065,627 |
| BNP Paribas S.A. | 5.57 | 12/22/2023 | 1/3/2024 | 2,397,490 | | 2,396,985 |
| BNP Paribas S.A. | 5.57 | 12/22/2023 | 1/3/2024 | 3,554,523 | | 3,553,783 |
| BNP Paribas S.A. | 5.57 | 12/22/2023 | 1/3/2024 | 12,906,146 | | 12,903,585 |
| BNP Paribas S.A. | 5.57 | 12/22/2023 | 1/3/2024 | 18,965,173 | | 18,961,017 |
| BNP Paribas S.A. | 5.57 | 12/22/2023 | 1/3/2024 | 6,320,413 | | 6,319,029 |
| BNP Paribas S.A. | 5.57 | 12/22/2023 | 1/3/2024 | 5,020,104 | | 5,019,054 |
| BNP Paribas S.A. | 5.57 | 12/22/2023 | 1/3/2024 | 9,803,642 | | 9,801,440 |
| BNP Paribas S.A. | 5.57 | 12/22/2023 | 1/3/2024 | 3,644,174 | | 3,643,379 |
| BNP Paribas S.A. | 5.57 | 12/22/2023 | 1/3/2024 | 12,612,615 | | 12,609,895 |
| BNP Paribas S.A. | 5.57 | 12/22/2023 | 1/3/2024 | 14,154,204 | | 14,151,351 |
| BNP Paribas S.A. | 5.57 | 12/22/2023 | 1/3/2024 | 8,221,562 | | 8,219,829 |
| BNP Paribas S.A. | 5.57 | 12/22/2023 | 1/3/2024 | 2,174,290 | | 2,173,802 |
| BNP Paribas S.A. | 5.57 | 12/22/2023 | 1/3/2024 | 2,301,233 | | 2,300,725 |
| BNP Paribas S.A. | 5.57 | 12/22/2023 | 1/3/2024 | 16,318,903 | | 16,315,239 |
| BNP Paribas S.A. | 5.57 | 12/22/2023 | 1/3/2024 | 7,994,656 | | 7,992,888 |
| BNP Paribas S.A. | 5.57 | 12/22/2023 | 1/3/2024 | 16,949,373 | | 16,945,534 |
| BNP Paribas S.A. | 5.57 | 12/22/2023 | 1/3/2024 | 3,354,759 | | 3,354,012 |
| BNP Paribas S.A. | 5.57 | 12/22/2023 | 1/3/2024 | 13,314,783 | | 13,311,864 |
| BNP Paribas S.A. | 5.57 | 12/22/2023 | 1/3/2024 | 2,141,480 | | 2,141,017 |
| BNP Paribas S.A. | 5.57 | 12/22/2023 | 1/3/2024 | 20,548,410 | | 20,543,839 |
| BNP Paribas S.A. | 5.57 | 12/22/2023 | 1/3/2024 | 11,282,887 | | 11,280,412 |
| BNP Paribas S.A. | 5.57 | 12/22/2023 | 1/3/2024 | 25,308,562 | | 25,303,289 |
| BNP Paribas S.A. | 5.57 | 12/22/2023 | 1/3/2024 | 10,358,720 | | 10,356,876 |
| BNP Paribas S.A. | 5.71 | 12/27/2023 | 1/4/2024 | 2,840,046 | | 2,838,541 |
| | | | | $340,614,163 | | $340,529,989 |
(a) During the year ended December 31, 2023, the Portfolio’s average amount of borrowing was $24,493,107 at a weighted average interest rate of 4.97%.
(b) Payable for sale-buyback transactions includes $(84,174) of deferred price drop.
The notes to the financial statements are an integral part of, and should be read in conjunction with, the financial statements.
25
Statement of Assets and Liabilities as of December 31, 2023
| Assets |
Investment in unaffiliated securities, at value
(identified cost $576,736,654) | $ 525,493,191 |
Investment in affiliated investment companies, at value
(identified cost $1,122,983) | 1,122,983 |
Repurchase agreements, at value
(amortized cost $277,600,000) | 277,600,000 |
| Cash | 9,503 |
Cash denominated in foreign currencies
(identified cost $1,616,648) | 1,170,219 |
| Cash collateral on deposit at broker for futures contracts | 1,031,000 |
| Cash collateral on deposit at broker for swap contracts | 828,000 |
| Due from custodian | 1,200,854 |
| Receivables: | |
| Investment securities sold | 337,548,526 |
| Interest | 1,739,994 |
| Variation margin on futures contracts | 384,496 |
| Portfolio shares sold | 142,170 |
| Variation margin on centrally cleared swap contracts | 134,154 |
| Unrealized appreciation on OTC swap contracts | 1,833,495 |
| Unrealized appreciation on foreign currency forward contracts | 13,678 |
| Other assets | 2,673 |
| Total assets | 1,150,254,936 |
| Liabilities |
| Written options, at value (premiums received $893,750) | 1,502,022 |
| Cash collateral due to broker for swaps contracts | 1,290,000 |
| Cash collateral due to broker for TBA | 931,000 |
| Payables: | |
| Sale buyback transactions | 340,529,989 |
| Investment securities purchased | 323,944,368 |
| Portfolio shares redeemed | 228,155 |
| Manager (See Note 3) | 194,968 |
| Custodian | 91,319 |
| NYLIFE Distributors (See Note 3) | 73,210 |
| Professional fees | 62,810 |
| Shareholder communication | 44 |
| Accrued expenses | 130 |
| Unrealized depreciation on OTC swap contracts | 199,017 |
| Unrealized depreciation on foreign currency forward contracts | 687,116 |
| Total liabilities | 669,734,148 |
| Net assets | $ 480,520,788 |
| Composition of Net Assets |
| Shares of beneficial interest outstanding (par value of $.001 per share) unlimited number of shares authorized | $ 61,921 |
| Additional paid-in-capital | 599,316,010 |
| | 599,377,931 |
| Total distributable earnings (loss) | (118,857,143) |
| Net assets | $ 480,520,788 |
| Initial Class | |
| Net assets applicable to outstanding shares | $ 134,068,341 |
| Shares of beneficial interest outstanding | 17,240,881 |
| Net asset value per share outstanding | $ 7.77 |
| Service Class | |
| Net assets applicable to outstanding shares | $ 346,452,447 |
| Shares of beneficial interest outstanding | 44,680,350 |
| Net asset value per share outstanding | $ 7.75 |
The notes to the financial statements are an integral part of, and should be read in conjunction with, the financial statements.
| 26 | MainStay VP PIMCO Real Return Portfolio |
Statement of Operations for the year ended December 31, 2023
| Investment Income (Loss) |
| Income | |
| Interest | $ 24,682,942 |
| Dividends-affiliated | 43,452 |
| Securities lending, net | 69 |
| Other | 88,029 |
| Total income | 24,814,492 |
| Expenses | |
| Manager (See Note 3) | 2,448,592 |
| Interest expense | 1,234,517 |
| Distribution/Service—Service Class (See Note 3) | 902,808 |
| Custodian | 234,195 |
| Professional fees | 180,104 |
| Trustees | 12,855 |
| Shareholder communication | 6,887 |
| Miscellaneous | 12,359 |
| Total expenses before waiver/reimbursement | 5,032,317 |
| Expense waiver/reimbursement from Manager (See Note 3) | (299,482) |
| Reimbursement from prior custodian(a) | (42,322) |
| Net expenses | 4,690,513 |
| Net investment income (loss) | 20,123,979 |
| Realized and Unrealized Gain (Loss) |
| Net realized gain (loss) on: | |
| Unaffiliated investment transactions | (9,968,070) |
| Futures transactions | 2,082,859 |
| Swap transactions | (4,874,297) |
| Foreign currency transactions | (2,313,165) |
| Foreign currency forward transactions | (1,173,534) |
| Written option transactions | 865,773 |
| Net realized gain (loss) | (15,380,434) |
| Net change in unrealized appreciation (depreciation) on: | |
| Unaffiliated investments | 9,352,941 |
| Futures contracts | (3,794,502) |
| Swap contracts | 6,285,978 |
| Foreign currency forward contracts | 1,119,847 |
| Translation of other assets and liabilities in foreign currencies | (432,867) |
| Written option contracts | (715,399) |
| Net change in unrealized appreciation (depreciation) | 11,815,998 |
| Net realized and unrealized gain (loss) | (3,564,436) |
| Net increase (decrease) in net assets resulting from operations | $ 16,559,543 |
| (a) | Represents a refund for overbilling of custody fees. |
The notes to the financial statements are an integral part of, and should be read in conjunction with, the financial statements.
27
Statements of Changes in Net Assets
for the years ended December 31, 2023 and December 31, 2022
| | 2023 | 2022 |
| Increase (Decrease) in Net Assets |
| Operations: | | |
| Net investment income (loss) | $ 20,123,979 | $ 37,910,942 |
| Net realized gain (loss) | (15,380,434) | 4,414,215 |
| Net change in unrealized appreciation (depreciation) | 11,815,998 | (107,138,056) |
| Net increase (decrease) in net assets resulting from operations | 16,559,543 | (64,812,899) |
| Distributions to shareholders: | | |
| Initial Class | (11,335,518) | (6,510,777) |
| Service Class | (29,658,529) | (22,747,983) |
| Total distributions to shareholders | (40,994,047) | (29,258,760) |
| Capital share transactions: | | |
| Net proceeds from sales of shares | 53,122,871 | 102,583,407 |
| Net asset value of shares issued to shareholders in reinvestment of distributions | 40,994,047 | 29,258,760 |
| Cost of shares redeemed | (83,054,069) | (135,760,697) |
| Increase (decrease) in net assets derived from capital share transactions | 11,062,849 | (3,918,530) |
| Net increase (decrease) in net assets | (13,371,655) | (97,990,189) |
| Net Assets |
| Beginning of year | 493,892,443 | 591,882,632 |
| End of year | $480,520,788 | $ 493,892,443 |
The notes to the financial statements are an integral part of, and should be read in conjunction with, the financial statements.
| 28 | MainStay VP PIMCO Real Return Portfolio |
Statement of Cash Flows
for the year ended December 31, 2023
| Cash Flows From (Used in) Operating Activities: |
| Net increase in net assets resulting from operations | $ 16,559,543 |
| Adjustments to reconcile net increase in net assets resulting from operations to net cash used in operating activities: | |
| Long term investments purchased | (414,768,808) |
| Long term investments sold | 403,768,878 |
| Purchase of short term investments, net | (239,741,065) |
| Sale of affiliated investments, net | 3,102,829 |
| Amortization (accretion) of discount and premium, net | (12,944,460) |
| Increase in due from custodian | (1,200,854) |
| Increase in investment securities sold receivable | (54,992,297) |
| Increase in interest receivable | (74,268) |
| Decrease in securities lending | 141 |
| Decrease in other assets | 4,355 |
| Decrease in unrealized appreciation for open forward foreign currency contracts | 30,432 |
| Increase in premiums from written options | 645,419 |
| Increase in cash collateral due to broker for TBA | 931,000 |
| Increase in cash collateral due to broker for swap contracts | 1,290,000 |
| Increase in investment securities purchased payable | 309,974,433 |
| Decrease in due to NYLIFE Distributors | (7,086) |
| Increase in professional fees payable | 18,384 |
| Increase in custodian payable | 59,354 |
| Decrease in shareholder communication payable | (26,511) |
| Increase in due to manager | 11,244 |
| Decrease in variation margin on centrally cleared swap contracts | 151,772 |
| Decrease in variation margin on futures contracts | (1,394,494) |
| Decrease in unrealized depreciation for open forward foreign currency contracts | (1,150,279) |
| Decrease in accrued expenses | (8,729) |
| Increase in unrealized appreciation on OTC swap contracts | (1,661,695) |
| Decrease in unrealized depreciation on OTC swap contracts | (751,183) |
| Net realized loss from investments | 9,968,070 |
| Net change in unrealized (appreciation) depreciation on unaffiliated investments | (9,352,941) |
| Net change in unrealized (appreciation) depreciation on written options | 715,399 |
| Net cash from operating activities | 9,156,583 |
| Cash Flows From (Used in) Financing Activities: |
| Proceeds from shares sold | 53,033,222 |
| Payment on shares redeemed | (82,935,865) |
| Proceeds on sale-buyback transactions | 1,738,712,481 |
| Payments from sale-buyback transactions | (1,719,307,068) |
| Net cash used in financing activities | (10,497,230) |
| Effect of exchange rate changes on cash | (353,281) |
| Net decrease in cash | (1,693,928) |
| Cash, restricted cash and foreign currency at beginning of year | 4,732,650 |
| Cash, restricted cash and foreign currency at end of year | $ 3,038,722 |
| Non-cash financing activities not included herein consist of all reinvestment of dividends and distributions of $40,994,047. |
| Supplemental disclosure of cash flow information: |
| The following tables provide a reconciliation of cash and restricted cash reported within the Statement of Assets and Liabilities that sums to the total of the such amounts shown on the Statement of Cash Flows: |
| Cash and restricted cash at beginning of year | |
| Cash | $ 38,705 |
| Cash denominated in foreign currencies | 1,844,945 |
| Cash collateral on deposit at broker for futures contracts | 2,288,000 |
| Cash collateral on deposit at broker for swap contracts | 291,000 |
| Cash collateral on deposit at broker for sale-buyback transactions | 270,000 |
| Total cash and restricted cash shown in the Statement of Cash Flows | $4,732,650 |
| Cash and restricted cash at end of year | |
| Cash | $ 9,503 |
| Cash denominated in foreign currencies | 1,170,219 |
| Cash collateral on deposit at broker for futures contracts | 1,031,000 |
| Cash collateral on deposit at broker for swap contracts | 828,000 |
| Total cash and restricted cash shown in the Statement of Cash Flows | $3,038,722 |
| Restricted cash consists of cash that has been segregated to cover the Portfolio’s collateral or margin obligations under derivative contracts. It is separately reported on the Statement of Assets and Liabilities as cash collateral on deposit at brokers. |
The notes to the financial statements are an integral part of, and should be read in conjunction with, the financial statements.
29
Financial Highlights selected per share data and ratios
| | Year Ended December 31, |
| Initial Class | 2023 | | 2022 | | 2021 | | 2020 | | 2019 |
| Net asset value at beginning of year | $ 8.23 | | $ 9.92 | | $ 9.47 | | $ 8.63 | | $ 8.20 |
| Net investment income (loss) (a) | 0.35 | | 0.68 | | 0.50 | | 0.12 | | 0.20 |
| Net realized and unrealized gain (loss) | (0.09) | | (1.82) | | — | | 0.91 | | 0.51 |
| Total from investment operations | 0.26 | | (1.14) | | 0.50 | | 1.03 | | 0.71 |
| Less distributions: | | | | | | | | | |
| From net investment income | (0.72) | | (0.55) | | (0.05) | | (0.19) | | (0.28) |
| Net asset value at end of year | $ 7.77 | | $ 8.23 | | $ 9.92 | | $ 9.47 | | $ 8.63 |
| Total investment return (b) | 3.72% | | (11.45)% | | 5.36%(c) | | 11.93%(c) | | 8.56%(c) |
| Ratios (to average net assets)/Supplemental Data: | | | | | | | | | |
| Net investment income (loss) | 4.31%(d) | | 7.42% | | 5.20% | | 1.27% | | 2.35% |
| Net expenses (e) | 0.77%(f) | | 0.71% | | 0.55% | | 0.78% | | 1.65% |
| Expenses (before waiver/reimbursement) (e) | 0.84% | | 0.76% | | 0.59% | | 0.83% | | 1.71% |
| Interest expense and fees | 0.25% | | 0.18% | | 0.02% | | 0.25% | | 1.09% |
| Portfolio turnover rate | 81% | | 71% | | 125%(g) | | 199%(g) | | 187%(g) |
| Net assets at end of year (in 000's) | $ 134,068 | | $ 119,313 | | $ 139,038 | | $ 48,479 | | $ 48,707 |
| (a) | Per share data based on average shares outstanding during the year. |
| (b) | Total return does not reflect any deduction of sales charges, mortality and expense charges, contract charges or administrative charges. For periods of less than one year, total return is not annualized. |
| (c) | Total investment return may reflect adjustments to conform to generally accepted accounting principles. |
| (d) | Without the custody fee reimbursement, net investment income (loss) would have been 4.30%. |
| (e) | In addition to the fees and expenses which the Portfolio bears directly, it also indirectly bears a pro-rata share of the fees and expenses of the underlying funds in which it invests. Such indirect expenses are not included in the above expense ratios. |
| (f) | Without the custody fee reimbursement, net expenses would have been 0.78%. |
| (g) | The portfolio turnover rates not including mortgage dollar rolls were 42%, 128% and 139% for the years ended December 31, 2021, 2020 and 2019, respectively. |
| | Year Ended December 31, |
| Service Class | 2023 | | 2022 | | 2021 | | 2020 | | 2019 |
| Net asset value at beginning of year | $ 8.20 | | $ 9.89 | | $ 9.44 | | $ 8.61 | | $ 8.19 |
| Net investment income (loss) (a) | 0.33 | | 0.66 | | 0.44 | | 0.09 | | 0.18 |
| Net realized and unrealized gain (loss) | (0.08) | | (1.82) | | 0.04 | | 0.91 | | 0.50 |
| Total from investment operations | 0.25 | | (1.16) | | 0.48 | | 1.00 | | 0.68 |
| Less distributions: | | | | | | | | | |
| From net investment income | (0.70) | | (0.53) | | (0.03) | | (0.17) | | (0.26) |
| Net asset value at end of year | $ 7.75 | | $ 8.20 | | $ 9.89 | | $ 9.44 | | $ 8.61 |
| Total investment return (b) | 3.46% | | (11.68)% | | 5.12% | | 11.61%(c) | | 8.30%(c) |
| Ratios (to average net assets)/Supplemental Data: | | | | | | | | | |
| Net investment income (loss) | 4.04%(d) | | 7.27% | | 4.58% | | 1.04% | | 2.14% |
| Net expenses (e) | 1.02%(f) | | 0.96% | | 0.80% | | 1.03% | | 1.89% |
| Expenses (before waiver/reimbursement) (e) | 1.09% | | 1.01% | | 0.84% | | 1.08% | | 1.96% |
| Interest expense and fees | 0.25% | | 0.18% | | 0.02% | | 0.25% | | 1.09% |
| Portfolio turnover rate | 81% | | 71% | | 125%(g) | | 199%(g) | | 187%(g) |
| Net assets at end of year (in 000's) | $ 346,452 | | $ 374,580 | | $ 452,844 | | $ 433,668 | | $ 343,332 |
| (a) | Per share data based on average shares outstanding during the year. |
| (b) | Total return does not reflect any deduction of sales charges, mortality and expense charges, contract charges or administrative charges. For periods of less than one year, total return is not annualized. |
| (c) | Total investment return may reflect adjustments to conform to generally accepted accounting principles. |
| (d) | Without the custody fee reimbursement, net investment income (loss) would have been 4.03%. |
| (e) | In addition to the fees and expenses which the Portfolio bears directly, it also indirectly bears a pro-rata share of the fees and expenses of the underlying funds in which it invests. Such indirect expenses are not included in the above expense ratios. |
| (f) | Without the custody fee reimbursement, net expenses would have been 1.03%. |
| (g) | The portfolio turnover rates not including mortgage dollar rolls were 42%, 128% and 139% for the years ended December 31, 2021, 2020 and 2019, respectively. |
The notes to the financial statements are an integral part of, and should be read in conjunction with, the financial statements.
| 30 | MainStay VP PIMCO Real Return Portfolio |
Notes to Financial Statements
Note 1–Organization and Business
MainStay VP Funds Trust (the “Fund”) was organized as a Delaware statutory trust on February 1, 2011. The Fund is registered under the Investment Company Act of 1940, as amended (the “1940 Act”), as an open-end management investment company. The Fund is comprised of thirty-one separate series (collectively referred to as the “Portfolios”). These financial statements and notes relate to the MainStay VP PIMCO Real Return Portfolio (the "Portfolio"), a "non-diversified” portfolio, as that term is defined in the 1940 Act, as interpreted or modified by regulatory authorities having jurisdiction, from time to time. However, due to its principal investment strategies and investment processes, the Portfolio has historically operated as a "diversified" portfolio. Therefore, the Portfolio will not operate as "non-diversified" portfolio without first obtaining shareholder approval.
Shares of the Portfolio are currently offered to certain separate accounts to fund variable annuity policies and variable universal life insurance policies issued by New York Life Insurance and Annuity Corporation (“NYLIAC”), a wholly-owned subsidiary of New York Life Insurance Company (“New York Life”) and may also be offered to fund variable annuity policies and variable universal life insurance policies issued by other insurance companies. NYLIAC allocates shares of the Portfolio to, among others, certain NYLIAC separate accounts. Shares of the Portfolio are also offered to the MainStay VP Conservative Allocation Portfolio, MainStay VP Moderate Allocation Portfolio, MainStay VP Growth Allocation Portfolio and MainStay VP Equity Allocation Portfolio, which operate as “funds-of-funds," and other variable insurance funds.
The following table lists the Portfolio's share classes that have been registered and commenced operations:
| Class | Commenced Operations |
| Initial Class | February 17, 2012 |
| Service Class | February 17, 2012 |
Shares of the Portfolio are offered and are redeemed at a price equal to their respective net asset value (“NAV”) per share. No sales or redemption charge is applicable to the purchase or redemption of the Portfolio's shares. Under the terms of the Fund’s multiple class plan, adopted pursuant to Rule 18f-3 under the 1940 Act, the classes differ in that, among other things, Service Class shares of the Portfolio pay a combined distribution and service fee of 0.25% of average daily net assets attributable to Service Class shares of the Portfolio to the Distributor (as defined in Note 3(B)) pursuant to a plan adopted in accordance with Rule 12b-1 under the 1940 Act. Contract owners of variable annuity contracts purchased after June 2, 2003, are permitted to invest only in the Service Class shares.
The Portfolio's investment objective is to seek maximum real return, consistent with preservation of real capital and prudent investment management.
Note 2–Significant Accounting Policies
The Portfolio is an investment company and accordingly follows the investment company accounting and reporting guidance of the Financial Accounting Standards Board (“FASB”) Accounting Standards Codification Topic 946 Financial Services—Investment Companies. The Portfolio prepares its financial statements in accordance with generally accepted accounting principles (“GAAP”) in the United States of America and follows the significant accounting policies described below.
(A) Securities Valuation. Investments are usually valued as of the close of regular trading on the New York Stock Exchange (the "Exchange") (usually 4:00 p.m. Eastern time) on each day the Portfolio is open for business ("valuation date").
Pursuant to Rule 2a-5 under the 1940 Act, the Board of Trustees of the Fund (the "Board") has designated New York Life Investment Management LLC (“New York Life Investments” or the "Manager") as its Valuation Designee (the "Valuation Designee"). The Valuation Designee is responsible for performing fair valuations relating to all investments in the Portfolio’s portfolio for which market quotations are not readily available; periodically assessing and managing material valuation risks; establishing and applying fair value methodologies; testing fair valuation methodologies; evaluating and overseeing pricing services; ensuring appropriate segregation of valuation and portfolio management functions; providing quarterly, annual and prompt reporting to the Board, as appropriate; identifying potential conflicts of interest; and maintaining appropriate records. The Valuation Designee has established a valuation committee ("Valuation Committee") to assist in carrying out the Valuation Designee’s responsibilities and establish prices of securities for which market quotations are not readily available. The Portfolio's and the Valuation Designee's policies and procedures ("Valuation Procedures") govern the Valuation Designee’s selection and application of methodologies for determining and calculating the fair value of Portfolio investments. The Valuation Designee may value the Portfolio's portfolio securities for which market quotations are not readily available and other Portfolio assets utilizing inputs from pricing services and other third-party sources. The Valuation Committee meets (in person, via electronic mail or via teleconference) on an ad-hoc basis to determine fair valuations and on a quarterly basis to review fair value events with respect to certain securities for which market quotations are not readily available, including valuation risks and back-testing results, and to preview reports to the Board.
The Valuation Committee establishes prices of securities for which market quotations are not readily available based on such methodologies and measurements on a regular basis after considering information that is reasonably available and deemed relevant by the Valuation Committee. The Board shall oversee the Valuation Designee and review fair valuation materials on a prompt, quarterly and annual basis and approve proposed revisions to the Valuation Procedures.
Investments for which market quotations are not readily available are valued at fair value as determined in good faith pursuant to the Valuation
Notes to Financial Statements (continued)
Procedures. A market quotation is readily available only when that quotation is a quoted price (unadjusted) in active markets for identical investments that the Portfolio can access at the measurement date, provided that a quotation will not be readily available if it is not reliable. "Fair value" is defined as the price the Portfolio would reasonably expect to receive upon selling an asset or liability in an orderly transaction to an independent buyer in the principal or most advantageous market for the asset or liability. Fair value measurements are determined within a framework that establishes a three-tier hierarchy that maximizes the use of observable market data and minimizes the use of unobservable inputs to establish a classification of fair value measurements for disclosure purposes. "Inputs" refer broadly to the assumptions that market participants would use in pricing the asset or liability, including assumptions about risk, such as the risk inherent in a particular valuation technique used to measure fair value using a pricing model and/or the risk inherent in the inputs for the valuation technique. Inputs may be observable or unobservable. Observable inputs reflect the assumptions market participants would use in pricing the asset or liability based on market data obtained from sources independent of the Portfolio. Unobservable inputs reflect the Portfolio’s own assumptions about the assumptions market participants would use in pricing the asset or liability based on the information available. The inputs or methodology used for valuing assets or liabilities may not be an indication of the risks associated with investing in those assets or liabilities. The three-tier hierarchy of inputs is summarized below.
| • | Level 1—quoted prices (unadjusted) in active markets for an identical asset or liability |
| • | Level 2—other significant observable inputs (including quoted prices for a similar asset or liability in active markets, interest rates and yield curves, prepayment speeds, credit risk, etc.) |
| • | Level 3—significant unobservable inputs (including the Portfolio's own assumptions about the assumptions that market participants would use in measuring fair value of an asset or liability) |
The level of an asset or liability within the fair value hierarchy is based on the lowest level of an input, both individually and in the aggregate, that is significant to the fair value measurement. The aggregate value by input level of the Portfolio’s assets and liabilities as of December 31, 2023, is included at the end of the Portfolio of Investments.
The Portfolio may use third-party vendor evaluations, whose prices may be derived from one or more of the following standard inputs, among others:
| • Benchmark yields | • Reported trades |
| • Broker/dealer quotes | • Issuer spreads |
| • Two-sided markets | • Benchmark securities |
| • Bids/offers | • Reference data (corporate actions or material event notices) |
| • Industry and economic events | • Comparable bonds |
| • Equity and credit default swap curves | • Monthly payment information |
An asset or liability for which a market quotation is not readily available is valued by methods deemed reasonable in good faith by the Valuation Committee, following the Valuation Procedures to represent fair value. Under these procedures, the Valuation Designee generally uses a market-based approach which may use related or comparable assets or liabilities, recent transactions, market multiples, book values and other relevant information. The Valuation Designee may also use an income-based valuation approach in which the anticipated future cash flows of the asset or liability are discounted to calculate fair value. Discounts may also be applied due to the nature and/or duration of any restrictions on the disposition of the asset or liability. Fair value represents a good faith approximation of the value of a security. Fair value determinations involve the consideration of a number of subjective factors, an analysis of applicable facts and circumstances and the exercise of judgment. As a result, it is possible that the fair value for a security determined in good faith in accordance with the Valuation Procedures may differ from valuations for the same security determined for other funds using their own valuation procedures. Although the Valuation Procedures are designed to value a security at the price the Portfolio may reasonably expect to receive upon the security's sale in an orderly transaction, there can be no assurance that any fair value determination thereunder would, in fact, approximate the amount that the Portfolio would actually realize upon the sale of the security or the price at which the security would trade if a reliable market price were readily available. During the year ended December 31, 2023, there were no material changes to the fair value methodologies.
Securities which may be valued in this manner include, but are not limited to: (i) a security for which trading has been halted or suspended or otherwise does not have a readily available market quotation on a given day; (ii) a debt security that has recently gone into default and for which there is not a current market quotation; (iii) a security of an issuer that has entered into a restructuring; (iv) a security that has been delisted from a national exchange; (v) a security subject to trading collars for which no or limited trading takes place; and (vi) a security whose principal market has been temporarily closed at a time when, under normal conditions, it would be open. Securities valued in this manner are generally categorized as Level 2 or 3 in the hierarchy.
Investments in mutual funds, including money market funds, are valued at their respective NAVs at the close of business each day on the valuation date. These securities are generally categorized as Level 1 in the hierarchy.
Futures contracts are valued at the last posted settlement price on the market where such futures are primarily traded. These securities are generally categorized as Level 1 in the hierarchy.
Options contracts are valued at the last posted settlement price on the market where such options are primarily traded. These securities are generally categorized as Level 1 (exchanged-traded) or Level 2 (OTC) in the hierarchy.
| 32 | MainStay VP PIMCO Real Return Portfolio |
Swaps are marked to market daily based upon quotations from pricing agents, brokers or market makers. These securities are generally categorized as Level 2 in the hierarchy.
Debt securities (other than convertible and municipal bonds) are valued at the evaluated bid prices (evaluated mean prices in the case of convertible and municipal bonds) supplied by a pricing agent or broker selected by the Valuation Designee, in consultation with the Subadvisor. The evaluations are market-based measurements processed through a pricing application and represents the pricing agent’s good faith determination as to what a holder may receive in an orderly transaction under market conditions. The rules-based logic utilizes valuation techniques that reflect participants’ assumptions and vary by asset class and per methodology, maximizing the use of relevant observable data including quoted prices for similar assets, benchmark yield curves and market corroborated inputs. The evaluated bid or mean prices are deemed by the Valuation Designee, in consultation with the Subadvisor, to be representative of market values at the regular close of trading of the Exchange on each valuation date. Debt securities purchased on a delayed delivery basis are marked to market daily until settlement at the forward settlement date. Debt securities, including corporate bonds, U.S. government and federal agency bonds, municipal bonds, foreign bonds, convertible bonds, asset-backed securities and mortgage-backed securities are generally categorized as Level 2 in the hierarchy.
Foreign currency forward contracts are valued at their fair market values measured on the basis of the mean between the last current bid and ask prices based on dealer or exchange quotations and are generally categorized as Level 2 in the hierarchy.
Temporary cash investments acquired in excess of 60 days to maturity at the time of purchase are valued using the latest bid prices or using valuations based on a matrix system (which considers such factors as security prices, yields, maturities and ratings), both as furnished by independent pricing services. Temporary cash investments that mature in 60 days or less at the time of purchase ("Short-Term Investments") are valued using the amortized cost method of valuation, unless the use of such method would be inappropriate. The amortized cost method involves valuing a security at its cost on the date of purchase and thereafter assuming a constant amortization to maturity of the difference between such cost and the value on maturity date. Amortized cost approximates the current fair value of a security. Securities valued using the amortized cost method are not valued using quoted prices in an active market and are generally categorized as Level 2 in the hierarchy.
The information above is not intended to reflect an exhaustive list of the methodologies that may be used to value portfolio investments. The Valuation Procedures permit the use of a variety of valuation methodologies in connection with valuing portfolio investments. The methodology used for a specific type of investment may vary based on the market data available or other considerations. The methodologies summarized above may not represent the specific means by which portfolio investments are valued on any particular business day.
(B) Income Taxes. The Portfolio's policy is to comply with the requirements of the Internal Revenue Code of 1986, as amended (the “Internal Revenue Code”), applicable to regulated investment companies and to distribute all of its taxable income to the shareholders of the Portfolio within the allowable time limits.
The Manager evaluates the Portfolio’s tax positions to determine if the tax positions taken meet the minimum recognition threshold in connection with accounting for uncertainties in income tax positions taken or expected to be taken for the purposes of measuring and recognizing tax liabilities in the financial statements. Recognition of tax benefits of an uncertain tax position is permitted only to the extent the position is “more likely than not” to be sustained assuming examination by taxing authorities. The Manager analyzed the Portfolio's tax positions taken on federal, state and local income tax returns for all open tax years (for up to three tax years) and has concluded that no provisions for federal, state and local income tax are required in the Portfolio's financial statements. The Portfolio's federal, state and local income tax and federal excise tax returns for tax years for which the applicable statutes of limitations have not expired are subject to examination by the Internal Revenue Service and state and local departments of revenue.
(C) Foreign Taxes. The Portfolio may be subject to foreign taxes on income and other transaction-based taxes imposed by certain countries in which it invests. A portion of the taxes on gains on investments or currency purchases/repatriation may be reclaimable. The Portfolio will accrue such taxes and reclaims as applicable, based upon its current interpretation of tax rules and regulations that exist in the markets in which it invests.
The Portfolio may be subject to taxation on realized capital gains, repatriation proceeds and other transaction-based taxes imposed by certain countries in which it invests. The Portfolio will accrue such taxes as applicable based upon its current interpretation of tax rules and regulations that exist in the market in which it invests. Capital gains taxes relating to positions still held are reflected as a liability in the Statement of Assets and Liabilities, as well as an adjustment to the Portfolio's net unrealized appreciation (depreciation). Taxes related to capital gains realized, if any, are reflected as part of net realized gain (loss) in the Statement of Operations. Changes in tax liabilities related to capital gains taxes on unrealized investment gains, if any, are reflected as part of the change in net unrealized appreciation (depreciation) on investments in the Statement of Operations. Transaction-based charges are generally assessed as a percentage of the transaction amount.
(D) Dividends and Distributions to Shareholders. Dividends and distributions are recorded on the ex-dividend date. The Portfolio intends to declare and pay dividends from net investment income and distributions from net realized capital and currency gains, if any, at least annually. All dividends and distributions are reinvested at NAV in the same class of shares of the Portfolio. Dividends and distributions to shareholders are determined in accordance with federal income tax regulations and may differ from determinations using GAAP.
Notes to Financial Statements (continued)
(E) Security Transactions and Investment Income. The Portfolio records security transactions on the trade date. Realized gains and losses on security transactions are determined using the identified cost method. Dividend income is recognized on the ex-dividend date, net of any foreign tax withheld at the source, and interest income is accrued as earned using the effective interest rate method. Distributions received from real estate investment trusts may be classified as dividends, capital gains and/or return of capital. Discounts and premiums on securities purchased for the Portfolio are accreted and amortized, respectively, on the effective interest rate method.
Investment income and realized and unrealized gains and losses on investments of the Portfolio are allocated pro rata to the separate classes of shares based upon their relative net assets on the date the income is earned or realized and unrealized gains and losses are incurred.
The Portfolio may place a debt security on non-accrual status and reduce related interest income by ceasing current accruals and writing off all or a portion of any interest receivables when the collection of all or a portion of such interest has become doubtful. A debt security is removed from non-accrual status when the issuer resumes interest payments or when collectability of interest is reasonably assured.
(F) Expenses. Expenses of the Fund are allocated to the individual Portfolios in proportion to the net assets of the respective Portfolios when the expenses are incurred, except where direct allocations of expenses can be made. Expenses (other than fees incurred under the distribution and service plans, further discussed in Note 3(B), which are charged directly to the Service Class shares) are allocated to separate classes of shares pro rata based upon their relative net assets on the date the expenses are incurred. The expenses borne by the Portfolio, including those of related parties to the Portfolio, are shown in the Statement of Operations.
Additionally, the Portfolio may invest in mutual funds, which are subject to management fees and other fees that may cause the costs of investing in mutual funds to be greater than the costs of owning the underlying securities directly. These indirect expenses of mutual funds are not included in the amounts shown as expenses in the Statement of Operations or in the expense ratios included in the Financial Highlights.
(G) Use of Estimates. In preparing financial statements in conformity with GAAP, the Manager makes estimates and assumptions that affect the reported amounts and disclosures in the financial statements. Actual results could differ from those estimates and assumptions.
(H) Futures Contracts. A futures contract is an agreement to purchase or sell a specified quantity of an underlying instrument at a specified future date and price, or to make or receive a cash payment based on the value of a financial instrument (e.g., foreign currency, interest rate, security or securities index). The Portfolio is subject to risks such as market price risk, leverage risk, liquidity risk, counterparty risk, operational risk, legal risk and/or interest rate risk in the normal course of investing in these contracts. Upon entering into a futures contract, the Portfolio is required to pledge to the broker or futures commission
merchant an amount of cash and/or U.S. government securities equal to a certain percentage of the collateral amount, known as the “initial margin.” During the period the futures contract is open, changes in the value of the contract are recognized as unrealized appreciation or depreciation by marking to market such contract on a daily basis to reflect the market value of the contract at the end of each day’s trading. The Portfolio agrees to receive from or pay to the broker or futures commission merchant an amount of cash equal to the daily fluctuation in the value of the contract. Such receipts or payments are known as “variation margin.” When the futures contract is closed, the Portfolio records a realized gain or loss equal to the difference between the proceeds from (or cost of) the closing transaction and the Portfolio's basis in the contract.
The use of futures contracts involves, to varying degrees, elements of market risk in excess of the amount recognized in the Statement of Assets and Liabilities. The contract or notional amounts and variation margin reflect the extent of the Portfolio's involvement in open futures positions. There are several risks associated with the use of futures contracts as hedging techniques. There can be no assurance that a liquid market will exist at the time when the Portfolio seeks to close out a futures contract. If no liquid market exists, the Portfolio would remain obligated to meet margin requirements until the position is closed. Futures contracts may involve a small initial investment relative to the risk assumed, which could result in losses greater than if the Portfolio did not invest in futures contracts. Futures contracts may be more volatile than direct investments in the instrument underlying the futures and may not correlate to the underlying instrument, causing a given hedge not to achieve its objectives. The Portfolio's activities in futures contracts have minimal counterparty risk as they are conducted through regulated exchanges that guarantee the futures against default by the counterparty. In the event of a bankruptcy or insolvency of a futures commission merchant that holds margin on behalf of the Portfolio, the Portfolio may not be entitled to the return of the entire margin owed to the Portfolio, potentially resulting in a loss. The Portfolio may invest in futures contracts to seek enhanced returns or to reduce the risk of loss by hedging certain of its holdings. The Portfolio's investment in futures contracts and other derivatives may increase the volatility of the Portfolio's NAVs and may result in a loss to the Portfolio.
(I) Swap Contracts. The Portfolio may enter into credit default, interest rate, equity, index and currency exchange rate swap contracts (“swaps”). In a typical swap transaction, two parties agree to exchange the future returns (or differentials in rates of future returns) earned or realized at periodic intervals on a particular investment or instrument based on a notional principal amount. Generally, the Portfolio will enter into a swap on a net basis, which means that the two payment streams under the swap are netted, with the Portfolio receiving or paying (as the case may be) only the net amount of the two payment streams. Therefore, the Portfolio's current obligation under a swap generally will be equal to the net amount to be paid or received under the swap, based on the relative value of notional positions attributable to each counterparty to the swap. The payments may be adjusted for transaction costs, interest payments, the
| 34 | MainStay VP PIMCO Real Return Portfolio |
amount of interest paid on the investment or instrument or other factors. Collateral, in the form of cash or securities, may be required to be held in segregated accounts with the custodian bank or broker in accordance with the terms of the swap. Swap agreements are privately negotiated in the over the counter (“OTC”) market and may be executed in a multilateral or other trade facilities platform, such as a registered commodities exchange (“centrally cleared swaps”).
Certain standardized swaps, including certain credit default and interest rate swaps, are subject to mandatory clearing and exchange-trading, and more types of standardized swaps are expected to be subject to mandatory clearing and exchange-trading in the future. The counterparty risk for exchange-traded and cleared derivatives is expected to be generally lower than for uncleared derivatives, but cleared contracts are not risk-free. In a cleared derivative transaction, the Portfolio typically enters into the transaction with a financial institution counterparty, and performance of the transaction is effectively guaranteed by a central clearinghouse, thereby reducing or eliminating the Portfolio's exposure to the credit risk of its original counterparty. The Portfolio will be required to post specified levels of margin with the clearinghouse or at the instruction of the clearinghouse; the margin required by a clearinghouse may be greater than the margin the Portfolio would be required to post in an uncleared transaction.
Swaps are marked to market daily based upon quotations from pricing agents, brokers, or market makers and the change in value, if any, is recorded as unrealized appreciation or depreciation. Any payments made or received upon entering into a swap would be amortized or accreted over the life of the swap and recorded as a realized gain or loss. Early termination of a swap is recorded as a realized gain or loss. Daily changes in valuation of centrally cleared swaps, if any, are recorded as a receivable or payable for the change in value as appropriate on the Statement of Assets and Liabilities.
The Portfolio bears the risk of loss of the amount expected to be received under a swap in the event of the default or bankruptcy of the swap counterparty. The Portfolio may be able to eliminate its exposure under a swap either by assignment or other disposition, or by entering into an offsetting swap with the same party or a similar credit-worthy party. Swaps are not actively traded on financial markets. Entering into swaps involves elements of credit, market, leverage, liquidity, operational, counterparty and legal/documentation risk in excess of the amounts recognized on the Statement of Assets and Liabilities. Such risks involve the possibilities that there will be no liquid market for these swaps, that the counterparty to the swaps may default on its obligation to perform or disagree as to the meaning of the contractual terms in the swaps and that there may be unfavorable changes in interest rates, the price of the index or the security underlying these transactions, among other risks.
Total Return Swaps: Total Return Swap Agreements are entered into to gain or mitigate exposure to the underlying reference asset. Total return swap agreements involve commitments where single or multiple cash flows are exchanged based on the price of an underlying reference asset and on a fixed or variable interest rate. Total return swap agreements may
involve commitments to pay interest in exchange for a market-linked return. One counterparty pays out the total return of a specific underlying reference asset, which may include a single security, a basket of securities, or an index, and in return receives a fixed or variable rate. At the maturity date, a net cash flow is exchanged where the total return is equivalent to the return of the underlying reference asset less a financing rate, if any. As a receiver, the Portfolio would receive payments based on any net positive total return and would owe payments in the event of a net negative total return. As the payer, the Portfolio would owe payments on any net positive total return, and would receive payments in the event of a net negative total return.
Inflation Swaps: Inflation swap agreements are contracts in which one party agrees to pay the cumulative percentage increase in a price index (the Consumer Price Index with respect to CPI swaps) over the term of the swap (with some lag on the inflation index), and the other pays a compounded fixed rate. Inflation swaps may be used to protect the net asset value, or NAV, of a Fund against an unexpected change in the rate of inflation measured by an inflation index since the value of these agreements is expected to increase if there are unexpected inflation increases.
Interest Rate Swaps : An interest rate swap is an agreement between two parties where one stream of future interest payments is exchanged for another based on a specified principal amount. Interest rate swaps often exchange a fixed payment for a floating payment that is linked to an interest rate (most often Secured Overnight Financing Rate ("SOFR")). The Portfolio will typically use interest rate swaps to limit, or manage, its exposure to fluctuations in interest rates, or to obtain a marginally lower interest rate than it would have been able to get without the swap.
(J) Foreign Currency Forward Contracts. The Portfolio may enter into foreign currency forward contracts, which are agreements to buy or sell foreign currencies on a specified future date at a specified rate. The Portfolio is subject to foreign currency exchange rate risk in the normal course of investing in these transactions. During the period the forward contract is open, changes in the value of the contract are recognized as unrealized appreciation or depreciation by marking to market such contract on a daily basis to reflect the market value of the contract at the end of each day’s trading. Cash movement occurs on the settlement date. When the forward contract is closed, the Portfolio records a realized gain or loss equal to the difference between the proceeds from (or cost of) the closing transaction and the Portfolio's basis in the contract. The Portfolio may purchase and sell foreign currency forward contracts for purposes of seeking to enhance portfolio returns and manage portfolio risk more efficiently. Foreign currency forward contracts may also be used to gain exposure to a particular currency or to hedge against the risk of loss due to changing currency exchange rates. Foreign currency forward contracts to purchase or sell a foreign currency may also be used in anticipation of future purchases or sales of securities denominated in foreign currency, even if the specific investments have not yet been selected.
The use of foreign currency forward contracts involves, to varying degrees, elements of risk in excess of the amount recognized in the
Notes to Financial Statements (continued)
Statement of Assets and Liabilities, including counterparty risk, market risk, leverage risk, operational risk, legal risk and liquidity risk. Counterparty risk is heightened for these instruments because foreign currency forward contracts are not exchange-traded and therefore no clearinghouse or exchange stands ready to meet the obligations under such contracts. Thus, the Portfolio faces the risk that its counterparties under such contracts may not perform their obligations. Market risk is the risk that the value of a foreign currency forward contract will depreciate due to unfavorable changes in exchange rates. Liquidity risk arises because the secondary market for foreign currency forward contracts may have less liquidity relative to markets for other securities and financial instruments. Liquidity risk also can arise when forward currency contracts create margin or settlement payment obligations for the Portfolio. Leverage risk is the risk that a foreign currency forward contract can magnify the Portfolio's gains and losses. Operational risk refers to risk related to potential operational issues (including documentation issues, settlement issues, systems failures, inadequate controls and human error), and legal risk refers to insufficient documentation, insufficient capacity or authority of the counterparty, or legality or enforceability of a foreign currency forward contract. Risks also arise from the possible movements in the foreign exchange rates underlying these instruments. While the Portfolio may enter into forward contracts to reduce currency exchange risks, changes in currency exchange rates may result in poorer overall performance for the Portfolio than if it had not engaged in such transactions. Exchange rate movements can be large, depending on the currency, and can last for extended periods of time, affecting the value of the Portfolio's assets. Moreover, there may be an imperfect correlation between the Portfolio's holdings of securities denominated in a particular currency and forward contracts entered into by the Portfolio. Such imperfect correlation may prevent the Portfolio from achieving the intended hedge or expose the Portfolio to the risk of currency exchange loss. The unrealized appreciation (depreciation) on forward contracts also reflects the Portfolio's exposure at the valuation date to credit loss in the event of a counterparty’s failure to perform its obligations.
(K) Foreign Currency Transactions. The Portfolio's books and records are maintained in U.S. dollars. Prices of securities denominated in foreign currency amounts are translated into U.S. dollars at the mean between the buying and selling rates last quoted by any major U.S. bank at the following dates:
(i) market value of investment securities, other assets and liabilities— at the valuation date; and
(ii) purchases and sales of investment securities, income and expenses—at the date of such transactions.
The assets and liabilities that are denominated in foreign currency amounts are presented at the exchange rates and market values at the close of the period. The realized and unrealized changes in net assets arising from fluctuations in exchange rates and market prices of securities are not separately presented.
Net realized gain (loss) on foreign currency transactions represents net currency gains or losses realized as a result of differences between the amounts of securities sale proceeds or purchase cost, dividends, interest and withholding taxes as recorded on the Portfolio's books, and the U.S. dollar equivalent amount actually received or paid. Net currency gains or losses from valuing such foreign currency denominated assets and liabilities, other than investments at valuation date exchange rates, are reflected in unrealized foreign exchange gains or losses.
(L) Repurchase Agreements. The Portfolio may enter into repurchase agreements (i.e., buy a security from another party with the agreement that it will be sold back in the future) to earn income. The Portfolio may enter into repurchase agreements only with counterparties, usually financial institutions, that are deemed by the Manager or the Subadvisor to be creditworthy, pursuant to guidelines established by the Board. During the term of any repurchase agreement, the Manager or the Subadvisor will continue to monitor the creditworthiness of the counterparty. Under the 1940 Act, repurchase agreements are considered to be collateralized loans by the Portfolio to the counterparty secured by the securities transferred to the Portfolio.
Repurchase agreements are subject to counterparty risk, meaning the Portfolio could lose money by the counterparty’s failure to perform under the terms of the agreement. The Portfolio mitigates this risk by ensuring the repurchase agreement is collateralized by cash, U.S. government securities, fixed income securities and/or other securities. The collateral is held by the Portfolio's custodian and valued daily on a mark to market basis to determine if the value, including accrued interest, exceeds the repurchase price. In the event of the counterparty’s default on the obligation to repurchase, the Portfolio has the right to liquidate the collateral and apply the proceeds in satisfaction of the obligation. Under certain circumstances, such as in the event of default or bankruptcy by the counterparty, realization and/or retention of the collateral may be limited or subject to delay, to legal proceedings and possible realized loss to the Portfolio.
(M) Securities Lending. In order to realize additional income, the Portfolio may engage in securities lending, subject to the limitations set forth in the 1940 Act and relevant guidance by the staff of the Securities and Exchange Commission (“SEC”). If the Portfolio engages in securities lending, the Portfolio will lend through its custodian, JPMorgan Chase Bank, N.A., ("JPMorgan"), acting as securities lending agent on behalf of the Portfolio. Under the current arrangement, JPMorgan will manage the Portfolio's collateral in accordance with the securities lending agency agreement between the Portfolio and JPMorgan, and indemnify the Portfolio against counterparty risk. The loans will be collateralized by cash (which may be invested in a money market fund) and/or non-cash collateral (which may include U.S. Treasury securities and/or U.S. government agency securities issued or guaranteed by the United States government or its agencies or instrumentalities) at least equal at all times to the market value of the securities loaned. Non-cash collateral held at year end is segregated and cannot be transferred by the Portfolio. The Portfolio bears the risk of delay in recovery of, or loss of rights in, the
| 36 | MainStay VP PIMCO Real Return Portfolio |
securities loaned. The Portfolio may also record a realized gain or loss on securities deemed sold due to a borrower’s inability to return securities on loan. The Portfolio bears the risk of any loss on investment of cash collateral. The Portfolio will receive compensation for lending its securities in the form of fees or it will retain a portion of interest earned on the investment of any cash collateral. The Portfolio will also continue to receive interest and dividends on the securities loaned and any gain or loss in the market price of the securities loaned that may occur during the term of the loan will be for the account of the Portfolio. Income earned from securities lending activities, if any, is reflected in the Statement of Operations.
(N) Dollar Rolls. The Portfolio may enter into dollar roll transactions in which it sells mortgage-backed securities ("MBS") from its portfolio to a counterparty from whom it simultaneously agrees to buy a similar security on a delayed delivery basis. The Portfolio generally transfers MBS where the MBS are "to be announced," therefore, the Portfolio accounts for these transactions as purchases and sales.
When accounted for as purchase and sales, the securities sold in connection with the dollar rolls are removed from the portfolio and a realized gain or loss is recognized. The securities the Portfolio has agreed to acquire are included at market value in the Portfolio of Investments and liabilities for such purchase commitments are included as payables for investments purchased. During the roll period, the Portfolio foregoes principal and interest paid on the securities. The Portfolio is compensated by the difference between the current sales price and the forward price for the future as well as by the earnings on the cash proceeds of the initial sale. Dollar rolls may be renewed without physical delivery of the securities subject to the contract. Dollar roll transactions involve certain risks, including the risk that the securities returned to the Portfolio at the end of the roll period, while substantially similar, could be inferior to what was initially sold to the counterparty.
(O) Options Contracts. The Portfolio may write call and put options on securities and financial derivative instruments it owns or in which it may invest. Writing put options tends to increase the Portfolio’s exposure to the underlying instrument. Writing call options tends to decrease the Portfolio’s exposure to the underlying instrument. When the Portfolio writes a call or put, an amount equal to the premium received is recorded as a liability and subsequently marked to market to reflect the current value of the option written. These liabilities are reflected as written options outstanding on the Statement of Assets and Liabilities. Premiums received from writing options which expire are treated as realized gains. Premiums received from writing options which are exercised or closed are added to the proceeds or offset against amounts paid on the underlying futures, swaps, security or currency transaction to determine the realized gain or loss. Certain options may be written with premiums to be determined on a future date. Entering into options contracts involves leverage risk, liquidity risk, counterparty risk, market risk, operational risk and legal risk. The Portfolio, as a writer of an option, has no control over whether the underlying instrument may be sold (call) or purchased (put) and as a result bears the market risk of an unfavorable change in the
price of the instrument underlying the written option. There is the risk the Portfolio may not be able to enter into a closing transaction because of an illiquid market. Writing call options involves risk of loss in excess of the related amounts reflected in the Statement of Assets and Liabilities.
The Portfolio may also purchase put and call options. Purchasing call options tends to increase the Portfolio’s exposure to the underlying instrument. Alternatively, purchasing put options tends to decrease the Portfolio’s exposure to the underlying instrument. The Portfolio pays a premium which is included on the Portfolio’s Statement of Assets and Liabilities as an investment and subsequently marked to market to reflect the current value of the option. Premiums paid for purchasing options which expire are treated as realized losses. Certain options may be purchased with premiums to be determined on a future date. The premiums for these options are based upon implied volatility parameters at specified terms. The risk associated with purchasing put and call options is limited to the premium paid. Premiums paid for purchasing options which are exercised or closed are added to the amounts paid or offset against the proceeds on the underlying investment transaction to determine the realized gain or loss when the underlying transaction is sold.
The Portfolio may purchase or write foreign currency options. Purchasing a foreign currency option gives the Portfolio the right, but not the obligation, to buy or sell a specified amount of the currency at a specified rate of exchange that may be exercised on or before the option’s expiration date. Writing a foreign currency option obligates the Portfolio to buy or sell a specified amount of foreign currency at a specified rate of exchange, and such option may be exercised on or before the option’s expiration date in exchange for an option premium. These options may be used as a short or long hedge against possible variations in foreign exchange rates or to gain exposure to foreign currencies. The risks associated with writing a foreign currency put option include the risk that the Portfolio may incur a loss if the value of the referenced foreign currency decreases and the option is exercised. The risks associated with writing a foreign currency call option include the risk that if the value of the referenced foreign currency increases, and if the option is exercised, the Portfolio must either acquire the referenced foreign currency at the then higher price for delivery or, if the Portfolio already owns the referenced foreign currency, forego the opportunity for profit with respect to such foreign currency.
The Portfolio may purchase or write option on exchanged-traded futures contracts (“Futures Option”) to hedge an existing position or futures investment, for speculative purposes or to manage exposure to market movements. A Futures Option is an option contract in which the underlying instrument is a single futures contract.
The Portfolio may purchase or write inflation-capped options to enhance returns or for hedging opportunities. An inflation-capped option pays out if inflation exceeds a certain level over a specified period of time. The purpose of purchasing inflation-capped options is to protect the Portfolio from inflation erosion above a certain rate on a given notional exposure. When the Portfolio writes an inflation-capped option, an amount equal to
Notes to Financial Statements (continued)
the premium received is recorded as a liability and subsequently marked to market to reflect the current value of the option written.
(P) Sale-Buybacks. The Portfolio may enter into financing transactions referred to as ‘sale-buybacks’ in accordance with Rule 18f-4 under the 1940 Act. A sale-buyback transaction consists of a sale of a security by the Portfolio to a financial institution, the counterparty, with a simultaneous agreement to repurchase the same or substantially the same security at an agreed-upon price and date. The Portfolio is not entitled to receive principal and interest payments, if any, made on the security sold to the counterparty during the term of the agreement. The agreed-upon proceeds for securities to be repurchased by the Portfolio are reflected as a liability on the Statement of Assets and Liabilities. The Portfolio will recognize net income represented by the price differential between the price received for the transferred security and the agreed-upon repurchase price. This is commonly referred to as the “price drop”. A price drop consists of (i) the foregone interest and inflationary income adjustments, if any, the Portfolio would have otherwise received had the security not been sold and (ii) the negotiated financing terms between the Portfolio and counterparty. Foregone interest and inflationary income adjustments, if any, are recorded as components of interest income on the Statement of Operations. Interest payments based upon negotiated financing terms made by the Portfolio to counterparties are recorded as a component of interest expense on the Statement of Operations. In periods of increased demand for the security, the Portfolio may receive a fee for use of the security by the counterparty, which may result in interest income to the Portfolio.
(Q) Delayed Delivery Transactions. The Portfolio may purchase or sell securities on a delayed delivery basis. These transactions involve a commitment by the Portfolio to purchase or sell securities for a predetermined price or yield, with payment and delivery taking place beyond the customary settlement period. When delayed delivery purchases are outstanding, the Portfolio will designate liquid assets in an amount sufficient to meet the purchase price. When purchasing a security on a delayed delivery basis, the Portfolio assumes the rights and risks of ownership of the security, including the risk of price and yield fluctuations, and takes such fluctuations into account when determining its NAV. The Portfolio may dispose of or renegotiate a delayed delivery transaction after it is entered into, and may sell delayed delivery securities before they are delivered, which may result in a realized gain or loss. When the Portfolio has sold a security it owns on a delayed delivery basis, the Portfolio does not participate in future gains and losses with respect to the security.
(R) Treasury Inflation-Protected Securities. The Portfolio invests in Treasury Inflation-Protected Securities (“TIPS”) which are specially structured bonds in which the principal amount is adjusted to keep pace with inflation. The inflation (deflation) adjustment is applied to the principal of each bond on a monthly basis and is accounted for as interest income on the Statement of Operations. TIPS are subject to interest rate risk.
(S) Debt Securities Risk. The ability of issuers of debt securities held by the Portfolio to meet their obligations may be affected by, among other things, economic or political developments in a specific country, industry or region. Debt securities are also subject to the risks associated with changes in interest rates.
The Portfolio primarily invests in high yield debt securities (commonly referred to as “junk bonds”), which are considered speculative because they present a greater risk of loss, including default, than higher rated debt securities. These securities pay investors a premium—a higher interest rate or yield than investment grade debt securities—because of the increased risk of loss. These securities can also be subject to greater price volatility. In times of unusual or adverse market, economic or political conditions, these securities may experience higher than normal default rates.
Investments in the Portfolio are not guaranteed, even though some of the Portfolio’s underlying investments are guaranteed by the U.S. government or its agencies or instrumentalities. The principal risk of mortgage-related and asset-backed securities is that the underlying debt may be prepaid ahead of schedule, if interest rates fall, thereby reducing the value of the Portfolio’s investment. If interest rates rise, less of the debt may be prepaid and the Portfolio may lose money because the Portfolio may be unable to invest in higher yielding assets. The Portfolio is subject to interest-rate risk and can lose principal value when interest rates rise. Bonds are also subject to credit risk, in which the bond issuer may fail to pay interest and principal in a timely manner.
The Portfolio may invest in foreign debt securities, which carry certain risks that are in addition to the usual risks inherent in domestic debt securities. Foreign regulatory regimes and securities markets can have less stringent investor protections and disclosure standards and less liquid trading markets than U.S. regulatory regimes and securities markets, and can experience political, social and economic developments that may affect the value of investments in foreign securities. These risks include those resulting from currency fluctuations, future adverse political or economic developments and possible imposition of currency exchange blockages or other foreign governmental laws or restrictions. Economic sanctions and other similar governmental actions or developments could, among other things, effectively restrict or eliminate the Portfolio's ability to purchase or sell certain foreign securities or groups of foreign securities, and thus may make the Portfolio’s investments in such securities less liquid or more difficult to value. These risks are likely to be greater in emerging markets than in developed markets. The ability of issuers of debt securities held by the Portfolio to meet their obligations may be affected by, among other things, economic or political developments in a specific country, industry or region.
(T) Counterparty Credit Risk. In order to better define its contractual rights and to secure rights that will help the Portfolio mitigate its counterparty risk, the Portfolio may enter into an International Swaps and Derivatives Association, Inc. Master Agreement (“ISDA Master Agreement”) or similar agreement with its counterparties. An ISDA Master Agreement is a bilateral agreement between the Portfolio and a
| 38 | MainStay VP PIMCO Real Return Portfolio |
counterparty that governs certain OTC derivatives and typically contains collateral posting terms and netting provisions. Under an ISDA Master Agreement, the Portfolio may, under certain circumstances, offset with the counterparty certain derivative financial instruments’ payables and/ or receivables with collateral held and/or posted and create one single net payment. The provisions of the ISDA Master Agreement typically permit a single net payment in the event of default including the bankruptcy or insolvency of the counterparty. Bankruptcy or insolvency laws of a particular jurisdiction may restrict or prohibit the right of offset in bankruptcy, insolvency or other events. In addition, certain ISDA Master Agreements may contain provisions for early termination of OTC derivative transactions in the event the net assets of the Portfolio decline below specific levels or if the Portfolio fails to meet the terms of its ISDA Master Agreements. The result would cause the Portfolio to accelerate payment of any net liability owed to the counterparty.
For financial reporting purposes, the Portfolio does not offset derivative assets and derivative liabilities that are subject to netting arrangements, if any, in the Statement of Assets and Liabilities.
(U) Indemnifications. Under the Fund’s organizational documents, its officers and trustees are indemnified against certain liabilities that may arise out of performance of their duties to the Fund. Additionally, in the normal course of business, the Portfolio enters into contracts with third-party service providers that contain a variety of representations and warranties and that may provide general indemnifications. The Portfolio's maximum exposure under these arrangements is unknown, as this would
involve future claims that may be made against the Portfolio that have not yet occurred. The Manager believes that the risk of loss in connection with these potential indemnification obligations is remote. However, there can be no assurance that material liabilities related to such obligations will not arise in the future, which could adversely impact the Portfolio.
(V) Quantitative Disclosure of Derivative Holdings. The following tables show additional disclosures related to the Portfolio's derivative and hedging activities, including how such activities are accounted for and their effect on the Portfolio's financial positions, performance and cash flows.
The Portfolio wrote or purchased options to enhance returns or to hedge an existing position or future investment.
The Portfolio entered into futures contracts to manage its exposure to the securities markets or to movements in interest rates and currency values.
The Portfolio entered into total return swap contracts to seek to enhance returns or reduce the risk of loss by hedging certain of the Portfolio's holdings. These derivatives are not accounted for as hedging instruments.
The Portfolio utilizes interest rate and inflation swap agreements to manage its exposure to interest rate and inflation risk.
The Portfolio entered into foreign currency forward contracts to to hedge the currency exposure associated with some or all of the Portfolio's securities or as a part of an investment strategy.
Fair value of derivative instruments as of December 31, 2023:
| Asset Derivatives | Foreign
Exchange
Contracts
Risk | Interest
Rate
Contracts
Risk | Total |
| Futures Contracts - Net Assets—Net unrealized appreciation on futures contracts (a) | $ — | $2,286,890 | $2,286,890 |
| OTC Swap Contracts - Unrealized appreciation on OTC swap contracts | — | 1,833,495 | 1,833,495 |
| Centrally Cleared Swap Contracts - Net Assets—Net unrealized appreciation on swap contracts (b) | — | 5,585,760 | 5,585,760 |
| Forward Contracts - Unrealized appreciation on foreign currency forward contracts | 13,678 | — | 13,678 |
| Total Fair Value | $13,678 | $9,706,145 | $9,719,823 |
| (a) | Includes cumulative appreciation (depreciation) of futures contracts as reported in the Portfolio of Investments. Only current day’s variation margin is reported within the Statement of Assets and Liabilities. |
| (b) | Includes cumulative appreciation (depreciation) of centrally cleared swap agreements as reported in the Portfolio of Investments. Only the current day’s variation margin is reported within the Statement of Assets and Liabilities. |
Notes to Financial Statements (continued)
| Liability Derivatives | Foreign
Exchange
Contracts
Risk | Interest
Rate
Contracts
Risk | Total |
| Written Options - Investments in written options, at value | $ — | $ (1,502,022) | $ (1,502,022) |
| Futures Contracts - Net Assets—Net unrealized depreciation on futures contracts (a) | — | (4,214,167) | (4,214,167) |
| OTC Swap Contracts - Unrealized depreciation on OTC swap contracts | — | (199,017) | (199,017) |
| Centrally Cleared Swap Contracts - Net Assets—Net unrealized depreciation on swap contracts (b) | — | (4,111,020) | (4,111,020) |
| Forward Contracts - Unrealized depreciation on foreign currency forward contracts | (687,116) | — | (687,116) |
| Total Fair Value | $(687,116) | $(10,026,226) | $(10,713,342) |
| (a) | Includes cumulative appreciation (depreciation) of futures contracts as reported in the Portfolio of Investments. Only current day’s variation margin is reported within the Statement of Assets and Liabilities. |
| (b) | Includes cumulative appreciation (depreciation) of centrally cleared swap agreements as reported in the Portfolio of Investments. Only the current day’s variation margin is reported within the Statement of Assets and Liabilities. |
The effect of derivative instruments on the Statement of Operations for the year ended December 31, 2023:
| Net Realized Gain (Loss) from: | Foreign
Exchange
Contracts
Risk | Credit
Contracts
Risk | Interest
Rate
Contracts
Risk | Total |
| Purchased Option Transactions | $ — | $ — | $ (181,498) | $ (181,498) |
| Written Option Transactions | — | — | 865,773 | 865,773 |
| Futures Transactions | — | — | 2,082,859 | 2,082,859 |
| Swap Transactions | — | 411 | (4,874,708) | (4,874,297) |
| Forward Transactions | (1,173,534) | — | — | (1,173,534) |
| Total Net Realized Gain (Loss) | $(1,173,534) | $411 | $(2,107,574) | $(3,280,697) |
| Net Change in Unrealized Appreciation (Depreciation) | Foreign
Exchange
Contracts
Risk | Credit
Contracts
Risk | Interest
Rate
Contracts
Risk | Total |
| Purchased Options | $ — | $— | $ 218,656 | $ 218,656 |
| Written Options | — | — | (715,399) | (715,399) |
| Futures Contracts | — | — | (3,794,502) | (3,794,502) |
| Swap Contracts | — | 53 | 6,285,925 | 6,285,978 |
| Forward Contracts | 1,119,847 | — | — | 1,119,847 |
| Total Net Change in Unrealized Appreciation (Depreciation) | $1,119,847 | $ 53 | $ 1,994,680 | $ 3,114,580 |
| Average Notional Amount | Total |
| Purchased Swaptions (a) | $ 17,100,000 |
| Written Swaptions | $ (50,332,498) |
| Written Inflation—Capped Options | $ (300,000) |
| Options on Futures Contracts | $ 71,805 |
| Futures Contracts Long | $ 79,516,471 |
| Futures Contracts Short | $(203,739,299) |
| Swap Contracts Long | $ 249,889,185 |
| Forward Contracts Long | $ 8,940,325 |
| Forward Contracts Short | $(102,541,755) |
| (a) | Positions were open for five months during the reporting period. |
(W) Borrowings and other financing transactions summary
| 40 | MainStay VP PIMCO Real Return Portfolio |
The following is a summary by counterparty of the market value of Borrowings and Other Financing Transactions and collateral (received)/pledged as of December 31, 2023:
| Counterparty | Payable for
Sale-Buyback
Transactions | Total
Borrowings and
Other Financing
Transactions | Collateral
(Received)/
Pledged | Net
Exposure (a) |
| Master Securities Forward Transaction Agreement | | | | |
| BNP Paribas S.A. | $(340,529,989) | $(340,529,989) | $340,614,163 | $84,174 |
| Total Borrowings and Other Financing Transactions | $(340,529,989) | $(340,529,989) | $340,614,163 | $84,174 |
| (a) | Net Exposure represents the net receivable/(payable) that would be due from/to the counterparty in the event of default. Exposure from borrowings and other financing transactions can only be netted across transactions governed under the same master agreement with the same legal entity. |
Certain Transfers Accounted for as Secured Borrowings
Remaining Contractual Maturity of the Agreements
| | Overnight and
Continuous | Up to 30 days | 31-90 days | Greater than
90 days | Total |
| Sale-Buyback Transactions | | | | | |
| US Treasury Obligations | $— | $340,529,989 | $— | $— | $340,529,989 |
| Total Borrowings | $— | $340,529,989 | $— | $— | $340,529,989 |
| Payable for sale-buyback financing transactions | | | | $340,529,989 |
Note 3–Fees and Related Party Transactions
(A) Manager and Subadvisor. New York Life Investments, a registered investment adviser and an indirect, wholly-owned subsidiary of New York Life, serves as the Portfolio’s Manager pursuant to an Amended and Restated Management Agreement (“Management Agreement”). The Manager provides offices, conducts clerical, recordkeeping and bookkeeping services, and keeps most of the financial and accounting records required to be maintained by the Portfolio. Except for the portion of salaries and expenses that are the responsibility of the Portfolio, the Manager pays the salaries and expenses of all personnel affiliated with the Portfolio and certain operational expenses of the Portfolio. The Portfolio reimburses New York Life Investments in an amount equal to the portion of the compensation of the Chief Compliance Officer attributable to the Portfolio. Pacific Investment Management Company LLC (“ PIMCO” or the “Subadvisor”), a registered investment adviser, serves as Subadvisor to the Portfolio and is responsible for the day-to-day portfolio management of the Portfolio. Pursuant to the terms of a Subadvisory Agreement between New York Life Investments and PIMCO, New York Life Investments pays for the services of the Subadvisor.
Pursuant to the Management Agreement, the Fund pays the Manager, on behalf of the Portfolio, a monthly fee for the services performed and the facilities furnished at an annual percentage of the Portfolio’s average daily net assets of 0.50% on all assets.
New York Life Investments has contractually agreed to waive fees and/or reimburse expenses so that the Total Annual Portfolio Operating Expenses (excluding taxes, interest, litigation, extraordinary expenses, brokerage and other transaction expenses relating to the purchase or sale of
portfolio investments, and acquired (underlying) portfolio/fund fees and expenses) of Initial Class shares and Service Class shares do not exceed 0.53% and 0.78%, respectively, of the Portfolio's average daily net assets. This agreement will remain in effect until May 1, 2024, and shall renew automatically for one-year terms unless New York Life Investments provides written notice of termination prior to the start of the next term or upon approval of the Board.
During the year ended December 31, 2023, New York Life Investments earned fees from the Portfolio in the amount of $2,448,592 and waived fees and/or reimbursed expenses in the amount of $299,482 and paid the Subadvisor fees in the amount of $1,224,296.
JPMorgan provides sub-administration and sub-accounting services to the Portfolio pursuant to an agreement with New York Life Investments. These services include calculating the daily NAVs of the Portfolio, maintaining the general ledger and sub-ledger accounts for the calculation of the Portfolio's NAVs, and assisting New York Life Investments in conducting various aspects of the Portfolio's administrative operations. For providing these services to the Portfolio, JPMorgan is compensated by New York Life Investments.
Pursuant to an agreement between the Fund and New York Life Investments, New York Life Investments is responsible for providing or procuring certain regulatory reporting services for the Portfolio. The Portfolio will reimburse New York Life Investments for the actual costs incurred by New York Life Investments in connection with providing or procuring these services for the Portfolio.
Notes to Financial Statements (continued)
(B) Distribution and Service Fees. The Fund, on behalf of the Portfolio, has entered into a distribution agreement with NYLIFE Distributors LLC (the “Distributor”), an affiliate of New York Life Investments. The Portfolio has adopted a distribution plan (the “Plan”) in accordance with the provisions of Rule 12b-1 under the 1940 Act. Under the Plan, the Distributor has agreed to provide, through its affiliates or independent third parties, various distribution-related, shareholder and administrative support services to the Service Class shareholders. For its services, the Distributor is entitled to a combined distribution and service fee accrued daily and paid monthly at an annual rate of 0.25% of the average daily net assets attributable to the Service Class shares of the Portfolio.
Note 4-Federal Income Tax
As of December 31, 2023, the cost and unrealized appreciation (depreciation) of the Portfolio’s investment portfolio, including applicable derivative contracts and other financial instruments, as determined on a federal income tax basis, were as follows:
| | Federal Tax
Cost | Gross
Unrealized
Appreciation | Gross
Unrealized
(Depreciation) | Net
Unrealized
Appreciation/
(Depreciation) |
| Investments in Securities | $933,861,523 | $1,347,274 | $(131,350,182) | $(130,002,908) |
As of December 31, 2023, the components of accumulated gain (loss) on a tax basis were as follows:
Ordinary
Income | Accumulated
Capital
and Other
Gain (Loss) | Other
Temporary
Differences | Unrealized
Appreciation
(Depreciation) | Total
Accumulated
Gain (Loss) |
| $14,949,766 | $(4,526,010) | $(1) | $(129,280,898) | $(118,857,143) |
The difference between book-basis and tax-basis unrealized appreciation (depreciation) is primarily due to wash sale adjustments, cumulative bond amortization adjustment, cumulative mark to market of swaps, mark to market of forwards contract, mark to market of futures contracts and straddle loss deferral.
As of December 31, 2023, for federal income tax purposes, capital loss carryforwards of $4,213,764, as shown in the table below, were available to the extent provided by the regulations to offset future realized gains of the Portfolio. Accordingly, no capital gains distributions are expected to be paid to shareholders until net gains have been realized in excess of such amounts.
Capital Loss
Available Through | Short-Term
Capital Loss
Amounts (000’s) | Long-Term
Capital Loss
Amounts (000’s) |
| Unlimited | $— | $4,214 |
During the years ended December 31, 2023 and December 31, 2022, the tax character of distributions paid as reflected in the Statements of Changes in Net Assets was as follows:
| | 2023 | 2022 |
| Distributions paid from: | | |
| Ordinary Income | $40,994,047 | $29,258,760 |
Note 5–Custodian
JPMorgan is the custodian of cash and securities held by the Portfolio. Custodial fees are charged to the Portfolio based on the Portfolio's net assets and/or the market value of securities held by the Portfolio and the number of certain transactions incurred by the Portfolio.
Note 6–Line of Credit
The Portfolio and certain other funds managed by New York Life Investments maintain a line of credit with a syndicate of banks in order to secure a source of funds for temporary purposes to meet unanticipated or excessive redemption requests.
Effective July 25, 2023, under the credit agreement (the “Credit Agreement”), the aggregate commitment amount is $600,000,000 with an additional uncommitted amount of $100,000,000. The commitment fee is an annual rate of 0.15% of the average commitment amount payable quarterly, regardless of usage, to JPMorgan, who serves as the agent to the syndicate. The commitment fee is allocated among the Portfolio and certain other funds managed by New York Life Investments based upon their respective net assets and other factors. Interest on any revolving credit loan is charged based upon the Federal Funds Rate, Daily SOFR + 0.10%, or the Overnight Bank Funding Rate, whichever is higher. The Credit Agreement expires on July 23, 2024, although the Portfolio, certain other funds managed by New York Life Investments and the syndicate of banks may renew the Credit Agreement for an additional year on the same or different terms or enter into a credit agreement with a different syndicate of banks. Prior to July 25, 2023, the aggregate commitment amount and the commitment fee were the same as those under the current Credit Agreement. During the year ended December 31, 2023, there were no borrowings made or outstanding with respect to the Portfolio under the Credit Agreement.
Note 7–Interfund Lending Program
Pursuant to an exemptive order issued by the SEC, the Portfolio, along with certain other funds managed by New York Life Investments, may participate in an interfund lending program. The interfund lending program provides an alternative credit facility that permits the Portfolio and certain other funds managed by New York Life Investments to lend or borrow money for temporary purposes directly to or from one another, subject to the conditions of the exemptive order. During the year ended December 31, 2023, there were no interfund loans made or outstanding with respect to the Portfolio.
| 42 | MainStay VP PIMCO Real Return Portfolio |
Note 8–Purchases and Sales of Securities (in 000’s)
During the year ended December 31, 2023, purchases and sales of U.S. government securities were $89,673 and $87,455, respectively. Purchases and sales of securities, other than U.S. government securities and short-term securities, were $325,096 and $316,314, respectively.
Note 9–Capital Share Transactions
Transactions in capital shares for the years ended December 31, 2023 and December 31, 2022, were as follows:
| Initial Class | Shares | Amount |
| Year ended December 31, 2023: | | |
| Shares sold | 2,958,161 | $ 24,393,797 |
| Shares issued to shareholders in reinvestment of distributions | 1,535,125 | 11,335,518 |
| Shares redeemed | (1,758,214) | (14,244,076) |
| Net increase (decrease) | 2,735,072 | $ 21,485,239 |
| Year ended December 31, 2022: | | |
| Shares sold | 6,286,978 | $ 56,587,286 |
| Shares issued to shareholders in reinvestment of distributions | 806,908 | 6,510,777 |
| Shares redeemed | (6,598,491) | (62,522,654) |
| Net increase (decrease) | 495,395 | $ 575,409 |
| |
| Service Class | Shares | Amount |
| Year ended December 31, 2023: | | |
| Shares sold | 3,518,842 | $ 28,729,074 |
| Shares issued to shareholders in reinvestment of distributions | 4,025,863 | 29,658,529 |
| Shares redeemed | (8,539,375) | (68,809,993) |
| Net increase (decrease) | (994,670) | $(10,422,390) |
| Year ended December 31, 2022: | | |
| Shares sold | 5,046,128 | $ 45,996,121 |
| Shares issued to shareholders in reinvestment of distributions | 2,826,082 | 22,747,983 |
| Shares redeemed | (7,970,053) | (73,238,043) |
| Net increase (decrease) | (97,843) | $ (4,493,939) |
Note 10–Other Matters
As of the date of this report, the Portfolio faces a heightened level of risk associated with current uncertainty, volatility and state of economies, financial markets, rising interest rates, and labor and health conditions around the world. Events such as war, acts of terrorism, recessions, rapid inflation, the imposition of international sanctions, earthquakes, hurricanes, epidemics and pandemics and other unforeseen natural or human disasters may have broad adverse social, political and economic effects on the global economy, which could negatively impact the value of the Portfolio's investments. Developments that disrupt global economies and financial markets may magnify factors that affect the Portfolio's performance.
Note 11–Subsequent Events
In connection with the preparation of the financial statements of the Portfolio as of and for the year ended December 31, 2023, events and transactions subsequent to December 31, 2023, through the date the financial statements were issued, have been evaluated by the Manager for possible adjustment and/or disclosure. No subsequent events requiring financial statement adjustment or disclosure have been identified.
Report of Independent Registered Public Accounting Firm
To the Board of Trustees of MainStay VP Funds Trust and Shareholders of MainStay VP PIMCO Real Return Portfolio.
Opinion on the Financial Statements
We have audited the accompanying statement of assets and liabilities, including the portfolio of investments, of MainStay VP PIMCO Real Return Portfolio (one of the portfolios constituting MainStay VP Funds Trust, referred to hereafter as the “Portfolio”) as of December 31, 2023, the related statements of operations and cash flows for the year ended December 31, 2023, the statements of changes in net assets for each of the two years in the period ended December 31, 2023, including the related notes, and the financial highlights for each of the five years in the period ended December 31, 2023 (collectively referred to as the “financial statements”). In our opinion, the financial statements present fairly, in all material respects, the financial position of the Portfolio as of December 31, 2023, the results of its operations and its cash flows for the year then ended, the changes in its net assets for each of the two years in the period ended December 31, 2023 and the financial highlights for each of the five years in the period ended December 31, 2023 in conformity with accounting principles generally accepted in the United States of America.
Basis for Opinion
These financial statements are the responsibility of the Portfolio’s management. Our responsibility is to express an opinion on the Portfolio’s financial statements based on our audits. We are a public accounting firm registered with the Public Company Accounting Oversight Board (United States) (PCAOB) and are required to be independent with respect to the Portfolio in accordance with the U.S. federal securities laws and the applicable rules and regulations of the Securities and Exchange Commission and the PCAOB.
We conducted our audits of these financial statements in accordance with the standards of the PCAOB. Those standards require that we plan and perform the audit to obtain reasonable assurance about whether the financial statements are free of material misstatement, whether due to error or fraud.
Our audits included performing procedures to assess the risks of material misstatement of the financial statements, whether due to error or fraud, and performing procedures that respond to those risks. Such procedures included examining, on a test basis, evidence regarding the amounts and disclosures in the financial statements. Our audits also included evaluating the accounting principles used and significant estimates made by management, as well as evaluating the overall presentation of the financial statements. Our procedures included confirmation of securities owned as of December 31, 2023 by correspondence with the custodian, transfer agent and brokers; when replies were not received from brokers, we performed other auditing procedures. We believe that our audits provide a reasonable basis for our opinion.
/s/PricewaterhouseCoopers LLP
New York, New York
February 26, 2024
We have served as the auditor of one or more investment companies in the MainStay group of funds since 1984.
| 44 | MainStay VP PIMCO Real Return Portfolio |
Board Consideration and Approval of Management Agreement and Subadvisory Agreement (Unaudited)
The continuation of the Management Agreement with respect to the MainStay VP PIMCO Real Return Portfolio (“Portfolio”) and New York Life Investment Management LLC (“New York Life Investments”) and the Subadvisory Agreement between New York Life Investments and Pacific Investment Management Company LLC (“PIMCO”) with respect to the Portfolio (together, “Advisory Agreements”) is subject to annual review and approval by the Board of Trustees of MainStay VP Funds Trust (“Board” of the “Trust”) in accordance with Section 15 of the Investment Company Act of 1940, as amended (“1940 Act”). At its December 6–7, 2023 meeting, the Board, including the Trustees who are not an “interested person” (as such term is defined in the 1940 Act) of the Trust (“Independent Trustees”) voting separately, unanimously approved the continuation of each of the Advisory Agreements for a one-year period.
In reaching the decision to approve the continuation of each of the Advisory Agreements, the Board considered information and materials furnished by New York Life Investments and PIMCO in connection with an annual contract review process undertaken by the Board that took place at meetings of the Board and its Contracts Committee from September 2023 through December 2023, including information and materials furnished by New York Life Investments and PIMCO in response to requests prepared on behalf of the Board, and in consultation with the Independent Trustees, by independent legal counsel to the Independent Trustees, which encompassed a variety of topics, including those summarized below. Information and materials requested by and furnished to the Board for consideration in connection with the contract review process included, among other items, reports on the Portfolio and “peer funds” prepared by Institutional Shareholder Services Inc. (“ISS”), an independent third-party service provider engaged by the Board to report objectively on the Portfolio’s investment performance, management fee and total expenses. The Board also considered information on the fees charged to other investment advisory clients of New York Life Investments and/or PIMCO that follow investment strategies similar to those of the Portfolio, if any, and, when applicable, the rationale for differences in the Portfolio’s management and subadvisory fees and the fees charged to those other investment advisory clients. In addition, the Board considered information regarding the legal standards and fiduciary obligations applicable to its consideration of the continuation of each of the Advisory Agreements. The contract review process, including the structure and format for information and materials provided to the Board, has been developed in consultation with the Board. The Independent Trustees also met in executive sessions with their independent legal counsel and, for portions thereof, with senior management of New York Life Investments.
The Board’s deliberations with respect to the continuation of each of the Advisory Agreements reflect a year-long process, and the Board also took into account information furnished to the Board and its Committees throughout the year, as deemed relevant and appropriate by the Trustees, including, among other items, reports on investment performance of the Portfolio and investment-related matters for the Portfolio as well as presentations from New York Life Investments and, generally annually, PIMCO personnel. In addition, the Board took into account other
information provided by New York Life Investments throughout the year, including, among other items, periodic reports on legal and compliance matters, risk management, portfolio turnover, brokerage commissions and non-advisory services provided to the Portfolio by New York Life Investments, as deemed relevant and appropriate by the Trustees.
In addition to information provided to the Board throughout the year, the Board received information in connection with its June 2023 meeting provided specifically in response to requests prepared on behalf of the Board, and in consultation with the Independent Trustees, by independent legal counsel to the Independent Trustees regarding the Portfolio’s distribution arrangements. In addition, the Board received information regarding the Portfolio’s asset levels, share purchase and redemption activity and the payment of Rule 12b-1 and/or certain other fees by the applicable share classes of the Portfolio, among other information.
In considering the continuation of each of the Advisory Agreements, the Trustees reviewed and evaluated the information and factors they believed to reasonably be necessary and appropriate in light of legal advice furnished to them by independent legal counsel to the Independent Trustees and through the exercise of their own business judgment. Although individual Trustees may have weighed certain factors or information differently and the Board did not consider any single factor or information controlling in reaching its decision, the factors that figured prominently in the Board’s consideration of the continuation of each of the Advisory Agreements are summarized in more detail below and include, among other factors: (i) the nature, extent and quality of the services provided to the Portfolio by New York Life Investments and PIMCO; (ii) the qualifications of the portfolio managers of the Portfolio and the historical investment performance of the Portfolio, New York Life Investments and PIMCO; (iii) the costs of the services provided, and profits realized, by New York Life Investments and PIMCO with respect to their relationships with the Portfolio; (iv) the extent to which economies of scale have been realized or may be realized if the Portfolio grows and the extent to which any economies of scale have been shared, have benefited or may benefit the Portfolio’s shareholders; and (v) the reasonableness of the Portfolio’s management and subadvisory fees and total ordinary operating expenses. Although the Board recognized that comparisons between the Portfolio’s fees and expenses and those of other funds are imprecise given different terms of agreements, variations in fund strategies and other factors, the Board considered the reasonableness of the Portfolio’s management fee and total ordinary operating expenses as compared to the peer funds identified by ISS. Throughout their considerations, the Trustees acknowledged the commitment of New York Life Investments and its affiliates to serve the MainStay Group of Funds, as well as their capacity, experience, resources, financial stability and reputations. The Trustees also acknowledged the entrepreneurial and other risks assumed by New York Life Investments in sponsoring and managing the Portfolio. With respect to the Subadvisory Agreement, the Board took into account New York Life Investments’ recommendation to approve the continuation of the Subadvisory Agreement.
Board Consideration and Approval of Management Agreement and Subadvisory Agreement (Unaudited) (continued)
The Trustees noted that, throughout the year, the Trustees are afforded an opportunity to ask questions of, and request additional information or materials from, New York Life Investments and PIMCO. The Board’s decision with respect to each of the Advisory Agreements may have also been based, in part, on the Board’s knowledge of New York Life Investments and PIMCO resulting from, among other things, the Board’s consideration of each of the Advisory Agreements in prior years, the advisory agreements for other funds in the MainStay Group of Funds, the Board’s review throughout the year of the performance and operations of other funds in the MainStay Group of Funds and each Trustee’s business judgment and industry experience. In addition to considering the above-referenced factors, the Board observed that in the marketplace, notably under variable life insurance policies and variable annuity contracts for which the Portfolio serves as an investment option, there are a range of investment options available to investors and that the Portfolio’s shareholders, having had the opportunity to consider other investment options, have invested in the Portfolio.
The factors that figured prominently in the Board’s decision to approve the continuation of each of the Advisory Agreements during the Board’s December 6–7, 2023 meeting are summarized in more detail below.
Nature, Extent and Quality of Services Provided by New York Life Investments and PIMCO
The Board examined the nature, extent and quality of the services that New York Life Investments provides to the Portfolio. The Board evaluated New York Life Investments’ experience and capabilities in serving as manager of the Portfolio and considered that the Portfolio operates in a “manager-of-managers” structure. The Board also considered New York Life Investments’ responsibilities and services provided pursuant to this structure, including overseeing the services provided by PIMCO, evaluating the performance of PIMCO, making recommendations to the Board as to whether the Subadvisory Agreement should be renewed, modified or terminated and periodically reporting to the Board regarding the results of New York Life Investments’ evaluation and monitoring functions. The Board noted that New York Life Investments manages other mutual funds, serves a variety of other investment advisory clients, including other pooled investment vehicles, and has experience overseeing mutual fund service providers, including subadvisors. The Board considered the experience of senior personnel at New York Life Investments providing management and administrative and other non-advisory services to the Portfolio. The Board observed that New York Life Investments devotes significant resources and time to providing management and administrative and other non-advisory services to the Portfolio, including New York Life Investments’ oversight and due diligence reviews of PIMCO and ongoing analysis of, and interactions with, PIMCO with respect to, among other things, the Portfolio’s investment performance and risks as well as PIMCO’s investment capabilities and subadvisory services with respect to the Portfolio.
The Board also considered the range of services that New York Life Investments provides to the Portfolio under the terms of the Management Agreement, including: (i) fund accounting and ongoing supervisory
services provided by New York Life Investments’ Fund Administration and Accounting Group; (ii) investment supervisory and analytical services provided by New York Life Investments’ Investment Consulting Group; (iii) compliance services provided by the Trust’s Chief Compliance Officer as well as New York Life Investments’ compliance department, including supervision and implementation of the Portfolio’s compliance program; (iv) legal services provided by New York Life Investments’ Office of the General Counsel; and (v) risk management monitoring and analysis by compliance and investment personnel. In addition, the Board considered New York Life Investments’ willingness to invest in personnel and other resources, such as cyber security, information security and business continuity planning, that may benefit the Portfolio and noted that New York Life Investments is responsible for compensating the Trust’s officers, except for a portion of the salary of the Trust’s Chief Compliance Officer. The Board recognized that New York Life Investments provides certain other non-advisory services to the Portfolio and has over time provided an increasingly broad array of non-advisory services to the MainStay Group of Funds as a result of regulatory and other developments.
The Board also examined the range, and the nature, extent and quality, of the investment advisory services that PIMCO provides to the Portfolio and considered the terms of each of the Advisory Agreements. The Board evaluated PIMCO’s experience and performance in serving as subadvisor to the Portfolio and advising other portfolios and PIMCO’s track record and experience in providing investment advisory services as well as the experience of investment advisory, senior management and administrative personnel at PIMCO. The Board considered New York Life Investments’ and PIMCO’s overall resources, legal and compliance environment, capabilities, reputation, financial condition and history. In addition to information provided in connection with quarterly meetings with the Trust’s Chief Compliance Officer, the Board considered information regarding the compliance policies and procedures of New York Life Investments and PIMCO and acknowledged their commitment to further developing and strengthening compliance programs that may relate to the Portfolio. The Board also considered PIMCO’s ability to recruit and retain qualified investment professionals and willingness to invest in personnel and other resources that may benefit the Portfolio. In this regard, the Board considered the qualifications and experience of the Portfolio’s portfolio managers, the number of accounts managed by the portfolio managers and the method for compensating the portfolio managers.
In addition, the Board considered information provided by New York Life Investments and PIMCO regarding their respective business continuity and disaster recovery plans.
Based on these considerations, among others, the Board concluded that the Portfolio would likely continue to benefit from the nature, extent and quality of these services.
Investment Performance
In evaluating the Portfolio’s investment performance, the Board considered investment performance results over various periods in light of the Portfolio’s investment objective, strategies and risks. The Board
| 46 | MainStay VP PIMCO Real Return Portfolio |
considered investment reports on, and analysis of, the Portfolio’s performance provided to the Board throughout the year. These reports include, among other items, information on the Portfolio’s gross and net returns, the Portfolio’s investment performance compared to a relevant investment category and the Portfolio’s benchmarks, the Portfolio’s risk-adjusted investment performance and the Portfolio’s investment performance as compared to peer funds, as appropriate, as well as portfolio attribution information and commentary on the effect of market conditions. The Board also considered information provided by ISS showing the investment performance of the Portfolio as compared to peer funds. In addition, the Board reviewed the methodology used by ISS to construct the group of peer funds for comparative purposes.
The Board also took into account its discussions with senior management at New York Life Investments concerning the Portfolio’s investment performance over various periods as well as discussions between representatives of PIMCO and the members of the Board’s Investment Committee, which generally occur on an annual basis.
Based on these considerations, among others, the Board concluded that its review of the Portfolio’s investment performance and related information supported a determination to approve the continuation of each of the Advisory Agreements.
Costs of the Services Provided, and Profits and Other Benefits Realized, by New York Life Investments and PIMCO
The Board considered the costs of the services provided under each of the Advisory Agreements. The Board also considered the profitability of New York Life Investments and its affiliates and PIMCO due to their relationships with the Portfolio as well as by New York Life Investments and its affiliates due to their relationships with the MainStay Group of Funds. With respect to the profitability of PIMCO’s relationship with the Portfolio, the Board considered information from New York Life Investments that PIMCO’s subadvisory fee reflected an arm’s-length negotiation and that this fee is paid by New York Life Investments, not the Portfolio, and the relevance of PIMCO’s profitability was considered by the Trustees in that context. On this basis, the Board primarily considered the costs and profitability for New York Life Investments and its affiliates with respect to the Portfolio.
In addition, the Board acknowledged the difficulty in obtaining reliable comparative data about mutual fund managers’ profitability because such information generally is not publicly available and may be impacted by numerous factors, including the structure of a fund manager’s organization, the types of funds it manages, the methodology used to allocate certain fixed costs to specific funds and the manager’s capital structure and costs of capital.
In evaluating the costs of the services provided by New York Life Investments and PIMCO, and profitability of New York Life Investments and its affiliates and PIMCO due to their relationships with the Portfolio, the Board considered, among other factors, New York Life Investments’ and its affiliates’ and PIMCO’s continuing investments in, or willingness to invest in, personnel and other resources that may support and further
enhance the management of the Portfolio, and that New York Life Investments is responsible for paying the subadvisory fee for the Portfolio. The Board also considered the financial resources of New York Life Investments and PIMCO and acknowledged that New York Life Investments and PIMCO must be in a position to recruit and retain experienced professional personnel and to maintain a strong financial position for New York Life Investments and PIMCO to continue to provide high-quality services to the Portfolio. The Board recognized that the Portfolio benefits from the allocation of certain fixed costs among the funds in the MainStay Group of Funds, among other expected benefits resulting from its relationship with New York Life Investments.
The Board considered information regarding New York Life Investments’ methodology for calculating profitability and allocating costs provided by New York Life Investments in connection with the fund profitability analysis presented to the Board. The Board concluded that New York Life Investments’ methods for allocating costs and procedures for estimating overall profitability of the relationship with the funds in the MainStay Group of Funds were reasonable. The Board recognized the difficulty in calculating and evaluating a manager’s profitability with respect to the Portfolio and considered that other profitability methodologies may also be reasonable.
The Board also considered certain fall-out benefits that may be realized by New York Life Investments and its affiliates and PIMCO and its affiliates due to their relationships with the Portfolio, including reputational and other indirect benefits. In this regard, the Board also requested and considered information from New York Life Investments concerning other material business relationships between PIMCO and its affiliates and New York Life Investments and its affiliates that relates to certain current and future products and represents a potential conflict of interest associated with New York Life Investments’ recommendation to approve the Subadvisory Agreement. In addition, the Board considered its review of the management agreement for a money market fund advised by New York Life Investments and an affiliated subadvisor that serves as an investment option for the Portfolio, including the potential rationale for and costs associated with investments in this money market fund by the Portfolio, if any, and considered information from New York Life Investments that the nature and type of specific investment advisory services provided to this money market fund are distinct from, or in addition to, the investment advisory services provided to the Portfolio. In addition, the Board considered the potential dividend received tax deduction for insurance company affiliates of New York Life Investments from the Portfolio’s securities lending activity.
The Board noted that the Portfolio serves as an investment option primarily under variable contracts issued by affiliates of New York Life Investments that would receive fees under those contracts. The Board observed that, in addition to fees earned by New York Life Investments under the Management Agreement for managing the Portfolio, New York Life Investments’ affiliates also earn revenues from serving the Portfolio in various other capacities, including as the Portfolio’s distributor, and insurance companies affiliated with New York Life Investments would be entitled to receive fees from the Portfolio under a distribution and service
Board Consideration and Approval of Management Agreement and Subadvisory Agreement (Unaudited) (continued)
plan adopted pursuant to Rule 12b-1 under the 1940 Act. The Board considered information about these other revenues and their impact on the profitability of the relationship with the Portfolio to New York Life Investments and its affiliates. The Board noted that, although it assessed the overall profitability of the relationship with the Portfolio to New York Life Investments and its affiliates as part of the contract review process, when considering the reasonableness of the fee paid to New York Life Investments under the Management Agreement, the Board considered the profitability of New York Life Investments’ relationship with the Portfolio on a pre-tax basis and without regard to distribution expenses incurred by New York Life Investments from its own resources.
After evaluating the information deemed relevant by the Trustees, the Board concluded that any profits realized by New York Life Investments and its affiliates due to their relationships with the Portfolio were not excessive, other expected benefits that may accrue to New York Life Investments and its affiliates are reasonable and other expected benefits that may accrue to PIMCO and its affiliates are consistent with those expected for a subadvisor to a mutual fund. With respect to PIMCO, the Board considered that any profits realized by PIMCO due to its relationship with the Portfolio are the result of arm’s-length negotiations between New York Life Investments and PIMCO, acknowledging that any such profits are based on the subadvisory fee paid to PIMCO by New York Life Investments, not the Portfolio.
Management and Subadvisory Fees and Total Ordinary Operating Expenses
The Board evaluated the reasonableness of the fee paid under each of the Advisory Agreements and the Portfolio’s total ordinary operating expenses. With respect to the management fee and subadvisory fee, the Board primarily considered the reasonableness of the management fee paid by the Portfolio to New York Life Investments because the subadvisory fee paid to PIMCO is paid by New York Life Investments, not the Portfolio. The Board also considered the reasonableness of the subadvisory fee paid by New York Life Investments and the amount of the management fee retained by New York Life Investments.
In assessing the reasonableness of the Portfolio’s fees and expenses, the Board primarily considered comparative data provided by ISS on the fees and expenses of similar mutual funds managed by other investment advisers. The Board reviewed the methodology used by ISS to construct the group of peer funds for comparative purposes. In addition, the Board considered information provided by New York Life Investments and PIMCO on fees charged to other investment advisory clients, including institutional separate accounts and/or other funds, that follow investment strategies similar to those of the Portfolio, if any. The Board considered the contractual management fee schedule for the Portfolio as compared to those for such other investment advisory clients, taking into account the rationale for differences in fee schedules. The Board also took into account information provided by New York Life Investments about the more extensive scope of services provided to registered investment companies, such as the Portfolio, as compared with other investment advisory clients. Additionally, the Board considered the impact of
voluntary waivers and expense limitation arrangements on the Portfolio’s net management fee and expenses. The Board also considered that in proposing fees for the Portfolio, New York Life Investments considers the competitive marketplace for mutual funds.
Based on the factors outlined above, among other considerations, the Board concluded that the Portfolio’s management fee and total ordinary operating expenses are within a range that is competitive and support a conclusion that these fees and expenses are reasonable.
Economies of Scale
The Board considered information regarding economies of scale, including whether economies of scale may exist with respect to the Portfolio and whether the Portfolio’s management fee and expense structure permits any economies of scale to be appropriately shared with the Portfolio’s shareholders. The Board also considered a report from New York Life Investments, previously prepared at the request of the Board, that addressed economies of scale, including with respect to the mutual fund business generally, and the various ways in which the benefits of economies of scale may be shared with the funds in the MainStay Group of Funds. Although the Board recognized the difficulty of determining economies of scale with precision, the Board acknowledged that economies of scale may be shared with the Portfolio in a number of ways, including, for example, through the imposition of fee breakpoints, initially setting management fee rates at scale or making additional investments to enhance the services provided to the Portfolio. The Board reviewed information from New York Life Investments showing how the Portfolio’s management fee schedule compared to fee schedules of other funds and accounts managed by New York Life Investments. The Board also reviewed information from ISS showing how the Portfolio’s management fee schedule compared with fees paid for similar services by peer funds at varying asset levels.
Based on this information, the Board concluded that economies of scale are appropriately shared for the benefit of the Portfolio’s shareholders through the Portfolio’s management fee and expense structure and other methods to share benefits from economies of scale.
Conclusion
On the basis of the information and factors summarized above, among other information and factors deemed relevant by the Trustees, and the evaluation thereof, the Board, including the Independent Trustees voting separately, unanimously voted to approve the continuation of each of the Advisory Agreements.
| 48 | MainStay VP PIMCO Real Return Portfolio |
Proxy Voting Policies and Procedures and Proxy Voting Record
The Portfolio is required to file with the SEC its proxy voting record for the 12-month period ending June 30 on Form N-PX. A description of the policies and procedures that are used to vote proxies relating to portfolio securities of the Portfolio is available free of charge upon request by calling 800-598-2019 or visiting the SEC's website at www.sec.gov. The most recent Form N-PX or proxy voting record is available free of charge upon request by calling 800-598-2019; visiting https://www.newyorklifeinvestments.com/investment-products/vp; or visiting the SEC’s website at www.sec.gov.
Shareholder Reports and Quarterly Portfolio Disclosure
The Portfolio is required to file its complete schedule of portfolio holdings with the SEC 60 days after its first and third fiscal quarter on Form N-PORT. The Portfolio's holdings report is available free of charge upon request by calling 800-598-2019 or by visiting the SEC’s website at www.sec.gov.
Board of Trustees and Officers (Unaudited)
The Trustees and officers of the Portfolio are listed below. The Board oversees the MainStay Group of Funds (which consists of MainStay Funds and MainStay Funds Trust), MainStay VP Funds Trust, MainStay MacKay DefinedTerm Municipal Opportunities Fund, MainStay CBRE Global Infrastructure Megatrends Term Fund, the Manager and the Subadvisors, and elects the officers of the Portfolios who are responsible for the day-to-day operations of the Portfolio. Information pertaining to the Trustees and officers is set forth below. Each Trustee serves until his or her successor is elected and qualified or until his or her resignation,
death or removal. Under the Board’s retirement policy, unless an exception is made, a Trustee must tender his or her resignation by the end of the calendar year during which he or she reaches the age of 75. Officers are elected annually by the Board. The business address of each Trustee and officer listed below is 51 Madison Avenue, New York, New York 10010. A majority of the Trustees are not “interested persons” (as defined by the 1940 Act and rules adopted by the SEC thereunder) of the Portfolio (“Independent Trustees”).
| | Name and
Year of Birth | Term of Office,
Position(s) Held and
Length of Service | Principal Occupation(s)
During Past Five Years | Number of
Portfolios in
Fund Complex
Overseen by
Trustee | Other Directorships
Held by Trustee |
| | | | | | |
| | Naïm Abou-Jaoudé*
1966 | MainStay VP Funds Trust: Trustee since 2023 | Chief Executive Officer of New York Life Investment Management LLC (since 2023). Chief Executive Officer of Candriam (an affiliate of New York Life Investment Management LLC) (2007 to 2023). | 81 | MainStay Funds: Trustee since 2023 (11 Funds)
MainStay Funds Trust: Trustee since 2023 (37 Funds);
MainStay MacKay DefinedTerm Municipal Opportunities Fund: Trustee since 2023;
MainStay CBRE Global Infrastructure Megatrends Term Fund: Trustee since 2023; and
New York Life Investment Management International (Chair) since 2015 |
| * | This Trustee is considered to be an “interested person” of the MainStay Group of Funds, MainStay VP Funds Trust, MainStay CBRE Global Infrastructure Megatrends Term Fund and MainStay MacKay DefinedTerm Municipal Opportunities Fund, within the meaning of the 1940 Act because of his affiliation with New York Life Investment Management LLC and Candriam, as described in detail above in the column entitled “Principal Occupation(s) During Past Five Years.” |
| | |
| 50 | MainStay VP PIMCO Real Return Portfolio |
| | Name and
Year of Birth | Term of Office,
Position(s) Held and
Length of Service | Principal Occupation(s)
During Past Five Years | Number of
Portfolios in
Fund Complex
Overseen by
Trustee | Other Directorships
Held by Trustee |
| | | | | | |
| | David H. Chow
1957 | MainStay VP Funds Trust: Trustee since January 2016, Advisory Board Member (June 2015 to December 2015) | Founder and CEO, DanCourt Management, LLC since 1999 | 81 | MainStay Funds: Trustee since January 2016, Advisory Board Member (June 2015 to December 2015) (11 Funds);
MainStay Funds Trust: Trustee since January 2016, Advisory Board Member (June 2015 to December 2015) (37 Funds);
MainStay MacKay DefinedTerm Municipal Opportunities Fund: Trustee since January 2016, Advisory Board Member (June 2015 to December 2015);
MainStay CBRE Global Infrastructure Megatrends Term Fund: Trustee since 2021;
VanEck Vectors Group of Exchange-Traded Funds: Trustee since 2006 and Independent Chairman of the Board of Trustees from 2008 to 2022 (57 portfolios); and
Berea College of Kentucky: Trustee since 2009, Chair of the Investment Committee since 2018 |
| | Karen Hammond
1956 | MainStay VP Funds Trust: Trustee since December 2021, Advisory Board Member (June 2021 to December 2021)
| Retired, Managing Director, Devonshire Investors (2007 to 2013); Senior Vice President, Fidelity Management & Research Co. (2005 to 2007); Senior Vice President and Corporate Treasurer, FMR Corp. (2003 to 2005); Chief Operating Officer, Fidelity Investments Japan (2001 to 2003) | 81 | MainStay Funds: Trustee since December 2021, Advisory Board Member (June 2021 to December 2021) (11 Funds);
MainStay Funds Trust: Trustee since December 2021, Advisory Board Member (June 2021 to December 2021) (37 Funds);
MainStay MacKay DefinedTerm Municipal Opportunities Fund: Trustee since December 2021, Advisory Board Member (June 2021 to December 2021);
MainStay CBRE Global Infrastructure Megatrends Term Fund: Trustee since December 2021, Advisory Board Member (June 2021 to December 2021);
Two Harbors Investment Corp.: Director since 2018;
Rhode Island State Investment Commission: Member since 2017; and
Blue Cross Blue Shield of Rhode Island: Director since 2019 |
| | Susan B. Kerley
1951 | MainStay VP Funds Trust: Chair since 2017 and Trustee since 2007** | President, Strategic Management Advisors LLC since 1990 | 81 | MainStay Funds: Chair since January 2017 and Trustee since 2007 (11 Funds); MainStay Funds Trust: Chair since January 2017 and Trustee since 1990 (37 Funds)***;
MainStay MacKay DefinedTerm Municipal Opportunities Fund: Chair since January 2017 and Trustee since 2011;
MainStay CBRE Global Infrastructure Megatrends Term Fund: Trustee since June 2021; and
Legg Mason Partners Funds: Trustee since 1991 (45 portfolios) |
Board of Trustees and Officers (Unaudited) (continued)
| | Name and
Year of Birth | Term of Office,
Position(s) Held and
Length of Service | Principal Occupation(s)
During Past Five Years | Number of
Portfolios in
Fund Complex
Overseen by
Trustee | Other Directorships
Held by Trustee |
| | | | | | |
| | Alan R. Latshaw
1951 | MainStay VP Funds Trust: Trustee since 2007** | Retired; Partner, Ernst & Young LLP (2002 to 2003); Partner, Arthur Andersen LLP (1989 to 2002); Consultant to the MainStay Funds Audit and Compliance Committee (2004 to 2006) | 81 | MainStay Funds: Trustee since 2006 (11 Funds);
MainStay Funds Trust: Trustee since 2007 (37 Funds)***;
MainStay MacKay DefinedTerm Municipal Opportunities Fund: Trustee since 2011; and
MainStay CBRE Global Infrastructure Megatrends Term Fund: Trustee since June 2021 |
| | Jacques P. Perold
1958 | MainStay VP Funds Trust: Trustee since January 2016, Advisory Board Member (June 2015 to December 2015) | Founder and Chief Executive Officer, CapShift Advisors LLC (since 2018); President, Fidelity Management & Research Company (2009 to 2014); President and Chief Investment Officer, Geode Capital Management, LLC (2001 to 2009) | 81 | MainStay Funds: Trustee since January 2016, Advisory Board Member (June 2015 to December 2015) (11 Funds);
MainStay Funds Trust: Trustee since January 2016, Advisory Board Member (June 2015 to December 2015) (37 Funds);
MainStay MacKay DefinedTerm Municipal Opportunities Fund: Trustee since January 2016, Advisory Board Member (June 2015 to December 2015);
MainStay CBRE Global Infrastructure Megatrends Term Fund: Trustee since June 2021;
Allstate Corporation: Director since 2015;
Partners in Health: Trustee since 2019; and
MSCI Inc.: Director since 2017 |
| | Richard S. Trutanic
1952 | MainStay VP Funds Trust: Trustee since 2007** | Chairman and Chief Executive Officer, Somerset & Company (financial advisory firm) since 2004; Managing Director, The Carlyle Group (private investment firm) (2002 to 2004); Senior Managing Director, Partner and Board Member, Groupe Arnault S.A. (private investment firm) (1999 to 2002) | 81 | MainStay Funds: Trustee since 1994 (11 Funds);
MainStay Funds Trust: Trustee since 2007 (37 Funds)***;
MainStay MacKay DefinedTerm Municipal Opportunities Fund: Trustee since 2011; and
MainStay CBRE Global Infrastructure Megatrends Term Fund: Trustee since June 2021 |
| ** | Includes prior service as a Director of MainStay VP Series Fund, Inc., the predecessor to MainStay VP Funds Trust. |
| *** | Includes prior service as a Director/Trustee of certain predecessor entities to MainStay Funds Trust. |
| 52 | MainStay VP PIMCO Real Return Portfolio |
| | Name and
Year of Birth | Position(s) Held and
Length of Service | Principal Occupation(s)
During Past Five Years | |
| | | | | |
| | Kirk C. Lehneis
1974 | President, MainStay VP Funds Trust (since 2017) | Chief Operating Officer and Senior Managing Director (since 2016), New York Life Investment Management LLC and New York Life Investment Management Holdings LLC; Member of the Board of Managers (since 2017) and Senior Managing Director (since 2018), NYLIFE Distributors LLC; Chairman of the Board and Senior Managing Director, NYLIM Service Company LLC (since 2017); Trustee, President and Principal Executive Officer of IndexIQ Trust, IndexIQ ETF Trust and IndexIQ Active ETF Trust (since 2018); President, MainStay CBRE Global Infrastructure Megatrends Term Fund (since 2021), MainStay MacKay DefinedTerm Municipal Opportunities Fund, MainStay Funds and MainStay Funds Trust (since 2017); Senior Managing Director, Global Product Development (from 2015 to 2016); Managing Director, Product Development (from 2010 to 2015), New York Life Investment Management LLC | |
| | Jack R. Benintende
1964 | Treasurer and Principal Financial and Accounting Officer, MainStay VP Funds Trust (since 2007)** | Managing Director, New York Life Investment Management LLC (since 2007); Treasurer and Principal Financial and Accounting Officer, MainStay CBRE Global Infrastructure Megatrends Term Fund (since 2021), MainStay MacKay DefinedTerm Municipal Opportunities Fund (since 2011), MainStay Funds Trust (since 2009) and MainStay Funds (since 2007); and Assistant Treasurer, New York Life Investment Management Holdings LLC (2008 to 2012) | |
| | J. Kevin Gao
1967 | Secretary and Chief Legal Officer, MainStay VP Funds Trust (since 2010)** | Managing Director and Associate General Counsel, New York Life Investment Management LLC (since 2010); Secretary and Chief Legal Officer, MainStay CBRE Global Infrastructure Megatrends Term Fund (since 2021), MainStay MacKay DefinedTerm Municipal Opportunities Fund (since 2011), MainStay Funds and MainStay Funds Trust (since 2010) | |
| | Kevin M. Gleason
1967 | Vice President and Chief Compliance Officer, MainStay VP Funds Trust (since June 2022) | Vice President and Chief Compliance Officer, IndexIQ Trust, IndexIQ ETF Trust and IndexIQ Active ETF Trust (since June 2022); Vice President and Chief Compliance Officer, MainStay CBRE Global Infrastructure Megatrends Term Fund, MainStay MacKay DefinedTerm Municipal Opportunities Fund (since June 2022); MainStay Funds Trust and MainStay Funds (since June 2022); Senior Vice President, Voya Investment Management and Chief Compliance Officer, Voya Family of Funds (2012 to 2022) | |
| | Scott T. Harrington
1959 | Vice President— Administration, MainStay VP Funds Trust (since 2005)** | Managing Director, New York Life Investment Management LLC (including predecessor advisory organizations) (since 2000); Member of the Board of Directors, New York Life Trust Company (since 2009); Vice President—Administration, MainStay CBRE Global Infrastructure Megatrends Term Fund (since 2021), MainStay MacKay DefinedTerm Municipal Opportunities Fund (since 2011), MainStay Funds Trust and MainStay Funds (since 2009) | |
| * | The officers listed above are considered to be “interested persons” of the MainStay Group of Funds, MainStay VP Funds Trust, MainStay CBRE Global Infrastructure Megatrends Term Fund and MainStay MacKay DefinedTerm Municipal Opportunities Fund within the meaning of the 1940 Act because of their affiliation with the MainStay Group of Funds, New York Life Insurance Company and/or its affiliates, including New York Life Investment Management LLC, New York Life Insurance Company, NYLIM Service Company LLC, NYLIFE Securities LLC and/or NYLIFE Distributors LLC, as described in detail in the column captioned “Principal Occupation(s) During Past Five Years.” Officers are elected annually by the Board. |
| ** | Includes prior service as an Officer of MainStay VP Series Fund, Inc., the predecessor to MainStay VP Funds Trust. |
Officers of the Trust (Who are not Trustees)*
This page intentionally left blank.
MainStay VP Portfolios
MainStay VP offers a wide range of Portfolios. The full array of MainStay VP offerings is listed here, with information about the manager, subadvisors, legal counsel, and independent registered public accounting firm.
Equity
MainStay VP American Century Sustainable Equity Portfolio
MainStay VP Candriam Emerging Markets Equity Portfolio
MainStay VP Epoch U.S. Equity Yield Portfolio
MainStay VP Fidelity Institutional AM® Utilities Portfolio†
MainStay VP Natural Resources Portfolio
MainStay VP PineStone International Equity Portfolio1
MainStay VP S&P 500 Index Portfolio
MainStay VP Small Cap Growth Portfolio
MainStay VP Wellington Growth Portfolio
MainStay VP Wellington Mid Cap Portfolio
MainStay VP Wellington Small Cap Portfolio
MainStay VP Wellington U.S. Equity Portfolio
MainStay VP Winslow Large Cap Growth Portfolio
Mixed Asset
MainStay VP Balanced Portfolio
MainStay VP Income Builder Portfolio
MainStay VP Janus Henderson Balanced Portfolio
MainStay VP MacKay Convertible Portfolio
Income
MainStay VP Bond Portfolio
MainStay VP Floating Rate Portfolio
MainStay VP Indexed Bond Portfolio
MainStay VP MacKay Government Portfolio2
MainStay VP MacKay High Yield Corporate Bond Portfolio
MainStay VP MacKay Strategic Bond Portfolio
MainStay VP PIMCO Real Return Portfolio
Money Market
MainStay VP U.S. Government Money Market Portfolio
Alternative
MainStay VP CBRE Global Infrastructure Portfolio
MainStay VP IQ Hedge Multi-Strategy Portfolio
Asset Allocation
MainStay VP Conservative Allocation Portfolio
MainStay VP Equity Allocation Portfolio
MainStay VP Growth Allocation Portfolio
MainStay VP Moderate Allocation Portfolio
Manager
New York Life Investment Management LLC
New York, New York
Subadvisors
American Century Investment Management, Inc.
Kansas City, Missouri
Brown Advisory LLC
Baltimore, Maryland
Candriam*
Strassen, Luxembourg
CBRE Investment Management Listed Real Assets LLC
Radnor, Pennsylvania
Epoch Investment Partners, Inc.
New York, New York
FIAM LLC
Smithfield, Rhode Island
IndexIQ Advisors LLC*
New York, New York
Janus Henderson Investors US LLC
Denver, Colorado
MacKay Shields LLC*
New York, New York
Newton Investment Management North America, LLC
Boston, Massachusetts
NYL Investors LLC*
New York, New York
Pacific Investment Management Company LLC
Newport Beach, California
PineStone Asset Management Inc.
Montreal, Québec
Segall Bryant & Hamill, LLC
Chicago, Illinois
Wellington Management Company LLP
Boston, Massachusetts
Winslow Capital Management, LLC
Minneapolis, Minnesota
Legal Counsel
Dechert LLP
Washington, District of Columbia
Independent Registered Public Accounting Firm
PricewaterhouseCoopers LLP
New York, New York
Distributor
NYLIFE Distributors LLC*
Jersey City, New Jersey
Custodian
JPMorgan Chase Bank, N.A.
New York, New York
Some Portfolios may not be available in all products.
† Fidelity Institutional AM is a registered trade mark of FMR LLC. Used with permission.
* An affiliate of New York Life Investment Management LLC.
| 1. | Prior to August 28, 2023, the Portfolio's name was MainStay VP MacKay International Equity Portfolio. |
| 2. | Effective on or about May 1, 2024, the MainStay VP MacKay Government Portfolio will be renamed the MainStay VP U.S. Infrastructure Bond Portfolio. |
Not part of the Annual Report
2023 Annual Report
This report is for the general information of New York Life Variable Annuities and NYLIAC Variable Universal Life Insurance Products policyowners. It must be preceded or accompanied by the appropriate product(s) and funds prospectuses if it is given to anyone who is not an owner of a New York Life variable annuity policy or a NYLIAC Variable Universal Life Insurance Product. This report does not offer for sale or solicit orders to purchase securities.
The performance data quoted in this report represents past performance. Past performance is no guarantee of future results. Due to market volatility and other factors, current performance may be lower or higher than the figures shown. The most recent month-end performance summary for your variable annuity or variable life policy is available by calling 800-598-2019 and is updated periodically on newyorklife.com.
The New York Life Variable Annuities and NYLIAC Variable Universal Life Insurance Products are issued by New York Life Insurance and Annuity Corporation (a Delaware Corporation) and distributed by NYLIFE Distributors LLC (Member FINRA/SIPC).
New York Life Insurance Company
New York Life Insurance and Annuity
Corporation (NYLIAC) (A Delaware Corporation)
51 Madison Avenue, Room 551
New York, NY 10010
newyorklife.com
newyorklifeinvestments.com
NYLIFE Distributors LLC, 30 Hudson Street, Jersey City, NJ 07302
New York Life Investment Management LLC is the investment manager to the MainStay VP Funds Trust
©2024 by NYLIFE Distributors LLC. All rights reserved.
You may obtain copies of the Prospectus and the Statement of Additional Information free of charge, upon request, by calling toll-free 800-598-2019 or writing to New York Life Insurance and Annuity Corporation, 51 Madison Avenue, New York, NY 10010.
| Not FDIC Insured | No Bank Guarantee | May Lose Value |
(NYLIAC) NI528
Item 2. Code of Ethics.
As of the end of the period covered by this report, the Registrant has adopted a code of ethics (the “Code”) that applies to the Registrant’s principal executive officer (“PEO”) and principal financial officer (“PFO”). During the period covered by this report, no amendments were made to the provisions of the Code. The Registrant did not grant any waivers, including implicit waivers, from any provisions of the Code to the PEO or PFO during the period covered by this report. A copy of the Code is filed herewith.
| Item 3. | Audit Committee Financial Expert. |
The Board of Trustees has determined that the Registrant has three “audit committee financial experts” (as defined by Item 3 of Form N-CSR) serving on its Audit Committee. The Audit Committee financial experts are Alan R. Latshaw, Karen Hammond and Susan B. Kerley. Mr. Latshaw, Ms. Hammond and Ms. Kerley are “independent” as defined by Item 3 of Form N-CSR.
| Item 4. | Principal Accountant Fees and Services. |
(a) Audit Fees
The aggregate fees billed for the fiscal year ended December 31, 2023 for professional services rendered by PricewaterhouseCoopers LLP (“PwC”) for the audit of the Registrant’s annual financial statements or services that are normally provided by PwC in connection with statutory and regulatory filings or engagements for that fiscal year were $1,986,750.
The aggregate fees billed for the fiscal year ended December 31, 2022 for professional services rendered by PwC for the audit of the Registrant’s annual financial statements or services that are normally provided by PwC in connection with statutory and regulatory filings or engagements for that fiscal year were $1,949,250.
(b) Audit-Related Fees
The aggregate fees billed for assurance and related services by PwC that are reasonably related to the performance of the audit of the Registrant’s financial statements and are not reported under paragraph (a) of this Item were: (i) $0 for the fiscal year ended December 31, 2023, and (ii) $0 for the fiscal year ended December 31, 2022.
(c) Tax Fees
The aggregate fees billed for professional services rendered by PwC for tax compliance, tax advice, and tax planning were: (i) $0 during the fiscal year ended December 31, 2023; and (ii) $0 during the fiscal year ended December 31, 2022. These services primarily included preparation of federal, state and local income tax returns and excise tax returns, as well as services relating to excise tax distribution requirements.
(d) All Other Fees
The aggregate fees billed for products and services provided by PwC, other than the services reported in paragraphs (a) through (c) of this Item were: (i) $0 during the fiscal year ended December 31, 2023; and (ii) $0 during the fiscal year ended December 31, 2022.
(e) Pre-Approval Policies and Procedures
| | (1) | The Registrant’s Audit Committee has adopted pre-approval policies and procedures (the “Procedures”) to govern the Committee’s pre-approval of (i) all audit services and permissible non-audit services to be provided to the Registrant by its independent accountant, and (ii) all permissible non-audit services to be provided by such independent accountant to the Registrant’s investment adviser and to any entity controlling, controlled by or under common control with the investment adviser that provides ongoing services to the Registrant (collectively, the “Service Affiliates”) if the services directly relate to the Registrant’s operations and financial reporting. In accordance with the Procedures, the Audit Committee is responsible for the engagement of the independent accountant to certify the Registrant’s financial statements for each fiscal year. With respect to the pre-approval of non-audit services provided to the Registrant and its Service Affiliates, the Procedures provide that the Audit Committee may annually pre-approve a list of the types of services that may be provided to the Registrant or its Service Affiliates, or the Audit Committee may pre-approve such services on a project-by-project basis as they arise. Unless a type of service has received general pre-approval, it will require specific pre-approval by the Audit Committee if it is to be provided by the independent accountant. The Procedures also permit the Audit Committee to delegate authority to one or more of its members to pre-approve any proposed non-audit services that have not been previously pre-approved by the Audit Committee, subject to the ratification by the full Audit Committee no later than its next scheduled meeting. To date, the Audit Committee has not delegated such authority. |
| | (2) | With respect to the services described in paragraphs (b) through (d) of this Item 4, no amount was approved by the Audit Committee pursuant to paragraph (c)(7)(i)(C) of Rule 2-01 of Regulation S-X. |
(f) There were no hours expended on PwC’s engagement to audit the Registrant’s financial statements for the most recent fiscal year was attributable to work performed by persons other than PwC’s full-time, permanent employees.
(g) All non-audit fees billed by PwC for services rendered to the Registrant for the fiscal years ended December 31, 2023 and December 31, 2022 are disclosed in 4(b)-(d) above.
The aggregate non-audit fees billed by PwC for services rendered to the Registrant’s investment adviser (not including any sub-adviser whose role is primarily portfolio management and is subcontracted with or overseen by another investment adviser), and any entity controlling, controlled by, or under common
control with the adviser that provides ongoing services to the Registrant were approximately: (i) $14,573,000 for the fiscal year ended December 31, 2023; and (ii) $13,012,000 for the fiscal year ended December 31, 2022.
(h) The Registrant’s Audit Committee has determined that the non-audit services rendered by PwC for the fiscal year ended December 31, 2023 to the Registrant’s investment adviser and any entity controlling, controlled by, or under common control with the Registrant’s investment adviser that provides ongoing services to the Registrant that were not required to be pre-approved by the Audit Committee because they did not relate directly to the operations and financial reporting of the registrant were compatible with maintaining the respective independence of PwC during the relevant time period.
| Item 5. | Audit Committee of Listed Registrants |
Not applicable.
The Schedule of Investments is included as part of Item 1 of this report.
| Item 7. | Disclosure of Proxy Voting Policies and Procedures for Closed-End Management Investment Companies. |
Not applicable.
| Item 8. | Portfolio Managers of Closed-End Management Investment Companies. |
Not applicable.
| Item 9. | Purchases of Equity Securities by Closed-End Management Investment Company and Affiliated Purchasers. |
Not applicable.
| Item 10. | Submission of Matters to a Vote of Security Holders. |
Since the Registrant’s last response to this Item, there have been no material changes to the procedures by which shareholders may recommend nominees to the Registrant’s Board of Trustees.
| Item 11. | Controls and Procedures. |
(a) Based on an evaluation of the Registrant’s Disclosure Controls and Procedures (as defined in Rule 30a-3(c) under the Investment Company Act of 1940) (the “Disclosure Controls”), as of a date within 90 days prior to the filing date (the “Filing Date”) of this Form N-CSR (the “Report”), the Registrant’s principal executive officer and principal financial officer have concluded that the Disclosure Controls are reasonably designed to ensure that information required to be disclosed by the Registrant in the Report is recorded, processed, summarized and reported by the Filing Date, including ensuring that information required to be disclosed in the Report is accumulated and communicated to the Registrant’s management, including the Registrant’s principal executive officer and principal financial officer, as appropriate to allow timely decisions regarding required disclosure.
(b) There were no changes in the Registrant’s internal control over financial reporting (as defined in Rule 30a-3(d)) under the Investment Company Act of 1940 that occurred during the period covered by this report that has materially affected, or is reasonably likely to materially affect, the Registrant’s internal control over financial reporting.
| Item 12. | Disclosure of Securities Lending Activities for Closed-End Management Investment Companies. |
Not applicable.
SIGNATURES
Pursuant to the requirements of the Securities Exchange Act of 1934 and the Investment Company Act of 1940, the Registrant has duly caused this Report to be signed on its behalf by the undersigned, thereunto duly authorized.
MAINSTAY VP FUNDS TRUST
| | |
| By: | | /s/ Kirk C. Lehneis |
| | Kirk C. Lehneis |
| | President and Principal Executive Officer |
| |
| Date: | | March 5, 2024 |
Pursuant to the requirements of the Securities Exchange Act of 1934 and the Investment Company Act of 1940, this Report has been signed below by the following persons on behalf of the Registrant and in the capacities and on the dates indicated.
| | |
| By: | | /s/ Kirk C. Lehneis |
| | Kirk C. Lehneis |
| | President and Principal Executive Officer |
| |
| Date: | | March 5, 2024 |
| |
| By: | | /s/ Jack R. Benintende |
| | Jack R. Benintende |
| | Treasurer and Principal Financial and Accounting Officer |
| |
| Date: | | March 5, 2024 |