Exhibit (c)(2)(iii)
Presentation to the Independent Committee Regarding
February 21, 2011
Project GIBSON
Important Information
The following pages contain material that was provided to the Independent Committee of the Board of Directors of
GIBSON (the “Committee”) in the context of a meeting held to consider a potential going private transaction whereby
FENDER, the Company’s current majority owner, would purchase shares of the Company’s common stock that it does not
already own (the “Transaction”). The accompanying material was compiled or prepared on a confidential basis for use by
the Committee and not with a view toward public disclosure. The information utilized in preparing this presentation was
obtained from the Company and public sources. Any estimates and projections for the Company contained herein have
been prepared by the senior management of the Company or are publicly available, or are based upon such estimates
and projections, and involve numerous and significant subjective determinations, which may or may not prove to be
correct. No representation or warranty, express or implied, is made as to the accuracy or completeness of such
information and nothing contained herein is, or shall be relied upon as, a representation, whether as to the past or the
future. Because this material was prepared for use in the context of an oral presentation to the Committee, which is
familiar with the business and affairs of the Company, neither the Company nor William Blair & Company, L.L.C. (“William
Blair”) nor any of their respective legal or financial advisors or accountants take any responsibility for the accuracy or
completeness of any of the material if used by persons other than the Committee of the Company. William Blair has no
obligation to update or otherwise revise the accompanying materials.
Confidential material presented to the Independent Committee of the Board of Directors of
GIBSON (the “Company”)
Important Information
1
Table of Contents
I. Executive Summary
II. GIBSON Overview
III. Valuation Analyses
A. Selected Public Companies Analysis
B. Selected M&A Transactions Analysis
C. M&A Premiums Paid Analysis
D. Discounted Cash Flow Analysis
Table of Contents
Executive Summary
Scope of Review and Analysis
Executive Summary
§ William Blair’s role is to render its opinion with respect to the fairness, from a financial point of view, to the holders (other than
FENDER and any of its affiliates) of the outstanding shares of common stock of GIBSON of the $5.25 per share consideration to
be paid to such holders pursuant to the Transaction.
FENDER and any of its affiliates) of the outstanding shares of common stock of GIBSON of the $5.25 per share consideration to
be paid to such holders pursuant to the Transaction.
§ In connection with the review of the Transaction and the preparation of its opinion, William Blair examined:
§ The draft of the Agreement and Plan of Merger dated as of February 18, 2011 (the “Agreement”);
§ The audited historical financial statements of the Company for the years ended March 31, 2008 through March 31, 2010;
§ The unaudited financial information of the Company for the nine-month periods ended December 31, 2009 and December 31,
2010;
2010;
§ Certain internal business, operating and financial information and forecasts of the Company for the fiscal years ending March
31, 2011 through 2016 prepared by the senior management of the Company (the “Forecasts”);
§ Certain publicly available business, financial and other information relating to the Company that we deemed to be relevant;
§ Current and historical market prices and trading volumes of the Company’s shares;
§ The financial position and operating results of the Company compared with those of certain other publicly traded companies
we deemed relevant; and
§ Information regarding publicly available financial terms of certain other business combinations we deemed relevant.
§ We have also held discussions the Committee and senior management of the Company to discuss the foregoing.
§ Additionally, we have considered other matters which we have deemed relevant to our inquiry and have taken into account such
accepted financial and investment banking procedures and considerations as we have deemed relevant.
2
Key Assumptions Underlying Our Review and Analysis
Executive Summary
§ We have assumed and relied upon, without any duty of independent verification, the accuracy and completeness of all of the
information that was examined by, or otherwise reviewed or discussed with, us for purposes of this presentation, including without
limitation the Forecasts, and we assume no responsibility or liability therefore.
information that was examined by, or otherwise reviewed or discussed with, us for purposes of this presentation, including without
limitation the Forecasts, and we assume no responsibility or liability therefore.
§ We have not made or obtained an independent valuation or appraisal of the assets, liabilities or solvency of the Company.
§ We have been advised by senior management of the Company that the Forecasts examined by us have been reasonably
prepared on bases reflecting the best currently available estimates and judgments of the senior management of the Company, and
we have assumed, with the Company’s consent, that (i) the Forecasts will be achieved in the amounts and at the times
contemplated thereby and (ii) all material assets and liabilities (contingent or otherwise) of the Company are as set forth in their
respective financial statements or other information made available to us.
§ We express no opinion with respect to the Forecasts or the estimates and judgments on which they are based.
§ We have relied upon and assumed, without any duty of independent verification, that there has been no material change in the
business, assets, liabilities, financial condition, results of operations, cash flows or prospects of the Company since the date of the
most recent financial statements and Forecasts provided to us (i.e., February 1, 2011), and that there is no information or any
facts that would make any of the information reviewed by us incomplete or misleading.
§ Our opinion does not address the relative merits of any aspect of the Transaction as compared to any alternative business
strategies that might exist for the Company.
§ Our opinion is based upon economic, market, financial and other conditions existing on, and other information disclosed to us as
of, the date of this opinion.
§ It should be understood that, although subsequent developments may affect this opinion, we do not have any obligation to update,
revise or reaffirm this opinion.
§ We have relied on the Committee’s determination that FENDER is not interested in selling its ownership stake in GIBSON. Based
upon FENDER’s position and other factors, the Committee determined not to proceed with a process to initiate contact with other
potential buyers at this time.
upon FENDER’s position and other factors, the Committee determined not to proceed with a process to initiate contact with other
potential buyers at this time.
§ We have relied as to all legal, accounting and tax matters on advice of counsel to the Company as well as counsel to the
Committee.
Committee.
§ We have assumed that the Transaction will be consummated on the terms described in the Agreement, without any waiver of any
material terms or conditions.
§ William Blair is serving as an investment banker in connection with the Transaction and will receive a fee for its services, a
significant portion of which is contingent upon consummation of the proposed Transaction.
§ In the ordinary course of our business, William Blair may from time to time trade the securities of the Company for William Blair’s
own account and for the accounts of customers, and accordingly may at any time hold a long or short position in such securities.
3
Transaction Summary
Executive Summary
Transaction
Structure
One of FENDER’s wholly-owned subsidiaries (“Merger Sub”) will merge with and into GIBSON with
GIBSON surviving as a subsidiary of FENDER, and, subject to certain limitations as set forth in the
Agreement, each share not owned by GIBSON, FENDER or their respective subsidiaries or any
stockholder who has effectively exercised appraisal rights will thereupon be cancelled and
converted into the right to receive cash in an amount equal to $5.25 per share.
Nature of
Purchaser
Purchaser
Nature of
Seller
FENDER is a public company headquartered Mumbai, India that trades on the Bombay Stock
Exchange. FENDER’s primary business involves manufacturing and marketing pharmaceutical
formulations and specialty active pharmaceutical ingredients primarily in India and the U.S.
Exchange. FENDER’s primary business involves manufacturing and marketing pharmaceutical
formulations and specialty active pharmaceutical ingredients primarily in India and the U.S.
GIBSON is a public company headquartered in Detroit, Michigan that trades on the American Stock
Exchange. GIBSON’s primary business involves manufacturing and distributing generic
pharmaceuticals throughout the U.S. Approximately 75.8% of GIBSON’s equity is owned by
FENDER.
Exchange. GIBSON’s primary business involves manufacturing and distributing generic
pharmaceuticals throughout the U.S. Approximately 75.8% of GIBSON’s equity is owned by
FENDER.
On September 30, 2009, GIBSON entered into a consent decree with the U.S. Food and Drug
Administration thereby ceasing the Company’s drug manufacturing operations. The decree provides
a series of measures that, when satisfied, will permit GIBSON to resume manufacturing and
distributing those products that are manufactured in its Detroit area facilities. The timing of the
resumption of manufacturing operations remains unclear.
On December 27, 2010, GIBSON announced that distribution agreements with FENDER have been
extended until January 28, 2012 but will terminate following these extensions. Accordingly,
FENDER has informed GIBSON of its intention to transfer the sales and distribution of FENDER
products from GIBSON to FENDER and/or its wholly-owned affiliates to enhance its ability to
compete. For the fiscal year ended March 31, 2010, net sales of products under these agreements
accounted for $211.4 million or 90% of GIBSON’s net sales.
4
Timeline of Key Events
Executive Summary
10/26/2010: FENDER Chairman communicates interest to explore a possible Transaction
10/26/2010: GIBSON’s Committee retains counsel (Carrington, Coleman, Sloman & Blumenthal,
L.L.P.)
L.L.P.)
10/26/2010: GIBSON’s Committee begins to investigate a possible Transaction
12/03/2010: GIBSON receives, and publicly discloses after the market close, FENDER’s proposal to
purchase all outstanding shares not already owned by FENDER for $4.75 per share
12/21/2010: GIBSON’s Committee retains William Blair & Company
12/27/2010: GIBSON announces future termination of FENDER distribution agreements
01/26/2010: GIBSON’s Committee negotiates with FENDER to improve terms of proposal
02/15/2011: GIBSON receives Agreement from FENDER outlining FENDER’s intent to purchase all
outstanding shares not already owned by FENDER for $5.25 per share
Note: GIBSON’s Committee is a standing committee and was not created for the purpose of this Transaction.
5
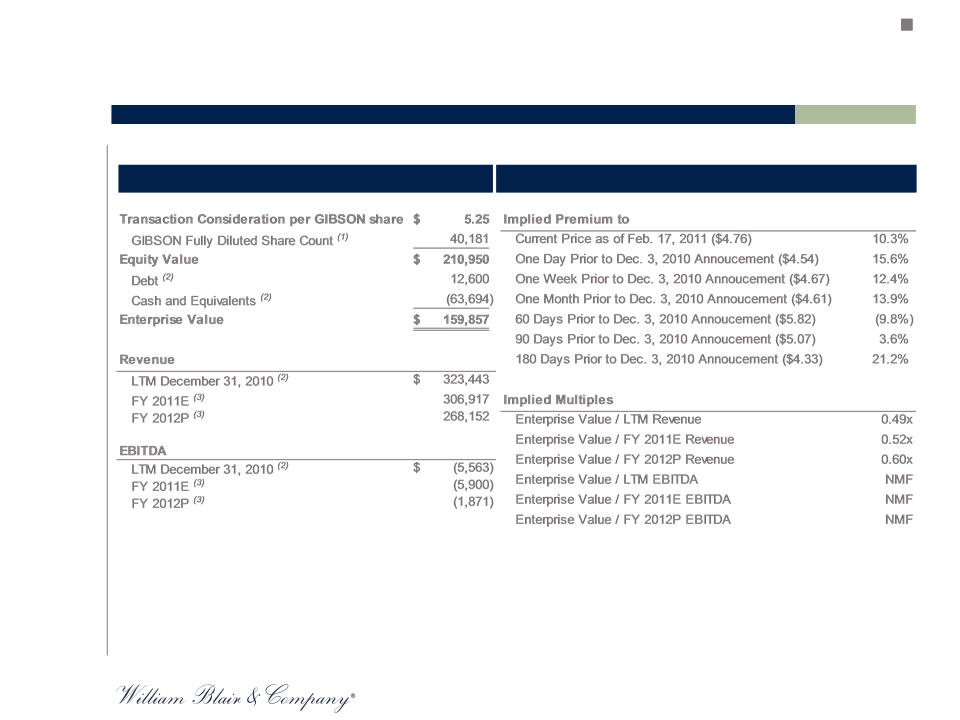
Summary of Key Financial Terms and Valuation
(1) Per GIBSON management and 10-Q as of December 31 ,2010, and includes 40,179,194 outstanding common shares and 9,000 'in the money' options. Options
maintain weighted average strike price of $4.18 as of December 31, 2010.
(2) Per GIBSON 10-Q as of December 31, 2010.
(3) Per GIBSON management.
Executive Summary
($ in thousands, except per share values; fiscal year end March 31)
Key Financial Terms
Valuation
6
GIBSON Overview
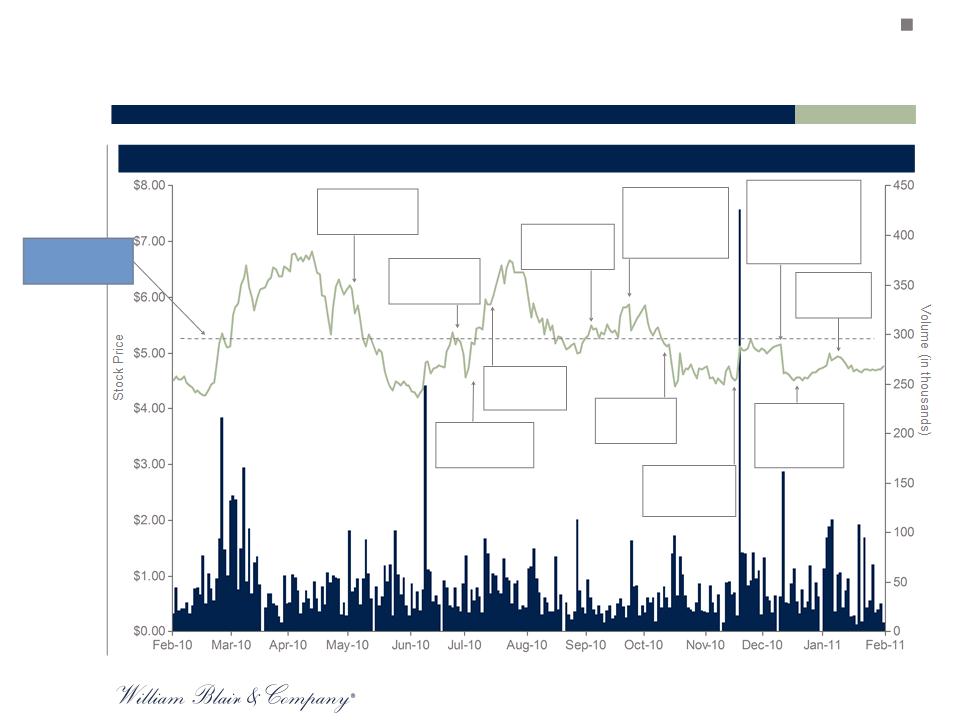
Annotated Stock Price Performance
GIBSON Stock Price Performance and Volume
FENDER Current
Offer:
Offer:
$5.25 per share
Source: FactSet Research Systems as of February 17, 2011.
GIBSON Overview
5/22/2010:
FY10 results
released
FY10 results
released
7/27/2010:
Q1 FY11
results
released
Q1 FY11
results
released
7/23/2010:
G.P. Singh appointed
Chief Operating Officer
G.P. Singh appointed
Chief Operating Officer
9/15/2010:
Eddie Munson
appointed to
Board
Eddie Munson
appointed to
Board
10/08/2010:
Jitendra N. Doshi
resigns as Chief
Executive Officer
and G.P. Singh
assumes role
Jitendra N. Doshi
resigns as Chief
Executive Officer
and G.P. Singh
assumes role
10/29/2010:
Q2 FY11 results
released
Q2 FY11 results
released
12/03/10:
FENDER makes
initial proposal of
$4.75 per share
FENDER makes
initial proposal of
$4.75 per share
1/03/2011:
GIBSON
provides update
on remediation
activities
GIBSON
provides update
on remediation
activities
12/27/2010:
GIBSON announces
one-year extension
and future termination
of distribution
agreements
GIBSON announces
one-year extension
and future termination
of distribution
agreements
with FENDER
1/30/2011:
Q3 FY11
results
released
Q3 FY11
results
released
7/09/2010:
Madhava Reddy
resigns as
Director
Madhava Reddy
resigns as
Director
7
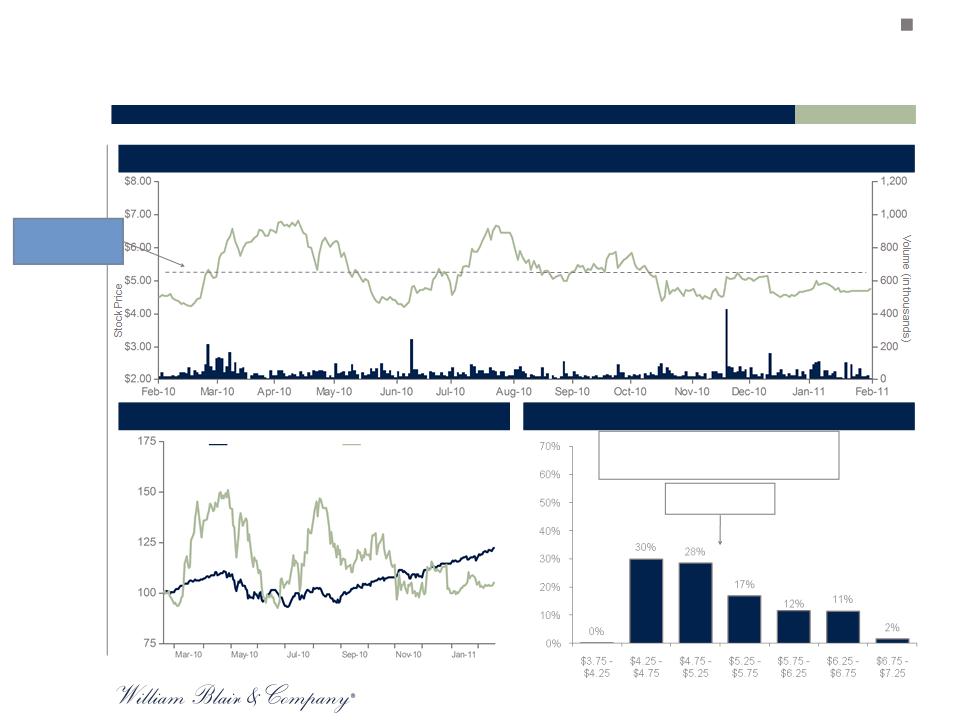
GIBSON Trading Information - Last Twelve Months
Stock Price Performance and Volume
Indexed Stock Price Performance
Historical Trading Histogram
§ 11.996 million total shares traded
§ Average Daily Volume: 46.858 thousand shares
§ Volume Weighted Average Stock Price: $5.27
S&P 500 +22.4%
GIBSON +5.3%
FENDER Current Offer:
$5.25 per share
$5.25 per share
GIBSON Overview
Source: FactSet Research Systems as of February 17, 2011.
FENDER Current
Offer:
Offer:
$5.25 per share
8
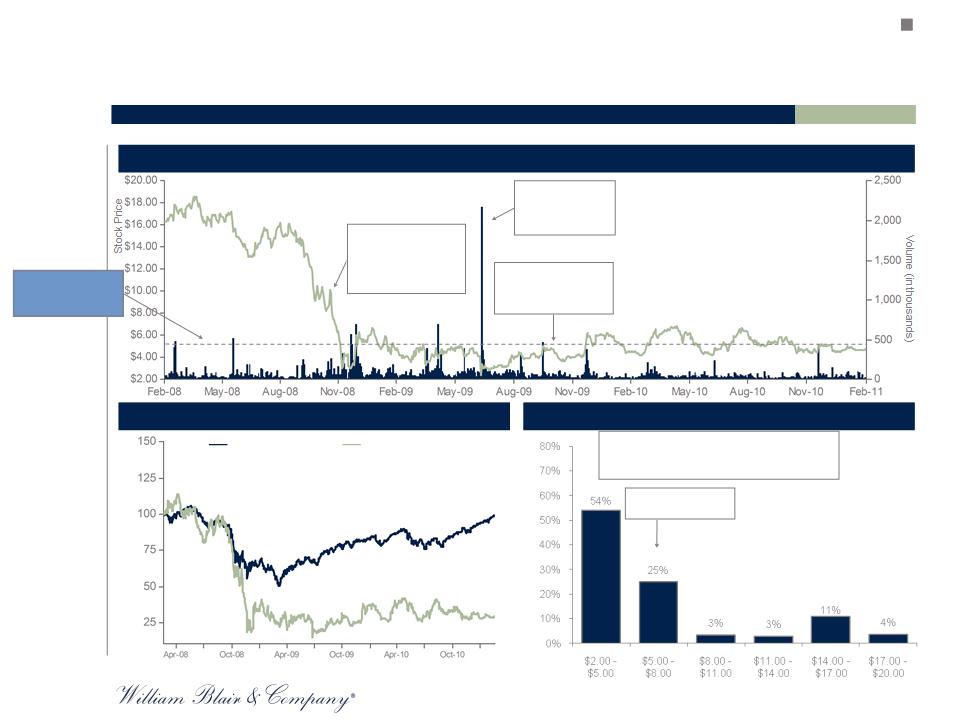
GIBSON Trading Information - Last Three Years
Indexed Stock Price Performance
Historical Trading Histogram
S&P 500 (0.7%)
GIBSON (70.8%)
Stock Price Performance and Volume
GIBSON Overview
§ 56.933 million total shares traded
§ Average Daily Volume: 75.011 thousand shares
§ Volume Weighted Average Stock Price: $6.66
FENDER Current Offer:
$5.25 per share
$5.25 per share
6/25/2009:
GIBSON
announces FDA
seizure of inventory
GIBSON
announces FDA
seizure of inventory
11/03/2008:
GIBSON receives U.S.
FDA warning letter
GIBSON receives U.S.
FDA warning letter
Source: FactSet Research Systems as of February 17, 2011.
FENDER Current
Offer:
Offer:
$5.25 per share
9/30/2009:
GIBSON entered into a
consent decree with
U.S. FDA
GIBSON entered into a
consent decree with
U.S. FDA
9
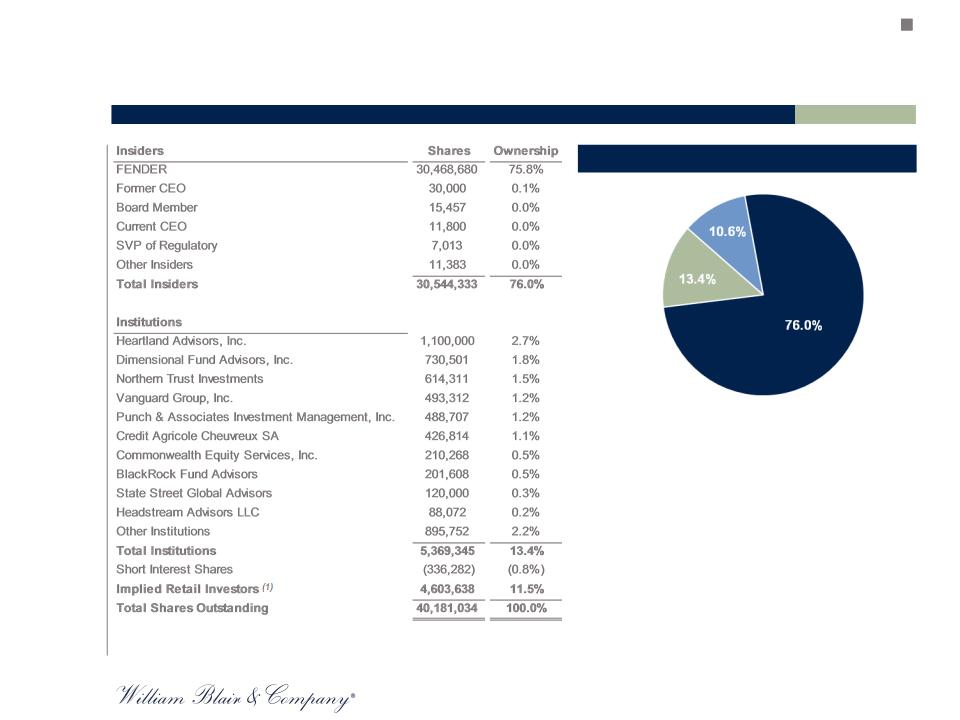
GIBSON Current Ownership Summary
Implied Retail
(net of short
interest)
interest)
Insiders
Institutional
Investors
Investors
Source: FactSet Lionshares as of February 17, 2011, GIBSON management and 10-Q as of December 31, 2010.
(1) Implied retail investors defined as total shares outstanding minus shares held by short interest, insiders and institutional investors.
Share Ownership
GIBSON Overview
10
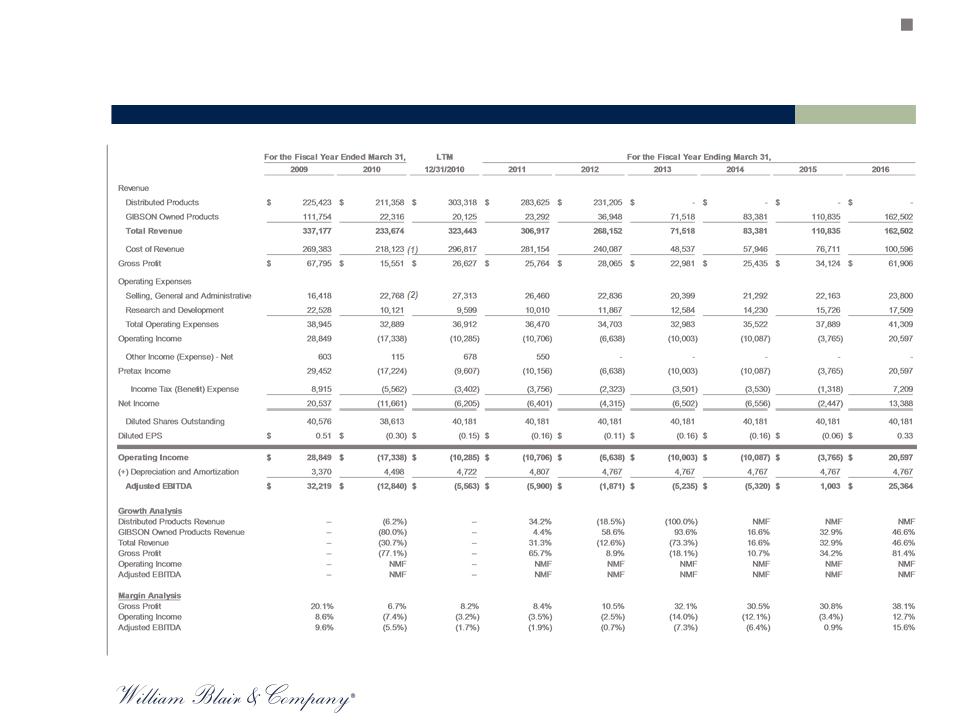
Financial Overview and Projections
Source: Public filings and GIBSON management.
(1) Excludes a $16.0 million expense related to inventory seized by the FDA.
(2) Excludes $20.0 million of non-recurring income generated by an asset sale.
($ in thousands, except per share values)
GIBSON Overview
11
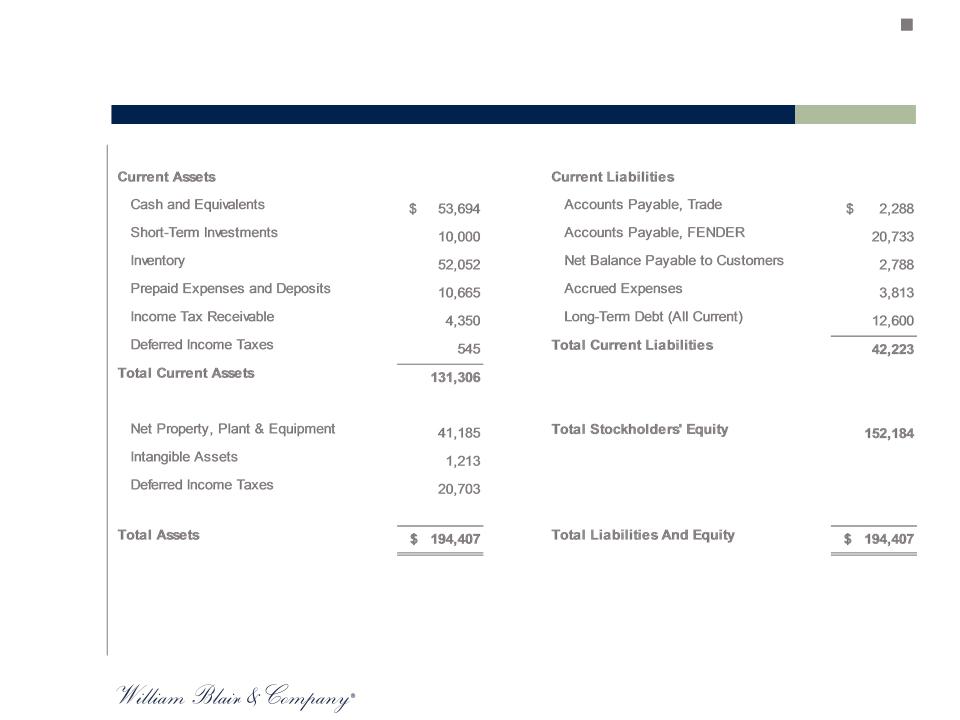
GIBSON Balance Sheet as of December 31, 2010
Source: Per GIBSON 10-Q as of December 31, 2010.
GIBSON Overview
($ in thousands)
12
Valuation Analyses
Selected Public Companies Analysis
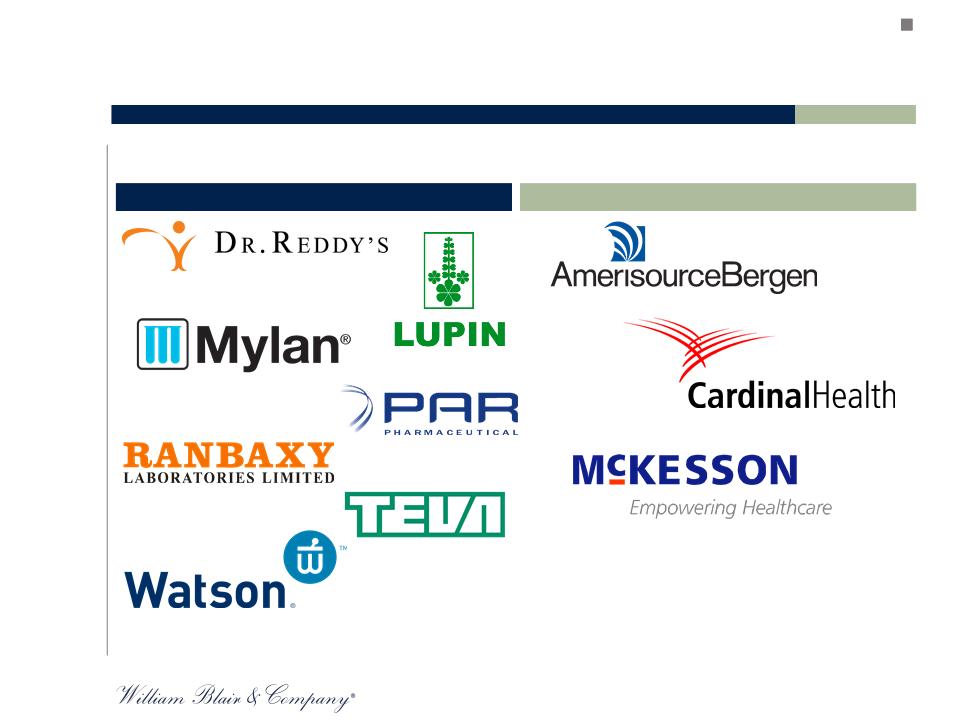
Selected Public Companies
Selected Public Companies Analysis
Note: No selected company is directly comparable to GIBSON.
Generic Pharmaceuticals
Pharmaceutical Distributors
§ William Blair selected 10 public companies that we deemed relevant to GIBSON
13
Selected Public Companies -
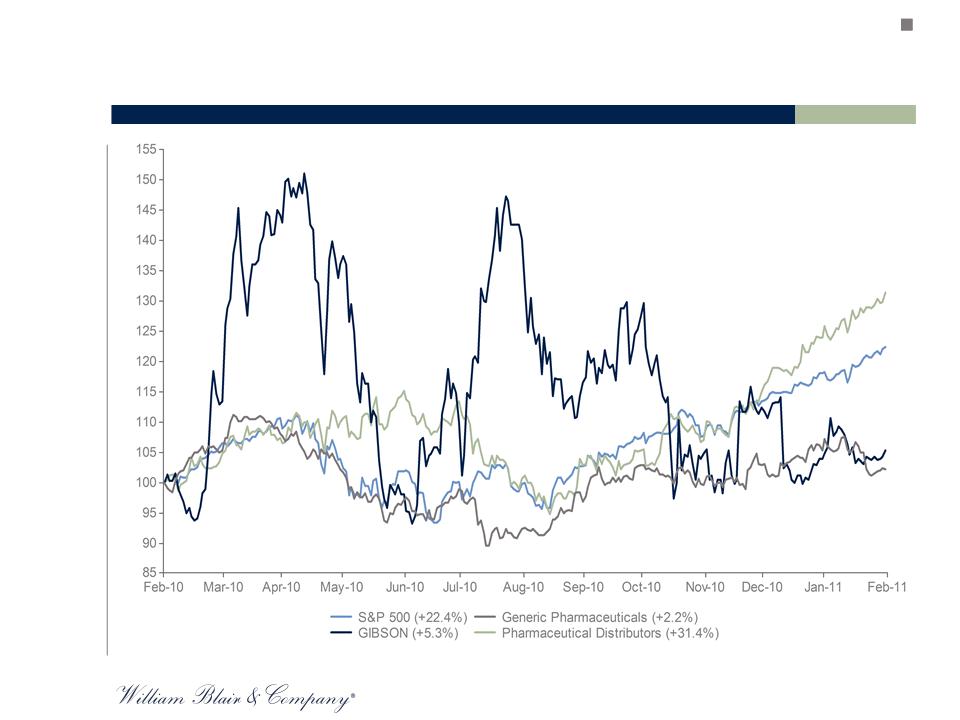
Stock Price Performance Last Twelve Months
Selected Public Companies Analysis
+22.4%
+2.2%
Source: FactSet as of February 17, 2011.
Note: Generic Pharmaceuticals include Dr. Reddy’s, Lupin, Mylan, Par Pharmaceuticals, Ranbaxy Laboratories, Teva Pharmaceuticals and Watson Pharmaceuticals;
Pharmaceutical Distributors include AmerisourceBergen, Cardinal Health and McKesson.
+31.4%
+5.3%
14
Selected Public Companies -
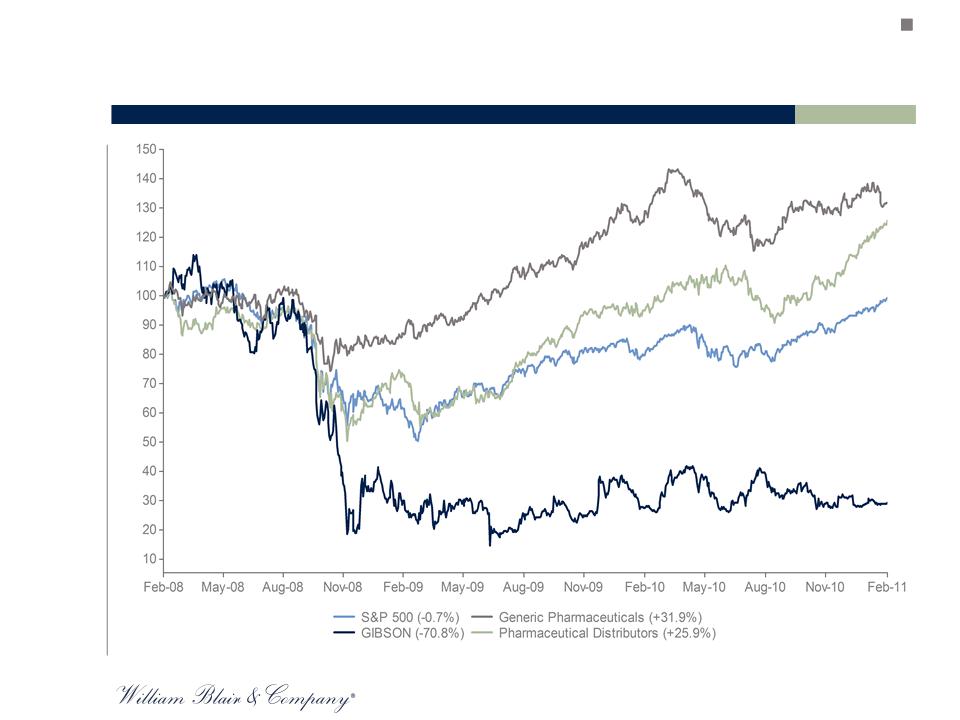
Stock Price Performance Last Three Years
Selected Public Companies Analysis
-0.7%
+31.9%
+25.9%
-70.8%
Source: FactSet as of February 17, 2011.
Note: Generic Pharmaceuticals include Dr. Reddy’s, Lupin, Mylan, Par Pharmaceuticals, Ranbaxy Laboratories, Teva Pharmaceuticals and Watson Pharmaceuticals;
Pharmaceutical Distributors include AmerisourceBergen, Cardinal Health and McKesson.
15
Selected Public Companies - Summary
Selected Public Companies Analysis
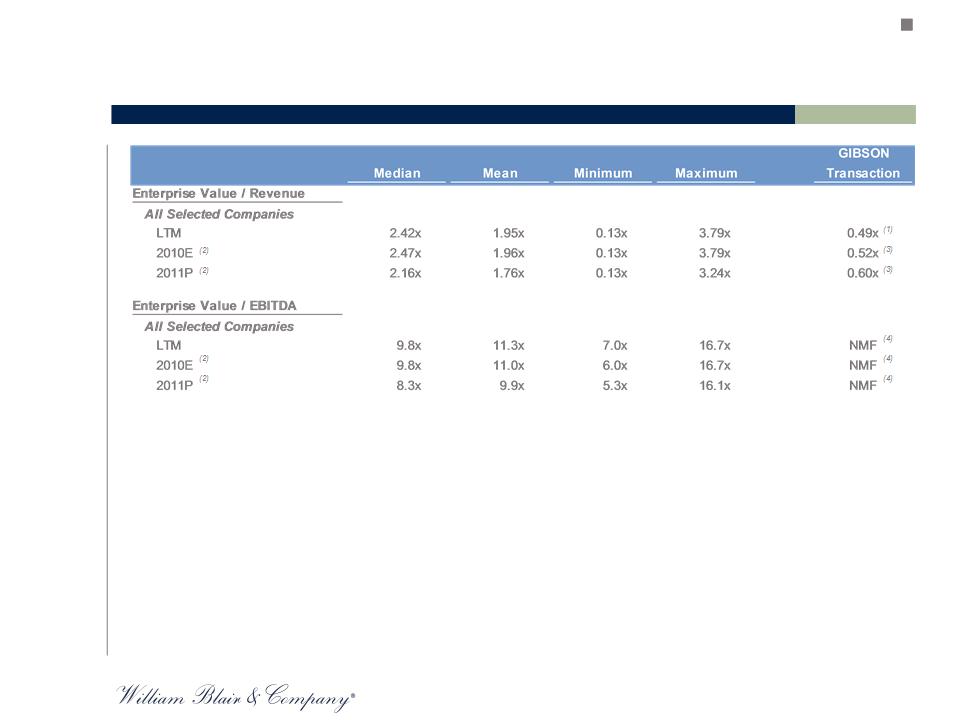
Sources: GIBSON management, public company filings, CapitalIQ, FactSet and Bloomberg as of February 17, 2011. Note that the selected public company multiples
reflect the inherent ongoing nature of their respective businesses; however, the GIBSON Distributed Products revenue is projected to cease in FY 2012.
(1)LTM for GIBSON as of December 31, 2010.
(2)Reflects full calendar year consensus estimates for selected companies.
(3)GIBSON estimates for 2010E reflect the fiscal year ending March 31, 2011. GIBSON estimates for 2011P reflect the fiscal year ending March 31, 2012.
(4)GIBSON EBITDA is negative in all periods presented above.
16
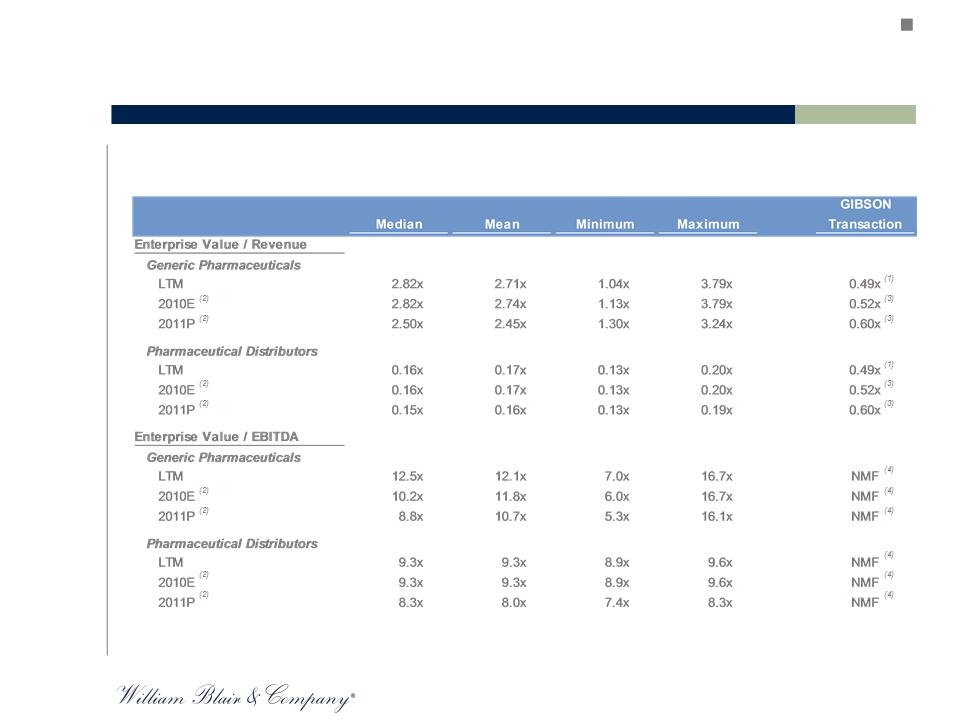
§ Given the discreet nature of GIBSON’s two primary business lines - distribution of third-party products and
development and manufacturing of GIBSON-owned products - William Blair also segmented the selected
companies into two separate groups for comparison to GIBSON (i.e., Generic Pharma and Pharma Distributors)
development and manufacturing of GIBSON-owned products - William Blair also segmented the selected
companies into two separate groups for comparison to GIBSON (i.e., Generic Pharma and Pharma Distributors)
Selected Public Companies - by Business Segment
Selected Public Companies Analysis
Sources: GIBSON management, public company filings, CapitalIQ, FactSet and Bloomberg as of February 17, 2011. Note that the selected public company multiples reflect the inherent
ongoing nature of their respective businesses; however, the GIBSON Distributed Products revenue is projected to cease in FY 2012.
(1)LTM for GIBSON as of December 31, 2010.
(2)Reflects full calendar year consensus estimates for selected companies.
(3)GIBSON estimates for 2010E reflect the fiscal year ending March 31, 2011. GIBSON estimates for 2011P reflect the fiscal year ending March 31, 2012.
(4)GIBSON EBITDA is negative in all periods presented above.
17
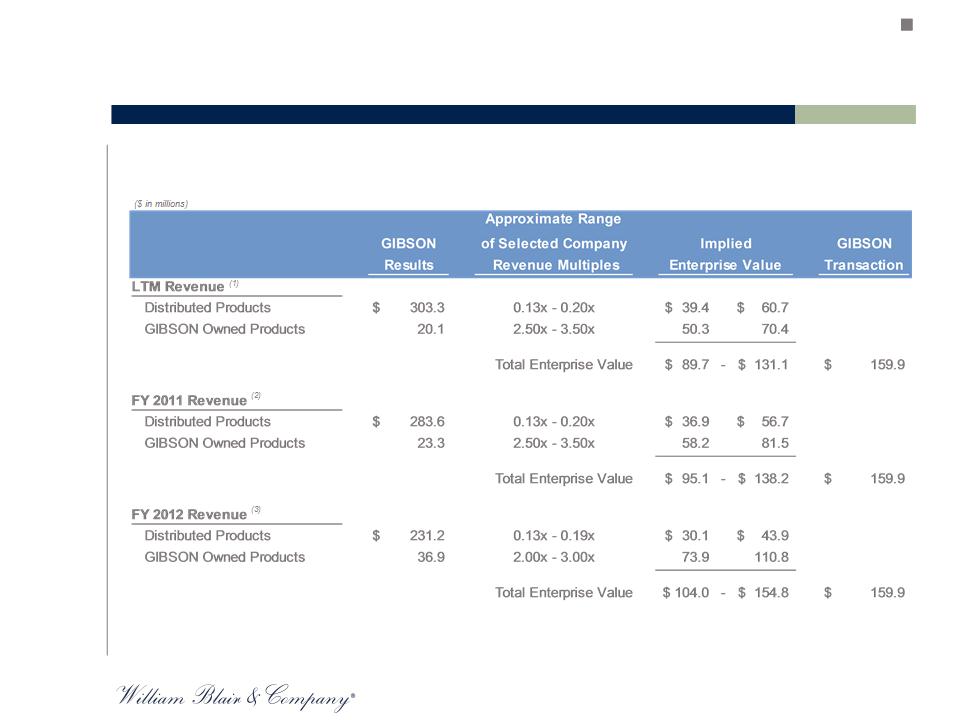
§ William Blair also applied the range of revenue multiples of the relevant selected company segment (i.e., Generic
Pharma or Pharma Distributors) to the revenue of the corresponding GIBSON business line to derive, for illustrative
comparison purposes, an enterprise value reflecting the sum of GIBSON’s parts
Pharma or Pharma Distributors) to the revenue of the corresponding GIBSON business line to derive, for illustrative
comparison purposes, an enterprise value reflecting the sum of GIBSON’s parts
Selected Public Companies - Illustrative Sum of Parts
Selected Public Companies Analysis
Sources: GIBSON management, public company filings, CapitalIQ, FactSet and Bloomberg as of February 17, 2011. Note that the selected public company multiples
reflect the inherent ongoing nature of their respective businesses; however, the GIBSON Distributed Products revenue is projected to cease in FY 2012.
(1)LTM for GIBSON as of December 31, 2010.
(2)GIBSON estimates reflect the fiscal year ending March 31, 2011.
(3)GIBSON estimates reflect the fiscal year ending March 31, 2012.
18
Selected Public Companies - Operating Metrics
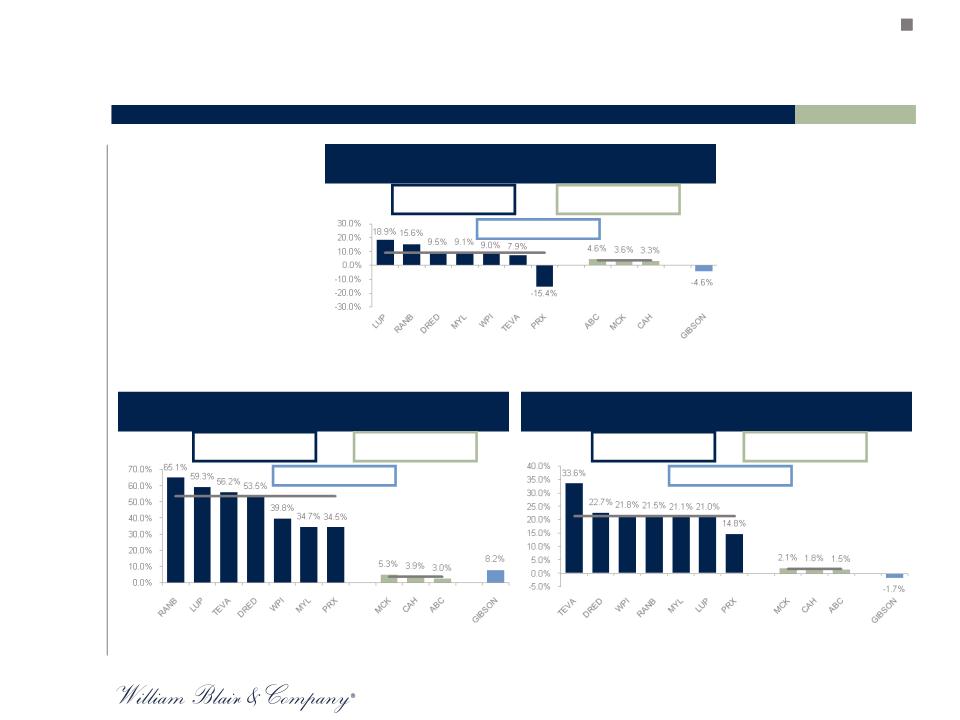
LTM EBITDA Margin
2009-2011P Revenue CAGR
LTM Gross Margin
Selected Public Companies Analysis
Pharmaceutical Distributors
Median: 3.6%
Median: 3.6%
Generic Pharmaceuticals
Median: 9.1%
Pharmaceutical Distributors
Median: 3.9%
Median: 3.9%
Generic Pharmaceuticals
Median: 53.5%
Median: 53.5%
Pharmaceutical Distributors
Median: 1.8%
Median: 1.8%
Generic Pharmaceuticals
Median: 21.5%
Median: 21.5%
Sources: GIBSON management, public company filings, CapitalIQ, FactSet and Bloomberg as of February 17, 2011.
Note: LTM for GIBSON as of December 31, 2010. Projected metrics for selected companies reflect calendar year consensus.
(1) GIBSON results per management. GIBSON estimates for 2009 reflect the fiscal year ending March 31, 2010. GIBSON estimates for 2011P reflect the fiscal year
ending March 31, 2012.
Overall Median: 8.4%
Overall Median: 37.3%
Overall Median: 21.1%
(1)
19
Selected Public Companies - Valuation Metrics
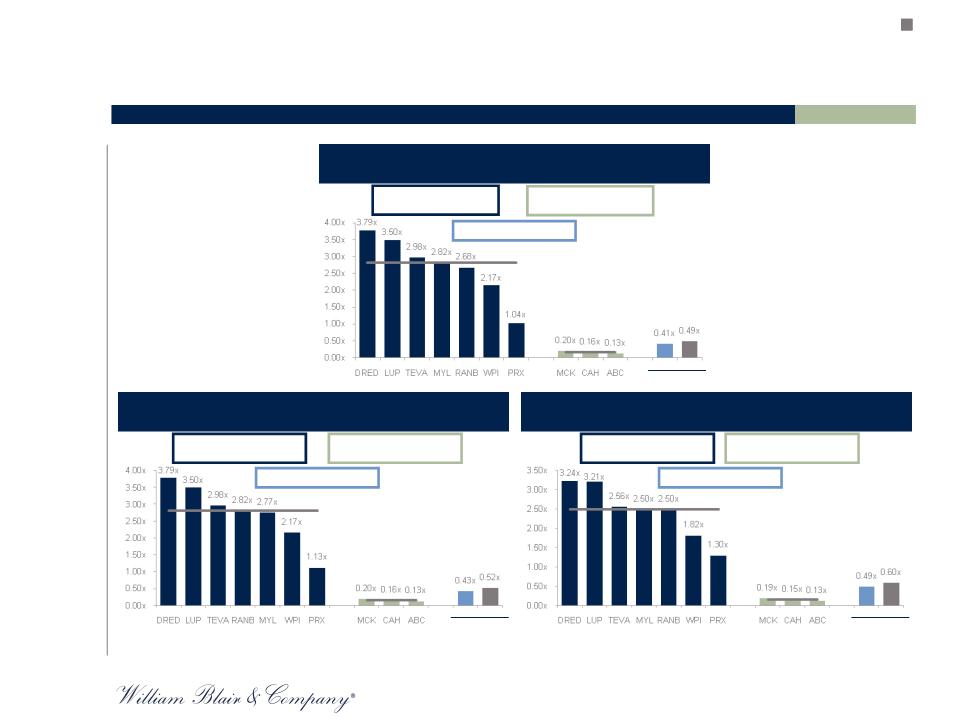
Enterprise Value / LTM Revenue
Enterprise Value / 2011P Revenue
Enterprise Value / 2010E Revenue
Selected Public Companies Analysis
GIBSON
As of
Dec. 3,
2010
Dec. 3,
2010
At Transaction
price of
$5.25/share
price of
$5.25/share
GIBSON
Pharmaceutical Distributors
Median: 0.16x
Median: 0.16x
Generic Pharmaceuticals
Median: 2.82x
Median: 2.82x
Pharmaceutical Distributors
Median: 0.16x
Median: 0.16x
Generic Pharmaceuticals
Median: 2.82x
Median: 2.82x
Pharmaceutical Distributors
Median: 0.15x
Median: 0.15x
Generic Pharmaceuticals
Median: 2.50x
Median: 2.50x
As of
Dec. 3,
2010
Dec. 3,
2010
At Transaction
price of
$5.25/share
price of
$5.25/share
GIBSON
As of
Dec. 3,
2010
Dec. 3,
2010
At Transaction
price of
$5.25/share
price of
$5.25/share
Sources: GIBSON management, public company filings, CapitalIQ, FactSet and Bloomberg as of February 17, 2011. Note that the selected public company multiples reflect the inherent ongoing nature of their respective
businesses; however, the GIBSON Distributed Products revenue is projected to cease in FY 2012.
Note: LTM for GIBSON as of December 31, 2010. Projected metrics for selected companies reflect calendar year consensus.
(1) GIBSON results per management. GIBSON estimates for 2010 reflect the fiscal year ending March 31, 2011. GIBSON estimates for 2011P reflect the fiscal year ending March 31, 2012.
Overall Median: 2.42x
Overall Median: 2.47x
Overall Median: 2.16x
(1)
(1)
20
Selected Public Companies - Valuation Metrics (continued)
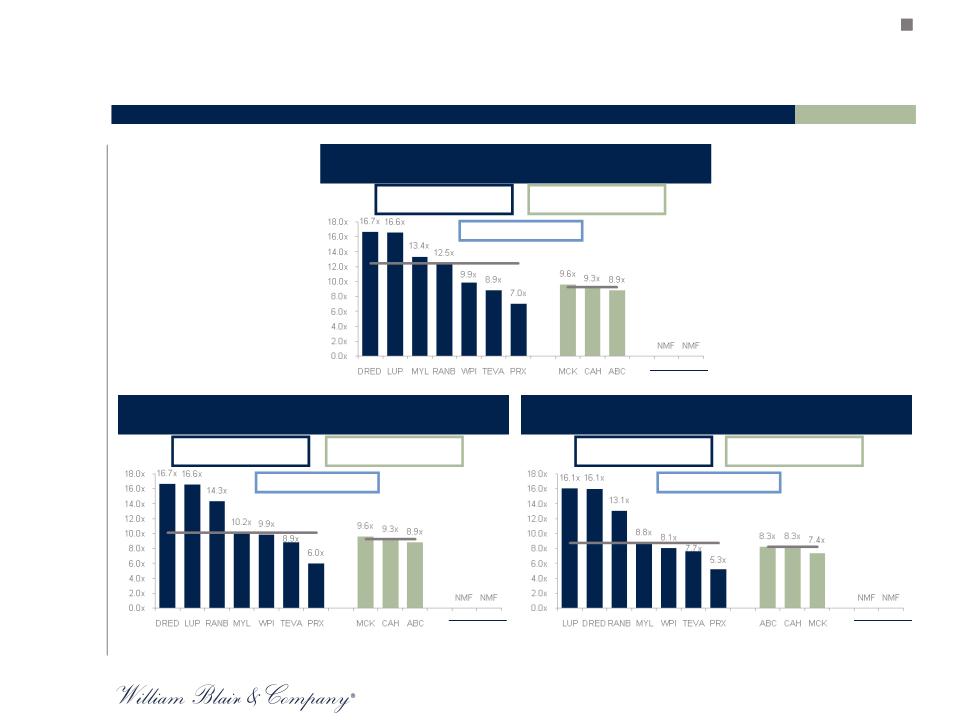
Enterprise Value / LTM EBITDA
Enterprise Value / 2011P EBITDA
Enterprise Value / 2010E EBITDA
Selected Public Companies Analysis
Pharmaceutical Distributors
Median: 9.3x
Median: 9.3x
Generic Pharmaceuticals
Median: 12.5x
Median: 12.5x
Pharmaceutical Distributors
Median: 9.3x
Median: 9.3x
Generic Pharmaceuticals
Median: 10.2x
Median: 10.2x
Pharmaceutical Distributors
Median: 8.3x
Median: 8.3x
Generic Pharmaceuticals
Median: 8.8x
Median: 8.8x
GIBSON
As of
Dec. 3,
2010
Dec. 3,
2010
At Transaction
price of
$5.25/share
price of
$5.25/share
GIBSON
As of
Dec. 3,
2010
Dec. 3,
2010
At Transaction
price of
$5.25/share
price of
$5.25/share
GIBSON
As of
Dec. 3,
2010
Dec. 3,
2010
At Transaction
price of
$5.25/share
price of
$5.25/share
Sources: GIBSON management, public company filings, CapitalIQ, FactSet and Bloomberg as of February 17, 2011. Note that the selected public company multiples reflect the inherent ongoing nature of their respective
businesses; however, the GIBSON Distributed Products revenue is projected to cease in FY 2012.
Note: LTM for GIBSON as of December 31, 2010. Selected company projected metrics reflect calendar year consensus estimates.
(1) GIBSON results per management. GIBSON EBITDA is negative in all periods presented above.
Overall Median: 9.8x
Overall Median: 8.3x
(1)
(1)
(1)
21
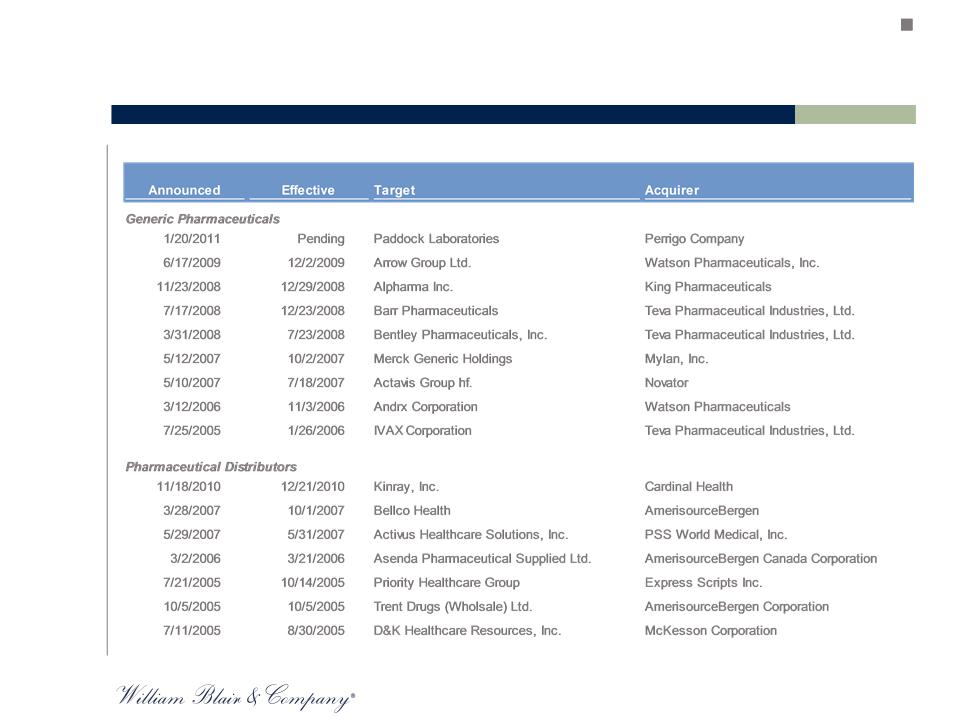
Selected M&A Transactions Analysis
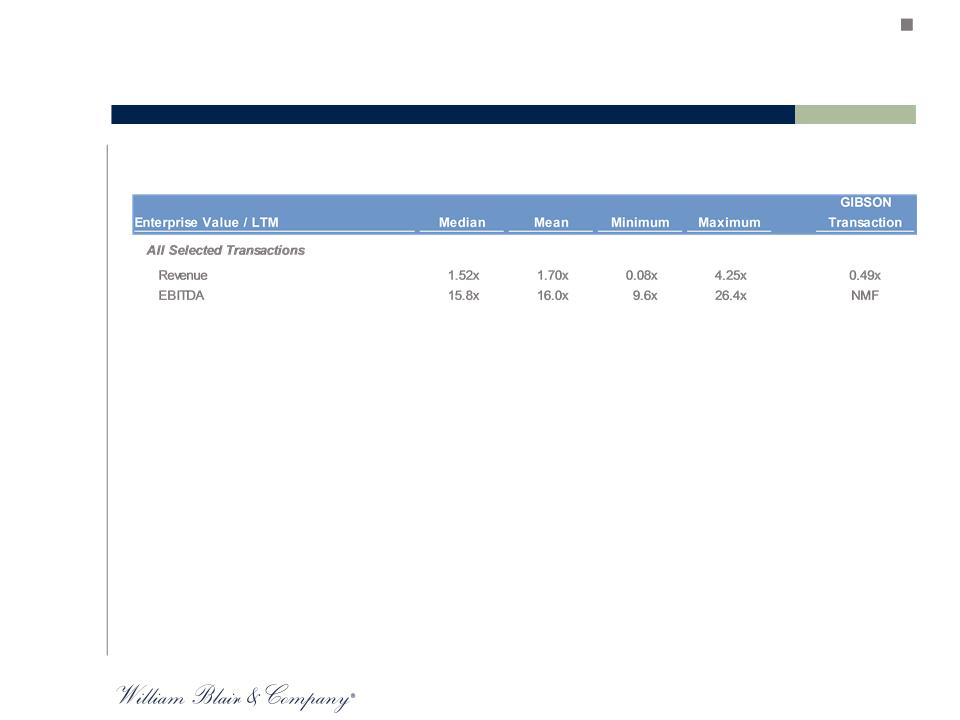
§ William Blair selected 16 M&A transactions completed since 2005 that we deemed relevant to the
GIBSON transaction
GIBSON transaction
Selected M&A Transactions - Summary
Selected M&A Transactions Analysis
Sources: GIBSON management, public company filings, CapitalIQ, FactSet and Bloomberg. Note that the selected M&A transaction multiples reflect the inherent
ongoing nature of their respective businesses; however, the GIBSON Distributed Products revenue is projected to cease in FY 2012.
(1)LTM for GIBSON as of December 31, 2010.
(2)GIBSON EBITDA is negative for the LTM period.
(1)
(2)
22
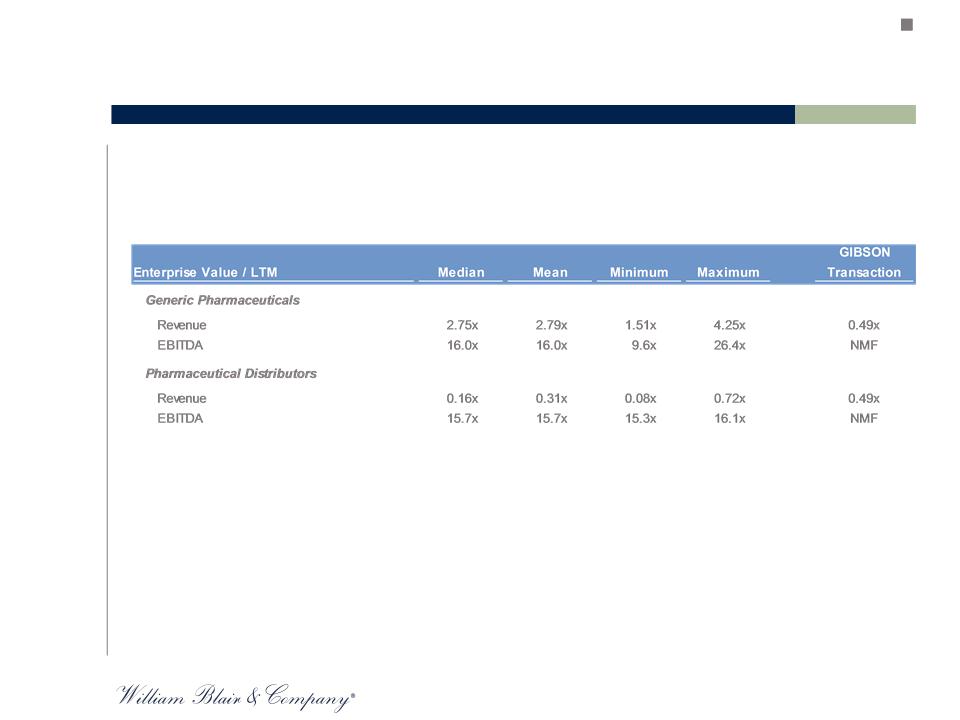
§ Given the discreet nature of GIBSON’s two primary business lines - distribution of third-party products and
development and manufacturing of GIBSON-owned products - William Blair also segmented the selected
M&A transactions into two separate groups for comparison to the GIBSON transaction (i.e., Generic
Pharma and Pharma Distributors)
development and manufacturing of GIBSON-owned products - William Blair also segmented the selected
M&A transactions into two separate groups for comparison to the GIBSON transaction (i.e., Generic
Pharma and Pharma Distributors)
Selected M&A Transactions - by Business Segment
Selected M&A Transactions Analysis
Sources: GIBSON management, public company filings, CapitalIQ, FactSet and Bloomberg. Note that the selected M&A transaction multiples reflect the inherent
ongoing nature of their respective businesses; however, the GIBSON Distributed Products revenue is projected to cease in FY 2012.
(1)LTM for GIBSON as of December 31, 2010.
(2)GIBSON EBITDA is negative for the LTM period.
(1)
(2)
(1)
(2)
23
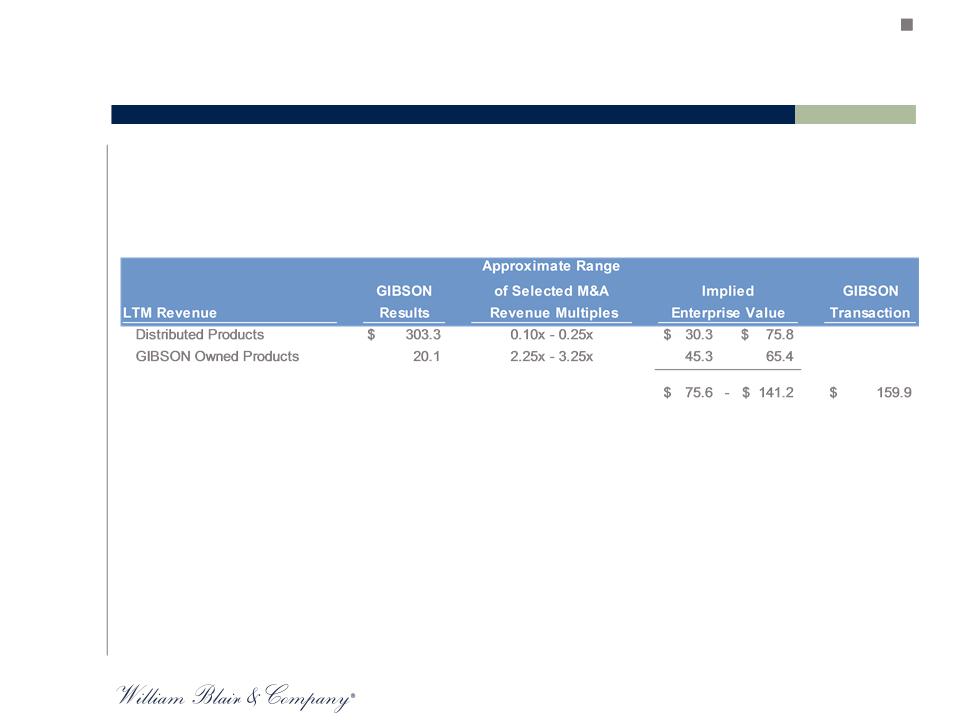
Selected M&A Transactions - Illustrative Sum of Parts
Selected M&A Transactions Analysis
§ William Blair also applied the range of revenue multiples of the relevant selected transactions (i.e.,
Generic Pharma or Pharma Distributors) to the revenue of the corresponding GIBSON business line to
derive, for illustrative comparison purposes, an enterprise value reflecting the sum of GIBSON’s parts
Generic Pharma or Pharma Distributors) to the revenue of the corresponding GIBSON business line to
derive, for illustrative comparison purposes, an enterprise value reflecting the sum of GIBSON’s parts
($ in millions)
(1)
Sources: GIBSON management, public company filings, CapitalIQ, FactSet and Bloomberg. Note that the selected M&A transaction multiples reflect the inherent
ongoing nature of their respective businesses; however, the GIBSON Distributed Products revenue is projected to cease in FY 2012.
(1)LTM for GIBSON as of December 31, 2010.
24
Selected M&A Transactions - Detail
Selected M&A Transactions Analysis
($ in millions)
Sources: Public company filings, CapitalIQ, FactSet and Bloomberg.
25
M&A Premiums Paid Analysis
Premiums in Public Acquisitions
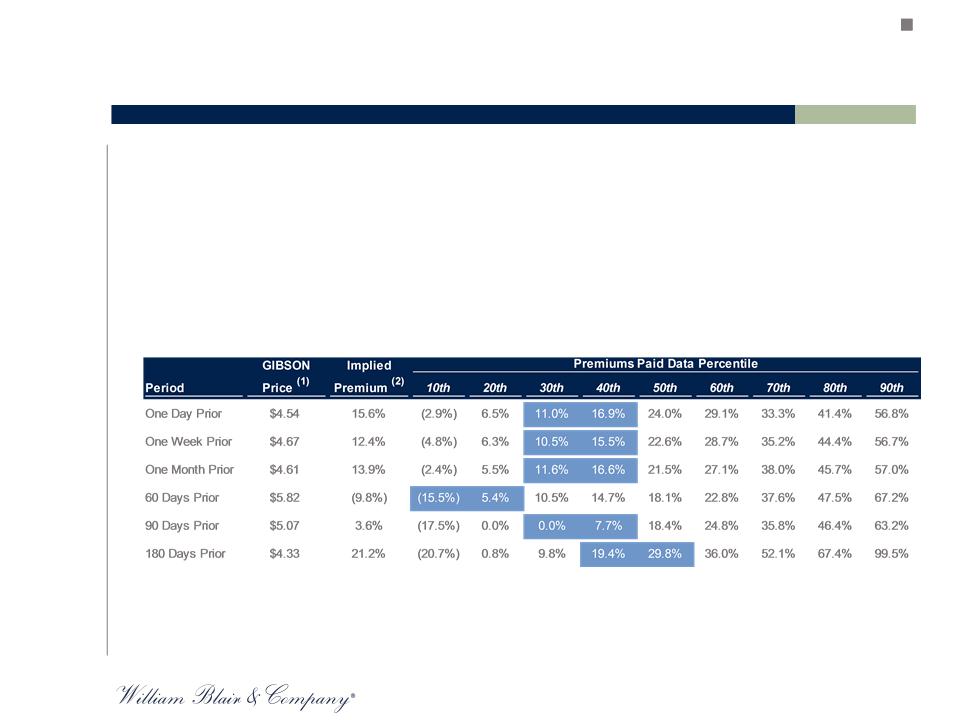
§ William Blair analyzed 66 domestic public transactions announced since January 1, 2005 with transaction
values greater than $10 million in which 1.0% to 49.9% of the target’s equity was acquired with the acquiror
owning greater than 50% but less than 99% of the target prior to the transaction. Upon completion of the
transaction the acquiror owned 100% of the target.
values greater than $10 million in which 1.0% to 49.9% of the target’s equity was acquired with the acquiror
owning greater than 50% but less than 99% of the target prior to the transaction. Upon completion of the
transaction the acquiror owned 100% of the target.
§ William Blair compared the price of each transaction to the closing price of the target stock one day, one
week, one month, 60 days, 90 days and180 days prior to the December 3, 2010 announcement of the
transaction
week, one month, 60 days, 90 days and180 days prior to the December 3, 2010 announcement of the
transaction
§ William Blair then compared the range of premiums calculated from that universe to the premiums implied by
the FENDER proposal
the FENDER proposal
M&A Premiums Paid Analysis
Source: FactSet Research Systems. Data as of February 17, 2011.
(1) GIBSON prices reflect time periods prior to the December 3, 2010 announcement of FENDER’s initial proposal.
(2) Implied premium to current FENDER offer of $5.25 per share.
26
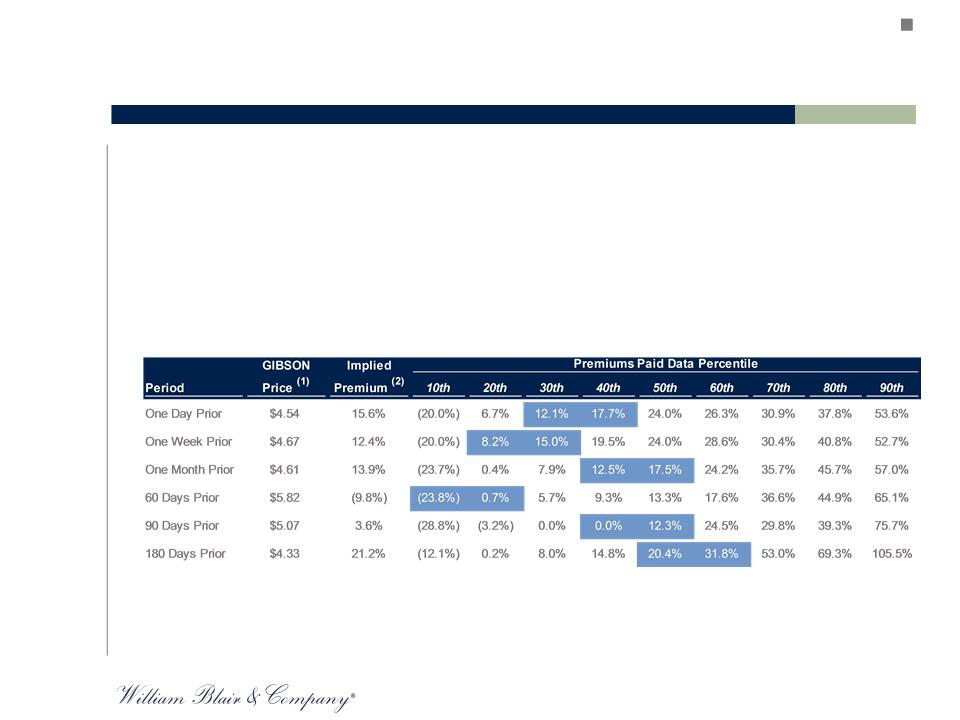
§ William Blair analyzed 26 domestic public transactions announced since January 1, 2005 with transaction
values greater than $10 million in which 15% to 35% of the target’s equity was acquired with the acquiror
owning between 65% to 85% of the target prior to the transaction. Upon completion of the transaction the
acquiror owned 100% of the target.
values greater than $10 million in which 15% to 35% of the target’s equity was acquired with the acquiror
owning between 65% to 85% of the target prior to the transaction. Upon completion of the transaction the
acquiror owned 100% of the target.
§ William Blair compared the price of each transaction to the closing price of the target stock one day, one
week, one month, 60 days, 90 days and180 days prior to the December 3, 2010 announcement of the
transaction
week, one month, 60 days, 90 days and180 days prior to the December 3, 2010 announcement of the
transaction
§ William Blair then compared the range of premiums calculated from that universe to the premiums implied by
the FENDER proposal
the FENDER proposal
M&A Premiums Paid Analysis
Premiums in Public Acquisitions
Source: FactSet Research Systems. Data as of February 17, 2011.
(1) GIBSON prices reflect time periods prior to the December 3, 2010 announcement of FENDER’s initial proposal.
(2) Implied premium to current FENDER offer of $5.25 per share.
27
Discounted Cash Flow Analysis
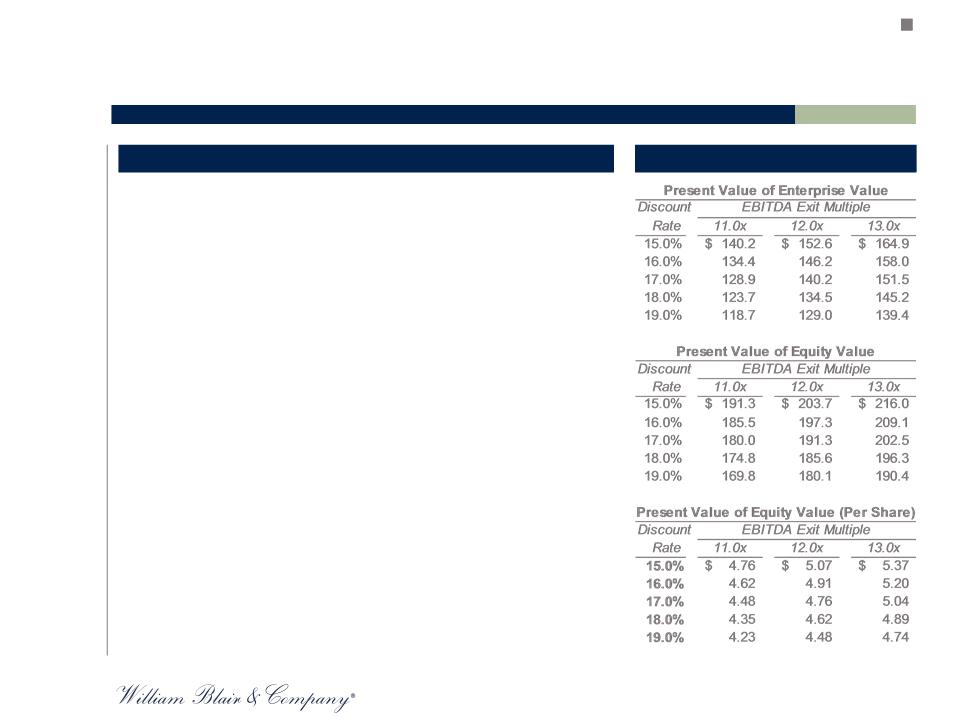
§ Performed a discounted cash flow analysis of GIBSON’s stand-
alone projected results to calculate the present value of GIBSON
based on its future cash flows
alone projected results to calculate the present value of GIBSON
based on its future cash flows
§ Discounted projections to January 31, 2011
§ Utilized the unaudited balance sheet as of December 31, 2010
per GIBSON 10-Q and projections for Q4 FY 2011E through FY
2016P (Income Statement, Balance Sheet and Statement of Cash
Flows) provided by management
per GIBSON 10-Q and projections for Q4 FY 2011E through FY
2016P (Income Statement, Balance Sheet and Statement of Cash
Flows) provided by management
§ Assumed net cash of $51.1 million per GIBSON 10-Q as of
December 31, 2010
December 31, 2010
§ Assumed fully-diluted shares outstanding of 40.2 million per
GIBSON 10-Q as of December 31, 2010
§ Assumed GIBSON tax rate of 40.0% in all years on taxable
income
income
§ Developed a valuation range based on the following parameters:
§ Terminal EBITDA multiples ranging from 11.0x to 13.0x
§ Discount rates ranging from 15.0% to 19.0%
§ The enterprise value generated by the terminal value
represents approximately 100% of the total enterprise value
Discounted Cash Flow Analysis
Parameters
Sensitivity Analysis
($ in millions, except per share values)
Note: To estimate the cash flow generated during the months of February and March of 2011, William Blair assumed two-thirds of the projected fiscal quarter ending March 31, 2011.
(1) Parameters were derived from a variety of data and other factors, including selected companies and transactions detailed earlier in the materials herein.
(1)
28