EXHIBIT 99.2
MRV COMMUNICATIONS
Moderator: Anne Marie Frisch
February 05, 2004/2:00 p.m. PT
Page 1
MRV COMMUNICATIONS
February 05, 2004
2:00 p.m. PT
| | | |
| Coordinator | | Good afternoon, ladies and gentlemen, and welcome to the MRV Communications Fourth Quarter Results Conference Call. Throughout this conference all lines will be on listen only. At this time I would like to turn the conference over to your host for today’s call, Miss Diane Hayden, Director of Corporate Communications. |
| | | |
| D. Hayden | | Thank you, Rob. Good afternoon everyone and thank you for joining us today. With me on today’s call is Noam Lotan, our President and CEO and Shay Gonen, our CFO. |
| | | |
| | | If you haven’t seen the press release, it can be retrieved at www.mrv.com or off First Call or PR Newswire. In addition, this conference call is being Web cast on our company Web page and will be available for replay. We will provide replay information at the end of today’s call. |
MRV COMMUNICATIONS
Moderator: Anne Marie Frisch
February 05, 2004/2:00 p.m. PT
Page 2
| | | |
| | | Today Noam will provide an introduction and Shay will review in detail the financial results for the fourth quarter ending December 31, 2003. Following Shay’s comments Noam will discuss the fourth quarter highlights and MRV’s strategy going forward. A financial highlight and overview will be available in conjunction with this fourth quarter 2003 teleconference and Web cast. The presentation can be downloaded at www.mrv.com\investor\quarterly_center.php. |
| | | |
| | | Before we begin with the call let me take a few minutes to remind you, the press release teleconference and presentation for the fourth quarter and yearend 2003 results, contain forward-looking statements within the meaning of Section 21E of the Securities Exchange Act of 1934 and is subject to the Safe Harbor created by that section. These forward-looking statements include statements by Mr. Lotan and Mr. Gonen, relating the competitive environment in 2004, the company’s expectations of future success in achieving its objectives. |
| | | |
| | | Any forward-looking statements in this presentation teleconference are subject to a number of risks and uncertainties, including the strength of the overall economy and the high technology market in particular, competition, product development efforts and acceptance of MRV |
MRV COMMUNICATIONS
Moderator: Anne Marie Frisch
February 05, 2004/2:00 p.m. PT
Page 3
| | | |
| | | Communication’s current and future products. Actual results could differ materially from those projected in our forward-looking statements. Investors should review the risk factors described in more detail in our most recent SEC reports, available free of charge, from MRV Communications at www.mrv.com or from the SEC at www.sec.gov. |
| | | |
| | | MRV Communications assumes no obligation to update the forward-looking statements contained in this presentation and teleconference. Any information contained herein should be read in conjunction with the February 5, 2004 Q4 financial results press release with accompanying financial tables. Noam? |
| | | |
| N. Lotan | | Thank you, Diana. Good afternoon and welcome to our call. Q4 was a strong quarter, revenue increased 27% sequentially and 6% year-over-year. Next quarter we also anticipate to be up, with revenue up year-over-year. Revenue for the networking group, increased 27% sequentially, while the optical component group increased by 22%. Revenue in the United States were up 21% sequentially and 30% in Europe. Operating expenses continue to trend down and our operating loss was cut in half from the previous quarter. |
MRV COMMUNICATIONS
Moderator: Anne Marie Frisch
February 05, 2004/2:00 p.m. PT
Page 4
| | | |
| | | The bottom line improved substantially. Return to profitability is now within our reach. The trend continues to be positive and our outlook is good for the first quarter. Considering the seasonal downturn from Q4 to Q1, we anticipate a year-over-year increase of 12% to 20%. Accordingly Q1 revenue will be in the $57 million to $61 million range. With respect to the bottom line, we believe we can continue to deliver further improvements in future quarters. |
| | | |
| | | We are very proud of what we were able to accomplish, not only in the past quarter, but also for the past year. We have a team that executes well and we certainly see further growth ahead. Let me now turn the call over to Shay, for more details on our financial results. |
| | | |
| S. Gonen | | Thank you Noam. Good afternoon everyone and thank you for joining us for MRV’s fourth quarter conference call. Let me start with a brief review of our highlighted results. You may turn now to slide number six, please. |
| | | |
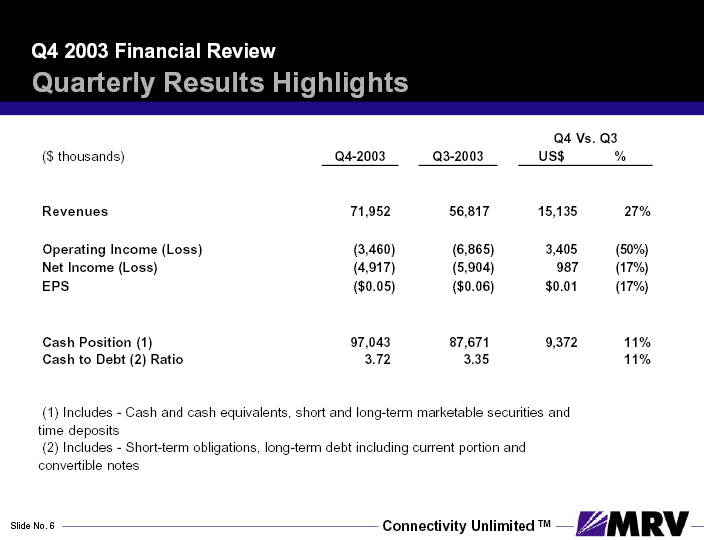
| | | Our revenues, which exceeded our guidance, were $72 million in Q4, compared to $56.8 million in the previous quarter, reflecting an increase of 27% sequentially. Our net loss for Q4 was $4.9 million compared to |
MRV COMMUNICATIONS
Moderator: Anne Marie Frisch
February 05, 2004/2:00 p.m. PT
Page 5
| | | |
| | | $5.9 million for Q3, a 17% improvement of $0.05 per share for Q4, compared to $0.06 per share for Q3. |
| | | |
| | | We also reduced our operating loss by 60%, to $3.5 million from $6.9 million in the previous quarter. As for our consolidated cash position, including cash and cash equivalents, short-term and long-term marketable securities and time deposits, during the fourth quarter of ’03, we increased our cash by $9.4 million compared to cash consumption of $4.1 million in the previous quarter. Therefore, our yearend cash position totaled $97 million compared to $87.7 million for the previous quarter. Accordingly, cash to debt ratio improved from 3.4 to 3.7. |
| | | |
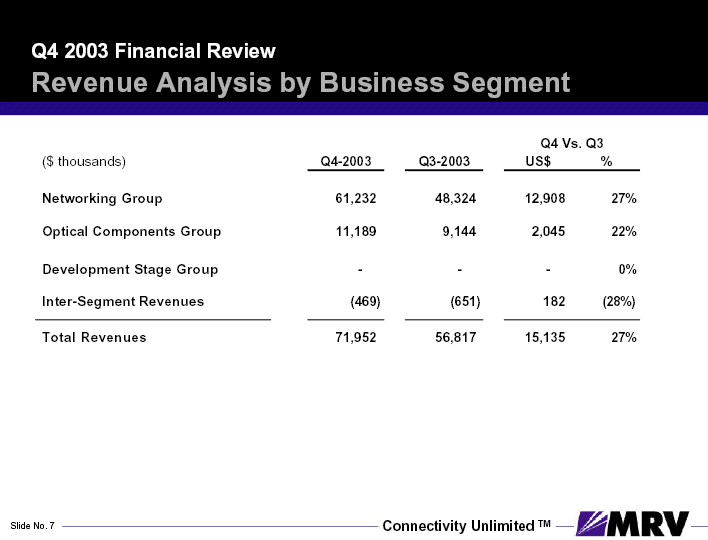
| | | Now I would like to break down our revenues by business segment, geographical regions and product lines. Let us start with our revenues by business segment, slide number seven, please. We present segment reporting information according to the following segments: Networking Group; Optical Component Group; and Development Stage and Deployed Group. |
| | | |
| | | Accordingly, our revenues by business segment for Q4 and Q3 were as follows. For the networking group, revenues increased sequentially by |
MRV COMMUNICATIONS
Moderator: Anne Marie Frisch
February 05, 2004/2:00 p.m. PT
Page 6
| | | |
| | | 27% to $61.2 million in Q4, compared to $48.3 million in Q3. Revenues for the optical component group increased by 22% to $11.2 million in Q4 compared to $9.1 million in Q3. Our intra-segment revenues from the optical component group to the networking group were $469,000 in Q4 compared to $651,000 in Q3. These revenues are eliminated in our consolidated revenues. There were no revenues generated by our development stage enterprise group. |
| | | |
| | | Please turn now to slide number eight. With respect to geographical breakdown, we provide revenue data bay the following regions: the Americas; Europe; Asia-Pacific; and other regions, which include the Middle East and Africa. The geographical breakdown, as a percentage of revenues for Q4 and Q3 were as follows. Q4 revenues in the Americas were 21% in Q4 compared to 22% in Q3. In absolute dollars revenues in the Americas increased by $2.6 million or 21%. Q4 revenues in Europe were 73% compared to 71% in Q3. In absolute dollars revenues in Europe increased by $11.9 million or 30%. This seasonal increase is typical for the European business. Q4 revenues in Asia-Pacific were 6% in Q4 compared to 7% in Q3. In absolute dollars revenues for Asia-Pacific increased by $409,000 or 10%, mainly in optical components. Q4 revenues in other regions remained at one-percent or less. |
MRV COMMUNICATIONS
Moderator: Anne Marie Frisch
February 05, 2004/2:00 p.m. PT
Page 7
| | | |
| | | For product line analogies, please turn to slide number nine. As I previously mentioned, revenues were $72 million, of which 90% consisted of product revenues, while 10% were service related revenues. Product line revenue as a percentage of revenue for Q4 versus Q3, were as follows. Optical active components were 18% in Q4 compared to 15% in Q3. Optical passive components were 6% in Q4 compared to 5% in Q3. Network physical infrastructure products were 18% in Q4 compared to 22% in Q3. Although in absolute dollars revenue remained unchanged at $12.7 million. |
| | | |
| | | Switches and routers were 29% in Q4 compared to 24% in Q3. Remote device management products were 6% in Q4 compared to 9% in Q3. Although in absolute dollars remote management products slightly decreased by $465,000. Of service and other revenues, service related revenues were 10% of revenues in Q4 compared to 9% of revenues in Q3, an increase of 38% in absolute dollars. |
| | | |
| | | In other network product revenues, we include communication network for aerospace, defense and other applications including cellular |
MRV COMMUNICATIONS
Moderator: Anne Marie Frisch
February 05, 2004/2:00 p.m. PT
Page 8
| | | |
| | | communications. These revenues were 14% in Q4 compared to 15% of revenues in Q3, representing a sequential increase of $1.4 million or 16%. |
| | | |
| | | In Q4, we continued to strengthen our system integration and distribution capabilities. We sell in markets, our products, with other products manufactured by third party vendors, supplied as part of network integration and distribution services. Successful partnerships are key components of our overall strategy and allow MRV to offer best of class in networking solutions. Revenue generated from the sale of third party products, through our system integration and distribution offices were 49% in Q4 compared to 45% in Q3. |
| | | |
| | | Looking at our consolidated P&L, the following items are worthy of note. Slide number ten, please. |
| | | |
| | | Net Loss. As stated before, our net loss in Q4 was $4.9 million compared to $5.9 million in Q3. Please remember that Q3 results included a substantial extraordinary gain. We acquired preferred shares in one of our development stage divisions from a minority shareholder, which resulted in an extraordinary gain of approximately $2 million. We also included in Q3, income from the recapturing of accelerated deferred stock expense |
MRV COMMUNICATIONS
Moderator: Anne Marie Frisch
February 05, 2004/2:00 p.m. PT
Page 9
| | | |
| | | from terminated employees of $861,000, where in Q4 we had deferred stock expense of $309,000. |
| | | |
| | | Gross Profit. Our gross profit for Q4 increased by $2.8 million to $21.2 million. Our growth margin was 30% of revenues compared to 32% in the previous quarter, resulting from the increase in third party equipment sales, which generated lower margins. |
| | | |
| | | Product Development and Engineering. Our product development and engineering expense in Q4 decreased by $830,000 to $7.3 million or 10% of revenues compared to $8.1 million or 14% of revenues in Q3. |
| | | |
| | | Selling, General and Administration. Our SG&A expense in Q4 was 24% of revenues compared to 30% in Q3. In absolute dollars our SG&A was $17.4 million compared to $16.8 million for Q3. In Q4 our SG&A includes deferred stock expense of $136,000 as compared to income from the capturing of accelerated deferred stock expense due to terminated employees, totaling $985,000 in Q3. |
| | | |
| | | Operating Loss. We were able to reduce our operating loss in Q4 by $3.4 million or 50% from $6.9 million to $3.5 million. Our operating loss |
MRV COMMUNICATIONS
Moderator: Anne Marie Frisch
February 05, 2004/2:00 p.m. PT
Page 10
| | | |
| | | included deferred stock expense of $309,000 as compared to income from recapturing accelerated deferred stock expense due to terminated employees, totaling $861,000 in Q3. |
| | | |
| | | Other Expenses Net. Other expenses for Q4 remained constant at less than one-percent of revenues and were $450,000 compared to $526,000 for Q3. Q4 other expenses consisted mainly of interest expense on our convertible notes issued in ’03. |
| | | |
| | | Looking at our consolidated balance sheet, the following items are worthy of note. Please turn to slide number eleven. |
| | | |
| | | Overall Debt. Our short-term and long-term obligations, including our convertible notes, as of December 31, 2003 remained constant at $26.1 million. Our cash to debt ratio as of yearend was 3.7 to 1 compared to 3.4 to 1 at the end of Q3, reflecting improvement of 11%. |
| | | |
| | | Cash. As of December 31, 2003 our consolidated cash, cash ... short-term and long-term multiple securities and time deposits were $97 million compared to $87.7 million for the previous quarters. The increase in cash in Q4 was $9.4 million compared to a decrease of $4.1 million in Q3. The |
MRV COMMUNICATIONS
Moderator: Anne Marie Frisch
February 05, 2004/2:00 p.m. PT
Page 11
| | | |
| | | increase of cash is partially due to the sale of approximately $1.7 million newly issued shares of MRV’s common stock to several institutional investors in ... of ’03. This transaction generated profit of approximately $5 million. |
| | | |
| | | Our cash also increased due to improved collection and reduction in overall spending. In Q4 we used approximately $1.2 million in our development stage enterprise group, compared to $1.5 million in Q3. |
| | | |
| | | Accounts Receivables. In Q4 accounts receivables increased to $57.3 million compared to $52.3 million in Q3, an increase of $5 million or approximately 10%. This increase in absolute dollars is attributed to the increase in our revenues. DSOs in Q4 were 72 days compared to 84 days in Q3, translating to a 14% improvement. |
| | | |
| | | Inventory. In Q4 inventory remained unchanged at approximately $36 million. Therefore days in inventory for Q4 were 64 days compared to 85 days in Q3. This reflects a reduction of 24%. |
MRV COMMUNICATIONS
Moderator: Anne Marie Frisch
February 05, 2004/2:00 p.m. PT
Page 12
| | | |
| | | Accounts Payable. Accounts payable in Q4 increased to $50.6 million compared to $42.6 million in Q3, representing an increase of $8.1 million or approximately 19%. |
| | | |
| | | As for the outlook, Noam mentioned that our outlook is good for the first quarter. Considering the seasonal downturn from Q4 to Q1, we still anticipate a year-over-year increase of 12% to 20%. Today we report Q4 revenue of $72 million and Q1 revenue are expected to be in the $57 million to $61 million range an approximate increase of 15% year-over-year. |
| | | |
| | | We also expect our bottom line to continue the improvement trend. With that I would like to turn the call back to Noam Lotan, our President and CEO. Noam, please. |
| | | |
| N. Lotan | | Thank you, Shay. Let’s talk about the environment and then we will comment on our growth strategy. Clearly recent economic trends have been positive and that translated into increased demand. Our products are well positioned to succeed in the new economic environment. |
MRV COMMUNICATIONS
Moderator: Anne Marie Frisch
February 05, 2004/2:00 p.m. PT
Page 13
| | | |
| | | Four years have passed since the Y2K investment cycle and the peak of the Internet bubble. The typical life span for computing equipment is three to four years. Therefore the IT industry is beginning a technology upgrade cycle, with a focus on storage security and disaster recovery. |
| | | |
| | | On the carrier side more and more providers are rebuilding their network around IT and Ethernet product end services. This is encouraging for MRV, as our products fit very well in that environment. New technologies such as Voiceover IP and Wireless Access are getting attention as are new legal ways of distributing content over the Internet. |
| | | |
| | | All this spells a need for broadband access and that is Broadband with a capital B. Accordingly, carriers investment and infrastructure is already beginning to move from the core of the network, where the over investment was greatest during the bubble, to the edge of the network, where is needed the most. This is a shift toward Ethernet services for business and residential customers, as well as in Fiber-to-the-Premises or FTTP. We are now seeing the earliest phase in deployment of some of these next generation services. |
MRV COMMUNICATIONS
Moderator: Anne Marie Frisch
February 05, 2004/2:00 p.m. PT
Page 14
| | | |
| | | Currently carriers offer Ethernet services, mostly as retail point to point. They use a wide variety of technologies to transport the data across their infrastructure, including Sonnet SDH, as well as MPLS, WDM and RPR. This makes end to end management and carrier to carrier handoff very complex. The standard process aimed at solving these problems is advancing quickly. Fortunately MRV is at the lead edge of implementing the new standards for Ethernet service delivery. As the standards continue to mature, there will be more and more infrastructure investment directed toward Ethernet services, clearly MRV’s area of expertise. |
| | | |
| | | Let’s shift our attention to Fiber-to-the-Home or Fiber-to-the-Premises. Until recently Fiber-to-the-Premises was cost prohibitive. With a dramatic reduction in component costs, however, carriers can now obtain an acceptable ROI. Market dynamics are also prompting the ILECs to get serious with deployment of FTTP. Recently the U.S. has reached a 20% penetration of broadband in residential households. Some analysts consider this the tipping point for residential broadband to take off. This fact and the heated competition between the ILEC and cable operators could drive a new growth phase for broadband equipment vendors. |
MRV COMMUNICATIONS
Moderator: Anne Marie Frisch
February 05, 2004/2:00 p.m. PT
Page 15
| | | |
| | | The ILECs have been steadily losing broadband market share to cable providers or MSOs. The MSOs now control more than 60% of the market for broadband home connectivity. They have a well-established broadcast, TV and video-on-demand technology; therefore, they are in a better position to deliver the triple-play voice, video and data solution. To regain market share in broadband, a new investment in FTTP infrastructure is required by the ILECs. They need it for any serious triple-play deployment. To help out, recent FCC rulings exempt ILECs from unbundling fiber they installed in Greenfield developments. It is clearly designed to encourage investment in FTTP. |
| | | |
| | | Let’s move on to growth strategy. The emergence of Ethernet services represents an excellent opportunity for MRV. Our expertise in Ethernet access and aggregation, optical transport and remote management, in addition through luminous OIC, MRV offers the best and the most comprehensive range of components and the most expertise in FTTP. As Metro Ethernet continues to gain acceptance and carriers ship their investment from legacy TDM to IP and Ethernet, MRV sees more potential for growth. |
MRV COMMUNICATIONS
Moderator: Anne Marie Frisch
February 05, 2004/2:00 p.m. PT
Page 16
| | | |
| | | In the Ethernet access, at the point where the enterprise networks meet the service provider’s edge, we have the broadest range of solutions for network demarcation and aggregation. From remotely managed fiber converters to layer 23 and above, MRV has a wide suite of customer premises equipment of CPE. It includes the recently introduced OSM105, an intelligent security access router with VPN capability and extensive security features. |
| | | |
| | | Our access and aggregation solutions, Fiber Driver, Opti-Switch and OSM series, facilitate the deployment of Ethernet and IP services by incorporating the latest industry standards. These products are deployed in metro networks around the world and should continue to gain traction as Metro Ethernet spreads. |
| | | |
| | | New opportunities have also emerged with our remote device management products, the In-Reach and the LX families. We continue to gain traction with strategic partners, such as Sun Microsystems and others. Moreover some of our customers, telecom equipment vendors and carriers, plan to rollout voiceover IP gear. MRV helps provide the critical management and control of these networks. |
MRV COMMUNICATIONS
Moderator: Anne Marie Frisch
February 05, 2004/2:00 p.m. PT
Page 17
| | | |
| | | In optical transport, MRV advances the state of the art of wave division multiplexing, WDM, by using pluggable optics. Pluggable optics make both CWDM and DWDM solutions more affordable and flexible. It provides users with cap ex and off ex benefits, due to flexibility, inventory control and advanced optical management. As an added benefit, Luminent, our wholly owned subsidiary, supplies our pluggable optic transceivers, resulting in higher margins and better customer satisfaction. |
| | | |
| | | Luminent has recently announced brand unification with its Taiwanese facilities, to become Luminent OIC. This move was designed to reflect the unification of both entities. The strategy is to deliver state of the art optical components for metro and residential access, at compelling price points. This is best accomplished by doing R&D in California and high volume manufacturing and cost reduction in Taiwan. |
| | | |
| | | We need to be innovative, but also retain the ability to scale. Having full ownership of laser design and manufacturing process, is a strategic advantage for low-cost, high-volume production. The lasers are then integrated in the transceivers and into Fiber-to-the-Premises products, such as triplexes and biplexes. |
MRV COMMUNICATIONS
Moderator: Anne Marie Frisch
February 05, 2004/2:00 p.m. PT
Page 18
| | | |
| | | We have been supplying optical transmission components for Fiber-to-the-Curb and Fiber-to-the-Home for over ten years. Our products are already serving more than one million homes in the U.S. and in Japan. With this unification, Luminent OIC will be able to scale and meet the potential requirements of the FTTP drive in North America. |
| | | |
| | | Two weeks ago Luminent OIC announced an industry first, dense WDM or DWDM transmission in small form pluggable transceivers. This exciting new product provides twice the density and half the power consumption of traditional WDM solutions. The SSB form factor is commonly used for fiber optic transmission, but never before for DWDM. |
| | | |
| | | Luminent OIC is the first to make DWDM work in this same form factor. It will allow equipment vendors to integrate DWDMs technology directly to their switches, routers and sonic gear, without needing expensive external transponders. Luminent OIC customers are already testing this new technology and we will demonstrate it at the upcoming OSC show, later this month. Our pipeline of newly introduced and updated products, within the last 90 days, can be viewed on the new product section of our Web site, under the products pull down menu. |
MRV COMMUNICATIONS
Moderator: Anne Marie Frisch
February 05, 2004/2:00 p.m. PT
Page 19
| | | |
| | | Core Initiatives Updates. As we stated in previous calls, MRV is focused on three core initiatives that will help us realize goal number one, profitability. The core initiatives are sales channel development, federal government business and the development of the MRV brand. The vast majority of our sales are generated with the support of qualified network reseller and distributors. Therefore our first initiative is a worldwide commitment to our channel partners program. |
| | | |
| | | Over the past year we have increased the number of qualified resellers by 50% and improved geographical and vertical coverage. We recently started a series of activities designed to build loyalty and develop new business opportunities with channel partners. We are about to launch a new partner section on our Web site. |
| | | |
| | | MRV Educational Services are now offered year round, on a monthly basis, in three locations around the world, LA, Boston and Frankfurt. We also offer online distance learning classes, to certified partners, from the convenience of their desks. We’re actually using our remote device management products to run these classes. A monthly channel newsletter has been created with new product details, competitive analysis, case studies, whitepapers and tradeshow information. We are also about to |
MRV COMMUNICATIONS
Moderator: Anne Marie Frisch
February 05, 2004/2:00 p.m. PT
Page 20
| | | |
| | | begin a series of vertically focused select programs, designed to offer specific benefits to new partners who meet certain criteria. |
| | | |
| | | Our second initiative is developing new business with the federal government. Our remote device management and optical transport solutions, including FSO (Free Space Optics) and switches are ideal for many branches of the government. The first of our vertically focused select initiatives is the government select reseller project, which also support our channel initiatives. We continue to identify new programs were MRV can make a contribution and are currently engaged in several situations that could result in significant revenue opportunities, as they mature. |
| | | |
| | | Our third initiative is the development of the MRV brand. This is a relatively new beginning for us, as we used to sell products under different names. We invest in targeted activities, with the goal of developing the MRV brand name. We do regional and industry focused trade shows, seminars, advertising and press articles. We continue to advertise for branding and product awareness in print and electronic media. In January we participated in three trade shows and we will participate in five shows |
MRV COMMUNICATIONS
Moderator: Anne Marie Frisch
February 05, 2004/2:00 p.m. PT
Page 21
| | | |
| | | this month, plus the OSC show for Luminent OIC. This process requires patience and consistency, but it will pay off over time. |
| | | |
| | | I’d like to update you about developmental stage enterprises, principally Charlotte’s Web Networks. Charlotte’s Web has made significant adjustments and reduced its burn rate. As Shay mentioned, the burn rate was down to $1.2 million from $1.5 million. Currently we have a very good team here and we’re optimistic about the ultimate success of this venture. With that, let me turn the call back to the operator for Q&A. Operator? |
| | | |
| Coordinator | | Thank you, sir. Your first question is from Shaul Eyal, from CIBC World Markets. |
| | | |
| S. Eyal | | Congratulations first of all on the strong quarter, second of all on the presentation on the Internet Kudos, very, very assisting. Two quick questions from me. Shay, the impact of the euro/dollar currency, what did they do this quarter to revenue, any impact that you can discuss with us? Noam, secondly, you just mentioned about the reduced burn rate of Charlotte, but can you provide us with some more fundamentals, with some more color as to the company’s progress? Thank you. |
MRV COMMUNICATIONS
Moderator: Anne Marie Frisch
February 05, 2004/2:00 p.m. PT
Page 22
| | | |
| S. Gonen | | Shaul, your first question, as I described before, our revenues in Europe in this quarter were at 73% of the total amount of $72 million. So you can access what was the impact of the weakening dollar on our results. But please be reminded that this impact is of course favorably impacts our top line, but also our expenses. So in this quarter, we managed to reduce our expenses, while the dollar continued to weaken. |
| | | |
| N. Lotan | | Shaul, with respect to Charlotte, I actually prefer not to comment further. It is a developmental stage group, but we have a very good team there, they’re committed, they’re motivated and we’re extremely optimistic about the outcome. |
| | | |
| Coordinator | | Thank you. Your next question is from Greg Waters, of Investors Asset Management. |
| | | |
| G. Waters | | My question really, I guess, centers around FTTP and some specific things that might have happened recently. Can you clarify the relationship of MRV with the new combination of Marconi’s U.S. Optical division and AFCI? |
MRV COMMUNICATIONS
Moderator: Anne Marie Frisch
February 05, 2004/2:00 p.m. PT
Page 23
| | | |
| N. Lotan | | Certainly. Marconi has been our customer for well over ten years. We have a very close relationship and as you know, most of our implementations of the Fiber-to-the-Premises to date have been mostly with Marconi. We also have a relationship with all of the other vendors that are in the race for Fiber-to-the-Home, Fiber-to-the-Premises and they also include, of course, the company that you mentioned. But I think at this point I would rather not go any further beyond what I just mentioned. |
| | | |
| G. Waters | | What was the main driver in the increase in the U.S. business? |
| | | |
| N. Lotan | | It was the combination of the increase in the optical business, it was a combination of that, plus the data networking and military and aerospace business as well. So it’s really a combination of all three components. |
| | | |
| G. Waters | | The military and aerospace, briefly. Here in the U.S. I would assume it’s the development of what you had just discussed as being one of your three objectives. Abroad with CES, is that pretty much what is the other, not the other, what was it listed as, on the revenue breakdown. Yes, the other networking products, is that basically CES? |
| | | |
| N. Lotan | | It is mainly, yes, indeed. |
MRV COMMUNICATIONS
Moderator: Anne Marie Frisch
February 05, 2004/2:00 p.m. PT
Page 24
| | | |
| G. Waters | | Is it a large part of CES, also in government? |
| | | |
| N. Lotan | | Yes they are. |
| | | |
| Coordinator | | Thank you, sir. As there are no further questions, I’d like to turn the conference back over to Mr. Lotan, for any closing remarks. |
| | | |
| N. Lotan | | Thank you all for participating on the call today. I hope it was a productive call for you. As you can tell, we are very proud of our results, but obviously we don’t take anything for granted and we continue to push forward. Thanks for being on the call; we look forward to your participation next quarter. Now I’d like to turn it over to Diana. |
| | | |
| D. Hayden | | Thank you again for participating on today’s conference call. A transcript of Mr. Lotan and Mr. Gonen’s teleconference discussion will be available on MRV’s Web site at www.mrv.com\investor\quarterly_center.php, beginning at 8 o’clock p.m. Eastern time, 5 o’clock Pacific time, today. For those of you wishing to listen to the replay of the conference call, an archived version of the Web cast will be available on MRV’s Investor Relations site. As well, we will also provide a replay of the call, |
MRV COMMUNICATIONS
Moderator: Anne Marie Frisch
February 05, 2004/2:00 p.m. PT
Page 25
| | | |
| | | accessible by telephone, after 8 o’clock p.m. today, Pacific Time. To replay the call dial 617-801-6888, access code 87311223. Thank you again. |

| 4th Quarter and Year-End 2003 Financial Results Teleconference February 5, 2004 Connectivity Unlimited TM 20415 Nordhoff Street Chatsworth, CA 91311 818-886-6782 |

| 4th Quarter and Year-End 2003 Financial Results Teleconference Introduction Diana HaydenDirector, Corporate CommunicationsSlide No. 2Connectivity Unlimited TM |
| Q4 2003 Financial Review Forward-Looking Statement Disclosure This press release, teleconference and presentation contain forward-looking statements within the meaning of Section 21E of the Securities Exchange Act of 1934, and is subject to the safe harbor created by that section. These forward-looking statements include statements by Mr. Lotan and Mr. Gonen relating to the competitive environment in 2004 and the Company’s expectations of future success in achieving its objectives. Any forward-looking statements in this press release/teleconference/presentation are subject to a number of risks and uncertainties, including the strength of the overall economy and the high technology market in particular, competition, product development efforts, and acceptance of MRV Communications’ current and future products. Actual results could differ materially from those projected in our forward-looking statements. Investors should review the risk factors described in more detail in our most recent SEC reports available free of charge from MRV Communications at www.mrv.com or from the SEC at www.sec.gov. MRV Communications, Inc. assumes no obligation to update the forward-looking statements contained in this press release/teleconference/presentation. Any information contained herein should be read in conjunction with the February 5, 2004 Q4 financial results press release with accompanying financial tables. Slide No. 3Connectivity Unlimited TM |
| 4th Quarter and Year-End 2003 Financial Results Teleconference Opening Remarks Noam LotanPresident and Chief Executive Officer Slide No. 4Connectivity Unlimited TM |

| 4th Quarter and Year-End 2003 Financial Results Teleconference Financial Review Shay GonenChief Financial Officer Slide No. 5Connectivity Unlimited TM |
| Q4 2003 Financial Review Quarterly Results Highlights Q4 Vs. Q3($ thousands)Q4-2003 Q3-2003 US$ % Revenues 71,952 56,817 15,135 27% Operating Income (Loss) (3,460) (6,865) 3,405 (50%) Net Income (Loss) (4,917) (5,904) 987 (17%) EPS ($0.05) ($0.06) $0.01 (17%) Cash Position (1) 97,043 87,671 9,372 11% Cash to Debt (2) Ratio 3.72 3.35 11% (1) Includes — Cash and cash equivalents, short and long-term marketable securities and time deposits (2) Includes — Short-term obligations, long-term debt including current portion and convertible notes Slide No. 6Connectivity Unlimited TM |
| Q4 2003 Financial Review Revenue Analysis by Business Segment Q4 Vs. Q3($ thousands)Q4-2003 Q3-2003 US$ % Networking Group 61,232 48,324 12,908 27% Optical Components Group 11,189 9,144 2,045 22% Development Stage Group — - — 0% Inter-Segment Revenues (469) (651) 182 (28%) Total Revenues 71,952 56,817 15,135 27% Slide No. 7Connectivity Unlimited TM |
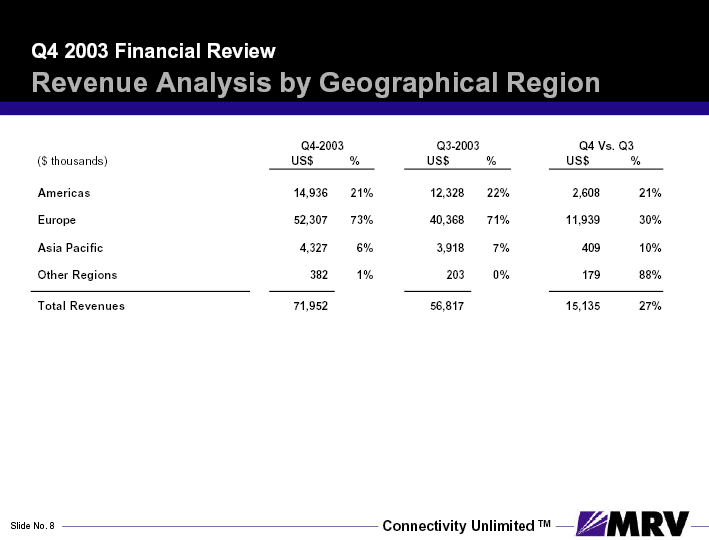
| Q4 2003 Financial Review Revenue Analysis by Geographical Region Q4-2003 Q3-2003 Q4 Vs. Q3 ($ thousands)US$ % US$ % US$ % Americas 14,936 21% 12,328 22% 2,608 21% Europe 52,307 73% 40,368 71% 11,939 30% Asia Pacific 4,327 6% 3,918 7% 409 10% Other Regions 382 1% 203 0% 179 88% Total Revenues 71,952 56,817 15,135 27% Slide No. 8Connectivity Unlimited TM |
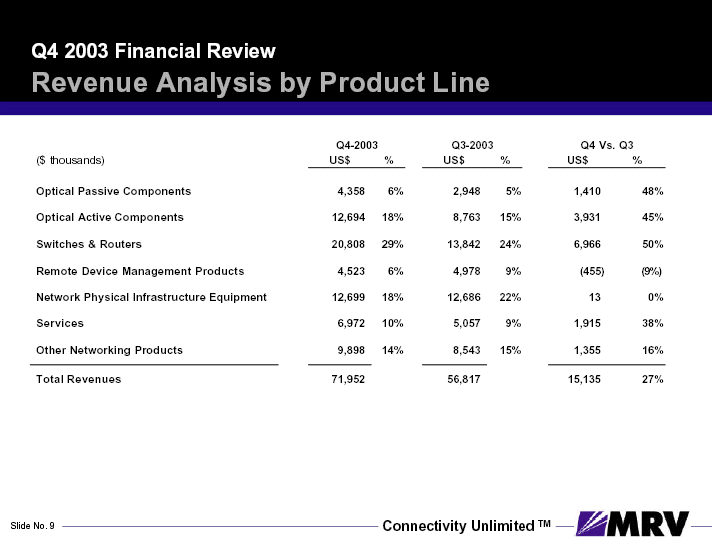
| Q4 2003 Financial Review Revenue Analysis by Product Line Q4-2003 Q3-2003 Q4 Vs.Q3 ($ thousands)US$ % US$ % US$ % Optical Passive Components 4,358 6% 2,948 5% 1,410 48% Optical Active Components 12,694 18% 8,763 15% 3,931 45% Switches & Routers 20,808 29% 13,842 24% 6,966 50% Remote Device Management Products 4,523 6% 4,978 9% (455) (9%) Network Physical Infrastructure Equipment 12,699 18% 12,686 22% 13 0% Services 6,972 10% 5,057 9% 1,915 38% Other Networking Products 9,898 14% 8,543 15% 1,355 16% Total Revenues 71,952 56,817 15,135 27% Slide No. 9Connectivity Unlimited TM |
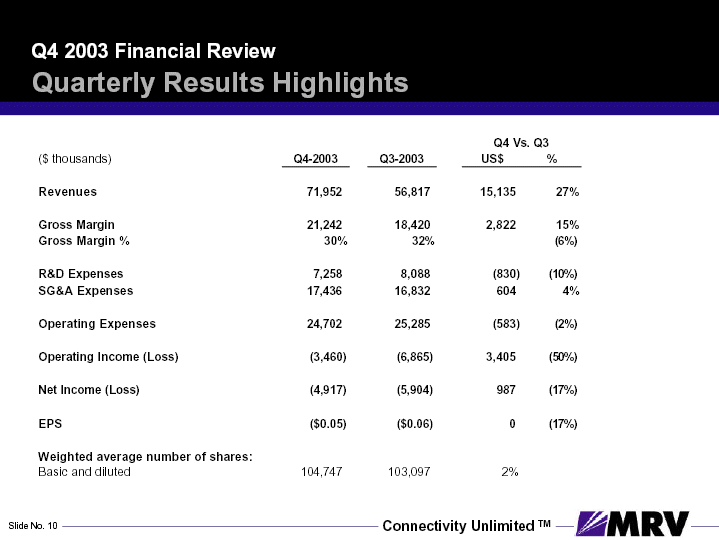
| Q4 2003 Financial Review Quarterly Results Highlights Q4 Vs. Q3($ thousands)Q4-2003 Q3-2003 US$ % Revenues 71,952 56,817 15,135 27% Gross Margin 21,242 18,420 2,822 15% Gross Margin %30% 32%(6%) R&D Expenses 7,258 8,088 (830) (10%) SG&A Expenses 17,436 16,832 6044% Operating Expenses 24,702 25,285 (583) (2%) Operating Income (Loss) (3,460) (6,865) 3,405 (50%) Net Income (Loss) (4,917) (5,904) 987 (17%) EPS ($0.05) ($0.06) 0 (17%) Weighted average number of shares: Basic and diluted 104,747 103,097 2% Slide No. 10Connectivity Unlimited TM |
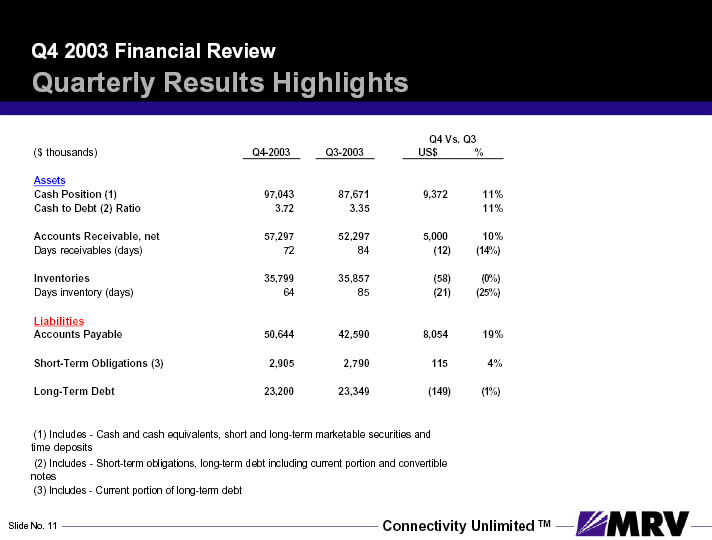
| Q4 2003 Financial Review Quarterly Results Highlights Q4 Vs. Q3($ thousands)Q4-2003 Q3-2003 US$ % Assets Cash Position (1) 97,043 87,671 9,372 11% Cash to Debt (2) Ratio 3.72 3.35 11% Accounts Receivable, net 57,297 52,297 5,000 10% Days receivables (days) 72 84(12) (14%) Inventories 35,799 35,857 (58) (0%) Days inventory (days) 64 85(21) (25%) Liabilities Accounts Payable 50,644 42,590 8,054 19% Short-Term Obligations (3) 2,905 2,790 115 4% Long-Term Debt 23,200 23,349 (149) (1%) (1) Includes — Cash and cash equivalents, short and long-term marketable securities and time deposits (2) Includes — Short-term obligations, long-term debt including current portion and convertible notes (3) Includes — Current portion of long-term debt Slide No. 11Connectivity Unlimited TM |
| 4th Quarter and Year-End 2003 Financial Results Teleconference Executive Review Noam LotanPresident and Chief Executive Officer Slide No. 12Connectivity Unlimited TM |

| 4th Quarter and Year-End 2003 Financial Results Teleconference Q&A Session Slide No. 13Connectivity Unlimited TM |


