UNITED STATES
SECURITIES AND EXCHANGE COMMISSION
Washington, D.C. 20549
FORM N-CSR
CERTIFIED SHAREHOLDER REPORT OF REGISTERED MANAGEMENT INVESTMENT COMPANIES
| | |
Investment Company Act file number: | | 811-06677 |
| |
Exact name of registrant as specified in charter: | | Dryden Index Series Fund |
| |
Address of principal executive offices: | | Gateway Center 3, 100 Mulberry Street, Newark, New Jersey 07102 |
| |
Name and address of agent for service: | | Deborah A. Docs Gateway Center 3, 100 Mulberry Street, Newark, New Jersey 07102 |
| |
Registrant’s telephone number, including area code: | | 800-225-1852 |
| |
Date of fiscal year end: | | 9/30/2008 |
| |
Date of reporting period: | | 3/31/2008 |
| | | | |
Item 1 | | – | | Reports to Stockholders |


| | |
| MARCH 31, 2008 | | SEMIANNUAL REPORT |
Dryden Stock Index Fund
FUND TYPE
Large-capitalization stock
OBJECTIVE
Provide investment results that correspond to the price and yield performance of the S&P 500 Index
This report is not authorized for distribution to prospective investors unless preceded or accompanied by a current prospectus.
The views expressed in this report and information about the Fund’s portfolio holdings are for the period covered by this report and are subject to change thereafter.
The accompanying financial statements as of March 31, 2008, were not audited and, accordingly, no auditor’s opinion is expressed on them.
JennisonDryden, Dryden, Prudential Financial and the Rock Prudential logo are registered service marks of The Prudential Insurance Company of America, Newark, NJ, and its affiliates.

May 15, 2008
Dear Shareholder:
On the following pages, you’ll find your Fund’s semiannual report, including a table showing fund performance over the first half of the fiscal year and for longer periods. The report also contains a listing of the Fund’s holdings at period-end. The semiannual report is an interim statement furnished between the Fund’s annual reports, which include an analysis of Fund performance over the fiscal year in addition to other data.
Mutual fund prices and returns will rise or fall over time, and asset managers tend to have periods when they perform better or worse than their long-term average. The best measures of a mutual fund’s quality are its return compared to that of similar investments and the variability of its return over the long term. We recommend that you review your portfolio regularly with your financial professional.
Sincerely,

Judy A. Rice, President
Dryden Index Series Fund/Dryden Stock Index Fund
| | |
| Dryden Index Series Fund/Dryden Stock Index Fund | | 1 |
Your Fund’s Performance
Fund objective
The investment objective of the Dryden Stock Index Fund is to provide investment results that correspond to the price and yield performance of the Standard & Poor’s 500 Composite Stock Price Index (S&P 500 Index). There can be no assurance that the Fund will achieve its investment objective.
Performance data quoted represent past performance. Past performance does not guarantee future results. The investment return and principal value of an investment will fluctuate, so that an investor’s shares, when redeemed, may be worth more or less than their original cost. Current performance may be lower or higher than the past performance data quoted. An investor may obtain performance data as of the most recent month-end by visiting our website at www.jennisondryden.com or by calling (800) 225-1852. The maximum initial sales charge is 3.25% (Class A shares). Gross operating expenses: Class A, 0.71%; Class B, 1.59%; Class C, 1.50%; Class I, 0.39%; Class Z, 0.45%. Net operating expenses apply to: Class A, 0.48%; Class B, 1.39%; Class C, 1.30%; Class I, 0.19%; Class Z, 0.25%, after contractual reduction through 1/31/2008 for Class A and after contractual reduction through 1/31/2009 for all classes.
| | | | | | | | | | | | | |
| Cumulative Total Returns as of 3/31/08 | | | | | |
| | | Six Months | | | One Year | | | Five Years | | | Ten Years | | Since Inception1 |
Class A | | –12.64 | % | | –5.47 | % | | 66.18 | % | | N/A | | 2.45% (11/18/99) |
Class B | | –13.03 | | | –6.24 | | | 60.00 | | | N/A | | –3.90 (11/18/99) |
Class C | | –13.00 | | | –6.21 | | | 60.05 | | | N/A | | –3.81 (11/18/99) |
Class I | | –12.52 | | | –5.16 | | | 69.04 | | | 38.84% | | — |
Class Z | | –12.52 | | | –5.22 | | | 68.38 | | | 37.72 | | — |
S&P 500 Index2 | | –12.46 | | | –5.08 | | | 70.91 | | | 41.12 | | ** |
Lipper EQ S&P 500 Index Objective Funds Avg.3 | | –12.70 | | | –5.59 | | | 66.51 | | | 34.83 | | *** |
| | | | | | | | | | | | | |
| | | | | | | | | | | | |
| Average Annual Total Returns4 as of 3/31/08 | | | | | |
| | | One Year | | | Five Years | | | Ten Years | | Since Inception1 |
Class A | | –8.54 | % | | 9.96 | % | | N/A | | –0.11% (11/18/99) |
Class B | | –10.90 | | | 9.72 | | | N/A | | –0.47 (11/18/99) |
Class C | | –7.14 | | | 9.86 | | | N/A | | –0.46 (11/18/99) |
Class I | | –5.16 | | | 11.07 | | | 3.34% | | — |
Class Z | | –5.22 | | | 10.98 | | | 3.25 | | — |
S&P 500 Index2 | | –5.08 | | | 11.32 | | | 3.50 | | ** |
Lipper EQ S&P 500 Index Objective Funds Avg.3 | | –5.59 | | | 10.73 | | | 3.03 | | *** |
| | |
| 2 | | Visit our website at www.jennisondryden.com |
The cumulative total returns do not reflect the deduction of applicable sales charges. If reflected, the applicable sales charges would reduce the cumulative total returns performance quoted. Class A shares are subject to a maximum front-end sales charge of 3.25%. Under certain circumstances, Class A shares may be subject to a contingent deferred sales charge (CDSC) of 1%. Class B and Class C shares are subject to a maximum CDSC of 5% and 1%, respectively. Class I and Class Z shares are not subject to a sales charge.
Source: Prudential Investments LLC and Lipper Inc. Performance figures may reflect fee waivers and/or expense reimbursements. In the absence of such fee waivers and/or expense reimbursements, total returns would be lower.
1Inception date returns are provided for any share class with less than 10 calendar years of returns.
2The S&P 500 Index is an unmanaged index of 500 stocks of large U.S. public companies. It gives a broad look at how U.S. stock prices have performed.
3The Lipper EQ S&P 500 Index Objective Funds Average (Lipper Average) represents returns based on the average return of all funds in the Lipper EQ S&P 500 Index Objective Funds category for the periods noted. Funds in the Lipper Average are passively managed, limited expense (management fee no higher than 0.50%) funds designed to replicate the performance of the S&P 500 Index on a reinvested basis.
4The average annual total returns take into account applicable sales charges. Class A, Class B, and Class C shares are subject to an annual distribution and service (12b-1) fee of up to 0.30%, 1.00%, and 1.00%, respectively. Approximately seven years after purchase, Class B shares will automatically convert to Class A shares on a quarterly basis. Class I and Class Z shares are not subject to a 12b-1 fee. The returns in the tables do not reflect the deduction of taxes that a shareholder would pay on Fund distributions or following the redemption of Fund shares.
**S&P 500 Index Closest Month-End to Inception cumulative total return is 9.38% for Class A, B, and C. S&P 500 Index Closest Month-End to Inception average annual total return is 1.08% for Class A, B, and C.
***Lipper Average Closest Month-End to Inception cumulative total return is 4.93% for Class A, B, and C. Lipper Average Closest Month-End to Inception average annual total return is 0.57% for Class A, B, and C.
Investors cannot invest directly in an index. The returns for the S&P 500 Index would be lower if they included the effects of sales charges, operating expenses of a mutual fund, or taxes. Returns for the Lipper Average reflect the deduction of operating expenses, but not sales charges or taxes.
| | |
| Dryden Index Series Fund/Dryden Stock Index Fund | | 3 |
Your Fund’s Performance (continued)
S&P 500 Index as of 3/31/08
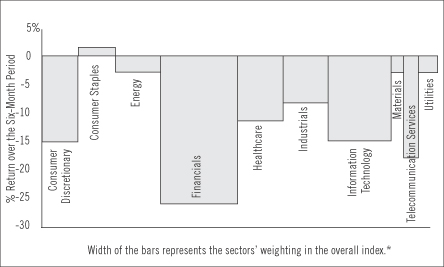
Source: Factset.
“Standard & Poor’s®”, “S&P®”, “S&P 500®”, “Standard & Poor’s 500”, and “500” are trademarks of The McGraw-Hill Companies, Inc. and have been licensed for use by Prudential Investments LLC, its affiliates, and subsidiaries. The Dryden Stock Index Fund is not sponsored, endorsed, sold, or promoted by S&P and S&P makes no representation regarding the advisability of investing in the Fund. The performance cited does not represent the performance of the Dryden Stock Index Fund. Past performance does not guarantee future results. Investors cannot invest directly in an index.
| * | Industry weightings are subject to change. |
| | |
| 4 | | Visit our website at www.jennisondryden.com |
Fees and Expenses (Unaudited)
As a shareholder of the Fund, you incur two types of costs: (1) transaction costs, including sales charges (loads) on purchase payments and redemptions, as applicable, and (2) ongoing costs, including management fees, distribution and/or service (12b-1) fees, and other Fund expenses, as applicable. This example is intended to help you understand your ongoing costs (in dollars) of investing in the Fund and to compare these costs with the ongoing costs of investing in other mutual funds.
The example is based on an investment of $1,000 invested on October 1, 2007, at the beginning of the period, and held through the six-month period ended March 31, 2008. The example is for illustrative purposes only; you should consult the Prospectus for information on initial and subsequent minimum investment requirements.
The Fund’s transfer agent may charge additional fees to holders of certain accounts that are not included in the expenses shown in the table on the following page. These fees apply to individual retirement accounts (IRAs) and Section 403(b) accounts. As of the close of the six-month period covered by the table, IRA fees included an annual maintenance fee of $15 per account (subject to a maximum annual maintenance fee of $25 for all accounts held by the same shareholder). Section 403(b) accounts are charged an annual $25 fiduciary maintenance fee. Some of the fees may vary in amount, or may be waived, based on your total account balance or the number of JennisonDryden funds, including the Fund, that you own. You should consider the additional fees that were charged to your Fund account over the six-month period when you estimate the total ongoing expenses paid over the period and the impact of these fees on your ending account value, as these additional expenses are not reflected in the information provided in the expense table. Additional fees have the effect of reducing investment returns.
Actual Expenses
The first line for each share class in the table on the following page provides information about actual account values and actual expenses. You may use the information on this line, together with the amount you invested, to estimate the expenses that you paid over the period. Simply divide your account value by $1,000 (for example, an $8,600 account value ÷ $1,000 = 8.6), then multiply the result by the number on the first line under the heading “Expenses Paid During the Six-Month Period” to estimate the expenses you paid on your account during this period.
Hypothetical Example for Comparison Purposes
The second line for each share class in the table on the following page provides information about hypothetical account values and hypothetical expenses based on
| | |
| Dryden Index Series Fund/Dryden Stock Index Fund | | 5 |
Fees and Expenses (continued)
the Fund’s actual expense ratio and an assumed rate of return of 5% per year before expenses, which is not the Fund’s actual return. The hypothetical account values and
expenses may not be used to estimate the actual ending account balance or expenses you paid for the period. You may use this information to compare the ongoing costs of investing in the Fund and other funds. To do so, compare this 5% hypothetical example with the 5% hypothetical examples that appear in the shareholder reports of the other funds.
Please note that the expenses shown in the table are meant to highlight your ongoing costs only and do not reflect any transactional costs such as sales charges (loads). Therefore, the second line for each share class in the table is useful in comparing ongoing costs only and will not help you determine the relative total costs of owning different funds. In addition, if these transactional costs were included, your costs would have been higher.
| | | | | | | | | | | | | | |
Dryden Stock
Index Fund | | Beginning Account
Value
October 1, 2007 | | Ending Account
Value March 31, 2008 | | Annualized
Expense Ratio
Based on the
Six-Month Period | | | Expenses Paid
During the
Six-Month Period* |
| | | | | | | | | | | | | | |
| Class A | | Actual | | $ | 1,000.00 | | $ | 873.60 | | 0.48 | % | | $ | 2.25 |
| | | Hypothetical | | $ | 1,000.00 | | $ | 1,022.60 | | 0.48 | % | | $ | 2.43 |
| | | | | | | | | | | | | | |
| Class B | | Actual | | $ | 1,000.00 | | $ | 869.70 | | 1.39 | % | | $ | 6.50 |
| | | Hypothetical | | $ | 1,000.00 | | $ | 1,018.05 | | 1.39 | % | | $ | 7.01 |
| | | | | | | | | | | | | | |
| Class C | | Actual | | $ | 1,000.00 | | $ | 870.00 | | 1.30 | % | | $ | 6.08 |
| | | Hypothetical | | $ | 1,000.00 | | $ | 1,018.50 | | 1.30 | % | | $ | 6.56 |
| | | | | | | | | | | | | | |
| Class I | | Actual | | $ | 1,000.00 | | $ | 874.80 | | 0.19 | % | | $ | 0.89 |
| | | Hypothetical | | $ | 1,000.00 | | $ | 1,024.05 | | 0.19 | % | | $ | 0.96 |
| | | | | | | | | | | | | | |
| Class Z | | Actual | | $ | 1,000.00 | | $ | 1,000.00 | | 0.25 | % | | $ | 1.25 |
| | | Hypothetical | | $ | 1,000.00 | | $ | 1,023.75 | | 0.25 | % | | $ | 1.26 |
| | | | | | | | | | | | | | |
* Fund expenses (net of fee waivers or subsidies, if any) for each share class are equal to the annualized expense ratio for each share class (provided in the table), multiplied by the average account value over the period, multiplied by the 183 days in the six-month period ended March 31, 2008, and divided by the 366 days in the Fund’s fiscal year ended September 30, 2008 (to reflect the six-month period). Expenses presented in the table include the expenses of any underlying portfolios in which the Fund may invest.
| | |
| 6 | | Visit our website at www.jennisondryden.com |
Schedule of Investments
as of March 31, 2008 (Unaudited)
| | | | | |
| Shares | | Description | | Value (Note 1) |
| | | | | |
LONG-TERM INVESTMENTS 98.2% | | | |
COMMON STOCKS | | | |
| |
Aerospace/Defense 2.9% | | | |
| 88,784 | | Boeing Co. | | $ | 6,602,866 |
| 45,012 | | General Dynamics Corp.(b) | | | 3,752,650 |
| 13,799 | | Goodrich Corp. | | | 793,580 |
| 83,915 | | Honeywell International, Inc. | | | 4,734,484 |
| 13,800 | | L-3 Communications Holdings, Inc. | | | 1,508,892 |
| 40,156 | | Lockheed Martin Corp. | | | 3,987,491 |
| 40,748 | | Northrop Grumman Corp. | | | 3,170,602 |
| 16,000 | | Precision Castparts Corp. | | | 1,633,280 |
| 50,144 | | Raytheon Co. | | | 3,239,804 |
| 19,663 | | Rockwell Collins, Inc. | | | 1,123,740 |
| 110,640 | | United Technologies Corp. | | | 7,614,246 |
| | | | | |
| | | | | 38,161,635 |
| |
Air Freight & Logistics 1.0% | | | |
| 16,700 | | C.H. Robinson Worldwide, Inc.(b) | | | 908,480 |
| 18,500 | | Expeditors International of Washington, Inc.(b) | | | 835,830 |
| 34,916 | | FedEx Corp.(b) | | | 3,235,666 |
| 116,200 | | United Parcel Service, Inc. (Class B Stock) | | | 8,484,924 |
| | | | | |
| | | | | 13,464,900 |
| |
Airlines 0.1% | | | |
| 77,374 | | Southwest Airlines Co.(b) | | | 959,438 |
| |
Auto Components 0.2% | | | |
| 24,971 | | Goodyear Tire & Rubber Co.(a) | | | 644,252 |
| 69,456 | | Johnson Controls, Inc. | | | 2,347,613 |
| | | | | |
| | | | | 2,991,865 |
| |
Automobiles 0.3% | | | |
| 210,563 | | Ford Motor Co.(a)(b) | | | 1,204,420 |
| 61,978 | | General Motors Corp.(b) | | | 1,180,681 |
| 27,700 | | Harley-Davidson, Inc.(b) | | | 1,038,750 |
| | | | | |
| | | | | 3,423,851 |
| |
Banking and Finance | | | |
| 6,503 | | Toronto-Dominion Bank | | | 398,955 |
See Notes to Financial Statements.
| | |
| Dryden Index Series Fund/Dryden Stock Index Fund | | 7 |
Schedule of Investments
as of March 31, 2008 (Unaudited) continued
| | | | | |
| Shares | | Description | | Value (Note 1) |
| | | | | |
COMMON STOCKS (Continued) | | | |
| |
Beverages 2.5% | | | |
| 81,254 | | Anheuser-Busch Cos., Inc.(b) | | $ | 3,855,502 |
| 8,776 | | Brown-Forman Corp. (Class B Stock) | | | 581,147 |
| 221,632 | | Coca-Cola Co. (The) | | | 13,490,739 |
| 29,800 | | Coca-Cola Enterprises, Inc.(b) | | | 721,160 |
| 21,500 | | Constellation Brands, Inc. (Class A Stock)(a)(b) | | | 379,905 |
| 13,994 | | Molson Coors Brewing Co. (Class B Stock) | | | 735,665 |
| 17,000 | | Pepsi Bottling Group, Inc. | | | 576,470 |
| 179,005 | | PepsiCo, Inc. | | | 12,924,161 |
| | | | | |
| | | | | 33,264,749 |
| |
Biotechnology 1.3% | | | |
| 121,604 | | Amgen, Inc.(a) | | | 5,080,615 |
| 31,220 | | Biogen Idec, Inc.(a)(b) | | | 1,925,962 |
| 45,600 | | Celgene Corp.(a) | | | 2,794,824 |
| 27,400 | | Genzyme Corp.(a) | | | 2,042,396 |
| 101,100 | | Gilead Sciences, Inc.(a)(b) | | | 5,209,683 |
| | | | | |
| | | | | 17,053,480 |
| |
Building Products 0.1% | | | |
| 40,726 | | Masco Corp.(b) | | | 807,597 |
| 16,700 | | Trane Inc | | | 766,530 |
| | | | | |
| | | | | 1,574,127 |
| |
Capital Markets 2.9% | | | |
| 15,300 | | American Capital Strategies Ltd.(b) | | | 522,648 |
| 26,271 | | Ameriprise Financial, Inc. | | | 1,362,151 |
| 124,138 | | Bank of New York Mellon Corp. (The) | | | 5,180,279 |
| 12,698 | | Bear Stearns Cos., Inc.(b) | | | 133,202 |
| 109,211 | | Charles Schwab Corp.(b) | | | 2,056,443 |
| 30,000 | | E*Trade Financial Corp.(a)(b) | | | 115,800 |
| 9,400 | | Federated Investors, Inc. (Class B Stock)(b) | | | 368,104 |
| 19,314 | | Franklin Resources, Inc. | | | 1,873,265 |
| 44,800 | | Goldman Sachs Group, Inc. | | | 7,409,472 |
| 17,600 | | Janus Capital Group, Inc.(b) | | | 409,552 |
| 13,100 | | Legg Mason, Inc. | | | 733,338 |
| 60,248 | | Lehman Brothers Holdings, Inc.(b) | | | 2,267,735 |
| 106,434 | | Merrill Lynch & Co., Inc.(b) | | | 4,336,121 |
| 121,236 | | Morgan Stanley | | | 5,540,485 |
| 20,862 | | Northern Trust Corp. | | | 1,386,697 |
| 41,862 | | State Street Corp. | | | 3,307,098 |
| 27,900 | | T. Rowe Price Group, Inc.(b) | | | 1,395,000 |
| | | | | |
| | | | | 38,397,390 |
See Notes to Financial Statements.
| | |
| 8 | | Visit our website at www.jennisondryden.com |
| | | | | |
| Shares | | Description | | Value (Note 1) |
| | | | | |
COMMON STOCKS (Continued) | | | |
| |
Chemicals 2.0% | | | |
| 23,932 | | Air Products & Chemicals, Inc. | | $ | 2,201,744 |
| 6,445 | | Ashland, Inc.(b) | | | 304,849 |
| 112,736 | | Dow Chemical Co. | | | 4,154,322 |
| 99,644 | | E.I. Du Pont de Nemours & Co. | | | 4,659,353 |
| 9,893 | | Eastman Chemical Co. | | | 617,818 |
| 18,782 | | Ecolab, Inc. | | | 815,702 |
| 12,031 | | Hercules, Inc. | | | 220,047 |
| 9,275 | | International Flavors & Fragrances, Inc. | | | 408,564 |
| 59,784 | | Monsanto Co. | | | 6,665,915 |
| 19,074 | | PPG Industries, Inc. | | | 1,154,168 |
| 36,058 | | Praxair, Inc. | | | 3,037,165 |
| 15,270 | | Rohm and Haas Co.(b) | | | 825,802 |
| 13,032 | | Sigma-Aldrich Corp. | | | 777,359 |
| | | | | |
| | | | | 25,842,808 |
| |
Commercial Banks 2.9% | | | |
| 61,258 | | BB&T Corp.(b) | | | 1,963,931 |
| 15,961 | | Comerica, Inc.(b) | | | 559,912 |
| 62,873 | | Fifth Third Bancorp. | | | 1,315,303 |
| 9,800 | | First Horizon National Corp.(b) | | | 137,298 |
| 48,429 | | Huntington Bancshares, Inc.(b) | | | 520,612 |
| 44,035 | | KeyCorp. | | | 966,568 |
| 9,300 | | M&T Bank Corp.(b) | | | 748,464 |
| 30,399 | | Marshall & Ilsley Corp. | | | 705,257 |
| 75,698 | | National City Corp.(b) | | | 753,195 |
| 37,436 | | PNC Financial Services Group, Inc. | | | 2,454,679 |
| 87,174 | | Regions Financial Corp.(b) | | | 1,721,687 |
| 37,883 | | SunTrust Banks, Inc.(b) | | | 2,088,869 |
| 191,195 | | US Bancorp | | | 6,187,070 |
| 230,959 | | Wachovia Corp.(b) | | | 6,235,893 |
| 375,380 | | Wells Fargo & Co.(b) | | | 10,923,557 |
| 13,200 | | Zions Bancorp.(b) | | | 601,260 |
| | | | | |
| | | | | 37,883,555 |
| |
Commercial Services & Supplies 0.5% | | | |
| 35,500 | | Allied Waste Industries, Inc.(a) | | | 383,755 |
| 11,968 | | Avery Dennison Corp. | | | 589,424 |
| 15,200 | | Cintas Corp.(b) | | | 433,808 |
| 13,530 | | Equifax, Inc.(b) | | | 466,514 |
| 13,000 | | Monster Worldwide, Inc.(a)(b) | | | 314,730 |
See Notes to Financial Statements.
| | |
| Dryden Index Series Fund/Dryden Stock Index Fund | | 9 |
Schedule of Investments
as of March 31, 2008 (Unaudited) continued
| | | | | |
| Shares | | Description | | Value (Note 1) |
| | | | | |
COMMON STOCKS (Continued) | | | |
| |
Commercial Services & Supplies (cont’d.) | | | |
| 28,840 | | R.R Donnelley & Sons Co. | | $ | 874,140 |
| 24,825 | | Pitney Bowes, Inc. | | | 869,372 |
| 19,700 | | Robert Half International, Inc. | | | 507,078 |
| 55,013 | | Waste Management, Inc. | | | 1,846,237 |
| | | | | |
| | | | | 6,285,058 |
| |
Communications Equipment 2.5% | | | |
| 7,057 | | Ciena Corp.(a)(b) | | | 217,567 |
| 662,244 | | Cisco Systems, Inc.(a) | | | 15,953,458 |
| 178,097 | | Corning, Inc. | | | 4,281,452 |
| 16,187 | | JDS Uniphase Corp.(a)(b) | | | 216,744 |
| 60,100 | | Juniper Networks, Inc.(a)(b) | | | 1,502,500 |
| 225,913 | | Motorola, Inc. | | | 2,100,991 |
| 187,500 | | QUALCOMM, Inc. | | | 7,687,500 |
| 42,194 | | Tellabs, Inc.(a)(b) | | | 229,957 |
| | | | | |
| | | | | 32,190,169 |
| |
Computers & Peripherals 4.3% | | | |
| 96,324 | | Apple, Inc.(a) | | | 13,822,494 |
| 253,440 | | Dell, Inc.(a) | | | 5,048,525 |
| 230,004 | | EMC Corp.(a)(b) | | | 3,298,257 |
| 280,702 | | Hewlett-Packard Co. | | | 12,816,853 |
| 153,634 | | International Business Machines Corp. | | | 17,689,419 |
| 13,052 | | Lexmark International, Inc.(a)(b) | | | 400,957 |
| 39,600 | | Network Appliance, Inc.(a) | | | 793,980 |
| 22,500 | | QLogic Corp.(a) | | | 345,375 |
| 22,400 | | SanDisk Corp.(a)(b) | | | 505,568 |
| 89,924 | | Sun Microsystems Inc.(a) | | | 1,396,520 |
| | | | | |
| | | | | 56,117,948 |
| |
Construction & Engineering 0.2% | | | |
| 9,537 | | Fluor Corp. | | | 1,346,243 |
| 12,100 | | Jacobs Engineering Group Inc.(a)(b) | | | 890,439 |
| | | | | |
| | | | | 2,236,682 |
| |
Construction Materials | | | |
| 9,300 | | Vulcan Materials Co.(b) | | | 617,520 |
See Notes to Financial Statements.
| | |
| 10 | | Visit our website at www.jennisondryden.com |
| | | | | |
| Shares | | Description | | Value (Note 1) |
| | | | | |
COMMON STOCKS (Continued) | | | |
| |
Consumer Finance 0.7% | | | |
| 127,159 | | American Express Co. | | $ | 5,559,391 |
| 44,266 | | Capital One Financial Corp.(b) | | | 2,178,773 |
| 58,018 | | Discover Financial Services | | | 949,755 |
| 45,092 | | SLM Corp.(b) | | | 692,162 |
| | | | | |
| | | | | 9,380,081 |
| |
Containers & Packaging 0.1% | | | |
| 10,532 | | Ball Corp.(b) | | | 483,841 |
| 8,210 | | Bemis Co., Inc.(b) | | | 208,780 |
| 17,458 | | Pactiv Corp.(a) | | | 457,574 |
| 18,436 | | Sealed Air Corp. | | | 465,509 |
| | | | | |
| | | | | 1,615,704 |
| |
Distributors 0.1% | | | |
| 20,699 | | Genuine Parts Co. | | | 832,514 |
| |
Diversified Consumer Services 0.1% | | | |
| 17,200 | | Apollo Group, Inc. (Class A Stock)(a)(b) | | | 743,040 |
| 32,420 | | H&R Block, Inc. | | | 673,039 |
| | | | | |
| | | | | 1,416,079 |
| |
Diversified Financial Services 4.2% | | | |
| 496,071 | | Bank of America Corp. | | | 18,806,051 |
| 25,000 | | CIT Group, Inc.(b) | | | 296,250 |
| 578,955 | | Citigroup, Inc. | | | 12,401,216 |
| 5,790 | | CME Group, Inc.(b) | | | 2,716,089 |
| 7,400 | | IntercontinentalExchange Inc.(a)(b) | | | 965,700 |
| 377,366 | | JPMorgan Chase & Co. | | | 16,207,870 |
| 16,900 | | Leucadia National Corp.(b) | | | 764,218 |
| 25,276 | | Moody’s Corp.(b) | | | 880,363 |
| 29,600 | | NYSE Euronext | | | 1,826,616 |
| | | | | |
| | | | | 54,864,373 |
| |
Diversified Telecommunication Services 3.1% | | | |
| 681,931 | | AT&T, Inc. | | | 26,117,957 |
| 14,150 | | CenturyTel, Inc. | | | 470,346 |
| 37,800 | | Citizens Communications Co. | | | 396,522 |
| 17,388 | | Embarq Corp. | | | 697,259 |
| 175,636 | | Qwest Communications International, Inc.(b) | | | 795,631 |
| 327,033 | | Verizon Communications, Inc. | | | 11,920,353 |
| 56,177 | | Windstream Corp. | | | 671,315 |
| | | | | |
| | | | | 41,069,383 |
See Notes to Financial Statements.
| | |
| Dryden Index Series Fund/Dryden Stock Index Fund | | 11 |
Schedule of Investments
as of March 31, 2008 (Unaudited) continued
| | | | | |
| Shares | | Description | | Value (Note 1) |
| | | | | |
COMMON STOCKS (Continued) | | | |
| |
Electric Utilities 2.1% | | | |
| 14,900 | | Allegheny Energy, Inc. | | $ | 752,450 |
| 47,291 | | American Electric Power Co., Inc. | | | 1,968,724 |
| 142,669 | | Duke Energy Corp. | | | 2,546,642 |
| 37,462 | | Edison International | | | 1,836,387 |
| 20,815 | | Entergy Corp. | | | 2,270,500 |
| 74,656 | | Exelon Corp. | | | 6,067,293 |
| 33,006 | | FirstEnergy Corp. | | | 2,264,872 |
| 46,772 | | FPL Group, Inc. | | | 2,934,475 |
| 15,600 | | Pepco Holdings, Inc. | | | 385,632 |
| 10,800 | | Pinnacle West Capital Corp.(b) | | | 378,864 |
| 41,352 | | PPL Corp. | | | 1,898,884 |
| 30,558 | | Progress Energy, Inc. | | | 1,274,269 |
| 84,715 | | Southern Co.(b) | | | 3,016,701 |
| | | | | |
| | | | | 27,595,693 |
| |
Electrical Equipment 0.5% | | | |
| 21,440 | | Cooper Industries, Ltd. (Class A Stock) | | | 860,816 |
| 89,050 | | Emerson Electric Co. | | | 4,582,513 |
| 17,763 | | Rockwell Automation, Inc. | | | 1,019,951 |
| | | | | |
| | | | | 6,463,280 |
| |
Electronic Equipment & Instruments 0.3% | | | |
| 43,798 | | Agilent Technologies, Inc.(a)(b) | | | 1,306,494 |
| 23,900 | | Jabil Circuit, Inc. | | | 226,094 |
| 18,650 | | Molex, Inc. | | | 431,934 |
| 55,795 | | Tyco Electronics Ltd. | | | 1,914,885 |
| | | | | |
| | | | | 3,879,407 |
| |
Energy Equipment & Services 2.6% | | | |
| 34,379 | | Baker Hughes, Inc. | | | 2,354,962 |
| 28,200 | | BJ Services Co. | | | 803,982 |
| 19,800 | | Cameron International Corp.(a) | | | 824,472 |
| 16,800 | | ENSCO International, Inc.(b) | | | 1,052,016 |
| 99,922 | | Halliburton Co. | | | 3,929,932 |
| 30,500 | | Nabors Industries Ltd.(a) | | | 1,029,985 |
| 40,200 | | National-Oilwell Varco, Inc.(a) | | | 2,346,876 |
| 29,700 | | Noble Corp. | | | 1,475,199 |
| 10,410 | | Rowan Cos., Inc. | | | 428,684 |
| 131,742 | | Schlumberger Ltd. | | | 11,461,554 |
| 19,600 | | Smith International Inc. | | | 1,258,908 |
See Notes to Financial Statements.
| | |
| 12 | | Visit our website at www.jennisondryden.com |
| | | | | |
| Shares | | Description | | Value (Note 1) |
| | | | | |
COMMON STOCKS (Continued) | | | |
| |
Energy Equipment & Services (cont’d.) | | | |
| 33,830 | | Transocean Inc | | $ | 4,573,816 |
| 34,600 | | Weatherford International Ltd.(a) | | | 2,507,462 |
| | | | | |
| | | | | 34,047,848 |
| |
Food & Staples Retailing 2.6% | | | |
| 48,608 | | Costco Wholesale Corp.(b) | | | 3,158,062 |
| 160,099 | | CVS Caremark Corp.(b) | | | 6,485,610 |
| 81,634 | | Kroger Co. | | | 2,073,504 |
| 52,500 | | Safeway, Inc. | | | 1,540,875 |
| 25,178 | | SUPERVALU, Inc. | | | 754,836 |
| 66,180 | | Sysco Corp. | | | 1,920,544 |
| 106,778 | | Walgreen Co. | | | 4,067,174 |
| 263,826 | | Wal-Mart Stores, Inc. | | | 13,898,354 |
| 9,100 | | Whole Foods Market, Inc.(b) | | | 300,027 |
| | | | | |
| | | | | 34,198,986 |
| |
Food Products 1.6% | | | |
| 72,759 | | Archer-Daniels-Midland Co. | | | 2,994,760 |
| 25,747 | | Campbell Soup Co. | | | 874,111 |
| 59,943 | | ConAgra Food, Inc. | | | 1,435,635 |
| 17,000 | | Dean Foods Co.(b) | | | 341,530 |
| 38,372 | | General Mills, Inc. | | | 2,297,715 |
| 36,514 | | H.J. Heinz Co. | | | 1,715,063 |
| 19,116 | | Hershey Co. (The)(b) | | | 720,100 |
| 27,970 | | Kellogg Co. | | | 1,470,103 |
| 173,966 | | Kraft Foods, Inc. | | | 5,394,686 |
| 12,600 | | McCormick & Co., Inc.(b) | | | 465,822 |
| 92,186 | | Sara Lee Corp. | | | 1,288,760 |
| 29,300 | | Tyson Foods, Inc. (Class A Stock)(b) | | | 467,335 |
| 23,004 | | Wm. Wrigley Jr. Co.(b) | | | 1,445,571 |
| | | | | |
| | | | | 20,911,191 |
| |
Gas Utilities 0.1% | | | |
| 3,300 | | Nicor, Inc.(b) | | | 110,583 |
| 19,200 | | Questar Corp.(b) | | | 1,085,952 |
| | | | | |
| | | | | 1,196,535 |
| |
Healthcare Equipment & Supplies 1.9% | | | |
| 74,574 | | Baxter International, Inc. | | | 4,311,869 |
| 27,712 | | Becton Dickinson & Co. | | | 2,379,075 |
See Notes to Financial Statements.
| | |
| Dryden Index Series Fund/Dryden Stock Index Fund | | 13 |
Schedule of Investments
as of March 31, 2008 (Unaudited) continued
| | | | | |
| Shares | | Description | | Value (Note 1) |
| | | | | |
COMMON STOCKS (Continued) | | | |
| |
Healthcare Equipment & Supplies (cont’d.) | | | |
| 143,172 | | Boston Scientific Corp.(a) | | $ | 1,842,624 |
| 12,812 | | C.R. Bard, Inc. | | | 1,235,077 |
| 56,595 | | Covidien Ltd. | | | 2,504,329 |
| 18,307 | | Hospira, Inc.(a)(b) | | | 782,990 |
| 129,558 | | Medtronic, Inc. | | | 6,266,721 |
| 38,464 | | St. Jude Medical, Inc.(a) | | | 1,661,260 |
| 27,700 | | Stryker Corp. | | | 1,801,885 |
| 10,400 | | Varian Mediacl Systems, Inc.(a)(b) | | | 487,136 |
| 24,911 | | Zimmer Holdings, Inc.(a)(b) | | | 1,939,570 |
| | | | | |
| | | | | 25,212,536 |
| |
Healthcare Providers & Services 1.8% | | | |
| 56,972 | | Aetna, Inc. | | | 2,397,951 |
| 17,800 | | AmerisourceBergen Corp. | | | 729,444 |
| 41,673 | | Cardinal Health, Inc. | | | 2,188,249 |
| 34,591 | | CIGNA Corp. | | | 1,403,357 |
| 17,450 | | Coventry Health Care, Inc.(a)(b) | | | 704,108 |
| 33,200 | | Express Scripts, Inc.(a) | | | 2,135,424 |
| 18,910 | | Humana, Inc.(a) | | | 848,303 |
| 12,800 | | Laboratory Corp. of America Holdings(a)(b) | | | 943,104 |
| 28,576 | | McKesson Corp. | | | 1,496,525 |
| 58,368 | | Medco Health Solutions, Inc.(a)(b) | | | 2,555,935 |
| 9,800 | | Patterson Cos., Inc.(a) | | | 355,740 |
| 17,500 | | Quest Diagnostics, Inc. | | | 792,225 |
| 23,472 | | Tenet Healthcare Corp.(a) | | | 132,852 |
| 140,948 | | UnitedHealth Group, Inc. | | | 4,842,972 |
| 60,100 | | Wellpoint, Inc.(a) | | | 2,652,213 |
| | | | | |
| | | | | 24,178,402 |
| |
Healthcare Technology | | | |
| 22,910 | | IMS Health, Inc. | | | 481,339 |
| |
Hotels, Restaurants & Leisure 1.3% | | | |
| 49,600 | | Carnival Corp. | | | 2,007,808 |
| 15,653 | | Darden Restaurants, Inc. | | | 509,505 |
| 34,300 | | International Game Technology | | | 1,379,203 |
| 32,204 | | Marriott International, Inc. (Class A Stock) | | | 1,106,529 |
| 132,630 | | McDonald’s Corp. | | | 7,396,776 |
| 77,900 | | Starbucks Corp.(a) | | | 1,363,250 |
| 20,200 | | Starwood Hotels & Resorts Worldwide, Inc. | | | 1,045,350 |
See Notes to Financial Statements.
| | |
| 14 | | Visit our website at www.jennisondryden.com |
| | | | | |
| Shares | | Description | | Value (Note 1) |
| | | | | |
COMMON STOCKS (Continued) | | | |
| |
Hotels, Restaurants & Leisure (cont’d.) | | | |
| 10,879 | | Wendy’s International, Inc. | | $ | 250,870 |
| 21,251 | | Wyndham Worldwide Corp. | | | 439,471 |
| 58,064 | | Yum! Brands, Inc. | | | 2,160,561 |
| | | | | |
| | | | | 17,659,323 |
| |
Household Durables 0.5% | | | |
| 7,032 | | Black & Decker Corp. | | | 464,815 |
| 13,894 | | Centex Corp. | | | 336,374 |
| 26,000 | | D.R. Horton, Inc. | | | 409,500 |
| 17,208 | | Fortune Brands, Inc. | | | 1,195,955 |
| 6,700 | | Harman International Industries, Inc. | | | 291,718 |
| 7,082 | | KB Home(b) | | | 175,138 |
| 17,600 | | Leggett & Platt, Inc.(b) | | | 268,400 |
| 13,400 | | Lennar Corp. (Class A Stock) | | | 252,054 |
| 29,827 | | Newell Rubbermaid, Inc. | | | 682,143 |
| 17,472 | | Pulte Homes, Inc.(b) | | | 254,218 |
| 5,842 | | Snap-On, Inc. | | | 297,066 |
| 10,638 | | Stanley Works (The) | | | 506,582 |
| 8,685 | | Whirlpool Corp.(b) | | | 753,684 |
| | | | | |
| | | | | 5,887,647 |
| |
Household Products 2.5% | | | |
| 13,732 | | Clorox Co. | | | 777,780 |
| 56,430 | | Colgate-Palmolive Co. | | | 4,396,461 |
| 47,616 | | Kimberly-Clark Corp. | | | 3,073,613 |
| 344,123 | | Procter & Gamble Co. | | | 24,112,699 |
| | | | | |
| | | | | 32,360,553 |
| |
Independent Power Producers & Energy Traders 0.3% | | | |
| 90,200 | | AES Corp.(a)(b) | | | 1,503,634 |
| 20,829 | | Constellation Energy Group, Inc. | | | 1,838,576 |
| 33,100 | | Dynegy Inc(a) | | | 261,159 |
| | | | | |
| | | | | 3,603,369 |
| |
Industrial Conglomerates 4.0% | | | |
| 79,498 | | 3M Co. | | | 6,292,267 |
| 1,120,972 | | General Electric Co. | | | 41,487,173 |
| 28,034 | | Textron, Inc. | | | 1,553,644 |
| 59,595 | | Tyco International Ltd. | | | 2,625,160 |
| | | | | |
| | | | | 51,958,244 |
See Notes to Financial Statements.
| | |
| Dryden Index Series Fund/Dryden Stock Index Fund | | 15 |
Schedule of Investments
as of March 31, 2008 (Unaudited) continued
| | | | | |
| Shares | | Description | | Value (Note 1) |
| | | | | |
COMMON STOCKS (Continued) | | | |
| |
Insurance 3.9% | | | |
| 37,600 | | ACE Ltd. | | $ | 2,070,256 |
| 52,600 | | AFLAC, Inc. | | | 3,416,370 |
| 64,008 | | Allstate Corp. | | | 3,076,224 |
| 14,000 | | Ambac Financial Group, Inc.(b) | | | 80,500 |
| 282,538 | | American International Group, Inc.(b) | | | 12,219,768 |
| 28,789 | | Aon Corp. | | | 1,157,318 |
| 11,700 | | Assurant, Inc. | | | 712,062 |
| 41,568 | | Chubb Corp. | | | 2,056,785 |
| 19,907 | | Cincinnati Financial Corp. | | | 757,262 |
| 50,100 | | Genworth Financial, Inc. (Class A Stock) | | | 1,134,264 |
| 34,553 | | Hartford Financial Services Group, Inc. | | | 2,618,081 |
| 29,251 | | Lincoln National Corp. | | | 1,521,052 |
| 49,704 | | Loews Corp. | | | 1,999,095 |
| 53,740 | | Marsh & McLennan Co., Inc. | | | 1,308,569 |
| 10,000 | | MBIA, Inc.(b) | | | 122,200 |
| 78,900 | | MetLife, Inc. | | | 4,754,514 |
| 27,900 | | Principal Financial Group, Inc.(b) | | | 1,554,588 |
| 64,516 | | Progressive Corp.(b) | | | 1,036,772 |
| 49,300 | | Prudential Financial, Inc.(b)(d) | | | 3,857,725 |
| 10,629 | | SAFECO Corp.(b) | | | 466,401 |
| 10,115 | | Torchmark Corp. | | | 608,013 |
| 71,511 | | Travelers Cos., Inc | | | 3,421,801 |
| 42,026 | | Unum Group Corp. | | | 924,992 |
| 21,600 | | XL Capital Ltd. (Class A Stock) | | | 638,280 |
| | | | | |
| | | | | 51,512,892 |
| |
Internet & Catalog Retail 0.2% | | | |
| 31,300 | | Amazon.Com, Inc.(a)(b) | | | 2,231,690 |
| 19,000 | | Expedia Inc.(a) | | | 415,910 |
| 20,700 | | IAC/InterActiveCorp.(a) | | | 429,732 |
| | | | | |
| | | | | 3,077,332 |
| |
Internet Software & Services 1.5% | | | |
| 13,800 | | Akamai Technologies, Inc. (a)(b) | | | 388,608 |
| 126,000 | | eBay, Inc.(a)(b) | | | 3,759,840 |
| 25,900 | | Google, Inc. (Class A Stock)(a) | | | 11,408,173 |
| 19,200 | | VeriSign, Inc.(a)(b) | | | 638,208 |
| 140,600 | | Yahoo!, Inc.(a)(b) | | | 4,067,558 |
| | | | | |
| | | | | 20,262,387 |
See Notes to Financial Statements.
| | |
| 16 | | Visit our website at www.jennisondryden.com |
| | | | | |
| Shares | | Description | | Value (Note 1) |
| | | | | |
COMMON STOCKS (Continued) | | | |
| |
IT Services 0.9% | | | |
| 13,300 | | Affiliated Computer Services, Inc. (Class A Stock)(a) | | $ | 666,463 |
| 59,778 | | Automatic Data Processing, Inc. | | | 2,533,989 |
| 30,400 | | Cognizant Technology Solutions Corp. (a) | | | 876,432 |
| 20,551 | | Computer Sciences Corp.(a) | | | 838,275 |
| 20,600 | | Convergys Corp.(a) | | | 310,236 |
| 54,900 | | Electronic Data Systems Corp. | | | 914,085 |
| 13,900 | | Fidelity National Information Services, Inc. | | | 530,146 |
| 18,900 | | Fiserv, Inc.(a)(b) | | | 908,901 |
| 37,925 | | Paychex, Inc.(b) | | | 1,299,311 |
| 27,590 | | Unisys Corp.(a)(b) | | | 122,224 |
| 86,452 | | Western Union Co. | | | 1,838,834 |
| | | | | |
| | | | | 10,838,896 |
| |
Leisure Equipment & Products 0.2% | | | |
| 11,899 | | Brunswick Corp.(b) | | | 190,027 |
| 26,365 | | Eastman Kodak Co.(b) | | | 465,870 |
| 16,354 | | Hasbro, Inc. | | | 456,277 |
| 43,713 | | Mattel, Inc. | | | 869,888 |
| | | | | |
| | | | | 1,982,062 |
| |
Life Sciences, Tools & Services 0.4% | | | |
| 25,064 | | Applera Corp. - Applied Biosystems Group | | | 823,603 |
| 3,561 | | Millipore Corp.(a)(b) | | | 240,047 |
| 13,070 | | PerkinElmer, Inc. | | | 316,948 |
| 48,702 | | Thermo Fisher Scientific, Inc.(a) | | | 2,768,221 |
| 12,500 | | Waters Corp.(a) | | | 696,250 |
| | | | | |
| | | | | 4,845,069 |
| |
Machinery 1.8% | | | |
| 69,156 | | Caterpillar, Inc.(b) | | | 5,414,224 |
| 23,716 | | Cummins, Inc.(b) | | | 1,110,383 |
| 25,900 | | Danaher Corp. | | | 1,969,177 |
| 49,680 | | Deere & Co. | | | 3,996,260 |
| 24,462 | | Dover Corp.(b) | | | 1,022,022 |
| 17,054 | | Eaton Corp. | | | 1,358,692 |
| 44,636 | | Illinois Tool Works, Inc. | | | 2,152,794 |
| 33,390 | | Ingersoll-Rand Co. | | | 1,488,526 |
| 18,472 | | ITT Corp.(b) | | | 957,034 |
| 10,700 | | Manitowoc Co., Inc. (The)(b) | | | 436,560 |
| 40,764 | | PACCAR, Inc.(b) | | | 1,834,380 |
See Notes to Financial Statements.
| | |
| Dryden Index Series Fund/Dryden Stock Index Fund | | 17 |
Schedule of Investments
as of March 31, 2008 (Unaudited) continued
| | | | | |
| Shares | | Description | | Value (Note 1) |
| | | | | |
COMMON STOCKS (Continued) | | | |
| |
Machinery (cont’d.) | | | |
| 10,704 | | Pall Corp. | | $ | 375,389 |
| 19,638 | | Parker Hannifin Corp. | | | 1,360,324 |
| 12,100 | | Terex Corp.(a) | | | 756,250 |
| | | | | |
| | | | | 24,232,015 |
| |
Media 2.8% | | | |
| 77,976 | | CBS Corp. (Class B Stock)(b) | | | 1,721,710 |
| 48,738 | | Clear Channel Communications, Inc.(b) | | | 1,424,124 |
| 334,585 | | Comcast Corp. (Class A Stock) | | | 6,470,875 |
| 86,100 | | DIRECTV Group, Inc. (The)(a)(b) | | | 2,134,419 |
| 9,300 | | E.W. Scripps Co. | | | 390,693 |
| 26,389 | | Gannett Co., Inc. | | | 766,600 |
| 31,812 | | Interpublic Group of Cos., Inc.(a)(b) | | | 267,539 |
| 36,600 | | McGraw-Hill Cos., Inc. | | | 1,352,370 |
| 6,096 | | Meredith Corp.(b) | | | 233,172 |
| 13,490 | | New York Times Co. (Class A Stock)(b) | | | 254,691 |
| 247,000 | | News Corp. (Class A Stock)(b) | | | 4,631,250 |
| 36,634 | | Omnicom Group, Inc. | | | 1,618,490 |
| 407,724 | | Time Warner, Inc. | | | 5,716,290 |
| 73,776 | | Viacom, Inc. (Class B Stock)(a) | | | 2,923,005 |
| 217,613 | | Walt Disney Co. (The)(b) | | | 6,828,697 |
| 400 | | Washington Post Co., (Class B Stock) | | | 264,600 |
| | | | | |
| | | | | 36,998,525 |
| |
Metals & Mining 1.1% | | | |
| 96,144 | | Alcoa, Inc. | | | 3,466,953 |
| 12,418 | | Allegheny Technologies, Inc.(b) | | | 886,148 |
| 40,546 | | Freeport-McMoran Copper & Gold, Inc., (Class B Stock)(b) | | | 3,901,336 |
| 49,997 | | Newmont Mining Corp.(b) | | | 2,264,864 |
| 32,412 | | Nucor Corp. | | | 2,195,589 |
| 2,000 | | Titanium Metals Corp.(b) | | | 30,100 |
| 13,009 | | United States Steel Corp.(b) | | | 1,650,452 |
| | | | | |
| | | | | 14,395,442 |
| |
Multiline Retail 0.8% | | | |
| 13,924 | | Big Lots, Inc.(a)(b) | | | 310,505 |
| 3,223 | | Dillard’s, Inc.(b) | | | 55,468 |
| 18,600 | | Family Dollar Stores, Inc. | | | 362,700 |
| 21,084 | | J.C. Penney Co., Inc. | | | 795,078 |
| 34,900 | | Kohl’s Corp.(a)(b) | | | 1,496,861 |
See Notes to Financial Statements.
| | |
| 18 | | Visit our website at www.jennisondryden.com |
| | | | | |
| Shares | | Description | | Value (Note 1) |
| | | | | |
COMMON STOCKS (Continued) | | | |
| |
Multiline Retail (cont’d.) | | | |
| 49,882 | | Macy’s, Inc. | | $ | 1,150,279 |
| 20,700 | | Nordstrom, Inc.(b) | | | 674,820 |
| 5,807 | | Sears Holdings Corp.(a)(b) | | | 592,837 |
| 87,482 | | Target Corp. | | | 4,433,587 |
| | | | | |
| | | | | 9,872,135 |
| |
Multi-Utilities 1.1% | | | |
| 23,769 | | Ameren Corp.(b) | | | 1,046,787 |
| 36,679 | | CenterPoint Energy, Inc. | | | 523,409 |
| 29,000 | | CMS Energy Corp.(b) | | | 392,660 |
| 31,651 | | Consolidated Edison, Inc.(b) | | | 1,256,545 |
| 68,304 | | Dominion Resources, Inc. | | | 2,789,535 |
| 18,687 | | DTE Energy Co. | | | 726,737 |
| 5,308 | | Integrys Energy Group, Inc. | | | 247,565 |
| 30,300 | | NiSource, Inc. | | | 522,372 |
| 42,152 | | PG&E Corp. | | | 1,552,037 |
| 57,394 | | Public Service Enterprise Group, Inc. | | | 2,306,665 |
| 29,998 | | Sempra Energy | | | 1,598,293 |
| 21,200 | | TECO Energy, Inc.(b) | | | 338,140 |
| 50,183 | | Xcel Energy, Inc. | | | 1,001,151 |
| | | | | |
| | | | | 14,301,896 |
| |
Office Electronics 0.1% | | | |
| 117,898 | | Xerox Corp. | | | 1,764,933 |
| |
Oil, Gas & Consumable Fuels 10.4% | | | |
| 52,136 | | Anadarko Petroleum Corp. | | | 3,286,132 |
| 37,548 | | Apache Corp. | | | 4,536,549 |
| 49,100 | | Chesapeake Energy Corp.(b) | | | 2,265,965 |
| 235,792 | | Chevron Corp. | | | 20,127,205 |
| 179,057 | | ConocoPhillips | | | 13,645,934 |
| 17,900 | | Consol Energy, Inc. | | | 1,238,501 |
| 50,000 | | Devon Energy Corp. | | | 5,216,500 |
| 83,904 | | El Paso Corp. | | | 1,396,163 |
| 28,300 | | EOG Resources, Inc.(b) | | | 3,396,000 |
| 600,914 | | Exxon Mobil Corp. | | | 50,825,307 |
| 30,434 | | Hess Corp. | | | 2,683,670 |
| 79,578 | | Marathon Oil Corp. | | | 3,628,757 |
| 22,200 | | Murphy Oil Corp. | | | 1,823,508 |
| 18,500 | | Noble Energy Inc.(b) | | | 1,346,800 |
See Notes to Financial Statements.
| | |
| Dryden Index Series Fund/Dryden Stock Index Fund | | 19 |
Schedule of Investments
as of March 31, 2008 (Unaudited) continued
| | | | | |
| Shares | | Description | | Value (Note 1) |
| | | | | |
COMMON STOCKS (Continued) | | | |
| |
Oil, Gas & Consumable Fuels (cont’d.) | | | |
| 94,076 | | Occidental Petroleum Corp. | | $ | 6,883,541 |
| 25,300 | | Peabody Energy Corp.(b) | | | 1,290,300 |
| 13,200 | | Range Resources Corp | | | 837,540 |
| 74,484 | | Spectra Energy Corp | | | 1,694,511 |
| 17,628 | | Sunoco, Inc. | | | 924,941 |
| 12,100 | | Tesoro Petroleum Corp. | | | 363,000 |
| 62,100 | | Valero Energy Corp. | | | 3,049,731 |
| 73,892 | | Williams Cos., Inc. | | | 2,436,958 |
| 53,916 | | XTO Energy, Inc. | | | 3,335,244 |
| | | | | |
| | | | | 136,232,757 |
| |
Paper & Forest Products 0.2% | | | |
| 47,984 | | International Paper Co.(b) | | | 1,305,165 |
| 20,135 | | MeadWestvaco Corp. | | | 548,075 |
| 19,500 | | Weyerhaeuser Co.(b) | | | 1,268,280 |
| | | | | |
| | | | | 3,121,520 |
| |
Personal Products 0.2% | | | |
| 48,044 | | Avon Products, Inc. | | | 1,899,660 |
| 12,900 | | Estee Lauder Cos., Inc. (The)(b) | | | 591,465 |
| | | | | |
| | | | | 2,491,125 |
| |
Pharmaceuticals 6.1% | | | |
| 172,974 | | Abbott Laboratories | | | 9,539,516 |
| 30,564 | | Allergan, Inc. | | | 1,723,504 |
| 12,900 | | Barr Pharmaceuticals, Inc.(a) | | | 623,199 |
| 223,614 | | Bristol-Myers Squibb Co. | | | 4,762,978 |
| 37,900 | | Forest Laboratories, Inc.(a) | | | 1,516,379 |
| 318,569 | | Johnson & Johnson | | | 20,665,572 |
| 40,433 | | King Pharmaceuticals, Inc.(a) | | | 351,767 |
| 112,697 | | Lilly (Eli) & Co. | | | 5,814,038 |
| 248,844 | | Merck & Co., Inc. | | | 9,443,630 |
| 19,900 | | Mylan Inc.(b) | | | 230,840 |
| 771,923 | | Pfizer, Inc. | | | 16,156,348 |
| 171,524 | | Schering-Plough Corp. | | | 2,471,661 |
| 12,500 | | Watson Pharmaceuticals, Inc.(a) | | | 366,500 |
| 151,891 | | Wyeth | | | 6,342,968 |
| | | | | |
| | | | | 80,008,900 |
See Notes to Financial Statements.
| | |
| 20 | | Visit our website at www.jennisondryden.com |
| | | | | |
| Shares | | Description | | Value (Note 1) |
| | | | | |
COMMON STOCKS (Continued) | | | |
| |
Real Estate Investment Trust 1.1% | | | |
| 11,795 | | Apartment Investment & Management Co., (Class A Stock)(b) | | $ | 422,379 |
| 7,300 | | AvalonBay Communities, Inc.(b) | | | 704,596 |
| 11,800 | | Boston Properties, Inc. | | | 1,086,426 |
| 14,500 | | Developers Diversified Realty Corp. | | | 607,260 |
| 27,600 | | Equity Residential Properties Trust(b) | | | 1,145,124 |
| 26,500 | | General Growth Properties, Inc.(b) | | | 1,011,505 |
| 9,300 | | Health Care Property Investors, Inc. | | | 314,433 |
| 60,800 | | Host Hotels & Resorts, Inc.(b) | | | 967,936 |
| 28,800 | | Kimco Realty Corp.(b) | | | 1,128,096 |
| 16,200 | | Plum Creek Timber Co., Inc. | | | 659,340 |
| 28,700 | | ProLogis | | | 1,689,282 |
| 14,600 | | Public Storage, Inc.(b) | | | 1,293,852 |
| 26,200 | | Simon Property Group, Inc.(b) | | | 2,434,242 |
| 14,400 | | Vornado Realty Trust(b) | | | 1,241,424 |
| | | | | |
| | | | | 14,705,895 |
| |
Real Estate Management & Development | | | |
| 23,100 | | C.B. Richard Ellis Group, Inc., (Class A Stock)(a)(b) | | | 499,884 |
| 15,371 | | Total System Services, Inc. | | | 363,678 |
| | | | | |
| | | | | 863,562 |
| |
Road & Rail 0.9% | | | |
| 32,723 | | Burlington Northern Santa Fe Corp. | | | 3,017,715 |
| 47,606 | | CSX Corp.(b) | | | 2,669,268 |
| 44,311 | | Norfolk Southern Corp. | | | 2,406,974 |
| 6,121 | | Ryder System, Inc. | | | 372,830 |
| 29,729 | | Union Pacific Corp. | | | 3,727,422 |
| | | | | |
| | | | | 12,194,209 |
| |
Semiconductors & Semiconductor Equipment 2.4% | | | |
| 50,124 | | Advanced Micro Devices, Inc.(a)(b) | | | 295,230 |
| 36,000 | | Altera Corp.(b) | | | 663,480 |
| 36,400 | | Analog Devices, Inc. | | | 1,074,528 |
| 142,888 | | Applied Materials, Inc. | | | 2,787,745 |
| 44,500 | | Broadcom Corp., (Class A Stock)(a) | | | 857,515 |
| 654,288 | | Intel Corp. | | | 13,857,819 |
| 21,720 | | KLA-Tencor Corp.(b) | | | 805,812 |
| 27,200 | | Linear Technology Corp.(b) | | | 834,768 |
| 68,844 | | LSI Corp.(a)(b) | | | 340,778 |
| 24,300 | | MEMC Electronic Materials Inc.(a) | | | 1,722,870 |
See Notes to Financial Statements.
| | |
| Dryden Index Series Fund/Dryden Stock Index Fund | | 21 |
Schedule of Investments
as of March 31, 2008 (Unaudited) continued
| | | | | |
| Shares | | Description | | Value (Note 1) |
| | | | | |
COMMON STOCKS (Continued) | | | |
| |
Semiconductors & Semiconductor Equipment (cont’d.) | | | |
| 19,700 | | Microchip Technology, Inc.(b) | | $ | 644,781 |
| 54,716 | | Micron Technology, Inc.(a)(b) | | | 326,655 |
| 31,852 | | National Semiconductor Corp.(b) | | | 583,529 |
| 9,400 | | Novellus Systems, Inc.(a) | | | 197,870 |
| 64,500 | | NVIDIA Corp.(a) | | | 1,276,455 |
| 19,800 | | Teradyne, Inc.(a) | | | 245,916 |
| 154,252 | | Texas Instruments, Inc.(b) | | | 4,360,704 |
| 34,100 | | Xilinx, Inc. | | | 809,875 |
| | | | | |
| | | | | 31,686,330 |
| |
Software 3.5% | | | |
| 71,440 | | Adobe Systems, Inc.(a) | | | 2,542,550 |
| 20,120 | | Autodesk, Inc.(a) | | | 633,378 |
| 23,900 | | BMC Software, Inc.(a) | | | 777,228 |
| 45,658 | | CA, Inc. | | | 1,027,305 |
| 18,400 | | Citrix Systems, Inc.(a) | | | 539,672 |
| 58,100 | | Compuware Corp.(a)(b) | | | 426,454 |
| 31,000 | | Electronic Arts, Inc.(a) | | | 1,547,520 |
| 39,900 | | Intuit, Inc.(a)(b) | | | 1,077,699 |
| 907,212 | | Microsoft Corp. | | | 25,746,676 |
| 29,602 | | Novell, Inc.(a) | | | 186,197 |
| 455,340 | | Oracle Corp.(a) | | | 8,906,449 |
| 111,517 | | Symantec Corp.(a)(b) | | | 1,853,413 |
| 21,700 | | Teradata Corp.(a)(b) | | | 478,702 |
| | | | | |
| | | | | 45,743,243 |
| |
Specialty Retail 1.6% | | | |
| 7,800 | | Abercrombie & Fitch Co. | | | 570,492 |
| 20,523 | | AutoNation, Inc.(a)(b) | | | 307,229 |
| 4,900 | | AutoZone, Inc.(a)(b) | | | 557,767 |
| 26,800 | | Bed Bath & Beyond, Inc.(a)(b) | | | 790,600 |
| 39,400 | | Best Buy Co., Inc.(b) | | | 1,633,524 |
| 15,600 | | Gamestop Corp New(a) | | | 806,676 |
| 55,513 | | Gap, Inc.(b) | | | 1,092,496 |
| 191,184 | | Home Depot, Inc. | | | 5,347,416 |
| 37,622 | | Limited Brands, Inc. | | | 643,336 |
| 161,896 | | Lowe’s Cos., Inc. | | | 3,713,894 |
| 32,600 | | Office Depot, Inc.(a)(b) | | | 360,230 |
| 9,049 | | OfficeMax, Inc. | | | 173,198 |
| 9,854 | | RadioShack Corp. | | | 160,128 |
See Notes to Financial Statements.
| | |
| 22 | | Visit our website at www.jennisondryden.com |
| | | | | |
| Shares | | Description | | Value (Note 1) |
| | | | | |
COMMON STOCKS (Continued) | | | |
| |
Specialty Retail (cont’d.) | | | |
| 12,416 | | Sherwin-Williams Co.(b) | | $ | 633,713 |
| 74,225 | | Staples, Inc. | | | 1,641,115 |
| 16,800 | | Tiffany & Co. | | | 702,912 |
| 50,632 | | TJX Cos., Inc. | | | 1,674,400 |
| | | | | |
| | | | | 20,809,126 |
| |
Textiles, Apparel & Luxury Goods 0.5% | | | |
| 41,300 | | Coach, Inc.(a)(b) | | | 1,245,195 |
| 17,900 | | Jones Apparel Group, Inc. | | | 240,218 |
| 16,492 | | Liz Claiborne, Inc.(b) | | | 299,330 |
| 42,876 | | NIKE, Inc., (Class B Stock)(b) | | | 2,915,568 |
| 6,000 | | Polo Ralph Lauren Corp. | | | 349,740 |
| 11,234 | | V.F. Corp. | | | 870,747 |
| | | | | |
| | | | | 5,920,798 |
| |
Thrifts & Mortgage Finance 0.6% | | | |
| 74,548 | | Countrywide Financial Corp.(b) | | | 410,014 |
| 104,934 | | Fannie Mae(b) | | | 2,761,863 |
| 68,032 | | Freddie Mac | | | 1,722,570 |
| 57,100 | | Hudson City Bancorp, Inc. | | | 1,009,528 |
| 5,000 | | MGIC Investment Corp.(b) | | | 52,650 |
| 46,475 | | Sovereign Bancorp, Inc.(b) | | | 433,147 |
| 103,871 | | Washington Mutual, Inc.(b) | | | 1,069,871 |
| | | | | |
| | | | | 7,459,643 |
| |
Tobacco 1.5% | | | |
| 235,879 | | Altria Group, Inc. | | | 5,236,514 |
| 235,879 | | Philip Morris International Inc. | | | 11,930,760 |
| 20,800 | | Reynolds American, Inc.(b) | | | 1,227,824 |
| 18,099 | | UST, Inc. | | | 986,757 |
| | | | | |
| | | | | 19,381,855 |
| |
Trading Companies & Distributors | | | |
| 7,274 | | Grainger (W.W.), Inc.(b) | | | 555,661 |
| |
Wireless Telecommunication Services 0.3% | | | |
| 42,100 | | American Tower Corp. (Class A Stock)(a) | | | 1,650,741 |
| 320,274 | | Sprint Nextel Corp. (b) | | | 2,142,633 |
| | | | | |
| | | | | 3,793,374 |
| | | | | |
| | Total long-term investments
(cost $731,825,436) | | | 1,288,728,199 |
| | | | | |
See Notes to Financial Statements.
| | |
| Dryden Index Series Fund/Dryden Stock Index Fund | | 23 |
Schedule of Investments
as of March 31, 2008 (Unaudited) continued
| | | | | | |
| Shares | | Description | | Value (Note 1) | |
| | | | | | |
SHORT-TERM INVESTMENTS 18.3% | | | | |
| |
Affiliated Money Market Mutual Fund 18.2% | | | | |
| 238,331,544 | | Dryden Core Investment Fund-Taxable Money Market Series;
(cost $238,331,544; includes $218,658,852 of cash collateral received for securities on loan) (Note 3)(c)(d)(e) | | $ | 238,331,544 | |
| | | | | | |
| |
Principal
Amount (000) | | | |
| |
U.S. Government Securities 0.1% | | | | |
| $ 1,800 | | United States Treasury bill 1.79%, 06/19/2008(f)
(cost $1,797,235) | | | 1,795,266 | |
| | | | | | |
| | Total short-term investments
(cost $240,128,779) | | | 240,126,810 | |
| | | | | | |
| | Total Investments 116.5%
(cost $971,954,215; Note 5) | | | 1,528,855,009 | |
| | Liabilities in excess of other assets(g) (16.5%) | | | (216,793,297 | ) |
| | | | | | |
| | Net Asset 100.0% | | $ | 1,312,061,712 | |
| | | | | | |
| (a) | Non-income producing security. |
| (b) | Securities, or portion thereof, on loan with an aggregate market value of $212,037,396; cash collateral of $218,658,852 (included in liabilities) was received with which the Fund purchased highly liquid short-term investments. |
| (c) | Represents security, or a portion thereof, purchased with cash collateral received for securities on loan. |
| (e) | Prudential Investments LLC, the Manager of the Fund, also serves as Manager of the Dryden Core Investment Fund-Taxable Money Market Series. |
| (f) | Security segregated as collateral for futures contracts. |
| (g) | Liabilities in excess of other assets include net unrealized appreciation on financial futures contracts as follows: |
Open future contracts outstanding at March 31, 2008:
| | | | | | | | | | | | | |
Number of
Contracts | | Type | | Expiration
Date | | Value at
March 31,
2008 | | Value at
Trade
Date | | Unrealized
Appreciation |
| | Long Position: | | | | | | | | | | | |
| 71 | | S&P 500 Index Futures | | June 2008 | | $ | 23,501,000 | | $ | 23,359,025 | | $ | 141,975 |
See Notes to Financial Statements.
| | |
| 24 | | Visit our website at www.jennisondryden.com |
The industry classification of portfolio holdings and liabilities in excess of other assets shown as a percentage of net assets as of March 31, 2008 were as follows:
| | | |
Affiliated Money Market Mutual Fund (including 16.7 % of collateral received for securities on loan) | | 18.2 | % |
Oil, Gas & Consumable Fuels | | 10.4 | |
Pharmaceuticals | | 6.1 | |
Computers & Peripherals | | 4.3 | |
Diversified Financial Services | | 4.2 | |
Industrial Conglomerates | | 4.0 | |
Insurance | | 3.9 | |
Software | | 3.5 | |
Diversified Telecommunication Services | | 3.1 | |
Aerospace/Defense | | 2.9 | |
Capital Markets | | 2.9 | |
Commercial Banks | | 2.9 | |
Media | | 2.8 | |
Energy Equipment & Services | | 2.6 | |
Foods & Staples Retailing | | 2.6 | |
Beverages | | 2.5 | |
Communications Equipment | | 2.5 | |
Household Products | | 2.5 | |
Semiconductors & Semiconductor Equipment | | 2.4 | |
Electric Utilities | | 2.1 | |
Chemicals | | 2.0 | |
Healthcare Equipment & Supplies | | 1.9 | |
Healthcare Providers & Services | | 1.8 | |
Machinery | | 1.8 | |
Food Products | | 1.6 | |
Specialty Retail | | 1.6 | |
Internet Software & Services | | 1.5 | |
Tobacco | | 1.5 | |
Biotechnology | | 1.3 | |
Hotels, Restaurants & Leisure | | 1.3 | |
Metals & Mining | | 1.1 | |
Multi-Utilities | | 1.1 | |
Real Estate Investment Trust | | 1.1 | |
Air Freight & Logistics | | 1.0 | |
IT Services | | 0.9 | |
Road & Rail | | 0.9 | |
Multiline Retail | | 0.8 | |
Consumer Finance | | 0.7 | |
Thrifts & Mortgage Finance | | 0.6 | |
Commercial Services & Supplies | | 0.5 | |
Electrical Equipment | | 0.5 | |
Household Durables | | 0.5 | |
Textiles, Apparel & Luxury Goods | | 0.5 | |
Life Sciences, Tools & Services | | 0.4 | |
Automobiles | | 0.3 | |
Electronic Equipment & Instruments | | 0.3 | |
See Notes to Financial Statements.
| | |
| Dryden Index Series Fund/Dryden Stock Index Fund | | 25 |
Schedule of Investments
as of March 31, 2008 (Unaudited) continued
| | | |
Independent Power Producers & Energy Traders | | 0.3 | % |
Wireless Telecommunication Services | | 0.3 | |
Auto Components | | 0.2 | |
Construction & Engineering | | 0.2 | |
Internet & Catalog Retail | | 0.2 | |
Leisure Equipment & Products | | 0.2 | |
Paper & Forest Products | | 0.2 | |
Personal Products | | 0.2 | |
Office Electronics | | 0.1 | |
Airlines | | 0.1 | |
Building Products | | 0.1 | |
Containers & Packaging | | 0.1 | |
Distributors | | 0.1 | |
Diversified Consumer Services | | 0.1 | |
Gas Utilities | | 0.1 | |
United States Treasury Securities | | 0.1 | |
| | | |
| | 116.5 | |
Liabilities in excess of other assets | | (16.5 | ) |
| | | |
| | 100.0 | % |
| | | |
See Notes to Financial Statements.
| | |
| 26 | | Visit our website at www.jennisondryden.com |
Financial Statements
(Unaudited)
| | |
| MARCH 31, 2008 | | SEMIANNUAL REPORT |
Dryden Index Series Fund/Dryden Stock Index Fund
Statement of Assets and Liabilities
as of March 31, 2008 (Unaudited)
| | | | |
Assets | | | | |
Investments at value, including securities on loan of $212,037,396: | | | | |
Unaffiliated Investments (cost $732,085,224) | | $ | 1,286,665,740 | |
Affiliated Investments (cost $239,868,991) | | | 242,189,269 | |
Cash | | | 615,202 | |
Receivable for investments sold | | | 2,651,897 | |
Dividends and interest receivable | | | 1,920,686 | |
Receivable for Fund shares sold | | | 745,937 | |
Due from broker—variation margin | | | 90,525 | |
Prepaid expenses | | | 11,833 | |
| | | | |
Total assets | | | 1,534,891,089 | |
| | | | |
| |
Liabilities | | | | |
Payable to broker for collateral for securities on loan | | | 218,658,852 | |
Payable for Fund shares reacquired | | | 1,870,896 | |
Payable for investments purchased | | | 1,484,939 | |
Management fee payable | | | 89,115 | |
Accrued expenses | | | 284,500 | |
Transfer agent fee payable | | | 340,107 | |
Distribution fee payable | | | 94,861 | |
Deferred trustees’ fees | | | 6,107 | |
| | | | |
Total liabilities | | | 222,829,377 | |
| | | | |
| |
Net Assets | | $ | 1,312,061,712 | |
| | | | |
| | | | | |
Net assets were comprised of: | | | | |
Common stock, at par | | $ | 44,570 | |
Paid-in capital in excess of par | | | 901,203,841 | |
| | | | |
| | | 901,248,411 | |
Undistributed net investment income | | | 8,367,216 | |
Accumulated net realized loss on investments | | | (154,596,684 | ) |
Net unrealized appreciation on investments | | | 557,042,769 | |
| | | | |
Net assets March 31, 2008 | | $ | 1,312,061,712 | |
| | | | |
See Notes to Financial Statements.
| | |
| 28 | | Visit our website at www.jennisondryden.com |
| | | |
| |
Class A | | | |
Net asset value and redemption price per share | | | |
($101,279,870 ÷ 3,444,638 shares of beneficial interest issued and outstanding) | | $ | 29.40 |
Maximum sales charge (3.25% of offering price) | | | .99 |
| | | |
Maximum offering price to public | | $ | 30.39 |
| | | |
| |
Class B | | | |
Net asset value, offering price and redemption price per share | | | |
($43,759,513 ÷ 1,497,584 shares of beneficial interest issued and outstanding) | | $ | 29.22 |
| | | |
| |
Class C | | | |
Net asset value, offering price and redemption price per share | | | |
($35,703,418 ÷ 1,221,562 shares of beneficial interest issued and outstanding) | | $ | 29.23 |
| | | |
| |
Class I | | | |
Net asset value, offering price and redemption price per share | | | |
($556,280,141 ÷ 18,884,810 shares of beneficial interest issued and outstanding) | | $ | 29.46 |
| | | |
| |
Class Z | | | |
Net asset value, offering price and redemption price per share | | | |
($575,038,770 ÷ 19,521,719 shares of beneficial interest issued and outstanding) | | $ | 29.46 |
| | | |
See Notes to Financial Statements.
| | |
| Dryden Index Series Fund/Dryden Stock Index Fund | | 29 |
Statement of Operations
Six Months Ended March 31, 2008 (Unaudited)
| | | | |
Net Investment Income | | | | |
Income | | | | |
Unaffiliated dividends | | $ | 16,289,097 | |
Affiliated dividend income | | | 704,107 | |
Affiliated income from securities loaned, net | | | 526,169 | |
Unaffiliated interest | | | 37,785 | |
| | | | |
Total income | | | 17,557,158 | |
| | | | |
| |
Expenses | | | | |
Management fee | | | 2,097,085 | |
Distribution fee—Class A | | | 141,586 | |
Distribution fee—Class B | | | 276,833 | |
Distribution fee—Class C | | | 201,598 | |
Transfer agent fee—Class A (including affiliated expense of $25,000) | | | 52,000 | |
Transfer agent fee—Class B (including affiliated expense of $20,200) | | | 76,000 | |
Transfer agent fee—Class C (including affiliated expense of $36,100) | | | 38,000 | |
Transfer agent fee—Class I (including affiliated expense of $193,500) | | | 244,000 | |
Transfer agent fee—Class Z (including affiliated expense of $432,000) | | | 432,000 | |
Custodian’s fees and expenses | | | 84,000 | |
Reports to shareholders | | | 44,000 | |
Registration fees | | | 33,000 | |
Trustees’ fees | | | 23,000 | |
Insurance | | | 18,000 | |
Legal fees and expenses | | | 19,000 | |
Audit fee | | | 10,000 | |
Miscellaneous | | | 9,283 | |
| | | | |
Total expenses | | | 3,799,385 | |
Less: Management fee waiver (Note 2) | | | (1,506,017 | ) |
| | | | |
Net expenses | | | 2,293,368 | |
| | | | |
Net investment income | | | 15,263,790 | |
| | | | |
| |
Realized And Unrealized Gain (Loss) On Investments | | | | |
Net realized gain (loss) on: | | | | |
Investment transactions | | | 35,010,851 | |
Financial futures contracts | | | (4,474,584 | ) |
| | | | |
| | | 30,536,267 | |
| | | | |
Net change in unrealized appreciation on: | | | | |
Investments | | | (243,527,149 | ) |
Financial futures contracts | | | (677,775 | ) |
| | | | |
| | | (244,204,924 | ) |
| | | | |
Net loss on investments | | | (213,668,657 | ) |
| | | | |
Net Decrease In Net Assets Resulting From Operations | | $ | (198,404,867 | ) |
| | | | |
See Notes to Financial Statements.
| | |
| 30 | | Visit our website at www.jennisondryden.com |
Statement of Changes in Net Assets
(Unaudited)
| | | | | | | | |
| | | Six Months
Ended
March 31, 2008 | | | Year
Ended
September 30, 2007 | |
Increase (Decrease) In Net Assets | | | | | | | | |
Operations | | | | | | | | |
Net investment income | | $ | 15,263,790 | | | $ | 26,857,759 | |
Net realized gain on investment transactions | | | 30,536,267 | | | | 80,736,440 | |
Net change in unrealized appreciation (depreciation) on investments | | | (244,204,924 | ) | | | 137,949,939 | |
| | | | | | | | |
Net increase (decrease) in net assets resulting from operations | | | (198,404,867 | ) | | | 245,544,138 | |
| | | | | | | | |
Dividends from net investment income (Note 1) | | | | | | | | |
Class A | | | (1,647,857 | ) | | | (1,391,031 | ) |
Class B | | | (457,636 | ) | | | (696,089 | ) |
Class C | | | (320,796 | ) | | | (376,794 | ) |
Class I | | | (12,166,848 | ) | | | (14,618,930 | ) |
Class Z | | | (11,909,022 | ) | | | (11,939,805 | ) |
| | | | | | | | |
| | | (26,502,159 | ) | | | (29,022,649 | ) |
| | | | | | | | |
| | |
Fund share transactions (Net of share conversions) (Note 6) | | | | | | | | |
Net proceeds from shares sold | | | 112,795,267 | | | | 317,991,334 | |
Net asset value of shares issued in reinvestment of dividends | | | 24,778,396 | | | | 26,502,957 | |
Cost of shares reacquired | | | (221,619,838 | ) | | | (595,882,580 | ) |
| | | | | | | | |
Net decrease in net assets from Fund share transactions | | | (84,046,175 | ) | | | (251,388,289 | ) |
| | | | | | | | |
Total decrease | | | (308,953,201 | ) | | | (34,866,800 | ) |
| | |
Net Assets | | | | | | | | |
Beginning of period | | | 1,621,014,913 | | | | 1,655,881,713 | |
| | | | | | | | |
End of period(a) | | $ | 1,312,061,712 | | | $ | 1,621,014,913 | |
| | | | | | | | |
(a) Includes undistributed net investment income of: | | $ | 8,367,216 | | | $ | 19,605,585 | |
| | | | | | | | |
See Notes to Financial Statements.
| | |
| Dryden Index Series Fund/Dryden Stock Index Fund | | 31 |
Notes to Financial Statements
(Unaudited)
The Dryden Index Series Fund (the “Company”) is registered under the Investment Company Act of 1940 as an open-end, diversified management investment company. The Company was established as a Delaware business trust on May 11, 1992 and currently consists of one fund, which is the Dryden Stock Index Fund (the “Fund”). Investment operations of the Fund commenced on November 5, 1992. The Fund’s investment objective is to provide investment results that correspond to the price and yield performance of Standard & Poor’s 500 Composite Stock Price Index.
Note 1. Accounting Policies
The following is a summary of significant accounting policies followed by the Fund in preparation of its financial statements.
Securities Valuation: Securities listed on a securities exchange (other than options on securities and indices) are valued at the last sale price on such exchange on the day of valuation or, if there was no sale on such day, at the mean between the last reported bid and ask prices, or at the last bid price on such day in the absence of an asked price. Securities traded via Nasdaq are valued at the Nasdaq official closing price (NOCP) on the day of valuation, or if there was no NOCP, at the last sale price.
Securities that are actively traded in the over-the-counter market, including listed securities for which the primary market is believed by Prudential Investments LLC (“PI” or “Manager”), in consultation with the subadviser(s); to be over-the-counter, are valued at market value using prices provided by an independent pricing agent or principal market maker. Options on securities and indices traded on an exchange are valued at the last sale price as of the close of trading on the applicable exchange or, if there was no sale, at the mean between the most recently quoted bid and asked prices on such exchange. Futures contracts and options thereon traded on a commodities exchange or board of trade are valued at the last sale price at the close of trading on such exchange or board of trade or, if there was no sale on the applicable commodities exchange or board of trade on such day, at the mean between the most recently quoted bid and asked prices on such exchange or board of trade or at the last bid price in the absence of an asked price. Securities for which reliable market quotations are not readily available, or whose values have been affected by events occurring after the close of the security’s foreign market and before the Fund’s normal pricing time, are valued at fair value in accordance with the Board of Trustees’ approved fair valuation procedures. When determining the fair valuation
| | |
| 32 | | Visit our website at www.jennisondryden.com |
of securities some of the factors influencing the valuation include, the nature of any restrictions on disposition of the securities; assessment of the general liquidity of the securities; the issuer’s financial condition and the markets in which it does business; the cost of the investment; the size of the holding and the capitalization of issuer; the prices of any recent transactions or bids/offers for such securities or any comparable securities; any available analyst media or other reports or information deemed reliable by the investment adviser regarding the issuer or the markets or industry in which it operates. Using fair value to price securities may result in a value that is different from a security’s most recent closing price and from the price used by other mutual funds to calculate their net asset values.
Investments in mutual funds are valued at their net asset value as of the close of the New York Stock Exchange on the date of valuation.
Short-term debt securities which mature in 60 days or less are valued at amortized cost, which approximates market value. The amortized cost method involves valuing a security at its cost on the date of purchase and thereafter assuming a constant amortization to maturity of the difference between the principal amount due at maturity and cost. Short-term debt securities which mature in more than 60 days are valued at current market quotations.
Financial Futures Contracts: A financial futures contract is an agreement to purchase (long) or sell (short) an agreed amount of securities at a set price for delivery on a future date. Upon entering into a financial futures contract, the Fund is required to pledge to the broker an amount of cash and/or other assets equal to a certain percentage of the contract amount. This amount is known as the “initial margin.” Subsequent payments, known as “variation margin,” are made or received by the Fund each day, depending on the daily fluctuations in the value of the underlying security. Such variation margin is recorded for financial statement purposes on a daily basis as unrealized gain or loss. When the contract expires or is closed, the gain or loss is realized and is presented in the Statement of Operations as net realized gain or loss on financial futures contracts. The Fund invests in financial futures contracts in order to hedge its existing portfolio securities, or securities the Fund intends to purchase, against fluctuations in value caused by changes in prevailing interest rates or market conditions. Should interest rates move unexpectedly, the Fund may not achieve the anticipated benefits of the financial futures contracts and may realize a loss. The use of futures transactions involves the risk of imperfect correlation in movements in the price of futures contracts, interest rates and the underlying hedged assets.
| | |
| Dryden Index Series Fund/Dryden Stock Index Fund | | 33 |
Notes to Financial Statements
(Unaudited) continued
Financial futures contracts involve elements of both market and credit risk in excess of the amounts reflected on the Statement of Assets and Liabilities.
Securities Lending: The Fund may lend its portfolio securities to qualified institutions. The loans are secured by collateral in an amount equal to at least the market value at all times of the loaned securities. During the time the securities are on loan, the Fund will continue to receive the interest and dividends or amounts equivalent thereto on the loaned securities. The Fund receives compensation, net of any rebate and securities lending agent fee, for lending its securities in the form of interest or dividends on the collateral received for securities loaned. Loans are subject to termination at the option of the borrower or the Fund. Upon termination of the loan, the borrower will return to the lender securities identical to the loaned securities. The Fund bears the risk of delay in recovery of, or even loss of rights in, the securities loaned should the borrower of the securities fail financially.
Securities Transactions and Net Investment Income: Securities transactions are recorded on the trade date. Realized and unrealized gains or losses on sales of securities are calculated on the identified cost basis. Dividend income is recorded on the ex-dividend date and interest income, including amortization of premium and accretion of discount on debt securities, as required, is recorded on the accrual basis. Expenses are recorded on the accrual basis.
Net investment income or loss (other than distribution and transfer agent fees) and unrealized and realized gains or losses are allocated daily to each class of shares based upon the relative proportion of net assets of each class at the beginning of the day. Transfer agent fees are incurred based on shareholder activity and number of accounts for each class.
Dividends and Distributions: Dividends from net investment income and distributions of net capital and currency gains in excess of a capital loss carryforward, if any, are declared and paid annually. Dividends and distributions to shareholders, which are determined in accordance with federal income tax regulations which may differ from generally accepted accounting principles, are recorded on the ex-dividend date. Permanent book/tax differences relating to income and gains are reclassified amongst undistributed net investment income, accumulated net realized gain or loss and paid in capital in excess of par, as appropriate.
| | |
| 34 | | Visit our website at www.jennisondryden.com |
Taxes: It is the Fund’s policy to continue to meet the requirements of the Internal Revenue Code applicable to regulated investment companies and to distribute all of its taxable net income and net capital gains, if any, to its shareholders. Therefore, no federal income tax provision is required.
Withholding taxes on foreign dividends have been provided for in accordance with the Fund’s understanding of the applicable country’s tax rules and rates.
Estimates: The preparation of the financial statements requires management to make estimates and assumptions that affect the reported amounts and disclosures in the financial statements. Actual results could differ from those estimates.
Note 2. Agreements
The Fund has a management agreement with PI. Pursuant to this agreement, PI has responsibility for all investment advisory services and supervises the subadviser’s performance of such services. PI has entered into a subadvisory agreement with Quantitative Management Associates LLC (“QMA”). The subadvisory agreement provides that QMA furnishes investment advisory services in connection with the management of the Fund. In connection therewith, QMA is obligated to keep certain books and records of the Fund. PI pays for the services of QMA, the cost of compensation of officers of the Fund, occupancy and certain clerical and bookkeeping costs of the Fund. The Fund bears all other costs and expenses.
The management fee paid to PI is computed daily and payable monthly at an annual rate of .30 of 1% of the average daily net assets of the Fund up to $1 billion and .25 of 1% in excess of $1 billion. Effective June 1, 2007 to January 31, 2009, the Fund’s manager has agreed to contractually waive a portion of its management fee, so that the effective management fee for the Fund will be .08% of 1% of the average daily net assets of Fund. The effective management fee rate was .08 of 1% for the six months ended March 31, 2008.
The Fund has a distribution agreement with Prudential Investment Management Services LLC (“PIMS”), which acts as the distributor of the Class A, Class B, Class C, Class I and Class Z shares of the Fund. The Fund compensates PIMS for distributing and servicing the Fund’s Class A, Class B and Class C shares, pursuant to plans of distribution, (the “Class A, B and C plans”), regardless of expenses actually incurred by PIMS. The distribution fees are accrued daily and payable monthly. No distribution or service fees are paid to PIMS as distributor for Class I and Class Z shares of the Fund.
| | |
| Dryden Index Series Fund/Dryden Stock Index Fund | | 35 |
Notes to Financial Statements
(Unaudited) continued
Pursuant to the Class A, B and C Plans, the Fund compensates PIMS for distribution- related activities at an annual rate of up to .30 of 1%, 1% and 1% of the average daily net assets of the Class A, B and C shares, respectively. PIMS has advised the Fund that it received approximately $34,200 in front-end sales charges resulting from sales of Class A shares during the six months ended March 31, 2008. From these fees, PIMS paid sales charges to dealers who in turn paid commissions to salespersons, and incurred other distribution costs.
PIMS has advised the Fund that for the six months ended March 31, 2008, it received approximately $20,100 and $2,100 in contingent deferred sales charges imposed upon certain redemptions by Class B and Class C shareholders, respectively.
PI, QMA and PIMS are indirect, wholly-owned subsidiaries of Prudential Financial, Inc. (“Prudential”).
The Fund, along with other affiliated registered investment companies (the “Funds”), is a party to a syndicated credit agreement (“SCA”) with two banks. The SCA provides for a commitment of $500 million. Interest on any borrowings under the SCA is incurred at contracted market rates and a commitment fee for the unused amount is accrued daily and paid quarterly. Effective October 26, 2007, the Funds renewed SCA with the banks. The commitment under the renewed SCA continues to be $500 million. The Funds pay a commitment fee of .06 of 1% of the unused portion of the renewed SCA. The expiration date of the renewed SCA will be October 24, 2008. For the period from October 27, 2006 through October 26, 2007, the Funds paid a commitment fee of .07 of 1% of the unused portion of the agreement. The purpose of the SCA is to provide an alternative source of temporary funding for capital share redemptions.
The Fund did not borrow any amounts pursuant to the SCA during the six months ended March 31, 2008.
Note 3. Other Transactions With Affiliates
Prudential Mutual Fund Services LLC (“PMFS”), an affiliate of PI and an indirect, wholly-owned subsidiary of Prudential, serves as the Fund’s transfer agent. Transfer agent fees and expenses in the Statement of Operations include certain out-of-pocket expenses paid to non-affiliates, where applicable. Effective June 1, 2007, the Fund’s Class I and Class Z shares are subject to a transfer agent fee of .07% and .13% of the
| | |
| 36 | | Visit our website at www.jennisondryden.com |
average daily net assets of the Class I and Class Z shares, respectively. Classes A, B, and C incur their respective fee.
The Fund pays networking fees to affiliated and unaffiliated broker/dealers including fees relating to the services of First Clearing (“First Clearing”), an affiliate of PI. These networking fees are payments made to broker/dealers that clear mutual fund transactions through a national clearing system. For the six months ended March 31, 2008, the Fund incurred approximately $57,000 total networking fees of which $37,100 was paid to First Clearing. These amounts are included in transfer agent’s fees and expenses in the Statement of Operations.
Prudential Investment Management Inc. (“PIM”), an indirect, wholly-owned subsidiary of Prudential, is the Fund’s security lending agent. For the six months ended March 31, 2008, PIM has been compensated approximately $225,500 for these services.
The Fund invests in the Taxable Money Market Series (the “Series”), a portfolio of the Dryden Core Investment Fund, pursuant to an exemptive order received from the Securities and Exchange Commission. The Series is a money market mutual fund registered under the Investment Company Act of 1940, as amended, and managed by PI.
Note 4. Portfolio Securities
Purchases and sales of portfolio securities, excluding short-term investments, for the six months ended March 31, 2008 aggregated $28,168,931 and $117,190,295 respectively.
Note 5. Tax Information
For federal income tax purposes, the Fund had a capital loss carryforward as of September 30, 2007 of approximately $169,673,000 of which $119,528,000 expires in 2011, $1,967,000 expires in 2012, $16,903,000 expires in 2013 and $31,275,000 expires in 2014. The Fund utilized approximately $78,766,000 of its capital loss carryforward during fiscal year ended September 30, 2007. Accordingly, no capital gains distribution is expected to be paid to shareholders until net gains have been realized in excess of this amount.
| | |
| Dryden Index Series Fund/Dryden Stock Index Fund | | 37 |
Notes to Financial Statements
(Unaudited) continued
The United States federal income tax basis of the Fund’s investments and the net unrealized appreciation as of March 31, 2008 were as follows:
| | | | | | |
Tax Basis
of Investments | | Appreciation | | Depreciation | | Net Unrealized
Appreciation |
| $972,905,470 | | $611,607,080 | | $55,657,541 | | $555,949,539 |
The difference between book basis and tax basis was primarily attributable to deferred losses on wash sales.
Management has analyzed the Funds’ tax positions taken on federal income tax returns for all open tax years and has concluded that as of March 31, 2008, no provision for income tax would be required in the Funds’ financial statements. The Fund’s federal and state income and federal excise tax returns for tax years for which the applicable statutes of limitations have not expired are subject to examination by the Internal Revenue Service and state departments of revenue.
Note 6. Capital
The Fund offers Class A, Class B, Class C, Class I and Class Z shares. Class A shares are sold with a front-end sales charge of up to 3.25%. Certain investors who purchase $1 million or more of Class A shares and sell these shares within 12 months of purchase are subject to a 1% contingent deferred sales charge, although they are not subject to an initial sales charge. Class B shares are sold with a contingent deferred sales charge (CDSC) which declines from 5% to zero depending upon the period of time the shares are held. Class C shares are sold with a CDSC of 1% during the first year. Class B shares will automatically convert to Class A shares on a quarterly basis approximately seven years after purchase. Class I and Class Z shares are not subject to any sales or redemption charge and are offered exclusively for sale to a limited group of investors.
The Fund has authorized an unlimited number of shares of beneficial interest at $.001 par value divided into five classes, designated Class A, Class B, Class C, Class I and Class Z.
| | |
| 38 | | Visit our website at www.jennisondryden.com |
Transactions in shares of beneficial interest were as follows:
| | | | | | | |
Class A | | Shares | | | Amount | |
Six months ended March 31, 2008: | | | | | | | |
Shares sold | | 206,656 | | | $ | 6,482,077 | |
Shares issued in reinvestment of dividends | | 49,454 | | | | 1,573,125 | |
Shares reacquired | | (377,605 | ) | | | (11,734,803 | ) |
| | | | | | | |
Net increase (decrease) in shares outstanding before conversion | | (121,495 | ) | | | (3,679,601 | ) |
Shares issued upon conversion from Class B | | 232,653 | | | | 7,065,577 | |
| | | | | | | |
Net increase (decrease) in shares outstanding | | 111,158 | | | $ | 3,385,976 | |
| | | | | | | |
Year ended September 30, 2007: | | | | | | | |
Shares sold | | 680,901 | | | $ | 21,781,491 | |
Shares issued in reinvestment of dividends | | 43,069 | | | | 1,344,615 | |
Shares reacquired | | (665,559 | ) | | | (21,442,465 | ) |
| | | | | | | |
Net increase (decrease) in shares outstanding before conversion | | 58,411 | | | | 1,683,641 | |
Shares issued upon conversion from Class B | | 428,136 | | | | 13,909,356 | |
| | | | | | | |
Net increase (decrease) in shares outstanding | | 486,547 | | | $ | 15,592,997 | |
| | | | | | | |
Class B | | | | | | |
Six months ended March 31, 2008: | | | | | | | |
Shares sold | | 4,166 | | | $ | 127,098 | |
Shares issued in reinvestment of dividends | | 13,682 | | | | 433,996 | |
Shares reacquired | | (195,307 | ) | | | (6,123,678 | ) |
| | | | | | | |
Net increase (decrease) in shares outstanding before conversion | | (177,459 | ) | | | (5,562,584 | ) |
Shares reacquired upon conversion into Class A | | (233,770 | ) | | | (7,065,577 | ) |
| | | | | | | |
Net increase (decrease) in shares outstanding | | (411,229 | ) | | $ | (12,628,161 | ) |
| | | | | | | |
Year ended September 30, 2007: | | | | | | | |
Shares sold | | 12,191 | | | $ | 381,726 | |
Shares issued in reinvestment of dividends | | 21,156 | | | | 658,148 | |
Shares reacquired | | (460,747 | ) | | | (14,767,378 | ) |
| | | | | | | |
Net increase (decrease) in shares outstanding before conversion | | (427,400 | ) | | | (13,727,504 | ) |
Shares reacquired upon conversion into Class A | | (431,153 | ) | | | (13,909,356 | ) |
| | | | | | | |
Net increase (decrease) in shares outstanding | | (858,553 | ) | | $ | (27,636,860 | ) |
| | | | | | | |
| | |
| Dryden Index Series Fund/Dryden Stock Index Fund | | 39 |
Notes to Financial Statements
(Unaudited) continued
| | | | | | | |
Class C | | Shares | | | Amount | |
Six months ended March 31, 2008: | | | | | | | |
Shares sold | | 35,196 | | | $ | 1,110,282 | |
Shares issued in reinvestment of dividends | | 9,320 | | | | 295,621 | |
Shares reacquired | | (154,558 | ) | | | (4,847,888 | ) |
| | | | | | | |
Net increase (decrease) in shares outstanding | | (110,042 | ) | | $ | (3,441,985 | ) |
| | | | | | | |
Year ended September 30, 2007: | | | | | | | |
Shares sold | | 149,947 | | | $ | 4,793,670 | |
Shares issued in reinvestment of dividends | | 11,261 | | | | 350,464 | |
Shares reacquired | | (274,456 | ) | | | (8,814,757 | ) |
| | | | | | | |
Net increase (decrease) in shares outstanding | | (113,248 | ) | | $ | (3,670,623 | ) |
| | | | | | | |
Class I | | | | | | |
Six months ended March 31, 2008: | | | | | | | |
Shares sold | | 859,074 | | | $ | 27,078,487 | |
Shares issued in reinvestment of dividends | | 337,131 | | | | 10,734,242 | |
Shares reacquired | | (2,819,998 | ) | | | (88,785,936 | ) |
| | | | | | | |
Net increase (decrease) in shares outstanding | | (1,623,793 | ) | | $ | (50,973,207 | ) |
| | | | | | | |
Year ended September 30, 2007: | | | | | | | |
Shares sold | | 2,778,892 | | | $ | 88,790,672 | |
Shares issued in reinvestment of dividends | | 391,470 | | | | 12,233,434 | |
Shares reacquired | | (8,508,525 | ) | | | (273,093,838 | ) |
| | | | | | | |
Net increase (decrease) in shares outstanding | | (5,338,163 | ) | | $ | (172,069,732 | ) |
| | | | | | | |
Class Z | | | | | | |
Six months ended March 31, 2008: | | | | | | | |
Shares sold | | 2,416,412 | | | $ | 77,997,323 | |
Shares issued in reinvestment of dividends | | 368,758 | | | | 11,741,412 | |
Shares reacquired | | (3,495,253 | ) | | | (110,127,533 | ) |
| | | | | | | |
Net increase (decrease) in shares outstanding | | (710,083 | ) | | $ | (20,388,798 | ) |
| | | | | | | |
Year ended September 30, 2007: | | | | | | | |
Shares sold | | 6,257,302 | | | $ | 202,243,775 | |
Shares issued in reinvestment of dividends | | 381,199 | | | | 11,916,296 | |
Shares reacquired | | (8,613,875 | ) | | | (277,764,142 | ) |
| | | | | | | |
Net increase (decrease) in shares outstanding | | (1,975,374 | ) | | $ | (63,604,071 | ) |
| | | | | | | |
| | |
| 40 | | Visit our website at www.jennisondryden.com |
Note 7. New Accounting Pronouncements
On September 20, 2006, the Financial Accounting Standards Board (“FASB”) released Statement of Financial Accounting Standards No. 157 “Fair Value Measurements” (FAS 157). FAS 157 establishes an authoritative definition of fair value, sets out a framework for measuring fair value, and requires additional disclosures about fair-value measurements. The application of FAS 157 is required for fiscal years beginning after November 15, 2007 and interim periods within those fiscal years. At this time, management is evaluating the implications of FAS 157 and its impact, if any, in the financial statements has not yet been determined.
In March 2008, the FASB released Statement of Financial Accounting Standards No. 161, Disclosures about Derivative Instruments and Hedging Activities (FAS 161). FAS 161 requires qualitative disclosures about objectives and strategies for using derivatives, quantitative disclosures about fair value amounts of and gains and losses on derivative instruments, and disclosures about credit-risk-related contingent features in derivative agreements. The application of FAS 161 is required for fiscal years beginning after November 15, 2008 and interim periods within those fiscal years. At this time, management is evaluating the implications of FAS 161 and its impact on the financial statements has not yet been determined.
| | |
| Dryden Index Series Fund/Dryden Stock Index Fund | | 41 |
Financial Highlights
(Unaudited)
| | | | |
| | | Class A | |
| | | Six Months Ended
March 31, 2008 | |
Per Share Operating Performance: | | | | |
Net Asset Value, Beginning Of Period | | $ | 34.18 | |
| | | | |
Income (loss) from investment operations: | | | | |
Net investment income | | | .31 | |
Net realized and unrealized gain on investment transactions | | | (4.59 | ) |
| | | | |
Total from investment operations | | | (4.28 | ) |
| | | | |
Less Dividends: | | | | |
Dividends from net investment income | | | (.50 | ) |
| | | | |
Net asset value, end of period | | $ | 29.40 | |
| | | | |
Total Return(b): | | | (12.64 | )% |
Ratios/Supplemental Data: | | | | |
Net assets, end of period (000) | | $ | 101,280 | |
Average net assets (000) | | $ | 106,684 | |
Ratios to average net assets(a)(f): | | | | |
Expenses, including distribution and service (12b-1) fees(c) | | | .48 | %(d) |
Expenses, excluding distribution and service (12b-1) fees | | | .21 | %(d) |
Net investment income | | | 1.89 | %(d) |
For Class A, B, C, I and Z shares: | | | | |
Portfolio turnover rate | | | 2 | %(e) |
| (a) | Net of expense subsidy and/or management fee waiver, where applicable. If the investment advisor had not reimbursed/waived expenses, the annual expense and net investment income ratios would have been .68% and 1.69% respectively for the six months ended March 31, 2008; .67% and 1.36% respectively for the year ended September 30, 2007; .67% and 1.30% respectively for the year ended September 30, 2006; .64% and 1.32% respectively for the year ended September 30, 2005; .64% and 1.09% respectively for the year ended September 30, 2004; and .71% and 1.05% for the year ended September 30, 2003. |
| (b) | Total return does not consider the effects of sales loads. Total investment return is calculated assuming a purchase of a share on the first day and a sale on the last day of each period reported and includes reinvestment of dividends and distributions. Total investment returns may reflect adjustments to conform to generally accepted accounting principles. Total return includes the effect of expense subsidies. Total return for periods of less than a full year are not annualized. |
| (c) | The distributor of the Fund had contractually agreed to limit its distribution and service (12b-1) fees to .25 of 1% of the average daily net assets of the Class A shares through January 31, 2008. |
| (f) | Does not include expenses of the underlying funds in which the Fund invests. |
See Notes to Financial Statements.
| | |
| 42 | | Visit our website at www.jennisondryden.com |
| | | | | | | | | | | | | | | | | | |
| Class A | |
| Year Ended September 30, | |
| 2007 | | | 2006 | | | 2005 | | | 2004 | | | 2003 | |
| | | | | | | | | | | | | | | | | | |
| $ | 29.98 | | | $ | 27.57 | | | $ | 25.05 | | | $ | 22.38 | | | $ | 18.28 | |
| | | | | | | | | | | | | | | | | | | |
| | | | | | | | | | | | | | | | | | |
| | .46 | | | | .38 | | | | .44 | | | | .27 | | | | .23 | |
| | 4.23 | | | | 2.41 | | | | 2.44 | | | | 2.66 | | | | 4.07 | |
| | | | | | | | | | | | | | | | | | | |
| | 4.69 | | | | 2.79 | | | | 2.88 | | | | 2.93 | | | | 4.30 | |
| | | | | | | | | | | | | | | | | | | |
| | | | | | | | | | | | | | | | | | |
| | (.49 | ) | | | (.38 | ) | | | (.36 | ) | | | (.26 | ) | | | (.20 | ) |
| | | | | | | | | | | | | | | | | | | |
| $ | 34.18 | | | $ | 29.98 | | | $ | 27.57 | | | $ | 25.05 | | | $ | 22.38 | |
| | | | | | | | | | | | | | | | | | | |
| | 15.81 | % | | | 10.21 | % | | | 11.59 | % | | | 13.16 | % | | | 23.62 | % |
| | | | | | | | | | | | | | | | | | |
| $ | 113,940 | | | $ | 85,357 | | | $ | 77,898 | | | $ | 85,082 | | | $ | 59,374 | |
| $ | 97,885 | | | $ | 81,562 | | | $ | 75,078 | | | $ | 76,034 | | | $ | 51,350 | |
| | | | | | | | | | | | | | | | | | |
| | .59 | % | | | .65 | % | | | .64 | % | | | .63 | % | | | .65 | % |
| | .34 | % | | | .40 | % | | | .39 | % | | | .39 | % | | | .40 | % |
| | 1.44 | % | | | 1.32 | % | | | 1.51 | % | | | 1.10 | % | | | 1.11 | % |
| | | | | | | | | | | | | | | | | | |
| | 3 | % | | | 3 | % | | | 3 | % | | | 5 | % | | | 2 | % |
See Notes to Financial Statements.
| | |
| Dryden Index Series Fund/Dryden Stock Index Fund | | 43 |
Financial Highlights
(Unaudited) continued
| | | | |
| | | Class B | |
| | | Six Months Ended
March 31, 2008 | |
Per Share Operating Performance: | | | | |
Net Asset Value, Beginning Of Period | | $ | 33.86 | |
| | | | |
Income (loss) from investment operations: | | | | |
Net investment income | | | .12 | |
Net realized and unrealized gain on investment transactions | | | (4.51 | ) |
| | | | |
Total from investment operations | | | (4.39 | ) |
| | | | |
Less Dividends: | | | | |
Dividends from net investment income | | | (.25 | ) |
| | | | |
Net asset value, end of period | | $ | 29.22 | |
| | | | |
Total Return(b): | | | (13.03 | )% |
Ratios/Supplemental Data: | | | | |
Net assets, end of period (000) | | $ | 43,760 | |
Average net assets (000) | | $ | 55,367 | |
Ratios to average net assets(a)(c): | | | | |
Expenses, including distribution and service (12b-1) fees | | | 1.39 | %(d) |
Expenses, excluding distribution and service (12b-1) fees | | | .39 | %(d) |
Net investment income | | | 1.00 | %(d) |
| (a) | Net of expense subsidy and/or management fee waiver, where applicable. If the investment advisor had not reimbursed/waived expenses, the annual expense and net investment income ratios would have been 1.59% and 0.79% respectively for the six months ended March 31, 2008; 1.52% and .50% respectively for the year ended September 30, 2007; 1.55% and .43% respectively for the year ended September 30, 2006; 1.51% and .65% respectively for the year ended September 30, 2005; 1.52% and .21% respectively for the year ended September 30, 2004; and 1.63% and .15% for the year ended September 30, 2003. |
| (b) | Total return does not consider the effects of sales loads. Total investment return is calculated assuming a purchase of a share on the first day and a sale on the last day of each period reported and includes reinvestment of dividends and distributions. Total investment returns may reflect adjustments to conform to generally accepted accounting principles. Total return includes the effect of expense subsidies. Total return for periods of less than a full year are not annualized. |
| (c) | Does not include expenses of the underlying funds in which the Fund invests. |
See Notes to Financial Statements.
| | |
| 44 | | Visit our website at www.jennisondryden.com |
| | | | | | | | | | | | | | | | | | |
| Class B | |
| Year Ended September 30, | |
| 2007 | | | 2006 | | | 2005 | | | 2004 | | | 2003 | |
| | | | | | | | | | | | | | | | | | |
| $ | 29.70 | | | $ | 27.29 | | | $ | 24.79 | | | $ | 22.16 | | | $ | 18.09 | |
| | | | | | | | | | | | | | | | | | | |
| | | | | | | | | | | | | | | | | | |
| | .20 | | | | .16 | | | | .19 | | | | .08 | | | | .08 | |
| | 4.22 | | | | 2.39 | | | | 2.48 | | | | 2.64 | | | | 4.02 | |
| | | | | | | | | | | | | | | | | | | |
| | 4.42 | | | | 2.55 | | | | 2.67 | | | | 2.72 | | | | 4.10 | |
| | | | | | | | | | | | | | | | | | | |
| | | | | | | | | | | | | | | | | | |
| | (.26 | ) | | | (.14 | ) | | | (.17 | ) | | | (.09 | ) | | | (.03 | ) |
| | | | | | | | | | | | | | | | | | | |
| $ | 33.86 | | | $ | 29.70 | | | $ | 27.29 | | | $ | 24.79 | | | $ | 22.16 | |
| | | | | | | | | | | | | | | | | | | |
| | 14.96 | % | | | 9.39 | % | | | 10.78 | % | | | 12.27 | % | | | 22.69 | % |
| | | | | | | | | | | | | | | | | | |
| $ | 64,637 | | | $ | 82,204 | | | $ | 95,284 | | | $ | 108,217 | | | $ | 95,729 | |
| $ | 77,195 | | | $ | 88,427 | | | $ | 104,121 | | | $ | 110,193 | | | $ | 82,986 | |
| | | | | | | | | | | | | | | | | | |
| | 1.34 | % | | | 1.40 | % | | | 1.40 | % | | | 1.40 | % | | | 1.40 | % |
| | .34 | % | | | .40 | % | | | .40 | % | | | .40 | % | | | .40 | % |
| | .68 | % | | | .58 | % | | | .75 | % | | | .33 | % | | | .38 | % |
See Notes to Financial Statements.
| | |
| Dryden Index Series Fund/Dryden Stock Index Fund | | 45 |
Financial Highlights
(Unaudited) continued
| | | | |
| | | Class C | |
| | | Six Months Ended
March 31, 2008 | |
Per Share Operating Performance: | | | | |
Net Asset Value, Beginning Of Period | | $ | 33.86 | |
| | | | |
Income (loss) from investment operations: | | | | |
Net investment income | | | .16 | |
Net realized and unrealized gain on investment transactions | | | (4.54 | ) |
| | | | |
Total from investment operations | | | (4.38 | ) |
| | | | |
Less Dividends: | | | | |
Dividends from net investment income | | | (.25 | ) |
| | | | |
Net asset value, end of period | | $ | 29.23 | |
| | | | |
Total Return(b): | | | (13.00 | )% |
Ratios/Supplemental Data: | | | | |
Net assets, end of period (000) | | $ | 35,703 | |
Average net assets (000) | | $ | 40,320 | |
Ratios to average net assets(a)(c): | | | | |
Expenses, including distribution and service (12b-1) fees | | | 1.30 | %(d) |
Expenses, excluding distribution and service (12b-1) fees | | | .30 | %(d) |
Net investment income | | | 1.07 | %(d) |
| (a) | Net of expense subsidy and/or management fee waiver, where applicable. If the investment advisor had not reimbursed/waived expenses, the annual expense and net investment income ratios would have been 1.50% and .87% respectively for the six months ended March 31, 2008; 1.47% and .56% respectively for the year ended September 30, 2007; 1.46% and .52% respectively for the year ended September 30, 2006; 1.43% and .72% respectively for the year ended September 30, 2005; 1.44% and .29% respectively for the year ended September 30, 2004; and 1.53% and .25% for the year ended September 30, 2003. |
| (b) | Total return does not consider the effects of sales loads. Total investment return is calculated assuming a purchase of a share on the first day and a sale on the last day of each period reported and includes reinvestment of dividends and distributions. Total investment returns may reflect adjustments to conform to generally accepted accounting principles. Total return includes the effect of expense subsidies. Total return for periods of less than a full year are not annualized. |
| (c) | Does not include expenses of the underlying funds in which the Fund invests. |
See Notes to Financial Statements.
| | |
| 46 | | Visit our website at www.jennisondryden.com |
| | | | | | | | | | | | | | | | | | |
| Class C | |
| Year Ended September 30, | |
| 2007 | | | 2006 | | | 2005 | | | 2004 | | | 2003 | |
| | | | | | | | | | | | | | | | | | |
| $ | 29.71 | | | $ | 27.29 | | | $ | 24.79 | | | $ | 22.16 | | | $ | 18.09 | |
| | | | | | | | | | | | | | | | | | | |
| | | | | | | | | | | | | | | | | | |
| | .21 | | | | .16 | | | | .19 | | | | .08 | | | | .07 | |
| | 4.20 | | | | 2.40 | | | | 2.48 | | | | 2.64 | | | | 4.03 | |
| | | | | | | | | | | | | | | | | | | |
| | 4.41 | | | | 2.56 | | | | 2.67 | | | | 2.72 | | | | 4.10 | |
| | | | | | | | | | | | | | | | | | | |
| | | | | | | | | | | | | | | | | | |
| | (.26 | ) | | | (.14 | ) | | | (.17 | ) | | | (.09 | ) | | | (.03 | ) |
| | | | | | | | | | | | | | | | | | | |
| $ | 33.86 | | | $ | 29.71 | | | $ | 27.29 | | | $ | 24.79 | | | $ | 22.16 | |
| | | | | | | | | | | | | | | | | | | |
| | 14.92 | % | | | 9.42 | % | | | 10.78 | % | | | 12.27 | % | | | 22.69 | % |
| | | | | | | | | | | | | | | | | | |
| $ | 45,085 | | | $ | 42,921 | | | $ | 48,051 | | | $ | 51,946 | | | $ | 48,823 | |
| $ | 44,982 | | | $ | 45,636 | | | $ | 50,981 | | | $ | 52,697 | | | $ | 43,820 | |
| | | | | | | | | | | | | | | | | | |
| | 1.36 | % | | | 1.40 | % | | | 1.40 | % | | | 1.40 | % | | | 1.40 | % |
| | .36 | % | | | .40 | % | | | .40 | % | | | .40 | % | | | .40 | % |
| | .67 | % | | | .58 | % | | | .75 | % | | | .33 | % | | | .38 | % |
See Notes to Financial Statements.
| | |
| Dryden Index Series Fund/Dryden Stock Index Fund | | 47 |
Financial Highlights
(Unaudited) continued
| | | | |
| | | Class I | |
| | | Six Months Ended
March 31, 2008 | |
Per Share Operating Performance: | | | | |
Net Asset Value, Beginning Of Period | | $ | 34.31 | |
| | | | |
Income (loss) from investment operations: | | | | |
Net investment income | | | .36 | |
Net realized and unrealized gain (loss) on investment transactions | | | (4.61 | ) |
| | | | |
Total from investment operations | | | (4.25 | ) |
| | | | |
Less Dividends: | | | | |
Dividends from net investment income | | | (.60 | ) |
| | | | |
Net asset value, end of period | | $ | 29.46 | |
| | | | |
Total Return(b): | | | (12.52 | )% |
Ratios/Supplemental Data: | | | | |
Net assets, end of period (000) | | $ | 556,280 | |
Average net assets (000) | | $ | 630,994 | |
Ratios to average net assets(a): | | | | |
Expenses, including distribution and service (12b-1) fees | | | .19 | %(d) |
Expenses, excluding distribution and service (12b-1) fees | | | .19 | %(d) |
Net investment income | | | 2.19 | %(d) |
| (a) | Net of expense subsidy and/or management fee waiver, where applicable. If the investment advisor had not reimbursed/waived expenses, the annual expense and net investment income ratios would have been .39% and 1.98% respectively for six months ended March 31, 2008; .34% and 1.69% respectively for the year ended September 30, 2007; .31% and 1.67% respectively for the year ended September 30, 2006; .31% and 1.84% respectively for the year ended September 30, 2005; .31% and 1.42% respectively for the year ended September 30, 2004; and .36% and 1.42% for the year ended September 30, 2003. |
| (b) | Total return does not consider the effects of sales loads. Total investment return is calculated assuming a purchase of a share on the first day and a sale on the last day of each period reported and includes reinvestment of dividends and distributions. Total investment returns may reflect adjustments to conform to generally accepted accounting principles. Total return includes the effect of expense subsidies. Total return for periods of less than a full year are not annualized. |
| (c) | Does not include expenses of the underlying funds in which the Fund invests. |
See Notes to Financial Statements.
| | |
| 48 | | Visit our website at www.jennisondryden.com |
| | | | | | | | | | | | | | | | | | |
| Class I | |
| Year Ended September 30, | |
| 2007 | | | 2006 | | | 2005 | | | 2004 | | | 2003 | |
| | | | | | | | | | | | | | | | | | |
| $ | 30.08 | | | $ | 27.66 | | | $ | 25.12 | | | $ | 22.45 | | | $ | 18.34 | |
| | | | | | | | | | | | | | | | | | | |
| | | | | | | | | | | | | | | | | | |
| | .62 | | | | .53 | | | | .51 | | | | .39 | | | | .31 | |
| | 4.20 | | | | 2.36 | | | | 2.48 | | | | 2.62 | | | | 4.08 | |
| | | | | | | | | | | | | | | | | | | |
| | 4.82 | | | | 2.89 | | | | 2.99 | | | | 3.01 | | | | 4.39 | |
| | | | | | | | | | | | | | | | | | | |
| | | | | | | | | | | | | | | | | | |
| | (.59 | ) | | | (.47 | ) | | | (.45 | ) | | | (.34 | ) | | | (.28 | ) |
| | | | | | | | | | | | | | | | | | | |
| $ | 34.31 | | | $ | 30.08 | | | $ | 27.66 | | | $ | 25.12 | | | $ | 22.45 | |
| | | | | | | | | | | | | | | | | | | |
| | 16.23 | % | | | 10.56 | % | | | 11.99 | % | | | 13.50 | % | | | 24.08 | % |
| | | | | | | | | | | | | | | | | | |
| $ | 703,556 | | | $ | 777,551 | | | $ | 978,627 | | | $ | 1,099,999 | | | $ | 1,213,338 | |
| $ | 741,032 | | | $ | 860,728 | | | $ | 1,014,636 | | | $ | 1,346,643 | | | $ | 1,118,408 | |
| | | | | | | | | | | | | | | | | | |
| | .26 | % | | | .30 | % | | | .30 | % | | | .30 | % | | | .30 | % |
| | .26 | % | | | .30 | % | | | .30 | % | | | .30 | % | | | .30 | % |
| | 1.77 | % | | | 1.68 | % | | | 1.85 | % | | | 1.43 | % | | | 1.48 | % |
See Notes to Financial Statements.
| | |
| Dryden Index Series Fund/Dryden Stock Index Fund | | 49 |
Financial Highlights
(Unaudited) continued
| | | | |
| | | Class Z | |
| | | Six Months Ended
March 31, 2008 | |
Per Share Operating Performance: | | | | |
Net Asset Value, Beginning Of Period | | $ | 34.29 | |
| | | | |
Income from investment operations: | | | | |
Net investment income | | | .34 | |
Net realized and unrealized gain (loss) on investment transactions | | | (4.59 | ) |
| | | | |
Total from investment operations | | | (4.25 | ) |
| | | | |
Less Dividends: | | | | |
Dividends from net investment income | | | (.58 | ) |
| | | | |
Net asset value, end of period | | $ | 29.46 | |
| | | | |
Total Return(b): | | | (12.52 | )% |
Ratios/Supplemental Data: | | | | |
Net assets, end of period (000) | | $ | 575,039 | |
Average net assets (000) | | $ | 644,303 | |
Ratios to average net assets(a)(c): | | | | |
Expenses, including distribution and service (12b-1) fees | | | .25 | %(d) |
Expenses, excluding distribution and service (12b-1) fees | | | .25 | %(d) |
Net investment income | | | 2.13 | %(d) |
| (a) | Net of expense subsidy and/or management fee waiver, where applicable. If the investment advisor had not reimbursed/waived expenses, the annual expense and net investment income ratios would have been .45% and 1.93% respectively for the six months ended March 31, 2008; .42% and 1.61% respectively for the year ended September 30, 2007; .40% and 1.57% respectively for the year ended September 30, 2006; .41% and 1.74% respectively for the year ended September 30, 2005; .42% and 1.31% respectively for the year ended September 30, 2004; and .49% and 1.28% for the year ended September 30, 2003. |
| (b) | Total return does not consider the effects of sales loads. Total investment return is calculated assuming a purchase of a share on the first day and a sale on the last day of each period reported and includes reinvestment of dividends and distributions. Total investment returns may reflect adjustments to conform to generally accepted accounting principles. Total return includes the effect of expense subsidies. Total return for periods of less than a full year are not annualized. |
| (c) | Does not include expenses of the underlying funds in which the Fund invests. |
See Notes to Financial Statements.
| | |
| 50 | | Visit our website at www.jennisondryden.com |
| | | | | | | | | | | | | | | | | | |
| Class Z | |
| Year Ended September 30, | |
| 2007 | | | 2006 | | | 2005 | | | 2004 | | | 2003 | |
| | | | | | | | | | | | | | | | | | |
| $ | 30.07 | | | $ | 27.64 | | | $ | 25.10 | | | $ | 22.43 | | | $ | 18.32 | |
| | | | | | | | | | | | | | | | | | | |
| | | | | | | | | | | | | | | | | | |
| | .60 | | | | .51 | | | | .51 | | | | .34 | | | | .28 | |
| | 4.19 | | | | 2.35 | | | | 2.45 | | | | 2.65 | | | | 4.08 | |
| | | | | | | | | | | | | | | | | | | |
| | 4.79 | | | | 2.86 | | | | 2.96 | | | | 2.99 | | | | 4.36 | |
| | | | | | | | | | | | | | | | | | | |
| | | | | | | | | | | | | | | | | | |
| | (.57 | ) | | | (.43 | ) | | | (.42 | ) | | | (.32 | ) | | | (.25 | ) |
| | | | | | | | | | | | | | | | | | | |
| $ | 34.29 | | | $ | 30.07 | | | $ | 27.64 | | | $ | 25.10 | | | $ | 22.43 | |
| | | | | | | | | | | | | | | | | | | |
| | 16.11 | % | | | 10.53 | % | | | 11.86 | % | | | 13.41 | % | | | 23.97 | % |
| | | | | | | | | | | | | | | | | | |
| $ | 693,797 | | | $ | 667,849 | | | $ | 716,185 | | | $ | 790,519 | | | $ | 754,206 | |
| $ | 684,731 | | | $ | 697,473 | | | $ | 775,321 | | | $ | 807,187 | | | $ | 693,096 | |
| | | | | | | | | | | | | | | | | | |
| | .34 | % | | | .39 | % | | | .40 | % | | | .40 | % | | | .40 | % |
| | .34 | % | | | .39 | % | | | .40 | % | | | .40 | % | | | .40 | % |
| | 1.69 | % | | | 1.58 | % | | | 1.75 | % | | | 1.33 | % | | | 1.37 | % |
See Notes to Financial Statements.
| | |
| Dryden Index Series Fund/Dryden Stock Index Fund | | 51 |
| | | | |
| n MAIL | | n TELEPHONE | | n WEBSITE |
Gateway Center Three 100 Mulberry Street Newark, NJ 07102 | | (800) 225-1852 | | www.jennisondryden.com |
|
| PROXY VOTING |
| The Board of Trustees of the Fund has delegated to the Fund’s investment subadviser the responsibility for voting any proxies and maintaining proxy recordkeeping with respect to the Fund. A description of these proxy voting policies and procedures is available without charge, upon request, by calling (800) 225-1852 or by visiting the Securities and Exchange Commission’s website at www.sec.gov. Information regarding how the Fund voted proxies relating to portfolio securities during the most recent 12-month period ended June 30 is available on the Fund’s website and on the Commission’s website. |
|
TRUSTEES
Linda W. Bynoe • David E.A. Carson • Robert F. Gunia • Robert E. La Blanc •
Douglas H. McCorkindale • Richard A. Redeker • Judy A. Rice • Robin B. Smith •
Stephen G. Stoneburn • Clay T. Whitehead |
OFFICERS
Judy A. Rice, President • Robert F. Gunia, Vice President • Grace C. Torres, Treasurer and Principal Financial and Accounting Officer • Kathryn L. Quirk, Chief Legal Officer • Deborah A. Docs, Secretary • Timothy J. Knierim, Chief Compliance Officer • Valerie M. Simpson, Deputy Chief Compliance Officer • Noreen M. Fierro, Anti-Money Laundering Compliance Officer • Jonathan D. Shain, Assistant Secretary • Claudia DiGiacomo, Assistant Secretary • John P. Schwartz, Assistant Secretary • Andrew R. French, Assistant Secretary • M. Sadiq Peshimam, Assistant Treasurer • Peter Parrella, Assistant Treasurer
| | | | |
| MANAGER | | Prudential Investments LLC | | Gateway Center Three
100 Mulberry Street
Newark, NJ 07102 |
|
| INVESTMENT SUBADVISER | | Quantitative Management Associates LLC | | Gateway Center Two
100 Mulberry Street
Newark, NJ 07102 |
|
| DISTRIBUTOR | | Prudential Investment
Management Services LLC | | Gateway Center Three
100 Mulberry Street
Newark, NJ 07102 |
|
| CUSTODIAN | | The Bank of New York | | One Wall Street
New York, NY 10286 |
|
| TRANSFER AGENT | | Prudential Mutual Fund
Services LLC | | PO Box 9658 Providence, RI 02940 |
|
| INDEPENDENT REGISTERED PUBLIC ACCOUNTING FIRM | | KPMG LLP | | 345 Park Avenue New York, NY 10154 |
|
| FUND COUNSEL | | Willkie Farr & Gallagher LLP | | 787 Seventh Avenue New York, NY 10019 |
|
| An investor should consider the investment objectives, risks, charges, and expenses of the Fund carefully before investing. The prospectus for the Fund contains this and other information about the Fund. An investor may obtain a prospectus by visiting our website at www.jennisondryden.com or by calling (800) 225-1852. The prospectus should be read carefully before investing. |
|
| E-DELIVERY |
| To receive your mutual fund documents on-line, go to www.icsdelivery.com/prudential/funds and enroll. Instead of receiving printed documents by mail, you will receive notification via e-mail when new materials are available. You can cancel your enrollment or change your e-mail address at any time by clicking on the change/cancel enrollment option at the icsdelivery website address. |
|
| SHAREHOLDER COMMUNICATIONS WITH TRUSTEES |
| Shareholders can communicate directly with the Board of Trustees by writing to the Chair of the Board, Dryden Stock Index Fund, Prudential Investments, Attn: Board of Trustees, 100 Mulberry Street, Gateway Center Three, Newark, NJ 07102. Shareholders can communicate directly with an individual Trustee by writing to the same address. Communications are not screened before being delivered to the addressee. |
|
| AVAILABILITY OF PORTFOLIO SCHEDULE |
| The Fund files its complete schedule of portfolio holdings with the Securities and Exchange Commission for the first and third quarters of each fiscal year on Form N-Q under the Dryden Index Series Fund name. The Fund’s Forms N-Q are available on the Commission’s website at www.sec.gov. The Fund’s Forms N-Q may also be reviewed and copied at the Commission’s Public Reference Room in Washington, D.C. Information on the operation and location of the Public Reference Room may be obtained by calling (800) SEC-0330 (732-0330). The Fund’s schedule of portfolio holdings is also available on the Fund’s website as of the end of each fiscal quarter. |
Mutual Funds:
| | | | |
ARE NOT INSURED BY THE FDIC OR ANY
FEDERAL GOVERNMENT AGENCY | | MAY LOSE VALUE | | ARE NOT A DEPOSIT OF OR GUARANTEED
BY ANY BANK OR ANY BANK AFFILIATE |

| | | | | | | | | | | | | | |
| Dryden Stock Index Fund | | | | | | | | | | |
| | | Share Class | | A | | B | | C | | I | | Z | | |
| | NASDAQ | | PSIAX | | PBSIX | | PSICX | | PDSIX | | PSIFX | | |
| | CUSIP | | 262439102 | | 262439201 | | 262439300 | | 262439409 | | 262439508 | | |
| | | | | | | | | | | | | | |
MF174E2 IFS-A148057 Ed. 05/2008

| | | | |
| Item 2 | | – | | Code of Ethics – Not required, as this is not an annual filing. |
| | |
| Item 3 | | – | | Audit Committee Financial Expert – Not required, as this is not an annual filing. |
| | |
| Item 4 | | – | | Principal Accountant Fees and Services – Not required, as this is not an annual filing. |
| | |
| Item 5 | | – | | Audit Committee of Listed Registrants – Not applicable. |
| | |
| Item 6 | | – | | Schedule of Investments – The schedule is included as part of the report to shareholders filed under Item 1 of this Form. |
| | |
| Item 7 | | – | | Disclosure of Proxy Voting Policies and Procedures for Closed-End Management Investment Companies – Not applicable. |
| | |
| Item 8 | | – | | Portfolio Managers of Closed-End Management Investment Companies – Not applicable. |
| | |
| Item 9 | | – | | Purchases of Equity Securities by Closed-End Management Investment Company and Affiliated Purchasers – Not applicable. |
| | |
| Item 10 | | – | | Submission of Matters to a Vote of Security Holders – Not applicable. |
| | |
| Item 11 | | – | | Controls and Procedures |
| | |
| | (a) | | It is the conclusion of the registrant’s principal executive officer and principal financial officer that the effectiveness of the registrant’s current disclosure controls and procedures (such disclosure controls and procedures having been evaluated within 90 days of the date of this filing) provide reasonable assurance that the information required to be disclosed by the registrant has been recorded, processed, summarized and reported within the time period specified in the Commission’s rules and forms and that the information required to be disclosed by the registrant has been accumulated and communicated to the registrant’s principal executive officer and principal financial officer in order to allow timely decisions regarding required disclosure. |
| | |
| | (b) | | There has been no significant change in the registrant’s internal control over financial reporting that occurred during the registrant’s most recent fiscal quarter of the period covered by this report that has materially affected, or is likely to materially affect, the registrant’s internal control over financial reporting. |
| | |
| Item 12 | | – | | Exhibits |
| | |
| | (a) | | (1) Code of Ethics – Not required, as this is not an annual filing. |
| | |
| | | | (2) Certifications pursuant to Section 302 of the Sarbanes-Oxley Act – Attached hereto as Exhibit EX-99.CERT. |
| | |
| | | | (3) Any written solicitation to purchase securities under Rule 23c-1. – Not applicable. |
| | |
| | (b) | | Certifications pursuant to Section 906 of the Sarbanes-Oxley Act – Attached hereto as Exhibit EX-99.906CERT. |
SIGNATURES
Pursuant to the requirements of the Securities Exchange Act of 1934 and the Investment Company Act of 1940, the registrant has duly caused this report to be signed on its behalf by the undersigned, thereunto duly authorized.
| | |
| (Registrant) | | Dryden Index Series Fund |
| | | | | | | | |
| By (Signature and Title)* | | /s/ Deborah A. Docs | | | | | | |
| | Deborah A. Docs Secretary | | | | | | |
Pursuant to the requirements of the Securities Exchange Act of 1934 and the Investment Company Act of 1940, this report has been signed below by the following persons on behalf of the registrant and in the capacities and on the dates indicated.
| | | | | | | | |
| By (Signature and Title)* | | /s/ Judy A. Rice | | | | | | |
| | Judy A. Rice President and Principal Executive Officer | | | | |
| | | | | | | | |
| By (Signature and Title)* | | /s/ Grace C. Torres | | | | | | |
| | Grace C. Torres Treasurer and Principal Financial Officer | | | | |
* Print the name and title of each signing officer under his or her signature.