UNITED STATES
SECURITIES AND EXCHANGE COMMISSION
Washington, D.C. 20549
FORM N-CSR
CERTIFIED SHAREHOLDER REPORT OF REGISTERED MANAGEMENT INVESTMENT COMPANIES
| | |
| Investment Company Act file number: | | 811-06677 |
| |
| Exact name of registrant as specified in charter: | | Prudential Investment Portfolios 8 |
| |
| Address of principal executive offices: | | 655 Broad Street, 17th Floor |
| | | Newark, New Jersey 07102 |
| |
| Name and address of agent for service: | | Andrew R. French |
| | | 655 Broad Street, 17th Floor |
| | | Newark, New Jersey 07102 |
| |
| Registrant’s telephone number, including area code: | | 800-225-1852 |
| |
| Date of fiscal year end: | | 9/30/2018 |
| |
| Date of reporting period: | | 9/30/2018 |
Item 1 – Reports to Stockholders

PGIM QMA STOCK INDEX FUND
(Formerly known as Prudential QMA Stock Index Fund)
ANNUAL REPORT
SEPTEMBER 30, 2018

To enroll in e-delivery, go to pgiminvestments.com/edelivery
|
Objective: Provide investment results that correspond to the price and yield
performance of the S&P 500 Index |
Highlights (unaudited)
| • | | The Fund closely tracked the performance of the S&P 500 Index over the 12-month reporting period that ended September 30, 2018, before deduction of fees and expenses. |
| • | | The Fund held all stocks included in the Index in approximately the same proportions. |
This report is not authorized for distribution to prospective investors unless preceded or accompanied by a current prospectus.
The views expressed in this report and information about the Fund’s portfolio holdings are for the period covered by this report and are subject to change thereafter.
Mutual funds are distributed by Prudential Investment Management Services LLC, a Prudential Financial company and member SIPC. QMA is the primary business name of Quantitative Management Associates LLC, a registered investment adviser and a wholly owned subsidiary of PGIM, Inc. (PGIM), a Prudential Financial company. © 2018 Prudential Financial, Inc. and its related entities. PGIM and the PGIM logo are service marks of Prudential Financial, Inc. and its related entities, registered in many jurisdictions worldwide.
| | |
| 2 | | Visit our website at pgiminvestments.com |
PGIM FUNDS — UPDATE
The Board of Directors/Trustees for the Fund has approved the implementation of an automatic conversion feature for Class C shares, effective as of April 1, 2019. To reflect these changes, effective April 1, 2019, the section of the Fund’s Prospectus entitled “How to Buy, Sell and Exchange Fund Shares—How to Exchange Your Shares—Frequent Purchases and Redemptions of Fund Shares” is restated to read as follows:
This supplement should be read in conjunction with your Summary Prospectus, Statutory Prospectus and Statement of Additional Information, be retained for future reference and is in addition to any existing Fund supplements.
| | 1. | In each Fund’s Statutory Prospectus, the following is added at the end of the section entitled “Fund Distributions And Tax Issues—If You Sell or Exchange Your Shares”: |
Automatic Conversion of Class C Shares
The conversion of Class C shares into Class A shares—which happens automatically approximately 10 years after purchase—is not a taxable event for federal income tax purposes. For more information about the automatic conversion of Class C shares, see Class C Shares Automatically Convert to Class A Shares in How to Buy, Sell and Exchange Fund Shares.
| | 2. | In each Fund’s Statutory Prospectus, the following sentence is added at the end of the section entitled “How to Buy, Sell and Exchange Shares—Closure of Certain Share Classes to New Group Retirement Plans”: |
Shareholders owning Class C shares may continue to hold their Class C shares until the shares automatically convert to Class A shares under the conversion schedule, or until the shareholder redeems their Class C shares.
| | 3. | In each Fund’s Statutory Prospectus, the following disclosure is added immediately following the section entitled “How to Buy, Sell and Exchange Shares—How to Buy Shares—Class B Shares Automatically Convert to Class A Shares”: |
Class C Shares Automatically Convert to Class A Shares
Starting on or about April 1, 2019 (the “Effective Date”), Class C shares will be eligible for automatic conversion into Class A shares on a monthly basis approximately ten years after the original date of purchase (the “Conversion Date”). Conversion will take place based on the relative NAV of the two classes, without the imposition of any sales load, fee or other charge. All such automatic conversions of Class C shares will constitute tax-free exchanges for federal income tax purposes.
For shareholders investing in Class C shares through retirement plans or omnibus accounts, and in certain other instances, the Fund and its agents may not have transparency into how
| | | | |
| PGIM QMA Stock Index Fund | | | 3 | |
long a shareholder has held Class C shares for purposes of determining whether such Class C shares are eligible for automatic conversion into Class A shares, and the relevant financial intermediary may not have the ability to track purchases in order to credit individual shareholders’ holding periods. In these circumstances, the Fund will not be able to automatically convert Class C shares into Class A shares as described above. In order to determine eligibility for conversion in these circumstances, it is the responsibility of the financial intermediary to notify the Fund that the shareholder is eligible for the conversion of Class C shares to Class A shares, and the financial intermediary may be required to maintain and provide the Fund with records that substantiate the holding period of Class C shares. It is the financial intermediary’s (and not the Fund’s) responsibility to keep records of transactions made in accounts it holds and to ensure that the shareholder is credited with the proper holding period based on such records or those provided to the financial intermediary by the shareholder. Please consult with your financial intermediary for the applicability of this conversion feature to your shares.
A financial intermediary may sponsor and/or control accounts, programs or platforms that impose a different conversion schedule or different eligibility requirements for the exchange of Class C shares for Class A shares (see Appendix A: Waivers and Discounts Available From Certain Financial Intermediaries of the Prospectus). Please consult with your financial intermediary if you have any questions regarding your shares’ conversion from Class C shares to Class A shares.
| | 4. | In Part II of each Fund’s Statement of Additional Information, the following disclosure is added immediately following the section entitled “Purchase, Redemption and Pricing of Fund Shares—Share Classes—Automatic Conversion of Class B Shares”: |
AUTOMATIC CONVERSION OF CLASS C SHARES. Starting on or about April 1, 2019 (the “Effective Date”), Class C shares will be eligible for automatic conversion into Class A shares on a monthly basis approximately ten years after the original date of purchase (the “Conversion Date”). Conversion will take place based on the relative NAV of the two classes, without the imposition of any sales load, fee or other charge. Class C shares of a Fund acquired through automatic reinvestment of dividends or distributions will convert to Class A shares of the Fund on the Conversion Date pro rata with the converting Class C shares of the Fund that were not acquired through reinvestment of dividends or distributions. All such automatic conversions of Class C shares will constitute tax-free exchanges for federal income tax purposes.
For shareholders investing in Class C shares through retirement plans or omnibus accounts, and in certain other instances, the Fund and its agents may not have transparency into how long a shareholder has held Class C shares for purposes of determining whether such Class C shares are eligible for automatic conversion into Class A shares, and the relevant financial intermediary may not have the ability to track purchases in order to credit individual shareholders’ holding periods. In these circumstances, the Fund will not be able to automatically convert Class C shares into Class A shares as
| | |
| 4 | | Visit our website at pgiminvestments.com |
described above. In order to determine eligibility for conversion in these circumstances, it is the responsibility of the financial intermediary to notify the Fund that the shareholder is eligible for the conversion of Class C shares to Class A shares, and the financial intermediary may be required to maintain and provide the Fund with records that substantiate the holding period of Class C shares. It is the financial intermediary’s (and not the Fund’s) responsibility to keep records of transactions made in accounts it holds and to ensure that the shareholder is credited with the proper holding period based on such records or those provided to the financial intermediary by the shareholder. Please consult with your financial intermediary for the applicability of this conversion feature to your shares.
Class C shares were generally closed to investments by new group retirement plans effective June 1, 2018. Group retirement plans (and their successor, related and affiliated plans) that have Class C shares of the Fund available to participants on or before the Effective Date may continue to open accounts for new participants in such share class and purchase additional shares in existing participant accounts.
The Fund has no responsibility for monitoring or implementing a financial intermediary’s process for determining whether a shareholder meets the required holding period for conversion. A financial intermediary may sponsor and/or control accounts, programs or platforms that impose a different conversion schedule or different eligibility requirements for the exchange of Class C shares for Class A shares, as set forth on Appendix A: Waivers and Discounts Available From Certain Financial Intermediaries of the Prospectus. In these cases, Class C shareholders may have their shares exchanged for Class A shares under the policies of the financial intermediary. Financial intermediaries will be responsible for making such exchanges in those circumstances. Please consult with your financial intermediary if you have any questions regarding your shares’ conversion from Class C shares to Class A shares.
LR1094
- Not part of the Annual Report -
| | | | |
| PGIM QMA Stock Index Fund | | | 5 | |
Table of Contents
| | |
| 6 | | Visit our website at pgiminvestments.com |
Letter from the President

Dear Shareholder:
We hope you find the annual report for the PGIM QMA Stock Index Fund informative and useful. The report covers performance for the 12-month period that ended September 30, 2018.
We have important information to share with you. Effective June 11, 2018, Prudential Mutual Funds were renamed PGIM Funds. This renaming is part of our ongoing effort to further build our reputation and establish our global brand, which began when our firm adopted PGIM Investments as its name in April 2017. Please note that only the Fund’s name has changed. Your Fund’s management and operation, along with its symbols, remained the same.*
Over the reporting period, the global economy continued to grow, and central banks gradually tightened monetary policy. In the US, the economy expanded and employment increased. In June, the Federal Reserve hiked interest rates for the seventh time since 2015, based on confidence in the economy.
Equity returns were strong, due to optimistic earnings expectations and investor sentiment. Global equities, including emerging markets, generally posted positive returns. However, they trailed the performance of US equities, which rose on higher corporate profits, new regulatory policies, and tax reform benefits. Volatility spiked briefly in the middle of the period on inflation concerns, rising interest rates, and a potential global trade war, but it decreased as the period ended.
The overall bond market declined modestly during the period, as measured by the Bloomberg Barclays US Aggregate Bond Index. The best performance came from higher-yielding, economically sensitive sectors. Although they finished the period with negative returns, US investment-grade corporate bonds outperformed US government nominal bonds. A major trend during the period was the flattening of the US Treasury yield curve, which increased the yield on fixed income investments with shorter maturities and made them more attractive to investors.
Regarding your investments with PGIM, we believe it is important to maintain a diversified portfolio of funds consistent with your tolerance for risk, time horizon, and financial goals. Your financial advisor can help you create a diversified investment plan that may include funds covering all the basic asset classes and that reflects your personal investor profile and risk tolerance. However, diversification and asset allocation strategies do not assure a profit or protect against loss in declining markets.
At PGIM Investments, we consider it a great privilege and responsibility to help investors participate in opportunities across global markets while meeting their toughest investment challenges. PGIM is a top-10 global investment manager with more than $1 trillion in assets under management. This investment expertise allows us to deliver actively managed funds and strategies to meet the needs of investors around the globe.
Thank you for choosing our family of funds.
Sincerely,

Stuart S. Parker, President
PGIM QMA Stock Index Fund
November 15, 2018
*The Prudential Day One Funds did not change their names.
| | | | |
| PGIM QMA Stock Index Fund | | | 7 | |
Your Fund’s Performance (unaudited)
Performance data quoted represent past performance. Past performance does not guarantee future results. The investment return and principal value of an investment will fluctuate, so that an investor’s shares, when redeemed, may be worth more or less than their original cost. Current performance may be lower or higher than the past performance data quoted. An investor may obtain performance data as of the most recent month-end by visiting our website at www.pgiminvestments.com or by calling (800) 225-1852.
| | | | | | | | | | | | | | |
| | | Average Annual Total Returns as of 9/30/18 (with sales charges) | |
| | | One Year (%) | | Five Years (%) | | | Ten Years (%) | | | Since Inception (%) | |
| Class A | | 13.52 | | | 12.63 | | | | 11.07 | | | | — | |
| Class C | | 15.56 | | | 12.65 | | | | 10.72 | | | | — | |
| Class I | | 17.72 | | | 13.76 | | | | 11.83 | | | | — | |
| Class Z | | 17.67 | | | 13.69 | | | | 11.76 | | | | — | |
| Class R6* | | N/A | | | N/A | | | | N/A | | | | 12.57** (11/28/17) | |
| S&P 500 Index | |
| | 17.91 | | | 13.93 | | | | 11.96 | | | | — | |
| Lipper S&P 500 Index Funds Average | | | | — | |
| | | 17.40 | | | 13.37 | | | | 11.38 | | | | — | |
| | | | | | | | | | | | | | |
| | | Average Annual Total Returns as of 9/30/18
(without sales charges) | |
| | | One Year (%) | | Five Years (%) | | | Ten Years (%) | | | Since Inception (%) | |
| Class A | | 17.34 | | | 13.38 | | | | 11.44 | | | | — | |
| Class C | | 16.56 | | | 12.65 | | | | 10.72 | | | | — | |
| Class I | | 17.72 | | | 13.76 | | | | 11.83 | | | | — | |
| Class Z | | 17.67 | | | 13.69 | | | | 11.76 | | | | — | |
| Class R6* | | N/A | | | N/A | | | | N/A | | | | 12.57** (11/28/17) | |
| S&P 500 Index | | | | | | | | | | | | | | |
| | 17.91 | | | 13.93 | | | | 11.96 | | | | — | |
| Lipper S&P 500 Index Funds Average | | | | | | | | | | | | | — | |
| | | 17.40 | | | 13.37 | | | | 11.38 | | | | — | |
| | |
| 8 | | Visit our website at pgiminvestments.com |
Growth of a $10,000 Investment (unaudited)
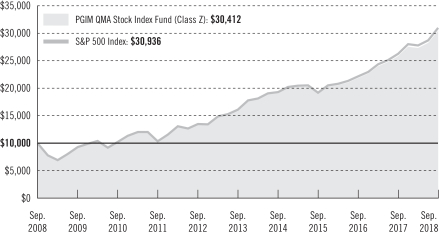
The graph compares a $10,000 investment in the Fund’s Class Z shares with a similar investment in the S&P 500 Index by portraying the initial account values at the beginning of the 10-year period (September 30, 2008) and the account values at the end of the current fiscal year (September 30, 2018) as measured on a quarterly basis. For purposes of the graph, and unless otherwise indicated, it has been assumed that (a) all recurring fees (including management fees) were deducted; and (b) all dividends and distributions were reinvested. The line graph provides information for Class Z shares only. As indicated in the tables provided earlier, performance for other share classes will vary due to the differing charges and expenses applicable to each share class (as indicated in the following paragraphs). Without waiver of fees and/or expense reimbursement, if any, the Fund’s returns would have been lower.
Past performance does not predict future performance. Total returns and the ending account values in the graphs include changes in share price and reinvestment of dividends and capital gains distributions in a hypothetical investment for the periods shown. The Fund’s total returns do not reflect the deduction of income taxes on an individual’s investment. Taxes may reduce your actual investment returns on income or gains paid by the Fund or any gains you may realize if you sell your shares.
Source: PGIM Investments LLC and Lipper Inc.
*Formerly known as Class Q shares.
**Not annualized
Since Inception returns are provided for any share class with less than 10 fiscal years of returns. Since Inception returns for the Index and the Lipper Average are measured from the closest month-end to the class’ inception date.
| | | | |
| PGIM QMA Stock Index Fund | | | 9 | |
Your Fund’s Performance (continued)
The returns in the tables do not reflect the deduction of taxes that a shareholder would pay on Fund distributions or following the redemption of Fund shares. The average annual total returns take into account applicable sales charges, which are described for each share class in the table below.
| | | | | | | | | | |
| | | Class A | | Class C | | Class I | | Class Z | | Class R6* |
| Maximum initial sales charge | | 3.25% of the public offering price | | None | | None | | None | | None |
Contingent deferred sales charge (CDSC)
(as a percentage of the lower of original purchase price or net asset value at redemption) | | 1.00% on sales of $1 million or more made within 12 months of purchase | | 1.00% on sales made within 12 months of purchase | | None | | None | | None |
| Annual distribution and service (12b-1) fees (shown as a percentage of average daily net assets) | | 0.30% | | 1.00% | | None | | None | | None |
*Formerly known as Class Q shares.
Benchmark Definitions
S&P 500 Index—The S&P 500 Index (the Index) is an unmanaged index of over 500 stocks of large US public companies. It gives a broad look at how stock prices in the United States have performed. The cumulative total return for the Index measured from the month-end closest to the inception date of the Fund’s Class R6 shares is 11.79%.
Lipper S&P 500 Index Funds Average—The Lipper S&P 500 Index Funds Average (Lipper Average) is based on the average return of all funds in the Lipper S&P 500 Index Funds Average universe for the periods noted. Funds in the Lipper Average are passively managed, limited expense (management fee no higher than 0.50%) funds designed to replicate the performance of the S&P 500 Index on a reinvested basis. The cumulative total return for the Lipper Average measured from the month-end closest to the inception date of the Fund’s Class R6 shares is 11.39%.
Investors cannot invest directly in an index or average. The returns for the Index would be lower if they included the effects of sales charges, operating expenses of a mutual fund, or taxes. Returns for the Lipper Average reflect the deduction of operating expenses, but not sales charges or taxes.
| | |
| 10 | | Visit our website at pgiminvestments.com |
12-month performance broken out by S&P 500 Index sectors.
S&P 500 Index as of 9/30/18
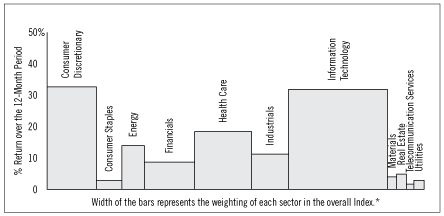
*Sector weightings are subject to change.
Source: FactSet.
| | | | |
| PGIM QMA Stock Index Fund | | | 11 | |
Strategy and Performance Overview (unaudited)
How did the Fund perform?
The PGIM QMA Stock Index Fund’s Class Z shares returned 17.67% in the 12-month reporting period that ended September 30, 2018, underperforming the 17.91% return of the S&P 500 Index (the Index), and outperforming the 17.40% return of the Lipper S&P 500 Index Funds Average.
| • | | The Fund closely tracked the performance of the Index over the reporting period before deduction of fees and expenses. |
| • | | The Fund held all stocks included in the Index in approximately the same proportions. |
| • | | The Fund held S&P 500 stock index futures, a form of derivatives, to maintain exposure to equities and provide portfolio liquidity. Futures had minimal impact on performance over the year. |
What were market conditions?
| • | | In a major event capping 2017, the US Congress passed a tax reform bill that was signed into law in December. The law cut the corporate tax rate to 21% from 35% and reduced individual tax rates, including lowering the top rate to 37% from 39.6%. The US equity market advanced in anticipation of the law and surged into the new year. |
| • | | In late January through February, US equities experienced a steep decline, triggered by an inflation scare and US protectionist trade measures. The market pullback was accompanied by a sharp spike in volatility that drove the unwinding of investors’ short volatility positions. These positions seek to profit from the potential of continued low levels of volatility. |
| • | | US equities remained range bound during the spring, despite 25% year-over-year earnings growth in the first two quarters of 2018, fueled by the fiscal stimulus of corporate tax cuts. The economic backdrop was also favorable, amid continued strong growth. Equity performance may have been restrained by geopolitical concerns. Anxiety regarding a global trade war emerged in March, eased in May, but intensified again in June on the heels of unprecedented acrimony at the G7 (Group of Seven) summit and the Trump administration’s threat to impose tariffs on Chinese goods. The G7 consists of Canada, France, Germany, Italy, Japan, the United Kingdom (UK), and the United States. These countries, with the seven largest advanced economies in the world, represent more than 62% of the global net wealth. Retaliatory measures by China ignited fears of a tit-for-tat escalation cycle that could be destructive for global economic growth. |
| • | | Fears of a trade war abated toward the end of the summer, with good news heralded by a trade agreement between the US and Mexico, lower-than-expected tariffs on $500 billion of Chinese goods, and a trade deal with Canada that concluded the renegotiation of the North American Free Trade Agreement. US equity markets surged in response, delivering strong gains from July to September and reaching new highs as geopolitical anxiety eased and strong corporate earnings continued. |
| | |
| 12 | | Visit our website at pgiminvestments.com |
| • | | At the end of the reporting period, US economic growth was accelerating, while growth in other major economies appeared to be slowing. As a result, 2018 appeared to be a year of global growth divergence, whereas 2017 was characterized by synchronized global economic recovery. |
| • | | US economic growth was accompanied by rising interest rates and a stronger US dollar, which strained emerging markets economies. Higher US interest rates caused capital outflows from the emerging markets, leading to the sharp depreciation of emerging markets currencies and unleashing a vicious cycle of increased inflation and central bank rate hikes. This was especially true in countries with significant political problems, economic imbalances, and limited reserves, such as Turkey and Argentina. Trade tensions and the high price of crude oil further exacerbated the problem, even in stronger emerging markets countries, by putting additional pressure on their foreign currency reserves. Nevertheless, the potential of an emerging markets crisis appeared to be contained at the end of the period, thanks to China’s commitment to doing “whatever it takes” to keep its own economy stable and the proactive stance of emerging markets central banks overall. |
| • | | In Europe and Japan, economic growth has been slowing since the beginning of 2018, roiled by negative news such as tariff uncertainty, protracted negotiations over the UK’s exit from the European Union, and the possibility of Italy leaving as well. Consequently, the MSCI EAFE Index declined 4% during 2018 through September 30, while the MSCI Emerging Markets Index dropped 12% (both returns in US dollar terms). In contrast, the S&P 500 Index generated a positive return of 9% in that same period. QMA believes the divergence in equity returns between the US and other developed markets countries has reached an unprecedented level and thinks they are likely to converge. |
| • | | US small-cap equities outperformed from March to July at the height of the trade tensions, perceived by investors as a domestic asset class that could provide safe haven from macroeconomic turbulence abroad. With trade tensions easing, this sector gave back some of its gains toward the end of the reporting period. |
| • | | The Federal Reserve (the Fed) continued tightening US monetary policy, having raised short-term rates six times from the beginning of 2017 through the end of the reporting period. This has lifted the short-term end of the US Treasury yield curve, while the long-term end has remained anchored by interest rate differentials with the rest of the world and investors’ fears about the maturity of the US business cycle. As a result, the US Treasury yield curve flattened throughout 2018. |
| • | | US Treasury securities and investment-grade corporate bonds underperformed US equities between January 1 and September 30, 2018. At the same time, high yield corporate bonds performed strongly, as spreads (yield differentials versus US Treasuries) narrowed due to the healthy economic backdrop. |
| | | | |
| PGIM QMA Stock Index Fund | | | 13 | |
Strategy and Performance Overview (continued)
Current outlook
| • | | The global economy enters the last quarter of 2018 with good momentum; however, growth has become less synchronized, more uneven, and less robust than in 2017, with economic activity accelerating in the US; moderating in the eurozone, the UK, and Japan; and slowing in China and other emerging markets. |
| • | | Trade tensions and emerging markets turmoil top downside risks. Trade uncertainty has now seeped into gross domestic product and business confidence data for Europe and Japan, while the combination of trade tensions, fears of Turkish lira contagion, and Fed rate hikes have contributed to slowdowns in a number of emerging markets, including China. On balance, the near-term risk of a global economic downturn remains very low. However, storm clouds are gathering. |
| | |
| 14 | | Visit our website at pgiminvestments.com |
Fees and Expenses (unaudited)
As a shareholder of the Fund, you incur two types of costs: (1) transaction costs, including sales charges (loads) on purchase payments and redemptions, as applicable, and (2) ongoing costs, including management fees, distribution and/or service (12b-1) fees, and other Fund expenses, as applicable. This example is intended to help you understand your ongoing costs (in dollars) of investing in the Fund and to compare these costs with the ongoing costs of investing in other mutual funds.
The example is based on an investment of $1,000 held through the six-month period ended September 30, 2018. The example is for illustrative purposes only; you should consult the Prospectus for information on initial and subsequent minimum investment requirements.
Actual Expenses
The first line for each share class in the table on the following page provides information about actual account values and actual expenses. You may use the information on this line, together with the amount you invested, to estimate the expenses that you paid over the period. Simply divide your account value by $1,000 (for example, an $8,600 account value ÷ $1,000 = 8.6), then multiply the result by the number on the first line under the heading “Expenses Paid During the Six-Month Period” to estimate the expenses you paid on your account during this period.
Hypothetical Example for Comparison Purposes
The second line for each share class in the table on the following page provides information about hypothetical account values and hypothetical expenses based on the Fund’s actual expense ratio and an assumed rate of return of 5% per year before expenses, which is not the Fund’s actual return. The hypothetical account values and expenses may not be used to estimate the actual ending account balance or expenses you paid for the period. You may use this information to compare the ongoing costs of investing in the Fund and other funds. To do so, compare this 5% hypothetical example with the 5% hypothetical examples that appear in the shareholder reports of the other funds.
The Fund’s transfer agent may charge additional fees to holders of certain accounts that are not included in the expenses shown in the table on the following page. These fees apply to individual retirement accounts (IRAs) and Section 403(b) accounts. As of the close of the six-month period covered by the table, IRA fees included an annual maintenance fee of $15 per account (subject to a maximum annual maintenance fee of $25 for all accounts held by the same shareholder). Section 403(b) accounts are charged an annual $25 fiduciary maintenance fee. Some of the fees may vary in amount, or may be waived, based on your total account balance or the number of PGIM funds, including the Fund, that you own. You should consider the additional fees that were charged to your Fund account over
| | | | |
| PGIM QMA Stock Index Fund | | | 15 | |
Fees and Expenses (continued)
the six-month period when you estimate the total ongoing expenses paid over the period and the impact of these fees on your ending account value, as these additional expenses are not reflected in the information provided in the expense table. Additional fees have the effect of reducing investment returns.
Please note that the expenses shown in the table are meant to highlight your ongoing costs only and do not reflect any transactional costs such as sales charges (loads). Therefore, the second line for each share class in the table is useful in comparing ongoing costs only and will not help you determine the relative total costs of owning different funds. In addition, if these transactional costs were included, your costs would have been higher.
| | | | | | | | | | | | | | | | | | |
PGIM QMA Stock
Index Fund | | Beginning Account
Value
April 1, 2018 | | | Ending Account
Value
September 30, 2018 | | | Annualized
Expense Ratio
Based on the
Six-Month Period | | | Expenses Paid
During the
Six-Month Period* | |
| Class A | | Actual | | $ | 1,000.00 | | | $ | 1,111.10 | | | | 0.52 | % | | $ | 2.75 | |
| | Hypothetical | | $ | 1,000.00 | | | $ | 1,022.46 | | | | 0.52 | % | | $ | 2.64 | |
| Class C | | Actual | | $ | 1,000.00 | | | $ | 1,107.40 | | | | 1.18 | % | | $ | 6.23 | |
| | Hypothetical | | $ | 1,000.00 | | | $ | 1,019.15 | | | | 1.18 | % | | $ | 5.97 | |
| Class I | | Actual | | $ | 1,000.00 | | | $ | 1,113.00 | | | | 0.19 | % | | $ | 1.01 | |
| | Hypothetical | | $ | 1,000.00 | | | $ | 1,024.12 | | | | 0.19 | % | | $ | 0.96 | |
| Class Z | | Actual | | $ | 1,000.00 | | | $ | 1,112.90 | | | | 0.24 | % | | $ | 1.27 | |
| | Hypothetical | | $ | 1,000.00 | | | $ | 1,023.87 | | | | 0.24 | % | | $ | 1.22 | |
| Class R6** | | Actual | | $ | 1,000.00 | | | $ | 1,113.20 | | | | 0.18 | % | | $ | 0.95 | |
| | | Hypothetical | | $ | 1,000.00 | | | $ | 1,024.17 | | | | 0.18 | % | | $ | 0.91 | |
*Fund expenses (net of fee waivers or subsidies, if any) for each share class are equal to the annualized expense ratio for each share class (provided in the table), multiplied by the average account value over the period, multiplied by the 183 days in the six-month period ended September 30, 2018, and divided by the 365 days in the Fund’s fiscal year ended September 30, 2018 (to reflect the six-month period). Expenses presented in the table include the expenses of any underlying portfolios in which the Fund may invest.
**Formerly known as Class Q shares.
| | |
| 16 | | Visit our website at pgiminvestments.com |
Schedule of Investments
as of September 30, 2018
| | | | | | | | |
| Description | | Shares | | | Value | |
LONG-TERM INVESTMENTS 98.4% | | | | | | | | |
| | |
COMMON STOCKS 98.2% | | | | | | | | |
| | |
Aerospace & Defense 2.7% | | | | | | | | |
Arconic, Inc. | | | 16,881 | | | $ | 371,551 | |
Boeing Co. (The) | | | 22,794 | | | | 8,477,088 | |
General Dynamics Corp. | | | 11,512 | | | | 2,356,737 | |
Harris Corp. | | | 5,050 | | | | 854,510 | |
Huntington Ingalls Industries, Inc. | | | 2,000 | | | | 512,160 | |
L3 Technologies, Inc. | | | 3,340 | | | | 710,151 | |
Lockheed Martin Corp. | | | 10,346 | | | | 3,579,302 | |
Northrop Grumman Corp. | | | 7,348 | | | | 2,332,035 | |
Raytheon Co. | | | 12,044 | | | | 2,489,013 | |
Rockwell Collins, Inc. | | | 6,873 | | | | 965,450 | |
Textron, Inc. | | | 10,734 | | | | 767,159 | |
TransDigm Group, Inc.* | | | 2,100 | | | | 781,830 | |
United Technologies Corp. | | | 31,180 | | | | 4,359,276 | |
| | | | | | | | |
| | | | | | | 28,556,262 | |
| | |
Air Freight & Logistics 0.7% | | | | | | | | |
C.H. Robinson Worldwide, Inc. | | | 6,000 | | | | 587,520 | |
Expeditors International of Washington, Inc. | | | 7,200 | | | | 529,416 | |
FedEx Corp. | | | 10,216 | | | | 2,459,911 | |
United Parcel Service, Inc. (Class B Stock) | | | 28,690 | | | | 3,349,557 | |
| | | | | | | | |
| | | | | | | 6,926,404 | |
| | |
Airlines 0.5% | | | | | | | | |
Alaska Air Group, Inc. | | | 4,900 | | | | 337,414 | |
American Airlines Group, Inc. | | | 16,650 | | | | 688,145 | |
Delta Air Lines, Inc. | | | 27,000 | | | | 1,561,410 | |
Southwest Airlines Co. | | | 22,374 | | | | 1,397,256 | |
United Continental Holdings, Inc.* | | | 9,700 | | | | 863,882 | |
| | | | | | | | |
| | | | | | | 4,848,107 | |
| | |
Auto Components 0.1% | | | | | | | | |
Aptiv PLC | | | 11,200 | | | | 939,680 | |
BorgWarner, Inc. | | | 8,200 | | | | 350,796 | |
Goodyear Tire & Rubber Co. (The) | | | 9,971 | | | | 233,222 | |
| | | | | | | | |
| | | | | | | 1,523,698 | |
| | |
Automobiles 0.3% | | | | | | | | |
Ford Motor Co. | | | 162,938 | | | | 1,507,177 | |
See Notes to Financial Statements.
| | | | |
| PGIM QMA Stock Index Fund | | | 17 | |
Schedule of Investments (continued)
as of September 30, 2018
| | | | | | | | |
| Description | | Shares | | | Value | |
COMMON STOCKS (Continued) | | | | | | | | |
| | |
Automobiles (cont’d.) | | | | | | | | |
General Motors Co. | | | 52,400 | | | $ | 1,764,308 | |
Harley-Davidson, Inc. | | | 6,300 | | | | 285,390 | |
| | | | | | | | |
| | | | | | | 3,556,875 | |
| | |
Banks 5.8% | | | | | | | | |
Bank of America Corp. | | | 393,095 | | | | 11,580,579 | |
BB&T Corp. | | | 32,558 | | | | 1,580,365 | |
Citigroup, Inc. | | | 106,295 | | | | 7,625,603 | |
Citizens Financial Group, Inc. | | | 19,800 | | | | 763,686 | |
Comerica, Inc. | | | 7,161 | | | | 645,922 | |
Fifth Third Bancorp | | | 28,473 | | | | 794,966 | |
Huntington Bancshares, Inc. | | | 45,329 | | | | 676,309 | |
JPMorgan Chase & Co. | | | 141,933 | | | | 16,015,720 | |
KeyCorp | | | 44,135 | | | | 877,845 | |
M&T Bank Corp. | | | 6,170 | | | | 1,015,212 | |
People’s United Financial, Inc. | | | 14,000 | | | | 239,680 | |
PNC Financial Services Group, Inc. (The) | | | 19,772 | | | | 2,692,749 | |
Regions Financial Corp. | | | 45,274 | | | | 830,778 | |
SunTrust Banks, Inc. | | | 19,383 | | | | 1,294,590 | |
SVB Financial Group* | | | 2,220 | | | | 690,043 | |
U.S. Bancorp | | | 64,795 | | | | 3,421,824 | |
Wells Fargo & Co. | | | 182,536 | | | | 9,594,092 | |
Zions Bancorp NA | | | 8,300 | | | | 416,245 | |
| | | | | | | | |
| | | | | | | 60,756,208 | |
| | |
Beverages 1.7% | | | | | | | | |
Brown-Forman Corp. (Class B Stock) | | | 10,950 | | | | 553,522 | |
Coca-Cola Co. (The) | | | 159,564 | | | | 7,370,261 | |
Constellation Brands, Inc. (Class A Stock) | | | 7,100 | | | | 1,530,902 | |
Molson Coors Brewing Co. (Class B Stock) | | | 7,394 | | | | 454,731 | |
Monster Beverage Corp.* | | | 16,950 | | | | 987,846 | |
PepsiCo, Inc. | | | 59,181 | | | | 6,616,436 | |
| | | | | | | | |
| | | | | | | 17,513,698 | |
| | |
Biotechnology 2.6% | | | | | | | | |
AbbVie, Inc. | | | 63,274 | | | | 5,984,455 | |
Alexion Pharmaceuticals, Inc.* | | | 9,400 | | | | 1,306,694 | |
Amgen, Inc. | | | 27,726 | | | | 5,747,323 | |
Biogen, Inc.* | | | 8,840 | | | | 3,123,260 | |
Celgene Corp.* | | | 29,600 | | | | 2,648,904 | |
Gilead Sciences, Inc. | | | 54,300 | | | | 4,192,503 | |
Incyte Corp.* | | | 7,100 | | | | 490,468 | |
See Notes to Financial Statements.
| | | | | | | | |
| Description | | Shares | | | Value | |
COMMON STOCKS (Continued) | | | | | | | | |
| | |
Biotechnology (cont’d.) | | | | | | | | |
Regeneron Pharmaceuticals, Inc.* | | | 3,230 | | | $ | 1,305,049 | |
Vertex Pharmaceuticals, Inc.* | | | 10,760 | | | | 2,073,882 | |
| | | | | | | | |
| | | | | | | 26,872,538 | |
| | |
Building Products 0.3% | | | | | | | | |
A.O. Smith Corp. | | | 6,000 | | | | 320,220 | |
Allegion PLC | | | 3,933 | | | | 356,212 | |
Fortune Brands Home & Security, Inc. | | | 5,800 | | | | 303,688 | |
Johnson Controls International PLC | | | 37,987 | | | | 1,329,545 | |
Masco Corp. | | | 12,226 | | | | 447,471 | |
| | | | | | | | |
| | | | | | | 2,757,136 | |
| | |
Capital Markets 2.7% | | | | | | | | |
Affiliated Managers Group, Inc. | | | 2,400 | | | | 328,128 | |
Ameriprise Financial, Inc. | | | 6,121 | | | | 903,827 | |
Bank of New York Mellon Corp. (The) | | | 40,338 | | | | 2,056,835 | |
BlackRock, Inc. | | | 5,160 | | | | 2,432,063 | |
Cboe Global Markets, Inc. | | | 4,800 | | | | 460,608 | |
Charles Schwab Corp. (The) | | | 50,111 | | | | 2,462,956 | |
CME Group, Inc. | | | 14,100 | | | | 2,399,961 | |
E*TRADE Financial Corp.* | | | 10,820 | | | | 566,860 | |
Franklin Resources, Inc. | | | 13,242 | | | | 402,689 | |
Goldman Sachs Group, Inc. (The) | | | 14,740 | | | | 3,305,298 | |
Intercontinental Exchange, Inc. | | | 23,740 | | | | 1,777,889 | |
Invesco Ltd. | | | 16,000 | | | | 366,080 | |
Moody’s Corp. | | | 7,076 | | | | 1,183,107 | |
Morgan Stanley | | | 56,636 | | | | 2,637,538 | |
MSCI, Inc. | | | 3,700 | | | | 656,417 | |
Nasdaq, Inc. | | | 4,700 | | | | 403,260 | |
Northern Trust Corp. | | | 8,762 | | | | 894,863 | |
Raymond James Financial, Inc. | | | 5,600 | | | | 515,480 | |
S&P Global, Inc. | | | 10,470 | | | | 2,045,733 | |
State Street Corp. | | | 15,362 | | | | 1,287,028 | |
T. Rowe Price Group, Inc. | | | 10,200 | | | | 1,113,636 | |
| | | | | | | | |
| | | | | | | 28,200,256 | |
| | |
Chemicals 1.8% | | | | | | | | |
Air Products & Chemicals, Inc. | | | 9,202 | | | | 1,537,194 | |
Albemarle Corp. | | | 4,640 | | | | 462,979 | |
CF Industries Holdings, Inc. | | | 9,800 | | | | 533,512 | |
DowDuPont, Inc. | | | 96,828 | | | | 6,227,009 | |
Eastman Chemical Co. | | | 6,086 | | | | 582,552 | |
See Notes to Financial Statements.
| | | | |
| PGIM QMA Stock Index Fund | | | 19 | |
Schedule of Investments (continued)
as of September 30, 2018
| | | | | | | | |
| Description | | Shares | | | Value | |
COMMON STOCKS (Continued) | | | | | | | | |
| | |
Chemicals (cont’d.) | | | | | | | | |
Ecolab, Inc. | | | 10,842 | | | $ | 1,699,809 | |
FMC Corp. | | | 5,700 | | | | 496,926 | |
International Flavors & Fragrances, Inc. | | | 3,375 | | | | 469,530 | |
LyondellBasell Industries NV (Class A Stock) | | | 13,400 | | | | 1,373,634 | |
Mosaic Co. (The) | | | 14,200 | | | | 461,216 | |
PPG Industries, Inc. | | | 10,548 | | | | 1,151,103 | |
Praxair, Inc. | | | 11,928 | | | | 1,917,187 | |
Sherwin-Williams Co. (The) | | | 3,476 | | | | 1,582,310 | |
| | | | | | | | |
| | | | | | | 18,494,961 | |
| | |
Commercial Services & Supplies 0.3% | | | | | | | | |
Cintas Corp. | | | 3,760 | | | | 743,765 | |
Copart, Inc.* | | | 8,300 | | | | 427,699 | |
Republic Services, Inc. | | | 9,135 | | | | 663,749 | |
Stericycle, Inc.* | | | 3,600 | | | | 211,248 | |
Waste Management, Inc. | | | 16,513 | | | | 1,492,115 | |
| | | | | | | | |
| | | | | | | 3,538,576 | |
| | |
Communications Equipment 1.1% | | | | | | | | |
Arista Networks, Inc.* | | | 1,850 | | | | 491,841 | |
Cisco Systems, Inc. | | | 195,744 | | | | 9,522,946 | |
F5 Networks, Inc.* | | | 2,700 | | | | 538,434 | |
Juniper Networks, Inc. | | | 13,600 | | | | 407,592 | |
Motorola Solutions, Inc. | | | 6,916 | | | | 900,048 | |
| | | | | | | | |
| | | | | | | 11,860,861 | |
| | |
Construction & Engineering 0.1% | | | | | | | | |
Fluor Corp. | | | 5,974 | | | | 347,089 | |
Jacobs Engineering Group, Inc. | | | 5,000 | | | | 382,500 | |
Quanta Services, Inc.* | | | 6,100 | | | | 203,618 | |
| | | | | | | | |
| | | | | | | 933,207 | |
| | |
Construction Materials 0.1% | | | | | | | | |
Martin Marietta Materials, Inc. | | | 2,700 | | | | 491,265 | |
Vulcan Materials Co. | | | 5,400 | | | | 600,480 | |
| | | | | | | | |
| | | | | | | 1,091,745 | |
| | |
Consumer Finance 0.7% | | | | | | | | |
American Express Co. | | | 29,739 | | | | 3,166,906 | |
Capital One Financial Corp. | | | 20,366 | | | | 1,933,345 | |
See Notes to Financial Statements.
| | | | | | | | |
| Description | | Shares | | | Value | |
COMMON STOCKS (Continued) | | | | | | | | |
| | |
Consumer Finance (cont’d.) | | | | | | | | |
Discover Financial Services | | | 14,518 | | | $ | 1,109,901 | |
Synchrony Financial | | | 28,865 | | | | 897,124 | |
| | | | | | | | |
| | | | | | | 7,107,276 | |
| | |
Containers & Packaging 0.3% | | | | | | | | |
Avery Dennison Corp. | | | 3,738 | | | | 405,012 | |
Ball Corp. | | | 13,928 | | | | 612,693 | |
International Paper Co. | | | 16,884 | | | | 829,849 | |
Packaging Corp. of America | | | 3,900 | | | | 427,791 | |
Sealed Air Corp. | | | 6,536 | | | | 262,420 | |
WestRock Co. | | | 10,533 | | | | 562,884 | |
| | | | | | | | |
| | | | | | | 3,100,649 | |
| | |
Distributors 0.1% | | | | | | | | |
Genuine Parts Co. | | | 5,999 | | | | 596,301 | |
LKQ Corp.* | | | 12,100 | | | | 383,207 | |
| | | | | | | | |
| | | | | | | 979,508 | |
| | |
Diversified Consumer Services 0.0% | | | | | | | | |
H&R Block, Inc. | | | 8,520 | | | | 219,390 | |
| | |
Diversified Financial Services 1.7% | | | | | | | | |
Berkshire Hathaway, Inc. (Class B Stock)* | | | 80,250 | | | | 17,182,328 | |
Jefferies Financial Group, Inc. | | | 12,300 | | | | 270,108 | |
| | | | | | | | |
| | | | | | | 17,452,436 | |
| | |
Diversified Telecommunication Services 1.9% | | | | | | | | |
AT&T, Inc. | | | 302,707 | | | | 10,164,901 | |
CenturyLink, Inc. | | | 40,779 | | | | 864,515 | |
Verizon Communications, Inc. | | | 172,233 | | | | 9,195,520 | |
| | | | | | | | |
| | | | | | | 20,224,936 | |
| | |
Electric Utilities 1.7% | | | | | | | | |
Alliant Energy Corp. | | | 9,500 | | | | 404,415 | |
American Electric Power Co., Inc. | | | 20,291 | | | | 1,438,226 | |
Duke Energy Corp. | | | 29,039 | | | | 2,323,701 | |
Edison International | | | 13,462 | | | | 911,108 | |
Entergy Corp. | | | 7,715 | | | | 625,918 | |
Evergy, Inc. | | | 10,500 | | | | 576,660 | |
Eversource Energy | | | 13,100 | | | | 804,864 | |
See Notes to Financial Statements.
| | | | |
| PGIM QMA Stock Index Fund | | | 21 | |
Schedule of Investments (continued)
as of September 30, 2018
| | | | | | | | |
| Description | | Shares | | | Value | |
COMMON STOCKS (Continued) | | | | | | | | |
| | |
Electric Utilities (cont’d.) | | | | | | | | |
Exelon Corp. | | | 40,012 | | | $ | 1,746,924 | |
FirstEnergy Corp. | | | 18,677 | | | | 694,224 | |
NextEra Energy, Inc. | | | 19,632 | | | | 3,290,323 | |
PG&E Corp. | | | 21,303 | | | | 980,151 | |
Pinnacle West Capital Corp. | | | 4,700 | | | | 372,146 | |
PPL Corp. | | | 28,452 | | | | 832,506 | |
Southern Co. (The) | | | 41,815 | | | | 1,823,134 | |
Xcel Energy, Inc. | | | 20,983 | | | | 990,607 | |
| | | | | | | | |
| | | | | | | 17,814,907 | |
| | |
Electrical Equipment 0.5% | | | | | | | | |
AMETEK, Inc. | | | 9,800 | | | | 775,376 | |
Eaton Corp. PLC | | | 18,293 | | | | 1,586,552 | |
Emerson Electric Co. | | | 26,150 | | | | 2,002,567 | |
Rockwell Automation, Inc. | | | 5,303 | | | | 994,418 | |
| | | | | | | | |
| | | | | | | 5,358,913 | |
| | |
Electronic Equipment, Instruments & Components 0.4% | | | | | | | | |
Amphenol Corp. (Class A Stock) | | | 12,600 | | | | 1,184,652 | |
Corning, Inc. | | | 33,897 | | | | 1,196,564 | |
FLIR Systems, Inc. | | | 5,700 | | | | 350,379 | |
IPG Photonics Corp.* | | | 1,600 | | | | 249,712 | |
TE Connectivity Ltd. | | | 14,550 | | | | 1,279,382 | |
| | | | | | | | |
| | | | | | | 4,260,689 | |
| | |
Energy Equipment & Services 0.7% | | | | | | | | |
Baker Hughes a GE Co. | | | 17,145 | | | | 580,015 | |
Halliburton Co. | | | 36,122 | | | | 1,464,025 | |
Helmerich & Payne, Inc. | | | 4,200 | | | | 288,834 | |
National Oilwell Varco, Inc. | | | 15,800 | | | | 680,664 | |
Schlumberger Ltd. | | | 57,632 | | | | 3,510,941 | |
TechnipFMC PLC (United Kingdom) | | | 17,300 | | | | 540,625 | |
| | | | | | | | |
| | | | | | | 7,065,104 | |
| | |
Equity Real Estate Investment Trusts (REITs) 2.5% | | | | | | | | |
Alexandria Real Estate Equities, Inc. | | | 4,300 | | | | 540,897 | |
American Tower Corp. | | | 18,450 | | | | 2,680,785 | |
Apartment Investment & Management Co. (Class A Stock) | | | 6,280 | | | | 277,136 | |
AvalonBay Communities, Inc. | | | 5,911 | | | | 1,070,778 | |
Boston Properties, Inc. | | | 6,580 | | | | 809,932 | |
Crown Castle International Corp. | | | 17,200 | | | | 1,914,876 | |
See Notes to Financial Statements.
| | | | | | | | |
| Description | | Shares | | | Value | |
COMMON STOCKS (Continued) | | | | | | | | |
| | |
Equity Real Estate Investment Trusts (REITs) (cont’d.) | | | | | | | | |
Digital Realty Trust, Inc. | | | 8,500 | | | $ | 956,080 | |
Duke Realty Corp. | | | 14,300 | | | | 405,691 | |
Equinix, Inc. | | | 3,386 | | | | 1,465,765 | |
Equity Residential | | | 15,500 | | | | 1,027,030 | |
Essex Property Trust, Inc. | | | 2,900 | | | | 715,459 | |
Extra Space Storage, Inc. | | | 5,400 | | | | 467,856 | |
Federal Realty Investment Trust | | | 3,100 | | | | 392,057 | |
HCP, Inc. | | | 18,900 | | | | 497,448 | |
Host Hotels & Resorts, Inc. | | | 30,536 | | | | 644,310 | |
Iron Mountain, Inc. | | | 11,205 | | | | 386,797 | |
Kimco Realty Corp. | | | 17,600 | | | | 294,624 | |
Macerich Co. (The) | | | 4,400 | | | | 243,276 | |
Mid-America Apartment Communities, Inc. | | | 4,800 | | | | 480,864 | |
Prologis, Inc. | | | 25,737 | | | | 1,744,711 | |
Public Storage | | | 6,200 | | | | 1,250,106 | |
Realty Income Corp. | | | 11,800 | | | | 671,302 | |
Regency Centers Corp. | | | 6,100 | | | | 394,487 | |
SBA Communications Corp.* | | | 4,800 | | | | 771,024 | |
Simon Property Group, Inc. | | | 12,889 | | | | 2,278,131 | |
SL Green Realty Corp. | | | 3,800 | | | | 370,614 | |
UDR, Inc. | | | 10,900 | | | | 440,687 | |
Ventas, Inc. | | | 14,833 | | | | 806,619 | |
Vornado Realty Trust | | | 7,184 | | | | 524,432 | |
Welltower, Inc. | | | 15,500 | | | | 996,960 | |
Weyerhaeuser Co. | | | 31,239 | | | | 1,008,082 | |
| | | | | | | | |
| | | | | | | 26,528,816 | |
| | |
Food & Staples Retailing 1.4% | | | | | | | | |
Costco Wholesale Corp. | | | 18,408 | | | | 4,323,671 | |
Kroger Co. (The) | | | 33,168 | | | | 965,520 | |
Sysco Corp. | | | 20,080 | | | | 1,470,860 | |
Walgreens Boots Alliance, Inc. | | | 35,678 | | | | 2,600,926 | |
Walmart, Inc. | | | 60,426 | | | | 5,674,606 | |
| | | | | | | | |
| | | | | | | 15,035,583 | |
| | |
Food Products 1.0% | | | | | | | | |
Archer-Daniels-Midland Co. | | | 23,259 | | | | 1,169,230 | |
Campbell Soup Co. | | | 7,247 | | | | 265,458 | |
Conagra Brands, Inc. | | | 15,843 | | | | 538,187 | |
General Mills, Inc. | | | 24,644 | | | | 1,057,721 | |
Hershey Co. (The) | | | 5,716 | | | | 583,032 | |
Hormel Foods Corp. | | | 11,200 | | | | 441,280 | |
J.M. Smucker Co. (The) | | | 4,900 | | | | 502,789 | |
See Notes to Financial Statements.
| | | | |
| PGIM QMA Stock Index Fund | | | 23 | |
Schedule of Investments (continued)
as of September 30, 2018
| | | | | | | | |
| Description | | Shares | | | Value | |
COMMON STOCKS (Continued) | | | | | | | | |
| | |
Food Products (cont’d.) | | | | | | | | |
Kellogg Co. | | | 10,270 | | | $ | 719,105 | |
Kraft Heinz Co. (The) | | | 24,555 | | | | 1,353,226 | |
McCormick & Co., Inc. | | | 5,200 | | | | 685,100 | |
Mondelez International, Inc. (Class A Stock) | | | 61,266 | | | | 2,631,987 | |
Tyson Foods, Inc. (Class A Stock) | | | 12,100 | | | | 720,313 | |
| | | | | | | | |
| | | | | | | 10,667,428 | |
| | |
Health Care Equipment & Supplies 3.2% | | | | | | | | |
Abbott Laboratories | | | 73,213 | | | | 5,370,906 | |
ABIOMED, Inc.* | | | 1,800 | | | | 809,550 | |
Align Technology, Inc.* | | | 3,050 | | | | 1,193,221 | |
Baxter International, Inc. | | | 20,374 | | | | 1,570,632 | |
Becton, Dickinson & Co. | | | 11,305 | | | | 2,950,605 | |
Boston Scientific Corp.* | | | 56,772 | | | | 2,185,722 | |
Cooper Cos., Inc. (The) | | | 2,100 | | | | 582,015 | |
Danaher Corp. | | | 25,700 | | | | 2,792,562 | |
DENTSPLY SIRONA, Inc. | | | 9,400 | | | | 354,756 | |
Edwards Lifesciences Corp.* | | | 8,970 | | | | 1,561,677 | |
Hologic, Inc.* | | | 11,100 | | | | 454,878 | |
IDEXX Laboratories, Inc.* | | | 3,700 | | | | 923,742 | |
Intuitive Surgical, Inc.* | | | 4,760 | | | | 2,732,240 | |
Medtronic PLC | | | 56,615 | | | | 5,569,218 | |
ResMed, Inc. | | | 6,100 | | | | 703,574 | |
Stryker Corp. | | | 13,530 | | | | 2,404,010 | |
Varian Medical Systems, Inc.* | | | 3,700 | | | | 414,141 | |
Zimmer Biomet Holdings, Inc. | | | 8,411 | | | | 1,105,794 | |
| | | | | | | | |
| | | | | | | 33,679,243 | |
| | |
Health Care Providers & Services 3.3% | | | | | | | | |
Aetna, Inc. | | | 13,744 | | | | 2,787,970 | |
AmerisourceBergen Corp. | | | 6,800 | | | | 627,096 | |
Anthem, Inc. | | | 10,760 | | | | 2,948,778 | |
Cardinal Health, Inc. | | | 12,973 | | | | 700,542 | |
Centene Corp.* | | | 8,700 | | | | 1,259,586 | |
Cigna Corp. | | | 10,221 | | | | 2,128,523 | |
CVS Health Corp. | | | 42,199 | | | | 3,321,905 | |
DaVita, Inc.* | | | 5,600 | | | | 401,128 | |
Envision Healthcare Corp.* | | | 4,500 | | | | 205,785 | |
Express Scripts Holding Co.* | | | 23,270 | | | | 2,210,883 | |
HCA Healthcare, Inc. | | | 11,700 | | | | 1,627,704 | |
Henry Schein, Inc.* | | | 6,400 | | | | 544,192 | |
Humana, Inc. | | | 5,800 | | | | 1,963,416 | |
Laboratory Corp. of America Holdings* | | | 4,400 | | | | 764,192 | |
See Notes to Financial Statements.
| | | | | | | | |
| Description | | Shares | | | Value | |
COMMON STOCKS (Continued) | | | | | | | | |
| | |
Health Care Providers & Services (cont’d.) | | | | | | | | |
McKesson Corp. | | | 8,326 | | | $ | 1,104,444 | |
Quest Diagnostics, Inc. | | | 5,600 | | | | 604,296 | |
UnitedHealth Group, Inc. | | | 40,218 | | | | 10,699,597 | |
Universal Health Services, Inc. (Class B Stock) | | | 3,770 | | | | 481,957 | |
WellCare Health Plans, Inc.* | | | 1,500 | | | | 480,735 | |
| | | | | | | | |
| | | | | | | 34,862,729 | |
| | |
Health Care Technology 0.1% | | | | | | | | |
Cerner Corp.* | | | 13,000 | | | | 837,330 | |
| | |
Hotels, Restaurants & Leisure 1.6% | | | | | | | | |
Carnival Corp. | | | 16,600 | | | | 1,058,582 | |
Chipotle Mexican Grill, Inc.* | | | 1,060 | | | | 481,791 | |
Darden Restaurants, Inc. | | | 5,253 | | | | 584,081 | |
Hilton Worldwide Holdings, Inc. | | | 11,800 | | | | 953,204 | |
Marriott International, Inc. (Class A Stock) | | | 12,570 | | | | 1,659,617 | |
McDonald’s Corp. | | | 32,860 | | | | 5,497,150 | |
MGM Resorts International | | | 20,400 | | | | 569,364 | |
Norwegian Cruise Line Holdings Ltd.* | | | 8,200 | | | | 470,926 | |
Royal Caribbean Cruises Ltd. | | | 7,100 | | | | 922,574 | |
Starbucks Corp. | | | 56,500 | | | | 3,211,460 | |
Wynn Resorts Ltd. | | | 3,600 | | | | 457,416 | |
Yum! Brands, Inc. | | | 13,664 | | | | 1,242,194 | |
| | | | | | | | |
| | | | | | | 17,108,359 | |
| | |
Household Durables 0.3% | | | | | | | | |
D.R. Horton, Inc. | | | 13,800 | | | | 582,084 | |
Garmin Ltd. | | | 4,700 | | | | 329,235 | |
Leggett & Platt, Inc. | | | 4,800 | | | | 210,192 | |
Lennar Corp. (Class A Stock) | | | 11,200 | | | | 522,928 | |
Mohawk Industries, Inc.* | | | 2,640 | | | | 462,924 | |
Newell Brands, Inc. | | | 20,127 | | | | 408,578 | |
PulteGroup, Inc. | | | 10,511 | | | | 260,357 | |
Whirlpool Corp. | | | 2,685 | | | | 318,844 | |
| | | | | | | | |
| | | | | | | 3,095,142 | |
| | |
Household Products 1.4% | | | | | | | | |
Church & Dwight Co., Inc. | | | 10,100 | | | | 599,637 | |
Clorox Co. (The) | | | 5,432 | | | | 817,027 | |
Colgate-Palmolive Co. | | | 36,060 | | | | 2,414,217 | |
See Notes to Financial Statements.
| | | | |
| PGIM QMA Stock Index Fund | | | 25 | |
Schedule of Investments (continued)
as of September 30, 2018
| | | | | | | | |
| Description | | Shares | | | Value | |
COMMON STOCKS (Continued) | | | | | | | | |
| | |
Household Products (cont’d.) | | | | | | | | |
Kimberly-Clark Corp. | | | 14,516 | | | $ | 1,649,598 | |
Procter & Gamble Co. (The) | | | 104,823 | | | | 8,724,419 | |
| | | | | | | | |
| | | | | | | 14,204,898 | |
| | |
Independent Power & Renewable Electricity Producers 0.1% | | | | | | | | |
AES Corp. | | | 27,500 | | | | 385,000 | |
NRG Energy, Inc. | | | 12,200 | | | | 456,280 | |
| | | | | | | | |
| | | | | | | 841,280 | |
| | |
Industrial Conglomerates 1.5% | | | | | | | | |
3M Co. | | | 24,778 | | | | 5,220,972 | |
General Electric Co. | | | 360,507 | | | | 4,070,124 | |
Honeywell International, Inc. | | | 31,115 | | | | 5,177,536 | |
Roper Technologies, Inc. | | | 4,380 | | | | 1,297,400 | |
| | | | | | | | |
| | | | | | | 15,766,032 | |
| | |
Insurance 2.3% | | | | | | | | |
Aflac, Inc. | | | 31,900 | | | | 1,501,533 | |
Allstate Corp. (The) | | | 14,708 | | | | 1,451,679 | |
American International Group, Inc. | | | 36,951 | | | | 1,967,271 | |
Aon PLC | | | 10,289 | | | | 1,582,242 | |
Arthur J. Gallagher & Co. | | | 7,300 | | | | 543,412 | |
Assurant, Inc. | | | 2,300 | | | | 248,285 | |
Brighthouse Financial, Inc.* | | | 4,272 | | | | 188,993 | |
Chubb Ltd. | | | 19,423 | | | | 2,595,690 | |
Cincinnati Financial Corp. | | | 6,307 | | | | 484,441 | |
Everest Re Group Ltd. | | | 1,850 | | | | 422,669 | |
Hartford Financial Services Group, Inc. (The) | | | 14,853 | | | | 742,056 | |
Lincoln National Corp. | | | 9,051 | | | | 612,391 | |
Loews Corp. | | | 10,517 | | | | 528,269 | |
Marsh & McLennan Cos., Inc. | | | 21,340 | | | | 1,765,245 | |
MetLife, Inc. | | | 42,000 | | | | 1,962,240 | |
Principal Financial Group, Inc. | | | 10,800 | | | | 632,772 | |
Progressive Corp. (The) | | | 24,116 | | | | 1,713,201 | |
Prudential Financial, Inc.(g) | | | 17,600 | | | | 1,783,232 | |
Torchmark Corp. | | | 4,533 | | | | 392,966 | |
Travelers Cos., Inc. (The) | | | 11,231 | | | | 1,456,773 | |
Unum Group | | | 8,426 | | | | 329,204 | |
Willis Towers Watson PLC | | | 5,600 | | | | 789,264 | |
| | | | | | | | |
| | | | | | | 23,693,828 | |
See Notes to Financial Statements.
| | | | | | | | |
| Description | | Shares | | | Value | |
COMMON STOCKS (Continued) | | | | | | | | |
| | |
Internet & Direct Marketing Retail 4.4% | | | | | | | | |
Amazon.com, Inc.* | | | 16,950 | | | $ | 33,950,850 | |
Booking Holdings, Inc.* | | | 2,100 | | | | 4,166,400 | |
Expedia Group, Inc. | | | 5,000 | | | | 652,400 | |
Netflix, Inc.* | | | 18,160 | | | | 6,794,201 | |
TripAdvisor, Inc.* | | | 4,300 | | | | 219,601 | |
| | | | | | | | |
| | | | | | | 45,783,452 | |
| | |
Internet Software & Services 4.8% | | | | | | | | |
Akamai Technologies, Inc.* | | | 6,900 | | | | 504,735 | |
Alphabet, Inc. (Class A Stock)* | | | 12,510 | | | | 15,100,571 | |
Alphabet, Inc. (Class C Stock)* | | | 12,732 | | | | 15,195,260 | |
eBay, Inc.* | | | 37,740 | | | | 1,246,175 | |
Facebook, Inc. (Class A Stock)* | | | 100,010 | | | | 16,447,644 | |
Twitter, Inc.* | | | 27,000 | | | | 768,420 | |
VeriSign, Inc.* | | | 4,100 | | | | 656,492 | |
| | | | | | | | |
| | | | | | | 49,919,297 | |
| | |
IT Services 4.6% | | | | | | | | |
Accenture PLC (Class A Stock) | | | 26,900 | | | | 4,578,380 | |
Alliance Data Systems Corp. | | | 2,090 | | | | 493,574 | |
Automatic Data Processing, Inc. | | | 18,548 | | | | 2,794,442 | |
Broadridge Financial Solutions, Inc. | | | 4,700 | | | | 620,165 | |
Cognizant Technology Solutions Corp. (Class A Stock) | | | 24,200 | | | | 1,867,030 | |
DXC Technology Co. | | | 11,759 | | | | 1,099,702 | |
Fidelity National Information Services, Inc. | | | 13,700 | | | | 1,494,259 | |
Fiserv, Inc.* | | | 17,000 | | | | 1,400,460 | |
FleetCor Technologies, Inc.* | | | 3,560 | | | | 811,110 | |
Gartner, Inc.* | | | 3,770 | | | | 597,545 | |
Global Payments, Inc. | | | 6,400 | | | | 815,360 | |
International Business Machines Corp. | | | 36,304 | | | | 5,489,528 | |
Mastercard, Inc. (Class A Stock) | | | 38,260 | | | | 8,517,059 | |
Paychex, Inc. | | | 13,425 | | | | 988,751 | |
PayPal Holdings, Inc.* | | | 46,300 | | | | 4,066,992 | |
Total System Services, Inc. | | | 6,971 | | | | 688,316 | |
Visa, Inc. (Class A Stock) | | | 74,610 | | | | 11,198,215 | |
Western Union Co. (The) | | | 17,852 | | | | 340,259 | |
| | | | | | | | |
| | | | | | | 47,861,147 | |
See Notes to Financial Statements.
| | | | |
| PGIM QMA Stock Index Fund | | | 27 | |
Schedule of Investments (continued)
as of September 30, 2018
| | | | | | | | |
| Description | | Shares | | | Value | |
COMMON STOCKS (Continued) | | | | | | | | |
| | |
Leisure Products 0.1% | | | | | | | | |
Hasbro, Inc. | | | 4,854 | | | $ | 510,253 | |
Mattel, Inc.*(a) | | | 12,713 | | | | 199,594 | |
| | | | | | | | |
| | | | | | | 709,847 | |
| | |
Life Sciences Tools & Services 0.9% | | | | | | | | |
Agilent Technologies, Inc. | | | 13,498 | | | | 952,149 | |
Illumina, Inc.* | | | 6,170 | | | | 2,264,760 | |
IQVIA Holdings, Inc.* | | | 6,800 | | | | 882,232 | |
Mettler-Toledo International, Inc.* | | | 1,130 | | | | 688,147 | |
PerkinElmer, Inc. | | | 4,570 | | | | 444,524 | |
Thermo Fisher Scientific, Inc. | | | 16,922 | | | | 4,130,322 | |
Waters Corp.* | | | 3,300 | | | | 642,444 | |
| | | | | | | | |
| | | | | | | 10,004,578 | |
| | |
Machinery 1.5% | | | | | | | | |
Caterpillar, Inc. | | | 24,856 | | | | 3,790,292 | |
Cummins, Inc. | | | 6,406 | | | | 935,724 | |
Deere & Co. | | | 13,480 | | | | 2,026,448 | |
Dover Corp. | | | 6,462 | | | | 572,081 | |
Flowserve Corp. | | | 5,400 | | | | 295,326 | |
Fortive Corp.(a) | | | 12,950 | | | | 1,090,390 | |
Illinois Tool Works, Inc. | | | 12,646 | | | | 1,784,604 | |
Ingersoll-Rand PLC | | | 10,300 | | | | 1,053,690 | |
PACCAR, Inc. | | | 14,364 | | | | 979,481 | |
Parker-Hannifin Corp. | | | 5,568 | | | | 1,024,122 | |
Pentair PLC (United Kingdom) | | | 6,746 | | | | 292,439 | |
Snap-on, Inc. | | | 2,442 | | | | 448,351 | |
Stanley Black & Decker, Inc. | | | 6,588 | | | | 964,747 | |
Xylem, Inc. | | | 7,600 | | | | 607,012 | |
| | | | | | | | |
| | | | | | | 15,864,707 | |
| | |
Media 2.2% | | | | | | | | |
CBS Corp. (Class B Stock) | | | 13,876 | | | | 797,176 | |
Charter Communications, Inc. (Class A Stock)* | | | 7,760 | | | | 2,528,829 | |
Comcast Corp. (Class A Stock) | | | 190,870 | | | | 6,758,707 | |
Discovery, Inc. (Class A Stock)* | | | 6,000 | | | | 192,000 | |
Discovery, Inc. (Class C Stock)* | | | 13,300 | | | | 393,414 | |
DISH Network Corp. (Class A Stock)* | | | 8,700 | | | | 311,112 | |
Interpublic Group of Cos., Inc. (The) | | | 15,688 | | | | 358,784 | |
News Corp. (Class A Stock) | | | 15,575 | | | | 205,434 | |
News Corp. (Class B Stock) | | | 4,100 | | | | 55,760 | |
Omnicom Group, Inc. | | | 9,534 | | | | 648,503 | |
See Notes to Financial Statements.
| | | | | | | | |
| Description | | Shares | | | Value | |
COMMON STOCKS (Continued) | | | | | | | | |
| | |
Media (cont’d.) | | | | | | | | |
Twenty-First Century Fox, Inc. (Class A Stock) | | | 43,300 | | | $ | 2,006,089 | |
Twenty-First Century Fox, Inc. (Class B Stock) | | | 18,200 | | | | 833,924 | |
Viacom, Inc. (Class B Stock) | | | 14,376 | | | | 485,334 | |
Walt Disney Co. (The) | | | 62,113 | | | | 7,263,494 | |
| | | | | | | | |
| | | | | | | 22,838,560 | |
| | |
Metals & Mining 0.2% | | | | | | | | |
Freeport-McMoRan, Inc. | | | 55,692 | | | | 775,233 | |
Newmont Mining Corp. | | | 21,297 | | | | 643,169 | |
Nucor Corp. | | | 13,312 | | | | 844,646 | |
| | | | | | | | |
| | | | | | | 2,263,048 | |
| | |
Multiline Retail 0.5% | | | | | | | | |
Dollar General Corp. | | | 10,700 | | | | 1,169,510 | |
Dollar Tree, Inc.* | | | 9,742 | | | | 794,460 | |
Kohl’s Corp. | | | 6,950 | | | | 518,123 | |
Macy’s, Inc. | | | 12,682 | | | | 440,446 | |
Nordstrom, Inc. | | | 4,800 | | | | 287,088 | |
Target Corp. | | | 22,382 | | | | 1,974,316 | |
| | | | | | | | |
| | | | | | | 5,183,943 | |
| | |
Multi-Utilities 0.9% | | | | | | | | |
Ameren Corp. | | | 9,969 | | | | 630,240 | |
CenterPoint Energy, Inc. | | | 17,279 | | | | 477,765 | |
CMS Energy Corp. | | | 11,800 | | | | 578,200 | |
Consolidated Edison, Inc. | | | 12,651 | | | | 963,880 | |
Dominion Energy, Inc. | | | 27,104 | | | | 1,904,869 | |
DTE Energy Co. | | | 7,487 | | | | 817,056 | |
NiSource, Inc. | | | 13,700 | | | | 341,404 | |
Public Service Enterprise Group, Inc. | | | 20,794 | | | | 1,097,715 | |
SCANA Corp. | | | 5,600 | | | | 217,784 | |
Sempra Energy | | | 10,878 | | | | 1,237,373 | |
WEC Energy Group, Inc. | | | 13,133 | | | | 876,759 | |
| | | | | | | | |
| | | | | | | 9,143,045 | |
| | |
Oil, Gas & Consumable Fuels 5.2% | | | | | | | | |
Anadarko Petroleum Corp. | | | 21,536 | | | | 1,451,742 | |
Andeavor | | | 5,900 | | | | 905,650 | |
Apache Corp. | | | 15,548 | | | | 741,173 | |
Cabot Oil & Gas Corp. | | | 17,700 | | | | 398,604 | |
Chevron Corp. | | | 79,852 | | | | 9,764,303 | |
See Notes to Financial Statements.
| | | | |
| PGIM QMA Stock Index Fund | | | 29 | |
Schedule of Investments (continued)
as of September 30, 2018
| | | | | | | | |
| Description | | Shares | | | Value | |
COMMON STOCKS (Continued) | | | | | | | | |
| | |
Oil, Gas & Consumable Fuels (cont’d.) | | | | | | | | |
Cimarex Energy Co. | | | 4,000 | | | $ | 371,760 | |
Concho Resources, Inc.* | | | 7,900 | | | | 1,206,725 | |
ConocoPhillips | | | 48,857 | | | | 3,781,532 | |
Devon Energy Corp. | | | 21,300 | | | | 850,722 | |
EOG Resources, Inc. | | | 24,100 | | | | 3,074,437 | |
EQT Corp. | | | 9,500 | | | | 420,185 | |
Exxon Mobil Corp. | | | 176,452 | | | | 15,001,949 | |
Hess Corp. | | | 10,634 | | | | 761,182 | |
HollyFrontier Corp. | | | 7,400 | | | | 517,260 | |
Kinder Morgan, Inc. | | | 78,480 | | | | 1,391,450 | |
Marathon Oil Corp. | | | 35,378 | | | | 823,600 | |
Marathon Petroleum Corp. | | | 19,178 | | | | 1,533,665 | |
Newfield Exploration Co.* | | | 8,200 | | | | 236,406 | |
Noble Energy, Inc. | | | 19,900 | | | | 620,681 | |
Occidental Petroleum Corp. | | | 31,976 | | | | 2,627,468 | |
ONEOK, Inc. | | | 17,200 | | | | 1,165,988 | |
Phillips 66 | | | 17,528 | | | | 1,975,756 | |
Pioneer Natural Resources Co. | | | 7,200 | | | | 1,254,168 | |
Valero Energy Corp. | | | 18,100 | | | | 2,058,875 | |
Williams Cos., Inc. (The) | | | 48,892 | | | | 1,329,373 | |
| | | | | | | | |
| | | | | | | 54,264,654 | |
| | |
Personal Products 0.1% | | | | | | | | |
Coty, Inc. (Class A Stock) | | | 18,800 | | | | 236,128 | |
Estee Lauder Cos., Inc. (The) (Class A Stock) | | | 9,370 | | | | 1,361,648 | |
| | | | | | | | |
| | | | | | | 1,597,776 | |
| | |
Pharmaceuticals 4.7% | | | | | | | | |
Allergan PLC | | | 14,195 | | | | 2,703,864 | |
Bristol-Myers Squibb Co. | | | 68,279 | | | | 4,238,760 | |
Eli Lilly & Co. | | | 39,897 | | | | 4,281,347 | |
Johnson & Johnson | | | 111,889 | | | | 15,459,703 | |
Merck & Co., Inc. | | | 112,233 | | | | 7,961,809 | |
Mylan NV* | | | 20,700 | | | | 757,620 | |
Nektar Therapeutics* | | | 6,800 | | | | 414,528 | |
Perrigo Co. PLC | | | 5,500 | | | | 389,400 | |
Pfizer, Inc. | | | 243,563 | | | | 10,733,822 | |
Zoetis, Inc. | | | 20,200 | | | | 1,849,512 | |
| | | | | | | | |
| | | | | | | 48,790,365 | |
| | |
Professional Services 0.3% | | | | | | | | |
Equifax, Inc. | | | 5,130 | | | | 669,824 | |
See Notes to Financial Statements.
| | | | | | | | |
| Description | | Shares | | | Value | |
COMMON STOCKS (Continued) | | | | | | | | |
| | |
Professional Services (cont’d.) | | | | | | | | |
IHS Markit Ltd.* | | | 14,800 | | | $ | 798,608 | |
Nielsen Holdings PLC | | | 13,700 | | | | 378,942 | |
Robert Half International, Inc. | | | 5,200 | | | | 365,976 | |
Verisk Analytics, Inc.* | | | 6,500 | | | | 783,575 | |
| | | | | | | | |
| | | | | | | 2,996,925 | |
| | |
Real Estate Management & Development 0.0% | | | | | | | | |
CBRE Group, Inc. (Class A Stock)* | | | 12,600 | | | | 555,660 | |
| | |
Road & Rail 1.0% | | | | | | | | |
CSX Corp. | | | 36,518 | | | | 2,704,158 | |
J.B. Hunt Transport Services, Inc. | | | 3,750 | | | | 446,025 | |
Kansas City Southern | | | 4,400 | | | | 498,432 | |
Norfolk Southern Corp. | | | 11,731 | | | | 2,117,445 | |
Union Pacific Corp. | | | 31,936 | | | | 5,200,139 | |
| | | | | | | | |
| | | | | | | 10,966,199 | |
| | |
Semiconductors & Semiconductor Equipment 3.8% | | | | | | | | |
Advanced Micro Devices, Inc.*(a) | | | 33,700 | | | | 1,040,993 | |
Analog Devices, Inc. | | | 15,647 | | | | 1,446,722 | |
Applied Materials, Inc. | | | 41,688 | | | | 1,611,241 | |
Broadcom, Inc. | | | 17,069 | | | | 4,211,434 | |
Intel Corp. | | | 194,248 | | | | 9,185,988 | |
KLA-Tencor Corp. | | | 6,390 | | | | 649,927 | |
Lam Research Corp. | | | 6,962 | | | | 1,056,135 | |
Microchip Technology, Inc.(a) | | | 9,260 | | | | 730,707 | |
Micron Technology, Inc.* | | | 47,916 | | | | 2,167,241 | |
NVIDIA Corp. | | | 25,360 | | | | 7,126,667 | |
Qorvo, Inc.* | | | 5,071 | | | | 389,909 | |
QUALCOMM, Inc. | | | 59,300 | | | | 4,271,379 | |
Skyworks Solutions, Inc. | | | 7,400 | | | | 671,254 | |
Texas Instruments, Inc. | | | 40,752 | | | | 4,372,282 | |
Xilinx, Inc. | | | 10,400 | | | | 833,768 | |
| | | | | | | | |
| | | | | | | 39,765,647 | |
| | |
Software 6.3% | | | | | | | | |
Activision Blizzard, Inc. | | | 31,900 | | | | 2,653,761 | |
Adobe Systems, Inc.* | | | 20,670 | | | | 5,579,866 | |
ANSYS, Inc.* | | | 3,600 | | | | 672,048 | |
Autodesk, Inc.* | | | 9,220 | | | | 1,439,334 | |
CA, Inc. | | | 12,658 | | | | 558,851 | |
Cadence Design Systems, Inc.* | | | 11,100 | | | | 503,052 | |
See Notes to Financial Statements.
| | | | |
| PGIM QMA Stock Index Fund | | | 31 | |
Schedule of Investments (continued)
as of September 30, 2018
| | | | | | | | |
| Description | | Shares | | | Value | |
COMMON STOCKS (Continued) | | | | | | | | |
| | |
Software (cont’d.) | | | | | | | | |
Citrix Systems, Inc.* | | | 5,500 | | | $ | 611,380 | |
Electronic Arts, Inc.* | | | 12,700 | | | | 1,530,223 | |
Intuit, Inc. | | | 10,200 | | | | 2,319,480 | |
Microsoft Corp. | | | 320,472 | | | | 36,652,383 | |
Oracle Corp. | | | 122,040 | | | | 6,292,382 | |
Red Hat, Inc.* | | | 7,400 | | | | 1,008,472 | |
salesforce.com, Inc.* | | | 29,800 | | | | 4,739,094 | |
Symantec Corp. | | | 24,717 | | | | 525,978 | |
Synopsys, Inc.* | | | 6,300 | | | | 621,243 | |
Take-Two Interactive Software, Inc.* | | | 4,600 | | | | 634,754 | |
| | | | | | | | |
| | | | | | | 66,342,301 | |
| | |
Specialty Retail 2.4% | | | | | | | | |
Advance Auto Parts, Inc. | | | 3,150 | | | | 530,239 | |
AutoZone, Inc.* | | | 1,190 | | | | 923,083 | |
Best Buy Co., Inc. | | | 10,200 | | | | 809,472 | |
CarMax, Inc.* | | | 7,600 | | | | 567,492 | |
Foot Locker, Inc. | | | 4,600 | | | | 234,508 | |
Gap, Inc. (The) | | | 9,013 | | | | 260,025 | |
Home Depot, Inc. (The) | | | 48,164 | | | | 9,977,173 | |
L Brands, Inc. | | | 9,822 | | | | 297,607 | |
Lowe’s Cos., Inc. | | | 34,396 | | | | 3,949,349 | |
O’Reilly Automotive, Inc.* | | | 3,480 | | | | 1,208,674 | |
Ross Stores, Inc. | | | 15,800 | | | | 1,565,780 | |
Tiffany & Co. | | | 4,270 | | | | 550,702 | |
TJX Cos., Inc. (The) | | | 26,264 | | | | 2,942,093 | |
Tractor Supply Co. | | | 5,100 | | | | 463,488 | |
Ulta Beauty, Inc.* | | | 2,520 | | | | 710,942 | |
| | | | | | | | |
| | | | | | | 24,990,627 | |
| | |
Technology Hardware, Storage & Peripherals 4.7% | | | | | | | | |
Apple, Inc. | | | 194,698 | | | | 43,951,127 | |
Hewlett Packard Enterprise Co. | | | 63,102 | | | | 1,029,194 | |
HP, Inc. | | | 67,302 | | | | 1,734,373 | |
NetApp, Inc. | | | 11,100 | | | | 953,379 | |
Seagate Technology PLC | | | 12,000 | | | | 568,200 | |
Western Digital Corp. | | | 12,325 | | | | 721,505 | |
Xerox Corp. | | | 8,425 | | | | 227,306 | |
| | | | | | | | |
| | | | | | | 49,185,084 | |
| | |
Textiles, Apparel & Luxury Goods 0.8% | | | | | | | | |
Hanesbrands, Inc. | | | 14,500 | | | | 267,235 | |
See Notes to Financial Statements.
| | | | | | | | |
| Description | | Shares | | | Value | |
COMMON STOCKS (Continued) | | | | | | | | |
| | |
Textiles, Apparel & Luxury Goods (cont’d.) | | | | | | | | |
Michael Kors Holdings Ltd.* | | | 6,000 | | | $ | 411,360 | |
NIKE, Inc. (Class B Stock) | | | 53,374 | | | | 4,521,845 | |
PVH Corp. | | | 3,300 | | | | 476,520 | |
Ralph Lauren Corp. | | | 2,500 | | | | 343,875 | |
Tapestry, Inc. | | | 11,600 | | | | 583,132 | |
Under Armour, Inc. (Class A Stock)*(a) | | | 6,800 | | | | 144,296 | |
Under Armour, Inc. (Class C Stock)*(a) | | | 7,567 | | | | 147,254 | |
VF Corp. | | | 13,536 | | | | 1,264,939 | |
| | | | | | | | |
| | | | | | | 8,160,456 | |
| | |
Tobacco 1.0% | | | | | | | | |
Altria Group, Inc. | | | 78,579 | | | | 4,739,099 | |
Philip Morris International, Inc. | | | 64,679 | | | | 5,273,926 | |
| | | | | | | | |
| | | | | | | 10,013,025 | |
| | |
Trading Companies & Distributors 0.2% | | | | | | | | |
Fastenal Co. | | | 12,100 | | | | 702,042 | |
United Rentals, Inc.* | | | 3,600 | | | | 588,960 | |
W.W. Grainger, Inc. | | | 2,154 | | | | 769,861 | |
| | | | | | | | |
| | | | | | | 2,060,863 | |
| | |
Water Utilities 0.1% | | | | | | | | |
American Water Works Co., Inc. | | | 7,400 | | | | 650,978 | |
| | | | | | | | |
TOTAL COMMON STOCKS
(cost $254,363,177) | | | | | | | 1,027,247,192 | |
| | | | | | | | |
| | |
EXCHANGE TRADED FUND 0.2% | | | | | | | | |
iShares Core S&P 500 ETF
(cost $1,224,306) | | | 5,600 | | | | 1,639,288 | |
| | | | | | | | |
TOTAL LONG-TERM INVESTMENTS
(cost $255,587,483) | | | | | | | 1,028,886,480 | |
| | | | | | | | |
See Notes to Financial Statements.
| | | | |
| PGIM QMA Stock Index Fund | | | 33 | |
Schedule of Investments (continued)
as of September 30, 2018
| | | | | | | | |
| Description | | Shares | | | Value | |
SHORT-TERM INVESTMENTS 2.2% | | | | | | | | |
| | |
AFFILIATED MUTUAL FUNDS 2.1% | | | | | | | | |
PGIM Core Ultra Short Bond Fund(w) | | | 18,381,265 | | | $ | 18,381,265 | |
PGIM Institutional Money Market Fund
(cost $3,424,059; includes $3,405,631 of cash collateral for securities on loan)(b)(w) | | | 3,423,760 | | | | 3,424,103 | |
| | | | | | | | |
TOTAL AFFILIATED MUTUAL FUNDS
(cost $21,805,324) | | | | | | | 21,805,368 | |
| | | | | | | | |
| | | | | | | | | | | | | | | | |
| | | | |
| | | Interest
Rate | | | Maturity
Date | | | Principal
Amount (000)# | | | | |
U.S. TREASURY OBLIGATION 0.1% | | | | | | | | | | | | | | | | |
U.S. Treasury Bills(k)
(cost $995,275) | | | 2.166 | %(n) | | | 12/20/18 | | | | 1,000 | | | | 995,269 | |
| | | | | | | | | | | | | | | | |
TOTAL SHORT-TERM INVESTMENTS
(cost $22,800,599) | | | | | | | | | | | | | | | 22,800,637 | |
| | | | | | | | | | | | | | | | |
TOTAL INVESTMENTS 100.6%
(cost $278,388,082) | | | | | | | | | | | | | | | 1,051,687,117 | |
Liabilities in excess of other assets(z) (0.6)% | | | | | | | | | | | | | | | (5,905,870 | ) |
| | | | | | | | | | | | | | | | |
NET ASSETS 100.0% | | | | | | | | | | | | | | $ | 1,045,781,247 | |
| | | | | | | | | | | | | | | | |
The following abbreviations are used in the annual report:
ETF—Exchange Traded Fund
NASDAQ—National Association of Securities Dealers Automated Quotations
REITs—Real Estate Investment Trusts
S&P—Standard & Poor
| * | Non-income producing security. |
| # | Principal amount is shown in U.S. dollars unless otherwise stated. |
| (a) | All or a portion of security is on loan. The aggregate market value of such securities, including those sold and pending settlement, is $3,278,726; cash collateral of $3,405,631 (included in liabilities) was received with which the Fund purchased highly liquid short-term investments. |
| (b) | Represents security purchased with cash collateral received for securities on loan and includes dividend reinvestment. |
| (g) | An affiliated security. |
| (k) | Represents security, or a portion thereof, segregated as collateral for centrally cleared/exchange-traded derivatives. |
| (n) | Rate shown reflects yield to maturity at purchased date. |
| (w) | PGIM Investments LLC, the manager of the Fund, also serves as manager of PGIM Core Ultra Short Bond Fund and PGIM Institutional Money Market Fund. |
| (z) | Includes net unrealized appreciation/(depreciation) and/or market value of the below holdings which are excluded from the Schedule of Investments: |
See Notes to Financial Statements.
Futures contracts outstanding at September 30, 2018:
| | | | | | | | | | | | | | | | |
Number of
Contracts | | | Type | | Expiration
Date | | | Current
Notional
Amount | | | Value /
Unrealized
Appreciation
(Depreciation) | |
| | | | Long Positions: | | | | | | | | | | | | |
| | 38 | | | S&P 500 E-Mini Index | | | Dec. 2018 | | | $ | 5,546,100 | | | $ | 15,065 | |
| | 19 | | | S&P 500 Index | | | Dec. 2018 | | | | 13,865,250 | | | | 63,774 | |
| | | | | | | | | | | | | | | | |
| | | | | | | | | | | | | | $ | 78,839 | |
| | | | | | | | | | | | | | | | |
Summary of Collateral for Centrally Cleared/Exchange-traded Derivatives:
Cash and securities segregated as collateral to cover requirements for open centrally cleared/exchange-traded derivatives are listed by broker as follows:
| | | | | | | | |
Broker | | Cash and/or Foreign Currency | | | Securities Market Value | |
UBS AG | | $ | — | | | $ | 995,269 | |
| | | | | | | | |
Fair Value Measurements:
Various inputs are used in determining the value of the Fund’s investments. These inputs are summarized in the three broad levels listed below.
Level 1—unadjusted quoted prices generally in active markets for identical securities.
Level 2—quoted prices for similar securities, interest rates and yield curves, prepayment speeds, foreign currency exchange rates and other observable inputs.
Level 3—unobservable inputs for securities valued in accordance with Board approved fair valuation procedures.
The following is a summary of the inputs used as of September 30, 2018 in valuing such portfolio securities:
| | | | | | | | | | | | |
| | | Level 1 | | | Level 2 | | | Level 3 | |
Investments in Securities | | | | | | | | | | | | |
Common Stocks | | | | | | | | | | | | |
Aerospace & Defense | | $ | 28,556,262 | | | $ | — | | | $ | — | |
Air Freight & Logistics | | | 6,926,404 | | | | — | | | | — | |
Airlines | | | 4,848,107 | | | | — | | | | — | |
Auto Components | | | 1,523,698 | | | | — | | | | — | |
Automobiles | | | 3,556,875 | | | | — | | | | — | |
Banks | | | 60,756,208 | | | | — | | | | — | |
Beverages | | | 17,513,698 | | | | — | | | | — | |
Biotechnology | | | 26,872,538 | | | | — | | | | — | |
Building Products | | | 2,757,136 | | | | — | | | | — | |
Capital Markets | | | 28,200,256 | | | | — | | | | — | |
Chemicals | | | 18,494,961 | | | | — | | | | — | |
Commercial Services & Supplies | | | 3,538,576 | | | | — | | | | — | |
Communications Equipment | | | 11,860,861 | | | | — | | | | — | |
See Notes to Financial Statements.
| | | | |
| PGIM QMA Stock Index Fund | | | 35 | |
Schedule of Investments (continued)
as of September 30, 2018
| | | | | | | | | | | | |
| | | Level 1 | | | Level 2 | | | Level 3 | |
Investments in Securities (continued) | | | | | | | | | | | | |
Common Stocks (continued) | | | | | | | | | | | | |
Construction & Engineering | | $ | 933,207 | | | $ | — | | | $ | — | |
Construction Materials | | | 1,091,745 | | | | — | | | | — | |
Consumer Finance | | | 7,107,276 | | | | — | | | | — | |
Containers & Packaging | | | 3,100,649 | | | | — | | | | — | |
Distributors | | | 979,508 | | | | — | | | | — | |
Diversified Consumer Services | | | 219,390 | | | | — | | | | — | |
Diversified Financial Services | | | 17,452,436 | | | | — | | | | — | |
Diversified Telecommunication Services | | | 20,224,936 | | | | — | | | | — | |
Electric Utilities | | | 17,814,907 | | | | — | | | | — | |
Electrical Equipment | | | 5,358,913 | | | | — | | | | — | |
Electronic Equipment, Instruments & Components | | | 4,260,689 | | | | — | | | | — | |
Energy Equipment & Services | | | 7,065,104 | | | | — | | | | — | |
Equity Real Estate Investment Trusts (REITs) | | | 26,528,816 | | | | — | | | | — | |
Food & Staples Retailing | | | 15,035,583 | | | | — | | | | — | |
Food Products | | | 10,667,428 | | | | — | | | | — | |
Health Care Equipment & Supplies | | | 33,679,243 | | | | — | | | | — | |
Health Care Providers & Services | | | 34,862,729 | | | | — | | | | — | |
Health Care Technology | | | 837,330 | | | | — | | | | — | |
Hotels, Restaurants & Leisure | | | 17,108,359 | | | | — | | | | — | |
Household Durables | | | 3,095,142 | | | | — | | | | — | |
Household Products | | | 14,204,898 | | | | — | | | | — | |
Independent Power & Renewable Electricity Producers | | | 841,280 | | | | — | | | | — | |
Industrial Conglomerates | | | 15,766,032 | | | | — | | | | — | |
Insurance | | | 23,693,828 | | | | — | | | | — | |
Internet & Direct Marketing Retail | | | 45,783,452 | | | | — | | | | — | |
Internet Software & Services | | | 49,919,297 | | | | — | | | | — | |
IT Services | | | 47,861,147 | | | | — | | | | — | |
Leisure Products | | | 709,847 | | | | — | | | | — | |
Life Sciences Tools & Services | | | 10,004,578 | | | | — | | | | — | |
Machinery | | | 15,864,707 | | | | — | | | | — | |
Media | | | 22,838,560 | | | | — | | | | — | |
Metals & Mining | | | 2,263,048 | | | | — | | | | — | |
Multiline Retail | | | 5,183,943 | | | | — | | | | — | |
Multi-Utilities | | | 9,143,045 | | | | — | | | | — | |
Oil, Gas & Consumable Fuels | | | 54,264,654 | | | | — | | | | — | |
Personal Products | | | 1,597,776 | | | | — | | | | — | |
Pharmaceuticals | | | 48,790,365 | | | | — | | | | — | |
Professional Services | | | 2,996,925 | | | | — | | | | — | |
Real Estate Management & Development | | | 555,660 | | | | — | | | | — | |
Road & Rail | | | 10,966,199 | | | | — | | | | — | |
Semiconductors & Semiconductor Equipment | | | 39,765,647 | | | | — | | | | — | |
Software | | | 66,342,301 | | | | — | | | | — | |
Specialty Retail | | | 24,990,627 | | | | — | | | | — | |
Technology Hardware, Storage & Peripherals | | | 49,185,084 | | | | — | | | | — | |
Textiles, Apparel & Luxury Goods | | | 8,160,456 | | | | — | | | | — | |
Tobacco | | | 10,013,025 | | | | — | | | | — | |
Trading Companies & Distributors | | | 2,060,863 | | | | — | | | | — | |
See Notes to Financial Statements.
| | | | | | | | | | | | |
| | | Level 1 | | | Level 2 | | | Level 3 | |
Investments in Securities (continued) | | | | | | | | | | | | |
Common Stocks (continued) | | | | | | | | | | | | |
Water Utilities | | $ | 650,978 | | | $ | — | | | $ | — | |
Exchange Traded Fund | | | 1,639,288 | | | | — | | | | — | |
Affiliated Mutual Funds | | | 21,805,368 | | | | — | | | | — | |
U.S. Treasury Obligation | | | — | | | | 995,269 | | | | — | |
Other Financial Instruments* | | | | | | | | | | | | |
Futures Contracts | | | 78,839 | | | | — | | | | — | |
| | | | | | | | | | | | |
Total | | $ | 1,050,770,687 | | | $ | 995,269 | | | $ | — | |
| | | | | | | | | | | | |
| * | Other financial instruments are derivative instruments not reflected in the Schedule of Investments, such as futures, forwards and centrally cleared swap contracts, which are recorded at the unrealized appreciation (depreciation) on the instrument, and OTC swap contracts which are recorded at fair value. |
Industry Classification:
The industry classification of investments and liabilities in excess of other assets shown as a percentage of net assets as of September 30, 2018 were as follows (unaudited):
| | | | |
Software | | | 6.3 | % |
Banks | | | 5.8 | |
Oil, Gas & Consumable Fuels | | | 5.2 | |
Internet Software & Services | | | 4.8 | |
Technology Hardware, Storage & Peripherals | | | 4.7 | |
Pharmaceuticals | | | 4.7 | |
IT Services | | | 4.6 | |
Internet & Direct Marketing Retail | | | 4.4 | |
Semiconductors & Semiconductor Equipment | | | 3.8 | |
Health Care Providers & Services | | | 3.3 | |
Health Care Equipment & Supplies | | | 3.2 | |
Aerospace & Defense | | | 2.7 | |
Capital Markets | | | 2.7 | |
Biotechnology | | | 2.6 | |
Equity Real Estate Investment Trusts (REITs) | | | 2.5 | |
Specialty Retail | | | 2.4 | |
Insurance | | | 2.3 | |
Media | | | 2.2 | |
Affiliated Mutual Funds (0.3% represents investments purchased with collateral from securities on loan) | | | 2.1 | |
Diversified Telecommunication Services | | | 1.9 | |
Chemicals | | | 1.8 | |
Electric Utilities | | | 1.7 | |
Beverages | | | 1.7 | |
Diversified Financial Services | | | 1.7 | |
Hotels, Restaurants & Leisure | | | 1.6 | |
| | | | |
Machinery | | | 1.5 | % |
Industrial Conglomerates | | | 1.5 | |
Food & Staples Retailing | | | 1.4 | |
Household Products | | | 1.4 | |
Communications Equipment | | | 1.1 | |
Road & Rail | | | 1.0 | |
Food Products | | | 1.0 | |
Tobacco | | | 1.0 | |
Life Sciences Tools & Services | | | 0.9 | |
Multi-Utilities | | | 0.9 | |
Textiles, Apparel & Luxury Goods | | | 0.8 | |
Consumer Finance | | | 0.7 | |
Energy Equipment & Services | | | 0.7 | |
Air Freight & Logistics | | | 0.7 | |
Electrical Equipment | | | 0.5 | |
Multiline Retail | | | 0.5 | |
Airlines | | | 0.5 | |
Electronic Equipment, Instruments & Components | | | 0.4 | |
Automobiles | | | 0.3 | |
Commercial Services & Supplies | | | 0.3 | |
Containers & Packaging | | | 0.3 | |
Household Durables | | | 0.3 | |
Professional Services | | | 0.3 | |
Building Products | | | 0.3 | |
Metals & Mining | | | 0.2 | |
Trading Companies & Distributors | | | 0.2 | |
Exchange Traded Fund | | | 0.2 | |
See Notes to Financial Statements.
| | | | |
| PGIM QMA Stock Index Fund | | | 37 | |
Schedule of Investments (continued)
as of September 30, 2018
Industry Classification (continued):
| | | | |
Personal Products | | | 0.1 | % |
Auto Components | | | 0.1 | |
Construction Materials | | | 0.1 | |
U.S. Treasury Obligation | | | 0.1 | |
Distributors | | | 0.1 | |
Construction & Engineering | | | 0.1 | |
Independent Power & Renewable Electricity | | | | |
Producers | | | 0.1 | |
Health Care Technology | | | 0.1 | |
Leisure Products | | | 0.1 | |
Water Utilities | | | 0.1 | |
| | | | |
Real Estate Management & Development | | | 0.0 | *% |
Diversified Consumer Services | | | 0.0 | * |
| | | | |
| | | 100.6 | |
Liabilities in excess of other assets | | | (0.6 | ) |
| | | | |
| | | 100.0 | % |
| | | | |
Effects of Derivative Instruments on the Financial Statements and Primary Underlying Risk Exposure:
The Fund invested in derivative instruments during the reporting period. The primary types of risk associated with these derivative instruments is equity contracts risk. The effect of such derivative instruments on the Fund’s financial position and financial performance as reflected in the Statement of Assets and Liabilities and Statement of Operations is presented in the summary below.
Fair values of derivative instruments as of September 30, 2018 as presented in the Statement of Assets and Liabilities:
| | | | | | | | | | | | |
| | | Asset Derivatives | | | Liability Derivatives | |
Derivatives not accounted
for as hedging instruments,
carried at fair value | | Statement of
Assets and
Liabilities Location | | Fair
Value | | | Statement of
Assets and
Liabilities Location | | Fair
Value | |
| Equity contracts | | Due from/to broker—
variation margin
futures | | $ | 78,839 | * | | — | | $ | — | |
| | | | | | | | | | | | |
| * | Includes cumulative appreciation (depreciation) as reported in the schedule of open futures and centrally cleared swap contracts. Only unsettled variation margin receivable (payable) is reported within the Statement of Assets and Liabilities. |
The effects of derivative instruments on the Statement of Operations for the year ended September 30, 2018 are as follows:
| | | | |
Amount of Realized Gain (Loss) on Derivatives Recognized in Income | |
Derivatives not accounted for as hedging
instruments, carried at fair value | | Futures | |
Equity contracts | | $ | 3,505,484 | |
| | | | |
| | | | |
Change in Unrealized Appreciation (Depreciation) on Derivatives Recognized in Income | |
Derivatives not accounted for as hedging
instruments, carried at fair value | | Futures | |
Equity contracts | | $ | (107,514 | ) |
| | | | |
See Notes to Financial Statements.
For the year ended September 30, 2018, the Fund’s average volume of derivative activities is as follows:
|
Futures
Contracts—
Long
Positions(1) |
| $21,092,265 |
| (1) | Notional Amount in USD. |
Financial Instruments/Transactions—Summary of Offsetting and Netting Arrangements:
The Fund entered into financial instruments/transactions during the reporting period that are either offset in accordance with current requirements or are subject to enforceable master netting arrangements or similar agreements that permit offsetting. The information about offsetting and related netting arrangements for financial instruments/transactions, where the legal right to set-off exists, is presented in the summary below.
Offsetting of financial instrument/transaction assets and liabilities:
| | | | | | | | | | | | |
Description | | Gross Market
Value of
Recognized
Assets/(Liabilities) | | | Collateral
Pledged/(Received)(1) | | | Net Amount | |
Securities on Loan | | $ | 3,278,726 | | | $ | (3,278,726 | ) | | $ | — | |
| | | | | | | | | | | | |
| (1) | Collateral amount disclosed by the Fund is limited to the market value of financial instruments/transactions. |
See Notes to Financial Statements.
| | | | |
| PGIM QMA Stock Index Fund | | | 39 | |
Statement of Assets & Liabilities
as of September 30, 2018
| | | | |
Assets | | | | |
Investments at value, including securities on loan of $3,278,726: | | | | |
Unaffiliated investments (cost $256,039,358) | | $ | 1,028,098,517 | |
Affiliated investments (cost $22,348,724) | | | 23,588,600 | |
Dividends receivable | | | 880,095 | |
Receivable for Fund shares sold | | | 773,015 | |
Prepaid expenses and other assets | | | 10,206 | |
| | | | |
Total Assets | | | 1,053,350,433 | |
| | | | |
| |
Liabilities | | | | |
Payable for Fund shares reacquired | | | 3,735,833 | |
Payable to broker for collateral for securities on loan | | | 3,405,631 | |
Accrued expenses and other liabilities | | | 165,125 | |
Distribution fee payable | | | 157,937 | |
Management fee payable | | | 57,426 | |
Affiliated transfer agent fee payable | | | 41,249 | |
Due to broker—variation margin futures | | | 5,985 | |
| | | | |
Total Liabilities | | | 7,569,186 | |
| | | | |
| |
Net Assets | | $ | 1,045,781,247 | |
| | | | |
| | | | | |
Net assets were comprised of: | | | | |
Shares of beneficial interest, at par | | $ | 18,248 | |
Paid-in capital in excess of par | | | 121,582,666 | |
| | | | |
| | | 121,600,914 | |
Undistributed net investment income | | | 15,895,549 | |
Accumulated net realized gain on investment transactions | | | 134,906,910 | |
Net unrealized appreciation on investments | | | 773,377,874 | |
| | | | |
Net assets, September 30, 2018 | | $ | 1,045,781,247 | |
| | | | |
See Notes to Financial Statements.
| | | | |
Class A | | | | |
Net asset value and redemption price per share,
($276,784,884 ÷ 4,839,633 shares of beneficial interest issued and outstanding) | | $ | 57.19 | |
Maximum sales charge (3.25% of offering price) | | | 1.92 | |
| | | | |
Maximum offering price to public | | $ | 59.11 | |
| | | | |
| |
Class C | | | | |
Net asset value, offering price and redemption price per share,
($108,458,741 ÷ 1,919,466 shares of beneficial interest issued and outstanding) | | $ | 56.50 | |
| | | | |
| |
Class I | | | | |
Net asset value, offering price and redemption price per share,
($290,252,213 ÷ 5,047,466 shares of beneficial interest issued and outstanding) | | $ | 57.50 | |
| | | | |
| |
Class Z | | | | |
Net asset value, offering price and redemption price per share,
($370,188,431 ÷ 6,439,447 shares of beneficial interest issued and outstanding) | | $ | 57.49 | |
| | | | |
| |
Class R6 | | | | |
Net asset value, offering price and redemption price per share,
($96,978 ÷ 1,686 shares of beneficial interest issued and outstanding) | | $ | 57.52 | |
| | | | |
See Notes to Financial Statements.
| | | | |
| PGIM QMA Stock Index Fund | | | 41 | |
Statement of Operations
Year Ended September 30, 2018
| | | | |
Net Investment Income (Loss) | | | | |
Income | | | | |
Unaffiliated dividend income (net of $3 foreign withholding tax) | | $ | 19,457,646 | |
Affiliated dividend income | | | 363,272 | |
Interest income | | | 16,737 | |
Income from securities lending, net (including affiliated income of $4,988) | | | 12,800 | |
| | | | |
Total income | | | 19,850,455 | |
| | | | |
| |
Expenses | | | | |
Management fee | | | 1,557,501 | |
Distribution fee(a) | | | 1,845,927 | |
Transfer agent’s fees and expenses (including affiliated expense of $215,901)(a) | | | 1,053,453 | |
Custodian and accounting fees | | | 122,415 | |
Registration fees(a) | | | 97,751 | |
Shareholders’ reports | | | 51,907 | |
Legal fees and expenses | | | 35,930 | |
Trustees’ fees | | | 30,900 | |
Audit fee | | | 24,352 | |
Miscellaneous | | | 32,070 | |
| | | | |
Total expenses | | | 4,852,206 | |
Less: Fee waiver and/or expense reimbursement(a) | | | (739,532 | ) |
| | | | |
Net expenses | | | 4,112,674 | |
| | | | |
Net investment income (loss) | | | 15,737,781 | |
| | | | |
| |
Realized And Unrealized Gain (Loss) On Investments | | | | |
Net realized gain (loss) on: | | | | |
Investment transactions (including affiliated of $326,263) | | | 145,517,539 | |
Futures transactions | | | 3,505,484 | |
| | | | |
| | | 149,023,023 | |
| | | | |
Net change in unrealized appreciation (depreciation) on: | | | | |
Investments (including affiliated of $(393,761)) | | | 7,996,575 | |
Futures | | | (107,514 | ) |
| | | | |
| | | 7,889,061 | |
| | | | |
Net gain (loss) on investment transactions | | | 156,912,084 | |
| | | | |
Net Increase (Decrease) In Net Assets Resulting From Operations | | $ | 172,649,865 | |
| | | | |
| (a) | Class specific expenses and waivers were as follows: |
| | | | | | | | | | | | | | | | | | | | |
| | | Class A | | | Class C | | | Class I | | | Class Z | | | Class R6 | |
Distribution fee | | | 818,662 | | | | 1,027,265 | | | | — | | | | — | | | | — | |
Transfer agent’s fees and expenses | | | 289,988 | | | | 50,486 | | | | 202,418 | | | | 510,502 | | | | 59 | |
Registration fees | | | 17,387 | | | | 20,118 | | | | 15,953 | | | | 16,307 | | | | 27,986 | |
Fee waiver and/or expense reimbursement | | | (183,861 | ) | | | (69,301 | ) | | | (194,176 | ) | | | (264,149 | ) | | | (28,045 | ) |
See Notes to Financial Statements.
Statements of Changes in Net Assets
| | | | | | | | |
| | | Year Ended September 30, | |
| | | 2018 | | | 2017 | |
Increase (Decrease) in Net Assets | | | | | | | | |
Operations | | | | | | | | |
Net investment income (loss) | | $ | 15,737,781 | | | $ | 18,093,024 | |
Net realized gain (loss) on investment transactions | | | 149,023,023 | | | | 45,798,534 | |
Net change in unrealized appreciation (depreciation) on investments | | | 7,889,061 | | | | 119,375,494 | |
| | | | | | | | |
Net increase (decrease) in net assets resulting from operations | | | 172,649,865 | | | | 183,267,052 | |
| | | | | | | | |
| | |
Dividends and Distributions | | | | | | | | |
Dividends from net investment income | | | | | | | | |
Class A | | | (3,579,338 | ) | | | (3,917,494 | ) |
Class C | | | (876,609 | ) | | | (743,425 | ) |
Class I | | | (5,308,178 | ) | | | (6,381,312 | ) |
Class Z | | | (6,219,386 | ) | | | (7,309,837 | ) |
Class R6 | | | (150 | ) | | | — | |
| | | | | | | | |
| | | (15,983,661 | ) | | | (18,352,068 | ) |
| | | | | | | | |
Distributions from net realized gains | | | | | | | | |
Class A | | | (12,245,362 | ) | | | (4,824,460 | ) |
Class C | | | (4,458,137 | ) | | | (1,472,722 | ) |
Class I | | | (15,438,690 | ) | | | (6,529,611 | ) |
Class Z | | | (18,580,627 | ) | | | (7,707,918 | ) |
Class R6 | | | (445 | ) | | | — | |
| | | | | | | | |
| | | (50,723,261 | ) | | | (20,534,711 | ) |
| | | | | | | | |
| | |
Fund share transactions (Net of share conversions) | | | | | | | | |
Net proceeds from shares sold | | | 124,404,893 | | | | 209,977,288 | |
Net asset value of shares issued in reinvestment of dividends and distributions | | | 66,310,557 | | | | 38,673,391 | |
Cost of shares reacquired | | | (360,793,391 | ) | | | (324,980,221 | ) |
| | | | | | | | |
Net increase (decrease) in net assets from Fund share transactions | | | (170,077,941 | ) | | | (76,329,542 | ) |
| | | | | | | | |
Total increase (decrease) | | | (64,134,998 | ) | | | 68,050,731 | |
| | |
Net Assets: | | | | | | | | |
Beginning of year | | | 1,109,916,245 | | | | 1,041,865,514 | |
| | | | | | | | |
End of year(a) | | $ | 1,045,781,247 | | | $ | 1,109,916,245 | |
| | | | | | | | |
(a) Includes undistributed/(distributions in excess of) net investment income of: | | $ | 15,895,549 | | | $ | 16,178,324 | |
| | | | | | | | |
See Notes to Financial Statements.
| | | | |
| PGIM QMA Stock Index Fund | | | 43 | |
Notes to Financial Statements
Prudential Investment Portfolios 8 (the “Trust”) is registered under the Investment Company Act of 1940, as amended (“1940 Act”), as a diversified open-end management investment company. The Trust consists of one fund: PGIM QMA Stock Index Fund (the “Fund”). Effective June 11, 2018, the Fund’s name was changed by replacing “Prudential” with “PGIM” and the Fund’s Class Q shares were renamed Class R6 shares.
The investment objective of the Fund is to provide investment results that correspond to the price and yield performance of the Standard & Poor’s 500 Composite Stock Price Index.
1. Accounting Policies
The Fund follows the investment company accounting and reporting guidance of the Financial Accounting Standards Board (“FASB”) Accounting Standard Codification Topic 946 Financial Services—Investment Companies. The following accounting policies conform to U.S. generally accepted accounting principles. The Fund consistently follows such policies in the preparation of its financial statements.
Securities Valuation: The Fund holds securities and other assets and liabilities that are fair valued at the close of each day (generally, 4:00 PM Eastern time) the New York Stock Exchange (“NYSE”) is open for trading. Fair value is the price that would be received to sell an asset or paid to transfer a liability in an orderly transaction between market participants on the measurement date. The Trust’s Board of Trustees (the “Board”) has adopted valuation procedures for security valuation under which fair valuation responsibilities have been delegated to PGIM Investments LLC (“PGIM Investments” or the “Manager”). Pursuant to the Board’s delegation, a Valuation Committee has been established as two persons, being one or more officers of the Trust, including: the Trust’s Treasurer (or the Treasurer’s direct reports); and the Trust’s Chief or Deputy Chief Compliance Officer (or Vice-President-level direct reports of the Chief or Deputy Chief Compliance Officer). Under the current valuation procedures, the Valuation Committee of the Board is responsible for supervising the valuation of portfolio securities and other assets and liabilities. The valuation procedures permit the Fund to utilize independent pricing vendor services, quotations from market makers, and alternative valuation methods when market quotations are either not readily available or not deemed representative of fair value. A record of the Valuation Committee’s actions is subject to the Board’s review, approval, and ratification at its next regularly scheduled quarterly meeting.
For the fiscal reporting period-end, securities and other assets and liabilities were fair valued at the close of the last U.S. business day. Trading in certain foreign securities may occur when the NYSE is closed (including weekends and holidays). Because such foreign securities trade in markets that are open on weekends and U.S. holidays, the values of some
of the Fund’s foreign investments may change on days when investors cannot purchase or redeem Fund shares.
Various inputs determine how the Fund’s investments are valued, all of which are categorized according to the three broad levels (Level 1, 2, or 3) detailed in the Schedule of Investments referred to herein as the “fair value hierarchy” in accordance with FASB ASC Topic 820.
Common and preferred stocks, exchange-traded funds, and derivative instruments, such as futures or options, that are traded on a national securities exchange are valued at the last sale price as of the close of trading on the applicable exchange where the security principally trades. Securities traded via NASDAQ are valued at the NASDAQ official closing price. To the extent these securities are valued at the last sale price or NASDAQ official closing price, they are classified as Level 1 in the fair value hierarchy. In the event that no sale or official closing price on valuation date exists, these securities are generally valued at the mean between the last reported bid and ask prices, or at the last bid price in the absence of an ask price. These securities are classified as Level 2 in the fair value hierarchy.
Investments in open-end, non-exchange-traded mutual funds are valued at their net asset values as of the close of the NYSE on the date of valuation. These securities are classified as Level 1 in the fair value hierarchy since they may be purchased or sold at their net asset values on the date of valuation.
Securities and other assets that cannot be priced according to the methods described above are valued based on pricing methodologies approved by the Board. In the event that unobservable inputs are used when determining such valuations, the securities will be classified as Level 3 in the fair value hierarchy.
When determining the fair value of securities, some of the factors influencing the valuation include: the nature of any restrictions on disposition of the securities; assessment of the general liquidity of the securities; the issuer’s financial condition and the markets in which it does business; the cost of the investment; the size of the holding and the capitalization of the issuer; the prices of any recent transactions or bids/offers for such securities or any comparable securities; any available analyst media or other reports or information deemed reliable by the Manager regarding the issuer or the markets or industry in which it operates. Using fair value to price securities may result in a value that is different from a security’s most recent closing price and from the price used by other unaffiliated mutual funds to calculate their net asset values.
Restricted and Illiquid Securities: Subject to guidelines adopted by the Board, the Fund may invest up to 15% of its net assets in illiquid securities, including those which are restricted as to disposition under securities law (“restricted securities”). Restricted securities are valued pursuant to the valuation procedures noted above. Illiquid securities are those that, because of the absence of a readily available market or due to legal or contractual restrictions on resale, cannot be sold within seven days in the ordinary course of business at
| | | | |
| PGIM QMA Stock Index Fund | | | 45 | |
Notes to Financial Statements (continued)
approximately the amount at which the Fund has valued the investment. Therefore, the Fund may find it difficult to sell illiquid securities at the time considered most advantageous by its subadviser and may incur transaction costs that would not be incurred in the sale of securities that were freely marketable. Certain securities that would otherwise be considered illiquid because of legal restrictions on resale to the general public may be traded among qualified institutional buyers under Rule 144A of the Securities Act of 1933. These Rule 144A securities, as well as commercial paper that is sold in private placements under Section 4(2) of the Securities Act, may be deemed liquid by the Fund’s subadviser under the guidelines adopted by the Trustees of the Trust. However, the liquidity of the Fund’s investments in Rule 144A securities could be impaired if trading does not develop or declines.
Financial Futures Contracts: A financial futures contract is an agreement to purchase (long) or sell (short) an agreed amount of securities at a set price for delivery on a future date. Upon entering into a financial futures contract, the Fund is required to pledge to the broker an amount of cash and/or other assets equal to a certain percentage of the contract amount. This amount is known as the “initial margin.” Subsequent payments, known as “variation margin,” are made or received by the Fund each day, depending on the daily fluctuations in the value of the underlying security. Such variation margin is recorded for financial statement purposes on a daily basis as unrealized gain (loss). When the contract expires or is closed, the gain (loss) is realized and is presented in the Statement of Operations as net realized gain (loss) on futures transactions.
The Fund invested in financial futures contracts in order to hedge its existing portfolio securities, or securities the Fund intends to purchase, against fluctuations in value caused by changes in value of equities. The use of futures transactions involves the risk of imperfect correlation in movements in the price of futures contracts and the underlying hedged assets. Since futures contracts are exchange-traded, there is minimal counterparty credit risk to the Fund since the exchanges’ clearinghouse acts as counterparty to all exchange-traded futures and guarantees the futures contracts against default.
Master Netting Arrangements: The Trust, on behalf of the Fund, is subject to various Master Agreements, or netting arrangements, with select counterparties. These are agreements which a subadviser may have negotiated and entered into on behalf of the Fund. A master netting arrangement between the Fund and the counterparty permits the Fund to offset amounts payable by the Fund to the same counterparty against amounts to be received; and by the receipt of collateral from the counterparty by the Fund to cover the Fund’s exposure to the counterparty. However, there is no assurance that such mitigating factors are easily enforceable. In addition to master netting arrangements, the right to set-off exists when all the conditions are met such that each of the parties owes the other determinable amounts, the reporting party has the right to set-off the amount owed with the amount owed by the
other party, the reporting party intends to set-off and the right of set-off is enforceable by law. During the reporting period, there was no intention to settle on a net basis and all amounts are presented on a gross basis on the Statement of Assets and Liabilities.
Securities Lending: The Fund may lend its portfolio securities to banks and broker-dealers. The loans are secured by collateral at least equal to the market value of the securities loaned. Collateral pledged by each borrower is invested in an affiliated money market fund and is marked to market daily, based on the previous day’s market value, such that the value of the collateral exceeds the value of the loaned securities. In the event of significant appreciation in value of securities on loan on the last business day of the reporting period, the financial statements may reflect a collateral value that is less than the market value of the loaned securities. Such shortfall is remedied as described above. Loans are subject to termination at the option of the borrower or the Fund. Upon termination of the loan, the borrower will return to the Fund securities identical to the loaned securities. Should the borrower of the securities fail financially, the Fund has the right to repurchase the securities in the open market using the collateral.
The Fund recognizes income, net of any rebate and securities lending agent fees, for lending its securities in the form of fees or interest on the investment of any cash received as collateral. The borrower receives all interest and dividends from the securities loaned and such payments are passed back to the lender in amounts equivalent thereto. The Fund also continues to recognize any unrealized gain (loss) in the market price of the securities loaned and on the change in the value of the collateral invested that may occur during the term of the loan. In addition, realized gain (loss) is recognized on changes in the value of the collateral invested upon liquidation of the collateral. Net earnings from securities lending are disclosed on the Statement of Operations as “Income from securities lending, net”.
Equity and Mortgage Real Estate Investment Trusts (collectively equity REITs): The Fund invests in equity REITs, which report information on the source of their distributions annually. Based on current and historical information, a portion of distributions received from equity REITs during the period is estimated to be dividend income, capital gain or return of capital and recorded accordingly. When material, these estimates are adjusted periodically when the actual source of distributions is disclosed by the equity REITs.
Securities Transactions and Net Investment Income: Securities transactions are recorded on the trade date. Realized gains (losses) from investment and currency transactions are calculated on the specific identification method. Dividend income is recorded on the ex-date. Expenses are recorded on an accrual basis, which may require the use of certain estimates by management that may differ from actual. Net investment income or loss (other than class specific expenses and waivers, which are allocated as noted below) and unrealized and realized gains (losses) are allocated daily to each class of shares based upon the relative proportion of adjusted net assets of each class at the beginning of the day. Class specific expenses and waivers, where applicable, are charged to the respective share classes. Class specific expenses include distribution fees and distribution fee waivers,
| | | | |
| PGIM QMA Stock Index Fund | | | 47 | |
Notes to Financial Statements (continued)
shareholder servicing fees, transfer agent’s fees and expenses, registration fees and fee waivers and/or expense reimbursements, as applicable.
Taxes: It is the Fund’s policy to continue to meet the requirements of the Internal Revenue Code applicable to regulated investment companies and to distribute all of its taxable net investment income and capital gains, if any, to its shareholders. Therefore, no federal income tax provision is required. Withholding taxes on foreign dividends, interest and capital gains, if any, are recorded, net of reclaimable amounts, at the time the related income is earned.
Dividends and Distributions: The Fund expects to pay dividends from net investment income and distributions from net realized capital gains, if any, annually. Dividends and distributions to shareholders, which are determined in accordance with federal income tax regulations and which may differ from generally accepted accounting principles, are recorded on the ex-date. Permanent book/tax differences relating to income and gain (loss) are reclassified amongst undistributed net investment income, accumulated net realized gain (loss) and paid-in capital in excess of par, as appropriate.
Estimates: The preparation of financial statements requires management to make estimates and assumptions that affect the reported amounts and disclosures in the financial statements. Actual results could differ from those estimates.
2. Agreements
The Trust, on behalf of the Fund, has a management agreement with PGIM Investments. Pursuant to this agreement, PGIM Investments has responsibility for all investment advisory services and supervises the subadviser’s performance of such services. In addition, under the management agreement, PGIM Investments provides all of the administrative functions necessary for the organization, operation and management of the Fund. PGIM Investments administers the corporate affairs of the Fund and, in connection therewith, furnishes the Fund with office facilities, together with those ordinary clerical and bookkeeping services which are not being furnished by, the Fund’s custodian, and the Fund’s transfer agent. PGIM Investments is also responsible for the staffing and management of dedicated groups of legal, marketing, compliance and related personnel necessary for the operation of the Fund. The legal, marketing, compliance and related personnel are also responsible for the management and oversight of the various service providers to the Fund, including, but not limited to, the custodian, transfer agent, and accounting agent.
PGIM Investments has entered into a subadvisory agreement with Quantitative Management Associates, LLC (“QMA”). The subadvisory agreement provides that QMA will furnish investment advisory services in connection with the management of the Fund. In connection
therewith, QMA is obligated to keep certain books and records of the Fund. PGIM Investments pays for the services of QMA, the cost of compensation of officers of the Fund, occupancy and certain clerical and bookkeeping costs of the Fund. The Fund bears all other costs and expenses.
The management fee paid to PGIM Investments is accrued daily and payable monthly at an annual rate of 0.15% of the Fund’s average daily net assets up to and including $1 billion and 0.10% of such average daily net assets in excess of $1 billion. The effective management fee before any waivers and/or expense reimbursements was 0.15% for the year ended September 30, 2018.
PGIM Investments has contractually agreed through January 31, 2019 to waive a portion of its management fee so that the effective management fee for the Fund will be 0.08% of the average daily net assets of the Fund. Separately, PGIM Investments has contractually agreed, through January 31, 2019, to limit transfer agency, shareholder servicing, sub-transfer agency, and blue sky fees, as applicable, to the extent that such fees cause the Total Annual Fund Operating Expenses to exceed 0.18% of average daily net assets for Class R6 shares. This contractual expense limitation excludes interest, brokerage, taxes (such as income and foreign withholding taxes, stamp duty and deferred tax expenses), acquired fund fees and expenses, extraordinary expenses, and certain other Fund expenses such as dividend and interest expense and broker charges on short sales. Expenses waived/reimbursed by the Manager in accordance with this agreement may be recouped by the Manager within the same fiscal year during which such waiver/reimbursement is made if such recoupment can be realized without exceeding the expense limit in effect at the time of the recoupment for that fiscal year. Effective October 1, 2018 this waiver agreement was extended through January 31, 2020.
Where applicable, PGIM Investments has voluntarily agreed through September 30, 2018, to waive management fees or shared operating expenses on any share class to the same extent that it waives similar expenses on any other share class and, in addition, Total Annual Fund Operating Expenses for Class R6 shares will not exceed Total Annual Fund Operating Expenses for Class Z shares. Effective October 1, 2018 this voluntary agreement became part of the Fund’s contractual waiver through January 31, 2020 and is subject to recoupment by the Manager within the same fiscal year during which such waiver/reimbursement is made if such recoupment can be realized without exceeding the expense limit in effect at the time of the recoupment for that fiscal year.
The Trust, on behalf of the Fund, has a distribution agreement with Prudential Investment Management Services LLC (“PIMS”) which acts as the distributor of the Class A, Class C, Class I, Class Z and Class R6 shares of the Fund. The Fund compensates PIMS for distributing and servicing the Fund’s Class A and Class C shares, pursuant to the plans of distribution (the “Distribution Plans”), regardless of expenses actually incurred by PIMS. The distribution fees are accrued daily and payable monthly. No distribution or service fees are paid to PIMS as distributor of the Class I, Class Z and Class R6 shares of the Fund.
| | | | |
| PGIM QMA Stock Index Fund | | | 49 | |
Notes to Financial Statements (continued)
Pursuant to the Distribution Plans, the Fund compensates PIMS for distribution related activities at an annual rate of up to 0.30% and 1% of the average daily net assets of the Class A and Class C shares, respectively.
PIMS has advised the Fund that it received $113,053, in front-end sales charges resulting from sales of Class A shares during the year ended September 30, 2018. From these fees, PIMS paid such sales charges to broker-dealers, who in turn paid commissions to salespersons and incurred other distribution costs.
PIMS has advised the Fund that for the year ended September 30, 2018, it received $8,338 in contingent deferred sales charges imposed upon redemptions by certain Class C shareholders.
PGIM Investments, PIMS and QMA are indirect, wholly-owned subsidiaries of Prudential Financial, Inc. (“Prudential”).
3. Other Transactions with Affiliates
Prudential Mutual Fund Services LLC (“PMFS”), an affiliate of PGIM Investments and an indirect, wholly-owned subsidiary of Prudential, serves as the Fund’s transfer agent. Transfer agent’s fees and expenses in the Statement of Operations include certain out-of-pocket expenses paid to non-affiliates, where applicable.
The Fund may enter into certain securities purchase or sale transactions under Board approved Rule 17a-7 procedures. Rule 17a-7 is an exemptive rule under the 1940 Act, that, subject to certain conditions, permits purchase and sale transactions among affiliated investment companies, or between an investment company and a person that is affiliated solely by reason of having a common (or affiliated) investment adviser, common directors, and/or common officers. Such transactions are subject to ratification by the Board. For the reporting period ended September 30, 2018, no such transactions were entered into by the Fund.
The Fund may invest its overnight sweep cash in the PGIM Core Ultra Short Bond Fund (the “Core Fund”), and its securities lending cash collateral in the PGIM Institutional Money Market Fund (the “Money Market Fund”), each a series of Prudential Investment Portfolios 2, registered under the 1940 Act and managed by PGIM Investments. For the reporting period ended September 30, 2018, PGIM, Inc. was compensated $2,972 by PGIM Investments for managing the Fund’s securities lending cash collateral as subadviser to the Money Market Fund. Earnings from the Core Fund and Money Market Fund are disclosed on the Statement of Operations as “Affiliated dividend income” and “Income from securities lending, net”, respectively.
4. Portfolio Securities
The aggregate cost of purchases and proceeds from sales of portfolio securities (excluding short-term investments and U.S. Government securities) for the year ended September 30, 2018, were $17,155,983 and $230,765,176, respectively.
A summary of the cost of purchases and proceeds from sales of shares of affiliated investments for the year ended September 30, 2018, is presented as follows:
| | | | | | | | | | | | | | | | | | | | | | | | | | | | | | | | |
Affiliated
Investments | | Value,
Beginning
of Year | | | Cost of
Purchases | | | Proceeds
from Sales | | | Change in
Unrealized
Gain
(Loss) | | | Realized
Gain
(Loss) | | | Value,
End of
Year | | | Shares,
End of
Year | | | Dividend
Income | |
Prudential Financial, Inc. | | $ | 2,301,828 | | | $ | — | | | $ | 450,478 | | | $ | (393,552 | ) | | $ | 325,434 | | | $ | 1,783,232 | | | | 17,600 | | | $ | 64,898 | |
PGIM Core Ultra Short Bond Fund* | | | 19,203,477 | | | | 136,559,786 | | | | 137,381,998 | | | | — | | | | — | | | | 18,381,265 | | | | 18,381,265 | | | | 298,374 | |
PGIM Institutional Money Market Fund* | | | 3,792,303 | | | | 117,075,889 | | | | 117,444,709 | | | | (209 | ) | | | 829 | | | | 3,424,103 | | | | 3,423,760 | | | | 4,988 | ** |
| | | | | | | | | | | | | | | | | | | | | | | | | | | | | | | | |
| | $ | 25,297,608 | | | $ | 253,635,675 | | | $ | 255,277,185 | | | $ | (393,761 | ) | | $ | 326,263 | | | $ | 23,588,600 | | | | | | | $ | 368,260 | |
| | | | | | | | | | | | | | | | | | | | | | | | | | | | | | | | |
| * | The Funds did not have any capital gain distributions during the reporting period. |
| ** | This amount is included in “Income from securities lending, net” on the Statement of Operations. |
5. Distributions and Tax Information
Distributions to shareholders, which are determined in accordance with federal income tax regulations and which may differ from generally accepted accounting principles, are recorded on the ex-date. In order to present undistributed net investment income, accumulated net realized gain on investment transactions and paid-in capital in excess of par on the Statement of Assets and Liabilities that more closely represent their tax character, certain adjustments have been made to undistributed net investment income and accumulated net realized gain on investment transactions. For the year ended September 30, 2018, the adjustments were to decrease undistributed net investment income and increase accumulated net realized gain on investment transactions by $36,895 due to certain book to tax differences. Net investment income, net realized gain (loss) on investments and net assets were not affected by this change.
For the year ended September 30, 2018, the tax character of dividends paid by the Fund were $19,225,453 from ordinary income and $47,481,469 from long-term capital gains. For the year ended September 30, 2017, the tax character of dividends paid by the Fund were $22,119,405 from ordinary income and $16,767,374 from long-term capital gains.
As of September 30, 2018, the accumulated undistributed earnings on a tax basis were $17,312,255 of ordinary income and $139,452,220 of long-term capital gains. This differs
| | | | |
| PGIM QMA Stock Index Fund | | | 51 | |
Notes to Financial Statements (continued)
from the amount shown on the Statement of Assets and Liabilities primarily due to cumulative timing differences between financial and tax reporting.
The United States federal income tax basis of the Fund’s investments and the net unrealized appreciation as of September 30, 2018 were as follows:
| | | | | | |
Tax Basis | | Gross Unrealized Appreciation | | Gross Unrealized Depreciation | | Net Unrealized Appreciation |
| $284,350,098 | | $775,351,379 | | $(7,935,521) | | $767,415,858 |
The difference between book basis and tax basis was primarily attributable to deferred losses on wash sales, corporate actions adjustments and other book to tax differences.
Management has analyzed the Fund’s tax positions taken on federal, state and local income tax returns for all open tax years and has concluded that no provision for income tax is required in the Fund’s financial statements for the current reporting period. The Fund’s federal, state and local income and federal excise tax returns for tax years for which the applicable statutes of limitations have not expired are subject to examination by the Internal Revenue Service and state departments of revenue.
6. Capital and Ownership
The Fund offers Class A, Class C, Class I, Class Z and Class R6 shares. Class A shares are sold with a maximum front-end sales charge of 3.25%. Investors who purchase $1 million or more of Class A shares and sell these shares within 12 months of purchase are subject to a contingent deferred sales charge (“CDSC”) of 1%, although they are not subject to an initial sales charge. The Class A CDSC is waived for certain retirement and/or benefit plans. A special exchange privilege is also available for shareholders who qualified to purchase Class A shares at net asset value. Class C shares are sold with a CDSC of 1% on sales made within 12 months of purchase. Class I, Class Z and Class R6 shares are not subject to any sales or redemption charge and are offered exclusively for sale to a limited group of investors.
Under certain circumstances, an exchange may be made from specified share classes of the Fund to one or more other share classes of the Fund as presented in the table of transactions in shares of beneficial interest.
The Trust has authorized an unlimited number of shares of beneficial interest at $0.001 par value per share, currently of one Fund, divided into five classes, designated Class A, Class C, Class I, Class Z and Class R6 shares.
Prudential through its affiliated entities, owned 196 Class R6 shares of the fund. At reporting period end, four shareholders of record held 39% of the Fund’s outstanding shares on behalf of multiple beneficial owners, of which 16% were held by an affiliate of Prudential.
Transactions in shares of beneficial interest were as follows:
| | | | | | | | |
Class A | | Shares | | | Amount | |
Year ended September 30, 2018: | | | | | | | | |
Shares sold | | | 322,414 | | | $ | 17,210,353 | |
Shares issued in reinvestment of dividends and distributions | | | 299,134 | | | | 15,536,992 | |
Shares reacquired | | | (925,553 | ) | | | (49,570,977 | ) |
| | | | | | | | |
Net increase (decrease) in shares outstanding before conversion | | | (304,005 | ) | | | (16,823,632 | ) |
Shares issued upon conversion from other share class(es) | | | 16,322 | | | | 891,027 | |
Shares reacquired upon conversion into other share class(es) | | | (28,722 | ) | | | (1,554,356 | ) |
| | | | | | | | |
Net increase (decrease) in shares outstanding | | | (316,405 | ) | | $ | (17,486,961 | ) |
| | | | | | | | |
Year ended September 30, 2017: | | | | | | | | |
Shares sold | | | 849,318 | | | $ | 40,042,531 | |
Shares issued in reinvestment of dividends and distributions | | | 188,570 | | | | 8,613,901 | |
Shares reacquired | | | (1,125,735 | ) | | | (54,010,729 | ) |
| | | | | | | | |
Net increase (decrease) in shares outstanding before conversion | | | (87,847 | ) | | | (5,354,297 | ) |
Shares issued upon conversion from other share class(es) | | | 29,927 | | | | 1,451,445 | |
Shares reacquired upon conversion into other share class(es) | | | (46,652 | ) | | | (2,279,206 | ) |
| | | | | | | | |
Net increase (decrease) in shares outstanding | | | (104,572 | ) | | $ | (6,182,058 | ) |
| | | | | | | | |
Class C | | | | | | |
Year ended September 30, 2018: | | | | | | | | |
Shares sold | | | 319,490 | | | $ | 16,927,644 | |
Shares issued in reinvestment of dividends and distributions | | | 103,128 | | | | 5,320,388 | |
Shares reacquired | | | (289,134 | ) | | | (15,338,071 | ) |
| | | | | | | | |
Net increase (decrease) in shares outstanding before conversion | | | 133,484 | | | | 6,909,961 | |
Shares reacquired upon conversion into other share class(es) | | | (53,562 | ) | | | (2,939,825 | ) |
| | | | | | | | |
Net increase (decrease) in shares outstanding | | | 79,922 | | | $ | 3,970,136 | |
| | | | | | | | |
Year ended September 30, 2017: | | | | | | | | |
Shares sold | | | 525,000 | | | $ | 24,713,507 | |
Shares issued in reinvestment of dividends and distributions | | | 47,816 | | | | 2,174,659 | |
Shares reacquired | | | (247,780 | ) | | | (11,854,418 | ) |
| | | | | | | | |
Net increase (decrease) in shares outstanding before conversion | | | 325,036 | | | | 15,033,748 | |
Shares reacquired upon conversion into other share class(es) | | | (88,708 | ) | | | (4,258,548 | ) |
| | | | | | | | |
Net increase (decrease) in shares outstanding | | | 236,328 | | | $ | 10,775,200 | |
| | | | | | | | |
| | | | |
| PGIM QMA Stock Index Fund | | | 53 | |
Notes to Financial Statements (continued)
| | | | | | | | |
Class I | | Shares | | | Amount | |
Year ended September 30, 2018: | | | | | | | | |
Shares sold | | | 707,654 | | | $ | 38,223,432 | |
Shares issued in reinvestment of dividends and distributions | | | 397,716 | | | | 20,717,008 | |
Shares reacquired | | | (2,462,699 | ) | | | (129,320,520 | ) |
| | | | | | | | |
Net increase (decrease) in shares outstanding before conversion | | | (1,357,329 | ) | | | (70,380,080 | ) |
Shares issued upon conversion from other share class(es) | | | 1,239 | | | | 70,037 | |
Shares reacquired upon conversion into other share class(es) | | | (20,436 | ) | | | (1,109,058 | ) |
| | | | | | | | |
Net increase (decrease) in shares outstanding | | | (1,376,526 | ) | | $ | (71,419,101 | ) |
| | | | | | | | |
Year ended September 30, 2017: | | | | | | | | |
Shares sold | | | 1,310,965 | | | $ | 62,562,418 | |
Shares issued in reinvestment of dividends and distributions | | | 281,834 | | | | 12,893,918 | |
Shares reacquired | | | (2,520,013 | ) | | | (121,710,610 | ) |
| | | | | | | | |
Net increase (decrease) in shares outstanding before conversion | | | (927,214 | ) | | | (46,254,274 | ) |
Shares issued upon conversion from other share class(es) | | | 7,149 | | | | 341,205 | |
Shares reacquired upon conversion into other share class(es) | | | (4,308 | ) | | | (198,843 | ) |
| | | | | | | | |
Net increase (decrease) in shares outstanding | | | (924,373 | ) | | $ | (46,111,912 | ) |
| | | | | | | | |
Class Z | | | | | | |
Year ended September 30, 2018: | | | | | | | | |
Shares sold | | | 965,932 | | | $ | 51,963,615 | |
Shares issued in reinvestment of dividends and distributions | | | 474,771 | | | | 24,735,574 | |
Shares reacquired | | | (3,102,160 | ) | | | (166,543,375 | ) |
| | | | | | | | |
Net increase (decrease) in shares outstanding before conversion | | | (1,661,457 | ) | | | (89,844,186 | ) |
Shares issued upon conversion from other share class(es) | | | 99,833 | | | | 5,495,274 | |
Shares reacquired upon conversion into other share class(es) | | | (16,202 | ) | | | (888,551 | ) |
| | | | | | | | |
Net increase (decrease) in shares outstanding | | | (1,577,826 | ) | | $ | (85,237,463 | ) |
| | | | | | | | |
Year ended September 30, 2017: | | | | | | | | |
Shares sold | | | 1,744,755 | | | $ | 82,658,832 | |
Shares issued in reinvestment of dividends and distributions | | | 327,527 | | | | 14,990,913 | |
Shares reacquired | | | (2,861,214 | ) | | | (137,404,464 | ) |
| | | | | | | | |
Net increase (decrease) in shares outstanding before conversion | | | (788,932 | ) | | | (39,754,719 | ) |
Shares issued upon conversion from other share class(es) | | | 107,477 | | | | 5,217,931 | |
Shares reacquired upon conversion into other share class(es) | | | (5,864 | ) | | | (273,984 | ) |
| | | | | | | | |
Net increase (decrease) in shares outstanding | | | (687,319 | ) | | $ | (34,810,772 | ) |
| | | | | | | | |
Class R6 | | | | | | |
Period ended September 30, 2018*: | | | | | | | | |
Shares sold | | | 1,402 | | | $ | 79,849 | |
Shares issued in reinvestment of dividends and distributions | | | 11 | | | | 595 | |
Shares reacquired | | | (371 | ) | | | (20,448 | ) |
| | | | | | | | |
Net increase (decrease) in shares outstanding before conversion | | | 1,042 | | | | 59,996 | |
Shares issued upon conversion from other share class(es) | | | 644 | | | | 35,452 | |
| | | | | | | | |
Net increase (decrease) in shares outstanding | | | 1,686 | | | $ | 95,448 | |
| | | | | | | | |
| * | Commencement of offering was November 28, 2017. |
7. Borrowings
The Trust, on behalf of the Fund, along with other affiliated registered investment companies (the “Funds”), is a party to a Syndicated Credit Agreement (“SCA”) with a group of banks. The purpose of the SCA is to provide an alternative source of temporary funding for capital share redemptions. The SCA provides for a commitment of $900 million for the period October 5, 2017 through October 4, 2018. The Funds pay an annualized commitment fee of 0.15% of the unused portion of the SCA. The Fund’s portion of the commitment fee for the unused amount, allocated based upon a method approved by the Board, is accrued daily and paid quarterly. Prior to October 5, 2017, the Funds had another SCA that provided a commitment of $900 million and the Funds paid an annualized commitment fee of 0.15% of the unused portion of the SCA.
Subsequent to the reporting period end, the SCA was renewed effective October 4, 2018 and will continue to provide a commitment of $900 million through October 3, 2019. The commitment fee paid by the Funds will continue to be 0.15% of the unused portion of the SCA. The interest on borrowings under both SCAs is paid monthly and at a per annum interest rate based upon a contractual spread plus the higher of (1) the effective federal funds rate, (2) the 1-month LIBOR rate or (3) zero percent.
Other affiliated registered investment companies that are parties to the SCA include portfolios that are subject to a predetermined mathematical formula used to manage certain benefit guarantees offered under variable annuity contracts. The formula may result in large scale asset flows into and out of these portfolios. Consequently, these portfolios may be more likely to utilize the SCA for purposes of funding redemptions. It may be possible for those portfolios to fully exhaust the committed amount of the SCA, thereby requiring the Manager to allocate available funding per a Board-approved methodology designed to treat the Funds in the SCA equitably.
The Fund did not utilize the SCA during the year ended September 30, 2018.
8. Other Risks
The Fund’s risks include, but are not limited to, the risks discussed below:
Equity and Equity-Related Securities Risks: The value of a particular security could go down and you could lose money. In addition to an individual security losing value, the value of the equity markets or a sector in which the Fund invests could go down. The Fund’s holdings can vary significantly from broad market indexes and the performance of the Fund can deviate from the performance of these indexes. Different parts of a market can react differently to adverse issuer, market, regulatory, political and economic developments.
Market and Credit Risk: Securities markets may be volatile and the market prices of the Fund’s securities may decline. Securities fluctuate in price based on changes in an issuer’s financial condition and overall market and economic conditions. If the market prices of the securities owned by the Fund fall, the value of an investment in the Fund will decline.
| | | | |
| PGIM QMA Stock Index Fund | | | 55 | |
Notes to Financial Statements (continued)
Additionally, the Fund may also be exposed to credit risk in the event that an issuer or guarantor fails to perform or that an institution or entity with which the Fund has unsettled or open transactions defaults.
9. Recent Accounting Pronouncements and Reporting Updates
In August 2018, the FASB issued Accounting Standards Update (“ASU”) No. 2018-13, which changes certain fair value measurement disclosure requirements. The new ASU, in addition to other modifications and additions, removes the requirement to disclose the amount and reasons for transfers between Level 1 and Level 2 of the fair value hierarchy, and the Fund’s policy for the timing of transfers between levels. The amendments are effective for financial statements issued for fiscal years beginning after December, 15, 2019, and interim periods within those fiscal years. Management has evaluated the implications of certain other provisions of the ASU and has determined to early adopt aspects related to the removal and modifications of certain fair value measurement disclosures under the ASU effective immediately. At this time, management is evaluating the implications of certain other provisions of the ASU related to new disclosure requirements and any impact on the financial statement disclosures has not yet been determined.
Financial Highlights
| | | | | | | | | | | | | | | | | | | | |
| Class A Shares | | | | | | | | | | | | | | | |
| | | Year Ended September 30, | |
| | | 2018 | | | 2017 | | | 2016 | | | 2015 | | | 2014 | |
| Per Share Operating Performance(a): | | | | | | | | | | | | | | | | | | | | |
| Net Asset Value, Beginning of Year | | | $51.67 | | | | $45.37 | | | | $40.91 | | | | $43.97 | | | | $37.45 | |
| Income (loss) from investment operations: | | | | | | | | | | | | | | | | | | | | |
| Net investment income (loss) | | | 0.73 | | | | 0.71 | | | | 0.69 | | | | 0.65 | | | | 0.61 | |
| Net realized and unrealized gain (loss) on investment transactions | | | 7.91 | | | | 7.23 | | | | 5.27 | | | | (0.93 | ) | | | 6.47 | |
| Total from investment operations | | | 8.64 | | | | 7.94 | | | | 5.96 | | | | (0.28 | ) | | | 7.08 | |
| Less Dividends and Distributions: | | | | | | | | | | | | | | | | | | | | |
| Dividends from net investment income | | | (0.70 | ) | | | (0.74 | ) | | | (0.84 | ) | | | (0.63 | ) | | | (0.47 | ) |
| Distributions from net realized gains | | | (2.42 | ) | | | (0.90 | ) | | | (0.66 | ) | | | (2.15 | ) | | | (0.09 | ) |
| Total dividends and distributions | | | (3.12 | ) | | | (1.64 | ) | | | (1.50 | ) | | | (2.78 | ) | | | (0.56 | ) |
| Net asset value, end of year | | | $57.19 | | | | $51.67 | | | | $45.37 | | | | $40.91 | | | | $43.97 | |
| Total Return(b): | | | 17.34% | | | | 17.97% | | | | 14.85% | | | | (1.06)% | | | | 19.09% | |
| |
| Ratios/Supplemental Data: | | | | | | | | | | | | | |
| Net assets, end of year (000) | | | $276,785 | | | | $266,434 | | | | $238,671 | | | | $200,334 | | | | $197,250 | |
| Average net assets (000) | | | $272,887 | | | | $257,269 | | | | $222,230 | | | | $210,562 | | | | $184,199 | |
| Ratios to average net assets(c): | | | | | | | | | | | | | | | | | | | | |
| Expenses after waivers and/or expense reimbursement | | | 0.52% | | | | 0.52% | | | | 0.53% | | | | 0.54% | | | | 0.53% | |
| Expenses before waivers and/or expense reimbursement | | | 0.59% | (d) | | | 0.59% | | | | 0.60% | | | | 0.61% | | | | 0.67% | |
| Net investment income (loss) | | | 1.36% | | | | 1.49% | | | | 1.61% | | | | 1.49% | | | | 1.47% | |
| Portfolio turnover rate(e) | | | 2% | | | | 4% | | | | 4% | | | | 6% | | | | 4% | |
| (a) | Calculated based on average shares outstanding during the year. |
| (b) | Total return does not consider the effects of sales loads. Total return is calculated assuming a purchase of a share on the first day and a sale on the last day of each year reported and includes reinvestment of dividends and distributions, if any. Total returns may reflect adjustments to conform to generally accepted accounting principles. |
| (c) | Does not include expenses of the underlying funds in which the Fund invests. |
| (d) | Effective October 1, 2017, class specific expenses include Transfer Agent Fees and expenses and Registration Fees, which are charged to their respective share class. |
| (e) | The Fund’s portfolio turnover rate is calculated in accordance with regulatory requirements, without regard to transactions involving short term investments and certain derivatives. If such transactions were included, the Fund’s portfolio turnover rate may be higher. |
See Notes to Financial Statements.
| | | | |
| PGIM QMA Stock Index Fund | | | 57 | |
Financial Highlights (continued)
| | | | | | | | | | | | | | | | | | | | |
| Class C Shares | | | | | | | | | | | | | | | |
| | | Year Ended September 30, | |
| | | 2018 | | | 2017 | | | 2016 | | | 2015 | | | 2014 | |
| Per Share Operating Performance(a): | | | | | | | | | | | | | | | | | | | | |
| Net Asset Value, Beginning of Year | | | $51.19 | | | | $44.97 | | | | $40.56 | | | | $43.64 | | | | $37.18 | |
| Income (loss) from investment operations: | | | | | | | | | | | | | | | | | | | | |
| Net investment income (loss) | | | 0.37 | | | | 0.40 | | | | 0.41 | | | | 0.37 | | | | 0.35 | |
| Net realized and unrealized gain (loss) on investment transactions | | | 7.83 | | | | 7.18 | | | | 5.22 | | | | (0.94 | ) | | | 6.45 | |
| Total from investment operations | | | 8.20 | | | | 7.58 | | | | 5.63 | | | | (0.57 | ) | | | 6.80 | |
| Less Dividends and Distributions: | | | | | | | | | | | | | | | | | | | | |
| Dividends from net investment income | | | (0.47 | ) | | | (0.46 | ) | | | (0.56 | ) | | | (0.36 | ) | | | (0.25 | ) |
| Distributions from net realized gains | | | (2.42 | ) | | | (0.90 | ) | | | (0.66 | ) | | | (2.15 | ) | | | (0.09 | ) |
| Total dividends and distributions | | | (2.89 | ) | | | (1.36 | ) | | | (1.22 | ) | | | (2.51 | ) | | | (0.34 | ) |
| Net asset value, end of year | | | $56.50 | | | | $51.19 | | | | $44.97 | | | | $40.56 | | | | $43.64 | |
| Total Return(b): | | | 16.56% | | | | 17.24% | | | | 14.10% | | | | (1.70)% | | | | 18.38% | |
| |
| Ratios/Supplemental Data: | | | | | | | | | | | | | |
| Net assets, end of year (000) | | | $108,459 | | | | $94,169 | | | | $72,100 | | | | $49,462 | | | | $38,749 | |
| Average net assets (000) | | | $102,726 | | | | $85,397 | | | | $61,856 | | | | $46,945 | | | | $34,419 | |
| Ratios to average net assets(c): | | | | | | | | | | | | | | | | | | | | |
| Expenses after waivers and/or expense reimbursement | | | 1.18% | | | | 1.16% | | | | 1.18% | | | | 1.19% | | | | 1.16% | |
| Expenses before waivers and/or expense reimbursement | | | 1.25% | (d) | | | 1.23% | | | | 1.25% | | | | 1.26% | | | | 1.30% | |
| Net investment income (loss) | | | 0.70% | | | | 0.85% | | | | 0.96% | | | | 0.85% | | | | 0.84% | |
| Portfolio turnover rate(e) | | | 2% | | | | 4% | | | | 4% | | | | 6% | | | | 4% | |
| (a) | Calculated based on average shares outstanding during the year. |
| (b) | Total return does not consider the effects of sales loads. Total return is calculated assuming a purchase of a share on the first day and a sale on the last day of each year reported and includes reinvestment of dividends and distributions, if any. Total returns may reflect adjustments to conform to generally accepted accounting principles. |
| (c) | Does not include expenses of the underlying funds in which the Fund invests. |
| (d) | Effective October 1, 2017, class specific expenses include Transfer Agent Fees and expenses and Registration Fees, which are charged to their respective share class. |
| (e) | The Fund’s portfolio turnover rate is calculated in accordance with regulatory requirements, without regard to transactions involving short term investments and certain derivatives. If such transactions were included, the Fund’s portfolio turnover rate may be higher. |
See Notes to Financial Statements.
| | | | | | | | | | | | | | | | | | | | |
| Class I Shares | | | | | | | | | | | | | | | |
| | | Year Ended September 30, | |
| | | 2018 | | | 2017 | | | 2016 | | | 2015 | | | 2014 | |
| Per Share Operating Performance(a): | | | | | | | | | | | | | | | | | | | | |
| Net Asset Value, Beginning of Year | | | $51.89 | | | | $45.54 | | | | $41.07 | | | | $44.14 | | | | $37.57 | |
| Income (loss) from investment operations: | | | | | | | | | | | | | | | | | | | | |
| Net investment income (loss) | | | 0.91 | | | | 0.88 | | | | 0.84 | | | | 0.81 | | | | 0.75 | |
| Net realized and unrealized gain (loss) on investment transactions | | | 7.95 | | | | 7.26 | | | | 5.29 | | | | (0.97 | ) | | | 6.51 | |
| Total from investment operations | | | 8.86 | | | | 8.14 | | | | 6.13 | | | | (0.16 | ) | | | 7.26 | |
| Less Dividends and Distributions: | | | | | | | | | | | | | | | | | | | | |
| Dividends from net investment income | | | (0.83 | ) | | | (0.89 | ) | | | (1.00 | ) | | | (0.76 | ) | | | (0.60 | ) |
| Distributions from net realized gains | | | (2.42 | ) | | | (0.90 | ) | | | (0.66 | ) | | | (2.15 | ) | | | (0.09 | ) |
| Total dividends and distributions | | | (3.25 | ) | | | (1.79 | ) | | | (1.66 | ) | | | (2.91 | ) | | | (0.69 | ) |
| Net asset value, end of year | | | $57.50 | | | | $51.89 | | | | $45.54 | | | | $41.07 | | | | $44.14 | |
| Total Return(b): | | | 17.72% | | | | 18.40% | | | | 15.23% | | | | (0.77)% | | | | 19.54% | |
| |
| Ratios/Supplemental Data: | | | | | | | | | | | | | |
| Net assets, end of year (000) | | | $290,252 | | | | $333,339 | | | | $334,673 | | | | $295,412 | | | | $255,507 | |
| Average net assets (000) | | | $289,170 | | | | $339,473 | | | | $323,821 | | | | $291,839 | | | | $241,829 | |
| Ratios to average net assets(c): | | | | | | | | | | | | | | | | | | | | |
| Expenses after waivers and/or expense reimbursement | | | 0.18% | | | | 0.18% | | | | 0.19% | | | | 0.19% | | | | 0.19% | |
| Expenses before waivers and/or expense reimbursement | | | 0.25% | (d) | | | 0.25% | | | | 0.26% | | | | 0.26% | | | | 0.33% | |
| Net investment income (loss) | | | 1.69% | | | | 1.86% | | | | 1.96% | | | | 1.83% | | | | 1.81% | |
| Portfolio turnover rate(e) | | | 2% | | | | 4% | | | | 4% | | | | 6% | | | | 4% | |
| (a) | Calculated based on average shares outstanding during the year. |
| (b) | Total return is calculated assuming a purchase of a share on the first day and a sale on the last day of each year reported and includes reinvestment of dividends and distributions, if any. Total returns may reflect adjustments to conform to generally accepted accounting principles. |
| (c) | Does not include expenses of the underlying funds in which the Fund invests. |
| (d) | Effective October 1, 2017, class specific expenses include Transfer Agent Fees and expenses and Registration Fees, which are charged to their respective share class. |
| (e) | The Fund’s portfolio turnover rate is calculated in accordance with regulatory requirements, without regard to transactions involving short term investments and certain derivatives. If such transactions were included, the Fund’s portfolio turnover rate may be higher. |
See Notes to Financial Statements.
| | | | |
| PGIM QMA Stock Index Fund | | | 59 | |
Financial Highlights (continued)
| | | | | | | | | | | | | | | | | | | | |
| Class Z Shares | | | | | | | | | | | | | | | |
| | | Year Ended September 30, | |
| | | 2018 | | | 2017 | | | 2016 | | | 2015 | | | 2014 | |
| Per Share Operating Performance(a): | | | | | | | | | | | | | | | | | | | | |
| Net Asset Value, Beginning of Year | | | $51.88 | | | | $45.54 | | | | $41.07 | | | | $44.12 | | | | $37.57 | |
| Income (loss) from investment operations: | | | | | | | | | | | | | | | | | | | | |
| Net investment income (loss) | | | 0.88 | | | | 0.85 | | | | 0.82 | | | | 0.78 | | | | 0.73 | |
| Net realized and unrealized gain (loss) on investment transactions | | | 7.95 | | | | 7.25 | | | | 5.28 | | | | (0.94 | ) | | | 6.49 | |
| Total from investment operations | | | 8.83 | | | | 8.10 | | | | 6.10 | | | | (0.16 | ) | | | 7.22 | |
| Less Dividends and Distributions: | | | | | | | | | | | | | | | | | | | | |
| Dividends from net investment income | | | (0.80 | ) | | | (0.86 | ) | | | (0.97 | ) | | | (0.74 | ) | | | (0.58 | ) |
| Distributions from net realized gains | | | (2.42 | ) | | | (0.90 | ) | | | (0.66 | ) | | | (2.15 | ) | | | (0.09 | ) |
| Total dividends and distributions | | | (3.22 | ) | | | (1.76 | ) | | | (1.63 | ) | | | (2.89 | ) | | | (0.67 | ) |
| Net asset value, end of year | | | $57.49 | | | | $51.88 | | | | $45.54 | | | | $41.07 | | | | $44.12 | |
| Total Return(b): | | | 17.67% | | | | 18.31% | | | | 15.16% | | | | (0.78)% | | | | 19.42% | |
| |
| Ratios/Supplemental Data: | | | | | | | | | | | | | |
| Net assets, end of year (000) | | | $370,188 | | | | $415,974 | | | | $396,421 | | | | $388,796 | | | | $425,001 | |
| Average net assets (000) | | | $392,699 | | | | $412,869 | | | | $390,514 | | | | $442,546 | | | | $424,209 | |
| Ratios to average net assets(c): | | | | | | | | | | | | | | | | | | | | |
| Expenses after waivers and/or expense reimbursement | | | 0.24% | | | | 0.24% | | | | 0.25% | | | | 0.25% | | | | 0.25% | |
| Expenses before waivers and/or expense reimbursement | | | 0.31% | (d) | | | 0.31% | | | | 0.32% | | | | 0.32% | | | | 0.39% | |
| Net investment income (loss) | | | 1.63% | | | | 1.77% | | | | 1.89% | | | | 1.78% | | | | 1.75% | |
| Portfolio turnover rate(e) | | | 2% | | | | 4% | | | | 4% | | | | 6% | | | | 4% | |
| (a) | Calculated based on average shares outstanding during the year. |
| (b) | Total return is calculated assuming a purchase of a share on the first day and a sale on the last day of each year reported and includes reinvestment of dividends and distributions, if any. Total returns may reflect adjustments to conform to generally accepted accounting principles. |
| (c) | Does not include expenses of the underlying funds in which the Fund invests. |
| (d) | Effective October 1, 2017, class specific expenses include Transfer Agent Fees and expenses and Registration Fees, which are charged to their respective share class. |
| (e) | The Fund’s portfolio turnover rate is calculated in accordance with regulatory requirements, without regard to transactions involving short term investments and certain derivatives. If such transactions were included, the Fund’s portfolio turnover rate may be higher. |
See Notes to Financial Statements.
| | | | |
| Class R6 Shares | | | |
| | | November 28,
2017(a)
through
September 30,
2018 | |
| Per Share Operating Performance(b): | | | | |
| Net Asset Value, Beginning of Period | | | $54.26 | |
| Income (loss) from investment operations: | | | | |
| Net investment income (loss) | | | 0.70 | |
| Net realized and unrealized gain (loss) on investment transactions | | | 5.79 | |
| Total from investment operations | | | 6.49 | |
| Less Dividends and Distributions: | | | | |
| Dividends from net investment income | | | (0.81 | ) |
| Distributions from net realized gains | | | (2.42 | ) |
| Total dividends and distributions | | | (3.23 | ) |
| Net asset value, end of period | | | $57.52 | |
| Total Return(c): | | | 12.57% | |
| |
| Ratios/Supplemental Data: | | | |
| Net assets, end of period (000) | | | $97 | |
| Average net assets (000) | | | $23 | |
| Ratios to average net assets(d): | | | | |
| Expenses after waivers and/or expense reimbursement | | | 0.18% | (e) |
| Expenses before waivers and/or expense reimbursement | | | 146.02% | (e) |
| Net investment income (loss) | | | 1.55% | (e) |
| Portfolio turnover rate(f) | | | 2% | |
| (a) | Commencement of offering. |
| (b) | Calculated based on average shares outstanding during the period. |
| (c) | Total return is calculated assuming a purchase of a share on the first day and a sale on the last day of each period reported and includes reinvestment of dividends and distributions, if any. Total returns may reflect adjustments to conform to generally accepted accounting principles. Total returns for periods less than one full year are not annualized. |
| (d) | Does not include expenses of the underlying funds in which the Fund invests. |
| (f) | The Fund’s portfolio turnover rate is calculated in accordance with regulatory requirements, without regard to transactions involving short term investments and certain derivatives. If such transactions were included, the Fund’s portfolio turnover rate may be higher. |
See Notes to Financial Statements.
| | | | |
| PGIM QMA Stock Index Fund | | | 61 | |
Report of Independent Registered Public Accounting Firm
The Board of Trustees and Shareholders
Prudential Investment Portfolios 8:
Opinion on the Financial Statements
We have audited the accompanying statement of assets and liabilities of PGIM QMA Stock Index Fund (formerly Prudential QMA Stock Index Fund) (the “Fund”), a series of Prudential Investment Portfolios 8, including the schedule of investments, as of September 30, 2018, the related statement of operations for the year then ended, the statements of changes in net assets for each of the years in the two-year period then ended, and the related notes (collectively, the financial statements) and the financial highlights for the years or periods indicated therein. In our opinion, the financial statements and financial highlights present fairly, in all material respects, the financial position of the Fund as of September 30, 2018, the results of its operations for the year then ended, the changes in its net assets for each of the years in the two-year period then ended, and the financial highlights for the years or periods indicated therein, in conformity with U.S. generally accepted accounting principles.
Basis for Opinion
These financial statements and financial highlights are the responsibility of the Fund’s management. Our responsibility is to express an opinion on these financial statements and financial highlights based on our audits. We are a public accounting firm registered with the Public Company Accounting Oversight Board (United States) (“PCAOB”) and are required to be independent with respect to the Fund in accordance with the U.S. federal securities laws and the applicable rules and regulations of the Securities and Exchange Commission and the PCAOB.
We conducted our audits in accordance with the standards of the PCAOB. Those standards require that we plan and perform the audit to obtain reasonable assurance about whether the financial statements and financial highlights are free of material misstatement, whether due to error or fraud. Our audits included performing procedures to assess the risks of material misstatement of the financial statements and financial highlights, whether due to error or fraud, and performing procedures that respond to those risks. Such procedures included examining, on a test basis, evidence regarding the amounts and disclosures in the financial statements and financial highlights. Such procedures also included confirmation of securities owned as of September 30, 2018, by correspondence with the custodians, transfer agents and brokers or by other appropriate auditing procedures when replies from brokers were not received. Our audits also included evaluating the accounting principles used and significant estimates made by management, as well as evaluating the overall presentation of the financial statements and financial highlights. We believe that our audits provide a reasonable basis for our opinion.

We have served as the auditor of one or more PGIM and/or Prudential Retail investment companies since 2003.
New York, New York
November 19, 2018
Tax Information (unaudited)
We are advising you that during the fiscal year ended September 30, 2018, the Fund reports the maximum amount allowed per share, but not less than $2.26 for Class A, C, I, Z and R6 shares as a capital gain distribution in accordance with Section 852(b)(3)(C) of the Internal Revenue Code.
For the year ended September 30, 2018, the Fund reports the maximum amount allowable under Section 854 of the Internal Revenue Code, but not less than, the following percentages of the ordinary income dividends paid as 1) qualified dividend income (QDI); and 2) eligible for corporate dividends received deduction (DRD):
| | | | | | | | |
| | | QDI | | | DRD | |
PGIM QMA Stock Index Fund | | | 100.00% | | | | 95.99% | |
In January 2019, you will be advised on IRS Form 1099-DIV or substitute 1099-DIV, as to the federal tax status of dividends and distributions received by you in calendar year 2018.
| | | | |
| PGIM QMA Stock Index Fund | | | 63 | |
INFORMATION ABOUT BOARD MEMBERS AND OFFICERS (unaudited)
Information about Board Members and Officers of the Fund is set forth below. Board Members who are not deemed to be “interested persons” of the Fund, as defined in the 1940 Act, are referred to as “Independent Board Members.” Board Members who are deemed to be “interested persons” of the Fund are referred to as “Interested Board Members.” The Board Members are responsible for the overall supervision of the operations of the Fund and perform the various duties imposed on the directors of investment companies by the 1940 Act. The Board in turn elects the Officers, who are responsible for administering the day-to-day operations of the Fund.
| | | | | | |
| Independent Board Members | | | | |
| | | | |
Name, Address, Age Position(s) Portfolios Overseen | | Principal Occupation(s) During Past Five Years | | Other Directorships Held During Past Five Years | | Length of Board Service |
| | | | |
Ellen S. Alberding (60) Board Member Portfolios Overseen: 93 | | President and Board Member, The Joyce Foundation (charitable foundation) (since 2002); Vice Chair, City Colleges of Chicago (community college system) (2011-2015); Trustee, National Park Foundation (charitable foundation for national park system) (2009-2018); Trustee, Economic Club of Chicago (since 2009); Trustee, Loyola University (since 2018). | | None. | | Since September 2013 |
| | | | |
Kevin J. Bannon (66) Board Member Portfolios Overseen: 93 | | Retired; Managing Director (April 2008-May 2015) and Chief Investment Officer (October 2008-November 2013) of Highmount Capital LLC (registered investment adviser); formerly Executive Vice President and Chief Investment Officer (April 1993-August 2007) of Bank of New York Company; President (May 2003-May 2007) of BNY Hamilton Family of Mutual Funds. | | Director of Urstadt Biddle Properties (equity real estate investment trust) (since September 2008). | | Since July 2008 |
| | | | |
Linda W. Bynoe (66) Board Member Portfolios Overseen: 93 | | President and Chief Executive Officer (since March 1995) and formerly Chief Operating Officer (December 1989-February 1995) of Telemat Ltd. (management consulting); formerly Vice President (January 1985-June 1989) at Morgan Stanley & Co. (broker-dealer). | | Director of Anixter International, Inc. (communication products distributor) (since January 2006); Director of Northern Trust Corporation (financial services) (since April 2006); Trustee of Equity Residential (residential real estate) (since December 2009). | | Since March 2005 |
PGIM QMA Stock Index Fund
| | | | | | |
Independent Board Members | | | | |
| | | | |
Name, Address, Age Position(s) Portfolios Overseen | | Principal Occupation(s) During Past Five Years | | Other Directorships Held During Past Five Years | | Length of Board Service |
| | | | |
Barry H. Evans (58) Board Member Portfolios Overseen: 92 | | Retired; formerly President (2005 – 2016), Global Chief Operating Officer (2014– 2016), Chief Investment Officer – Global Head of Fixed Income (1998-2014), and various portfolio manager roles (1986-2006), Manulife Asset Management U.S. | | Director, Manulife Trust Company (since 2011); formerly Director, Manulife Asset Management Limited (2015-2017); formerly Chairman of the Board of Directors of Manulife Asset Management U.S. (2005-2016); formerly Chairman of the Board, Declaration Investment Management and Research (2008-2016). | | Since September 2017 |
| | | | |
Keith F. Hartstein (62) Board Member & Independent Chair Portfolios Overseen: 93 | | Retired; Member (since November 2014) of the Governing Council of the Independent Directors Council (organization of independent mutual fund directors); formerly President and Chief Executive Officer (2005-2012), Senior Vice President (2004-2005), Senior Vice President of Sales and Marketing (1997-2004), and various executive management positions (1990-1997), John Hancock Funds, LLC (asset management); Chairman, Investment Company Institute’s Sales Force Marketing Committee (2003-2008). | | None. | | Since September 2013 |
Visit our website at pgiminvestments.com
| | | | | | |
| Independent Board Members | | | | |
| | | | |
Name, Address, Age Position(s) Portfolios Overseen | | Principal Occupation(s) During Past Five Years | | Other Directorships Held During Past Five Years | | Length of Board Service |
| | | | |
Laurie Simon Hodrick (56) Board Member Portfolios Overseen: 92 | | A. Barton Hepburn Professor Emerita of Economics in the Faculty of Business, Columbia Business School (since 2018); Visiting Professor of Law, Stanford Law School (since 2015); Visiting Fellow at the Hoover Institution, Stanford University (since 2015); Sole Member, ReidCourt LLC (since 2008) (a consulting firm); formerly A. Barton Hepburn Professor of Economics in the Faculty of Business, Columbia Business School (1996-2017); formerly Managing Director, Global Head of Alternative Investment Strategies, Deutsche Bank (2006-2008). | | Independent Director, Corporate Capital Trust (since April 2017) (a business development company); Independent Director, Kabbage, Inc. (since July 2018) (financial services). | | Since September 2017 |
| | | | |
Michael S. Hyland, CFA (73) Board Member Portfolios Overseen: 93 | | Retired (since February 2005); formerly Senior Managing Director (July 2001-February 2005) of Bear Stearns & Co, Inc.; Global Partner, INVESCO (1999-2001); Managing Director and President of Salomon Brothers Asset Management (1989-1999). | | None. | | Since July 2008 |
| | | | |
Richard A. Redeker (75) Board Member Portfolios Overseen: 93 | | Retired Mutual Fund Senior Executive (50 years); Management Consultant; Director, Mutual Fund Directors Forum (since 2014); Independent Directors Council (organization of independent mutual fund directors)-Executive Committee, Chair of Policy Steering Committee, Governing Council. | | None. | | Since October 1993 |
PGIM QMA Stock Index Fund
| | | | | | |
| Independent Board Members | | | | |
| | | | |
Name, Address, Age Position(s) Portfolios Overseen | | Principal Occupation(s) During Past Five Years | | Other Directorships Held During Past Five Years | | Length of Board Service |
| | | | |
Brian K. Reid (56)# Board Member Portfolios Overseen: 92 | | Retired; formerly Chief Economist for the Investment Company Institute (ICI) (2005-2017); formerly Senior Economist and Director of Industry and Financial Analysis at the ICI (1998-2004); formerly Senior Economist, Industry and Financial Analysis at the ICI (1996-1998); formerly Staff Economist at the Federal Reserve Board (1989-1996); Director, ICI Mutual Insurance Company (2012-2017). | | None. | | Since March 2018 |
| # | Mr. Reid joined the Board effective as of March 1, 2018. |
| | | | | | |
| Interested Board Members | | | | |
| | | | |
Name, Address, Age Position(s) Portfolios Overseen | | Principal Occupation(s) During Past Five Years | | Other Directorships Held During Past Five Years | | Length of
Board Service |
| | | | |
Stuart S. Parker (56) Board Member & President Portfolios Overseen: 93 | | President of PGIM Investments LLC (formerly known as Prudential Investments LLC) (since January 2012); Executive Vice President of Prudential Investment Management Services LLC (since December 2012); formerly Executive Vice President of Jennison Associates LLC and Head of Retail Distribution of PGIM Investments LLC (June 2005-December 2011). | | None. | | Since January 2012 |
Visit our website at pgiminvestments.com
| | | | | | |
| Interested Board Members | | | | |
| | | | |
Name, Address, Age Position(s) Portfolios Overseen | | Principal Occupation(s) During Past Five Years | | Other Directorships Held During Past Five Years | | Length of Board Service |
| | | | |
Scott E. Benjamin (45) Board Member & Vice President Portfolios Overseen:93 | | Executive Vice President (since June 2009) of PGIM Investments LLC; Executive Vice President (June 2009-June 2012) and Vice President (since June 2012) of Prudential Investment Management Services LLC; Executive Vice President (since September 2009) of AST Investment Services, Inc.; Senior Vice President of Product Development and Marketing, PGIM Investments (since February 2006); formerly Vice President of Product Development and Product Management, PGIM Investments LLC (2003-2006). | | None. | | Since March 2010 |
| | | | |
Grace C. Torres* (59) Board Member Portfolios Overseen: 92 | | Retired; formerly Treasurer and Principal Financial and Accounting Officer of the PGIM Funds, Target Funds, Advanced Series Trust, Prudential Variable Contract Accounts and The Prudential Series Fund (1998-June 2014); Assistant Treasurer (March 1999-June 2014) and Senior Vice President (September 1999-June 2014) of PGIM Investments LLC; Assistant Treasurer (May 2003-June 2014) and Vice President (June 2005-June 2014) of AST Investment Services, Inc.; Senior Vice President and Assistant Treasurer (May 2003-June 2014) of Prudential Annuities Advisory Services, Inc. | | Formerly Director (July 2015-January 2018) of Sun Bancorp, Inc. N.A. and Sun National Bank; Director (since January 2018) of OceanFirst Financial Corp. and OceanFirst Bank. | | Since November 2014 |
* Note: Prior to her retirement in 2014, Ms. Torres was employed by PGIM Investments LLC. Due to her prior employment, she is considered to be an “interested person” under the 1940 Act. Ms. Torres is a Non-Management Interested Board Member.
PGIM QMA Stock Index Fund
| | | | |
| Fund Officers(a) | | | | |
| | | |
Name, Address and Age Position with Fund | | Principal Occupation(s) During Past Five Years | | Length of Service as Fund Officer |
| | | |
Raymond A. O’Hara (63) Chief Legal Officer | | Vice President and Corporate Counsel (since July 2010) of Prudential Insurance Company of America (Prudential); Vice President (March 2011-Present) of Pruco Life Insurance Company and Pruco Life Insurance Company of New Jersey; Vice President and Corporate Counsel (March 2011-Present) of Prudential Annuities Life Assurance Corporation; Chief Legal Officer of PGIM Investments LLC (since June 2012); Chief Legal Officer of Prudential Mutual Fund Services LLC (since June 2012) and Corporate Counsel of AST Investment Services, Inc. (since June 2012); formerly Assistant Vice President and Corporate Counsel (September 2008-July 2010) of The Hartford Financial Services Group, Inc.; formerly Associate (September 1980-December 1987) and Partner (January 1988–August 2008) of Blazzard & Hasenauer, P.C. (formerly, Blazzard, Grodd & Hasenauer, P.C.). | | Since June 2012 |
| | | |
Chad A. Earnst (43) Chief Compliance Officer | | Chief Compliance Officer (September 2014-Present) of PGIM Investments LLC; Chief Compliance Officer (September 2014-Present) of the PGIM Funds, Target Funds, Advanced Series Trust, The Prudential Series Fund, Prudential’s Gibraltar Fund, Inc., PGIM Global Short Duration High Yield Income Fund, Inc., PGIM Short Duration High Yield Fund, Inc. and PGIM Jennison MLP Income Fund, Inc.; formerly Assistant Director (March 2010-August 2014) of the Asset Management Unit, Division of Enforcement, US Securities & Exchange Commission; Assistant Regional Director (January 2010-August 2014), Branch Chief (June 2006–December 2009) and Senior Counsel (April 2003-May 2006) of the Miami Regional Office, Division of Enforcement, US Securities & Exchange Commission. | | Since September 2014 |
| | | |
Dino Capasso (44) Deputy Chief Compliance Officer | | Vice President and Deputy Chief Compliance Officer (June 2017-Present) of PGIM Investments LLC; formerly, Senior Vice President and Senior Counsel (January 2016-June 2017), and Vice President and Counsel (February 2012-December 2015) of Pacific Investment Management Company LLC. | | Since March 2018 |
| | | |
Andrew R. French (55) Secretary | | Vice President and Corporate Counsel (since February 2010) of Prudential; formerly Director and Corporate Counsel (2006-2010) of Prudential; Vice President and Assistant Secretary (since January 2007) of PGIM Investments LLC; Vice President and Assistant Secretary (since January 2007) of Prudential Mutual Fund Services LLC. | | Since October 2006 |
Visit our website at pgiminvestments.com
| | | | |
| Fund Officers(a) | | | | |
| | | |
Name, Address and Age Position with Fund | | Principal Occupation(s) During Past Five Years | | Length of Service as Fund Officer |
| | | |
Jonathan D. Shain (60) Assistant Secretary | | Vice President and Corporate Counsel (since August 1998) of Prudential; Vice President and Assistant Secretary (since May 2001) of PGIM Investments LLC; Vice President and Assistant Secretary (since February 2001) of Prudential Mutual Fund Services LLC; formerly Vice President and Assistant Secretary (May 2003-June 2005) of AST Investment Services, Inc. | | Since May 2005 |
| | | |
Claudia DiGiacomo (44) Assistant Secretary | | Vice President and Corporate Counsel (since January 2005) of Prudential; Vice President and Assistant Secretary of PGIM Investments LLC (since December 2005); formerly Associate at Sidley Austin Brown & Wood LLP (1999-2004). | | Since December 2005 |
| | | |
Charles H. Smith (45) Anti-Money Laundering Compliance Officer | | Vice President, Corporate Compliance, Anti-Money Laundering Unit (since January 2015) of Prudential; committee member of the American Council of Life Insurers Anti-Money Laundering and Critical Infrastructure Committee (since January 2016); formerly Global Head of Economic Sanctions Compliance at AIG Property Casualty (February 2007 – December 2014); Assistant Attorney General at the New York State Attorney General’s Office, Division of Public Advocacy. (August 1998 —January 2007). | | Since January 2017 |
| | | |
Brian D. Nee (52) Treasurer and Principal Financial and Accounting Officer | | Vice President and Head of Finance of PGIM Investments LLC (since August 2015) and PGIM Global Partners (since February 2017); formerly, Vice President, Treasurer’s Department of Prudential (September 2007-August 2015). | | Since July 2018 |
| | | |
Peter Parrella (60) Assistant Treasurer | | Vice President (since 2007) and Director (2004-2007) within Prudential Mutual Fund Administration; formerly Tax Manager at SSB Citi Fund Management LLC (1997-2004). | | Since June 2007 |
| | | |
Lana Lomuti (51) Assistant Treasurer | | Vice President (since 2007) and Director (2005-2007), within Prudential Mutual Fund Administration; formerly Assistant Treasurer (December 2007-February 2014) of The Greater China Fund, Inc. | | Since April 2014 |
| | | |
Linda McMullin (57) Assistant Treasurer | | Vice President (since 2011) and Director (2008-2011) within Prudential Mutual Fund Administration. | | Since April 2014 |
| | | |
Kelly A. Coyne (50) Assistant Treasurer | | Director, Investment Operations of Prudential Mutual Fund Services LLC (since 2010). | | Since March 2015 |
(a) Excludes Mr. Parker and Mr. Benjamin, interested Board Members who also serve as President and Vice President, respectively.
Explanatory Notes to Tables:
| ∎ | | Board Members are deemed to be “Interested,” as defined in the 1940 Act, by reason of their affiliation with PGIM Investments LLC and/or an affiliate of PGIM Investments LLC. |
| ∎ | | Unless otherwise noted, the address of all Board Members and Officers is c/o PGIM Investments LLC, 655 Broad Street, Newark, New Jersey 07102-4410. |
| ∎ | | There is no set term of office for Board Members or Officers. The Board Members have adopted a retirement policy, which calls for the retirement of Board Members on December 31 of the year in which they reach the age of 75. |
PGIM QMA Stock Index Fund
| ∎ | | “Other Directorships Held” includes only directorships of companies required to register or file reports with the SEC under the 1934 Act (that is, “public companies”) or other investment companies registered under the 1940 Act. |
| ∎ | | “Portfolios Overseen” includes all investment companies managed by PGIM Investments LLC. The investment companies for which PGIM Investments LLC serves as manager include the PGIM Funds, The Prudential Variable Contract Accounts, PGIM ETF Trust, PGIM Short Duration High Yield Fund, Inc., PGIM Global Short Duration High Yield Fund, Inc., The Prudential Series Fund, Prudential’s Gibraltar Fund, Inc. and the Advanced Series Trust. |
Visit our website at pgiminvestments.com
Approval of Advisory Agreements (unaudited)
The Fund’s Board of Trustees
The Board of Trustees (the “Board”) of PGIM QMA Stock Index Fund (the “Fund”)1 consists of twelve individuals, nine of whom are not “interested persons” of the Fund, as defined in the Investment Company Act of 1940, as amended (the “1940 Act”) (the “Independent Trustees”). The Board is responsible for the oversight of the Fund and its operations, and performs the various duties imposed on the directors of investment companies by the 1940 Act. The Independent Trustees have retained independent legal counsel to assist them in connection with their duties. The Chair of the Board is an Independent Trustee. The Board has established four standing committees: the Audit Committee, the Nominating and Governance Committee, and two Investment Committees. Each committee is chaired by, and composed of, Independent Trustees.
Annual Approval of the Fund’s Advisory Agreements
As required under the 1940 Act, the Board determines annually whether to renew the Fund’s management agreement with PGIM Investments LLC (“PGIM Investments”) and the Fund’s subadvisory agreement with Quantitative Management Associates LLC (“QMA”). In considering the renewal of the agreements, the Board, including all of the Independent Trustees, met on June 7, 2018 and on June 19-21, 2018 and approved the renewal of the agreements through July 31, 2019, after concluding that the renewal of the agreements was in the best interests of the Fund and its shareholders.
In advance of the meetings, the Board requested and received materials relating to the agreements, and had the opportunity to ask questions and request further information in connection with its consideration. Among other things, the Board considered comparative fee information from PGIM Investments and QMA. Also, the Board considered comparisons with other mutual funds in relevant Peer Universes and Peer Groups, as is further discussed below.
In approving the agreements, the Board, including the Independent Trustees advised by independent legal counsel, considered the factors it deemed relevant, including the nature, quality and extent of services provided by PGIM Investments and the subadviser, the performance of the Fund, the profitability of PGIM Investments and its affiliates, expenses and fees, and the potential for economies of scale that may be shared with the Fund and its shareholders as the Fund’s assets grow. In their deliberations, the Trustees did not identify any single factor which alone was responsible for the Board’s decision to approve the agreements with respect to the Fund. In connection with its deliberations, the Board considered information provided by PGIM Investments throughout the year at regular Board meetings, presentations from portfolio managers and other information, as well as information furnished at or in advance of the meetings on June 7, 2018 and on June 19-21, 2018.
| 1 | PGIM QMA Stock Index Fund is the sole outstanding series of Prudential Investment Portfolios 8. |
| | |
| PGIM QMA Stock Index Fund |
Approval of Advisory Agreements (continued)
The Trustees determined that the overall arrangements between the Fund and PGIM Investments, which serves as the Fund’s investment manager pursuant to a management agreement, and between PGIM Investments and QMA, which serves as the Fund’s subadviser pursuant to the terms of a subadvisory agreement with PGIM Investments, are in the best interests of the Fund and its shareholders in light of the services performed, fees charged and such other matters as the Trustees considered relevant in the exercise of their business judgment.
The material factors and conclusions that formed the basis for the Trustees’ reaching their determinations to approve the continuance of the agreements are separately discussed below.
Nature, Quality and Extent of Services
The Board received and considered information regarding the nature, quality and extent of services provided to the Fund by PGIM Investments and QMA. The Board considered the services provided by PGIM Investments, including but not limited to the oversight of the subadviser for the Fund, as well as the provision of fund recordkeeping, compliance, and other services to the Fund. With respect to PGIM Investments’ oversight of the subadviser, the Board noted that PGIM Investments’ Strategic Investment Research Group (“SIRG”), which is a business unit of PGIM Investments, is responsible for monitoring and reporting to PGIM Investments’ senior management on the performance and operations of the subadviser. The Board also considered that PGIM Investments pays the salaries of all of the officers and interested Trustees of the Fund who are part of Fund management. The Board also considered the investment subadvisory services provided by QMA, including investment research and security selection, as well as adherence to the Fund’s investment restrictions and compliance with applicable Fund policies and procedures. The Board considered PGIM Investments’ evaluation of the subadviser, as well as PGIM Investments’ recommendation, based on its review of the subadviser, to renew the subadvisory agreement.
The Board considered the qualifications, backgrounds and responsibilities of PGIM Investments’ senior management responsible for the oversight of the Fund and QMA, and also considered the qualifications, backgrounds and responsibilities of QMA’s portfolio managers who are responsible for the day-to-day management of the Fund’s portfolio. The Board was provided with information pertaining to PGIM Investments’ and QMA’s organizational structure, senior management, investment operations, and other relevant information pertaining to both PGIM Investments and QMA. The Board also noted that it received favorable compliance reports from the Fund’s Chief Compliance Officer (“CCO”) as to both PGIM Investments and QMA. The Board noted that QMA is affiliated with PGIM Investments.
The Board concluded that it was satisfied with the nature, extent and quality of the investment management services provided by PGIM Investments and the subadvisory
| | |
| Visit our website at pgiminvestments.com | | |
services provided to the Fund by QMA, and that there was a reasonable basis on which to conclude that the Fund benefits from the services provided by PGIM Investments and QMA under the management and subadvisory agreements.
Costs of Services and Profits Realized by PGIM Investments
The Board was provided with information on the profitability of PGIM Investments and its affiliates in serving as the Fund’s investment manager. The Board discussed with PGIM Investments the methodology utilized in assembling the information regarding profitability and considered its reasonableness. The Board recognized that it is difficult to make comparisons of profitability from fund management contracts because comparative information is not generally publicly available and is affected by numerous factors, including the structure of the particular adviser, the types of funds it manages, its business mix, numerous assumptions regarding allocations and the adviser’s capital structure and cost of capital. However, the Board considered that the cost of services provided by PGIM Investments during the year ended December 31, 2017 exceeded the management fees received by PGIM Investments, resulting in an operating loss to PGIM Investments. Taking these factors into account, the Board concluded that the profitability of PGIM Investments and its affiliates in relation to the services rendered was not unreasonable.
Economies of Scale
The Board received and discussed information concerning economies of scale that PGIM Investments may realize as the Fund’s assets grow beyond current levels. The Board noted that the management fee schedule for the Fund includes breakpoints, which have the effect of decreasing the fee rate as assets increase. During the course of time, the Board has considered information regarding the launch date of the Fund, the management fees of the Fund compared to those of similarly managed funds and PGIM Investments investment in the Fund over time. The Board noted that economies of scale can be shared with the Fund in other ways, including low management fees from inception, additional technological and personnel investments to enhance shareholder services, and maintaining existing expense structures in the face of a rising cost environment. The Board also considered PGIM Investments’ assertion that it continually evaluates the management fee schedule of the Fund and the potential to share economies of scale through breakpoints or fee waivers as asset levels increase.
The Board recognized the inherent limitations of any analysis of economies of scale, stemming largely from the Board’s understanding that most of PGIM Investments’ costs are not specific to individual funds, but rather are incurred across a variety of products and services.
| | |
| PGIM QMA Stock Index Fund |
Approval of Advisory Agreements (continued)
Other Benefits to PGIM Investments and QMA
The Board considered potential ancillary benefits that might be received by PGIM Investments and QMA and their affiliates as a result of their relationship with the Fund. The Board concluded that potential benefits to be derived by PGIM Investments included transfer agency fees received by the Fund’s transfer agent (which is affiliated with PGIM Investments), and benefits to its reputation as well as other intangible benefits resulting from PGIM Investments’ association with the Fund. The Board concluded that the potential benefits to be derived by QMA included its ability to use soft dollar credits, as well as the potential benefits consistent with those generally resulting from an increase in assets under management, specifically, potential access to additional research resources and benefits to its reputation. The Board concluded that the benefits derived by PGIM Investments and QMA were consistent with the types of benefits generally derived by investment managers and subadvisers to mutual funds.
Performance of the Fund / Fees and Expenses
The Board considered certain additional specific factors and made related conclusions relating to the historical performance of the Fund for the one-, three-, five- and ten-year periods ended December 31, 2017.
The Board also considered the Fund’s actual management fee, as well as the Fund’s net total expense ratio, for the fiscal year ended September 30, 2017. The Board considered the management fee for the Fund as compared to the management fee charged by PGIM Investments to other funds and the fee charged by other advisers to comparable mutual funds in a Peer Group. The actual management fee represents the fee rate actually paid by Fund shareholders and includes any fee waivers or reimbursements. The net total expense ratio for the Fund represents the actual expense ratio incurred by Fund shareholders.
The mutual funds included in the Peer Universe, which was used to consider performance, and the Peer Group, which was used to consider fees and expenses, were objectively determined by Broadridge, an independent provider of mutual fund data. In certain circumstances, PGIM Investments also may have provided supplemental Peer Universe or Peer Group information for reasons addressed with the Board. The comparisons placed the Fund in various quartiles, with the first quartile being the best 25% of the mutual funds (for performance, the best performing mutual funds and, for expenses, the lowest cost mutual funds).
The section below summarizes key factors considered by the Board and the Board’s conclusions regarding the Fund’s performance, fees and overall expenses. The table sets forth gross performance comparisons (which do not reflect the impact on performance of fund expenses, or any subsidies, expense caps or waivers that may be applicable) with the
| | |
| Visit our website at pgiminvestments.com | | |
Peer Universe, actual management fees with the Peer Group (which reflect the impact of any subsidies or fee waivers), and net total expenses with the Peer Group, each of which were key factors considered by the Board.
| | | | | | | | |
| Gross Performance | | 1 Year | | 3 Years | | 5 Years | | 10 Years |
| | | 2nd Quartile | | 1st Quartile | | 1st Quartile | | 1st Quartile |
| Actual Management Fees: 1st Quartile |
| Net Total Expenses: 1st Quartile |
| • | | The Board noted that the Fund outperformed its benchmark index over all periods. |
| • | | The Board and PGIM Investments agreed to retain the existing management fee waiver so that the effective management fee rate is 0.08% though January 31, 2019. |
| • | | The Board and PGIM Investments also agreed to continue the existing expense cap, which (exclusive of certain fees and expenses) caps transfer agency, shareholder servicing, sub-transfer agency and blue sky fees to the extent that such fees cause total annual fund operating expenses to exceed 0.18% for Class R6 shares through January 31, 2020. |
| • | | The Board concluded that, in light of the above, it would be in the best interests of the Fund and its shareholders to renew the agreements. |
| • | | The Board concluded that the management fees (including subadvisory fees) and total expenses were reasonable in light of the services provided. |
* * *
After full consideration of these factors, the Board concluded that the approval of the agreements was in the best interests of the Fund and its shareholders.
| | |
| PGIM QMA Stock Index Fund |
| | | | |
| ∎ MAIL | | ∎ TELEPHONE | | ∎ WEBSITE |
655 Broad Street Newark, NJ 07102 | | (800) 225-1852 | | www.pgiminvestments.com |
|
| PROXY VOTING |
| The Board of Trustees of the Fund has delegated to the Fund’s investment subadviser the responsibility for voting any proxies and maintaining proxy recordkeeping with respect to the Fund. A description of these proxy voting policies and procedures is available without charge, upon request, by calling (800) 225-1852. Information regarding how the Fund voted proxies relating to portfolio securities during the most recent 12-month period ended June 30 is available on the Fund’s website and on the Securities and Exchange Commission’s website. |
|
| TRUSTEES |
| Ellen S. Alberding • Kevin J. Bannon • Scott E. Benjamin • Linda W. Bynoe • Barry H. Evans • Keith F. Hartstein • Laurie Simon Hodrick • Michael S. Hyland • Stuart S. Parker • Richard A. Redeker • Brian K. Reid • Grace C. Torres |
|
| OFFICERS |
| Stuart S. Parker, President • Scott E. Benjamin, Vice President • Brian D. Nee, Treasurer and Principal Financial and Accounting Officer • Raymond A. O’Hara, Chief Legal Officer • Andrew R. French, Secretary • Chad A. Earnst, Chief Compliance Officer • Dino Capasso, Vice President and Deputy Chief Compliance Officer • Charles H. Smith, Anti-Money Laundering Compliance Officer • Jonathan D. Shain, Assistant Secretary • Claudia DiGiacomo, Assistant Secretary • Peter Parrella, Assistant Treasurer • Lana Lomuti, Assistant Treasurer • Linda McMullin, Assistant Treasurer • Kelly A. Coyne, Assistant Treasurer |
| | | | |
| MANAGER | | PGIM Investments LLC | | 655 Broad Street
Newark, NJ 07102 |
|
| INVESTMENT SUBADVISER | | Quantitative Management Associates LLC | | Gateway Center Two 100 Mulberry Street
Newark, NJ 07102 |
|
| DISTRIBUTOR | | Prudential Investment Management Services LLC | | 655 Broad Street
Newark, NJ 07102 |
|
| CUSTODIAN | | The Bank of New York Mellon | | 225 Liberty Street
New York, NY 10286 |
|
| TRANSFER AGENT | | Prudential Mutual Fund Services LLC | | PO Box 9658 Providence, RI 02940 |
|
| INDEPENDENT REGISTERED PUBLIC ACCOUNTING FIRM | | KPMG LLP | | 345 Park Avenue New York, NY 10154 |
|
| FUND COUNSEL | | Willkie Farr & Gallagher LLP | | 787 Seventh Avenue New York, NY 10019 |
|
|
| An investor should consider the investment objectives, risks, charges, and expenses of the Fund carefully before investing. The prospectus and summary prospectus contain this and other information about the Fund. An investor may obtain a prospectus and summary prospectus by visiting our website at www.pgiminvestments.com or by calling (800) 225-1852. The prospectus and summary prospectus should be read carefully before investing. |
|
| E-DELIVERY |
| To receive your mutual fund documents online, go to www.pgiminvestments.com/edelivery and enroll. Instead of receiving printed documents by mail, you will receive notification via email when new materials are available. You can cancel your enrollment or change your email address at any time by visiting the website address above. |
|
| SHAREHOLDER COMMUNICATIONS WITH TRUSTEES |
| Shareholders can communicate directly with the Board of Trustees by writing to the Chair of the Board, PGIM QMA Stock Index Fund, PGIM Investments, Attn: Board of Trustees, 655 Broad Street, Newark, NJ 07102. Shareholders can communicate directly with an individual Trustee by writing to the same address. Communications are not screened before being delivered to the addressee. |
|
| AVAILABILITY OF PORTFOLIO SCHEDULE |
| The Fund files its complete schedule of portfolio holdings with the Securities and Exchange Commission for the first and third quarters of each fiscal year on Form N-Q. The Fund’s Forms N-Q are available on the Commission’s website at www.sec.gov. The Fund’s schedule of portfolio holdings is also available on the Fund’s website as of the end of each month no sooner than 15 days after the end of the month. |
|
| The Fund’s Statement of Additional Information contains additional information about the Fund’s Trustees and is available without charge upon request by calling (800) 225-1852. |
Mutual Funds:
| | | | |
ARE NOT INSURED BY THE FDIC OR ANY
FEDERAL GOVERNMENT AGENCY | | MAY LOSE VALUE | | ARE NOT A DEPOSIT OF OR GUARANTEED
BY ANY BANK OR ANY BANK AFFILIATE |
PGIM QMA STOCK INDEX FUND
| | | | | | | | | | | | |
| | | SHARE CLASS | | A | | C | | I | | Z | | R6* |
| | NASDAQ | | PSIAX | | PSICX | | PDSIX | | PSIFX | | PQSIX |
| | CUSIP | | 74441F108 | | 74441F306 | | 74441F405 | | 74441F504 | | 74441F702 |
* Formerly known as Class Q shares.
MF174 E
Item 2 – Code of Ethics – – See Exhibit (a)
As of the end of the period covered by this report, the registrant has adopted a code of ethics (the “Section 406 Standards for Investment Companies – Ethical Standards for Principal Executive and Financial Officers”) that applies to the registrant’s Principal Executive Officer and Principal Financial Officer; the registrant’s Principal Financial Officer also serves as the Principal Accounting Officer.
The registrant hereby undertakes to provide any person, without charge, upon request, a copy of the code of ethics. To request a copy of the code of ethics, contact the registrant 800-225-1852, and ask for a copy of the Section 406 Standards for Investment Companies - Ethical Standards for Principal Executive and Financial Officers.
Item 3 – Audit Committee Financial Expert –
The registrant’s Board has determined that Mr. Kevin J. Bannon, member of the Board’s Audit Committee is an “audit committee financial expert,” and that he is “independent,” for purposes of this Item.
Item 4 – Principal Accountant Fees and Services –
(a) Audit Fees
For the fiscal years ended September 30, 2018 and September 30, 2017, KPMG LLP (“KPMG”), the Registrant’s principal accountant, billed the Registrant $24,352 and $26,574 respectively, for professional services rendered for the audit of the Registrant’s annual financial statements or services that are normally provided in connection with statutory and regulatory filings.
(b) Audit-Related Fees
For the fiscal years ended September 30, 2018 and September 30, 2017: none.
(c) Tax Fees
For the fiscal years ended September 30, 2018 and September 30, 2017: none.
(d) All Other Fees
For the fiscal years ended September 30, 2018 and September 30, 2017: none.
(e) (1) Audit Committee Pre-Approval Policies and Procedures
THE PRUDENTIAL MUTUAL FUNDS
AUDIT COMMITTEE POLICY
on
Pre-Approval of Services Provided by the Independent Accountants
The Audit Committee of each Prudential Mutual Fund is charged with the responsibility to monitor the independence of the Fund’s independent accountants. As part of this responsibility, the Audit Committee must pre-approve the independent accounting firm’s engagement to render audit and/or permissible non-audit services, as required by law. In evaluating a proposed engagement of the independent accountants, the Audit Committee will assess the effect that the engagement might reasonably be expected to have on the accountant’s independence. The Committee’s evaluation will be based on:
| | ● | | a review of the nature of the professional services expected to be provided, |
| | ● | | a review of the safeguards put into place by the accounting firm to safeguard independence, and |
| | ● | | periodic meetings with the accounting firm. |
Policy for Audit and Non-Audit Services Provided to the Funds
On an annual basis, the scope of audits for each Fund, audit fees and expenses, and audit-related and non-audit services (and fees proposed in respect thereof) proposed to be performed by the Fund’s independent accountants will be presented by the Treasurer and the independent accountants to the Audit Committee for review and, as appropriate, approval prior to the initiation of such services. Such presentation shall be accompanied by confirmation by both the Treasurer and the independent accountants that the proposed non-audit services will not adversely affect the independence of the independent accountants. Such proposed non-audit services shall be described in sufficient detail to enable the Audit Committee to assess the appropriateness of such services and fees, and the compatibility of the provision of such services with the auditor’s independence. The Committee shall receive periodic reports on the progress of the audit and other services which are approved by the Committee or by the Committee Chair pursuant to authority delegated in this Policy.
The categories of services enumerated under “Audit Services”, “Audit-related Services”, and “Tax Services” are intended to provide guidance to the Treasurer and the independent accountants as to those categories of services which the Committee believes are generally consistent with the independence of the independent accountants and which the Committee (or the Committee Chair) would expect upon the presentation of specific proposals to pre-approve. The enumerated categories are not intended as an exclusive list of audit, audit-related or tax services, which the Committee (or the Committee Chair) would consider for pre-approval.
Audit Services
The following categories of audit services are considered to be consistent with the role of the Fund’s independent accountants:
| | Ø | Annual Fund financial statement audits |
| | Ø | Seed audits (related to new product filings, as required) |
| | Ø | SEC and regulatory filings and consents |
Audit-related Services
The following categories of audit-related services are considered to be consistent with the role of the Fund’s independent accountants:
| | Ø | Accounting consultations |
| | Ø | Fund merger support services |
| | Ø | Agreed Upon Procedure Reports |
| | Ø | Other Internal Control Reports |
Individual audit-related services that fall within one of these categories (except for fund merger support services) and are not presented to the Audit Committee as part of the annual pre-approval process are subject to an authorized pre-approval by the Audit Committee so long as the estimated fee for those services does not exceed $30,000. Any services provided under such pre-approval will be reported to the Audit Committee at its next regular meeting. Should the amount of such services exceed $30,000 any additional fees will be subject to pre-approval by the Committee Chair (or any other Committee member on whom this responsibility has been delegated). Fees related to fund merger support services are subject to a separate authorized pre-approval by the Audit Committee with fees determined on a per occurrence and merger complexity basis.
Tax Services
The following categories of tax services are considered to be consistent with the role of the Fund’s independent accountants:
| | Ø | Tax compliance services related to the filing or amendment of the following: |
| | ◾ | Federal, state and local income tax compliance; and, |
| | ◾ | Sales and use tax compliance |
| | Ø | Timely RIC qualification reviews |
| | Ø | Tax distribution analysis and planning |
| | Ø | Tax authority examination services |
| | Ø | Tax appeals support services |
| | Ø | Accounting methods studies |
| | Ø | Fund merger support services |
| | Ø | Tax consulting services and related projects |
Individual tax services that fall within one of these categories and are not presented to the Audit Committee as part of the annual pre-approval process are subject to an authorized pre-approval by the Audit Committee so long as the estimated fee for those services does not exceed $30,000. Any services provided under such pre-approval will be reported to the Audit Committee at its next regular meeting. Should the amount of such services exceed $30,000 any additional fees will be subject to pre-approval by the Committee Chair (or any other Committee member on whom this responsibility has been delegated).
Other Non-Audit Services
Certain non-audit services that the independent accountants are legally permitted to render will be subject to pre-approval by the Committee or by one or more Committee members to whom the Committee has delegated this authority and who will report to the full Committee any pre-approval decisions made pursuant to this Policy. Non-audit services presented for pre-approval pursuant to this paragraph will be accompanied by a confirmation from both the Treasurer and the independent accountants that the proposed services will not adversely affect the independence of the independent accountants.
Proscribed Services
The Fund’s independent accountants will not render services in the following categories of non-audit services:
| | Ø | Bookkeeping or other services related to the accounting records or financial statements of the Fund |
| | Ø | Financial information systems design and implementation |
| | Ø | Appraisal or valuation services, fairness opinions, or contribution-in-kind reports |
| | Ø | Internal audit outsourcing services |
| | Ø | Management functions or human resources |
| | Ø | Broker or dealer, investment adviser, or investment banking services |
| | Ø | Legal services and expert services unrelated to the audit |
Ø Any other service that the Public Company Accounting Oversight Board determines, by regulation, is impermissible.
Pre-approval of Non-Audit Services Provided to Other Entities Within the Prudential Fund Complex
Certain non-audit services provided to PGIM Investments LLC or any of its affiliates that also provide ongoing services to the Prudential Mutual Funds will be subject to pre-approval by the Audit Committee. The only non-audit services provided to these entities that will require pre-approval are those related directly to the operations and financial reporting of the Funds. Individual projects that are not presented to the Audit Committee as part of the annual pre-approval process will be subject to pre-approval by the Committee Chair (or any other Committee member on whom this responsibility has been delegated) so long as the estimated fee for those services does not exceed $30,000. Services presented for pre-approval pursuant to this paragraph will be accompanied by a confirmation from both the Treasurer and the independent accountants that the proposed services will not adversely affect the independence of the independent accountants.
Although the Audit Committee will not pre-approve all services provided to PGIM Investments LLC and its affiliates, the Committee will receive an annual report from the Fund’s independent accounting firm showing the aggregate fees for all services provided to PGIM Investments and its affiliates.
(e) (2) Percentage of services referred to in 4(b) – 4(d) that were approved by the audit committee –
For the fiscal years ended September 30, 2018 and September 30, 2017: none.
(f) Percentage of hours expended attributable to work performed by other than full time employees of principal accountant if greater than 50%.
The percentage of hours expended on the principal accountant’s engagement to audit the registrant’s financial statements for the most recent fiscal year that were attributed to work performed by persons other than the principal accountant’s full-time, permanent employees was 0%.
(g) Non-Audit Fees
The aggregate non-audit fees billed by KPMG for services rendered to the registrant’s investment adviser and any entity controlling, controlled by, or under common control with the investment adviser that provides ongoing services to the registrant for the fiscal years ended September 30, 2018 and September 30, 2017 was $0 and $0, respectively.
(h) Principal Accountant’s Independence
Not applicable as KPMG has not provided non-audit services to the registrant’s investment adviser and any entity controlling, controlled by, or under common control with the investment adviser that provides ongoing services to the registrant that were not pre-approved pursuant to Rule 2-01(c)(7)(ii) of Regulation S-X.
| | | | |
| Item 5 | | – | | Audit Committee of Listed Registrants – Not applicable. |
| | |
| Item 6 | | – | | Schedule of Investments – The schedule is included as part of the report to shareholders filed under Item 1 of this Form. |
| | |
| Item 7 | | – | | Disclosure of Proxy Voting Policies and Procedures for Closed-End Management Investment Companies – Not applicable. |
| | |
| Item 8 | | – | | Portfolio Managers of Closed-End Management Investment Companies – Not applicable. |
| | |
| Item 9 | | – | | Purchases of Equity Securities by Closed-End Management Investment Company and Affiliated Purchasers – Not applicable. |
| | | | |
| | |
| Item 10 | | – | | Submission of Matters to a Vote of Security Holders – Not applicable. |
| | |
| Item 11 | | – | | Controls and Procedures |
| | (a) | It is the conclusion of the registrant’s principal executive officer and principal financial officer that the effectiveness of the registrant’s current disclosure controls and procedures (such disclosure controls and procedures having been evaluated within 90 days of the date of this filing) provide reasonable assurance that the information required to be disclosed by the registrant has been recorded, processed, summarized and reported within the time period specified in the Commission’s rules and forms and that the information required to be disclosed by the registrant has been accumulated and communicated to the registrant’s principal executive officer and principal financial officer in order to allow timely decisions regarding required disclosure. |
| | (b) | There has been no significant change in the registrant’s internal control over financial reporting that occurred during the registrant’s most recent fiscal quarter of the period covered by this report that has materially affected, or is likely to materially affect, the registrant’s internal control over financial reporting. |
| | | | |
| (a) | | (1) | | Code of Ethics – Attached hereto as Exhibit EX-99.CODE-ETH |
| | |
| | (2) | | Certifications pursuant to Section 302 of the Sarbanes-Oxley Act – Attached hereto as Exhibit EX-99.CERT. |
| | |
| | (3) | | Any written solicitation to purchase securities under Rule 23c-1. – Not applicable. |
| |
| (b) | | Certifications pursuant to Section 906 of the Sarbanes-Oxley Act – Attached hereto as Exhibit EX-99.906CERT. |
SIGNATURES
Pursuant to the requirements of the Securities Exchange Act of 1934 and the Investment Company Act of 1940, the registrant has duly caused this report to be signed on its behalf by the undersigned, thereunto duly authorized.
| | |
| Registrant: | | Prudential Investment Portfolios 8 |
| |
| By: | | /s/ Andrew R. French |
| | Andrew R. French |
| | Secretary |
| |
| Date: | | November 19, 2018 |
Pursuant to the requirements of the Securities Exchange Act of 1934 and the Investment Company Act of 1940, this report has been signed below by the following persons on behalf of the registrant and in the capacities and on the dates indicated.
| | |
| By: | | /s/ Stuart S. Parker |
| | Stuart S. Parker |
| | President and Principal Executive Officer |
| |
| Date: | | November 19, 2018 |
| |
| By: | | /s/ Brian D. Nee |
| | Brian D. Nee |
| | Treasurer and Principal Financial and Accounting Officer |
| |
| Date: | | November 19, 2018 |