UNITED STATES
SECURITIES AND EXCHANGE COMMISSION
Washington, D.C. 20549
FORMN-CSR
CERTIFIED SHAREHOLDER REPORT OF REGISTERED MANAGEMENT INVESTMENT COMPANIES
| | |
| Investment Company Act file number: | | 811-06677 |
| |
| Exact name of registrant as specified in charter: | | Prudential Investment Portfolios 8 |
| |
| Address of principal executive offices: | | 655 Broad Street, 17th Floor |
| | Newark, New Jersey 07102 |
| |
| Name and address of agent for service: | | Andrew R. French |
| | 655 Broad Street, 17th Floor |
| | Newark, New Jersey 07102 |
| |
| Registrant’s telephone number, including area code: | | 800-225-1852 |
| |
| Date of fiscal year end: | | 9/30/2019 |
| |
| Date of reporting period: | | 9/30/2019 |
Item 1 – Reports to Stockholders

PGIM QMA STOCK INDEX FUND
ANNUAL REPORT
SEPTEMBER 30, 2019
COMING SOON: PAPERLESS SHAREHOLDER REPORTS
Beginning on January 1, 2021, as permitted by regulations adopted by the Securities and Exchange Commission, paper copies of the Fund’s annual and semiannual shareholder reports will no longer be sent by mail, unless you specifically request paper copies of the reports. Instead, the reports will be made available on the Fund’s website (pgiminvestments.com), and you will be notified by mail each time a report is posted and provided with a website link to access the report.
If you already elected to receive shareholder reports electronically, you will not be affected by this change and you need not take any action. You may elect to receive shareholder reports and other communications from the Fund electronically anytime by contacting your financial intermediary (such as a broker-dealer or bank) or, if you are a direct investor, by calling 1-800-225-1852 or by sending an email request to PGIM Investments at shareholderreports@pgim.com.
You may elect to receive all future reports in paper free of charge. If you invest through a financial intermediary, you can contact your financial intermediary or follow instructions included with this notice to elect to continue to receive paper copies of your shareholder reports. If you invest directly with the Fund, you can call 1-800-225-1852 or send an email request to shareholderreports@pgim.com to let the Fund know you wish to continue receiving paper copies of your shareholder reports. Your election to receive reports in paper will apply to all funds held in your account if you invest through your financial intermediary or all funds held with the fund complex if you invest directly with the Fund.

To enroll in e-delivery, go to pgiminvestments.com/edelivery
|
Objective:Provide investment results that correspond to the price and yield
performance of the S&P 500 Index |
Highlights(unaudited)
| • | | The Fund closely tracked the performance of the S&P 500 Index over the reporting period before deduction of fees and expenses. |
| • | | The Fund held all stocks included in the Index in approximately the same proportions. |
This report is not authorized for distribution to prospective investors unless preceded or accompanied by a current prospectus.
The views expressed in this report and information about the Fund’s portfolio holdings are for the period covered by this report and are subject to change thereafter.
Mutual funds are distributed by Prudential Investment Management Services LLC, a Prudential Financial company and member SIPC. QMA is the primary business name of QMA LLC, a wholly owned subsidiary of PGIM, Inc. (PGIM), a Prudential Financial company.© 2019 Prudential Financial, Inc. and its related entities. PGIM and the PGIM logo are service marks of Prudential Financial, Inc. and its related entities, registered in many jurisdictions worldwide.
| | |
| 2 | | Visit our website at pgiminvestments.com |
Table of Contents
| | | | |
| PGIM QMA Stock Index Fund | | | 3 | |
This Page Intentionally Left Blank
Letter from the President

Dear Shareholder:
We hope you find the annual report for the PGIM QMA Stock Index Fund informative and useful. The report covers performance for the12-month period that ended September 30, 2019.
While the US economy remained healthy, with rising corporate profits and strong job growth, the Federal Reserve cut interest rates late in the period for the first time since the Great Recession more than a decade ago. After nine rate increases in recent
years, the cut was a proactive attempt by the Fed to extend the longest domestic economic expansion on record as growth in many other regions weakened. China in particular showed signs of slowing amid trade tensions with the US, and turmoil in the United Kingdom continued as it negotiated an exit from the European Union.
Despite the growing US economy, volatility returned to the equity markets during the period. After corporate tax cuts and regulatory reforms helped boost US stocks early in the period, equities declined significantly at the end of 2018 on concerns about China’s economy, a potential global trade war, higher interest rates, and worries that profit growth might slow. Stocks reversed course early in 2019, rising sharply after the Fed moderated its position on additional rate hikes for the remainder of the year. For the period overall,large-cap US equities rose whilesmall-cap US stocks fell. Stocks also declined in developed foreign and emerging markets.
The overall US bond market posted strong returns during the period on a significant rally in interest rates that saw the10-year US Treasury yield decline from around 3% to 2%. Investment grade corporate bonds led the way with a double-digit gain, while corporate high yield and municipal bonds each had a high single-digit return. Globally, bonds in developed markets delivered solid returns, while emerging markets debt also posted positive results. A continuing trend during the period was the inversion of a portion of the US Treasury yield curve, as the yield on certain shorter maturities exceeded the yield on the10-year bond.
Regarding your investments with PGIM, we believe it is important to maintain a diversified portfolio of funds consistent with your tolerance for risk, time horizon, and financial goals. Your financial advisor can help you create a diversified investment plan that may include funds covering all the basic asset classes and that reflects your personal investor profile and risk tolerance. However, diversification and asset allocation strategies do not assure a profit or protect against loss in declining markets.
At PGIM Investments, we consider it a great privilege and responsibility to help investors participate in opportunities across global markets while meeting their toughest investment challenges. PGIM is atop-10 global investment manager with more than $1 trillion in assets under management. This scale and investment expertise allow us to deliver actively managed funds and strategies to meet the needs of investors around the globe.
Thank you for choosing our family of funds.
Sincerely,

Stuart S. Parker, President
PGIM QMA Stock Index Fund
November 15, 2019
| | | | |
| PGIM QMA Stock Index Fund | | | 5 | |
Your Fund’s Performance(unaudited)
Performance data quoted represent past performance. Past performance does not guarantee future results. The investment return and principal value of an investment will fluctuate, so that an investor’s shares, when redeemed, may be worth more or less than their original cost. Current performance may be lower or higher than the past performance data quoted. An investor may obtain performance data as of the most recent month-end by visiting our website atpgiminvestments.com or by calling (800) 225-1852.
| | | | | | | | | | | | | | |
| |
| | | Average Annual Total Returns as of 9/30/19 (with sales charges) | |
| | | One Year (%) | | Five Years (%) | | | Ten Years (%) | | | Since Inception (%) | |
| Class A | | 0.38 | | | 9.56 | | | | 12.32 | | | | — | |
| Class C | | 2.24 | | | 9.58 | | | | 11.98 | | | | — | |
| Class I | | 4.12 | | | 10.66 | | | | 13.08 | | | | — | |
| Class Z | | 4.05 | | | 10.60 | | | | 13.02 | | | | — | |
| Class R6 | | 4.12 | | | N/A | | | | N/A | | | | 9.02 (11/28/17) | |
| S&P 500 Index | | | | | | | | | | | | | | |
| | | 4.25 | | | 10.83 | | | | 13.23 | | | | — | |
| | | | | | | | | | | | | | |
| |
| | | Average Annual Total Returns as of 9/30/19
(without sales charges) | |
| | | One Year (%) | | Five Years (%) | | | Ten Years (%) | | | Since Inception (%) | |
| Class A | | 3.75 | | | 10.29 | | | | 12.69 | | | | — | |
| Class C | | 3.08 | | | 9.58 | | | | 11.98 | | | | — | |
| Class I | | 4.12 | | | 10.66 | | | | 13.08 | | | | — | |
| Class Z | | 4.05 | | | 10.60 | | | | 13.02 | | | | — | |
| Class R6 | | 4.12 | | | N/A | | | | N/A | | | | 9.02 (11/28/17) | |
| S&P 500 Index | | | | | | | | | | | | | | |
| | | 4.25 | | | 10.83 | | | | 13.23 | | | | — | |
| | |
| 6 | | Visit our website at pgiminvestments.com |
Growth of a $10,000 Investment(unaudited)
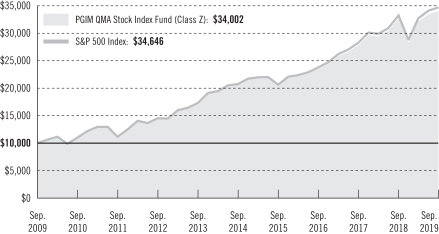
The graph compares a $10,000 investment in the Fund’s Class Z shares with a similar investment in the S&P 500 Index by portraying the initial account values at the beginning of the 10-year period (September 30, 2009) and the account values at the end of the current fiscal year (September 30, 2019) as measured on a quarterly basis. For purposes of the graph, and unless otherwise indicated, it has been assumed that (a) all recurring fees (including management fees) were deducted; and (b) all dividends and distributions were reinvested. The line graph provides information for Class Z shares only. As indicated in the tables provided earlier, performance for other share classes will vary due to the differing charges and expenses applicable to each share class (as indicated in the following paragraphs). Without waiver of fees and/or expense reimbursement, if any, the Fund’s returns would have been lower.
Past performance does not predict future performance. Total returns and the ending account values in the graphs include changes in share price and reinvestment of dividends and capital gains distributions in a hypothetical investment for the periods shown. The Fund’s total returns do not reflect the deduction of income taxes on an individual’s investment. Taxes may reduce your actual investment returns on income or gains paid by the Fund or any gains you may realize if you sell your shares.
Source: PGIM Investments LLC and Lipper Inc.
Since Inception returns are provided for any share class with less than 10 fiscal years of returns. Since Inception returns for the Index are measured from the closest month-end to the inception date for Class R6 shares.
| | | | |
| PGIM QMA Stock Index Fund | | | 7 | |
Your Fund’s Performance(continued)
The returns in the tables do not reflect the deduction of taxes that a shareholder would pay on Fund distributions or following the redemption of Fund shares. The average annual total returns take into account applicable sales charges, which are described for each share class in the table below.
| | | | | | | | | | |
| | | | | | |
| | | Class A | | Class C | | Class I | | Class Z | | Class R6 |
| Maximum initial sales charge | | 3.25% of the public offering price | | None | | None | | None | | None |
Contingent deferred sales charge (CDSC)
(as a percentage of the lower of the original purchase price or the net asset value at redemption) | | 1.00% on sales of $1 million or more made within 12 months of purchase | | 1.00% on sales made within 12 months of purchase | | None | | None | | None |
| Annual distribution and service (12b-1) fees (shown as a percentage of average daily net assets) | | 0.30% | | 1.00% | | None | | None | | None |
Benchmark Definitions
S&P 500 Index—The S&P 500 Index (the Index) is an unmanaged index of over 500 stocks of large US public companies. It gives a broad look at how stock prices in the United States have performed. The average annual total return for the Index measured from the month-end closest to the inception date of the Fund’s Class R6 shares is 8.71%.
Investors cannot invest directly in an index. The returns for the Index would be lower if they included the effects of sales charges, operating expenses of a mutual fund, or taxes.
| | |
| 8 | | Visit our website at pgiminvestments.com |
12-month performance broken out by S&P 500 Index sectors.
S&P 500 Index as of 9/30/19
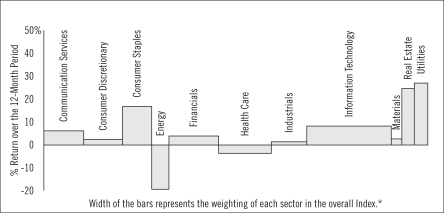
*Sector weightings are subject to change.
Source: FactSet Research Systems Inc.
Presentation of Fund Holdingsas of 9/30/19
| | | | |
| Ten Largest Holdings | | Line of Business | | % of Net Assets |
| Microsoft Corp. | | Software | | 4.2% |
| Apple, Inc. | | Technology Hardware, Storage & Peripherals | | 3.8% |
| Amazon.com, Inc. | | Internet & Direct Marketing Retail | | 2.9% |
| Facebook, Inc. (Class A Stock) | | Interactive Media & Services | | 1.7% |
| Berkshire Hathaway, Inc. (Class B Stock) | | Diversified Financial Services | | 1.6% |
| JPMorgan Chase & Co. | | Banks | | 1.5% |
| Alphabet, Inc. (Class C Stock) | | Interactive Media & Services | | 1.5% |
| Alphabet, Inc. (Class A Stock) | | Interactive Media & Services | | 1.4% |
| Johnson & Johnson | | Pharmaceuticals | | 1.4% |
| Procter & Gamble Co. (The) | | Household Products | | 1.2% |
For a complete list of holdings, please refer to the Schedule of Investments section of this report. Holdings reflect only long-term investments.
| | | | |
| PGIM QMA Stock Index Fund | | | 9 | |
Strategy and Performance Overview(unaudited)
How did the Fund perform?
ThePGIM QMA Stock Index Fund’s Class Z shares returned 4.05% in the12-month reporting period that ended September 30, 2019, underperforming the 4.25% return of the S&P 500 Index (the Index).
| • | | The Fund closely tracked the performance of the Index over the reporting period before deduction of fees and expenses. |
| • | | The Fund held all stocks included in the Index in approximately the same proportions. |
What were the market conditions?
| • | | Markets fluctuated throughout the reporting period due to geopolitical tensions, a slowdown in global growth, and eventually concerted global monetary easing as an antidote to these challenges. Against this backdrop, equities underperformed perceived safe-haven bonds, with the broad-based S&P 500 Index returning 4.25% during the period and the Bloomberg Barclays US Aggregate Bond Index returning 10.30%. |
| • | | US equity markets experienced a major correction in the fourth quarter of 2018. The Federal Reserve’s (the Fed’s) persistent interest rate tightening, which began in late 2016, sparked fears of a policy mistake amid weakening global growth and the escalation ofUS-China trade tensions. |
| • | | The markets then staged a sharp “relief rally” in the first four months of 2019 after an abrupt dovish pivot by the Fed and progress on trade relations. Following its January meeting, the Fed signaled a new “patient” stance (i.e., an intention to put interest rate rises on hold). Meanwhile, the US and China commenced trade talks, which appeared to be progressing smoothly. |
| • | | The rally was cut short in March when the US yield curve inverted. A yield curve inversion occurs when yields on short-term US Treasuries rise above yields on long-term Treasuries. Such an inversion has preceded past recessions, and its occurrence earlier this year triggered investors’ fears and remained at the epicenter of debates over the looming end of the US business cycle. |
| • | | In May 2019, investors learned of a breakdown in theUS-China trade talks. It soon became apparent that this was not a mere hiccup on a path to a resolution but rather a standoff of two major geopolitical rivals. Equity markets retreated as retaliatory rounds of tariffs followed swiftly on both the US and China side. |
| • | | BeyondUS-China trade tensions, other global risks flared, including Brexit uncertainty, violent protests in Hong Kong over the legitimacy of a controversial extradition law, and growing tension in the Middle East, underscored by attacks on the Saudi oil fields. |
| • | | The trade war and a wave of tariffs had an adverse effect on global growth via a slowdown in global trade flows, increases in uncertainty, and reduction in global demand for |
| | |
| 10 | | Visit our website at pgiminvestments.com |
| | manufactured goods. Europe, Japan, and emerging markets showed clear signs of economic slowing. While tariffs did not significantly reduce US economic growth during the period, they did catalyze investors’ fears about a possible slowdown in the US. |
| • | | US growth remained on solid footing, with gross domestic product (GDP) growth in excess of 2% in the first half of 2019. While signs of a slowdown appeared in manufacturing, the sector most exposed to global trade, the economy continued to be powered by a buoyant consumer, whose confidence was underpinned by the resiliency of the US job market. |
| • | | Geopolitical instability and mounting risks to global growth caused central banks around the globe to ease their monetary policies. The Fed cut rates twice during the reporting period as insurance against disruptions sparked by theUS-China standoff, while the European Central Bank launched a new round of easing measures. Meanwhile, China continued stimulating its economy, with many emerging-market central banks following suit. |
| • | | The remainder of the period was characterized by sharp rallies and pullbacks as global markets were caught in the crosscurrents of monetary easing and the adverse effects of geopolitical instability. |
| • | | All the geopolitical and economic uncertainty initiated a rally in safe-haven assets, such as government bonds. US10-year Treasury yields dipped from about 3% to under 2% during the period, pulled down by a global search for yield. The interest rate differential between the US and the rest of the world widened, resulting in further appreciation of the US dollar. |
| • | | The US economy outperformed the rest of the world during the period due to its resilient growth and an accommodating Fed. USlarge-cap stocks fared better than theirsmall-cap peers, which tend to underperform in the late-cycle environment due to rising costs and margin pressures. |
Did the Fund use derivatives and, if so, how did they affect performance?
The Fund held S&P 500 stock index futures, a form of derivatives, to maintain exposure to equities and provide portfolio liquidity. These futures had minimal impact on performance over the period.
Current outlook
| • | | Global economic growth continues to be weak, buffeted by powerful crosscurrents of theUS-China trade war on one hand and global monetary easing on the other. |
| • | | The trade standoff has taken a toll on business confidence, industrial production, and trade flows. It also has weighed heavily on global manufacturing and hit export-oriented economies—including China, Europe, and Japan—the hardest. |
| | | | |
| PGIM QMA Stock Index Fund | | | 11 | |
Strategy and Performance Overview(continued)
| • | | Powered by a healthy consumer, US growth remains resilient while eurozone growth is anemic, with Germany and Italy teetering on the edge of recession. Brexit uncertainty is finally catching up with the UK economy, which contracted in the second quarter of 2019. Japanese growth is decent, but risks are tilted to the downside given weak global growth, yen appreciation, and a pending consumer tax hike. |
| • | | The greatest threat to the global economy is an escalation of the trade war, which would lead to an even deeper downturn in global manufacturing. This could progressively weaken the more healthy components of the global economy, namely the services sector and the US consumer. |
| | |
| 12 | | Visit our website at pgiminvestments.com |
Fees and Expenses (unaudited)
As a shareholder of the Fund, you incur two types of costs: (1) transaction costs, including sales charges (loads) on purchase payments and redemptions, as applicable, and (2) ongoing costs, including management fees, distribution and/or service (12b-1) fees, and other Fund expenses, as applicable. This example is intended to help you understand your ongoing costs (in dollars) of investing in the Fund and to compare these costs with the ongoing costs of investing in other mutual funds.
The example is based on an investment of $1,000 held through the six-month period ended September 30, 2019. The example is for illustrative purposes only; you should consult the Prospectus for information on initial and subsequent minimum investment requirements.
Actual Expenses
The first line for each share class in the table on the following page provides information about actual account values and actual expenses. You may use the information on this line, together with the amount you invested, to estimate the expenses that you paid over the period. Simply divide your account value by $1,000 (for example, an $8,600 account value ÷ $1,000 = 8.6), then multiply the result by the number on the first line under the heading “Expenses Paid During the Six-Month Period” to estimate the expenses you paid on your account during this period.
Hypothetical Example for Comparison Purposes
The second line for each share class in the table on the following page provides information about hypothetical account values and hypothetical expenses based on the Fund’s actual expense ratio and an assumed rate of return of 5% per year before expenses, which is not the Fund’s actual return. The hypothetical account values and expenses may not be used to estimate the actual ending account balance or expenses you paid for the period. You may use this information to compare the ongoing costs of investing in the Fund and other funds. To do so, compare this 5% hypothetical example with the 5% hypothetical examples that appear in the shareholder reports of the other funds.
The Fund’s transfer agent may charge additional fees to holders of certain accounts that are not included in the expenses shown in the table on the following page. These fees apply to individual retirement accounts (IRAs) and Section 403(b) accounts. As of the close of the six-month period covered by the table, IRA fees included an annual maintenance fee of $15 per account (subject to a maximum annual maintenance fee of $25 for all accounts held by the same shareholder). Section 403(b) accounts are charged an annual $25 fiduciary maintenance fee. Some of the fees may vary in amount, or may be waived, based on your total account balance or the number of PGIM funds, including the Fund, that you own. You should consider the additional fees that were charged to your Fund account over the six-month period when you estimate the total ongoing expenses paid over the period
| | | | |
| PGIM QMA Stock Index Fund | | | 13 | |
Fees and Expenses(continued)
and the impact of these fees on your ending account value, as these additional expenses are not reflected in the information provided in the expense table. Additional fees have the effect of reducing investment returns.
Please note that the expenses shown in the table are meant to highlight your ongoing costs only and do not reflect any transactional costs such as sales charges (loads). Therefore, the second line for each share class in the table is useful in comparing ongoing costs only and will not help you determine the relative total costs of owning different funds. In addition, if these transactional costs were included, your costs would have been higher.
| | | | | | | | | | | | | | | | | | |
| | | | |
PGIM QMA Stock
Index Fund | | Beginning Account
Value
April 1, 2019 | | | Ending Account
Value
September 30, 2019 | | | Annualized
Expense Ratio
Based on the
Six-Month Period | | | Expenses Paid
During the
Six-Month Period* | |
| Class A | | Actual | | $ | 1,000.00 | | | $ | 1,058.30 | | | | 0.54 | % | | $ | 2.79 | |
| | Hypothetical | | $ | 1,000.00 | | | $ | 1,022.36 | | | | 0.54 | % | | $ | 2.74 | |
| Class C | | Actual | | $ | 1,000.00 | | | $ | 1,054.80 | | | | 1.20 | % | | $ | 6.18 | |
| | Hypothetical | | $ | 1,000.00 | | | $ | 1,019.05 | | | | 1.20 | % | | $ | 6.07 | |
| Class I | | Actual | | $ | 1,000.00 | | | $ | 1,060.10 | | | | 0.19 | % | | $ | 0.98 | |
| | Hypothetical | | $ | 1,000.00 | | | $ | 1,024.12 | | | | 0.19 | % | | $ | 0.96 | |
| Class Z | | Actual | | $ | 1,000.00 | | | $ | 1,059.80 | | | | 0.26 | % | | $ | 1.34 | |
| | Hypothetical | | $ | 1,000.00 | | | $ | 1,023.76 | | | | 0.26 | % | | $ | 1.32 | |
| Class R6 | | Actual | | $ | 1,000.00 | | | $ | 1,060.30 | | | | 0.18 | % | | $ | 0.93 | |
| | | Hypothetical | | $ | 1,000.00 | | | $ | 1,024.17 | | | | 0.18 | % | | $ | 0.91 | |
*Fund expenses (net of fee waivers or subsidies, if any) for each share class are equal to the annualized expense ratio for each share class (provided in the table), multiplied by the average account value over the period, multiplied by the 183 days in the six-month period ended September 30, 2019, and divided by the 365 days in the Fund’s fiscal year ended September 30, 2019 (to reflect the six-month period). Expenses presented in the table include the expenses of any underlying portfolios in which the Fund may invest.
| | |
| 14 | | Visit our website at pgiminvestments.com |
Schedule of Investments
as of September 30, 2019
| | | | | | | | |
| Description | | Shares | | | Value | |
LONG-TERM INVESTMENTS 97.4% | | | | | | | | |
| | |
COMMON STOCKS 97.0% | | | | | | | | |
| | |
Aerospace & Defense 2.6% | | | | | | | | |
Arconic, Inc. | | | 12,381 | | | $ | 321,906 | |
Boeing Co. (The) | | | 18,564 | | | | 7,063,045 | |
General Dynamics Corp. | | | 8,512 | | | | 1,555,398 | |
Huntington Ingalls Industries, Inc. | | | 1,500 | | | | 317,685 | |
L3Harris Technologies, Inc. | | | 7,876 | | | | 1,643,249 | |
Lockheed Martin Corp. | | | 8,646 | | | | 3,372,459 | |
Northrop Grumman Corp. | | | 5,508 | | | | 2,064,343 | |
Raytheon Co. | | | 9,744 | | | | 1,911,675 | |
Textron, Inc. | | | 7,534 | | | | 368,865 | |
TransDigm Group, Inc. | | | 1,750 | | | | 911,172 | |
United Technologies Corp. | | | 28,229 | | | | 3,853,823 | |
| | | | | | | | |
| | | | | | | 23,383,620 | |
| | |
Air Freight & Logistics 0.6% | | | | | | | | |
C.H. Robinson Worldwide, Inc. | | | 4,800 | | | | 406,944 | |
Expeditors International of Washington, Inc. | | | 5,900 | | | | 438,311 | |
FedEx Corp. | | | 8,416 | | | | 1,225,117 | |
United Parcel Service, Inc. (Class B Stock) | | | 24,290 | | | | 2,910,428 | |
| | | | | | | | |
| | | | | | | 4,980,800 | |
| | |
Airlines 0.4% | | | | | | | | |
Alaska Air Group, Inc. | | | 4,100 | | | | 266,131 | |
American Airlines Group, Inc. | | | 13,550 | | | | 365,443 | |
Delta Air Lines, Inc. | | | 20,000 | | | | 1,152,000 | |
Southwest Airlines Co. | | | 16,474 | | | | 889,761 | |
United Airlines Holdings, Inc.* | | | 7,700 | | | | 680,757 | |
| | | | | | | | |
| | | | | | | 3,354,092 | |
| | |
Auto Components 0.1% | | | | | | | | |
Aptiv PLC | | | 8,850 | | | | 773,667 | |
BorgWarner, Inc. | | | 6,300 | | | | 231,084 | |
| | | | | | | | |
| | | | | | | 1,004,751 | |
| | |
Automobiles 0.3% | | | | | | | | |
Ford Motor Co. | | | 135,738 | | | | 1,243,360 | |
General Motors Co. | | | 44,400 | | | | 1,664,112 | |
Harley-Davidson, Inc. | | | 5,400 | | | | 194,238 | |
| | | | | | | | |
| | | | | | | 3,101,710 | |
See Notes to Financial Statements.
| | | | |
| PGIM QMA Stock Index Fund | | | 15 | |
Schedule of Investments(continued)
as of September 30, 2019
| | | | | | | | |
| Description | | Shares | | | Value | |
COMMON STOCKS (Continued) | | | | | | | | |
| | |
Banks 5.3% | | | | | | | | |
Bank of America Corp. | | | 293,195 | | | $ | 8,552,498 | |
BB&T Corp. | | | 26,458 | | | | 1,412,063 | |
Citigroup, Inc. | | | 79,295 | | | | 5,477,699 | |
Citizens Financial Group, Inc. | | | 14,900 | | | | 527,013 | |
Comerica, Inc. | | | 5,161 | | | | 340,574 | |
Fifth Third Bancorp | | | 24,573 | | | | 672,809 | |
First Republic Bank | | | 5,500 | | | | 531,850 | |
Huntington Bancshares, Inc. | | | 34,329 | | | | 489,875 | |
JPMorgan Chase & Co. | | | 111,533 | | | | 13,126,319 | |
KeyCorp | | | 34,735 | | | | 619,672 | |
M&T Bank Corp. | | | 4,670 | | | | 737,720 | |
People’s United Financial, Inc. | | | 13,100 | | | | 204,818 | |
PNC Financial Services Group, Inc. (The) | | | 15,472 | | | | 2,168,556 | |
Regions Financial Corp. | | | 33,174 | | | | 524,813 | |
SunTrust Banks, Inc. | | | 15,183 | | | | 1,044,590 | |
SVB Financial Group* | | | 1,820 | | | | 380,289 | |
U.S. Bancorp | | | 49,995 | | | | 2,766,723 | |
Wells Fargo & Co. | | | 139,836 | | | | 7,053,328 | |
Zions Bancorp NA | | | 6,100 | | | | 271,572 | |
| | | | | | | | |
| | | | | | | 46,902,781 | |
| | |
Beverages 1.9% | | | | | | | | |
Brown-Forman Corp. (Class B Stock) | | | 5,850 | | | | 367,263 | |
Coca-Cola Co. (The) | | | 134,064 | | | | 7,298,444 | |
Constellation Brands, Inc. (Class A Stock) | | | 5,900 | | | | 1,222,952 | |
Molson Coors Brewing Co. (Class B Stock) | | | 6,294 | | | | 361,905 | |
Monster Beverage Corp.* | | | 13,050 | | | | 757,683 | |
PepsiCo, Inc. | | | 48,841 | | | | 6,696,101 | |
| | | | | | | | |
| | | | | | | 16,704,348 | |
| | |
Biotechnology 2.1% | | | | | | | | |
AbbVie, Inc. | | | 51,574 | | | | 3,905,183 | |
Alexion Pharmaceuticals, Inc.* | | | 7,700 | | | | 754,138 | |
Amgen, Inc. | | | 21,196 | | | | 4,101,638 | |
Biogen, Inc.* | | | 6,670 | | | | 1,552,910 | |
Celgene Corp.* | | | 24,700 | | | | 2,452,710 | |
Gilead Sciences, Inc. | | | 44,300 | | | | 2,807,734 | |
Incyte Corp.* | | | 6,200 | | | | 460,226 | |
Regeneron Pharmaceuticals, Inc.* | | | 2,830 | | | | 785,042 | |
Vertex Pharmaceuticals, Inc.* | | | 8,960 | | | | 1,518,003 | |
| | | | | | | | |
| | | | | | | 18,337,584 | |
See Notes to Financial Statements.
| | | | | | | | |
| Description | | Shares | | | Value | |
COMMON STOCKS (Continued) | | | | | | | | |
| | |
Building Products 0.3% | | | | | | | | |
A.O. Smith Corp. | | | 4,600 | | | $ | 219,466 | |
Allegion PLC | | | 3,233 | | | | 335,101 | |
Fortune Brands Home & Security, Inc. | | | 4,700 | | | | 257,090 | |
Johnson Controls International PLC | | | 27,287 | | | | 1,197,626 | |
Masco Corp. | | | 9,526 | | | | 397,044 | |
| | | | | | | | |
| | | | | | | 2,406,327 | |
| | |
Capital Markets 2.6% | | | | | | | | |
Affiliated Managers Group, Inc. | | | 1,900 | | | | 158,365 | |
Ameriprise Financial, Inc. | | | 4,561 | | | | 670,923 | |
Bank of New York Mellon Corp. (The) | | | 29,438 | | | | 1,330,892 | |
BlackRock, Inc. | | | 4,160 | | | | 1,853,862 | |
Cboe Global Markets, Inc. | | | 3,800 | | | | 436,658 | |
Charles Schwab Corp. (The) | | | 40,211 | | | | 1,682,026 | |
CME Group, Inc. | | | 12,600 | | | | 2,662,884 | |
E*TRADE Financial Corp. | | | 7,920 | | | | 346,025 | |
Franklin Resources, Inc. | | | 9,142 | | | | 263,838 | |
Goldman Sachs Group, Inc. (The) | | | 11,280 | | | | 2,337,554 | |
Intercontinental Exchange, Inc. | | | 19,740 | | | | 1,821,410 | |
Invesco Ltd. | | | 12,200 | | | | 206,668 | |
MarketAxess Holdings, Inc. | | | 1,300 | | | | 425,750 | |
Moody’s Corp. | | | 5,736 | | | | 1,174,905 | |
Morgan Stanley | | | 43,236 | | | | 1,844,880 | |
MSCI, Inc. | | | 3,100 | | | | 675,025 | |
Nasdaq, Inc. | | | 3,900 | | | | 387,465 | |
Northern Trust Corp. | | | 7,562 | | | | 705,686 | |
Raymond James Financial, Inc. | | | 4,400 | | | | 362,824 | |
S&P Global, Inc. | | | 8,570 | | | | 2,099,479 | |
State Street Corp. | | | 12,562 | | | | 743,545 | |
T. Rowe Price Group, Inc. | | | 8,100 | | | | 925,425 | |
| | | | | | | | |
| | | | | | | 23,116,089 | |
| | |
Chemicals 1.9% | | | | | | | | |
Air Products & Chemicals, Inc. | | | 7,702 | | | | 1,708,766 | |
Albemarle Corp.(a) | | | 3,440 | | | | 239,149 | |
Celanese Corp. | | | 4,300 | | | | 525,847 | |
CF Industries Holdings, Inc. | | | 7,300 | | | | 359,160 | |
Corteva, Inc. | | | 25,409 | | | | 711,452 | |
Dow, Inc. | | | 25,809 | | | | 1,229,799 | |
DuPont de Nemours, Inc. | | | 26,109 | | | | 1,861,833 | |
Eastman Chemical Co. | | | 4,586 | | | | 338,584 | |
Ecolab, Inc. | | | 8,842 | | | | 1,751,070 | |
FMC Corp. | | | 4,400 | | | | 385,792 | |
See Notes to Financial Statements.
| | | | |
| PGIM QMA Stock Index Fund | | | 17 | |
Schedule of Investments(continued)
as of September 30, 2019
| | | | | | | | |
| Description | | Shares | | | Value | |
COMMON STOCKS (Continued) | | | | | | | | |
| | |
Chemicals (cont’d.) | | | | | | | | |
International Flavors & Fragrances, Inc.(a) | | | 3,415 | | | $ | 418,986 | |
Linde PLC (United Kingdom) | | | 18,828 | | | | 3,647,360 | |
LyondellBasell Industries NV (Class A Stock) | | | 9,000 | | | | 805,230 | |
Mosaic Co. (The) | | | 11,500 | | | | 235,750 | |
PPG Industries, Inc. | | | 8,348 | | | | 989,321 | |
Sherwin-Williams Co. (The) | | | 2,926 | | | | 1,608,920 | |
| | | | | | | | |
| | | | | | | 16,817,019 | |
| | |
Commercial Services & Supplies 0.4% | | | | | | | | |
Cintas Corp. | | | 2,960 | | | | 793,576 | |
Copart, Inc.* | | | 7,100 | | | | 570,343 | |
Republic Services, Inc. | | | 7,435 | | | | 643,499 | |
Rollins, Inc. | | | 4,050 | | | | 137,984 | |
Waste Management, Inc. | | | 13,613 | | | | 1,565,495 | |
| | | | | | | | |
| | | | | | | 3,710,897 | |
| | |
Communications Equipment 1.0% | | | | | | | | |
Arista Networks, Inc.* | | | 1,850 | | | | 442,002 | |
Cisco Systems, Inc. | | | 148,044 | | | | 7,314,854 | |
F5 Networks, Inc.* | | | 2,100 | | | | 294,882 | |
Juniper Networks, Inc. | | | 11,300 | | | | 279,675 | |
Motorola Solutions, Inc. | | | 5,756 | | | | 980,880 | |
| | | | | | | | |
| | | | | | | 9,312,293 | |
| | |
Construction & Engineering 0.1% | | | | | | | | |
Jacobs Engineering Group, Inc. | | | 4,200 | | | | 384,300 | |
Quanta Services, Inc. | | | 4,300 | | | | 162,540 | |
| | | | | | | | |
| | | | | | | 546,840 | |
| | |
Construction Materials 0.1% | | | | | | | | |
Martin Marietta Materials, Inc. | | | 2,300 | | | | 630,430 | |
Vulcan Materials Co. | | | 4,700 | | | | 710,828 | |
| | | | | | | | |
| | | | | | | 1,341,258 | |
| | |
Consumer Finance 0.7% | | | | | | | | |
American Express Co. | | | 23,839 | | | | 2,819,677 | |
Capital One Financial Corp. | | | 16,366 | | | | 1,488,979 | |
See Notes to Financial Statements.
| | | | | | | | |
| Description | | Shares | | | Value | |
COMMON STOCKS (Continued) | | | | | | | | |
| | |
Consumer Finance (cont’d.) | | | | | | | | |
Discover Financial Services | | | 11,218 | | | $ | 909,667 | |
Synchrony Financial | | | 21,265 | | | | 724,924 | |
| | | | | | | | |
| | | | | | | 5,943,247 | |
| | |
Containers & Packaging 0.4% | | | | | | | | |
Amcor PLC | | | 53,460 | | | | 521,235 | |
Avery Dennison Corp. | | | 3,038 | | | | 345,025 | |
Ball Corp. | | | 11,628 | | | | 846,635 | |
International Paper Co. | | | 13,084 | | | | 547,173 | |
Packaging Corp. of America | | | 3,370 | | | | 357,557 | |
Sealed Air Corp. | | | 5,236 | | | | 217,346 | |
Westrock Co. | | | 8,033 | | | | 292,803 | |
| | | | | | | | |
| | | | | | | 3,127,774 | |
| | |
Distributors 0.1% | | | | | | | | |
Genuine Parts Co. | | | 4,999 | | | | 497,850 | |
LKQ Corp.* | | | 9,900 | | | | 311,355 | |
| | | | | | | | |
| | | | | | | 809,205 | |
| | |
Diversified Consumer Services 0.0% | | | | | | | | |
H&R Block, Inc. | | | 6,720 | | | | 158,726 | |
| | |
Diversified Financial Services 1.6% | | | | | | | | |
Berkshire Hathaway, Inc. (Class B Stock)* | | | 68,230 | | | | 14,193,205 | |
| | |
Diversified Telecommunication Services 2.1% | | | | | | | | |
AT&T, Inc. | | | 254,707 | | | | 9,638,113 | |
CenturyLink, Inc. | | | 32,379 | | | | 404,090 | |
Verizon Communications, Inc. | | | 144,333 | | | | 8,711,940 | |
| | | | | | | | |
| | | | | | | 18,754,143 | |
| | |
Electric Utilities 2.1% | | | | | | | | |
Alliant Energy Corp. | | | 7,200 | | | | 388,296 | |
American Electric Power Co., Inc. | | | 17,391 | | | | 1,629,363 | |
Duke Energy Corp. | | | 25,539 | | | | 2,448,168 | |
Edison International | | | 12,362 | | | | 932,342 | |
Entergy Corp. | | | 6,615 | | | | 776,336 | |
Evergy, Inc. | | | 8,300 | | | | 552,448 | |
Eversource Energy | | | 11,000 | | | | 940,170 | |
Exelon Corp. | | | 33,712 | | | | 1,628,627 | |
FirstEnergy Corp. | | | 17,677 | | | | 852,562 | |
See Notes to Financial Statements.
| | | | |
| PGIM QMA Stock Index Fund | | | 19 | |
Schedule of Investments(continued)
as of September 30, 2019
| | | | | | | | |
| Description | | Shares | | | Value | |
COMMON STOCKS (Continued) | | | | | | | | |
| | |
Electric Utilities (cont’d.) | | | | | | | | |
NextEra Energy, Inc. | | | 16,732 | | | $ | 3,898,389 | |
Pinnacle West Capital Corp. | | | 3,900 | | | | 378,573 | |
PPL Corp. | | | 24,552 | | | | 773,142 | |
Southern Co. (The) | | | 35,915 | | | | 2,218,470 | |
Xcel Energy, Inc. | | | 17,283 | | | | 1,121,494 | |
| | | | | | | | |
| | | | | | | 18,538,380 | |
| | |
Electrical Equipment 0.5% | | | | | | | | |
AMETEK, Inc. | | | 8,000 | | | | 734,560 | |
Eaton Corp. PLC | | | 14,693 | | | | 1,221,723 | |
Emerson Electric Co. | | | 21,150 | | | | 1,414,089 | |
Rockwell Automation, Inc. | | | 4,103 | | | | 676,174 | |
| | | | | | | | |
| | | | | | | 4,046,546 | |
| | |
Electronic Equipment, Instruments & Components 0.5% | | | | | | | | |
Amphenol Corp. (Class A Stock) | | | 10,200 | | | | 984,300 | |
CDW Corp. | | | 4,500 | | | | 554,580 | |
Corning, Inc. | | | 26,397 | | | | 752,842 | |
FLIR Systems, Inc. | | | 4,400 | | | | 231,396 | |
IPG Photonics Corp.* | | | 1,400 | | | | 189,840 | |
Keysight Technologies, Inc.* | | | 6,600 | | | | 641,850 | |
TE Connectivity Ltd. | | | 11,750 | | | | 1,094,865 | |
| | | | | | | | |
| | | | | | | 4,449,673 | |
| | |
Energy Equipment & Services 0.4% | | | | | | | | |
Baker Hughes a GE Co. | | | 17,445 | | | | 404,724 | |
Halliburton Co. | | | 29,122 | | | | 548,950 | |
Helmerich & Payne, Inc. | | | 3,100 | | | | 124,217 | |
National Oilwell Varco, Inc. | | | 12,900 | | | | 273,480 | |
Schlumberger Ltd. | | | 47,632 | | | | 1,627,585 | |
TechnipFMC PLC (United Kingdom) | | | 14,600 | | | | 352,444 | |
| | | | | | | | |
| | | | | | | 3,331,400 | |
| | |
Entertainment 1.7% | | | | | | | | |
Activision Blizzard, Inc. | | | 26,500 | | | | 1,402,380 | |
Electronic Arts, Inc.* | | | 10,400 | | | | 1,017,328 | |
Netflix, Inc.* | | | 15,300 | | | | 4,094,586 | |
Take-Two Interactive Software, Inc.* | | | 4,000 | | | | 501,360 | |
See Notes to Financial Statements.
| | | | | | | | |
| Description | | Shares | | | Value | |
COMMON STOCKS (Continued) | | | | | | | | |
| | |
Entertainment (cont’d.) | | | | | | | | |
Viacom, Inc. (Class B Stock) | | | 11,776 | | | $ | 282,977 | |
Walt Disney Co. (The) | | | 62,436 | | | | 8,136,660 | |
| | | | | | | | |
| | | | | | �� | 15,435,291 | |
| | |
Equity Real Estate Investment Trusts (REITs) 3.0% | | | | | | | | |
Alexandria Real Estate Equities, Inc. | | | 4,000 | | | | 616,160 | |
American Tower Corp. | | | 15,550 | | | | 3,438,572 | |
Apartment Investment & Management Co. (Class A Stock) | | | 4,982 | | | | 259,761 | |
AvalonBay Communities, Inc. | | | 4,911 | | | | 1,057,486 | |
Boston Properties, Inc. | | | 4,980 | | | | 645,707 | |
Crown Castle International Corp. | | | 14,700 | | | | 2,043,447 | |
Digital Realty Trust, Inc. | | | 7,300 | | | | 947,613 | |
Duke Realty Corp. | | | 12,200 | | | | 414,434 | |
Equinix, Inc. | | | 3,026 | | | | 1,745,397 | |
Equity Residential | | | 12,200 | | | | 1,052,372 | |
Essex Property Trust, Inc. | | | 2,300 | | | | 751,295 | |
Extra Space Storage, Inc. | | | 4,400 | | | | 514,008 | |
Federal Realty Investment Trust | | | 2,500 | | | | 340,350 | |
HCP, Inc. | | | 15,900 | | | | 566,517 | |
Host Hotels & Resorts, Inc. | | | 25,436 | | | | 439,788 | |
Iron Mountain, Inc. | | | 9,105 | | | | 294,911 | |
Kimco Realty Corp. | | | 14,000 | | | | 292,320 | |
Macerich Co. (The) | | | 3,000 | | | | 94,770 | |
Mid-America Apartment Communities, Inc. | | | 4,070 | | | | 529,141 | |
Prologis, Inc. | | | 22,037 | | | | 1,877,993 | |
Public Storage | | | 5,200 | | | | 1,275,404 | |
Realty Income Corp. | | | 11,000 | | | | 843,480 | |
Regency Centers Corp. | | | 5,600 | | | | 389,144 | |
SBA Communications Corp. | | | 4,000 | | | | 964,600 | |
Simon Property Group, Inc. | | | 10,689 | | | | 1,663,743 | |
SL Green Realty Corp. | | | 3,000 | | | | 245,250 | |
UDR, Inc. | | | 9,400 | | | | 455,712 | |
Ventas, Inc. | | | 12,833 | | | | 937,194 | |
Vornado Realty Trust | | | 5,484 | | | | 349,166 | |
Welltower, Inc. | | | 14,100 | | | | 1,278,165 | |
Weyerhaeuser Co. | | | 25,039 | | | | 693,580 | |
| | | | | | | | |
| | | | | | | 27,017,480 | |
| | |
Food & Staples Retailing 1.6% | | | | | | | | |
Costco Wholesale Corp. | | | 15,508 | | | | 4,468,010 | |
Kroger Co. (The) | | | 27,568 | | | | 710,703 | |
Sysco Corp. | | | 16,980 | | | | 1,348,212 | |
See Notes to Financial Statements.
| | | | |
| PGIM QMA Stock Index Fund | | | 21 | |
Schedule of Investments(continued)
as of September 30, 2019
| | | | | | | | |
| Description | | Shares | | | Value | |
COMMON STOCKS (Continued) | | | | | | | | |
| | |
Food & Staples Retailing (cont’d.) | | | | | | | | |
Walgreens Boots Alliance, Inc. | | | 26,378 | | | $ | 1,458,967 | |
Walmart, Inc. | | | 48,926 | | | | 5,806,538 | |
| | | | | | | | |
| | | | | | | 13,792,430 | |
| | |
Food Products 1.1% | | | | | | | | |
Archer-Daniels-Midland Co. | | | 18,659 | | | | 766,325 | |
Campbell Soup Co. | | | 6,147 | | | | 288,417 | |
Conagra Brands, Inc. | | | 16,243 | | | | 498,335 | |
General Mills, Inc. | | | 20,844 | | | | 1,148,921 | |
Hershey Co. (The) | | | 4,916 | | | | 761,931 | |
Hormel Foods Corp. | | | 9,300 | | | | 406,689 | |
J.M. Smucker Co. (The) | | | 4,000 | | | | 440,080 | |
Kellogg Co. | | | 8,470 | | | | 545,045 | |
Kraft Heinz Co. (The) | | | 20,855 | | | | 582,585 | |
Lamb Weston Holdings, Inc. | | | 5,100 | | | | 370,872 | |
McCormick & Co., Inc. | | | 4,400 | | | | 687,720 | |
Mondelez International, Inc. (Class A Stock) | | | 50,066 | | | | 2,769,651 | |
Tyson Foods, Inc. (Class A Stock) | | | 10,200 | | | | 878,628 | |
| | | | | | | | |
| | | | | | | 10,145,199 | |
| | |
Gas Utilities 0.0% | | | | | | | | |
Atmos Energy Corp. | | | 3,800 | | | | 432,782 | |
| | |
Health Care Equipment & Supplies 3.5% | | | | | | | | |
Abbott Laboratories | | | 61,413 | | | | 5,138,426 | |
ABIOMED, Inc.* | | | 1,600 | | | | 284,624 | |
Align Technology, Inc.* | | | 2,530 | | | | 457,727 | |
Baxter International, Inc. | | | 17,174 | | | | 1,502,210 | |
Becton, Dickinson & Co. | | | 9,505 | | | | 2,404,385 | |
Boston Scientific Corp.* | | | 47,972 | | | | 1,951,981 | |
Cooper Cos., Inc. (The) | | | 1,800 | | | | 534,600 | |
Danaher Corp. | | | 22,100 | | | | 3,191,903 | |
DENTSPLY SIRONA, Inc. | | | 7,400 | | | | 394,494 | |
Edwards Lifesciences Corp.* | | | 7,370 | | | | 1,620,737 | |
Hologic, Inc.* | | | 8,900 | | | | 449,361 | |
IDEXX Laboratories, Inc.* | | | 3,100 | | | | 842,983 | |
Intuitive Surgical, Inc.* | | | 4,080 | | | | 2,202,914 | |
Medtronic PLC | | | 46,715 | | | | 5,074,183 | |
ResMed, Inc. | | | 5,000 | | | | 675,550 | |
Stryker Corp. | | | 10,930 | | | | 2,364,159 | |
Teleflex, Inc. | | | 1,600 | | | | 543,600 | |
See Notes to Financial Statements.
| | | | | | | | |
| Description | | Shares | | | Value | |
COMMON STOCKS (Continued) | | | | | | | | |
| | |
Health Care Equipment & Supplies (cont’d.) | | | | | | | | |
Varian Medical Systems, Inc.* | | | 3,200 | | | $ | 381,088 | |
Zimmer Biomet Holdings, Inc. | | | 7,211 | | | | 989,854 | |
| | | | | | | | |
| | | | | | | 31,004,779 | |
| | |
Health Care Providers & Services 2.4% | | | | | | | | |
AmerisourceBergen Corp. | | | 5,360 | | | | 441,289 | |
Anthem, Inc. | | | 9,060 | | | | 2,175,306 | |
Cardinal Health, Inc. | | | 10,273 | | | | 484,783 | |
Centene Corp.* | | | 14,400 | | | | 622,944 | |
Cigna Corp. | | | 13,168 | | | | 1,998,771 | |
CVS Health Corp. | | | 45,146 | | | | 2,847,358 | |
DaVita, Inc.* | | | 3,600 | | | | 205,452 | |
HCA Healthcare, Inc. | | | 9,400 | | | | 1,131,948 | |
Henry Schein, Inc.* | | | 5,100 | | | | 323,850 | |
Humana, Inc. | | | 4,800 | | | | 1,227,216 | |
Laboratory Corp. of America Holdings* | | | 3,500 | | | | 588,000 | |
McKesson Corp. | | | 6,426 | | | | 878,177 | |
Quest Diagnostics, Inc. | | | 4,600 | | | | 492,338 | |
UnitedHealth Group, Inc. | | | 33,198 | | | | 7,214,589 | |
Universal Health Services, Inc. (Class B Stock) | | | 2,970 | | | | 441,788 | |
WellCare Health Plans, Inc.* | | | 1,800 | | | | 466,506 | |
| | | | | | | | |
| | | | | | | 21,540,315 | |
| | |
Health Care Technology 0.1% | | | | | | | | |
Cerner Corp. | | | 10,900 | | | | 743,053 | |
| | |
Hotels, Restaurants & Leisure 1.9% | | | | | | | | |
Carnival Corp. | | | 13,300 | | | | 581,343 | |
Chipotle Mexican Grill, Inc.* | | | 910 | | | | 764,828 | |
Darden Restaurants, Inc. | | | 4,353 | | | | 514,612 | |
Hilton Worldwide Holdings, Inc. | | | 10,160 | | | | 945,998 | |
Marriott International, Inc. (Class A Stock) | | | 9,440 | | | | 1,174,053 | |
McDonald’s Corp. | | | 26,550 | | | | 5,700,550 | |
MGM Resorts International | | | 16,900 | | | | 468,468 | |
Norwegian Cruise Line Holdings Ltd.* | | | 7,000 | | | | 362,390 | |
Royal Caribbean Cruises Ltd. | | | 5,900 | | | | 639,147 | |
Starbucks Corp. | | | 41,800 | | | | 3,695,956 | |
Wynn Resorts Ltd. | | | 3,300 | | | | 358,776 | |
Yum! Brands, Inc. | | | 10,764 | | | | 1,220,960 | |
| | | | | | | | |
| | | | | | | 16,427,081 | |
See Notes to Financial Statements.
| | | | |
| PGIM QMA Stock Index Fund | | | 23 | |
Schedule of Investments(continued)
as of September 30, 2019
| | | | | | | | |
| Description | | Shares | | | Value | |
COMMON STOCKS (Continued) | | | | | | | | |
| | |
Household Durables 0.4% | | | | | | | | |
D.R. Horton, Inc. | | | 11,400 | | | $ | 600,894 | |
Garmin Ltd. | | | 4,300 | | | | 364,167 | |
Leggett & Platt, Inc. | | | 3,400 | | | | 139,196 | |
Lennar Corp. (Class A Stock) | | | 9,800 | | | | 547,330 | |
Mohawk Industries, Inc.* | | | 2,240 | | | | 277,917 | |
Newell Brands, Inc. | | | 11,727 | | | | 219,529 | |
NVR, Inc.* | | | 100 | | | | 371,735 | |
PulteGroup, Inc. | | | 8,611 | | | | 314,732 | |
Whirlpool Corp. | | | 2,185 | | | | 346,017 | |
| | | | | | | | |
| | | | | | | 3,181,517 | |
| | |
Household Products 1.8% | | | | | | | | |
Church & Dwight Co., Inc. | | | 8,700 | | | | 654,588 | |
Clorox Co. (The) | | | 4,432 | | | | 673,088 | |
Colgate-Palmolive Co. | | | 30,060 | | | | 2,209,710 | |
Kimberly-Clark Corp. | | | 11,916 | | | | 1,692,668 | |
Procter & Gamble Co. (The) | | | 87,323 | | | | 10,861,235 | |
| | | | | | | | |
| | | | | | | 16,091,289 | |
| | |
Independent Power & Renewable Electricity Producers 0.1% | | | | | | | | |
AES Corp. | | | 21,300 | | | | 348,042 | |
NRG Energy, Inc. | | | 8,700 | | | | 344,520 | |
| | | | | | | | |
| | | | | | | 692,562 | |
| | |
Industrial Conglomerates 1.3% | | | | | | | | |
3M Co. | | | 20,178 | | | | 3,317,263 | |
General Electric Co. | | | 303,807 | | | | 2,716,035 | |
Honeywell International, Inc. | | | 25,085 | | | | 4,244,382 | |
Roper Technologies, Inc. | | | 3,680 | | | | 1,312,288 | |
| | | | | | | | |
| | | | | | | 11,589,968 | |
| | |
Insurance 2.4% | | | | | | | | |
Aflac, Inc. | | | 25,400 | | | | 1,328,928 | |
Allstate Corp. (The) | | | 11,508 | | | | 1,250,689 | |
American International Group, Inc. | | | 30,351 | | | | 1,690,551 | |
Aon PLC | | | 8,189 | | | | 1,585,145 | |
Arthur J Gallagher & Co. | | | 6,200 | | | | 555,334 | |
Assurant, Inc. | | | 2,100 | | | | 264,222 | |
Chubb Ltd. | | | 15,953 | | | | 2,575,452 | |
Cincinnati Financial Corp. | | | 5,307 | | | | 619,168 | |
Everest Re Group Ltd. | | | 1,550 | | | | 412,440 | |
See Notes to Financial Statements.
| | | | | | | | |
| Description | | Shares | | | Value | |
COMMON STOCKS (Continued) | | | | | | | | |
| | |
Insurance (cont’d.) | | | | | | | | |
Globe Life, Inc. | | | 3,433 | | | $ | 328,744 | |
Hartford Financial Services Group, Inc. (The) | | | 12,253 | | | | 742,654 | |
Lincoln National Corp. | | | 6,951 | | | | 419,284 | |
Loews Corp. | | | 8,617 | | | | 443,603 | |
Marsh & McLennan Cos., Inc. | | | 17,740 | | | | 1,774,887 | |
MetLife, Inc. | | | 28,750 | | | | 1,355,850 | |
Principal Financial Group, Inc. | | | 9,000 | | | | 514,260 | |
Progressive Corp. (The) | | | 20,416 | | | | 1,577,136 | |
Prudential Financial, Inc.(g) | | | 14,100 | | | | 1,268,295 | |
Travelers Cos., Inc. (The) | | | 9,231 | | | | 1,372,557 | |
Unum Group | | | 7,026 | | | | 208,813 | |
Willis Towers Watson PLC | | | 4,500 | | | | 868,365 | |
| | | | | | | | |
| | | | | | | 21,156,377 | |
| | |
Interactive Media & Services 4.7% | | | | | | | | |
Alphabet, Inc. (Class A Stock)* | | | 10,530 | | | | 12,858,604 | |
Alphabet, Inc. (Class C Stock)* | | | 10,632 | | | | 12,960,408 | |
Facebook, Inc. (Class A Stock)* | | | 83,960 | | | | 14,951,597 | |
TripAdvisor, Inc.* | | | 3,500 | | | | 135,380 | |
Twitter, Inc.* | | | 25,100 | | | | 1,034,120 | |
| | | | | | | | |
| | | | | | | 41,940,109 | |
| | |
Internet & Direct Marketing Retail 3.4% | | | | | | | | |
Amazon.com, Inc.* | | | 14,560 | | | | 25,274,849 | |
Booking Holdings, Inc.* | | | 1,570 | | | | 3,081,298 | |
eBay, Inc. | | | 27,440 | | | | 1,069,611 | |
Expedia Group, Inc. | | | 4,700 | | | | 631,727 | |
| | | | | | | | |
| | | | | | | 30,057,485 | |
| | |
IT Services 5.4% | | | | | | | | |
Accenture PLC (Class A Stock) | | | 22,370 | | | | 4,302,870 | |
Akamai Technologies, Inc.* | | | 5,900 | | | | 539,142 | |
Alliance Data Systems Corp. | | | 1,390 | | | | 178,101 | |
Automatic Data Processing, Inc. | | | 15,148 | | | | 2,445,190 | |
Broadridge Financial Solutions, Inc. | | | 4,100 | | | | 510,163 | |
Cognizant Technology Solutions Corp. (Class A Stock) | | | 19,100 | | | | 1,151,062 | |
DXC Technology Co. | | | 8,259 | | | | 243,641 | |
Fidelity National Information Services, Inc. | | | 21,500 | | | | 2,854,340 | |
Fiserv, Inc.* | | | 19,800 | | | | 2,051,082 | |
FleetCor Technologies, Inc.* | | | 3,060 | | | | 877,547 | |
Gartner, Inc.* | | | 3,270 | | | | 467,577 | |
Global Payments, Inc. | | | 10,194 | | | | 1,620,846 | |
See Notes to Financial Statements.
| | | | |
| PGIM QMA Stock Index Fund | | | 25 | |
Schedule of Investments(continued)
as of September 30, 2019
| | | | | | | | |
| Description | | Shares | | | Value | |
COMMON STOCKS (Continued) | | | | | | | | |
| | |
IT Services (cont’d.) | | | | | | | | |
International Business Machines Corp. | | | 31,074 | | | $ | 4,518,781 | |
Jack Henry & Associates, Inc. | | | 2,700 | | | | 394,119 | |
Leidos Holdings, Inc. | | | 4,500 | | | | 386,460 | |
Mastercard, Inc. (Class A Stock) | | | 31,220 | | | | 8,478,415 | |
Paychex, Inc. | | | 10,925 | | | | 904,262 | |
PayPal Holdings, Inc.* | | | 41,160 | | | | 4,263,764 | |
VeriSign, Inc.* | | | 3,780 | | | | 713,021 | |
Visa, Inc. (Class A Stock) | | | 60,510 | | | | 10,408,325 | |
Western Union Co. (The) | | | 14,552 | | | | 337,170 | |
| | | | | | | | |
| | | | | | | 47,645,878 | |
| | |
Leisure Products 0.1% | | | | | | | | |
Hasbro, Inc. | | | 4,154 | | | | 493,038 | |
| | |
Life Sciences Tools & Services 1.0% | | | | | | | | |
Agilent Technologies, Inc. | | | 10,898 | | | | 835,114 | |
Illumina, Inc.* | | | 5,130 | | | | 1,560,649 | |
IQVIA Holdings, Inc.* | | | 6,000 | | | | 896,280 | |
Mettler-Toledo International, Inc.* | | | 950 | | | | 669,180 | |
PerkinElmer, Inc. | | | 3,870 | | | | 329,608 | |
Thermo Fisher Scientific, Inc. | | | 14,122 | | | | 4,113,315 | |
Waters Corp.* | | | 2,350 | | | | 524,590 | |
| | | | | | | | |
| | | | | | | 8,928,736 | |
| | |
Machinery 1.5% | | | | | | | | |
Caterpillar, Inc. | | | 19,596 | | | | 2,475,171 | |
Cummins, Inc. | | | 5,006 | | | | 814,326 | |
Deere & Co. | | | 10,980 | | | | 1,852,106 | |
Dover Corp. | | | 4,962 | | | | 494,017 | |
Flowserve Corp. | | | 4,300 | | | | 200,853 | |
Fortive Corp. | | | 10,150 | | | | 695,884 | |
IDEX Corp. | | | 2,500 | | | | 409,700 | |
Illinois Tool Works, Inc. | | | 10,326 | | | | 1,615,916 | |
Ingersoll-Rand PLC | | | 8,600 | | | | 1,059,606 | |
PACCAR, Inc. | | | 12,164 | | | | 851,602 | |
Parker-Hannifin Corp. | | | 4,468 | | | | 806,965 | |
Pentair PLC | | | 5,046 | | | | 190,739 | |
Snap-on, Inc. | | | 2,042 | | | | 319,655 | |
Stanley Black & Decker, Inc. | | | 5,388 | | | | 778,081 | |
Wabtec Corp. | | | 5,760 | | | | 413,913 | |
Xylem, Inc. | | | 6,050 | | | | 481,701 | |
| | | | | | | | |
| | | | | | | 13,460,235 | |
See Notes to Financial Statements.
| | | | | | | | |
| Description | | Shares | | | Value | |
COMMON STOCKS (Continued) | | | | | | | | |
| | |
Media 1.4% | | | | | | | | |
CBS Corp. (Class B Stock) | | | 10,976 | | | $ | 443,101 | |
Charter Communications, Inc. (Class A Stock)* | | | 5,700 | | | | 2,349,084 | |
Comcast Corp. (Class A Stock) | | | 158,120 | | | | 7,128,050 | |
Discovery, Inc. (Class A Stock)* | | | 5,500 | | | | 146,465 | |
Discovery, Inc. (Class C Stock)* | | | 11,900 | | | | 292,978 | |
DISH Network Corp. (Class A Stock)* | | | 8,000 | | | | 272,560 | |
Fox Corp. (Class A Stock) | | | 12,266 | | | | 386,808 | |
Fox Corp. (Class B Stock) | | | 4,866 | | | | 153,474 | |
Interpublic Group of Cos., Inc. (The) | | | 12,988 | | | | 280,021 | |
News Corp. (Class A Stock) | | | 13,275 | | | | 184,788 | |
News Corp. (Class B Stock) | | | 4,100 | | | | 58,610 | |
Omnicom Group, Inc. | | | 7,734 | | | | 605,572 | |
| | | | | | | | |
| | | | | | | 12,301,511 | |
| | |
Metals & Mining 0.2% | | | | | | | | |
Freeport-McMoRan, Inc. | | | 50,192 | | | | 480,338 | |
Newmont Goldcorp Corp. | | | 28,097 | | | | 1,065,438 | |
Nucor Corp. | | | 10,612 | | | | 540,257 | |
| | | | | | | | |
| | | | | | | 2,086,033 | |
| | |
Multiline Retail 0.5% | | | | | | | | |
Dollar General Corp. | | | 9,000 | | | | 1,430,460 | |
Dollar Tree, Inc.* | | | 8,242 | | | | 940,907 | |
Kohl’s Corp. | | | 5,350 | | | | 265,681 | |
Macy’s, Inc. | | | 9,982 | | | | 155,120 | |
Nordstrom, Inc.(a) | | | 3,300 | | | | 111,111 | |
Target Corp. | | | 17,882 | | | | 1,911,765 | |
| | | | | | | | |
| | | | | | | 4,815,044 | |
| | |
Multi-Utilities 1.1% | | | | | | | | |
Ameren Corp. | | | 8,169 | | | | 653,928 | |
CenterPoint Energy, Inc. | | | 17,379 | | | | 524,498 | |
CMS Energy Corp. | | | 9,900 | | | | 633,105 | |
Consolidated Edison, Inc. | | | 11,451 | | | | 1,081,776 | |
Dominion Energy, Inc. | | | 27,850 | | | | 2,256,964 | |
DTE Energy Co. | | | 6,587 | | | | 875,808 | |
NiSource, Inc. | | | 12,600 | | | | 376,992 | |
Public Service Enterprise Group, Inc. | | | 17,394 | | | | 1,079,820 | |
Sempra Energy | | | 9,678 | | | | 1,428,570 | |
WEC Energy Group, Inc. | | | 10,933 | | | | 1,039,728 | |
| | | | | | | | |
| | | | | | | 9,951,189 | |
See Notes to Financial Statements.
| | | | |
| PGIM QMA Stock Index Fund | | | 27 | |
Schedule of Investments(continued)
as of September 30, 2019
| | | | | | | | |
| Description | | Shares | | | Value | |
COMMON STOCKS (Continued) | | | | | | | | |
| | |
Oil, Gas & Consumable Fuels 4.0% | | | | | | | | |
Apache Corp. | | | 12,148 | | | $ | 310,989 | |
Cabot Oil & Gas Corp. | | | 13,500 | | | | 237,195 | |
Chevron Corp. | | | 66,222 | | | | 7,853,929 | |
Cimarex Energy Co. | | | 3,200 | | | | 153,408 | |
Concho Resources, Inc. | | | 6,600 | | | | 448,140 | |
ConocoPhillips | | | 38,457 | | | | 2,191,280 | |
Devon Energy Corp. | | | 13,200 | | | | 317,592 | |
Diamondback Energy, Inc. | | | 5,300 | | | | 476,523 | |
EOG Resources, Inc. | | | 20,200 | | | | 1,499,244 | |
Exxon Mobil Corp. | | | 147,752 | | | | 10,432,769 | |
Hess Corp. | | | 8,734 | | | | 528,232 | |
HollyFrontier Corp. | | | 5,100 | | | | 273,564 | |
Kinder Morgan, Inc. | | | 67,780 | | | | 1,396,946 | |
Marathon Oil Corp. | | | 27,578 | | | | 338,382 | |
Marathon Petroleum Corp. | | | 22,676 | | | | 1,377,567 | |
Noble Energy, Inc. | | | 15,600 | | | | 350,376 | |
Occidental Petroleum Corp. | | | 30,579 | | | | 1,359,848 | |
ONEOK, Inc. | | | 14,500 | | | | 1,068,505 | |
Phillips 66 | | | 15,128 | | | | 1,549,107 | |
Pioneer Natural Resources Co. | | | 5,900 | | | | 742,043 | |
Valero Energy Corp. | | | 14,300 | | | | 1,218,932 | |
Williams Cos., Inc. (The) | | | 41,892 | | | | 1,007,922 | |
| | | | | | | | |
| | | | | | | 35,132,493 | |
| | |
Personal Products 0.2% | | | | | | | | |
Coty, Inc. (Class A Stock) | | | 8,700 | | | | 91,437 | |
Estee Lauder Cos., Inc. (The) (Class A Stock) | | | 7,670 | | | | 1,525,946 | |
| | | | | | | | |
| | | | | | | 1,617,383 | |
| | |
Pharmaceuticals 4.2% | | | | | | | | |
Allergan PLC | | | 10,995 | | | | 1,850,349 | |
Bristol-Myers Squibb Co. | | | 56,879 | | | | 2,884,334 | |
Eli Lilly & Co. | | | 29,597 | | | | 3,309,832 | |
Johnson & Johnson | | | 92,059 | | | | 11,910,593 | |
Merck & Co., Inc. | | | 89,293 | | | | 7,516,685 | |
Mylan NV* | | | 17,000 | | | | 336,260 | |
Nektar Therapeutics* | | | 5,900 | | | | 107,468 | |
Perrigo Co. PLC | | | 4,100 | | | | 229,149 | |
Pfizer, Inc. | | | 192,863 | | | | 6,929,568 | |
Zoetis, Inc. | | | 16,800 | | | | 2,093,112 | |
| | | | | | | | |
| | | | | | | 37,167,350 | |
See Notes to Financial Statements.
| | | | | | | | |
| Description | | Shares | | | Value | |
COMMON STOCKS (Continued) | | | | | | | | |
| | |
Professional Services 0.3% | | | | | | | | |
Equifax, Inc. | | | 4,330 | | | $ | 609,101 | |
IHS Markit Ltd.* | | | 12,800 | | | | 856,064 | |
Nielsen Holdings PLC | | | 12,400 | | | | 263,500 | |
Robert Half International, Inc. | | | 3,900 | | | | 217,074 | |
Verisk Analytics, Inc. | | | 5,800 | | | | 917,212 | |
| | | | | | | | |
| | | | | | | 2,862,951 | |
| | |
Real Estate Management & Development 0.1% | | | | | | | | |
CBRE Group, Inc. (Class A Stock)* | | | 10,400 | | | | 551,304 | |
| | |
Road & Rail 0.9% | | | | | | | | |
CSX Corp. | | | 26,918 | | | | 1,864,610 | |
J.B. Hunt Transport Services, Inc. | | | 3,050 | | | | 337,483 | |
Kansas City Southern | | | 3,500 | | | | 465,535 | |
Norfolk Southern Corp. | | | 9,331 | | | | 1,676,407 | |
Union Pacific Corp. | | | 24,636 | | | | 3,990,539 | |
| | | | | | | | |
| | | | | | | 8,334,574 | |
| | |
Semiconductors & Semiconductor Equipment 3.8% | | | | | | | | |
Advanced Micro Devices, Inc.* | | | 34,850 | | | | 1,010,301 | |
Analog Devices, Inc. | | | 13,047 | | | | 1,457,741 | |
Applied Materials, Inc. | | | 32,088 | | | | 1,601,191 | |
Broadcom, Inc. | | | 13,969 | | | | 3,856,422 | |
Intel Corp. | | | 154,548 | | | | 7,963,858 | |
KLA Corp. | | | 5,690 | | | | 907,271 | |
Lam Research Corp. | | | 5,042 | | | | 1,165,257 | |
Maxim Integrated Products, Inc. | | | 9,400 | | | | 544,354 | |
Microchip Technology, Inc.(a) | | | 8,460 | | | | 786,019 | |
Micron Technology, Inc.* | | | 37,916 | | | | 1,624,701 | |
NVIDIA Corp. | | | 21,320 | | | | 3,711,172 | |
Qorvo, Inc.* | | | 4,071 | | | | 301,824 | |
QUALCOMM, Inc. | | | 42,400 | | | | 3,234,272 | |
Skyworks Solutions, Inc. | | | 5,800 | | | | 459,650 | |
Texas Instruments, Inc. | | | 32,752 | | | | 4,232,868 | |
Xilinx, Inc. | | | 9,000 | | | | 863,100 | |
| | | | | | | | |
| | | | | | | 33,720,001 | |
| | |
Software 6.5% | | | | | | | | |
Adobe, Inc.* | | | 16,910 | | | | 4,671,388 | |
ANSYS, Inc.* | | | 3,000 | | | | 664,080 | |
Autodesk, Inc.* | | | 7,620 | | | | 1,125,474 | |
Cadence Design Systems, Inc.* | | | 9,500 | | | | 627,760 | |
See Notes to Financial Statements.
| | | | |
| PGIM QMA Stock Index Fund | | | 29 | |
Schedule of Investments(continued)
as of September 30, 2019
| | | | | | | | |
| Description | | Shares | | | Value | |
COMMON STOCKS (Continued) | | | | | | | | |
| | |
Software (cont’d.) | | | | | | | | |
Citrix Systems, Inc. | | | 4,460 | | | $ | 430,479 | |
Fortinet, Inc.* | | | 4,900 | | | | 376,124 | |
Intuit, Inc. | | | 9,150 | | | | 2,433,351 | |
Microsoft Corp. | | | 266,712 | | | | 37,080,969 | |
Oracle Corp. | | | 77,090 | | | | 4,242,263 | |
salesforce.com, Inc.* | | | 30,360 | | | | 4,506,638 | |
Symantec Corp. | | | 19,317 | | | | 456,461 | |
Synopsys, Inc.* | | | 5,400 | | | | 741,150 | |
| | | | | | | | |
| | | | | | | 57,356,137 | |
| | |
Specialty Retail 2.3% | | | | | | | | |
Advance Auto Parts, Inc. | | | 2,450 | | | | 405,230 | |
AutoZone, Inc.* | | | 920 | | | | 997,850 | |
Best Buy Co., Inc. | | | 8,100 | | | | 558,819 | |
CarMax, Inc.* | | | 5,700 | | | | 501,600 | |
Gap, Inc. (The) | | | 6,913 | | | | 120,010 | |
Home Depot, Inc. (The) | | | 38,264 | | | | 8,878,013 | |
L Brands, Inc. | | | 7,622 | | | | 149,315 | |
Lowe’s Cos., Inc. | | | 26,896 | | | | 2,957,484 | |
O’Reilly Automotive, Inc.* | | | 2,680 | | | | 1,068,007 | |
Ross Stores, Inc. | | | 12,800 | | | | 1,406,080 | |
Tiffany & Co. | | | 3,570 | | | | 330,689 | |
TJX Cos., Inc. (The) | | | 42,028 | | | | 2,342,641 | |
Tractor Supply Co. | | | 4,100 | | | | 370,804 | |
Ulta Beauty, Inc.* | | | 2,020 | | | | 506,313 | |
| | | | | | | | |
| | | | | | | 20,592,855 | |
| | |
Technology Hardware, Storage & Peripherals 4.1% | | | | | | | | |
Apple, Inc. | | | 148,428 | | | | 33,243,419 | |
Hewlett Packard Enterprise Co. | | | 45,202 | | | | 685,714 | |
HP, Inc. | | | 51,402 | | | | 972,526 | |
NetApp, Inc. | | | 7,900 | | | | 414,829 | |
Seagate Technology PLC | | | 7,800 | | | | 419,562 | |
Western Digital Corp. | | | 10,225 | | | | 609,819 | |
Xerox Holdings Corp. | | | 6,425 | | | | 192,172 | |
| | | | | | | | |
| | | | | | | 36,538,041 | |
| | |
Textiles, Apparel & Luxury Goods 0.7% | | | | | | | | |
Capri Holdings Ltd.* | | | 4,700 | | | | 155,852 | |
Hanesbrands, Inc. | | | 12,500 | | | | 191,500 | |
NIKE, Inc. (Class B Stock) | | | 43,574 | | | | 4,092,470 | |
PVH Corp. | | | 2,500 | | | | 220,575 | |
See Notes to Financial Statements.
| | | | | | | | |
| Description | | Shares | | | Value | |
COMMON STOCKS (Continued) | | | | | | | | |
| | |
Textiles, Apparel & Luxury Goods (cont’d.) | | | | | | | | |
Ralph Lauren Corp. | | | 2,000 | | | $ | 190,940 | |
Tapestry, Inc. | | | 9,600 | | | | 250,080 | |
Under Armour, Inc. (Class A Stock)* | | | 6,400 | | | | 127,616 | |
Under Armour, Inc. (Class C Stock)* | | | 6,367 | | | | 115,434 | |
VF Corp. | | | 11,436 | | | | 1,017,689 | |
| | | | | | | | |
| | | | | | | 6,362,156 | |
| | |
Tobacco 0.8% | | | | | | | | |
Altria Group, Inc. | | | 64,379 | | | | 2,633,101 | |
Philip Morris International, Inc. | | | 54,079 | | | | 4,106,219 | |
| | | | | | | | |
| | | | | | | 6,739,320 | |
| | |
Trading Companies & Distributors 0.2% | | | | | | | | |
Fastenal Co. | | | 19,800 | | | | 646,866 | |
United Rentals, Inc.* | | | 2,700 | | | | 336,528 | |
W.W. Grainger, Inc. | | | 1,534 | | | | 455,828 | |
| | | | | | | | |
| | | | | | | 1,439,222 | |
| | |
Water Utilities 0.1% | | | | | | | | |
American Water Works Co., Inc. | | | 6,400 | | | | 795,072 | |
| | |
Wireless Telecommunication Services 0.1% | | | | | | | | |
T-Mobile US, Inc.* | | | 10,500 | | | | 827,085 | |
| | | | | | | | |
TOTAL COMMON STOCKS
(cost $211,230,856) | | | | | | | 859,338,033 | |
| | | | | | | | |
| | |
EXCHANGE-TRADED FUND 0.4% | | | | | | | | |
iShares Core S&P 500 ETF
(cost $3,200,124) | | | 12,700 | | | | 3,791,204 | |
| | | | | | | | |
TOTAL LONG-TERM INVESTMENTS
(cost $214,430,980) | | | | | | | 863,129,237 | |
| | | | | | | | |
See Notes to Financial Statements.
| | | | |
| PGIM QMA Stock Index Fund | | | 31 | |
Schedule of Investments(continued)
as of September 30, 2019
| | | | | | | | | | | | | | | | |
| Description | | | | | | | | Shares | | | Value | |
SHORT-TERM INVESTMENTS 2.8% | | | | | | | | | |
| | |
AFFILIATED MUTUAL FUNDS 2.7% | | | | | | | | | |
PGIM Core Ultra Short Bond Fund(w) | | | | | | | | | | | 22,119,442 | | | $ | 22,119,442 | |
PGIM Institutional Money Market Fund
(cost $1,554,043; includes $1,544,782 of cash collateral for securities on loan)(b)(w) | | | | 1,553,966 | | | | 1,554,121 | |
| | | | | | | | | | | | | | | | |
TOTAL AFFILIATED MUTUAL FUNDS
(cost $23,673,485) | | | | | | | | 23,673,563 | |
| | | | | | | | | | | | | | | | |
| | | | |
| | | Interest
Rate | | | Maturity
Date | | | Principal
Amount (000)# | | | | |
U.S. TREASURY OBLIGATION 0.1% | |
U.S. Treasury Bills(k)
(cost $1,194,997) | | | 1.909 | %(n) | | | 12/19/19 | | | | 1,200 | | | | 1,195,457 | |
| | | | | | | | | | | | | | | | |
TOTAL SHORT-TERM INVESTMENTS
(cost $24,868,482) | | | | | | | | | | | | | | | 24,869,020 | |
| | | | | | | | | | | | | | | | |
TOTAL INVESTMENTS 100.2%
(cost $239,299,462) | | | | | | | | | | | | | | | 887,998,257 | |
Liabilities in excess of other assets(z) (0.2)% | | | | | | | | | | | | | | | (1,767,848 | ) |
| | | | | | | | | | | | | | | | |
NET ASSETS 100.0% | | | | | | | | | | | | | | $ | 886,230,409 | |
| | | | | | | | | | | | | | | | |
Below is a list of the abbreviation(s) used in the annual report:
USD—US Dollar
ETF—Exchange-Traded Fund
LIBOR—London Interbank Offered Rate
NASDAQ—National Association of Securities Dealers Automated Quotations
REITs—Real Estate Investment Trust
S&P—Standard & Poor’s
| * | Non-income producing security. |
| # | Principal amount is shown in U.S. dollars unless otherwise stated. |
| (a) | All or a portion of security is on loan. The aggregate market value of such securities, including those sold and pending settlement, is $1,541,702; cash collateral of $1,544,782 (included in liabilities) was received with which the Fund purchased highly liquid short-term investments. |
| (b) | Represents security purchased with cash collateral received for securities on loan and includes dividend reinvestment. |
| (g) | An affiliated security. |
| (k) | Represents security, or a portion thereof, segregated as collateral for centrally cleared/exchange-traded derivatives. |
| (n) | Rate shown reflects yield to maturity at purchased date. |
| (w) | PGIM Investments LLC, the manager of the Fund, also serves as manager of the PGIM Core Ultra Short Bond Fund and PGIM Institutional Money Market Fund. |
| (z) | Includes net unrealized appreciation/(depreciation) and/or market value of the below holdings which are excluded from the Schedule of Investments: |
See Notes to Financial Statements.
Futures contracts outstanding at September 30, 2019:
| | | | | | | | | | | | | | | | |
Number of
Contracts | | | Type | | Expiration
Date | | | Current
Notional
Amount | | | Value /
Unrealized
Appreciation
(Depreciation) | |
| | | | Long Positions: | | | | | | | | | | | | |
| | 62 | | | S&P 500 E-Mini Index | | | Dec. 2019 | | | $ | 9,233,350 | | | $ | (75,576 | ) |
| | 19 | | | S&P 500 Index | | | Dec. 2019 | | | | 14,147,875 | | | | (109,564 | ) |
| | | | | | | | | | | | | | | | |
| | | | | | | | | | | | | | $ | (185,140 | ) |
| | | | | | | | | | | | | | | | |
Summary of Collateral for Centrally Cleared/Exchange-traded Derivatives:
Cash and securities segregated as collateral, including pending settlement for closed positions, to cover requirements for centrally cleared/exchange-traded derivatives are listed by broker as follows:
| | | | | | | | |
Broker | | Cash and/or Foreign Currency | | | Securities Market Value | |
UBS Securities LLC | | $ | — | | | $ | 1,195,457 | |
| | | | | | | | |
Fair Value Measurements:
Various inputs are used in determining the value of the Fund’s investments. These inputs are summarized in the three broad levels listed below.
Level 1—unadjusted quoted prices generally in active markets for identical securities.
Level 2—quoted prices for similar securities, interest rates and yield curves, prepayment speeds, foreign currency exchange rates and other observable inputs.
Level 3—unobservable inputs for securities valued in accordance with Board approved fair valuation procedures.
The following is a summary of the inputs used as of September 30, 2019 in valuing such portfolio securities:
| | | | | | | | | | | | |
| | | Level 1 | | | Level 2 | | | Level 3 | |
Investments in Securities | | | | | | | | | | | | |
Common Stocks | | | | | | | | | | | | |
Aerospace & Defense | | $ | 23,383,620 | | | $ | — | | | $ | — | |
Air Freight & Logistics | | | 4,980,800 | | | | — | | | | — | |
Airlines | | | 3,354,092 | | | | — | | | | — | |
Auto Components | | | 1,004,751 | | | | — | | | | — | |
Automobiles | | | 3,101,710 | | | | — | | | | — | |
Banks | | | 46,902,781 | | | | — | | | | — | |
Beverages | | | 16,704,348 | | | | — | | | | — | |
Biotechnology | | | 18,337,584 | | | | — | | | | — | |
Building Products | | | 2,406,327 | | | | — | | | | — | |
Capital Markets | | | 23,116,089 | | | | — | | | | — | |
Chemicals | | | 16,817,019 | | | | — | | | | — | |
Commercial Services & Supplies | | | 3,710,897 | | | | — | | | | — | |
Communications Equipment | | | 9,312,293 | | | | — | | | | — | |
See Notes to Financial Statements.
| | | | |
| PGIM QMA Stock Index Fund | | | 33 | |
Schedule of Investments(continued)
as of September 30, 2019
| | | | | | | | | | | | |
| | | Level 1 | | | Level 2 | | | Level 3 | |
Investments in Securities (continued) | | | | | | | | | | | | |
Common Stocks (continued) | | | | | | | | | | | | |
Construction & Engineering | | $ | 546,840 | | | $ | — | | | $ | — | |
Construction Materials | | | 1,341,258 | | | | — | | | | — | |
Consumer Finance | | | 5,943,247 | | | | — | | | | — | |
Containers & Packaging | | | 3,127,774 | | | | — | | | | — | |
Distributors | | | 809,205 | | | | — | | | | — | |
Diversified Consumer Services | | | 158,726 | | | | — | | | | — | |
Diversified Financial Services | | | 14,193,205 | | | | — | | | | — | |
Diversified Telecommunication Services | | | 18,754,143 | | | | — | | | | — | |
Electric Utilities | | | 18,538,380 | | | | — | | | | — | |
Electrical Equipment | | | 4,046,546 | | | | — | | | | — | |
Electronic Equipment, Instruments & Components | | | 4,449,673 | | | | — | | | | — | |
Energy Equipment & Services | | | 3,331,400 | | | | — | | | | — | |
Entertainment | | | 15,435,291 | | | | — | | | | — | |
Equity Real Estate Investment Trusts (REITs) | | | 27,017,480 | | | | — | | | | — | |
Food & Staples Retailing | | | 13,792,430 | | | | — | | | | — | |
Food Products | | | 10,145,199 | | | | — | | | | — | |
Gas Utilities | | | 432,782 | | | | — | | | | — | |
Health Care Equipment & Supplies | | | 31,004,779 | | | | — | | | | — | |
Health Care Providers & Services | | | 21,540,315 | | | | — | | | | — | |
Health Care Technology | | | 743,053 | | | | — | | | | — | |
Hotels, Restaurants & Leisure | | | 16,427,081 | | | | — | | | | — | |
Household Durables | | | 3,181,517 | | | | — | | | | — | |
Household Products | | | 16,091,289 | | | | — | | | | — | |
Independent Power & Renewable Electricity Producers | | | 692,562 | | | | — | | | | — | |
Industrial Conglomerates | | | 11,589,968 | | | | — | | | | — | |
Insurance | | | 21,156,377 | | | | — | | | | — | |
Interactive Media & Services | | | 41,940,109 | | | | — | | | | — | |
Internet & Direct Marketing Retail | | | 30,057,485 | | | | — | | | | — | |
IT Services | | | 47,645,878 | | | | — | | | | — | |
Leisure Products | | | 493,038 | | | | — | | | | — | |
Life Sciences Tools & Services | | | 8,928,736 | | | | — | | | | — | |
Machinery | | | 13,460,235 | | | | — | | | | — | |
Media | | | 12,301,511 | | | | — | | | | — | |
Metals & Mining | | | 2,086,033 | | | | — | | | | — | |
Multiline Retail | | | 4,815,044 | | | | — | | | | — | |
Multi-Utilities | | | 9,951,189 | | | | — | | | | — | |
Oil, Gas & Consumable Fuels | | | 35,132,493 | | | | — | | | | — | |
Personal Products | | | 1,617,383 | | | | — | | | | — | |
Pharmaceuticals | | | 37,167,350 | | | | — | | | | — | |
Professional Services | | | 2,862,951 | | | | — | | | | — | |
Real Estate Management & Development | | | 551,304 | | | | — | | | | — | |
Road & Rail | | | 8,334,574 | | | | — | | | | — | |
Semiconductors & Semiconductor Equipment | | | 33,720,001 | | | | — | | | | — | |
Software | | | 57,356,137 | | | | — | | | | — | |
Specialty Retail | | | 20,592,855 | | | | — | | | | — | |
Technology Hardware, Storage & Peripherals | | | 36,538,041 | | | | — | | | | — | |
Textiles, Apparel & Luxury Goods | | | 6,362,156 | | | | — | | | | — | |
See Notes to Financial Statements.
| | | | | | | | | | | | |
| | | Level 1 | | | Level 2 | | | Level 3 | |
Investments in Securities (continued) | | | | | | | | | | | | |
Common Stocks (continued) | | | | | | | | | | | | |
Tobacco | | $ | 6,739,320 | | | $ | — | | | $ | — | |
Trading Companies & Distributors | | | 1,439,222 | | | | — | | | | — | |
Water Utilities | | | 795,072 | | | | — | | | | — | |
Wireless Telecommunication Services | | | 827,085 | | | | — | | | | — | |
Exchange-Traded Fund | | | 3,791,204 | | | | — | | | | — | |
Affiliated Mutual Funds | | | 23,673,563 | | | | — | | | | — | |
U.S. Treasury Obligation | | | — | | | | 1,195,457 | | | | — | |
Other Financial Instruments* | | | | | | | | | | | | |
Futures Contracts | | | (185,140 | ) | | | — | | | | — | |
| | | | | | | | | | | | |
Total | | $ | 886,617,660 | | | $ | 1,195,457 | | | $ | — | |
| | | | | | | | | | | | |
| * | Other financial instruments are derivative instruments not reflected in the Schedule of Investments, such as futures, forwards and centrally cleared swap contracts, which are recorded at the unrealized appreciation (depreciation) on the instrument, and OTC swap contracts which are recorded at fair value. |
Industry Classification:
The industry classification of investments and liabilities in excess of other assets shown as a percentage of net assets as of September 30, 2019 were as follows (unaudited):
| | | | |
Software | | | 6.5 | % |
IT Services | | | 5.4 | |
Banks | | | 5.3 | |
Interactive Media & Services | | | 4.7 | |
Pharmaceuticals | | | 4.2 | |
Technology Hardware, Storage & Peripherals | | | 4.1 | |
Oil, Gas & Consumable Fuels | | | 4.0 | |
Semiconductors & Semiconductor Equipment | | | 3.8 | |
Health Care Equipment & Supplies | | | 3.5 | |
Internet & Direct Marketing Retail | | | 3.4 | |
Equity Real Estate Investment Trusts (REITs) | | | 3.0 | |
Affiliated Mutual Funds (0.2% represents investments purchased with collateral from securities on loan) | | | 2.7 | |
Aerospace & Defense | | | 2.6 | |
Capital Markets | | | 2.6 | |
Health Care Providers & Services | | | 2.4 | |
Insurance | | | 2.4 | |
Specialty Retail | | | 2.3 | |
Diversified Telecommunication Services | | | 2.1 | |
Electric Utilities | | | 2.1 | |
Biotechnology | | | 2.1 | |
Chemicals | | | 1.9 | |
Beverages | | | 1.9 | |
Hotels, Restaurants & Leisure | | | 1.9 | |
| | | | |
Household Products | | | 1.8 | % |
Entertainment | | | 1.7 | |
Diversified Financial Services | | | 1.6 | |
Food & Staples Retailing | | | 1.6 | |
Machinery | | | 1.5 | |
Media | | | 1.4 | |
Industrial Conglomerates | | | 1.3 | |
Food Products | | | 1.1 | |
Multi-Utilities | | | 1.1 | |
Communications Equipment | | | 1.0 | |
Life Sciences Tools & Services | | | 1.0 | |
Road & Rail | | | 0.9 | |
Tobacco | | | 0.8 | |
Textiles, Apparel & Luxury Goods | | | 0.7 | |
Consumer Finance | | | 0.7 | |
Air Freight & Logistics | | | 0.6 | |
Multiline Retail | | | 0.5 | |
Electronic Equipment, Instruments & Components | | | 0.5 | |
Electrical Equipment | | | 0.5 | |
Exchange-Traded Fund | | | 0.4 | |
Commercial Services & Supplies | | | 0.4 | |
Airlines | | | 0.4 | |
Energy Equipment & Services | | | 0.4 | |
Household Durables | | | 0.4 | |
Containers & Packaging | | | 0.4 | |
See Notes to Financial Statements.
| | | | |
| PGIM QMA Stock Index Fund | | | 35 | |
Schedule of Investments(continued)
as of September 30, 2019
Industry Classification (continued):
| | | | |
Automobiles | | | 0.3 | % |
Professional Services | | | 0.3 | |
Building Products | | | 0.3 | |
Metals & Mining | | | 0.2 | |
Personal Products | | | 0.2 | |
Trading Companies & Distributors | | | 0.2 | |
Construction Materials | | | 0.1 | |
U.S. Treasury Obligation | | | 0.1 | |
Auto Components | | | 0.1 | |
Wireless Telecommunication Services | | | 0.1 | |
Distributors | | | 0.1 | |
Water Utilities | | | 0.1 | |
Health Care Technology | | | 0.1 | |
Independent Power & Renewable Electricity Producers | | | 0.1 | |
Real Estate Management & Development | | | 0.1 | % |
Construction & Engineering | | | 0.1 | |
Leisure Products | | | 0.1 | |
Gas Utilities | | | 0.0 | * |
Diversified Consumer Services | | | 0.0 | * |
| | | | |
| | | 100.2 | |
Liabilities in excess of other assets | | | (0.2 | ) |
| | | | |
| | | 100.0 | % |
| | | | |
Effects of Derivative Instruments on the Financial Statements and Primary Underlying Risk Exposure:
The Fund invested in derivative instruments during the reporting period. The primary type of risk associated with these derivative instruments is equity contracts risk. See the Notes to Financial Statements for additional detail regarding these derivative instruments and their risks. The effect of such derivative instruments on the Fund’s financial position and financial performance as reflected in the Statement of Assets and Liabilities and Statement of Operations is presented in the summary below.
Fair values of derivative instruments as of September 30, 2019 as presented in the Statement of Assets and Liabilities:
| | | | | | | | | | | | |
| | | Asset Derivatives | | | Liability Derivatives | |
Derivatives not accounted for as hedging instruments, carried at fair value | | Statement of
Assets and
Liabilities Location | | Fair
Value | | | Statement of
Assets and
Liabilities Location | | Fair
Value | |
| Equity contracts | | — | | $ | — | | | Due from/to broker—
variation margin
futures | | $ | 185,140 | * |
| | | | | | | | | | | | |
| * | Includes cumulative appreciation (depreciation) as reported in the schedule of open futures and centrally cleared swap contracts. Only unsettled variation margin receivable (payable) is reported within the Statement of Assets and Liabilities. |
The effects of derivative instruments on the Statement of Operations for the year ended September 30, 2019 are as follows:
| | | | |
Amount of Realized Gain (Loss) on Derivatives Recognized in Income | |
Derivatives not accounted for as hedging instruments, carried at fair value | | Futures | |
Equity contracts | | $ | 832,220 | |
| | | | |
See Notes to Financial Statements.
| | | | |
Change in Unrealized Appreciation (Depreciation) on Derivatives Recognized in Income | |
Derivatives not accounted for as hedging instruments, carried at fair value | | Futures | |
Equity contracts | | $ | (263,979 | ) |
| | | | |
For the year ended September 30, 2019, the Fund’s average volume of derivative activities is as follows:
|
Futures
Contracts—
Long
Positions(1) |
| $20,628,251 |
| (1) | Notional Amount in USD. |
Financial Instruments/Transactions—Summary of Offsetting and Netting Arrangements:
The Fund entered into financial instruments/transactions during the reporting period that are either offset in accordance with current requirements or are subject to enforceable master netting arrangements or similar agreements that permit offsetting. The information about offsetting and related netting arrangements for financial instruments/transactions, where the legal right toset-off exists, is presented in the summary below.
Offsetting of financial instrument/transaction assets and liabilities:
| | | | | | | | | | | | |
Description | | Gross Market
Value of
Recognized
Assets/(Liabilities) | | | Collateral
Pledged/(Received)(1) | | | Net
Amount | |
Securities on Loan | | $ | 1,541,702 | | | $ | (1,541,702 | ) | | $ | — | |
| | | | | | | | | | | | |
| (1) | Collateral amount disclosed by the Fund is limited to the market value of financial instruments/transactions. |
See Notes to Financial Statements.
| | | | |
| PGIM QMA Stock Index Fund | | | 37 | |
Statement of Assets and Liabilities
as of September 30, 2019
| | | | |
Assets | | | | |
Investments at value, including securities on loan of $1,541,702: | | | | |
Unaffiliated investments (cost $215,190,639) | | $ | 863,056,399 | |
Affiliated investments (cost $24,108,823) | | | 24,941,858 | |
Cash | | | 123 | |
Dividends receivable | | | 754,976 | |
Receivable for Fund shares sold | | | 753,264 | |
Due from broker—variation margin futures | | | 115,395 | |
Prepaid expenses | | | 7,387 | |
| | | | |
Total Assets | | | 889,629,402 | |
| | | | |
| |
Liabilities | | | | |
Payable to broker for collateral for securities on loan | | | 1,544,782 | |
Payable for Fund shares reacquired | | | 1,444,222 | |
Accrued expenses and other liabilities | | | 179,809 | |
Distribution fee payable | | | 129,545 | |
Management fee payable | | | 57,493 | |
Affiliated transfer agent fee payable | | | 43,142 | |
| | | | |
Total Liabilities | | | 3,398,993 | |
| | | | |
| |
Net Assets | | $ | 886,230,409 | |
| | | | |
| | | | | |
Net assets were comprised of: | | | | |
Shares of beneficial interest, at par | | $ | 18,250 | |
Paid-in capital in excess of par | | | 103,253,240 | |
Total distributable earnings (loss) | | | 782,958,919 | |
| | | | |
Net assets, September 30, 2019 | | $ | 886,230,409 | |
| | | | |
See Notes to Financial Statements.
| | | | |
Class A | | | | |
Net asset value and redemption price per share,
($287,076,304 ÷ 5,923,536 shares of beneficial interest issued and outstanding) | | $ | 48.46 | |
Maximum sales charge (3.25% of offering price) | | | 1.63 | |
| | | | |
Maximum offering price to public | | $ | 50.09 | |
| | | | |
| |
Class C | | | | |
Net asset value, offering price and redemption price per share, | | | | |
($70,382,114 ÷ 1,468,636 shares of beneficial interest issued and outstanding) | | $ | 47.92 | |
| | | | |
| |
Class I | | | | |
Net asset value, offering price and redemption price per share, | | | | |
($228,062,816 ÷ 4,682,811 shares of beneficial interest issued and outstanding) | | $ | 48.70 | |
| | | | |
| |
Class Z | | | | |
Net asset value, offering price and redemption price per share, | | | | |
($289,780,145 ÷ 5,950,526 shares of beneficial interest issued and outstanding) | | $ | 48.70 | |
| | | | |
| |
Class R6 | | | | |
Net asset value, offering price and redemption price per share, | | | | |
($10,929,030 ÷ 224,319 shares of beneficial interest issued and outstanding) | | $ | 48.72 | |
| | | | |
See Notes to Financial Statements.
| | | | |
| PGIM QMA Stock Index Fund | | | 39 | |
Statement of Operations
Year Ended September 30, 2019
| | | | |
Net Investment Income (Loss) | | | | |
Income | | | | |
Unaffiliated dividend income (net of $2 foreign withholding tax) | | $ | 17,949,858 | |
Affiliated dividend income | | | 497,682 | |
Income from securities lending, net (including affiliated income of $18,871) | | | 38,974 | |
Interest income | | | 22,451 | |
| | | | |
Total income | | | 18,508,965 | |
| | | | |
| |
Expenses | | | | |
Management fee | | | 1,370,964 | |
Distribution fee(a) | | | 1,648,002 | |
Transfer agent’s fees and expenses (including affiliated expense of $242,652)(a) | | | 963,203 | |
Custodian and accounting fees | | | 114,340 | |
Registration fees(a) | | | 83,209 | |
Shareholders’ reports | | | 60,185 | |
Legal fees and expenses | | | 30,005 | |
Trustees’ fees | | | 27,320 | |
Audit fee | | | 24,596 | |
Miscellaneous | | | 34,565 | |
| | | | |
Total expenses | | | 4,356,389 | |
Less: Fee waiver and/or expense reimbursement(a) | | | (650,687 | ) |
| | | | |
Net expenses | | | 3,705,702 | |
| | | | |
Net investment income (loss) | | | 14,803,263 | |
| | | | |
| |
Realized And Unrealized Gain (Loss) On Investments | | | | |
Net realized gain (loss) on: | | | | |
Investment transactions (including affiliated of $206,342) | | | 133,591,366 | |
Futures transactions | | | 832,220 | |
| | | | |
| | | 134,423,586 | |
| | | | |
Net change in unrealized appreciation (depreciation) on: | | | | |
Investments (including affiliated of $(406,841)) | | | (124,600,240 | ) |
Futures | | | (263,979 | ) |
| | | | |
| | | (124,864,219 | ) |
| | | | |
Net gain (loss) on investment transactions | | | 9,559,367 | |
| | | | |
Net Increase (Decrease) In Net Assets Resulting From Operations | | $ | 24,362,630 | |
| | | | |
| (a) | Class specific expenses and waivers were as follows: |
| | | | | | | | | | | | | | | | | | | | |
| | | Class A | | | Class C | | | Class I | | | Class Z | | | Class R6 | |
Distribution fee | | | 799,026 | | | | 848,976 | | | | — | | | | — | | | | — | |
Transfer agent’s fees and expenses | | | 321,400 | | | | 52,408 | | | | 167,636 | | | | 421,518 | | | | 241 | |
Registration fees | | | 18,154 | | | | 16,395 | | | | 15,742 | | | | 16,792 | | | | 16,126 | |
Fee waiver and/or expense reimbursement | | | (186,475 | ) | | | (59,430 | ) | | | (167,609 | ) | | | (220,592 | ) | | | (16,581 | ) |
See Notes to Financial Statements.
Statements of Changes in Net Assets
| | | | | | | | |
| |
| | | Year Ended September 30, | |
| | |
| | | 2019 | | | 2018 | |
Increase (Decrease) in Net Assets | | | | | | | | |
Operations | | | | | | | | |
Net investment income (loss) | | $ | 14,803,263 | | | $ | 15,737,781 | |
Net realized gain (loss) on investment transactions | | | 134,423,586 | | | | 149,023,023 | |
Net change in unrealized appreciation (depreciation) on investments | | | (124,864,219 | ) | | | 7,889,061 | |
| | | | | | | | |
Net increase (decrease) in net assets resulting from operations | | | 24,362,630 | | | | 172,649,865 | |
| | | | | | | | |
| | |
Dividends and Distributions | | | | | | | | |
Distributions from distributable earnings* | | | | | | | | |
Class A | | | (44,754,456 | ) | | | — | |
Class C | | | (16,634,611 | ) | | | — | |
Class I | | | (44,901,740 | ) | | | — | |
Class Z | | | (58,968,361 | ) | | | — | |
Class R6 | | | (324,876 | ) | | | — | |
| | | | | | | | |
| | | (165,584,044 | ) | | | — | |
| | | | | | | | |
Dividends from net investment income* | | | | | | | | |
Class A | | | | | | | (3,579,338 | ) |
Class C | | | | | | | (876,609 | ) |
Class I | | | | | | | (5,308,178 | ) |
Class Z | | | | | | | (6,219,386 | ) |
Class R6 | | | | | | | (150 | ) |
| | | | | | | | |
| | | * | | | | (15,983,661 | ) |
| | | | | | | | |
Distributions from net realized gains* | | | | | | | | |
Class A | | | | | | | (12,245,362 | ) |
Class C | | | | | | | (4,458,137 | ) |
Class I | | | | | | | (15,438,690 | ) |
Class Z | | | | | | | (18,580,627 | ) |
Class R6 | | | | | | | (445 | ) |
| | | | | | | | |
| | | * | | | | (50,723,261 | ) |
| | | | | | | | |
Fund share transactions (Net of share conversions) | | | | | | | | |
Net proceeds from shares sold | | | 143,095,692 | | | | 124,404,893 | |
Net asset value of shares issued in reinvestment of dividends and distributions | | | 164,718,849 | | | | 66,310,557 | |
Cost of shares reacquired | | | (326,143,965 | ) | | | (360,793,391 | ) |
| | | | | | | | |
Net increase (decrease) in net assets from Fund share transactions | | | (18,329,424 | ) | | | (170,077,941 | ) |
| | | | | | | | |
Total increase (decrease) | | | (159,550,838 | ) | | | (64,134,998 | ) |
| | |
Net Assets: | | | | | | | | |
Beginning of year | | | 1,045,781,247 | | | | 1,109,916,245 | |
| | | | | | | | |
End of year(a) | | $ | 886,230,409 | | | $ | 1,045,781,247 | |
| | | | | | | | |
(a) Includes undistributed/(distributions in excess of) net investment income of: | | $ | * | | | $ | 15,895,549 | |
| | | | | | | | |
| * | For the year ended September 30, 2019, the disclosures have been revised to reflect revisions to RegulationS-X adopted by the SEC in 2018 (refer to Note 9). |
See Notes to Financial Statements.
| | | | |
| PGIM QMA Stock Index Fund | | | 41 | |
Notes to Financial Statements
Prudential Investment Portfolios 8 (the “Trust”) is registered under the Investment Company Act of 1940, as amended (“1940 Act”), as anopen-end management investment company. The Trust currently consists of two funds: PGIM QMA Stock Index Fund, which is a diversified fund, and PGIM Securitized Credit Fund, which is anon-diversified fund for purposes of the 1940 Act and may invest a greater percentage of their assets in the securities of a single company or other issuer than a diversified fund. Investing in anon-diversified fund involves greater risk than investing in a diversified fund because a loss resulting from the decline in value of any one security may represent a greater portion of the total assets of anon-diversified fund. These financial statements relate only to the PGIM QMA Stock Index Fund (the “Fund”).
The investment objective of the Fund is to provide investment results that correspond to the price and yield performance of the Standard & Poor’s 500 Composite Stock Price Index.
1. Accounting Policies
The Fund follows the investment company accounting and reporting guidance of the Financial Accounting Standards Board (“FASB”) Accounting Standard Codification (“ASC”) Topic 946 Financial Services—Investment Companies.The following accounting policies conform to U.S. generally accepted accounting principles. The Fund consistently follows such policies in the preparation of its financial statements.
Securities Valuation:The Fund holds securities and other assets and liabilities that are fair valued at the close of each day (generally, 4:00 PM Eastern time) the New York Stock Exchange (“NYSE”) is open for trading. Fair value is the price that would be received to sell an asset or paid to transfer a liability in an orderly transaction between market participants on the measurement date. The Trust’s Board of Trustees (the “Board”) has adopted valuation procedures for security valuation under which fair valuation responsibilities have been delegated to PGIM Investments LLC (“PGIM Investments” or the “Manager”). Pursuant to the Board’s delegation, the Manager has established a Valuation Committee responsible for supervising the fair valuation of portfolio securities and other assets and liabilities. The valuation procedures permit the Fund to utilize independent pricing vendor services, quotations from market makers, and alternative valuation methods when market quotations are either not readily available or not deemed representative of fair value. A record of the Valuation Committee’s actions is subject to the Board’s review, approval, and ratification at its next regularly scheduled quarterly meeting.
For the fiscal reportingyear-end, securities and other assets and liabilities were fair valued at the close of the last U.S. business day. Trading in certain foreign securities may occur when the NYSE is closed (including weekends and holidays). Because such foreign securities
trade in markets that are open on weekends and U.S. holidays, the values of some of the Fund’s foreign investments may change on days when investors cannot purchase or redeem Fund shares.
Various inputs determine how the Fund’s investments are valued, all of which are categorized according to the three broad levels (Level 1, 2, or 3) detailed in the Schedule of Investments and referred to herein as the “fair value hierarchy” in accordance with FASB ASC Topic 820—Fair Value Measurements and Disclosures.
Common and preferred stocks, exchange-traded funds, and derivative instruments, such as futures or options, that are traded on a national securities exchange are valued at the last sale price as of the close of trading on the applicable exchange where the security principally trades. Securities traded via NASDAQ are valued at the NASDAQ official closing price. To the extent these securities are valued at the last sale price or NASDAQ official closing price, they are classified as Level 1 in the fair value hierarchy. In the event that no sale or official closing price on valuation date exists, these securities are generally valued at the mean between the last reported bid and ask prices, or at the last bid price in the absence of an ask price. These securities are classified as Level 2 in the fair value hierarchy.
Investments inopen-end,non-exchange-traded mutual funds are valued at their net asset values as of the close of the NYSE on the date of valuation. These securities are classified as Level 1 in the fair value hierarchy since they may be purchased or sold at their net asset values on the date of valuation.
Securities and other assets that cannot be priced according to the methods described above are valued based on pricing methodologies approved by the Board. In the event that unobservable inputs are used when determining such valuations, the securities will be classified as Level 3 in the fair value hierarchy.
When determining the fair value of securities, some of the factors influencing the valuation include: the nature of any restrictions on disposition of the securities; assessment of the general liquidity of the securities; the issuer’s financial condition and the markets in which it does business; the cost of the investment; the size of the holding and the capitalization of the issuer; the prices of any recent transactions or bids/offers for such securities or any comparable securities; any available analyst media or other reports or information deemed reliable by the Manager regarding the issuer or the markets or industry in which it operates. Using fair value to price securities may result in a value that is different from a security’s most recent closing price and from the price used by other unaffiliated mutual funds to calculate their net asset values.
Illiquid Securities:Pursuant to Rule22e-4 under the 1940 Act, the Fund has adopted a Board approved Liquidity Risk Management Program (“LRMP”) that requires, among other things, that the Fund limit its illiquid investments that are assets to no more than 15% of net assets. Illiquid securities are those that, because of the absence of a readily available market or due to legal or contractual restrictions on resale, may not reasonably be expected to be
| | | | |
| PGIM QMA Stock Index Fund | | | 43 | |
Notes to Financial Statements(continued)
sold or disposed of in current market conditions in seven calendar days or less without the sale or disposition significantly changing the market value of the investment. The Fund may find it difficult to sell illiquid securities at the time considered most advantageous by its subadviser and may incur transaction costs that would not be incurred in the sale of securities that were freely marketable.
Restricted Securities:Securities acquired in unregistered, private sales from the issuing company or from an affiliate of the issuer are considered restricted as to disposition under federal securities law (“restricted securities”). Such restricted securities are valued pursuant to the valuation procedures noted above. Restricted securities that would otherwise be considered illiquid investments pursuant to the Fund’s LRMP because of legal restrictions on resale to the general public may be traded among qualified institutional buyers under Rule 144A of the Securities Act of 1933. Therefore, these Rule 144A securities, as well as commercial paper that is sold in private placements under Section 4(2) of the Securities Act of 1933, may be classified higher than “illiquid” under the LRMP (i.e. “moderately liquid” or “less liquid” investments). However, the liquidity of the Fund’s investments in restricted securities could be impaired if trading does not develop or declines.
Financial Futures Contracts:A financial futures contract is an agreement to purchase (long) or sell (short) an agreed amount of securities at a set price for delivery on a future date. Upon entering into a financial futures contract, the Fund is required to pledge to the broker an amount of cash and/or other assets equal to a certain percentage of the contract amount. This amount is known as the “initial margin.” Subsequent payments, known as “variation margin,” are made or received by the Fund each day, depending on the daily fluctuations in the value of the underlying security. Such variation margin is recorded for financial statement purposes on a daily basis as unrealized gain (loss). When the contract expires or is closed, the gain (loss) is realized and is presented in the Statement of Operations as net realized gain (loss) on futures transactions.
The Fund invested in financial futures contracts in order to hedge its existing portfolio securities, or securities the Fund intends to purchase, against fluctuations in value caused by changes in prevailing interest rates. Should interest rates move unexpectedly, the Fund may not achieve the anticipated benefits of the financial futures contracts and may realize a loss. The use of futures transactions involves the risk of imperfect correlation in movements in the price of futures contracts, interest rates and the underlying hedged assets. Since futures contracts are exchange-traded, there is minimal counterparty credit risk to the Fund since the exchanges’ clearinghouse acts as counterparty to all exchange-traded futures and guarantees the futures contracts against default.
Master Netting Arrangements:The Trust, on behalf of the Fund, is subject to various Master Agreements, or netting arrangements, with select counterparties. These are agreements
which a subadviser may have negotiated and entered into on behalf of all or a portion of the Fund. A master netting arrangement between the Fund and the counterparty permits the Fund to offset amounts payable by the Fund to the same counterparty against amounts to be received; and by the receipt of collateral from the counterparty by the Fund to cover the Fund’s exposure to the counterparty. However, there is no assurance that such mitigating factors are easily enforceable. In addition to master netting arrangements, the right toset-off exists when all the conditions are met such that each of the parties owes the other determinable amounts, the reporting party has the right toset-off the amount owed with the amount owed by the other party, the reporting party intends toset-off and the right ofset-off is enforceable by law. During the reporting period, there was no intention to settle on a net basis and all amounts are presented on a gross basis on the Statement of Assets and Liabilities.
Securities Lending:The Fund lends its portfolio securities to banks and broker-dealers. The loans are secured by collateral at least equal to the market value of the securities loaned. Collateral pledged by each borrower is invested in an affiliated money market fund and is marked to market daily, based on the previous day’s market value, such that the value of the collateral exceeds the value of the loaned securities. In the event of significant appreciation in value of securities on loan on the last business day of the reporting period, the financial statements may reflect a collateral value that is less than the market value of the loaned securities. Such shortfall is remedied as described above. Loans are subject to termination at the option of the borrower or the Fund. Upon termination of the loan, the borrower will return to the Fund securities identical to the loaned securities. Should the borrower of the securities fail financially, the Fund has the right to repurchase the securities in the open market using the collateral.
The Fund recognizes income, net of any rebate and securities lending agent fees, for lending its securities in the form of fees or interest on the investment of any cash received as collateral. The borrower receives all interest and dividends from the securities loaned and such payments are passed back to the lender in amounts equivalent thereto. The Fund also continues to recognize any unrealized gain (loss) in the market price of the securities loaned and on the change in the value of the collateral invested that may occur during the term of the loan. In addition, realized gain (loss) is recognized on changes in the value of the collateral invested upon liquidation of the collateral. Net earnings from securities lending are disclosed on the Statement of Operations as “Income from securities lending, net”.
Equity and Mortgage Real Estate Investment Trusts (collectively equity REITs):The Fund invested in equity REITs, which report information on the source of their distributions annually. Based on current and historical information, a portion of distributions received from equity REITs during the period is estimated to be dividend income, capital gain or return of capital and recorded accordingly. When material, these estimates are adjusted periodically when the actual source of distributions is disclosed by the equity REITs.
Securities Transactions and Net Investment Income:Securities transactions are recorded on the trade date. Realized gains (losses) from investment and currency transactions are
| | | | |
| PGIM QMA Stock Index Fund | | | 45 | |
Notes to Financial Statements(continued)
calculated on the specific identification method. Dividend income is recorded on theex-date, or for certain foreign securities, when the Fund becomes aware of such dividends. Expenses are recorded on an accrual basis, which may require the use of certain estimates by management that may differ from actual. Net investment income or loss (other than class specific expenses and waivers, which are allocated as noted below) and unrealized and realized gains (losses) are allocated daily to each class of shares based upon the relative proportion of adjusted net assets of each class at the beginning of the day. Class specific expenses and waivers, where applicable, are charged to the respective share classes. Class specific expenses include distribution fees and distribution fee waivers, shareholder servicing fees, transfer agent’s fees and expenses, registration fees and fee waivers and/or expense reimbursements, as applicable.
Taxes:It is the Fund’s policy to continue to meet the requirements of the Internal Revenue Code applicable to regulated investment companies and to distribute all of its taxable net investment income and capital gains, if any, to its shareholders. Therefore, no federal income tax provision is required. Withholding taxes on foreign dividends, interest and capital gains, if any, are recorded, net of reclaimable amounts, at the time the related income is earned.
Dividends and Distributions:The Fund expects to pay dividends from net investment income and distributions from net realized capital gains, if any, annually. Dividends and distributions to shareholders, which are determined in accordance with federal income tax regulations and which may differ from generally accepted accounting principles, are recorded on theex-date. Permanent book/tax differences relating to income and gain (loss) are reclassified between total distributable earnings (loss) andpaid-in capital in excess of par, as appropriate.
Estimates:The preparation of financial statements requires management to make estimates and assumptions that affect the reported amounts and disclosures in the financial statements. Actual results could differ from those estimates.
2. Agreements
The Trust, on behalf of the Fund, has a management agreement with the Manager. Pursuant to this agreement, the Manager has responsibility for all investment advisory services and supervises the subadviser’s performance of such services. In addition, under the management agreement, the Manager provides all of the administrative functions necessary for the organization, operation and management of the Fund. The Manager administers the corporate affairs of the Fund and, in connection therewith, furnishes the Fund with office facilities, together with those ordinary clerical and bookkeeping services which are not being furnished by the Fund’s custodian and the Fund’s transfer agent. The Manager is also
responsible for the staffing and management of dedicated groups of legal, marketing, compliance and related personnel necessary for the operation of the Fund. The legal, marketing, compliance and related personnel are also responsible for the management and oversight of the various service providers to the Fund, including, but not limited to, the custodian, transfer agent, and accounting agent.
The Manager has entered into a subadvisory agreement with QMA LLC (“QMA”) (formerly known as Quantitative Management Associates, LLC). The subadvisory agreement provides that QMA will furnish investment advisory services in connection with the management of the Fund. In connection therewith, QMA is obligated to keep certain books and records of the Fund. The Manager pays for the services of QMA, the cost of compensation of officers of the Fund, occupancy and certain clerical and bookkeeping costs of the Fund. The Fund bears all other costs and expenses.
The management fee paid to the Manager is accrued daily and payable monthly at an annual rate of 0.15% of the Fund’s average daily net assets up to and including $1 billion and 0.10% of such average daily net assets in excess of $1 billion. The effective management fee rate before any waivers and/or expense reimbursements was 0.15% for the year ended September 30, 2019.
The Manager has contractually agreed, through January 31, 2021 to waive a portion of its management fee so that the effective management fee for the Fund will be 0.08% of the average daily net assets of the Fund. Separately, the Manager has contractually agreed, through January 31, 2021, to limit transfer agency, shareholder servicing,sub-transfer agency and blue sky fees, as applicable, to the extent that such fees cause the total annual operating expenses to exceed 0.18% of average daily net assets for Class R6 shares. This contractual expense limitation excludes interest, brokerage, taxes (such as income and foreign withholding taxes, stamp duty and deferred tax expenses), acquired fund fees and expenses, extraordinary expenses, and certain other Fund expenses such as dividend and interest expense and broker charges on short sales. Where applicable, the Manager agrees to waive management fees or shared operating expenses on any share class to the same extent that it waives similar expenses on any other share class. In addition, total annual operating expenses for Class R6 shares will not exceed total annual operating expenses for Class Z shares. Fees and/or expenses waived and/or reimbursed by the Manager may be recouped by the Manager within the same fiscal year during which such waiver and/or reimbursement is made if such recoupment can be realized without exceeding the expense limit in effect at the time of the recoupment for the fiscal year.
The Trust, on behalf of the Fund, has a distribution agreement with Prudential Investment Management Services LLC (“PIMS”), which acts as the distributor of the Class A, Class C, Class I, Class Z and Class R6 shares of the Fund. The Fund compensates PIMS for distributing and servicing the Fund’s Class A and Class C shares, pursuant to the plans of distribution (the “Distribution Plans”), regardless of expenses actually incurred by PIMS. The distribution fees are accrued daily and payable monthly. No distribution or service fees are paid to PIMS as distributor of the Class I, Class Z and Class R6 shares of the Fund.
| | | | |
| PGIM QMA Stock Index Fund | | | 47 | |
Notes to Financial Statements(continued)
Pursuant to the Distribution Plans, the Fund compensates PIMS for distribution related activities at an annual rate of up to 0.30% and 1% of the average daily net assets of the Class A and Class C shares, respectively.
For the year ended September 30, 2019, PIMS received $113,718 infront-end sales charges resulting from sales of Class A shares. Additionally, for the year ended September 30, 2019, PIMS received $11,848 in contingent deferred sales charges imposed upon redemptions by certain Class C shareholders. From these fees, PIMS paid such sales charges to broker-dealers, who in turn paid commissions to salespersons and incurred other distribution costs.
PGIM Investments, PIMS and QMA are indirect, wholly-owned subsidiaries of Prudential Financial, Inc. (“Prudential”).
3. Other Transactions with Affiliates
Prudential Mutual Fund Services LLC (“PMFS”), an affiliate of PGIM Investments and an indirect, wholly-owned subsidiary of Prudential, serves as the Trust’s transfer agent. Transfer agent’s fees and expenses in the Statement of Operations include certainout-of-pocket expenses paid tonon-affiliates, where applicable.
The Fund may invest its overnight sweep cash in the PGIM Core Ultra Short Bond Fund (the “Core Fund”), and its securities lending cash collateral in the PGIM Institutional Money Market Fund (the “Money Market Fund”), each a series of Prudential Investment Portfolios 2, registered under the 1940 Act and managed by PGIM Investments. Through the Fund’s investments in the mentioned underlying funds, PGIM Investments and/or its affiliates are paid fees or reimbursed for providing their services. In addition to the realized and unrealized gains on investments in the Core Fund and Money Market Fund, earnings from such investments are disclosed on the Statement of Operations as “Affiliated dividend income” and “Income from securities lending, net”, respectively.
The Fund may enter into certain securities purchase or sale transactions under Board approved Rule17a-7 procedures. Rule17a-7 is an exemptive rule under the 1940 Act, that subject to certain conditions, permits purchase and sale transactions among affiliated investment companies, or between an investment company and a person that is affiliated solely by reason of having a common (or affiliated) investment adviser, common directors, and/or common officers. Pursuant to the Rule17a-7 procedures and consistent with guidance issued by the SEC, the Trust’s Chief Compliance Officer (“CCO”) prepares a quarterly summary of all such transactions for submission to the Board, together with the CCO’s written representation that all such17a-7 transactions were effected in accordance with the Fund’s Rule17a-7 procedures. For the year ended September 30, 2019, no17a-7
transactions were entered into by the Fund.
4. Portfolio Securities
The aggregate cost of purchases and proceeds from sales of portfolio securities (excluding short-term investments and U.S. Government securities) for the year ended September 30, 2019, were $25,111,525 and $198,088,167, respectively.
A summary of the cost of purchases and proceeds from sales of shares of affiliated investments for the year ended September 30, 2019, is presented as follows:
| | | | | | | | | | | | | | | | | | | | | | | | | | | | | | |
Value, Beginning of Year | | | Cost of
Purchases | | | Proceeds
from Sales | | | Change in
Unrealized
Gain
(Loss) | | | Realized
Gain
(Loss) | | | Value,
End of
Year | | | Shares,
End of
Year | | | Income | |
| | PGIM Core Ultra Short Bond Fund* | |
| $ | 18,381,265 | | | $ | 158,476,533 | | | $ | 154,738,356 | | | $ | — | | | $ | — | | | $ | 22,119,442 | | | | 22,119,442 | | | $ | 436,902 | |
| | PGIM Institutional Money Market Fund* | |
| | 3,424,103 | | | | 120,044,371 | | | | 121,912,519 | | | | 34 | | | | (1,868 | ) | | | 1,554,121 | | | | 1,553,966 | | | | 18,871 | ** |
| | Prudential Financial, Inc. | |
| | 1,783,232 | | | | — | | | | 316,272 | | | | (406,875 | ) | | | 208,210 | | | | 1,268,295 | | | | 14,100 | | | | 60,780 | |
| | | | | | | | | | | | | | | | | | | | | | | | | | | | | | |
| $ | 23,588,600 | | | $ | 278,520,904 | | | $ | 276,967,147 | | | $ | (406,841 | ) | | $ | 206,342 | | | $ | 24,941,858 | | | | | | | $ | 516,553 | |
| | | | | | | | | | | | | | | | | | | | | | | | | | | | | | |
| * | The Fund did not have any capital gain distributions during the reporting period. |
| ** | This amount is included in “Income from securities lending, net” on the Statement of Operations. |
5. Distributions and Tax Information
Distributions to shareholders, which are determined in accordance with federal income tax regulations and which may differ from generally accepted accounting principles, are recorded on theex-date.
For the year ended September 30, 2019, the tax character of dividends paid by the Fund were $21,197,243 of ordinary income and $144,386,801 of long-term capital gains. For the year ended September 30, 2018, the tax character of dividends paid by the Fund were $19,225,453 of ordinary income and $47,481,469 of long-term capital gains.
As of September 30, 2019, the accumulated undistributed earnings on a tax basis were $10,918,275 of ordinary income and $127,478,664 of long-term capital gains.
| | | | |
| PGIM QMA Stock Index Fund | | | 49 | |
Notes to Financial Statements(continued)
The United States federal income tax basis of the Fund’s investments and the net unrealized appreciation as of September 30, 2019 were as follows:
| | | | | | |
Tax Basis | | Gross Unrealized Appreciation | | Gross Unrealized Depreciation | | Net Unrealized Appreciation |
| $243,251,137 | | $653,277,219 | | $(8,715,239) | | $644,561,980 |
The difference between book basis and tax basis was primarily attributable to deferred losses on wash sales, corporate actions adjustments and other book to tax differences.
The Manager has analyzed the Fund’s tax positions taken on federal, state and local income tax returns for all open tax years and has concluded that no provision for income tax is required in the Fund’s financial statements for the current reporting period. Since tax authorities can examine previously filed tax returns, the Fund’s U.S. federal and state tax returns for each of the four fiscal years up to the most recent fiscal year ended September 30, 2019 are subject to such review.
6. Capital and Ownership
The Fund offers Class A, Class C, Class Z, Class I and Class R6 shares. Class A shares are sold with a maximumfront-end sales charge of 3.25%. Investors who purchase $1 million or more of Class A shares and sell these shares within 12 months of purchase are subject to a contingent deferred sales charge (“CDSC”) of 1%, although they are not subject to an initial sales charge. The Class A CDSC is waived for certain retirement and/or benefit plans. A special exchange privilege is also available for shareholders who qualified to purchase Class A shares at net asset value. Class C shares are sold with a CDSC of 1% on sales made within 12 months of purchase. Class C shares will automatically convert to Class A shares on a monthly basis approximately 10 years after purchase. Class I, Class Z and Class R6 shares are not subject to any sales or redemption charge and are available exclusively for sale to a limited group of investors.
Under certain circumstances, an exchange may be made from specified share classes of the Fund to one or more other share classes of the Fund as presented in the table of transactions in shares of beneficial interest.
The Trust has authorized an unlimited number of shares of beneficial interest of the Fund at $0.001 par value per share, divided into five classes, designated Class A, Class C, Class I, Class Z and Class R6 shares.
As of September 30, 2019, Prudential, through its affiliated entities, including affiliated funds (if applicable), owned 241 Class R6 shares of the Fund. At reporting period end, four
shareholders of record, each holding greater than 5% of the Fund, held 38% of the Fund’s outstanding shares, of which 15% were held by an affiliate of Prudential.
Transactions in shares of beneficial interest were as follows:
| | | | | | | | |
Class A | | Shares | | | Amount | |
Year ended September 30, 2019: | | | | | | | | |
Shares sold | | | 517,289 | | | $ | 23,888,544 | |
Shares issued in reinvestment of dividends and distributions | | | 1,055,599 | | | | 44,155,701 | |
Shares reacquired | | | (1,038,744 | ) | | | (47,708,395 | ) |
| | | | | | | | |
Net increase (decrease) in shares outstanding before conversion | | | 534,144 | | | | 20,335,850 | |
Shares issued upon conversion from other share class(es) | | | 556,917 | | | | 26,219,127 | |
Shares reacquired upon conversion into other share class(es) | | | (7,158 | ) | | | (341,469 | ) |
| | | | | | | | |
Net increase (decrease) in shares outstanding | | | 1,083,903 | | | $ | 46,213,508 | |
| | | | | | | | |
Year ended September 30, 2018: | | | | | | | | |
Shares sold | | | 322,414 | | | $ | 17,210,353 | |
Shares issued in reinvestment of dividends and distributions | | | 299,134 | | | | 15,536,992 | |
Shares reacquired | | | (925,553 | ) | | | (49,570,977 | ) |
| | | | | | | | |
Net increase (decrease) in shares outstanding before conversion | | | (304,005 | ) | | | (16,823,632 | ) |
Shares issued upon conversion from other share class(es) | | | 16,322 | | | | 891,027 | |
Shares reacquired upon conversion into other share class(es) | | | (28,722 | ) | | | (1,554,356 | ) |
| | | | | | | | |
Net increase (decrease) in shares outstanding | | | (316,405 | ) | | $ | (17,486,961 | ) |
| | | | | | | | |
Class C | | | | | | |
Year ended September 30, 2019: | | | | | | | | |
Shares sold | | | 258,072 | | | $ | 11,768,465 | |
Shares issued in reinvestment of dividends and distributions | | | 399,106 | | | | 16,590,836 | |
Shares reacquired | | | (484,475 | ) | | | (22,020,304 | ) |
| | | | | | | | |
Net increase (decrease) in shares outstanding before conversion | | | 172,703 | | | | 6,338,997 | |
Shares reacquired upon conversion into other share class(es) | | | (623,533 | ) | | | (28,976,985 | ) |
| | | | | | | | |
Net increase (decrease) in shares outstanding | | | (450,830 | ) | | $ | (22,637,988 | ) |
| | | | | | | | |
Year ended September 30, 2018: | | | | | | | | |
Shares sold | | | 319,490 | | | $ | 16,927,644 | |
Shares issued in reinvestment of dividends and distributions | | | 103,128 | | | | 5,320,388 | |
Shares reacquired | | | (289,134 | ) | | | (15,338,071 | ) |
| | | | | | | | |
Net increase (decrease) in shares outstanding before conversion | | | 133,484 | | | | 6,909,961 | |
Shares reacquired upon conversion into other share class(es) | | | (53,562 | ) | | | (2,939,825 | ) |
| | | | | | | | |
Net increase (decrease) in shares outstanding | | | 79,922 | | | $ | 3,970,136 | |
| | | | | | | | |
| | | | |
| PGIM QMA Stock Index Fund | | | 51 | |
Notes to Financial Statements(continued)
| | | | | | | | |
Class I | | Shares | | | Amount | |
Year ended September 30, 2019: | | | | | | | | |
Shares sold | | | 686,826 | | | $ | 32,236,077 | |
Shares issued in reinvestment of dividends and distributions | | | 1,068,996 | | | | 44,812,293 | |
Shares reacquired | | | (2,114,147 | ) | | | (99,027,714 | ) |
| | | | | | | | |
Net increase (decrease) in shares outstanding before conversion | | | (358,325 | ) | | | (21,979,344 | ) |
Shares issued upon conversion from other share class(es) | | | 1,243 | | | | 57,579 | |
Shares reacquired upon conversion into other share class(es) | | | (7,573 | ) | | | (379,889 | ) |
| | | | | | | | |
Net increase (decrease) in shares outstanding | | | (364,655 | ) | | $ | (22,301,654 | ) |
| | | | | | | | |
Year ended September 30, 2018: | | | | | | | | |
Shares sold | | | 707,654 | | | $ | 38,223,432 | |
Shares issued in reinvestment of dividends and distributions | | | 397,716 | | | | 20,717,008 | |
Shares reacquired | | | (2,462,699 | ) | | | (129,320,520 | ) |
| | | | | | | | |
Net increase (decrease) in shares outstanding before conversion | | | (1,357,329 | ) | | | (70,380,080 | ) |
Shares issued upon conversion from other share class(es) | | | 1,239 | | | | 70,037 | |
Shares reacquired upon conversion into other share class(es) | | | (20,436 | ) | | | (1,109,058 | ) |
| | | | | | | | |
Net increase (decrease) in shares outstanding | | | (1,376,526 | ) | | $ | (71,419,101 | ) |
| | | | | | | | |
Class Z | | | | | | |
Year ended September 30, 2019: | | | | | | | | |
Shares sold | | | 1,390,087 | | | $ | 63,996,507 | |
Shares issued in reinvestment of dividends and distributions | | | 1,403,175 | | | | 58,835,143 | |
Shares reacquired | | | (3,356,148 | ) | | | (155,599,106 | ) |
| | | | | | | | |
Net increase (decrease) in shares outstanding before conversion | | | (562,886 | ) | | | (32,767,456 | ) |
Shares issued upon conversion from other share class(es) | | | 74,308 | | | | 3,407,059 | |
Shares reacquired upon conversion into other share class(es) | | | (343 | ) | | | (16,213 | ) |
| | | | | | | | |
Net increase (decrease) in shares outstanding | | | (488,921 | ) | | $ | (29,376,610 | ) |
| | | | | | | | |
Year ended September 30, 2018: | | | | | | | | |
Shares sold | | | 965,932 | | | $ | 51,963,615 | |
Shares issued in reinvestment of dividends and distributions | | | 474,771 | | | | 24,735,574 | |
Shares reacquired | | | (3,102,160 | ) | | | (166,543,375 | ) |
| | | | | | | | |
Net increase (decrease) in shares outstanding before conversion | | | (1,661,457 | ) | | | (89,844,186 | ) |
Shares issued upon conversion from other share class(es) | | | 99,833 | | | | 5,495,274 | |
Shares reacquired upon conversion into other share class(es) | | | (16,202 | ) | | | (888,551 | ) |
| | | | | | | | |
Net increase (decrease) in shares outstanding | | | (1,577,826 | ) | | $ | (85,237,463 | ) |
| | | | | | | | |
| | | | | | | | |
Class R6 | | Shares | | | Amount | |
Year ended September 30, 2019: | | | | | | | | |
Shares sold | | | 252,541 | | | $ | 11,206,099 | |
Shares issued in reinvestment of dividends and distributions | | | 7,748 | | | | 324,876 | |
Shares reacquired | | | (38,327 | ) | | | (1,788,446 | ) |
| | | | | | | | |
Net increase (decrease) in shares outstanding before conversion | | | 221,962 | | | | 9,742,529 | |
Shares issued upon conversion from other share class(es) | | | 671 | | | | 30,791 | |
| | | | | | | | |
Net increase (decrease) in shares outstanding | | | 222,633 | | | $ | 9,773,320 | |
| | | | | | | | |
Period ended September 30, 2018*: | | | | | | | | |
Shares sold | | | 1,402 | | | $ | 79,849 | |
Shares issued in reinvestment of dividends and distributions | | | 11 | | | | 595 | |
Shares reacquired | | | (371 | ) | | | (20,448 | ) |
| | | | | | | | |
Net increase (decrease) in shares outstanding before conversion | | | 1,042 | | | | 59,996 | |
Shares issued upon conversion from other share class(es) | | | 644 | | | | 35,452 | |
| | | | | | | | |
Net increase (decrease) in shares outstanding | | | 1,686 | | | $ | 95,448 | |
| | | | | | | | |
| * | Commencement of offering was November 28, 2017. |
7. Borrowings
The Trust, on behalf of the Fund, along with other affiliated registered investment companies (the “Funds”), is a party to a Syndicated Credit Agreement (“SCA”) with a group of banks. The purpose of the SCA is to provide an alternative source of temporary funding for capital share redemptions. The SCA provides for a commitment of $900 million for the period October 4, 2018 through October 3, 2019. The Funds pay an annualized commitment fee of 0.15% of the unused portion of the SCA. The Fund’s portion of the commitment fee for the unused amount, allocated based upon a method approved by the Board, is accrued daily and paid quarterly. Prior to October 4, 2018, the Funds had another SCA that provided a commitment of $900 million and the Funds paid an annualized commitment fee of 0.15% of the unused portion of the SCA. The interest on borrowings under both SCAs is paid monthly and at a per annum interest rate of 1.25% plus the higher of (1) the effective federal funds rate, (2) theone-month LIBOR rate or (3) zero percent.
Subsequent to the reporting period end, the SCA has been renewed effective October 3, 2019 and will continue to provide a commitment of $900 million through October 1, 2020. The commitment fee paid by the Funds will continue to be 0.15% of the unused portion of the SCA. The interest on borrowings under the renewed SCA will be paid monthly and at a per annum interest rate of 1.20% plus the higher of (1) the effective federal funds rate, (2) theone-month LIBOR rate or (3) zero percent.
Certain affiliated registered investment companies that are parties to the SCA include portfolios that are subject to a predetermined mathematical formula used to manage certain benefit guarantees offered under variable annuity contracts. The formula may result in large scale asset flows into and out of these portfolios. Consequently, these portfolios may be more likely to utilize the SCA for purposes of funding redemptions. It may be possible for those portfolios to fully exhaust the committed amount of the SCA, thereby requiring the Manager
| | | | |
| PGIM QMA Stock Index Fund | | | 53 | |
Notes to Financial Statements(continued)
to allocate available funding per a Board-approved methodology designed to treat the Funds in the SCA equitably.
The average daily balance for the 2 days that the Fund had loans outstanding during the period was approximately $10,954,000, borrowed at a weighted average interest rate of 3.64%. The maximum loan outstanding amount during the period was $16,903,000. At September 30, 2019, the Fund did not have an outstanding loan amount.
8. Risks of Investing in the Fund
The Fund’s risks include, but are not limited to, some or all of the risks discussed below:
Derivatives Risk:Derivatives involve special risks and costs and may result in losses to the Fund. The successful use of derivatives requires sophisticated management, and, to the extent that derivatives are used, the Fund will depend on the subadviser’s ability to analyze and manage derivative transactions. The prices of derivatives may move in unexpected ways, especially in abnormal market conditions. Some derivatives are “leveraged” and therefore may magnify or otherwise increase investment losses to the Fund. Other risks arise from the potential inability to terminate or sell derivatives positions. A liquid secondary market may not always exist for the Fund’s derivatives positions. In fact, many OTC derivative instruments will not have liquidity beyond the counterparty to the instrument. OTC derivative instruments also involve the risk that the other party will not meet its obligations to the Fund.
Equity and Equity-Related Securities Risks:The value of a particular security could go down and you could lose money. In addition to an individual security losing value, the value of the equity markets or a sector in which the Fund invests could go down. The Fund’s holdings can vary significantly from broad market indexes and the performance of the Fund can deviate from the performance of these indexes. Different parts of a market can react differently to adverse issuer, market, regulatory, political and economic developments.
Market and Credit Risk:Securities markets may be volatile and the market prices of the Fund’s securities may decline. Securities fluctuate in price based on changes in an issuer’s financial condition and overall market and economic conditions. If the market prices of the securities owned by the Fund fall, the value of an investment in the Fund will decline. Additionally, the Fund may also be exposed to credit risk in the event that an issuer or guarantor fails to perform or that an institution or entity with which the Fund has unsettled or open transactions defaults.
9. Recent Accounting Pronouncements and Reporting Updates
In August 2018, the Securities and Exchange Commission (the “SEC”) adopted amendments to RegulationS-X to update and simplify the disclosure requirements for registered investment companies by eliminating requirements that are redundant or duplicative of US GAAP requirements or other SEC disclosure requirements. The new amendments require the presentation of the total, rather than the components, of distributable earnings on the Statement of Assets and Liabilities and the total, rather than the components, of dividends from net investment income and distributions from net realized gains on the Statements of Changes in Net Assets. The amendments also removed the requirement for the parenthetical disclosure of undistributed net investment income on the Statements of Changes in Net Assets and certain tax adjustments that were reflected in the Notes to Financial Statements. The Manager has adopted the amendments and reflected them in the Fund’s financial statements.
In August 2018, the FASB issued Accounting Standards Update (“ASU”)No. 2018-13, which changes certain fair value measurement disclosure requirements. The new ASU, in addition to other modifications and additions, removes the requirement to disclose the amount and reasons for transfers between Level 1 and Level 2 of the fair value hierarchy, and the Fund’s policy for the timing of transfers between levels. The amendments are effective for financial statements issued for fiscal years beginning after December 15, 2019, and interim periods within those fiscal years. The Manager has evaluated the implications of certain provisions of the ASU and has determined to early adopt aspects related to the removal and modification of certain fair value measurement disclosures under the ASU effective immediately. The Manager continues to evaluate certain other provisions of the ASU and does not expect a material impact to financial statement disclosures.
| | | | |
| PGIM QMA Stock Index Fund | | | 55 | |
Financial Highlights
| | | | | | | | | | | | | | | | | | | | | | | | |
| Class A Shares | | | | | | | | | | | | | | | | | | |
| | | | | | Year Ended September 30, | |
| | | | | | 2019 | | | 2018 | | | 2017 | | | 2016 | | | 2015 | |
| Per Share Operating Performance(a): | | | | | | | | | | | | | | | | | | | | | | | | |
| Net Asset Value, Beginning of Year | | | | | | | $57.19 | | | | $51.67 | | | | $45.37 | | | | $40.91 | | | | $43.97 | |
| Income (loss) from investment operations: | | | | | | | | | | | | | | | | | | | | | | | | |
| Net investment income (loss) | | | | | | | 0.70 | | | | 0.73 | | | | 0.71 | | | | 0.69 | | | | 0.65 | |
| Net realized and unrealized gain (loss) on investment transactions | | | | | | | (0.04 | ) | | | 7.91 | | | | 7.23 | | | | 5.27 | | | | (0.93 | ) |
| Total from investment operations | | | | | | | 0.66 | | | | 8.64 | | | | 7.94 | | | | 5.96 | | | | (0.28 | ) |
| Less Dividends and Distributions: | | | | | | | | | | | | | | | | | | | | | | | | |
| Dividends from net investment income | | | | | | | (1.04 | ) | | | (0.70 | ) | | | (0.74 | ) | | | (0.84 | ) | | | (0.63 | ) |
| Distributions from net realized gains | | | | | | | (8.35 | ) | | | (2.42 | ) | | | (0.90 | ) | | | (0.66 | ) | | | (2.15 | ) |
| Total dividends and distributions | | | | | | | (9.39 | ) | | | (3.12 | ) | | | (1.64 | ) | | | (1.50 | ) | | | (2.78 | ) |
| Net asset value, end of year | | | | | | | $48.46 | | | | $57.19 | | | | $51.67 | | | | $45.37 | | | | $40.91 | |
| Total Return(b): | | | | | | | 3.75% | | | | 17.34% | | | | 17.97% | | | | 14.85% | | | | (1.06)% | |
| |
| Ratios/Supplemental Data: | | | | | | | | | | | | | | | | | | |
| Net assets, end of year (000) | | | | | | | $287,076 | | | | $276,785 | | | | $266,434 | | | | $238,671 | | | | $200,334 | |
| Average net assets (000) | | | | | | | $266,336 | | | | $272,887 | | | | $257,269 | | | | $222,230 | | | | $210,562 | |
| Ratios to average net assets(c)(d): | | | | | | | | | | | | | | | | | | | | | | | | |
| Expenses after waivers and/or expense reimbursement | | | | | | | 0.54% | | | | 0.52% | | | | 0.52% | | | | 0.53% | | | | 0.54% | |
| Expenses before waivers and/or expense reimbursement | | | | | | | 0.61% | | | | 0.59% | | | | 0.59% | | | | 0.60% | | | | 0.61% | |
| Net investment income (loss) | | | | | | | 1.48% | | | | 1.36% | | | | 1.49% | | | | 1.61% | | | | 1.49% | |
| Portfolio turnover rate(e) | | | | | | | 3% | | | | 2% | | | | 4% | | | | 4% | | | | 6% | |
| (a) | Calculated based on average shares outstanding during the year. |
| (b) | Total return does not consider the effects of sales loads. Total return is calculated assuming a purchase of a share on the first day and a sale on the last day of each year reported and includes reinvestment of dividends and distributions, if any. Total returns may reflect adjustments to conform to generally accepted accounting principles. |
| (c) | Effective October 1, 2017, class specific expenses include transfer agent fees and expenses and registration fees, which are charged to their respective share class. |
| (d) | Does not include expenses of the underlying funds in which the Fund invests. |
| (e) | The Fund’s portfolio turnover rate is calculated in accordance with regulatory requirements, without regard to transactions involving short-term investments and certain derivatives. If such transactions were included, the Fund’s portfolio turnover rate may be higher. |
See Notes to Financial Statements.
| | | | | | | | | | | | | | | | | | | | | | | | |
| Class C Shares | | | | | | | | | | | | | | | | | | |
| | | | | | Year Ended September 30, | |
| | | | | | 2019 | | | 2018 | | | 2017 | | | 2016 | | | 2015 | |
| Per Share Operating Performance(a): | | | | | | | | | | | | | | | | | | | | | | | | |
| Net Asset Value, Beginning of Year | | | | | | | $56.50 | | | | $51.19 | | | | $44.97 | | | | $40.56 | | | | $43.64 | |
| Income (loss) from investment operations: | | | | | | | | | | | | | | | | | | | | | | | | |
| Net investment income (loss) | | | | | | | 0.39 | | | | 0.37 | | | | 0.40 | | | | 0.41 | | | | 0.37 | |
| Net realized and unrealized gain (loss) on investment transactions | | | | | | | (0.02 | ) | | | 7.83 | | | | 7.18 | | | | 5.22 | | | | (0.94 | ) |
| Total from investment operations | | | | | | | 0.37 | | | | 8.20 | | | | 7.58 | | | | 5.63 | | | | (0.57 | ) |
| Less Dividends and Distributions: | | | | | | | | | | | | | | | | | | | | | | | | |
| Dividends from net investment income | | | | | | | (0.60 | ) | | | (0.47 | ) | | | (0.46 | ) | | | (0.56 | ) | | | (0.36 | ) |
| Distributions from net realized gains | | | | | | | (8.35 | ) | | | (2.42 | ) | | | (0.90 | ) | | | (0.66 | ) | | | (2.15 | ) |
| Total dividends and distributions | | | | | | | (8.95 | ) | | | (2.89 | ) | | | (1.36 | ) | | | (1.22 | ) | | | (2.51 | ) |
| Net asset value, end of year | | | | | | | $47.92 | | | | $56.50 | | | | $51.19 | | | | $44.97 | | | | $40.56 | |
| Total Return(b): | | | | | | | 3.08% | | | | 16.56% | | | | 17.24% | | | | 14.10% | | | | (1.70)% | |
| |
| Ratios/Supplemental Data: | | | | | | | | | | | | | | | | | | |
| Net assets, end of year (000) | | | | | | | $70,382 | | | | $108,459 | | | | $94,169 | | | | $72,100 | | | | $49,462 | |
| Average net assets (000) | | | | | | | $84,898 | | | | $102,726 | | | | $85,397 | | | | $61,856 | | | | $46,945 | |
| Ratios to average net assets(c)(d): | | | | | | | | | | | | | | | | | | | | | | | | |
| Expenses after waivers and/or expense reimbursement | | | | | | | 1.19% | | | | 1.18% | | | | 1.16% | | | | 1.18% | | | | 1.19% | |
| Expenses before waivers and/or expense reimbursement | | | | | | | 1.26% | | | | 1.25% | | | | 1.23% | | | | 1.25% | | | | 1.26% | |
| Net investment income (loss) | | | | | | | 0.84% | | | | 0.70% | | | | 0.85% | | | | 0.96% | | | | 0.85% | |
| Portfolio turnover rate(e) | | | | | | | 3% | | | | 2% | | | | 4% | | | | 4% | | | | 6% | |
| (a) | Calculated based on average shares outstanding during the year. |
| (b) | Total return does not consider the effects of sales loads. Total return is calculated assuming a purchase of a share on the first day and a sale on the last day of each year reported and includes reinvestment of dividends and distributions, if any. Total returns may reflect adjustments to conform to generally accepted accounting principles. |
| (c) | Effective October��1, 2017, class specific expenses include transfer agent fees and expenses and registration fees, which are charged to their respective share class. |
| (d) | Does not include expenses of the underlying funds in which the Fund invests. |
| (e) | The Fund’s portfolio turnover rate is calculated in accordance with regulatory requirements, without regard to transactions involving short-term investments and certain derivatives. If such transactions were included, the Fund’s portfolio turnover rate may be higher. |
See Notes to Financial Statements.
| | | | |
| PGIM QMA Stock Index Fund | | | 57 | |
Financial Highlights(continued)
| | | | | | | | | | | | | | | | | | | | | | | | |
| Class I Shares | | | | | | | | | | | | | | | | | | |
| | | | | | Year Ended September 30, | |
| | | | | | 2019 | | | 2018 | | | 2017 | | | 2016 | | | 2015 | |
| Per Share Operating Performance(a): | | | | | | | | | | | | | | | | | | | | | | | | |
| Net Asset Value, Beginning of Year | | | | | | | $57.50 | | | | $51.89 | | | | $45.54 | | | | $41.07 | | | | $44.14 | |
| Income (loss) from investment operations: | | | | | | | | | | | | | | | | | | | | | | | | |
| Net investment income (loss) | | | | | | | 0.87 | | | | 0.91 | | | | 0.88 | | | | 0.84 | | | | 0.81 | |
| Net realized and unrealized gain (loss) on investment transactions | | | | | | | (0.06 | ) | | | 7.95 | | | | 7.26 | | | | 5.29 | | | | (0.97 | ) |
| Total from investment operations | | | | | | | 0.81 | | | | 8.86 | | | | 8.14 | | | | 6.13 | | | | (0.16 | ) |
| Less Dividends and Distributions: | | | | | | | | | | | | | | | | | | | | | | | | |
| Dividends from net investment income | | | | | | | (1.26 | ) | | | (0.83 | ) | | | (0.89 | ) | | | (1.00 | ) | | | (0.76 | ) |
| Distributions from net realized gains | | | | | | | (8.35 | ) | | | (2.42 | ) | | | (0.90 | ) | | | (0.66 | ) | | | (2.15 | ) |
| Total dividends and distributions | | | | | | | (9.61 | ) | | | (3.25 | ) | | | (1.79 | ) | | | (1.66 | ) | | | (2.91 | ) |
| Net asset value, end of year | | | | | | | $48.70 | | | | $57.50 | | | | $51.89 | | | | $45.54 | | | | $41.07 | |
| Total Return(b): | | | | | | | 4.12% | | | | 17.72% | | | | 18.40% | | | | 15.23% | | | | (0.77)% | |
| |
| Ratios/Supplemental Data: | | | | | | | | | | | | | | | | | | |
| Net assets, end of year (000) | | | | | | | $228,063 | | | | $290,252 | | | | $333,339 | | | | $334,673 | | | | $295,412 | |
| Average net assets (000) | | | | | | | $239,501 | | | | $289,170 | | | | $339,473 | | | | $323,821 | | | | $291,839 | |
| Ratios to average net assets(c)(d): | | | | | | | | | | | | | | | | | | | | | | | | |
| Expenses after waivers and/or expense reimbursement | | | | | | | 0.19% | | | | 0.18% | | | | 0.18% | | | | 0.19% | | | | 0.19% | |
| Expenses before waivers and/or expense reimbursement | | | | | | | 0.26% | | | | 0.25% | | | | 0.25% | | | | 0.26% | | | | 0.26% | |
| Net investment income (loss) | | | | | | | 1.83% | | | | 1.69% | | | | 1.86% | | | | 1.96% | | | | 1.83% | |
| Portfolio turnover rate(e) | | | | | | | 3% | | | | 2% | | | | 4% | | | | 4% | | | | 6% | |
| (a) | Calculated based on average shares outstanding during the year. |
| (b) | Total return is calculated assuming a purchase of a share on the first day and a sale on the last day of each year reported and includes reinvestment of dividends and distributions, if any. Total returns may reflect adjustments to conform to generally accepted accounting principles. |
| (c) | Effective October 1, 2017, class specific expenses include transfer agent fees and expenses and registration fees, which are charged to their respective share class. |
| (d) | Does not include expenses of the underlying funds in which the Fund invests. |
| (e) | The Fund’s portfolio turnover rate is calculated in accordance with regulatory requirements, without regard to transactions involving short-term investments and certain derivatives. If such transactions were included, the Fund’s portfolio turnover rate may be higher. |
See Notes to Financial Statements.
| | | | | | | | | | | | | | | | | | | | | | | | |
| Class Z Shares | | | | | | | | | | | | | | | | | | |
| | | | | | Year Ended September 30, | |
| | | | | | 2019 | | | 2018 | | | 2017 | | | 2016 | | | 2015 | |
| Per Share Operating Performance(a): | | | | | | | | | | | | | | | | | | | | | | | | |
| Net Asset Value, Beginning of Year | | | | | | | $57.49 | | | | $51.88 | | | | $45.54 | | | | $41.07 | | | | $44.12 | |
| Income (loss) from investment operations: | | | | | | | | | | | | | | | | | | | | | | | | |
| Net investment income (loss) | | | | | | | 0.84 | | | | 0.88 | | | | 0.85 | | | | 0.82 | | | | 0.78 | |
| Net realized and unrealized gain (loss) on investment transactions | | | | | | | (0.05 | ) | | | 7.95 | | | | 7.25 | | | | 5.28 | | | | (0.94 | ) |
| Total from investment operations | | | | | | | 0.79 | | | | 8.83 | | | | 8.10 | | | | 6.10 | | | | (0.16 | ) |
| Less Dividends and Distributions: | | | | | | | | | | | | | | | | | | | | | | | | |
| Dividends from net investment income | | | | | | | (1.23 | ) | | | (0.80 | ) | | | (0.86 | ) | | | (0.97 | ) | | | (0.74 | ) |
| Distributions from net realized gains | | | | | | | (8.35 | ) | | | (2.42 | ) | | | (0.90 | ) | | | (0.66 | ) | | | (2.15 | ) |
| Total dividends and distributions | | | | | | | (9.58 | ) | | | (3.22 | ) | | | (1.76 | ) | | | (1.63 | ) | | | (2.89 | ) |
| Net asset value, end of year | | | | | | | $48.70 | | | | $57.49 | | | | $51.88 | | | | $45.54 | | | | $41.07 | |
| Total Return(b): | | | | | | | 4.05% | | | | 17.67% | | | | 18.31% | | | | 15.16% | | | | (0.78)% | |
| |
| Ratios/Supplemental Data: | | | | | | | | | | | | | | | | | | |
| Net assets, end of year (000) | | | | | | | $289,780 | | | | $370,188 | | | | $415,974 | | | | $396,421 | | | | $388,796 | |
| Average net assets (000) | | | | | | | $315,161 | | | | $392,699 | | | | $412,869 | | | | $390,514 | | | | $442,546 | |
| Ratios to average net assets(c)(d): | | | | | | | | | | | | | | | | | | | | | | | | |
| Expenses after waivers and/or expense reimbursement | | | | | | | 0.25% | | | | 0.24% | | | | 0.24% | | | | 0.25% | | | | 0.25% | |
| Expenses before waivers and/or expense reimbursement | | | | | | | 0.32% | | | | 0.31% | | | | 0.31% | | | | 0.32% | | | | 0.32% | |
| Net investment income (loss) | | | | | | | 1.78% | | | | 1.63% | | | | 1.77% | | | | 1.89% | | | | 1.78% | |
| Portfolio turnover rate(e) | | | | | | | 3% | | | | 2% | | | | 4% | | | | 4% | | | | 6% | |
| (a) | Calculated based on average shares outstanding during the year. |
| (b) | Total return is calculated assuming a purchase of a share on the first day and a sale on the last day of each year reported and includes reinvestment of dividends and distributions, if any. Total returns may reflect adjustments to conform to generally accepted accounting principles. |
| (c) | Effective October 1, 2017, class specific expenses include transfer agent fees and expenses and registration fees, which are charged to their respective share class. |
| (d) | Does not include expenses of the underlying funds in which the Fund invests. |
| (e) | The Fund’s portfolio turnover rate is calculated in accordance with regulatory requirements, without regard to transactions involving short-term investments and certain derivatives. If such transactions were included, the Fund’s portfolio turnover rate may be higher. |
See Notes to Financial Statements.
| | | | |
| PGIM QMA Stock Index Fund | | | 59 | |
Financial Highlights(continued)
| | | | | | | | | | | | |
| Class R6 Shares | | | | | | | | | |
| | | Year Ended
September 30,
2019 | | | | | | November 28,
2017(a)
through
September 30,
2018 | |
| Per Share Operating Performance(b): | | | | | | | | | | | | |
| Net Asset Value, Beginning of Period | | | $57.52 | | | | | | | | $54.26 | |
| Income (loss) from investment operations: | | | | | | | | | | | | |
| Net investment income (loss) | | | 0.86 | | | | | | | | 0.70 | |
| Net realized and unrealized gain (loss) on investment transactions | | | (0.05 | ) | | | | | | | 5.79 | |
| Total from investment operations | | | 0.81 | | | | | | | | 6.49 | |
| Less Dividends and Distributions: | | | | | | | | | | | | |
| Dividends from net investment income | | | (1.26 | ) | | | | | | | (0.81 | ) |
| Distributions from net realized gains | | | (8.35 | ) | | | | | | | (2.42 | ) |
| Total dividends and distributions | | | (9.61 | ) | | | | | | | (3.23 | ) |
| Net asset value, end of period | | | $48.72 | | | | | | | | $57.52 | |
| Total Return(c): | | | 4.12% | | | | | | | | 12.57% | |
| |
| Ratios/Supplemental Data: | | | | | | | | | |
| Net assets, end of period (000) | | | $10,929 | | | | | | | | $97 | |
| Average net assets (000) | | | $8,080 | | | | | | | | $23 | |
| Ratios to average net assets(d): | | | | | | | | | | | | |
| Expenses after waivers and/or expense reimbursement | | | 0.18% | | | | | | | | 0.18% | (e) |
| Expenses before waivers and/or expense reimbursement | | | 0.39% | | | | | | | | 146.02% | (e) |
| Net investment income (loss) | | | 1.85% | | | | | | | | 1.55% | (e) |
| Portfolio turnover rate(f) | | | 3% | | | | | | | | 2% | |
| (a) | Commencement of offering. |
| (b) | Calculated based on average shares outstanding during the period. |
| (c) | Total return is calculated assuming a purchase of a share on the first day and a sale on the last day of each period reported and includes reinvestment of dividends and distributions, if any. Total returns may reflect adjustments to conform to generally accepted accounting principles. Total returns for periods less than one full year are not annualized. |
| (d) | Does not include expenses of the underlying funds in which the Fund invests. |
| (f) | The Fund’s portfolio turnover rate is calculated in accordance with regulatory requirements, without regard to transactions involving short-term investments and certain derivatives. If such transactions were included, the Fund’s portfolio turnover rate may be higher. |
See Notes to Financial Statements.
Report of Independent Registered Public Accounting Firm
To the Shareholders of PGIM QMA Stock Index Fund and Board of Trustees
Prudential Investment Portfolios 8:
Opinion on the Financial Statements
We have audited the accompanying statement of assets and liabilities of PGIM QMA Stock Index Fund, a series of Prudential Investment Portfolios 8, (the Fund), including the schedule of investments, as of September 30, 2019, the related statement of operations for the year then ended, the statements of changes in net assets for each of the years in thetwo-year period ended September 30, 2019, and the related notes (collectively, the financial statements) and the financial highlights for the years or period indicated therein. In our opinion, the financial statements and financial highlights present fairly, in all material respects, the financial position of the Fund as of September 30, 2019, the results of its operations for the year then ended, the changes in its net assets for each of the years in thetwo-year period ended September 30, 2019, and the financial highlights for the years or periods indicated therein, in conformity with U.S. generally accepted accounting principles.
Basis for Opinion
These financial statements and financial highlights are the responsibility of the Fund’s management. Our responsibility is to express an opinion on these financial statements and financial highlights based on our audits. We are a public accounting firm registered with the Public Company Accounting Oversight Board (United States) (PCAOB) and are required to be independent with respect to the Fund in accordance with the U.S. federal securities laws and the applicable rules and regulations of the Securities and Exchange Commission and the PCAOB.
We conducted our audits in accordance with the standards of the PCAOB. Those standards require that we plan and perform the audit to obtain reasonable assurance about whether the financial statements and financial highlights are free of material misstatement, whether due to error or fraud. Our audits included performing procedures to assess the risks of material misstatement of the financial statements and financial highlights, whether due to error or fraud, and performing procedures that respond to those risks. Such procedures included examining, on a test basis, evidence regarding the amounts and disclosures in the financial statements and financial highlights. Such procedures also included confirmation of securities owned as of September 30, 2019, by correspondence with the custodian, transfer agent, and brokers, or by other appropriate auditing procedures when replies were not received. Our audits also included evaluating the accounting principles used and significant estimates made by management, as well as evaluating the overall presentation of the financial statements and financial highlights. We believe that our audits provide a reasonable basis for our opinion.

We have served as the auditor of one or more PGIM and/or Prudential Retail investment companies since 2003.
New York, New York
November 15, 2019
| | | | |
| PGIM QMA Stock Index Fund | | | 61 | |
Tax Information(unaudited)
We are advising you that during the fiscal year ended September 30, 2019, the Fund reports the maximum amount allowed per share, but not less than $8.26 for Class A, C, I, Z and R6 shares as a capital gain distribution in accordance with Section 852(b)(3)(C) of the Internal Revenue Code.
For the year ended September 30, 2019, the Fund reports the maximum amount allowable under Section 854 of the Internal Revenue Code, but not less than, the following percentages of the ordinary income dividends paid as 1) qualified dividend income (QDI); and 2) eligible for corporate dividends received deduction (DRD):
| | | | | | | | |
| | | QDI | | | DRD | |
PGIM QMA Stock Index Fund | | | 100.00 | % | | | 100.00 | % |
In January 2020, you will be advised on IRS Form 1099-DIV or substitute 1099-DIV, as to the federal tax status of dividends and distributions received by you in calendar year 2019.
INFORMATION ABOUT BOARD MEMBERS AND OFFICERS(unaudited)
Information about Board Members and Officers of the Fund is set forth below. Board Members who are not deemed to be “interested persons” of the Fund, as defined in the 1940 Act, are referred to as “Independent Board Members.” Board Members who are deemed to be “interested persons” of the Fund are referred to as “Interested Board Members.” The Board Members are responsible for the overall supervision of the operations of the Fund and perform the various duties imposed on the directors of investment companies by the 1940 Act. The Board in turn elects the Officers, who are responsible for administering theday-to-day operations of the Fund.
| | | | | | |
| Independent Board Members | | | | |
| | | | |
Name Date of Birth Position(s) Portfolios Overseen | | Principal Occupation(s) During Past Five Years | | Other Directorships
Held During Past Five Years | | Length of
Board Service |
| | | | |
Ellen S. Alberding 3/11/58 Board Member Portfolios Overseen: 96 | | President and Board Member, The Joyce Foundation (charitable foundation) (since 2002); Vice Chair, City Colleges of Chicago (community college system) (2011-2015); Trustee, National Park Foundation (charitable foundation for national park system) (2009-2018); Trustee, Economic Club of Chicago (since 2009); Trustee, Loyola University (since 2018). | | None. | | Since September 2013 |
| | | | |
Kevin J. Bannon 7/13/52 Board Member Portfolios Overseen: 96 | | Retired; Managing Director (April2008-May 2015) and Chief Investment Officer (October 2008-November 2013) of Highmount Capital LLC (registered investment adviser); formerly Executive Vice President and Chief Investment Officer (April 1993-August 2007) of Bank of New York Company; President (May2003-May 2007) of BNY Hamilton Family of Mutual Funds. | | Director of Urstadt Biddle Properties (equity real estate investment trust) (since September 2008). | | Since July 2008 |
PGIM QMA Stock Index Fund
| | | | | | |
| Independent Board Members | | | | |
| | | | |
Name Date of Birth Position(s) Portfolios Overseen | | Principal Occupation(s) During Past Five Years | | Other Directorships
Held During Past Five Years | | Length of Board Service |
| | | | |
Linda W. Bynoe 7/9/52 Board Member Portfolios Overseen: 96 | | President and Chief Executive Officer (since March 1995) and formerly Chief Operating Officer (December 1989-February 1995) of Telemat Ltd. (management consulting); formerly Vice President (January 1985-June 1989) at Morgan Stanley & Co. (broker-dealer). | | Director of Anixter International, Inc. (communication products distributor) (since January 2006); Director of Northern Trust Corporation (financial services) (since April 2006); Trustee of Equity Residential (residential real estate) (since December 2009). | | Since March 2005 |
| | | | |
Barry H. Evans 11/2/60 Board Member Portfolios Overseen: 95 | | Retired; formerly President (2005 – 2016), Global Chief Operating Officer (2014–2016), Chief Investment Officer – Global Head of Fixed Income (1998-2014), and various portfolio manager roles (1986-2006), Manulife Asset Management U.S. | | Formerly Director, Manulife Trust Company (2011-2018); formerly Director, Manulife Asset Management Limited (2015-2017); formerly Chairman of the Board of Directors of Manulife Asset Management U.S. (2005-2016); formerly Chairman of the Board, Declaration Investment Management and Research (2008-2016). | | Since September 2017 |
| | | | |
Keith F. Hartstein 10/13/56 Board Member & Independent Chair Portfolios Overseen: 96 | | Retired; Member (since November 2014) of the Governing Council of the Independent Directors Council (organization of independent mutual fund directors); formerly President and Chief Executive Officer (2005-2012), Senior Vice President (2004-2005), Senior Vice President of Sales and Marketing (1997-2004), and various executive management positions (1990-1997), John Hancock Funds, LLC (asset management); Chairman, Investment Company Institute’s Sales Force Marketing Committee (2003-2008). | | None. | | Since September 2013 |
Visit our website at pgiminvestments.com
| | | | | | |
| Independent Board Members | | | | |
| | | | |
Name Date of Birth Position(s) Portfolios Overseen | | Principal Occupation(s) During Past Five Years | | Other Directorships
Held During Past Five Years | | Length of
Board Service |
| | | | |
Laurie Simon Hodrick 9/29/62 Board Member Portfolios Overseen: 95 | | A. Barton Hepburn Professor Emerita of Economics in the Faculty of Business, Columbia Business School (since 2018); Visiting Professor of Law, Stanford Law School (since 2015); Visiting Fellow at the Hoover Institution, Stanford University (since 2015); Sole Member, ReidCourt LLC (since 2008) (a consulting firm); formerly A. Barton Hepburn Professor of Economics in the Faculty of Business, Columbia Business School (1996-2017); formerly Managing Director, Global Head of Alternative Investment Strategies, Deutsche Bank (2006-2008). | | Independent Director, Synnex Corporation (since April 2019) (information technology); Independent Director, Kabbage, Inc. (since July 2018) (financial services); Independent Director, Corporate Capital Trust (2017-2018) (a business development company). | | Since September 2017 |
| | | | |
Michael S. Hyland, CFA 10/4/45 Board Member Portfolios Overseen: 96 | | Retired (since February 2005); formerly Senior Managing Director (July 2001-February 2005) of Bear Stearns & Co, Inc.; Global Partner, INVESCO (1999-2001); Managing Director and President of Salomon Brothers Asset Management (1989-1999). | | None. | | Since July 2008 |
| | | | |
Brian K. Reid 9/22/61 Board Member Portfolios Overseen: 95 | | Retired; formerly Chief Economist for the Investment Company Institute (ICI) (2005-2017); formerly Senior Economist and Director of Industry and Financial Analysis at the ICI (1998-2004); formerly Senior Economist, Industry and Financial Analysis at the ICI (1996-1998); formerly Staff Economist at the Federal Reserve Board (1989-1996); Director, ICI Mutual Insurance Company (2012-2017). | | None. | | Since March 2018 |
PGIM QMA Stock Index Fund
| | | | | | |
Independent Board Members | | | | |
| | | | |
Name Date of Birth Position(s) Portfolios Overseen | | Principal Occupation(s) During Past Five Years | | Other Directorships
Held During Past Five Years | | Length of
Board Service |
| | | | |
Grace C. Torres 6/28/59 Board Member Portfolios Overseen: 95 | | Retired; formerly Treasurer and Principal Financial and Accounting Officer of the PGIM Funds, Target Funds, Advanced Series Trust, Prudential Variable Contract Accounts and The Prudential Series Fund (1998-June 2014); Assistant Treasurer (March 1999-June 2014) and Senior Vice President (September 1999-June 2014) of PGIM Investments LLC; Assistant Treasurer (May 2003-June 2014) and Vice President (June 2005-June 2014) of AST Investment Services, Inc.; Senior Vice President and Assistant Treasurer (May 2003-June 2014) of Prudential Annuities Advisory Services, Inc. | | Formerly Director (July 2015-January 2018) of Sun Bancorp, Inc. N.A. and Sun National Bank; Director (since January 2018) of OceanFirst Financial Corp. and OceanFirst Bank. | | Since November 2014 |
| | | | | | |
Interested Board Members | | | | |
| | | | |
Name Date of Birth Position(s) Portfolios Overseen | | Principal Occupation(s) During Past Five Years | | Other Directorships
Held During Past Five Years | | Length of
Board Service |
| | | | |
Stuart S. Parker 10/5/62 Board Member & President Portfolios Overseen: 96 | | President of PGIM Investments LLC (formerly known as Prudential Investments LLC) (since January 2012); Executive Vice President of Prudential Investment Management Services LLC (since December 2012); formerly Executive Vice President of Jennison Associates LLC and Head of Retail Distribution of PGIM Investments LLC (June 2005-December 2011). | | None. | | Since January 2012 |
Visit our website at pgiminvestments.com
| | | | | | |
Interested Board Members | | | | |
| | | | |
Name Date of Birth Position(s) Portfolios Overseen | | Principal Occupation(s) During Past Five Years | | Other Directorships
Held During Past Five Years | | Length of Board Service |
| | | | |
Scott E. Benjamin 5/21/73 Board Member & Vice President Portfolios Overseen: 96 | | Executive Vice President (since June 2009) of PGIM Investments LLC; Executive Vice President (June 2009-June 2012) and Vice President (since June 2012) of Prudential Investment Management Services LLC; Executive Vice President (since September 2009) of AST Investment Services, Inc.; Senior Vice President of Product Development and Marketing, PGIM Investments (since February 2006); formerly Vice President of Product Development and Product Management, PGIM Investments LLC (2003-2006). | | None. | | Since March 2010 |
| | | | |
| Fund Officers(a) | | | | |
| | | |
Name Date of Birth Fund Position | | Principal Occupation(s) During Past Five Years | | Length of Service as Fund Officer |
| | | |
Raymond A. O’Hara 9/11/55 Chief Legal Officer | | Vice President and Corporate Counsel (since July 2010) of Prudential Insurance Company of America (Prudential); Vice President (March 2011-Present) of Pruco Life Insurance Company and Pruco Life Insurance Company of New Jersey; Vice President and Corporate Counsel (March 2011-Present) of Prudential Annuities Life Assurance Corporation; Chief Legal Officer of PGIM Investments LLC (since June 2012); Chief Legal Officer of Prudential Mutual Fund Services LLC (since June 2012) and Corporate Counsel of AST Investment Services, Inc. (since June 2012); formerly Assistant Vice President and Corporate Counsel (September 2008-July 2010) of The Hartford Financial Services Group, Inc.; formerly Associate (September 1980-December 1987) and Partner (January 1988–August 2008) of Blazzard & Hasenauer, P.C. (formerly, Blazzard, Grodd & Hasenauer, P.C.). | | Since June 2012 |
PGIM QMA Stock Index Fund
| | | | |
| Fund Officers(a) | | | | |
| | | |
Name Date of Birth Fund Position | | Principal Occupation(s) During Past Five Years | | Length of Service as Fund Officer |
| | | |
Dino Capasso 8/19/74 Chief Compliance Officer | | Chief Compliance Officer (July 2019-Present) of PGIM Investments LLC; Chief Compliance Officer (July 2019-Present) of the PGIM Funds, Target Funds, Advanced Series Trust, The Prudential Series Fund, Prudential’s Gibraltar Fund, Inc., PGIM Global High Yield Fund, Inc., and PGIM High Yield Bond Fund, Inc.; Vice President and Deputy Chief Compliance Officer (June 2017-2019) of PGIM Investments LLC; formerly, Senior Vice President and Senior Counsel (January 2016-June 2017), and Vice President and Counsel (February 2012-December 2015) of Pacific Investment Management Company LLC. | | Since March 2018 |
| | | |
Andrew R. French 12/22/62 Secretary | | Vice President of PGIM Investments LLC (December 2018-Present); formerly Vice President and Corporate Counsel (February 2010-December 2018) of Prudential; formerly Director and Corporate Counsel (2006-2010) of Prudential; Vice President and Assistant Secretary (since January 2007) of PGIM Investments LLC; Vice President and Assistant Secretary (since January 2007) of Prudential Mutual Fund Services LLC. | | Since October 2006 |
| | | |
Jonathan D. Shain 8/9/58 Assistant Secretary | | Vice President and Corporate Counsel (since August 1998) of Prudential; Vice President and Assistant Secretary (since May 2001) of PGIM Investments LLC; Vice President and Assistant Secretary (since February 2001) of Prudential Mutual Fund Services LLC; formerly Vice President and Assistant Secretary (May 2003-June 2005) of AST Investment Services, Inc. | | Since May 2005 |
| | | |
Claudia DiGiacomo 10/14/74 Assistant Secretary | | Vice President and Corporate Counsel (since January 2005) of Prudential; Vice President and Assistant Secretary of PGIM Investments LLC (since December 2005); formerly Associate at Sidley Austin Brown & Wood LLP (1999-2004). | | Since December 2005 |
| | | |
Diana N. Huffman 4/14/82 Assistant Secretary | | Vice President and Corporate Counsel (since September 2015) of Prudential; formerly Associate at Willkie Farr & Gallagher LLP (2009-2015). | | Since March 2019 |
| | | |
Kelly A. Coyne 8/8/68 Assistant Secretary | | Director, Investment Operations of Prudential Mutual Fund Services LLC (since 2010). | | Since March 2015 |
| | | |
Christian J. Kelly 5/5/75 Treasurer and Principal Financial and Accounting Officer | | Vice President, Head of Fund Administration of PGIM Investments LLC (since November 2018); formerly, Director of Fund Administration of Lord Abbett & Co. LLC (2009-2018), Treasurer and Principal Accounting Officer of the Lord Abbett Family of Funds (2017-2018); Director of Accounting, Avenue Capital Group (2008-2009); Senior Manager, Investment Management Practice of Deloitte & Touche LLP (1998-2007). | | Since January 2019 |
Visit our website at pgiminvestments.com
| | | | |
| Fund Officers(a) | | | | |
| | | |
Name Date of Birth Fund Position | | Principal Occupation(s) During Past Five Years | | Length of Service as Fund Officer |
| | | |
Lana Lomuti 6/7/67 Assistant Treasurer | | Vice President (since 2007) and Director (2005-2007), within PGIM Investments Fund Administration; formerly Assistant Treasurer (December 2007-February 2014) of The Greater China Fund, Inc. | | Since April 2014 |
| | | |
Russ Shupak 10/08/73 Assistant Treasurer | | Vice President (since 2017) and Director (2013-2017), within PGIM Investments Fund Administration. | | Since October 2019 |
| | | |
Deborah Conway 3/26/69 Assistant Treasurer | | Vice President (since 2017) and Director (2007-2017), within PGIM Investments Fund Administration. | | Since October 2019 |
| | | |
Elyse M. McLaughlin 1/20/74 Assistant Treasurer | | Vice President (since 2017) and Director (2011-2017), within PGIM Investments Fund Administration. | | Since October 2019 |
| | | |
Charles H. Smith 1/11/73 Anti-Money Laundering Compliance Officer | | Vice President, Corporate Compliance, Anti-Money Laundering Unit (since January 2015) of Prudential; committee member of the American Council of Life Insurers Anti-Money Laundering and Critical Infrastructure Committee (since January 2016); formerly Global Head of Economic Sanctions Compliance at AIG Property Casualty (February 2007-December 2014); Assistant Attorney General at the New York State Attorney General’s Office, Division of Public Advocacy. (August 1998-January 2007). | | Since January 2017 |
(a)Excludes Mr. Parker and Mr. Benjamin, interested Board Members who also serve as President and Vice President, respectively.
Explanatory Notes to Tables:
| ∎ | | Board Members are deemed to be “Interested,” as defined in the 1940 Act, by reason of their affiliation with PGIM Investments LLC and/or an affiliate of PGIM Investments LLC. |
| ∎ | | Unless otherwise noted, the address of all Board Members and Officers is c/o PGIM Investments LLC, 655 Broad Street, Newark, New Jersey 07102-4410. |
| ∎ | | There is no set term of office for Board Members or Officers. The Board Members have adopted a retirement policy, which calls for the retirement of Board Members on December 31 of the year in which they reach the age of 75. |
| ∎ | | “Other Directorships Held” includes only directorships of companies required to register or file reports with the SEC under the 1934 Act (that is, “public companies”) or other investment companies registered under the 1940 Act. |
| ∎ | | “Portfolios Overseen” includes all investment companies managed by PGIM Investments LLC. The investment companies for which PGIM Investments LLC serves as manager include the PGIM Funds, The Prudential Variable Contract Accounts, PGIM ETF Trust, PGIM High Yield Bond Fund, Inc., PGIM Global High Yield Fund, Inc., The Prudential Series Fund, Prudential’s Gibraltar Fund, Inc. and the Advanced Series Trust. |
PGIM QMA Stock Index Fund
Approval of Advisory Agreements(unaudited)
The Fund’s Board of Trustees
The Board of Trustees (the “Board”) of PGIM QMA Stock Index Fund (the “Fund”)1 consists of eleven individuals, nine of whom are not “interested persons” of the Fund, as defined in the Investment Company Act of 1940, as amended (the “1940 Act”) (the “Independent Trustees”)2. The Board is responsible for the oversight of the Fund and its operations, and performs the various duties imposed on the directors of investment companies by the 1940 Act. The Independent Trustees have retained independent legal counsel to assist them in connection with their duties. The Chair of the Board is an Independent Trustee. The Board has established four standing committees: the Audit Committee, the Nominating and Governance Committee, and two Investment Committees. Each committee is chaired by, and composed of, Independent Trustees.
Annual Approval of the Fund’s Advisory Agreements
As required under the 1940 Act, the Board determines annually whether to renew the Fund’s management agreement with PGIM Investments LLC (“PGIM Investments”) and the Fund’s subadvisory agreement with QMA LLC (“QMA”). In considering the renewal of the agreements, the Board, including all of the Independent Trustees, met on May 30, 2019 and on June11-13, 2019 and approved the renewal of the agreements through July 31, 2020, after concluding that the renewal of the agreements was in the best interests of the Fund and its shareholders.
In advance of the meetings, the Board requested and received materials relating to the agreements, and had the opportunity to ask questions and request further information in connection with its consideration. Among other things, the Board considered comparative fee information from PGIM Investments and QMA. Also, the Board considered comparisons with other mutual funds in relevant Peer Universes and Peer Groups, as is further discussed below.
In approving the agreements, the Board, including the Independent Trustees advised by independent legal counsel, considered the factors it deemed relevant, including the nature, quality and extent of services provided by PGIM Investments and the subadviser, the performance of the Fund, the profitability of PGIM Investments and its affiliates, expenses and fees, and the potential for economies of scale that may be shared with the Fund and its shareholders as the Fund’s assets grow. In their deliberations, the Trustees did not identify any single factor which alone was responsible for the Board’s decision to approve the agreements with respect to the Fund. In connection with its deliberations, the Board considered information
| 1 | PGIM QMA Stock Index Fund is the sole outstanding series of Prudential Investment Portfolios 8. |
| 2 | Grace C. Torres was an Interested Trustee of the Fund at the time the Board considered and approved the renewal of the Fund’s advisory agreements, but has since become an Independent Trustee of the Fund. |
| | |
| PGIM QMA Stock Index Fund |
Approval of Advisory Agreements(continued)
provided by PGIM Investments throughout the year at regular Board meetings, presentations from portfolio managers and other information, as well as information furnished at or in advance of the meetings on May 30, 2019 and on June11-13, 2019.
The Trustees determined that the overall arrangements between the Fund and PGIM Investments, which serves as the Fund’s investment manager pursuant to a management agreement, and between PGIM Investments and QMA, which serves as the Fund’s subadviser pursuant to the terms of a subadvisory agreement with PGIM Investments, are in the best interests of the Fund and its shareholders in light of the services performed, fees charged and such other matters as the Trustees considered relevant in the exercise of their business judgment.
The material factors and conclusions that formed the basis for the Trustees’ reaching their determinations to approve the continuance of the agreements are separately discussed below.
Nature, Quality and Extent of Services
The Board received and considered information regarding the nature, quality and extent of services provided to the Fund by PGIM Investments and QMA. The Board noted that QMA is affiliated with PGIM Investments. The Board considered the services provided by PGIM Investments, including but not limited to the oversight of the subadviser for the Fund, as well as the provision of fund recordkeeping, compliance and other services to the Fund, and PGIM Investments’ role as administrator for the Fund’s liquidity risk management program. With respect to PGIM Investments’ oversight of the subadviser, the Board noted that PGIM Investments’ Strategic Investment Research Group (“SIRG”), which is a business unit of PGIM Investments, is responsible for monitoring and reporting to PGIM Investments’ senior management on the performance and operations of the subadviser. The Board also considered that PGIM Investments pays the salaries of all of the officers and interested Trustees of the Fund who are part of Fund management. The Board also considered the investment subadvisory services provided by QMA, including investment research and security selection, as well as adherence to the Fund’s investment restrictions and compliance with applicable Fund policies and procedures. The Board considered PGIM Investments’ evaluation of the subadviser, as well as PGIM Investments’ recommendation, based on its review of the subadviser, to renew the subadvisory agreement.
The Board considered the qualifications, backgrounds and responsibilities of PGIM Investments’ senior management responsible for the oversight of the Fund and QMA, and also considered the qualifications, backgrounds and responsibilities of QMA’s portfolio managers who are responsible for theday-to-day management of the Fund’s portfolio. The Board was provided with information pertaining to PGIM Investments’ and QMA’s organizational structure, senior management, investment operations, and other relevant
| | |
| Visit our website at pgiminvestments.com | | |
information pertaining to both PGIM Investments and QMA. The Board also noted that it received favorable compliance reports from the Fund’s Chief Compliance Officer (“CCO”) as to both PGIM Investments and QMA.
The Board concluded that it was satisfied with the nature, extent and quality of the investment management services provided by PGIM Investments and the subadvisory services provided to the Fund by QMA, and that there was a reasonable basis on which to conclude that the Fund benefits from the services provided by PGIM Investments and QMA under the management and subadvisory agreements.
Costs of Services and Profits Realized by PGIM Investments
The Board was provided with information on the profitability of PGIM Investments and its affiliates in serving as the Fund’s investment manager. The Board discussed with PGIM Investments the methodology utilized in assembling the information regarding profitability and considered its reasonableness. The Board recognized that it is difficult to make comparisons of profitability from fund management contracts because comparative information is not generally publicly available and is affected by numerous factors, including the structure of the particular adviser, the types of funds it manages, its business mix, numerous assumptions regarding allocations and the adviser’s capital structure and cost of capital. However, the Board considered that the cost of services provided by PGIM Investments during the year ended December 31, 2018 exceeded the management fees received by PGIM Investments, resulting in an operating loss to PGIM Investments. Taking these factors into account, the Board concluded that the profitability of PGIM Investments and its affiliates in relation to the services rendered was not unreasonable.
Economies of Scale
The Board received and discussed information concerning economies of scale that PGIM Investments may realize as the Fund’s assets grow beyond current levels. The Board noted that the management fee schedule for the Fund includes breakpoints, which have the effect of decreasing the fee rate as assets increase. During the course of time, the Board has considered information regarding the launch date of the Fund, the management fees of the Fund compared to those of similarly managed funds and PGIM Investments investment in the Fund over time. The Board noted that economies of scale can be shared with the Fund in other ways, including low management fees from inception, additional technological and personnel investments to enhance shareholder services, and maintaining existing expense structures in the face of a rising cost environment. The Board also considered PGIM Investments’ assertion that it continually evaluates the management fee schedule of the Fund and the potential to share economies of scale through breakpoints or fee waivers as asset levels increase.
| | |
| PGIM QMA Stock Index Fund |
Approval of Advisory Agreements(continued)
The Board recognized the inherent limitations of any analysis of economies of scale, stemming largely from the Board’s understanding that most of PGIM Investments’ costs are not specific to individual funds, but rather are incurred across a variety of products and services.
Other Benefits to PGIM Investments and QMA
The Board considered potential ancillary benefits that might be received by PGIM Investments and QMA and their affiliates as a result of their relationship with the Fund. The Board concluded that potential benefits to be derived by PGIM Investments included transfer agency fees received by the Fund’s transfer agent (which is affiliated with PGIM Investments), and benefits to its reputation as well as other intangible benefits resulting from PGIM Investments’ association with the Fund. The Board concluded that the potential benefits to be derived by QMA included its ability to use soft dollar credits, as well as the potential benefits consistent with those generally resulting from an increase in assets under management, specifically, potential access to additional research resources and benefits to its reputation. The Board concluded that the benefits derived by PGIM Investments and QMA were consistent with the types of benefits generally derived by investment managers and subadvisers to mutual funds.
Performance of the Fund / Fees and Expenses
The Board considered certain additional factors and made related conclusions relating to the historical performance of the Fund for theone-, three-, five- andten-year periods ended December 31, 2018.
The Board also considered the Fund’s actual management fee, as well as the Fund’s net total expense ratio, for the fiscal year ended September 30, 2018. The Board considered the management fee for the Fund as compared to the management fee charged by PGIM Investments to other funds and the fee charged by other advisers to comparable mutual funds in a Peer Group. The actual management fee represents the fee rate actually paid by Fund shareholders and includes any fee waivers or reimbursements. The net total expense ratio for the Fund represents the actual expense ratio incurred by Fund shareholders.
The mutual funds included in the Peer Universe, which was used to consider performance, and the Peer Group, which was used to consider fees and expenses, were objectively determined by Broadridge, an independent provider of mutual fund data. In certain circumstances, PGIM Investments also provided supplemental Peer Universe or Peer Group information for reasons addressed with the Board. The comparisons placed the Fund in various quartiles over various periods, with the first quartile being the best 25% of the mutual funds (for performance, the best performing mutual funds and, for expenses, the lowest cost mutual funds).
| | |
| Visit our website at pgiminvestments.com | | |
The section below summarizes key factors considered by the Board and the Board’s conclusions regarding the Fund’s performance, fees and overall expenses. The table sets forth net performance comparisons (which reflect the impact on performance of fund expenses, or any subsidies, expense caps or waivers that may be applicable) with the Peer Universe, actual management fees with the Peer Group (which reflect the impact of any subsidies or fee waivers), and net total expenses with the Peer Group, each of which were key factors considered by the Board.
| | | | | | | | |
| Net Performance | | 1 Year | | 3 Years | | 5 Years | | 10 Years |
| | 2nd Quartile | | 2nd Quartile | | 2nd Quartile | | 2nd Quartile |
| Actual Management Fees: 1st Quartile |
| Net Total Expenses: 2nd Quartile |
| • | | The Board noted that the Fund underperformed its benchmark index over all periods. |
| • | | The Board and PGIM Investments agreed to retain the existing management fee waiver, so that the effective management fee rate is 0.08% though January 31, 2020. |
| • | | The Board and PGIM Investments also agreed to retain the existing expense cap, which (exclusive of certain fees and expenses) limits transfer agency, shareholder servicing,sub-transfer agency and blue sky fees to the extent that such fees cause total annual operating expenses to exceed 0.18% for Class R6 shares through January 31, 2020. |
| • | | In addition, PGIM Investments will waive management fees or shared operating expenses on any share class to the same extent that it waives such expenses on any other share class, and has agreed that total annual fund operating expenses for Class R6 shares will not exceed total annual fund operating expenses for Class Z shares. |
| • | | The Board concluded that, in light of the above, it would be in the best interests of the Fund and its shareholders to renew the agreements. |
| • | | The Board concluded that the management fees (including subadvisory fees) and total expenses were reasonable in light of the services provided. |
* * *
After full consideration of these factors, the Board concluded that the approval of the agreements was in the best interests of the Fund and its shareholders.
| | |
| PGIM QMA Stock Index Fund |
| | | | |
| | |
| ∎ MAIL | | ∎ TELEPHONE | | ∎ WEBSITE |
655 Broad Street Newark, NJ 07102 | | (800) 225-1852 | | pgiminvestments.com |
|
| PROXY VOTING |
| The Board of Trustees of the Fund has delegated to the Fund’s subadviser the responsibility for voting any proxies and maintaining proxy recordkeeping with respect to the Fund. A description of these proxy voting policies and procedures is available without charge, upon request, by calling (800) 225-1852. Information regarding how the Fund voted proxies relating to portfolio securities during the most recent 12-month period ended June 30 is available on the Fund’s websiteand on the Securities and Exchange Commission’s website. |
|
| TRUSTEES |
| Ellen S. Alberding• Kevin J. Bannon• Scott E. Benjamin• Linda W. Bynoe• Barry H. Evans• Keith F. Hartstein• Laurie Simon Hodrick• Michael S. Hyland• Stuart S. Parker• Brian K. Reid• Grace C. Torres |
|
| OFFICERS |
| Stuart S. Parker,President• Scott E. Benjamin,Vice President• Christian J. Kelly,Treasurer and Principal Financial and Accounting Officer• Raymond A. O’Hara,Chief Legal Officer• Dino Capasso,Chief Compliance Officer• Charles H. Smith,Anti-Money Laundering Compliance Officer• Andrew R. French,Secretary• Jonathan D. Shain,Assistant Secretary• Claudia DiGiacomo,Assistant Secretary• Diana N. Huffman,Assistant Secretary• Kelly A. Coyne,Assistant Secretary• Lana Lomuti,Assistant Treasurer• Russ Shupak,Assistant Treasurer• Elyse McLaughlin,Assistant Treasurer• Deborah Conway,Assistant Treasurer |
| | | | |
| MANAGER | | PGIM Investments LLC | | 655 Broad Street
Newark, NJ 07102 |
|
| SUBADVISER | | QMA LLC | | Gateway Center Two 100 Mulberry Street
Newark, NJ 07102 |
|
| DISTRIBUTOR | | Prudential Investment Management Services LLC | | 655 Broad Street
Newark, NJ 07102 |
|
| CUSTODIAN | | The Bank of New York Mellon | | 240 Greenwich Street
New York, NY 10286 |
|
| TRANSFER AGENT | | Prudential Mutual Fund Services LLC | | PO Box 9658 Providence, RI 02940 |
|
| INDEPENDENT REGISTERED PUBLIC ACCOUNTING FIRM | | KPMG LLP | | 345 Park Avenue New York, NY 10154 |
|
| FUND COUNSEL | | Willkie Farr & Gallagher LLP | | 787 Seventh Avenue New York, NY 10019 |
|
|
| An investor should consider the investment objectives, risks, charges, and expenses of the Fund carefully before investing. The prospectus and summary prospectus contain this and other information about the Fund. An investor may obtain the prospectus and summary prospectus by visiting our website atpgiminvestments.com or by calling (800) 225-1852. The prospectus and summary prospectus should be read carefully before investing. |
|
| E-DELIVERY |
| To receive your mutual fund documents online, go topgiminvestments.com/edelivery and enroll. Instead of receiving printed documents by mail, you will receive notification via email when new materials are available. You can cancel your enrollment or change your email address at any time by visiting the website address above. |
|
| SHAREHOLDER COMMUNICATIONS WITH TRUSTEES |
| Shareholders can communicate directly with the Board of Trustees by writing to the Chair of the Board, PGIM QMA Stock Index Fund, PGIM Investments, Attn: Board of Trustees, 655 Broad Street, Newark, NJ 07102. Shareholders can communicate directly with an individual Trustee by writing to the same address. Communications are not screened before being delivered to the addressee. |
|
| AVAILABILITY OF PORTFOLIO HOLDINGS |
| The Fund files its complete schedule of portfolio holdings with the Securities and Exchange Commission on Form N-PORT. The Fund’s Form N-PORT filings are available on the Commission’s website at sec.gov. Form N-PORT is filed with the Commission quarterly, and each Fund’s full portfolio holdings as of the first and third fiscal quarter-ends (as of the third month of the Fund’s fiscal quarter for reporting periods on or after September 30, 2019) will be made publicly available 60 days after the end of each quarter at sec.gov. |
|
| The Fund’s Statement of Additional Information contains additional information about the Fund’s Trustees and is available without charge, upon request, by calling (800) 225-1852. |
Mutual Funds:
| | | | |
ARE NOT INSURED BY THE FDIC OR ANY
FEDERAL GOVERNMENT AGENCY | | MAY LOSE VALUE | | ARE NOT A DEPOSIT OF OR GUARANTEED
BY ANY BANK OR ANY BANK AFFILIATE |
PGIM QMA STOCK INDEX FUND
| | | | | | | | | | | | |
| | | SHARE CLASS | | A | | C | | I | | Z | | R6 |
| | NASDAQ | | PSIAX | | PSICX | | PDSIX | | PSIFX | | PQSIX |
| | CUSIP | | 74441F108 | | 74441F306 | | 74441F405 | | 74441F504 | | 74441F702 |
MF174 E

PGIM SECURITIZED CREDIT FUND
ANNUAL REPORT
SEPTEMBER 30, 2019
COMING SOON: PAPERLESS SHAREHOLDER REPORTS
Beginning on January 1, 2021, as permitted by regulations adopted by the Securities and Exchange Commission, paper copies of the Fund’s annual and semiannual shareholder reports will no longer be sent by mail, unless you specifically request paper copies of the reports. Instead, the reports will be made available on the Fund’s website (pgiminvestments.com), and you will be notified by mail each time a report is posted and provided with a website link to access the report.
If you already elected to receive shareholder reports electronically, you will not be affected by this change and you need not take any action. You may elect to receive shareholder reports and other communications from the Fund electronically anytime by contacting your financial intermediary (such as a broker-dealer or bank) or, if you are a direct investor, by calling 1-800-225-1852 or by sending an email request to PGIM Investments at shareholderreports@pgim.com.
You may elect to receive all future reports in paper free of charge. If you invest through a financial intermediary, you can contact your financial intermediary or follow instructions included with this notice to elect to continue to receive paper copies of your shareholder reports. If you invest directly with the Fund, you can call 1-800-225-1852 or send an email request to shareholderreports@pgim.com to let the Fund know you wish to continue receiving paper copies of your shareholder reports. Your election to receive reports in paper will apply to all funds held in your account if you invest through your financial intermediary or all funds held with the fund complex if you invest directly with the Fund.

To enroll in e-delivery, go to pgiminvestments.com/edelivery
|
Objective:Maximize total return, through a combination of current income and
capital appreciation |
Highlights(unaudited)
| • | | The Fund’s commercial mortgage-backed securities (CMBS) positioning was focused predominantly in single-asset, single-borrower CMBS mezzanine tranches, which outperformed senior bonds during the reporting period. |
| • | | The Fund’s US collateralized loan obligation (CLO) AAA- and AA-rated positions contributed positively to performance as those spreads remained stable despite weakness in the corporate market. |
| • | | Tactical positioning in US bank loans and high yield bonds, which the Fund invested in as an alternative to mezzanine CLOs, detracted from performance as some individual holdings missed earnings expectations and subsequently traded down. |
| • | | Positioning in AAA-rated CMBS detracted from performance as spreads widened in the third quarter of 2019. |
This report is not authorized for distribution to prospective investors unless preceded or accompanied by a current prospectus.
The views expressed in this report and information about the Fund’s portfolio holdings are for the period covered by this report and are subject to change thereafter.
Mutual funds are distributed by Prudential Investment Management Services LLC (PIMS), member SIPC. PGIM Fixed Income is a unit of PGIM, Inc. (PGIM), a registered investment adviser. PIMS and PGIM are Prudential Financial companies.© 2019 Prudential Financial, Inc. and its related entities. PGIM and the PGIM logo are service marks of Prudential Financial, Inc. and its related entities, registered in many jurisdictions worldwide.
| | |
| 2 | | Visit our website at pgiminvestments.com |
Table of Contents
| | | | |
| PGIM Securitized Credit Fund | | | 3 | |
This Page Intentionally Left Blank
Letter from the President

Dear Shareholder:
We hope you find the annual report for the PGIM Securitized Credit Fund informative and useful. The report covers performance for the reporting period that began July 1, 2019 (the Fund’s inception), and ended September 30, 2019.
While the US economy remained healthy, with rising corporate profits and strong job growth, the Federal Reserve cut interest rates late in the period for the first time since the Great Recession more than a decade ago. After nine rate increases in recent years, the cut was a proactive attempt by the Fed to extend the longest domestic economic expansion on record as growth in many other regions weakened. China in particular showed signs of slowing amid trade tensions with the US, and turmoil in the United Kingdom continued as it negotiated an exit from the European Union.
Despite the growing US economy, volatility returned to the equity markets during the period. After corporate tax cuts and regulatory reforms helped boost US stocks early in the period, equities declined significantly at the end of 2018 on concerns about China’s economy, a potential global trade war, higher interest rates, and worries that profit growth might slow. Stocks reversed course early in 2019, rising sharply after the Fed moderated its position on additional rate hikes for the remainder of the year. For the period overall,large-cap US equities rose whilesmall-cap US stocks fell. Stocks also declined in developed foreign and emerging markets.
The overall US bond market posted strong returns during the period on a significant rally in interest rates that saw the10-year US Treasury yield decline from around 3% to 2%. Investment grade corporate bonds led the way with a double-digit gain, while corporate high yield and municipal bonds each had a high single-digit return. Globally, bonds in developed markets delivered solid returns, while emerging markets debt also posted positive results. A continuing trend during the period was the inversion of a portion of the US Treasury yield curve, as the yield on certain shorter maturities exceeded the yield on the10-year bond.
Regarding your investments with PGIM, we believe it is important to maintain a diversified portfolio of funds consistent with your tolerance for risk, time horizon, and financial goals. Your financial advisor can help you create a diversified investment plan that may include funds covering all the basic asset classes and that reflects your personal investor profile and risk tolerance. However, diversification and asset allocation strategies do not assure a profit or protect against loss in declining markets.
At PGIM Investments, we consider it a great privilege and responsibility to help investors participate in opportunities across global markets while meeting their toughest investment challenges. PGIM is atop-10 global investment manager with more than $1 trillion in assets under management. This scale and investment expertise allow us to deliver actively managed funds and strategies to meet the needs of investors around the globe.
Thank you for choosing our family of funds.
Sincerely,

Stuart S. Parker, President
PGIM Securitized Credit Fund
November 15, 2019
| | | | |
| PGIM Securitized Credit Fund | | | 5 | |
Your Fund’s Performance (unaudited)
Performance data quoted represent past performance. Past performance does not guarantee future results. The investment return and principal value of an investment will fluctuate, so that an investor’s shares, when redeemed, may be worth more or less than their original cost. Current performance may be lower or higher than the past performance data quoted. An investor may obtain performance data as of the most recent month-end by visiting our website atpgiminvestments.com or by calling(800) 225-1852.
| | | | |
| |
| | | Average Annual Total Returns as of 9/30/19 (with sales charges)* |
| | | One Year (%) | | Since Inception (%) |
| Class A | | –0.54 | | 3.81 (11/16/15) |
| Class C | | 1.05 | | 3.92 (11/16/15) |
| Class Z | | 3.06 | | 4.96 (11/16/15) |
| Class R6 | | 3.11 | | 5.01 (11/16/15) |
| ICE BofAML US Dollar 3-Month Deposit Offered Rate Constant Maturity Index |
| | 2.65 | | 1.54 |
| Bloomberg Barclays US Aggregate Bond Index |
| | | 10.30 | | 3.71 |
| | | | |
| |
| | | Average Annual Total Returns as of 9/30/19 (without sales charges)* |
| | | One Year (%) | | Since Inception (%) |
| Class A | | 2.80 | | 4.70 (11/16/15) |
| Class C | | 2.05 | | 3.92 (11/16/15) |
| Class Z | | 3.06 | | 4.96 (11/16/15) |
| Class R6 | | 3.11 | | 5.01 (11/16/15)
|
| ICE BofAML US Dollar 3-Month Deposit Offered Rate Constant Maturity Index |
| | 2.65 | | 1.54 |
| Bloomberg Barclays US Aggregate Bond Index |
| | | 10.30 | | 3.71 |
Source: PGIM Investments LLC and Lipper Inc.
* For periods prior to July 1, 2019, the Fund’s performance is that of an investment trust (the “Predecessor Fund”), which commenced operations on November 16, 2015. The performance of the Predecessor Fund has been adjusted to reflect the fees and expenses for the applicable class of shares of the Fund. If the performance of the Predecessor Fund had not been adjusted to reflect the fees and expenses of the Fund, the performance may have been higher than the performance shown for each class of shares. The Predecessor Fund was reorganized into the Fund immediately before the Fund commenced operations on July 1, 2019. Prior to the reorganization, the Predecessor Fund was managed by the Fund’s subadviser since its inception (using the same portfolio management team). The investment objective and strategies of the Predecessor Fund were, in all material respects, the same as those of the Fund, and the Predecessor Fund was managed in a manner that, in all material respects, complied with the investment guidelines and restrictions of the Fund. However, the Predecessor Fund was not registered as an investment company under the Investment Company Act of 1940 (“1940 Act”) and the Predecessor Fund was not subject to certain investment limitations, diversification requirements, liquidity requirements, and other restrictions imposed by the 1940 Act and the Internal Revenue Code of 1986 which, if applicable, may have resulted in different performance.
| | |
| 6 | | Visit our website at pgiminvestments.com |
Growth of a $10,000 Investment(unaudited)
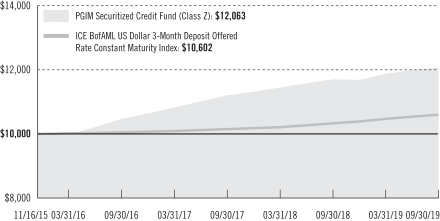
The graph shows a $10,000 investment in Fund’s Class Z shares by linking the performance of the Predecessor Fund* (which commenced operations on November 16, 2015) with the performance of Class Z shares (which commenced operations on July 1, 2019), and comparing that performance to a similar investment in the ICE BofAML US Dollar 3-Month Deposit Offered Rate Constant Maturity Index. The graph portrays the initial account values and the account values at the end of the current fiscal year (September 30, 2019) as measured on a quarterly basis. For purposes of the graph, and unless otherwise indicated, it has been assumed that (a) all recurring fees (including management fees) were deducted; and (b) all dividends and distributions were reinvested. The line graph provides information for Class Z shares only. As indicated in the tables provided earlier, performance for other share classes will vary due to the differing charges and expenses applicable to each share class (as indicated in the following paragraphs). Without waiver of fees and/or expense reimbursement, if any, the Fund’s returns would have been lower.
Past performance does not predict future performance. Total returns and the ending account values in the graphs include changes in share price and reinvestment of dividends and capital gains distributions in a hypothetical investment for the periods shown. The Fund’s total returns do not reflect the deduction of income taxes on an individual’s investment. Taxes may reduce your actual investment returns on income or gains paid by the Fund or any gains you may realize if you sell your shares.
* For periods prior to July 1, 2019, the Fund’s performance is that of an investment trust (the “Predecessor Fund”), which commenced operations on November 16, 2015. The performance of the Predecessor Fund has been adjusted to reflect the fees and expenses for the applicable class of shares of the Fund. If the performance of the Predecessor Fund had not been adjusted to reflect the fees and expenses of the Fund, the performance may have been higher than the performance shown for each class of shares. The Predecessor Fund was reorganized into the Fund immediately before the Fund commenced operations on July 1, 2019. Prior to the reorganization, the Predecessor Fund was managed by the Fund’s subadviser since
| | | | |
| PGIM Securitized Credit Fund | | | 7 | |
Your Fund’s Performance(continued)
its inception (using the same portfolio management team). The investment objective and strategies of the Predecessor Fund were, in all material respects, the same as those of the Fund, and the Predecessor Fund was managed in a manner that, in all material respects, complied with the investment guidelines and restrictions of the Fund. However, the Predecessor Fund was not registered as an investment company under the Investment Company Act of 1940 (“1940 Act”) and the Predecessor Fund was not subject to certain investment limitations, diversification requirements, liquidity requirements, and other restrictions imposed by the 1940 Act and the Internal Revenue Code of 1986 which, if applicable, may have resulted in different performance.
The returns in the tables do not reflect the deduction of taxes that a shareholder would pay on Fund distributions or following the redemption of Fund shares. The average annual total returns take into account applicable sales charges, which are described for each share class in the table below.
| | | | | | | | |
| | | | | |
| | | Class A | | Class C | | Class Z | | Class R6 |
| Maximum initial sales charge | | 3.25% of the public offering price. | | None | | None | | None |
| Contingent deferred sales charge (CDSC) (as a percentage of the lower of the original purchase price or the net asset value at redemption) | | 1.00% on sales of $500,000 or more made within 12 months of purchase. | | 1.00% on sales made within 12 months of purchase | | None | | None |
| Annual distribution and service(12b-1) fees (shown as a percentage of average daily net assets) | | 0.25% | | 1.00% | | None | | None |
Benchmark Definitions
ICE BofAML US Dollar 3-Month Deposit Offered Rate Constant Maturity Index—The ICE BofAML US Dollar 3-Month Deposit Offered Rate Constant Maturity Index is an unmanaged index which tracks the performance of a synthetic asset paying LIBOR to a stated maturity. The index is based on the assumed purchase at par of a synthetic instrument having exactly its stated maturity and with a coupon equal to that day’s fixing rate. That issue is assumed to be sold the following business day (priced at a yield equal to the current day fixing rate) and rolled into a new instrument. Index returns do not include the effect of any mutual fund sales charges, operating expenses, or taxes. These returns would be lower if they included the effect of these expenses. Source: ICE BofA Merrill Lynch, used with permission.
Bloomberg Barclays US Aggregate Bond Index—The Bloomberg Barclays US Aggregate Bond Index is unmanaged and represents securities that are SEC-registered, taxable, and dollar denominated. It covers the US investment-grade fixed rate bond market, with index components for government and corporate securities, mortgage pass-through securities, and asset-backed securities.
| | |
| 8 | | Visit our website at pgiminvestments.com |
Investors cannot invest directly in an index or average. The returns for the Index would be lower if they included the effects of sales charges, operating expenses of a mutual fund, or taxes.
| | | | |
|
| Credit Quality expressed as a percentage of total investments as of 9/30/19 (%) | |
| AAA | | | 25.8 | |
| AA | | | 27.1 | |
| A | | | 3.0 | |
| BBB | | | 10.9 | |
| BB | | | 9.3 | |
| B | | | 3.7 | |
| CCC | | | 1.5 | |
| Not Rated | | | 13.1 | |
| Cash/Cash Equivalents | | | 5.6 | |
| Total Investments | | | 100.0 | |
Source: PGIM Fixed Income
Credit ratings reflect the highest rating assigned by a nationally recognized statistical rating organization (NRSRO) such as Moody’s Investors Service, Inc. (Moody’s), S&P Global Ratings (S&P), or Fitch, Inc. (Fitch). Credit ratings reflect the common nomenclature used by both S&P and Fitch. Where applicable, ratings are converted to the comparable S&P/Fitch rating tier nomenclature. These rating agencies are independent and are widely used. The Not Rated category consists of securities that have not been rated by a NRSRO. Credit ratings are subject to change.
| | | | | | |
|
| Distributions and Yields as of 9/30/19 |
| | Total Distributions
Paid Since 7/1/19 ($) | | SEC 30-Day
SubsidizedYield* (%) | | SEC 30-Day
UnsubsidizedYield** (%) |
| Class A | | 0.08 | | 2.98 | | –199.98 |
| Class C | | 0.06 | | 2.32 | | –199.99 |
| Class Z | | 0.09 | | 3.35 | | 1.08 |
| Class R6 | | 0.09 | | 3.39 | | –199.99 |
*SEC 30-Day Subsidized Yield (%)—A standardized yield calculation created by the Securities and Exchange Commission, it reflects the income earned during a 30-day period, after the deduction of the Fund’s net expenses (net of any expense waivers or reimbursements). The investor experience is represented by the SEC 30-Day Subsidized Yield.
**SEC 30-Day Unsubsidized Yield (%)—A standardized yield calculation created by the Securities and Exchange Commission, it reflects the income earned during a 30-day period, after the deduction of the Fund’s gross expenses. The investor experience is represented by the SEC 30-Day Subsidized Yield.
| | | | |
| PGIM Securitized Credit Fund | | | 9 | |
Strategy and Performance Overview(unaudited)
How did the Fund perform?
ThePGIM Securitized Credit Fund’s Class Z shares returned 0.57% from the Fund’s inception on July 1, 2019 through the end of the reporting period on September 30, 2019, underperforming the 1.54% return of the ICE BofAML US Dollar3-Month Deposit Offered Rate Constant Maturity Index (the Index). For periods prior to July 1, 2019, the performance was that of the Predecessor Fund, which commenced operations on November 16, 2015.
What were the market conditions?
| • | | US Treasury rates rallied in the third quarter of 2019 as markets capitulated to the lower long-term global growth outlook. This outlook also impacted some of the more growth-sensitive sectors within corporate credit, especially those with higher leverage. Shifting expectations for growth and an ongoing need for yield, combined with a cautious view on corporate credit, led to bifurcated performance between different tranches within the commercial mortgage-backed securities (CMBS), asset-backed securities (ABS), and collateralized loan obligation (CLO) markets. |
| • | | In CMBS, the lower rates allowed lenders to be more competitive, leading to an increase in non-agency issuance. Despite the traditional summer slowdown, the CMBS market issued $13.1 billion of new securities in the third quarter after about $9.5 billion in the second quarter of 2019. PGIM Fixed Income expects issuance to remain elevated through the fourth quarter. As a result of higher-than-expected new issuance, AAA-rated CMBS spreads widened from the mid 80s to the mid 90s. (Spreads are yield differentials versus US Treasury securities of comparable maturity.) Conversely, BBB-rated CMBS spreads tightened, as investors favored riskier, higher-yielding, fixed-rate securities. From a fundamentals perspective, PGIM Fixed Income remained constructive on the outlook for commercial real estate, with low vacancies and net-operating-income growth in excess of inflation. Underwriting standards for CMBS conduit loans were largely stable in the third quarter, though there were some signs of deterioration, including a subtle shift to higher leverage. |
| • | | In residential mortgage-backed securities (RMBS), PGIM Fixed Income’s expectations for slowing home price appreciation (HPA) emerged in recent data, and HPA may move lower in 2020 while remaining positive. Overall, PGIM Fixed Income remained constructive on residential housing and post-crisis mortgage credit fundamentals, but the sector remained extremely crowded and there may be more compelling value in other parts of the securitized market. |
| • | | In ABS, spreads were also impacted by the US Treasury rally, as private student loans underperformed due to higher prepayment expectations. Conversely, short-term securities, such as subprime auto loans, performed well. |
| | |
| 10 | | Visit our website at pgiminvestments.com |
| • | | In CLOs, the bifurcation between senior and junior tranches was much more pronounced as the market began pricing in underlying fundamental weakness in parts of the bank loan market. Mezzanine and equity securities, which are most sensitive to credit technicals and fundamentals, underperformed as spreads widened. Meanwhile, AAA spreads remained unchanged, as these tranches are less sensitive to underlying credit deterioration. |
What worked?
| • | | The Fund’s CMBS positioning was focused predominantly in single-asset, single-borrower (SASB) CMBS mezzanine tranches, which outperformed senior bonds during the reporting period. The Fund also benefitted from a short position in AAA CMBX, which is a synthetic index that tracks CMBS, that the Fund closed out of as the market widened. The Fund’s positioning in interest-only tranches also contributed positively. |
| • | | The Fund’s US CLO AAA- and AA-rated positions contributed positively to performance as those spreads remained stable despite weakness in the corporate market. |
What didn’t work?
| • | | Tactical positioning in US bank loans and high yield bonds, which the Fund invested in as an alternative to mezzanine CLOs, detracted from performance as some individual holdings missed earnings expectations and subsequently traded down. |
| • | | Positioning in AAA-rated CMBS detracted from performance as spreads widened in the third quarter. |
| • | | Positioning in euro-denominated CLOs detracted from performance as spreads lagged primary market tightening. |
Did the Fund use derivatives?
| • | | The Fund utilized interest rate swaps to hedge interest rate risk relative to the Index to help immunize any impact from fluctuations in interest rates. |
| • | | Derivatives in the form of forward currency exchange contracts were used to hedge against the Fund’s positions not denominated in US dollars. The derivatives help immunize any impact from fluctuating currencies outside the US dollar. |
Current outlook
| • | | PGIM Fixed Income’s fundamental outlook remains benign across a host of asset types, including commercial real estate, residential real estate, and consumer loans. That said, PGIM Fixed Income is less bullish on fundamentals than in past years given headwinds such as slowing growth, trade uncertainty, a leveraged US consumer, and full valuations for commercial and residential real estate. |
| | | | |
| PGIM Securitized Credit Fund | | | 11 | |
Strategy and Performance Overview(continued)
| • | | The Fund’s risk positioning overall remains conservative given the uncertainty in broader market conditions. The largest exposures are in senior CLOs, AAA-rated CMBS, and select SASB CMBS subordinates, and PGIM Fixed Income expects to continue to hold its modest corporate credit exposures. The Fund’s exposure to non-agency RMBS investments is lower relative to previous periods reflecting the run-up in valuations in recent years. PGIM Fixed Income currently favors bespoke financings of high-quality mortgage pools at spreads ranging from LIBOR +115 to 225 basis points (bps). (One basis point is 0.01%.) |
| • | | Ongoing elevated issuance will likely place a near-term floor on spread tightening in both the CLO and CMBS AAA markets. PGIM Fixed Income believes the market in senior bonds will stay relatively stable, barring a macro sell-off, and spreads will remain range-bound (+/- 5 bps) from current levels. PGIM Fixed Income also believes consumer fundamentals will remain stable as economic data remains favorable, and it expects issuer tiering based on fundamental quality or market perception to continue in ABS, CMBS, and CLOs. |
| | |
| 12 | | Visit our website at pgiminvestments.com |
Fees and Expenses(unaudited)
As a shareholder of the Fund, you incur two types of costs: (1) transaction costs, including sales charges (loads) on purchase payments and redemptions, as applicable, and (2) ongoing costs, including management fees, distribution and/or service (12b-1) fees, and other Fund expenses, as applicable. This example is intended to help you understand your ongoing costs (in dollars) of investing in the Fund and to compare these costs with the ongoing costs of investing in other mutual funds.
The example is based on an investment of $1,000 held through the period ended September 30, 2019. The example is for illustrative purposes only; you should consult the Prospectus for information on initial and subsequent minimum investment requirements.
Actual Expenses
The first line for each share class in the table on the following page provides information about actual account values and actual expenses. You may use the information on this line, together with the amount you invested, to estimate the expenses that you paid over the period. Simply divide your account value by $1,000 (for example, an $8,600 account value ÷ $1,000 = 8.6), then multiply the result by the number on the first line under the heading “Expenses Paid During the Six-Month Period” to estimate the expenses you paid on your account during this period.
Hypothetical Example for Comparison Purposes
The second line for each share class in the table on the following page provides information about hypothetical account values and hypothetical expenses based on the Fund’s actual expense ratio and an assumed rate of return of 5% per year before expenses, which is not the Fund’s actual return. The hypothetical account values and expenses may not be used to estimate the actual ending account balance or expenses you paid for the period. You may use this information to compare the ongoing costs of investing in the Fund and other funds. To do so, compare this 5% hypothetical example with the 5% hypothetical examples that appear in the shareholder reports of the other funds.
The Fund’s transfer agent may charge additional fees to holders of certain accounts that are not included in the expenses shown in the table on the following page. These fees apply to individual retirement accounts (IRAs) and Section 403(b) accounts. As of the close of the six-month period covered by the table, IRA fees included an annual maintenance fee of $15 per account (subject to a maximum annual maintenance fee of $25 for all accounts held by the same shareholder). Section 403(b) accounts are charged an annual $25 fiduciary maintenance fee. Some of the fees may vary in amount, or may be waived, based on your total account balance or the number of PGIM funds, including the Fund, that you own. You should consider the additional fees that were charged to your Fund account over
| | | | |
| PGIM Securitized Credit Fund | | | 13 | |
the period when you estimate the total ongoing expenses paid over the period and the impact of these fees on your ending account value, as these additional expenses are not reflected in the information provided in the expense table. Additional fees have the effect of reducing investment returns.
Please note that the expenses shown in the table are meant to highlight your ongoing costs only and do not reflect any transactional costs such as sales charges (loads). Therefore, the second line for each share class in the table is useful in comparing ongoing costs only and will not help you determine the relative total costs of owning different funds. In addition, if these transactional costs were included, your costs would have been higher.
| | | | | | | | | | | | | | | | | | |
| | | | |
PGIM Securitized
Credit Fund | | Beginning Account
Value
April 1, 2019 | | | Ending Account
Value
September 30, 2019 | | | Annualized
Expense Ratio
Based on the
Six-Month Period | | | Expenses Paid
During the
Six-Month Period* | |
| Class A | | Actual** | | $ | 1,000.00 | | | $ | 1,005.10 | | | | 0.90 | % | | $ | 2.27 | |
| | Hypothetical | | $ | 1,000.00 | | | $ | 1,020.56 | | | | 0.90 | % | | $ | 4.56 | |
| Class C | | Actual** | | $ | 1,000.00 | | | $ | 1,003.30 | | | | 1.65 | % | | $ | 4.17 | |
| | Hypothetical | | $ | 1,000.00 | | | $ | 1,016.80 | | | | 1.65 | % | | $ | 8.34 | |
| Class Z | | Actual** | | $ | 1,000.00 | | | $ | 1,005.70 | | | | 0.65 | % | | $ | 1.64 | |
| | Hypothetical | | $ | 1,000.00 | | | $ | 1,021.81 | | | | 0.65 | % | | $ | 3.29 | |
| Class R6 | | Actual** | | $ | 1,000.00 | | | $ | 1,005.80 | | | | 0.60 | % | | $ | 1.52 | |
| | | Hypothetical | | $ | 1,000.00 | | | $ | 1,022.06 | | | | 0.60 | % | | $ | 3.04 | |
*Fund expenses (net of fee waivers or subsidies, if any) for each share class are equal to the annualized expense ratio for each share class (provided in the table), multiplied by the average account value over the period, multiplied by the 183 days in the six-month period ended September 30, 2019, and divided by the 365 days in the Fund’s fiscal year ended September 30, 2019 (to reflect the six-month period). Expenses presented in the table include the expenses of any underlying portfolios in which the Fund may invest.
**“Actual” expenses are calculated using 92-day period ended September 30, 2019 due to the Fund’s inception date of July 1, 2019.
| | |
| 14 | | Visit our website at pgiminvestments.com |
Schedule of Investments
as of September 30, 2019
| | | | | | | | | | | | | | | | |
| | | | |
| Description | | Interest
Rate | | | Maturity
Date | | | Principal Amount (000)# | | | Value | |
| | | | |
LONG-TERM INVESTMENTS 95.1% | | | | | | | | | | | | | | | | |
| | | | |
ASSET-BACKED SECURITIES 53.4% | | | | | | | | | | | | | | | | |
| | | | |
Automobiles 4.3% | | | | | | | | | | | | | | | | |
Ally Auto Receivables Trust,
Series 2017-03, Class R, IO, 144A^ | | | 0.000 | % | | | 01/16/24 | | | | 1 | | | $ | 231,600 | |
OneMain Direct Auto Receivables Trust, | | | | | | | | | | | | | | | | |
Series 2017-02A, Class E, 144A | | | 4.740 | | | | 11/14/25 | | | | 800 | | | | 812,925 | |
Series 2019-01A, Class B, 144A | | | 3.950 | | | | 11/14/28 | | | | 100 | | | | 105,258 | |
| | | | | | | | | | | | | | | | |
| | | | | | | | | | | | | | | 1,149,783 | |
| | | | |
Collateralized Loan Obligations 36.4% | | | | | | | | | | | | | | | | |
Anchorage Capital Europe CLO (Ireland),
Series 01X, Class A2 | | | 1.500 | | | | 01/15/31 | | | EUR | 500 | | | | 544,071 | |
Aurium CLO DAC (Ireland),
Series 04A, Class A2, 144A | | | 1.620 | | | | 01/16/31 | | | EUR | 450 | | | | 490,050 | |
BlueMountain Fuji CLO DAC (Ireland),
Series 04A, Class B2, 144A | | | 2.900 | | | | 03/30/32 | | | EUR | 500 | | | | 553,265 | |
Elevation CLO Ltd. (Cayman Islands),
Series 2015-04A, Class BR, 144A, 3 Month LIBOR + 1.670% (Cap N/A, Floor 0.000%) | | | 3.970 | (c) | | | 04/18/27 | | | | 500 | | | | 499,956 | |
Ellington CLO Ltd. (Cayman Islands), | | | | | | | | | | | | | | | | |
Series 2017-02A, Class A, 144A, 3 Month LIBOR + 1.700% (Cap N/A, Floor 1.700%) | | | 3.858 | (c) | | | 02/15/29 | | | | 750 | | | | 751,519 | |
Series 2019-04A, Class A, 144A, 3 Month LIBOR + 1.840% (Cap N/A, Floor 1.840%) | | | 4.143 | (c) | | | 04/15/29 | | | | 500 | | | | 501,919 | |
Jefferson Mill CLO Ltd. (Cayman Islands),
Series 2015-01A, Class BR, 144A, 3 Month LIBOR + 1.950% (Cap N/A, Floor 0.000%) | | | 4.228 | (c) | | | 10/20/31 | | | | 300 | | | | 300,052 | |
KVK CLO Ltd. (Cayman Islands),
Series 2018-01A, Class B, 144A, 3 Month LIBOR + 1.650% (Cap N/A, Floor 0.000%) | | | 3.786 | (c) | | | 05/20/29 | | | | 500 | | | | 496,428 | |
MidOcean Credit CLO (Cayman Islands),
Series 2018-08A, Class B, 144A, 3 Month LIBOR + 1.650% (Cap N/A, Floor 0.000%) | | | 3.786 | (c) | | | 02/20/31 | | | | 1,000 | | | | 985,569 | |
OCP Euro CLO DAC (Ireland),
Series 2019-03A, Class B2, 144A | | | 2.450 | | | | 04/20/30 | | | EUR | 250 | | | | 271,831 | |
OZLM Ltd. (Cayman Islands), | | | | | | | | | | | | | | | | |
Series 2014-06A, Class A2AS, 144A, 3 Month LIBOR + 1.750% (Cap N/A, Floor 0.000%) | | | 4.053 | (c) | | | 04/17/31 | | | | 250 | | | | 247,918 | |
Series 2014-09A, Class A2RR, 144A, 3 Month LIBOR + 1.900% (Cap N/A, Floor 1.900%) | | | 4.178 | (c) | | | 10/20/31 | | | | 500 | | | | 495,672 | |
See Notes to Financial Statements.
| | | | |
| PGIM Securitized Credit Fund | | | 15 | |
Schedule of Investments(continued)
as of September 30, 2019
| | | | | | | | | | | | | | | | |
| | | | |
| Description | | Interest
Rate | | | Maturity
Date | | | Principal
Amount (000)# | | | Value | |
| | | | |
ASSET-BACKED SECURITIES (Continued) | | | | | | | | | | | | | | | | |
| | | | |
Collateralized Loan Obligations (cont’d.) | | | | | | | | | | | | | | | | |
Park Avenue Institutional Advisers CLO Ltd. (Cayman Islands),
Series 2019-01A, Class A1, 144A, 3 Month LIBOR + 1.480%
(Cap N/A, Floor 1.480%) | | | 4.044 | %(c) | | | 05/15/32 | | | | 500 | | | $ | 500,077 | |
Trimaran Cavu Ltd. (Cayman Islands),
Series 2019-01A, Class B, 144A, 3 Month LIBOR + 2.200%
(Cap N/A, Floor 2.200%) | | | 4.667 | (c) | | | 07/20/32 | | | | 500 | | | | 499,743 | |
Trinitas CLO Ltd. (Cayman Islands), | | | | | | | | | | | | | | | | |
Series 2015-03A, Class BR, 144A, 3 Month LIBOR + 1.400%
(Cap N/A, Floor 0.000%) | | | 3.703 | (c) | | | 07/15/27 | | | | 750 | | | | 743,583 | |
Series 2016-04A, Class BR, 144A, 3 Month LIBOR + 1.950%
(Cap N/A, Floor 0.000%) | | | 4.250 | (c) | | | 10/18/31 | | | | 500 | | | | 501,429 | |
Series 2017-07A, Class B, 144A, 3 Month LIBOR + 1.600%
(Cap N/A, Floor 0.000%) | | | 3.876 | (c) | | | 01/25/31 | | | | 500 | | | | 491,875 | |
Zais CLO Ltd. (Cayman Islands),
Series 2015-03A, Class A2R, 144A, 3 Month LIBOR + 2.190%
(Cap N/A, Floor 0.000%) | | | 4.493 | (c) | | | 07/15/31 | | | | 975 | | | | 957,164 | |
| | | | | | | | | | | | | | | | |
| | | | | | | | | | | | | | | 9,832,121 | |
| | | | |
Consumer Loans 4.3% | | | | | | | | | | | | | | | | |
OneMain Financial Issuance Trust,
Series 2017-01A, Class C, 144A | | | 3.350 | | | | 09/14/32 | | | | 100 | | | | 100,431 | |
Oportun Funding LLC, | | | | | | | | | | | | | | | | |
Series 2017-B, Class B, 144A | | | 4.260 | | | | 10/10/23 | | | | 250 | | | | 251,988 | |
Series 2018-C, Class C, 144A | | | 5.520 | | | | 10/08/24 | | | | 500 | | | | 513,712 | |
PNMAC GMSR Issuer Trust, | | | | | | | | | | | | | | | | |
Series 2018-GT01, Class A, 144A, 1 Month LIBOR + 2.850%
(Cap N/A, Floor 2.850%) | | | 4.868 | (c) | | | 02/25/23 | | | | 100 | | | | 100,060 | |
Series 2018-GT02, Class A, 144A, 1 Month LIBOR + 2.650%
(Cap N/A, Floor 0.000%) | | | 4.668 | (c) | | | 08/25/25 | | | | 100 | | | | 100,352 | |
Springleaf Funding Trust,
Series 2017-AA, Class C, 144A | | | 3.860 | | | | 07/15/30 | | | | 100 | | | | 102,202 | |
| | | | | | | | | | | | | | | | |
| | | | | | | | | | | | | | | 1,168,745 | |
| | | | |
Home Equity Loans 0.7% | | | | | | | | | | | | | | | | |
Ameriquest Mortgage Securities, Inc. Asset-BackedPass-Through Certificates,
Series 2003-AR01, Class M3, 1 Month LIBOR + 4.500%
(Cap N/A, Floor 3.000%) | | | 4.054 | (c) | | | 01/25/33 | | | | 182 | | | | 182,237 | |
See Notes to Financial Statements.
| | | | | | | | | | | | | | | | |
| | | | |
| Description | | Interest
Rate | | | Maturity
Date | | | Principal
Amount (000)# | | | Value | |
| | | | |
ASSET-BACKED SECURITIES (Continued) | | | | | | | | | | | | | | | | |
| | | | |
Other 1.3% | | | | | | | | | | | | | | | | |
PNMAC FMSR Issuer Trust,
Series 2018-FT01, Class A, 144A, 1 Month LIBOR + 2.350% (Cap N/A, Floor 0.000%) | | | 4.368 | %(c) | | | 04/25/23 | | | | 360 | | | $ | 358,044 | |
| | | | |
Residential Mortgage-Backed Securities 4.2% | | | | | | | | | | | | | | | | |
Credit Suisse Mortgage Trust,
Series 2016-RPL01, Class A1, 144A, 1 Month LIBOR + 3.150% (Cap N/A, Floor 3.150%) | | | 5.250 | (c) | | | 12/26/46 | | | | 252 | | | | 252,060 | |
CWABS Asset-Backed Certificates Trust,
Series 2004-13, Class AF5A | | | 4.815 | (cc) | | | 05/25/35 | | | | 147 | | | | 148,161 | |
Legacy Mortgage Asset Trust,
Series 2019-GS04, Class A1, 144A | | | 3.438 | | | | 05/25/59 | | | | 97 | | | | 97,413 | |
TFS (Spain),
Series 2018-03, Class A1, 1 Month EURIBOR + 2.900% | | | 2.900 | (c) | | | 03/16/23 | | | EUR | 590 | | | | 641,693 | |
| | | | | | | | | | | | | | | | |
| | | | | | | | | | | | | | | 1,139,327 | |
| | | | |
Student Loans 2.2% | | | | | | | | | | | | | | | | |
Laurel Road Prime Student Loan Trust,
Series 2019-A, Class R, 144A | | | 0.000 | | | | 10/25/48 | | | | 2,700 | | | | 188,875 | |
SLM Student Loan Trust,
Series 2007-02, Class B, 3 Month LIBOR + 0.170%
(Cap N/A, Floor 0.000%) | | | 2.446 | (c) | | | 07/25/25 | | | | 200 | | | | 182,923 | |
SoFi Alternative Trust,
Series 2019-D, Class 1PT, 144A | | | 2.460 | (cc) | | | 01/16/46 | | | | 200 | | | | 205,955 | |
| | | | | | | | | | | | | | | | |
| | | | | | | | | | | | | | | 577,753 | |
| | | | | | | | | | | | | | | | |
TOTAL ASSET-BACKED SECURITIES
(cost $14,540,094) | | | | | | | | | | | | | | | 14,408,010 | |
| | | | | | | | | | | | | | | | |
| | | | |
BANK LOANS 4.1% | | | | | | | | | | | | | | | | |
| | | | |
Chemicals 0.4% | | | | | | | | | | | | | | | | |
Solenis International LP,
First Lien Initial Dollar Term Loan, 1 - 3 Month LIBOR + 4.000% | | | 6.118 | (c) | | | 06/26/25 | | | | 125 | | | | 121,367 | |
| | | | |
Environmental Control 0.4% | | | | | | | | | | | | | | | | |
Advanced Disposal Services, Inc.,
Initial Term Loan, 1 Month LIBOR + 2.250% | | | 4.197 | (c) | | | 11/10/23 | | | | 100 | | | | 99,920 | |
See Notes to Financial Statements.
| | | | |
| PGIM Securitized Credit Fund | | | 17 | |
Schedule of Investments(continued)
as of September 30, 2019
| | | | | | | | | | | | | | | | |
| | | | |
| Description | | Interest
Rate | | | Maturity
Date | | | Principal
Amount (000)# | | | Value | |
| | | | |
BANK LOANS (Continued) | | | | | | | | | | | | | | | | |
| | | | |
Pharmaceuticals 0.9% | | | | | | | | | | | | | | | | |
Arbor Pharmaceuticals LLC,
Term Loan | | | — | %(p) | | | 07/05/23 | | | | 123 | | | $ | 113,014 | |
NVA Holdings, Inc.,
Term B-3 Loan (First Lien), 1 Month LIBOR + 2.750% | | | 4.794 | (c) | | | 02/02/25 | | | | 125 | | | | 124,568 | |
| | | | | | | | | | | | | | | | |
| | | | | | | | | | | | | | | 237,582 | |
| | | | |
Real Estate 0.4% | | | | | | | | | | | | | | | | |
Brookfield Property REIT, Inc.,
Initial Term B Loan, 1 Month LIBOR + 2.500% | | | 4.544 | (c) | | | 08/27/25 | | | | 125 | | | | 122,704 | |
| | | | |
Software 1.2% | | | | | | | | | | | | | | | | |
Boxer Parent Co., Inc.,
Initial Dollar Term Loan, 1 Month LIBOR + 4.250% | | | 6.294 | (c) | | | 10/02/25 | | | | 125 | | | | 119,952 | |
Exela Intermediate LLC,
2018 Repriced Term Loan, 3 Month LIBOR + 6.500% | | | 8.849 | (c) | | | 07/12/23 | | | | 124 | | | | 74,303 | |
Finastra USA, Inc.,
First Lien Dollar Term Loan, 1 - 6 Month LIBOR + 3.500% | | | 5.696 | (c) | | | 06/13/24 | | | | 124 | | | | 121,125 | |
| | | | | | | | | | | | | | | | |
| | | | | | | | | | | | | | | 315,380 | |
| | | | |
Telecommunications 0.8% | | | | | | | | | | | | | | | | |
GTT Communications, Inc.,
Closing Date U.S. Term Loan, 1 Month LIBOR + 2.750% | | | 4.790 | (c) | | | 05/30/25 | | | | 125 | | | | 99,643 | |
West Corp.,
Initial Term B Loan, 1 Month LIBOR + 4.000% | | | 6.044 | (c) | | | 10/10/24 | | | | 124 | | | | 110,864 | |
| | | | | | | | | | | | | | | | |
| | | | | | | | | | | | | | | 210,507 | |
| | | | | | | | | | | | | | | | |
TOTAL BANK LOANS
(cost $1,167,178) | | | | | | | | | | | | | | | 1,107,460 | |
| | | | | | | | | | | | | | | | |
| | | |
COMMERCIAL MORTGAGE-BACKED SECURITIES 28.2% | | | | | | | | | | | | | |
20 Times Square Trust, | | | | | | | | | | | | | | | | |
Series 2018-20TS, Class G, 144A | | | 3.203 | (cc) | | | 05/15/35 | | | | 100 | | | | 96,776 | |
Series 2018-20TS, Class H, 144A | | | 3.203 | (cc) | | | 05/15/35 | | | | 100 | | | | 94,974 | |
Barclays Commercial Mortgage Trust,
Series 2019-C04, Class A4 | | | 2.661 | | | | 08/15/52 | | | | 1,000 | | | | 1,015,280 | |
See Notes to Financial Statements.
| | | | | | | | | | | | | | | | |
| | | | |
| Description | | Interest
Rate | | | Maturity
Date | | | Principal
Amount (000)# | | | Value | |
| | |
COMMERCIAL MORTGAGE-BACKED SECURITIES (Continued) | | | | | | | | | |
BBCMS Mortgage Trust, | | | | | | | | | | | | | | | | |
Series 2016-ETC, Class E, 144A | | | 3.729 | %(cc) | | | 08/14/36 | | | | 250 | | | $ | 236,927 | |
Series 2018-CHRS, Class D, 144A | | | 4.409 | (cc) | | | 08/05/38 | | | | 100 | | | | 106,094 | |
Series 2018-TALL, Class D, 144A, 1 Month LIBOR + 1.449%
(Cap N/A, Floor 1.449%) | | | 3.476 | (c) | | | 03/15/37 | | | | 210 | | | | 209,999 | |
Benchmark Mortgage Trust,
Series 2018-B02, Class A5 | | | 3.882 | (cc) | | | 02/15/51 | | | | 600 | | | | 664,419 | |
Citigroup Commercial Mortgage Trust,
Series 2019-SMRT, Class E, 144A | | | 4.903 | (cc) | | | 01/10/24 | | | | 500 | | | | 519,754 | |
Credit Suisse Mortgage Capital Certificates,
Series 2019-ICE04, Class F, 144A, 1 Month LIBOR + 2.650%
(Cap N/A, Floor 2.650%) | | | 4.678 | (c) | | | 05/15/36 | | | | 150 | | | | 150,468 | |
Credit Suisse Mortgage Trust, | | | | | | | | | | | | | | | | |
Series 2016-NXSR, Class A4 | | | 3.795 | (cc) | | | 12/15/49 | | | | 500 | | | | 542,871 | |
Series 2017-LSTK, Class D, 144A | | | 3.442 | (cc) | | | 04/05/33 | | | | 250 | | | | 249,947 | |
Series 2017-LSTK, Class E, 144A | | | 3.442 | (cc) | | | 04/05/33 | | | | 295 | | | | 293,272 | |
CSAIL Commercial Mortgage Trust, | | | | | | | | | | | | | | | | |
Series 2015-C04, Class XB, IO | | | 0.250 | (cc) | | | 11/15/48 | | | | 25,076 | | | | 336,066 | |
Series 2016-C06, Class A3 | | | 2.956 | | | | 01/15/49 | | | | 130 | | | | 133,607 | |
DBGS Mortgage Trust, | | | | | | | | | | | | | | | | |
Series 2018-BIOD, Class E, 144A, 1 Month LIBOR + 1.700%
(Cap N/A, Floor 1.700%) | | | 3.728 | (c) | | | 05/15/35 | | | | 93 | | | | 93,169 | |
Series 2018-BIOD, Class F, 144A, 1 Month LIBOR + 2.000%
(Cap N/A, Floor 2.000%) | | | 4.028 | (c) | | | 05/15/35 | | | | 162 | | | | 163,205 | |
DBWF Mortgage Trust, | | | | | | | | | | | | | | | | |
Series 2016-85T, Class D, 144A | | | 3.935 | (cc) | | | 12/10/36 | | | | 375 | | | | 393,167 | |
Series 2016-85T, Class E, 144A | | | 3.935 | (cc) | | | 12/10/36 | | | | 500 | | | | 500,389 | |
FHLMC Multifamily Structured Pass-Through Certificates, | | | | | | | | | | | | | | | | |
Series K006, Class AX1, IO | | | 1.060 | (cc) | | | 01/25/20 | | | | 1,905 | | | | 1,715 | |
Series K019, Class X1, IO | | | 1.743 | (cc) | | | 03/25/22 | | | | 971 | | | | 32,859 | |
Series K026, Class X1, IO | | | 1.107 | (cc) | | | 11/25/22 | | | | 1,499 | | | | 38,631 | |
Series K052, Class X1, IO | | | 0.797 | (cc) | | | 11/25/25 | | | | 2,306 | | | | 79,205 | |
Series K058, Class X1, IO | | | 1.056 | (cc) | | | 08/25/26 | | | | 3,703 | | | | 203,739 | |
Series K715, Class X1, IO | | | 1.233 | (cc) | | | 01/25/21 | | | | 1,499 | | | | 16,083 | |
FREMF Mortgage Trust,
Series 2012-K20, Class X2A, IO, 144A | | | 0.200 | | | | 05/25/45 | | | | 24,994 | | | | 109,817 | |
GS Mortgage Securities Trust,
Series 2018-GS10, Class A3 | | | 4.261 | (cc) | | | 07/10/51 | | | | 500 | | | | 546,892 | |
Independence Plaza Trust,
Series 2018-INDP, Class E, 144A | | | 4.996 | | | | 07/10/35 | | | | 100 | | | | 106,408 | |
JPMBB Commercial Mortgage Securities Trust,
Series 2015-C33, Class XB | | | 0.496 | (cc) | | | 12/15/48 | | | | 1,620 | | | | 34,079 | |
See Notes to Financial Statements.
| | | | |
| PGIM Securitized Credit Fund | | | 19 | |
Schedule of Investments(continued)
as of September 30, 2019
| | | | | | | | | | | | | | | | |
| | | | |
| Description | | Interest
Rate | | | Maturity
Date | | | Principal
Amount (000)# | | | Value | |
| | |
COMMERCIAL MORTGAGE-BACKED SECURITIES (Continued) | | | | | | | | | |
JPMorgan Chase Commercial Mortgage Securities Corp.,
Series 2018-AON, Class E, 144A | | | 4.767 | %(cc) | | | 07/05/31 | | | | 300 | | | $ | 314,976 | |
Morgan Stanley Bank of America Merrill Lynch Trust,
Series 2015-C21, Class XB, 144A | | | 0.437 | (cc) | | | 03/15/48 | | | | 10,000 | | | | 166,002 | |
Wells Fargo Commercial Mortgage Trust,
Series 2015-P02, Class XB | | | 0.642 | (cc) | | | 12/15/48 | | | | 6,400 | | | | 174,929 | |
| | | | | | | | | | | | | | | | |
TOTAL COMMERCIAL MORTGAGE-BACKED SECURITIES
(cost $7,538,581) | | | | | | | | | | | | | | | 7,625,719 | |
| | | | | | | | | | | | | | | | |
| | | | |
CORPORATE BONDS 4.9% | | | | | | | | | | | | | | | | |
| | | | |
Aerospace & Defense 0.2% | | | | | | | | | | | | | | | | |
Bombardier, Inc. (Canada),
Sr. Unsec’d. Notes, 144A | | | 7.875 | | | | 04/15/27 | | | | 50 | | | | 49,792 | |
| | | | |
Banks 3.9% | | | | | | | | | | | | | | | | |
Bank of America Corp.,
Jr. Sub. Notes, Series JJ | | | 5.125 | (ff) | | | — | (rr) | | | 500 | | | | 516,875 | |
BB&T Corp.,
Jr. Sub. Notes | | | 4.800 | (ff) | | | — | (rr) | | | 35 | | | | 35,000 | |
JPMorgan Chase & Co.,
Jr. Sub. Notes, Series FF | | | 5.000 | (ff) | | | — | (rr) | | | 500 | | | | 511,185 | |
| | | | | | | | | | | | | | | | |
| | | | | | | | | | | | | | | 1,063,060 | |
| | | | |
Electric 0.2% | | | | | | | | | | | | | | | | |
Calpine Corp.,
Sr. Unsec’d. Notes | | | 5.750 | | | | 01/15/25 | | | | 50 | | | | 50,875 | |
| | | | |
Healthcare-Services 0.2% | | | | | | | | | | | | | | | | |
MEDNAX, Inc.,
Gtd. Notes, 144A | | | 6.250 | | | | 01/15/27 | | | | 50 | | | | 49,622 | |
| | | | |
Home Builders 0.2% | | | | | | | | | | | | | | | | |
William Lyon Homes, Inc.,
Gtd. Notes, 144A | | | 6.625 | | | | 07/15/27 | | | | 50 | | | | 51,875 | |
See Notes to Financial Statements.
| | | | | | | | | | | | | | | | |
| | | | |
| Description | | Interest
Rate | | | Maturity
Date | | | Principal
Amount (000)# | | | Value | |
| | | | |
CORPORATE BONDS (Continued) | | | | | | | | | | | | | | | | |
| | | | |
Telecommunications 0.2% | | | | | | | | | | | | | | | | |
CenturyLink, Inc.,
Sr. Unsec’d. Notes, Series U | | | 7.650 | % | | | 03/15/42 | | | | 50 | | | $ | 48,625 | |
| | | | | | | | | | | | | | | | |
TOTAL CORPORATE BONDS
(cost $1,295,414) | | | | | | | | | | | | | | | 1,313,849 | |
| | | | | | | | | | | | | | | | |
| | | |
RESIDENTIAL MORTGAGE-BACKED SECURITIES 4.5% | | | | | | | | | | | | | |
Bellemeade Re Ltd. (Bermuda), | | | | | | | | | | | | | | | | |
Series 2018-01A, Class M1B, 144A, 1 Month LIBOR + 1.600%
(Cap N/A, Floor 0.000%) | | | 3.618 | (c) | | | 04/25/28 | | | | 157 | | | | 157,196 | |
Series 2018-02A, Class M1C, 144A, 1 Month LIBOR + 1.600%
(Cap N/A, Floor 0.000%) | | | 3.618 | (c) | | | 08/25/28 | | | | 150 | | | | 150,285 | |
Series 2018-03A, Class M1B, 144A, 1 Month LIBOR + 1.850%
(Cap N/A, Floor 1.850%) | | | 3.868 | (c) | | | 10/25/27 | | | | 220 | | | | 220,651 | |
Credit Suisse Mortgage Trust,
Series 2018-11R, Class 1A1, 144A, 1 Month LIBOR + 1.400%
(Cap N/A, Floor 1.400%) | | | 3.512 | (c) | | | 08/25/37 | | | | 84 | | | | 83,994 | |
Fannie Mae Connecticut Avenue Securities,
Series 2018-C06, Class 1M2, 1 Month LIBOR + 2.000%
(Cap N/A, Floor 2.000%) | | | 4.018 | (c) | | | 03/25/31 | | | | 250 | | | | 250,910 | |
Freddie Mac Structured Agency Credit Risk Debt Notes,
Series 2019-DNA01, Class M2, 144A, 1 Month LIBOR + 2.650%
(Cap N/A, Floor 0.000%) | | | 4.668 | (c) | | | 01/25/49 | | | | 60 | | | | 60,931 | |
IndyMac INDX Mortgage Loan Trust,
Series 2004-AR15, Class 3A1 | | | 4.297 | (cc) | | | 02/25/35 | | | | 134 | | | | 134,233 | |
LSTAR Securities Investment Trust,
Series 2018-02, Class A1, 144A, 1 Month LIBOR + 1.500%
(Cap N/A, Floor 0.000%) | | | 3.532 | (c) | | | 04/01/23 | | | | 67 | | | | 66,920 | |
Series 2019-02, Class A1, 144A, 1 Month LIBOR + 1.500%
(Cap N/A, Floor 0.000%) | | | 3.589 | (c) | | | 04/01/24 | | | | 100 | | | | 99,662 | |
| | | | | | | | | | | | | | | | |
TOTAL RESIDENTIAL MORTGAGE-BACKED SECURITIES
(cost $1,223,130) | | | | | | | | | | | | | | | 1,224,782 | |
| | | | | | | | | | | | | | | | |
TOTAL LONG-TERM INVESTMENTS
(cost $25,764,397) | | | | | | | | | | | | | | | 25,679,820 | |
| | | | | | | | | | | | | | | | |
See Notes to Financial Statements.
| | | | |
| PGIM Securitized Credit Fund | | | 21 | |
Schedule of Investments(continued)
as of September 30, 2019
| | | | | | | | |
| | |
| Description | | Shares | | | Value | |
| | |
SHORT-TERM INVESTMENT 2.2% | | | | | | | | |
| | |
AFFILIATED MUTUAL FUND | | | | | | | | |
PGIM Core Ultra Short Bond Fund
(cost $593,357)(w) | | | 593,357 | | | $ | 593,357 | |
| | | | | | | | |
| | |
TOTAL INVESTMENTS 97.3%
(cost $26,357,754) | | | | | | | 26,273,177 | |
Other assets in excess of liabilities(z) 2.7% | | | | | | | 718,045 | |
| | | | | | | | |
| | |
NET ASSETS 100.0% | | | | | | $ | 26,991,222 | |
| | | | | | | | |
Below is a list of the abbreviation(s) used in the annual report:
144A—Security was purchased pursuant to Rule 144A under the Securities Act of 1933 and, pursuant to the requirements of Rule 144A, may not be resold except to qualified institutional buyers.
A—Annual payment frequency for swaps
CLO—Collateralized Loan Obligation
EURIBOR—Euro Interbank Offered Rate
IO—Interest Only (Principal amount represents notional)
LIBOR—London Interbank Offered Rate
M—Monthly payment frequency for swaps
OTC—Over-the-counter
Q—Quarterly payment frequency for swaps
REITs—Real Estate Investment Trust
S—Semiannual payment frequency for swaps
T—Swap payment upon termination
USOIS—United States Overnight Index Swap
EUR—Euro
| # | Principal or notional amount is shown in U.S. dollars unless otherwise stated. |
| ^ | Indicates a Level 3 security. The aggregate value of Level 3 securities is $232,587 and 0.9% of net assets. |
| (c) | Variable rate instrument. The interest rate shown reflects the rate in effect at September 30, 2019. |
| (cc) | Variable rate instrument. The rate shown is based on the latest available information as of September 30, 2019. Certain variable rate securities are not based on a published reference rate and spread but are determined by the issuer or agent and are based on current market conditions. These securities do not indicate a reference rate and spread in their description. |
| (ff) | Variable rate security. Security may be issued at a fixed coupon rate, which converts to a variable rate at a specified date. Rate shown is the rate in effect as of period end. |
| (p) | Interest rate not available as of September 30, 2019. |
| (rr) | Perpetual security with no stated maturity date. |
| (w) | PGIM Investments LLC, the manager of the Fund, also serves as manager of the PGIM Core Ultra Short Bond Fund. |
| (z) | Includes net unrealized appreciation/(depreciation) and/or market value of the below holdings which are excluded from the Schedule of Investments: |
See Notes to Financial Statements.
Forward foreign currency exchange contracts outstanding at September 30, 2019:
| | | | | | | | | | | | | | | | | | | | | | | | |
Purchase Contracts | | Counterparty | | | Notional
Amount
(000) | | | Value at
Settlement
Date | | | Current
Value | | | Unrealized
Appreciation | | | Unrealized
Depreciation | |
OTC Forward Foreign Currency Exchange Contracts: | | | | | | | | | | | | | | | | | |
Euro, | | | | | | | | | | | | | | | | | | | | | | | | |
Expiring 10/02/19 | | | JPMorgan Chase Bank, N.A. | | | EUR | 2,243 | | | $ | 2,466,230 | | | $ | 2,444,936 | | | $ | — | | | $ | (21,294 | ) |
| | | | | | | | | | | | | | | | | | | | | | | | |
| | | | | | | | | | | | | | | | | | | | | | | | |
Sale Contracts | | Counterparty | | | Notional
Amount
(000) | | | Value at
Settlement
Date | | | Current
Value | | | Unrealized
Appreciation | | | Unrealized
Depreciation | |
OTC Forward Foreign Currency Exchange Contracts: | | | | | | | | | | | | | | | | | |
Euro, | | | | | | | | | | | | | | | | | | | | | | | | |
Expiring 10/02/19 | | | Citibank, N.A. | | | EUR | 2,243 | | | $ | 2,500,682 | | | $ | 2,444,936 | | | $ | 55,746 | | | $ | — | |
Expiring 11/04/19 | | | JPMorgan Chase Bank, N.A. | | | EUR | 2,243 | | | | 2,472,164 | | | | 2,451,284 | | | | 20,880 | | | | — | |
| | | | | | | | | | | | | | | | | | | | | | | | |
| | | | | | | | | | $ | 4,972,846 | | | $ | 4,896,220 | | | | 76,626 | | | | — | |
| | | | | | | | | | | | | | | | | | | | | | | | |
| | | | | | | | | | | | | | | | | | $ | 76,626 | | | $ | (21,294 | ) |
| | | | | | | | | | | | | | | | | | | | | | | | |
Credit default swap agreements outstanding at September 30, 2019:
| | | | | | | | | | | | | | | | | | | | | | | | | | | | | | |
Reference
Entity/
Obligation | | Termination
Date | | | Fixed
Rate | | | Notional
Amount
(000)#(3) | | | Implied
Credit
Spread at
September 30,
2019(4) | | | Fair
Value | | | Upfront
Premiums
Paid
(Received) | | | Unrealized
Appreciation
(Depreciation) | | | Counterparty |
OTC Credit Default Swap Agreements on asset-backed securities—Sell Protection(2)^: | | | |
Acas CLO Ltd. | | | 10/29/19 | | | | 0.500%(M) | | | | 12 | | | | * | | | $ | 1 | | | $ | — | | | $ | 1 | | | Goldman Sachs International |
Anchorage CLO | | | 10/29/19 | | | | 0.500%(M) | | | EUR | 29 | | | | * | | | | 2 | | | | — | | | | 2 | | | Goldman Sachs International |
AXA CLO | | | 10/29/19 | | | | 0.500%(M) | | | EUR | 14 | | | | 0.500 | % | | | 1 | | | | — | | | | 1 | | | Goldman Sachs International |
Barings CLO | | | 10/29/19 | | | | 1.000%(M) | | | | 2 | | | | * | | | | — | | | | — | | | | — | | | Goldman Sachs International |
Bear Stearns Asset Backed Securities Trust | | | 10/31/19 | | | | 1.250%(M) | | | | 54 | | | | * | | | | 71 | | | | — | | | | 71 | | | Goldman Sachs International |
Bear Stearns Asset Backed Securities Trust | | | 10/31/19 | | | | 1.250%(M) | | | | 31 | | | | * | | | | 41 | | | | — | | | | 41 | | | Goldman Sachs International |
See Notes to Financial Statements.
| | | | |
| PGIM Securitized Credit Fund | | | 23 | |
Schedule of Investments(continued)
as of September 30, 2019
Credit default swap agreements outstanding at September 30, 2019 (continued):
| | | | | | | | | | | | | | | | | | | | | | | | | | | | | | |
Reference
Entity/
Obligation | | Termination
Date | | | Fixed
Rate | | | Notional
Amount
(000)#(3) | | | Implied
Credit
Spread at
September 30,
2019(4) | | | Fair
Value | | | Upfront
Premiums
Paid
(Received) | | | Unrealized
Appreciation
(Depreciation) | | | Counterparty |
OTC Credit Default Swap Agreements on asset-backed securities—Sell Protection(2)^ (cont’d.): | | | |
Blue Mountain CLO | | | 10/29/19 | | | | 1.000%(M) | | | | 7 | | | | * | | | $ | 1 | | | $ | — | | | $ | 1 | | | Goldman Sachs International |
Blue Mountain CLO | | | 10/29/19 | | | | 1.000%(M) | | | | 6 | | | | * | | | | 1 | | | | — | | | | 1 | | | Goldman Sachs International |
Canyon CLO | | | 10/29/19 | | | | 0.500%(M) | | | | 4 | | | | 0.500 | % | | | — | | | | — | | | | — | | | Goldman Sachs International |
CIFC CLO | | | 10/29/19 | | | | 1.000%(M) | | | | 4 | | | | * | | | | — | | | | — | | | | — | | | Goldman Sachs International |
Citigroup Commercial Mortgage Trust | | | 10/30/19 | | | | 1.250%(M) | | | | 8 | | | | 4.670 | % | | | 11 | | | | — | | | | 11 | | | Goldman Sachs International |
COMM Mortgage Trust | | | 10/30/19 | | | | 1.250%(M) | | | | 27 | | | | 4.550 | % | | | 36 | | | | — | | | | 36 | | | Goldman Sachs International |
COMM Mortgage Trust | | | 10/30/19 | | | | 1.250%(M) | | | | 22 | | | | 19.740 | % | | | 29 | | | | — | | | | 29 | | | Goldman Sachs International |
COMM Mortgage Trust | | | 10/30/19 | | | | 1.250%(M) | | | | 20 | | | | 4.550 | % | | | 27 | | | | — | | | | 27 | | | Goldman Sachs International |
COMM Mortgage Trust | | | 10/30/19 | | | | 1.250%(M) | | | | 16 | | | | 6.940 | % | | | 21 | | | | — | | | | 21 | | | Goldman Sachs International |
COMM Mortgage Trust | | | 10/30/19 | | | | 1.250%(M) | | | | 14 | | | | 6.940 | % | | | 19 | | | | — | | | | 19 | | | Goldman Sachs International |
COMM Mortgage Trust | | | 10/30/19 | | | | 1.250%(M) | | | | 10 | | | | 7.460 | % | | | 13 | | | | — | | | | 13 | | | Goldman Sachs International |
Connecticut Avenue Securities | | | 10/31/19 | | | | 1.250%(M) | | | | 119 | | | | * | | | | 156 | | | | — | | | | 156 | | | Goldman Sachs International |
Connecticut Avenue Securities | | | 10/31/19 | | | | 1.250%(M) | | | | 79 | | | | * | | | | 103 | | | | — | | | | 103 | | | Goldman Sachs International |
See Notes to Financial Statements.
Credit default swap agreements outstanding at September 30, 2019 (continued):
| | | | | | | | | | | | | | | | | | | | | | | | | | | | | | |
Reference
Entity/
Obligation | | Termination
Date | | | Fixed
Rate | | | Notional
Amount
(000)#(3) | | | Implied
Credit
Spread at
September 30,
2019(4) | | | Fair
Value | | | Upfront
Premiums
Paid
(Received) | | | Unrealized
Appreciation
(Depreciation) | | | Counterparty |
OTC Credit Default Swap Agreements on asset-backed securities—Sell Protection(2)^ (cont’d.): | | | |
Crescent CLO | | | 10/29/19 | | | | 1.000%(M) | | | | 11 | | | | * | | | $ | 1 | | | $ | — | | | $ | 1 | | | Goldman Sachs International |
CSAM CLO | | | 10/29/19 | | | | 0.500%(M) | | | EUR | 30 | | | | * | | | | 2 | | | | — | | | | 2 | | | Goldman Sachs International |
CVC CLO | | | 10/29/19 | | | | 0.500%(M) | | | | 9 | | | | 0.500 | % | | | — | | | | — | | | | — | | | Goldman Sachs International |
Equity One Home Equity | | | 10/31/19 | | | | 1.250%(M) | | | | 19 | | | | * | | | | 25 | | | | — | | | | 25 | | | Goldman Sachs International |
Freddie Mac—Structured Agency Credit Risk | | | 10/31/19 | | | | 1.250%(M) | | | | 30 | | | | * | | | | 39 | | | | — | | | | 39 | | | Goldman Sachs International |
GMAC Home Equity | | | 10/31/19 | | | | 1.250%(M) | | | | 13 | | | | * | | | | 17 | | | | — | | | | 17 | | | Goldman Sachs International |
GMAC Home Equity | | | 10/31/19 | | | | 1.250%(M) | | | | 13 | | | | * | | | | 17 | | | | — | | | | 17 | | | Goldman Sachs International |
GS Mortgage Securities Trust | | | 10/30/19 | | | | 1.250%(M) | | | | 13 | | | | 6.978 | % | | | 17 | | | | — | | | | 17 | | | Goldman Sachs International |
GS Mortgage Securities Trust | | | 10/30/19 | | | | 1.250%(M) | | | | 13 | | | | 7.460 | % | | | 17 | | | | — | | | | 17 | | | Goldman Sachs International |
GSR Mortgage Loan Trust | | | 10/31/19 | | | | 1.250%(M) | | | | 22 | | | | * | | | | 29 | | | | — | | | | 29 | | | Goldman Sachs International |
ICG CLO | | | 10/29/19 | | | | 0.500%(M) | | | | 10 | | | | * | | | | 1 | | | | — | | | | 1 | | | Goldman Sachs International |
Investcorp CLO | | | 10/29/19 | | | | 1.000%(M) | | | | 22 | | | | 1.000 | % | | | 2 | | | | — | | | | 2 | | | Goldman Sachs International |
JPMBB Commercial Mortgage Securities Trust | | | 10/30/19 | | | | 1.250%(M) | | | | 35 | | | | 8.761 | % | | | 46 | | | | — | | | | 46 | | | Goldman Sachs International |
See Notes to Financial Statements.
| | | | |
| PGIM Securitized Credit Fund | | | 25 | |
Schedule of Investments(continued)
as of September 30, 2019
Credit default swap agreements outstanding at September 30, 2019 (continued):
| | | | | | | | | | | | | | | | | | | | | | | | | | | | | | |
Reference
Entity/
Obligation | | Termination
Date | | | Fixed
Rate | | | Notional
Amount
(000)#(3) | | | Implied
Credit
Spread at
September 30,
2019(4) | | | Fair
Value | | | Upfront
Premiums
Paid
(Received) | | | Unrealized
Appreciation
(Depreciation) | | | Counterparty |
OTC Credit Default Swap Agreements on asset-backed securities—Sell Protection(2)^ (cont’d.): | | | |
JPMBB Commercial Mortgage Securities Trust | | | 10/30/19 | | | | 1.250%(M) | | | | 22 | | | | * | | | $ | 29 | | | $ | — | | | $ | 29 | | | Goldman Sachs International |
JPMorgan Chase Commercial Mortgage Securities Trust | | | 10/30/19 | | | | 1.250%(M) | | | | 13 | | | | * | | | | 17 | | | | — | | | | 17 | | | Goldman Sachs International |
JPMorgan Chase Commercial Mortgage Securities Trust | | | 10/30/19 | | | | 1.250%(M) | | | | 5 | | | | * | | | | 7 | | | | — | | | | 7 | | | Goldman Sachs International |
Lehman Home Equity | | | 10/31/19 | | | | 1.250%(M) | | | | 11 | | | | * | | | | 14 | | | | — | | | | 14 | | | Goldman Sachs International |
Madison Park Funding Ltd. | | | 10/29/19 | | | | 1.000%(M) | | | | 4 | | | | * | | | | — | | | | — | | | | — | | | Goldman Sachs International |
MidOcean CLO | | | 10/29/19 | | | | 0.500%(M) | | | | 27 | | | | * | | | | 2 | | | | — | | | | 2 | | | Goldman Sachs International |
MJX CLO | | | 10/29/19 | | | | 1.000%(M) | | | | 11 | | | | * | | | | 1 | | | | — | | | | 1 | | | Goldman Sachs International |
MJX CLO | | | 10/29/19 | | | | 0.500%(M) | | | | 5 | | | | * | | | | — | | | | — | | | | — | | | Goldman Sachs International |
Morgan Stanley BAML Trust | | | 10/30/19 | | | | 1.250%(M) | | | | 15 | | | | 6.940 | % | | | 20 | | | | — | | | | 20 | | | Goldman Sachs International |
Morgan Stanley BAML Trust | | | 10/30/19 | | | | 1.250%(M) | | | | 14 | | | | * | | | | 18 | | | | — | | | | 18 | | | Goldman Sachs International |
Morgan Stanley Capital I Trust | | | 10/30/19 | | | | 1.250%(M) | | | | 24 | | | | * | | | | 31 | | | | — | | | | 31 | | | Goldman Sachs International |
Morgan Stanley Home Equity | | | 10/31/19 | | | | 1.250%(M) | | | | 12 | | | | * | | | | 2 | | | | — | | | | 2 | | | Goldman Sachs International |
Octagon CLO | | | 10/29/19 | | | | 1.000%(M) | | | | 1 | | | | * | | | | — | | | | — | | | | — | | | Goldman Sachs International |
See Notes to Financial Statements.
Credit default swap agreements outstanding at September 30, 2019 (continued):
| | | | | | | | | | | | | | | | | | | | | | | | | | | | | | |
Reference
Entity/
Obligation | | Termination
Date | | | Fixed
Rate | | | Notional
Amount
(000)#(3) | | | Implied
Credit
Spread at
September 30,
2019(4) | | | Fair
Value | | | Upfront
Premiums
Paid
(Received) | | | Unrealized
Appreciation
(Depreciation) | | | Counterparty |
OTC Credit Default Swap Agreements on asset-backed securities—Sell Protection(2)^ (cont’d.): | | | |
Palmer Square CLO | | | 10/29/19 | | | | 0.500%(M) | | | | 6 | | | | * | | | $ | — | | | $ | — | | | $ | — | | | Goldman Sachs International |
Sound Point CLO | | | 10/29/19 | | | | 0.500%(M) | | | | 14 | | | | * | | | | 1 | | | | — | | | | 1 | | | Goldman Sachs International |
Steele Creek | | | 10/29/19 | | | | 0.500%(M) | | | | 13 | | | | 0.500 | % | | | 1 | | | | — | | | | 1 | | | Goldman Sachs International |
Structured Agency Credit Risk | | | 10/31/19 | | | | 1.250%(M) | | | | 17 | | | | * | | | | 22 | | | | — | | | | 22 | | | Goldman Sachs International |
Vibrant CLO Ltd. | | | 10/29/19 | | | | 0.500%(M) | | | | 11 | | | | * | | | | 1 | | | | — | | | | 1 | | | Goldman Sachs International |
Wells Fargo Commercial Mortgage Trust | | | 10/30/19 | | | | 1.250%(M) | | | | 42 | | | | * | | | | 56 | | | | — | | | | 56 | | | Goldman Sachs International |
Wells Fargo Commercial Mortgage Trust | | | 10/30/19 | | | | 1.250%(M) | | | | 8 | | | | * | | | | 10 | | | | — | | | | 10 | | | Goldman Sachs International |
Wells Fargo Commercial Mortgage Trust | | | 10/30/19 | | | | 1.250%(M) | | | | 7 | | | | 4.670 | % | | | 9 | | | | — | | | | 9 | | | Goldman Sachs International |
| | | | | | | | | | | | | | | | | | | | | | | | | | | | | | |
| | | | | | | | | | | | | | | | | | $ | 987 | | | $ | — | | | $ | 987 | | | |
| | | | | | | | | | | | | | | | | | | | | | | | | | | | | | |
The Fund entered into credit default swaps (“CDS”) to provide a measure of protection against defaults or to take an active long or short position with respect to the likelihood of a particular issuer’s default or the reference entity’s credit soundness. CDS contracts generally trade based on a spread which represents the cost a protection buyer has to pay the protection seller. The protection buyer is said to be short the credit as the value of the contract rises the more the credit deteriorates. The value of the CDS contract increases for the protection buyer if the spread increases.
| (1) | If the Fund is a buyer of protection, it pays the fixed rate. When a credit event occurs, as defined under the terms of that particular swap agreement, the Fund will either (i) receive from the seller of protection an amount equal to the notional amount of the swap and make delivery of the referenced obligation or underlying securities comprising the referenced index or (ii) receive a net settlement amount in the form of cash or securities equal to the notional amount of the swap less the recovery value of the referenced obligation or underlying securities comprising the referenced index. |
| (2) | If the Fund is a seller of protection, it receives the fixed rate. When a credit event occurs, as defined under the terms of |
See Notes to Financial Statements.
| | | | |
| PGIM Securitized Credit Fund | | | 27 | |
Schedule of Investments(continued)
as of September 30, 2019
| | that particular swap agreement, the Fund will either (i) pay to the buyer of protection an amount equal to the notional amount of the swap and take delivery of the referenced obligation or underlying securities comprising the referenced index or (ii) pay a net settlement amount in the form of cash or securities equal to the notional amount of the swap less the recovery value of the referenced obligation or underlying securities comprising the referenced index. |
| (3) | Notional amount represents the maximum potential amount the Fund could be required to pay as a seller of credit protection or receive as a buyer of credit protection if a credit event occurs as defined under the terms of that particular swap agreement. |
| (4) | Implied credit spreads, represented in absolute terms, utilized in determining the fair value of credit default swap agreements where the Fund is the seller of protection as of the reporting date serve as an indicator of the current status of the payment/ performance risk and represent the likelihood of risk of default for the credit derivative. The implied credit spread of a particular referenced entity reflects the cost of buying/selling protection and may include up-front payments required to be made to enter into the agreement. Wider credit spreads represent a deterioration of the referenced entity’s credit soundness and a greater likelihood of risk of default or other credit event occurring as defined under the terms of the agreement. |
| * | When an implied credit spread is not available, reference the fair value of credit default swap agreements on credit indices and asset-backed securities. Where the Fund is the seller of protection, it serves as an indicator of the current status of the payment/performance risk and represents the likelihood of an expected liability (or profit) for the credit derivative should the notional amount of the swap agreement be closed/sold as of the reporting date. Increasing fair value in absolute terms, when compared to the notional amount of the swap, represents a deterioration of the referenced entity’s credit soundness and a greater likelihood of risk of default or other credit event occurring as defined under the terms of the agreement. |
Interest rate swap agreements outstanding at September 30, 2019:
| | | | | | | | | | | | | | | | | | | | | | | | |
Notional
Amount
(000)# | | | Termination
Date | | | Fixed
Rate | | | Floating Rate | | Value at
Trade
Date | | | Value at
September 30,
2019 | | | Unrealized
Appreciaton
(Depreciation) | |
| | Centrally Cleared Interest Rate Swap Agreements: | | | | | | | | | |
| EUR | 280 | | | | 11/10/21 | | | | 0.048%(A) | | | 6 Month EURIBOR(1)(S) | | $ | (3,140 | ) | | $ | (3,711 | ) | | $ | (571 | ) |
| EUR | 400 | | | | 12/06/21 | | | | 0.095%(A) | | | 6 Month EURIBOR(1)(S) | | | (5,160 | ) | | | (5,968 | ) | | | (808 | ) |
| EUR | 855 | | | | 05/11/24 | | | | 0.396%(A) | | | 6 Month EURIBOR(1)(S) | | | (30,433 | ) | | | (37,767 | ) | | | (7,334 | ) |
| EUR | 90 | | | | 05/11/28 | | | | 0.750%(A) | | | 6 Month EURIBOR(1)(S) | | | (6,108 | ) | | | (8,838 | ) | | | (2,730 | ) |
| EUR | 305 | | | | 05/11/29 | | | | 0.750%(A) | | | 6 Month EURIBOR(1)(S) | | | (20,233 | ) | | | (31,483 | ) | | | (11,250 | ) |
| | 18,000 | | | | 10/22/19 | | | | 2.000%(T) | | | 1 Day USOIS(2)(T) | | | 659 | | | | (4,528 | ) | | | (5,187 | ) |
| | 3,810 | | | | 05/11/20 | | | | 1.763%(S) | | | 3 Month LIBOR(1)(Q) | | | 10,401 | | | | (8,866 | ) | | | (19,267 | ) |
| | 1,565 | | | | 06/14/21 | | | | 1.142%(S) | | | 3 Month LIBOR(1)(Q) | | | 19,820 | | | | 10,313 | | | | (9,507 | ) |
See Notes to Financial Statements.
Interest rate swap agreements outstanding at September 30, 2019 (continued):
| | | | | | | | | | | | | | | | | | | | | | | | |
Notional
Amount
(000)# | | | Termination
Date | | | Fixed
Rate | | | Floating Rate | | Value at
Trade
Date | | | Value at
September 30,
2019 | | | Unrealized
Appreciation
(Depreciation) | |
| | Centrally Cleared Interest Rate Swap Agreements (cont’d.): | | | | | | | | | |
| | 150 | | | | 05/11/22 | | | | 1.982%(S) | | | 3 Month LIBOR(1)(Q) | | $ | (566 | ) | | $ | (2,244 | ) | | $ | (1,678 | ) |
| | 1,165 | | | | 05/11/23 | | | | 2.000%(S) | | | 3 Month LIBOR(2)(Q) | | | 11,537 | | | | 24,580 | | | | 13,043 | |
| | 220 | | | | 11/07/23 | | | | 1.479%(S) | | | 3 Month LIBOR(1)(Q) | | | 2,441 | | | | (191 | ) | | | (2,632 | ) |
| | 3,785 | | | | 05/11/24 | | | | 2.139%(S) | | | 3 Month LIBOR(1)(Q) | | | (74,109 | ) | | | (125,471 | ) | | | (51,362 | ) |
| | 760 | | | | 05/11/26 | | | | 1.900%(S) | | | 3 Month LIBOR(1)(Q) | | | (3,528 | ) | | | (21,922 | ) | | | (18,394 | ) |
| | 495 | | | | 06/14/26 | | | | 1.959%(S) | | | 3 Month LIBOR(1)(Q) | | | (4,124 | ) | | | (16,651 | ) | | | (12,527 | ) |
| | 560 | | | | 05/11/28 | | | | 2.000%(S) | | | 3 Month LIBOR(1)(Q) | | | (4,106 | ) | | | (23,335 | ) | | | (19,229 | ) |
| | 1,665 | | | | 05/11/29 | | | | 2.000%(S) | | | 3 Month LIBOR(1)(Q) | | | (47,247 | ) | | | (72,995 | ) | | | (25,748 | ) |
| | | | | | | | | | | | | | | | | | | | | | | | |
| | | | | | | | | | | | | | $ | (153,896 | ) | | $ | (329,077 | ) | | $ | (175,181 | ) |
| | | | | | | | | | | | | | | | | | | | | | | | |
| (1) | The Fund pays the fixed rate and receives the floating rate. |
| (2) | The Fund pays the floating rate and receives the fixed rate. |
Balances Reported in the Statement of Assets and Liabilities for OTC Swap Agreements:
| | | | | | | | | | | | | | | | |
| | | Premiums Paid | | | Premiums Received | | | Unrealized
Appreciation | | | Unrealized
Depreciation | |
OTC Swap Agreements | | $ | — | | | $ | — | | | $ | 987 | | | $ | — | |
| | | �� | | | | | | | | | | | | | |
Summary of Collateral for Centrally Cleared/Exchange-traded Derivatives:
Cash and securities segregated as collateral, including pending settlement for closed positions, to cover requirements for centrally cleared/exchange-traded derivatives are listed by broker as follows:
| | | | | | | | |
Broker | | Cash and/or Foreign Currency | | | Securities Market Value | |
J.P. Morgan Securities LLC | | $ | 407,000 | | | $ | — | |
| | | | | | | | |
Fair Value Measurements:
Various inputs are used in determining the value of the Fund’s investments. These inputs are summarized in the three broad levels listed below.
Level 1—unadjusted quoted prices generally in active markets for identical securities.
See Notes to Financial Statements.
| | | | |
| PGIM Securitized Credit Fund | | | 29 | |
Schedule of Investments(continued)
as of September 30, 2019
Level 2—quoted prices for similar securities, interest rates and yield curves, prepayment speeds, foreign currency exchange rates and other observable inputs.
Level 3—unobservable inputs for securities valued in accordance with Board approved fair valuation procedures.
The following is a summary of the inputs used as of September 30, 2019 in valuing such portfolio securities:
| | | | | | | | | | | | |
| | | Level 1 | | | Level 2 | | | Level 3 | |
Investments in Securities | | | | | | | | | | | | |
Asset-Backed Securities | | | | | | | | | | | | |
Automobiles | | $ | — | | | $ | 918,183 | | | $ | 231,600 | |
Collateralized Loan Obligations | | | — | | | | 9,832,121 | | | | — | |
Consumer Loans | | | — | | | | 1,168,745 | | | | — | |
Home Equity Loans | | | — | | | | 182,237 | | | | — | |
Other | | | — | | | | 358,044 | | | | — | |
Residential Mortgage-Backed Securities | | | — | | | | 1,139,327 | | | | — | |
Student Loans | | | — | | | | 577,753 | | | | — | |
Bank Loans | | | — | | | | 1,107,460 | | | | — | |
Commercial Mortgage-Backed Securities | | | — | | | | 7,625,719 | | | | — | |
Corporate Bonds | | | — | | | | 1,313,849 | | | | — | |
Residential Mortgage-Backed Securities | | | — | | | | 1,224,782 | | | | — | |
Affiliated Mutual Fund | | | 593,357 | | | | — | | | | — | |
Other Financial Instruments* | | | | | | | | | | | | |
OTC Forward Foreign Currency Exchange Contracts | | | — | | | | 55,332 | | | | — | |
OTC Credit Default Swap Agreements | | | — | | | | — | | | | 987 | |
Centrally Cleared Interest Rate Swap Agreements | | | — | | | | (175,181 | ) | | | — | |
| | | | | | | | | | | | |
Total | | $ | 593,357 | | | $ | 25,328,371 | | | $ | 232,587 | |
| | | | | | | | | | | | |
| * | Other financial instruments are derivative instruments not reflected in the Schedule of Investments, such as futures, forwards and centrally cleared swap contracts, which are recorded at the unrealized appreciation (depreciation) on the instrument, and OTC swap contracts which are recorded at fair value. |
Industry Classification:
The industry classification of investments and other assets in excess of liabilities shown as a percentage of net assets as of September 30, 2019 were as follows (unaudited):
| | | | |
Collateralized Loan Obligations | | | 36.4 | % |
Commercial Mortgage-Backed Securities | | | 28.2 | |
Residential Mortgage-Backed Securities | | | 8.7 | |
Consumer Loans | | | 4.3 | |
Automobiles | | | 4.3 | |
Banks | | | 3.9 | |
Affiliated Mutual Fund | | | 2.2 | |
Student Loans | | | 2.2 | |
Other | | | 1.3 | |
Software | | | 1.2 | |
Telecommunications | | | 1.0 | |
Pharmaceuticals | | | 0.9 | |
Home Equity Loans | | | 0.7 | |
Real Estate | | | 0.4 | % |
Chemicals | | | 0.4 | |
Environmental Control | | | 0.4 | |
Home Builders | | | 0.2 | |
Electric | | | 0.2 | |
Aerospace & Defense | | | 0.2 | |
Healthcare-Services | | | 0.2 | |
| | | | |
| | | 97.3 | |
Other assets in excess of liabilities | | | 2.7 | |
| | | | |
| | | 100.0 | % |
| | | | |
See Notes to Financial Statements.
Effects of Derivative Instruments on the Financial Statements and Primary Underlying Risk Exposure:
The Fund invested in derivative instruments during the reporting period. The primary types of risk associated with these derivative instruments are credit contracts risk, foreign exchange contracts risk and interest rate contracts risk. See the Notes to Financial Statements for additional detail regarding these derivative instruments and their risks. The effect of such derivative instruments on the Fund’s financial position and financial performance as reflected in the Statement of Assets and Liabilities and Statement of Operations is presented in the summary below.
Fair values of derivative instruments as of September 30, 2019 as presented in the Statement of Assets and Liabilities:
| | | | | | | | | | | | |
| | | Asset Derivatives | | | Liability Derivatives | |
Derivatives not accounted for as hedging instruments, carried at fair value | | Statement of
Assets and
Liabilities Location | | Fair
Value | | | Statement of
Assets and
Liabilities Location | | Fair
Value | |
| Credit contracts | | Unrealized appreciation on OTC swap agreements | | $ | 987 | | | — | | $ | — | |
| Foreign exchange contracts | | Unrealized appreciation on OTC forward foreign currency exchange contracts | | | 76,626 | | | Unrealized depreciation on OTC forward foreign currency exchange contracts | | | 21,294 | |
| Interest rate contracts | | Due from/to broker-variation margin swaps | | | 13,043 | * | | Due from/to broker-variation margin swaps | | | 188,224 | * |
| | | | | | | | | | | | |
| | | | $ | 90,656 | | | | | $ | 209,518 | |
| | | | | | | | | | | | |
| * | Includes cumulative appreciation (depreciation) as reported in the schedule of open futures and centrally cleared swap contracts. Only unsettled variation margin receivable (payable) is reported within the Statement of Assets and Liabilities. |
The effects of derivative instruments on the Statement of Operations for the period ended September 30, 2019 are as follows:
| | | | | | | | |
Amount of Realized Gain (Loss) on Derivatives Recognized in Income | |
Derivatives not accounted for as hedging instruments, carried at fair value | | Forward
Currency
Exchange
Contracts | | | Swaps | |
Credit contracts | | $ | — | | | $ | 13,125 | |
Foreign exchange contracts | | | 70,221 | | | | — | |
Interest rate contracts | | | — | | | | 58,550 | |
| | | | | | | | |
Total | | $ | 70,221 | | | $ | 71,675 | |
| | | | | | | | |
See Notes to Financial Statements.
| | | | |
| PGIM Securitized Credit Fund | | | 31 | |
Schedule of Investments(continued)
as of September 30, 2019
| | | | | | | | |
Change in Unrealized Appreciation (Depreciation) on Derivatives Recognized in Income | |
Derivatives not accounted for as hedging instruments, carried at fair value | | Forward
Currency
Exchange
Contracts | | | Swaps | |
Credit contracts | | $ | — | | | $ | 987 | |
Foreign exchange contracts | | | 55,332 | | | | — | |
Interest rate contracts | | | — | | | | (175,181 | ) |
| | | | | | | | |
Total | | $ | 55,332 | | | $ | (174,194 | ) |
| | | | | | | | |
The derivative instruments outstanding as of period-end serve as indicators of the volume of derivative activities for the Fund.
Financial Instruments/Transactions—Summary of Offsetting and Netting Arrangements:
The Fund invested in OTC derivatives during the reporting period that are either offset in accordance with current requirements or are subject to enforceable master netting arrangements or similar agreements that permit offsetting. The information about offsetting and related netting arrangements for OTC derivatives where the legal right to set-off exists, is presented in the summary below.
Offsetting of OTC derivative assets and liabilities:
| | | | | | | | | | | | | | | | | | | | |
Counterparty | | Gross
Amounts of
Recognized
Assets(1) | | | Gross
Amounts of
Recognized
Liabilities(1) | | | Net Amounts of
Recognized
Assets/(Liabilities) | | | Collateral
Pledged/(Received)(2) | | | Net
Amount | |
Citibank, N.A. | | $ | 55,746 | | | $ | — | | | $ | 55,746 | | | $ | — | | | $ | 55,746 | |
Goldman Sachs International | | | 987 | | | | — | | | | 987 | | | | — | | | | 987 | |
JPMorgan Chase Bank, N.A. | | | 20,880 | | | | (21,294 | ) | | | (414 | ) | | | — | | | | (414 | ) |
| | | | | | | | | | | | | | | | | | | | |
| | $ | 77,613 | | | $ | (21,294 | ) | | $ | 56,319 | | | $ | — | | | $ | 56,319 | |
| | | | | | | | | | | | | | | | | | | | |
| (1) | Includes unrealized appreciation/(depreciation) on swaps and forwards, premiums paid/(received) on swap agreements and market value of purchased and written options, as represented on the Statement of Assets and Liabilities. |
| (2) | Collateral amount disclosed by the Fund is limited to the market value of financial instruments/transactions and the Fund’s OTC derivative exposure by counterparty. |
See Notes to Financial Statements.
Statement of Assets and Liabilities
as of September 30, 2019
| | | | |
Assets | | | | |
Investments at value: | | | | |
Unaffiliated investments (cost $25,764,397) | | $ | 25,679,820 | |
Affiliated investments (cost $593,357) | | | 593,357 | |
Cash | | | 2,625 | |
Foreign currency, at value (cost $27,266) | | | 27,105 | |
Deposit with broker for centrally cleared/exchange-traded derivatives | | | 407,000 | |
Interest receivable | | | 153,260 | |
Receivable for investments sold | | | 118,760 | |
Unrealized appreciation on OTC forward foreign currency exchange contracts | | | 76,626 | |
Due from Manager | | | 61,552 | |
Due from broker—variation margin swaps | | | 1,732 | |
Unrealized appreciation on OTC swap agreements | | | 987 | |
Prepaid expenses | | | 60,735 | |
| | | | |
Total Assets | | | 27,183,559 | |
| | | | |
| |
Liabilities | | | | |
Payable for investments purchased | | | 114,961 | |
Accrued expenses and other liabilities | | | 21,367 | |
Unrealized depreciation on OTC forward foreign currency exchange contracts | | | 21,294 | |
Custodian and accounting fees payable | | | 18,616 | |
Shareholders’ reports payable | | | 12,466 | |
Offering and organization fees payable | | | 3,530 | |
Affiliated transfer agent fee payable | | | 93 | |
Distribution fee payable | | | 10 | |
| | | | |
Total Liabilities | | | 192,337 | |
| | | | |
| |
Net Assets | | $ | 26,991,222 | |
| | | | |
| | | | | |
Net assets were comprised of: | | | | |
Shares of beneficial interest, at par | | $ | 2,706 | |
Paid-in capital in excess of par | | | 27,036,714 | |
Total distributable earnings (loss) | | | (48,198 | ) |
| | | | |
Net assets, September 30, 2019 | | $ | 26,991,222 | |
| | | | |
See Notes to Financial Statements.
| | | | |
| PGIM Securitized Credit Fund | | | 33 | |
Statement of Assets and Liabilities
as of September 30, 2019
| | | | |
Class A | | | | |
Net asset value and redemption price per share,
($10,055 ÷ 1,008 shares of beneficial interest issued and outstanding) | | $ | 9.97 | |
Maximum sales charge (3.25% of offering price) | | | 0.33 | |
| | | | |
Maximum offering price to public | | $ | 10.30 | |
| | | | |
| |
Class C | | | | |
Net asset value, offering price and redemption price per share, | | | | |
($10,036 ÷ 1,006 shares of beneficial interest issued and outstanding) | | $ | 9.97 | |
| | | | |
| |
Class Z | | | | |
Net asset value, offering price and redemption price per share, | | | | |
($26,961,069 ÷ 2,703,227 shares of beneficial interest issued and outstanding) | | $ | 9.97 | |
| | | | |
| |
Class R6 | | | | |
Net asset value, offering price and redemption price per share, | | | | |
($10,062 ÷ 1,009 shares of beneficial interest issued and outstanding) | | $ | 9.97 | |
| | | | |
See Notes to Financial Statements.
Statement of Operations
For the period July 1, 2019* through September 30, 2019
| | | | |
Net Investment Income (Loss) | | | | |
Income | | | | |
Interest income | | $ | 260,695 | |
Affiliated dividend income | | | 6,887 | |
| | | | |
Total income | | | 267,582 | |
| | | | |
| |
Expenses | | | | |
Management fee | | | 40,522 | |
Distribution fee(a) | | | 31 | |
Registration fees(a) | | | 81,448 | |
Audit fee | | | 49,500 | |
Offering fees | | | 20,165 | |
Custodian and accounting fees | | | 19,480 | |
Shareholders’ reports | | | 12,500 | |
Legal fees and expenses | | | 6,000 | |
Trustees’ fees | | | 2,710 | |
Transfer agent’s fees and expenses (including affiliated expense of $132)(a) | | | 400 | |
Miscellaneous | | | 3,600 | |
| | | | |
Total expenses | | | 236,356 | |
Less: Fee waiver and/or expense reimbursement(a) | | | (193,228 | ) |
| | | | |
Net expenses | | | 43,128 | |
| | | | |
Net investment income (loss) | | | 224,454 | |
| | | | |
| |
Realized And Unrealized Gain (Loss) On Investment And Foreign Currency Transactions | | | | |
Net realized gain (loss) on: | | | | |
Investment transactions | | | (12,500 | ) |
Forward currency contract transactions | | | 70,221 | |
Swap agreement transactions | | | 71,675 | |
Foreign currency transactions | | | 13,098 | |
| | | | |
| | | 142,494 | |
| | | | |
Net change in unrealized appreciation (depreciation) on: | | | | |
Investments | | | (84,577 | ) |
Forward currency contracts | | | 55,332 | |
Swap agreements | | | (174,194 | ) |
Foreign currencies | | | (147 | ) |
| | | | |
| | | (203,586 | ) |
| | | | |
Net gain (loss) on investment and foreign currency transactions | | | (61,092 | ) |
| | | | |
Net Increase (Decrease) In Net Assets Resulting From Operations | | $ | 163,362 | |
| | | | |
| * | Commencement of operations. |
| (a) | Class specific expenses and waivers were as follows: |
| | | | | | | | | | | | | | | | |
| | | Class A | | | Class C | | | Class Z | | | Class R6 | |
Distribution fee | | | 6 | | | | 25 | | | | — | | | | — | |
Registration fees | | | 20,362 | | | | 20,362 | | | | 20,362 | | | | 20,362 | |
Transfer agent’s fees and expenses | | | 100 | | | | 100 | | | | 100 | | | | 100 | |
Fee waiver and/or expense reimbursement | | | (20,503 | ) | | | (20,502 | ) | | | (106,735 | ) | | | (45,488 | ) |
See Notes to Financial Statements.
| | | | |
| PGIM Securitized Credit Fund | | | 35 | |
Statement of Changes in Net Assets
| | | | |
| |
| | | July 1, 2019*
through
September 30, 2019 | |
Increase (Decrease) in Net Assets | | | | |
Operations | | | | |
Net investment income (loss) | | $ | 224,454 | |
Net realized gain (loss) on investment and foreign currency transactions | | | 142,494 | |
Net change in unrealized appreciation (depreciation) on investments and foreign currencies | | | (203,586 | ) |
| | | | |
Net increase (decrease) in net assets resulting from operations | | | 163,362 | |
| | | | |
| |
Dividends and Distributions | | | | |
Distributions from distributable earnings | | | | |
Class A | | | (81 | ) |
Class C | | | (63 | ) |
Class Z | | | (233,713 | ) |
Class R6 | | | (88 | ) |
| | | | |
| | | (233,945 | ) |
| | | | |
| |
Fund share transactions (Net of share conversions) | | | | |
Net proceeds from shares sold | | | 26,828,000 | |
Net asset value of shares issued in reinvestment of dividends and distributions | | | 233,805 | |
| | | | |
Net increase (decrease) in net assets from Fund share transactions | | | 27,061,805 | |
| | | | |
Total increase (decrease) | | | 26,991,222 | |
| |
Net Assets: | | | | |
Beginning of period | | | — | |
| | | | |
End of period | | $ | 26,991,222 | |
| | | | |
| * | Commencement of operations. |
See Notes to Financial Statements.
Notes to Financial Statements
Prudential Investment Portfolios 8 (the “Trust”) is registered under the Investment Company Act of 1940, as amended (“1940 Act”), as an open-end management investment company. The Trust currently consists of two funds: PGIM QMA Stock Index Fund, which is a diversified fund, and PGIM Securitized Credit Fund, which is a non-diversified fund for purposes of the 1940 Act. These financial statements relate only to the PGIM Securitized Credit Fund (the “Fund”).
The investment objective of the Fund is to seek to maximize total return, through a combination of current income and capital appreciation.
1. Accounting Policies
The Fund follows the investment company accounting and reporting guidance of the Financial Accounting Standards Board (“FASB”) Accounting Standard Codification (“ASC”) Topic 946 Financial Services—Investment Companies.The following accounting policies conform to U.S. generally accepted accounting principles. The Fund consistently follows such policies in the preparation of its financial statements.
Securities Valuation:The Fund holds securities and other assets and liabilities that are fair valued at the close of each day (generally, 4:00 PM Eastern time) the New York Stock Exchange (“NYSE”) is open for trading. Fair value is the price that would be received to sell an asset or paid to transfer a liability in an orderly transaction between market participants on the measurement date. The Trust’s Board of Trustees (the “Board”) has adopted valuation procedures for security valuation under which fair valuation responsibilities have been delegated to PGIM Investments LLC (“PGIM Investments” or the “Manager”). Pursuant to the Board’s delegation, the Manager has established a Valuation Committee responsible for supervising the fair valuation of portfolio securities and other assets and liabilities. The valuation procedures permit the Fund to utilize independent pricing vendor services, quotations from market makers, and alternative valuation methods when market quotations are either not readily available or not deemed representative of fair value. A record of the Valuation Committee’s actions is subject to the Board’s review, approval, and ratification at its next regularly scheduled quarterly meeting.
For the fiscal reporting period-end, securities and other assets and liabilities were fair valued at the close of the last U.S. business day. Trading in certain foreign securities may occur when the NYSE is closed (including weekends and holidays). Because such foreign securities trade in markets that are open on weekends and U.S. holidays, the values of some of the Fund’s foreign investments may change on days when investors cannot purchase or redeem Fund shares.
| | | | |
| PGIM Securitized Credit Fund | | | 37 | |
Notes to Financial Statements(continued)
Various inputs determine how the Fund’s investments are valued, all of which are categorized according to the three broad levels (Level 1, 2, or 3) detailed in the Schedule of Investments and referred to herein as the “fair value hierarchy” in accordance with FASB ASC Topic 820—Fair Value Measurements and Disclosures.
Derivative instruments, such as futures or options, that are traded on a national securities exchange are valued at the last sale price as of the close of trading on the applicable exchange where the security principally trades. Securities traded via NASDAQ are valued at the NASDAQ official closing price. To the extent these securities are valued at the last sale price or NASDAQ official closing price, they are classified as Level 1 in the fair value hierarchy. In the event that no sale or official closing price on valuation date exists, these securities are generally valued at the mean between the last reported bid and ask prices, or at the last bid price in the absence of an ask price. These securities are classified as Level 2 in the fair value hierarchy.
Investments in open-end, non-exchange-traded mutual funds are valued at their net asset values as of the close of the NYSE on the date of valuation. These securities are classified as Level 1 in the fair value hierarchy since they may be purchased or sold at their net asset values on the date of valuation.
Fixed income securities traded in the OTC market are generally classified as Level 2 in the fair value hierarchy. Such fixed income securities are typically valued using the market approach which generally involves obtaining data from an approved independent third-party vendor source. The Fund utilizes the market approach as the primary method to value securities when market prices of identical or comparable instruments are available. The third-party vendors’ valuation techniques used to derive the evaluated bid price are based on evaluating observable inputs, including but not limited to, yield curves, yield spreads, credit ratings, deal terms, tranche level attributes, default rates, cash flows, prepayment speeds, broker/dealer quotations and reported trades. Certain Level 3 securities are also valued using the market approach when obtaining a single broker quote or when utilizing transaction prices for identical securities that have been used in excess of five business days. During the reporting period, there were no changes to report with respect to the valuation approach and/or valuation techniques discussed above.
Bank loans are generally valued at prices provided by approved independent pricing vendors. The pricing vendors utilize broker/dealer quotations and provide prices based on the average of such quotations. Bank loans valued using such vendor prices are generally classified as Level 2 in the fair value hierarchy. Bank loans valued based on a single broker quote or at the original transaction price in excess of five business days are classified as Level 3 in the fair value hierarchy.
OTC and centrally cleared derivative instruments are generally classified as Level 2 in the fair value hierarchy. Such derivative instruments are typically valued using the market approach and/or income approach which generally involves obtaining data from an approved independent third-party vendor source. The Fund utilizes the market approach when quoted prices in broker-dealer markets are available but also includes consideration of alternative valuation approaches, including the income approach. In the absence of reliable market quotations, the income approach is typically utilized for purposes of valuing derivatives such as interest rate swaps based on a discounted cash flow analysis whereby the value of the instrument is equal to the present value of its future cash inflows or outflows. Such analysis includes projecting future cash flows and determining the discount rate (including the present value factors that affect the discount rate) used to discount the future cash flows. In addition, the third-party vendors’ valuation techniques used to derive the evaluated derivative price is based on evaluating observable inputs, including but not limited to, underlying asset prices, indices, spreads, interest rates and exchange rates. Certain derivatives may be classified as Level 3 when valued using the market approach by obtaining a single broker quote or when utilizing unobservable inputs in the income approach. During the reporting period, there were no changes to report with respect to the valuation approach and/or valuation techniques discussed above.
Securities and other assets that cannot be priced according to the methods described above are valued based on pricing methodologies approved by the Board. In the event that unobservable inputs are used when determining such valuations, the securities will be classified as Level 3 in the fair value hierarchy.
When determining the fair value of securities, some of the factors influencing the valuation include: the nature of any restrictions on disposition of the securities; assessment of the general liquidity of the securities; the issuer’s financial condition and the markets in which it does business; the cost of the investment; the size of the holding and the capitalization of the issuer; the prices of any recent transactions or bids/offers for such securities or any comparable securities; any available analyst media or other reports or information deemed reliable by the Manager regarding the issuer or the markets or industry in which it operates. Using fair value to price securities may result in a value that is different from a security’s most recent closing price and from the price used by other unaffiliated mutual funds to calculate their net asset values.
Illiquid Securities:Pursuant to Rule 22e-4 under the 1940 Act, the Fund has adopted a Board approved Liquidity Risk Management Program (“LRMP”) that requires, among other things, that the Fund limit its illiquid investments that are assets to no more than 15% of net assets. Illiquid securities are those that, because of the absence of a readily available market or due to legal or contractual restrictions on resale, may not reasonably be expected to be sold or disposed of in current market conditions in seven calendar days or less without the sale or disposition significantly changing the market value of the investment. The Fund may find it difficult to sell illiquid securities at the time considered most advantageous by its subadviser and may incur transaction costs that would not be incurred in the sale of securities that were freely marketable.
| | | | |
| PGIM Securitized Credit Fund | | | 39 | |
Notes to Financial Statements(continued)
Restricted Securities:Securities acquired in unregistered, private sales from the issuing company or from an affiliate of the issuer are considered restricted as to disposition under federal securities law (“restricted securities”). Such restricted securities are valued pursuant to the valuation procedures noted above. Restricted securities that would otherwise be considered illiquid investments pursuant to the Fund’s LRMP because of legal restrictions on resale to the general public may be traded among qualified institutional buyers under Rule 144A of the Securities Act of 1933. Therefore, these Rule 144A securities, as well as commercial paper that is sold in private placements under Section 4(2) of the Securities Act of 1933, may be classified higher than “illiquid” under the LRMP (i.e. “moderately liquid” or “less liquid” investments). However, the liquidity of the Fund’s investments in restricted securities could be impaired if trading does not develop or declines.
Foreign Currency Translation:The books and records of the Fund are maintained in U.S. dollars. Foreign currency amounts are translated into U.S. dollars on the following basis:
(i) market value of investment securities, other assets and liabilities—at the current rates of exchange;
(ii) purchases and sales of investment securities, income and expenses—at the rates of exchange prevailing on the respective dates of such transactions.
Although the net assets of the Fund are presented at the foreign exchange rates and market values at the close of the period, the Fund does not generally isolate that portion of the results of operations arising as a result of changes in the foreign exchange rates from the fluctuations arising from changes in the market prices of long-term portfolio securities held at the end of the period. Similarly, the Fund does not isolate the effect of changes in foreign exchange rates from the fluctuations arising from changes in the market prices of long-term portfolio securities sold during the period. Accordingly, holding period realized foreign currency gains (losses) are included in the reported net realized gains (losses) on investment transactions.
Net realized gains (losses) on foreign currency transactions represent net foreign exchange gains (losses) from the disposition of holdings of foreign currencies, currency gains (losses) realized between the trade and settlement dates on forward currency transactions, and the difference between the amounts of interest, dividends and foreign withholding taxes recorded on the Fund’s books and the U.S. dollar equivalent amounts actually received or paid. Net unrealized currency gains (losses) arise from valuing foreign currency denominated assets and liabilities (other than investments) at period end exchange rates.
Forward and Cross Currency Contracts:A forward currency contract is a commitment to purchase or sell a foreign currency at a future date at a negotiated forward rate. The Fund
enters into forward currency contracts, as defined in the prospectus, in order to hedge its exposure to changes in foreign currency exchange rates on its foreign portfolio holdings or on specific receivables and payables denominated in a foreign currency and to gain exposure to certain currencies. The contracts are valued daily at current forward exchange rates and any unrealized gain (loss) is included in net unrealized appreciation (depreciation) on forward and cross currency contracts. Gain (loss) is realized on the settlement date of the contract equal to the difference between the settlement value of the original and negotiated forward contracts. This gain (loss), if any, is included in net realized gain (loss) on forward and cross currency contract transactions. Risks may arise upon entering into these contracts from the potential inability of the counterparties to meet the terms of their contracts. Forward currency contracts involve risks from currency exchange rate and credit risk in excess of the amounts reflected on the Statement of Assets and Liabilities. The Fund’s maximum risk of loss from counterparty credit risk is the net value of the cash flows to be received from the counterparty at the end of the contract’s life. A cross currency contract is a forward contract where a specified amount of one foreign currency will be exchanged for a specified amount of another foreign currency.
Bank Loans:The Fund invested in bank loans. Bank loans include fixed and floating rate loans that are privately negotiated between a corporate borrower and one or more financial institutions, including, but not limited to, term loans, revolvers, and other instruments issued in the bank loan market. The Fund may acquire interests in loans directly (by way of assignment from the selling institution) or indirectly (by way of the purchase of a participation interest from the selling institution). Under a bank loan assignment, the Fund generally will succeed to all the rights and obligations of an assigning lending institution and becomes a lender under the loan agreement with the relevant borrower in connection with that loan. Under a bank loan participation, the Fund generally will have a contractual relationship only with the lender, not with the relevant borrower. As a result, the Fund generally will have the right to receive payments of principal, interest, and any fees to which it is entitled only from the lender selling the participation and only upon receipt by the lender of the payments from the relevant borrower. The Fund may not directly benefit from the collateral supporting the debt obligation in which it has purchased the participation. As a result, the Fund will assume the credit risk of both the borrower and the institution selling the participation to the Fund.
Swap Agreements:The Fund entered into certain types of swap agreements detailed in the disclosures below. A swap agreement is an agreement to exchange the return generated by one instrument for the return generated by another instrument. Swap agreements are negotiated in the OTC market and may be executed either directly with a counterparty (“OTC-traded”) or through a central clearing facility, such as a registered exchange. Swap agreements are valued daily at current market value and any change in value is included in the net unrealized appreciation (depreciation) on swap agreements. Centrally cleared swaps pay or receive an amount known as “variation margin”, based on daily changes in the valuation of the swap contract. Any upfront premiums paid and received are shown as swap premiums paid and swap premiums received in the Statement of Assets and Liabilities. Risk
| | | | |
| PGIM Securitized Credit Fund | | | 41 | |
Notes to Financial Statements(continued)
of loss may exceed amounts recognized on the Statement of Assets and Liabilities. Swap agreements outstanding at period end, if any, are listed on the Schedule of Investments.
Interest Rate Swaps:Interest rate swaps represent an agreement between counterparties to exchange cash flows based on the difference between two interest rates, applied to a notional principal amount for a specified period. The Fund is subject to interest rate risk exposure in the normal course of pursuing its investment objective. The Fund used interest rate swaps to maintain its ability to generate steady cash flow by receiving a stream of fixed rate payments or to increase exposure to prevailing market rates by receiving floating rate payments. The Fund’s maximum risk of loss from counterparty credit risk is the discounted net present value of the cash flows to be received from the counterparty over the contract’s remaining life.
Credit Default Swaps (“CDS”):CDS involve one party (the protection buyer) making a stream of payments to another party (the protection seller) in exchange for the right to receive a specified payment in the event of a default or as a result of a default (collectively a “credit event”) for the referenced entity (typically corporate issues or sovereign issues of an emerging country) on its obligation; or in the event of a write-down, principal shortfall, interest shortfall or default of all or part of the referenced entities comprising a credit index.
The Fund is subject to credit risk in the normal course of pursuing its investment objectives, and as such, has entered into CDS contracts to provide a measure of protection against defaults or to take an active long or short position with respect to the likelihood of a particular issuer’s default or the reference entity’s credit soundness. CDS contracts generally trade based on a spread which represents the cost a protection buyer has to pay the protection seller. The protection buyer is said to be short the credit as the value of the contract rises the more the credit deteriorates. The value of the CDS contract increases for the protection buyer if the spread increases. The Fund’s maximum risk of loss from counterparty credit risk for purchased CDS is the inability of the counterparty to honor the contract up to the notional value due to a credit event.
As a seller of protection on credit default swap agreements, the Fund generally receives an agreed upon payment from the buyer of protection throughout the term of the swap, provided no credit event occurs. As the seller, the Fund effectively increases its investment risk because, in addition to its total net assets, the Fund may be subject to investment exposure on the notional amount of the swap.
The maximum amount of the payment that the Fund, as a seller of protection, could be required to make under a credit default swap agreement would be equal to the notional amount of the underlying security or index contract as a result of a credit event. This potential amount will be partially offset by any recovery values of the respective referenced
obligations, or net amounts received from the settlement of buy protection credit default swap agreements which the Fund entered into for the same referenced entity or index. As a buyer of protection, the Fund generally receives an amount up to the notional value of the swap if a credit event occurs.
Implied credit spreads, represented in absolute terms, utilized in determining the market value of credit default swap agreements where the Fund is the seller of protection as of period end are disclosed in the footnotes to the Schedule of Investments, if applicable. These spreads serve as indicators of the current status of the payment/performance risk and represent the likelihood of default risk for the credit derivative. The implied credit spread of a particular referenced entity reflects the cost of buying/selling protection and may include upfront payments required to enter into the agreement. Wider credit spreads and increased market value in absolute terms, when compared to the notional amount of the swap, represent a deterioration of the referenced entity’s credit soundness and a greater likelihood of risk of default or other credit event occurring as defined under the terms of the agreement.
Master Netting Arrangements:The Trust, on behalf of the Fund, is subject to various Master Agreements, or netting arrangements, with select counterparties. These are agreements which a subadviser may have negotiated and entered into on behalf of all or a portion of the Fund. A master netting arrangement between the Fund and the counterparty permits the Fund to offset amounts payable by the Fund to the same counterparty against amounts to be received; and by the receipt of collateral from the counterparty by the Fund to cover the Fund’s exposure to the counterparty. However, there is no assurance that such mitigating factors are easily enforceable. In addition to master netting arrangements, the right to set-off exists when all the conditions are met such that each of the parties owes the other determinable amounts, the reporting party has the right to set-off the amount owed with the amount owed by the other party, the reporting party intends to set-off and the right of set-off is enforceable by law. During the reporting period, there was no intention to settle on a net basis and all amounts are presented on a gross basis on the Statement of Assets and Liabilities.
The Trust, on behalf of the Fund, is a party to International Swaps and Derivatives Association, Inc. (“ISDA”) Master Agreements with certain counterparties that govern OTC derivative and foreign exchange contracts entered into from time to time. The Master Agreements may contain provisions regarding, among other things, the parties’ general obligations, representations, agreements, collateral requirements, events of default and early termination. With respect to certain counterparties, in accordance with the terms of the Master Agreements, collateral posted to the Fund is held in a segregated account by the Fund’s custodian and with respect to those amounts which can be sold or re-pledged, is presented in the Schedule of Investments. Collateral pledged by the Fund is segregated by the Fund’s custodian and identified in the Schedule of Investments. Collateral can be in the form of cash or debt securities issued by the U.S. Government or related agencies or other securities as agreed to by the Fund and the applicable counterparty. Collateral requirements are determined based on the Fund’s net position with each counterparty. Termination events
| | | | |
| PGIM Securitized Credit Fund | | | 43 | |
Notes to Financial Statements(continued)
applicable to the Fund may occur upon a decline in the Fund’s net assets below a specified threshold over a certain period of time. Termination events applicable to counterparties may occur upon a decline in the counterparty’s long-term and short-term credit ratings below a specified level. In each case, upon occurrence, the other party may elect to terminate early and cause settlement of all derivative and foreign exchange contracts outstanding, including the payment of any losses and costs resulting from such early termination, as reasonably determined by the terminating party. Any decision by one or more of the Fund’s counterparties to elect early termination could impact the Fund’s future derivative activity.
In addition to each instrument’s primary underlying risk exposure (e.g. interest rate, credit, equity or foreign exchange, etc.), swap agreements involve, to varying degrees, elements of credit, market and documentation risk. Such risks involve the possibility that no liquid market for these agreements will exist, the counterparty to the agreement may default on its obligation to perform or disagree on the contractual terms of the agreement, and changes in net interest rates will be unfavorable. In connection with these agreements, securities in the portfolio may be identified or received as collateral from the counterparty in accordance with the terms of the respective swap agreements to provide or receive assets of value and to serve as recourse in the event of default or bankruptcy/insolvency of either party. Such OTC derivative agreements include conditions which, when materialized, give the counterparty the right to cause an early termination of the transactions under those agreements. Any election by the counterparty for early termination of the contract(s) may impact the amounts reported on financial statements.
As of September 30, 2019, the Fund has not met conditions under such agreements which give the counterparty the right to call for an early termination.
Forward currency contracts, forward rate agreements, written options, short sales, swaps and financial futures contracts involve elements of both market and credit risk in excess of the amounts reflected on the Statement of Assets and Liabilities. Such risks may be mitigated by engaging in master netting arrangements.
Securities Transactions and Net Investment Income:Securities transactions are recorded on the trade date. Realized gains (losses) from investment and currency transactions are calculated on the specific identification method. Dividend income is recorded on the ex-date, or for certain foreign securities, when the Fund becomes aware of such dividends. Expenses are recorded on an accrual basis, which may require the use of certain estimates by management that may differ from actual. Net investment income or loss (other than class specific expenses and waivers, which are allocated as noted below) and unrealized and realized gains (losses) are allocated daily to each class of shares based upon the relative proportion of adjusted net assets of each class at the beginning of the day. Class specific expenses and waivers, where applicable, are charged to the respective share classes. Class
specific expenses include distribution fees and distribution fee waivers, shareholder servicing fees, transfer agent’s fees and expenses, registration fees and fee waivers and/or expense reimbursements, as applicable.
Taxes:It is the Fund’s policy to meet the requirements of the Internal Revenue Code applicable to regulated investment companies and to distribute all of its taxable net investment income and capital gains, if any, to its shareholders. Therefore, no federal income tax provision is required. Withholding taxes on foreign dividends, interest and capital gains, if any, are recorded, net of reclaimable amounts, at the time the related income is earned.
Dividends and Distributions:The Fund expects to declare dividends of its net investment income daily and pay such dividends monthly. Distributions of net realized capital gains, if any, are declared and paid at least annually. Dividends and distributions to shareholders, which are determined in accordance with federal income tax regulations and which may differ from generally accepted accounting principles, are recorded on the ex-date. Permanent book/tax differences relating to income and gain (loss) are reclassified between total distributable earnings (loss) and paid-in capital in excess of par, as appropriate.
Estimates:The preparation of financial statements requires management to make estimates and assumptions that affect the reported amounts and disclosures in the financial statements. Actual results could differ from those estimates.
2. Agreements
The Trust, on behalf of the Fund, has a management agreement with the Manager. Pursuant to this agreement, the Manager has responsibility for all investment advisory services and supervises the subadviser’s performance of such services. In addition, under the management agreement, the Manager provides all of the administrative functions necessary for the organization, operation and management of the Fund. The Manager administers the corporate affairs of the Fund and, in connection therewith, furnishes the Fund with office facilities, together with those ordinary clerical and bookkeeping services which are not being furnished by the Fund’s custodian and the Fund’s transfer agent. The Manager is also responsible for the staffing and management of dedicated groups of legal, marketing, compliance and related personnel necessary for the operation of the Fund. The legal, marketing, compliance and related personnel are also responsible for the management and oversight of the various service providers to the Fund, including, but not limited to, the custodian, transfer agent, and accounting agent.
The Manager has entered into subadvisory agreements with each of PGIM, Inc. and PGIM Limited, which provides subadvisory services to the Fund through its PGIM Fixed Income unit. The subadvisory agreements provide that PGIM, Inc. and PGIM Limited will furnish investment advisory services in connection with the management of the Fund. In connection therewith, PGIM, Inc. and PGIM Limited are obligated to keep certain books and records of the Fund. The Manager pays for the services of PGIM, Inc. and PGIM Limited, the cost of
| | | | |
| PGIM Securitized Credit Fund | | | 45 | |
Notes to Financial Statements(continued)
compensation of officers of the Fund, occupancy and certain clerical and bookkeeping costs of the Fund. The Fund bears all other costs and expenses.
The management fee paid to the Manager is accrued daily and payable monthly at an annual rate of 0.60% of the Fund’s average daily net assets up to $2.5 billion, 0.55% of the average daily net assets on the next $2.5 billion and 0.50% of the average daily net assets in excess of $5 billion. The effective management fee rate before any waivers and/or expense reimbursements was 0.60% for the reporting period ended September 30, 2019.
The Manager has contractually agreed, through January 31, 2021, to limit total annual operating expenses after fee waivers and/or expense reimbursements to 0.90% of average daily net assets for Class A shares, 1.65% of average daily net assets for Class C shares, 0.65% of average daily net assets for Class Z shares, and 0.60% of average daily net assets for Class R6 shares. This contractual waiver excludes interest, brokerage, taxes (such as income and foreign withholding taxes, stamp duty and deferred tax expenses), acquired fund fees and expenses, extraordinary expenses, and certain other Fund expenses such as dividend and interest expense and broker charges on short sales. Where applicable, the Manager agrees to waive management fees or shared operating expenses on any share class to the same extent that it waives similar expenses on any other share class. In addition, total annual operating expenses for Class R6 shares will not exceed total annual operating expenses for Class Z shares. Fees and/or expenses waived and/or reimbursed by the Manager may be recouped by the Manager within the same fiscal year during which such waiver and/or reimbursement is made if such recoupment can be realized without exceeding the expense limit in effect at the time of the recoupment for that fiscal year.
The Trust, on behalf of the Fund, has a distribution agreement with Prudential Investment Management Services LLC (“PIMS”), which acts as the distributor of the Class A, Class C, Class Z and Class R6 shares of the Fund. The Fund compensates PIMS for distributing and servicing the Fund’s Class A and Class C shares, pursuant to the plans of distribution (the “Distribution Plans”), regardless of expenses actually incurred by PIMS. The distribution fees are accrued daily and payable monthly. No distribution or service fees are paid to PIMS as distributor of the Class Z and Class R6 shares of the Fund.
Pursuant to the Distribution Plans, the Fund compensates PIMS for distribution related activities at an annual rate of up to 0.25% and 1% of the average daily net assets of the Class A and Class C shares, respectively.
For the reporting period ended September 30, 2019, PIMS did not receive any front-end sales charges resulting from sales of Class A shares. Additionally, for the reporting period ended September 30, 2019, PIMS did not receive any contingent deferred sales charges imposed upon redemptions by certain Class C shareholders.
PGIM Investments, PGIM, Inc. and PIMS are indirect, wholly-owned subsidiaries of Prudential Financial, Inc. (“Prudential”).
3. Other Transactions with Affiliates
Prudential Mutual Fund Services LLC (“PMFS”), an affiliate of PGIM Investments and an indirect, wholly-owned subsidiary of Prudential, serves as the Trust’s transfer agent. Transfer agent’s fees and expenses in the Statement of Operations include certain out-of-pocket expenses paid to non-affiliates, where applicable.
The Fund may invest its overnight sweep cash in the PGIM Core Ultra Short Bond Fund (the “Core Fund”), a series of Prudential Investment Portfolios 2, registered under the 1940 Act and managed by PGIM Investments. Through the Fund’s investments in the mentioned underlying funds, PGIM Investments and/or its affiliates are paid fees or reimbursed for providing their services. In addition to the realized and unrealized gains on investments in the Core Fund, earnings from such investments are disclosed on the Statement of Operations as “Affiliated dividend income”.
The Fund may enter into certain securities purchase or sale transactions under Board approved Rule 17a-7 procedures. Rule 17a-7 is an exemptive rule under the 1940 Act, that subject to certain conditions, permits purchase and sale transactions among affiliated investment companies, or between an investment company and a person that is affiliated solely by reason of having a common (or affiliated) investment adviser, common directors, and/or common officers. Pursuant to the Rule 17a-7 procedures and consistent with guidance issued by the SEC, the Trust’s Chief Compliance Officer (“CCO”) prepares a quarterly summary of all such transactions for submission to the Board, together with the CCO’s written representation that all such 17a-7 transactions were effected in accordance with the Fund’s Rule 17a-7 procedures. For the reporting period ended September 30, 2019, no 17a-7 transactions were entered into by the Fund.
4. Portfolio Securities
The aggregate cost of purchases and proceeds from sales of portfolio securities (excluding short-term investments and U.S. Government securities) for the reporting period ended September 30, 2019, were $4,669,223 and $3,350,691, respectively.
A summary of the cost of purchases and proceeds from sales of shares of affiliated investments for the reporting period ended September 30, 2019, is presented as follows:
| | | | |
| PGIM Securitized Credit Fund | | | 47 | |
Notes to Financial Statements(continued)
| | | | | | | | | | | | | | | | | | | | | | | | | | | | | | |
Value,
Beginning
of Period | | | Cost of
Purchases | | | Proceeds
from Sales | | | Change in
Unrealized
Gain
(Loss) | | | Realized
Gain
(Loss) | | | Value,
End of
Period | | | Shares,
End of
Period | | | Income | |
| | PGIM Core Ultra Short Bond Fund* | |
| $ | — | | | $ | 4,864,306 | | | $ | 4,270,949 | | | $ | — | | | $ | — | | | $ | 593,357 | | | | 593,357 | | | $ | 6,887 | |
| | | | | | | | | | | | | | | | | | | | | | | | | | | | | | |
| * | The Fund did not have any capital gain distributions during the reporting period. |
5. Distributions and Tax Information
Distributions to shareholders, which are determined in accordance with federal income tax regulations and which may differ from generally accepted accounting principles, are recorded on the ex-date. In order to present total distributable earnings (loss) and paid-in capital in excess of par on the Statement of Assets and Liabilities that more closely represent their tax character, certain adjustments have been made to total distributable earnings (loss) and paid-in capital in excess of par. For the period ended September 30, 2019, the adjustments were to decrease total distributable earnings (loss) and decrease paid-in capital in excess of par by $22,385 primarily due to non-deductible offering costs. Net investment income, net realized gain (loss) on investments and foreign currency transactions and net assets were not affected by this change.
For the period ended September 30, 2019, the tax character of dividends paid by the Fund was $233,945 of ordinary income.
As of September 30, 2019, the accumulated undistributed earnings on a tax basis was $165,234 of ordinary income.
The United States federal income tax basis of the Fund’s investments and the net unrealized depreciation as of September 30, 2019 were as follows:
| | | | | | |
Tax Basis | | Gross Unrealized Appreciation | | Gross Unrealized Depreciation | | Net Unrealized Depreciation |
| $26,361,231 | | $208,177 | | $(415,093) | | $(206,916) |
The difference between book basis and tax basis is primarily attributable to amortization of premiums, swaps and foreign currency contracts.
For federal income tax purposes, the Fund had a capital loss carryforward as of September 30, 2019 of approximately $6,500 which can be carried forward for an unlimited period. No capital gains distributions are expected to be paid to shareholders until net gains have been realized in excess of such losses.
The Manager has analyzed the Fund’s tax positions and has concluded that no provision for income tax is required in the Fund’s financial statements for the current reporting period.
6. Capital and Ownership
The Fund offers Class A, Class C, Class Z and Class R6 shares. Class A shares are sold with a maximum front-end sales charge of 3.25%. Investors who purchase $500,000 or more of Class A shares and sell those shares within 12 months of purchase are subject to a contingent deferred sales charge (“CDSC”) of 1.00% on sales of $500,000 or more made within 12 months of purchase. The Class A CDSC is waived for certain retirement and/or benefit plans. A special exchange privilege is also available for shareholders who qualified to purchase Class A shares at net asset value. Class C shares are sold with a CDSC of 1% on sales made within 12 months of purchase. Class C shares will automatically convert to Class A shares on a monthly basis approximately 10 years after purchase. Class Z and Class R6 shares are not subject to any sales or redemption charge and are available exclusively for sale to a limited group of investors.
Under certain circumstances, an exchange may be made from specified share classes of the Fund to one or more other share classes of the Fund as presented in the table of transactions in shares of beneficial interest.
As of September 30, 2019, Prudential, through its affiliated entities, including affiliated funds (if applicable), owned 1,008 Class A shares, 1,006 Class C shares, 2,699,057 Class Z shares and 1,009 Class R6 shares of the Fund. At reporting period end, one affiliated shareholder of record, holding greater than 5% of the Fund, held 99.7% of the Fund’s outstanding shares.
Transactions in shares of beneficial interest were as follows:
| | | | | | | | |
Class A | | Shares | | | Amount | |
Period ended September 30, 2019*: | | | | | | | | |
Shares sold | | | 1,000 | | | $ | 10,000 | |
Shares issued in reinvestment of dividends and distributions | | | 8 | | | | 81 | |
| | | | | | | | |
Net increase (decrease) in shares outstanding | | | 1,008 | | | $ | 10,081 | |
| | | | | | | | |
Class C | | | | | | |
Period ended September 30, 2019*: | | | | | | | | |
Shares sold | | | 1,000 | | | $ | 10,000 | |
Shares issued in reinvestment of dividends and distributions | | | 6 | | | | 63 | |
| | | | | | | | |
Net increase (decrease) in shares outstanding | | | 1,006 | | | $ | 10,063 | |
| | | | | | | | |
Class Z | | | | | | |
Period ended September 30, 2019*: | | | | | | | | |
Shares sold | | | 16,482 | | | $ | 154,905 | |
Shares issued in reinvestment of dividends and distributions | | | 23,415 | | | | 233,573 | |
| | | | | | | | |
Net increase (decrease) in shares outstanding before conversion | | | 39,897 | | | | 388,478 | |
Shares issued upon conversion from other share class(es) | | | 2,663,330 | | | | 26,686,565 | |
| | | | | | | | |
Net increase (decrease) in shares outstanding | | | 2,703,227 | | | $ | 27,075,043 | |
| | | | | | | | |
| | | | |
| PGIM Securitized Credit Fund | | | 49 | |
Notes to Financial Statements(continued)
| | | | | | | | |
Class R6 | | Shares | | | Amount | |
Period ended September 30, 2019*: | | | | | | | | |
Shares sold | | | 2,664,330 | | | $ | 26,653,095 | |
Shares issued in reinvestment of dividends and distributions | | | 9 | | | | 88 | |
| | | | | | | | |
Net increase (decrease) in shares outstanding before conversion | | | 2,664,339 | | | | 26,653,183 | |
Shares reacquired upon conversion into other share class(es) | | | (2,663,330 | ) | | | (26,686,565 | ) |
| | | | | | | | |
Net increase (decrease) in shares outstanding | | | 1,009 | | | $ | (33,382 | ) |
| | | | | | | | |
| * | Commencement of offering was July 1, 2019. |
7. Risks of Investing in the Fund
The Fund’s risks include, but are not limited to, some or all of the risks discussed below:
Bond Obligations Risk:The Fund’s holdings, share price, yield and total return may fluctuate in response to bond market movements. The value of bonds may decline for issuer-related reasons, including management performance, financial leverage and reduced demand for the issuer’s goods and services. Certain types of fixed-income obligations also may be subject to “call and redemption risk,” which is the risk that the issuer may call a bond held by the Fund for redemption before it matures and the Fund may not be able to reinvest at the same level and therefore would earn less income.
Derivatives Risk:Derivatives involve special risks and costs and may result in losses to the Fund. The successful use of derivatives requires sophisticated management, and, to the extent that derivatives are used, the Fund will depend on the subadviser’s ability to analyze and manage derivative transactions. The prices of derivatives may move in unexpected ways, especially in abnormal market conditions. Some derivatives are “leveraged” and therefore may magnify or otherwise increase investment losses to the Fund. Other risks arise from the potential inability to terminate or sell derivatives positions. A liquid secondary market may not always exist for the Fund’s derivatives positions. In fact, many OTC derivative instruments will not have liquidity beyond the counterparty to the instrument. OTC derivative instruments also involve the risk that the other party will not meet its obligations to the Fund.
Foreign Securities Risk:The Fund’s investments in securities of foreign issuers or issuers with significant exposure to foreign markets involve additional risk. Foreign countries in which the Fund may invest may have markets that are less liquid, less regulated and more volatile than US markets. The value of the Fund’s investments may decline because of factors affecting the particular issuer as well as foreign markets and issuers generally, such as unfavorable government actions, and political or financial instability.
Interest Rate Risk:The value of an investment may go down when interest rates rise. A rise in rates tends to have a greater impact on the prices of longer term or duration securities. When interest rates fall, the issuers of debt obligations may prepay principal more quickly than expected, and the Fund may be required to reinvest the proceeds at a lower interest rate. This is referred to as “prepayment risk.” When interest rates rise, debt obligations may be repaid more slowly than expected, and the value of the Fund’s holdings may fall sharply. This is referred to as “extension risk. The Fund may face a heightened level of interest rate risk as a result of the U.S. Federal Reserve Board’s policies. The Fund’s investments may lose value if short-term or long-term interest rates rise sharply or in a manner not anticipated by the subadviser.
Liquidity Risk:The Fund may invest in instruments that trade in lower volumes and are less liquid than other investments. Liquidity risk exists when particular investments made by the Fund are difficult to purchase or sell. Liquidity risk includes the risk that the Fund may make investments that may become less liquid in response to market developments or adverse investor perceptions. Investments that are illiquid or that trade in lower volumes may be more difficult to value. If the Fund is forced to sell these investments to pay redemption proceeds or for other reasons, the Fund may lose money. In addition, when there is no willing buyer and investments may not reasonably be expected to be sold or disposed of in current market conditions in seven calendar days or less without the sale or disposition significantly changing the market value of the investment, the Fund may incur higher transaction costs when executing trade orders of a given size. The reduction in dealer market-making capacity in the fixed-income markets that has occurred in recent years also has the potential to reduce liquidity. An inability to sell a portfolio position can adversely affect the Fund’s value or prevent the Fund from being able to take advantage of other investment opportunities.
Market and Credit Risk:Securities markets may be volatile and the market prices of the Fund’s securities may decline. Securities fluctuate in price based on changes in an issuer’s financial condition and overall market and economic conditions. If the market prices of the securities owned by the Fund fall, the value of an investment in the Fund will decline. Additionally, the Fund may also be exposed to credit risk in the event that an issuer or guarantor fails to perform or that an institution or entity with which the Fund has unsettled or open transactions defaults.
Mortgage-Backed and Other Asset-Backed Securities Risk:Mortgage-related securities are usually pass-through instruments that pay investors a share of all interest and principal payments from an underlying pool of fixed or adjustable rate mortgages. Asset-backed securities are another type of pass-through instruments that pays interest based upon the cash flow of an underlying pool of assets, such as automobile loans or credit card receivables. Asset-backed securities can also be collateralized by a portfolio of corporate bonds including junk bonds or other securities. The values of mortgage-backed and asset-backed securities vary with changes in interest rates and are particularly sensitive to prepayments (the risk is that the underlying debt instruments may be partially or wholly prepaid during periods of falling interest rates, which could require the Fund to reinvest in
| | | | |
| PGIM Securitized Credit Fund | | | 51 | |
Notes to Financial Statements(continued)
lower yielding debt instruments) or extensions (the risk is that rising interest rates may cause the underlying debt instruments to be repaid more slowly by the debtor, causing the value of the securities to fall). Asset-backed securities are also subject to liquidity risk.
Non-diversification Risk:A non-diversified Fund may invest a greater percentage of its assets in the securities of a single company or industry than a diversified fund. Investing in a non-diversified fund involves greater risk than investing in a diversified fund because a loss resulting from the decline in value of any one security may represent a greater portion of the total assets of a non-diversified fund.
8. Recent Accounting Pronouncements and Reporting Updates
In August 2018, the FASB issued Accounting Standards Update (“ASU”) No. 2018-13, which changes certain fair value measurement disclosure requirements. The new ASU, in addition to other modifications and additions, removes the requirement to disclose the amount and reasons for transfers between Level 1 and Level 2 of the fair value hierarchy, and the Fund’s policy for the timing of transfers between levels. The amendments are effective for financial statements issued for fiscal years beginning after December 15, 2019, and interim periods within those fiscal years. The Manager has evaluated the implications of certain provisions of the ASU and has determined to early adopt aspects related to the removal and modification of certain fair value measurement disclosures under the ASU effective immediately. The Manager continues to evaluate certain other provisions of the ASU and does not expect a material impact to financial statement disclosures.
Financial Highlights
| | | | |
| Class A Shares | | | |
| | | July 1, 2019(a)
through September 30,
2019 | |
| Per Share Operating Performance(b): | | | | |
| Net Asset Value, Beginning of Period | | | $10.00 | |
| Income (loss) from investment operations: | | | | |
| Net investment income (loss) | | | 0.08 | |
| Net realized and unrealized gain (loss) on investment and foreign currency transactions | | | (0.03 | ) |
| Total from investment operations | | | 0.05 | |
| Less Dividends and Distributions: | | | | |
| Dividends from net investment income | | | (0.08 | ) |
| Net asset value, end of period | | | $9.97 | |
| Total Return(c): | | | 0.51% | |
| |
| Ratios/Supplemental Data: | | | |
| Net assets, end of period (000) | | | $10 | |
| Average net assets (000) | | | $10 | |
| Ratios to average net assets(d): | | | | |
| Expenses after waivers and/or expense reimbursement | | | 0.90% | (e) |
| Expenses before waivers and/or expense reimbursement | | | 813.14% | (e) |
| Net investment income (loss) | | | 3.07% | (e) |
| Portfolio turnover rate(f) | | | 14% | |
| (a) | Commencement of operations. |
| (b) | Calculated based on average shares outstanding during the period. |
| (c) | Total return does not consider the effects of sales loads. Total return is calculated assuming a purchase of a share on the first day and a sale on the last day of each period reported and includes reinvestment of dividends and distributions, if any. Total returns may reflect adjustments to conform to generally accepted accounting principles. Total returns for periods less than one full year are not annualized. |
| (d) | Does not include expenses of the underlying funds in which the Fund invests. |
| (f) | The Fund’s portfolio turnover rate is calculated in accordance with regulatory requirements, without regard to transactions involving short-term investments and certain derivatives. If such transactions were included, the Fund’s portfolio turnover rate may be higher. |
See Notes to Financial Statements.
| | | | |
| PGIM Securitized Credit Fund | | | 53 | |
Financial Highlights(continued)
| | | | |
| Class C Shares | | | |
| | | July 1, 2019(a)
through September 30,
2019 | |
| Per Share Operating Performance(b): | | | | |
| Net Asset Value, Beginning of Period | | | $10.00 | |
| Income (loss) from investment operations: | | | | |
| Net investment income (loss) | | | 0.06 | |
| Net realized and unrealized gain (loss) on investment and foreign currency transactions | | | (0.03 | ) |
| Total from investment operations | | | 0.03 | |
| Less Dividends and Distributions: | | | | |
| Dividends from net investment income | | | (0.06 | ) |
| Net asset value, end of period | | | $9.97 | |
| Total Return(c): | | | 0.33% | |
| |
| Ratios/Supplemental Data: | | | |
| Net assets, end of period (000) | | | $10 | |
| Average net assets (000) | | | $10 | |
| Ratios to average net assets(d): | | | | |
| Expenses after waivers and/or expense reimbursement | | | 1.65% | (e) |
| Expenses before waivers and/or expense reimbursement | | | 814.62% | (e) |
| Net investment income (loss) | | | 2.32% | (e) |
| Portfolio turnover rate(f) | | | 14% | |
| (a) | Commencement of operations. |
| (b) | Calculated based on average shares outstanding during the period. |
| (c) | Total return does not consider the effects of sales loads. Total return is calculated assuming a purchase of a share on the first day and a sale on the last day of each period reported and includes reinvestment of dividends and distributions, if any. Total returns may reflect adjustments to conform to generally accepted accounting principles. Total returns for periods less than one full year are not annualized. |
| (d) | Does not include expenses of the underlying funds in which the Fund invests. |
| (f) | The Fund’s portfolio turnover rate is calculated in accordance with regulatory requirements, without regard to transactions involving short-term investments and certain derivatives. If such transactions were included, the Fund’s portfolio turnover rate may be higher. |
See Notes to Financial Statements.
| | | | |
| Class Z Shares | | | |
| | | July 1, 2019(a)
through
September 30,
2019 | |
| Per Share Operating Performance(b): | | | | |
| Net Asset Value, Beginning of Period | | | $10.00 | |
| Income (loss) from investment operations: | | | | |
| Net investment income (loss) | | | 0.08 | |
| Net realized and unrealized gain (loss) on investment and foreign currency transactions | | | (0.02 | ) |
| Total from investment operations | | | 0.06 | |
| Less Dividends and Distributions: | | | | |
| Dividends from net investment income | | | (0.09 | ) |
| Net asset value, end of period | | | $9.97 | |
| Total Return(c): | | | 0.57% | |
| |
| Ratios/Supplemental Data: | | | |
| Net assets, end of period (000) | | | $26,961 | |
| Average net assets (000) | | | $20,410 | |
| Ratios to average net assets(d): | | | | |
| Expenses after waivers and/or expense reimbursement | | | 0.65% | (e) |
| Expenses before waivers and/or expense reimbursement | | | 2.72% | (e) |
| Net investment income (loss) | | | 3.32% | (e) |
| Portfolio turnover rate(f) | | | 14% | |
| (a) | Commencement of operations. |
| (b) | Calculated based on average shares outstanding during the period. |
| (c) | Total return is calculated assuming a purchase of a share on the first day and a sale on the last day of each period reported and includes reinvestment of dividends and distributions, if any. Total returns may reflect adjustments to conform to generally accepted accounting principles. Total returns for periods less than one full year are not annualized. |
| (d) | Does not include expenses of the underlying funds in which the Fund invests. |
| (f) | The Fund’s portfolio turnover rate is calculated in accordance with regulatory requirements, without regard to transactions involving short-term investments and certain derivatives. If such transactions were included, the Fund’s portfolio turnover rate may be higher. |
See Notes to Financial Statements.
| | | | |
| PGIM Securitized Credit Fund | | | 55 | |
Financial Highlights(continued)
| | | | |
| Class R6 Shares | | | |
| | | July 1, 2019(a)
through
September 30,
2019 | |
| Per Share Operating Performance(b): | | | | |
| Net Asset Value, Beginning of Period | | | $10.00 | |
| Income (loss) from investment operations: | | | | |
| Net investment income (loss) | | | 0.08 | |
| Net realized and unrealized gain (loss) on investment and foreign currency transactions | | | (0.02 | ) |
| Total from investment operations | | | 0.06 | |
| Less Dividends and Distributions: | | | | |
| Dividends from net investment income | | | (0.09 | ) |
| Net asset value, end of period | | | $9.97 | |
| Total Return(c): | | | 0.58% | |
| |
| Ratios/Supplemental Data: | | | |
| Net assets, end of period (000) | | | $10 | |
| Average net assets (000) | | | $6,365 | |
| Ratios to average net assets(d): | | | | |
| Expenses after waivers and/or expense reimbursement | | | 0.60% | (e) |
| Expenses before waivers and/or expense reimbursement | | | 3.44% | (e) |
| Net investment income (loss) | | | 3.33% | (e) |
| Portfolio turnover rate(f) | | | 14% | |
| (a) | Commencement of operations. |
| (b) | Calculated based on average shares outstanding during the period. |
| (c) | Total return is calculated assuming a purchase of a share on the first day and a sale on the last day of each period reported and includes reinvestment of dividends and distributions, if any. Total returns may reflect adjustments to conform to generally accepted accounting principles. Total returns for periods less than one full year are not annualized. |
| (d) | Does not include expenses of the underlying funds in which the Fund invests. |
| (f) | The Fund’s portfolio turnover rate is calculated in accordance with regulatory requirements, without regard to transactions involving short-term investments and certain derivatives. If such transactions were included, the Fund’s portfolio turnover rate may be higher. |
See Notes to Financial Statements.
Report of Independent Registered Public Accounting Firm
To the Shareholders of PGIM Securitized Credit Fund and Board of Trustees
Prudential Investment Portfolios 8:
Opinion on the Financial Statements
We have audited the accompanying statement of assets and liabilities of PGIM Securitized Credit Fund, a series of Prudential Investment Portfolios 8, (the Fund), including the schedule of investments, as of September 30, 2019, and the related statements of operations and changes in net assets for the period from July 1, 2019 to September 30, 2019 , and the related notes (collectively, the financial statements) and the financial highlights for the period indicated therein. In our opinion, the financial statements and financial highlights present fairly, in all material respects, the financial position of the Fund as of September 30, 2019, the results of its operations and the changes in its net assets for the period from July 1, 2019 (commencement of operations) to September 30, 2019, and the financial highlights for the period indicated therein, in conformity with U.S. generally accepted accounting principles.
Basis for Opinion
These financial statements and financial highlights are the responsibility of the Fund’s management. Our responsibility is to express an opinion on these financial statements and financial highlights based on our audits. We are a public accounting firm registered with the Public Company Accounting Oversight Board (United States) (PCAOB) and are required to be independent with respect to the Fund in accordance with the U.S. federal securities laws and the applicable rules and regulations of the Securities and Exchange Commission and the PCAOB.
We conducted our audits in accordance with the standards of the PCAOB. Those standards require that we plan and perform the audit to obtain reasonable assurance about whether the financial statements and financial highlights are free of material misstatement, whether due to error or fraud. Our audits included performing procedures to assess the risks of material misstatement of the financial statements and financial highlights, whether due to error or fraud, and performing procedures that respond to those risks. Such procedures included examining, on a test basis, evidence regarding the amounts and disclosures in the financial statements and financial highlights. Such procedures also included confirmation of securities owned as of September 30, 2019, by correspondence with the custodian, transfer agent, and brokers, or by other appropriate auditing procedures when replies were not received. Our audits also included evaluating the accounting principles used and significant estimates made by management, as well as evaluating the overall presentation of the financial statements and financial highlights. We believe that our audits provide a reasonable basis for our opinion.

We have served as the auditor of one or more PGIM and/or Prudential Retail investment companies since 2003.
New York, New York
November 15, 2019
| | | | |
| PGIM Securitized Credit Fund | | | 57 | |
Tax Information(unaudited)
For the period ended September 30, 2019, the Fund reports the maximum amount allowable but not less than 21.40% as interest-related dividends in accordance with Section 871(k)(1) and 881(e)(1) of the Internal Revenue Code.
In January 2020, you will be advised on IRS Form 1099-DIV or substitute 1099-DIV, as to the federal tax status of dividends and distributions received by you in calendar year 2019.
INFORMATION ABOUT BOARD MEMBERS AND OFFICERS(unaudited)
Information about Board Members and Officers of the Fund is set forth below. Board Members who are not deemed to be “interested persons” of the Fund, as defined in the 1940 Act, are referred to as “Independent Board Members.” Board Members who are deemed to be “interested persons” of the Fund are referred to as “Interested Board Members.” The Board Members are responsible for the overall supervision of the operations of the Fund and perform the various duties imposed on the directors of investment companies by the 1940 Act. The Board in turn elects the Officers, who are responsible for administering theday-to-day operations of the Fund.
| | | | | | |
| Independent Board Members | | | | |
| | | | |
Name Date of Birth Position(s) Portfolios Overseen | | Principal Occupation(s) During Past Five Years | | Other Directorships
Held During Past Five Years | | Length of
Board Service |
| | | | |
Ellen S. Alberding 3/11/58 Board Member Portfolios Overseen: 96 | | President and Board Member, The Joyce Foundation (charitable foundation) (since 2002); Vice Chair, City Colleges of Chicago (community college system) (2011-2015); Trustee, National Park Foundation (charitable foundation for national park system) (2009-2018); Trustee, Economic Club of Chicago (since 2009); Trustee, Loyola University (since 2018). | | None. | | Since September 2013 |
| | | | |
Kevin J. Bannon 7/13/52 Board Member Portfolios Overseen: 96 | | Retired; Managing Director (April2008-May 2015) and Chief Investment Officer (October 2008-November 2013) of Highmount Capital LLC (registered investment adviser); formerly Executive Vice President and Chief Investment Officer (April 1993-August 2007) of Bank of New York Company; President (May2003-May 2007) of BNY Hamilton Family of Mutual Funds. | | Director of Urstadt Biddle Properties (equity real estate investment trust) (since September 2008). | | Since July 2008 |
PGIM Securitized Credit Fund
| | | | | | |
| Independent Board Members | | | | |
| | | | |
Name Date of Birth Position(s) Portfolios Overseen | | Principal Occupation(s) During Past Five Years | | Other Directorships
Held During Past Five Years | | Length of Board Service |
| | | | |
Linda W. Bynoe 7/9/52 Board Member Portfolios Overseen: 96 | | President and Chief Executive Officer (since March 1995) and formerly Chief Operating Officer (December 1989-February 1995) of Telemat Ltd. (management consulting); formerly Vice President (January 1985-June 1989) at Morgan Stanley & Co. (broker-dealer). | | Director of Anixter International, Inc. (communication products distributor) (since January 2006); Director of Northern Trust Corporation (financial services) (since April 2006); Trustee of Equity Residential (residential real estate) (since December 2009). | | Since March 2005 |
| | | | |
Barry H. Evans 11/2/60 Board Member Portfolios Overseen: 95 | | Retired; formerly President (2005 – 2016), Global Chief Operating Officer (2014–2016), Chief Investment Officer – Global Head of Fixed Income (1998-2014), and various portfolio manager roles (1986-2006), Manulife Asset Management U.S. | | Formerly Director, Manulife Trust Company (2011-2018); formerly Director, Manulife Asset Management Limited (2015-2017); formerly Chairman of the Board of Directors of Manulife Asset Management U.S. (2005-2016); formerly Chairman of the Board, Declaration Investment Management and Research (2008-2016). | | Since September 2017 |
| | | | |
Keith F. Hartstein 10/13/56 Board Member & Independent Chair Portfolios Overseen: 96 | | Retired; Member (since November 2014) of the Governing Council of the Independent Directors Council (organization of independent mutual fund directors); formerly President and Chief Executive Officer (2005-2012), Senior Vice President (2004-2005), Senior Vice President of Sales and Marketing (1997-2004), and various executive management positions (1990-1997), John Hancock Funds, LLC (asset management); Chairman, Investment Company Institute’s Sales Force Marketing Committee (2003-2008). | | None. | | Since September 2013 |
Visit our website at pgiminvestments.com
| | | | | | |
| Independent Board Members | | | | |
| | | | |
Name Date of Birth Position(s) Portfolios Overseen | | Principal Occupation(s) During Past Five Years | | Other Directorships
Held During Past Five Years | | Length of
Board Service |
| | | | |
Laurie Simon Hodrick 9/29/62 Board Member Portfolios Overseen: 95 | | A. Barton Hepburn Professor Emerita of Economics in the Faculty of Business, Columbia Business School (since 2018); Visiting Professor of Law, Stanford Law School (since 2015); Visiting Fellow at the Hoover Institution, Stanford University (since 2015); Sole Member, ReidCourt LLC (since 2008) (a consulting firm); formerly A. Barton Hepburn Professor of Economics in the Faculty of Business, Columbia Business School (1996-2017); formerly Managing Director, Global Head of Alternative Investment Strategies, Deutsche Bank (2006-2008). | | Independent Director, Synnex Corporation (since April 2019) (information technology); Independent Director, Kabbage, Inc. (since July 2018) (financial services); Independent Director, Corporate Capital Trust (2017-2018) (a business development company). | | Since September 2017 |
| | | | |
Michael S. Hyland, CFA 10/4/45 Board Member Portfolios Overseen: 96 | | Retired (since February 2005); formerly Senior Managing Director (July 2001-February 2005) of Bear Stearns & Co, Inc.; Global Partner, INVESCO (1999-2001); Managing Director and President of Salomon Brothers Asset Management (1989-1999). | | None. | | Since July 2008 |
| | | | |
Brian K. Reid 9/22/61 Board Member Portfolios Overseen: 95 | | Retired; formerly Chief Economist for the Investment Company Institute (ICI) (2005-2017); formerly Senior Economist and Director of Industry and Financial Analysis at the ICI (1998-2004); formerly Senior Economist, Industry and Financial Analysis at the ICI (1996-1998); formerly Staff Economist at the Federal Reserve Board (1989-1996); Director, ICI Mutual Insurance Company (2012-2017). | | None. | | Since March 2018 |
PGIM Securitized Credit Fund
| | | | | | |
Independent Board Members | | | | |
| | | | |
Name Date of Birth Position(s) Portfolios Overseen | | Principal Occupation(s) During Past Five Years | | Other Directorships
Held During Past Five Years | | Length of
Board Service |
| | | | |
Grace C. Torres 6/28/59 Board Member Portfolios Overseen: 95 | | Retired; formerly Treasurer and Principal Financial and Accounting Officer of the PGIM Funds, Target Funds, Advanced Series Trust, Prudential Variable Contract Accounts and The Prudential Series Fund (1998-June 2014); Assistant Treasurer (March 1999-June 2014) and Senior Vice President (September 1999-June 2014) of PGIM Investments LLC; Assistant Treasurer (May 2003-June 2014) and Vice President (June 2005-June 2014) of AST Investment Services, Inc.; Senior Vice President and Assistant Treasurer (May 2003-June 2014) of Prudential Annuities Advisory Services, Inc. | | Formerly Director (July 2015-January 2018) of Sun Bancorp, Inc. N.A. and Sun National Bank; Director (since January 2018) of OceanFirst Financial Corp. and OceanFirst Bank. | | Since November 2014 |
| | | | | | |
Interested Board Members | | | | |
| | | | |
Name Date of Birth Position(s) Portfolios Overseen | | Principal Occupation(s) During Past Five Years | | Other Directorships
Held During Past Five Years | | Length of
Board Service |
| | | | |
Stuart S. Parker 10/5/62 Board Member & President Portfolios Overseen: 96 | | President of PGIM Investments LLC (formerly known as Prudential Investments LLC) (since January 2012); Executive Vice President of Prudential Investment Management Services LLC (since December 2012); formerly Executive Vice President of Jennison Associates LLC and Head of Retail Distribution of PGIM Investments LLC (June 2005-December 2011). | | None. | | Since January 2012 |
Visit our website at pgiminvestments.com
| | | | | | |
Interested Board Members | | | | |
| | | | |
Name Date of Birth Position(s) Portfolios Overseen | | Principal Occupation(s) During Past Five Years | | Other Directorships
Held During Past Five Years | | Length of Board Service |
| | | | |
Scott E. Benjamin 5/21/73 Board Member & Vice President Portfolios Overseen: 96 | | Executive Vice President (since June 2009) of PGIM Investments LLC; Executive Vice President (June 2009-June 2012) and Vice President (since June 2012) of Prudential Investment Management Services LLC; Executive Vice President (since September 2009) of AST Investment Services, Inc.; Senior Vice President of Product Development and Marketing, PGIM Investments (since February 2006); formerly Vice President of Product Development and Product Management, PGIM Investments LLC (2003-2006). | | None. | | Since March 2010 |
| | | | |
| Fund Officers(a) | | | | |
| | | |
Name Date of Birth Fund Position | | Principal Occupation(s) During Past Five Years | | Length of Service as Fund Officer |
| | | |
Raymond A. O’Hara 9/11/55 Chief Legal Officer | | Vice President and Corporate Counsel (since July 2010) of Prudential Insurance Company of America (Prudential); Vice President (March 2011-Present) of Pruco Life Insurance Company and Pruco Life Insurance Company of New Jersey; Vice President and Corporate Counsel (March 2011-Present) of Prudential Annuities Life Assurance Corporation; Chief Legal Officer of PGIM Investments LLC (since June 2012); Chief Legal Officer of Prudential Mutual Fund Services LLC (since June 2012) and Corporate Counsel of AST Investment Services, Inc. (since June 2012); formerly Assistant Vice President and Corporate Counsel (September 2008-July 2010) of The Hartford Financial Services Group, Inc.; formerly Associate (September 1980-December 1987) and Partner (January 1988–August 2008) of Blazzard & Hasenauer, P.C. (formerly, Blazzard, Grodd & Hasenauer, P.C.). | | Since June 2012 |
PGIM Securitized Credit Fund
| | | | |
| Fund Officers(a) | | | | |
| | | |
Name Date of Birth Fund Position | | Principal Occupation(s) During Past Five Years | | Length of Service as Fund Officer |
| | | |
Dino Capasso 8/19/74 Chief Compliance Officer | | Chief Compliance Officer (July 2019-Present) of PGIM Investments LLC; Chief Compliance Officer (July 2019-Present) of the PGIM Funds, Target Funds, Advanced Series Trust, The Prudential Series Fund, Prudential’s Gibraltar Fund, Inc., PGIM Global High Yield Fund, Inc., and PGIM High Yield Bond Fund, Inc.; Vice President and Deputy Chief Compliance Officer (June 2017-2019) of PGIM Investments LLC; formerly, Senior Vice President and Senior Counsel (January 2016-June 2017), and Vice President and Counsel (February 2012-December 2015) of Pacific Investment Management Company LLC. | | Since March 2018 |
| | | |
Andrew R. French 12/22/62 Secretary | | Vice President of PGIM Investments LLC (December 2018-Present); formerly Vice President and Corporate Counsel (February 2010-December 2018) of Prudential; formerly Director and Corporate Counsel (2006-2010) of Prudential; Vice President and Assistant Secretary (since January 2007) of PGIM Investments LLC; Vice President and Assistant Secretary (since January 2007) of Prudential Mutual Fund Services LLC. | | Since October 2006 |
| | | |
Jonathan D. Shain 8/9/58 Assistant Secretary | | Vice President and Corporate Counsel (since August 1998) of Prudential; Vice President and Assistant Secretary (since May 2001) of PGIM Investments LLC; Vice President and Assistant Secretary (since February 2001) of Prudential Mutual Fund Services LLC; formerly Vice President and Assistant Secretary (May 2003-June 2005) of AST Investment Services, Inc. | | Since May 2005 |
| | | |
Claudia DiGiacomo 10/14/74 Assistant Secretary | | Vice President and Corporate Counsel (since January 2005) of Prudential; Vice President and Assistant Secretary of PGIM Investments LLC (since December 2005); formerly Associate at Sidley Austin Brown & Wood LLP (1999-2004). | | Since December 2005 |
| | | |
Diana N. Huffman 4/14/82 Assistant Secretary | | Vice President and Corporate Counsel (since September 2015) of Prudential; formerly Associate at Willkie Farr & Gallagher LLP (2009-2015). | | Since March 2019 |
| | | |
Kelly A. Coyne 8/8/68 Assistant Secretary | | Director, Investment Operations of Prudential Mutual Fund Services LLC (since 2010). | | Since March 2015 |
| | | |
Christian J. Kelly 5/5/75 Treasurer and Principal Financial
and Accounting Officer | | Vice President, Head of Fund Administration of PGIM Investments LLC (since November 2018); formerly, Director of Fund Administration of Lord Abbett & Co. LLC (2009-2018), Treasurer and Principal Accounting Officer of the Lord Abbett Family of Funds (2017-2018); Director of Accounting, Avenue Capital Group (2008-2009); Senior Manager, Investment Management Practice of Deloitte & Touche LLP (1998-2007). | | Since January 2019 |
Visit our website at pgiminvestments.com
| | | | |
| Fund Officers(a) | | | | |
| | | |
Name Date of Birth Fund Position | | Principal Occupation(s) During Past Five Years | | Length of Service as Fund Officer |
| | | |
Lana Lomuti 6/7/67 Assistant Treasurer | | Vice President (since 2007) and Director (2005-2007), within PGIM Investments Fund Administration; formerly Assistant Treasurer (December 2007-February 2014) of The Greater China Fund, Inc. | | Since April 2014 |
| | | |
Russ Shupak 10/08/73 Assistant Treasurer | | Vice President (since 2017) and Director (2013-2017), within PGIM Investments Fund Administration. | | Since October 2019 |
| | | |
Deborah Conway 3/26/69 Assistant Treasurer | | Vice President (since 2017) and Director (2007-2017), within PGIM Investments Fund Administration. | | Since October 2019 |
| | | |
Elyse M. McLaughlin 1/20/74 Assistant Treasurer | | Vice President (since 2017) and Director (2011-2017), within PGIM Investments Fund Administration. | | Since October 2019 |
| | | |
Charles H. Smith 1/11/73 Anti-Money Laundering Compliance Officer | | Vice President, Corporate Compliance, Anti-Money Laundering Unit (since January 2015) of Prudential; committee member of the American Council of Life Insurers Anti-Money Laundering and Critical Infrastructure Committee (since January 2016); formerly Global Head of Economic Sanctions Compliance at AIG Property Casualty (February 2007-December 2014); Assistant Attorney General at the New York State Attorney General’s Office, Division of Public Advocacy. (August 1998-January 2007). | | Since January 2017 |
(a)Excludes Mr. Parker and Mr. Benjamin, interested Board Members who also serve as President and Vice President, respectively.
Explanatory Notes to Tables:
| ∎ | | Board Members are deemed to be “Interested,” as defined in the 1940 Act, by reason of their affiliation with PGIM Investments LLC and/or an affiliate of PGIM Investments LLC. |
| ∎ | | Unless otherwise noted, the address of all Board Members and Officers is c/o PGIM Investments LLC, 655 Broad Street, Newark, New Jersey 07102-4410. |
| ∎ | | There is no set term of office for Board Members or Officers. The Board Members have adopted a retirement policy, which calls for the retirement of Board Members on December 31 of the year in which they reach the age of 75. |
| ∎ | | “Other Directorships Held” includes only directorships of companies required to register or file reports with the SEC under the 1934 Act (that is, “public companies”) or other investment companies registered under the 1940 Act. |
| ∎ | | “Portfolios Overseen” includes all investment companies managed by PGIM Investments LLC. The investment companies for which PGIM Investments LLC serves as manager include the PGIM Funds, The Prudential Variable Contract Accounts, PGIM ETF Trust, PGIM High Yield Bond Fund, Inc., PGIM Global High Yield Fund, Inc., The Prudential Series Fund, Prudential’s Gibraltar Fund, Inc. and the Advanced Series Trust. |
PGIM Securitized Credit Fund
Approval of Advisory Agreements(unaudited)
Initial Approval of the Fund’s Advisory Agreements
As required by the Investment Company Act of 1940 (the 1940 Act), the Board of Prudential Investment Portfolios 8 considered the proposed management agreement with PGIM Investments LLC (the Manager) and the proposed subadvisory agreement between the Manager and PGIM Fixed Income and PGIM Ltd (referred to herein as the Subadviser), which will subadvise the PGIM Securitized Credit Fund (the Fund), prior to the Fund’s commencement of operations. The Board, including all of the Independent Trustees, met on March 6, 2019 (the Meeting) and approved the agreements for an initialtwo-year period, after concluding that approval of the agreements was in the best interests of the Fund.
In advance of the Meeting, the Board requested and received materials relating to the agreements, and had the opportunity to ask questions and request further information in connection with its considerations.
In approving the agreements, the Board, including the Independent Trustees advised by independent legal counsel, considered the factors it deemed relevant, including the nature, quality and extent of services to be provided to the Fund by the Manager and the Subadviser; any relevant comparable performance and the Subadviser’s qualifications and track record in serving other affiliated mutual funds; and the fees proposed to be paid by the Fund to the Manager and by the Manager to the Subadviser under the agreements. In connection with its deliberations, the Board considered information provided by the Manager and the Subadviser at or in advance of the Meeting. The Board also considered information provided by the Manager with respect to other funds managed by the Manager and the Subadviser, which information had been provided throughout the year at regular Board meetings. In their deliberations, the Trustees did not identify any single factor which alone was responsible for the Board’s decision to approve the agreements with respect to the Fund.
The Trustees determined that the overall arrangements between the Fund and the Manager, which will serve as the Fund’s investment manager pursuant to a management agreement, and between the Manager and the Subadviser, which will serve as the Fund’s subadviser pursuant to the terms of a subadvisory agreement, were in the best interests of the Fund in light of the services to be performed and the fees to be charged under the agreements and such other matters as the Trustees considered relevant in the exercise of their business judgment.
The material factors and conclusions that formed the basis for the Trustees’ reaching their determinations to approve the agreements are separately discussed below.
| | |
| PGIM Securitized Credit Fund |
Approval of Advisory Agreements (continued)
Nature, Quality and Extent of Services
With respect to the Manager, the Board noted that it had received and considered information about the Manager at the June19-21, 2018 meetings (the June 2018 Meetings) in connection with the renewal of the investment management agreements between the Manager and the other PGIM Investments Funds, and that the Manager provided a representation that there were no material changes to such information. The Board also noted that it received and considered information at other regular meetings throughout the year of the PGIM Investments Funds, regarding the nature, quality and extent of services provided by the Manager, including but not limited to the oversight of the Subadviser, as well as the provision of fund recordkeeping, compliance and other services to the Fund. With respect to the Manager’s oversight of the Subadviser, the Board noted that the Manager’s Strategic Investment Research Group, which is a business unit of the Manager, is responsible for monitoring and reporting to the Manager’s senior management on the performance and operations of the Subadviser. The Board also considered that the Manager pays the salaries of all of the officers and interested Trustees of the Fund who are part of Fund management. The Board reviewed the qualifications, backgrounds and responsibilities of the Manager’s senior management responsible for the oversight of the Fund and the Subadviser, and was also provided with information pertaining to the Manager’s organizational structure, senior management, investment operations and other relevant information pertaining to the Manager. The Board noted that it received favorable compliance reports from the Fund’s Chief Compliance Officer as to the Manager. The Board noted that it had concluded that it was satisfied with the nature, quality and extent of the services provided by the Manager to the other PGIM Investments Funds and determined that it was reasonable to conclude that the nature, quality and extent of services to be provided by the Manager under the management agreement for the Fund would be similar in nature to those provided under the other management agreements.
With respect to the Subadviser, the Board noted that it had received and considered information about the Subadviser at the June 2018 Meeting in connection with the renewal of the subadvisory agreements between the Manager and the Subadviser with respect to other PGIM Investments Funds. The Board also noted that it received and considered information at other regular meetings throughout the year, regarding the nature, quality and extent of services provided by the Subadviser. The Board considered, among other things, the qualifications, background and experience of the Subadviser’s portfolio managers who will be responsible for theday-to-day management of the Fund’s portfolio, as well as information on the organizational structure, senior management, investment operations and other relevant information pertaining to the Subadviser. The Board further noted that it received favorable compliance reports from the Fund’s Chief Compliance Officer as to the Subadviser. The Board noted that the Subadviser is affiliated with the Manager. The Board noted that it had concluded that it was satisfied with the nature, quality and extent of
| | |
| Visit our website at pgiminvestments.com | | |
services provided by the Subadviser with respect to the other PGIM Investments Funds served by the Subadviser and determined that it was reasonable to conclude that the nature, quality and extent of services to be provided by the Subadviser under the subadvisory agreement for the Fund would be similar in nature to those provided under the other subadvisory agreements.
Performance
Because the Fund had not yet commenced operations, no investment performance for the Fund existed for Board review. The Board considered the historical performance information of an investment trust (the “Predecessor Fund”) managed by the Subadviser since its inception (using the same portfolio management team). The Board considered that before the Fund commences operations, all of the assets and liabilities of the Predecessor Fund will be transferred to the Fund in a reorganization (the “Reorganization”), which is expected to take place on or about July 1, 2019. The Board took note that the Predecessor Fund commenced operations on November 16, 2015 and that the investment objective and strategies of the Predecessor Fund were, in all material respects, the same as those of the Fund. The Board also considered that the Predecessor Fund was managed in a manner that, in all material respects, complied with the investment guidelines and restrictions of the Fund. It was noted that the Predecessor Fund was not registered as an investment company under the 1940 Act and the Predecessor Fund was not subject to certain investment limitations, diversification requirements, liquidity requirements, and other restrictions imposed by the 1940 Act and the Internal Revenue Code of 1986 which, if applicable, may have resulted in different performance.
The Board considered the background and professional experience of the proposed portfolio management team for the Fund. The Manager will provide information relating to performance to the Board in connection with future annual reviews of the management agreement and subadvisory agreement.
Fee Rates
The Board considered the proposal that the Fund will pay PGIM Investments at the rate of 0.60% of the Fund’s average daily net assets up to $2.5 billion; 0.55% of the Fund’s average daily net assets from $2.5 billion to $5 billion; and 0.50% of the Fund’s average daily net assets over $5 billion for all share classes. The Fund’s other expenses will include fees for custodian services, independent Trustees’ andNon-Management Interested Trustees’ fees, and fees for legal, accounting, valuation, and transfer agency services.
The Board considered the management fee for the Fund as compared to the management fee charged by PGIM Investments to other funds and the fee charged by the Predecessor
| | |
| PGIM Securitized Credit Fund |
Approval of Advisory Agreements (continued)
Fund. The Board considered information comparing the Fund’s proposed management fee rate and total expenses for Class Z shares to the peer group of comparable funds objectively chosen by Broadridge (the “Peer Group”), an independent provider of mutual fund data. The Board noted that the Fund’s management fee was in the first quartile of the Broadridge Peer Group (first quartile being the lowest fee). The Board further noted that anticipated net total expenses for Class Z shares were in the first quartile of the Broadridge Peer Group (first quartile being the lowest expenses).
The Board noted that the Manager has contractually agreed, through January 31, 2021, to limit Total Annual Fund Operating Expenses after fee waivers and/or reimbursements to 0.90% of average daily net assets for Class A shares, 1.65% of average daily net assets for Class C shares, 0.65% of average daily net assets for Class Z shares and 0.60% of average daily net assets for Class R6 shares. This contractual waiver excludes interest, brokerage, taxes (such as income and foreign withholding taxes, stamp duty and deferred tax expenses), acquired fund fees and expenses, extraordinary expenses, and certain other Fund expenses such as dividend and interest expense and broker charges on short sales. The Board also noted that where applicable, PGIM Investments agrees to waive management fees or shared operating expenses on any share class to the same extent that it waives similar expenses on any other share class and in addition, that Total Annual Fund Operating Expenses for Class R6 shares will not exceed Total Annual Fund Operating Expenses for Class Z shares.
Profitability
Because the Fund had not yet commenced operations and the actual asset base of the Fund has not yet been determined, the Board noted that there was no historical profitability information with respect to the Fund to be reviewed. The Board noted that the Subadviser was affiliated with the Manager and, as a result, the Board will not separately consider the Subadviser’s profitability since its profitability will be reflected in the Manager’s profitability report. The Board noted that it would review profitability information in connection with the annual renewal of the management and subadvisory agreements.
Economies of Scale
The Board noted that the proposed management fees payable by the Fund to the Manager contained breakpoints that would reduce the fee rates on assets above specified levels, as did the subadvisory fee payable by the Manager to the Subadviser. The Board considered the potential for the Manager and the Subadviser to experience economies of scale as the amount of assets managed by the Manager and the Subadviser, respectively, increased in size. Because the Fund had not yet commenced operations and the actual asset base of the Fund has not yet been determined, the Board noted that there was no historical
| | |
| Visit our website at pgiminvestments.com | | |
information regarding economies of scale with respect to the Fund to be reviewed. The Board noted that it would review such information in connection with the annual renewals of the management and subadvisory agreements.
Other Benefits to the Manager and the Subadviser
The Board considered potential“fall-out” or ancillary benefits that might be received by the Manager, the Subadviser and their affiliates as a result of their relationship with the Fund. The Board concluded that any potential benefits to be derived by the Manager were similar to benefits derived by the Manager in connection with its management of the other PGIM Investments Funds managed by the Manager (e.g., included transfer agency fees to be received by the Fund’s transfer agent (which is affiliated with PGIM Investments), and benefits to its reputation as well as other intangible benefits resulting from PGIM Investments’ association with the Fund), which are reviewed on an annual basis. The Board also concluded that any potential benefits to be derived by the Subadviser (e.g., its ability to use soft dollar credits, as well as the potential benefits consistent with those generally resulting from an increase in assets under management, specifically, potential access to additional research resources and benefits to its reputation) were consistent with those generally derived by subadvisers to the PGIM Investments Funds, and that those benefits are reviewed on an annual basis. The Board concluded that any potential benefits that may be derived by the Manager and the Subadviser were consistent with the types of benefits generally derived by investment managers and subadvisers to mutual funds.
* * *
After full consideration of these factors, the Board concluded that the approval of the agreements was in the best interests of the Fund.
| | |
| PGIM Securitized Credit Fund |
| | | | |
| | |
| ∎ MAIL | | ∎ TELEPHONE | | ∎ WEBSITE |
655 Broad Street Newark, NJ 07102 | | (800) 225-1852 | | pgiminvestments.com |
|
| PROXY VOTING |
| The Board of Trustees of the Fund has delegated to the Fund’s subadviser the responsibility for voting any proxies and maintaining proxy recordkeeping with respect to the Fund. A description of these proxy voting policies and procedures is available without charge, upon request, by calling (800) 225-1852. Information regarding how the Fund voted proxies relating to portfolio securities during the most recent 12-month period ended June 30 is available on the Fund’s website and on the Securities and Exchange Commission’s website. |
|
| TRUSTEES |
| Ellen S. Alberding• Kevin J. Bannon• Scott E. Benjamin• Linda W. Bynoe• Barry H. Evans• Keith F. Hartstein• Laurie Simon Hodrick• Michael S. Hyland• Stuart S. Parker• Brian K. Reid• Grace C. Torres |
|
| OFFICERS |
| Stuart S. Parker,President• Scott E. Benjamin,Vice President• Christian J. Kelly,Treasurer and Principal Financial and Accounting Officer• Raymond A. O’Hara,Chief Legal Officer• Dino Capasso,Chief Compliance Officer • Charles H. Smith,Anti-Money Laundering Compliance Officer • Andrew R. French,Secretary • Jonathan D. Shain,Assistant Secretary• Claudia DiGiacomo,Assistant Secretary • Diana N. Huffman,Assistant Secretary•Kelly A. Coyne,Assistant Secretary• Lana Lomuti,Assistant Treasurer• Russ Shupak,Assistant Treasurer• Elyse McLaughlin,Assistant Treasurer• Deborah Conway,Assistant Treasurer |
| | | | |
| MANAGER | | PGIM Investments LLC | | 655 Broad Street Newark, NJ 07102 |
|
| SUBADVISER | | PGIM Fixed Income | | 655 Broad Street Newark, NJ 07102 |
|
| DISTRIBUTOR | | Prudential Investment Management Services LLC | | 655 Broad Street Newark, NJ 07102 |
|
| CUSTODIAN | | The Bank of New York Mellon | | 240 Greenwich Street New York, NY 10286 |
|
| TRANSFER AGENT | | Prudential Mutual Fund Services LLC | | PO Box 9658 Providence, RI 02940 |
|
| INDEPENDENT REGISTERED PUBLIC ACCOUNTING FIRM | | KPMG LLP | | 345 Park Avenue New York, NY 10154 |
|
| FUND COUNSEL | | Willkie Farr & Gallagher LLP | | 787 Seventh Avenue New York, NY 10019 |
|
|
| An investor should consider the investment objectives, risks, charges, and expenses of the Fund carefully before investing. The prospectus and summary prospectus contain this and other information about the Fund. An investor may obtain the prospectus and summary prospectus by visiting our website atpgiminvestments.com or by calling (800) 225-1852. The prospectus and summary prospectus should be read carefully before investing. |
|
| E-DELIVERY |
| To receive your mutual fund documents online, go topgiminvestments.com/edelivery and enroll. Instead of receiving printed documents by mail, you will receive notification via email when new materials are available. You can cancel your enrollment or change your email address at any time by visiting the website address above. |
|
| SHAREHOLDER COMMUNICATIONS WITH TRUSTEES |
| Shareholders can communicate directly with the Board of Trustees by writing to the Chair of the Board, PGIM Securitized Credit Fund, PGIM Investments, Attn: Board of Trustees, 655 Broad Street, Newark, NJ 07102. Shareholders can communicate directly with an individual Trustee by writing to the same address. Communications are not screened before being delivered to the addressee. |
|
| AVAILABILITY OF PORTFOLIO HOLDINGS |
| The Fund files its complete schedule of portfolio holdings with the Securities and Exchange Commission on Form N-PORT. The Fund’s Form N-PORT filings are available on the Commission’s website at sec.gov. Form N-PORT is filed with the Commission quarterly, and each Fund’s full portfolio holdings as of the first and third fiscal quarter-ends (as of the third month of the Fund’s fiscal quarter for reporting periods on or after September 30, 2019) will be made publicly available 60 days after the end of each quarter at sec.gov. |
|
| The Fund’s Statement of Additional Information contains additional information about the Fund’s Trustees and is available without charge, upon request, by calling (800) 225-1852. |
Mutual Funds:
| | | | |
| ARE NOT INSURED BY THE FDIC OR ANY FEDERAL GOVERNMENT AGENCY | | MAY LOSE VALUE | | ARE NOT A DEPOSIT OF OR GUARANTEED
BY ANY BANK OR ANY BANK AFFILIATE |
PGIM SECURITIZED CREDIT FUND
| | | | | | | | |
| SHARE CLASS | | A | | C | | Z | | R6 |
| NASDAQ | | SCFOX | | SCFVX | | SCFZX | | SCFQX |
| CUSIP | | 74441F801 | | 74441F884 | | 74441F876 | | 74441F868 |
MF241E
Item 2 – Code of Ethics — See Exhibit (a)
As of the end of the period covered by this report, the registrant has adopted a code of ethics (the “Section 406 Standards for Investment Companies – Ethical Standards for Principal Executive and Financial Officers”) that applies to the registrant’s Principal Executive Officer and Principal Financial Officer; the registrant’s Principal Financial Officer also serves as the Principal Accounting Officer.
The registrant hereby undertakes to provide any person, without charge, upon request, a copy of the code of ethics. To request a copy of the code of ethics, contact the registrant800-225-1852, and ask for a copy of the Section 406 Standards for Investment Companies - Ethical Standards for Principal Executive and Financial Officers.
Item 3 – Audit Committee Financial Expert –
The registrant’s Board has determined that Mr. Kevin J. Bannon, member of the Board’s Audit Committee is an “audit committee financial expert,” and that he is “independent,” for purposes of this Item.
Item 4 – Principal Accountant Fees and Services – (a) Audit Fees
For the fiscal years ended September 30, 2019 and September 30, 2018, KPMG LLP (“KPMG”), the Registrant’s principal accountant, billed the Registrant $75,514 and $24,352 respectively, for professional services rendered for the audit of the Registrant’s annual financial statements or services that are normally provided in connection with statutory and regulatory filings.
(b) Audit-Related Fees
For the fiscal years ended September 30, 2019 and September 30, 2018: none.
(c) Tax Fees
For the fiscal years ended September 30, 2019 and September 30, 2018: none.
(d)All Other Fees
For the fiscal years ended September 30, 2019 and September 30, 2018: none.
(e) (1)Audit CommitteePre-Approval Policies and Procedures
THE PGIM MUTUAL FUNDS
AUDIT COMMITTEE POLICY
on
Pre-Approval of Services Provided by the Independent
Accountants
The Audit Committee of each PGIM Mutual Fund is charged with the responsibility to monitor the independence of the Fund’s independent accountants. As part of this responsibility, the Audit Committee mustpre-approve the independent accounting firm’s engagement to render audit and/or permissiblenon-audit services, as required by law. In evaluating a
proposed engagement of the independent accountants, the Audit Committee will assess the effect that the engagement might reasonably be expected to have on the accountant’s independence. The Committee’s evaluation will be based on:
| | • | | a review of the nature of the professional services expected to be provided, |
| | • | | a review of the safeguards put into place by the accounting firm to safeguard independence, and |
| | • | | periodic meetings with the accounting firm. |
Policy for Audit andNon-Audit Services Provided to the Funds
On an annual basis, the scope of audits for each Fund, audit fees and expenses, and audit-related andnon-audit services (and fees proposed in respect thereof) proposed to be performed by the Fund’s independent accountants will be presented by the Treasurer and the independent accountants to the Audit Committee for review and, as appropriate, approval prior to the initiation of such services.
Such presentation shall be accompanied by confirmation by both the Treasurer and the independent accountants that the proposednon-audit services will not adversely affect the independence of the independent accountants. Such proposednon-audit services shall be described in sufficient detail to enable the Audit Committee to assess the appropriateness of such services and fees, and the compatibility of the provision of such services with the auditor’s independence. The Committee shall receive periodic reports on the progress of the audit and other services which are approved by the Committee or by the Committee Chair pursuant to authority delegated in this Policy.
The categories of services enumerated under “Audit Services”, “Audit-related Services”, and “Tax Services” are intended to provide guidance to the Treasurer and the independent accountants as to those categories of services which the Committee believes are generally consistent with the independence of the independent accountants and which the Committee (or the Committee Chair) would expect upon the presentation of specific proposals topre-approve. The enumerated categories are not intended as an exclusive list of audit, audit-related or tax services, which the Committee (or the Committee Chair) would consider forpre-approval.
Audit Services
The following categories of audit services are considered to be consistent with the role of the Fund’s independent accountants:
| | • | | Annual Fund financial statement audits |
| | • | | Seed audits (related to new product filings, as required) |
| | • | | SEC and regulatory filings and consents |
Audit-related Services
The following categories of audit-related services are considered to be consistent with the role of the Fund’s independent accountants:
| | • | | Accounting consultations |
| | • | | Fund merger support services |
| | • | | Agreed Upon Procedure Reports |
| | • | | Other Internal Control Reports |
Individual audit-related services that fall within one of these categories (except for fund merger support services) and are not presented to the Audit Committee as part of the annualpre-approval process are subject to an authorizedpre-approval by the Audit Committee so long as the estimated fee for those services does not exceed $30,000. Any services provided under suchpre-approval will be reported to the Audit Committee at its next regular meeting. Should the amount of such services exceed $30,000 any additional fees will be subject topre-approval by the Committee Chair (or any other Committee member on whom this responsibility has been delegated). Fees related to fund merger support services are subject to a separate authorizedpre-approval by the Audit Committee with fees determined on a per occurrence and merger complexity basis.
Tax Services
The following categories of tax services are considered to be consistent with the role of the Fund’s independent accountants:
| | • | | Tax compliance services related to the filing or amendment of the following: |
| | • | | Federal, state and local income tax compliance; and, |
| | • | | Sales and use tax compliance |
| | • | | Timely RIC qualification reviews |
| | • | | Tax distribution analysis and planning |
| | • | | Tax authority examination services |
| | • | | Tax appeals support services |
| | • | | Accounting methods studies |
| | • | | Fund merger support services |
| | • | | Tax consulting services and related projects |
Individual tax services that fall within one of these categories and are not presented to the Audit Committee as part of the annualpre-approval process are subject to an authorizedpre-approval by the Audit Committee so long as the estimated fee for those services does not exceed $30,000. Any services provided under suchpre-approval will be reported to the Audit Committee at its next regular meeting. Should the amount of such services exceed $30,000 any additional fees will be subject topre-approval by the Committee Chair (or any other Committee member on whom this responsibility has been delegated).
OtherNon-Audit Services
Certainnon-audit services that the independent accountants are legally permitted to render will be subject topre-approval by the Committee or by one or more Committee members to whom the Committee has delegated this authority and who will report to the full Committee anypre-approval decisions made pursuant to this Policy.Non-audit services presented forpre-approval pursuant to this paragraph will be accompanied by a confirmation from both the Treasurer and the independent accountants that the proposed services will not adversely affect the independence of the independent accountants.
Proscribed Services
The Fund’s independent accountants will not render services in the following categories ofnon-audit services:
| | • | | Bookkeeping or other services related to the accounting records or financial statements of the Fund |
| | • | | Financial information systems design and implementation |
| | • | | Appraisal or valuation services, fairness opinions, orcontribution-in-kind reports |
| | • | | Internal audit outsourcing services |
| | • | | Management functions or human resources |
| | • | | Broker or dealer, investment adviser, or investment banking services |
| | • | | Legal services and expert services unrelated to the audit |
| | • | | Any other service that the Public Company Accounting Oversight Board determines, by regulation, is impermissible. |
Pre-approval ofNon-Audit Services Provided to Other Entities Within the PGIM Fund Complex
Certainnon-audit services provided to PGIM Investments LLC or any of its affiliates that also provide ongoing services to the PGIM Mutual Funds will be subject topre-approval by the Audit Committee. The onlynon-audit services provided to these entities that will requirepre-approval are thoserelated directly to the operations and financial reporting of the Funds. Individual projects that are not presented to the Audit Committee as part of the annualpre-approval process will be subject topre-approval by the Committee Chair (or any other Committee member on whom this responsibility has been delegated) so long as the estimated fee for those services does not exceed $30,000. Services presented forpre-approval pursuant to this paragraph
will be accompanied by a confirmation from both the Treasurer and the independent accountants that the proposed services will not adversely affect the independence of the independent accountants.
Although the Audit Committee will notpre-approve all services provided to PGIM Investments LLC and its affiliates, the Committee will receive an annual report from the Fund’s independent accounting firm showing the aggregate fees for all services provided to PGIM Investments and its affiliates.
(e) (2)Percentage of services referred to in 4(b) – 4(d) that were approved by the audit committee– For the fiscal years ended September 30, 2019 and September 30, 2018:
none.
(f)Percentage of hours expended attributable to work performed by other than full time employees of principal accountant if greaterthan 50%.
The percentage of hours expended on the principal accountant’s engagement to audit the registrant’s financial statements for the most recent fiscal year that were attributed to work performed by persons other than the principal accountant’s full-time, permanent employees was 0%.
(g)Non-Audit Fees
The aggregatenon-audit fees billed by KPMG for services rendered to the registrant’s investment adviser and any entity controlling, controlled by, or under common control with the investment adviser that provides ongoing services to the registrant for the fiscal years ended September 30, 2019 and September 30, 2018 was $0 and $0, respectively.
(h)Principal Accountant’s Independence
Not applicable as KPMG has not providednon-audit services to the registrant’s investment adviser and any entity controlling, controlled by, or under common control with the investment adviser that provides ongoing services to the registrant that were notpre-approved pursuant to Rule2-01(c)(7)(ii) of RegulationS-X.
Item 5 – Audit Committee of Listed Registrants –
The registrant has a separately designated standing audit committee (the “Audit Committee”) established in accordance with Section 3(a)(58)(A) of the Securities Exchange Act of 1934. The members of the Audit Committee are Kevin J. Bannon (chair), Laurie Simon Hodrick, Michael S. Hyland, CFA, Brian K. Reid, and Keith F. Hartstein(ex-officio).
Item 6 – Schedule of Investments – The schedule is included as part of the report to shareholders filed under Item 1 of this Form.
Item 7 – Disclosure of Proxy Voting Policies and Procedures forClosed-End Management Investment Companies – Not applicable.
| Item 8 – | Portfolio Managers ofClosed-End Management Investment Companies – Not applicable. |
| Item 9 – | Purchases of Equity Securities byClosed-End Management Investment Company and Affiliated Purchasers – Not applicable. |
| Item 10 – | Submission of Matters to a Vote of Security Holders – There have been no material changes to these procedures. |
| Item 11 – | Controls and Procedures |
| | (a) | It is the conclusion of the registrant’s principal executive officer and principal financial officer that the effectiveness of the registrant’s current disclosure controls and procedures (such disclosure controls and procedures having been evaluated within 90 days of the date of this filing) provide reasonable assurance that the information required to be disclosed by the registrant has been recorded, processed, summarized and |
| | reported within the time period specified in the Commission’s rules and forms and that the information required to be disclosed by the registrant has been accumulated and communicated to the registrant’s principal executive officer and principal financial officer in order to allow timely decisions regarding required disclosure. |
| | (b) | There has been no significant change in the registrant’s internal control over financial reporting that occurred during the registrant’s most recent fiscal quarter of the period covered by this report that has materially affected, or is likely to materially affect, the registrant’s internal control over financial reporting. |
Item 12 – Controls and Procedures - Disclosure of Securities Lending Activities forClosed-End Management Investment Companies – Not applicable.
| | (a) | (1) Code of Ethics – Attached hereto as ExhibitEX-99.CODE-ETH |
| | (2) | Certifications pursuant to Section 302 of the Sarbanes-Oxley Act – Attached hereto as ExhibitEX-99.CERT. |
| | (3) | Any written solicitation to purchase securities under Rule23c-1. – Not applicable. |
| | (b) | Certifications pursuant to Section 906 of the Sarbanes-Oxley Act – Attached hereto as ExhibitEX-99.906CERT. |
SIGNATURES
Pursuant to the requirements of the Securities Exchange Act of 1934 and the Investment Company Act of 1940, the registrant has duly caused this report to be signed on its behalf by the undersigned, thereunto duly authorized.
| | |
| Registrant: | | Prudential Investment Portfolios 8 |
| |
| By: | | /s/ Andrew R. French |
| | Andrew R. French |
| | Secretary |
| |
| Date: | | November 15, 2019 |
Pursuant to the requirements of the Securities Exchange Act of 1934 and the Investment Company Act of 1940, this report has been signed below by the following persons on behalf of the registrant and in the capacities and on the dates indicated.
| | |
| By: | | /s/ Stuart S. Parker |
| | Stuart S. Parker |
| | President and Principal Executive Officer |
| |
| Date: | | November 15, 2019 |
| |
| By: | | /s/ Christian J. Kelly |
| | Christian J. Kelly |
| | Treasurer and Principal Financial and Accounting Officer |
| |
| Date: | | November 15, 2019 |