UNITED STATES
SECURITIES AND EXCHANGE COMMISSION
Washington, D.C. 20549
FORM N-CSR
CERTIFIED SHAREHOLDER REPORT OF REGISTERED MANAGEMENT INVESTMENT COMPANIES
| | |
| Investment Company Act file number: | | 811-06677 |
| |
| Exact name of registrant as specified in charter: | | Prudential Investment Portfolios 8 |
| |
| Address of principal executive offices: | | 655 Broad Street, 6th Floor |
| | Newark, New Jersey 07102 |
| |
| Name and address of agent for service: | | Andrew R. French |
| | 655 Broad Street, 6th Floor |
| | Newark, New Jersey 07102 |
| |
| Registrant’s telephone number, including area code: | | 800-225-1852 |
| |
| Date of fiscal year end: | | 9/30/2022 |
| |
| Date of reporting period: | | 9/30/2022 |
Item 1 – Reports to Stockholders

PGIM QUANT SOLUTIONS STOCK INDEX FUND
ANNUAL REPORT
SEPTEMBER 30, 2022

To enroll in e-delivery, go to pgim.com/investments/resource/edelivery
Table of Contents
This report is not authorized for distribution to prospective investors unless preceded or accompanied by a current prospectus.
The views expressed in this report and information about the Fund’s portfolio holdings are for the period covered by this report and are subject to change thereafter.
Mutual funds are distributed by Prudential Investment Management Services LLC, a Prudential Financial company and member SIPC. PGIM Quantitative Solutions is the primary business name of PGIM Quantitative Solutions LLC, a wholly owned subsidiary of PGIM, Inc. (PGIM), a registered investment adviser and Prudential Financial company. © 2022 Prudential Financial, Inc. and its related entities. PGIM and the PGIM logo are service marks of Prudential Financial, Inc. and its related entities, registered in many jurisdictions worldwide.
2 Visit our website at pgim.com/investments
Letter from the President
| | |
 | | Dear Shareholder: We hope you find the annual report for the PGIM Quant Solutions Stock Index Fund informative and useful. The report covers performance for the 12-month period that ended September 30, 2022. The attention of the global economy and financial markets pivoted during the period from the COVID-19 pandemic to the challenge of rapidly rising inflation. While job growth and corporate profits remained strong, prices for a wide range of goods and services rose in response to economic re-openings, supply-chain disruptions, governmental stimulus, and Russia’s invasion of Ukraine. With inflation surging to a 40-year high, the US Federal Reserve and other central banks aggressively hiked interest rates, prompting recession concerns. |
After rising to record levels at the end of 2021, stocks have fallen sharply in 2022 as investors worried about higher prices, slowing economic growth, geopolitical uncertainty, and new COVID-19 outbreaks. Equities rallied for a time during the summer but began falling again in late August on fears that the Fed would keep raising rates to tame inflation. For the entire 12-month period, equities suffered a broad-based global decline, although large-cap US stocks outperformed their small-cap counterparts by a significant margin. International developed and emerging markets trailed the US market during this time.
Rising rates and economic uncertainty drove fixed income prices broadly lower as well. US and global investment-grade bonds, along with US high yield corporate bonds and emerging market debt, all posted negative returns during the period.
Regarding your investments with PGIM, we believe it is important to maintain a diversified portfolio of funds consistent with your tolerance for risk, time horizon, and financial goals. Your financial advisor can help you create a diversified investment plan that may include funds covering all the basic asset classes and that reflects your personal investor profile and risk tolerance. However, diversification and asset allocation strategies do not assure a profit or protect against loss in declining markets.
At PGIM Investments, we provide access to active investment strategies across the global markets in the pursuit of consistent outperformance for investors. PGIM is the world’s 11th-largest investment manager with more than $1.5 trillion in assets under management. Our scale and investment expertise allow us to deliver a diversified suite of actively managed solutions across a broad spectrum of asset classes and investment styles.
Thank you for choosing our family of funds.
Sincerely,

Stuart S. Parker, President
PGIM Quant Solutions Stock Index Fund
November 15, 2022
PGIM Quant Solutions Stock Index Fund 3
Your Fund’s Performance (unaudited)
Performance data quoted represent past performance. Past performance does not guarantee future results. The investment return and principal value of an investment will fluctuate so that an investor’s shares, when redeemed, may be worth more or less than their original cost. Current performance may be lower or higher than the past performance data quoted. An investor may obtain performance data as of the most recent month-end by visiting our website at pgim.com/investments or by calling (800) 225-1852.
| | | | | | | | |
| |
| | | Average Annual Total Returns as of 9/30/22 |
| | | One Year (%) | | Five Years (%) | | Ten Years (%) | | Since Inception (%) |
| | | | |
Class A | | | | | | | | |
| | | | |
(with sales charges) | | -18.64 | | 7.99 | | 10.78 | | — |
| | | | |
(without sales charges) | | -15.91 | | 8.70 | | 11.14 | | — |
| | | | |
Class C | | | | | | | | |
| | | | |
(with sales charges) | | -17.23 | | 7.98 | | 10.43 | | — |
| | | | |
(without sales charges) | | -16.48 | | 7.98 | | 10.43 | | — |
| | | | |
Class I | | | | | | | | |
| | | | |
(without sales charges) | | -15.63 | | 9.07 | | 11.52 | | — |
| | | | |
Class Z | | | | | | | | |
| | | | |
(without sales charges) | | -15.68 | | 9.01 | | 11.46 | | — |
| | | | |
Class R6 | | | | | | | | |
| | | | |
(without sales charges) | | -15.59 | | N/A | | N/A | | 8.40 (11/28/2017) |
| | | | |
S&P 500 Index | | | | | | | | |
| | | | |
| | | -15.46 | | 9.24 | | 11.70 | | — |
| | | | |
|
| Average Annual Total Returns as of 9/30/22 Since Inception (%) |
| | |
| | | | | Class R6
(11/28/2017) |
| | |
S&P 500 Index | | | | 8.37 |
Since Inception returns are provided for any share class with less than 10 fiscal years of returns. Since Inception returns for the Index are measured from the closest month-end to the class’s inception date.
4 Visit our website at pgim.com/investments
Growth of a $10,000 Investment (unaudited)
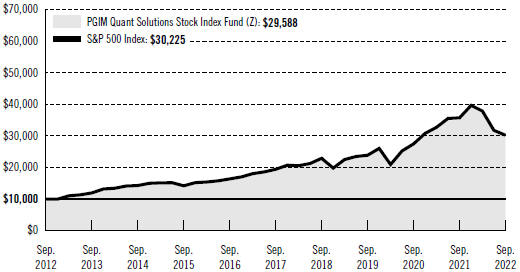
The graph compares a $10,000 investment in the Fund’s Class Z shares with a similar investment in the S&P 500 Index by portraying the initial account values at the beginning of the 10-year period (September 30, 2012) and the account values at the end of the current fiscal year (September 30, 2022), as measured on a quarterly basis. For purposes of the graph, and unless otherwise indicated, it has been assumed that (a) all recurring fees (including management fees) were deducted and (b) all dividends and distributions were reinvested. The line graph provides information for Class Z shares only. As indicated in the tables provided earlier, performance for other share classes will vary due to the differing fees and expenses applicable to each share class (as indicated in the following paragraphs). Without waiver of fees and/or expense reimbursements, if any, the returns would have been lower.
Past performance does not predict future performance. Total returns and the ending account values in the graph include changes in share price and reinvestment of dividends and capital gains distributions in a hypothetical investment for the periods shown. The Fund’s total returns do not reflect the deduction of income taxes on an individual’s investment. Taxes may reduce your actual investment returns on income or gains paid by the Fund or any gains you may realize if you sell your shares.
PGIM Quant Solutions Stock Index Fund 5
Your Fund’s Performance (continued)
The returns in the tables do not reflect the deduction of taxes that a shareholder would pay on Fund distributions or following the redemption of Fund shares. The average annual total returns take into account applicable sales charges, which are described for each share class in the table below.
| | | | | | | | | | |
| | | | | | |
| | | Class A | | Class C | | Class I | | Class Z | | Class R6 |
| | | | | | |
| Maximum initial sales charge | | 3.25% of the public offering price | | None | | None | | None | | None |
| | | | | | |
| Contingent deferred sales charge (CDSC) (as a percentage of the lower of the original purchase price or the net asset value at redemption) | | 1.00% on sales of $1 million or more made within 12 months of purchase | | 1.00% on sales made within 12 months of purchase | | None | | None | | None |
| | | | | | |
| Annual distribution and service (12b-1) fees (shown as a percentage of average daily net assets) | | 0.30% | | 1.00% | | None | | None | | None |
Benchmark Definition
S&P 500 Index*—The S&P 500 Index is an unmanaged index of over 500 stocks of large US public companies. It gives a broad look at how stock prices in the United States have performed.
*The S&P 500 Index is a product of S&P Dow Jones Indices LLC and/or its affiliates and has been licensed for use by PGIM, Inc. and/or its affiliates. Copyright © 2022 S&P Dow Jones Indices LLC, a division of S&P Global, Inc., and/or its affiliates. All rights reserved. Redistribution or reproduction in whole or in part are prohibited without written permission of S&P Dow Jones Indices LLC. For more information on any of S&P Dow Jones Indices LLC’s indices please visit www.spdji.com. S&P® is a registered trademark of S&P Global and Dow Jones® is a registered trademark of Dow Jones Trademark Holdings LLC.
Investors cannot invest directly in an index. The returns for the Index would be lower if they included the effects of sales charges, operating expenses of a mutual fund, or taxes that may be paid by an investor.
6 Visit our website at pgim.com/investments
12-month performance (the S&P 500 Index) broken out by S&P 500 Index sectors as of 9/30/22.
S&P 500 Index as of 9/30/22
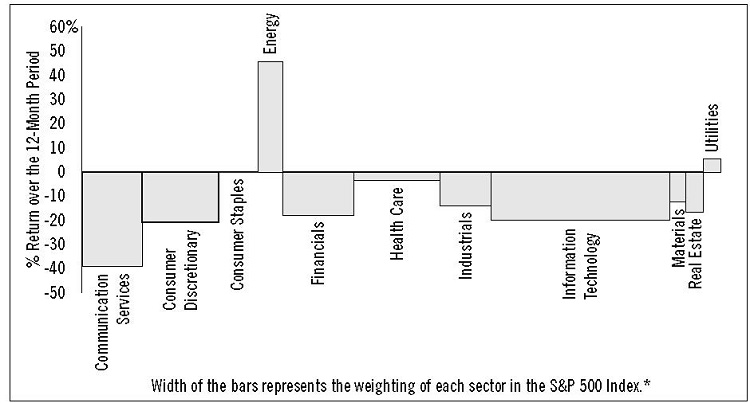
*Sector weightings are subject to change.
Source: FactSet Research Systems Inc.
PGIM Quant Solutions Stock Index Fund 7
Your Fund’s Performance (continued)
Presentation of Fund Holdings as of 9/30/22
| | | | |
| | |
| Ten Largest Holdings | | Line of Business | | % of Net Assets |
| | |
Apple, Inc. | | Technology Hardware, Storage & Peripherals | | 6.8% |
| | |
Microsoft Corp. | | Software | | 5.7% |
| | |
Amazon.com, Inc. | | Internet & Direct Marketing Retail | | 3.3% |
| | |
Tesla, Inc. | | Automobiles | | 2.3% |
| | |
Alphabet, Inc. (Class A Stock) | | Interactive Media & Services | | 1.9% |
| | |
Alphabet, Inc. (Class C Stock) | | Interactive Media & Services | | 1.7% |
| | |
Berkshire Hathaway, Inc. (Class B Stock) | | Diversified Financial Services | | 1.6% |
| | |
UnitedHealth Group, Inc. | | Health Care Providers & Services | | 1.5% |
| | |
Johnson & Johnson | | Pharmaceuticals | | 1.4% |
| | |
Exxon Mobil Corp. | | Oil, Gas & Consumable Fuels | | 1.2% |
Holdings reflect only long-term investments and are subject to change.
8 Visit our website at pgim.com/investments
Strategy and Performance Overview* (unaudited)
How did the Fund perform?
The PGIM Quant Solutions Stock Index Fund’s Class Z shares returned -15.68% in the 12-month reporting period that ended September 30, 2022, in line with the -15.46% return of the S&P 500 Index (the Index).
● The Fund closely tracked the performance of the Index during the period before the deduction of fees and expenses.
● The Fund held all stocks included in the Index in approximately the same proportions.
What were the market conditions?
Hawkish monetary policy aimed at curbing high inflation, coupled with rising energy prices stemming from the Russia-Ukraine conflict, heightened fears of a global recession. While segments of overall inflation in the US showed signs of easing, stickier elements, such as rent, wages, and medical costs, remained elevated. Inflation data supported the raise-and-hold message on interest rates, prompting equity sell-offs. Interest rate hikes also resulted in a TIA (There Is an Alternative) mentality, with the 10-year US Treasury rate exceeding the dividend yield on the S&P 500.
Current outlook
| ● | PGIM Quantitative Solutions believes economic growth likely will reaccelerate into the end of 2022 as the economic impact of COVID-19 recedes and global monetary policy conditions stay accommodative. |
*This strategy and performance overview, which discusses what strategies or holdings (including derivatives, if applicable) affected the Fund’s performance, is compiled based on how the Fund performed relative to the Fund’s benchmark index and is viewed for performance attribution purposes at the aggregate Fund level, which in most instances will not directly correlate to the amounts disclosed in the Statement of Operations which conform to US generally accepted accounting principles.
PGIM Quant Solutions Stock Index Fund 9
Fees and Expenses (unaudited)
As a shareholder of the Fund, you incur two types of costs: (1) transaction costs, including sales charges (loads) on purchase payments and redemptions, as applicable, and (2) ongoing costs, including management fees, distribution and/or service (12b-1) fees, and other Fund expenses, as applicable. This example is intended to help you understand your ongoing costs (in dollars) of investing in the Fund and to compare these costs with the ongoing costs of investing in other mutual funds.
The example is based on an investment of $1,000 held through the six-month period ended September 30, 2022. The example is for illustrative purposes only; you should consult the Prospectus for information on initial and subsequent minimum investment requirements.
Actual Expenses
The first line for each share class in the table on the following page provides information about actual account values and actual expenses. You may use the information on this line, together with the amount you invested, to estimate the expenses that you paid over the period. Simply divide your account value by $1,000 (for example, an $8,600 account value ÷ $1,000 = 8.6), then multiply the result by the number on the first line under the heading “Expenses Paid During the Six-Month Period” to estimate the expenses you paid on your account during this period.
Hypothetical Example for Comparison Purposes
The second line for each share class in the table on the following page provides information about hypothetical account values and hypothetical expenses based on the Fund’s actual expense ratio and an assumed rate of return of 5% per year before expenses, which is not the Fund’s actual return. The hypothetical account values and expenses may not be used to estimate the actual ending account balance or expenses you paid for the period. You may use this information to compare the ongoing costs of investing in the Fund and other funds. To do so, compare this 5% hypothetical example with the 5% hypothetical examples that appear in the shareholder reports of the other funds.
The Fund’s transfer agent may charge additional fees to holders of certain accounts that are not included in the expenses shown in the table on the following page. These fees apply to individual retirement accounts (IRAs) and Section 403(b) accounts. As of the close of the six-month period covered by the table, IRA fees included an annual maintenance fee of $15 per account (subject to a maximum annual maintenance fee of $25 for all accounts held by the same shareholder). Section 403(b) accounts are charged an annual $25 fiduciary maintenance fee. Some of the fees may vary in amount, or may be waived, based on your total account balance or the number of PGIM funds, including the Fund, that you own. You should consider the additional fees that were charged to your Fund account over the six-month period when you estimate the total ongoing expenses paid over the period and the impact of these fees on your ending account value, as these additional expenses are not reflected in the information
10 Visit our website at pgim.com/investments
provided in the expense table. Additional fees have the effect of reducing investment returns.
Please note that the expenses shown in the table are meant to highlight your ongoing costs only and do not reflect any transactional costs such as sales charges (loads). Therefore, the second line for each share class in the table is useful in comparing ongoing costs only and will not help you determine the relative total costs of owning different funds. In addition, if these transactional costs were included, your costs would have been higher.
| | | | | | | | | | |
| | | | |
PGIM Quant Solutions Stock Index Fund | | Beginning Account Value April 1, 2022 | | Ending Account Value
September 30, 2022 | | Annualized Expense Ratio Based on the Six-Month Period | | Expenses Paid During the Six-Month Period* |
| | | | | |
Class A | | Actual | | $1,000.00 | | $ 795.90 | | 0.52% | | $2.34 |
| | | | | |
| | Hypothetical | | $1,000.00 | | $1,022.46 | | 0.52% | | $2.64 |
| | | | | |
Class C | | Actual | | $1,000.00 | | $ 793.20 | | 1.23% | | $5.53 |
| | | | | |
| | Hypothetical | | $1,000.00 | | $1,018.90 | | 1.23% | | $6.23 |
| | | | | |
Class I | | Actual | | $1,000.00 | | $ 797.40 | | 0.19% | | $0.86 |
| | | | | |
| | Hypothetical | | $1,000.00 | | $1,024.12 | | 0.19% | | $0.96 |
| | | | | |
Class Z | | Actual | | $1,000.00 | | $ 797.00 | | 0.25% | | $1.13 |
| | | | | |
| | Hypothetical | | $1,000.00 | | $1,023.82 | | 0.25% | | $1.27 |
| | | | | |
Class R6 | | Actual | | $1,000.00 | | $ 797.40 | | 0.14% | | $0.63 |
| | | | | |
| | | Hypothetical | | $1,000.00 | | $1,024.37 | | 0.14% | | $0.71 |
*Fund expenses (net of fee waivers or subsidies, if any) for each share class are equal to the annualized expense ratio for each share class (provided in the table), multiplied by the average account value over the period, multiplied by the 183 days in the six-month period ended September 30, 2022, and divided by the 365 days in the Fund’s fiscal year ended September 30, 2022 (to reflect the six-month period). Expenses presented in the table include the expenses of any underlying portfolios in which the Fund may invest.
PGIM Quant Solutions Stock Index Fund 11
Schedule of Investments
as of September 30, 2022
| | | | | | | | |
| | |
| Description | | Shares | | | Value | |
| | |
LONG-TERM INVESTMENTS 98.8% | | | | | | | | |
| | |
COMMON STOCKS 98.3% | | | | | | | | |
| | |
Aerospace & Defense 1.6% | | | | | | | | |
| | |
Boeing Co. (The)* | | | 11,444 | | | $ | 1,385,640 | |
General Dynamics Corp. | | | 4,532 | | | | 961,554 | |
Howmet Aerospace, Inc. | | | 7,781 | | | | 240,666 | |
Huntington Ingalls Industries, Inc. | | | 800 | | | | 177,200 | |
L3Harris Technologies, Inc. | | | 3,916 | | | | 813,862 | |
Lockheed Martin Corp. | | | 4,766 | | | | 1,841,058 | |
Northrop Grumman Corp. | | | 3,068 | | | | 1,442,942 | |
Raytheon Technologies Corp. | | | 30,731 | | | | 2,515,640 | |
Textron, Inc. | | | 4,434 | | | | 258,325 | |
TransDigm Group, Inc. | | | 1,040 | | | | 545,813 | |
| | | | | | | | |
| | |
| | | | | | | 10,182,700 | |
| | |
Air Freight & Logistics 0.6% | | | | | | | | |
| | |
C.H. Robinson Worldwide, Inc. | | | 2,600 | | | | 250,406 | |
Expeditors International of Washington, Inc. | | | 3,300 | | | | 291,423 | |
FedEx Corp. | | | 4,846 | | | | 719,486 | |
United Parcel Service, Inc. (Class B Stock) | | | 15,090 | | | | 2,437,638 | |
| | | | | | | | |
| | |
| | | | | | | 3,698,953 | |
| | |
Airlines 0.2% | | | | | | | | |
| | |
Alaska Air Group, Inc.* | | | 2,900 | | | | 113,535 | |
American Airlines Group, Inc.* | | | 14,250 | | | | 171,570 | |
Delta Air Lines, Inc.* | | | 13,800 | | | | 387,228 | |
Southwest Airlines Co.* | | | 12,674 | | | | 390,866 | |
United Airlines Holdings, Inc.* | | | 7,000 | | | | 227,710 | |
| | | | | | | | |
| | |
| | | | | | | 1,290,909 | |
| | |
Auto Components 0.1% | | | | | | | | |
| | |
Aptiv PLC* | | | 5,450 | | | | 426,245 | |
BorgWarner, Inc. | | | 4,800 | | | | 150,720 | |
| | | | | | | | |
| | |
| | | | | | | 576,965 | |
| | |
Automobiles 2.6% | | | | | | | | |
| | |
Ford Motor Co. | | | 82,438 | | | | 923,306 | |
General Motors Co. | | | 30,400 | | | | 975,536 | |
Tesla, Inc.* | | | 55,170 | | | | 14,633,842 | |
| | | | | | | | |
| | |
| | | | | | | 16,532,684 | |
See Notes to Financial Statements.
PGIM Quant Solutions Stock Index Fund 13
Schedule of Investments (continued)
as of September 30, 2022
| | | | | | | | |
| | |
| Description | | Shares | | | Value | |
| | |
COMMON STOCKS (Continued) | | | | | | | | |
| | |
Banks 3.7% | | | | | | | | |
| | |
Bank of America Corp. | | | 144,895 | | | $ | 4,375,829 | |
Citigroup, Inc. | | | 40,495 | | | | 1,687,427 | |
Citizens Financial Group, Inc. | | | 10,300 | | | | 353,908 | |
Comerica, Inc. | | | 2,761 | | | | 196,307 | |
Fifth Third Bancorp | | | 14,073 | | | | 449,773 | |
First Republic Bank | | | 3,700 | | | | 483,035 | |
Huntington Bancshares, Inc. | | | 29,929 | | | | 394,464 | |
JPMorgan Chase & Co. | | | 60,703 | | | | 6,343,463 | |
KeyCorp | | | 20,035 | | | | 320,961 | |
M&T Bank Corp. | | | 3,755 | | | | 662,082 | |
PNC Financial Services Group, Inc. (The) | | | 8,372 | | | | 1,250,944 | |
Regions Financial Corp. | | | 19,974 | | | | 400,878 | |
Signature Bank | | | 1,200 | | | | 181,200 | |
SVB Financial Group* | | | 1,250 | | | | 419,725 | |
Truist Financial Corp. | | | 27,772 | | | | 1,209,193 | |
U.S. Bancorp | | | 28,195 | | | | 1,136,822 | |
Wells Fargo & Co. | | | 78,236 | | | | 3,146,652 | |
Zions Bancorp NA | | | 3,300 | | | | 167,838 | |
| | | | | | | | |
| | |
| | | | | | | 23,180,501 | |
| | |
Beverages 1.8% | | | | | | | | |
| | |
Brown-Forman Corp. (Class B Stock) | | | 3,650 | | | | 242,981 | |
Coca-Cola Co. (The) | | | 80,564 | | | | 4,513,195 | |
Constellation Brands, Inc. (Class A Stock) | | | 3,350 | | | | 769,428 | |
Keurig Dr. Pepper, Inc. | | | 17,600 | | | | 630,432 | |
Molson Coors Beverage Co. (Class B Stock) | | | 4,094 | | | | 196,471 | |
Monster Beverage Corp.* | | | 7,750 | | | | 673,940 | |
PepsiCo, Inc. | | | 28,441 | | | | 4,643,278 | |
| | | | | | | | |
| | |
| | | | | | | 11,669,725 | |
| | |
Biotechnology 2.2% | | | | | | | | |
| | |
AbbVie, Inc. | | | 36,689 | | | | 4,924,031 | |
Amgen, Inc. | | | 10,996 | | | | 2,478,498 | |
Biogen, Inc.* | | | 2,880 | | | | 768,960 | |
Gilead Sciences, Inc. | | | 25,800 | | | | 1,591,602 | |
Incyte Corp.* | | | 3,800 | | | | 253,232 | |
Moderna, Inc.* | | | 6,940 | | | | 820,655 | |
Regeneron Pharmaceuticals, Inc.* | | | 2,210 | | | | 1,522,403 | |
Vertex Pharmaceuticals, Inc.* | | | 5,360 | | | | 1,551,934 | |
| | | | | | | | |
| | |
| | | | | | | 13,911,315 | |
See Notes to Financial Statements.
14
| | | | | | | | |
| | |
| Description | | Shares | | | Value | |
| | |
COMMON STOCKS (Continued) | | | | | | | | |
| | |
Building Products 0.4% | | | | | | | | |
| | |
A.O. Smith Corp. | | | 2,800 | | | $ | 136,024 | |
Allegion PLC | | | 1,833 | | | | 164,384 | |
Carrier Global Corp. | | | 17,729 | | | | 630,443 | |
Fortune Brands Home & Security, Inc. | | | 2,700 | | | | 144,963 | |
Johnson Controls International PLC | | | 14,487 | | | | 713,050 | |
Masco Corp. | | | 5,026 | | | | 234,664 | |
Trane Technologies PLC | | | 4,800 | | | | 695,088 | |
| | | | | | | | |
| | |
| | | | | | | 2,718,616 | |
| | |
Capital Markets 2.9% | | | | | | | | |
| | |
Ameriprise Financial, Inc. | | | 2,261 | | | | 569,659 | |
Bank of New York Mellon Corp. (The) | | | 15,438 | | | | 594,672 | |
BlackRock, Inc. | | | 3,130 | | | | 1,722,376 | |
Cboe Global Markets, Inc. | | | 2,100 | | | | 246,477 | |
Charles Schwab Corp. (The) | | | 31,611 | | | | 2,271,883 | |
CME Group, Inc. | | | 7,300 | | | | 1,293,049 | |
FactSet Research Systems, Inc. | | | 700 | | | | 280,077 | |
Franklin Resources, Inc. | | | 5,742 | | | | 123,568 | |
Goldman Sachs Group, Inc. (The) | | | 7,080 | | | | 2,074,794 | |
Intercontinental Exchange, Inc. | | | 11,400 | | | | 1,029,990 | |
Invesco Ltd. | | | 9,400 | | | | 128,780 | |
MarketAxess Holdings, Inc. | | | 710 | | | | 157,968 | |
Moody’s Corp. | | | 3,166 | | | | 769,686 | |
Morgan Stanley | | | 27,790 | | | | 2,195,688 | |
MSCI, Inc. | | | 1,690 | | | | 712,825 | |
Nasdaq, Inc. | | | 6,900 | | | | 391,092 | |
Northern Trust Corp. | | | 4,362 | | | | 373,213 | |
Raymond James Financial, Inc. | | | 4,000 | | | | 395,280 | |
S&P Global, Inc. | | | 7,040 | | | | 2,149,664 | |
State Street Corp. | | | 7,462 | | | | 453,764 | |
T. Rowe Price Group, Inc. | | | 4,800 | | | | 504,048 | |
| | | | | | | | |
| | |
| | | | | | | 18,438,553 | |
| | |
Chemicals 1.7% | | | | | | | | |
| | |
Air Products & Chemicals, Inc. | | | 4,502 | | | | 1,047,751 | |
Albemarle Corp. | | | 2,440 | | | | 645,234 | |
Celanese Corp. | | | 2,100 | | | | 189,714 | |
CF Industries Holdings, Inc. | | | 4,200 | | | | 404,250 | |
Corteva, Inc. | | | 15,109 | | | | 863,479 | |
Dow, Inc. | | | 15,209 | | | | 668,131 | |
DuPont de Nemours, Inc. | | | 10,509 | | | | 529,654 | |
Eastman Chemical Co. | | | 2,686 | | | | 190,840 | |
Ecolab, Inc. | | | 5,242 | | | | 757,050 | |
See Notes to Financial Statements.
PGIM Quant Solutions Stock Index Fund 15
Schedule of Investments (continued)
as of September 30, 2022
| | | | | | | | |
| | |
| Description | | Shares | | | Value | |
| | |
COMMON STOCKS (Continued) | | | | | | | | |
| | |
Chemicals (cont’d.) | | | | | | | | |
| | |
FMC Corp. | | | 2,500 | | | $ | 264,250 | |
International Flavors & Fragrances, Inc. | | | 5,215 | | | | 473,678 | |
Linde PLC (United Kingdom) | | | 10,268 | | | | 2,768,150 | |
LyondellBasell Industries NV (Class A Stock) | | | 5,300 | | | | 398,984 | |
Mosaic Co. (The) | | | 7,500 | | | | 362,475 | |
PPG Industries, Inc. | | | 4,748 | | | | 525,556 | |
Sherwin-Williams Co. (The) | | | 4,888 | | | | 1,000,818 | |
| | | | | | | | |
| | |
| | | | | | | 11,090,014 | |
| | |
Commercial Services & Supplies 0.5% | | | | | | | | |
| | |
Cintas Corp. | | | 1,760 | | | | 683,215 | |
Copart, Inc.* | | | 4,400 | | | | 468,160 | |
Republic Services, Inc. | | | 4,135 | | | | 562,525 | |
Rollins, Inc. | | | 4,575 | | | | 158,661 | |
Waste Management, Inc. | | | 7,813 | | | | 1,251,721 | |
| | | | | | | | |
| | |
| | | | | | | 3,124,282 | |
| | |
Communications Equipment 0.8% | | | | | | | | |
| | |
Arista Networks, Inc.* | | | 5,080 | | | | 573,481 | |
Cisco Systems, Inc. | | | 85,844 | | | | 3,433,760 | |
F5, Inc.* | | | 1,300 | | | | 188,149 | |
Juniper Networks, Inc. | | | 6,700 | | | | 175,004 | |
Motorola Solutions, Inc. | | | 3,356 | | | | 751,644 | |
| | | | | | | | |
| | |
| | | | | | | 5,122,038 | |
| | |
Construction & Engineering 0.1% | | | | | | | | |
| | |
Quanta Services, Inc. | | | 2,900 | | | | 369,431 | |
| | |
Construction Materials 0.1% | | | | | | | | |
| | |
Martin Marietta Materials, Inc. | | | 1,300 | | | | 418,717 | |
Vulcan Materials Co. | | | 2,700 | | | | 425,817 | |
| | | | | | | | |
| | |
| | | | | | | 844,534 | |
| | |
Consumer Finance 0.5% | | | | | | | | |
| | |
American Express Co. | | | 12,399 | | | | 1,672,749 | |
Capital One Financial Corp. | | | 7,966 | | | | 734,226 | |
Discover Financial Services | | | 5,618 | | | | 510,789 | |
Synchrony Financial | | | 9,965 | | | | 280,913 | |
| | | | | | | | |
| | |
| | | | | | | 3,198,677 | |
See Notes to Financial Statements.
16
| | | | | | | | |
| | |
| Description | | Shares | | | Value | |
| | |
COMMON STOCKS (Continued) | | | | | | | | |
| | |
Containers & Packaging 0.3% | | | | | | | | |
| | |
Amcor PLC | | | 32,160 | | | $ | 345,077 | |
Avery Dennison Corp. | | | 1,638 | | | | 266,503 | |
Ball Corp. | | | 6,628 | | | | 320,265 | |
International Paper Co. | | | 7,884 | | | | 249,923 | |
Packaging Corp. of America | | | 1,970 | | | | 221,211 | |
Sealed Air Corp. | | | 3,136 | | | | 139,583 | |
Westrock Co. | | | 5,533 | | | | 170,914 | |
| | | | | | | | |
| | |
| | | | | | | 1,713,476 | |
| | |
Distributors 0.1% | | | | | | | | |
| | |
Genuine Parts Co. | | | 2,799 | | | | 417,947 | |
LKQ Corp. | | | 5,700 | | | | 268,755 | |
Pool Corp. | | | 820 | | | | 260,932 | |
| | | | | | | | |
| | |
| | | | | | | 947,634 | |
| | |
Diversified Financial Services 1.6% | | | | | | | | |
| | |
Berkshire Hathaway, Inc. (Class B Stock)* | | | 37,390 | | | | 9,983,878 | |
| | |
Diversified Telecommunication Services 0.9% | | | | | | | | |
| | |
AT&T, Inc. | | | 147,907 | | | | 2,268,894 | |
Lumen Technologies, Inc. | | | 20,979 | | | | 152,727 | |
Verizon Communications, Inc. | | | 86,733 | | | | 3,293,252 | |
| | | | | | | | |
| | |
| | | | | | | 5,714,873 | |
| | |
Electric Utilities 2.0% | | | | | | | | |
| | |
Alliant Energy Corp. | | | 5,400 | | | | 286,146 | |
American Electric Power Co., Inc. | | | 10,591 | | | | 915,592 | |
Constellation Energy Corp. | | | 6,903 | | | | 574,261 | |
Duke Energy Corp. | | | 15,839 | | | | 1,473,344 | |
Edison International | | | 8,062 | | | | 456,148 | |
Entergy Corp. | | | 4,115 | | | | 414,092 | |
Evergy, Inc. | | | 4,700 | | | | 279,180 | |
Eversource Energy | | | 7,200 | | | | 561,312 | |
Exelon Corp. | | | 20,412 | | | | 764,634 | |
FirstEnergy Corp. | | | 11,277 | | | | 417,249 | |
NextEra Energy, Inc. | | | 40,528 | | | | 3,177,800 | |
NRG Energy, Inc. | | | 4,800 | | | | 183,696 | |
PG&E Corp.* | | | 31,600 | | | | 395,000 | |
Pinnacle West Capital Corp. | | | 2,300 | | | | 148,373 | |
PPL Corp. | | | 15,652 | | �� | | 396,778 | |
See Notes to Financial Statements.
PGIM Quant Solutions Stock Index Fund 17
Schedule of Investments (continued)
as of September 30, 2022
| | | | | | | | |
| | |
| Description | | Shares | | | Value | |
| | |
COMMON STOCKS (Continued) | | | | | | | | |
| | |
Electric Utilities (cont’d.) | | | | | | | | |
| | |
Southern Co. (The) | | | 21,915 | | | $ | 1,490,220 | |
Xcel Energy, Inc. | | | 11,283 | | | | 722,112 | |
| | | | | | | | |
| | |
| | | | | | | 12,655,937 | |
| | |
Electrical Equipment 0.5% | | | | | | | | |
| | |
AMETEK, Inc. | | | 4,700 | | | | 533,027 | |
Eaton Corp. PLC | | | 8,293 | | | | 1,105,954 | |
Emerson Electric Co. | | | 12,350 | | | | 904,267 | |
Generac Holdings, Inc.* | | | 1,300 | | | | 231,582 | |
Rockwell Automation, Inc. | | | 2,343 | | | | 504,003 | |
| | | | | | | | |
| | |
| | | | | | | 3,278,833 | |
| | |
Electronic Equipment, Instruments & Components 0.6% | | | | | | | | |
| | |
Amphenol Corp. (Class A Stock) | | | 12,400 | | | | 830,304 | |
CDW Corp. | | | 2,700 | | | | 421,416 | |
Corning, Inc. | | | 15,797 | | | | 458,429 | |
Keysight Technologies, Inc.* | | | 3,600 | | | | 566,496 | |
TE Connectivity Ltd. (Switzerland) | | | 6,550 | | | | 722,858 | |
Teledyne Technologies, Inc.* | | | 908 | | | | 306,423 | |
Trimble, Inc.* | | | 5,100 | | | | 276,777 | |
Zebra Technologies Corp. (Class A Stock)* | | | 1,020 | | | | 267,250 | |
| | | | | | | | |
| | |
| | | | | | | 3,849,953 | |
| | |
Energy Equipment & Services 0.3% | | | | | | | | |
| | |
Baker Hughes Co. | | | 20,945 | | | | 439,007 | |
Halliburton Co. | | | 19,122 | | | | 470,784 | |
Schlumberger NV | | | 29,732 | | | | 1,067,379 | |
| | | | | | | | |
| | |
| | | | | | | 1,977,170 | |
| | |
Entertainment 1.3% | | | | | | | | |
| | |
Activision Blizzard, Inc. | | | 14,700 | | | | 1,092,798 | |
Electronic Arts, Inc. | | | 5,500 | | | | 636,405 | |
Live Nation Entertainment, Inc.* | | | 2,800 | | | | 212,912 | |
Netflix, Inc.* | | | 9,150 | | | | 2,154,276 | |
Take-Two Interactive Software, Inc.* | | | 3,200 | | | | 348,800 | |
Walt Disney Co. (The)* | | | 37,636 | | | | 3,550,204 | |
Warner Bros. Discovery, Inc.* | | | 46,085 | | | | 529,977 | |
| | | | | | | | |
| | |
| | | | | | | 8,525,372 | |
See Notes to Financial Statements.
18
| | | | | | | | |
| | |
| Description | | Shares | | | Value | |
| | |
COMMON STOCKS (Continued) | | | | | | | | |
| | |
Equity Real Estate Investment Trusts (REITs) 2.7% | | | | | | | | |
| | |
Alexandria Real Estate Equities, Inc. | | | 3,100 | | | $ | 434,589 | |
American Tower Corp. | | | 9,550 | | | | 2,050,385 | |
AvalonBay Communities, Inc. | | | 2,911 | | | | 536,177 | |
Boston Properties, Inc. | | | 2,880 | | | | 215,913 | |
Camden Property Trust | | | 2,200 | | | | 262,790 | |
Crown Castle, Inc. | | | 8,900 | | | | 1,286,495 | |
Digital Realty Trust, Inc. | | | 6,000 | | | | 595,080 | |
Duke Realty Corp. | | | 7,900 | | | | 380,780 | |
Equinix, Inc. | | | 1,886 | | | | 1,072,832 | |
Equity Residential | | | 7,000 | | | | 470,540 | |
Essex Property Trust, Inc. | | | 1,300 | | | | 314,899 | |
Extra Space Storage, Inc. | | | 2,700 | | | | 466,317 | |
Federal Realty Investment Trust | | | 1,500 | | | | 135,180 | |
Healthpeak Properties, Inc. | | | 11,100 | | | | 254,412 | |
Host Hotels & Resorts, Inc. | | | 15,336 | | | | 243,536 | |
Invitation Homes, Inc. | | | 12,000 | | | | 405,240 | |
Iron Mountain, Inc. | | | 6,305 | | | | 277,231 | |
Kimco Realty Corp. | | | 13,300 | | | | 244,853 | |
Mid-America Apartment Communities, Inc. | | | 2,370 | | | | 367,516 | |
Prologis, Inc. | | | 15,237 | | | | 1,548,079 | |
Public Storage | | | 3,200 | | | | 936,992 | |
Realty Income Corp. | | | 12,500 | | | | 727,500 | |
Regency Centers Corp. | | | 3,200 | | | | 172,320 | |
SBA Communications Corp. | | | 2,200 | | | | 626,230 | |
Simon Property Group, Inc. | | | 6,789 | | | | 609,313 | |
UDR, Inc. | | | 6,200 | | | | 258,602 | |
Ventas, Inc. | | | 8,333 | | | | 334,737 | |
VICI Properties, Inc. | | | 20,500 | | | | 611,925 | |
Vornado Realty Trust | | | 3,284 | | | | 76,057 | |
Welltower, Inc. | | | 9,600 | | | | 617,472 | |
Weyerhaeuser Co. | | | 15,439 | | | | 440,938 | |
| | | | | | | | |
| | |
| | | | | | | 16,974,930 | |
| | |
Food & Staples Retailing 1.6% | | | | | | | | |
| | |
Costco Wholesale Corp. | | | 9,158 | | | | 4,325,049 | |
Kroger Co. (The) | | | 13,668 | | | | 597,975 | |
Sysco Corp. | | | 10,580 | | | | 748,112 | |
Walgreens Boots Alliance, Inc. | | | 14,778 | | | | 464,029 | |
Walmart, Inc. | | | 29,386 | | | | 3,811,364 | |
| | | | | | | | |
| | |
| | | | | | | 9,946,529 | |
| | |
Food Products 1.1% | | | | | | | | |
| | |
Archer-Daniels-Midland Co. | | | 11,759 | | | | 946,012 | |
See Notes to Financial Statements.
PGIM Quant Solutions Stock Index Fund 19
Schedule of Investments (continued)
as of September 30, 2022
| | | | | | | | |
| | |
| Description | | Shares | | | Value | |
| | |
COMMON STOCKS (Continued) | | | | | | | | |
| | |
Food Products (cont’d.) | | | | | | | | |
| | |
Campbell Soup Co. | | | 4,347 | | | $ | 204,831 | |
Conagra Brands, Inc. | | | 9,943 | | | | 324,440 | |
General Mills, Inc. | | | 12,544 | | | | 960,996 | |
Hershey Co. (The) | | | 2,916 | | | | 642,890 | |
Hormel Foods Corp. | | | 6,000 | | | | 272,640 | |
J.M. Smucker Co. (The) | | | 2,200 | | | | 302,302 | |
Kellogg Co. | | | 5,270 | | | | 367,108 | |
Kraft Heinz Co. (The) | | | 16,455 | | | | 548,774 | |
Lamb Weston Holdings, Inc. | | | 3,000 | | | | 232,140 | |
McCormick & Co., Inc. | | | 5,300 | | | | 377,731 | |
Mondelez International, Inc. (Class A Stock) | | | 28,466 | | | | 1,560,791 | |
Tyson Foods, Inc. (Class A Stock) | | | 6,100 | | | | 402,173 | |
| | | | | | | | |
| | |
| | | | | | | 7,142,828 | |
| | |
Gas Utilities 0.0% | | | | | | | | |
| | |
Atmos Energy Corp. | | | 2,900 | | | | 295,365 | |
| | |
Health Care Equipment & Supplies 2.6% | | | | | | | | |
| | |
Abbott Laboratories | | | 36,113 | | | | 3,494,294 | |
ABIOMED, Inc.* | | | 900 | | | | 221,094 | |
Align Technology, Inc.* | | | 1,410 | | | | 292,025 | |
Baxter International, Inc. | | | 10,274 | | | | 553,358 | |
Becton, Dickinson & Co. | | | 5,865 | | | | 1,306,898 | |
Boston Scientific Corp.* | | | 29,872 | | | | 1,156,943 | |
Cooper Cos., Inc. (The) | | | 1,000 | | | | 263,900 | |
DENTSPLY SIRONA, Inc. | | | 4,300 | | | | 121,905 | |
Dexcom, Inc.* | | | 8,020 | | | | 645,931 | |
Edwards Lifesciences Corp.* | | | 12,910 | | | | 1,066,753 | |
Hologic, Inc.* | | | 5,300 | | | | 341,956 | |
IDEXX Laboratories, Inc.* | | | 1,720 | | | | 560,376 | |
Intuitive Surgical, Inc.* | | | 7,280 | | | | 1,364,563 | |
Medtronic PLC | | | 27,715 | | | | 2,237,986 | |
ResMed, Inc. | | | 2,890 | | | | 630,887 | |
STERIS PLC | | | 2,100 | | | | 349,188 | |
Stryker Corp. | | | 6,860 | | | | 1,389,424 | |
Teleflex, Inc. | | | 900 | | | | 181,314 | |
Zimmer Biomet Holdings, Inc. | | | 4,211 | | | | 440,260 | |
| | | | | | | | |
| | |
| | | | | | | 16,619,055 | |
| | |
Health Care Providers & Services 3.6% | | | | | | | | |
| | |
AmerisourceBergen Corp. | | | 3,160 | | | | 427,643 | |
Cardinal Health, Inc. | | | 5,573 | | | | 371,608 | |
Centene Corp.* | | | 11,808 | | | | 918,780 | |
See Notes to Financial Statements.
20
| | | | | | | | |
| | |
| Description | | Shares | | | Value | |
| | |
COMMON STOCKS (Continued) | | | | | | | | |
| | |
Health Care Providers & Services (cont’d.) | | | | | | | | |
| | |
Cigna Corp. | | | 6,368 | | | $ | 1,766,929 | |
CVS Health Corp. | | | 27,246 | | | | 2,598,451 | |
DaVita, Inc.* | | | 1,300 | | | | 107,601 | |
Elevance Health, Inc. | | | 4,950 | | | | 2,248,488 | |
HCA Healthcare, Inc. | | | 4,400 | | | | 808,676 | |
Henry Schein, Inc.* | | | 2,900 | | | | 190,733 | |
Humana, Inc. | | | 2,600 | | | | 1,261,494 | |
Laboratory Corp. of America Holdings | | | 1,900 | | | | 389,139 | |
McKesson Corp. | | | 3,026 | | | | 1,028,447 | |
Molina Healthcare, Inc.* | | | 1,200 | | | | 395,808 | |
Quest Diagnostics, Inc. | | | 2,400 | | | | 294,456 | |
UnitedHealth Group, Inc. | | | 19,378 | | | | 9,786,665 | |
Universal Health Services, Inc. (Class B Stock) | | | 1,370 | | | | 120,806 | |
| | | | | | | | |
| | |
| | | | | | | 22,715,724 | |
| | |
Hotels, Restaurants & Leisure 1.9% | | | | | | | | |
| | |
Booking Holdings, Inc.* | | | 820 | | | | 1,347,432 | |
Caesars Entertainment, Inc.* | | | 4,700 | | | | 151,622 | |
Carnival Corp.* | | | 21,300 | | | | 149,739 | |
Chipotle Mexican Grill, Inc.* | | | 577 | | | | 867,092 | |
Darden Restaurants, Inc. | | | 2,453 | | | | 309,863 | |
Domino’s Pizza, Inc. | | | 800 | | | | 248,160 | |
Expedia Group, Inc.* | | | 3,000 | | | | 281,070 | |
Hilton Worldwide Holdings, Inc. | | | 5,660 | | | | 682,709 | |
Las Vegas Sands Corp.* | | | 6,760 | | | | 253,635 | |
Marriott International, Inc. (Class A Stock) | | | 5,740 | | | | 804,404 | |
McDonald’s Corp. | | | 15,180 | | | | 3,502,633 | |
MGM Resorts International | | | 6,800 | | | | 202,096 | |
Norwegian Cruise Line Holdings Ltd.* | | | 8,400 | | | | 95,424 | |
Royal Caribbean Cruises Ltd.* | | | 4,500 | | | | 170,550 | |
Starbucks Corp. | | | 23,680 | | | | 1,995,277 | |
Wynn Resorts Ltd.* | | | 2,300 | | | | 144,969 | |
Yum! Brands, Inc. | | | 5,764 | | | | 612,944 | |
| | | | | | | | |
| | |
| | | | | | | 11,819,619 | |
| | |
Household Durables 0.3% | | | | | | | | |
| | |
D.R. Horton, Inc. | | | 6,600 | | | | 444,510 | |
Garmin Ltd. | | | 3,200 | | | | 256,992 | |
Lennar Corp. (Class A Stock) | | | 5,300 | | | | 395,115 | |
Mohawk Industries, Inc.* | | | 1,140 | | | | 103,957 | |
Newell Brands, Inc. | | | 7,927 | | | | 110,106 | |
NVR, Inc.* | | | 55 | | | | 219,289 | |
See Notes to Financial Statements.
PGIM Quant Solutions Stock Index Fund 21
Schedule of Investments (continued)
as of September 30, 2022
| | | | | | | | |
| | |
| Description | | Shares | | | Value | |
| | |
COMMON STOCKS (Continued) | | | | | | | | |
| | |
Household Durables (cont’d.) | | | | | | | | |
| | |
PulteGroup, Inc. | | | 5,211 | | | $ | 195,412 | |
Whirlpool Corp. | | | 1,085 | | | | 146,269 | |
| | | | | | | | |
| | |
| | | | | | | 1,871,650 | |
| | |
Household Products 1.4% | | | | | | | | |
| | |
Church & Dwight Co., Inc. | | | 5,100 | | | | 364,344 | |
Clorox Co. (The) | | | 2,582 | | | | 331,503 | |
Colgate-Palmolive Co. | | | 17,460 | | | | 1,226,565 | |
Kimberly-Clark Corp. | | | 6,966 | | | | 783,953 | |
Procter & Gamble Co. (The) | | | 49,563 | | | | 6,257,329 | |
| | | | | | | | |
| | |
| | | | | | | 8,963,694 | |
| | |
Independent Power & Renewable Electricity Producers 0.0% | | | | | | | | |
| | |
AES Corp. (The) | | | 13,900 | | | | 314,140 | |
| | |
Industrial Conglomerates 0.8% | | | | | | | | |
| | |
3M Co. | | | 11,488 | | | | 1,269,424 | |
General Electric Co. | | | 22,700 | | | | 1,405,357 | |
Honeywell International, Inc. | | | 13,985 | | | | 2,335,075 | |
| | | | | | | | |
| | |
| | | | | | | 5,009,856 | |
| | |
Insurance 2.2% | | | | | | | | |
| | |
Aflac, Inc. | | | 11,900 | | | | 668,780 | |
Allstate Corp. (The) | | | 5,708 | | | | 710,817 | |
American International Group, Inc. | | | 15,751 | | | | 747,858 | |
Aon PLC (Class A Stock) | | | 4,489 | | | | 1,202,469 | |
Arthur J. Gallagher & Co. | | | 4,400 | | | | 753,368 | |
Assurant, Inc. | | | 1,100 | | | | 159,797 | |
Brown & Brown, Inc. | | | 5,000 | | | | 302,400 | |
Chubb Ltd. | | | 8,653 | | | | 1,573,808 | |
Cincinnati Financial Corp. | | | 3,307 | | | | 296,208 | |
Everest Re Group Ltd. | | | 750 | | | | 196,830 | |
Globe Life, Inc. | | | 1,933 | | | | 192,720 | |
Hartford Financial Services Group, Inc. (The) | | | 6,653 | | | | 412,087 | |
Lincoln National Corp. | | | 3,551 | | | | 155,924 | |
Loews Corp. | | | 3,917 | | | | 195,223 | |
Marsh & McLennan Cos., Inc. | | | 10,340 | | | | 1,543,659 | |
MetLife, Inc. | | | 13,850 | | | | 841,803 | |
Principal Financial Group, Inc. | | | 4,800 | | | | 346,320 | |
Progressive Corp. (The) | | | 12,016 | | | | 1,396,379 | |
Prudential Financial, Inc.(g) | | | 7,900 | | | | 677,662 | |
Travelers Cos., Inc. (The) | | | 4,831 | | | | 740,109 | |
See Notes to Financial Statements.
22
| | | | | | | | |
| | |
| Description | | Shares | | | Value | |
| | |
COMMON STOCKS (Continued) | | | | | | | | |
| | |
Insurance (cont’d.) | | | | | | | | |
| | |
W.R. Berkley Corp. | | | 4,200 | | | $ | 271,236 | |
Willis Towers Watson PLC | | | 2,200 | | | | 442,068 | |
| | | | | | | | |
| | |
| | | | | | | 13,827,525 | |
| | |
Interactive Media & Services 4.7% | | | | | | | | |
| | |
Alphabet, Inc. (Class A Stock)* | | | 124,000 | | | | 11,860,600 | |
Alphabet, Inc. (Class C Stock)* | | | 111,140 | | | | 10,686,111 | |
Match Group, Inc.* | | | 5,800 | | | | 276,950 | |
Meta Platforms, Inc. (Class A Stock)* | | | 47,160 | | | | 6,398,669 | |
Twitter, Inc.* | | | 13,900 | | | | 609,376 | |
| | | | | | | | |
| | |
| | | | | | | 29,831,706 | |
| | |
Internet & Direct Marketing Retail 3.4% | | | | | | | | |
| | |
Amazon.com, Inc.* | | | 183,400 | | | | 20,724,200 | |
eBay, Inc. | | | 11,340 | | | | 417,425 | |
Etsy, Inc.* | | | 2,500 | | | | 250,325 | |
| | | | | | | | |
| | |
| | | | | | | 21,391,950 | |
| | |
IT Services 4.3% | | | | | | | | |
| | |
Accenture PLC (Class A Stock) | | | 13,190 | | | | 3,393,787 | |
Akamai Technologies, Inc.* | | | 3,400 | | | | 273,088 | |
Automatic Data Processing, Inc. | | | 8,648 | | | | 1,956,091 | |
Broadridge Financial Solutions, Inc. | | | 2,300 | | | | 331,936 | |
Cognizant Technology Solutions Corp. (Class A Stock) | | | 10,700 | | | | 614,608 | |
DXC Technology Co.* | | | 5,259 | | | | 128,740 | |
EPAM Systems, Inc.* | | | 1,200 | | | | 434,628 | |
Fidelity National Information Services, Inc. | | | 12,560 | | | | 949,159 | |
Fiserv, Inc.* | | | 13,300 | | | | 1,244,481 | |
FleetCor Technologies, Inc.* | | | 1,620 | | | | 285,396 | |
Gartner, Inc.* | | | 1,570 | | | | 434,403 | |
Global Payments, Inc. | | | 5,694 | | | | 615,237 | |
International Business Machines Corp. | | | 18,574 | | | | 2,206,777 | |
Jack Henry & Associates, Inc. | | | 1,500 | | | | 273,405 | |
Mastercard, Inc. (Class A Stock) | | | 17,700 | | | | 5,032,818 | |
Paychex, Inc. | | | 6,625 | | | | 743,391 | |
PayPal Holdings, Inc.* | | | 24,130 | | | | 2,076,869 | |
VeriSign, Inc.* | | | 1,880 | | | | 326,556 | |
Visa, Inc. (Class A Stock) | | | 33,950 | | | | 6,031,218 | |
| | | | | | | | |
| | |
| | | | | | | 27,352,588 | |
See Notes to Financial Statements.
PGIM Quant Solutions Stock Index Fund 23
Schedule of Investments (continued)
as of September 30, 2022
| | | | | | | | |
| | |
| Description | | Shares | | | Value | |
| | |
COMMON STOCKS (Continued) | | | | | | | | |
| | |
Leisure Products 0.0% | | | | | | | | |
| | |
Hasbro, Inc. | | | 2,554 | | | $ | 172,191 | |
| | |
Life Sciences Tools & Services 1.9% | | | | | | | | |
| | |
Agilent Technologies, Inc. | | | 6,198 | | | | 753,367 | |
Bio-Rad Laboratories, Inc. (Class A Stock)* | | | 450 | | | | 187,713 | |
Bio-Techne Corp. | | | 720 | | | | 204,480 | |
Charles River Laboratories International, Inc.* | | | 1,050 | | | | 206,640 | |
Danaher Corp. | | | 13,520 | | | | 3,492,081 | |
Illumina, Inc.* | | | 3,230 | | | | 616,252 | |
IQVIA Holdings, Inc.* | | | 3,910 | | | | 708,257 | |
Mettler-Toledo International, Inc.* | | | 460 | | | | 498,695 | |
PerkinElmer, Inc. | | | 2,570 | | | | 309,248 | |
Thermo Fisher Scientific, Inc. | | | 8,092 | | | | 4,104,181 | |
Waters Corp.* | | | 1,220 | | | | 328,827 | |
West Pharmaceutical Services, Inc. | | | 1,440 | | | | 354,355 | |
| | | | | | | | |
| | |
| | | | | | | 11,764,096 | |
| | |
Machinery 1.6% | | | | | | | | |
| | |
Caterpillar, Inc. | | | 10,796 | | | | 1,771,408 | |
Cummins, Inc. | | | 2,806 | | | | 571,049 | |
Deere & Co. | | | 5,730 | | | | 1,913,190 | |
Dover Corp. | | | 2,962 | | | | 345,310 | |
Fortive Corp. | | | 7,550 | | | | 440,165 | |
IDEX Corp. | | | 1,600 | | | | 319,760 | |
Illinois Tool Works, Inc. | | | 5,886 | | | | 1,063,306 | |
Ingersoll Rand, Inc. | | | 8,729 | | | | 377,616 | |
Nordson Corp. | | | 1,100 | | | | 233,497 | |
Otis Worldwide Corp. | | | 8,764 | | | | 559,143 | |
PACCAR, Inc. | | | 7,164 | | | | 599,555 | |
Parker-Hannifin Corp. | | | 2,668 | | | | 646,483 | |
Pentair PLC | | | 3,646 | | | | 148,137 | |
Snap-on, Inc. | | | 1,142 | | | | 229,942 | |
Stanley Black & Decker, Inc. | | | 3,188 | | | | 239,769 | |
Westinghouse Air Brake Technologies Corp. | | | 3,860 | | | | 314,011 | |
Xylem, Inc. | | | 3,750 | | | | 327,600 | |
| | | | | | | | |
| | |
| | | | | | | 10,099,941 | |
| | |
Media 0.7% | | | | | | | | |
| | |
Charter Communications, Inc. (Class A Stock)*(a) | | | 2,190 | | | | 664,336 | |
Comcast Corp. (Class A Stock) | | | 91,320 | | | | 2,678,416 | |
DISH Network Corp. (Class A Stock)* | | | 5,333 | | | | 73,755 | |
Fox Corp. (Class A Stock) | | | 6,466 | | | | 198,377 | |
Fox Corp. (Class B Stock) | | | 3,366 | | | | 95,931 | |
See Notes to Financial Statements.
24
| | | | | | | | |
| | |
| Description | | Shares | | | Value | |
| | |
COMMON STOCKS (Continued) | | | | | | | | |
| | |
Media (cont’d.) | | | | | | | | |
| | |
Interpublic Group of Cos., Inc. (The) | | | 8,588 | | | $ | 219,853 | |
News Corp. (Class A Stock) | | | 8,475 | | | | 128,057 | |
News Corp. (Class B Stock) | | | 2,700 | | | | 41,634 | |
Omnicom Group, Inc. | | | 4,234 | | | | 267,123 | |
Paramount Global (Class B Stock) | | | 10,497 | | | | 199,863 | |
| | | | | | | | |
| | |
| | | | | | | 4,567,345 | |
| | |
Metals & Mining 0.3% | | | | | | | | |
| | |
Freeport-McMoRan, Inc. | | | 30,242 | | | | 826,514 | |
Newmont Corp. | | | 16,497 | | | | 693,369 | |
Nucor Corp. | | | 5,312 | | | | 568,331 | |
| | | | | | | | |
| | |
| | | | | | | 2,088,214 | |
| | |
Multiline Retail 0.5% | | | | | | | | |
| | |
Dollar General Corp. | | | 4,600 | | | | 1,103,356 | |
Dollar Tree, Inc.* | | | 4,342 | | | | 590,946 | |
Target Corp. | | | 9,582 | | | | 1,421,873 | |
| | | | | | | | |
| | |
| | | | | | | 3,116,175 | |
| | |
Multi-Utilities 0.9% | | | | | | | | |
| | |
Ameren Corp. | | | 5,369 | | | | 432,473 | |
CenterPoint Energy, Inc. | | | 13,579 | | | | 382,656 | |
CMS Energy Corp. | | | 6,000 | | | | 349,440 | |
Consolidated Edison, Inc. | | | 7,451 | | | | 638,998 | |
Dominion Energy, Inc. | | | 17,250 | | | | 1,192,148 | |
DTE Energy Co. | | | 3,987 | | | | 458,704 | |
NiSource, Inc. | | | 8,800 | | | | 221,672 | |
Public Service Enterprise Group, Inc. | | | 10,494 | | | | 590,078 | |
Sempra Energy | | | 6,378 | | | | 956,317 | |
WEC Energy Group, Inc. | | | 6,433 | | | | 575,303 | |
| | | | | | | | |
| | |
| | | | | | | 5,797,789 | |
| | |
Oil, Gas & Consumable Fuels 4.2% | | | | | | | | |
| | |
APA Corp. | | | 7,148 | | | | 244,390 | |
Chevron Corp. | | | 37,147 | | | | 5,336,909 | |
ConocoPhillips | | | 26,381 | | | | 2,699,832 | |
Coterra Energy, Inc. | | | 17,000 | | | | 444,040 | |
Devon Energy Corp. | | | 13,600 | | | | 817,768 | |
Diamondback Energy, Inc. | | | 3,680 | | | | 443,293 | |
EOG Resources, Inc. | | | 12,100 | | | | 1,351,933 | |
EQT Corp. | | | 7,300 | | | | 297,475 | |
See Notes to Financial Statements.
PGIM Quant Solutions Stock Index Fund 25
Schedule of Investments (continued)
as of September 30, 2022
| | | | | | | | |
| | |
| Description | | Shares | | | Value | |
| | |
COMMON STOCKS (Continued) | | | | | | | | |
| | |
Oil, Gas & Consumable Fuels (cont’d.) | | | | | | | | |
| | |
Exxon Mobil Corp.(a) | | | 86,352 | | | $ | 7,539,393 | |
Hess Corp. | | | 5,834 | | | | 635,848 | |
Kinder Morgan, Inc. | | | 40,680 | | | | 676,915 | |
Marathon Oil Corp. | | | 14,078 | | | | 317,881 | |
Marathon Petroleum Corp. | | | 10,376 | | | | 1,030,648 | |
Occidental Petroleum Corp. | | | 15,479 | | | | 951,185 | |
ONEOK, Inc. | | | 9,200 | | | | 471,408 | |
Phillips 66 | | | 10,028 | | | | 809,460 | |
Pioneer Natural Resources Co.(a) | | | 4,900 | | | | 1,060,997 | |
Valero Energy Corp. | | | 8,300 | | | | 886,855 | |
Williams Cos., Inc. (The) | | | 25,292 | | | | 724,110 | |
| | | | | | | | |
| | |
| | | | | | | 26,740,340 | |
| | |
Personal Products 0.2% | | | | | | | | |
| | |
Estee Lauder Cos., Inc. (The) (Class A Stock) | | | 4,770 | | | | 1,029,843 | |
| | |
Pharmaceuticals 4.6% | | | | | | | | |
| | |
Bristol-Myers Squibb Co. | | | 44,279 | | | | 3,147,794 | |
Catalent, Inc.* | | | 3,700 | | | | 267,732 | |
Eli Lilly & Co. | | | 16,297 | | | | 5,269,635 | |
Johnson & Johnson | | | 54,509 | | | | 8,904,590 | |
Merck & Co., Inc. | | | 52,493 | | | | 4,520,697 | |
Organon & Co. | | | 5,509 | | | | 128,911 | |
Pfizer, Inc. | | | 116,363 | | | | 5,092,045 | |
Viatris, Inc. | | | 25,699 | | | | 218,955 | |
Zoetis, Inc. | | | 9,600 | | | | 1,423,584 | |
| | | | | | | | |
| | |
| | | | | | | 28,973,943 | |
| | |
Professional Services 0.4% | | | | | | | | |
| | |
CoStar Group, Inc.* | | | 8,200 | | | | 571,130 | |
Equifax, Inc. | | | 2,530 | | | | 433,718 | |
Jacobs Solutions, Inc. | | | 2,700 | | | | 292,923 | |
Leidos Holdings, Inc. | | | 2,800 | | | | 244,916 | |
Nielsen Holdings PLC | | | 7,400 | | | | 205,128 | |
Robert Half International, Inc. | | | 2,300 | | | | 175,950 | |
Verisk Analytics, Inc. | | | 3,130 | | | | 533,759 | |
| | | | | | | | |
| | |
| | | | | | | 2,457,524 | |
| | |
Real Estate Management & Development 0.1% | | | | | | | | |
| | |
CBRE Group, Inc. (Class A Stock)* | | | 6,600 | | | | 445,566 | |
See Notes to Financial Statements.
26
| | | | | | | | |
| | |
| Description | | Shares | | | Value | |
| | |
COMMON STOCKS (Continued) | | | | | | | | |
| | |
Road & Rail 0.9% | | | | | | | | |
| | |
CSX Corp. | | | 44,354 | | | $ | 1,181,591 | |
J.B. Hunt Transport Services, Inc. | | | 1,750 | | | | 273,735 | |
Norfolk Southern Corp. | | | 4,731 | | | | 991,854 | |
Old Dominion Freight Line, Inc. | | | 1,800 | | | | 447,786 | |
Union Pacific Corp. | | | 12,856 | | | | 2,504,606 | |
| | | | | | | | |
| | |
| | | | | | | 5,399,572 | |
| | |
Semiconductors & Semiconductor Equipment 4.7% | | | | | | | | |
| | |
Advanced Micro Devices, Inc.* | | | 33,428 | | | | 2,117,998 | |
Analog Devices, Inc. | | | 10,816 | | | | 1,507,101 | |
Applied Materials, Inc. | | | 17,988 | | | | 1,473,757 | |
Broadcom, Inc. | | | 8,369 | | | | 3,715,920 | |
Enphase Energy, Inc.* | | | 2,820 | | | | 782,465 | |
Intel Corp. | | | 85,148 | | | | 2,194,264 | |
KLA Corp. | | | 2,930 | | | | 886,706 | |
Lam Research Corp. | | | 2,752 | | | | 1,007,232 | |
Microchip Technology, Inc. | | | 11,520 | | | | 703,066 | |
Micron Technology, Inc. | | | 22,816 | | | | 1,143,082 | |
Monolithic Power Systems, Inc. | | | 890 | | | | 323,426 | |
NVIDIA Corp. | | | 51,940 | | | | 6,304,996 | |
NXP Semiconductors NV (China) | | | 5,460 | | | | 805,405 | |
ON Semiconductor Corp.* | | | 9,200 | | | | 573,436 | |
Qorvo, Inc.* | | | 2,271 | | | | 180,340 | |
QUALCOMM, Inc. | | | 23,300 | | | | 2,632,434 | |
Skyworks Solutions, Inc. | | | 3,400 | | | | 289,918 | |
SolarEdge Technologies, Inc.* | | | 1,200 | | | | 277,752 | |
Teradyne, Inc. | | | 3,200 | | | | 240,480 | |
Texas Instruments, Inc. | | | 18,852 | | | | 2,917,912 | |
| | | | | | | | |
| | |
| | | | | | | 30,077,690 | |
| | |
Software 8.4% | | | | | | | | |
| | |
Adobe, Inc.* | | | 9,580 | | | | 2,636,416 | |
ANSYS, Inc.* | | | 1,700 | | | | 376,890 | |
Autodesk, Inc.* | | | 4,390 | | | | 820,052 | |
Cadence Design Systems, Inc.* | | | 5,700 | | | | 931,551 | |
Ceridian HCM Holding, Inc.* | | | 2,900 | | | | 162,052 | |
Citrix Systems, Inc. | | | 2,560 | | | | 266,240 | |
Fortinet, Inc.* | | | 13,600 | | | | 668,168 | |
Intuit, Inc. | | | 5,950 | | | | 2,304,554 | |
Microsoft Corp. | | | 154,312 | | | | 35,939,265 | |
NortonLifeLock, Inc. | | | 12,517 | | | | 252,092 | |
Oracle Corp. | | | 31,490 | | | | 1,923,094 | |
Paycom Software, Inc.* | | | 950 | | | | 313,491 | |
See Notes to Financial Statements.
PGIM Quant Solutions Stock Index Fund 27
Schedule of Investments (continued)
as of September 30, 2022
| | | | | | | | |
| | |
| Description | | Shares | | | Value | |
| | |
COMMON STOCKS (Continued) | | | | | | | | |
| | |
Software (cont’d.) | | | | | | | | |
| | |
PTC, Inc.* | | | 2,200 | | | $ | 230,120 | |
Roper Technologies, Inc. | | | 2,200 | | | | 791,208 | |
Salesforce, Inc.* | | | 20,460 | | | | 2,942,966 | |
ServiceNow, Inc.* | | | 4,100 | | | | 1,548,201 | |
Synopsys, Inc.* | | | 3,200 | | | | 977,632 | |
Tyler Technologies, Inc.* | | | 920 | | | | 319,700 | |
| | | | | | | | |
| | |
| | | | | | | 53,403,692 | |
| | |
Specialty Retail 2.2% | | | | | | | | |
| | |
Advance Auto Parts, Inc. | | | 1,250 | | | | 195,425 | |
AutoZone, Inc.* | | | 400 | | | | 856,772 | |
Bath & Body Works, Inc. | | | 4,822 | | | | 157,197 | |
Best Buy Co., Inc. | | | 4,300 | | | | 272,362 | |
CarMax, Inc.* | | | 3,200 | | | | 211,264 | |
Home Depot, Inc. (The) | | | 21,164 | | | | 5,839,994 | |
Lowe’s Cos., Inc. | | | 13,266 | | | | 2,491,488 | |
O’Reilly Automotive, Inc.* | | | 1,320 | | | | 928,422 | |
Ross Stores, Inc. | | | 7,300 | | | | 615,171 | |
TJX Cos., Inc. (The) | | | 24,128 | | | | 1,498,831 | |
Tractor Supply Co. | | | 2,200 | | | | 408,936 | |
Ulta Beauty, Inc.* | | | 1,120 | | | | 449,333 | |
| | | | | | | | |
| | |
| | | | | | | 13,925,195 | |
| | |
Technology Hardware, Storage & Peripherals 7.0% | | | | | | | | |
| | |
Apple, Inc. | | | 312,562 | | | | 43,196,068 | |
Hewlett Packard Enterprise Co. | | | 27,902 | | | | 334,266 | |
HP, Inc. | | | 18,802 | | | | 468,546 | |
NetApp, Inc. | | | 4,700 | | | | 290,695 | |
Seagate Technology Holdings PLC | | | 4,100 | | | | 218,243 | |
Western Digital Corp.* | | | 6,825 | | | | 222,154 | |
| | | | | | | | |
| | |
| | | | | | | 44,729,972 | |
| | |
Textiles, Apparel & Luxury Goods 0.4% | | | | | | | | |
| | |
NIKE, Inc. (Class B Stock) | | | 26,174 | | | | 2,175,583 | |
Ralph Lauren Corp. | | | 900 | | | | 76,437 | |
Tapestry, Inc. | | | 5,600 | | | | 159,208 | |
VF Corp. | | | 6,936 | | | | 207,456 | |
| | | | | | | | |
| | |
| | | | | | | 2,618,684 | |
See Notes to Financial Statements.
28
| | | | | | | | | | | | | | |
| | | | |
| Description | | | | | | | Shares | | | Value | |
| | | | |
COMMON STOCKS (Continued) | | | | | | | | | | | | | | |
| | | | |
Tobacco 0.7% | | | | | | | | | | | | | | |
| | | | |
Altria Group, Inc. | | | | | | | | | 37,279 | | | $ | 1,505,326 | |
Philip Morris International, Inc. | | | | | | | | | 31,979 | | | | 2,654,577 | |
| | | | | | | | | | | | | | |
| | | | |
| | | | | | | | | | | | | 4,159,903 | |
| | | | |
Trading Companies & Distributors 0.2% | | | | | | | | | | | | | | |
| | | | |
Fastenal Co. | | | | | | | | | 12,000 | | | | 552,480 | |
United Rentals, Inc.* | | | | | | | | | 1,350 | | | | 364,662 | |
W.W. Grainger, Inc. | | | | | | | | | 944 | | | | 461,795 | |
| | | | | | | | | | | | | | |
| | | | |
| | | | | | | | | | | | | 1,378,937 | |
| | | | |
Water Utilities 0.1% | | | | | | | | | | | | | | |
| | | | |
American Water Works Co., Inc. | | | | | | | | | 3,700 | | | | 481,592 | |
| | | | |
Wireless Telecommunication Services 0.3% | | | | | | | | | | | | | | |
| | | | |
T-Mobile US, Inc.* | | | | | | | | | 12,470 | | | | 1,673,100 | |
| | | | | | | | | | | | | | |
| | | | |
TOTAL COMMON STOCKS
(cost $143,044,141) | | | | | | | | | | | | | 623,775,486 | |
| | | | | | | | | | | | | | |
| | | | |
EXCHANGE-TRADED FUND 0.5% | | | | | | | | | | | | | | |
iShares Core S&P 500 ETF(a)
(cost $2,141,992) | | | | | | | | | 8,700 | | | | 3,120,255 | |
| | | | | | | | | | | | | | |
| | | | |
TOTAL LONG-TERM INVESTMENTS
(cost $145,186,133) | | | | | | | | | | | | | 626,895,741 | |
| | | | | | | | | | | | | | |
| | | | |
SHORT-TERM INVESTMENTS 2.8% | | | | | | | | | | | | | | |
| | | | |
AFFILIATED MUTUAL FUND 1.5% | | | | | | | | | | | | | | |
PGIM Institutional Money Market Fund
(cost $9,712,347; includes $9,686,377 of cash collateral for securities on loan)(b)(wa) | | | | | | | | | 9,721,244 | | | | 9,714,439 | |
| | | | | | | | | | | | | | |
| | | | |
| | | Interest Rate | | Maturity Date | | | Principal
Amount (000)# | | | | |
| | | | |
U.S. TREASURY OBLIGATION(k)(n) 0.1% | | | | | | | | | | | | | | |
U.S. Treasury Bills
(cost $695,399) | | 3.180% | | | 12/15/22 | | | | 700 | | | | 695,930 | |
| | | | | | | | | | | | | | |
See Notes to Financial Statements.
PGIM Quant Solutions Stock Index Fund 29
Schedule of Investments (continued)
as of September 30, 2022
| | | | | | | | |
| | |
| Description | | Shares | | | Value | |
| | |
UNAFFILIATED FUND 1.2% | | | | | | | | |
Dreyfus Government Cash Management (Institutional Shares)
(cost $7,424,366) | | | 7,424,366 | | | $ | 7,424,366 | |
| | | | | | | | |
| | |
TOTAL SHORT-TERM INVESTMENTS
(cost $17,832,112) | | | | | | | 17,834,735 | |
| | | | | | | | |
| | |
TOTAL INVESTMENTS 101.6%
(cost $163,018,245) | | | | | | | 644,730,476 | |
Liabilities in excess of other assets(z) (1.6)% | | | | | | | (10,336,931 | ) |
| | | | | | | | |
| | |
NET ASSETS 100.0% | | | | | | $ | 634,393,545 | |
| | | | | | | | |
Below is a list of the abbreviation(s) used in the annual report:
ETF—Exchange-Traded Fund
LIBOR—London Interbank Offered Rate
OTC—Over-the-counter
REITs—Real Estate Investment Trust
S&P—Standard & Poor’s
SOFR—Secured Overnight Financing Rate
| * | Non-income producing security. |
| # | Principal amount is shown in U.S. dollars unless otherwise stated. |
| (a) | All or a portion of security is on loan. The aggregate market value of such securities, including those sold and pending settlement, is $9,326,393; cash collateral of $9,686,377 (included in liabilities) was received with which the Fund purchased highly liquid short-term investments. In the event of significant appreciation in value of securities on loan on the last business day of the reporting period, the Fund may reflect a collateral value that is less than the market value of the loaned securities and such shortfall is remedied the following business day. |
| (b) | Represents security, or portion thereof, purchased with cash collateral received for securities on loan and includes dividend reinvestment. |
| (g) | An affiliated security. |
| (k) | Represents security, or a portion thereof, segregated as collateral for centrally cleared/exchange-traded derivatives. |
| (n) | Rate shown reflects yield to maturity at purchased date. |
| (wa) | PGIM Investments LLC, the manager of the Fund, also serves as manager of the PGIM Core Ultra Short Bond Fund and PGIM Institutional Money Market Fund, if applicable. |
| (z) | Includes net unrealized appreciation/(depreciation) and/or market value of the below holdings which are excluded from the Schedule of Investments: |
Futures contracts outstanding at September 30, 2022:
| | | | | | | | | | | | | | | | | | |
Number of Contracts | | Type | | Expiration
Date | | | Current
Notional
Amount | | | Value / Unrealized
Appreciation
(Depreciation) |
| | | | | | | | | | | | | | |
Long Position: | | | | | | | | | | | | | | | | |
45 S&P 500 E-Mini Index | | | Dec. 2022 | | | $ | 8,103,375 | | | | | $ | (1,088,603 | ) | | |
| | | | | | | | | | | | | | | | | | |
See Notes to Financial Statements.
30
Summary of Collateral for Centrally Cleared/Exchange-traded Derivatives:
Cash and securities segregated as collateral, including pending settlement for closed positions, to cover requirements for centrally cleared/exchange-traded derivatives are listed by broker as follows:
| | | | | | | | | | |
Broker | | Cash and/or Foreign Currency | | Securities Market Value |
| | |
| UBS Securities LLC | | | $ | — | | | | $ | 695,930 | |
| | | | | | | | | | |
Fair Value Measurements:
Various inputs are used in determining the value of the Fund’s investments. These inputs are summarized in the three broad levels listed below.
Level 1—unadjusted quoted prices generally in active markets for identical securities.
Level 2—quoted prices for similar securities, interest rates and yield curves, prepayment speeds, foreign currency exchange rates and other observable inputs.
Level 3—unobservable inputs for securities valued in accordance with Board approved fair valuation procedures.
The following is a summary of the inputs used as of September 30, 2022 in valuing such portfolio securities:
| | | | | | | | | | | | |
| | | Level 1 | | | Level 2 | | | Level 3 | |
Investments in Securities | | | | | | | | | | | | |
Assets | | | | | | | | | | | | |
Long-Term Investments | | | | | | | | | | | | |
Common Stocks | | | | | | | | | | | | |
Aerospace & Defense | | $ | 10,182,700 | | | $ | — | | | | $— | |
Air Freight & Logistics | | | 3,698,953 | | | | — | | | | — | |
Airlines | | | 1,290,909 | | | | — | | | | — | |
Auto Components | | | 576,965 | | | | — | | | | — | |
Automobiles | | | 16,532,684 | | | | — | | | | — | |
Banks | | | 23,180,501 | | | | — | | | | — | |
Beverages | | | 11,669,725 | | | | — | | | | — | |
Biotechnology | | | 13,911,315 | | | | — | | | | — | |
Building Products | | | 2,718,616 | | | | — | | | | — | |
Capital Markets | | | 18,438,553 | | | | — | | | | — | |
Chemicals | | | 11,090,014 | | | | — | | | | — | |
Commercial Services & Supplies | | | 3,124,282 | | | | — | | | | — | |
Communications Equipment | | | 5,122,038 | | | | — | | | | — | |
Construction & Engineering | | | 369,431 | | | | — | | | | — | |
Construction Materials | | | 844,534 | | | | — | | | | — | |
Consumer Finance | | | 3,198,677 | | | | — | | | | — | |
Containers & Packaging | | | 1,713,476 | | | | — | | | | — | |
Distributors | | | 947,634 | | | | — | | | | — | |
Diversified Financial Services | | | 9,983,878 | | | | — | | | | — | |
Diversified Telecommunication Services | | | 5,714,873 | | | | — | | | | — | |
Electric Utilities | | | 12,655,937 | | | | — | | | | — | |
Electrical Equipment | | | 3,278,833 | | | | — | | | | — | |
Electronic Equipment, Instruments & Components | | | 3,849,953 | | | | — | | | | — | |
See Notes to Financial Statements.
PGIM Quant Solutions Stock Index Fund 31
Schedule of Investments (continued)
as of September 30, 2022
| | | | | | | | | | | | |
| | | Level 1 | | | Level 2 | | | Level 3 | |
Investments in Securities (continued) | | | | | | | | | | | | |
Assets (continued) | | | | | | | | | | | | |
Long-Term Investments (continued) | | | | | | | | | | | | |
Common Stocks (continued) | | | | | | | | | | | | |
Energy Equipment & Services | | $ | 1,977,170 | | | $ | — | | | | $— | |
Entertainment | | | 8,525,372 | | | | — | | | | — | |
Equity Real Estate Investment Trusts (REITs) | | | 16,974,930 | | | | — | | | | — | |
Food & Staples Retailing | | | 9,946,529 | | | | — | | | | — | |
Food Products | | | 7,142,828 | | | | — | | | | — | |
Gas Utilities | | | 295,365 | | | | — | | | | — | |
Health Care Equipment & Supplies | | | 16,619,055 | | | | — | | | | — | |
Health Care Providers & Services | | | 22,715,724 | | | | — | | | | — | |
Hotels, Restaurants & Leisure | | | 11,819,619 | | | | — | | | | — | |
Household Durables | | | 1,871,650 | | | | — | | | | — | |
Household Products | | | 8,963,694 | | | | — | | | | — | |
Independent Power & Renewable Electricity Producers | | | 314,140 | | | | — | | | | — | |
Industrial Conglomerates | | | 5,009,856 | | | | — | | | | — | |
Insurance | | | 13,827,525 | | | | — | | | | — | |
Interactive Media & Services | | | 29,831,706 | | | | — | | | | — | |
Internet & Direct Marketing Retail | | | 21,391,950 | | | | — | | | | — | |
IT Services | | | 27,352,588 | | | | — | | | | — | |
Leisure Products | | | 172,191 | | | | — | | | | — | |
Life Sciences Tools & Services | | | 11,764,096 | | | | — | | | | — | |
Machinery | | | 10,099,941 | | | | — | | | | — | |
Media | | | 4,567,345 | | | | — | | | | — | |
Metals & Mining | | | 2,088,214 | | | | — | | | | — | |
Multiline Retail | | | 3,116,175 | | | | — | | | | — | |
Multi-Utilities | | | 5,797,789 | | | | — | | | | — | |
Oil, Gas & Consumable Fuels | | | 26,740,340 | | | | — | | | | — | |
Personal Products | | | 1,029,843 | | | | — | | | | — | |
Pharmaceuticals | | | 28,973,943 | | | | — | | | | — | |
Professional Services | | | 2,457,524 | | | | — | | | | — | |
Real Estate Management & Development | | | 445,566 | | | | — | | | | — | |
Road & Rail | | | 5,399,572 | | | | — | | | | — | |
Semiconductors & Semiconductor Equipment | | | 30,077,690 | | | | — | | | | — | |
Software | | | 53,137,452 | | | | 266,240 | | | | — | |
Specialty Retail | | | 13,925,195 | | | | — | | | | — | |
Technology Hardware, Storage & Peripherals | | | 44,729,972 | | | | — | | | | — | |
Textiles, Apparel & Luxury Goods | | | 2,618,684 | | | | — | | | | — | |
Tobacco | | | 4,159,903 | | | | — | | | | — | |
Trading Companies & Distributors | | | 1,378,937 | | | | — | | | | — | |
Water Utilities | | | 481,592 | | | | — | | | | — | |
Wireless Telecommunication Services | | | 1,673,100 | | | | — | | | | — | |
Exchange-Traded Fund | | | 3,120,255 | | | | — | | | | — | |
Short-Term Investments | | | | | | | | | | | | |
Affiliated Mutual Fund | | | 9,714,439 | | | | — | | | | — | |
See Notes to Financial Statements.
32
| | | | | | | | | | | | | | | | | | | | |
| | | Level 1 | | | Level 2 | | | Level 3 | |
Investments in Securities (continued) | | | | | | | | | | | | | | | | | | | | |
Assets (continued) | | | | | | | | | | | | | | | | | | | | |
Short-Term Investments (continued) | | | | | | | | | | | | | | | | | | | | |
U.S. Treasury Obligation | | $ | — | | | $ | 695,930 | | | | | | | | $— | | | | | |
Unaffiliated Fund | | | 7,424,366 | | | | — | | | | | | | | — | | | | | |
| | | | | | | | | | | | | | | | | | | | |
| | | | | |
Total | | $ | 643,768,306 | | | $ | 962,170 | | | | | | | | $— | | | | | |
| | | | | | | | | | | | |
| | | | | |
Other Financial Instruments* | | | | | | | | | | | | | | | | | | | | |
Liabilities | | | | | | | | | | | | | | | | | | | | |
Futures Contracts | | $ | (1,088,603 | ) | | $ | — | | | | | | | | $— | | | | | |
| | | | | | | | | | | | |
| * | Other financial instruments are derivative instruments not reflected in the Schedule of Investments, such as futures, forwards and centrally cleared swap contracts, which are recorded at the unrealized appreciation (depreciation) on the instrument, and OTC swap contracts which are recorded at fair value. |
Industry Classification:
The industry classification of investments and liabilities in excess of other assets shown as a percentage of net assets as of September 30, 2022 were as follows:
| | | | |
Software | | | 8.4 | % |
Technology Hardware, Storage & Peripherals | �� | | 7.0 | |
Semiconductors & Semiconductor Equipment | | | 4.7 | |
Interactive Media & Services | | | 4.7 | |
Pharmaceuticals | | | 4.6 | |
IT Services | | | 4.3 | |
Oil, Gas & Consumable Fuels | | | 4.2 | |
Banks | | | 3.7 | |
Health Care Providers & Services | | | 3.6 | |
Internet & Direct Marketing Retail | | | 3.4 | |
Capital Markets | | | 2.9 | |
Equity Real Estate Investment Trusts (REITs) | | | 2.7 | |
Health Care Equipment & Supplies | | | 2.6 | |
Automobiles | | | 2.6 | |
Specialty Retail | | | 2.2 | |
Biotechnology | | | 2.2 | |
Insurance | | | 2.2 | |
Electric Utilities | | | 2.0 | |
Hotels, Restaurants & Leisure | | | 1.9 | |
Life Sciences Tools & Services | | | 1.9 | |
Beverages | | | 1.8 | |
Chemicals | | | 1.7 | |
Aerospace & Defense | | | 1.6 | |
Machinery | | | 1.6 | |
Diversified Financial Services | | | 1.6 | |
| | | | |
Food & Staples Retailing | | | 1.6 | % |
Affiliated Mutual Fund (1.5% represents investments purchased with collateral from securities on loan) | | | 1.5 | |
Household Products | | | 1.4 | |
Entertainment | | | 1.3 | |
Unaffiliated Fund | | | 1.2 | |
Food Products | | | 1.1 | |
Multi-Utilities | | | 0.9 | |
Diversified Telecommunication Services | | | 0.9 | |
Road & Rail | | | 0.9 | |
Communications Equipment | | | 0.8 | |
Industrial Conglomerates | | | 0.8 | |
Media | | | 0.7 | |
Tobacco | | | 0.7 | |
Electronic Equipment, Instruments & Components | | | 0.6 | |
Air Freight & Logistics | | | 0.6 | |
Electrical Equipment | | | 0.5 | |
Consumer Finance | | | 0.5 | |
Commercial Services & Supplies | | | 0.5 | |
Exchange-Traded Fund | | | 0.5 | |
Multiline Retail | | | 0.5 | |
Building Products | | | 0.4 | |
Textiles, Apparel & Luxury Goods | | | 0.4 | |
Professional Services | | | 0.4 | |
Metals & Mining | | | 0.3 | |
See Notes to Financial Statements.
PGIM Quant Solutions Stock Index Fund 33
Schedule of Investments (continued)
as of September 30, 2022
Industry Classification (continued):
| | | | |
Energy Equipment & Services | | | 0.3 | % |
Household Durables | | | 0.3 | |
Containers & Packaging | | | 0.3 | |
Wireless Telecommunication Services | | | 0.3 | |
Trading Companies & Distributors | | | 0.2 | |
Airlines | | | 0.2 | |
Personal Products | | | 0.2 | |
Distributors | | | 0.1 | |
Construction Materials | | | 0.1 | |
U.S. Treasury Obligation | | | 0.1 | |
Auto Components | | | 0.1 | |
Water Utilities | | | 0.1 | |
Real Estate Management & Development | | | 0.1 | |
| | | | |
Construction & Engineering | | | 0.1 | % |
Independent Power & Renewable Electricity Producers | | | 0.0 | * |
Gas Utilities | | | 0.0 | * |
Leisure Products | | | 0.0 | * |
| | | | |
| |
| | | 101.6 | |
Liabilities in excess of other assets | | | (1.6 | ) |
| | | | |
| |
| | | 100.0 | % |
| | | | |
Effects of Derivative Instruments on the Financial Statements and Primary Underlying Risk Exposure:
The Fund invested in derivative instruments during the reporting period. The primary type of risk associated with these derivative instruments is equity contracts risk. See the Notes to Financial Statements for additional detail regarding these derivative instruments and their risks. The effect of such derivative instruments on the Fund’s financial position and financial performance as reflected in the Statement of Assets and Liabilities and Statement of Operations is presented in the summary below.
Fair values of derivative instruments as of September 30, 2022 as presented in the Statement of Assets and Liabilities:
| | | | | | | | | | | | |
| | | Asset Derivatives | | | Liability Derivatives | |
| | | | |
Derivatives not accounted for as
hedging instruments, carried at
fair value | | Statement of
Assets and
�� Liabilities Location | | Fair
Value | | | Statement of
Assets and
Liabilities Location | | Fair
Value | |
Equity contracts | | — | | | $— | | | Due from/to
broker-variation margin
futures | | $ | 1,088,603 | * |
| | | | | | | | | | | | |
| * | Includes cumulative appreciation (depreciation) as reported in the schedule of open futures and centrally cleared swap contracts. Only unsettled variation margin receivable (payable) is reported within the Statement of Assets and Liabilities. |
The effects of derivative instruments on the Statement of Operations for the year ended September 30, 2022 are as follows:
| | | | |
| Amount of Realized Gain (Loss) on Derivatives Recognized in Income | |
| |
| |
Derivatives not accounted for as hedging instruments, carried at fair value | | Futures | |
Equity contracts | | $ | (956,534 | ) |
| | | | |
See Notes to Financial Statements.
34
| | | | |
| Change in Unrealized Appreciation (Depreciation) on Derivatives Recognized in Income | |
| |
| |
Derivatives not accounted for as hedging instruments, carried at fair value | | Futures | |
Equity contracts | | $ | (642,991 | ) |
| | | | |
For the year ended September 30, 2022, the Fund’s average volume of derivative activities is as follows:
| | |
| Derivative Contract Type | | Average Volume of Derivative Activities* |
Futures Contracts - Long Positions (1) | | $10,644,383 |
| * | Average volume is based on average quarter end balances as noted for the year ended September 30, 2022. |
| (1) | Notional Amount in USD. |
Financial Instruments/Transactions—Summary of Offsetting and Netting Arrangements:
The Fund entered into financial instruments/transactions during the reporting period that are either offset in accordance with current requirements or are subject to enforceable master netting arrangements or similar agreements that permit offsetting. The information about offsetting and related netting arrangements for financial instruments/transactions where the legal right to set-off exists is presented in the summary below.
Offsetting of financial instrument/transaction assets and liabilities:
| | | | | | |
| Description | | Gross Market Value of Recognized Assets/(Liabilities) | | Collateral Pledged/(Received)(1) | | Net Amount |
Securities on Loan | | $9,326,393 | | $(9,326,393) | | $— |
| (1) | Collateral amount disclosed by the Fund is limited to the market value of financial instruments/transactions. |
See Notes to Financial Statements.
PGIM Quant Solutions Stock Index Fund 35
Statement of Assets and Liabilities
as of September 30, 2022
| | | | | | | | |
| | |
Assets | | | | | | | | |
| | |
Investments at value, including securities on loan of $9,326,393: | | | | | | | | |
Unaffiliated investments (cost $153,061,985) | | $ | 634,338,375 | | | | | |
Affiliated investments (cost $9,956,260) | | | 10,392,101 | | | | | |
Cash | | | 31 | | | | | |
Dividends and interest receivable | | | 520,131 | | | | | |
Receivable for Fund shares sold | | | 499,028 | | | | | |
Receivable for investments sold | | | 451,886 | | | | | |
Prepaid expenses and other assets | | | 35,325 | | | | | |
| | | | | | | | |
| | |
Total Assets | | | 646,236,877 | | | | | |
| | | | | | | | |
| | |
Liabilities | | | | | | | | |
| | |
Payable to broker for collateral for securities on loan | | | 9,686,377 | | | | | |
Payable for Fund shares purchased | | | 1,007,969 | | | | | |
Payable for investments purchased | | | 692,425 | | | | | |
Accrued expenses and other liabilities | | | 153,197 | | | | | |
Due to broker—variation margin futures | | | 118,688 | | | | | |
Distribution fee payable | | | 108,648 | | | | | |
Management fee payable | | | 45,314 | | | | | |
Affiliated transfer agent fee payable | | | 30,714 | | | | | |
| | | | | | | | |
| | |
Total Liabilities | | | 11,843,332 | | | | | |
| | | | | | | | |
| | |
Net Assets | | $ | 634,393,545 | | | | | |
| | | | | | | | |
| | |
| | | | | | | | | |
| | |
Net assets were comprised of: | | | | | | | | |
Shares of beneficial interest, at par | | $ | 17,699 | | | | | |
Paid-in capital in excess of par | | | 62,053,140 | | | | | |
Total distributable earnings (loss) | | | 572,322,706 | | | | | |
| | | | | | | | |
Net assets, September 30, 2022 | | $ | 634,393,545 | | | | | |
| | | | | | | | |
See Notes to Financial Statements.
36
| | | | | | | | |
| | |
Class A | | | | | | | | |
| | |
Net asset value and redemption price per share, ($248,713,941 ÷ 6,962,499 shares of beneficial interest issued and outstanding) | | $ | 35.72 | | | | | |
Maximum sales charge (3.25% of offering price) | | | 1.20 | | | | | |
| | | | | | | | |
Maximum offering price to public | | $ | 36.92 | | | | | |
| | | | | | | | |
| | |
Class C | | | | | | | | |
| | |
Net asset value, offering price and redemption price per share, ($46,543,143 ÷ 1,331,802 shares of beneficial interest issued and outstanding) | | $ | 34.95 | | | | | |
| | | | | | | | |
| | |
Class I | | | | | | | | |
| | |
Net asset value, offering price and redemption price per share, ($120,777,828 ÷ 3,349,476 shares of beneficial interest issued and outstanding) | | $ | 36.06 | | | | | |
| | | | | | | | |
| | |
Class Z | | | | | | | | |
| | |
Net asset value, offering price and redemption price per share, ($160,673,531 ÷ 4,456,920 shares of beneficial interest issued and outstanding) | | $ | 36.05 | | | | | |
| | | | | | | | |
| | |
Class R6 | | | | | | | | |
| | |
Net asset value, offering price and redemption price per share, ($57,685,102 ÷ 1,598,318 shares of beneficial interest issued and outstanding) | | $ | 36.09 | | | | | |
| | | | | | | | |
See Notes to Financial Statements.
PGIM Quant Solutions Stock Index Fund 37
Statement of Operations
Year Ended September 30, 2022
| | | | |
Net Investment Income (Loss) | | | | |
| |
Income | | | | |
Unaffiliated dividend income (net of $2,689 foreign withholding tax) | | $ | 12,057,819 | |
Affiliated dividend income | | | 42,453 | |
Income from securities lending, net (including affiliated income of $11,800) | | | 18,613 | |
Interest income | | | 5,698 | |
| | | | |
| |
Total income | | | 12,124,583 | |
| | | | |
| |
Expenses | | | | |
Management fee | | | 1,221,125 | |
Distribution fee(a) | | | 1,559,589 | |
Transfer agent’s fees and expenses (including affiliated expense of $202,443)(a) | | | 803,720 | |
Custodian and accounting fees | | | 87,728 | |
Registration fees(a) | | | 64,906 | |
Shareholders’ reports | | | 48,978 | |
Legal fees and expenses | | | 24,393 | |
Audit fee | | | 24,350 | |
Trustees’ fees | | | 19,400 | |
Miscellaneous | | | 35,585 | |
| | | | |
| |
Total expenses | | | 3,889,774 | |
Less: Fee waiver and/or expense reimbursement(a) | | | (569,858 | ) |
| | | | |
| |
Net expenses | | | 3,319,916 | |
| | | | |
| |
Net investment income (loss) | | | 8,804,667 | |
| | | | |
| |
Realized And Unrealized Gain (Loss) On Investments | | | | |
| |
Net realized gain (loss) on: | | | | |
Investment transactions (including affiliated of $88,576) | | | 86,145,100 | |
Futures transactions | | | (956,534 | ) |
| | | | |
| |
| | | 85,188,566 | |
| | | | |
Net change in unrealized appreciation (depreciation) on: | | | | |
Investments (including affiliated of $(234,994)) | | | (211,744,595 | ) |
Futures | | | (642,991 | ) |
| | | | |
| |
| | | (212,387,586 | ) |
| | | | |
| |
Net gain (loss) on investment transactions | | | (127,199,020 | ) |
| | | | |
| |
Net Increase (Decrease) In Net Assets Resulting From Operations | | $ | (118,394,353 | ) |
| | | | |
| (a) | Class specific expenses and waivers were as follows: |
| | | | | | | | | | | | | | | | | | | | | | | | | |
| | | | | |
| | | Class A | | Class C | | Class I | | Class Z | | Class R6 |
Distribution fee | | | | 940,592 | | | | | 618,997 | | | | | — | | | | | — | | | | | — | |
Transfer agent’s fees and expenses | | | | 331,415 | | | | | 48,289 | | | | | 113,378 | | | | | 309,600 | | | | | 1,038 | |
Registration fees | | | | 20,537 | | | | | 13,413 | | | | | 9,685 | | | | | 10,061 | | | | | 11,210 | |
Fee waiver and/or expense reimbursement | | | | (219,471 | ) | | | | (43,330 | ) | | | | (113,378 | ) | | | | (166,708 | ) | | | | (26,971 | ) |
See Notes to Financial Statements.
38
Statements of Changes in Net Assets
| | | | | | | | |
| |
| | | Year Ended September 30, | |
| | | | |
| | |
| | | 2022 | | | 2021 | |
| | |
Increase (Decrease) in Net Assets | | | | | | | | |
| | |
Operations | | | | | | | | |
Net investment income (loss) | | $ | 8,804,667 | | | $ | 8,712,938 | |
Net realized gain (loss) on investment transactions | | | 85,188,566 | | | | 94,450,236 | |
Net change in unrealized appreciation (depreciation) on investments | | | (212,387,586 | ) | | | 109,505,721 | |
| | | | | | | | |
Net increase (decrease) in net assets resulting from operations | | | (118,394,353 | ) | | | 212,668,895 | |
| | | | | | | | |
| | |
Dividends and Distributions | | | | | | | | |
Distributions from distributable earnings | | | | | | | | |
Class A | | | (35,916,717 | ) | | | (70,372,499 | ) |
Class C | | | (6,999,155 | ) | | | (15,500,376 | ) |
Class I | | | (19,639,235 | ) | | | (42,109,552 | ) |
Class Z | | | (29,447,083 | ) | | | (55,975,223 | ) |
Class R6 | | | (3,459,618 | ) | | | (3,271,898 | ) |
| | | | | | | | |
| | | (95,461,808 | ) | | | (187,229,548 | ) |
| | | | | | | | |
| | |
Fund share transactions (Net of share conversions) | | | | | | | | |
Net proceeds from shares sold | | | 132,481,534 | | | | 128,254,915 | |
Net asset value of shares issued in reinvestment of dividends and distributions | | | 95,106,775 | | | | 186,438,027 | |
Cost of shares purchased | | | (247,306,418 | ) | | | (234,923,478 | ) |
| | | | | | | | |
Net increase (decrease) in net assets from Fund share transactions | | | (19,718,109 | ) | | | 79,769,464 | |
| | | | | | | | |
Total increase (decrease) | | | (233,574,270 | ) | | | 105,208,811 | |
| | |
Net Assets: | | | | | | | | |
| | |
Beginning of year | | | 867,967,815 | | | | 762,759,004 | |
| | | | | | | | |
End of year | | $ | 634,393,545 | | | $ | 867,967,815 | |
| | | | | | | | |
See Notes to Financial Statements.
PGIM Quant Solutions Stock Index Fund 39
Financial Highlights
| | | | | | | | | | | | | | | | | | | | |
| | | | | | |
Class A Shares | | | | | | | | | | | | | | | | | | | | |
| | | Year Ended September 30, | |
| | | | | | |
| | | 2022 | | | 2021 | | | 2020 | | | 2019 | | | 2018 | |
| | | | | | |
Per Share Operating Performance(a) : | | | | | | | | | | | | | | | | | | | | |
Net Asset Value, Beginning of Year | | | $47.35 | | | | $47.07 | | | | $48.46 | | | | $57.19 | | | | $51.67 | |
Income (loss) from investment operations: | | | | | | | | | | | | | | | | | | | | |
Net investment income (loss) | | | 0.42 | | | | 0.42 | | | | 0.60 | | | | 0.70 | | | | 0.73 | |
| Net realized and unrealized gain (loss) on investment transactions | | | (6.76 | ) | | | 11.36 | | | | 6.00 | | | | (0.04 | ) | | | 7.91 | |
Total from investment operations | | | (6.34 | ) | | | 11.78 | | | | 6.60 | | | | 0.66 | | | | 8.64 | |
Less Dividends and Distributions: | | | | | | | | | | | | | | | | | | | | |
Dividends from net investment income | | | (0.40 | ) | | | (0.72 | ) | | | (0.59 | ) | | | (1.04 | ) | | | (0.70 | ) |
Distributions from net realized gains | | | (4.89 | ) | | | (10.78 | ) | | | (7.40 | ) | | | (8.35 | ) | | | (2.42 | ) |
Total dividends and distributions | | | (5.29 | ) | | | (11.50 | ) | | | (7.99 | ) | | | (9.39 | ) | | | (3.12 | ) |
Net asset value, end of year | | | $35.72 | | | | $47.35 | | | | $47.07 | | | | $48.46 | | | | $57.19 | |
Total Return(b): | | | (15.91 | )% | | | 29.24 | % | | | 14.72 | % | | | 3.75 | % | | | 17.34 | % |
| | | | | | | | | | | | | | | | | | | | | |
| | | | | | |
Ratios/Supplemental Data: | | | | | | | | | | | | | | | | | | | | |
Net assets, end of year (000) | | | $248,714 | | | | $337,161 | | | | $295,551 | | | | $287,076 | | | | $276,785 | |
Average net assets (000) | | | $313,531 | | | | $331,222 | | | | $285,833 | | | | $266,336 | | | | $272,887 | |
Ratios to average net assets(c): | | | | | | | | | | | | | | | | | | | | |
| Expenses after waivers and/or expense reimbursement | | | 0.52 | % | | | 0.52 | % | | | 0.53 | % | | | 0.54 | % | | | 0.52 | % |
| Expenses before waivers and/or expense reimbursement | | | 0.59 | % | | | 0.59 | % | | | 0.60 | % | | | 0.61 | % | | | 0.59 | % |
Net investment income (loss) | | | 0.97 | % | | | 0.92 | % | | | 1.35 | % | | | 1.48 | % | | | 1.36 | % |
Portfolio turnover rate(d) | | | 3 | % | | | 5 | % | | | 2 | % | | | 3 | % | | | 2 | % |
| (a) | Calculated based on average shares outstanding during the year. |
| (b) | Total return does not consider the effects of sales loads. Total return is calculated assuming a purchase of a share on the first day and a sale on the last day of each year reported and includes reinvestment of dividends and distributions, if any. Total returns may reflect adjustments to conform to GAAP. |
| (c) | Does not include expenses of the underlying funds in which the Fund invests. |
| (d) | The Fund’s portfolio turnover rate is calculated in accordance with regulatory requirements, without regard to transactions involving short-term investments, certain derivatives and in-kind transactions (if any). If such transactions were included, the Fund’s portfolio turnover rate may be higher. |
See Notes to Financial Statements.
40
| | | | | | | | | | | | | | | | | | | | |
| | | | | | |
Class C Shares | | | | | | | | | | | | | | | | | | | | |
| | | Year Ended September 30, | |
| | | | | | |
| | | 2022 | | | 2021 | | | 2020 | | | 2019 | | | 2018 | |
| | | | | | |
Per Share Operating Performance(a): | | | | | | | | | | | | | | | | | | | | |
Net Asset Value, Beginning of Year | | | $46.45 | | | | $46.37 | | | | $47.92 | | | | $56.50 | | | | $51.19 | |
Income (loss) from investment operations: | | | | | | | | | | | | | | | | | | | | |
Net investment income (loss) | | | 0.12 | | | | 0.12 | | | | 0.30 | | | | 0.39 | | | | 0.37 | |
| Net realized and unrealized gain (loss) on investment transactions | | | (6.63 | ) | | | 11.17 | | | | 5.92 | | | | (0.02 | ) | | | 7.83 | |
Total from investment operations | | | (6.51 | ) | | | 11.29 | | | | 6.22 | | | | 0.37 | | | | 8.20 | |
Less Dividends and Distributions: | | | | | | | | | | | | | | | | | | | | |
Dividends from net investment income | | | (0.10 | ) | | | (0.43 | ) | | | (0.37 | ) | | | (0.60 | ) | | | (0.47 | ) |
Distributions from net realized gains | | | (4.89 | ) | | | (10.78 | ) | | | (7.40 | ) | | | (8.35 | ) | | | (2.42 | ) |
Total dividends and distributions | | | (4.99 | ) | | | (11.21 | ) | | | (7.77 | ) | | | (8.95 | ) | | | (2.89 | ) |
Net asset value, end of year | | | $34.95 | | | | $46.45 | | | | $46.37 | | | | $47.92 | | | | $56.50 | |
Total Return(b): | | | (16.48 | )% | | | 28.37 | % | | | 13.98 | % | | | 3.08 | % | | | 16.56 | % |
| | | | | | | | | | | | | | | | | | | | | |
| | | | | | |
Ratios/Supplemental Data: | | | | | | | | | | | | | | | | | | | | |
Net assets, end of year (000) | | | $46,543 | | | | $66,318 | | | | $66,347 | | | | $70,382 | | | | $108,459 | |
Average net assets (000) | | | $61,900 | | | | $67,968 | | | | $67,889 | | | | $84,898 | | | | $102,726 | |
Ratios to average net assets(c): | | | | | | | | | | | | | | | | | | | | |
| Expenses after waivers and/or expense reimbursement | | | 1.21 | % | | | 1.19 | % | | | 1.20 | % | | | 1.19 | % | | | 1.18 | % |
| Expenses before waivers and/or expense reimbursement | | | 1.28 | % | | | 1.26 | % | | | 1.27 | % | | | 1.26 | % | | | 1.25 | % |
Net investment income (loss) | | | 0.28 | % | | | 0.26 | % | | | 0.69 | % | | | 0.84 | % | | | 0.70 | % |
Portfolio turnover rate(d) | | | 3 | % | | | 5 | % | | | 2 | % | | | 3 | % | | | 2 | % |
| (a) | Calculated based on average shares outstanding during the year. |
| (b) | Total return does not consider the effects of sales loads. Total return is calculated assuming a purchase of a share on the first day and a sale on the last day of each year reported and includes reinvestment of dividends and distributions, if any. Total returns may reflect adjustments to conform to GAAP. |
| (c) | Does not include expenses of the underlying funds in which the Fund invests. |
| (d) | The Fund’s portfolio turnover rate is calculated in accordance with regulatory requirements, without regard to transactions involving short-term investments, certain derivatives and in-kind transactions (if any). If such transactions were included, the Fund’s portfolio turnover rate may be higher. |
See Notes to Financial Statements.
PGIM Quant Solutions Stock Index Fund 41
Financial Highlights (continued)
| | | | | | | | | | | | | | | | | | | | |
| | | | | | |
Class I Shares | | | | | | | | | | | | | | | | | | | | |
| | | Year Ended September 30, | |
| | | 2022 | | | 2021 | | | 2020 | | | 2019 | | | 2018 | |
| | | | | | |
Per Share Operating Performance(a): | | | | | | | | | | | | | | | | | | | | |
Net Asset Value, Beginning of Year | | | $47.75 | | | | $47.38 | | | | $48.70 | | | | $57.50 | | | | $51.89 | |
Income (loss) from investment operations: | | | | | | | | | | | | | | | | | | | | |
Net investment income (loss) | | | 0.57 | | | | 0.58 | | | | 0.77 | | | | 0.87 | | | | 0.91 | |
| Net realized and unrealized gain (loss) on investment transactions | | | (6.81 | ) | | | 11.44 | | | | 6.03 | | | | (0.06 | ) | | | 7.95 | |
Total from investment operations | | | (6.24 | ) | | | 12.02 | | | | 6.80 | | | | 0.81 | | | | 8.86 | |
Less Dividends and Distributions: | | | | | | | | | | | | | | | | | | | | |
Dividends from net investment income | | | (0.56 | ) | | | (0.87 | ) | | | (0.72 | ) | | | (1.26 | ) | | | (0.83 | ) |
Distributions from net realized gains | | | (4.89 | ) | | | (10.78 | ) | | | (7.40 | ) | | | (8.35 | ) | | | (2.42 | ) |
Total dividends and distributions | | | (5.45 | ) | | | (11.65 | ) | | | (8.12 | ) | | | (9.61 | ) | | | (3.25 | ) |
Net asset value, end of year | | | $36.06 | | | | $47.75 | | | | $47.38 | | | | $48.70 | | | | $57.50 | |
Total Return(b): | | | (15.63 | )% | | | 29.69 | % | | | 15.11 | % | | | 4.12 | % | | | 17.72 | % |
| | | | | | | | | | | | | | | | | | | | | |
| | | | | | |
Ratios/Supplemental Data: | | | | | | | | | | | | | | | | | | | | |
Net assets, end of year (000) | | | $120,778 | | | | $172,635 | | | | $142,746 | | | | $228,063 | | | | $290,252 | |
Average net assets (000) | | | $161,968 | | | | $164,271 | | | | $204,880 | | | | $239,501 | | | | $289,170 | |
Ratios to average net assets(c): | | | | | | | | | | | | | | | | | | | | |
| Expenses after waivers and/or expense reimbursement | | | 0.19 | % | | | 0.19 | % | | | 0.19 | % | | | 0.19 | % | | | 0.18 | % |
| Expenses before waivers and/or expense reimbursement | | | 0.26 | % | | | 0.26 | % | | | 0.26 | % | | | 0.26 | % | | | 0.25 | % |
Net investment income (loss) | | | 1.30 | % | | | 1.26 | % | | | 1.72 | % | | | 1.83 | % | | | 1.69 | % |
Portfolio turnover rate(d) | | | 3 | % | | | 5 | % | | | 2 | % | | | 3 | % | | | 2 | % |
| (a) | Calculated based on average shares outstanding during the year. |
| (b) | Total return is calculated assuming a purchase of a share on the first day and a sale on the last day of each year reported and includes reinvestment of dividends and distributions, if any. Total returns may reflect adjustments to conform to GAAP. |
| (c) | Does not include expenses of the underlying funds in which the Fund invests. |
| (d) | The Fund’s portfolio turnover rate is calculated in accordance with regulatory requirements, without regard to transactions involving short-term investments, certain derivatives and in-kind transactions (if any). If such transactions were included, the Fund’s portfolio turnover rate may be higher. |
See Notes to Financial Statements.
42
| | | | | | | | | | | | | | | | | | | | |
| | | | | | |
Class Z Shares | | | | | | | | | | | | | | | | | | | | |
| | | Year Ended September 30, | |
| | | | | | |
| | | 2022 | | | 2021 | | | 2020 | | | 2019 | | | 2018 | |
| | | | | | |
Per Share Operating Performance(a): | | | | | | | | | | | | | | | | | | | | |
Net Asset Value, Beginning of Year | | | $47.74 | | | | $47.37 | | | | $48.70 | | | | $57.49 | | | | $51.88 | |
Income (loss) from investment operations: | | | | | | | | | | | | | | | | | | | | |
Net investment income (loss) | | | 0.55 | | | | 0.56 | | | | 0.74 | | | | 0.84 | | | | 0.88 | |
| Net realized and unrealized gain (loss) on investment transactions | | | (6.82 | ) | | | 11.44 | | | | 6.02 | | | | (0.05 | ) | | | 7.95 | |
Total from investment operations | | | (6.27 | ) | | | 12.00 | | | | 6.76 | | | | 0.79 | | | | 8.83 | |
Less Dividends and Distributions: | | | | | | | | | | | | | | | | | | | | |
Dividends from net investment income | | | (0.53 | ) | | | (0.85 | ) | | | (0.69 | ) | | | (1.23 | ) | | | (0.80 | ) |
Distributions from net realized gains | | | (4.89 | ) | | | (10.78 | ) | | | (7.40 | ) | | | (8.35 | ) | | | (2.42 | ) |
Total dividends and distributions | | | (5.42 | ) | | | (11.63 | ) | | | (8.09 | ) | | | (9.58 | ) | | | (3.22 | ) |
Net asset value, end of year | | | $36.05 | | | | $47.74 | | | | $47.37 | | | | $48.70 | | | | $57.49 | |
Total Return(b): | | | (15.68 | )% | | | 29.62 | % | | | 15.03 | % | | | 4.05 | % | | | 17.67 | % |
| | | | | | | | | | | | | | | | | | | | | |
| | | | | | |
Ratios/Supplemental Data: | | | | | | | | | | | | | | | | | | | | |
Net assets, end of year (000) | | | $160,674 | | | | $265,893 | | | | $244,155 | | | | $289,780 | | | | $370,188 | |
Average net assets (000) | | | $238,154 | | | | $263,618 | | | | $253,908 | | | | $315,161 | | | | $392,699 | |
Ratios to average net assets(c): | | | | | | | | | | | | | | | | | | | | |
| Expenses after waivers and/or expense reimbursement | | | 0.24 | % | | | 0.24 | % | | | 0.25 | % | | | 0.25 | % | | | 0.24 | % |
| Expenses before waivers and/or expense reimbursement | | | 0.31 | % | | | 0.31 | % | | | 0.32 | % | | | 0.32 | % | | | 0.31 | % |
Net investment income (loss) | | | 1.24 | % | | | 1.20 | % | | | 1.64 | % | | | 1.78 | % | | | 1.63 | % |
Portfolio turnover rate(d) | | | 3 | % | | | 5 | % | | | 2 | % | | | 3 | % | | | 2 | % |
| (a) | Calculated based on average shares outstanding during the year. |
| (b) | Total return is calculated assuming a purchase of a share on the first day and a sale on the last day of each year reported and includes reinvestment of dividends and distributions, if any. Total returns may reflect adjustments to conform to GAAP. |
| (c) | Does not include expenses of the underlying funds in which the Fund invests. |
| (d) | The Fund’s portfolio turnover rate is calculated in accordance with regulatory requirements, without regard to transactions involving short-term investments, certain derivatives and in-kind transactions (if any). If such transactions were included, the Fund’s portfolio turnover rate may be higher. |
See Notes to Financial Statements.
PGIM Quant Solutions Stock Index Fund 43
Financial Highlights (continued)
| | | | | | | | | | | | | | | | | | | | | | | | |
| | | | | | | |
| Class R6 Shares | | | | | | | | | | | | | | | | | |
| | | | | | | | | | | | | | | November 28, 2017(a)
through September 30,
2018 | | | |
| | | Year Ended September 30, | |
| | | 2022 | | | 2021 | | | 2020 | | | 2019 | |
| | | | | | | |
Per Share Operating Performance(b): | | | | | | | | | | | | | | | | | | | | | | | | |
Net Asset Value, Beginning of Period | | | $47.78 | | | | $47.40 | | | | $48.72 | | | | $57.52 | | | | $54.26 | | | | | |
Income (loss) from investment operations: | | | | | | | | | | | | | | | | | | | | | | | | |
Net investment income (loss) | | | 0.60 | | | | 0.58 | | | | 0.75 | | | | 0.86 | | | | 0.70 | | | | | |
| Net realized and unrealized gain (loss) on investment transactions | | | (6.83 | ) | | | 11.46 | | | | 6.05 | | | | (0.05 | ) | | | 5.79 | | | | | |
Total from investment operations | | | (6.23 | ) | | | 12.04 | | | | 6.80 | | | | 0.81 | | | | 6.49 | | | | | |
Less Dividends and Distributions: | | | | | | | | | | | | | | | | | | | | | | | | |
Dividends from net investment income | | | (0.57 | ) | | | (0.88 | ) | | | (0.72 | ) | | | (1.26 | ) | | | (0.81 | ) | | | | |
Distributions from net realized gains | | | (4.89 | ) | | | (10.78 | ) | | | (7.40 | ) | | | (8.35 | ) | | | (2.42 | ) | | | | |
Total dividends and distributions | | | (5.46 | ) | | | (11.66 | ) | | | (8.12 | ) | | | (9.61 | ) | | | (3.23 | ) | | | | |
Net asset value, end of period | | | $36.09 | | | | $47.78 | | | | $47.40 | | | | $48.72 | | | | $57.52 | | | | | |
Total Return(c): | | | (15.59 | )% | | | 29.72 | % | | | 15.12 | % | | | 4.12 | % | | | 12.57 | % | | | | |
| | | | | | | | | | | | | | | | | | | | | | | | | |
| | | | | | | |
| Ratios/Supplemental Data: | | | | | | | | | | | | | | | | | |
Net assets, end of period (000) | | | $57,685 | | | | $25,961 | | | | $13,960 | | | | $10,929 | | | | $97 | | | | | |
Average net assets (000) | | | $38,530 | | | | $19,506 | | | | $12,526 | | | | $8,080 | | | | $23 | | | | | |
Ratios to average net assets(d): | | | | | | | | | | | | | | | | | | | | | | | | |
Expenses after waivers and/or expense reimbursement | | | 0.14 | % | | | 0.16 | % | | | 0.18 | % | | | 0.18 | % | | | 0.18 | %(e) | | | | |
Expenses before waivers and/or expense reimbursement | | | 0.21 | % | | | 0.23 | % | | | 0.30 | % | | | 0.39 | % | | | 146.02 | %(e) | | | | |
Net investment income (loss) | | | 1.39 | % | | | 1.25 | % | | | 1.69 | % | | | 1.85 | % | | | 1.55 | %(e) | | | | |
Portfolio turnover rate(f) | | | 3 | % | | | 5 | % | | | 2 | % | | | 3 | % | | | 2 | % | | | | |
| (a) | Commencement of offering. |
| (b) | Calculated based on average shares outstanding during the period. |
| (c) | Total return is calculated assuming a purchase of a share on the first day and a sale on the last day of each period reported and includes reinvestment of dividends and distributions, if any. Total returns may reflect adjustments to conform to GAAP. Total returns for periods less than one full year are not annualized. |
| (d) | Does not include expenses of the underlying funds in which the Fund invests. |
| (f) | The Fund’s portfolio turnover rate is calculated in accordance with regulatory requirements, without regard to transactions involving short-term investments, certain derivatives and in-kind transactions (if any). If such transactions were included, the Fund’s portfolio turnover rate may be higher. |
See Notes to Financial Statements.
44
Notes to Financial Statements
Prudential Investment Portfolios 8 (the “Registered Investment Company” or “RIC”) is registered under the Investment Company Act of 1940, as amended (“1940 Act”), as an open-end management investment company. The RIC is organized as a Delaware Statutory Trust. These financial statements relate only to the PGIM Quant Solutions Stock Index Fund (formerly known as PGIM QMA Stock Index Fund) (the “Fund”), a series of the RIC. The Fund is classified as a diversified fund for purposes of the 1940 Act.
The investment objective of the Fund is to provide investment results that correspond to the price and yield performance of the S&P 500 Index.
The Fund follows the investment company accounting and reporting guidance of the Financial Accounting Standards Board (“FASB”) Accounting Standard Codification (“ASC”) Topic 946 Financial Services — Investment Companies. The following is a summary of significant accounting policies followed by the Fund in the preparation of its financial statements. The policies conform to U.S. generally accepted accounting principles (“GAAP”). The Fund consistently follows such policies in the preparation of its financial statements.
Securities Valuation: The Fund holds securities and other assets and liabilities that are fair valued as of the close of each day (generally, 4:00 PM Eastern time) the New York Stock Exchange (“NYSE”) is open for trading. As described in further detail below, the Fund’s investments are valued daily based on a number of factors, including the type of investment and whether market quotations are readily available. The RIC’s Board of Trustees (the “Board”) has approved the Fund’s valuation policies and procedures for security valuation and designated to PGIM Investments LLC (“PGIM Investments” or the “Manager”) as the Valuation Designee pursuant to SEC Rule 2a-5(b) to perform the fair value determination relating to all Fund investments. Pursuant to the Board’s oversight, the Valuation Designee has established a Valuation Committee to perform the duties and responsibilities as valuation designee under SEC Rule 2a-5. The valuation procedures permit the Fund to utilize independent pricing vendor services, quotations from market makers, and alternative valuation methods when market quotations are either not readily available or not deemed representative of fair value. Fair value is the price that would be received to sell an asset or paid to transfer a liability in an orderly transaction between market participants on the measurement date. A record of the Valuation Committee’s actions is provided to the Board at the first quarterly meeting following the quarter in which such actions take place.
For the fiscal reporting year-end, securities and other assets and liabilities were fair valued at the close of the last U.S. business day. Trading in certain foreign securities may occur when
PGIM Quant Solutions Stock Index Fund 45
Notes to Financial Statements (continued)
the NYSE is closed (including weekends and holidays). Because such foreign securities trade in markets that are open on weekends and U.S. holidays, the values of some of the Fund’s foreign investments may change on days when investors cannot purchase or redeem Fund shares.
Various inputs determine how the Fund’s investments are valued, all of which are categorized according to the three broad levels (Level 1, 2, or 3) detailed in the Schedule of Investments and referred to herein as the “fair value hierarchy” in accordance with FASB ASC Topic 820 - Fair Value Measurement.
Common or preferred stocks, exchange-traded funds and derivative instruments, if applicable, that are traded on a national securities exchange are valued at the last sale price as of the close of trading on the applicable exchange where the security principally trades. Securities traded via NASDAQ are valued at the NASDAQ official closing price. To the extent these securities are valued at the last sale price or NASDAQ official closing price, they are classified as Level 1 in the fair value hierarchy. In the event that no sale or official closing price on valuation date exists, these securities are generally valued at the mean between the last reported bid and ask prices, or at the last bid price in the absence of an ask price. These securities are classified as Level 2 in the fair value hierarchy.
Investments in open-end funds (other than exchange-traded funds) are valued at their net asset values as of the close of the NYSE on the date of valuation. These securities are classified as Level 1 in the fair value hierarchy since they may be purchased or sold at their net asset values on the date of valuation.
Securities and other assets that cannot be priced according to the methods described above are valued based on policies and procedures approved by the Board. In the event that unobservable inputs are used when determining such valuations, the securities will be classified as Level 3 in the fair value hierarchy. Altering one or more unobservable inputs may result in a significant change to a Level 3 security’s fair value measurement.
When determining the fair value of securities, some of the factors influencing the valuation include: the nature of any restrictions on disposition of the securities; assessment of the general liquidity of the securities; the issuer’s financial condition and the markets in which it does business; the cost of the investment; the size of the holding and the capitalization of the issuer; the prices of any recent transactions or bids/offers for such securities or any comparable securities; any available analyst media or other reports or information deemed reliable by the Valuation Designee regarding the issuer or the markets or industry in which it operates. Using fair value to price securities may result in a value that is different from a security’s most recent closing price and from the price used by other unaffiliated mutual funds to calculate their net asset values.
46
Financial Futures Contracts: A financial futures contract is an agreement to purchase (long) or sell (short) an agreed amount of securities at a set price for delivery on a future date. Upon entering into a financial futures contract, the Fund is required to pledge to the broker an amount of cash and/or other assets equal to a certain percentage of the contract amount. This amount is known as the “initial margin.” Subsequent payments, known as “variation margin,” are made or received by the Fund each day, depending on the daily fluctuations in the value of the underlying security. Such variation margin is recorded for financial statement purposes on a daily basis as unrealized gain (loss). When the contract expires or is closed, the gain (loss) is realized and is presented in the Statement of Operations as net realized gain (loss) on futures transactions.
The Fund invested in financial futures contracts in order to hedge its existing portfolio securities, or securities the Fund intends to purchase, against fluctuations in value caused by changes in prevailing interest rates. Should interest rates move unexpectedly, the Fund may not achieve the anticipated benefits of the financial futures contracts and may realize a loss. The use of futures transactions involves the risk of imperfect correlation in movements in the price of futures contracts, interest rates and the underlying hedged assets. Since futures contracts are exchange-traded, there is minimal counterparty credit risk to the Fund since the exchanges’ clearinghouse acts as counterparty to all exchange-traded futures and guarantees the futures contracts against default.
Master Netting Arrangements: The RIC, on behalf of the Fund, is subject to various Master Agreements, or netting arrangements, with select counterparties. These are agreements which a subadviser may have negotiated and entered into on behalf of all or a portion of the Fund. A master netting arrangement between the Fund and the counterparty permits the Fund to offset amounts payable by the Fund to the same counterparty against amounts to be received; and by the receipt of collateral from the counterparty by the Fund to cover the Fund’s exposure to the counterparty. However, there is no assurance that such mitigating factors are easily enforceable. In addition to master netting arrangements, the right to set-off exists when all the conditions are met such that each of the parties owes the other determinable amounts, the reporting party has the right to set-off the amount owed with the amount owed by the other party, the reporting party intends to set-off and the right of set-off is enforceable by law.
Securities Lending: The Fund lends its portfolio securities to banks and broker-dealers. The loans are secured by collateral at least equal to the market value of the securities loaned. Collateral pledged by each borrower is invested in an affiliated money market fund and is marked to market daily, based on the previous day’s market value, such that the value of the collateral exceeds the value of the loaned securities. In the event of significant appreciation in value of securities on loan on the last business day of the reporting period, the financial statements may reflect a collateral value that is less than the market value of the loaned securities. Such shortfall is remedied as described above. Loans are subject to termination at the option of the borrower or the Fund. Upon termination of the loan, the borrower will return to the Fund securities identical to the loaned securities. The remaining open loans of the securities lending transactions are considered overnight and continuous. Should the
PGIM Quant Solutions Stock Index Fund 47
Notes to Financial Statements (continued)
borrower of the securities fail financially, the Fund has the right to repurchase the securities in the open market using the collateral.
The Fund recognizes income, net of any rebate and securities lending agent fees, for lending its securities in the form of fees or interest on the investment of any cash received as collateral. The borrower receives all interest and dividends from the securities loaned and such payments are passed back to the lender in amounts equivalent thereto, which are reflected in interest income or unaffiliated dividend income based on the nature of the payment on the Statement of Operations. The Fund also continues to recognize any unrealized gain (loss) in the market price of the securities loaned and on the change in the value of the collateral invested that may occur during the term of the loan. In addition, realized gain (loss) is recognized on changes in the value of the collateral invested upon liquidation of the collateral. Net earnings from securities lending are disclosed in the Statement of Operations.
Equity and Mortgage Real Estate Investment Trusts (collectively REITs): The Fund invested in REITs, which report information on the source of their distributions annually. Based on current and historical information, a portion of distributions received from REITs during the period is estimated to be dividend income, capital gain or return of capital and recorded accordingly. When material, these estimates are adjusted periodically when the actual source of distributions is disclosed by the REITs.
Securities Transactions and Net Investment Income: Securities transactions are recorded on the trade date. Realized gains (losses) from investment and currency transactions are calculated on the specific identification method. Dividend income is recorded on the ex-date, or for certain foreign securities, when the Fund becomes aware of such dividends. Expenses are recorded on an accrual basis, which may require the use of certain estimates by management that may differ from actual. Net investment income or loss (other than class specific expenses and waivers, which are allocated as noted below) and unrealized and realized gains (losses) are allocated daily to each class of shares based upon the relative proportion of adjusted net assets of each class at the beginning of the day. Class specific expenses and waivers, where applicable, are charged to the respective share classes. Such class specific expenses and waivers include distribution fees and distribution fee waivers, shareholder servicing fees, transfer agent’s fees and expenses, registration fees and fee waivers and/or expense reimbursements, as applicable.
Taxes: It is the Fund’s policy to continue to meet the requirements of the Internal Revenue Code applicable to regulated investment companies and to distribute all of its taxable net investment income and capital gains, if any, to its shareholders. Therefore, no federal
48
income tax provision is required. Withholding taxes on foreign dividends, interest and capital gains, if any, are recorded, net of reclaimable amounts, at the time the related income is earned.
Dividends and Distributions: Dividends and distributions to shareholders, which are determined in accordance with federal income tax regulations and which may differ from GAAP, are recorded on the ex-date. Permanent book/tax differences relating to income and gain (loss) are reclassified between total distributable earnings (loss) and paid-in capital in excess of par, as appropriate. The chart below sets forth the expected frequency of dividend and capital gains distributions to shareholders. Various factors may impact the frequency of dividend distributions to shareholders, including but not limited to adverse market conditions or portfolio holding-specific events.
| | |
| | |
| Expected Distribution Schedule to Shareholders* | | Frequency |
Net Investment Income | | Annually |
Short-Term Capital Gains | | Annually |
Long-Term Capital Gains | | Annually |
| * | Under certain circumstances, the Fund may make more than one distribution of short-term and/or long-term capital gains during a fiscal year. |
Estimates: The preparation of financial statements requires management to make estimates and assumptions that affect the reported amounts and disclosures in the financial statements. Actual results could differ from those estimates.
The RIC, on behalf of the Fund, has a management agreement with the Manager pursuant to which it has responsibility for all investment advisory services and supervises the subadviser’s performance of such services, and pursuant to which it renders administrative services.
The Manager has entered into a subadvisory agreement with PGIM Quantitative Solutions LLC (“PGIM Quantitative Solutions” or the “subadviser”). The Manager pays for the services of PGIM Quantitative Solutions.
Fees payable under the management agreement are computed daily and paid monthly. For the reporting period ended September 30, 2022, the contractual and effective management fee rates were as follows:
| | |
| | |
| Contractual Management Rate | | Effective Management Fee, before any waivers and/or expense reimbursements |
0.15% of average daily net assets up to and including $1 billion; | | 0.15% |
0.10% of average daily net assets over $1 billion. | | |
PGIM Quant Solutions Stock Index Fund 49
Notes to Financial Statements (continued)
The Manager has contractually agreed, through January 31, 2024 to waive a portion of its management fee so that the effective management fee for the Fund will be 0.08% of the average daily net assets of the Fund. Separately, the Manager has contractually agreed, through January 31, 2024, to limit transfer agency, shareholder servicing, sub-transfer agency and blue sky fees, as applicable. This contractual expense limitation excludes interest, brokerage, taxes (such as income and foreign withholding taxes, stamp duty and deferred tax expenses), acquired fund fees and expenses, extraordinary expenses, and certain other Fund expenses such as dividend and interest expense and broker charges on short sales.
Where applicable, the Manager agrees to waive management fees or shared operating expenses on any share class to the same extent that it waives such expenses on any other share class. In addition, total annual operating expenses for Class R6 shares will not exceed total annual operating expenses for Class Z shares. Fees and/or expenses waived and/or reimbursed by the Manager for the purpose of preventing the expenses from exceeding a certain expense ratio limit may be recouped by the Manager within the same fiscal year during which such waiver and/or reimbursement is made if such recoupment can be realized without exceeding the expense limit in effect at the time of the recoupment for the fiscal year. The expense limitations attributable to each class are as follows:
| | | | |
| | |
| Class | | Expense
Limitations |
| A | | | —% | |
| C | | | — | |
| I | | | — | |
| Z | | | — | |
| R6 | | | 0.18 | |
The RIC, on behalf of the Fund, has a distribution agreement with Prudential Investment Management Services LLC (“PIMS”), which acts as the distributor of the Class A, Class C, Class I, Class Z and Class R6 shares of the Fund. The Fund compensates PIMS for distributing and servicing the Fund’s Class A and Class C shares, pursuant to the plans of distribution (the “Distribution Plans”), regardless of expenses actually incurred by PIMS.
Pursuant to the Distribution Plans, the Fund compensates PIMS for distribution related activities at an annual rate based on average daily net assets per class. The distribution fees are accrued daily and payable monthly.
The Fund’s annual gross and net distribution rate, where applicable, are as follows:
| | | | |
| | | |
| Class | | Gross Distribution Fee | | Net Distribution Fee |
A | | 0.30% | | 0.30% |
C | | 1.00 | | 1.00 |
50
| | | | |
| | | |
| Class | | Gross Distribution Fee | | Net Distribution Fee |
I | | N/A% | | N/A% |
Z | | N/A | | N/A |
R6 | | N/A | | N/A |
For the year ended September 30, 2022, PIMS received front-end sales charges (“FESL”) resulting from sales of certain class shares and contingent deferred sales charges (“CDSC”) imposed upon redemptions by certain shareholders. From these fees, PIMS paid such sales charges to broker-dealers, who in turn paid commissions to salespersons and incurred other distribution costs. The sales charges are as follows where applicable:
| | | | | | | | |
| | | |
| Class | | FESL | | | CDSC | |
A | | $ | 67,954 | | | $ | 129 | |
C | | | — | | | | 2,388 | |
PGIM Investments, PIMS and PGIM Quantitative Solutions are indirect, wholly-owned subsidiaries of Prudential Financial, Inc. (“Prudential”).
| 4. | Other Transactions with Affiliates |
Prudential Mutual Fund Services LLC (“PMFS”), an affiliate of PGIM Investments and an indirect, wholly-owned subsidiary of Prudential, serves as the Fund’s transfer agent and shareholder servicing agent. Transfer agent’s fees and expenses in the Statement of Operations include certain out-of-pocket expenses paid to non-affiliates, where applicable.
The Fund may invest its overnight sweep cash in the PGIM Core Ultra Short Bond Fund (the “Core Fund”), and its securities lending cash collateral in the PGIM Institutional Money Market Fund (the “Money Market Fund”), each a fund of Prudential Investment Portfolios 2, registered under the 1940 Act and managed by PGIM Investments. PGIM Investments and/or its affiliates are paid fees or reimbursed for providing their services to the Core Fund and the Money Market Fund. In addition to the realized and unrealized gains on investments in the Core Fund and Money Market Fund, earnings from such investments are disclosed on the Statement of Operations as “Affiliated dividend income” and “Income from securities lending, net”, respectively. Effective January 2022, the Fund changed its overnight cash sweep vehicle from the Core Fund to an unaffiliated money market fund.
The Fund may enter into certain securities purchase or sale transactions under Board approved Rule 17a-7 procedures. Rule 17a-7 is an exemptive rule under the 1940 Act, that subject to certain conditions, permits purchase and sale transactions among affiliated investment companies, or between an investment company and a person that is affiliated solely by reason of having a common (or affiliated) investment adviser, common directors/trustees, and/or common officers. For the year ended September 30, 2022, no 17a-7 transactions were entered into by the Fund.
PGIM Quant Solutions Stock Index Fund 51
Notes to Financial Statements (continued)
The aggregate cost of purchases and proceeds from sales of portfolio securities (excluding short-term investments and U.S. Government securities) for the reporting period ended September 30, 2022, were as follows:
| | |
| | |
| Cost of Purchases | | Proceeds from Sales |
| |
$20,821,843 | | $126,052,464 |
A summary of the cost of purchases and proceeds from sales of shares of affiliated mutual funds and other investments for the year ended September 30, 2022, is presented as follows:
| | | | | | | | | | | | | | | | | | | | | | | | | | | | |
| | | | | | | | |
Value, Beginning of Year | | Cost of
Purchases | | Proceeds from Sales | | Change in Unrealized Gain (Loss) | | Realized Gain (Loss) | | Value,
End of Year | | Shares, End of Year | | Dividend Income | |
|
| Long-Term Investments - Common Stock: | |
|
| Prudential Financial, Inc.(g) | |
| $ 946,800 | | | $ — | | | | $ 121,494 | | | | $(235,176 | ) | | | $87,532 | | | | $ 677,662 | | | | 7,900 | | | | $39,640 | |
|
| Short-Term Investments - Affiliated Mutual Funds: | |
|
| PGIM Core Ultra Short Bond Fund(1)(wa) | |
| 10,628,397 | | | 42,780,959 | | | | 53,409,356 | | | | — | | | | — | | | | — | | | | — | | | | 2,813 | |
|
| PGIM Institutional Money Market Fund(1)(b)(wa) | |
| 13,020,603 | | | 435,575,117 | | | | 438,882,507 | | | | 182 | | | | 1,044 | | | | 9,714,439 | | | | 9,721,244 | | | | 11,800 | (2) |
| $23,649,000 | | | $478,356,076 | | | | $492,291,863 | | | | $ 182 | | | | $ 1,044 | | | | $ 9,714,439 | | | | | | | | $14,613 | |
| $24,595,800 | | | $478,356,076 | | | | $492,413,357 | | | | $(234,994 | ) | | | $88,576 | | | | $10,392,101 | | | | | | | | $54,253 | |
| (1) | The Fund did not have any capital gain distributions during the reporting period. |
| (2) | The amount, or a portion thereof, represents the affiliated securities lending income shown on the Statement of Operations. |
| (b) | Represents security, or portion thereof, purchased with cash collateral received for securities on loan and includes dividend reinvestment. |
| (g) | An affiliated security. |
| (wa) | PGIM Investments LLC, the manager of the Fund, also serves as manager of the PGIM Core Ultra Short Bond Fund and PGIM Institutional Money Market Fund, if applicable. |
| 6. | Distributions and Tax Information |
Distributions to shareholders, which are determined in accordance with federal income tax regulations and which may differ from GAAP, are recorded on the ex-date.
For the year ended September 30, 2022, the tax character of dividends paid by the Fund were $11,210,712 of ordinary income and $84,251,096 of long-term capital gains. For the
52
year ended September 30, 2021, the tax character of dividends paid by the Fund were $13,902,474 of ordinary income and $173,327,074 of long-term capital gains.
As of September 30, 2022, the accumulated undistributed earnings on a tax basis were $8,783,134 of ordinary income and $84,548,819 of long-term capital gains.
The United States federal income tax basis of the Fund’s investments and the net unrealized appreciation as of September 30, 2022 were as follows:
| | | | | | |
| | | | |
| Tax Basis | | Gross
Unrealized
Appreciation | | Gross
Unrealized
Depreciation | | Net
Unrealized
Appreciation |
| $164,651,120 | | $491,056,007 | | $(12,065,254) | | $478,990,753 |
The difference between GAAP and tax basis was primarily attributable to deferred losses on wash sales, corporate actions adjustments, mark-to-market of futures contracts and other GAAP to tax differences.
The Manager has analyzed the Fund’s tax positions taken on federal, state and local income tax returns for all open tax years and has concluded that no provision for income tax is required in the Fund’s financial statements for the current reporting period. Since tax authorities can examine previously filed tax returns, the Fund’s U.S. federal and state tax returns for each of the four fiscal years up to the most recent fiscal year ended September 30, 2022 are subject to such review.
The Fund offers Class A, Class C, Class Z, Class I and Class R6 shares. Class A shares are sold with a maximum front-end sales charge of 3.25%. Investors who purchase $1 million or more of Class A shares and sell these shares within 12 months of purchase are subject to a CDSC of 1%, although they are not subject to an initial sales charge. The Class A CDSC is waived for certain retirement and/or benefit plans. A special exchange privilege is also available for shareholders who qualified to purchase Class A shares at net asset value. Class C shares are sold with a CDSC of 1% on sales made within 12 months of purchase. Class C shares will automatically convert to Class A shares on a monthly basis approximately eight years (ten years prior to January 22, 2021) after purchase. Class I, Class Z and Class R6 shares are not subject to any sales or redemption charges and are available exclusively for sale to a limited group of investors.
Under certain circumstances, an exchange may be made from specified share classes of the Fund to one or more other share classes of the Fund as presented in the table of transactions in shares of beneficial interest, below.
The RIC has authorized an unlimited number of shares of beneficial interest of the Fund at $0.001 par value per share, currently divided into five classes, designated Class A, Class C, Class I, Class Z and Class R6.
PGIM Quant Solutions Stock Index Fund 53
Notes to Financial Statements (continued)
As of September 30, 2022, Prudential, through its affiliated entities, including affiliated funds (if applicable), owned shares of the Fund as follows:
| | | | | | | | | | |
| | | |
| Class | | Number of Shares | | Percentage of Outstanding Shares |
A | | | | 2,016,783 | | | | | 29.0 | % |
C | | | | 10 | | | | | 0.1 | |
I | | | | 874,904 | | | | | 26.1 | |
Z | | | | 93,983 | | | | | 2.1 | |
At the reporting period end, the number of shareholders holding greater than 5% of the Fund are as follows:
| | | | | | | | | | |
| | | |
| | | Number of Shareholders | | Percentage of Outstanding Shares |
Affiliated | | | | 1 | | | | | 16.3 | % |
Unaffiliated | | | | 2 | | | | | 27.7 | |
Transactions in shares of beneficial interest were as follows:
| | | | | | | | |
| | | |
| Share Class | | Shares | | | Amount | |
| | |
Class A | | | | | | | | |
Year ended September 30, 2022: | | | | | | | | |
Shares sold | | | 344,313 | | | $ | 15,011,045 | |
Shares issued in reinvestment of dividends and distributions | | | 772,674 | | | | 35,651,156 | |
Shares purchased | | | (1,361,487 | ) | | | (60,976,339 | ) |
Net increase (decrease) in shares outstanding before conversion | | | (244,500 | ) | | | (10,314,138 | ) |
Shares issued upon conversion from other share class(es) | | | 102,104 | | | | 4,437,782 | |
Shares purchased upon conversion into other share class(es) | | | (15,321 | ) | | | (647,100 | ) |
Net increase (decrease) in shares outstanding | | | (157,717 | ) | | $ | (6,523,456 | ) |
| | |
Year ended September 30, 2021: | | | | | | | | |
Shares sold | | | 374,465 | | | $ | 17,185,901 | |
Shares issued in reinvestment of dividends and distributions | | | 1,727,874 | | | | 69,788,829 | |
Shares purchased | | | (1,378,359 | ) | | | (62,916,957 | ) |
Net increase (decrease) in shares outstanding before conversion | | | 723,980 | | | | 24,057,773 | |
Shares issued upon conversion from other share class(es) | | | 144,138 | | | | 6,401,923 | |
Shares purchased upon conversion into other share class(es) | | | (26,851 | ) | | | (1,295,365 | ) |
Net increase (decrease) in shares outstanding | | | 841,267 | | | $ | 29,164,331 | |
54
| | | | | | | | |
| | | |
| Share Class | | Shares | | | Amount | |
| | |
Class C | | | | | | | | |
Year ended September 30, 2022: | | | | | | | | |
Shares sold | | | 143,057 | | | $ | 6,097,701 | |
Shares issued in reinvestment of dividends and distributions | | | 153,894 | | | | 6,983,703 | |
Shares purchased | | | (280,958 | ) | | | (11,637,956 | ) |
Net increase (decrease) in shares outstanding before conversion | | | 15,993 | | | | 1,443,448 | |
Shares purchased upon conversion into other share class(es) | | | (111,876 | ) | | | (4,762,446 | ) |
Net increase (decrease) in shares outstanding | | | (95,883 | ) | | $ | (3,318,998 | ) |
| | |
Year ended September 30, 2021: | | | | | | | | |
Shares sold | | | 124,622 | | | $ | 5,729,823 | |
Shares issued in reinvestment of dividends and distributions | | | 388,258 | | | | 15,464,322 | |
Shares purchased | | | (335,250 | ) | | | (14,819,698 | ) |
Net increase (decrease) in shares outstanding before conversion | | | 177,630 | | | | 6,374,447 | |
Shares purchased upon conversion into other share class(es) | | | (180,898 | ) | | | (7,953,448 | ) |
Net increase (decrease) in shares outstanding | | | (3,268 | ) | | $ | (1,579,001 | ) |
| | |
Class I | | | | | | | | |
Year ended September 30, 2022: | | | | | | | | |
Shares sold | | | 429,548 | | | $ | 19,304,769 | |
Shares issued in reinvestment of dividends and distributions | | | 422,676 | | | | 19,633,303 | |
Shares purchased | | | (1,116,903 | ) | | | (47,709,178 | ) |
Net increase (decrease) in shares outstanding before conversion | | | (264,679 | ) | | | (8,771,106 | ) |
Shares issued upon conversion from other share class(es) | | | 2,622 | | | | 110,558 | |
Shares purchased upon conversion into other share class(es) | | | (4,057 | ) | | | (186,504 | ) |
Net increase (decrease) in shares outstanding | | | (266,114 | ) | | $ | (8,847,052 | ) |
| | |
Year ended September 30, 2021: | | | | | | | | |
Shares sold | | | 1,160,786 | | | $ | 57,111,625 | |
Shares issued in reinvestment of dividends and distributions | | | 1,036,324 | | | | 42,095,486 | |
Shares purchased | | | (1,608,694 | ) | | | (69,126,604 | ) |
Net increase (decrease) in shares outstanding before conversion | | | 588,416 | | | | 30,080,507 | |
Shares issued upon conversion from other share class(es) | | | 15,611 | | | | 770,127 | |
Shares purchased upon conversion into other share class(es) | | | (959 | ) | | | (45,276 | ) |
Net increase (decrease) in shares outstanding | | | 603,068 | | | $ | 30,805,358 | |
| | |
Class Z | | | | | | | | |
Year ended September 30, 2022: | | | | | | | | |
Shares sold | | | 1,024,883 | | | $ | 44,546,538 | |
Shares issued in reinvestment of dividends and distributions | | | 632,350 | | | | 29,378,995 | |
Shares purchased | | | (2,792,609 | ) | | | (118,593,490 | ) |
Net increase (decrease) in shares outstanding before conversion | | | (1,135,376 | ) | | | (44,667,957 | ) |
Shares issued upon conversion from other share class(es) | | | 24,637 | | | | 1,081,177 | |
Shares purchased upon conversion into other share class(es) | | | (2,151 | ) | | | (102,846 | ) |
Net increase (decrease) in shares outstanding | | | (1,112,890 | ) | | $ | (43,689,626 | ) |
PGIM Quant Solutions Stock Index Fund 55
Notes to Financial Statements (continued)
| | | | | | | | |
| | | |
| Share Class | | Shares | | | Amount | |
| | |
Year ended September 30, 2021: | | | | | | | | |
Shares sold | | | 941,599 | | | $ | 42,892,579 | |
Shares issued in reinvestment of dividends and distributions | | | 1,373,800 | | | | 55,817,492 | |
Shares purchased | | | (1,742,344 | ) | | | (80,946,709 | ) |
Net increase (decrease) in shares outstanding before conversion | | | 573,055 | | | | 17,763,362 | |
Shares issued upon conversion from other share class(es) | | | 46,195 | | | | 2,149,778 | |
Shares purchased upon conversion into other share class(es) | | | (203,118 | ) | | | (9,411,119 | ) |
Net increase (decrease) in shares outstanding | | | 416,132 | | | $ | 10,502,021 | |
| | |
Class R6 | | | | | | | | |
Year ended September 30, 2022: | | | | | | | | |
Shares sold | | | 1,172,287 | | | $ | 47,521,481 | |
Shares issued in reinvestment of dividends and distributions | | | 74,448 | | | | 3,459,618 | |
Shares purchased | | | (193,491 | ) | | | (8,389,455 | ) |
Net increase (decrease) in shares outstanding before conversion | | | 1,053,244 | | | | 42,591,644 | |
Shares issued upon conversion from other share class(es) | | | 1,722 | | | | 69,379 | |
Net increase (decrease) in shares outstanding | | | 1,054,966 | | | $ | 42,661,023 | |
| | |
Year ended September 30, 2021: | | | | | | | | |
Shares sold | | | 116,717 | | | $ | 5,334,987 | |
Shares issued in reinvestment of dividends and distributions | | | 80,509 | | | | 3,271,898 | |
Shares purchased | | | (150,924 | ) | | | (7,113,510 | ) |
Net increase (decrease) in shares outstanding before conversion | | | 46,302 | | | | 1,493,375 | |
Shares issued upon conversion from other share class(es) | | | 202,553 | | | | 9,383,380 | |
Net increase (decrease) in shares outstanding | | | 248,855 | | | $ | 10,876,755 | |
The RIC, on behalf of the Fund, along with other affiliated registered investment companies (the “Participating Funds”), is a party to a Syndicated Credit Agreement (“SCA”) with a group of banks. The purpose of the SCA is to provide an alternative source of temporary funding for capital share redemptions. The table below provides details of the current SCA in effect at the reporting period-end as well as the prior SCA.
| | | | |
| | | Current SCA | | Prior SCA |
Term of Commitment | | 9/30/2022 - 9/28/2023 | | 10/1/2021 – 9/29/2022 |
Total Commitment | | $ 1,200,000,000 | | $ 1,200,000,000 |
Annualized Commitment Fee on the
Unused Portion of the SCA | | 0.15% | | 0.15% |
56
| | | | |
| | | |
| | | Current SCA | | Prior SCA |
Annualized Interest Rate on Borrowings | | 1.00% plus the higher of (1) the effective federal funds rate, (2) the daily SOFR rate plus 0.10% or (3) zero percent | | 1.20% plus the higher of (1) the effective federal funds rate, (2) the one-month LIBOR rate or (3) zero percent |
Certain affiliated registered investment companies that are parties to the SCA include portfolios that are subject to a predetermined mathematical formula used to manage certain benefit guarantees offered under variable annuity contracts. The formula may result in large scale asset flows into and out of these portfolios. Consequently, these portfolios may be more likely to utilize the SCA for purposes of funding redemptions. It may be possible for those portfolios to fully exhaust the committed amount of the SCA, thereby requiring the Manager to allocate available funding per a Board-approved methodology designed to treat the Participating Funds in the SCA equitably.
The Fund utilized the SCA during the year ended September 30, 2022. The average daily balance for the 10 days that the Fund had loans outstanding during the period was approximately $1,465,500, borrowed at a weighted average interest rate of 1.96%. The maximum loan outstanding amount during the period was $3,523,000. At September 30, 2022, the Fund did not have an outstanding loan amount.
| 9. | Risks of Investing in the Fund |
The Fund’s risks include, but are not limited to, some or all of the risks discussed below. For further information on the Fund’s risks, please refer to the Fund’s Prospectus and Statement of Additional Information.
Economic and Market Events Risk: Events in the U.S. and global financial markets, including actions taken by the U.S. Federal Reserve or foreign central banks to stimulate or stabilize economic growth or the functioning of the securities markets, may at times result in unusually high market volatility, which could negatively impact performance. Relatively reduced liquidity in credit and fixed income markets could adversely affect issuers worldwide.
Equity and Equity-Related Securities Risk: Equity and equity-related securities may be subject to changes in value, and their values may be more volatile than those of other asset classes. In addition to an individual security losing value, the value of the equity markets or a sector in which the Fund invests could go down. Different parts of a market can react differently to adverse issuer, market, regulatory, political and economic developments.
Increase in Expenses Risk: Your actual cost of investing in the Fund may be higher than the expenses shown in the expense table in the Fund’s prospectus for a variety of reasons. For example, expense ratios may be higher than those shown if average net assets decrease. Net assets are more likely to decrease and Fund expense ratios are more likely to increase when markets are volatile.
PGIM Quant Solutions Stock Index Fund 57
Notes to Financial Statements (continued)
Index Investment Approach Risk: Since the Fund is passively managed, assets are not allocated from one stock or group of stocks to another based on their prospects, or from stocks into bonds or cash equivalents in an attempt to cushion the impact of a market decline. As a result, the Fund’s performance may be less favorable than that of a portfolio using an active investment strategy. There is no guarantee that the Fund’s investment results will have a high degree of correlation to those of the Index. The Fund’s expenses, changes in securities markets, changes in the composition of the Index, errors in index provider data, and the timing of purchases and redemptions of Fund shares, among other things, may affect the correlation between Fund and Index performance. The Fund may not perform as well as other investments if, among other things, the Index declines or performs poorly relative to other related indexes or individual securities or the securities issued by companies that comprise the Index fall out of favor with investors.
Large Capitalization Company Risk: Companies with large market capitalizations go in and out of favor based on market and economic conditions. Larger companies tend to be less volatile than companies with smaller market capitalizations. In exchange for this potentially lower risk, the Fund’s value may not rise or fall as much as the value of funds that emphasize companies with smaller market capitalizations.
Large Shareholder and Large Scale Redemption Risk: Certain individuals, accounts, funds (including funds affiliated with the Manager) or institutions, including the Manager and its affiliates, may from time to time own or control a substantial amount of the Fund’s shares. There is no requirement that these entities maintain their investment in the Fund. There is a risk that such large shareholders or that the Fund’s shareholders generally may redeem all or a substantial portion of their investments in the Fund in a short period of time, which could have a significant negative impact on the Fund’s NAV, liquidity, and brokerage costs. Large redemptions could also result in tax consequences to shareholders and impact the Fund’s ability to implement its investment strategy. The Fund’s ability to pursue its investment objective after one or more large scale redemptions may be impaired and, as a result, the Fund may invest a larger portion of its assets in cash or cash equivalents.
Market Disruption and Geopolitical Risks: Market disruption can be caused by economic, financial or political events and factors, including but not limited to, international wars or conflicts (including Russia’s military invasion of Ukraine), geopolitical developments (including trading and tariff arrangements, sanctions and cybersecurity attacks), instability in regions such as Asia, Eastern Europe and the Middle East, terrorism, natural disasters and public health epidemics (including the outbreak of COVID-19 globally).
The extent and duration of such events and resulting market disruptions cannot be predicted, but could be substantial and could magnify the impact of other risks to the Fund. These and other similar events could adversely affect the U.S. and foreign financial markets
58
and lead to increased market volatility, reduced liquidity in the securities markets, significant negative impacts on issuers and the markets for certain securities and commodities and/or government intervention. They may also cause short- or long-term economic uncertainties in the United States and worldwide. As a result, whether or not the Fund invests in securities of issuers located in or with significant exposure to the countries directly affected, the value and liquidity of the Fund’s investments may be negatively impacted. Further, due to closures of certain markets and restrictions on trading certain securities, the value of certain securities held by the Fund could be significantly impacted, which could lead to such securities being valued at zero.
COVID-19 and the related governmental and public responses have had and may continue to have an impact on the Fund’s investments and net asset value and have led and may continue to lead to increased market volatility and the potential for illiquidity in certain classes of securities and sectors of the market. They have also had and may continue to result in periods of business disruption, business closures, inability to obtain raw materials, supplies and component parts, and reduced or disrupted operations for the issuers in which the Fund invests. The occurrence, reoccurrence and pendency of public health epidemics could adversely affect the economies and financial markets either in specific countries or worldwide.
Market Risk: Securities markets may be volatile and the market prices of the Fund’s securities may decline. Securities fluctuate in price based on changes in an issuer’s financial condition and overall market and economic conditions. If the market prices of the securities owned by the Fund fall, the value of your investment in the Fund will decline.
Tracking Error Risk: Tracking error is the divergence of the Fund’s performance from that of the Index. Tracking error may occur because of differences between the securities and other instruments held in the Fund’s portfolio and those included in the Index, pricing differences, transaction costs, the Fund’s holding of uninvested cash, differences in timing of the accrual of distributions, tax gains or losses, changes to the Index or the need to meet various new or existing regulatory requirements. This risk may be heightened during times of increased market volatility or other unusual market conditions. Tracking error also may result because the Fund incurs fees and expenses, while the Index does not.
PGIM Quant Solutions Stock Index Fund 59
Report of Independent Registered Public Accounting Firm
To the Board of Trustees of Prudential Investment Portfolios 8 and Shareholders of PGIM Quant Solutions Stock Index Fund
Opinion on the Financial Statements
We have audited the accompanying statement of assets and liabilities, including the schedule of investments, of PGIM Quant Solutions Stock Index Fund (one of the funds constituting Prudential Investment Portfolios 8, referred to hereafter as the “Fund”) as of September 30, 2022, the related statement of operations for the year ended September 30, 2022, the statements of changes in net assets for each of the two years in the period ended September 30, 2022, including the related notes, and the financial highlights for each of the three years in the period ended September 30, 2022 (collectively referred to as the “financial statements”). In our opinion, the financial statements present fairly, in all material respects, the financial position of the Fund as of September 30, 2022, the results of its operations for the year then ended, the changes in its net assets for each of the two years in the period ended September 30, 2022 and the financial highlights for each of the three years in the period ended September 30, 2022 in conformity with accounting principles generally accepted in the United States of America.
The financial statements of the Fund as of and for the year ended September 30, 2019 and the financial highlights for each of the periods ended on or prior to September 30, 2019 (not presented herein, other than the financial highlights) were audited by other auditors whose report dated November 15, 2019 expressed an unqualified opinion on those financial statements and financial highlights.
Basis for Opinion
These financial statements are the responsibility of the Fund’s management. Our responsibility is to express an opinion on the Fund’s financial statements based on our audits. We are a public accounting firm registered with the Public Company Accounting Oversight Board (United States) (PCAOB) and are required to be independent with respect to the Fund in accordance with the U.S. federal securities laws and the applicable rules and regulations of the Securities and Exchange Commission and the PCAOB.
We conducted our audits of these financial statements in accordance with the standards of the PCAOB. Those standards require that we plan and perform the audit to obtain reasonable assurance about whether the financial statements are free of material misstatement, whether due to error or fraud.
Our audits included performing procedures to assess the risks of material misstatement of the financial statements, whether due to error or fraud, and performing procedures that respond to those risks. Such procedures included examining, on a test basis, evidence regarding the amounts and disclosures in the financial statements. Our audits also included evaluating the accounting principles used and significant estimates made by management, as well as evaluating the overall presentation of the financial statements. Our procedures included confirmation of securities owned as of September 30, 2022 by correspondence with the custodian, transfer agent and brokers. We believe that our audits provide a reasonable basis for our opinion.
/s/ PricewaterhouseCoopers LLP
New York, New York
November 17, 2022
We have served as the auditor of one or more investment companies in the PGIM Retail Funds complex since 2020.
60
Tax Information (unaudited)
We are advising you that during the fiscal year ended September 30, 2022, the Fund reports the maximum amount allowed per share, but not less than $4.72 for Class A, C, I, Z and R6 shares as a capital gain distribution in accordance with Section 852(b)(3)(C) of the Internal Revenue Code.
For the year ended September 30, 2022, the Fund reports the maximum amount allowable under Section 854 of the Internal Revenue Code, but not less than, the following percentages of the ordinary income dividends paid as 1) qualified dividend income (QDI); and 2) eligible for corporate dividends received deduction (DRD):
| | | | |
| | | |
| Funds | | QDI | | DRD |
| | |
PGIM Quant Solutions Stock Index Fund | | 96.38% | | 93.11% |
In January 2023, you will be advised on IRS Form 1099-DIV or substitute 1099-DIV, as to the federal tax status of dividends and distributions received by you in calendar year 2022.
PGIM QMA Stock Index Fund 61
INFORMATION ABOUT BOARD MEMBERS AND OFFICERS (unaudited)
Information about Board Members and Officers of the Fund is set forth below. Board Members who are not deemed to be “interested persons” of the Fund, as defined in the 1940 Act, are referred to as “Independent Board Members.” Board Members who are deemed to be “interested persons” of the Fund are referred to as “Interested Board Members.” The Board Members are responsible for the overall supervision of the operations of the Fund and perform the various duties imposed on the directors of investment companies by the 1940 Act. The Board in turn elects the Officers, who are responsible for administering the day-to-day operations of the Fund.
| | | | | | |
| | | |
| Independent Board Members | | | | |
| | | | |
Name Year of Birth Position(s) Portfolios Overseen | | Principal Occupation(s) During Past Five Years | | Other Directorships Held During Past Five Years | | Length of Board Service |
| | | | |
Ellen S. Alberding 1958 Board Member Portfolios Overseen: 97 | | President and Board Member, The Joyce Foundation (charitable foundation) (since 2002); formerly Vice Chair, City Colleges of Chicago (community college system) (2011-2015); Trustee, National Park Foundation (charitable foundation for national park system) (2009-2018); Trustee, Economic Club of Chicago (2009-2016); Trustee, Loyola University (since 2018). | | None. | | Since September 2013 |
| | | | |
Kevin J. Bannon 1952 Board Member Portfolios Overseen: 97 | | Retired; formerly Managing Director (April 2008-May 2015) and Chief Investment Officer (October 2008-November 2013) of Highmount Capital LLC (registered investment adviser); formerly Executive Vice President and Chief Investment Officer (April 1993-August 2007) of Bank of New York Company; President (May 2003-May 2007) of BNY Hamilton Family of Mutual Funds. | | Director of Urstadt Biddle Properties (equity real estate investment trust) (since September 2008). | | Since July 2008 |
PGIM Quant Solutions Stock Index Fund
| | | | | | |
| | | |
| Independent Board Members | | | | |
| | | | |
Name Year of Birth Position(s) Portfolios Overseen | | Principal Occupation(s) During Past Five Years | | Other Directorships Held During Past Five Years | | Length of Board Service |
| | | | |
Linda W. Bynoe 1952 Board Member Portfolios Overseen: 94 | | President and Chief Executive Officer (since March 1995) and formerly Chief Operating Officer (December 1989-February 1995) of Telemat Limited LLC (formerly Telemat Ltd) (management consulting); formerly Vice President (January 1985-June 1989) at Morgan Stanley & Co. (broker-dealer). | | Trustee of Equity Residential (residential real estate) (since December 2009); Director of Northern Trust Corporation (financial services) (since April 2006); formerly Director of Anixter International, Inc. (communication products distributor) (January 2006-June 2020). | | Since March 2005 |
| | | | |
Barry H. Evans 1960 Board Member Portfolios Overseen: 96 | | Retired; formerly President (2005-2016), Global Chief Operating Officer (2014-2016), Chief Investment Officer - Global Head of Fixed Income (1998-2014), and various portfolio manager roles (1986-2006), Manulife Asset Management (asset management). | | Formerly Director, Manulife Trust Company (2011-2018); formerly Director, Manulife Asset Management Limited (2015-2017); formerly Chairman of the Board of Directors of Manulife Asset Management U.S. (2005-2016); formerly Chairman of the Board, Declaration Investment Management and Research (2008-2016). | | Since September 2017 |
| | | | |
Keith F. Hartstein 1956 Board Member & Independent Chair Portfolios Overseen: 97 | | Retired; Member (November 2014-September 2022) of the Governing Council of the Independent Directors Council (IDC) (organization of independent mutual fund directors); formerly Executive Committee of the IDC Board of Governors (October 2019-December 2021); formerly President and Chief Executive Officer (2005-2012), Senior Vice President (2004-2005), Senior Vice President of Sales and Marketing (1997-2004), and various executive management positions (1990-1997), John Hancock Funds, LLC (asset management); Chairman, Investment Company Institute’s Sales Force Marketing Committee (2003-2008). | | None. | | Since September 2013 |
Visit our website at pgim.com/investments
| | | | | | |
| | | |
| Independent Board Members | | | | |
| | | | |
Name Year of Birth Position(s) Portfolios Overseen | | Principal Occupation(s) During Past Five Years | | Other Directorships Held During Past Five Years | | Length of Board Service |
| | | | |
Laurie Simon Hodrick 1962 Board Member Portfolios Overseen: 93 | | A. Barton Hepburn Professor Emerita of Economics in the Faculty of Business, Columbia Business School (since 2018); Visiting Fellow at the Hoover Institution, Stanford University (since 2015); Sole Member, ReidCourt LLC (since 2008) (a consulting firm); formerly Visiting Professor of Law, Stanford Law School (2015-2021); formerly A. Barton Hepburn Professor of Economics in the Faculty of Business, Columbia Business School (1996-2017); formerly Managing Director, Global Head of Alternative Investment Strategies, Deutsche Bank (2006-2008). | | Independent Director, Andela (since January 2022) (global talent network); Independent Director, Roku (since December 2020) (communication services); formerly Independent Director, Synnex Corporation (2019-2021) (information technology); formerly Independent Director, Kabbage, Inc. (2018-2020) (financial services); formerly Independent Director, Corporate Capital Trust (2017-2018) (a business development company). | | Since September 2017 |
| | | | |
Brian K. Reid 1961 Board Member Portfolios Overseen: 96 | | Retired; formerly Chief Economist for the Investment Company Institute (ICI) (2005-2017); formerly Senior Economist and Director of Industry and Financial Analysis at the ICI (1998-2004); formerly Senior Economist, Industry and Financial Analysis at the ICI (1996-1998); formerly Staff Economist at the Federal Reserve Board (1989-1996); Director, ICI Mutual Insurance Company (2012-2017). | | None. | | Since March 2018 |
PGIM Quant Solutions Stock Index Fund
| | | | | | |
| | | |
| Independent Board Members | | | | |
| | | | |
Name Year of Birth Position(s) Portfolios Overseen | | Principal Occupation(s) During Past Five Years | | Other Directorships Held During Past Five Years | | Length of Board Service |
| | | | |
Grace C. Torres 1959 Board Member Portfolios Overseen: 96 | | Retired; formerly Treasurer and Principal Financial and Accounting Officer of the PGIM Funds, Target Funds, Advanced Series Trust, Prudential Variable Contract Accounts and The Prudential Series Fund (1998-June 2014); Assistant Treasurer (March 1999-June 2014) and Senior Vice President (September 1999-June 2014) of PGIM Investments LLC; Assistant Treasurer (May 2003-June 2014) and Vice President (June 2005-June 2014) of AST Investment Services, Inc.; Senior Vice President and Assistant Treasurer (May 2003-June 2014) of Prudential Annuities Advisory Services, Inc. | | Director (since January 2018) of OceanFirst Financial Corp. and OceanFirst Bank; formerly Director (July 2015-January 2018) of Sun Bancorp, Inc. N.A. and Sun National Bank. | | Since November 2014 |
Visit our website at pgim.com/investments
| | | | | | |
| | | | |
| Interested Board Members | | | | | | |
| | | | |
Name Year of Birth Position(s) Portfolios Overseen | | Principal Occupation(s) During Past Five Years | | Other Directorships Held During Past Five Years | | Length of Board Service |
| | | | |
Stuart S. Parker 1962 Board Member & President Portfolios Overseen: 96 | | President, Chief Executive Officer, Chief Operating Officer and Officer in Charge of PGIM Investments LLC (formerly known as Prudential Investments LLC) (since January 2012); President and Principal Executive Officer (“PEO”) (since September 2022) of the PGIM Private Credit Fund; President and PEO (since March 2022) of the PGIM Private Real Estate Fund, Inc.; formerly Executive Vice President of Jennison Associates LLC and Head of Retail Distribution of PGIM Investments LLC (June 2005-December 2011); Investment Company Institute - Board of Governors (since May 2012). | | None. | | Since January 2012 |
| | | | |
Scott E. Benjamin 1973 Board Member & Vice President Portfolios Overseen: 97 | | Executive Vice President (since May 2009) of PGIM Investments LLC; Vice President (since June 2012) of Prudential Investment Management Services LLC; Executive Vice President (since September 2009) of AST Investment Services, Inc.; Senior Vice President of Product Development and Marketing, PGIM Investments (since February 2006); Vice President (since September 2022) of the PGIM Private Credit Fund; Vice President (since March 2022) of the PGIM Private Real Estate Fund, Inc.; formerly Vice President of Product Development and Product Management, PGIM Investments LLC (2003-2006). | | None. | | Since March 2010 |
PGIM Quant Solutions Stock Index Fund
| | | | |
| | | |
| Fund Officers(a) | | | | |
| | | |
Name Year of Birth Fund Position | | Principal Occupation(s) During Past Five Years | | Length of Service as Fund Officer |
| | | |
Claudia DiGiacomo 1974 Chief Legal Officer | | Chief Legal Officer (since September 2022) of the PGIM Private Credit Fund; Chief Legal Officer (since July 2022) of the PGIM Private Real Estate Fund, Inc.; Chief Legal Officer, Executive Vice President and Secretary of PGIM Investments LLC (since August 2020); Chief Legal Officer of Prudential Mutual Fund Services LLC (since August 2020); Chief Legal Officer of PIFM Holdco, LLC (since August 2020); Vice President and Corporate Counsel (since January 2005) of Prudential; and Corporate Counsel of AST Investment Services, Inc. (since August 2020); formerly Vice President and Assistant Secretary of PGIM Investments LLC (2005-2020); formerly Associate at Sidley Austin Brown & Wood LLP (1999-2004). | | Since December 2005 |
| | | |
Isabelle Sajous 1976 Chief Compliance Officer | | Chief Compliance Officer (since April 2022) of PGIM Investments LLC, the PGIM Funds, Target Funds, PGIM ETF Trust, PGIM Global High Yield Fund, Inc., PGIM High Yield Bond Fund, Inc., PGIM Short Duration High Yield Opportunities Fund, Advanced Series Trust, The Prudential Series Fund and Prudential’s Gibraltar Fund, Inc.; Chief Compliance Officer (since September 2022) of the PGIM Private Credit Fund; Chief Compliance Officer (since March 2022) of the PGIM Private Real Estate Fund, Inc.; Vice President, Compliance of PGIM Investments LLC (since December 2020); formerly Director, Compliance (July 2018-December 2020) of Credit Suisse Asset Management LLC; and Vice President, Associate General Counsel & Deputy Chief Compliance Officer of Cramer Rosenthal McGlynn, LLC (August 2014-July 2018). | | Since April 2022 |
| | | |
Andrew R. French 1962 Secretary | | Vice President (since December 2018) of PGIM Investments LLC; Secretary (since September 2022) of the PGIM Private Credit Fund; Secretary (since March 2022) of the PGIM Private Real Estate Fund, Inc.; formerly Vice President and Corporate Counsel (2010-2018) of Prudential; formerly Director and Corporate Counsel (2006-2010) of Prudential; Vice President and Assistant Secretary (since January 2007) of PGIM Investments LLC; Vice President and Assistant Secretary (since January 2007) of Prudential Mutual Fund Services LLC. | | Since October 2006 |
| | | |
Melissa Gonzalez 1980 Assistant Secretary | | Vice President and Corporate Counsel (since September 2018) of Prudential; Vice President and Assistant Secretary (since August 2020) of PGIM Investments LLC; Assistant Secretary (since September 2022) of the PGIM Private Credit Fund; Assistant Secretary (since March 2022) of the PGIM Private Real Estate Fund, Inc.; formerly Director and Corporate Counsel (March 2014-September 2018) of Prudential. | | Since March 2020 |
Visit our website at pgim.com/investments
| | | | |
| | | |
| Fund Officers(a) | | | | |
| | | |
Name Year of Birth Fund Position | | Principal Occupation(s) During Past Five Years | | Length of Service as Fund Officer |
| | | |
Patrick E. McGuinness 1986 Assistant Secretary | | Vice President and Assistant Secretary (since August 2020) of PGIM Investments LLC; Director and Corporate Counsel (since February 2017) of Prudential; Assistant Secretary (since September 2022) of the PGIM Private Credit Fund; Assistant Secretary (since March 2022) of the PGIM Private Real Estate Fund, Inc. | | Since June 2020 |
| | | |
Debra Rubano 1975 Assistant Secretary | | Vice President and Corporate Counsel (since November 2020) of Prudential; Assistant Secretary (since September 2022) of the PGIM Private Credit Fund; Assistant Secretary (since March 2022) of the PGIM Private Real Estate Fund, Inc; formerly Director and Senior Counsel of Allianz Global Investors U.S. Holdings LLC (2010-2020) and Assistant Secretary of numerous funds in the Allianz fund complex (2015-2020). | | Since December 2020 |
| | | |
Kelly A. Coyne 1968 Assistant Secretary | | Director, Investment Operations of Prudential Mutual Fund Services LLC (since 2010); Assistant Secretary (since September 2022) of the PGIM Private Credit Fund; Assistant Secretary (since March 2022) of the PGIM Private Real Estate Fund, Inc. | | Since March 2015 |
| | | |
Christian J. Kelly 1975 Treasurer and Principal Financial and Accounting Officer | | Vice President, Head of Fund Administration of PGIM Investments LLC (since November 2018); Principal Financial Officer (since September 2022) of the PGIM Private Credit Fund; Principal Financial Officer (since March 2022) of the PGIM Private Real Estate Fund, Inc.; formerly, Treasurer and Principal Accounting Officer (March 2022- July 2022) of the PGIM Private Real Estate Fund, Inc.; formerly Director of Fund Administration of Lord Abbett & Co. LLC (2009-2018), Treasurer and Principal Accounting Officer of the Lord Abbett Family of Funds (2017-2018); Director of Accounting, Avenue Capital Group (2008-2009); Senior Manager, Investment Management Practice of Deloitte & Touche LLP (1998-2007). | | Since January 2019 |
| | | |
Lana Lomuti 1967 Assistant Treasurer | | Vice President (since 2007) and Director (2005-2007), within PGIM Investments Fund Administration; formerly Assistant Treasurer (December 2007-February 2014) of The Greater China Fund, Inc. | | Since April 2014 |
| | | |
Russ Shupak 1973 Assistant Treasurer | | Vice President (since 2017) and Director (2013-2017), within PGIM Investments Fund Administration; Treasurer and Principal Accounting Officer (since July 2022) of the PGIM Private Real Estate Fund, Inc.; Assistant Treasurer (since September 2022) of the PGIM Private Credit Fund; formerly Assistant Treasurer (March 2022 – July 2022) of the PGIM Private Real Estate Fund, Inc. | | Since October 2019 |
| | | |
Deborah Conway 1969 Assistant Treasurer | | Vice President (since 2017) and Director (2007-2017), within PGIM Investments Fund Administration. | | Since October 2019 |
PGIM Quant Solutions Stock Index Fund
| | | | |
| | | |
| Fund Officers(a) | | | | |
| | | |
Name Year of Birth Fund Position | | Principal Occupation(s) During Past Five Years | | Length of Service as Fund Officer |
| | | |
Elyse M. McLaughlin 1974 Assistant Treasurer | | Vice President (since 2017) and Director (2011-2017), within PGIM Investments Fund Administration; Treasurer and Principal Accounting Officer (since September 2022) of the PGIM Private Credit Fund; Assistant Treasurer (since March 2022) of the PGIM Private Real Estate Fund, Inc. | | Since October 2019 |
| | | |
Kelly Florio 1978 Anti-Money Laundering Compliance Officer | | Vice President, Corporate Compliance, Global Compliance Programs and Compliance Risk Management (since December 2021) of Prudential; formerly, Head of Fraud Risk Management (October 2019 to December 2021) at New York Life Insurance Company; formerly, Head of Key Risk Area Operations (November 2018 to October 2019), Director of the US Anti-Money Laundering Compliance Unit (2009-2018) and Bank Loss Prevention Associate (2006 -2009) at MetLife. | | Since June 2022 |
| (a) | Excludes Mr. Parker and Mr. Benjamin, interested Board Members who also serve as President and Vice President, respectively. |
Explanatory Notes to Tables:
| ∎ | | Board Members are deemed to be “Interested,” as defined in the 1940 Act, by reason of their affiliation with PGIM Investments LLC and/or an affiliate of PGIM Investments LLC. |
| ∎ | | Unless otherwise noted, the address of all Board Members and Officers is c/o PGIM Investments LLC, 655 Broad Street, Newark, New Jersey 07102-4410. |
| ∎ | | There is no set term of office for Board Members or Officers. The Board Members have adopted a retirement policy, which calls for the retirement of Board Members on December 31 of the year in which they reach the age of 75. |
| ∎ | | “Other Directorships Held” includes all directorships of companies required to register or file reports with the SEC under the 1934 Act (that is, “public companies”) or other investment companies registered under the 1940 Act. |
| ∎ | | “Portfolios Overseen” includes all investment companies managed by PGIM Investments LLC. The investment companies for which PGIM Investments LLC serves as manager include the PGIM Mutual Funds, Target Funds, The Prudential Variable Contract Accounts, PGIM ETF Trust, PGIM Private Real Estate Fund, Inc., PGIM Private Credit Fund, PGIM High Yield Bond Fund, Inc., PGIM Global High Yield Fund, Inc., PGIM Short Duration High Yield Opportunities Fund, The Prudential Series Fund, Prudential’s Gibraltar Fund, Inc. and the Advanced Series Trust. |
| ∎ | | As used in the Fund Officers table “Prudential” means The Prudential Insurance Company of America. |
Visit our website at pgim.com/investments
Approval of Advisory Agreements (unaudited)
The Fund’s Board of Trustees
The Board of Trustees (the “Board”) of PGIM Quant Solutions Stock Index Fund (the “Fund”)1 consists of ten individuals, eight of whom are not “interested persons” of the Fund, as defined in the Investment Company Act of 1940, as amended (the “1940 Act”) (the “Independent Trustees”). The Board is responsible for the oversight of the Fund and its operations, and performs the various duties imposed on the directors of investment companies by the 1940 Act. The Independent Trustees have retained independent legal counsel to assist them in connection with their duties. The Chair of the Board is an Independent Trustee. The Board has established five standing committees: the Audit Committee, the Nominating and Governance Committee, the Compliance Committees and two Investment Committees. Each committee is chaired by, and composed of, Independent Trustees.
Annual Approval of the Fund’s Advisory Agreements
As required under the 1940 Act, the Board determines annually whether to renew the Fund’s management agreement with PGIM Investments LLC (“PGIM Investments”) and the Fund’s subadvisory agreement with PGIM Quantitative Solutions LLC (“PGIM Quantitative Solutions”). In considering the renewal of the agreements, the Board, including all of the Independent Trustees, met on May 26 and June 7-9, 2022 (the “Board Meeting”) and approved the renewal of the agreements through July 31, 2023, after concluding that the renewal of the agreements was in the best interests of the Fund and its shareholders.
In advance of the meetings, the Board requested and received materials relating to the agreements, and had the opportunity to ask questions and request further information in connection with its consideration. Among other things, the Board considered comparative fee information from PGIM Investments and PGIM Quantitative Solutions. Also, the Board considered comparisons with other mutual funds in relevant Peer Universes and Peer Groups, as is further discussed below.
In approving the agreements, the Board, including the Independent Trustees advised by independent legal counsel, considered the factors it deemed relevant, including the nature, quality and extent of services provided by PGIM Investments and the subadviser, the performance of the Fund, the profitability of PGIM Investments and its affiliates, expenses and fees, and the potential for economies of scale that may be shared with the Fund and its shareholders as the Fund’s assets grow. In their deliberations, the Trustees did not identify any single factor which alone was responsible for the Board’s decision to approve the agreements with respect to the Fund. In connection with its deliberations, the Board considered information provided by PGIM Investments throughout the year at regular Board meetings, presentations from portfolio managers and other information, as well as information furnished at or in advance of the Board Meeting.
| 1 | PGIM Quant Solutions Stock Index Fund is a series of Prudential Investment Portfolios 8. |
PGIM Quant Solutions Stock Index Fund
Approval of Advisory Agreements (continued)
The Trustees determined that the overall arrangements between the Fund and PGIM Investments, which serves as the Fund’s investment manager pursuant to a management agreement, and between PGIM Investments and PGIM Quantitative Solutions, which serves as the Fund’s subadviser pursuant to the terms of a subadvisory agreement with PGIM Investments, are in the best interests of the Fund and its shareholders in light of the services performed, fees charged and such other matters as the Trustees considered relevant in the exercise of their business judgment.
The material factors and conclusions that formed the basis for the Trustees’ reaching their determinations to approve the continuance of the agreements are separately discussed below.
Nature, Quality and Extent of Services
The Board received and considered information regarding the nature, quality and extent of services provided to the Fund by PGIM Investments and PGIM Quantitative Solutions. The Board noted that PGIM Quantitative Solutions is affiliated with PGIM Investments. The Board considered the services provided by PGIM Investments, including but not limited to the oversight of the subadviser for the Fund, as well as the provision of fund recordkeeping, compliance and other services to the Fund, and PGIM Investments’ role as administrator for the Fund’s liquidity risk management program. With respect to PGIM Investments’ oversight of the subadviser, the Board noted that PGIM Investments’ Strategic Investment Research Group (“SIRG”), which is a business unit of PGIM Investments, is responsible for monitoring and reporting to PGIM Investments’ senior management on the performance and operations of the subadviser. The Board also considered that PGIM Investments pays the salaries of all of the officers and interested Trustees of the Fund who are part of Fund management. The Board also considered the investment subadvisory services provided by PGIM Quantitative Solutions, including investment research and security selection, as well as adherence to the Fund’s investment restrictions and compliance with applicable Fund policies and procedures. The Board considered PGIM Investments’ evaluation of the subadviser, as well as PGIM Investments’ recommendation, based on its review of the subadviser, to renew the subadvisory agreement.
The Board considered the qualifications, backgrounds and responsibilities of PGIM Investments’ senior management responsible for the oversight of the Fund and PGIM Quantitative Solutions, and also considered the qualifications, backgrounds and responsibilities of PGIM Quantitative Solutions’ portfolio managers who are responsible for the day-to-day management of the Fund’s portfolio. The Board was provided with information pertaining to PGIM Investments’ and PGIM Quantitative Solutions’ organizational structure, senior management, investment operations, and other relevant information pertaining to both PGIM Investments and PGIM Quantitative Solutions. The Board also noted that it received favorable compliance reports from the Fund’s Chief Compliance Officer (“CCO”) as to both PGIM Investments and PGIM Quantitative Solutions.
Visit our website at pgim.com/investments
The Board concluded that it was satisfied with the nature, extent and quality of the investment management services provided by PGIM Investments and the subadvisory services provided to the Fund by PGIM Quantitative Solutions, and that there was a reasonable basis on which to conclude that the Fund benefits from the services provided by PGIM Investments and PGIM Quantitative Solutions under the management and subadvisory agreements.
Costs of Services and Profits Realized by PGIM Investments
The Board was provided with information on the profitability of PGIM Investments and its affiliates in serving as the Fund’s investment manager. The Board discussed with PGIM Investments the methodology utilized in assembling the information regarding profitability and considered its reasonableness. The Board recognized that it is difficult to make comparisons of profitability from fund management contracts because comparative information is not generally publicly available and is affected by numerous factors, including the structure of the particular adviser, the types of funds it manages, its business mix, numerous assumptions regarding allocations and the adviser’s capital structure and cost of capital. However, the Board considered that the cost of services provided by PGIM Investments during the year ended December 31, 2021 exceeded the management fees received by PGIM Investments, resulting in an operating loss to PGIM Investments. Taking these factors into account, the Board concluded that the profitability of PGIM Investments and its affiliates in relation to the services rendered was not unreasonable.
Economies of Scale
The Board received and discussed information concerning economies of scale that PGIM Investments may realize as the Fund’s assets grow beyond current levels. The Board noted that the management fee schedule for the Fund includes breakpoints, which have the effect of decreasing the fee rate as assets increase. During the course of time, the Board has considered information regarding the launch date of the Fund, the management fees of the Fund compared to those of similarly managed funds and PGIM Investments investment in the Fund over time. The Board noted that economies of scale can be shared with the Fund in other ways, including low management fees from inception, additional technological and personnel investments to enhance shareholder services, and maintaining existing expense structures in the face of a rising cost environment. The Board also considered PGIM Investments’ assertion that it continually evaluates the management fee schedule of the Fund and the potential to share economies of scale through breakpoints or fee waivers as asset levels increase.
The Board recognized the inherent limitations of any analysis of economies of scale, stemming largely from the Board’s understanding that most of PGIM Investments’ costs are not specific to individual funds, but rather are incurred across a variety of products and services.
PGIM Quant Solutions Stock Index Fund
Approval of Advisory Agreements (continued)
Other Benefits to PGIM Investments and PGIM Quantitative Solutions
The Board considered potential ancillary benefits that might be received by PGIM Investments and PGIM Quantitative Solutions and their affiliates as a result of their relationship with the Fund. The Board concluded that potential benefits to be derived by PGIM Investments included transfer agency fees received by the Fund’s transfer agent (which is affiliated with PGIM Investments), and benefits to its reputation as well as other intangible benefits resulting from PGIM Investments’ association with the Fund. The Board concluded that the potential benefits to be derived by PGIM Quantitative Solutions included its ability to use soft dollar credits, as well as the potential benefits consistent with those generally resulting from an increase in assets under management, specifically, potential access to additional research resources and benefits to its reputation. The Board concluded that the benefits derived by PGIM Investments and PGIM Quantitative Solutions were consistent with the types of benefits generally derived by investment managers and subadvisers to mutual funds.
Performance of the Fund / Fees and Expenses
The Board considered certain additional factors and made related conclusions relating to the historical performance of the Fund for the one-, three-, five- and ten-year periods ended December 31, 2021.
The Board also considered the Fund’s actual management fee, as well as the Fund’s net total expense ratio, for the fiscal year ended September 30, 2021. The Board considered the management fee for the Fund as compared to the management fee charged by PGIM Investments to other funds and the fee charged by other advisers to comparable mutual funds in a Peer Group. The actual management fee represents the fee rate actually paid by Fund shareholders and includes any fee waivers or reimbursements. The net total expense ratio for the Fund represents the actual expense ratio incurred by Fund shareholders.
The mutual funds included in the Peer Universe, which was used to consider performance, and the Peer Group, which was used to consider fees and expenses, were objectively determined by Broadridge, an independent provider of mutual fund data. In certain circumstances, PGIM Investments also provided supplemental Peer Universe or Peer Group information for reasons addressed with the Board. The comparisons placed the Fund in various quartiles over various periods, with the first quartile being the best 25% of the mutual funds (for performance, the best performing mutual funds and, for expenses, the lowest cost mutual funds).
The section below summarizes key factors considered by the Board and the Board’s conclusions regarding the Fund’s performance, fees and overall expenses. The table sets forth net performance comparisons (which reflect the impact on performance of fund expenses, or any subsidies, expense caps or waivers that may be applicable) with the Peer Universe, actual management fees with the Peer Group (which reflect the
Visit our website at pgim.com/investments
impact of any subsidies or fee waivers), and net total expenses with the Peer Group, each of which were key factors considered by the Board.
| | | | | | | | |
| Net Performance | | 1 Year | | 3 Years | | 5 Years | | 10 Years |
| | 2nd Quartile | | 2nd Quartile | | 2nd Quartile | | 2nd Quartile |
Actual Management Fees: 1st Quartile |
Net Total Expenses: 1st Quartile |
| ● | The Board noted that the Fund underperformed its benchmark index over all periods. |
| ● | The Board and PGIM Investments agreed to retain the existing management fee waiver, so that the effective management fee rate is 0.08% though January 31, 2023. |
| ● | The Board and PGIM Investments also agreed to retain the existing contractual expense cap, which (exclusive of certain fees and expenses) limits transfer agency, shareholder servicing, sub-transfer agency and blue sky fees to the extent that such fees cause total annual operating expenses to exceed 0.18% for Class R6 shares through January 31, 2023. |
| ● | In addition, PGIM Investments will waive management fees or shared operating expenses on any share class to the same extent that it waives such expenses on any other share class, and has agreed that total annual fund operating expenses for Class R6 shares will not exceed total annual fund operating expenses for Class Z shares. |
| ● | The Board concluded that, in light of the above, it would be in the best interests of the Fund and its shareholders to renew the agreements. |
| ● | The Board concluded that the management fees (including subadvisory fees) and total expenses were reasonable in light of the services provided. |
* * *
After full consideration of these factors, the Board concluded that the approval of the agreements was in the best interests of the Fund and its shareholders.
PGIM Quant Solutions Stock Index Fund
| | | | |
| ∎ MAIL | | ∎ TELEPHONE | | ∎ WEBSITE |
| | | |
| 655 Broad Street | | (800) 225-1852 | | pgim.com/investments |
| Newark, NJ 07102 | | | | |
PROXY VOTING
The Board of Trustees of the Fund has delegated to the Fund’s subadviser the responsibility for voting any proxies and maintaining proxy recordkeeping with respect to the Fund. A description of these proxy voting policies and procedures is available without charge, upon request, by calling (800) 225-1852 or by visiting the Securities and Exchange Commission’s website at sec.gov. Information regarding how the Fund voted proxies relating to portfolio securities during the most recent 12-month period ended June 30 is available on the Fund’s website and on the Securities and Exchange Commission’s website.
TRUSTEES
Ellen S. Alberding · Kevin J. Bannon · Scott E. Benjamin · Linda W. Bynoe · Barry H. Evans · Keith F. Hartstein · Laurie Simon Hodrick · Stuart S. Parker · Brian K. Reid · Grace C. Torres
OFFICERS
Stuart S. Parker, President · Scott E. Benjamin, Vice President · Christian J. Kelly, Treasurer and Principal Financial and Accounting Officer · Claudia DiGiacomo, Chief Legal Officer · Isabelle Sajous, Chief Compliance Officer · Kelly Florio, Anti-Money Laundering Compliance Officer · Andrew R. French, Secretary · Melissa Gonzalez, Assistant Secretary · Kelly A. Coyne, Assistant Secretary · Patrick E. McGuinness, Assistant Secretary · Debra Rubano, Assistant Secretary · Lana Lomuti, Assistant Treasurer · Russ Shupak, Assistant Treasurer · Elyse M. McLaughlin, Assistant Treasurer · Deborah Conway, Assistant Treasurer
| | | | |
| MANAGER | | PGIM Investments LLC | | 655 Broad Street Newark, NJ 07102 |
| | |
| SUBADVISER | | PGIM Quantitative Solutions LLC | | Gateway Center Two 100 Mulberry Street Newark, NJ 07102 |
| | |
| DISTRIBUTOR | | Prudential Investment Management Services LLC | | 655 Broad Street Newark, NJ 07102 |
| | |
| CUSTODIAN | | The Bank of New York Mellon | | 240 Greenwich Street New York, NY 10286 |
| | |
| TRANSFER AGENT | | Prudential Mutual Fund Services LLC | | PO Box 9658 Providence, RI 02940 |
| | |
INDEPENDENT REGISTERED PUBLIC ACCOUNTING FIRM | | PricewaterhouseCoopers LLP | | 300 Madison Avenue New York, NY 10017 |
| | |
| FUND COUNSEL | | Willkie Farr & Gallagher LLP | | 787 Seventh Avenue New York, NY 10019 |
An investor should consider the investment objectives, risks, charges, and expenses of the Fund carefully before investing. The prospectus and summary prospectus contain this and other information about the Fund. An investor may obtain the prospectus and summary prospectus by visiting our website at pgim.com/investments or by calling (800) 225-1852. The prospectus and summary prospectus should be read carefully before investing.
E-DELIVERY
To receive your mutual fund documents online, go to pgim.com/investments/resource/edelivery and enroll. Instead of receiving printed documents by mail, you will receive notification via email when new materials are available. You can cancel your enrollment or change your email address at any time by visiting the website address above.
SHAREHOLDER COMMUNICATIONS WITH TRUSTEES
Shareholders can communicate directly with the Board of Trustees by writing to the Chair of the Board, PGIM Quant Solutions Stock Index Fund, PGIM Investments, Attn: Board of Trustees, 655 Broad Street, Newark, NJ 07102. Shareholders can communicate directly with an individual Trustee by writing to that Trustee at the same address. Communications are not screened before being delivered to the addressee.
AVAILABILITY OF PORTFOLIO HOLDINGS
The Fund files its complete schedule of portfolio holdings with the Securities and Exchange Commission for the first and third quarters of each fiscal year as an exhibit to its reports on Form N-PORT. The Fund’s Form N-PORT filings are available on the Commission’s website at sec.gov.
The Fund’s Statement of Additional Information contains additional information about the Fund’s Trustees and is available without charge, upon request, by calling (800) 225-1852.
| | | | |
| Mutual Funds: | | | | |
| | | |
ARE NOT INSURED BY THE FDIC OR ANY FEDERAL GOVERNMENT AGENCY | | MAY LOSE VALUE | | ARE NOT A DEPOSIT OF OR GUARANTEED BY ANY BANK OR ANY BANK AFFILIATE |

PGIM QUANT SOLUTIONS STOCK INDEX FUND
| | | | | | | | | | | | | | |
| | | | | | |
| SHARE CLASS | | | | | A | | C | | I | | Z | | R6 |
| | | | | | |
NASDAQ | | | | | | PSIAX | | PSICX | | PDSIX | | PSIFX | | PQSIX |
| | | | | | |
CUSIP | | | | | | 74441F108 | | 74441F306 | | 74441F405 | | 74441F504 | | 74441F702 |
MF174 E

PGIM SECURITIZED CREDIT FUND
ANNUAL REPORT
SEPTEMBER 30, 2022

To enroll in e-delivery, go to pgim.com/investments/resource/edelivery
Table of Contents
This report is not authorized for distribution to prospective investors unless preceded or accompanied by a current prospectus.
The views expressed in this report and information about the Fund’s portfolio holdings are for the period covered by this report and are subject to change thereafter.
Mutual funds are distributed by Prudential Investment Management Services LLC (PIMS), member SIPC. PGIM Fixed Income is a unit of PGIM, Inc. (PGIM), a registered investment adviser. PIMS and PGIM are Prudential Financial companies. © 2022 Prudential Financial, Inc. and its related entities. PGIM and the PGIM logo are service marks of Prudential Financial, Inc. and its related entities, registered in many jurisdictions worldwide.
2 Visit our website at pgim.com/investments
Letter from the President
| | |
 | | Dear Shareholder: |
| | We hope you find the annual report for the PGIM Securitized Credit Fund informative and useful. The report covers performance for the 12-month period that ended September 30, 2022. |
| | The attention of the global economy and financial markets pivoted during the period from the COVID-19 pandemic to the challenge of rapidly rising inflation. While job growth and corporate profits remained strong, prices for a wide range of goods and services rose in response to economic re-openings, supply-chain disruptions, governmental stimulus, and Russia’s invasion of Ukraine. With inflation surging to a 40-year high, the US Federal Reserve and other central banks aggressively hiked interest rates, prompting recession concerns. |
After rising to record levels at the end of 2021, stocks have fallen sharply in 2022 as investors worried about higher prices, slowing economic growth, geopolitical uncertainty, and new COVID-19 outbreaks. Equities rallied for a time during the summer but began falling again in late August on fears that the Fed would keep raising rates to tame inflation. For the entire 12-month period, equities suffered a broad-based global decline, although large-cap US stocks outperformed their small-cap counterparts by a significant margin. International developed and emerging markets trailed the US market during this time.
Rising rates and economic uncertainty drove fixed income prices broadly lower as well. US and global investment-grade bonds, along with US high yield corporate bonds and emerging market debt, all posted negative returns during the period.
Regarding your investments with PGIM, we believe it is important to maintain a diversified portfolio of funds consistent with your tolerance for risk, time horizon, and financial goals. Your financial advisor can help you create a diversified investment plan that may include funds covering all the basic asset classes and that reflects your personal investor profile and risk tolerance. However, diversification and asset allocation strategies do not assure a profit or protect against loss in declining markets.
At PGIM Investments, we provide access to active investment strategies across the global markets in the pursuit of consistent outperformance for investors. PGIM is the world’s 11th-largest investment manager with more than $1.5 trillion in assets under management. Our scale and investment expertise allow us to deliver a diversified suite of actively managed solutions across a broad spectrum of asset classes and investment styles.
Thank you for choosing our family of funds.
Sincerely,

Stuart S. Parker, President
PGIM Securitized Credit Fund
November 15, 2022
PGIM Securitized Credit Fund 3
Your Fund’s Performance (unaudited)
Performance data quoted represent past performance. Past performance does not guarantee future results. The investment return and principal value of an investment will fluctuate so that an investor’s shares, when redeemed, may be worth more or less than their original cost. Current performance may be lower or higher than the past performance data quoted. An investor may obtain performance data as of the most recent month-end by visiting our website at pgim.com/investments or by calling (800) 225-1852.
| | | | | | |
| |
| | | Average Annual Total Returns as of 9/30/22 |
| | | One Year (%) | | Five Years (%) | | Since Inception (%) |
| | | |
Class A | | | | | | |
| | | |
(with sales charges) | | -5.63 | | 1.29 | | 2.54 (11/16/2015) |
| | | |
(without sales charges) | | -2.46 | | 1.96 | | 3.04 (11/16/2015) |
| | | |
Class C | | | | | | |
| | | |
(with sales charges) | | -4.15 | | 1.20 | | 2.27 (11/16/2015) |
| | | |
(without sales charges) | | -3.21 | | 1.20 | | 2.27 (11/16/2015) |
| | | |
Class Z | | | | | | |
| | | |
(without sales charges) | | -2.21 | | 2.22 | | 3.30 (11/16/2015) |
| | | |
Class R6 | | | | | | |
| | | |
(without sales charges) | | -2.16 | | 2.26 | | 3.35 (11/16/2015) |
| | | |
ICE BofA US 3-Month Treasury Bill Index | | | | | | |
| | | |
| | 0.62 | | 1.15 | | 0.98 |
| |
ICE BofA US Dollar 3-Month Deposit Offered Rate Constant Maturity Index | | |
| | 0.41 | | 1.32 | | 1.18 |
| | | |
Bloomberg US Aggregate Bond Index | | | | | | |
| | | |
| | | -14.60 | | -0.27 | | 0.59 |
Since Inception returns are provided for any share class with less than 10 fiscal years of returns. Since Inception returns for the Index are measured from the closest month-end to the class’s inception date.
The ICE BofA US 3-Month Treasury Bill Index was adopted as the Fund’s primary benchmark in March 2022 due to the pending discontinuation of LIBOR.
4 Visit our website at pgim.com/investments
Growth of a $10,000 Investment (unaudited)
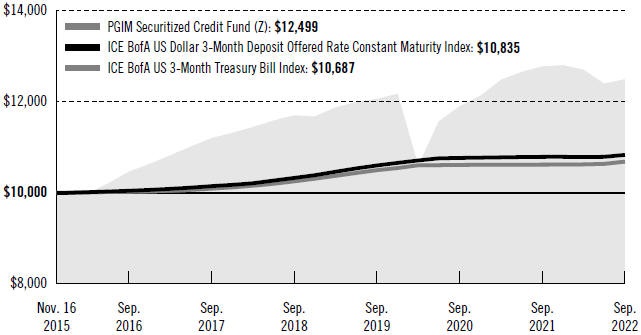
The graph compares a $10,000 investment in the Fund’s Class Z shares by combining the performance of the Predecessor Fund* for the period November 16, 2015 through July 1, 2019, with the performance of Class Z shares beginning with its commencement of operations on July 1, 2019, and comparing that combined performance to a similar investment in the ICE BofA US Dollar 3-Month Deposit Offered Rate Constant Maturity Index and the ICE BofA US 3-Month Treasury Bill Index. The graph portrays the initial account values and the account values at the end of the current fiscal year (September 30, 2022), as measured on a quarterly basis. For purposes of the graph, and unless otherwise indicated, it has been assumed that (a) all recurring fees (including management fees) were deducted and (b) all dividends and distributions were reinvested. The line graph provides information for Class Z shares only. As indicated in the tables provided earlier, performance for other share classes will vary due to the differing fees and expenses applicable to each share class (as indicated in the following paragraphs). Without waiver of fees and/or expense reimbursements, if any, the returns would have been lower.
Past performance does not predict future performance. Total returns and the ending account values in the graph include changes in share price and reinvestment of dividends and capital gains distributions in a hypothetical investment for the periods shown. The Fund’s total returns do not reflect the deduction of income taxes on an individual’s investment. Taxes may reduce your actual investment returns on income or gains paid by the Fund or any gains you may realize if you sell your shares.
* For periods prior to July 1, 2019, the Fund’s performance is that of an investment trust (the “Predecessor Fund”), which commenced operations on November 16, 2015. The performance of the Predecessor Fund has been adjusted to reflect the fees and expenses for the applicable class of shares of the Fund. If the performance of the Predecessor Fund had not been adjusted to reflect the fees and expenses of the Fund, the performance may have been higher than the performance shown
PGIM Securitized Credit Fund 5
Your Fund’s Performance (continued)
for each class of shares. The Predecessor Fund was reorganized into the Fund immediately before the Fund commenced operations on July 1, 2019. Prior to the reorganization, the Predecessor Fund was managed by the Fund’s subadviser since its inception. The investment objective and strategies of the Predecessor Fund were, in all material respects, the same as those of the Fund, and the Predecessor Fund was managed in a manner that, in all material respects, complied with the investment guidelines and restrictions of the Fund. However, the Predecessor Fund was not registered as an investment company under the Investment Company Act of 1940 (“1940 Act”) and the Predecessor Fund was not subject to certain investment limitations, diversification requirements, liquidity requirements, and other restrictions imposed by the 1940 Act and the Internal Revenue Code of 1986 which, if applicable, may have resulted in different performance.
The ICE BofA US 3-Month Treasury Bill Index was adopted as the Fund’s primary benchmark in March 2022 due to the pending discontinuation of LIBOR.
The returns in the tables do not reflect the deduction of taxes that a shareholder would pay on Fund distributions or following the redemption of Fund shares. The average annual total returns take into account applicable sales charges, which are described for each share class in the table below.
| | | | | | | | |
| | | | | |
| | | Class A | | Class C | | Class Z | | Class R6 |
| | | | | |
| Maximum initial sales charge | | 3.25% of the public offering price | | None | | None | | None |
| Contingent deferred sales charge (CDSC) (as a percentage of the lower of the original purchase price or the net asset value at redemption) | | 1.00% on sales of $500,000 or more made within 12 months of purchase | | 1.00% on sales made within 12 months of purchase | | None | | None |
| Annual distribution and service (12b-1) fees (shown as a percentage of average daily net assets) | | 0.25% | | 1.00% | | None | | None |
Benchmark Definitions
ICE BofA US 3-Month Treasury Bill Index—The ICE BofA US 3-Month Treasury Bill Index is an unmanaged index which is comprised of a single issue purchased at the beginning of the month and held for a full month. At the end of the month that issue is sold and rolled into a newly selected issue. The issue selected at each month-end rebalancing is the outstanding Treasury Bill that matures closest to, but not beyond, three months from the rebalancing date. To qualify for selection, an issue must have settled on or before the month-end rebalancing date.
ICE BofA US Dollar 3-Month Deposit Offered Rate Constant Maturity Index—The ICE BofA US Dollar 3-Month Deposit Offered Rate Constant Maturity Index is an unmanaged index which tracks the performance of a synthetic asset paying LIBOR to a stated maturity. The Index is based on the assumed
6 Visit our website at pgim.com/investments
purchase at par of a synthetic instrument having exactly its stated maturity and with a coupon equal to that day’s fixing rate. That issue is assumed to be sold the following business day (priced at a yield equal to the current day fixing rate) and rolled into a new instrument.
Source: ICE BofA, used with permission.
Bloomberg US Aggregate Bond Index—The Bloomberg US Aggregate Bond Index is unmanaged and represents securities that are taxable and US dollar denominated. It covers the US investment grade fixed rate bond market, with index components for government and corporate securities, mortgage pass-through securities, and asset-backed securities.
PGIM Securitized Credit Fund 7
Your Fund’s Performance (continued)
Investors cannot invest directly in an index. The returns for the Indexes would be lower if they included the effects of sales charges, operating expenses of a mutual fund, or taxes that may be paid by an investor.
| | | | |
|
| Credit Quality expressed as a percentage of total investments as of 9/30/22 (%) | |
| |
AAA | | | 9.7 | |
| |
AA | | | 10.0 | |
| |
A | | | 2.1 | |
| |
BBB | | | 25.4 | |
| |
BB | | | 30.8 | |
| |
B | | | 8.1 | |
| |
CCC | | | 0.2 | |
| |
Not Rated | | | 5.6 | |
| |
Cash/Cash Equivalents | | | 8.1 | |
| | |
| Total | | | 100.0 | |
Source: PGIM Fixed Income
Credit ratings reflect the highest rating assigned by a nationally recognized statistical rating organization (NRSRO) such as Moody’s Investors Service, Inc. (Moody’s), S&P Global Ratings (S&P), or Fitch, Inc. (Fitch). Credit ratings reflect the common nomenclature used by both S&P and Fitch. Where applicable, ratings are converted to the comparable S&P/Fitch rating tier nomenclature. These rating agencies are independent and are widely used. The Not Rated category consists of securities that have not been rated by an NRSRO. Credit ratings are subject to change.
| | | | | | |
| | | |
| Distributions and Yields as of 9/30/22 | | | | | | |
| | | |
| | | Total Distributions Paid for 12 Months ($) | | SEC 30-Day Subsidized
Yield* (%) | | SEC 30-Day Unsubsidized
Yield** (%) |
| | | |
Class A | | 0.30 | | 5.01 | | -6.30 |
| | | |
Class C | | 0.23 | | 4.42 | | 2.52 |
| | | |
Class Z | | 0.33 | | 5.44 | | 4.96 |
| | | |
Class R6 | | 0.33 | | 5.46 | | -5.19 |
*SEC 30-Day Subsidized Yield (%)—A standardized yield calculation created by the Securities and Exchange Commission, it reflects the income earned during a 30-day period, after the deduction of the Fund’s net expenses (net of any expense waivers or reimbursements). The investor experience is represented by the SEC 30-Day Subsidized Yield.
**SEC 30-Day Unsubsidized Yield (%)—A standardized yield calculation created by the Securities and Exchange Commission, it reflects the income earned during a 30-day period, after the deduction of the Fund’s gross expenses. The investor experience is represented by the SEC 30-Day Subsidized Yield.
8 Visit our website at pgim.com/investments
Strategy and Performance Overview* (unaudited)
How did the Fund perform?
The PGIM Securitized Credit Fund’s Class Z shares returned –2.21% in the 12-month reporting period that ended September 30, 2022, underperforming the 0.62% return of the ICE BofA US 3-Month Treasury Bill Index (the Index).
What were the market conditions?
| · | | From a starting point of low yields and tight spreads, the shift in fundamentals—most notably, high inflation—drove a wholesale repricing of markets during the reporting period. Concerns about central bank tightening, hard economic landings, and the war in Ukraine led global credit spreads notably wider, while rate volatility increased as markets first began pricing in more aggressive Federal Open Market Committee policy tightening and then later began to price in a hard economic landing. |
| · | | Against the backdrop of historic lows in unemployment and generational highs in inflation, the Federal Reserve (the Fed) signaled an increased willingness to accept more economic and market pain than it had over the prior decade of low inflation. A succession of interest rate hikes—including outsized 75 basis point hikes in June, July, and September—confirmed to markets that the Fed is fully focused on tackling inflation. (One basis point equals 0.01%.) |
| · | | Elevated inflationary pressures, a slowing growth outlook, and an increasingly hawkish Fed drove spreads across fixed income markets wider throughout the period, with residential mortgage-backed securities (RMBS), commercial mortgage-backed securities (CMBS), asset-backed securities (ABS), collateralized loan obligations (CLOs), investment grade corporates, high yield bonds, and bank loans all trading well above their recent tights by the end of the period. |
| · | | ABS: Tight labor market conditions continued to buoy consumer-backed ABS despite a lower personal savings rate, and they ended the period well off the peaks seen in early 2020 and 2021. Higher default rates began to emerge in some deeper subprime segments, while credit card, consumer loan, and auto loan delinquencies remained low as the unemployment rate remained near historic lows. |
| · | | RMBS: A confluence of factors—including favorable demographics, tight inventories, low mortgage rates, and a need for shelter—fueled a 15.8% year-over-year appreciation in home prices through July 2022, according to the US CoreLogic S&P Case-Shiller Index. However, housing supply-and-demand dynamics weakened appreciably during the last few months of the period in response to higher mortgage rates. While housing affordability remained an issue, housing price appreciation likely peaked in the first quarter of 2022 and is expected to fall in 2023. Meanwhile, underwriting standards remain stringent, and delinquencies remain at an all-time low. |
| · | | CMBS: After peaking in the first quarter of 2022, commercial property prices declined 5% in the second quarter and another 1% in August, according to the Green Street Commercial Property Price Index, as higher US Treasury yields pressured capitalization rates. The net lease, mall, and office segments led the price declines, while the lodging segment fared best. Meanwhile, overall CMBS delinquency rates |
PGIM Securitized Credit Fund 9
Strategy and Performance Overview* (continued)
| | continued to decline through the period, led by low delinquencies in the office, industrial, and multi-family segments. Delinquencies in the lodging and retail segments remained elevated. |
| · | | CLOs: Issuance slowed considerably, as expected, from the record pace of 2021 as investors, particularly US money-center banks, slowed purchases. Spreads widened across the capital structure but particularly in the senior tranches. Default rates in the underlying bank loan market remained low but began to rise toward the end of the period, and negative credit migration in underlying loans is expected to increase—especially in single-B-rated loans. |
What worked?
| · | | The Fund’s minimal exposure to interest rate risk and relatively guarded credit risk positioning helped total returns in the period despite a challenged attribution against the Index. |
| · | | The Fund’s moderate credit risk profile at the beginning of the period, combined with a tactical reduction of risk along with increased levels of cash throughout the period, reduced the portfolio’s sensitivity to market spread widening. |
What didn’t work?
| · | | Investments in single-asset single-borrower (SASB) CMBS securities detracted from performance during the period as spreads widened across property types. |
| · | | Positioning in non-agency mortgage-backed securities (RMBS), bank loans, high yield, and CLOs also detracted. |
Did the Fund use derivatives?
| · | | The Fund utilized interest rate swaps to hedge interest rate risk relative to the Index to help immunize any impact from fluctuations in interest rates. The aggregate impact was positive. |
| · | | Derivatives in the form of forward currency exchange contracts were used to hedge against the Fund’s positions not denominated in US dollars, which had a negligible impact on performance. |
| · | | The Fund used credit index derivatives to manage its overall risk profile relative to the Index. |
Current outlook
| · | | Tighter financial conditions are expected to continue working their way through the economy with lagged effects in coming quarters. For now, the Fed is focused on currently-high monthly inflation readings, vowing to keep up the pressure until readings show convincing signs of softening toward the Fed’s target. At some point, though, PGIM Fixed Income expects the Fed will likely pivot back toward a focus on the projected lagged effects of its tightening and—should material signs of softening accumulate—adopt a more measured pace of policy normalization. |
10 Visit our website at pgim.com/investments
| · | | Higher rates should put downward pressure on both residential and commercial real estate. PGIM Fixed Income expects home prices to soften by 10% over the second half of 2022 and into 2023, effectively resetting prices back to late 2021 levels. Despite the softening, PGIM Fixed Income expects mortgage credit to remain robust, given embedded equity and solid underwriting. |
| · | | PGIM Fixed Income expects commercial real estate prices to also moderate over the medium term, given higher capitalization rates and a more difficult financing environment. It also sees the office sector as more challenged, given persistent working-from-home dynamics. Consumer credit should continue to normalize as inflation pressures begin to erode lower-income households’ balance sheets. |
| · | | The withdrawal of central bank accommodation and the concomitant risk of a policy error make PGIM Fixed Income cautious about the direction of the broader spread markets over the medium term. Nevertheless, PGIM Fixed Income believes securitized credit spreads remain attractive versus other spread sectors, particularly those at the short end of the curve. |
| · | | The Fund’s risk positioning overall remains moderate, given the uncertainty in broader market conditions. The largest exposures are in SASB CMBS, senior CLOs, and credit risk transfer (CRT). CRT securities are mortgage-related bonds issued by Fannie Mae and Freddie Mac. PGIM Fixed Income also expects to maintain the Fund’s modest corporate credit exposures. |
| · | | PGIM Fixed Income remains constructive on high-quality securitized assets over the long term, given their relative attractiveness to other fixed income spreads, and it believes conditions at the top of the capital structure should remain resilient in the event an economic downturn affects real estate, corporate loans, and consumer health. Despite the near-term views based on a decade of low default rates and strong market technicals, PGIM Fixed Income remains cautious on mezzanine risk in CLOs and conduit CMBS, as the market does not appear to be pricing in a high enough probability of future stress. However, PGIM Fixed Income continues to find value in select mezzanine tranches of SASB CMBS, consumer ABS, and non-agency mortgage-backed securities. |
*This strategy and performance overview, which discusses what strategies or holdings (including derivatives, if applicable) affected the Fund’s performance, is compiled based on how the Fund performed relative to the Fund’s benchmark index and is viewed for performance attribution purposes at the aggregate Fund level, which in most instances will not directly correlate to the amounts disclosed in the Statement of Operations which conform to US generally accepted accounting principles.
PGIM Securitized Credit Fund 11
Fees and Expenses (unaudited)
As a shareholder of the Fund, you incur two types of costs: (1) transaction costs, including sales charges (loads) on purchase payments and redemptions, as applicable, and (2) ongoing costs, including management fees, distribution and/or service (12b-1) fees, and other Fund expenses, as applicable. This example is intended to help you understand your ongoing costs (in dollars) of investing in the Fund and to compare these costs with the ongoing costs of investing in other mutual funds.
The example is based on an investment of $1,000 held through the six-month period ended September 30, 2022. The example is for illustrative purposes only; you should consult the Prospectus for information on initial and subsequent minimum investment requirements.
Actual Expenses
The first line for each share class in the table on the following page provides information about actual account values and actual expenses. You may use the information on this line, together with the amount you invested, to estimate the expenses that you paid over the period. Simply divide your account value by $1,000 (for example, an $8,600 account value ÷ $1,000 = 8.6), then multiply the result by the number on the first line under the heading “Expenses Paid During the Six-Month Period” to estimate the expenses you paid on your account during this period.
Hypothetical Example for Comparison Purposes
The second line for each share class in the table on the following page provides information about hypothetical account values and hypothetical expenses based on the Fund’s actual expense ratio and an assumed rate of return of 5% per year before expenses, which is not the Fund’s actual return. The hypothetical account values and expenses may not be used to estimate the actual ending account balance or expenses you paid for the period. You may use this information to compare the ongoing costs of investing in the Fund and other funds. To do so, compare this 5% hypothetical example with the 5% hypothetical examples that appear in the shareholder reports of the other funds.
The Fund’s transfer agent may charge additional fees to holders of certain accounts that are not included in the expenses shown in the table on the following page. These fees apply to individual retirement accounts (IRAs) and Section 403(b) accounts. As of the close of the six-month period covered by the table, IRA fees included an annual maintenance fee of $15 per account (subject to a maximum annual maintenance fee of $25 for all accounts held by the same shareholder). Section 403(b) accounts are charged an annual $25 fiduciary maintenance fee. Some of the fees may vary in amount, or may be waived, based on your total account balance or the number of PGIM funds, including the Fund, that you own. You should consider the additional fees that were charged to your Fund account over the six-month period when you estimate the total ongoing expenses paid over the period and the impact of these fees on your ending account value, as these additional expenses are not reflected in the information
12 Visit our website at pgim.com/investments
provided in the expense table. Additional fees have the effect of reducing investment returns.
Please note that the expenses shown in the table are meant to highlight your ongoing costs only and do not reflect any transactional costs such as sales charges (loads). Therefore, the second line for each share class in the table is useful in comparing ongoing costs only and will not help you determine the relative total costs of owning different funds. In addition, if these transactional costs were included, your costs would have been higher.
| | | | | | | | | | | | |
| | | | | |
| PGIM Securitized Credit Fund | | Beginning Account Value
April 1, 2022 | | Ending Account Value
September 30, 2022 | | Annualized Expense Ratio Based on the Six-Month Period | | Expenses Paid
During the Six-Month Period* |
| | | | | |
Class A | | Actual | | $1,000.00 | | | $ 983.30 | | | 0.91% | | $4.52 |
| | | | | |
| | Hypothetical | | $1,000.00 | | | $1,020.51 | | | 0.91% | | $4.61 |
| | | | | |
Class C | | Actual | | $1,000.00 | | | $ 979.60 | | | 1.66% | | $8.24 |
| | | | | |
| | Hypothetical | | $1,000.00 | | | $1,016.75 | | | 1.66% | | $8.39 |
| | | | | |
Class Z | | Actual | | $1,000.00 | | | $ 983.60 | | | 0.66% | | $3.28 |
| | | | | |
| | Hypothetical | | $1,000.00 | | | $1,021.76 | | | 0.66% | | $3.35 |
| | | | | |
Class R6 | | Actual | | $1,000.00 | | | $ 983.80 | | | 0.61% | | $3.03 |
| | | | | |
| | | Hypothetical | | $1,000.00 | | | $1,022.01 | | | 0.61% | | $3.09 |
*Fund expenses (net of fee waivers or subsidies, if any) for each share class are equal to the annualized expense ratio for each share class (provided in the table), multiplied by the average account value over the period, multiplied by the 183 days in the six-month period ended September 30, 2022, and divided by the 365 days in the Fund’s fiscal year ended September 30, 2022 (to reflect the six-month period). Expenses presented in the table include the expenses of any underlying portfolios in which the Fund may invest.
PGIM Securitized Credit Fund 13
Schedule of Investments
as of September 30, 2022
| | | | | | | | | | | | |
| | | | |
| Description | | Interest Rate | | Maturity Date | | Principal Amount (000)# | | | Value | |
| | | | |
LONG-TERM INVESTMENTS 91.2% | | | | | | | | | | | | |
| | | | |
ASSET-BACKED SECURITIES 30.0% | | | | | | | | | | | | |
| | | | |
Automobiles 5.3% | | | | | | | | | | | | |
| | | | |
Exeter Automobile Receivables Trust,
Series 2022-01A, Class E, 144A | | 5.020% | | 10/15/29 | | | 1,200 | | | $ | 1,062,738 | |
JPMorgan Chase Bank NA - CACLN,
Series 2020-01, Class F, 144A | | 6.684 | | 01/25/28 | | | 800 | | | | 792,637 | |
Santander Bank Auto Credit-Linked Notes,
Series 2022-A, Class C, 144A | | 7.375 | | 05/15/32 | | | 655 | | | | 643,128 | |
Santander Bank NA,
Series 2021-01A, Class D, 144A | | 5.004 | | 12/15/31 | | | 600 | | | | 550,886 | |
Santander Consumer Auto Receivables Trust,
Series 2021-AA, Class E, 144A | | 3.280 | | 03/15/27 | | | 750 | | | | 685,744 | |
| | | | | | | | | | | | |
| | | | |
| | | | | | | | | | | 3,735,133 | |
| | | | |
Collateralized Loan Obligations 16.0% | | | | | | | | | | | | |
| | | | |
Atlas Static Senior Loan Fund Ltd. (Cayman Islands),
Series 2022-01A, Class B, 144A, 3 Month SOFR + 3.400% (Cap N/A, Floor 3.400%) | | 5.900(c) | | 07/15/30 | | | 500 | | | | 494,849 | |
Battalion CLO Ltd. (Cayman Islands),
Series 2018-12A, Class B2R, 144A, 3 Month LIBOR + 2.080% (Cap N/A, Floor 2.080%) | | 5.022(c) | | 05/17/31 | | | 500 | | | | 481,964 | |
Elevation CLO Ltd. (Cayman Islands),
Series 2014-02A, Class A1R, 144A, 3 Month SOFR + 1.492% (Cap N/A, Floor 0.000%) | | 3.819(c) | | 10/15/29 | | | 443 | | | | 437,258 | |
Ellington CLO Ltd. (Cayman Islands),
Series 2017-02A, Class A, 144A, 3 Month LIBOR + 1.700% (Cap N/A, Floor 1.700%) | | 4.605(c) | | 02/15/29 | | | 356 | | | | 351,828 | |
ICG US CLO Ltd. (Cayman Islands),
Series 2015-02RA, Class A2, 144A, 3 Month LIBOR + 1.800% (Cap N/A, Floor 0.000%) | | 4.540(c) | | 01/16/33 | | | 2,000 | | | | 1,870,286 | |
Madison Park Funding Ltd. (Cayman Islands),
Series 2019-33A, Class AR, 144A, 3 Month SOFR + 1.290% (Cap N/A, Floor 1.290%) | | 3.618(c) | | 10/15/32 | | | 1,500 | | | | 1,452,855 | |
Marble Point CLO Ltd. (Cayman Islands),
Series 2021-03A, Class A1, 144A, 3 Month LIBOR + 1.240% (Cap N/A, Floor 1.240%) | | 3.980(c) | | 10/17/34 | | | 500 | | | | 479,086 | |
MidOcean Credit CLO (Cayman Islands), | | | | | | | | | | | | |
Series 2014-03A, Class BR, 144A, 3 Month LIBOR + 1.800% (Cap N/A, Floor 1.800%) | | 4.532(c) | | 04/21/31 | | | 250 | | | | 231,017 | |
Series 2017-07A, Class A1R, 144A, 3 Month LIBOR + 1.040% (Cap N/A, Floor 0.000%) | | 3.552(c) | | 07/15/29 | | | 557 | | | | 547,665 | |
See Notes to Financial Statements.
PGIM Securitized Credit Fund 15
Schedule of Investments (continued)
as of September 30, 2022
| | | | | | | | | | | | |
| | | | |
| Description | | Interest Rate | | Maturity Date | | Principal Amount (000)# | | | Value | |
| | | | |
ASSET-BACKED SECURITIES (Continued) | | | | | | | | | | | | |
| | | | |
Collateralized Loan Obligations (cont’d.) | | | | | | | | | | | | |
| | | | |
Race Point CLO Ltd. (Cayman Islands),
Series 2013-08A, Class AR2, 144A, 3 Month LIBOR + 1.040% (Cap N/A, Floor 1.040%) | | 4.024%(c) | | 02/20/30 | | | 1,899 | | | $ | 1,867,893 | |
St. Pauls CLO (Ireland),
Series 11A, Class C2R, 144A | | 2.500 | | 01/17/32 | | EUR | 750 | | | | 641,875 | |
TCW CLO Ltd. (Cayman Islands),
Series 2019-02A, Class BR, 144A, 3 Month SOFR + 1.850% (Cap N/A, Floor 1.850%) | | 4.327(c) | | 10/20/32 | | | 1,000 | | | | 932,963 | |
TICP CLO Ltd. (Cayman Islands),
Series 2017-09A, Class A, 144A, 3 Month LIBOR + 1.140% (Cap N/A, Floor 1.140%) | | 3.850(c) | | 01/20/31 | | | 1,000 | | | | 975,792 | |
Trimaran Cavu Ltd.,
Series 2019-01A, Class B, 144A, 3 Month LIBOR + 2.200% (Cap N/A, Floor 2.200%) | | 4.910(c) | | 07/20/32 | | | 500 | | | | 486,086 | |
| | | | | | | | | | | | |
| | | | |
| | | | | | | | | | | 11,251,417 | |
| | | | |
Consumer Loans 5.3% | | | | | | | | | | | | |
| | | | |
Lendmark Funding Trust,
Series 2021-01A, Class D, 144A | | 5.050 | | 11/20/31 | | | 500 | | | | 369,520 | |
OneMain Financial Issuance Trust,
Series 2022-02A, Class D, 144A | | 6.550 | | 10/14/34 | | | 880 | | | | 851,232 | |
Oportun Funding XIV LLC, | | | | | | | | | | | | |
Series 2021-A, Class A, 144A | | 1.210 | | 03/08/28 | | | 1,500 | | | | 1,392,687 | |
Series 2021-A, Class D, 144A | | 5.400 | | 03/08/28 | | | 500 | | | | 460,171 | |
Oportun Issuance Trust,
Series 2022-02, Class A, 144A | | 5.940 | | 10/09/29 | | | 638 | | | | 634,424 | |
| | | | | | | | | | | | |
| | | | |
| | | | | | | | | | | 3,708,034 | |
| | | | |
Other 2.3% | | | | | | | | | | | | |
| | | | |
Loandepot GMSR Master Trust,
Series 2018-GT01, Class A, 144A, 1 Month LIBOR + 2.800% (Cap N/A, Floor 2.800%) | | 5.739(c) | | 10/16/23 | | | 400 | | | | 368,063 | |
PNMAC FMSR Issuer Trust,
Series 2018-FT01, Class A, 144A, 1 Month LIBOR + 2.350% (Cap N/A, Floor 0.000%) | | 5.434(c) | | 04/25/23 | | | 710 | | | | 680,323 | |
TH MSR Issuer Trust,
Series 2019-FT01, Class A, 144A, 1 Month LIBOR + 2.800% (Cap N/A, Floor 2.800%) | | 5.884(c) | | 06/25/24 | | | 620 | | | | 574,467 | |
| | | | | | | | | | | | |
| | | | |
| | | | | | | | | | | 1,622,853 | |
See Notes to Financial Statements.
16
| | | | | | | | | | | | |
| | | | |
| Description | | Interest
Rate | | Maturity
Date | | Principal Amount (000)# | | | Value | |
| | | | |
ASSET-BACKED SECURITIES (Continued) | | | | | | | | | | | | |
| | | | |
Residential Mortgage-Backed Securities 0.8% | | | | | | | | | | | | |
| | | | |
LSF11 Boson Investments Sarl Compartment 2 (Spain),
Series 2021-NPLA, Class A1, 144A, 3 Month EURIBOR + 2.000% (Cap N/A, Floor 2.000%) | | 2.468%(c) | | 11/25/60 | | EUR | 348 | | | $ | 320,170 | |
TFS (Spain), | | | | | | | | | | | | |
Series 2018-03^ | | 0.000(s) | | 04/16/40 | | EUR | —(r | ) | | | 314 | |
Series 2018-03, Class A1, 1 Month EURIBOR + 3.000%^ | | 3.619(c) | | 04/16/23 | | EUR | 279 | | | | 259,621 | |
| | | | | | | | | | | | |
| | | | |
| | | | | | | | | | | 580,105 | |
| | | | |
Student Loans 0.3% | | | | | | | | | | | | |
| | | | |
Laurel Road Prime Student Loan Trust,
Series 2019-A, Class R, 144A | | 0.000 | | 10/25/48 | | | 716 | | | | 164,923 | |
SoFi Alternative Trust,
Series 2019-D, Class 1PT, 144A | | 3.085(cc) | | 01/16/46 | | | 58 | | | | 53,894 | |
| | | | | | | | | | | | |
| | | | |
| | | | | | | | | | | 218,817 | |
| | | | | | | | | | | | |
| | | | |
TOTAL ASSET-BACKED SECURITIES
(cost $22,362,367) | | | | | | | | | | | 21,116,359 | |
| | | | | | | | | | | | |
| | | | |
COMMERCIAL MORTGAGE-BACKED SECURITIES 24.7% | | | | | | | | | | | | |
| | | | |
20 Times Square Trust, | | | | | | | | | | | | |
Series 2018-20TS, Class F, 144A | | 3.203(cc) | | 05/15/35 | | | 520 | | | | 488,101 | |
Series 2018-20TS, Class G, 144A | | 3.203(cc) | | 05/15/35 | | | 200 | | | | 184,711 | |
Series 2018-20TS, Class H, 144A | | 3.203(cc) | | 05/15/35 | | | 100 | | | | 90,865 | |
Barclays Commercial Mortgage Securities Trust, | | | | | | | | | | | | |
Series 2016-ETC, Class E, 144A | | 3.729(cc) | | 08/14/36 | | | 250 | | | | 188,189 | |
Series 2018-CHRS, Class D, 144A | | 4.409(cc) | | 08/05/38 | | | 490 | | | | 381,414 | |
BX Commercial Mortgage Trust, | | | | | | | | | | | | |
Series 2019-XL, Class G, 144A, 1 Month LIBOR + 2.300% (Cap N/A, Floor 2.300%) | | 5.118(c) | | 10/15/36 | | | 213 | | | | 203,458 | |
Series 2019-XL, Class J, 144A, 1 Month LIBOR + 2.650% (Cap N/A, Floor 2.650%) | | 5.468(c) | | 10/15/36 | | | 765 | | | | 730,521 | |
Series 2021-CIP, Class E, 144A, 1 Month LIBOR + 2.820% (Cap N/A, Floor 2.820%) | | 5.638(c) | | 12/15/38 | | | 347 | | | | 323,298 | |
Series 2022-AHP, Class E, 144A, 1 Month SOFR + 3.040% (Cap N/A, Floor 3.040%) | | 5.885(c) | | 01/17/39 | | | 1,450 | | | | 1,349,435 | |
Citigroup Commercial Mortgage Trust, | | | | | | | | | | | | |
Series 2019-SMRT, Class E, 144A | | 4.903(cc) | | 01/10/36 | | | 726 | | | | 689,812 | |
See Notes to Financial Statements.
PGIM Securitized Credit Fund 17
Schedule of Investments (continued)
as of September 30, 2022
| | | | | | | | | | | | |
| | | | |
| Description | | Interest
Rate | | Maturity
Date | | Principal Amount (000)# | | | Value | |
| | |
COMMERCIAL MORTGAGE-BACKED SECURITIES (Continued) | | | | | | | | |
| | | | |
Cold Storage Trust,
Series 2020-ICE05, Class E, 144A, 1 Month LIBOR + 2.766% (Cap N/A, Floor 2.833%) | | 5.583%(c) | | 11/15/37 | | | 1,293 | | | $ | 1,245,702 | |
Credit Suisse Mortgage Capital Certificates, | | | | | | | | | | | | |
Series 2019-ICE04, Class E, 144A, 1 Month LIBOR + 2.150% (Cap N/A, Floor 2.150%) | | 4.968(c) | | 05/15/36 | | | 150 | | | | 144,907 | |
Series 2019-ICE04, Class F, 144A, 1 Month LIBOR + 2.650% (Cap N/A, Floor 2.650%) | | 5.468(c) | | 05/15/36 | | | 2,353 | | | | 2,254,118 | |
CSAIL Commercial Mortgage Trust, | | | | | | | | | | | | |
Series 2015-C04, Class XB, IO | | 0.250(cc) | | 11/15/48 | | | 25,076 | | | | 157,756 | |
DBGS Mortgage Trust, | | | | | | | | | | | | |
Series 2018-BIOD, Class F, 144A, 1 Month LIBOR + 2.000% (Cap N/A, Floor 2.000%) | | 4.705(c) | | 05/15/35 | | | 525 | | | | 501,482 | |
DBWF Mortgage Trust, | | | | | | | | | | | | |
Series 2016-85T, Class E, 144A | | 3.935(cc) | | 12/10/36 | | | 500 | | | | 403,983 | |
Deco DAC (United Kingdom), | | | | | | | | | | | | |
Series 2019-RAM, Class A, SONIA + 2.007% (Cap N/A, Floor 2.007%) | | 3.899(c) | | 08/07/30 | | GBP | 379 | | | | 403,321 | |
Series 2019-RAM, Class B, SONIA + 3.607% (Cap N/A, Floor 3.607%) | | 5.499(c) | | 08/07/30 | | GBP | 176 | | | | 168,113 | |
FHLMC Multifamily Mortgage Trust, | | | | | | | | | | | | |
Series 2019-K735, Class X2A, IO, 144A | | 0.100 | | 05/25/26 | | | 93,743 | | | | 249,338 | |
FHLMC Multifamily Structured Pass-Through Certificates, | | | | | | | | | | | | |
Series K026, Class X1, IO | | 1.019(cc) | | 11/25/22 | | | 871 | | | | 19 | |
Series K052, Class X1, IO | | 0.773(cc) | | 11/25/25 | | | 2,175 | | | | 34,915 | |
Series K058, Class X1, IO | | 1.045(cc) | | 08/25/26 | | | 3,568 | | | | 103,488 | |
GS Mortgage Securities Corp. Trust, | | | | | | | | | | | | |
Series 2021-IP, Class E, 144A, 1 Month LIBOR + 3.550% (Cap N/A, Floor 3.550%) | | 6.368(c) | | 10/15/36 | | | 1,950 | | | | 1,803,787 | |
Series 2021-IP, Class F, 144A, 1 Month LIBOR + 4.550% (Cap N/A, Floor 4.550%) | | 7.368(c) | | 10/15/36 | | | 140 | | | | 129,501 | |
Independence Plaza Trust, | | | | | | | | | | | | |
Series 2018-INDP, Class E, 144A | | 4.996 | | 07/10/35 | | | 100 | | | | 87,830 | |
JPMBB Commercial Mortgage Securities Trust, | | | | | | | | | | | | |
Series 2015-C33, Class XB, IO | | 0.500(cc) | | 12/15/48 | | | 1,620 | | | | 16,857 | |
JPMorgan Chase Commercial Mortgage Securities Trust, | | | | | | | | | | | | |
Series 2018-AON, Class E, 144A | | 4.767(cc) | | 07/05/31 | | | 600 | | | | 489,484 | |
Series 2021-NYAH, Class H, 144A, 1 Month LIBOR + 3.390% (Cap N/A, Floor 3.390%) | | 6.208(c) | | 06/15/38 | | | 1,300 | | | | 1,208,852 | |
Last Mile Logistics Pan Euro Finance DAC (Ireland),
Series 01A, Class D, 144A, 3 Month EURIBOR + 1.900% (Cap N/A, Floor 1.900%) | | 2.239(c) | | 08/17/33 | | EUR | 100 | | | | 85,142 | |
See Notes to Financial Statements.
18
| | | | | | | | | | | | |
| | | | |
| Description | | Interest Rate | | Maturity Date | | Principal Amount (000)# | | | Value | |
| | |
COMMERCIAL MORTGAGE-BACKED SECURITIES (Continued) | | | | | | | | |
| | | | |
MHC Commercial Mortgage Trust,
Series 2021-MHC, Class F, 144A, 1 Month LIBOR + 2.601% (Cap N/A, Floor 2.601%) | | 5.419%(c) | | 04/15/38 | | | 300 | | | $ | 278,498 | |
MKT Mortgage Trust,
Series 2020-525M, Class F, 144A | | 3.039(cc) | | 02/12/40 | | | 250 | | | | 153,240 | |
Morgan Stanley Bank of America Merrill Lynch Trust,
Series 2015-C21, Class XB, IO, 144A | | 0.412(cc) | | 03/15/48 | | | 10,000 | | | | 69,752 | |
Morgan Stanley Capital I Trust,
Series 2019-MEAD, Class E, 144A | | 3.283(cc) | | 11/10/36 | | | 525 | | | | 445,668 | |
One New York Plaza Trust,
Series 2020-01NYP, Class D, 144A, 1 Month LIBOR + 2.750% (Cap N/A, Floor 2.750%) | | 5.568(c) | | 01/15/36 | | | 300 | | | | 281,847 | |
SREIT Trust,
Series 2021-MFP, Class F, 144A, 1 Month LIBOR + 2.625% (Cap N/A, Floor 2.625%) | | 5.443(c) | | 11/15/38 | | | 260 | | | | 241,721 | |
Taurus DAC (United Kingdom), | | | | | | | | | | | | |
Series 2021-UK1A, Class D, 144A, SONIA + 2.600% (Cap N/A, Floor 2.600%) | | 4.561(c) | | 05/17/31 | | GBP | 248 | | | | 248,191 | |
Series 2021-UK4A, Class D, 144A, SONIA + 2.100% (Cap N/A, Floor 2.100%) | | 4.061(c) | | 08/17/31 | | GBP | 238 | | | | 245,288 | |
Wells Fargo Commercial Mortgage Trust, | | | | | | | | | | | | |
Series 2015-P02, Class XB, IO | | 0.568(cc) | | 12/15/48 | | | 6,400 | | | | 83,939 | |
Series 2021-FCMT, Class D, 144A, 1 Month LIBOR + 3.500% (Cap N/A, Floor 3.500%) | | 6.318(c) | | 05/15/31 | | | 340 | | | | 317,981 | |
Series 2021-FCMT, Class E, 144A, 1 Month LIBOR + 4.500% (Cap N/A, Floor 4.500%) | | 7.318(c) | | 05/15/31 | | | 1,000 | | | | 927,689 | |
| | | | | | | | | | | | |
| | |
TOTAL COMMERCIAL MORTGAGE-BACKED SECURITIES
(cost $18,995,066) | | | | | | | 17,412,213 | |
| | | | | | | | | | | | |
| | | | |
CORPORATE BONDS 5.8% | | | | | | | | | | | | |
| | | | |
Aerospace & Defense 0.1% | | | | | | | | | | | | |
| | | | |
Bombardier, Inc. (Canada), | | | | | | | | | | | | |
Sr. Unsec’d. Notes, 144A | | 7.500 | | 03/15/25 | | | 21 | | | | 20,420 | |
Sr. Unsec’d. Notes, 144A | | 7.875 | | 04/15/27 | | | 50 | | | | 46,000 | |
| | | | | | | | | | | | |
| | | | |
| | | | | | | | | | | 66,420 | |
| | | | |
Banks 5.4% | | | | | | | | | | | | |
| | | | |
Bank of America Corp., | | | | | | | | | | | | |
Jr. Sub. Notes, Series JJ | | 5.125(ff) | | 06/20/24(oo) | | | 550 | | | | 516,675 | |
Jr. Sub. Notes, Series RR | | 4.375(ff) | | 01/27/27(oo) | | | 700 | | | | 566,853 | |
Citigroup, Inc., | | | | | | | | | | | | |
Jr. Sub. Notes | | 3.875(ff) | | 02/18/26(oo) | | | 700 | | | | 580,107 | |
See Notes to Financial Statements.
PGIM Securitized Credit Fund 19
Schedule of Investments (continued)
as of September 30, 2022
| | | | | | | | | | | | |
| | | | |
| Description | | Interest
Rate | | Maturity
Date | | Principal Amount (000)# | | | Value | |
| | | | |
CORPORATE BONDS (Continued) | | | | | | | | | | | | |
| | | | |
Banks (cont’d.) | | | | | | | | | | | | |
| | | | |
Citigroup, Inc., (cont’d.) | | | | | | | | | | | | |
Jr. Sub. Notes, Series V | | 4.700%(ff) | | 01/30/25(oo) | | | 605 | | | $ | 486,212 | |
Goldman Sachs Group, Inc. (The), | | | | | | | | | | | | |
Jr. Sub. Notes, Series U | | 3.650(ff) | | 08/10/26(oo) | | | 760 | | | | 586,482 | |
JPMorgan Chase & Co., | | | | | | | | | | | | |
Jr. Sub. Notes, Series FF | | 5.000(ff) | | 08/01/24(oo) | | | 500 | | | | 449,512 | |
Jr. Sub. Notes, Series HH | | 4.600(ff) | | 02/01/25(oo) | | | 80 | | | | 69,591 | |
Texas Capital Bank NA, | | | | | | | | | | | | |
Sr. Unsec’d. Notes, 144A, 3 Month LIBOR + 4.500% | | 8.174(c) | | 09/30/24 | | | 600 | | | | 576,832 | |
| | | | | | | | | | | | |
| | | | |
| | | | | | | | | | | 3,832,264 | |
| | | | |
Entertainment 0.1% | | | | | | | | | | | | |
| | | | |
AMC Entertainment Holdings, Inc.,
Sec’d. Notes, 144A, Cash coupon 10.000% or PIK 12.000% or Cash coupon 5.000% and PIK 6.000% | | 10.000 | | 06/15/26 | | | 61 | | | | 41,586 | |
| | | | |
Media 0.0% | | | | | | | | | | | | |
| | | | |
Diamond Sports Group LLC/Diamond Sports Finance Co.,
Gtd. Notes, 144A | | 6.625 | | 08/15/27 | | | 75 | | | | 5,124 | |
| | | | |
Pipelines 0.2% | | | | | | | | | | | | |
| | | | |
Energy Transfer LP, | | | | | | | | | | | | |
Jr. Sub. Notes, Series G | | 7.125(ff) | | 05/15/30(oo) | | | 140 | | | | 116,060 | |
| | | | | | | | | | | | |
| | | | |
TOTAL CORPORATE BONDS
(cost $4,801,144) | | | | | | | | | | | 4,061,454 | |
| | | | | | | | | | | | |
| | | | |
FLOATING RATE AND OTHER LOANS 4.9% | | | | | | | | | | | | |
| | | | |
Commercial Services 0.6% | | | | | | | | | | | | |
| | | | |
Adtalem Global Education, Inc.,
Term B Loan, 1 Month LIBOR + 4.500% | | 7.052(c) | | 08/12/28 | | | 131 | | | | 128,869 | |
Fly Funding II Sarl (Luxembourg),
Term Loan, 3 Month LIBOR + 1.750%^ | | 4.620(c) | | 08/09/25 | | | 400 | | | | 322,000 | |
| | | | | | | | | | | | |
| | | | |
| | | | | | | | | | | 450,869 | |
See Notes to Financial Statements.
20
| | | | | | | | | | | | |
| | | | |
| Description | | Interest
Rate | | Maturity
Date | | Principal Amount (000)# | | | Value | |
| | | | |
FLOATING RATE AND OTHER LOANS (Continued) | | | | | | | | | | | | |
| | | | |
Computers 0.3% | | | | | | | | | | | | |
| | | | |
McAfee Corp., | | | | | | | | | | | | |
Tranche B-1 Term Loan, 1 Month SOFR + 3.750% | | 6.362%(c) | | 03/01/29 | | | 249 | | | $ | 226,619 | |
| | | | |
Electric 0.3% | | | | | | | | | | | | |
| | | | |
Heritage Power LLC, | | | | | | | | | | | | |
Term Loan B, 3 Month LIBOR + 6.000% | | 8.806(c) | | 07/30/26 | | | 122 | | | | 39,786 | |
Lightstone HoldCo LLC, | | | | | | | | | | | | |
Term Loan, 1 Month LIBOR + 5.750% | | 8.784(c) | | 01/30/27 | | | 177 | | | | 161,496 | |
Term Loan, 1 Month LIBOR + 5.750% | | 8.784(c) | | 01/30/27 | | | 10 | | | | 9,134 | |
| | | | | | | | | | | | |
| | | | |
| | | | | | | | | | | 210,416 | |
| | | | |
Entertainment 0.4% | | | | | | | | | | | | |
| | | | |
Allen Media LLC,
Term B Loan, 3 Month SOFR + 5.500%^ | | 9.203(c) | | 02/10/27 | | | 297 | | | | 254,219 | |
| | | | |
Media 0.2% | | | | | | | | | | | | |
| | | | |
Diamond Sports Group LLC, | | | | | | | | | | | | |
First Lien Term Loan, 1 Month SOFR + 8.000% | | 10.695(c) | | 05/25/26 | | | 50 | | | | 47,473 | |
Second Lien Term Loan, 1 Month SOFR + 3.350% | | 5.945(c) | | 08/24/26 | | | 461 | | | | 89,352 | |
| | | | | | | | | | | | |
| | | | |
| | | | | | | | | | | 136,825 | |
| | | | |
Packaging & Containers 0.5% | | | | | | | | | | | | |
| | | | |
Clydesdale Acquisition Holdings, Inc.,
Term B Loan, 1 Month SOFR + 4.175% | | 7.309(c) | | 04/13/29 | | | 400 | | | | 376,172 | |
| | | | |
Pharmaceuticals 0.6% | | | | | | | | | | | | |
| | | | |
Change Healthcare Holdings LLC,
Closing Date Term Loan, PRIME + 1.500% | | 7.750(c) | | 03/01/24 | | | 450 | | | | 448,594 | |
| | | | |
Retail 0.5% | | | | | | | | | | | | |
| | | | |
Fogo de Chao, Inc.,
Term Loan, 1 Month LIBOR + 4.250% | | 7.365(c) | | 04/05/25 | | | 350 | | | | 328,125 | |
| | | | |
Software 0.3% | | | | | | | | | | | | |
| | | | |
Finastra USA, Inc.,
First Lien Dollar Term Loan, 6 Month LIBOR + 3.500% | | 6.871(c) | | 06/13/24 | | | 233 | | | | 202,471 | |
See Notes to Financial Statements.
PGIM Securitized Credit Fund 21
Schedule of Investments (continued)
as of September 30, 2022
| | | | | | | | | | | | | | |
| | | | |
| Description | | Interest
Rate | | | Maturity
Date | | Principal
Amount
(000)# | | | Value | |
| | |
FLOATING RATE AND OTHER LOANS (Continued) | | | | | | | | |
| | |
Telecommunications 1.2% | | | | | | | | |
| | | | |
Connect Finco Sarl (United Kingdom),
Amendment No. 1 Refinancing Term Loan, 1 Month LIBOR + 3.500% | | | 6.620 | %(c) | | 12/11/26 | | | 265 | | | $ | 245,859 | |
GTT Communications, Inc.,
Closing Date U.S. Term Loan, PRIME + 0.000% | | | 10.000 | (c) | | 05/30/25 | | | 62 | | | | 44,269 | |
Intelsat Jackson Holdings SA (Luxembourg),
Term B Loan, 3 Month SOFR + 4.250% | | | 7.445 | (c) | | 02/01/29 | | | 271 | | | | 253,874 | |
West Corp.,
Initial Term B Loan, 1 Month LIBOR + 4.000% | | | 7.115 | (c) | | 10/10/24 | | | 304 | | | | 259,728 | |
| | | | | | | | | | | | | | |
| | | | |
| | | | | | | | | | | | | 803,730 | |
| | | | | | | | | | | | | | |
| | | | |
TOTAL FLOATING RATE AND OTHER LOANS
(cost $3,840,401) | | | | | | | | | | | | | 3,438,040 | |
| | | | | | | | | | | | | | |
| | | | |
RESIDENTIAL MORTGAGE-BACKED SECURITIES 25.8% | | | | | | | | | | | | | | |
| | |
Bellemeade Re Ltd., | | | | | | | | |
Series 2018-03A, Class M1B, 144A, 1 Month LIBOR + 1.850% (Cap N/A, Floor 1.850%) | | | 4.934(c) | | | 10/25/28 | | | 39 | | | | 38,819 | |
Series 2019-02A, Class M2, 144A, 1 Month LIBOR + 3.100% (Cap N/A, Floor 3.100%) | | | 6.184(c) | | | 04/25/29 | | | 2,500 | | | | 2,424,643 | |
Series 2019-04A, Class M2, 144A, 1 Month LIBOR + 2.850% (Cap N/A, Floor 2.850%) | | | 5.934(c) | | | 10/25/29 | | | 1,490 | | | | 1,413,693 | |
Series 2020-02A, Class M1C, 144A, 1 Month LIBOR + 4.000% (Cap N/A, Floor 4.000%) | | | 7.084(c) | | | 08/26/30 | | | 36 | | | | 36,540 | |
Series 2020-04A, Class M2B, 144A, 1 Month LIBOR + 3.600% (Cap N/A, Floor 3.600%) | | | 6.684(c) | | | 06/25/30 | | | 399 | | | | 398,278 | |
Series 2021-01A, Class M1C, 144A, 30 Day Average SOFR + 2.950% (Cap N/A, Floor 2.950%) | | | 5.231(c) | | | 03/25/31 | | | 150 | | | | 145,037 | |
Series 2022-01, Class M1C, 144A, 30 Day Average SOFR + 3.700% (Cap N/A, Floor 3.700%) | | | 5.981(c) | | | 01/26/32 | | | 510 | | | | 475,992 | |
BVRT Financing Trust,
Series 2021-04, Class F, 144A, 1 Month SOFR + 2.000%^ | | | 4.285 | (c) | | 09/12/26 | | | 133 | | | | 132,297 | |
Connecticut Avenue Securities Trust, | | | | | | | | |
Series 2018-R07, Class 1B1, 144A, 1 Month LIBOR + 4.350% (Cap N/A, Floor 0.000%) | | | 7.434(c) | | | 04/25/31 | | | 1,600 | | | | 1,602,026 | |
Series 2021-R01, Class 1B1, 144A, 30 Day Average SOFR + 3.100% (Cap N/A, Floor 0.000%) | | | 5.381(c) | | | 10/25/41 | | | 130 | | | | 117,812 | |
See Notes to Financial Statements.
22
| | | | | | | | | | | | |
| | | | |
| Description | | Interest
Rate | | Maturity
Date | | Principal
Amount
(000)# | | | Value | |
| | |
RESIDENTIAL MORTGAGE-BACKED SECURITIES (Continued) | | | | | | | | |
Connecticut Avenue Securities Trust, (cont’d.) | | | | | | | | | | | | |
Series 2022-R02, Class 2B1, 144A, 30 Day Average SOFR + 4.500% (Cap N/A, Floor 0.000%) | | 6.781%(c) | | 01/25/42 | | | 620 | | | $ | 554,126 | |
Series 2022-R03, Class 1B1, 144A, 30 Day Average SOFR + 6.250% (Cap N/A, Floor 0.000%) | | 8.531(c) | | 03/25/42 | | | 75 | | | | 71,881 | |
Series 2022-R04, Class 1B1, 144A, 30 Day Average SOFR + 5.250% (Cap N/A, Floor 0.000%) | | 7.531(c) | | 03/25/42 | | | 60 | | | | 55,129 | |
Series 2022-R08, Class 1B1, 144A, 30 Day Average SOFR + 5.600% (Cap N/A, Floor 5.600%) | | 7.905(c) | | 07/25/42 | | | 120 | | | | 112,200 | |
Eagle Re Ltd., | | | | | | | | | | | | |
Series 2019-01, Class M2, 144A, 1 Month LIBOR + 3.300% (Cap N/A, Floor 0.000%) | | 6.384(c) | | 04/25/29 | | | 1,000 | | | | 977,993 | |
Series 2021-01, Class M1C, 144A, 30 Day Average SOFR + 2.700% (Cap N/A, Floor 2.700%) | | 4.981(c) | | 10/25/33 | | | 295 | | | | 293,093 | |
Fannie Mae Connecticut Avenue Securities,
Series 2021-R02, Class 2B1, 144A, 30 Day Average SOFR + 3.300% (Cap N/A, Floor 0.000%) | | 5.581(c) | | 11/25/41 | | | 90 | | | | 81,257 | |
FHLMC Structured Agency Credit Risk Debt Notes, | | | | | | | | | | | | |
Series 2020-HQA05, Class B1, 144A, 30 Day Average SOFR + 4.000% (Cap N/A, Floor 0.000%) | | 6.281(c) | | 11/25/50 | | | 110 | | | | 100,207 | |
Series 2021-DNA02, Class B1, 144A, 30 Day Average SOFR + 3.400% (Cap N/A, Floor 0.000%) | | 5.681(c) | | 08/25/33 | | | 500 | | | | 450,020 | |
FHLMC Structured Agency Credit Risk REMIC Trust, | | | | | | | | | | | | |
Series 2020-DNA01, Class B1, 144A, 1 Month LIBOR + 2.300% (Cap N/A, Floor 0.000%) | | 5.384(c) | | 01/25/50 | | | 900 | | | | 824,145 | |
Series 2020-DNA03, Class B1, 144A, 1 Month LIBOR + 5.100% (Cap N/A, Floor 0.000%) | | 8.184(c) | | 06/25/50 | | | 62 | | | | 63,107 | |
Series 2020-DNA04, Class B1, 144A, 1 Month LIBOR + 6.000% (Cap N/A, Floor 0.000%) | | 9.084(c) | | 08/25/50 | | | 100 | | | | 103,312 | |
Series 2020-DNA05, Class B1, 144A, 30 Day Average SOFR + 4.800% (Cap N/A, Floor 0.000%) | | 7.081(c) | | 10/25/50 | | | 120 | | | | 120,799 | |
Series 2020-HQA04, Class B1, 144A, 1 Month LIBOR + 5.250% (Cap N/A, Floor 0.000%) | | 8.334(c) | | 09/25/50 | | | 120 | | | | 119,251 | |
Series 2021-DNA01, Class B1, 144A, 30 Day Average SOFR + 2.650% (Cap N/A, Floor 0.000%) | | 4.931(c) | | 01/25/51 | | | 250 | | | | 225,914 | |
See Notes to Financial Statements.
PGIM Securitized Credit Fund 23
Schedule of Investments (continued)
as of September 30, 2022
| | | | | | | | | | | | |
| | | | |
| Description | | Interest
Rate | | Maturity
Date | | Principal
Amount
(000)# | | | Value | |
| | |
RESIDENTIAL MORTGAGE-BACKED SECURITIES (Continued) | | | | | | | | |
FHLMC Structured Agency Credit Risk REMIC Trust, (cont’d.) | | | | | | | | | | | | |
Series 2021-DNA05, Class B1, 144A, 30 Day Average SOFR + 3.050% (Cap N/A, Floor 0.000%) | | 5.331%(c) | | 01/25/34 | | | 890 | | | $ | 789,603 | |
Series 2021-DNA06, Class B1, 144A, 30 Day Average SOFR + 3.400% (Cap N/A, Floor 0.000%) | | 5.681(c) | | 10/25/41 | | | 900 | | | | 804,800 | |
Series 2021-DNA07, Class M2, 144A, 30 Day Average SOFR + 1.800% (Cap N/A, Floor 0.000%) | | 4.081(c) | | 11/25/41 | | | 1,000 | | | | 896,249 | |
Series 2021-HQA03, Class B1, 144A, 30 Day Average SOFR + 3.350% (Cap N/A, Floor 0.000%) | | 5.631(c) | | 09/25/41 | | | 90 | | | | 77,125 | |
Series 2022-DNA06, Class M1B, 144A, 30 Day Average SOFR + 3.700% (Cap N/A, Floor 0.000%) | | 5.985(c) | | 09/25/42 | | | 500 | | | | 485,462 | |
Series 2022-HQA03, Class M1B, 144A, 30 Day Average SOFR + 3.550% (Cap N/A, Floor 0.000%) | | 5.831(c) | | 08/25/42 | | | 600 | | | | 562,532 | |
Home Re Ltd., | | | | | | | | | | | | |
Series 2020-01, Class M1C, 144A, 1 Month LIBOR + 4.150% (Cap N/A, Floor 4.150%) | | 7.234(c) | | 10/25/30 | | | 136 | | | | 135,864 | |
Series 2021-01, Class M1C, 144A, 1 Month LIBOR + 2.300% (Cap N/A, Floor 0.000%) | | 5.384(c) | | 07/25/33 | | | 150 | | | | 144,301 | |
Oaktown Re V Ltd., | | | | | | | | | | | | |
Series 2020-02A, Class M1B, 144A, 1 Month LIBOR + 3.600% (Cap N/A, Floor 3.600%) | | 6.684(c) | | 10/25/30 | | | 47 | | | | 47,360 | |
Oaktown Re VII Ltd., | | | | | | | | | | | | |
Series 2021-02, Class M1B, 144A, 30 Day Average SOFR + 2.900% (Cap N/A, Floor 2.900%) | | 5.181(c) | | 04/25/34 | | | 200 | | | | 186,428 | |
PMT Credit Risk Transfer Trust, | | | | | | | | | | | | |
Series 2020-02R, Class A, 144A, 1 Month LIBOR + 3.815% (Cap N/A, Floor 3.815%) | | 6.928(c) | | 12/25/22 | | | 317 | | | | 307,062 | |
PNMAC GMSR Issuer Trust, | | | | | | | | | | | | |
Series 2018-GT01, Class A, 144A, 1 Month LIBOR + 2.850% (Cap N/A, Floor 2.850%) | | 5.934(c) | | 02/25/23 | | | 100 | | | | 99,268 | |
Series 2018-GT02, Class A, 144A, 1 Month LIBOR + 2.650% (Cap N/A, Floor 0.000%) | | 5.734(c) | | 08/25/25 | | | 100 | | | | 97,980 | |
Radnor Re Ltd., | | | | | | | | | | | | |
Series 2018-01, Class M2, 144A, 1 Month LIBOR + 2.700% (Cap N/A, Floor 0.000%) | | 5.784(c) | | 03/25/28 | | | 800 | | | | 793,859 | |
Series 2019-01, Class B1, 144A, 1 Month LIBOR + 4.450% (Cap N/A, Floor 4.450%) | | 7.534(c) | | 02/25/29 | | | 1,000 | | | | 959,992 | |
See Notes to Financial Statements.
24
| | | | | | | | | | | | | | |
| | | | | |
| Description | | Interest
Rate | | Maturity
Date | | | | Principal
Amount
(000)# | | | Value | |
| |
RESIDENTIAL MORTGAGE-BACKED SECURITIES (Continued) | | | |
Radnor Re Ltd., (cont’d.) | | | | | |
Series 2019-02, Class M1B, 144A, 1 Month LIBOR + 1.750% (Cap N/A, Floor 1.750%) | | 4.834%(c) | | 06/25/29 | | | | | 384 | | | $ | 383,354 | |
Series 2021-02, Class M1B, 144A, 30 Day Average SOFR + 3.700% (Cap N/A, Floor 3.700%) | | 5.981(c) | | 11/25/31 | | | | | 300 | | | | 281,304 | |
Retiro Mortgage Securities DAC (Spain), | | | | | |
Series 01A, Class A1, 144A, 3 Month EURIBOR + 2.000% (Cap 5.000%, Floor 0.000%) | | 2.238(c) | | 07/30/75 | | EUR | | | 199 | | | | 191,422 | |
| | | | | | | | | | | | | | |
| | | |
TOTAL RESIDENTIAL MORTGAGE-BACKED SECURITIES
(cost $18,999,624) | | | | | | | | 18,181,536 | |
| | | | | | | | | | | | | | |
| | | |
| | | | | Shares | | | | |
| | | | |
COMMON STOCK 0.0% | | | | | | | | | | | | |
| | | | |
Oil, Gas & Consumable Fuels | | | | | | | | | | | | |
| | | | |
Chesapeake Energy Corp. Backstop Commitment
(cost $398) | | | | | | | 42 | | | | 3,957 | |
| | | | | | | | | | | | | | |
| | | | |
TOTAL LONG-TERM INVESTMENTS
(cost $68,999,000) | | | | | | | | | | | 64,213,559 | |
| | | | | | | | | | | | | | |
| | | | |
SHORT-TERM INVESTMENT 7.9% | | | | | | | | | | | | |
| | | | |
UNAFFILIATED FUND | | | | | | | | | | | | |
| | | | |
Dreyfus Government Cash Management (Institutional Shares)
(cost $5,609,194) | | | | | | | 5,609,194 | | | | 5,609,194 | |
| | | | | | | | | | | | | | |
| | | | |
TOTAL INVESTMENTS, BEFORE OPTIONS WRITTEN 99.1%
(cost $74,608,194) | | | | | | | | | | | 69,822,753 | |
| | | | | | | | | | | | | | |
| | | | |
OPTIONS WRITTEN*~ (0.0)%
(premiums received $0) | | | | | | | | | | | (20 | ) |
| | | | | | | | | | | | | | |
| | | | |
TOTAL INVESTMENTS, NET OF OPTIONS WRITTEN 99.1%
(cost $74,608,194) | | | | | | | | | | | 69,822,733 | |
Other assets in excess of liabilities(z) 0.9% | | | | | | | | | | | 604,317 | |
| | | | | | | | | | | | | | |
| | | | |
NET ASSETS 100.0% | | | | | | | | | | $ | 70,427,050 | |
| | | | | | | | | | | | | | |
Below is a list of the abbreviation(s) used in the annual report:
EUR—Euro
See Notes to Financial Statements.
PGIM Securitized Credit Fund 25
Schedule of Investments (continued)
as of September 30, 2022
GBP—British Pound
USD—US Dollar
144A—Security was purchased pursuant to Rule 144A under the Securities Act of 1933 and, pursuant to the requirements of Rule 144A, may not be resold except to qualified institutional buyers.
A—Annual payment frequency for swaps
CDS—Credit Default Swap
CDX—Credit Derivative Index
CLO—Collateralized Loan Obligation
EURIBOR—Euro Interbank Offered Rate
FHLMC—Federal Home Loan Mortgage Corporation
IO—Interest Only (Principal amount represents notional)
LIBOR—London Interbank Offered Rate
LP—Limited Partnership
M—Monthly payment frequency for swaps
OTC—Over-the-counter
PIK—Payment-in-Kind
Q—Quarterly payment frequency for swaps
REMIC—Real Estate Mortgage Investment Conduit
SOFR—Secured Overnight Financing Rate
SONIA—Sterling Overnight Index Average
USOIS—United States Overnight Index Swap
| * | Non-income producing security. |
| # | Principal or notional amount is shown in U.S. dollars unless otherwise stated. |
| ~ | See tables subsequent to the Schedule of Investments for options detail. |
| ^ | Indicates a Level 3 instrument. The aggregate value of Level 3 instruments is $975,447 and 1.4% of net assets. |
| (c) | Variable rate instrument. The interest rate shown reflects the rate in effect at September 30, 2022. |
| (cc) | Variable rate instrument. The rate shown is based on the latest available information as of September 30, 2022. Certain variable rate securities are not based on a published reference rate and spread but are determined by the issuer or agent and are based on current market conditions. These securities do not indicate a reference rate and spread in their description. |
| (ff) | Variable rate security. Security may be issued at a fixed coupon rate, which converts to a variable rate at a specified date. Rate shown is the rate in effect as of period end. |
| (oo) | Perpetual security. Maturity date represents next call date. |
| (r) | Principal or notional amount is less than $500 par. |
| (s) | Represents zero coupon bond or principal only security. Rate represents yield to maturity at purchase date. |
| (z) | Includes net unrealized appreciation/(depreciation) and/or market value of the below holdings which are excluded from the Schedule of Investments: |
Options Written:
OTC Swaptions
| | | | | | | | | | | | | | | | | | | | | | | | | | | | |
Description | | Call/ Put | | Counterparty | | Expiration
Date | | Strike | | Receive | | | Pay | | | Notional
Amount
(000)# | | Value |
| | | | | | | | | |
GS_21-PJ2A^ | | Put | | Goldman Sachs International | | 11/15/24 | | 0.50% | | | 0.50%(M) | | | | GS_21-PJ2A(M) | | | | 330 | | | | | | | $ | (7 | ) |
GS_21-PJA^ | | Put | | Goldman Sachs International | | 06/17/24 | | 0.25% | | | 0.25%(M) | | | | GS_21-PJA(M) | | | | 630 | | | | | | | | (13 | ) |
| | | | | | | | | | | | | | | | | | | | | | | | | | | | |
Total Options Written (premiums received $—) | | | | | | | | | | | | | | | | | | $ | (20 | ) |
| | | | | | | | | | | | | | | | | | | | | | | | | | | | |
See Notes to Financial Statements.
26
Futures contracts outstanding at September 30, 2022:
| | | | | | | | | | | | | | | | | | |
Number of Contracts | | Type | | Expiration
Date | | | Current
Notional
Amount | | | Value / Unrealized
Appreciation
(Depreciation) |
| | | | |
Long Position: | | | | | | | | | | | | | |
1 | | 20 Year U.S. Treasury Bonds | | | Dec. 2022 | | | $ | 126,406 | | | | | $ | (10,845 | ) | | |
| | | | | | | | | | | | | | | | | | |
Short Positions: | | | | | | | | | | | | | | | | |
16 | | 2 Year U.S. Treasury Notes | | | Dec. 2022 | | | | 3,286,250 | | | | | | 55,856 | | | |
4 | | 5 Year Euro-Bobl | | | Dec. 2022 | | | | 469,444 | | | | | | 14,228 | | | |
39 | | 5 Year U.S. Treasury Notes | | | Dec. 2022 | | | | 4,192,805 | | | | | | 143,918 | | | |
11 | | 10 Year U.S. Treasury Notes | | | Dec. 2022 | | | | 1,232,688 | | | | | | 58,079 | | | |
4 | | Euro Schatz Index | | | Dec. 2022 | | | | 420,108 | | | | | | 4,466 | | | |
| | | | | | | | | | | | | | | | | | |
| | | | | | | | | | | | | | | 276,547 | | | |
| | | | | | | | | | | | | | | | | | |
| | | | | | | | | | | | | | $ | 265,702 | | | |
| | | | | | | | | | | | | | | | | | |
Forward foreign currency exchange contracts outstanding at September 30, 2022:
| | | | | | | | | | | | | | | | | | | | | | | | | | | | | | | | |
Purchase Contracts | | Counterparty | | | | Notional
Amount
(000) | | | Value at
Settlement
Date | | | Current
Value | | | Unrealized Appreciation | | Unrealized Depreciation |
| | | | | | | | |
OTC Forward Foreign Currency Exchange Contracts: | | | | | | | | | | | | | | | | | | | | | | | | | |
British Pound, | | | | | | | | | | | | | | | | | | | | | | | | | | | | | | | | |
Expiring 10/04/22 | | Morgan Stanley & Co.
International PLC | | | | GBP | 996 | | | $ | 1,078,022 | | | $ | 1,112,705 | | | | | $ | 34,683 | | | | | | | $ | — | | | |
Euro, | | | | | | | | | | | | | | | | | | | | | | | | | | | | | | | | |
Expiring 10/04/22 | | Barclays Bank PLC | | | | EUR | 94 | | | | 94,715 | | | | 91,684 | | | | | | — | | | | | | | | (3,031 | ) | | |
Expiring 10/04/22 | | UBS AG | | | | EUR | 1,599 | | | | 1,543,571 | | | | 1,567,368 | | | | | | 23,797 | | | | | | | | — | | | |
| | | | | | | | | | | | | | | | | | | | | | | | | | | | | | | | |
| | | | | | | | | | $ | 2,716,308 | | | $ | 2,771,757 | | | | | | 58,480 | | | | | | | | (3,031 | ) | | |
| | | | | | | | | | | | | | | | | | | | | | | | | | | | | | | | |
| | | | | | | | | | | | | | | | | | | | | | | | | | | | | | |
Sale Contracts | | Counterparty | | Notional
Amount
(000) | | | Value at
Settlement
Date | | | Current
Value | | | Unrealized Appreciation | | Unrealized Depreciation |
| | | | | | | | |
OTC Forward Foreign Currency Exchange Contracts: | | | | | | | | | | | | | | | | | | | | | | | | | |
British Pound, | | | | | | | | | | | | | | | | | | | | | | | | | | | | | | |
Expiring 10/04/22 | | HSBC Bank PLC | | GBP | 996 | | | $ | 1,178,549 | | | $ | 1,112,705 | | | | | $ | 65,844 | | | | | | | $ | — | | | |
Expiring 11/02/22 | | Morgan Stanley & Co. | | | | | | | | | | | | | | | | | | | | | | | | | | | | |
| | International PLC | | GBP | 996 | | | | 1,078,640 | | | | 1,113,365 | | | | | | — | | | | | | | | (34,725 | ) | | |
Euro, | | | | | | | | | | | | | | | | | | | | | | | | | | | | | | |
Expiring 10/04/22 | | Barclays Bank PLC | | EUR | 1,692 | | | | 1,689,775 | | | | 1,659,052 | | | | | | 30,723 | | | | | | | | — | | | |
Expiring 11/02/22 | | UBS AG | | EUR | 1,599 | | | | 1,546,792 | | | | 1,570,511 | | | | | | — | | | | | | | | (23,719 | ) | | |
| | | | | | | | | | | | | | | | | | | | | | | | | | | | | | |
| | | | | | | | $ | 5,493,756 | | | $ | 5,455,633 | | | | | | 96,567 | | | | | | | | (58,444 | ) | | |
| | | | | | | | | | | | | | | | | | | | | | | | | | | | | | |
| | | | | | | | | | | | | | | | | | $ | 155,047 | | | | | | | $ | (61,475 | ) | | |
| | | | | | | | | | | | | | | | | | | | | | | | | | | | | | |
See Notes to Financial Statements.
PGIM Securitized Credit Fund 27
Schedule of Investments (continued)
as of September 30, 2022
Credit default swap agreements outstanding at September 30, 2022:
| | | | | | | | | | | | | | | | | | | | | | | | | | | | | | | | |
Reference Entity/ Obligation | | Termination
Date | | Fixed
Rate | | Notional
Amount
(000)#(3) | | | Implied
Credit
Spread at
September 30,
2022(4) | | Fair
Value | | | Upfront Premiums Paid (Received) | | Unrealized Appreciation (Depreciation) | | Counterparty |
| | | | | | | | | | | | | | | | | | | | | | | | | | | | | |
OTC Credit Default Swap Agreements on asset-backed and/or mortgage-backed securities - Sell Protection(2)^: |
Alcentra CLO | | 10/26/22 | | 1.000%(M) | | EUR | 378 | | | * | | $ | 319 | | | | | $ | (9 | ) | | | | | | $ | 328 | | | | | Goldman
Sachs
International |
Barings CLO | | 10/26/22 | | 1.000%(M) | | EUR | 382 | | | * | | | 322 | | | | | | (9 | ) | | | | | | | 331 | | | | | Goldman
Sachs
International |
Barings CLO | | 10/26/22 | | 1.000%(M) | | EUR | 190 | | | * | | | 159 | | | | | | (5 | ) | | | | | | | 164 | | | | | Goldman
Sachs
International |
Bellemeade Re Ltd. | | 10/28/22 | | 1.250%(M) | | | 135 | * | | | | | 145 | | | | | | (5 | ) | | | | | | | 150 | | | | | Goldman
Sachs
International |
Bellemeade Re Ltd. | | 10/28/22 | | 1.000%(M) | | | 79 | | | 12.320% | | | 68 | | | | | | (2 | ) | | | | | | | 70 | | | | | Goldman
Sachs
International |
Black Diamond CLO | | 10/26/22 | | 1.000%(M) | | EUR | 142 | | | * | | | 120 | | | | | | (3 | ) | | | | | | | 123 | | | | | Goldman
Sachs
International |
BSREP Commercial Mortgage Trust | | 10/27/22 | | 1.250%(M) | | | 85 | | | 1.500% | | | 90 | | | | | | (3 | ) | | | | | | | 93 | | | | | Goldman
Sachs
International |
Carlyle CLO | | 10/26/22 | | 1.000%(M) | | EUR | 202 | | | * | | | 170 | | | | | | (5 | ) | | | | | | | 175 | | | | | Goldman
Sachs
International |
Carlyle CLO | | 10/26/22 | | 1.000%(M) | | EUR | 188 | | | * | | | 159 | | | | | | (4 | ) | | | | | | | 163 | | | | | Goldman
Sachs
International |
Carlyle CLO | | 10/26/22 | | 1.000%(M) | | EUR | 138 | | | * | | | 117 | | | | | | (3 | ) | | | | | | | 120 | | | | | Goldman
Sachs
International |
Carlyle CLO | | 10/26/22 | | 1.000%(M) | | EUR | 93 | | | * | | | 78 | | | | | | (2 | ) | | | | | | | 80 | | | | | Goldman
Sachs
International |
COMM Mortgage Trust | | 10/27/22 | | 1.250%(M) | | | 162 | * | | | | | 174 | | | | | | (5 | ) | | | | | | | 179 | | | | | Goldman
Sachs
International |
Credit Suisse Mortgage Trust | | 10/27/22 | | 1.250%(M) | | | 1,003 | | | 4.670% | | | 1,078 | | | | | | (32 | ) | | | | | | | 1,110 | | | | | Goldman
Sachs
International |
Cross Ocean CLO | | 10/26/22 | | 1.000%(M) | | EUR | 489 | | | * | | | 412 | | | | | | (12 | ) | | | | | | | 424 | | | | | Goldman
Sachs
International |
See Notes to Financial Statements.
28
Credit default swap agreements outstanding at September 30, 2022: (continued)
| | | | | | | | | | | | | | | | | | | | | | | | | | | | | | | | |
Reference Entity/ Obligation | | Termination
Date | | Fixed
Rate | | Notional
Amount
(000)#(3) | | | Implied
Credit
Spread at
September 30,
2022(4) | | Fair
Value | | | Upfront Premiums Paid (Received) | | Unrealized Appreciation (Depreciation) | | Counterparty |
| | | | | | | | | | | | | | | | | | | | | | | | | | | | | |
OTC Credit Default Swap Agreements on asset-backed and/or mortgage-backed securities - Sell Protection(2)^ (cont’d.): |
Eagle Re Ltd. | | 10/28/22 | | 1.250%(M) | | | 311 | | | 43.910% | | $ | 335 | | | | | $ | (10 | ) | | | | | | $ | 345 | | | | | Goldman
Sachs
International |
Federal Home Loan Mortgage Corp. | | 10/27/22 | | 1.250%(M) | | | 331 | | | 4.670% | | | 355 | | | | | | (11 | ) | | | | | | | 366 | | | | | Goldman
Sachs
International |
Federal Home Loan Mortgage Corp. | | 10/27/22 | | 1.250%(M) | | | 227 | | | * | | | 244 | | | | | | (7 | ) | | | | | | | 251 | | | | | Goldman
Sachs
International |
Federal Home Loan Mortgage Corp. | | 10/27/22 | | 1.250%(M) | | | 105 | | | * | | | 113 | | | | | | (3 | ) | | | | | | | 116 | | | | | Goldman
Sachs
International |
Federal Home Loan Mortgage Corp. | | 10/27/22 | | 1.250%(M) | | | 84 | | | * | | | 90 | | | | | | (3 | ) | | | | | | | 93 | | | | | Goldman
Sachs
International |
Federal Home Loan Mortgage Corp. | | 10/27/22 | | 1.250%(M) | | | 33 | | | * | | | 35 | | | | | | (1 | ) | | | | | | | 36 | | | | | Goldman
Sachs
International |
Federal Home Loan Mortgage Corp. | | 10/27/22 | | 1.250%(M) | | | 28 | | | 4.670% | | | 30 | | | | | | (1 | ) | | | | | | | 31 | | | | | Goldman
Sachs
International |
Federal Home Loan Mortgage Corp. | | 10/27/22 | | 1.250%(M) | | | 25 | | | 4.670% | | | 26 | | | | | | (1 | ) | | | | | | | 27 | | | | | Goldman
Sachs
International |
Federal Home Loan Mortgage Corp. | | 10/27/22 | | 1.250%(M) | | | 16 | | | * | | | 16 | | | | | | (1 | ) | | | | | | | 17 | | | | | Goldman
Sachs
International |
Genworth Mortgage Insurance Corp. | | 10/28/22 | | 1.250%(M) | | | 57 | | | * | | | 61 | | | | | | (2 | ) | | | | | | | 63 | | | | | Goldman
Sachs
International |
Genworth Mortgage Insurance Corp. | | 10/28/22 | | 1.250%(M) | | | 18 | | | 11.550% | | | 19 | | | | | | (1 | ) | | | | | | | 20 | | | | | Goldman
Sachs
International |
GS Mortgage Securities Trust | | 10/27/22 | | 1.250%(M) | | | 18 | | | 4.670% | | | 18 | | | | | | (1 | ) | | | | | | | 19 | | | | | Goldman
Sachs
International |
GS Mortgage Securities Trust | | 10/27/22 | | 1.250%(M) | | | 16 | | | * | | | 16 | | | | | | (1 | ) | | | | | | | 17 | | | | | Goldman
Sachs
International |
See Notes to Financial Statements.
PGIM Securitized Credit Fund 29
Schedule of Investments (continued)
as of September 30, 2022
Credit default swap agreements outstanding at September 30, 2022: (continued)
| | | | | | | | | | | | | | | | | | | | | | | | | | | | | | | | |
Reference Entity/ Obligation | | Termination
Date | | Fixed
Rate | | Notional
Amount
(000)#(3) | | | Implied
Credit
Spread at
September 30,
2022(4) | | Fair
Value | | | Upfront Premiums Paid
(Received) | | Unrealized Appreciation (Depreciation) | | Counterparty |
| | | | | | | | | | | | | | | | | | | | | | | | | | | | | |
OTC Credit Default Swap Agreements on asset-backed and/or mortgage-backed securities - Sell Protection(2)^ (cont’d.): |
GS_21-PJ2-A | | 10/14/22 | | 0.500%(M) | | | 150 | | | 0.500% | | $ | 98 | | | | | $ | (2 | ) | | | | | | $ | 100 | | | | | Goldman
Sachs
International |
GS_21-PJ-A | | 10/14/22 | | 0.250%(M) | | | 287 | | | * | | | 93 | | | | | | (2 | ) | | | | | | | 95 | | | | | Goldman
Sachs
International |
ICG CLO | | 10/26/22 | | 1.000%(M) | | EUR | 326 | | | * | | | 275 | | | | | | (8 | ) | | | | | | | 283 | | | | | Goldman
Sachs
International |
Investcorp CLO | | 10/26/22 | | 1.000%(M) | | EUR | 264 | | | * | | | 223 | | | | | | (6 | ) | | | | | | | 229 | | | | | Goldman
Sachs
International |
JPMorgan Chase Commercial Mortgage Securities Trust | | 10/27/22 | | 1.250%(M) | | | 261 | | | * | | | 281 | | | | | | (8 | ) | | | | | | | 289 | | | | | Goldman
Sachs
International |
Multi-Family Structure Credit Risk | | 10/27/22 | | 1.250%(M) | | | 170 | | | 4.670% | | | 183 | | | | | | (5 | ) | | | | | | | 188 | | | | | Goldman
Sachs
International |
Natixis Commercial Mortgage Securities Trust | | 10/27/22 | | 1.250%(M) | | | 83 | | | * | | | 89 | | | | | | (3 | ) | | | | | | | 92 | | | | | Goldman
Sachs
International |
Oaktree CLO | | 10/26/22 | | 1.000%(M) | | EUR | 370 | | | * | | | 312 | | | | | | (9 | ) | | | | | | | 321 | | | | | Goldman
Sachs
International |
Palmer Square CLO | | 10/26/22 | | 1.000%(M) | | EUR | 161 | | | * | | | 135 | | | | | | (4 | ) | | | | | | | 139 | | | | | Goldman
Sachs
International |
Pret LLC | | 10/28/22 | | 0.500%(M) | | | 29 | | | 6.470% | | | 13 | | | | | | — | | | | | | | | 13 | | | | | Goldman
Sachs
International |
Radnor Re Ltd. | | 10/28/22 | | 1.000%(M) | | | 18 | | | 20.860% | | | 16 | | | | | | — | | | | | | | | 16 | | | | | Goldman
Sachs
International |
Sculptor CLO | | 10/26/22 | | 1.000%(M) | | EUR | 202 | | | * | | | 171 | | | | | | (5 | ) | | | | | | | 176 | | | | | Goldman
Sachs
International |
See Notes to Financial Statements.
30
Credit default swap agreements outstanding at September 30, 2022: (continued)
| | | | | | | | | | | | | | | | | | | | | | | | | | | | | | | | | | | | | | |
Reference Entity/ Obligation | | Termination
Date | | | Fixed
Rate | | | Notional
Amount
(000)#(3) | | | Implied
Credit
Spread at
September 30,
2022(4) | | | Fair
Value | | | Upfront Premiums Paid
(Received) | | Unrealized Appreciation (Depreciation) | | Counterparty |
| | | | | | | | | | | | | | | | | | | | | | | | | | | | | | | | |
|
OTC Credit Default Swap Agreements on asset-backed and/or mortgage-backed securities - Sell Protection(2)^ (cont’d.): |
Tharaldson Hotel Potfolio Trust | | | 10/27/22 | | | | 1.250%(M) | | | | 252 | | | | 4.670% | | | $ | 271 | | | | | $ | (8 | ) | | | | | | $ | 279 | | | | | Goldman
Sachs
International |
UBS Barclays Commercial Mortgage Trust | | | 10/27/22 | | | | 1.250%(M) | | | | 81 | | | | * | | | | 87 | | | | | | (3 | ) | | | | | | | 90 | | | | | Goldman
Sachs
International |
| | | | | | | | | | | | | | | | | | | | | | | | | | | | | | | | | | | | | | |
| | | | | | | | | | | | | | | | | | $ | 7,016 | | | | | $ | (205 | ) | | | | | | $ | 7,221 | | | | | |
| | | | | | | | | | | | | | | | | | | | | | | | | | | | | | | | | | | | | | |
| | | | | | | | | | | | | | | | | | | | | | | | | | | | | | | | |
Reference Entity/ Obligation | | Termination
Date | | Fixed
Rate | | Notional
Amount
(000)#(3) | | | Value at Trade Date | | Value at September 30, 2022 | | Unrealized Appreciation (Depreciation) |
| | | | | | | | | | | | | | | | | | | | | | | | | | | | | |
| |
Centrally Cleared Credit Default Swap Agreement on credit indices - Buy Protection(1): | | | |
CDX.NA.IG.39.V1 | | 12/20/27 | | 1.000%(Q) | | | 9,155 | | | | | $ | (13,481 | ) | | | | | | $ | 28,626 | | | | | | | $ | 42,107 | | | |
| | | | | | | | | | | | | | | | | | | | | | | | | | | | | | | | |
The Fund entered into credit default swaps (“CDS”) to provide a measure of protection against defaults or to take an active long or short position with respect to the likelihood of a particular issuer’s default or the reference entity’s credit soundness. CDS contracts generally trade based on a spread which represents the cost a protection buyer has to pay the protection seller. The protection buyer is said to be short the credit as the value of the contract rises the more the credit deteriorates. The value of the CDS contract increases for the protection buyer if the spread increases.
| (1) | If the Fund is a buyer of protection, it pays the fixed rate. When a credit event occurs, as defined under the terms of that particular swap agreement, the Fund will either (i) receive from the seller of protection an amount equal to the notional amount of the swap and make delivery of the referenced obligation or underlying securities comprising the referenced index or (ii) receive a net settlement amount in the form of cash or securities equal to the notional amount of the swap less the recovery value of the referenced obligation or underlying securities comprising the referenced index. |
| (2) | If the Fund is a seller of protection, it receives the fixed rate. When a credit event occurs, as defined under the terms of that particular swap agreement, the Fund will either (i) pay to the buyer of protection an amount equal to the notional amount of the swap and take delivery of the referenced obligation or underlying securities comprising the referenced index or (ii) pay a net settlement amount in the form of cash or securities equal to the notional amount of the swap less the recovery value of the referenced obligation or underlying securities comprising the referenced index. |
| (3) | Notional amount represents the maximum potential amount the Fund could be required to pay as a seller of credit protection or receive as a buyer of credit protection if a credit event occurs as defined under the terms of that particular swap agreement. |
| (4) | Implied credit spreads, represented in absolute terms, utilized in determining the fair value of credit default swap agreements where the Fund is the seller of protection as of the reporting date serve as an indicator of the current status |
See Notes to Financial Statements.
PGIM Securitized Credit Fund 31
Schedule of Investments (continued)
as of September 30, 2022
| | of the payment/ performance risk and represent the likelihood of risk of default for the credit derivative. The implied credit spread of a particular referenced entity reflects the cost of buying/selling protection and may include up-front payments required to be made to enter into the agreement. Wider credit spreads represent a deterioration of the referenced entity’s credit soundness and a greater likelihood of risk of default or other credit event occurring as defined under the terms of the agreement. |
| * | When an implied credit spread is not available, reference the fair value of credit default swap agreements on credit indices and asset-backed securities. Where the Fund is the seller of protection, it serves as an indicator of the current status of the payment/performance risk and represents the likelihood of an expected liability (or profit) for the credit derivative should the notional amount of the swap agreement be closed/sold as of the reporting date. Increasing fair value in absolute terms, when compared to the notional amount of the swap, represents a deterioration of the referenced entity’s credit soundness and a greater likelihood of risk of default or other credit event occurring as defined under the terms of the agreement. |
Interest rate swap agreements outstanding at September 30, 2022:
| | | | | | | | | | | | | | | | | | | | | | | | | | | | | | | | | | | | | | | | | | | | | | | | | | | | |
Notional Amount (000)# | | | | | | Termination
Date | | | | Fixed
Rate | | | | Floating
Rate | | Value at Trade Date | | | Value at September 30, 2022 | | | Unrealized Appreciation
(Depreciation) | |
| |
| | Centrally Cleared Interest Rate Swap Agreement: | | | | | |
| | 2,100 | | | | | | | 05/11/23 | | | | 2.250%(A) | | | | 1 Day USOIS(1)(A) | | | | | | $ | (134,663 | ) | | | | | | | | | | $ | 20,074 | | | | | | | | | | | $ | 154,737 | | | | | |
| | | | | | | | | | | | | | | | | | | | | | | | | | | | | | | | | | | | | | | | | | | | | | | | | | | | |
| (1) | The Fund pays the fixed rate and receives the floating rate. |
| (2) | The Fund pays the floating rate and receives the fixed rate. |
Balances Reported in the Statement of Assets and Liabilities for OTC Swap Agreements:
| | | | | | | | |
| | | Premiums Paid | | Premiums Received | | Unrealized
Appreciation | | Unrealized
Depreciation |
| | | | | |
OTC Swap Agreements | | $— | | $(205) | | $7,221 | | $— |
Summary of Collateral for Centrally Cleared/Exchange-traded Derivatives:
Cash and securities segregated as collateral, including pending settlement for closed positions, to cover requirements for centrally cleared/exchange-traded derivatives are listed by broker as follows:
| | | | | | | | | | | | | | | | |
Broker | | Cash and/or Foreign Currency | | Securities Market Value |
| | | | | | |
J.P. Morgan Securities LLC | | | | $ | 424,000 | | | | | | | $ | — | | | |
| | | | | | | | | | | | | | | | |
Fair Value Measurements:
Various inputs are used in determining the value of the Fund’s investments. These inputs are summarized in the three broad levels listed below.
Level 1—unadjusted quoted prices generally in active markets for identical securities.
Level 2—quoted prices for similar securities, interest rates and yield curves, prepayment speeds, foreign currency exchange rates and other observable inputs.
See Notes to Financial Statements.
32
Level 3—unobservable inputs for securities valued in accordance with Board approved fair valuation procedures.
The following is a summary of the inputs used as of September 30, 2022 in valuing such portfolio securities:
| | | | | | | | | | | | |
| | | Level 1 | | | Level 2 | | | Level 3 | |
Investments in Securities | | | | | | | | | | | | |
Assets | | | | | | | | | | | | |
Long-Term Investments | | | | | | | | | | | | |
Asset-Backed Securities | | | | | | | | | | | | |
Automobiles | | $ | — | | | $ | 3,735,133 | | | $ | — | |
Collateralized Loan Obligations | | | — | | | | 11,251,417 | | | | — | |
Consumer Loans | | | — | | | | 3,708,034 | | | | — | |
Other | | | — | | | | 1,622,853 | | | | — | |
Residential Mortgage-Backed Securities | | | — | | | | 320,170 | | | | 259,935 | |
Student Loans | | | — | | | | 218,817 | | | | — | |
Commercial Mortgage-Backed Securities | | | — | | | | 17,412,213 | | | | — | |
Corporate Bonds | | | — | | | | 4,061,454 | | | | — | |
Floating Rate and other Loans | | | — | | | | 2,861,821 | | | | 576,219 | |
Residential Mortgage-Backed Securities | | | — | | | | 18,049,239 | | | | 132,297 | |
Common Stock | | | — | | | | 3,957 | | | | — | |
Short-Term Investment | | | | | | | | | | | | |
Unaffiliated Fund | | | 5,609,194 | | | | — | | | | — | |
| | | | | | | | | | | | |
| | | |
Total | | $ | 5,609,194 | | | $ | 63,245,108 | | | $ | 968,451 | |
| | | | | | | | | | | | |
| | | |
Liabilities | | | | | | | | | | | | |
Options Written | | $ | — | | | $ | — | | | $ | (20 | ) |
| | | | | | | | | | | | |
| | | |
Other Financial Instruments* | | | | | | | | | | | | |
Assets | | | | | | | | | | | | |
Futures Contracts | | $ | 276,547 | | | $ | — | | | $ | — | |
OTC Forward Foreign Currency Exchange Contracts | | | — | | | | 155,047 | | | | — | |
Centrally Cleared Credit Default Swap Agreement | | | — | | | | 42,107 | | | | — | |
OTC Credit Default Swap Agreements | | | — | | | | — | | | | 7,016 | |
Centrally Cleared Interest Rate Swap Agreement | | | — | | | | 154,737 | | | | — | |
| | | | | | | | | | | | |
| | | |
Total | | $ | 276,547 | | | $ | 351,891 | | | $ | 7,016 | |
| | | | | | | | | | | | |
| | | |
Liabilities | | | | | | | | | | | | |
Futures Contracts | | $ | (10,845 | ) | | $ | — | | | $ | — | |
OTC Forward Foreign Currency Exchange Contracts | | | — | | | | (61,475 | ) | | | — | |
| | | | | | | | | | | | |
| | | |
Total | | $ | (10,845 | ) | | $ | (61,475 | ) | | $ | — | |
| | | | | | | | | | | | |
| * | Other financial instruments are derivative instruments not reflected in the Schedule of Investments, such as futures, forwards and centrally cleared swap contracts, which are recorded at the unrealized appreciation (depreciation) on the instrument, and OTC swap contracts which are recorded at fair value. |
See Notes to Financial Statements.
PGIM Securitized Credit Fund 33
Schedule of Investments (continued)
as of September 30, 2022
The following is a reconciliation of assets in which unobservable inputs (Level 3) were used in determining fair value:
| | | | | | | | | | | | | | | | | | | | | | | | | | | | | | | | | | | | | | | | | | | | | | | | | | | | | | | | | | | | |
| | | Asset-Backed Securities- Residential Mortgage-Backed Securities | | | Floating Rate and other Loans | | | Residential Mortgage-Backed
Securities | | | Options
Written | | | OTC Credit Default Swap
Agreements | |
| | | | | | | | | | | | | | | |
Balance as of 09/30/21 | | | | | | $ | — | | | | | | | | | | | $ | — | | | | | | �� | | | | | $ | 350,000 | | | | | | | | | | | $ | (93 | ) | | | | | | | | | | $ | 1,382 | | | | | |
Realized gain (loss) | | | | | | | (42,252 | ) | | | | | | | | | | | — | | | | | | | | | | | | — | | | | | | | | | | | | — | | | | | | | | | | | | 2,291 | | | | | |
Change in unrealized appreciation (depreciation) | | | | | | | 7,255 | | | | | | | | | | | | (63,113 | ) | | | | | | | | | | | (665 | ) | | | | | | | | | | | 73 | | | | | | | | | | | | 7,016 | | | | | |
Purchases/Exchanges/Issuances | | | | | | | 1 | | | | | | | | | | | | 642,000 | | | | | | | | | | | | — | | | | | | | | | | | | — | | | | | | | | | | | | — | | | | | |
Sales/Paydowns | | | | | | | (180,436 | ) | | | | | | | | | | | (2,668 | ) | | | | | | | | | | | (217,038 | ) | | | | | | | | | | | — | | | | | | | | | | | | (3,673 | ) | | | | |
Accrued discount/premium | | | | | | | 218 | | | | | | | | | | | | — | | | | | | | | | | | | — | | | | | | | | | | | | — | | | | | | | | | | | | — | | | | | |
Transfers into Level 3* | | | | | | | 475,149 | | | | | | | | | | | | — | | | | | | | | | | | | — | | | | | | | | | | | | — | | | | | | | | | | | | — | | | | | |
Transfers out of Level 3* | | | | | | | — | | | | | | | | | | | | — | | | | | | | | | | | | — | | | | | | | | | | | | — | | | | | | | | | | | | — | | | | | |
| | | | | | | | | | | | | | | | | | | | | | | | | | | | | | | | | | | | | | | | | | | | | | | | | | | | | | | | | | | | |
| | | | | | | | | | | | | | | |
Balance as of 09/30/22 | | | | | | $ | 259,935 | | | | | | | | | | | $ | 576,219 | | | | | | | | | | | $ | 132,297 | | | | | | | | | | | $ | (20 | ) | | | | | | | | | | $ | 7,016 | | | | | |
| | | | | | | | | | | | | | | | | | | | | | | | | | | | | | | | | | | | | | | | | | | | | | | | | | | | | | | | | | | | |
Change in unrealized appreciation (depreciation) relating to securities still held at reporting period end | | | | | | $ | 7,255 | | | | | | | | | | | $ | (63,113 | ) | | | | | | | | | | $ | (665 | ) | | | | | | | | | | $ | 73 | | | | | | | | | | | $ | 7,016 | | | | | |
| | | | | | | | | | | | | | | | | | | | | | | | | | | | | | | | | | | | | | | | | | | | | | | | | | | | | | | | | | | | |
| * | It is the Fund’s policy to recognize transfers in and transfers out at the securities’ fair values as of the beginning of period. Securities transferred between Level 2 and Level 3 are due to changes in the method utilized in valuing the investments. Transfers from Level 2 to Level 3 are typically a result of a change from the use of methods used by independent pricing services (Level 2) to the use of a single broker quote or valuation technique which utilizes significant unobservable inputs due to an absence of current or reliable market quotations (Level 3). Transfers from Level 3 to Level 2 are a result of the availability of current and reliable market data provided by independent pricing services or other valuation techniques which utilize observable inputs. In accordance with the requirements of ASC 820, the amounts of transfers into and out of Level 3, if material, are disclosed in the Notes to the Schedule of Investments of the Fund. |
See Notes to Financial Statements.
34
Level 3 securities as presented in the table above are being fair valued using pricing methodologies approved by the Board, which contain unobservable inputs as follows:
| | | | | | | | | | | | | | | | | | | | |
Level 3 Securities** | | Fair Value as of September 30, 2022 | | | Valuation
Approach | | | Valuation Methodology | | Unobservable Inputs |
| | | | | | |
Asset-Backed Securities - Residential Mortgage-Backed Securities | | | | | | $ | 259,621 | | | | | | | | Market | | | Adjusted Spread | | Estimated Spread |
Asset-Backed Securities - Residential Mortgage-Backed Securities | | | | | | | 314 | | | | | | | | Market | | | Contingent Value | | Contingent Value |
| | | | | | | | | | | | | | | | | | | | |
| | | | | | |
| | | | | | $ | 259,935 | | | | | | | | | | | | | |
| | | | | | | | | | | | | | | | | | | | |
** The table does not include Level 3 securities and/or derivatives that are valued by independent pricing vendors or brokers.
As of September 30, 2022, the aggregate value of these securities was $715,512. The unobservable inputs for these investments were not developed by the Fund and are not readily available.
Industry Classification:
The industry classification of investments and other assets in excess of liabilities shown as a percentage of net assets as of September 30, 2022 were as follows:
| | | | |
Residential Mortgage-Backed Securities | | | 26.6 | % |
Commercial Mortgage-Backed Securities | | | 24.7 | |
Collateralized Loan Obligations | | | 16.0 | |
Unaffiliated Fund | | | 7.9 | |
Banks | | | 5.4 | |
Automobiles | | | 5.3 | |
Consumer Loans | | | 5.3 | |
Other | | | 2.3 | |
Telecommunications | | | 1.2 | |
Commercial Services | | | 0.6 | |
Pharmaceuticals | | | 0.6 | |
Packaging & Containers | | | 0.5 | |
Retail | | | 0.5 | |
Entertainment | | | 0.5 | |
Computers | | | 0.3 | |
Student Loans | | | 0.3 | |
| | | | |
Electric | | | 0.3 | % |
Software | | | 0.3 | |
Media | | | 0.2 | |
Pipelines | | | 0.2 | |
Aerospace & Defense | | | 0.1 | |
Oil, Gas & Consumable Fuels | | | 0.0 | * |
| | | | |
| | | 99.1 | |
Options Written | | | (0.0 | )* |
Other assets in excess of liabilities | | | 0.9 | |
| | | | |
| |
| | | 100.0 | % |
| | | | |
Effects of Derivative Instruments on the Financial Statements and Primary Underlying Risk Exposure:
The Fund invested in derivative instruments during the reporting period. The primary types of risk associated with these derivative instruments are credit contracts risk, foreign exchange contracts risk and interest rate contracts risk. See the
See Notes to Financial Statements.
PGIM Securitized Credit Fund 35
Schedule of Investments (continued)
as of September 30, 2022
Notes to Financial Statements for additional detail regarding these derivative instruments and their risks. The effect of such derivative instruments on the Fund’s financial position and financial performance as reflected in the Statement of Assets and Liabilities and Statement of Operations is presented in the summary below.
Fair values of derivative instruments as of September 30, 2022 as presented in the Statement of Assets and Liabilities:
| | | | | | | | | | | | |
| | | Asset Derivatives | | | Liability Derivatives | |
| | | | |
Derivatives not accounted for as hedging instruments, carried at fair value | | Statement of Assets and Liabilities Location | | Fair
Value | | | Statement of Assets and Liabilities Location | | Fair
Value | |
| | | | |
Credit contracts | | Due from/to broker-variation margin swaps | | $ | 42,107 | * | | — | | $ | — | |
Credit contracts | | — | | | — | | | Premiums received for OTC swap agreements | | | 205 | |
Credit contracts | | — | | | — | | | Options written outstanding, at value | | | 20 | |
Credit contracts | | Unrealized appreciation on OTC swap agreements | | | 7,221 | | | — | | | — | |
Foreign exchange contracts | | Unrealized appreciation on OTC forward foreign currency exchange contracts | | | 155,047 | | | Unrealized depreciation on OTC forward foreign currency exchange contracts | | | 61,475 | |
Interest rate contracts | | Due from/to broker-variation margin futures | | | 276,547 | * | | Due from/to broker-variation margin futures | | | 10,845 | * |
Interest rate contracts | | Due from/to broker-variation margin swaps | | | 154,737 | * | | — | | | — | |
| | | | | | | | | | | | |
| | | | |
| | | | $ | 635,659 | | | | | $ | 72,545 | |
| | | | | | | | | | | | |
| * | Includes cumulative appreciation (depreciation) as reported in the schedule of open futures and centrally cleared swap contracts. Only unsettled variation margin receivable (payable) is reported within the Statement of Assets and Liabilities. |
The effects of derivative instruments on the Statement of Operations for the year ended September 30, 2022 are as follows:
| | | | | | | | | | | | |
Amount of Realized Gain (Loss) on Derivatives Recognized in Income | |
| | | |
Derivatives not accounted for as hedging instruments, carried at fair value | | Futures | | | Forward
Currency
Exchange
Contracts | | | Swaps | |
| | | |
Credit contracts | | $ | — | | | $ | — | | | $ | (58 | ) |
Foreign exchange contracts | | | — | | | | 572,359 | | | | — | |
Interest rate contracts | | | 641,950 | | | | — | | | | 35,394 | |
| | | | | | | | | | | | |
| | | |
Total | | $ | 641,950 | | | $ | 572,359 | | | $ | 35,336 | |
| | | | | | | | | | | | |
See Notes to Financial Statements.
36
| | | | | | | | | | | | | | | | | | | | | | | | | | | | | | | | | | | | | | | | | | |
Change in Unrealized Appreciation (Depreciation) on Derivatives Recognized in Income | |
| | | | |
Derivatives not accounted for as hedging instruments, carried at fair value | | Options Written | | | Futures | | | Forward Currency Exchange Contracts | | Swaps | |
| | | | | | | | | | | | |
Credit contracts | | | | $ | 73 | | | | | | | | | | | $ | — | | | | | | | | | $ | — | | | | | | | | | $ | 91,791 | | | | | |
Foreign exchange contracts | | | | | — | | | | | | | | | | | | — | | | | | | | | | | 25,423 | | | | | | | | | | — | | | | | |
Interest rate contracts | | | | | — | | | | | | | | | | | | 255,859 | | | | | | | | | | — | | | | | | | | | | 73,999 | | | | | |
| | | | | | | | | | | | | | | | | | | | | | | | | | | | | | | | | | | | | | | | | | |
Total | | | | $ | 73 | | | | | | | | | | | $ | 255,859 | | | | | | | | | $ | 25,423 | | | | | | | | | $ | 165,790 | | | | | |
| | | | | | | | | | | | | | | | | | | | | | | | | | | | | | | | | | | | | | | | | | |
For the year ended September 30, 2022, the Fund’s average volume of derivative activities is as follows:
| | | | |
| Derivative Contract Type | | Average Volume of Derivative Activities* |
| |
Options Written (1) | | | $ 894,000 | |
| |
Futures Contracts - Long Positions (1) | | | 496,426 | |
| |
Futures Contracts - Short Positions (1) | | | 8,262,828 | |
| |
Forward Foreign Currency Exchange Contracts - Purchased (2) | | | 2,818,850 | |
| |
Forward Foreign Currency Exchange Contracts - Sold (2) | | | 6,506,230 | |
| |
Interest Rate Swap Agreements (1) | | | 3,788,017 | |
| |
Credit Default Swap Agreements - Buy Protection (1) | | | 1,951,000 | |
| |
Credit Default Swap Agreements - Sell Protection (1) | | | 6,963,176 | |
| * | Average volume is based on average quarter end balances as noted for the year ended September 30, 2022. |
| (1) | Notional Amount in USD. |
| (2) | Value at Settlement Date. |
Financial Instruments/Transactions—Summary of Offsetting and Netting Arrangements:
The Fund invested in OTC derivatives during the reporting period that are either offset in accordance with current requirements or are subject to enforceable master netting arrangements or similar agreements that permit offsetting. The information about offsetting and related netting arrangements for OTC derivatives where the legal right to set-off exists is presented in the summary below.
Offsetting of OTC derivative assets and liabilities:
| | | | | | | | | | | | | | | | | | |
Counterparty | | Gross Amounts of
Recognized
Assets(1) | | Gross Amounts of
Recognized
Liabilities(1) | | Net Amounts of
Recognized
Assets/(Liabilities) | | Collateral
Pledged/(Received)(2) | | Net Amount |
| | | | | |
Barclays Bank PLC | | | $ 30,723 | | | | $ (3,031 | ) | | | $ 27,692 | | | $— | | | $ 27,692 | |
Goldman Sachs International | | | 7,221 | | | | (225 | ) | | | 6,996 | | | — | | | 6,996 | |
HSBC Bank PLC | | | 65,844 | | | | — | | | | 65,844 | | | — | | | 65,844 | |
See Notes to Financial Statements.
PGIM Securitized Credit Fund 37
Schedule of Investments (continued)
as of September 30, 2022
| | | | | | | | | | | | | | | | | | | | | | | | | | | | | | | | | | | | | | | | |
Counterparty | | Gross Amounts of Recognized Assets(1) | | Gross Amounts of Recognized Liabilities(1) | | Net Amounts of Recognized Assets/(Liabilities) | | Collateral
Pledged/(Received)(2) | | Net Amount |
| | | | | | | | | | | | | | | |
Morgan Stanley & Co. International PLC | | | | $ | 34,683 | | | | | | | $ | (34,725 | ) | | | | | | $ | (42 | ) | | | | | | $ | — | | | | | | | $ | (42 | ) | | |
UBS AG | | | | | 23,797 | | | | | | | | (23,719 | ) | | | | | | | 78 | | | | | | | | — | | | | | | | | 78 | | | |
| | | | | | | | | | | | | | | | | | | | | | | | | | | | | | | | | | | | | | | | |
| | | | | | | | | | | | | | | |
| | | | $ | 162,268 | | | | | | | $ | (61,700 | ) | | | | | | $ | 100,568 | | | | | | | $ | — | | | | | | | $ | 100,568 | | | |
| | | | | | | | | | | | | | | | | | | | | | | | | | | | | | | | | | | | | | | | |
| (1) | Includes unrealized appreciation/(depreciation) on swaps and forwards, premiums paid/(received) on swap agreements and market value of purchased and written options, as represented on the Statement of Assets and Liabilities. |
| (2) | Collateral amount disclosed by the Fund is limited to the market value of financial instruments/transactions and the Fund’s OTC derivative exposure by counterparty. |
See Notes to Financial Statements.
38
Statement of Assets and Liabilities
as of September 30, 2022
| | | | |
Assets | | | | |
| |
Unaffiliated investments (cost $74,608,194) | | $ | 69,822,753 | |
Cash | | | 2,413 | |
Foreign currency, at value (cost $32,359) | | | 31,971 | |
Cash segregated for counterparty - OTC | | | 400,000 | |
Deposit with broker for centrally cleared/exchange-traded derivatives | | | 424,000 | |
Dividends and interest receivable | | | 265,095 | |
Unrealized appreciation on OTC forward foreign currency exchange contracts | | | 155,047 | |
Receivable for Fund shares sold | | | 125,898 | |
Due from broker—variation margin futures | | | 13,641 | |
Unrealized appreciation on OTC swap agreements | | | 7,221 | |
Prepaid expenses and other assets | | | 5,964 | |
| | | | |
| |
Total Assets | | | 71,254,003 | |
| | | | |
| |
Liabilities | | | | |
| |
Payable for investments purchased | | | 485,311 | |
Payable for Fund shares purchased | | | 167,239 | |
Unrealized depreciation on OTC forward foreign currency exchange contracts | | | 61,475 | |
Audit fee payable | | | 57,000 | |
Accrued expenses and other liabilities | | | 48,894 | |
Management fee payable | | | 5,250 | |
Dividends payable | | | 743 | |
Due to broker—variation margin swaps | | | 399 | |
Affiliated transfer agent fee payable | | | 314 | |
Premiums received for OTC swap agreements | | | 205 | |
Distribution fee payable | | | 103 | |
Options written outstanding, at value | | | 20 | |
| | | | |
| |
Total Liabilities | | | 826,953 | |
| | | | |
| |
Net Assets | | $ | 70,427,050 | |
| | | | |
| |
| | | | |
| |
Net assets were comprised of: | | | | |
Shares of beneficial interest, at par | | $ | 7,537 | |
Paid-in capital in excess of par | | | 74,590,448 | |
Total distributable earnings (loss) | | | (4,170,935 | ) |
| | | | |
| |
Net assets, September 30, 2022 | | $ | 70,427,050 | |
| | | | |
See Notes to Financial Statements.
PGIM Securitized Credit Fund 39
Statement of Assets and Liabilities
as of September 30, 2022
| | | | | | |
Class A | | | | | | |
| | |
Net asset value and redemption price per share, ($134,652 ÷ 14,414 shares of beneficial interest issued and outstanding) | | | $9.34 | | | |
Maximum sales charge (3.25% of offering price) | | | 0.31 | | | |
| | | | | | |
| | |
Maximum offering price to public | | | $9.65 | | | |
| | | | | | |
| | |
Class C | | | | | | |
| | |
Net asset value, offering price and redemption price per share, ($91,697 ÷ 9,817 shares of beneficial interest issued and outstanding) | | | $9.34 | | | |
| | | | | | |
| | |
Class Z | | | | | | |
| | |
Net asset value, offering price and redemption price per share, ($70,190,261 ÷ 7,511,865 shares of beneficial interest issued and outstanding) | | | $9.34 | | | |
| | | | | | |
| | |
Class R6 | | | | | | |
| | |
Net asset value, offering price and redemption price per share, ($10,440 ÷ 1,117 shares of beneficial interest issued and outstanding) | | | $9.34 | | | |
| | | | | | |
Net asset value per share may not recalculate due to rounding.
See Notes to Financial Statements.
40
Statement of Operations
Year Ended September 30, 2022
| | | | |
Net Investment Income (Loss) | | | | |
| |
Income | | | | |
Interest income | | $ | 2,357,978 | |
Unaffiliated dividend income | | | 36,511 | |
Affiliated dividend income | | | 435 | |
| | | | |
| |
Total income | | | 2,394,924 | |
| | | | |
| |
Expenses | | | | |
Management fee | | | 372,730 | |
Distribution fee(a) | | | 841 | |
Transfer agent’s fees and expenses (including affiliated expense of $1,373)(a) | | | 86,987 | |
Custodian and accounting fees | | | 65,193 | |
Audit fee | | | 57,000 | |
Registration fees(a) | | | 37,998 | |
Legal fees and expenses | | | 20,322 | |
Shareholders’ reports | | | 15,170 | |
Trustees’ fees | | | 10,531 | |
Miscellaneous | | | 16,863 | |
| | | | |
| |
Total expenses | | | 683,635 | |
Less: Fee waiver and/or expense reimbursement(a) | | | (279,014 | ) |
| | | | |
| |
Net expenses | | | 404,621 | |
| | | | |
| |
Net investment income (loss) | | | 1,990,303 | |
| | | | |
| |
Realized And Unrealized Gain (Loss) On Investment And Foreign Currency Transactions | | | | |
| |
Net realized gain (loss) on: | | | | |
Investment transactions | | | (413,483 | ) |
Futures transactions | | | 641,950 | |
Forward currency contract transactions | | | 572,359 | |
Swap agreement transactions | | | 35,336 | |
Foreign currency transactions | | | (61,702 | ) |
| | | | |
| |
| | | 774,460 | |
| | | | |
| |
Net change in unrealized appreciation (depreciation) on: | | | | |
Investments | | | (5,157,594 | ) |
Futures | | | 255,859 | |
Forward currency contracts | | | 25,423 | |
Options written | | | 73 | |
Swap agreements | | | 165,790 | |
Foreign currencies | | | 6,666 | |
| | | | |
| |
| | | (4,703,783 | ) |
| | | | |
| |
Net gain (loss) on investment and foreign currency transactions | | | (3,929,323 | ) |
| | | | |
| |
Net Increase (Decrease) In Net Assets Resulting From Operations | | $ | (1,939,020 | ) |
| | | | |
| (a) | Class specific expenses and waivers were as follows: |
| | | | | | | | | | | | | | | | |
| | | Class A | | Class C | | Class Z | | Class R6 | |
| | | | |
Distribution fee | | | 239 | | | | 602 | | | | — | | | | — | |
Transfer agent’s fees and expenses | | | 594 | | | | 197 | | | | 86,090 | | | | 106 | |
Registration fees | | | 8,771 | | | | 5,871 | | | | 17,485 | | | | 5,871 | |
Fee waiver and/or expense reimbursement | | | (9,609 | ) | | | (6,194 | ) | | | (257,181 | ) | | | (6,030) | |
See Notes to Financial Statements.
PGIM Securitized Credit Fund 41
Statements of Changes in Net Assets
| | | | | | | | | | |
| | |
| | | Year Ended
September 30, | | | |
| | | |
| | | 2022 | | | 2021 | | | |
| | | |
Increase (Decrease) in Net Assets | | | | | | | | | | |
| | | |
Operations | | | | | | | | | | |
Net investment income (loss) | | $ | 1,990,303 | | | $ | 884,283 | | | |
Net realized gain (loss) on investment and foreign currency transactions | | | 774,460 | | | | 124,187 | | | |
Net change in unrealized appreciation (depreciation) on investments and foreign currencies | | | (4,703,783 | ) | | | 1,093,783 | | | |
| | | | | | | | | | |
Net increase (decrease) in net assets resulting from operations | | | (1,939,020 | ) | | | 2,102,253 | | | |
| | | | | | | | | | |
| | | |
Dividends and Distributions | | | | | | | | | | |
Distributions from distributable earnings | | | | | | | | | | |
Class A | | | (3,157 | ) | | | (624 | ) | | |
Class C | | | (1,541 | ) | | | (169 | ) | | |
Class Z | | | (2,115,845 | ) | | | (793,722 | ) | | |
Class R6 | | | (610 | ) | | | (281 | ) | | |
| | | | | | | | | | |
| | | (2,121,153 | ) | | | (794,796 | ) | | |
| | | | | | | | | | |
| | | |
Fund share transactions (Net of share conversions) | | | | | | | | | | |
Net proceeds from shares sold | | | 63,086,882 | | | | 3,862,623 | | | |
Net asset value of shares issued in reinvestment of dividends and distributions | | | 2,119,977 | | | | 786,920 | | | |
Cost of shares purchased | | | (22,972,939 | ) | | | (1,881,634 | ) | | |
| | | | | | | | | | |
Net increase (decrease) in net assets from Fund share transactions | | | 42,233,920 | | | | 2,767,909 | | | |
| | | | | | | | | | |
Total increase (decrease) | | | 38,173,747 | | | | 4,075,366 | | | |
| | | |
Net Assets: | | | | | | | | | | |
| | | |
Beginning of year | | | 32,253,303 | | | | 28,177,937 | | | |
| | | | | | | | | | |
End of year | | $ | 70,427,050 | | | $ | 32,253,303 | | | |
| | | | | | | | | | |
See Notes to Financial Statements.
42
Financial Highlights
| | | | | | | | | | | | | | | | | | | | | | | | |
| | | | | | | | |
Class A Shares | | | | | | | | | | | | | | | | | | | | | | | | |
| | | | | | July 01, 2019(a) | | | |
| | | Year Ended September 30, | | | through September 30, | | | |
| | | 2022 | | | 2021 | | | 2020 | | | 2019 | | | |
Per Share Operating Performance(b): | | | | | | | | | | | | | | | | | | | | | | | | |
Net Asset Value, Beginning of Period | | | $9.88 | | | | $9.45 | | | | $9.97 | | | | | | $10.00 | | | | | | | |
Income (loss) from investment operations: | | | | | | | | | | | | | | | | | | | | | | | | |
Net investment income (loss) | | | 0.30 | | | | 0.26 | | | | 0.30 | | | | | | 0.08 | | | | | | | |
Net realized and unrealized gain (loss) on investment and foreign currency transactions | | | (0.54 | ) | | | 0.40 | | | | (0.46 | ) | | | | | (0.03 | ) | | | | | | |
Total from investment operations | | | (0.24 | ) | | | 0.66 | | | | (0.16 | ) | | | | | 0.05 | | | | | | | |
Less Dividends and Distributions: | | | | | | | | | | | | | | | | | | | | | | | | |
Dividends from net investment income | | | (0.30 | ) | | | (0.23 | ) | | | (0.36 | ) | | | | | (0.08 | ) | | | | | | |
Tax return of capital distributions | | | - | | | | - | | | | (- | )(c) | | | | | - | | | | | | | |
Total dividends and distributions | | | (0.30 | ) | | | (0.23 | ) | | | (0.36 | ) | | | | | (0.08 | ) | | | | | | |
Net asset value, end of period | | | $9.34 | | | | $9.88 | | | | $9.45 | | | | | | $ 9.97 | | | | | | | |
Total Return(d): | | | (2.46 | )% | | | 7.10 | % | | | (1.57 | )% | | | | | 0.51 | % | | | | | | |
| | | | | | | | | | | | | | | | | | | | | | | | | |
Ratios/Supplemental Data: | | | | | | | | | | | | | | | | | | | | | | | | |
Net assets, end of period (000) | | | $135 | | | | $39 | | | | $21 | | | | | | $ 10 | | | | | | | |
Average net assets (000) | | | $96 | | | | $26 | | | | $16 | | | | | | $ 10 | | | | | | | |
Ratios to average net assets(e): | | | | | | | | | | | | | | | | | | | | | | | | |
Expenses after waivers and/or expense reimbursement | | | 0.90 | % | | | 0.90 | % | | | 0.90 | % | | | | | 0.90 | %(f) | | | | | | |
Expenses before waivers and/or expense reimbursement | | | 10.95 | % | | | 26.65 | % | | | 94.01 | % | | | | | 813.14 | %(f) | | | | | | |
Net investment income (loss) | | | 3.09 | % | | | 2.70 | % | | | 3.15 | % | | | | | 3.07 | %(f) | | | | | | |
Portfolio turnover rate(g) | | | 37 | % | | | 58 | % | | | 60 | % | | | | | 14 | % | | | | | | |
| (a) | Commencement of operations. |
| (b) | Calculated based on average shares outstanding during the period. |
| (c) | Amount rounds to zero. |
| (d) | Total return does not consider the effects of sales loads. Total return is calculated assuming a purchase of a share on the first day and a sale on the last day of each period reported and includes reinvestment of dividends and distributions, if any. Total returns may reflect adjustments to conform to GAAP. Total returns for periods less than one full year are not annualized. |
| (e) | Does not include expenses of the underlying funds in which the Fund invests. |
| (f) | Annualized, with the exception of certain non-recurring expenses. |
| (g) | The Fund’s portfolio turnover rate is calculated in accordance with regulatory requirements, without regard to transactions involving short-term investments, certain derivatives and in-kind transactions (if any). If such transactions were included, the Fund’s portfolio turnover rate may be higher. |
See Notes to Financial Statements.
PGIM Securitized Credit Fund 43
Financial Highlights (continued)
| | | | | | | | | | | | | | | | | | | | | | | | | | | | |
| | | | | | | | |
Class C Shares | | | | | | | | | | | | | | | | | | | | | | | | | | | | |
| | | | | | July 01, 2019(a) | | | | |
| | | Year Ended September 30, | | | through September 30, | | | | |
| | | 2022 | | | 2021 | | | 2020 | | | 2019 | | | | |
Per Share Operating Performance(b): | | | | | | | | | | | | | | | | | | | | | | | | | | | | |
Net Asset Value, Beginning of Period | | | $9.88 | | | | $9.44 | | | | $9.97 | | | | | | | | $10.00 | | | | | | | | | |
Income (loss) from investment operations: | | | | | | | | | | | | | | | | | | | | | | | | | | | | |
Net investment income (loss) | | | 0.23 | | | | 0.19 | | | | 0.24 | | | | | | | | 0.06 | | | | | | | | | |
Net realized and unrealized gain (loss) on investment and foreign currency transactions | | | (0.54 | ) | | | 0.41 | | | | (0.48 | ) | | | | | | | (0.03 | ) | | | | | | | | |
Total from investment operations | | | (0.31 | ) | | | 0.60 | | | | (0.24 | ) | | | | | | | 0.03 | | | | | | | | | |
Less Dividends and Distributions: | | | | | | | | | | | | | | | | | | | | | | | | | | | | |
Dividends from net investment income | | | (0.23 | ) | | | (0.16 | ) | | | (0.29 | ) | | | | | | | (0.06 | ) | | | | | | | | |
Tax return of capital distributions | | | - | | | | - | | | | (- | )(c) | | | | | | | - | | | | | | | | | |
Total dividends and distributions | | | (0.23 | ) | | | (0.16 | ) | | | (0.29 | ) | | | | | | | (0.06 | ) | | | | | | | | |
Net asset value, end of period | | | $9.34 | | | | $9.88 | | | | $9.44 | | | | | | | | $ 9.97 | | | | | | | | | |
Total Return(d): | | | (3.21 | )% | | | 6.41 | % | | | (2.40 | )% | | | | | | | 0.33 | % | | | | | | | | |
| | | | | | | | | | | | | | | | | | | | | | | | | | | | | |
Ratios/Supplemental Data: | | | | | | | | | | | | | | | | | | | | | | | | | | | | |
Net assets, end of period (000) | | | $92 | | | | $10 | | | | $10 | | | | | | | | $ 10 | | | | | | | | | |
Average net assets (000) | | | $60 | | | | $10 | | | | $10 | | | | | | | | $ 10 | | | | | | | | | |
Ratios to average net assets(e): | | | | | | | | | | | | | | | | | | | | | | | | | | | | |
Expenses after waivers and/or expense reimbursement | | | 1.65 | % | | | 1.65 | % | | | 1.65 | % | | | | | | | 1.65 | %(f) | | | | | | | | |
Expenses before waivers and/or expense reimbursement | | | 11.95 | % | | | 64.82 | % | | | 148.80 | % | | | | | | | 814.62 | %(f) | | | | | | | | |
Net investment income (loss) | | | 2.38 | % | | | 1.97 | % | | | 2.51 | % | | | | | | | 2.32 | %(f) | | | | | | | | |
Portfolio turnover rate(g) | | | 37 | % | | | 58 | % | | | 60 | % | | | | | | | 14 | % | | | | | | | | |
| (a) | Commencement of operations. |
| (b) | Calculated based on average shares outstanding during the period. |
| (c) | Amount rounds to zero. |
| (d) | Total return does not consider the effects of sales loads. Total return is calculated assuming a purchase of a share on the first day and a sale on the last day of each period reported and includes reinvestment of dividends and distributions, if any. Total returns may reflect adjustments to conform to GAAP. Total returns for periods less than one full year are not annualized. |
| (e) | Does not include expenses of the underlying funds in which the Fund invests. |
| (f) | Annualized, with the exception of certain non-recurring expenses. |
| (g) | The Fund’s portfolio turnover rate is calculated in accordance with regulatory requirements, without regard to transactions involving short-term investments, certain derivatives and in-kind transactions (if any). If such transactions were included, the Fund’s portfolio turnover rate may be higher. |
See Notes to Financial Statements.
44
| | | | | | | | | | | | | | | | | | | | | | | | |
| | | | | | | | |
Class Z Shares | | | | | | | | | | | | | | | | | | | | | | | | |
| | | | | | July 01, 2019(a) | | | |
| | | Year Ended September 30, | | | through September 30, | | | |
| | | 2022 | | | 2021 | | | 2020 | | | 2019 | | | |
Per Share Operating Performance(b): | | | | | | | | | | | | | | | | | | | | | | | | |
Net Asset Value, Beginning of Period | | | $ 9.88 | | | | $ 9.45 | | | | $9.97 | | | | | | $ 10.00 | | | | | | | |
Income (loss) from investment operations: | | | | | | | | | | | | | | | | | | | | | | | | |
Net investment income (loss) | | | 0.31 | | | | 0.29 | | | | 0.33 | | | | | | 0.08 | | | | | | | |
Net realized and unrealized gain (loss) on investment and foreign currency transactions | | | (0.52 | ) | | | 0.40 | | | | (0.47 | ) | | | | | (0.02 | ) | | | | | | |
Total from investment operations | | | (0.21 | ) | | | 0.69 | | | | (0.14 | ) | | | | | 0.06 | | | | | | | |
Less Dividends and Distributions: | | | | | | | | | | | | | | | | | | | | | | | | |
Dividends from net investment income | | | (0.33 | ) | | | (0.26 | ) | | | (0.37 | ) | | | | | (0.09 | ) | | | | | | |
Tax return of capital distributions | | | - | | | | - | | | | (0.01 | ) | | | | | - | | | | | | | |
Total dividends and distributions | | | (0.33 | ) | | | (0.26 | ) | | | (0.38 | ) | | | | | (0.09 | ) | | | | | | |
Net asset value, end of period | | | $ 9.34 | | | | $ 9.88 | | | | $9.45 | | | | | | $ 9.97 | | | | | | | |
Total Return(c): | | | (2.21 | )% | | | 7.37 | % | | | (1.32 | )% | | | | | 0.57 | % | | | | | | |
| | | | | | | | | | | | | | | | | | | | | | | | | |
Ratios/Supplemental Data: | | | | | | | | | | | | | | | | | | | | | | | | |
Net assets, end of period (000) | | | $70,190 | | | | $32,193 | | | | $28,137 | | | | | | $26,961 | | | | | | | |
Average net assets (000) | | | $61,949 | | | | $29,735 | | | | $27,164 | | | | | | $20,410 | | | | | | | |
Ratios to average net assets(d): | | | | | | | | | | | | | | | | | | | | | | | | |
Expenses after waivers and/or expense reimbursement | | | 0.65 | % | | | 0.65 | % | | | 0.65 | % | | | | | 0.65 | %(e) | | | | | | |
Expenses before waivers and/or expense reimbursement | | | 1.07 | % | | | 1.40 | % | | | 1.68 | % | | | | | 2.72 | %(e) | | | | | | |
Net investment income (loss) | | | 3.20 | % | | | 2.97 | % | | | 3.50 | % | | | | | 3.32 | %(e) | | | | | | |
Portfolio turnover rate(f) | | | 37 | % | | | 58 | % | | | 60 | % | | | | | 14 | % | | | | | | |
| (a) | Commencement of operations. |
| (b) | Calculated based on average shares outstanding during the period. |
| (c) | Total return is calculated assuming a purchase of a share on the first day and a sale on the last day of each period reported and includes reinvestment of dividends and distributions, if any. Total returns may reflect adjustments to conform to GAAP. Total returns for periods less than one full year are not annualized. |
| (d) | Does not include expenses of the underlying funds in which the Fund invests. |
| (e) | Annualized, with the exception of certain non-recurring expenses. |
| (f) | The Fund’s portfolio turnover rate is calculated in accordance with regulatory requirements, without regard to transactions involving short-term investments, certain derivatives and in-kind transactions (if any). If such transactions were included, the Fund’s portfolio turnover rate may be higher. |
See Notes to Financial Statements.
PGIM Securitized Credit Fund 45
Financial Highlights (continued)
| | | | | | | | | | | | | | | | | | | | | | | | | | | | |
| | | | | | | | |
Class R6 Shares | | | | | | | | | | | | | | | | | | | | | | | | | | | | |
| | | | | | July 01, 2019(a) | | | | |
| | | Year Ended September 30, | | | through September 30, | | | | |
| | | 2022 | | | 2021 | | | 2020 | | | 2019 | | | | |
Per Share Operating Performance(b): | | | | | | | | | | | | | | | | | | | | | | | | | | | | |
Net Asset Value, Beginning of Period | | | $9.88 | | | | $9.45 | | | | $ 9.97 | | | | | | | | $10.00 | | | | | | | | | |
Income (loss) from investment operations: | | | | | | | | | | | | | | | | | | | | | | | | | | | | |
Net investment income (loss) | | | 0.32 | | | | 0.29 | | | | 0.34 | | | | | | | | 0.08 | | | | | | | | | |
Net realized and unrealized gain (loss) on investment and foreign currency transactions | | | (0.53 | ) | | | 0.40 | | | | (0.47 | ) | | | | | | | (0.02 | ) | | | | | | | | |
Total from investment operations | | | (0.21 | ) | | | 0.69 | | | | (0.13 | ) | | | | | | | 0.06 | | | | | | | | | |
Less Dividends and Distributions: | | | | | | | | | | | | | | | | | | | | | | | | | | | | |
Dividends from net investment income | | | (0.33 | ) | | | (0.26 | ) | | | (0.38 | ) | | | | | | | (0.09 | ) | | | | | | | | |
Tax return of capital distributions | | | - | | | | - | | | | (0.01 | ) | | | | | | | - | | | | | | | | | |
Total dividends and distributions | | | (0.33 | ) | | | (0.26 | ) | | | (0.39 | ) | | | | | | | (0.09 | ) | | | | | | | | |
Net asset value, end of period | | | $9.34 | | | | $9.88 | | | | $ 9.45 | | | | | | | | $ 9.97 | | | | | | | | | |
Total Return(c): | | | (2.16 | )% | | | 7.42 | % | | | (1.28 | )% | | | | | | | 0.58 | % | | | | | | | | |
| | | | | | | | | | | | | | | | | | | | | | | | | | | | | |
Ratios/Supplemental Data: | | | | | | | | | | | | | | | | | | | | | | | | | | | | |
Net assets, end of period (000) | | | $ 10 | | | | $ 11 | | | | $ 10 | | | | | | | | $ 10 | | | | | | | | | |
Average net assets (000) | | | $ 17 | | | | $ 10 | | | | $ 10 | | | | | | | | $6,365 | | | | | | | | | |
Ratios to average net assets(d): | | | | | | | | | | | | | | | | | | | | | | | | | | | | |
Expenses after waivers and/or expense reimbursement | | | 0.60 | % | | | 0.60 | % | | | 0.60 | % | | | | | | | 0.60 | %(e) | | | | | | | | |
Expenses before waivers and/or expense reimbursement | | | 35.37 | % | | | 62.68 | % | | | 146.78 | % | | | | | | | 3.44 | %(e) | | | | | | | | |
Net investment income (loss) | | | 3.31 | % | | | 3.02 | % | | | 3.56 | % | | | | | | | 3.33 | %(e) | | | | | | | | |
Portfolio turnover rate(f) | | | 37 | % | | | 58 | % | | | 60 | % | | | | | | | 14 | % | | | | | | | | |
| (a) | Commencement of operations. |
| (b) | Calculated based on average shares outstanding during the period. |
| (c) | Total return is calculated assuming a purchase of a share on the first day and a sale on the last day of each period reported and includes reinvestment of dividends and distributions, if any. Total returns may reflect adjustments to conform to GAAP. Total returns for periods less than one full year are not annualized. |
| (d) | Does not include expenses of the underlying funds in which the Fund invests. |
| (e) | Annualized, with the exception of certain non-recurring expenses. |
| (f) | The Fund’s portfolio turnover rate is calculated in accordance with regulatory requirements, without regard to transactions involving short-term investments, certain derivatives and in-kind transactions (if any). If such transactions were included, the Fund’s portfolio turnover rate may be higher. |
See Notes to Financial Statements.
46
Notes to Financial Statements
Prudential Investment Portfolios 8 (the “Registered Investment Company” or “RIC”) is registered under the Investment Company Act of 1940, as amended (“1940 Act”), as an open-end management investment company. The RIC is organized as a Delaware Statutory Trust. These financial statements relate only to the PGIM Securitized Credit Fund (the “Fund”), a series of the RIC. The Fund is classified as a diversified fund for purposes of the 1940 Act.
The investment objective of the Fund is to seek to maximize total return, through a combination of current income and capital appreciation.
The Fund follows the investment company accounting and reporting guidance of the Financial Accounting Standards Board (“FASB”) Accounting Standard Codification (“ASC”) Topic 946 Financial Services — Investment Companies. The following is a summary of significant accounting policies followed by the Fund in the preparation of its financial statements. The policies conform to U.S. generally accepted accounting principles (“GAAP”). The Fund consistently follows such policies in the preparation of its financial statements.
Securities Valuation: The Fund holds securities and other assets and liabilities that are fair valued as of the close of each day (generally, 4:00 PM Eastern time) the New York Stock Exchange (“NYSE”) is open for trading. As described in further detail below, the Fund’s investments are valued daily based on a number of factors, including the type of investment and whether market quotations are readily available. The RIC’s Board of Trustees (the “Board”) has approved the Fund’s valuation policies and procedures for security valuation and designated to PGIM Investments LLC (“PGIM Investments” or the “Manager”) as the Valuation Designee pursuant to SEC Rule 2a-5(b) to perform the fair value determination relating to all Fund investments. Pursuant to the Board’s oversight, the Valuation Designee has established a Valuation Committee to perform the duties and responsibilities as valuation designee under SEC Rule 2a-5. The valuation procedures permit the Fund to utilize independent pricing vendor services, quotations from market makers, and alternative valuation methods when market quotations are either not readily available or not deemed representative of fair value. Fair value is the price that would be received to sell an asset or paid to transfer a liability in an orderly transaction between market participants on the measurement date. A record of the Valuation Committee’s actions is provided to the Board at the first quarterly meeting following the quarter in which such actions take place.
For the fiscal reporting year-end, securities and other assets and liabilities were fair valued at the close of the last U.S. business day. Trading in certain foreign securities may occur when
PGIM Securitized Credit Fund 47
Notes to Financial Statements (continued)
the NYSE is closed (including weekends and holidays). Because such foreign securities trade in markets that are open on weekends and U.S. holidays, the values of some of the Fund’s foreign investments may change on days when investors cannot purchase or redeem Fund shares.
Various inputs determine how the Fund’s investments are valued, all of which are categorized according to the three broad levels (Level 1, 2, or 3) detailed in the Schedule of Investments and referred to herein as the “fair value hierarchy” in accordance with FASB ASC Topic 820 - Fair Value Measurement.
Common or preferred stocks, exchange-traded funds and derivative instruments, if applicable, that are traded on a national securities exchange are valued at the last sale price as of the close of trading on the applicable exchange where the security principally trades. Securities traded via NASDAQ are valued at the NASDAQ official closing price. To the extent these securities are valued at the last sale price or NASDAQ official closing price, they are classified as Level 1 in the fair value hierarchy. In the event that no sale or official closing price on valuation date exists, these securities are generally valued at the mean between the last reported bid and ask prices, or at the last bid price in the absence of an ask price. These securities are classified as Level 2 in the fair value hierarchy.
Investments in open-end funds (other than exchange-traded funds) are valued at their net asset values as of the close of the NYSE on the date of valuation. These securities are classified as Level 1 in the fair value hierarchy since they may be purchased or sold at their net asset values on the date of valuation.
Fixed income securities traded in the OTC market are generally classified as Level 2 in the fair value hierarchy. Such fixed income securities are typically valued using the market approach which generally involves obtaining data from an approved independent third-party vendor source. The Fund utilizes the market approach as the primary method to value securities when market prices of identical or comparable instruments are available. The third-party vendors’ valuation techniques used to derive the evaluated bid price are based on evaluating observable inputs, including but not limited to, yield curves, yield spreads, credit ratings, deal terms, tranche level attributes, default rates, cash flows, prepayment speeds, broker/dealer quotations and reported trades. Certain Level 3 securities are also valued using the market approach when obtaining a single broker quote or when utilizing transaction prices for identical securities that have been used in excess of five business days. During the reporting period, there were no changes to report with respect to the valuation approach and/or valuation techniques discussed above.
Floating rate and other loans are generally valued at prices provided by approved independent pricing vendors. The pricing vendors utilize broker/dealer quotations and
48
provide prices based on the average of such quotations. Floating rate and other loans valued using such vendor prices are generally classified as Level 2 in the fair value hierarchy. Floating rate and other loans valued based on a single broker quote or at the original transaction price in excess of five business days are classified as Level 3 in the fair value hierarchy.
OTC and centrally cleared derivative instruments are generally classified as Level 2 in the fair value hierarchy. Such derivative instruments are typically valued using the market approach and/or income approach which generally involves obtaining data from an approved independent third-party vendor source. The Fund utilizes the market approach when quoted prices in broker-dealer markets are available but also includes consideration of alternative valuation approaches, including the income approach. In the absence of reliable market quotations, the income approach is typically utilized for purposes of valuing derivatives such as interest rate swaps based on a discounted cash flow analysis whereby the value of the instrument is equal to the present value of its future cash inflows or outflows. Such analysis includes projecting future cash flows and determining the discount rate (including the present value factors that affect the discount rate) used to discount the future cash flows. In addition, the third-party vendors’ valuation techniques used to derive the evaluated derivative price is based on evaluating observable inputs, including but not limited to, underlying asset prices, indices, spreads, interest rates and exchange rates. Certain derivatives may be classified as Level 3 when valued using the market approach by obtaining a single broker quote or when utilizing unobservable inputs in the income approach. During the reporting period, there were no changes to report with respect to the valuation approach and/or valuation techniques discussed above.
Securities and other assets that cannot be priced according to the methods described above are valued based on policies and procedures approved by the Board. In the event that unobservable inputs are used when determining such valuations, the securities will be classified as Level 3 in the fair value hierarchy. Altering one or more unobservable inputs may result in a significant change to a Level 3 security’s fair value measurement.
When determining the fair value of securities, some of the factors influencing the valuation include: the nature of any restrictions on disposition of the securities; assessment of the general liquidity of the securities; the issuer’s financial condition and the markets in which it does business; the cost of the investment; the size of the holding and the capitalization of the issuer; the prices of any recent transactions or bids/offers for such securities or any comparable securities; any available analyst media or other reports or information deemed reliable by the Valuation Designee regarding the issuer or the markets or industry in which it operates. Using fair value to price securities may result in a value that is different from a security’s most recent closing price and from the price used by other unaffiliated mutual funds to calculate their net asset values.
Foreign Currency Translation: The books and records of the Fund are maintained in U.S. dollars. Foreign currency amounts are translated into U.S. dollars on the following basis:
PGIM Securitized Credit Fund 49
Notes to Financial Statements (continued)
(i) market value of investment securities, other assets and liabilities — at the exchange rate as of the valuation date;
(ii) purchases and sales of investment securities, income and expenses — at the rates of exchange prevailing on the respective dates of such transactions.
Although the net assets of the Fund are presented at the foreign exchange rates and market values at the close of the period, the Fund does not generally isolate that portion of the results of operations arising as a result of changes in the foreign exchange rates from the fluctuations arising from changes in the market prices of long-term portfolio securities held at the end of the period. Similarly, the Fund does not isolate the effect of changes in foreign exchange rates from the fluctuations arising from changes in the market prices of long-term portfolio securities sold during the period. Accordingly, holding period unrealized and realized foreign currency gains (losses) are included in the reported net change in unrealized appreciation (depreciation) on investments and net realized gains (losses) on investment transactions on the Statements of Operations.
Net realized gains (losses) on foreign currency transactions represent net foreign exchange gains (losses) from the disposition of holdings of foreign currencies, currency gains (losses) realized between the trade and settlement dates on investment transactions, and the difference between the amounts of interest, dividends and foreign withholding taxes recorded on the Fund’s books and the U.S. dollar equivalent amounts actually received or paid. Net unrealized currency gains (losses) arise from valuing foreign currency denominated assets and liabilities (other than investments) at period end exchange rates.
Forward and Cross Currency Contracts: A forward currency contract is a commitment to purchase or sell a foreign currency at a future date at a negotiated forward rate. The Fund enters into forward currency contracts, as defined in the prospectus, in order to hedge its exposure to changes in foreign currency exchange rates on its foreign portfolio holdings or on specific receivables and payables denominated in a foreign currency and to gain exposure to certain currencies. The contracts are valued daily at current forward exchange rates and any unrealized gain (loss) is included in net unrealized appreciation or depreciation on forward and cross currency contracts. Gain (loss) is realized on the settlement date of the contract equal to the difference between the settlement value of the original and negotiated forward contracts. This gain (loss), if any, is included in net realized gain (loss) on forward and cross currency contract transactions. Risks may arise upon entering into these contracts from the potential inability of the counterparties to meet the terms of their contracts. Forward currency contracts involve risks from currency exchange rate and credit risk in excess of the amounts reflected on the Statement of Assets and Liabilities. The Fund’s maximum risk of loss from counterparty credit risk is the net value of the cash flows to be received from the counterparty at the end of the contract’s life. A cross
50
currency contract is a forward contract where a specified amount of one foreign currency will be exchanged for a specified amount of another foreign currency.
Options: The Fund purchased and/or wrote options in order to hedge against adverse market movements or fluctuations in value caused by changes in prevailing interest rates, value of equities or foreign currency exchange rates with respect to securities or financial instruments which the Fund currently owns or intends to purchase. The Fund may also use options to gain additional market exposure. The Fund’s principal reason for writing options is to realize, through receipt of premiums, a greater current return than would be realized on the underlying security alone. When the Fund purchases an option, it pays a premium and an amount equal to that premium is recorded as an asset. When the Fund writes an option, it receives a premium and an amount equal to that premium is recorded as a liability. The asset or liability is adjusted daily to reflect the current market value of the option. If an option expires unexercised, the Fund realizes a gain (loss) to the extent of the premium received or paid. If an option is exercised, the premium received or paid is recorded as an adjustment to the proceeds from the sale or the cost of the purchase in determining whether the Fund has realized a gain (loss). The difference between the premium and the amount received or paid at the closing of a purchase or sale transaction is also treated as a realized gain (loss). Gain (loss) on purchased options is included in net realized gain (loss) on investment transactions. Gain (loss) on written options is presented separately as net realized gain (loss) on options written transactions.
The Fund, as writer of an option, may have no control over whether the underlying securities or financial instruments may be sold (called) or purchased (put). As a result, the Fund bears the market risk of an unfavorable change in the price of the security or financial instrument underlying the written option. The Fund, as purchaser of an OTC option, bears the risk of the potential inability of the counterparties to meet the terms of their contracts. With exchange-traded options contracts, there is minimal counterparty credit risk to the Fund since the exchanges’ clearinghouse acts as counterparty to all exchange-traded options and guarantees the options contracts against default.
When the Fund writes an option on a swap, an amount equal to any premium received by the Fund is recorded as a liability and is subsequently adjusted to the current market value of the written option on the swap. If a call option on a swap is exercised, the Fund becomes obligated to pay a fixed interest rate (noted as the strike price) and receive a variable interest rate on a notional amount. If a put option on a swap is exercised, the Fund becomes obligated to pay a variable interest rate and receive a fixed interest rate (noted as the strike price) on a notional amount. Premiums received from writing options on swaps that expire or are exercised are treated as realized gains upon the expiration or exercise of such options on swaps. The risk associated with writing put and call options on swaps is that the Fund will be obligated to be party to a swap agreement if an option on a swap is exercised.
Financial Futures Contracts: A financial futures contract is an agreement to purchase (long) or sell (short) an agreed amount of securities at a set price for delivery on a future date. Upon entering into a financial futures contract, the Fund is required to pledge to the broker
PGIM Securitized Credit Fund 51
Notes to Financial Statements (continued)
an amount of cash and/or other assets equal to a certain percentage of the contract amount. This amount is known as the “initial margin.” Subsequent payments, known as “variation margin,” are made or received by the Fund each day, depending on the daily fluctuations in the value of the underlying security. Such variation margin is recorded for financial statement purposes on a daily basis as unrealized gain (loss). When the contract expires or is closed, the gain (loss) is realized and is presented in the Statement of Operations as net realized gain (loss) on futures transactions.
The Fund invested in financial futures contracts in order to hedge its existing portfolio securities, or securities the Fund intends to purchase, against fluctuations in value caused by changes in prevailing interest rates. Should interest rates move unexpectedly, the Fund may not achieve the anticipated benefits of the financial futures contracts and may realize a loss. The use of futures transactions involves the risk of imperfect correlation in movements in the price of futures contracts, interest rates and the underlying hedged assets. Since futures contracts are exchange-traded, there is minimal counterparty credit risk to the Fund since the exchanges’ clearinghouse acts as counterparty to all exchange-traded futures and guarantees the futures contracts against default.
Swap Agreements: The Fund entered into certain types of swap agreements detailed in the disclosures below. A swap agreement is an agreement to exchange the return generated by one instrument for the return generated by another instrument. Swap agreements are negotiated in the OTC market and may be executed either directly with a counterparty (“OTC-traded”) or through a central clearing facility, such as a registered exchange. Swap agreements are valued daily at current market value and any change in value is included in the net unrealized appreciation or depreciation on swap agreements. Centrally cleared swaps pay or receive an amount known as “variation margin”, based on daily changes in the valuation of the swap contract. For OTC-traded, upfront premiums paid and received are shown as swap premiums paid and swap premiums received in the Statement of Assets and Liabilities. Risk of loss may exceed amounts recognized on the Statement of Assets and Liabilities. Swap agreements outstanding at period end, if any, are listed on the Schedule of Investments.
Interest Rate Swaps: Interest rate swaps represent an agreement between counterparties to exchange cash flows based on the difference between two interest rates, applied to a notional principal amount for a specified period. The Fund is subject to interest rate risk exposure in the normal course of pursuing its investment objective. The Fund used interest rate swaps to maintain its ability to generate steady cash flow by receiving a stream of fixed rate payments or to increase exposure to prevailing market rates by receiving floating rate payments. The Fund’s maximum risk of loss from counterparty credit risk is the discounted net present value of the cash flows to be received from the counterparty over the contract’s remaining life.
52
Credit Default Swaps (“CDS”): CDS involve one party (the protection buyer) making a stream of payments to another party (the protection seller) in exchange for the right to receive a specified payment in the event of a default or as a result of a default (collectively a “credit event”) for the referenced entity (typically corporate issues or sovereign issues of an emerging country) on its obligation; or in the event of a write-down, principal shortfall, interest shortfall or default of all or part of the referenced entities comprising a credit index.
The Fund is subject to credit risk in the normal course of pursuing its investment objectives, and as such, has entered into CDS contracts to provide a measure of protection against defaults or to take an active long or short position with respect to the likelihood of a particular issuer’s default or the reference entity’s credit soundness. CDS contracts generally trade based on a spread which represents the cost a protection buyer has to pay the protection seller. The protection buyer is said to be short the credit as the value of the contract rises the more the credit deteriorates. The value of the CDS contract increases for the protection buyer if the spread increases. The Fund’s maximum risk of loss from counterparty credit risk for purchased CDS is the inability of the counterparty to honor the contract up to the notional value due to a credit event.
As a seller of protection on credit default swap agreements, the Fund generally receives an agreed upon payment from the buyer of protection throughout the term of the swap, provided no credit event occurs. As the seller, the Fund effectively increases its investment risk because, in addition to its total net assets, the Fund may be subject to investment exposure on the notional amount of the swap.
The maximum amount of the payment that the Fund, as a seller of protection, could be required to make under a credit default swap agreement would be equal to the notional amount of the underlying security or index contract as a result of a credit event. This potential amount will be partially offset by any recovery values of the respective referenced obligations, or net amounts received from the settlement of buy protection credit default swap agreements which the Fund entered into for the same referenced entity or index. As a buyer of protection, the Fund generally receives an amount up to the notional value of the swap if a credit event occurs.
Implied credit spreads, represented in absolute terms, utilized in determining the market value of credit default swap agreements where the Fund is the seller of protection as of period end are disclosed in the footnotes to the Schedule of Investments, if applicable. These spreads serve as indicators of the current status of the payment/performance risk and represent the likelihood of default risk for the credit derivative. The implied credit spread of a particular referenced entity reflects the cost of buying/selling protection and may include upfront payments required to enter into the agreement. Wider credit spreads and increased market value in absolute terms, when compared to the notional amount of the swap, represent a deterioration of the referenced entity’s credit soundness and a greater likelihood of risk of default or other credit event occurring as defined under the terms of the agreement.
PGIM Securitized Credit Fund 53
Notes to Financial Statements (continued)
Floating Rate and other Loans: The Fund invested in floating rate and other loans. Floating rate and other loans include loans that are privately negotiated between a corporate borrower and one or more financial institutions, including, but not limited to, term loans, revolvers, and other instruments issued in the floating rate and other loans market. The Fund acquire interests in loans directly (by way of assignment from the selling institution) and/or indirectly (by way of the purchase of a participation interest from the selling institution). Under a floating rate and other loans assignment, the Fund generally will succeed to all the rights and obligations of an assigning lending institution and become a lender under the loan agreement with the relevant borrower in connection with that loan. Under a floating rate and other loans participation, the Fund generally will have a contractual relationship only with the lender, not with the relevant borrower. As a result, the Fund generally will have the right to receive payments of principal, interest, and any fees to which they are entitled only from the lender selling the participation and only upon receipt by the lender of the payments from the relevant borrower. The Fund may not directly benefit from the collateral supporting the debt obligation in which they have purchased the participation. As a result, the Fund will assume the credit risk of both the borrower and the institution selling the participation to the Fund.
Mortgage-Backed and Asset-Backed Securities: Mortgage-backed securities are pass-through securities, meaning that principal and interest payments made by the borrower on the underlying mortgages are passed through to the Fund. Asset-backed securities directly or indirectly represent a participation interest in, or are secured by and payable from, a stream of payments generated by particular assets such as motor vehicle or credit card receivables. Asset-backed securities may be classified as pass-through certificates or collateralized obligations, such as collateralized bond obligations, collateralized loan obligations and other similarly structured securities. The value of mortgage-backed and asset-backed securities varies with changes in interest rates and may be affected by changes in credit quality or value of the mortgage loans or other assets that support the securities.
Stripped mortgage-backed securities are usually structured with two classes that receive different proportions of the interest (“IO”) and principal (“PO”) distributions on a pool of mortgage assets. Payments received for IOs are included in interest income on the Statements of Operations. Because no principal will be received at the maturity of an IO, adjustments are made to the cost of the security on a monthly basis until maturity. These adjustments are included in interest income on the Statements of Operations. Payments received for POs are treated as reductions to the cost and par value of the securities.
Master Netting Arrangements: The RIC, on behalf of the Fund, is subject to various Master Agreements, or netting arrangements, with select counterparties. These are agreements which a subadviser may have negotiated and entered into on behalf of all or a portion of the
54
Fund. A master netting arrangement between the Fund and the counterparty permits the Fund to offset amounts payable by the Fund to the same counterparty against amounts to be received; and by the receipt of collateral from the counterparty by the Fund to cover the Fund’s exposure to the counterparty. However, there is no assurance that such mitigating factors are easily enforceable. In addition to master netting arrangements, the right to set-off exists when all the conditions are met such that each of the parties owes the other determinable amounts, the reporting party has the right to set-off the amount owed with the amount owed by the other party, the reporting party intends to set-off and the right of set-off is enforceable by law.
The RIC, on behalf of the Fund, is a party to International Swaps and Derivatives Association, Inc. (“ISDA”) Master Agreements with certain counterparties that govern OTC derivative and foreign exchange contracts entered into from time to time. The Master Agreements may contain provisions regarding, among other things, the parties’ general obligations, representations, agreements, collateral requirements, events of default and early termination. With respect to certain counterparties, in accordance with the terms of the Master Agreements, collateral posted to the Fund is held in a segregated account by the Fund’s custodian and with respect to those amounts which can be sold or re-pledged, is presented in the Schedule of Investments. Collateral pledged by the Fund is segregated by the Fund’s custodian and identified in the Schedule of Investments. Collateral can be in the form of cash or debt securities issued by the U.S. Government or related agencies or other securities as agreed to by the Fund and the applicable counterparty. Collateral requirements are determined based on the Fund’s net position with each counterparty. Termination events applicable to the Fund may occur upon a decline in the Fund’s net assets below a specified threshold over a certain period of time. Termination events applicable to counterparties may occur upon a decline in the counterparty’s long-term and short-term credit ratings below a specified level. In each case, upon occurrence, the other party may elect to terminate early and cause settlement of all derivative and foreign exchange contracts outstanding, including the payment of any losses and costs resulting from such early termination, as reasonably determined by the terminating party. Any decision by one or more of the Fund’s counterparties to elect early termination could impact the Fund’s future derivative activity.
In addition to each instrument’s primary underlying risk exposure (e.g. interest rate, credit, equity or foreign exchange, etc.), swap agreements involve, to varying degrees, elements of credit, market and documentation risk. Such risks involve the possibility that no liquid market for these agreements will exist, the counterparty to the agreement may default on its obligation to perform or disagree on the contractual terms of the agreement, and changes in net interest rates will be unfavorable. In connection with these agreements, securities in the portfolio may be identified or received as collateral from the counterparty in accordance with the terms of the respective swap agreements to provide or receive assets of value and to serve as recourse in the event of default or bankruptcy/insolvency of either party. Such OTC derivative agreements include conditions which, when materialized, give the counterparty the right to cause an early termination of the transactions under those agreements. Any election by the counterparty for early termination of the contract(s) may impact the amounts reported on financial statements.
PGIM Securitized Credit Fund 55
Notes to Financial Statements (continued)
Short sales and OTC contracts, including forward foreign currency exchange contracts, swaps, forward rate agreements and written options involve elements of both market and credit risk in excess of the amounts reflected on the Statement of Assets and Liabilities, if applicable. Such risks may be mitigated by engaging in master netting arrangements.
Payment-In-Kind: The Fund invested in the open market or received pursuant to debt restructuring, securities that pay-in-kind (PIK) the interest due on such debt instruments. The PIK interest, computed at the contractual rate specified, is added to the existing principal balance of the debt when issued bonds have same terms as the bond or recorded as a separate bond when terms are different from the existing debt, and is recorded as interest income.
Securities Transactions and Net Investment Income: Securities transactions are recorded on the trade date. Realized gains (losses) from investment and currency transactions are calculated on the specific identification method. Dividend income is recorded on the ex-date, or for certain foreign securities, when the Fund becomes aware of such dividends. Interest income, including amortization of premium and accretion of discount on debt securities, as required, is recorded on the accrual basis. Expenses are recorded on an accrual basis, which may require the use of certain estimates by management that may differ from actual. Net investment income or loss (other than class specific expenses and waivers, which are allocated as noted below) and unrealized and realized gains (losses) are allocated daily to each class of shares based upon the relative proportion of adjusted net assets of each class at the beginning of the day. Class specific expenses and waivers, where applicable, are charged to the respective share classes. Such class specific expenses and waivers include distribution fees and distribution fee waivers, shareholder servicing fees, transfer agent’s fees and expenses, registration fees and fee waivers and/or expense reimbursements, as applicable.
Taxes: It is the Fund’s policy to continue to meet the requirements of the Internal Revenue Code applicable to regulated investment companies and to distribute all of its taxable net investment income and capital gains, if any, to its shareholders. Therefore, no federal income tax provision is required. Withholding taxes on foreign dividends, interest and capital gains, if any, are recorded, net of reclaimable amounts, at the time the related income is earned.
Dividends and Distributions: Dividends and distributions to shareholders, which are determined in accordance with federal income tax regulations and which may differ from GAAP, are recorded on the ex-date. Permanent book/tax differences relating to income and gain (loss) are reclassified between total distributable earnings (loss) and paid-in capital in excess of par, as appropriate. The chart below sets forth the expected frequency of dividend and capital gains distributions to shareholders. Various factors may impact the frequency of
56
dividend distributions to shareholders, including but not limited to adverse market conditions or portfolio holding-specific events.
| | |
| | |
| Expected Distribution Schedule to Shareholders* | | Frequency |
| |
Net Investment Income | | Monthly |
| |
Short-Term Capital Gains | | Annually |
| |
Long-Term Capital Gains | | Annually |
| * | Under certain circumstances, the Fund may make more than one distribution of short-term and/or long-term capital gains during a fiscal year. |
Estimates: The preparation of financial statements requires management to make estimates and assumptions that affect the reported amounts and disclosures in the financial statements. Actual results could differ from those estimates.
The RIC, on behalf of the Fund, has a management agreement with the Manager pursuant to which it has responsibility for all investment advisory services and supervises the subadviser’s performance of such services, and pursuant to which it renders administrative services.
The Manager has entered into a subadvisory agreement with PGIM, Inc., which provides subadvisory services to the Fund through its business unit PGIM Fixed Income and PGIM Limited (collectively the “subadviser”). The Manager pays for the services of the subadviser.
Fees payable under the management agreement are computed daily and paid monthly. For the reporting period ended September 30, 2022, the contractual and effective management fee rates were as follows:
| | |
| | |
| Contractual Management Rate | | Effective Management Fee, before any waivers and/or expense reimbursements |
| |
0.60% of the Fund’s average daily net assets up to $ 2.5 billion; | | 0.60% |
| |
0.55% of the Fund’s average daily net assets from $ 2.5 billion to $5 billion; | | |
| |
0.50% of the Fund’s average daily net assets over $ 5 billion. | | |
The Manager has contractually agreed, through January 31, 2024, to limit total annual operating expenses after fee waivers and/or expense reimbursements. This contractual waiver excludes interest, brokerage, taxes (such as income and foreign withholding taxes, stamp duty and deferred tax expenses), acquired fund fees and expenses, extraordinary expenses, and certain other Fund expenses such as dividend and interest expense and broker charges on short sales.
Where applicable, the Manager agrees to waive management fees or shared operating expenses on any share class to the same extent that it waives such expenses on any other
PGIM Securitized Credit Fund 57
Notes to Financial Statements (continued)
share class. In addition, total annual operating expenses for Class R6 shares will not exceed total annual operating expenses for Class Z shares. Fees and/or expenses waived and/or reimbursed by the Manager for the purpose of preventing the expenses from exceeding a certain expense ratio limit may be recouped by the Manager within the same fiscal year during which such waiver and/or reimbursement is made if such recoupment can be realized without exceeding the expense limit in effect at the time of the recoupment for that fiscal year. The expense limitations attributable to each class are as follows:
| | | | |
| | |
| Class | | Expense Limitations |
| |
A | | | 0.90 | % |
| |
C | | | 1.65 | |
| |
Z | | | 0.65 | |
| |
R6 | | | 0.60 | |
The RIC, on behalf of the Fund, has a distribution agreement with Prudential Investment Management Services LLC (“PIMS”), which acts as the distributor of the Class A, Class C, Class Z and Class R6 shares of the Fund. The Fund compensates PIMS for distributing and servicing the Fund’s Class A and Class C shares, pursuant to the plans of distribution (the “Distribution Plans”), regardless of expenses actually incurred by PIMS.
Pursuant to the Distribution Plans, the Fund compensates PIMS for distribution related activities at an annual rate based on average daily net assets per class. The distribution fees are accrued daily and payable monthly.
The Fund’s annual gross and net distribution rate, where applicable, are as follows:
| | | | | | | | |
| | | |
| Class | | Gross Distribution Fee | | Net Distribution Fee |
| | |
A | | | 0.25 | % | | | 0.25 | % |
| | |
C | | | 1.00 | | | | 1.00 | |
| | |
Z | | | N/A | | | | N/A | |
| | |
R6 | | | N/A | | | | N/A | |
For the year ended September 30, 2022, PIMS has not received front-end sales charges (“FESL”) resulting from sales of certain class shares. Additionally, for the year ended September 30, 2022, PIMS received contingent deferred sales charges (“CDSC”) imposed upon redemptions by certain shareholders. From these fees, PIMS paid such sales charges to broker-dealers, who in turn paid commissions to salespersons and incurred other distribution costs. The sales charges are as follows where applicable:
| | | | |
| | | |
| Class | | FESL | | CDSC |
| | |
A | | $— | | $— |
| | |
C | | — | | 6 |
58
PGIM Investments, PGIM, Inc., PGIM Limited and PIMS are indirect, wholly-owned subsidiaries of Prudential Financial, Inc. (“Prudential”).
| 4. | Other Transactions with Affiliates |
Prudential Mutual Fund Services LLC (“PMFS”), an affiliate of PGIM Investments and an indirect, wholly-owned subsidiary of Prudential, serves as the Fund’s transfer agent and shareholder servicing agent. Transfer agent’s fees and expenses in the Statement of Operations include certain out-of-pocket expenses paid to non-affiliates, where applicable.
The Fund may invest its overnight sweep cash in the PGIM Core Ultra Short Bond Fund (the “Core Fund”), a fund of Prudential Investment Portfolios 2, registered under the 1940 Act and managed by PGIM Investments. PGIM Investments and/or its affiliates are paid fees or reimbursed for providing their services to the Core Fund. In addition to the realized and unrealized gains on investments in the Core Fund, earnings from such investments are disclosed on the Statement of Operations as “Affiliated dividend income”. Effective January 2022, the Fund changed its overnight cash sweep vehicle from the Core Fund to an unaffiliated money market fund.
The Fund may enter into certain securities purchase or sale transactions under Board approved Rule 17a-7 procedures. Rule 17a-7 is an exemptive rule under the 1940 Act, that subject to certain conditions, permits purchase and sale transactions among affiliated investment companies, or between an investment company and a person that is affiliated solely by reason of having a common (or affiliated) investment adviser, common directors/trustees, and/or common officers. For the year ended September 30, 2022, no 17a-7 transactions were entered into by the Fund.
The aggregate cost of purchases and proceeds from sales of portfolio securities (excluding short-term investments and U.S. Government securities) for the reporting period ended September 30, 2022, were as follows:
| | |
| | |
| Cost of Purchases | | Proceeds from Sales |
| |
$59,242,315 | | $20,529,724 |
A summary of the cost of purchases and proceeds from sales of shares of affiliated mutual funds for the year ended September 30, 2022, is presented as follows:
PGIM Securitized Credit Fund 59
Notes to Financial Statements (continued)
| | | | | | | | | | | | | | |
| | | | | | | | |
Value,
Beginning
of Year | | Cost of
Purchases | | Proceeds
from Sales | | Change in Unrealized
Gain
(Loss) | | Realized
Gain
(Loss) | | Value, End of Year | | Shares,
End
of Year | | Income |
| | | |
Short-Term Investments - Affiliated Mutual Fund: | | | | | | |
| | | | | |
PGIM Core Ultra Short Bond Fund(1)(wb) | | | | | | | | | | |
| | | | | | | |
| $541,328 | | $4,231,710 | | $4,773,038 | | $— | | $— | | $— | | — | | $435 |
| (1) | The Fund did not have any capital gain distributions during the reporting period. |
| (wb) | PGIM Investments LLC, the manager of the Fund, also serves as manager of the PGIM Core Ultra Short Bond Fund. |
| 6. | Distributions and Tax Information |
Distributions to shareholders, which are determined in accordance with federal income tax regulations and which may differ from GAAP, are recorded on the ex-date.
For the year ended September 30, 2022, the tax character of dividends paid by the Fund was $2,121,153 of ordinary income. For the year ended September 30, 2021, the tax character of dividends paid by the Fund was $794,796 of ordinary income.
As of September 30, 2022, the accumulated undistributed earnings on a tax basis was $580,683 of ordinary income.
The United States federal income tax basis of the Fund’s investments and the net unrealized depreciation as of September 30, 2022 were as follows:
| | | | | | |
| | | | |
| Tax Basis | | Gross
Unrealized
Appreciation | | Gross
Unrealized
Depreciation | | Net
Unrealized
Depreciation |
| | | |
| $75,016,221 | | $804,799 | | $(5,435,153) | | $(4,630,354) |
The difference between GAAP and tax basis is primarily attributable to differences in the treatment of premium amortization for GAAP and tax purposes, appreciation (depreciation) of swaps, and mark-to-market of futures and forwards contracts.
For federal income tax purposes, the Fund had a capital loss carryforward as of September 30, 2022 of approximately $121,000 which can be carried forward for an unlimited period. The Fund utilized approximately $436,000 of its capital loss carryforward to offset net taxable gains realized in the fiscal year ended September 30, 2022. No capital gains distributions are expected to be paid to shareholders until net gains have been realized in excess of such losses.
60
The Manager has analyzed the Fund’s tax positions taken on federal, state and local income tax returns for all open tax years and has concluded that no provision for income tax is required in the Fund’s financial statements for the current reporting period. Since tax authorities can examine previously filed tax returns, the Fund’s U.S. federal and state tax returns for each of the four fiscal years up to the most recent fiscal year ended September 30, 2022 are subject to such review.
The Fund offers Class A, Class C, Class Z and Class R6 shares. Class A shares are sold with a maximum front-end sales charge of 3.25%. Investors who purchase $500,000 or more of Class A shares and sell those shares within 12 months of purchase are subject to a CDSC of 1% on sales although these purchases are not subject to a front-end sales charge. The Class A CDSC is waived for certain retirement and/or benefit plans. A special exchange privilege is also available for shareholders who qualified to purchase Class A shares at net asset value. Class C shares are sold with a CDSC of 1% on sales made within 12 months of purchase. Class C shares will automatically convert to Class A shares on a monthly basis approximately eight years (ten years prior to January 22, 2021) after purchase. Class Z and Class R6 shares are not subject to any sales or redemption charges and are available exclusively for sale to a limited group of investors.
Under certain circumstances, an exchange may be made from specified share classes of the Fund to one or more other share classes of the Fund as presented in the table of transactions in shares of beneficial interest, below.
The RIC has authorized an unlimited number of shares of beneficial interest of the Fund at
$0.001 par value per share, currently divided into four classes, designated Class A, Class C, Class R6 and Class Z.
As of September 30, 2022, Prudential, through its affiliated entities, including affiliated funds (if applicable), owned shares of the Fund as follows:
| | | | | | | | |
| | | |
| Class | | Number of Shares | | Percentage of Outstanding Shares |
| | |
A | | | 1,107 | | | | 7.7 | % |
| | |
C | | | 1,080 | | | | 11.0 | |
| | |
Z | | | 2,985,041 | | | | 39.7 | |
| | |
R6 | | | 1,117 | | | | 100.0 | |
At the reporting period end, the number of shareholders holding greater than 5% of the Fund are as follows:
| | | | | | |
| | | |
| | | Number of Shareholders | | Percentage of Outstanding Shares |
| | |
Affiliated | | 1 | | | 39.6 | % |
| | |
Unaffiliated | | 2 | | | 53.1 | |
PGIM Securitized Credit Fund 61
Notes to Financial Statements (continued)
Transactions in shares of beneficial interest were as follows:
| | | | | | | | |
| | | |
| Share Class | | Shares | | | Amount | |
| | |
Class A | | | | | | | | |
| | |
Year ended September 30, 2022: | | | | | | | | |
| | |
Shares sold | | | 12,241 | | | $ | 118,579 | |
| | |
Shares issued in reinvestment of dividends and distributions | | | 330 | | | | 3,140 | |
| | |
Shares purchased | | | (2,103 | ) | | | (20,270 | ) |
| | |
Net increase (decrease) in shares outstanding | | | 10,468 | | | $ | 101,449 | |
| | |
Year ended September 30, 2021: | | | | | | | | |
| | |
Shares sold | | | 4,764 | | | $ | 46,526 | |
| | |
Shares issued in reinvestment of dividends and distributions | | | 62 | | | | 610 | |
| | |
Shares purchased | | | (2,621 | ) | | | (25,416 | ) |
| | |
Net increase (decrease) in shares outstanding before conversion | | | 2,205 | | | | 21,720 | |
| | |
Shares purchased upon conversion into other share class(es) | | | (507 | ) | | | (5,000 | ) |
| | |
Net increase (decrease) in shares outstanding | | | 1,698 | | | $ | 16,720 | |
| | |
Class C | | | | | | | | |
| | |
Year ended September 30, 2022: | | | | | | | | |
| | |
Shares sold | | | 8,672 | | | $ | 84,524 | |
| | |
Shares issued in reinvestment of dividends and distributions | | | 162 | | | | 1,540 | |
| | |
Shares purchased | | | (72 | ) | | | (695 | ) |
| | |
Net increase (decrease) in shares outstanding | | | 8,762 | | | $ | 85,369 | |
| | |
Year ended September 30, 2021: | | | | | | | | |
| | |
Shares issued in reinvestment of dividends and distributions | | | 18 | | | $ | 169 | |
| | |
Net increase (decrease) in shares outstanding | | | 18 | | | $ | 169 | |
| | |
Class Z | | | | | | | | |
| | |
Year ended September 30, 2022: | | | | | | | | |
| | |
Shares sold | | | 6,431,761 | | | $ | 62,865,452 | |
| | |
Shares issued in reinvestment of dividends and distributions | | | 221,455 | | | | 2,114,748 | |
| | |
Shares purchased | | | (2,400,032 | ) | | | (22,933,699 | ) |
| | |
Net increase (decrease) in shares outstanding | | | 4,253,184 | | | $ | 42,046,501 | |
| | |
Year ended September 30, 2021: | | | | | | | | |
| | |
Shares sold | | | 389,701 | | | $ | 3,816,097 | |
| | |
Shares issued in reinvestment of dividends and distributions | | | 80,674 | | | | 785,860 | |
| | |
Shares purchased | | | (191,171 | ) | | | (1,856,218 | ) |
| | |
Net increase (decrease) in shares outstanding before conversion | | | 279,204 | | | | 2,745,739 | |
| | |
Shares issued upon conversion from other share class(es) | | | 507 | | | | 5,000 | |
| | |
Net increase (decrease) in shares outstanding | | | 279,711 | | | $ | 2,750,739 | |
62
| | | | | | | | |
| | | |
| Share Class | | Shares | | | Amount | |
| | |
Class R6 | | | | | | | | |
| | |
Year ended September 30, 2022: | | | | | | | | |
| | |
Shares sold | | | 1,901 | | | $ | 18,327 | |
| | |
Shares issued in reinvestment of dividends and distributions | | | 57 | | | | 549 | |
| | |
Shares purchased | | | (1,921 | ) | | | (18,275 | ) |
| | |
Net increase (decrease) in shares outstanding | | | 37 | | | $ | 601 | |
| | |
Year ended September 30, 2021: | | | | | | | | |
| | |
Shares issued in reinvestment of dividends and distributions | | | 29 | | | $ | 281 | |
| | |
Net increase (decrease) in shares outstanding | | | 29 | | | $ | 281 | |
The RIC, on behalf of the Fund, along with other affiliated registered investment companies (the “Participating Funds”), is a party to a Syndicated Credit Agreement (“SCA”) with a group of banks. The purpose of the SCA is to provide an alternative source of temporary funding for capital share redemptions. The table below provides details of the current SCA in effect at the reporting period-end as well as the prior SCA.
| | | | |
| | | |
| | | Current SCA | | Prior SCA |
| | |
Term of Commitment | | 9/30/2022 - 9/28/2023 | | 10/1/2021 – 9/29/2022 |
| | |
Total Commitment | | $ 1,200,000,000 | | $ 1,200,000,000 |
| | |
Annualized Commitment Fee on the Unused Portion of the SCA | | 0.15% | | 0.15% |
| | |
Annualized Interest Rate on Borrowings | | 1.00% plus the higher of (1) the effective federal funds rate, (2) the daily SOFR rate plus 0.10% or (3) zero percent | | 1.20% plus the higher of (1) the effective federal funds rate, (2) the one-month LIBOR rate or (3) zero percent |
Certain affiliated registered investment companies that are parties to the SCA include portfolios that are subject to a predetermined mathematical formula used to manage certain benefit guarantees offered under variable annuity contracts. The formula may result in large scale asset flows into and out of these portfolios. Consequently, these portfolios may be more likely to utilize the SCA for purposes of funding redemptions. It may be possible for those portfolios to fully exhaust the committed amount of the SCA, thereby requiring the Manager to allocate available funding per a Board-approved methodology designed to treat the Participating Funds in the SCA equitably.
The Fund did not utilize the SCA during the year ended September 30, 2022.
| 9. | Risks of Investing in the Fund |
The Fund’s risks include, but are not limited to, some or all of the risks discussed below. For further information on the Fund’s risks, please refer to the Fund’s Prospectus and Statement of Additional Information.
PGIM Securitized Credit Fund 63
Notes to Financial Statements (continued)
Covenant-Lite Risk: Some of the loans or debt obligations in which the Fund may invest or get exposure to may be “covenant-lite”, which means the loans or obligations contain fewer financial maintenance covenants than other loans or obligations (in some cases, none) and do not include terms which allow the lender to monitor the borrower’s performance and declare a default if certain criteria are breached. An investment by the Fund in a covenant-lite loan may potentially hinder the ability to reprice credit risk associated with the issuer and reduce the ability to restructure a problematic loan and mitigate potential loss. The Fund may also experience difficulty, expenses or delays in enforcing its rights on its holdings of covenant-lite loans or obligations. As a result of these risks, the Fund’s exposure to losses may be increased, which could result in an adverse impact on the Fund’s net income and NAV.
Credit Risk/Counterparty Risk: The ability, or perceived ability, of the issuer or guarantor of a debt security, or the counterparty (the party on the other side of the transaction) to a derivatives contract or other financial contract to meet its financial obligations will affect the value of the security or derivative. Counterparty and credit risk are especially important in the context of privately negotiated instruments. The Fund expects to enter into certain privately negotiated agreements where the counterparty assumes the physical settlement obligations of the Fund under such transactions. Under this type of arrangement, there is a risk that the relevant counterparty or intermediary would, due to insolvency or other reasons, be unable to or fail to assume the physical settlement obligations of the Fund, in which case the Fund could be required to sell portfolio instruments at unfavorable times or prices or could have insufficient assets to satisfy its physical settlement obligations.
Credit ratings are intended to provide a measure of credit risk. However, credit ratings are only the opinions of the credit rating agency issuing the ratings and are not guarantees as to quality. The lower the rating of a debt security held by the Fund, the greater the degree of credit risk that is perceived to exist by the credit rating agency with respect to that security. Increasing the amount of Fund assets allocated to lower-rated securities generally will increase the credit risk to which the Fund is subject. Not all securities in which the Fund invests are rated. The lower the credit quality of a bond, the more sensitive it is to credit risk.
Currency Risk: The Fund’s net asset value could decline as a result of changes in exchange rates, which could adversely affect the Fund’s investments in currencies, or in securities that trade in, and receive revenues related to, currencies, or in derivatives that provide exposure to currencies. Certain foreign countries may impose restrictions on the ability of issuers of foreign securities to make payment of principal and interest or dividends to investors located outside the country, due to blockage of foreign currency exchanges or otherwise.
Debt Obligations Risk: Debt obligations are subject to credit risk, market risk and interest rate risk. The Fund’s holdings, share price, yield and total return may also fluctuate in
64
response to bond market movements. The value of bonds may decline for issuer-related reasons, including management performance, financial leverage and reduced demand for the issuer’s goods and services. Certain types of fixed income obligations also may be subject to “call and redemption risk,” which is the risk that the issuer may call a bond held by the Fund for redemption before it matures and the Fund may not be able to reinvest at the same rate of interest and therefore would earn less income.
Derivatives Risk: Derivatives involve special risks and costs and may result in losses to the Fund. The successful use of derivatives requires sophisticated management, and, to the extent that derivatives are used, the Fund will depend on the subadviser’s ability to analyze and manage derivatives transactions. The prices of derivatives may move in unexpected ways, especially in abnormal market conditions. Some derivatives are “leveraged” or may create economic leverage for the Fund. and therefore may magnify or otherwise increase investment losses to the Fund. The Fund’s use of derivatives may also increase the amount of taxes payable by shareholders.
Other risks arise from the potential inability to terminate or sell derivatives positions. A liquid secondary market may not always exist for the Fund’s derivatives positions. In fact, many over-the-counter derivative instruments will not have liquidity beyond the counterparty to the instrument. Over-the-counter derivative instruments also involve the risk that the other party will not meet its obligations to the Fund. The use of derivatives also exposes the Fund to operational issues, such as documentation and settlement issues, systems failures, inadequate control and human error.
Derivatives may also involve legal risks, such as insufficient documentation, the lack of capacity or authority of a counterparty to execute or settle a transaction, and the legality and enforceability of derivatives contracts. The U.S. Government and foreign governments have adopted (and may adopt further) regulations governing derivatives markets, including mandatory clearing of certain derivatives, margin and reporting requirements and risk exposure limitations. Regulation of derivatives may make derivatives more costly, limit their availability or utility to the Fund, or otherwise adversely affect their performance or disrupt markets.
Economic and Market Events Risk: Events in the U.S. and global financial markets, including actions taken by the U.S. Federal Reserve or foreign central banks to stimulate or stabilize economic growth or the functioning of the securities markets, may at times result in unusually high market volatility, which could negatively impact performance. Relatively reduced liquidity in credit and fixed income markets could adversely affect issuers worldwide.
Floating Rate and Other Loans Risk: The Fund’s ability to receive payments of principal and interest and other amounts in connection with loans (whether through participations, assignments or otherwise) will depend primarily on the financial condition of the borrower. The failure by the Fund to receive scheduled interest or principal payments on a loan because of a default, bankruptcy or any other reason would adversely affect the income of
PGIM Securitized Credit Fund 65
Notes to Financial Statements (continued)
the Fund and would likely reduce the value of its assets. Even with loans secured by collateral, there is the risk that the value of the collateral may decline, may be insufficient to meet the obligations of the borrower, or be difficult to liquidate. In the event of a default, the Fund may have difficulty collecting on any collateral and would not have the ability to collect on any collateral for an uncollateralized loan. Further, the Fund’s access to collateral, if any, may be limited by bankruptcy laws. Due to the nature of the private syndication of senior loans, including, for example, lack of publicly-available information, some senior loans are not as easily purchased or sold as publicly-traded securities. In addition, loan participations generally are subject to restrictions on transfer, and only limited opportunities may exist to sell loan participations in secondary markets. As a result, it may be difficult for the Fund to value loans or sell loans at an acceptable price when it wants to sell them. Loans trade in an over-the-counter market, and confirmation and settlement, which are effected through standardized procedures and documentation, may take significantly longer than seven days to complete. Extended trade settlement periods may, in unusual market conditions with a high volume of shareholder redemptions, present a risk to shareholders regarding the Fund’s ability to pay redemption proceeds in a timely manner. In some instances, loans and loan participations are not rated by independent credit rating agencies; in such instances, a decision by the Fund to invest in a particular loan or loan participation could depend exclusively on the subadviser’s credit analysis of the borrower, or in the case of a loan participation, of the intermediary holding the portion of the loan that the Fund has purchased. To the extent the Fund invests in loans of non-U.S. issuers, the risks of investing in non-U.S. issuers are applicable. Loans may not be considered to be “securities” and as a result may not benefit from the protections of the federal securities laws, including anti-fraud protections and those with respect to the use of material non-public information, so that purchasers, such as the Fund, may not have the benefit of these protections. If the Fund is in possession of material non-public information about a borrower as a result of its investment in such borrower’s loan, the Fund may not be able to enter into a transaction with respect to a publicly-traded security of the borrower when it would otherwise be advantageous to do so.
Foreign Securities Risk: Investments in securities of non-U.S. issuers (including those denominated in U.S. dollars) may involve more risk than investing in securities of U.S. issuers. Foreign political, economic and legal systems, especially those in developing and emerging market countries, may be less stable and more volatile than in the United States. Foreign legal systems generally have fewer regulatory requirements than the U.S. legal system, particularly those of emerging markets. In general, less information is publicly available with respect to non-U.S. companies than U.S. companies. Non-U.S. companies generally are not subject to the same accounting, auditing, and financial reporting standards as are U.S. companies. Additionally, the changing value of foreign currencies and changes in exchange rates could also affect the value of the assets the Fund holds and the Fund’s performance. Certain foreign countries may impose restrictions on the ability of issuers of
66
foreign securities to make payment of principal and interest or dividends to investors located outside the country, due to blockage of foreign currency exchanges or otherwise. Investments in emerging markets are subject to greater volatility and price declines.
In addition, the Fund’s investments in non-U.S. securities may be subject to the risks of nationalization or expropriation of assets, imposition of currency exchange controls or restrictions on the repatriation of non-U.S. currency, confiscatory taxation and adverse diplomatic developments. Special U.S. tax considerations may apply.
Increase in Expenses Risk: Your actual cost of investing in the Fund may be higher than the expenses shown in the expense table in the Fund’s prospectus for a variety of reasons. For example, expense ratios may be higher than those shown if average net assets decrease. Net assets are more likely to decrease and Fund expense ratios are more likely to increase when markets are volatile. Active and frequent trading of Fund securities can increase expenses.
Interest Rate Risk: The value of your investment may go down when interest rates rise. A rise in rates tends to have a greater impact on the prices of longer term or duration debt securities. Similarly, a rise in interest rates may also have a greater negative impact on the value of equity securities whose issuers expect earnings further out in the future. For example, a fixed income security with a duration of three years is expected to decrease in value by approximately 3% if interest rates increase by 1%. This is referred to as “duration risk.” When interest rates fall, the issuers of debt obligations may prepay principal more quickly than expected, and the Fund may be required to reinvest the proceeds at a lower interest rate. This is referred to as “prepayment risk.” When interest rates rise, debt obligations may be repaid more slowly than expected, and the value of the Fund’s holdings may fall sharply. This is referred to as “extension risk.” The Fund may lose money if short-term or long-term interest rates rise sharply or in a manner not anticipated by the subadviser.
Junk Bonds Risk: High-yield, high-risk bonds have predominantly speculative characteristics, including particularly high credit risk. Junk bonds tend to have lower market liquidity than higher-rated securities. The liquidity of particular issuers or industries within a particular investment category may shrink or disappear suddenly and without warning. The non-investment grade bond market can experience sudden and sharp price swings and become illiquid due to a variety of factors, including changes in economic forecasts, stock market activity, large sustained sales by major investors, a high profile default or a change in the market’s psychology.
Large Shareholder and Large Scale Redemption Risk: Certain individuals, accounts, funds (including funds affiliated with the Manager) or institutions, including the Manager and its affiliates, may from time to time own or control a substantial amount of the Fund’s shares. There is no requirement that these entities maintain their investment in the Fund. There is a risk that such large shareholders or that the Fund’s shareholders generally may redeem all or a substantial portion of their investments in the Fund in a short period of time, which
PGIM Securitized Credit Fund 67
Notes to Financial Statements (continued)
could have a significant negative impact on the Fund’s NAV, liquidity, and brokerage costs. Large redemptions could also result in tax consequences to shareholders and impact the Fund’s ability to implement its investment strategy. The Fund’s ability to pursue its investment objective after one or more large scale redemptions may be impaired and, as a result, the Fund may invest a larger portion of its assets in cash or cash equivalents.
Leverage Risk: Certain transactions in which the Fund may engage may give rise to leverage. The use of leverage exaggerates the effect of any increase or decrease in the value of the Fund’s holdings, and makes any change in the Fund’s net asset value (“NAV”) greater than it would be without the use of leverage. This could result in increased volatility of investment return. The Fund may be required to pledge its assets or post margin in connection with certain borrowings or derivatives transactions that involve leverage. There is a possibility that posting or pledging a large portion of the assets of the Fund could impede portfolio management or the Fund’s ability to meet redemption requests or other current obligations or that the Fund may be required to dispose of some of its investment at unfavorable prices or times.
Liquidity Risk: Liquidity risk is the risk that the Fund could not meet requests to redeem shares issued by the Fund without significant dilution of remaining investors’ interests in the Fund. The Fund may invest in instruments that trade in lower volumes and are more illiquid than other investments. If the Fund is forced to sell these investments to pay redemption proceeds or for other reasons, the Fund may lose money. In addition, when there is no willing buyer and investments cannot be readily sold at the desired time or price, the Fund may have to accept a lower price or may not be able to sell the instrument at all. An inability to sell a portfolio position can adversely affect the Fund’s value or prevent the Fund from being able to take advantage of other investment opportunities.
Management Risk: The value of your investment may decrease if judgments by the subadviser about the attractiveness, value or market trends affecting a particular security, industry or sector or about market movements are incorrect.
Market Disruption and Geopolitical Risks: Market disruption can be caused by economic, financial or political events and factors, including but not limited to, international wars or conflicts (including Russia’s military invasion of Ukraine), geopolitical developments (including trading and tariff arrangements, sanctions and cybersecurity attacks), instability in regions such as Asia, Eastern Europe and the Middle East, terrorism, natural disasters and public health epidemics (including the outbreak of COVID-19 globally).
The extent and duration of such events and resulting market disruptions cannot be predicted, but could be substantial and could magnify the impact of other risks to the Fund. These and other similar events could adversely affect the U.S. and foreign financial markets
68
and lead to increased market volatility, reduced liquidity in the securities markets, significant negative impacts on issuers and the markets for certain securities and commodities and/or government intervention. They may also cause short- or long-term economic uncertainties in the United States and worldwide. As a result, whether or not the Fund invests in securities of issuers located in or with significant exposure to the countries directly affected, the value and liquidity of the Fund’s investments may be negatively impacted. Further, due to closures of certain markets and restrictions on trading certain securities, the value of certain securities held by the Fund could be significantly impacted, which could lead to such securities being valued at zero.
COVID-19 and the related governmental and public responses have had and may continue to have an impact on the Fund’s investments and net asset value and have led and may continue to lead to increased market volatility and the potential for illiquidity in certain classes of securities and sectors of the market. They have also had and may continue to result in periods of business disruption, business closures, inability to obtain raw materials, supplies and component parts, and reduced or disrupted operations for the issuers in which the Fund invests. The occurrence, reoccurrence and pendency of public health epidemics could adversely affect the economies and financial markets either in specific countries or worldwide.
Market Risk: Securities markets may be volatile and the market prices of the Fund’s securities may decline. Securities fluctuate in price based on changes in an issuer’s financial condition and overall market and economic conditions. If the market prices of the securities owned by the Fund fall, the value of your investment in the Fund will decline.
Mortgage-Backed and Asset-Backed Securities Risk: Mortgage-backed and asset-backed securities tend to increase in value less than other debt securities when interest rates decline, but are subject to similar risk of decline in market value during periods of rising interest rates. The values of mortgage-backed and asset-backed securities become more volatile as interest rates rise. In a period of declining interest rates, the Fund may be required to reinvest more frequent prepayments on mortgage-backed and asset-backed securities in lower-yielding investments.
Reference Rate Risk: The Fund may be exposed to financial instruments that are tied to the London Interbank Offered Rate (“LIBOR”) to determine payment obligations, financing terms, hedging strategies or investment value.
The United Kingdom’s Financial Conduct Authority announced a phase out of LIBOR such that after June 30, 2023, the overnight, 1-month, 3-month, 6-month and 12-month U.S. dollar LIBOR settings will cease to be published or will no longer be representative. All other LIBOR settings and certain other interbank offered rates, such as the Euro Overnight Index Average (“EONIA”), ceased to be published or representative after December 31, 2021. The Fund may have investments linked to other interbank offered rates that may also cease to be published in the future. Various financial industry groups have been planning for the transition away from LIBOR, but there remain challenges to converting certain securities and
PGIM Securitized Credit Fund 69
Notes to Financial Statements (continued)
transactions to a new reference rate (e.g., the Secured Overnight Financing Rate (“SOFR”), which is intended to replace the U.S. dollar LIBOR).
Neither the effect of the LIBOR transition process nor its ultimate success can yet be known. The transition process might lead to increased volatility and illiquidity in markets for instruments whose terms currently include LIBOR as well as loan facilities used by the Fund. While some existing LIBOR-based instruments may contemplate a scenario where LIBOR is no longer available by providing for an alternative rate-setting methodology, there may be significant uncertainty regarding the effectiveness of any such alternative methodologies to replicate LIBOR. Not all existing LIBOR-based instruments may have alternative rate-setting provisions and there remains uncertainty regarding the willingness and ability of issuers to add alternative rate-setting provisions in certain existing instruments. Global regulators have advised market participants to cease entering into new contracts using LIBOR as a reference rate, and it is possible that investments in LIBOR-based instruments could invite regulatory scrutiny. There may also be challenges for the Fund to enter into hedging transactions against such newly-issued instruments until a market for such hedging transactions develops. All of the aforementioned may adversely affect the Fund’s performance or net asset value.
Structured Products Risk: Holders of structured product securities bear risks of the underlying investments, index or reference obligation. Certain structured products may be thinly traded or have a limited trading market, and as a result may be characterized as illiquid. The possible lack of a liquid secondary market for structured securities and the resulting inability of the Fund to sell a structured security could expose the Fund to losses and could make structured securities more difficult for the Fund to value accurately, which may also result in additional costs. Structured products are also subject to credit risk; the assets backing the structured product may be insufficient to pay interest or principal. In addition to the general risks associated with investments in fixed income, structured products carry additional risks, including, but not limited to: the possibility that distributions from collateral securities will not be adequate to make interest or other payments; the quality of the collateral may decline in value or default; and the possibility that the structured products are subordinate to other classes. Structured securities are generally privately negotiated debt obligations where the principal and/or interest or value of the structured security is determined by reference to the performance of a specific asset, benchmark asset, market or interest rate (“reference instrument”), and changes in the reference instrument or security may cause significant price fluctuations, or could cause the interest rate on the structured security to be reduced to zero. Holders of structured products indirectly bear risks associated with the reference instrument, are subject to counterparty risk and typically do not have direct rights against the reference instrument. Structured products may also entail structural complexity and documentation risk and there is no
70
guarantee that the courts or administrators will interpret the priority of principal and interest payments as expected.
U.S. Government and Agency Securities Risk: U.S. Government and agency securities are subject to market risk, interest rate risk and credit risk. Not all U.S. Government securities are insured or guaranteed by the full faith and credit of the U.S. Government; some are only insured or guaranteed by the issuing agency, which must rely on its own resources to repay the debt. Some agency securities carry no guarantee whatsoever and the risk of default associated with these securities would be borne by the Fund. The maximum potential liability of the issuers of some U.S. Government securities held by the Fund may greatly exceed their current resources, including their legal right to support from the U.S. Treasury. No assurance can be given that the U.S. Government would provide financial support to any such issuers if it is not obligated to do so by law. It is possible that these issuers will not have the funds to meet their payment obligations in the future. In addition, the value of U.S. Government securities may be affected by changes in the credit rating of the U.S. Government.
| 10. | Recent Accounting Pronouncement and Regulatory Developments |
In March 2020, the FASB issued Accounting Standard Update (“ASU”) No. 2020-04, which provides optional guidance for applying GAAP to contract modifications, hedging relationships and other transactions affected by the reference rate reform if certain criteria are met. ASU 2020-04 is elective and is effective on March 12, 2020 through December 31, 2022. Management does not expect ASU 2020-04 to have a material impact on the financial statements.
PGIM Securitized Credit Fund 71
Report of Independent Registered Public Accounting Firm
To the Board of Trustees of Prudential Investment Portfolios 8 and Shareholders of PGIM Securitized Credit Fund
Opinion on the Financial Statements
We have audited the accompanying statement of assets and liabilities, including the schedule of investments, of PGIM Securitized Credit Fund (one of the funds constituting Prudential Investment Portfolios 8, referred to hereafter as the “Fund”) as of September 30, 2022, the related statement of operations for the year ended September 30, 2022, the statements of changes in net assets for each of the two years in the period ended September 30, 2022, including the related notes, and the financial highlights for each of the three years in the period ended September 30, 2022 (collectively referred to as the “financial statements”). In our opinion, the financial statements present fairly, in all material respects, the financial position of the Fund as of September 30, 2022, the results of its operations for the year then ended, the changes in its net assets for each of the two years in the period ended September 30, 2022 and the financial highlights for each of the three years in the period ended September 30, 2022 in conformity with accounting principles generally accepted in the United States of America.
The financial statements of the Fund as of September 30, 2019 and for the period July 1, 2019 (commencement of operations) through September 30, 2019 and the financial highlights for the period July 1, 2019 (commencement of operations) through September 30, 2019 (not presented herein, other than the financial highlights) were audited by other auditors whose report dated November 15, 2019 expressed an unqualified opinion on those financial statements and financial highlights.
Basis for Opinion
These financial statements are the responsibility of the Fund’s management. Our responsibility is to express an opinion on the Fund’s financial statements based on our audits. We are a public accounting firm registered with the Public Company Accounting Oversight Board (United States) (PCAOB) and are required to be independent with respect to the Fund in accordance with the U.S. federal securities laws and the applicable rules and regulations of the Securities and Exchange Commission and the PCAOB.
We conducted our audits of these financial statements in accordance with the standards of the PCAOB. Those standards require that we plan and perform the audit to obtain reasonable assurance about whether the financial statements are free of material misstatement, whether due to error or fraud.
Our audits included performing procedures to assess the risks of material misstatement of the financial statements, whether due to error or fraud, and performing procedures that respond to those risks. Such procedures included examining, on a test basis, evidence regarding the amounts and disclosures in the financial statements. Our audits also included evaluating the accounting principles used and significant estimates made by management, as well as evaluating the overall presentation of the financial statements. Our procedures included confirmation of securities owned as of September 30, 2022 by correspondence with the custodian, transfer agent and brokers; when replies were not received from brokers, we performed other auditing procedures. We believe that our audits provide a reasonable basis for our opinion.
/s/PricewaterhouseCoopers LLP
New York, New York
November 17, 2022
We have served as the auditor of one or more investment companies in the PGIM Retail Funds complex since 2020.
72
Tax Information (unaudited)
For the year ended September 30, 2022, the Fund reports the maximum amount allowable but not less than 53.99% as interest-related dividends in accordance with Section 871(k)(1) and 881(e)(1) of the Internal Revenue Code.
In January 2023, you will be advised on IRS Form 1099-DIV or substitute 1099-DIV, as to the federal tax status of dividends and distributions received by you in calendar year 2022.
PGIM Securitized Credit Fund 73
INFORMATION ABOUT BOARD MEMBERS AND OFFICERS (unaudited)
Information about Board Members and Officers of the Fund is set forth below. Board Members who are not deemed to be “interested persons” of the Fund, as defined in the 1940 Act, are referred to as “Independent Board Members.” Board Members who are deemed to be “interested persons” of the Fund are referred to as “Interested Board Members.” The Board Members are responsible for the overall supervision of the operations of the Fund and perform the various duties imposed on the directors of investment companies by the 1940 Act. The Board in turn elects the Officers, who are responsible for administering the day-to-day operations of the Fund.
| | | | | | |
| | | |
| Independent Board Members | | | | |
| | | | |
Name Year of Birth Position(s) Portfolios Overseen | | Principal Occupation(s) During Past Five Years | | Other Directorships Held During Past Five Years | | Length of
Board Service |
| | | | |
Ellen S. Alberding 1958 Board Member Portfolios Overseen: 97 | | President and Board Member, The Joyce Foundation (charitable foundation) (since 2002); formerly Vice Chair, City Colleges of Chicago (community college system) (2011-2015); Trustee, National Park Foundation (charitable foundation for national park system) (2009-2018); Trustee, Economic Club of Chicago (2009-2016); Trustee, Loyola University (since 2018). | | None. | | Since September 2013 |
| | | | |
Kevin J. Bannon 1952 Board Member Portfolios Overseen: 97 | | Retired; formerly Managing Director (April 2008-May 2015) and Chief Investment Officer (October 2008-November 2013) of Highmount Capital LLC (registered investment adviser); formerly Executive Vice President and Chief Investment Officer (April 1993-August 2007) of Bank of New York Company; President (May 2003-May 2007) of BNY Hamilton Family of Mutual Funds. | | Director of Urstadt Biddle Properties (equity real estate investment trust) (since September 2008). | | Since July 2008 |
PGIM Securitized Credit Fund
| | | | | | |
| | | |
| Independent Board Members | | | | |
| | | | |
Name Year of Birth Position(s) Portfolios Overseen | | Principal Occupation(s) During Past Five Years | | Other Directorships Held During Past Five Years | | Length of
Board Service |
| | | | |
Linda W. Bynoe 1952 Board Member Portfolios Overseen: 94 | | President and Chief Executive Officer (since March 1995) and formerly Chief Operating Officer (December 1989-February 1995) of Telemat Limited LLC (formerly Telemat Ltd) (management consulting); formerly Vice President (January 1985-June 1989) at Morgan Stanley & Co. (broker-dealer). | | Trustee of Equity Residential (residential real estate) (since December 2009); Director of Northern Trust Corporation (financial services) (since April 2006); formerly Director of Anixter International, Inc. (communication products distributor) (January 2006-June 2020). | | Since March 2005 |
| | | | |
Barry H. Evans 1960 Board Member Portfolios Overseen: 96 | | Retired; formerly President (2005-2016), Global Chief Operating Officer (2014-2016), Chief Investment Officer - Global Head of Fixed Income (1998-2014), and various portfolio manager roles (1986-2006), Manulife Asset Management (asset management). | | Formerly Director, Manulife Trust Company (2011-2018); formerly Director, Manulife Asset Management Limited (2015-2017); formerly Chairman of the Board of Directors of Manulife Asset Management U.S. (2005-2016); formerly Chairman of the Board, Declaration Investment Management and Research (2008-2016). | | Since September 2017 |
| | | | |
Keith F. Hartstein 1956 Board Member & Independent Chair Portfolios Overseen: 97 | | Retired; Member (November 2014-September 2022) of the Governing Council of the Independent Directors Council (IDC) (organization of independent mutual fund directors); formerly Executive Committee of the IDC Board of Governors (October 2019-December 2021); formerly President and Chief Executive Officer (2005-2012), Senior Vice President (2004-2005), Senior Vice President of Sales and Marketing (1997-2004), and various executive management positions (1990-1997), John Hancock Funds, LLC (asset management); Chairman, Investment Company Institute’s Sales Force Marketing Committee (2003-2008). | | None. | | Since September 2013 |
Visit our website at pgim.com/investments
| | | | | | |
| | | |
| Independent Board Members | | | | |
| | | | |
Name Year of Birth Position(s) Portfolios Overseen | | Principal Occupation(s) During Past Five Years | | Other Directorships Held During Past Five Years | | Length of
Board Service |
| | | | |
Laurie Simon Hodrick 1962 Board Member Portfolios Overseen: 93 | | A. Barton Hepburn Professor Emerita of Economics in the Faculty of Business, Columbia Business School (since 2018); Visiting Fellow at the Hoover Institution, Stanford University (since 2015); Sole Member, ReidCourt LLC (since 2008) (a consulting firm); formerly Visiting Professor of Law, Stanford Law School (2015-2021); formerly A. Barton Hepburn Professor of Economics in the Faculty of Business, Columbia Business School (1996-2017); formerly Managing Director, Global Head of Alternative Investment Strategies, Deutsche Bank (2006-2008). | | Independent Director, Andela (since January 2022) (global talent network); Independent Director, Roku (since December 2020) (communication services); formerly Independent Director, Synnex Corporation (2019-2021) (information technology); formerly Independent Director, Kabbage, Inc. (2018-2020) (financial services); formerly Independent Director, Corporate Capital Trust (2017-2018) (a business development company). | | Since September 2017 |
| | | | |
Brian K. Reid 1961 Board Member Portfolios Overseen: 96 | | Retired; formerly Chief Economist for the Investment Company Institute (ICI) (2005-2017); formerly Senior Economist and Director of Industry and Financial Analysis at the ICI (1998-2004); formerly Senior Economist, Industry and Financial Analysis at the ICI (1996-1998); formerly Staff Economist at the Federal Reserve Board (1989-1996); Director, ICI Mutual Insurance Company (2012-2017). | | None. | | Since March 2018 |
PGIM Securitized Credit Fund
| | | | | | |
| | | |
Independent Board Members | | | | |
| | | | |
Name Year of Birth Position(s) Portfolios Overseen | | Principal Occupation(s) During Past Five Years | | Other Directorships Held During Past Five Years | | Length of
Board Service |
| | | | |
Grace C. Torres 1959 Board Member Portfolios Overseen: 96 | | Retired; formerly Treasurer and Principal Financial and Accounting Officer of the PGIM Funds, Target Funds, Advanced Series Trust, Prudential Variable Contract Accounts and The Prudential Series Fund (1998-June 2014); Assistant Treasurer (March 1999-June 2014) and Senior Vice President (September 1999-June 2014) of PGIM Investments LLC; Assistant Treasurer (May 2003-June 2014) and Vice President (June 2005-June 2014) of AST Investment Services, Inc.; Senior Vice President and Assistant Treasurer (May 2003-June 2014) of Prudential Annuities Advisory Services, Inc. | | Director (since January 2018) of OceanFirst Financial Corp. and OceanFirst Bank; formerly Director (July 2015-January 2018) of Sun Bancorp, Inc. N.A. and Sun National Bank. | | Since November 2014 |
Visit our website at pgim.com/investments
| | | | | | |
| | |
Interested Board Members | | |
| | | | |
Name Year of Birth Position(s) Portfolios Overseen | | Principal Occupation(s) During Past Five Years | | Other Directorships Held During Past Five Years | | Length of Board Service |
| | | | |
Stuart S. Parker 1962 Board Member & President Portfolios Overseen: 96 | | President, Chief Executive Officer, Chief Operating Officer and Officer in Charge of PGIM Investments LLC (formerly known as Prudential Investments LLC) (since January 2012); President and Principal Executive Officer ("PEO") (since September 2022) of the PGIM Private Credit Fund; President and PEO (since March 2022) of the PGIM Private Real Estate Fund, Inc.; formerly Executive Vice President of Jennison Associates LLC and Head of Retail Distribution of PGIM Investments LLC (June 2005-December 2011); Investment Company Institute - Board of Governors (since May 2012). | | None. | | Since January 2012 |
| | | | |
Scott E. Benjamin 1973 Board Member & Vice President Portfolios Overseen: 97 | | Executive Vice President (since May 2009) of PGIM Investments LLC; Vice President (since June 2012) of Prudential Investment Management Services LLC; Executive Vice President (since September 2009) of AST Investment Services, Inc.; Senior Vice President of Product Development and Marketing, PGIM Investments (since February 2006); Vice President (since September 2022) of the PGIM Private Credit Fund; Vice President (since March 2022) of the PGIM Private Real Estate Fund, Inc.; formerly Vice President of Product Development and Product Management, PGIM Investments LLC (2003-2006). | | None. | | Since March 2010 |
PGIM Securitized Credit Fund
| | | | |
| | | |
| Fund Officers(a) | | | | |
| | | |
Name Year of Birth Fund Position | | Principal Occupation(s) During Past Five Years | | Length of Service as Fund Officer |
| | | |
Claudia DiGiacomo 1974 Chief Legal Officer | | Chief Legal Officer (since September 2022) of the PGIM Private Credit Fund; Chief Legal Officer (since July 2022) of the PGIM Private Real Estate Fund, Inc.; Chief Legal Officer, Executive Vice President and Secretary of PGIM Investments LLC (since August 2020); Chief Legal Officer of Prudential Mutual Fund Services LLC (since August 2020); Chief Legal Officer of PIFM Holdco, LLC (since August 2020); Vice President and Corporate Counsel (since January 2005) of Prudential; and Corporate Counsel of AST Investment Services, Inc. (since August 2020); formerly Vice President and Assistant Secretary of PGIM Investments LLC (2005-2020); formerly Associate at Sidley Austin Brown & Wood LLP (1999-2004). | | Since December 2005 |
| | | |
Isabelle Sajous 1976 Chief Compliance Officer | | Chief Compliance Officer (since April 2022) of PGIM Investments LLC, the PGIM Funds, Target Funds, PGIM ETF Trust, PGIM Global High Yield Fund, Inc., PGIM High Yield Bond Fund, Inc., PGIM Short Duration High Yield Opportunities Fund, Advanced Series Trust, The Prudential Series Fund and Prudential’s Gibraltar Fund, Inc.; Chief Compliance Officer (since September 2022) of the PGIM Private Credit Fund; Chief Compliance Officer (since March 2022) of the PGIM Private Real Estate Fund, Inc.; Vice President, Compliance of PGIM Investments LLC (since December 2020); formerly Director, Compliance (July 2018-December 2020) of Credit Suisse Asset Management LLC; and Vice President, Associate General Counsel & Deputy Chief Compliance Officer of Cramer Rosenthal McGlynn, LLC (August 2014-July 2018). | | Since April 2022 |
| | | |
Andrew R. French 1962 Secretary | | Vice President (since December 2018) of PGIM Investments LLC; Secretary (since September 2022) of the PGIM Private Credit Fund; Secretary (since March 2022) of the PGIM Private Real Estate Fund, Inc.; formerly Vice President and Corporate Counsel (2010-2018) of Prudential; formerly Director and Corporate Counsel (2006-2010) of Prudential; Vice President and Assistant Secretary (since January 2007) of PGIM Investments LLC; Vice President and Assistant Secretary (since January 2007) of Prudential Mutual Fund Services LLC. | | Since October 2006 |
| | | |
Melissa Gonzalez 1980 Assistant Secretary | | Vice President and Corporate Counsel (since September 2018) of Prudential; Vice President and Assistant Secretary (since August 2020) of PGIM Investments LLC; Assistant Secretary (since September 2022) of the PGIM Private Credit Fund; Assistant Secretary (since March 2022) of the PGIM Private Real Estate Fund, Inc.; formerly Director and Corporate Counsel (March 2014-September 2018) of Prudential. | | Since March 2020 |
Visit our website at pgim.com/investments
| | | | |
| | | |
| Fund Officers(a) | | | | |
| | | |
Name Year of Birth Fund Position | | Principal Occupation(s) During Past Five Years | | Length of Service as Fund Officer |
| | | |
Patrick E. McGuinness 1986 Assistant Secretary | | Vice President and Assistant Secretary (since August 2020) of PGIM Investments LLC; Director and Corporate Counsel (since February 2017) of Prudential; Assistant Secretary (since September 2022) of the PGIM Private Credit Fund; Assistant Secretary (since March 2022) of the PGIM Private Real Estate Fund, Inc. | | Since June 2020 |
| | | |
Debra Rubano 1975 Assistant Secretary | | Vice President and Corporate Counsel (since November 2020) of Prudential; Assistant Secretary (since September 2022) of the PGIM Private Credit Fund; Assistant Secretary (since March 2022) of the PGIM Private Real Estate Fund, Inc; formerly Director and Senior Counsel of Allianz Global Investors U.S. Holdings LLC (2010-2020) and Assistant Secretary of numerous funds in the Allianz fund complex (2015-2020). | | Since December 2020 |
| | | |
Kelly A. Coyne 1968 Assistant Secretary | | Director, Investment Operations of Prudential Mutual Fund Services LLC (since 2010); Assistant Secretary (since September 2022) of the PGIM Private Credit Fund; Assistant Secretary (since March 2022) of the PGIM Private Real Estate Fund, Inc. | | Since March 2015 |
| | | |
Christian J. Kelly 1975 Treasurer and Principal Financial and Accounting Officer | | Vice President, Head of Fund Administration of PGIM Investments LLC (since November 2018); Principal Financial Officer (since September 2022) of the PGIM Private Credit Fund; Principal Financial Officer (since March 2022) of the PGIM Private Real Estate Fund, Inc.; formerly, Treasurer and Principal Accounting Officer (March 2022- July 2022) of the PGIM Private Real Estate Fund, Inc.; formerly Director of Fund Administration of Lord Abbett & Co. LLC (2009-2018), Treasurer and Principal Accounting Officer of the Lord Abbett Family of Funds (2017-2018); Director of Accounting, Avenue Capital Group (2008-2009); Senior Manager, Investment Management Practice of Deloitte & Touche LLP (1998-2007). | | Since January 2019 |
| | | |
Lana Lomuti 1967 Assistant Treasurer | | Vice President (since 2007) and Director (2005-2007), within PGIM Investments Fund Administration; formerly Assistant Treasurer (December 2007-February 2014) of The Greater China Fund, Inc. | | Since April 2014 |
| | | |
Russ Shupak 1973 Assistant Treasurer | | Vice President (since 2017) and Director (2013-2017), within PGIM Investments Fund Administration; Treasurer and Principal Accounting Officer (since July 2022) of the PGIM Private Real Estate Fund, Inc.; Assistant Treasurer (since September 2022) of the PGIM Private Credit Fund; formerly Assistant Treasurer (March 2022 – July 2022) of the PGIM Private Real Estate Fund, Inc. | | Since October 2019 |
| | | |
Deborah Conway 1969 Assistant Treasurer | | Vice President (since 2017) and Director (2007-2017), within PGIM Investments Fund Administration. | | Since October 2019 |
PGIM Securitized Credit Fund
| | | | |
| | | |
| Fund Officers(a) | | | | |
| | | |
Name Year of Birth Fund Position | | Principal Occupation(s) During Past Five Years | | Length of Service as Fund Officer |
| | | |
Elyse M. McLaughlin 1974 Assistant Treasurer | | Vice President (since 2017) and Director (2011-2017), within PGIM Investments Fund Administration; Treasurer and Principal Accounting Officer (since September 2022) of the PGIM Private Credit Fund; Assistant Treasurer (since March 2022) of the PGIM Private Real Estate Fund, Inc. | | Since October 2019 |
| | | |
Kelly Florio 1978 Anti-Money Laundering Compliance Officer | | Vice President, Corporate Compliance, Global Compliance Programs and Compliance Risk Management (since December 2021) of Prudential; formerly, Head of Fraud Risk Management (October 2019 to December 2021) at New York Life Insurance Company; formerly, Head of Key Risk Area Operations (November 2018 to October 2019), Director of the US Anti-Money Laundering Compliance Unit (2009-2018) and Bank Loss Prevention Associate (2006 -2009) at MetLife. | | Since June 2022 |
| (a) | Excludes Mr. Parker and Mr. Benjamin, interested Board Members who also serve as President and Vice President, respectively. |
Explanatory Notes to Tables:
| ∎ | | Board Members are deemed to be “Interested,” as defined in the 1940 Act, by reason of their affiliation with PGIM Investments LLC and/or an affiliate of PGIM Investments LLC. |
| ∎ | | Unless otherwise noted, the address of all Board Members and Officers is c/o PGIM Investments LLC, 655 Broad Street, Newark, New Jersey 07102-4410. |
| ∎ | | There is no set term of office for Board Members or Officers. The Board Members have adopted a retirement policy, which calls for the retirement of Board Members on December 31 of the year in which they reach the age of 75. |
| ∎ | | “Other Directorships Held” includes all directorships of companies required to register or file reports with the SEC under the 1934 Act (that is, “public companies”) or other investment companies registered under the 1940 Act. |
| ∎ | | “Portfolios Overseen” includes all investment companies managed by PGIM Investments LLC. The investment companies for which PGIM Investments LLC serves as manager include the PGIM Mutual Funds, Target Funds, The Prudential Variable Contract Accounts, PGIM ETF Trust, PGIM Private Real Estate Fund, Inc., PGIM Private Credit Fund, PGIM High Yield Bond Fund, Inc., PGIM Global High Yield Fund, Inc., PGIM Short Duration High Yield Opportunities Fund, The Prudential Series Fund, Prudential’s Gibraltar Fund, Inc. and the Advanced Series Trust. |
| ∎ | | As used in the Fund Officers table “Prudential” means The Prudential Insurance Company of America. |
Visit our website at pgim.com/investments
Approval of Advisory Agreements (unaudited)
The Fund’s Board of Trustees
The Board of Trustees (the “Board”) of PGIM Securitized Credit Fund (the “Fund”)1 consists of ten individuals, eight of whom are not “interested persons” of the Fund, as defined in the Investment Company Act of 1940, as amended (the “1940 Act”) (the “Independent Trustees”). The Board is responsible for the oversight of the Fund and its operations, and performs the various duties imposed on the directors of investment companies by the 1940 Act. The Independent Trustees have retained independent legal counsel to assist them in connection with their duties. The Chair of the Board is an Independent Trustee. The Board has established five standing committees: the Audit Committee, the Nominating and Governance Committee, the Compliance Committee and two Investment Committees. Each committee is chaired by, and composed of, Independent Trustees.
Annual Approval of the Fund’s Advisory Agreements
As required under the 1940 Act, the Board determines annually whether to renew the Fund’s management agreement with PGIM Investments LLC (“PGIM Investments”), the Fund’s subadvisory agreement with PGIM, Inc. (“PGIM”), on behalf of its PGIM Fixed Income unit (“PGIM Fixed Income”), and PGIM Limited (“PGIML”). In considering the renewal of the agreements, the Board, including all of the Independent Trustees, met on May 26 and June 7-9, 2022 (the “Board Meeting”) and approved the renewal of the agreements through July 31, 2023, after concluding that the renewal of the agreements was in the best interests of the Fund and its shareholders.
In advance of the meetings, the Board requested and received materials relating to the agreements, and had the opportunity to ask questions and request further information in connection with its consideration. Among other things, the Board considered comparative fee information from PGIM Investments, PGIM, and where appropriate, affiliates of PGIM. Also, the Board considered comparisons with other mutual funds in relevant Peer Universes and Peer Groups, as is further discussed below.
In approving the agreements, the Board, including the Independent Trustees advised by independent legal counsel, considered the factors it deemed relevant, including the nature, quality and extent of services provided by PGIM Investments, the subadvisers and, as relevant, its affiliates, the performance of the Fund, the profitability of PGIM Investments and its affiliates, expenses and fees, and the potential for economies of scale that may be shared with the Fund and its shareholders as the Fund’s assets grow. In their deliberations, the Trustees did not identify any single factor which alone was responsible for the Board’s decision to approve the agreements with respect to the Fund. In connection with its deliberations, the Board considered information provided by PGIM Investments throughout the year at regular Board meetings, presentations from portfolio managers and other information, as well as information furnished at or in advance of the Board Meeting.
1PGIM Securitized Credit Fund is a series of Prudential Investment Portfolios 8.
PGIM Securitized Credit Fund
Approval of Advisory Agreements (continued)
The Trustees determined that the overall arrangements between the Fund and PGIM Investments, which serves as the Fund’s investment manager pursuant to a management agreement, and between PGIM Investments, PGIML and PGIM (through its PGIM Fixed Income unit), which serve as the Fund’s subadvisers pursuant to the terms of a subadvisory agreement with PGIM Investments, are in the best interests of the Fund and its shareholders in light of the services performed, fees charged and such other matters as the Trustees considered relevant in the exercise of their business judgment.
The material factors and conclusions that formed the basis for the Trustees’ reaching their determinations to approve the continuance of the agreements are separately discussed below.
Nature, Quality and Extent of Services
The Board received and considered information regarding the nature, quality and extent of services provided to the Fund by PGIM Investments, PGIM Fixed Income, and PGIML. The Board noted that PGIM Fixed Income and PGIML are affiliated with PGIM Investments. The Board considered the services provided by PGIM Investments, including but not limited to the oversight of the subadvisers for the Fund, as well as the provision of fund recordkeeping, compliance and other services to the Fund, and PGIM Investments’ role as administrator for the Fund’s liquidity risk management program. With respect to PGIM Investments’ oversight of the subadvisers, the Board noted that PGIM Investments’ Strategic Investment Research Group (“SIRG”), which is a business unit of PGIM Investments, is responsible for monitoring and reporting to PGIM Investments senior management on the performance and operations of the subadvisers. The Board also considered that PGIM Investments pays the salaries of all of the officers and interested Trustees of the Fund who are part of Fund management. The Board also considered the investment subadvisory services provided by PGIM Fixed Income and PGIML, including investment research and security selection, as well as adherence to the Fund’s investment restrictions and compliance with applicable Fund policies and procedures. The Board considered PGIM Investments’ evaluation of the subadvisers, as well as PGIM Investments’ recommendation, based on its review of the subadvisers, to renew the subadvisory agreement.
The Board considered the qualifications, backgrounds and responsibilities of PGIM Investments’ senior management responsible for the oversight of the Fund, PGIM Fixed Income, and PGIML, and also considered the qualifications, backgrounds and responsibilities of PGIM Fixed Income’s portfolio managers who are responsible for the day-to-day management of the Fund’s portfolio. The Board was provided with information pertaining to PGIM Investments’, PGIM Fixed Income’s, and PGIML’s organizational structure, senior management, investment operations, and other relevant information pertaining to PGIM Investments, PGIM Fixed Income, and PGIML. The Board also noted that it received favorable compliance reports from the Fund’s Chief Compliance Officer (“CCO”) as to PGIM Investments, PGIM Fixed Income, and PGIML.
Visit our website at pgim.com/investments
The Board concluded that it was satisfied with the nature, extent and quality of the investment management services provided by PGIM Investments, the subadvisory services provided to the Fund by PGIM Fixed Income, and PGIML, and that there was a reasonable basis on which to conclude that the Fund benefits from the services provided by PGIM Investments, PGIM Fixed Income, and PGIML under the management and subadvisory agreement.
Costs of Services and Profits Realized by PGIM Investments
The Board was provided with information on the profitability of PGIM Investments and its affiliates in serving as the Fund’s investment manager. The Board discussed with PGIM Investments the methodology utilized in assembling the information regarding profitability and considered its reasonableness. The Board recognized that it is difficult to make comparisons of profitability from fund management contracts because comparative information is not generally publicly available and is affected by numerous factors, including the structure of the particular adviser, the types of funds it manages, its business mix, numerous assumptions regarding allocations and the adviser’s capital structure and cost of capital. However, the Board considered that the cost of services provided by PGIM Investments to the Fund during the year ended December 31, 2021 exceeded the management fees paid by the Fund, resulting in an operating loss to PGIM Investments. Taking these factors into account, the Board concluded that the profitability of PGIM Investments and its affiliates in relation to the services rendered was not unreasonable.
Economies of Scale
The Board received and discussed information concerning economies of scale that PGIM Investments may realize as the Fund’s assets grow beyond current levels. The Board noted that the management fee schedule for the Fund includes breakpoints, which have the effect of decreasing the fee rate as assets increase. During the course of time, the Board has considered information regarding the launch date of the Fund, the management fees of the Fund compared to those of similarly managed funds and PGIM Investments’ investment in the Fund over time. The Board noted that economies of scale can be shared with the Fund in other ways, including low management fees from inception, additional technological and personnel investments to enhance shareholder services, and maintaining existing expense structures in the face of a rising cost environment. The Board also considered PGIM Investments’ assertion that it continually evaluates the management fee schedule of the Fund and the potential to share economies of scale through breakpoints or fee waivers as asset levels increase.
The Board recognized the inherent limitations of any analysis of economies of scale, stemming largely from the Board’s understanding that most of PGIM Investments’ costs are not specific to individual funds, but rather are incurred across a variety of products and services.
PGIM Securitized Credit Fund
Approval of Advisory Agreements (continued)
Other Benefits to PGIM Investments, PGIM Fixed Income and PGIML
The Board considered potential ancillary benefits that might be received by PGIM Investments, PGIM Fixed Income, PGIML and their affiliates as a result of their relationship with the Fund. The Board concluded that potential benefits to be derived by PGIM Investments included transfer agency fees received by the Fund’s transfer agent (which is affiliated with PGIM Investments), as well as benefits to its reputation or other intangible benefits resulting from PGIM Investments’ association with the Fund. The Board concluded that the potential benefits to be derived by PGIM Fixed Income and PGIML included the ability to use soft dollar credits, as well as the potential benefits consistent with those generally resulting from an increase in assets under management, specifically, potential access to additional research resources and benefits to their reputations. The Board concluded that the benefits derived by PGIM Investments, PGIM Fixed Income, and PGIML were consistent with the types of benefits generally derived by investment managers and subadvisers to mutual funds.
Performance of the Fund / Fees and Expenses
The Board considered certain additional factors and made related conclusions relating to the historical performance of the Fund for the one-, three- and five-year periods ended December 31, 2021.2 The Board considered that performance information was available as of November 16, 2015 and that longer-term performance was not yet available.
The Board also considered the Fund’s actual management fee, as well as the Fund’s net total expense ratio, for the fiscal year ended September 30, 2021. The Board considered the management fee for the Fund as compared to the management fee charged by PGIM Investments to other funds and the fee charged by other advisers to comparable mutual funds in a Peer Group. The actual management fee represents the fee rate actually paid by Fund shareholders and includes any fee waivers or reimbursements. The net total expense ratio for the Fund represents the actual expense ratio incurred by Fund shareholders.
The mutual funds included in the Peer Universe, which was used to consider performance, and the Peer Group, which was used to consider expenses and fees, were objectively determined by Broadridge, an independent provider of mutual fund data. In certain circumstances, PGIM Investments also provided supplemental Peer Universe or Peer Group information, for reasons addressed with the Board. The comparisons placed the Fund in various quartiles over various periods, with the first quartile being the best 25% of the mutual funds (for performance, the best performing mutual funds and, for expenses, the lowest cost mutual funds).
2 For periods prior to July 1, 2019, the Fund’s performance is that of an investment trust (the “Predecessor Fund”), which commenced operations on November 16, 2015. The performance of the Predecessor Fund has been adjusted to reflect the fees and expenses for the Class Z shares of the Fund.
Visit our website at pgim.com/investments
The section below summarizes key factors considered by the Board and the Board’s conclusions regarding the Fund’s performance, fees and overall expenses. The table sets forth net performance comparisons (which reflect the impact on performance of fund expenses, or any subsidies, expense caps or waivers that may be applicable) with the Peer Universe, actual management fees with the Peer Group (which reflect the impact of any subsidies or fee waivers), and net total expenses with the Peer Group, each of which were key factors considered by the Board.
| | | | | | | | |
| | | | | |
Net Performance | | 1 Year | | 3 Years | | 5 Years | | 10 Years |
| | | | | |
| | | 1st Quartile | | 3rd Quartile | | 2nd Quartile | | N/A |
| |
Actual Management Fees: 1st Quartile |
| |
Net Total Expenses: 1st Quartile |
| · | | The Board noted that the Fund outperformed its benchmark index over all periods. |
| · | | The Board considered PGIM Investments’ assertion that peer-relative performance comparisons are challenging for this Fund as its Lipper Peer Universe is more akin to a “catch-all” bucket for credit strategies that do not align elsewhere in the Lipper universe and so benchmark-relative comparisons are more appropriate. |
| · | | The Board noted that for periods prior to July 1, 2019, the Fund’s performance is that of a predecessor fund, performance information was available as of November 16, 2015. |
| · | | The Board and PGIM Investments agreed to retain the existing contractual expense cap, which (exclusive of certain fees and expenses) caps total annual fund operating expenses after fee waivers and/or expense reimbursements to 0.90% of average daily net assets for Class A shares, 1.65% of average daily net assets for Class C shares, 0.65% of average daily net assets for Class Z shares, and 0.60% of average daily net assets for Class R6 shares through January 31, 2023. |
| · | | In addition, PGIM Investments will waive management fees or shared operating expenses on any share class to the same extent that it waives such expenses on any other share class, and has agreed that total annual fund operating expenses for Class R6 shares will not exceed total annual fund operating expenses for Class Z shares. |
| · | | The Board concluded that, in light of the above, it would be in the best interests of the Fund and its shareholders and to renew the agreements. |
| · | | The Board concluded that the management fees (including subadvisory fees) and total expenses were reasonable in light of the services provided. |
* * *
After full consideration of these factors, the Board concluded that the approval of the agreements was in the best interests of the Fund and its shareholders.
PGIM Securitized Credit Fund
| | | | |
| | | |
| ⬛ MAIL | | ⬛ TELEPHONE | | ⬛ WEBSITE |
| | | |
655 Broad Street Newark, NJ 07102 | | (800) 225-1852 | | pgim.com/investments |
|
| |
PROXY VOTING |
| |
| The Board of Trustees of the Fund has delegated to the Fund’s subadvisers the responsibility for voting any proxies and maintaining proxy recordkeeping with respect to the Fund. A description of these proxy voting policies and procedures is available without charge, upon request, by calling (800) 225-1852 or by visiting the Securities and Exchange Commission’s website at sec.gov. Information regarding how the Fund voted proxies relating to portfolio securities during the most recent 12-month period ended June 30 is available on the Fund’s website and on the Securities and Exchange Commission’s website. |
|
| |
TRUSTEES |
| |
| Ellen S. Alberding ● Kevin J. Bannon ● Scott E. Benjamin ● Linda W. Bynoe ● Barry H. Evans ● Keith F. Hartstein ● Laurie Simon Hodrick ● Stuart S. Parker ● Brian K. Reid ● Grace C. Torres |
|
| |
OFFICERS |
| |
| Stuart S. Parker, President ● Scott E. Benjamin, Vice President ● Christian J. Kelly, Treasurer and Principal Financial and Accounting Officer ● Claudia DiGiacomo, Chief Legal Officer ● Isabelle Sajous, Chief Compliance Officer ● Kelly Florio, Anti-Money Laundering Compliance Officer ● Andrew R. French, Secretary ● Melissa Gonzalez, Assistant Secretary ● Kelly A. Coyne, Assistant Secretary ● Patrick E. McGuinness, Assistant Secretary ● Debra Rubano, Assistant Secretary ● Lana Lomuti, Assistant Treasurer ● Russ Shupak, Assistant Treasurer ● Elyse M. McLaughlin, Assistant Treasurer ● Deborah Conway, Assistant Treasurer |
| | | | |
| | |
MANAGER | | PGIM Investments LLC | | 655 Broad Street Newark, NJ 07102 |
| | |
SUBADVISERS | | PGIM Fixed Income | | 655 Broad Street Newark, NJ 07102 |
| | |
| | | PGIM Limited | | Grand Buildings, 1-3 Strand Trafalgar Square London, WC2N 5HR United Kingdom |
| | |
DISTRIBUTOR | | Prudential Investment Management Services LLC | | 655 Broad Street Newark, NJ 07102 |
| | |
CUSTODIAN | | The Bank of New York Mellon | | 240 Greenwich Street New York, NY 10286 |
| | |
TRANSFER AGENT | | Prudential Mutual Fund Services LLC | | PO Box 9658 Providence, RI 02940 |
| | |
| INDEPENDENT REGISTERED PUBLIC ACCOUNTING FIRM | | PricewaterhouseCoopers LLP | | 300 Madison Avenue New York, NY 10017 |
| | |
FUND COUNSEL | | Willkie Farr & Gallagher LLP | | 787 Seventh Avenue New York, NY 10019 |
|
| |
| An investor should consider the investment objectives, risks, charges, and expenses of the Fund carefully before investing. The prospectus and summary prospectus contain this and other information about the Fund. An investor may obtain the prospectus and summary prospectus by visiting our website at pgim.com/investments or by calling (800) 225-1852. The prospectus and summary prospectus should be read carefully before investing. |
|
| |
E-DELIVERY |
| To receive your mutual fund documents online, go to pgim.com/investments/resource/edelivery and enroll. Instead of receiving printed documents by mail, you will receive notification via email when new materials are available. You can cancel your enrollment or change your email address at any time by visiting the website address above. |
|
| |
SHAREHOLDER COMMUNICATIONS WITH TRUSTEES |
| Shareholders can communicate directly with the Board of Trustees by writing to the Chair of the Board, PGIM Securitized Credit Fund, PGIM Investments, Attn: Board of Trustees, 655 Broad Street, Newark, NJ 07102. Shareholders can communicate directly with an individual Trustee by writing to that Trustee at the same address. Communications are not screened before being delivered to the addressee. |
|
| |
AVAILABILITY OF PORTFOLIO HOLDINGS |
| The Fund files its complete schedule of portfolio holdings with the Securities and Exchange Commission for the first and third quarters of each fiscal year as an exhibit to its reports on Form N-PORT. The Fund’s Form N-PORT filings are available on the Commission’s website at sec.gov. |
|
| |
| The Fund’s Statement of Additional Information contains additional information about the Fund’s Trustees and is available without charge, upon request, by calling (800) 225-1852. |
Mutual Funds:
| | | | |
| | | |
ARE NOT INSURED BY THE FDIC OR ANY FEDERAL GOVERNMENT AGENCY | | MAY LOSE VALUE | | ARE NOT A DEPOSIT OF OR GUARANTEED BY ANY BANK OR ANY BANK AFFILIATE |
PGIM SECURITIZED CREDIT FUND
| | | | | | | | | | | | |
| | | | | |
| SHARE CLASS | | | | | A | | C | | Z | | R6 |
| | | | | |
NASDAQ | | | | | | SCFOX | | SCFVX | | SCFZX | | SCFQX |
| | | | | |
CUSIP | | | | | | 74441F801 | | 74441F884 | | 74441F876 | | 74441F868 |
MF241E
Item 2 – Code of Ethics — See Exhibit (a)
As of the end of the period covered by this report, the registrant has adopted a code of ethics (the “Section 406 Standards for Investment Companies – Ethical Standards for Principal Executive and Financial Officers”) that applies to the registrant’s Principal Executive Officer and Principal Financial Officer; the registrant’s Principal Financial Officer also serves as the Principal Accounting Officer.
The registrant hereby undertakes to provide any person, without charge, upon request, a copy of the code of ethics. To request a copy of the code of ethics, contact the registrant 800-225-1852, and ask for a copy of the Section 406 Standards for Investment Companies - Ethical Standards for Principal Executive and Financial Officers.
Item 3 – Audit Committee Financial Expert –
The registrant’s Board has determined that Ms. Grace C. Torres, member of the Board’s Audit Committee is an “audit committee financial expert,” and that she is “independent,” for purposes of this item.
Item 4 – Principal Accountant Fees and Services –
(a) Audit Fees
For the fiscal years ended September 30, 2022 and September 30, 2021, PricewaterhouseCoopers LLP (“PwC”), the Registrant’s principal accountant, billed the Registrant $81,350 and $81,350, respectively, for professional services rendered for the audit of the Registrant’s annual financial statements or services that are normally provided in connection with statutory and regulatory filings.
(b) Audit-Related Fees
For the fiscal years ended September 30, 2022 and September 30, 2021: none.
(c) Tax Fees
For the fiscal years ended September 30, 2022 and September 30, 2021: none.
(d) All Other Fees
For the fiscal years ended September 30, 2022 and September 30, 2021: none.
(e) (1) Audit Committee Pre-Approval Policies and Procedures
THE PGIM MUTUAL FUNDS
AUDIT COMMITTEE POLICY
on
Pre-Approval of Services Provided by the Independent
Accountants
The Audit Committee of each PGIM Mutual Fund is charged with the responsibility to monitor the independence of the Fund’s independent accountants. As part of this responsibility, the Audit Committee must pre-approve the independent accounting firm’s engagement to render audit and/or permissible non-audit services, as required by law. In evaluating a proposed engagement of the independent accountants, the Audit Committee will assess the effect that the engagement might reasonably be expected to have on the accountant’s independence. The Committee’s evaluation will be based on:
| | • | | a review of the nature of the professional services expected to be provided, |
| | • | | a review of the safeguards put into place by the accounting firm to safeguard independence, and |
| | • | | periodic meetings with the accounting firm. |
Policy for Audit and Non-Audit Services Provided to the Funds
On an annual basis, the scope of audits for each Fund, audit fees and expenses, and audit-related and non-audit services (and fees proposed in respect thereof) proposed to be performed by the Fund’s independent accountants will be presented by the Treasurer and the independent accountants to the Audit Committee for review and, as appropriate, approval prior to the initiation of such services.
Such presentation shall be accompanied by confirmation by both the Treasurer and the independent accountants that the proposed non-audit services will not adversely affect the independence of the independent accountants. Such proposed non-audit services shall be described in sufficient detail to enable the Audit Committee to assess the appropriateness of such services and fees, and the compatibility of the provision of such services with the auditor’s independence. The Committee shall receive periodic reports on the progress of the audit and other services which are approved by the Committee or by the Committee Chair pursuant to authority delegated in this Policy.
The categories of services enumerated under “Audit Services”, “Audit-related Services”, and “Tax Services” are intended to provide guidance to the Treasurer and the independent accountants as to those categories of services which the Committee believes are generally consistent with the independence of the independent accountants and which the Committee (or the Committee Chair) would expect upon the presentation of specific proposals to pre-approve. The enumerated categories are not intended as an exclusive list of audit, audit-related or tax services, which the Committee (or the Committee Chair) would consider for pre-approval.
Audit Services
The following categories of audit services are considered to be consistent with the role of the Fund’s independent accountants:
| | • | | Annual Fund financial statement audits |
| | • | | Seed audits (related to new product filings, as required) |
| | • | | SEC and regulatory filings and consents |
Audit-related Services
The following categories of audit-related services are considered to be consistent with the role of the Fund’s independent accountants:
| | • | | Accounting consultations |
| | • | | Fund merger support services |
| | • | | Agreed Upon Procedure Reports |
| | • | | Other Internal Control Reports |
Individual audit-related services that fall within one of these categories (except for fund merger support services) and are not presented to the Audit Committee as part of the annual pre-approval process are subject to an authorized pre-approval by the Audit Committee so long as the estimated fee for those services does not exceed $30,000. Any services provided under such pre-approval will be reported to the Audit Committee at its next regular meeting. Should the amount of such services exceed $30,000 any additional fees will be subject to pre-approval by the Committee Chair (or any other Committee member on
whom this responsibility has been delegated). Fees related to fund merger support services are subject to a separate authorized pre-approval by the Audit Committee with fees determined on a per occurrence and merger complexity basis.
Tax Services
The following categories of tax services are considered to be consistent with the role of the Fund’s independent accountants:
| | • | | Tax compliance services related to the filing or amendment of the following: |
| | • | | Federal, state and local income tax compliance; and, |
| | • | | Sales and use tax compliance |
| | • | | Timely RIC qualification reviews |
| | • | | Tax distribution analysis and planning |
| | • | | Tax authority examination services |
| | • | | Tax appeals support services |
| | • | | Accounting methods studies |
| | • | | Fund merger support services |
| | • | | Tax consulting services and related projects |
Individual tax services that fall within one of these categories and are not presented to the Audit Committee as part of the annual pre-approval process are subject to an authorized pre-approval by the Audit Committee so long as the estimated fee for those services does not exceed $30,000. Any services provided under such pre-approval will be reported to the Audit Committee at its next regular meeting. Should the amount of such services exceed $30,000 any additional fees will be subject to pre-approval by the Committee Chair (or any other Committee member on whom this responsibility has been delegated).
Other Non-Audit Services
Certain non-audit services that the independent accountants are legally permitted to render will be subject to pre-approval by the Committee or by one or more Committee members to whom the Committee has delegated this authority and who will report to the full Committee any pre-approval decisions made pursuant to this Policy. Non-audit services presented for pre-approval pursuant to this paragraph will be accompanied by a confirmation from both the Treasurer and the independent accountants that the proposed services will not adversely affect the independence of the independent accountants.
Proscribed Services
The Fund’s independent accountants will not render services in the following categories of non-audit services:
| | • | | Bookkeeping or other services related to the accounting records or financial statements of the Fund |
| | • | | Financial information systems design and implementation |
| | • | | Appraisal or valuation services, fairness opinions, or contribution-in-kind reports |
| | • | | Internal audit outsourcing services |
| | • | | Management functions or human resources |
| | • | | Broker or dealer, investment adviser, or investment banking services |
| | • | | Legal services and expert services unrelated to the audit |
| | • | | Any other service that the Public Company Accounting Oversight Board determines, by regulation, is impermissible. |
Pre-approval of Non-Audit Services Provided to Other Entities Within the PGIM Fund Complex
Certain non-audit services provided to PGIM Investments LLC or any of its affiliates that also provide ongoing services to the PGIM Mutual Funds will be subject to pre-approval by the Audit Committee. The only non-audit services provided to
these entities that will require pre-approval are those related directly to the operations and financial reporting of the Funds. Individual projects that are not presented to the Audit Committee as part of the annual pre-approval process will be subject to pre-approval by the Committee Chair (or any other Committee member on whom this responsibility has been delegated) so long as the estimated fee for those services does not exceed $30,000. Services presented for pre-approval pursuant to this paragraph will be accompanied by a confirmation from both the Treasurer and the independent accountants that the proposed services will not adversely affect the independence of the independent accountants.
Although the Audit Committee will not pre-approve all services provided to PGIM Investments LLC and its affiliates, the Committee will receive an annual report from the Fund’s independent accounting firm showing the aggregate fees for all services provided to PGIM Investments and its affiliates.
| (e) | (2) Percentage of services described in each of paragraphs (b) through (d) of this Item that were approved by the audit committee pursuant to paragraph (c)(7)(i)(C) of Rule 2-01 of Regulation S-X – |
| | | | |
| | Fiscal Year Ended September 30, 2022 | | Fiscal Year Ended September 30, 2021 |
| 4(b) | | Not applicable. | | Not applicable. |
| 4(c) | | Not applicable. | | Not applicable. |
| 4(d) | | Not applicable. | | Not applicable. |
(f) Percentage of hours expended attributable to work performed by other than full time employees of principal accountant if greater than 50%.
The percentage of hours expended on the principal accountant’s engagement to audit the registrant’s financial statements for the most recent fiscal year that were attributed to work performed by persons other than the principal accountant’s full-time, permanent employees was 0%.
(g) Non-Audit Fees
The aggregate non-audit fees billed by the Registrant’s principal accountant for services rendered to the registrant’s investment adviser and any entity controlling, controlled by, or under common control with the investment adviser that provides ongoing services to the registrant for the fiscal years ended September 30, 2022 and September 30, 2021 was $0 and $0, respectively.
(h) Principal Accountant’s Independence
Not applicable as the Registrant’s principal accountant has not provided non-audit services to the registrant’s investment adviser and any entity controlling, controlled by, or under common control with the investment adviser that provides ongoing services to the registrant that were not pre-approved pursuant to Rule 2-01(c)(7)(ii) of Regulation S-X.
(i) Not applicable.
(j) Not applicable.
Item 5 – Audit Committee of Listed Registrants – Not applicable.
Item 6 – Schedule of Investments – The schedule is included as part of the report to shareholders filed under Item 1 of this Form.
Item 7 – Disclosure of Proxy Voting Policies and Procedures for Closed-End Management Investment Companies – Not applicable.
Item 8 – Portfolio Managers of Closed-End Management Investment Companies – Not applicable.
Item 9 – Purchases of Equity Securities by Closed-End Management Investment Company and Affiliated Purchasers – Not applicable.
Item 10 – Submission of Matters to a Vote of Security Holders – There have been no material changes to these procedures.
Item 11 – Controls and Procedures
| | (a) | It is the conclusion of the registrant’s principal executive officer and principal financial officer that the effectiveness of the registrant’s current disclosure controls and procedures (such disclosure controls and procedures having been evaluated within 90 days of the date of this filing) provide reasonable assurance that the information required to be disclosed by the registrant has been recorded, processed, summarized and reported within the time period specified in the Commission’s rules and forms and that the information required to be disclosed by the registrant has been accumulated and communicated to the registrant’s principal executive officer and principal financial officer in order to allow timely decisions regarding required disclosure. |
| | (b) | There has been no significant change in the registrant’s internal control over financial reporting (as defined in Rule 30a-3(d) under the Act (17 CFR 270.30a-3(d)) that occurred during the period covered by this report that has materially affected, or is reasonably likely to materially affect, the registrant’s internal control over financial reporting. |
Item 12 – Controls and Procedures - Disclosure of Securities Lending Activities for Closed-End Management Investment Companies – Not applicable.
Item 13 – Exhibits
(2) Certifications pursuant to Section 302 of the Sarbanes-Oxley Act – Attached hereto as Exhibit EX-99.CERT.
(3) Any written solicitation to purchase securities under Rule 23c-1 – Not applicable.
SIGNATURES
Pursuant to the requirements of the Securities Exchange Act of 1934 and the Investment Company Act of 1940, the registrant has duly caused this report to be signed on its behalf by the undersigned, thereunto duly authorized.
| | |
| Registrant: | | Prudential Investment Portfolios 8 |
| |
| By: | | /s/ Andrew R. French |
| | Andrew R. French |
| | Secretary |
| |
| Date: | | November 17, 2022 |
Pursuant to the requirements of the Securities Exchange Act of 1934 and the Investment Company Act of 1940, this report has been signed below by the following persons on behalf of the registrant and in the capacities and on the dates indicated.
| | |
| By: | | /s/ Stuart S. Parker |
| | Stuart S. Parker |
| | President and Principal Executive Officer |
| |
| Date: | | November 17, 2022 |
| |
| By: | | /s/ Christian J. Kelly |
| | Christian J. Kelly |
| | Treasurer and Principal Financial and Accounting Officer |
| |
| Date: | | November 17, 2022 |