UNITED STATES
SECURITIES AND EXCHANGE COMMISSION
Washington, D.C. 20549
FORM N-CSR
CERTIFIED SHAREHOLDER REPORT OF REGISTERED
MANAGEMENT INVESTMENT COMPANIES
Investment Company Act file number: 811-06686
JPMorgan China Region Fund, Inc.
(Exact name of registrant as specified in charter)
One Beacon Street, 18th Floor
Boston, MA 02108
(Address of principal executive offices) (Zip code)
Dechert LLP
1095 Avenue of the Americas
New York, NY 10036
(Name and Address of Agent for Service)
Registrant’s telephone number, including area code: (800) 441-9800
Date of fiscal year end: December 31
Date of reporting period: January 1, 2014 through December 31, 2014
ITEM 1. REPORTS TO STOCKHOLDERS.
The following is a copy of the report transmitted to shareholders pursuant to Rule 30e-1 under the Investment Company Act of 1940 (17 CFR 270.30e-1).
[INSERT— JPMorgan China Region Fund, Inc. annual report 12/31/14]
This report, including the financial statements herein, is sent to the stockholders of the Fund for their information. It is not a prospectus, circular or representation intended for use in the purchase or sale of shares of the Fund or of any securities mentioned in this report.

Annual Report
December 31, 2014


CONTENTS
OBJECTIVES (Unaudited)
JPMorgan China Region Fund, Inc. (the ‘Fund’) seeks to achieve long-term capital appreciation through investments primarily in equity securities of companies with substantial assets in, or revenues derived from, the People’s Republic of China (‘China’), Hong Kong, Taiwan and Macau — collectively, the ‘China Region’.
The Fund provides investors with an opportunity to participate in the growing economies of the China Region where the economies of China, Hong Kong, Taiwan and Macau have become increasingly linked over recent years. Hong Kong enterprises have made substantial investments in China, particularly where labor and land prices are lower than in Hong Kong. Similarly, many Chinese companies have Hong Kong based subsidiaries with securities listed on the Hong Kong Stock Exchange (H-shares). Renminbi denominated China A-shares, which are listed in China, are available for acquisition by the Fund by direct investment up to $20m and by indirect investment up to 10% of the Fund’s total assets through exposure to China A-share investment companies. It is intended that the Fund will maintain a $20m direct investment in China A-shares. Further details on China A-shares are provided in note 7(iii) of the Notes to Financial Statements on page 25.
The Fund invests to take advantage of the many opportunities that result from this linkage among the markets of the China Region.
MANAGEMENT (Unaudited)
JF International Management Inc. (‘JFIMI’) is the investment management company appointed to advise and manage the Fund’s portfolio (the ‘Investment Advisor’). JFIMI is part of JPMorgan Chase & Co. (‘JPMC’), one of the world’s premier financial services institutions. In asset management, JPMC operates globally under the name of J.P. Morgan Asset Management (‘JPMAM’). Funds under management for the global asset management business of JPMAM were US$1.7 trillion as of December 31, 2014.
The Fund’s lead portfolio manager is Emerson Yip, a Senior Portfolio Manager within JPMAM’s Greater China investment team in Hong Kong.
| | | | | | | | |
| | | |
| DECEMBER 31, 2014 | | JPMORGAN CHINA REGION FUND, INC. | | | | | 1 | |
FORWARD-LOOKING STATEMENTS (Unaudited)
This report contains certain forward-looking statements within the meaning of Section 21E of the Securities Exchange Act of 1934. Forward-looking statements include statements regarding the goals, beliefs, plans or current expectations of the Fund and JFIMI and their respective representatives, taking into account the information currently available to them. Forward-looking statements include all statements that do not relate solely to current or historical fact. For example, forward-looking statements include the use of words such as ‘anticipate,’ ‘estimate,’ ‘intend,’ ‘expect,’ ‘believe,’ ‘plan,’ ‘may,’ ‘should,’ ‘would,’ or other words that convey uncertainty of future events or outcomes. Forward-looking statements involve known and unknown risks, uncertainties and other factors that may cause the actual results, performance or achievements of the Fund to be materially different from any future results, performance or achievements expressed or implied by the forward-looking statements. Factors that could materially and negatively affect the results, performance or achievements of the Fund include changes in economic, political, legal and regulatory conditions in the China Region and elsewhere, changes in interest and exchange rates and related policies and other risks. When evaluating the information included in this report, you are cautioned not to place undue reliance on these forward-looking statements, which reflect the judgment of the Fund, JFIMI or its respective representatives only as of the date hereof. The Fund, JFIMI and their respective representatives undertake no obligation to publicly revise or update these forward-looking statements to reflect events and circumstances that arise after the date hereof.
|
| MARKET INFORMATION |
The Fund is listed on the New York Stock Exchange (symbol JFC). The share price is published in • The Wall Street Journal (daily online at www.WSJ.com/Free) |
The estimated net asset value is published in • The Wall Street Journal under “Closed-End Funds” (every Saturday) • www.jpmchinaregionfund.com |
| | | | | | |
| | | |
| 2 | | | | JPMORGAN CHINA REGION FUND, INC. | | DECEMBER 31, 2014 |
HIGHLIGHTS (unaudited, except as indicated)
| | | | | | | | |
| | | DECEMBER 31, 2014
US$ | | | DECEMBER 31, 2013
US$ | |
Net Assets (Audited) | | | $125.0 million | | | | $111.4 million | |
Net Asset Value Per Share (Audited) | | | $19.39 | | | | $17.28 | |
| | |
Market Data | | | | | | | | |
Share Price on the New York Stock Exchange | | | $16.91 | | | | $15.16 | |
Discount to Net Asset Value Per Share | | | 12.8% | | | | 12.3% | |
| | |
Total Return for the Year Ended December 31, 2014 | | | | | | | | |
Net Asset Value | | | | | | | +13.0% | |
Share Price | | | | | | | +12.5% | |
| | |
JFC Benchmark Index* | | | | | | | +16.1% | |
MSCI Hong Kong Index | | | | | | | +5.1% | |
MSCI China Index | | | | | | | +8.3% | |
MSCI Taiwan Index | | | | | | | +10.1% | |
CSI 300 Index | | | | | | | +51.6% | |
|
Net Asset Value and Share Price vs. Benchmark Index | |
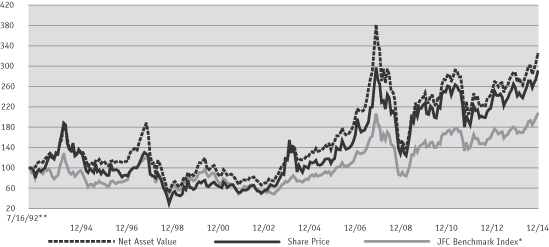
| * | | JFC Benchmark Index: 80% MSCI Golden Dragon Index (Net) 20% CSI 300 Index (Net). Prior to October 1, 2013, 80% MSCI Golden Dragon Index (GDR) +20% CSI 300 Index (Total). Prior to April 13, 2012, the MSCI Golden Dragon Index (Total). At December 31, 2011 the MSCI Golden Dragon Index (Total) comprised 24.1% of the MSCI Hong Kong Index (Total), 42.7% of the MSCI China Index (Total) and 33.2% of the MSCI Taiwan Index (Total). Prior to March 2001, 25% Taiwan Weighted Index, 20% BNP Paribas China Index, 50% MSCI Hong Kong, 5% HSBC; Prior to March 1999, 60% Hong Kong All Ordinaries, 30% Credit Lyonnais Securities Asia All China B Index, 10% Taiwan Weighted Index. Prior to January 1997, Peregrine Greater China Index. |
| ** | | Commencement of operations. |
Source: J.P. Morgan Asset Management.
| | | | | | | | |
| | | |
| DECEMBER 31, 2014 | | JPMORGAN CHINA REGION FUND, INC. | | | | | 3 | |
CHAIRMAN‘S STATEMENT
DECEMBER 31, 2014 (Unaudited)
Dear Fellow Stockholder
Performance
During the year ended December 31, 2014 the Fund’s total return on net asset value was +13.0% compared to a total return of +16.1% for the composite benchmark. Over the same period, the Fund’s share price total return was +12.5% as the discount at which the share trades to its NAV widened slightly from 12.3% to 12.8%. At the portfolio level, the Fund’s underperformance was largely due to stock selection in Hong Kong and Macau.
China A-shares
The Fund has $20m of China A-share quota which provides exposure to an investment universe otherwise restricted to foreign investors. This serves as a differentiating factor for the Fund when compared to its peer group of other New York listed Greater China region closed ended funds. As at December 31, 2014, the Fund held 24.6% of its total assets in China A-share investments. Overall, 2014 was a strong year for China A-shares, with most of the performance coming in the later part of the calendar year after the surprise interest rate cut by the People’s Bank of China.
Leverage
The Fund renewed its $17.5m credit facility with Scotiabank (Ireland) Ltd for a further two year period on February 25, 2015. The facility expires on February 24, 2017 at which point the Board will consider another credit facility. Under this arrangement, Scotiabank provides a secured, committed credit facility which can be utilized at any time. This financing arrangement gives the Investment Advisor the flexibility to tactically manage borrowed monies at its discretion under the scrutiny of the Board. During the year to December 31, 2014, the Fund’s
leverage ranged from 8.7% to 12.9% and at the time of writing is 11.6%, reflecting the Investment Advisor’s positive view on the market. The Investment Advisor does not receive a management fee on any cash held when borrowings are drawn under the leverage facility.
Total Expense Ratio
The Board monitors closely the Fund’s expenses. For the year ended December 31, 2014, the Fund’s ratio of total expenses to average net assets (excluding interest expense) was 1.94% (2013: 2.06%).
Share Repurchases and Discount Management
The Board currently has authority to repurchase up to 644,763 shares (equal to 10% of the Fund’s issued share capital). Although there have been no share repurchases since January 2003, the Board continues to believe that the power to repurchase shares is of ongoing benefit to shareholders. Share repurchases are a useful tool for decreasing discount volatility and this approach will be used when considered to be appropriate by the Board.
Board Succession
As mentioned in last year’s report, the Board through its Nomination Committee, considered succession planning and the need to refresh its Board and Committees. As a result, it has discussed the retirement of two Directors in 2016. The Board intends to recruit two new Directors in place of those retiring and will ensure it maintains an appropriate balance of skills.
Outlook
The Investment Advisor expects the macroeconomic environment to gradually recover from the post-financial crisis lows, underpinned by an improving property sector outlook and continued government
For more information please refer to the Fund’s website at www.jpmchinaregionfund.com
| | | | | | |
| | | |
| 4 | | | | JPMORGAN CHINA REGION FUND, INC. | | DECEMBER 31, 2014 |
support on infrastructure projects. The Investment Advisor also expects favourable liquidity conditions should continue to support China A-shares in the medium term, but anticipates more short term volatility after the strong rally and rising percentage of leveraged trades.
The Investment Advisor believes that expectations for regional growth are increasingly divergent with investors generally more confident of U.S. growth prospects, but concerned about stagnation in Europe, and a potentially sharp slowdown in China. The fall in oil prices however is expected to be a positive for China. Monetary policy globally is also mixed with the US expected to raise rates this year or next, but with central banks in Europe, China and Japan expected to ease further.
China’s reform program may cause stock market volatility (as it involves both de-leveraging and substantial policy changes), but ultimately the Investment Advisor believes this should result in a positive re-rating of the market. Furthermore, the People’s Bank of China has embarked on monetary easing which should be supportive of liquidity. Taiwan corporate performance should improve as trade continues to pick up and as the U.S. dollar strengthens. In contrast, we see less opportunities in Hong Kong given that the valuations of many of the companies will be adversely impacted by rising U.S. interest rates due to the Hong Kong dollar currency peg.
Respectfully submitted
The Rt. Hon. The Earl of Cromer
Chairman
February 27, 2015
For more information please refer to the Fund’s website at www.jpmchinaregionfund.com
| | | | | | | | |
| | | |
| DECEMBER 31, 2014 | | JPMORGAN CHINA REGION FUND, INC. | | | | | 5 | |
INVESTMENT ADVISOR’S REPORT (Unaudited)
Over the 12-month period ending December 2014, the Company achieved a total return, based on net asset value, of +13.0% underperforming the benchmark return of +16.1% by 3.1%.
The major drivers on the upside to the Fund’s performance included our overweight position in internet stocks such as Alibaba and JD.Com which we felt offered us the best way to gain exposure to Chinese consumption spending. In addition, we were correctly overweight in Chinese financials such as broker Haitong Securities, banks such as China Minsheng Bank and insurance companies such as Ping An Insurance. These stocks re-rated later in the year following the surprise cut in interest rates in China. On the negative side, we were hurt by our overweight position in Macau casino stocks which detracted from performance as the stocks fell on negative earnings revisions. Several of our renewable energy names such as Huaneng Renewables corrected in 2014 as growth slowed from 2013 levels.
China Review (including A-shares)
Chinese equities fell in the first quarter, with offshore-listed equities down 5.8% and domestic A-shares (CSI 300) down 7.9%. Most of the decline took place in January when the US Federal Reserve’s announcement of the tapering of its quantitative easing programme renewed concerns about emerging market currencies. The gradual decline in interbank rates from their fourth-quarter high did not alleviate market concerns over slowing growth, cases of trust/bond defaults and lack of evidence for solid structural reforms. Economic-sensitive sectors such as financials, consumer discretionary and commodities/industrials lagged, while structural growth sectors such as internet and health care outperformed.
In the second quarter Chinese equities rose, with offshore-listed equities up 3.4% and domestic A-shares (CSI 300) up 0.9%. Again, markets were volatile, with initial weakness in April due to weak
macro data, followed by a series of mini policy stimulus measures, which sparked a recovery. Economic-sensitive sectors such as banks, brokerage and autos outperformed, while defensives such as staples and health care lagged. Internet stocks rebounded due to strong earnings visibility, after a sharp global style shift led the sector lower in March/April.
Chinese equities diverged in the third quarter, with offshore-listed equities almost flat, returning 0.5%, and domestic A-shares (CSI 300) up strongly, returning 13%. The strong return for the A-share market was driven by the government’s continued mini policy stimulus, potential liquidity inflows from Shanghai-Hong Kong Stock Connect, further structural reform from the upcoming 4th Plenum, and a series of stock market reforms, such as increasing the scope of stocks eligible for financial leverage. Offshore markets rose first on better economic data and lagged performance status among emerging markets. Weak macroeconomic data for August, along with market worries about the Federal Reserve’s first rate rise, triggered an 8% market correction from early-September’s high. Reform beneficiaries, such as telecoms, along with cyclical recovery proxy properties, outperformed. Growth sectors such as technology, media & telecommunications (‘TMT’), gas and consumer-related sectors lagged.
Finally, in the fourth quarter, Chinese equities rallied with offshore-listed equities up 7% and domestic A-shares (CSI 300) rising sharply, up 44%, accounting for the bulk of the full-year gains for both markets. The key catalysts were the rate cut in late November — the first cut since 2012 — coupled with a steady recovery in property transactions and further progress on structural reforms (such as local government financing vehicle (‘LGFV’) debt). The rise was led almost solely by financial sectors, which benefited from the avoidance of a hard landing, rate sensitivity and attractive valuations.
| | | | | | |
| | | |
| 6 | | | | JPMORGAN CHINA REGION FUND, INC. | | DECEMBER 31, 2014 |
China Outlook
We expect the macroeconomic environment to gradually recover from the post-financial crisis lows, underpinned by an improving property sector outlook and continued government support on infrastructure projects. We believe there should be further interest rate and reserve ratio requirement (‘RRR’) cuts as real interest rates are still too high to ensure a smooth deleveraging process. We do not expect any major stimulus policies as the government continues its structural reforms.
On the structural reform front, we have seen good progress. The China Banking Regulatory Commission (‘CBRC’) circular 43 has largely resolved the LGFV concerns with its implicit guarantee of qualified local government debt from the central government, relieving a key market concern. We believe 2015 will be a critical year for the implementation of structural reforms, such as state-owned enterprise and fiscal reforms, following a lot of initial planning in 2014.
The market’s valuation at 9.2x forward one-year price to earnings, with earnings growth in the high single digits, is undemanding (vs. mid-cycle 12x). We believe the market will continue to re-rate as the macroeconomic environment stabilises and as there is further evidence of structural reform being carried out.
Hong Kong Review
The Hong Kong market was weighed down early in the year due to a correction in Macau gaming stocks. Hong Kong equities rebounded sharply in the second quarter, due to a confluence of positive factors, including economic stabilisation in China, the announcement of the mutual market access agreement with the Shanghai stock exchange and a surprising drop in long-term US Treasury yields. Hong Kong equities outperformed Chinese equities as well as regional and global stock markets for the quarter.
Hong Kong equities suffered a sharp correction in September due to slowing economic momentum in China. This correction more than erased the strong start to the quarter, which was aided by incremental targeted loosening. In late September, sentiment suffered a major hit as student pro-democracy protests rolled into an earlier-than-expected start to the Occupy Central campaign. The early use of tear gas for crowd control purposes garnered international headlines and galvanised the population, leading to more participants joining the demonstrations.
Despite a massive rally in the domestic Chinese equity market, Hong Kong equities managed only a modest gain in the fourth quarter, held back by substantial weakness in the Macau gaming sector. The highly-anticipated Shanghai-Hong Kong Stock Connect scheme commenced with disappointing volumes, especially on the southbound route. Institutional investors were likely not ready to participate in the scheme, while retail investors were more interested in their own domestic market. Meanwhile, the student-led pro-democracy protests were cleared up without much further incident due to waning public support. However, the aftermath of these protests may result in further political gridlock, affecting the ability of the government to move forward with its economic policy initiatives.
Hong Kong Outlook
With the pro-democracy protests having wound down peacefully and interest rate rise expectations being dampened, the prospects for equities have turned more positive for the medium term. Moreover, as the Shanghai-Hong Kong Stock Connect programme matures, with potential scope for expansion, this could spur further buying interest in Hong Kong equities.
The residential property market looks stable in the near term, since the supply situation remains attractive relative to growing demand. While the risk of
| | | | | | | | |
| | | |
| DECEMBER 31, 2014 | | JPMORGAN CHINA REGION FUND, INC. | | | | | 7 | |
INVESTMENT ADVISOR’S REPORT (Unaudited) (continued)
further government policy tightening remains present, this is likely only if price growth becomes excessive, which is not currently expected. Office property is also benefiting from tight supply conditions amid modest demand growth. However, retail property is facing more challenging conditions given slowing retail sales growth, especially in the high end, as mainland tourists continue to diversify their travels and spending outside of Hong Kong.
The policy risks on Macau remain heightened, especially given the more explicit attention and focus from Beijing. This scrutiny has dampened the potential for increased demand arising from monetary loosening and revived activity in the property sector in China.
Taiwan Review
After shrugging off several market shocks, including the collapse of Ukraine’s government, US Federal Reserve chair Janet Yellen’s indication of a possible rate rise in six months and home-grown protests over a trade deal with China, the Taiwan Stock Exchange Weighted Index (‘TWSE’) hit new yearly highs, to close with a 2.8% gain from the fourth quarter of 2013. Among the major losers were finance stocks, down 5.5% quarter on quarter, as students continued to occupy Taiwan’s parliament, demanding the withdrawal of the services pact. This is expected to boost access of Taiwanese firms to China’s financial markets.
Despite local protests over free-trade agreement talks with China, protests in Vietnam impacting some Taiwanese companies, and issues in Ukraine, the TWSE finished the second quarter up 6% from the first quarter. A surge of liquidity into Taiwan pushed the TWSE to its highest level since 2007, as enthusiasm grew over local technology companies and a recovering economy boosted corporate earnings. The technology sector outperformed, whilst the construction sector closed down for the quarter as the government announced expanded measures to
control rocketing housing prices by reducing the amount of money banks can lend to home buyers.
The Taiwan Capitalization Weighted Stock Index (‘TAIEX’) ended the third quarter down by over 4% quarter on quarter. The market peaked in early July as a surge of cash into Taiwan pushed the TAIEX to its highest level since 2007 on signs of a recovering economy and stronger corporate earnings. The Taiex looked to retest its July highs in late August with technology stocks leading the way, as the launch of new models by several global electronics brands, such as Apple and Samsung, were expected to boost local suppliers’ shipments. However, the index sold off all through September, with low trading volumes on weak sentiment and net foreign institutional selling.
The TWSE ended the fourth quarter with an almost 4% quarter-on-quarter gain, with a late year-end rally. The quarter was initially hampered by weak sentiment ahead of the 9-in-1 election. There were a number of negative factors, such as technology seasonality, unhappiness over the government’s plan to implement a tax on large retail investors (big player tax), concerns over Ebola, and the Kuomintang’s potential weak showing in the November election. Alongside the election, a food scandal dominated the news. Ting Hsin International Group was found to mix lard oil meant for animal feed in edible oil, which it then sold to the public. The other overriding influence for the period was the decline in the oil price, which led to airlines and shipping names outperforming massively. Concurrently, the currency weakened, following the continued quantitative easing attempts in Japan and Europe and the general US dollar strength vs. Asian currencies.
Taiwan Outlook
With Taiwan’s municipal elections out of the way and the presidential election not due until 2016, president Ma Ying-jeou could use this window wisely
| | | | | | |
| | | |
| 8 | | | | JPMORGAN CHINA REGION FUND, INC. | | DECEMBER 31, 2014 |
to win back confidence for the Kuomintang party. Several factors should support a decent first half to 2015. The positive effect from the iPhone 6 will carry over into the first half of the year, and the cheaper oil price will bolster disposable incomes, lending a boost to retailers. Tourism will be a bright spot, further supporting domestic consumption. The three-year delay to the big player tax should help retail sentiment and participation. However, macroeconomic uncertainty, especially from Europe, and a weak New Taiwan dollar could weigh on the market.
Overall, the market’s risk/reward prospects continue to look favourable given sustained growth into 2015. Fundamentals remain strong and valuations are still modest. We remain an overweight position in technology, industrial and consumption, and an underweight position in telecommunications and petrochemicals.
Greater China Outlook
2015 should be another positive year for Greater China markets. However, we expect continued volatility in the near-term given the strong rally in equity markets last year paired with the continued tapering of Fed stimulus. China’s reform program may cause stock market volatility (as it involves both de-leveraging and substantial policy changes), but ultimately this should result in a re-rating of the market. Furthermore, the People’s Bank of China has embarked on monetary easing which should be supportive of liquidity. Taiwan corporate performance should improve as trade continues to pick up and as the U.S. dollar strengthens. In contrast, we see fewer opportunities in Hong Kong given its sensitivity to expectations in U.S. interest rates.
| | | | | | | | |
| | | |
| DECEMBER 31, 2014 | | JPMORGAN CHINA REGION FUND, INC. | | | | | 9 | |
TOP TEN HOLDINGS
AT DECEMBER 31, 2014 (Unaudited)
| | | | |
| | | % OF
NET ASSETS | |
Taiwan Semiconductor Manufacturing Co., Ltd. (‘TSMC’) | | | 6.2 | |
| Manufactures and markets integrated circuits. The company provides the following services: wafer manufacturing, wafer probing, assembly and testing, mask production and design services. The company’s integrated circuits are used in computer, communication, consumer electronics, automotive and industrial equipment industries. | | | | |
| |
Tencent Holdings Ltd. | | | 4.9 | |
| Provides internet, mobile, and telecommunication value-added services in China. The company has an instant messaging community in China. Tencent also provides online advertising services. | | | | |
| |
China Construction Bank Corp. ‘A’ ‘H’ | | | 4.6 | |
| Provides a complete range of banking services and other financial services to individual and corporate customers. The bank’s services include retail banking, international settlement, project finance and credit card services. | | | | |
| |
Ping An Insurance Group Co. Ltd. ‘A’ ‘H’ | | | 4.5 | |
| Provides a variety of insurance service in China. The Company writes property, casualty, and life insurance. Ping An Insurance also offers financial services. | | | | |
| |
AIA Group Ltd. | | | 3.7 | |
| Offers insurance and financial services. The company writes life insurance for individuals and businesses, accident and health insurance, retirement planning, and wealth management services. | | | | |
| |
Agricultural Bank of China Ltd. ‘A’ ‘H’ | | | 3.3 | |
| Provides a full range of commercial banking services. The Banks services includes RMB and foreign currency deposit, loan, international and domestic settlement, bill discount, currency trading, bank guarantee, and treasury bill underwriting. | | | | |
| |
China Minsheng Banking Corp., Ltd. ‘A’ ‘H’ | | | 3.2 | |
| Provides deposit, loan, settlement, discount, financial bond issuance, government bond underwriting and trading, letter of credit, bank guarantee, and other related financial services. | | | | |
| |
China Vanke Co., Ltd. ‘A’ ‘H’ | | | 2.4 | |
| A Property development company. The Company mainly develops residential properties in Shenzhen, Shanghai, Beijing, Tianjin, Tangshan, Nanjing, and other big cities in China. | | | | |
| |
China Pacific Insurance Group Co., Ltd. ‘A’ ‘H’ | | | 2.2 | |
| Provides integrated insurance services. The Company offers life and property insurance products through its subsidiaries. | | | | |
| |
China Telecom Corp., Ltd. | | | 2.0 | |
| Provides wireline telephone, data, and Internet, as well as leased line services in China through its subsidiaries. | | | | |
| | | | | | |
| | | |
| 10 | | | | JPMORGAN CHINA REGION FUND, INC. | | DECEMBER 31, 2014 |
INVESTMENT PORTFOLIO
AT DECEMBER 31, 2014
| | | | | | | | |
| DESCRIPTION | | HOLDINGS
(IN SHARES) | | | VALUE
(IN US$) | |
COMMON STOCK (unless otherwise noted) | | | | | |
CHINA (66.2%) | | | | | |
Aerospace & Defense (0.3%) | | | | | |
AVIC Aircraft Co., Ltd., ‘A’ | | | 39,200 | | | | 119,673 | |
China Avic Electronics Co., Ltd., ‘A’ | | | 46,006 | | | | 205,336 | |
| | | | | | | | |
| | | | | | | 325,009 | |
| | | | | | | | |
Airlines (0.2%) | | | | | |
China Eastern Airlines Corp., Ltd. (a) | | | 624,000 | | | | 299,340 | |
| | | | | | | | |
Auto Components (0.6%) | | | | | |
Fuyao Glass Industry Group Co., Ltd., ‘A’ | | | 91,200 | | | | 178,461 | |
Huayu Automotive Systems Co., Ltd., ‘A’ | | | 129,900 | | | | 324,122 | |
Minth Group Ltd. | | | 140,000 | | | | 290,664 | |
| | | | | | | | |
| | | | | | | 793,247 | |
| | | | | | | | |
Automobiles (1.4%) | | | | | |
Chongqing Changan Automobile Co., Ltd., ‘A’ | | | 78,902 | | | | 208,955 | |
Chongqing Changan Automobile Co., Ltd., ‘B’ | | | 449,619 | | | | 1,018,139 | |
FAW CAR Co., Ltd., ‘A’ | | | 45,800 | | | | 111,769 | |
Jiangling Motors Corp., Ltd., ‘A’ | | | 19,452 | | | | 95,002 | |
SAIC Motor Corp., Ltd., ‘A’ | | | 107,200 | | | | 370,984 | |
| | | | | | | | |
| | | | | | | 1,804,849 | |
| | | | | | | | |
Banks (15.1%) | | | | | |
Agricultural Bank of China Ltd. | | | 6,639,000 | | | | 3,356,035 | |
Agricultural Bank of China Ltd., ‘A’ | | | 1,220,700 | | | | 729,980 | |
Bank of Communications Co., Ltd., ‘A’ | | | 875,000 | | | | 959,059 | |
China Construction Bank Corp. | | | 6,077,000 | | | | 4,991,907 | |
China Construction Bank Corp., ‘A’ | | | 664,400 | | | | 720,731 | |
China Everbright Bank Co., Ltd., ‘A’ | | | 430,000 | | | | 338,233 | |
China Merchants Bank Co., Ltd., ‘A’ | | | 428,000 | | | | 1,144,507 | |
China Merchants Bank Co., Ltd. | | | 208,500 | | | | 523,223 | |
China Minsheng Banking Corp., Ltd. | | | 2,156,900 | | | | 2,837,057 | |
China Minsheng Banking Corp., Ltd., ‘A’ | | | 655,000 | | | | 1,148,678 | |
Industrial Bank Co., Ltd., ‘A’ | | | 279,000 | | | | 742,021 | |
Ping An Bank Co., Ltd., ‘A’ | | | 340,264 | | | | 868,759 | |
Shanghai Pudong Development Bank Co., Ltd., ‘A’ | | | 220,000 | | | | 556,383 | |
| | | | | | | | |
| | | | | | | 18,916,573 | |
| | | | | | | | |
| | | | | | | | |
| DESCRIPTION | | HOLDINGS
(IN SHARES) | | | VALUE
(IN US$) | |
Beverages (0.4%) | | | | | |
Jiangsu Yanghe Brewery Joint-Stock Co., Ltd., ‘A’ | | | 17,805 | | | | 226,867 | |
Kweichow Moutai Co., Ltd., ‘A’ | | | 10,500 | | | | 320,924 | |
| | | | | | | | |
| | | | | | | 547,791 | |
| | | | | | | | |
Biotechnology (0.1%) | | | | | |
Beijing SL Pharmaceutical Co., Ltd., ‘A’ | | | 15,000 | | | | 95,745 | |
| | | | | | | | |
Capital Markets (4.7%) | | | | | |
China Cinda Asset Management Co., Ltd. (a) | | | 1,696,000 | | | | 826,714 | |
China Merchants Securities Co., Ltd., ‘A’ | | | 89,200 | | | | 406,461 | |
CITIC Securities Co., Ltd., ‘A’ | | | 334,937 | | | | 1,830,169 | |
Founder Securities Co., Ltd., ‘A’ (a) | | | 113,000 | | | | 256,636 | |
GF Securities Co., Ltd., ‘A’ | | | 132,700 | | | | 555,056 | |
Haitong Securities Co., Ltd. | | | 381,600 | | | | 960,563 | |
Haitong Securities Co., Ltd., ‘A’ | | | 197,000 | | | | 763,994 | |
Huatai Securities Co., Ltd., ‘A’ | | | 65,000 | | | | 256,375 | |
| | | | | | | | |
| | | | | | | 5,855,968 | |
| | | | | | | | |
Chemicals (0.3%) | | | | | |
Qinghai Salt Lake Industry Co., Ltd., ‘A’ | | | 74,249 | | | | 259,704 | |
Shandong Hualu Hengsheng Chemical Co., Ltd., ‘A’ | | | 45,000 | | | | 79,352 | |
| | | | | | | | |
| | | | | | | 339,056 | |
| | | | | | | | |
Construction & Engineering (1.5%) | | | | | |
China Communications Construction Co., Ltd., ‘A’ | | | 165,700 | | | | 370,982 | |
China Railway Construction Corp., Ltd., ‘A’ | | | 289,700 | | | | 712,576 | |
China State Construction Engineering Corp., Ltd., ‘A’ | | | 587,000 | | | | 688,807 | |
Power Construction Corp of China Ltd., ‘A’ | | | 62,200 | | | | 84,518 | |
| | | | | | | | |
| | | | | | | 1,856,883 | |
| | | | | | | | |
Construction Materials (0.1%) | | | | | |
Anhui Conch Cement Co., Ltd., ‘A’ | | | 45,000 | | | | 160,155 | |
| | | | | | | | |
Diversified Consumer Services (0.5%) | | | | | |
China Maple Leaf Educational Systems Ltd. (a) | | | 1,776,000 | | | | 558,818 | |
| | | | | | | | |
Diversified Financial Services (0.2%) | | | | | |
Avic Capital Co., Ltd., ‘A’ | | | 76,000 | | | | 219,155 | |
| | | | | | | | |
SEE ACCOMPANYING NOTES TO FINANCIAL STATEMENTS.
| | | | | | | | |
| | | |
| DECEMBER 31, 2014 | | JPMORGAN CHINA REGION FUND, INC. | | | | | 11 | |
INVESTMENT PORTFOLIO
AT DECEMBER 31, 2014 (continued)
| | | | | | | | |
| DESCRIPTION | | HOLDINGS
(IN SHARES) | | | VALUE
(IN US$) | |
COMMON STOCK — continued | |
Diversified Telecommunication Services (2.2%) | |
China Telecom Corp., Ltd. | | | 4,300,000 | | | | 2,517,457 | |
Dr Peng Telcom & Media Group Co., Ltd., ‘A’ | | | 66,600 | | | | 193,016 | |
| | | | | | | | |
| | | | | | | 2,710,473 | |
| | | | | | | | |
Electrical Equipment (0.1%) | | | | | |
Henan Pinggao Electric Co., Ltd., ‘A’ | | | 56,600 | | | | 135,387 | |
| | | | | | | | |
Electronic Equipment, Instruments & Components (1.4%) | |
AAC Technologies Holdings, Inc. | | | 236,000 | | | | 1,264,506 | |
Hangzhou Hikvision Digital Technology Co., Ltd., ‘A’ | | | 100,380 | | | | 361,944 | |
Shenzhen O-film Tech Co., Ltd., ‘A’ | | | 36,000 | | | | 110,019 | |
| | | | | | | | |
| | | | | | | 1,736,469 | |
| | | | | | | | |
Food & Staples Retailing (0.4%) | | | | | |
Jointown Pharmaceutical Group Co., Ltd., ‘A’ | | | 24,802 | | | | 72,239 | |
Shanghai Bailian Group Co., Ltd., ‘A’ | | | 75,800 | | | | 218,579 | |
Yonghui Superstores Co., Ltd., ‘A’ | | | 128,000 | | | | 179,703 | |
| | | | | | | | |
| | | | | | | 470,521 | |
| | | | | | | | |
Food Products (2.1%) | | | | | |
Beijing Dabeinong Technology Group Co., Ltd., ‘A’ | | | 102,000 | | | | 220,638 | |
Gansu Yasheng Industrial Group Co., ‘A’ | | | 101,000 | | | | 152,054 | |
Henan Shuanghui Investment & Development Co., Ltd., ‘A’ | | | 25,500 | | | | 129,678 | |
Inner Mongolia Yili Industrial Group Co., Ltd., ‘A’ | | | 96,654 | | | | 446,035 | |
Tingyi Cayman Islands Holding Corp. | | | 346,000 | | | | 790,638 | |
Want Want China Holdings Ltd. | | | 717,000 | | | | 944,948 | |
| | | | | | | | |
| | | | | | | 2,683,991 | |
| | | | | | | | |
Health Care Equipment & Supplies (0.1%) | |
Shinva Medical Instrument Co., Ltd., ‘A’ | | | 26,000 | | | | 131,299 | |
| | | | | | | | |
Health Care Providers & Services (1.9%) | |
Aier Eye Hospital Group Co., Ltd., ‘A’ | | | 43,411 | | | | 192,775 | |
iKang Healthcare Group, Inc. ADR (a) | | | 49,779 | | | | 748,676 | |
Phoenix Healthcare Group Co., Ltd. | | | 532,000 | | | | 981,037 | |
| | | | | | | | |
| DESCRIPTION | | HOLDINGS
(IN SHARES) | | | VALUE
(IN US$) | |
Health Care Providers & Services — continued | |
Shanghai Pharmaceuticals Holding Co., Ltd., ‘A’ | | | 157,000 | | | | 417,553 | |
| | | | | | | | |
| | | | | | | 2,340,041 | |
| | | | | | | | |
Hotels, Restaurants & Leisure (0.1%) | | | | | |
China International Travel Service Corp. Ltd., ‘A’ | | | 25,050 | | | | 179,275 | |
| | | | | | | | |
Household Durables (1.3%) | | | | | |
Gree Electric Appliances, Inc. of Zhuhai, ‘A’ | | | 46,001 | | | | 275,235 | |
Midea Group Co., Ltd., ‘A’ | | | 99,000 | | | | 437,872 | |
Ozner Water International Holding Ltd. (a) (e) | | | 1,195,000 | | | | 459,221 | |
Qingdao Haier Co., Ltd., ‘A’ | | | 135,000 | | | | 403,869 | |
| | | | | | | | |
| | | | | | | 1,576,197 | |
| | | | | | | | |
Independent Power & Renewable Electricity Producers (1.8%) | |
CGN Power Co., Ltd. (a) (e) | | | 1,426,000 | | | | 619,708 | |
China Longyuan Power Group Corp., Ltd. | | | 664,000 | | | | 691,002 | |
China Yangtze Power Co., Ltd., ‘A’ | | | 209,000 | | | | 359,451 | |
GD Power Development Co., Ltd., ‘A’ | | | 200,000 | | | | 149,259 | |
Huaneng Power International, Inc., ‘A’ | | | 172,000 | | | | 244,803 | |
SDIC Power Holdings Co., Ltd., ‘A’ | | | 118,100 | | | | 217,773 | |
| | | | | | | | |
| | | | | | | 2,281,996 | |
| | | | | | | | |
Insurance (6.9%) | | | | | |
China Life Insurance Co., Ltd., ‘A’ | | | 50,000 | | | | 275,226 | |
China Pacific Insurance Group Co., Ltd. | | | 470,000 | | | | 2,387,986 | |
China Pacific Insurance Group Co., Ltd., ‘A’ | | | 65,000 | | | | 338,411 | |
Ping An Insurance Group Co. of China Ltd. | | | 386,500 | | | | 3,942,428 | |
Ping An Insurance Group Co. of China Ltd., ‘A’ | | | 141,776 | | | | 1,707,299 | |
| | | | | | | | |
| | | | | | | 8,651,350 | |
| | | | | | | | |
Internet & Catalog Retail (0.2%) | | | | | |
JD.com, Inc. ADR (a) | | | 10,006 | | | | 231,539 | |
| | | | | | | | |
Internet Software & Services (6.9%) | | | | | |
Alibaba Group Holding Ltd. ADR (a) | | | 16,701 | | | | 1,735,902 | |
Leju Holdings Ltd. ADR (a) | | | 3,757 | | | | 40,424 | |
Tencent Holdings Ltd. | | | 422,800 | | | | 6,133,739 | |
YY, Inc. ADR (a) | | | 12,006 | | | | 748,454 | |
| | | | | | | | |
| | | | | | | 8,658,519 | |
| | | | | | | | |
SEE ACCOMPANYING NOTES TO FINANCIAL STATEMENTS.
| | | | | | |
| | | |
| 12 | | | | JPMORGAN CHINA REGION FUND, INC. | | DECEMBER 31, 2014 |
| | | | | | | | |
| DESCRIPTION | | HOLDINGS
(IN SHARES) | | | VALUE
(IN US$) | |
COMMON STOCK — continued | |
Machinery (2.5%) | | | | | |
China CNR Corp., Ltd., ‘A’ | | | 212,900 | | | | 243,648 | |
China Conch Venture Holdings Ltd. | | | 513,000 | | | | 1,118,000 | |
China Shipbuilding Industry Co., Ltd., ‘A’ | | | 493,600 | | | | 732,762 | |
Guangxi Liugong Machinery Co., Ltd., ‘A’ | | | 75,000 | | | | 152,079 | |
Sany Heavy Industry Co., Ltd., ‘A’ | | | 203,000 | | | | 326,554 | |
Siasun Robot & Automation Co., Ltd., ‘A’ | | | 12,500 | | | | 79,364 | |
Weichai Power Co., Ltd., ‘A’ | | | 50,660 | | | | 222,842 | |
Zoomlion Heavy Industry Science and Technology Co., Ltd., ‘A’ | | | 210,000 | | | | 238,975 | |
| | | | | | | | |
| | | | | | | 3,114,224 | |
| | | | | | | | |
Media (0.0%) | | | | | |
China South Publishing & Media Group Co., Ltd., ‘A’ | | | 20,000 | | | | 53,514 | |
| | | | | | | | |
Metals & Mining (0.7%) | | | | | |
Baoshan Iron & Steel Co., Ltd., ‘A’ | | | 212,000 | | | | 239,542 | |
China Minmetals Rare Earth Co., Ltd., ‘A’ (a) | | | 30,000 | | | | 145,019 | |
Inner Mongolia Baotou Steel Rare-Earth Hi-Tech Co., Ltd., ‘A’ | | | 35,000 | | | | 146,003 | |
Shenzhen Zhongjin Lingnan Nonfemet Co., Ltd., ‘A’ | | | 191,000 | | | | 292,165 | |
| | | | | | | | |
| | | | | | | 822,729 | |
| | | | | | | | |
Multiline Retail (0.6%) | | | | | |
Intime Retail Group Co., Ltd. | | | 810,500 | | | | 587,391 | |
Wuhan Department Store Group Co., Ltd., ‘A’ (a) | | | 64,535 | | | | 164,562 | |
| | | | | | | | |
| | | | | | | 751,953 | |
| | | | | | | | |
Oil, Gas & Consumable Fuels (2.8%) | | | | | |
China Petroleum & Chemical Corp. | | | 2,553,400 | | | | 2,057,959 | |
China Shenhua Energy Co., Ltd., ‘A’ | | | 69,000 | | | | 225,662 | |
CNOOC Ltd. | | | 739,000 | | | | 994,908 | |
Jizhong Energy Resources Co., Ltd., ‘A’ | | | 139,000 | | | | 186,857 | |
| | | | | | | | |
| | | | | | | 3,465,386 | |
| | | | | | | | |
Pharmaceuticals (2.3%) | | | | | |
CSPC Pharmaceutical Group Ltd. | | | 1,154,000 | | | | 1,017,887 | |
Jiangsu Hengrui Medicine Co., Ltd., ‘A’ | | | 50,745 | | | | 306,564 | |
| | | | | | | | |
| DESCRIPTION | | HOLDINGS
(IN SHARES) | | | VALUE
(IN US$) | |
Pharmaceuticals — continued | | | | | |
Luye Pharma Group Ltd. (a) | | | 852,000 | | | | 1,097,597 | |
Tasly Pharmaceutical Group Co., Ltd., ‘A’ | | | 59,447 | | | | 393,822 | |
| | | | | | | | |
| | | | | | | 2,815,870 | |
| | | | | | | | |
Real Estate Management & Development (4.6%) | |
Beijing Capital Development Co., Ltd., ‘A’ | | | 165,000 | | | | 268,085 | |
China Vanke Co., Ltd. (a) | | | 811,300 | | | | 1,809,945 | |
China Vanke Co., Ltd., ‘A’ | | | 559,000 | | | | 1,252,434 | |
E-House China Holdings Ltd. ADR | | | 75,138 | | | | 543,999 | |
Poly Real Estate Group Co., Ltd., ‘A’ | | | 294,450 | | | | 513,532 | |
Sunac China Holdings Ltd. | | | 1,293,000 | | | | 1,315,568 | |
| | | | | | | | |
| | | | | | | 5,703,563 | |
| | | | | | | | |
Road & Rail (0.8%) | | | | | |
CAR, Inc. (a) | | | 642,000 | | | | 862,662 | |
Daqin Railway Co., Ltd., ‘A’ | | | 64,980 | | | | 111,651 | |
| | | | | | | | |
| | | | | | | 974,313 | |
| | | | | | | | |
Semiconductors & Semiconductor Equipment (0.4%) | |
Hua Hong Semiconductor Ltd. (a) (e) | | | 420,000 | | | | 554,609 | |
| | | | | | | | |
Software (0.2%) | | | | | |
Aisino Co., Ltd., ‘A’ | | | 53,000 | | | | 260,643 | |
Yonyou Software Co., Ltd., ‘A’ | | | 12,000 | | | | 45,435 | |
| | | | | | | | |
| | | | | | | 306,078 | |
| | | | | | | | |
Specialty Retail (0.2%) | |
Pang Da Automobile Trade Co., Ltd., ‘A’ (a) | | | 137,300 | | | | 131,679 | |
Suning Commerce Group Co., Ltd., ‘A’ (a) | | | 96,200 | | | | 139,555 | |
| | | | | | | | |
| | | | | | | 271,234 | |
| | | | | | | | |
Transportation Infrastructure (0.3%) | |
Shanghai International Airport Co., Ltd., ‘A’ | | | 73,000 | | | | 230,861 | |
Sichuan Haite High-tech Co., Ltd., ‘A’ | | | 38,900 | | | | 137,943 | |
| | | | | | | | |
| | | | | | | 368,804 | |
| | | | | | | | |
TOTAL CHINA | | | | | | | 82,761,923 | |
| | | | | | | | |
SEE ACCOMPANYING NOTES TO FINANCIAL STATEMENTS.
| | | | | | | | |
| | | |
| DECEMBER 31, 2014 | | JPMORGAN CHINA REGION FUND, INC. | | | | | 13 | |
INVESTMENT PORTFOLIO
AT DECEMBER 31, 2014 (continued)
| | | | | | | | |
| DESCRIPTION | | HOLDINGS
(IN SHARES) | | | VALUE
(IN US$) | |
COMMON STOCK — continued | |
HONG KONG (24.7%) | |
Banks (3.0%) | |
BOC Hong Kong Holdings Ltd. | | | 640,000 | | | | 2,141,683 | |
Dah Sing Financial Holdings Ltd. | | | 213,769 | | | | 1,247,387 | |
HSBC Holdings plc | | | 38,444 | | | | 366,858 | |
| | | | | | | | |
| | | | | | | 3,755,928 | |
| | | | | | | | |
Commercial Services & Supplies (1.2%) | |
China Everbright International Ltd. | | | 1,021,000 | | | | 1,519,390 | |
| | | | | | | | |
Distributors (0.3%) | |
Dah Chong Hong Holdings Ltd. | | | 646,000 | | | | 349,047 | |
| | | | | | | | |
Diversified Financial Services (0.5%) | |
Hong Kong Exchanges and Clearing Ltd. | | | 29,100 | | | | 644,319 | |
| | | | | | | | |
Diversified Telecommunication Services (1.1%) | |
China Unicom Hong Kong Ltd. | | | 976,000 | | | | 1,308,944 | |
| | | | | | | | |
Electric Utilities (0.1%) | |
Cheung Kong Infrastructure Holdings Ltd. | | | 11,000 | | | | 81,422 | |
| | | | | | | | |
Gas Utilities (0.7%) | |
China Resources Gas Group Ltd. | | | 358,000 | | | | 930,242 | |
| | | | | | | | |
Hotels, Restaurants & Leisure (1.6%) | |
Melco Crown Entertainment Ltd. ADR | | | 26,426 | | | | 671,221 | |
REXLot Holdings Ltd. | | | 2,773,240 | | | | 225,302 | |
Sands China Ltd. | | | 230,000 | | | | 1,131,515 | |
| | | | | | | | |
| | | | | | | 2,028,038 | |
| | | | | | | | |
Industrial Conglomerates (1.9%) | |
Hutchison Whampoa Ltd. | | | 132,000 | | | | 1,519,217 | |
Shun Tak Holdings Ltd. | | | 1,892,000 | | | | 875,898 | |
| | | | | | | | |
| | | | | | | 2,395,115 | |
| | | | | | | | |
Insurance (3.7%) | |
AIA Group Ltd. | | | 823,600 | | | | 4,582,843 | |
| | | | | | | | |
Marine (0.9%) | |
Orient Overseas International Ltd. | | | 199,500 | | | | 1,166,697 | |
| | | | | | | | |
Multiline Retail (0.9%) | |
Lifestyle International Holdings Ltd. | | | 502,000 | | | | 1,056,481 | |
| | | | | | | | |
Pharmaceuticals (0.7%) | |
Sino Biopharmaceutical Ltd. | | | 1,004,000 | | | | 910,179 | |
| | | | | | | | |
| | | | | | | | |
| DESCRIPTION | | HOLDINGS
(IN SHARES) | | | VALUE
(IN US$) | |
Real Estate Investment Trusts (REITs) (1.0%) | |
Champion REIT | | | 1,310,000 | | | | 608,151 | |
Yuexiu Real Estate Investment Trust | | | 1,201,000 | | | | 602,463 | |
| | | | | | | | |
| | | | | | | 1,210,614 | |
| | | | | | | | |
Real Estate Management & Development (4.4%) | |
Cheung Kong Holdings Ltd. | | | 122,000 | | | | 2,049,944 | |
Hang Lung Properties Ltd. | | | 410,000 | | | | 1,149,955 | |
Hongkong Land Holdings Ltd. | | | 207,000 | | | | 1,399,320 | |
New World Development Co., Ltd. | | | 607,207 | | | | 698,457 | |
Wharf Holdings Ltd. (The) | | | 33,000 | | | | 238,309 | |
| | | | | | | | |
| | | | | | | 5,535,985 | |
| | | | | | | | |
Specialty Retail (0.9%) | |
Chow Tai Fook Jewellery Group Ltd. | | | 815,600 | | | | 1,093,826 | |
| | | | | | | | |
Textiles, Apparel & Luxury Goods (0.7%) | |
Samsonite International S.A. | | | 308,100 | | | | 913,813 | |
| | | | | | | | |
Water Utilities (1.1%) | |
Beijing Enterprises Water Group Ltd. (a) | | | 1,980,000 | | | | 1,350,699 | |
| | | | | | | | |
TOTAL HONG KONG | | | | | | | 30,833,582 | |
| | | | | | | | |
|
TAIWAN (20.1%) | |
Banks (1.1%) | |
E.Sun Financial Holding Co., Ltd. | | | 2,131,044 | | | | 1,325,075 | |
| | | | | | | | |
Chemicals (0.5%) | |
China Steel Chemical Corp. | | | 123,000 | | | | 603,285 | |
| | | | | | | | |
Diversified Financial Services (2.6%) | |
Chailease Holding Co., Ltd. | | | 398,000 | | | | 992,418 | |
Fubon Financial Holding Co., Ltd. | | | 1,429,989 | | | | 2,294,173 | |
| | | | | | | | |
| | | | | | | 3,286,591 | |
| | | | | | | | |
Electronic Equipment, Instruments & Components (2.5%) | |
Delta Electronics, Inc. | | | 279,000 | | | | 1,664,182 | |
Largan Precision Co., Ltd. | | | 20,000 | | | | 1,515,727 | |
| | | | | | | | |
| | | | | | | 3,179,909 | |
| | | | | | | | |
Food & Staples Retailing (0.9%) | |
President Chain Store Corp. | | | 143,000 | | | | 1,106,370 | |
| | | | | | | | |
Health Care Equipment & Supplies (0.3%) | |
St Shine Optical Co., Ltd. | | | 24,000 | | | | 396,431 | |
| | | | | | | | |
Internet Software & Services (0.6%) | |
PChome Online, Inc. | | | 66,917 | | | | 725,241 | |
| | | | | | | | |
SEE ACCOMPANYING NOTES TO FINANCIAL STATEMENTS.
| | | | | | |
| | | |
| 14 | | | | JPMORGAN CHINA REGION FUND, INC. | | DECEMBER 31, 2014 |
| | | | | | | | |
| DESCRIPTION | | HOLDINGS
(IN SHARES) | | | VALUE
(IN US$) | |
COMMON STOCK — continued | |
Leisure Products (0.6%) | |
Johnson Health Tech Co., Ltd. | | | 180,288 | | | | 407,904 | |
Merida Industry Co., Ltd. | | | 47,950 | | | | 325,463 | |
| | | | | | | | |
| | | | | | | 733,367 | |
| | | | | | | | |
Real Estate Management & Development (0.5%) | |
Ruentex Development Co., Ltd. | | | 394,992 | | | | 629,947 | |
| | | | | | | | |
Semiconductors & Semiconductor Equipment (9.5%) | |
Advanced Semiconductor Engineering, Inc. | | | 1,156,802 | | | | 1,394,664 | |
Chipbond Technology Corp. | | | 374,000 | | | | 686,412 | |
MediaTek, Inc. | | | 108,000 | | | | 1,578,887 | |
Powertech Technology, Inc. (a) | | | 292,000 | | | | 500,804 | |
Taiwan Semiconductor Manufacturing Co., Ltd. | | | 1,737,057 | | | | 7,750,302 | |
| | | | | | | | |
| | | | | | | 11,911,069 | |
| | | | | | | | |
Technology Hardware, Storage & Peripherals (0.9%) | |
Asustek Computer, Inc. | | | 104,000 | | | | 1,140,307 | |
| | | | | | | | |
Textiles, Apparel & Luxury Goods (0.1%) | |
Pou Chen Corp. | | | 108,000 | | | | 131,403 | |
| | | | | | | | |
TOTAL TAIWAN | | | | | | | 25,168,995 | |
| | | | | | | | |
TOTAL INVESTMENTS
(111.0% of Net Assets)
(Cost $110,900,213) | | | | | | | 138,764,500 | |
| | | | | | | | |
Liabilities in excess of other assets
(-11.0% of Net Assets) | | | | (13,742,193 | ) |
| | | | | | | | |
NET ASSETS (100.0%) | | | | | | | 125,022,307 | |
| | | | | | | | |
| | | | |
As of December 31, 2014, aggregate cost for Federal income tax purposes was $111,279,676. The aggregate unrealized gain for all securities is as follows: | |
Excess of value over cost | | | 31,529,533 | |
Excess of cost over value | | | (4,044,709 | ) |
| | | | |
Net unrealized gain | | | 27,484,824 | |
| | | | |
NOTES TO SCHEDULE OF PORTFOLIO INVESTMENTS:
| ADR – | American Depositary Receipt |
| (a) | Non-income producing security. |
| (e) | Security is exempt from registration under Rule 144A of the Securities Act of 1933, as amended. Unless otherwise indicated, this security has been determined to be liquid under procedures established by the Board of Directors and may be resold in transactions exempt from registration, normally to qualified institutional buyers. |
| A | China A shares (See Note 7.iii on page 25) |
| B | China B shares (See Note 7.iii on page 25) |
SEE ACCOMPANYING NOTES TO FINANCIAL STATEMENTS.
| | | | | | | | |
| | | |
| DECEMBER 31, 2014 | | JPMORGAN CHINA REGION FUND, INC. | | | | | 15 | |
STATEMENT OF ASSETS AND LIABILITIES
AT DECEMBER 31, 2014
| | | | |
| | | (in US$) | |
ASSETS: | | | | |
Investments in non-affiliates, at value (cost $110,900,213) | | | 138,764,500 | |
Cash | | | 1,106,048 | |
Foreign currency, at value (cost $1,160,677) | | | 1,162,989 | |
Deposits at broker (See Note 7.iii.) | | | 28,431 | |
Receivable for securities sold | | | 860,373 | |
Dividends receivable | | | 49,228 | |
| | | | |
Total Assets | | | 141,971,569 | |
| | | | |
| |
LIABILITIES: | | | | |
Loan payable to bank (See Note 6) | | | 15,000,000 | |
Payables | | | | |
Payable for securities purchased | | | 1,109,948 | |
Accrued Liabilities | | | | |
Deferred China capital gains tax | | | 496,421 | |
Custodian and accounting fees | | | 91,829 | |
Administration fees | | | 59,200 | |
Investment advisory fees | | | 34,557 | |
Interest on loan | | | 16,430 | |
Directors’ fees and expenses | | | 6,849 | |
Other | | | 134,028 | |
| | | | |
Total Liabilities | | | 16,949,262 | |
| | | | |
Net Assets | | | 125,022,307 | |
| | | | |
| |
| Net assets consist of: | | | | |
Common stock, $0.01 par value
(100,000,000 shares authorized; 6,447,637 shares issued and outstanding) | | | 64,476 | |
Paid-in capital | | | 98,994,144 | |
Undistributed net investment income | | | 1,491,587 | |
Accumulated realized loss on investments and foreign currency transactions | | | (3,393,798 | ) |
Accumulated net unrealized appreciation on investments, foreign currency holdings, and other
assets and liabilities denominated in foreign currencies | | | 27,865,898 | |
| | | | |
Net Assets | | | 125,022,307 | |
| | | | |
Net Asset Value Per Share ($125,022,307 ÷ 6,447,637) | | | 19.39 | |
| | | | |
SEE ACCOMPANYING NOTES TO FINANCIAL STATEMENTS.
| | | | | | |
| | | |
| 16 | | | | JPMORGAN CHINA REGION FUND, INC. | | DECEMBER 31, 2014 |
STATEMENT OF OPERATIONS
FOR THE YEAR ENDED DECEMBER 31, 2014
| | | | |
| | | (in US$) | |
INVESTMENT INCOME: | | | | |
Dividends from non-affiliates (net of foreign withholding tax of $291,822) | | | 3,273,820 | |
Interest income from non-affiliates | | | 5,895 | |
Interest income from affiliates | | | 465 | |
| | | | |
Total Investment Income | | | 3,280,180 | |
| | | | |
| |
EXPENSES: | | | | |
Investment advisory fees | | | 1,206,369 | |
Directors’ fees and expenses | | | 366,189 | |
Interest expense to non-affiliates (See Note 6) | | | 225,281 | |
Custodian and accounting fees | | | 185,931 | |
Legal fees | | | 89,018 | |
Administration fees | | | 88,367 | |
Audit fees | | | 71,942 | |
Insurance fees | | | 41,493 | |
Shareholder service fees | | | 30,846 | |
NYSE listing fees | | | 25,430 | |
Shareholder report fees | | | 11,322 | |
Interest expense to affiliates | | | 2 | |
Other expenses | | | 30,553 | |
| | | | |
Total Expenses | | | 2,372,743 | |
| | | | |
Net Investment Income | | | 907,437 | |
| | | | |
| |
REALIZED AND UNREALIZED GAIN (LOSS) ON INVESTMENTS, FOREIGN CURRENCY
HOLDINGS AND OTHER ASSETS AND LIABILITIES DENOMINATED IN FOREIGN CURRENCIES: | | | | |
Net realized gain (loss) | | | | |
Investments in non-affiliates (net of China tax of $138,405 on realized gain) | | | 7,467,309 | |
Investments in affiliates | | | 885,684 | |
Foreign currency transactions | | | (31,963 | ) |
| | | | |
Net realized gain (loss) | | | 8,321,030 | |
| | | | |
Net change in unrealized appreciation/depreciation | | | | |
Investments in non-affiliates (net of a reduction in China tax of $170,734 on unrealized appreciation) | | | 5,402,471 | |
Investments in affiliates | | | (221,422 | ) |
Foreign currency translations | | | (3,956 | ) |
| | | | |
Change in net unrealized appreciation/depreciation | | | 5,177,093 | |
| | | | |
Net realized and unrealized gain (loss) on investments, foreign currency holdings and other assets and liabilities denominated in foreign currencies | | | 13,498,123 | |
| | | | |
Net increase in net assets resulting from operations | | | 14,405,560 | |
| | | | |
SEE ACCOMPANYING NOTES TO FINANCIAL STATEMENTS.
| | | | | | | | |
| | | |
| DECEMBER 31, 2014 | | JPMORGAN CHINA REGION FUND, INC. | | | | | 17 | |
STATEMENTS OF CHANGES IN NET ASSETS
FOR THE PERIODS INDICATED
| | | | | | | | |
| | | Year Ended
December 31, 2014
(in US$) | | | Year Ended
December 31, 2013
(in US$) | |
INCREASE IN NET ASSETS: | | | | | | | | |
Operations | | | | | | | | |
Net investment income | | | 907,437 | | | | 641,115 | |
Net realized gain (loss) on investment transactions | | | 8,321,030 | | | | 5,738,325 | |
Net change in unrealized appreciation (depreciation) on investments, foreign currency holdings and other assets and liabilities denominated in foreign currencies | | | 5,177,093 | | | | 6,159,859 | |
| | | | | | | | |
Net increase (decrease) in net assets resulting from operations | �� | | 14,405,560 | | | | 12,539,299 | |
| | | | | | | | |
| | |
DISTRIBUTIONS TO STOCKHOLDERS: | | | | | | | | |
Net investment income | | | (818,850 | ) | | | (831,745 | ) |
| | | | | | | | |
Total distributions to shareholders | | | (818,850 | ) | | | (831,745 | ) |
| | | | | | | | |
Total increase (decrease) in net assets | | | 13,586,710 | | | | 11,707,554 | |
| | | | | | | | |
| | |
NET ASSETS: | | | | | | | | |
Beginning of period | | | 111,435,597 | | | | 99,728,043 | |
| | | | | | | | |
End of period (including undistributed net investment income of $1,491,587 and $534,460, respectively) | | | 125,022,307 | | | | 111,435,597 | |
| | | | | | | | |
| | |
SHARE TRANSACTIONS | | | | | | | | |
Opening number of shares | | | 6,447,637 | | | | 6,447,637 | |
| | | | | | | | |
Closing number of shares | | | 6,447,637 | | | | 6,447,637 | |
| | | | | | | | |
SEE ACCOMPANYING NOTES TO FINANCIAL STATEMENTS.
| | | | | | |
| | | |
| 18 | | | | JPMORGAN CHINA REGION FUND, INC. | | DECEMBER 31, 2014 |
STATEMENT OF CASH FLOWS
FOR THE YEAR ENDED DECEMBER 31, 2014
| | | | |
| | | (in US$) | |
INCREASE (DECREASE) IN CASH | | | | |
Cash flows provided (used) by operating activities: | | | | |
Net increase/decrease in net assets from operations | | | 14,405,560 | |
Adjustments to reconcile net increase/decrease in net assets
from operations to net cash provided (used) by operating activities: | | | | |
Purchase of investment securities | | | (107,376,521 | ) |
Proceeds from disposition of investment securities | | | 107,954,750 | |
Change in unrealized (appreciation)/depreciation on investments | | | (5,181,049 | ) |
Net realized (gain)/loss on investments | | | (8,352,993 | ) |
Decrease in deposits at broker | | | 704 | |
Increase in dividends receivable | | | (48,449 | ) |
Increase in accrued expenses and other liabilities | | | 169,264 | |
| | | | |
Net cash provided (used) by operating activities | | | 1,571,266 | |
| | | | |
| |
Cash flows provided (used) by financing activities: | | | | |
Cash distributions paid to shareholders | | | (818,850 | ) |
| | | | |
Net cash provided (used) by financing activities | | | (818,850 | ) |
| | | | |
Net increase/decrease in cash | | | 752,416 | |
| | | | |
| |
Cash: | | | | |
Beginning of period (including foreign currency of $1,497,939) | | | 1,516,621 | |
| | | | |
End of period (including foreign currency of $1,162,989) | | | 2,269,037 | |
| | | | |
Supplemental disclosure of cash flow information:
During 2014, the Fund paid $213,568 in interest expense, including $2 to affiliates.
For purposes of reporting the Statement of Cash Flows, the Fund considers all cash accounts that are not subject to withdrawal restrictions or penalties to be cash equivalents.
SEE ACCOMPANYING NOTES TO FINANCIAL STATEMENTS.
| | | | | | | | |
| | | |
| DECEMBER 31, 2014 | | JPMORGAN CHINA REGION FUND, INC. | | | | | 19 | |
FINANCIAL HIGHLIGHTS
FOR THE PERIODS INDICATED
| | | | | | | | | | | | | | | | | | | | |
| | | For the
Year Ended
December 31,
2014
(in US$) | | | For the
Year Ended
December 31,
2013
(in US$) | | | For the
Year Ended
December 31,
2012
(in US$) | | | For the
Year Ended
December 31,
2011
(in US$) | | | For the
Year Ended
December 31,
2010
(in US$) | |
For a share outstanding throughout each year: | | | | | | | | | | | | | | | | | | | | |
Net asset value, beginning of period | | | 17.28 | | | | 15.47 | | | | 12.75 | | | | 17.41 | | | | 15.27 | |
| | | | | | | | | | | | | | | | | | | | |
Net investment income | | | 0.14 | | | | 0.10 | | | | 0.08 | | | | 0.14 | | | | 0.05 | |
Net realized and unrealized gain (loss) | | | 2.10 | | | | 1.84 | | | | 2.74 | | | | (4.70 | ) | | | 2.11 | |
| | | | | | | | | | | | | | | | | | | | |
Total from investment operations | | | 2.24 | | | | 1.94 | | | | 2.82 | | | | (4.56 | ) | | | 2.16 | |
| | | | | | | | | | | | | | | | | | | | |
Dividends from net investment income | | | (0.13 | ) | | | (0.13 | ) | | | (0.10 | ) | | | (0.10 | ) | | | (0.02 | ) |
| | | | | | | | | | | | | | | | | | | | |
Net asset value, end of period | | | 19.39 | | | | 17.28 | | | | 15.47 | | | | 12.75 | | | | 17.41 | |
| | | | | | | | | | | | | | | | | | | | |
Market value, end of period | | | 16.91 | | | | 15.16 | | | | 14.00 | | | | 11.02 | | | | 15.79 | |
| | | | | | | | | | | | | | | | | | | | |
Total Investment Return | | | | | | | | | | | | | | | | | | | | |
Per share market value* | | | 12.5 | % | | | 9.2 | % | | | 28.2 | % | | | (29.6 | )% | | | 14.7 | % |
| | | | | |
RATIOS/SUPPLEMENTAL DATA | | | | | | | | | | | | | | | | | | | | |
Net assets, end of period | | | 125,022,307 | | | | 111,435,597 | | | | 99,728,043 | | | | 82,226,478 | | | | 112,248,790 | |
Ratios of total expenses to average net assets | | | 2.14 | % | | | 2.26 | % | | | 2.11 | % | | | 1.89 | % | | | 1.99 | % |
Ratios of total expenses to average net assets, excluding interest expense | | | 1.94 | % | | | 2.05 | % | | | 2.04 | % | | | 1.89 | % | | | 1.99 | % |
Ratios of net investment income to average net assets | | | 0.82 | % | | | 0.61 | % | | | 0.54 | % | | | 0.87 | % | | | 0.32 | % |
Portfolio turnover rate | | | 86.7 | % | | | 66.6 | % | | | 85.8 | % | | | 66.8 | % | | | 76.1 | % |
Number of shares outstanding at end of period (in thousands) | | | 6,448 | | | | 6,448 | | | | 6,448 | | | | 6,448 | | | | 6,448 | |
| * | The total investment return excludes the effect of commissions. Dividends and distributions, if any, are assumed for the purpose of this calculation to be reinvested at prices obtained under the Fund’s dividend reinvestment plan or if specified in accordance with the terms of the distribution. |
SEE ACCOMPANYING NOTES TO FINANCIAL STATEMENTS.
| | | | | | |
| | | |
| 20 | | | | JPMORGAN CHINA REGION FUND, INC. | | DECEMBER 31, 2014 |
NOTES TO FINANCIAL STATEMENTS
AT DECEMBER 31, 2014
1. Organization and Capital
JPMorgan China Region Fund, Inc. (the ‘Fund’) was incorporated in the State of Maryland on May 22, 1992, and is registered as a non-diversified, closed-end management investment company under the Investment Company Act of 1940 (‘1940 Act’). The Fund commenced operations on July 16, 1992.
The Fund seeks to achieve long-term capital appreciation through investments primarily in equity securities of companies with substantial assets in, or revenues derived from, the People’s Republic of China (‘China’), Hong Kong, Taiwan and Macau — collectively, the ‘China Region’.
2. Significant Accounting Policies
The following significant accounting policies, which are in conformity with U.S. generally accepted accounting principles (‘GAAP’), are consistently followed by the Fund in the preparation of its financial statements.
The Fund is an investment company and, accordingly, follows the investment company accounting and reporting guidance of the Financial Accounting Standards Board Accounting Standards Codification Topic 946 — Investment Companies, which is part of GAAP.
The preparation of financial statements in conformity with GAAP requires management to make estimates and assumptions that affect the reported amounts of assets and liabilities and disclosure of contingent assets and liabilities at the date of the financial statements and the reported amounts of increases and decreases in net assets from operations during the reported period. Actual results could differ from these estimates.
i) Security Valuation — All securities for which market quotations are readily available are valued at the last sales price prior to the time of determination or, if no sales price is available at that time, at the mean between the last current bid and ask prices. Securities that are traded over-the-counter are valued, if bid and ask quotations are available, at the mean between the current bid and ask prices. Certain investments of the Fund may, depending upon market conditions, trade in relatively thin markets and/or in markets that experience significant volatility. As a result of these conditions, the prices used by the Fund to value securities may differ from the value that would be realized if these securities were sold and the differences could be material. All other securities and assets are valued at fair value as determined in good faith by the Board of Directors. It is possible that the estimated values may differ significantly from the values that would have been used had a ready market for the investments existed, and such differences could be material. In valuing the Fund’s assets, quotations of foreign securities in a foreign currency are translated to United States (‘U.S.’) dollar equivalents at the prevailing exchange rate in effect on the valuation date. Investments in open ended mutual funds are valued at current day’s closing net asset value per share (‘NAV’).
Valuations reflected in this report are as of the report date. As a result, changes in valuation due to market events and/or issuer related events after the report date and prior to issuance of the report are not reflected herein.
The various inputs that are used in determining the fair value of the Fund’s investments are summarized into the three broad levels listed below.
| • | | Level 1 — quoted prices in active markets for identical securities |
| • | | Level 2 — other significant observable inputs (including quoted prices for similar securities, interest rates, prepayment speeds, credit risk, etc.) |
| • | | Level 3 — significant unobservable inputs (including the Fund’s own assumptions in determining the fair value of investments) |
A financial instrument’s level within the fair value hierarchy is based on the lowest level of any input, both individually and in the aggregate, that is significant to the fair value measurement. The inputs or methodology used for valuing securities are not necessarily an indication of the risk associated with investing in those securities.
| | | | | | | | |
| | | |
| DECEMBER 31, 2014 | | JPMORGAN CHINA REGION FUND, INC. | | | | | 21 | |
NOTES TO FINANCIAL STATEMENTS
AT DECEMBER 31, 2014 (continued)
The following table represents each valuation input as presented on the Investment Portfolio:
| | | | | | | | | | | | | | | | |
| | | Level 1
Quoted prices | | | Level 2
Other significant
observable inputs | | | Level 3 Significant
unobservable inputs | | | Total | |
Total Investments in Securities (a) | | $ | 138,599,938 | | | $ | 164,562 | | | $ | — | | | $ | 138,764,500 | |
| | | | | | | | | | | | | | | | |
| (a) | All portfolio holdings are designated as Level 1 with the exception of Wuhan Department Store Group Co., Ltd., ‘A’ which has been designated as Level 2. Please refer to the Investment Portfolio for industry specifics of portfolio holdings. |
ii) Foreign Currency Translation — The books and records of the Fund are maintained in U.S. dollars. Foreign currency amounts are translated into U.S. dollars at the mid-market price of such currencies against U.S. dollars as follows:
| • | | investments, other assets, and liabilities at the prevailing rates of exchange on the valuation date; |
| • | | investment transactions and investment income at the prevailing rates of exchange on the dates of such transactions. |
Although the net assets of the Fund are presented at the foreign exchange rates and market values at the close of the period, the Fund does not isolate that portion of the results of operations arising as a result of changes in the foreign exchange rates from the fluctuations arising from changes in the market prices of the securities held. Similarly, the Fund does not isolate the effect of changes in foreign exchange rates from the fluctuations arising from changes in the market prices of securities sold during the period. Accordingly, realized and unrealized foreign currency gains (losses) are included in the reported net unrealized appreciation/depreciation on investments. The Fund does isolate the effect of changes in foreign exchange rates from fluctuations when determining realized gain or loss for sales of fixed income securities.
Unrealized currency gains (losses) resulting from valuing foreign currency denominated assets and liabilities at period-end exchange rates are reflected as a component of accumulated net unrealized gain (loss) on investments, foreign currency holdings, and other assets and liabilities denominated in foreign currencies.
iii) Restricted and Illiquid Securities — Certain securities held by the Fund may be subject to legal or contractual restrictions on resale or are illiquid. Restricted securities generally may be resold in transactions exempt from registration under the Securities Act of 1933 (the ‘Securities Act’). Illiquid securities are securities which cannot be disposed of promptly (within seven days) and in the usual course of business at approximately its fair value and include, but are not limited to, repurchase agreements maturing in excess of seven days, time deposits with a withdrawal penalty, non-negotiable instruments and instruments for which no market exists. Disposal of these securities may involve time-consuming negotiations and expense. Prompt sale at the current valuation may be difficult and could adversely affect the net assets of the Fund.
iv) Distribution of Income and Gains — The Fund intends to distribute to stockholders, at least annually, substantially all of its net investment income and expects to distribute annually any net long-term capital gains in excess of net short-term capital losses.
Income and capital gain distributions are determined in accordance with Federal income tax regulations and may differ from those determined in accordance with GAAP.
v) Other — Security transactions are accounted for on trade date. Realized gains and losses on the sale of investment securities are determined on the identified cost basis. Interest income is recognized on the accrual basis. Dividend income, net of foreign taxes withheld, if any, is recorded on the ex-dividend date or when the Fund first learns of the dividend.
vi) Foreign Taxes — The Fund may be subject to foreign taxes on income, gains on investments or currency purchases/repatriation, a portion of which may be recoverable. The Fund will accrue such taxes and recoveries as applicable, based upon its current interpretation of tax rules and regulations that exist in the markets in which it invests.
| | | | | | |
| | | |
| 22 | | | | JPMORGAN CHINA REGION FUND, INC. | | DECEMBER 31, 2014 |
NOTES TO FINANCIAL STATEMENTS
AT DECEMBER 31, 2014 (continued)
As described in Note 7.iii, the Fund invests in China A-shares, which are separately identified in the Investment Portfolio.
On November 14, 2014, the People’s Republic of China (‘PRC’) Ministry of Finance, State Administration of Taxation and China Securities Regulatory Commission jointly issued notices confirming that they would no longer seek to claim 10% capital gains tax (‘CGT’) on foreign institutional investors who trade China A-shares. The Fund’s policy has been to accrue 100% of the contingent CGT liability for all realized and unrealized gains in A Shares and B Shares.
Further to these announcements and in accordance with J.P. Morgan’s recommendation, the Fund’s Board approved the following PRC tax provisioning policy with effect from November 17, 2014:
| | 1. | PRC income tax will no longer be provided for gains realized from sale of China A-shares on or after November 17, 2014. |
| | 2. | PRC income tax will not be provided for unrealized gains of China A-shares. |
| | 3. | Full provision (10%) CGT will be provided for all realized and unrealized gains (no netting against losses) for China B-shares, bonds (corporate and government), futures, index futures and exchange traded funds. |
| | 4. | Full provision of the 10% withholding tax for all dividends (on A-shares, B-shares and H-shares) and PRC sourced interest income (except interest derived from PRC government bonds which are tax exempt). |
Based on its current interpretation of PRC tax rules, the Fund has maintained its accrual for CGT on gains realized from the sale of China A-shares prior to November 17, 2014. The announcements referred to above confirmed that such gains were taxable; however, the PRC tax authorities have not issued guidance on how such tax would be collected.
3. Investment Transactions
During the year ended December 31, 2014, the Fund made purchases of $108,330,687 and sales of $108,187,210 of investment securities other than short-term investments. There were no purchases or sales of U.S. Government securities.
4. Related party, Other Service Provider Transactions and Directors
i) JF International Management Inc. (the Investment ‘Advisor’), an indirect wholly-owned subsidiary of JPMorgan Chase & Co. (‘JPMorgan’) provides investment advisory services to the Fund under the terms of an investment advisory agreement. The Advisor is paid a fee, computed weekly and payable monthly, at the annual rate of 1.00% of the Fund’s weekly managed gross assets. Investments in funds on which the Advisor or its affiliates charges a management fee are excluded from the calculation. The Advisor has agreed to waive its entitlement to a management fee on any cash held when borrowings are drawn under a borrowing facility.
ii) During the year ended December 31, 2014, the Fund did not pay any brokerage commissions to JPMorgan companies or affiliated brokers/dealers.
iii) Other Service Providers — Pursuant to an Administration Agreement, JPMorgan Chase Bank, N.A. (‘JPMCB’), an indirect, wholly-owned subsidiary of JPMorgan (the ‘Administrator’), provides certain administration services to the Fund. For the year ended December 31, 2014, the Fund paid an administration fee of $88,367 in respect of tax, compliance, financial reporting and regulatory services.
JPMCB provides portfolio custody and accounting services for the Fund. The amounts paid directly to JPMCB by the Fund for custody and accounting services are included in Custodian and accounting fees in the Statement of Operations. In consideration of the accounting services, JPMCB receives a fee accrued daily and paid monthly at the annual rate of 0.02% of the first $12.5 billion of the average daily net assets of all funds in the JPMorgan International Fund Complex and 0.0175% of the average daily net assets in excess of $12.5 billion of all such funds subject to a minimum annual fee of $35,000. The custodian fees are split between safekeeping and transaction charges and vary by market.
| | | | | | | | |
| | | |
| DECEMBER 31, 2014 | | JPMORGAN CHINA REGION FUND, INC. | | | | | 23 | |
NOTES TO FINANCIAL STATEMENTS
AT DECEMBER 31, 2014 (continued)
iv) Directors — The Fund pays each of its Directors who is not a director, officer or employee of the Advisor, Administrator or any affiliate thereof, an annual fee of $24,100, the Audit Committee Chairman $28,500 and the Chairman $35,000 plus a $3,300 attendance fee for each Board meeting, Management Engagement Committee meeting and Audit Committee meeting attended. A per diem allowance of $2,000 per day, or $1,000 per half day, is paid to Directors in respect of time spent by Directors on Fund business outside normal Board and Committee meetings. The per diem allowance is subject to Board approval in advance. In addition, the Fund reimburses all Directors for travel and out-of-pocket expenses incurred in connection with Board of Directors meetings. Under normal circumstances, in order to minimize expenses, the Board expects to hold two meetings a year by telephone.
v) As of December 31, 2014, the Fund had two shareholders, each holding more than 5% of the Fund’s outstanding shares, who held in aggregate approximately 63.6% of the Fund’s outstanding shares.
5. Capital Share Transactions
On September 4, 2014, the Board of Directors renewed an authority for the Fund to purchase shares of its common stock from Fund stockholders, as described below. When shares trade at a discount to NAV, any purchase of shares by the Fund has the effect of increasing the NAV of the Fund’s remaining shares outstanding. All shares purchased by the Fund are thereafter considered authorized and unissued.
i) Share Repurchase Program — On September 4, 2014, the Board renewed the Fund’s share repurchase authority up to 644,764 shares (10% of its then issued and outstanding shares) in the open market through September 4, 2015. Repurchases can be made only when the Fund’s shares are trading at less than NAV and at such times and amounts as it is believed to be in the best interest of the Fund’s stockholders.
During the years ended December 31, 2014 and December 31, 2013, the Fund did not repurchase any shares under the share repurchase program.
6. Borrowings
The Fund has a financing arrangement with Scotiabank (Ireland) Ltd (the ‘Lender’). Under this arrangement, the Lender provides a secured, committed credit facility in the aggregate amount of $17.5 million to the Fund. No compensating balances are required. The Fund has paid an upfront loan arrangement fee of $17,500, as required under this agreement. Interest on borrowings, if any, will be payable at 1.25% plus the London Interbank Offered Rate (‘LIBOR’). Interest on unutilized amounts will be payable at 0.25% if the unutilized amounts are equal to or less than 50% of the committed amount and 0.35% if the unutilized amounts are greater than 50% of the committed amount. At December 31, 2014, the interest rate on outstanding borrowings was 1.40%. This agreement was in effect until February 25, 2015, at which point it was extended. See note 9 on page 26 for the renewed terms of the agreement. The credit agreement governing the credit facility includes usual and customary covenants for this type of transaction.
Borrowings outstanding from the secured, committed credit facility and average borrowings from the credit facility for the year ended December 31, 2014, were as follows:
| | | | | | | | | | | | | | | | | | | | |
Outstanding
Borrowings at
December 31, 2014 | | Weighted
Average
Borrowings For Days Drawn Upon | | | Average
Interest
Rate on
Borrowings | | | Number of
Days
Outstanding | | | Interest
Expense on
Borrowings | | | Interest Expense on Unutilized Amounts | |
$15,000,000 | | $ | 15,000,000 | | | | 1.40 | % | | | 365 | | | $ | 218,944 | | | $ | 6,337 | |
| | | | | | |
| | | |
| 24 | | | | JPMORGAN CHINA REGION FUND, INC. | | DECEMBER 31, 2014 |
NOTES TO FINANCIAL STATEMENTS
AT DECEMBER 31, 2014 (continued)
The maximum borrowings during the year ended December 31, 2014 was $15,000,000, from January 1, 2014 to December 31, 2014. Interest expense to non-affiliates in the Statement of Operations includes interest expense on borrowings and unutilized amounts during the year ended December 31, 2014.
7. Risks and Uncertainties
i) China Region — Investing in securities of ‘China Region companies’ may include certain risks and considerations not typically associated with investing in U.S. securities. In general, China Region companies are companies organized in the People’s Republic of China, the Hong Kong Special Administrative Region, the Macau Special Administrative Region or Taiwan (the ‘China Region’) or for which the principal securities trading market is in the China Region; or companies, regardless of where organized, which have 50% or more of their assets in, or derive 50% or more of their revenues or profits from, the China Region. Such risks include fluctuating currency values and changing local and regional economic, political and social conditions, which may result in greater market volatility. In addition, these securities may not be as liquid as U.S. securities. At December 31, 2014, the Fund had 66.2%, 24.7% and 20.1%, based on net assets, of its total investments invested in China, Hong Kong and Taiwan, respectively.
ii) Foreign Transactions — Foreign security and currency transactions may involve certain considerations and risks not typically associated with those of U.S. dollar denominated transactions as a result of, among other factors, the level of governmental supervision and regulation of foreign securities markets and the possibility of political or economic instability.
iii) Direct Investments in China A-share securities — The China Securities Regulatory Commission (‘CSRC’) may grant qualified foreign institutional investor (‘QFII’) licenses, which allow foreign investments in A-shares on the Shanghai and Shenzhen Stock Exchanges and certain other securities historically not eligible for investment by non-Chinese investors. Each QFII is authorized to invest in China A-shares only up to a specified quota established by the Chinese State Administration of Foreign Exchange (‘SAFE’). JF Asset Management Limited has a QFII license permitting it to invest a specific portion of the assets of certain funds (which may include the Fund) in local Chinese securities. Although the laws of China permit the use of nominee accounts for clients of QFIIs, the Chinese regulators require the general securities trading and settlement accounts to be maintained in the name of the QFII. As the Fund is permitted to invest in China A-shares, the Fund’s local custodian bank maintains a specific sub-account for the A-share investments in the name of the Fund. This amount is included in Deposits at broker in the Statement of Assets and Liabilities. However, there is a risk that creditors of the QFII and its affiliates (each, a ‘JP Morgan Affiliate’) may assert that a JP Morgan Affiliate, and not the Fund, has recourse against the securities and other assets in the account and/or sub-accounts. If a court upholds such an assertion, creditors of a JP Morgan Affiliate could seek payment from the Fund’s A-share investments.
Additional risks for the Fund’s A-share investments include a potential lack of liquidity, greater price volatility, and restrictions on the repatriation of invested capital. Because of low trading volume and various restrictions on the free flow of capital into the A-share market, the China A-share market could be less liquid and trading prices of A-shares could be more volatile than other local securities markets. In addition, net realized profits on fund investments in A-shares may only be repatriated under certain conditions and upon the approval of SAFE. Rules regarding taxation of investments in mainland China are unsettled and may be subject to change. Changes in the taxation of A-shares could materially affect the Fund’s performance.
iv) Other — In the normal course of business, the Fund may enter into contracts that provide general indemnifications. The maximum exposure under these arrangements is dependent on future claims that may be made against the Fund and, therefore, cannot be estimated; however, based on experience, the risk of any loss from such claims is considered remote.
| | | | | | | | |
| | | |
| DECEMBER 31, 2014 | | JPMORGAN CHINA REGION FUND, INC. | | | | | 25 | |
NOTES TO FINANCIAL STATEMENTS
AT DECEMBER 31, 2014 (continued)
8. Tax Status
U.S. Federal Income Taxes — No provision for federal income taxes is required since the Fund intends to continue to qualify as a regulated investment company under subchapter M of the Internal Revenue Code and distribute substantially all of its taxable income. Management has reviewed the Fund’s tax positions for all open tax years and has determined that as of December 31, 2014, no liability for income tax is required in the Fund’s financial statements for net unrecognized tax benefits. However, management’s conclusions may be subject to future review based on changes in, or the interpretation of, the accounting standards or tax laws and regulations. The Fund’s Federal tax returns for the prior three fiscal years remain subject to examination by the Internal Revenue Service.
The tax character of distributions paid for the year ended December 31, 2014 was $818,850 from ordinary income.
The tax character of distributions paid for the year ended December 31, 2013 was $831,745 from ordinary income.
At December 31, 2014, the components of net assets (excluding paid-in capital) on a tax basis were as follows:
| | | | |
Tax Basis Ordinary Income | | $ | 1,526,360 | |
Tax Basis Capital Loss Carryover | | $ | (2,552,688 | ) |
Tax Unrealized Appreciation on Investments and Foreign Currencies | | $ | 27,486,435 | |
| | | | |
Net Assets (Excluding Paid-In Capital) | | $ | 26,460,107 | |
| | | | |
The cumulative timing differences primarily consist of China capital gains tax and wash sale loss deferrals.
During the year ended December 31, 2014, the Fund reclassified $868,539 from accumulated realized gains (losses) on investments and $1 from Paid-in-Capital to undistributed net investment income on investments as a result of permanent book and tax differences primarily relating to PFICs gains and losses. Net assets were not affected by the reclassifications.
Under the Regulated Investment Company Modernization Act of 2010 (the ‘Act’), net capital losses recognized by the Fund after December 31, 2010, are carried forward indefinitely, and retain their character as short-term and/or long-term losses. Prior to the Act, pre-enactment net capital losses incurred by the Fund were carried forward for eight years and treated as short-term losses. The Act requires that post-enactment net capital losses be used before pre-enactment net capital losses.
At December 31, 2014, the Fund had pre-enactment net capital loss carryforwards of $2,552,688, expiring during 2017, which are available to offset future realized gains.
During the year ended December 31, 2014, the Fund utilized pre-enactment capital loss carryforward of $7,330,351.
9. Subsequent Event
On February 25, 2015, the Fund renewed its financing arrangement with Scotiabank (Ireland) Ltd (the ‘Lender’). Under this arrangement, the Lender provides a secured, committed credit facility in the aggregate amount of $17.5 million to the Fund. Interest on borrowings, if any, will be payable at 0.85% plus the London Interbank Offered Rate (‘LIBOR’). The Fund has paid an upfront loan arrangement fee of $8,750, as required under this agreement. Interest on unutilized amounts will be payable at a flat commitment fee of 0.25%, irrespective of the amount of the utilized commitment. This agreement is in effect until February 24, 2017. The credit agreement governing the credit facility includes usual and customary covenants for this type of transaction.
| | | | | | |
| | | |
| 26 | | | | JPMORGAN CHINA REGION FUND, INC. | | DECEMBER 31, 2014 |
REPORT OF INDEPENDENT REGISTERED PUBLIC ACCOUNTING FIRM
To the Board of Directors and Shareholders of
JPMorgan China Region Fund, Inc.:
In our opinion, the accompanying statement of assets and liabilities, including the investment portfolio, and the related statements of operations, of changes in net assets and of cash flows and the financial highlights present fairly, in all material respects, the financial position of JPMorgan China Region Fund, Inc. (the ‘Fund’) at December 31, 2014, the results of its operations and its cash flows for the year then ended, the changes in its net assets for each of the two years in the period then ended and the financial highlights for each of the five years in the period then ended, in conformity with accounting principles generally accepted in the United States of America. These financial statements and financial highlights (hereafter referred to as ‘financial statements’) are the responsibility of the Fund’s management. Our responsibility is to express an opinion on these financial statements based on our audits. We conducted our audits of these financial statements in accordance with the standards of the Public Company Accounting Oversight Board (United States). Those standards require that we plan and perform the audit to obtain reasonable assurance about whether the financial statements are free of material misstatement. An audit includes examining, on a test basis, evidence supporting the amounts and disclosures in the financial statements, assessing the accounting principles used and significant estimates made by management, and evaluating the overall financial statement presentation. We believe that our audits, which included confirmation of securities at December 31, 2014 by correspondence with the custodian and brokers, provide a reasonable basis for our opinion.
PricewaterhouseCoopers LLP
New York, New York
February 27, 2015
| | | | | | | | |
| | | |
| DECEMBER 31, 2014 | | JPMORGAN CHINA REGION FUND, INC. | | | | | 27 | |
RESULTS OF THE ANNUAL STOCKHOLDERS‘ MEETING (Unaudited)
The Fund held its annual stockholders’ meeting on May 8, 2014. At this meeting, stockholders re-elected Julian M.I. Reid to the Fund’s Board of Directors, the results of which are set out below.
I) Election of Director
| | | | | | | | | | | | | | | | | | | | |
| Nominee | | Votes For | | | Votes Against | | | Votes Withheld | | | Shares Not
Voted | | | Total Voting Shares | |
| Julian M.I. Reid | | | 5,485,257 | | | | 396,430 | | | | — | | | | 565,950 | | | | 6,447,637 | |
OTHER INFORMATION
Fundamental Investment Restriction on Borrowing
On May 12, 2011, shareholders of the Fund approved a change to the Fund’s fundamental investment restrictions to permit, inter alia, the Fund to borrow up to 20% of its net assets for investment purposes.
This gives the Investment Advisor flexibility to take advantage of additional investment opportunities when it believes that the return from the additional investment would exceed the cost of borrowing. If the Fund borrows money, it may be exposed to additional risks. If the return on securities purchased with borrowed funds is less than the borrowing costs of those funds, then the use of borrowing will detract from Fund performance. In particular, borrowing will magnify losses in times of negative performance. Nonetheless, the Investment Advisor may maintain leverage if it expects that the long-term benefits to investors of maintaining leverage outweigh any current reduced return. Borrowing may also increase the Fund’s interest and other expenses. Finally, the use of borrowing would subject the Fund to additional restrictions imposed by lenders and the Investment Company Act of 1940 on the Fund’s investments.
The Investment Advisor will utilize borrowed monies at its discretion and under the supervision of the Board. The Investment Advisor has agreed to waive any entitlement to a management fee on any cash held when borrowings are drawn under a borrowing facility.
The entire text of the Fund’s fundamental investment restriction on borrowing is as follows:
“Under its fundamental investment restrictions, the Fund may not: Issue senior securities, borrow or pledge its assets, except that the Fund may (i) borrow from a bank for the purpose of obtaining amounts necessary to make distributions for qualification as a registered investment company to avoid imposition of an excise tax under United States tax law; and (ii) borrow money (including through reverse repurchase agreements) up to the maximum amount permitted under the Investment Company Act of 1940 (a) for temporary or emergency purposes, (b) for such short-term credits as may be necessary for the clearance or settlement of transactions, (c) for repurchases of its Common Stock and (d) for investment purposes, provided that amounts borrowed under this clause shall not exceed 20% on the net assets of the Fund. The Fund may also pledge its assets to secure such borrowings. Notwithstanding the above, initial and variation margin in respect of futures contracts and options thereon and any collateral arrangement in respect of options on securities or indexes will not be prohibited by this paragraph 3 or any other investment restrictions.”
Information About Portfolio Holdings
The Fund files its complete schedule of portfolio holdings with the U.S. Securities and Exchange Commission (the ‘Commission’) for the first and third quarters of each fiscal year on Form N-Q. The Fund’s Forms N-Q are available on the Commission’s website at http://www.sec.gov and may be reviewed and copied at the Commission’s Public Reference Room in Washington, DC. Information on the operation of the Public Reference Room may be obtained by calling 1-800-SEC-0330. The Fund’s Forms N-Q are also available on the Fund’s website at www.jpmchinaregionfund.com.
| | | | | | |
| | | |
| 28 | | | | JPMORGAN CHINA REGION FUND, INC. | | DECEMBER 31, 2014 |
Tax Letter (Unaudited)
We are providing this information as required by the Internal Revenue Code. The amounts shown may differ from those elsewhere in this report because of differences between tax and financial reporting requirements. For the fiscal year ended December 31, 2014, certain dividends paid by the Fund may be subject to a maximum tax rate of 20%. 100.00% of ordinary income distributions were treated as qualified dividends. For the fiscal year ended December 31, 2014, the Fund intends to elect to pass through to shareholders the income tax credit for taxes paid to foreign countries. Gross foreign source income and foreign tax expenses are $3,061,234 and $291,822, respectively.
Proxy Voting Policies and Procedures and Proxy Voting Record
A description of the policies and procedures that are used by the Fund’s investment advisor to vote proxies relating to the Fund’s portfolio securities is available (1) without charge, upon request, by calling +44 20 7742 3735; and
(2) as an exhibit to the Fund’s annual report on Form N-CSR which is available on the website of the Securities and Exchange Commission (the ‘Commission’) at http://www.sec.gov. Information regarding how the investment advisor votes these proxies is now available by calling the same number and on the Commission’s website. The Fund has filed its report on Form N-PX covering the Fund’s proxy voting record for the 12 month period ended June 30, 2014.
Certifications
Simon J. Crinage, as the Fund’s President, has certified to the New York Stock Exchange that, as of May 30, 2014, he was not aware of any violation by the Fund of applicable NYSE corporate governance listing standards. The Fund’s reports to the Commission on Forms N-CSR and N-CSRS contain certifications by the Fund’s principal executive officer and principal financial officer that relate to the Fund’s disclosure in such reports and that are required by Rule 30a-2(a) under the 1940 Act.
| | | | | | | | |
| | | |
| DECEMBER 31, 2014 | | JPMORGAN CHINA REGION FUND, INC. | | | | | 29 | |
APPROVAL OF INVESTMENT ADVISORY CONTRACT (Unaudited)
On November 4, 2014, the Fund’s Board considered and approved the renewal of the Investment Advisory Agreement (the ‘Agreement’) between the Fund and JFIMI for an additional term of twelve (12) months. At this meeting, the directors reviewed extensive materials prepared by JFIMI and discussed these materials with representatives of JFIMI. The directors considered the recommendation of the Management Engagement Committee (the ‘Committee’) that the Agreement be renewed, noting that the Committee had discussed, in an executive session with independent counsel, the nature, extent and quality of the advisory services provided to the Fund by JFIMI, the level of advisory fees, the costs of the services provided and the profits realized by JFIMI, the Fund’s expense ratio, its relative and absolute performance, any economies of scale with respect to the management of the Fund, any ancillary benefits received by JFIMI and its affiliates as a result of their relationship with the Fund, and various other matters included in the materials provided by JFIMI.
In approving the renewal of the Agreement, the Committee, and the Board, concluded that:
| • | | The annual investment advisory fee rate paid by the Fund to JFIMI for investment advisory services was reasonable relative to the Fund’s peer group and relative to other non-U.S. funds managed by JFIMI. |
| • | | The Committee and the Board were generally satisfied with the nature, quality and extent of other services provided by JFIMI. In reaching this conclusion, the Committee and the Board reviewed, among other things, JFIMI’s investment experience in the China region markets and the background and experience of JFIMI’s senior management. |
| • | | The Fund’s performance in the three (3) year period had outperformed its benchmark, the MSCI Golden Dragon Index. (The Board and the Committee reviewed the Fund’s performance in comparison to the peer group and the benchmark for the 1 year, 3 year, 5 year and since inception periods.) Although one (1) year and five (5) year performance lagged, it was noted that for certain longer-term periods, the Fund’s performance surpassed the benchmark. The Board and Committee noted that the Investment Advisor had made steady progress on implementing a strategic repositioning of the portfolio with the Board and Committee’s full support. |
| • | | In light of the costs of providing advisory services to the Fund, the profits and ancillary benefits that JFIMI received, with respect to providing investment advisory services to the Fund, were reasonable. The Board and the Committee noted that beginning in May 2005, the Fund discontinued using JFIMI’s affiliates to effect Fund securities trades, unless in exceptional circumstances, effectively eliminating brokerage commissions as an ancillary benefit for JFIMI. |
| • | | The Fund’s expense ratio remained at an acceptable level. |
| | | | | | |
| | | |
| 30 | | | | JPMORGAN CHINA REGION FUND, INC. | | DECEMBER 31, 2014 |
FUND MANAGEMENT (Unaudited)
Information pertaining to the Directors and officers of the Fund is set forth below.
| | | | | | | | |
Name, (YOB), Address and
Position(s) with Fund | | Term of
Office and
Length of
Time Served | | Principal Occupation(s) During
Past 5 Years | | Number of
Portfolios in
Fund Complex
Overseen by
Director* | | Other Trusteeships/
Directorships Held by Director |
Independent Directors | | | | |
| | | | |
The Rt. Hon. The Earl of Cromer (1946) 60 Victoria Embankment London EC4Y 0JP United Kingdom | | Three year term ends in 2015; Chairman and Director since 1994. | | Chairman of the Board of the Fund; Chairman of the Board, Western Provident Association (insurance), LG India Plus Fund Ltd (financial), Pedder Street Asia Absolute Return Fund Limited (financial); LG Asia Plus Fund Limited (financial); Director, Cheetah Korea Value Fund Ltd (financial) and Chief Executive Officer, Cromer Associates Limited (family business). | | 1 | | See Principal Occupation. |
| | | | |
Alexander R. Hamilton (1941) P.O. Box 12343 General Post Office Hong Kong Class II Director | | Three year term ends in 2016; Director since 1994. | | Director of CITIC Limited (infrastructure), Cosco International Holdings Limited (shipping), Esprit Holdings Limited (clothing retail), Shangri-La Asia Limited (hotels) and Octopus Cards Limited (financial services). Former Director of China Cosco Holdings Co. Limited (shipping) (retired May 2011). | | 1 | | See Principal Occupation. |
| | | | |
Julian M. I. Reid (1944) 60 Victoria Embankment London EC4Y 0JP United Kingdom | | Three year term ends in 2017; Director since 1998. | | Chief Executive Officer of 3a Funds Group (financial); Director and Chairman of Morgan’s Walk Properties Limited (property); Director and Chairman of The Korea Fund, Inc. (financial); Director and Chairman of Prosperity Voskhod Fund (financial); Director and Chairman of ASA Limited (financial) and Director of J M Properties Limited (property). | | 1 | | See Principal Occupation. |
| | | | | | | | |
| | | |
| DECEMBER 31, 2014 | | JPMORGAN CHINA REGION FUND, INC. | | | | | 31 | |
FUND MANAGEMENT (Unaudited)
(continued)
| | | | | | | | |
Name, (YOB), Address and
Position(s) with Fund | | Term of
Office and
Length of
Time Served | | Principal Occupation(s) During
Past 5 Years | | Number of
Portfolios in
Fund Complex
Overseen by
Director* | | Other Trusteeships/
Directorships Held by Director |
Independent Directors (continued) | | | | |
| | | | |
John R. Rettberg (1937) 1 Beacon St. Boston, MA 02108
USA
Class II Director | | Three year term ends in 2016; Director since 2008 | | Former Trustee, JPMorgan Alternative Products mutual fund Board (1997-2009). | | 1 | | None. |
Interested Director & President of the Fund | | | | |
| | | | |
Simon J. Crinage (1965) 60 Victoria Embankment London, EC4Y 0JP United Kingdom Class I Director and President | | Three year term ends in 2015; Director since 2009 & President since 2003** | | Managing Director, J.P. Morgan. | | 1 | | Director of The Association of Investment Companies Limited and JF International Management Inc. |
| * | | The Fund is the only fund in the Fund Complex. |
| ** | | The officers of the Fund serve at the discretion of the Board of Directors. |
| | | | | | |
| | | |
| 32 | | | | JPMORGAN CHINA REGION FUND, INC. | | DECEMBER 31, 2014 |
Information pertaining to the officers of the Fund is set forth below.
| | | | |
Name, (YOB), Address and
Position(s) with Fund | | Term of Office and
Length of Time Served | | Principal Occupation(s) During Past 5 Years |
Officers who are not Directors |
| | |
Neil S. Martin
(1971)
60 Victoria Embankment
London EC4Y 0JP
United Kingdom | | Since 2014** | | Chief Operating Officer and Treasurer of the Fund; Executive Director, J.P. Morgan. |
| | |
Lucy J. Dina
(1977)
60 Victoria Embankment
London EC4Y 0JP
United Kingdom
Secretary | | Since 2013** | | Secretary of the Fund; Vice President, J.P. Morgan. |
| | |
Steve M. Ungerman
(1953)
270 Park Avenue
New York
Chief Compliance Officer | | Since 2014** | | Chief Compliance Officer of the Fund;
Managing Director, J.P. Morgan Chase Bank NA. |
| ** | | The officers of the Fund serve at the discretion of the Board of Directors. |
| | | | | | | | |
| | | |
| DECEMBER 31, 2014 | | JPMORGAN CHINA REGION FUND, INC. | | | | | 33 | |
DIVIDEND REINVESTMENT AND CASH PURCHASE PLAN
(Unaudited)
The Fund operates an optional Dividend Reinvestment and Cash Purchase Plan (the ‘Plan’) whereby:
| | a) | shareholders may elect to receive dividend and capital gain distributions in the form of additional shares of the Fund (the Share Distribution Plan). |
| | b) | shareholders may make optional payments (any amount between $100 and $3,000) which will be used to purchase additional shares in the open market (the Share Purchase Plan). |
For a copy of the Plan brochure, as well as a dividend reinvestment authorization card, please contact the Plan Agent:
Computershare Trust Company, N.A.
P. O. Box 30170
College Station, TX 77842-3170
USA Telephone No.: 800-426-5523 (toll-free)
www.computershare.com
The following should be noted with respect to the Plan:
If you participate in the Share Distribution Plan, whenever the Board of Directors of the Fund declares an income dividend or net capital gain distribution, you will automatically receive your distribution in newly issued shares (cash will be paid in lieu of fractional shares) if the market price of the shares on the date of the distribution is at or above the net asset value of the shares. The number of shares to be issued to you by the Fund will be determined by dividing the amount of the cash distribution to which you are entitled (net of any applicable withholding taxes) by the greater of the net asset value (‘NAV’) per share on such date or 95% of the market price of a share on such date. If the market price of the shares on such a distribution date is below the NAV, the Plan Agent will, as agent for the participants, buy shares on the open market, on the New York Stock Exchange or elsewhere, for
the participant’s account on, or after, the payment date. There is no service charge for purchases under this Plan.
For U.S. federal income tax purposes, shareholders receiving newly issued shares pursuant to the Share Distribution Plan will be treated as receiving income or capital gains in an amount equal to the fair market value (determined as of the distribution date) of the shares received and will have a cost basis equal to such fair market value. Shareholders receiving a distribution in the form of shares purchased in the open market pursuant to the Plan will be treated as receiving a distribution of the cash distribution that such shareholder would have received had the shareholder not elected to have such distribution reinvested and will have a cost basis in such shares equal to the amount of the distribution.
There will be no brokerage charge to participants for shares issued directly by the Fund under the Plan. Each participant will pay a pro rata share of brokerage commissions incurred with respect to the Plan Agent’s open market purchases of shares in connection with the Plan. The Fund will pay the fees of the Plan Agent for handling the Plan.
You may terminate your account under the Share Distribution Plan by notifying the Plan Agent in writing. The Plan may be terminated by the Plan Agent or the Fund with notice to you at least 30 days prior to any record date for the payment of any distribution by the Fund. Upon any termination, the Plan Agent will deliver a certificate or certificates for the full shares held for you under the Plan and a cash adjustment for any fractional shares.
You also have the option of instructing the Plan Agent to make semi-annual cash purchases of shares in the open market. There is a service charge of $1.25 for each purchase under this Share Purchase Plan.
| | | | | | |
| | | |
| 34 | | | | JPMORGAN CHINA REGION FUND, INC. | | DECEMBER 31, 2014 |
DIRECTORS AND ADMINISTRATION
(Unaudited)
| | |
| Officers and Directors | | The Rt. Hon. The Earl of Cromer — Director and Chairman of the Board and Management Engagement Committee Simon J. Crinage — Director and President Alexander R. Hamilton — Director and Chairman of the Audit Committee and Pricing Committee Julian M. I. Reid — Director John R. Rettberg — Director Neil S. Martin — Chief Operating Officer and Treasurer Lucy J. Dina — Secretary Steve M. Ungerman — Chief Compliance Officer |
| |
| Investment Advisor | | JF International Management Inc. P.O. Box 3151 Road Town, Tortola British Virgin Islands |
| |
| Administrator | | JPMorgan Chase Bank, N.A. 1 Beacon Street, 18th Floor Boston, Massachusetts 02108 U.S.A. |
| |
| Custodian | | JPMorgan Chase Bank N.A. 1 Beacon Street, 18th Floor Boston, Massachusetts 02108 U.S.A. |
| |
Independent Registered Public
Accounting Firm | | PricewaterhouseCoopers LLP 300 Madison Avenue New York, New York 10017 U.S.A. |
| |
| Legal Counsel | | Dechert LLP New York: 1095 Avenue of the Americas New York, New York 10036 U.S.A. |
| |
| | Hong Kong: 27/F Henley Building 5 Queens Road Central Hong Kong |
| |
| Registrar, Transfer Agent, and Dividend Paying Agent | | Computershare Trust Company, N.A. P. O. Box 30170 College Station, TX 77842-3170 U.S.A. |
Notice is hereby given in accordance with Section 23(c) of the Investment Company Act of 1940, as amended, that from time to time the Fund may purchase shares of its common stock in the open market.
www.jpmchinaregionfund.com
| | | | | | | | |
| | | |
| DECEMBER 31, 2014 | | JPMORGAN CHINA REGION FUND, INC. | | | | | 35 | |

This report, including the financial statements herein, is sent to the stockholders of the Fund for their information. It is not a prospectus, circular or representation intended for use in the purchase or sale of shares of the Fund or of any securities mentioned in this report.
© JPMorgan Chase & Co., 2015 All rights reserved. December 31.
ITEM 2. CODE OF ETHICS.
| (a) | The JPMorgan China Region Fund, Inc. (the “Fund”) has adopted a Code of Ethics that applies to the Fund’s principal executive officer and principal financial officer. |
| (c) | There have been no amendments to the Fund’s Code of Ethics during the reporting period for this Form N-CSR. |
| (d) | There have been no waivers granted by the Fund to individuals covered by the Fund’s Code of Ethics during the reporting period for this Form N-CSR. |
| (f) | A copy of the Fund’s Code of Ethics is attached as exhibit 12(a)(1) to this Form N-CSR. |
ITEM 3. AUDIT COMMITTEE FINANCIAL EXPERT.
(a) (1) The Board of Directors of the Fund has determined that the Fund has one member serving on the Fund’s Audit Committee that possesses the attributes identified in Instruction 2(b) of Item 3 to Form N-CSR to qualify as “audit committee financial expert.”
(2) The name of the audit committee financial expert is John R. Rettberg. Mr. Rettberg has been deemed to be “independent” as that term is defined in Item 3(a)(2) of Form N-CSR.
ITEM 4. PRINCIPAL ACCOUNTANT FEES AND SERVICES.
a) Audit Fees
For the fiscal years ended December 31, 2014 and 2013, PricewaterhouseCoopers, LLP (“PwC”), the Fund’s independent registered public accounting firm, billed the Fund aggregate fees of US$55,000 and $53,000, respectively, for professional services rendered for the audit of the Fund’s annual financial statements.
(b) Audit-Related Fees
For the fiscal years ended December 31, 2014 and 2013, PwC billed the Fund aggregate fees of US$10, 500 and $11,000, respectively, for security count procedures performed as required under Rule 17f-2 of the Investment Company Act of 1940.
(c) Tax Fees
For the fiscal years ended December 31, 2014 and 2013, PwC billed the Fund aggregate fees of US$8, 975 and $8,750, respectively, for professional services rendered for tax compliance, tax advice, and tax planning. The nature of the services comprising the Tax Fees was the review of the Fund’s income tax returns and tax distribution requirements.
(d) All Other Fees
For the fiscal year ended December 31, 2014, PwC did not bill the Fund any other fees. For the fiscal year ended December 31, 2013, PwC did not bill the Fund any other fees.
(e) The Fund’s Audit Committee Charter requires the Audit Committee pre-approve all audit and non-audit services to be provided by the independent registered public accounting firm to the Fund, and all non-audit services to be provided by the auditors to the Fund’s Investment Advisor and any service providers controlling, controlled by or under common control with the Fund’s Investment Advisor that provide on-going services to the Fund, if the engagement relates directly to the operations and financial reporting of the Fund. All of the audit, audit-related and tax services described above for which PwC billed the Fund for the fiscal years ended December 31, 2014 and December 31, 2013 were pre-approved by the Audit Committee.
For the fiscal years ended December 31, 2014 and December 31, 2013, the Fund’s Audit Committee did not waive the pre-approval requirement of any non-audit services to be provided to the Fund by PwC.
(f) Not applicable to the Fund.
(g) For the fiscal years ended December 31, 2014 and 2013, the aggregate non-audit fees for services rendered by PwC to the Fund, the Fund’s investment advisor and any entity controlling, controlled by, or under common control with the investment advisor that provided ongoing services to the Fund were $6.9 million and $6.6 million, respectively.
(h) The Fund’s Audit Committee has considered whether the provision of non-audit services that were rendered to Fund’s investment advisor and any entity controlling, controlled by, or under common control with the investment advisor that provides ongoing services to the Fund that were not pre-approved pursuant to paragraph (c)(7)(ii) of Rule 2-01 of Regulation S-X is compatible with maintaining the principal accountant’s independence.
ITEM 5. AUDIT COMMITTEE OF LISTED REGISTRANTS.
(a) The Fund has a separately-designated audit committee established in accordance with Section 3(a)(58)(A) of the Exchange Act. The members of the Fund’s audit committee are: The Rt. Hon. The Earl of Cromer, Alexander R. Hamilton, John R. Rettberg and Julian M. I. Reid.
ITEM 6. SCHEDULE OF INVESTMENTS
(a) Schedule of Investments is included as part of Item 1.
(b) Not applicable to the Fund.
ITEM 7. DISCLOSURE OF PROXY VOTING POLICIES AND PROCEDURES FOR CLOSED-END MANAGEMENT INVESTMENT COMPANIES.
Attached to this Form N-CSR as exhibit 12(a)(4) are copies of the proxy voting policies and procedures of the Fund and J.P. Morgan Asset Management (“JPMAM”) (formerly JF Asset Management), parent company of the Fund’s advisor, JF International Management Inc. (the “Advisor”).
J.P. MORGAN ASSET MANAGEMENT (Voting policy and corporate governance guidelines)
Table of contents
I. PRINCIPLES
J.P. Morgan Asset Management (“JPMAM”) is committed to delivering superior investment performance to its clients worldwide. We believe that one of the drivers of investment performance is an assessment of the corporate governance principles and practices of the companies in which we invest our clients’ assets and we expect those companies to demonstrate high standards of governance in the management of their business.
We have set out below the principles which provide the framework for our corporate governance activity. Although the policies and guidelines set out in this document apply to Hong Kong and therefore principally concern accounts managed from the Hong Kong office, our colleagues in London, New York and Tokyo have similar standards, consistent with law and best practice in these different locations.
2
| | 1. | Fiduciary priority. Our clients appoint us to manage their assets in order to maximise the likelihood of meeting or exceeding their investment objectives at acceptable risk levels. Every decision to buy, hold or sell any security will be consistent with that overriding objective. |
| | 2. | Evaluation. Our clients expect us, as their delegates, to monitor the governance of companies in which we have invested their assets. |
| | 3. | Engagement. We encourage excellence in the management of companies through the considered application of our corporate governance policies and guidelines. We welcome consultation by companies with their leading shareholders on corporate governance issues. |
| | 4. | Proxy voting. Company management is accountable to the shareholders, our clients. It is our responsibility to ensure this is recognized through the considered use of our clients’ votes. |
| | 5. | Litigation and Joint Working Parties. JPMAM will align itself with other shareholders, for example, by joining class action suits or working parties as local practice dictates, where we are convinced that this is in the best interests of our clients. |
| | 6. | Disclosure. JPMAM’s corporate governance guidelines and policies are available to clients and companies alike. We believe that they conform to best practice and we are prepared to discuss them openly with other interested parties. |
| | 7. | Ongoing commitment. JPMAM is committed to reviewing its corporate governance principles, policies and guidelines to ensure that they fully reflect our interpretation of best market practice. |
II. POLICY and PROCEDURES
J.P. Morgan Asset Management (“JPMAM”) manages the voting rights of the shares entrusted to it as it would manage any other asset. It is the policy of JPMAM to vote in a prudent and diligent manner, based exclusively on our reasonable judgment of what will best serve the financial interests of the beneficial owners of the security.
1. Proxy Committee
The JPMAM Proxy Committee has been established to oversee the proxy voting process in the Asia ex Japan region on an ongoing basis. It is composed of the Proxy Administrator and senior officers from the Investment, Compliance and Risk Management Departments. The main functions of the Proxy Committee are to review the Proxy Voting Guidelines (“Guidelines”) to ensure they are aligned with best practice; to determine the independence of any third-party vendor which it has delegated proxy voting responsibilities and to conclude that there are no conflicts of interest that would prevent such vendor from providing such proxy voting services prior to delegating proxy responsibilities; and to provide advice and recommendations on general proxy voting matters as well as on specific voting issues as they occur. The Proxy Committee may delegate certain of its responsibilities to subgroups composed of Proxy Committee members. It meets quarterly or more frequently as circumstances dictate and its minutes are circulated to senior management including the Asia Risk Committee to whom it reports.
2. Voting
As these Guidelines represent what we consider to be in the best financial interests of our clients, we would normally expect clients to allow us to use them as a template for voting. However, we recognise that in certain circumstances further analysis may be required.
In view our overriding fiduciary duty to act in the best interest of our clients, the Guidelines are an indication only of JPMAM’s voting policy. The portfolio manager has discretion to override the policy should individual circumstances dictate.
Our Guidelines are primarily targeted at companies listed on main stock exchanges. It is sometimes difficult for smaller companies to apply the same corporate governance standards and we would look at any issues for such companies on a case-by-case basis. We would, however, encourage them to apply the highest possible standards of governance.
For markets in Asia ex Japan, we will generally abstain from voting at AGMs on the grounds that the matters normally considered at such meetings are of a routine and non-contentious nature. To ensure we fulfil our fiduciary obligation to always act in our clients best interests, we will review each AGM notice to check whether there are any non-routine matters such as company reorganisations/ restructurings, takeover/ merger and senior management compensation plans included therein. If any such matters are identified then we will consider each one individually so that our clients’ best interests are served. The major routine matters in AGM are as follows:
| | 1. | Accept Financial Statement and Statutory Reports |
3
| | 3. | Election and re-election of directors |
| | 4. | Fix remuneration of directors |
| | 5. | Appoint auditors and fix remunerations |
| | 6. | Approve issuance of Equity or Equity-Linked Securities without pre-emptive rights |
| | 7. | Approve repurchase of shares (up to 20% of issued capital) |
| | 8. | Authorise reissuance of repurchased shares |
Also, certain markets require that shares are blocked from trading in order to be tendered for voting purposes. In these instances, it may be in our clients’ best interests to abstain from voting in order to preserve the ability to trade. For these countries, a decision will be taken on a case-by-case basis by the research analyst in conjunction with the portfolio manager in order to determine how our clients’ best interests are served.
To assist JPMAM investment professionals with public companies’ proxy voting proposals, we have retained the services of an independent proxy voting service, Institutional Shareholder Services Inc. (ISS). ISS is assigned responsibility for various functions, which may include one or more of the following: coordinating with client custodians to ensure that all proxy materials are processed in a timely fashion; providing JPMAM with a comprehensive analysis of each proxy proposal and providing JPMAM with recommendations on how to vote each proxy proposal based on the Guidelines or, where no Guideline exists or where the Guidelines require a case-by-case analysis, on ISS’ analysis; and executing the voting of the proxies in accordance with Guidelines and its recommendation, except when a recommendation is overridden by JPMAM, as described below. The Proxy Voting Committee has adopted procedures to recall shares on loan if a proposed major corporate event contemplates a shareholder vote to approve or to take other action. (The Proxy Voting Committee may determine: (a) not to recall securities on loan if, in its judgment, the negative consequences to clients of recalling the loaned securities would outweigh the benefits of voting in the particular instance or (b) not to vote certain foreign securities positions if, in its judgment, the expense and administrative inconvenience or other burdens outweigh the benefits to clients of voting the securities.)Situations can sometimes arise where more than one JPMAM client invests in the same company or in which a single client may invest in the same company but in multiple accounts. In those situations, two or more clients, or one client with different accounts, may be invested in strategies having different investment objectives, investment styles, or portfolio managers. As a result, JPMAM may cast different votes on behalf of different clients or on behalf of the same client with different accounts.
In the event a JPMAM investment professional makes a recommendation in connection with an override, the investment professional must provide the appropriate Proxy Administrator with a written certification (“Certification”) which shall contain an analysis supporting his or her recommendation and a certification that he or she (A) received no communication in regard to the proxy that would violate either the JPMorgan Chase (“JPMC”) Safeguard Policy or written policy on information barriers, or received any communication in connection with the proxy solicitation or otherwise that would suggest the existence of an actual or potential conflict between JPMAM’s interests and that of its clients and (B) was not aware of any personal or other relationship that could present an actual or potential conflict of interest with the clients’ interests.
3. Engagement
We regard regular, systematic and direct contact with senior company management, both executive and non-executive, as crucially important. We consider that these dialogues have been useful and plan to expand this approach.
4. Conflicts of Interest
In order to maintain the integrity and independence of JPMAM’s proxy-voting decisions, JPMorgan Chase (including JPMAM) has established formal barriers designed to restrict the flow of information between JPMC’s securities, lending, investment banking and other divisions to JPMAM investment professionals. Where a potential material conflict of interest has been identified, the Proxy Administrator, in consultation with the Proxy Committee, evaluates the potential conflict and determines whether an actual conflict exists. In the event that this is the case, they make a recommendation on how to vote the proxy. A record of such decisions is available to clients on request. Finally, it should be pointed out that this document is intended as an overview only. Specific issues should always be directed to your account administrator or portfolio manager.
4
III. VOTING GUIDELINES
1. REPORTS & ACCOUNTS
1a. Annual Report
Reports and accounts should be both detailed and transparent, and should be submitted to shareholders for approval. They should meet accepted reporting standards, and company accounts should employ Generally Accepted Accounting Practices (GAAP). Reports should meet with the spirit as well as the letter of reporting standards, including the most recent recommendations of the International Accounting Standards Board (IASB).
The annual report should include a statement of compliance with relevant codes of best practice, in markets where they exist.
Legal disclosure varies from market to market. If, in our opinion, a company’s standards of disclosure (whilst meeting minimum legal requirements) are insufficient in any particular area, we will inform company management of our concerns. Depending on the circumstances, we will either abstain or vote against the resolution concerned. Similar consideration would relate to the use of inappropriate accounting methods.
2. DIVIDENDS
Proposals for the payment of dividends should be presented to shareholders for approval, and should be fully disclosed in advance of the meeting. We will vote against dividend proposals if we feel that payment of the proposed dividend would prejudice the solvency or future prospects of the company.
3. AUDITORS
3a. Auditor Independence
Auditors must provide an independent and objective check on the way in which the financial statements have been prepared and presented. JPMAM will vote against the appointment or re-appointment of auditors who are not perceived as being independent.
3b. Auditor Remuneration
Companies should be encouraged to distinguish clearly between audit and non-audit fees. Audit fees should never be excessive.
4. BOARDS
4a. Chairman & CEO
JPMAM believes that it is best practice for the roles of Chairman and Chief Executive Officer to be separate.
4b. Board Structure
JPMAM is in favour of unitary boards of the type found in Hong Kong, as opposed to tiered board structures.
4c. Board Size
Boards with more than 20 directors are considered to be excessively large.
4d. Board Independence
JPMAM believes that a strong independent element to a board is essential to the effective running of a company. The calibre and number of non-executive directors on a board should be such that their views will carry significant weight in the board’s decisions.
We believe that as a minimum, all boards should have at least three non-executive directors, unless the company is of such a size that sustaining such a number would be an excessive burden.
JPMAM will use its voting powers to encourage appropriate levels of board independence, taking into account local market practice.
4e. Board Committees
Where appropriate, boards should delegate key oversight functions to independent committees. The Chairman and members of any Committee should be clearly identified in the annual report.
5. DIRECTORS
5a. Executive Director’s Remuneration
Executive remuneration is and will remain a contentious issue, particularly the overall quantum of remuneration.
JPMAM will generally vote against shareholder proposals to restrict arbitrarily the compensation of executives or other employees.
5b. Director’s Liability
In certain markets, this proposal asks shareholders to give blanket discharge from responsibility for all decisions made during the previous financial year. Depending on the market, this resolution may or may not be legally binding, and may not release the board from its legal responsibility.
JPMAM will usually vote against discharging the board from responsibility in cases of pending litigation, or if there is evidence of wrongdoing for which the board must be held accountable.
5c. Directors over 70
JPMAM considers that a similar standard of care should be applied to the selection of a director over 70 as would be applied to that of any other director, although we would expect to see such a director offer him or herself for re-election each year.
5d. Directors’ Contract
Generally, we encourage contracts of one year or less and vote accordingly.
5
6. NON-EXECUTIVE DIRECTORS
6a. Role of Non-Executive Directors
As stated earlier in these guidelines, JPMAM believes that a strong independent element to a board is important to the effective running of a company.
In determining our vote, we will always consider independence issues on a case-by-case basis, taking into account any exceptional individual circumstances, together with local markets’ differing attitudes to director independence.
In order to help assess their contribution to the company, the time spent by each non-executive director should be disclosed to shareholders, as well as their attendance at board and committee meetings.
Audit and Remuneration Committees should be composed exclusively of independent directors.
6b. Director Independence
We consider that a director will generally be deemed to be independent if he or she has no significant financial, familial or other ties with the company which might pose a conflict, and has not been employed in an executive capacity by the company for at least the previous ten years.
6c. Multiple Directorships
In order to be able to devote sufficient time to his or her duties, we would not normally expect a non-executive to hold more than five significant directorships at any one time. For executives, only one additional non-executive post would normally be considered appropriate without further explanation.
6d. Non-Executive Director Remuneration
Non-executive directors should be paid but should not be awarded options.
6e. Bonuses for Retiring Directors and Internal Statutory Auditors
JPMAM will generally vote Against proposals for retirement bonuses which will be paid to retirees including one or more directors or statutory auditors designated by companies as an outsider.
7. ISSUE OF CAPITAL
7a. Issue of Equity
In most countries, company law requires that shareholder approval be obtained in order to increase the authorised share capital of the company. Proposals for equity issues will also specify whether pre-emptive rights are to be retained or suppressed or partially suppressed for the issue. As a general rule, JPMAM believes that any new issue of equity should first be offered to existing shareholders on a pre-emptive basis.
JPMAM will vote in favour of increases in capital which enhance a company’s long-term prospects.
7b. Issue of Debt
Reasons for increased bank borrowing powers are many and varied, including allowing normal growth of the company, the financing of acquisitions, and allowing increased financial leverage. Management may also attempt to borrow as part of a takeover defence.
JPMAM will vote in favour of proposals which will enhance a company’s long-term prospects. We will vote against an increase in bank borrowing powers which would result in the company reaching an unacceptable level of financial leverage, where such borrowing is expressly intended as part of a takeover defence, or where there is a material reduction in shareholder value.
7c. Share Repurchase Programmes
Boards may instigate share repurchase or stock buy-back programs for a number of reasons. JPMAM will vote in favour of such programmes where the repurchase would be in the best interests of shareholders, and where the company is not thought to be able to use the cash in a more useful way.
We will vote against such programmes when shareholders’ interests could be better served by deployment of the cash for alternative uses, or where the repurchase is a defensive manoeuvre or an attempt to entrench management.
8. MERGERS / ACQUISITIONS
Mergers and acquisitions are always reviewed on a case-by-case basis by the investment analyst in conjunction with portfolio managers and, in exceptional circumstances, the Proxy Committee. Individual circumstances will always apply. However, as a general rule, JPMAM will favour mergers and acquisitions where the proposed acquisition price represents fair value, where shareholders cannot realise greater value through other means, and where all shareholders receive fair and equal treatment under the merger/acquisition terms.
9. VOTING RIGHTS
JPMAM believes in the fundamental principle of “one share, one vote”. Accordingly, we will vote to phase out dual voting rights or classes of share with restricted voting rights, and will oppose attempts to introduce new ones. We are opposed to mechanisms that skew voting rights, such as cumulative voting; directors should represent all shareholders equally, and voting rights should accrue in accordance with the shareholder’s equity capital commitment to the company.
6
10. SHARE OPTIONS / LONG-TERM INCENTIVE PLANS (L-TIPs)
10a. Share Options
Best practice requires that share options be fully expensed, so that shareholders can assess their true cost to the company. The assumptions and methodology behind the expensing calculation should also be explained to shareholders.
We will generally vote against the cancellation and re-issue, re-pricing, of underwater options.
10b. Long-Term Incentive Plans (L-TIPs)
A Long-Term Incentive Plan (“L-TIP”) can be defined as any arrangement, other than deferred bonuses and retirement benefit plans, which require one or more conditions in respect of service and/or performance to be satisfied over more than one financial year.
JPMAM normally will vote in favour of schemes with keen incentives and challenging performance criteria, which are fully disclosed to shareholders in advance, and vote against payments which are excessive or performance criteria which are undemanding.
11. OTHERS
11a. Charitable Issues
Charitable donations are generally acceptable, provided they are within reasonable limits and fully disclosed to shareholders.
11b. Political Issues
JPMAM does not normally support the use of shareholder funds for political donations, and would require the fullest explanation as to why this would be beneficial to shareholders.
11c. Poison Pills
Poison pills, or shareholder rights plans, are designed to give shareholders of a target company the right to purchase shares of the acquiring company, the target company, or both at a substantial discount from market value. These rights are exercisable once a pre-defined “triggering event” occurs, generally a hostile takeover offer or an outsider’s acquisition of a certain percentage of stock. Corporations may or may not be able to adopt poison pills without shareholder approval, depending on the market.
In reaching its voting position, the Committee has reviewed and continues to review current takeover events. However, it has concluded that there is no clear evidence that poison pills deter takeover offers or defeat takeover attempts and are, in fact, sometimes used as tools to entrench management.
JPMAM will generally vote against anti-takeover devices and support proposals aimed at revoking existing plans. Where anti-takeover devices exist, they should be fully disclosed to shareholders and shareholders should be given the opportunity to review them periodically.
11d. Composite Resolutions
Agenda items at shareholder meetings should be presented in such a way that they can be voted upon clearly, distinctly and unambiguously. We normally oppose deliberately vague, composite or “bundled” resolutions, depending on the context.
11e. Amendments to company articles
| | i. | Limitation on Directors’ Liability – review on a case by case basis |
| | ii. | Changes in business activities/ Expansion of business line – generally vote For |
| | iii. | Relaxation of Quorum Requirement—generally vote Against |
| | iv. | Shares Repurchase at discretion of the Board of Directors – review on a case by case basis |
| | v. | Changes of shareholders record date at discretion of the Board of Directors – generally vote Against |
IV. ACTIVISM
Activism Policy
1. Discharge of Responsibilities
| | a) | Our primary responsibility is to protect our clients’ interests and, as active managers, we therefore absolutely reserve the right to dispose of an investment where a company fails to meet our expectations. |
| | b) | Our investment managers and analysts have explicit responsibilities for monitoring the companies in the universe of stocks from which clients’ portfolios are constructed. Whilst we attach considerable importance to meetings with management (and several hundred take place in Asia ex Japan each year), we also emphasise the benefits of fundamental research into companies in our investment processes. Industry research, balance sheet analysis and company news flow all have a role to varying degrees in our company monitoring. |
7
| | c) | Our approach to dealing with conflicts of interest is described fully in our Corporate Governance Policies and Procedures. We seek to minimise conflicts by controlling information flows between different parts of JPMorgan Chase. Where a material conflict does arise we require investors who make the voting decision to certify that they have acted solely in the clients’ best interests. |
2. Monitor Performance
Monitoring of company performance is a key part of our investment processes. We maintain a record of all private meetings held with companies. We regard these meetings as confidential and will not comment on them outside JPMAM.
3. Evaluating and Reporting
We are convinced that a strong governance culture leads ultimately to a better business and a better stock market rating. As investors we scrutinise companies’ governance policies as a part of our investment research and take comfort from good governance.
4. Intervening when necessary
We do not normally intervene directly in the management of companies . However where a company has failed to meet our expectations and it is not clear what action is being taken to remedy the situation , but we believe the potential of the company still justifies retention in our clients’ portfolios , we will arrange to meet senior management in order to express our concerns. Intervention at companies is never publicised. In the small capitalisation end of the market , more aggressive intervention is more common , but still infrequent , as we may hold a significant percentage of a company’s equity.
V. Sustainability
Where JPMAM engages with companies on broader social, environmental and sustainability issues, we have adopted a positive engagement approach. Thus, specific assets or types of assets are not excluded on purely social, environmental or ethical criteria (unless specifically requested by clients). Rather, analysts take such issues into account as part of the mainstream analytical process. Where appropriate, JPMAM will also engage with company management on specific issues at company one-to-one meetings. This engagement activity can then be reported to clients as required.
Where social or environmental issues are the subject of a proxy vote, JPMAM will consider the issue on a case-by-case basis, keeping in mind at all times the best financial interests of our clients.
It is anticipated that our sustainability program will continue to expand both in terms of scope and market coverage as client demand and availability of suitable resources dictate.
ITEM 8. PORTFOLIO MANAGERS OF CLOSED-END MANAGEMENT INVESTMENT COMPANIES.
(a)(1) The day-to-day management of the Fund’s portfolio is handled by the Greater China investment team of JPMAM. The Greater China Investment Team is based in Hong Kong. The head of this team is Howard Wang and Emerson Yip, Lillian Leung and Song Shen are portfolio managers.
Mr. Wang joined JPMAM in Hong Kong in 2005. Prior to his appointment, Mr. Wang spent eight years with Goldman Sachs, where in 2004, he was appointed Managing Director, Equities and General Manager of the Taipei branch office.
Mr. Yip joined JPMAM in Hong Kong in 2006. Prior to his appointment, Mr. Yip was a director of Newbridge Capital where, since 1998, he held various positions of responsibility.
Ms. Leung joined JPMAM in Hong Kong in 2010. Prior to her appointment, Ms. Leung worked as the Associate Director of China Research and later the Chief Representative of Shanghai Representative Office with Alliance Bernstein.
Mr. Shen joined JPMAM in Hong Kong in 2010. Prior to his appointment, Mr. Shen worked as a research analyst in China commodities in Goldman Sachs from 1994.
Ms. Huang joined JPMAM in Hong Kong in 2006. Prior to her appointment, Ms. Huang worked as a managing director of the Global Investment Research team of Goldman Sachs from 1997.
The chart below shows the number, type and market value as of December 31, 2014 of the accounts other than the Fund that are managed by each of the Fund’s portfolio managers. The potential for conflicts of interest exists when a portfolio manager manages other accounts with similar or different investment objectives and strategies as the Fund (“Other Accounts”). Potential conflicts may include, for example, conflicts between investment strategies and conflicts in the allocation of investment opportunities.
8
(a) (2)
| | | | | | | | | | |
Howard Wang (a)(2)(ii) |
| | |
Registered Investment companies | | Other Pooled Investment Vehicles | | Other Accounts |
Number of accounts | | Total Assets (USD) | | Number of accounts | | Total Assets (USD) | | Number of accounts | | Total Assets (USD) |
1 | | 341m | | 5 | | 2,103 | | Nil | | Nil |
|
| (a)(2)(iii) - Performance fee |
| | |
Registered Investment companies | | Other Pooled Investment Vehicles | | Other Accounts |
Number of accounts | | Total Assets (USD) | | Number of accounts | | Total Assets (USD) | | Number of accounts | | Total Assets (USD) |
Nil | | Nil | | Nil | | Nil | | Nil | | Nil |
|
Emerson Yip (a)(2)(ii) |
| | |
Registered Investment companies | | Other Pooled Investment Vehicles | | Other Accounts |
Number of accounts | | Total Assets (USD) | | Number of accounts | | Total Assets (USD) | | Number of accounts | | Total Assets (USD) |
1 | | 125m | | 4 | | 961m | | 3 | | 852m |
|
| (a)(2)(iii) - Performance fee |
| | |
Registered Investment companies | | Other Pooled Investment Vehicles | | Other Accounts |
Number of accounts | | Total Assets (USD) | | Number of accounts | | Total Assets (USD) | | Number of accounts | | Total Assets (USD) |
Nil | | Nil | | Nil | | Nil | | Nil | | Nil |
|
Lillian Leung (a)(2)(ii) |
| | |
Registered Investment companies | | Other Pooled Investment Vehicles | | Other Accounts |
Number of accounts | | Total Assets (USD) | | Number of accounts | | Total Assets (USD) | | Number of accounts | | Total Assets (USD) |
Nil | | Nil | | 2 | | 1,095m | | 1 | | 43m |
|
| (a)(2)(iii) - Performance fee |
| | |
Registered Investment companies | | Other Pooled Investment Vehicles | | Other Accounts |
Number of accounts | | Total Assets (USD) | | Number of accounts | | Total Assets (USD) | | Number of accounts | | Total Assets (USD) |
Nil | | Nil | | Nil | | Nil | | Nil | | Nil |
|
Song Shen (a)(2)(ii) |
| | |
Registered Investment companies | | Other Pooled Investment Vehicles | | Other Accounts |
Number of accounts | | Total Assets (USD) | | Number of accounts | | Total Assets (USD) | | Number of accounts | | Total Assets (USD) |
Nil | | Nil | | 6 | | 2,116m | | Nil | | Nil |
9
| | | | | | | | | | |
|
(a)(2)(iii) - Performance fee |
| | |
Registered Investment companies | | Other Pooled Investment Vehicles | | Other Accounts |
Number of accounts | | Total Assets (USD) | | Number of accounts | | Total Assets (USD) | | Number of accounts | | Total Assets (USD) |
Nil | | Nil | | Nil | | Nil | | Nil | | Nil |
|
(a)(4) Ownership of Securities |
| | | | |
Portfolio Manager | | None | | $1-$10,000 | | $10,000-$50,000 | | |
Howard Wang | | x | | | | | | | | |
Emerson Yip | | x | | | | | | | | |
Lilian Leung | | x | | | | | | | | |
Song Shen | | x | | | | | | | | |
Shumin Huang | | x | | | | | | | | |
Responsibility for managing the client portfolios of the Advisor and the Advisor’s participating affiliates is organized according to the mandates of each account. The Fund’s portfolio managers manage other accounts with similar objectives, approach and philosophy to the Fund. The portfolio holdings, relative position sizes and industry and sector exposures tend to be similar across these similar portfolios, which minimizes the potential for conflicts of interest. For Howard Wang, these similar portfolios include one registered investment company and five other pooled investment vehicles as described under ITEM 8 (a)(2)(ii) above that invest in the Greater China/China/Hong Kong markets and only take long positions in securities.
For Emerson Yip, the similar portfolios include two registered investment companies, six other pooled investment vehicles and three other accounts as described under ITEM 8 (a)(2)(ii) above that invest in Greater China/Hong Kong markets and only take long positions in securities.
For Lilian Leung, these similar portfolios include one pooled investment vehicle as described under ITEM 8 (a)(2)(ii) above that invest in China/Hong Kong markets and only take long positions in securities.
For Song Shen, these similar portfolios include six pooled investment vehicle as described under ITEM 8 (a)(2)(ii) above that invest in China/Hong Kong markets and only take long positions in securities.
For Shumin Huang, these similar portfolios include one registered investment company as described under ITEM 8 (a)(2)(ii) above that invest in Taiwan markets and only take long positions in securities.
The Advisor and the Advisor’s participating affiliates receive more compensation with respect to certain Other Accounts than that received with respect to the Fund and receive compensation based in part on the performance of one of the Other Accounts as described under ITEM 8 (a)(2)(iii). This may create a potential conflict of interest for the Advisor or the Fund’s portfolio managers by providing an incentive to favor these Other Accounts when, for example, placing securities transactions. The conflicts of interest may arise with both the aggregation and allocation of securities transactions and allocation of limited investment opportunities. Allocations of aggregated trades, particularly trade orders that were only partially completed due to limited availability, and allocation of investment opportunities generally, could raise a potential conflict of interest, as the Advisor or the portfolio managers may have an incentive to allocate securities that are expected to increase in value to favored accounts. Initial public offerings, in particular, are frequently of very limited availability. The portfolio managers may be perceived as causing accounts they manage to participate in an offering to increase the Advisor’s overall allocation of securities in that offering. A potential conflict of interest also may be perceived to arise if transactions in one account closely follow related transactions in a different account, such as when a purchase increases the value of securities previously purchased by another account, or when a sale in one account lowers the sale price received in a sale by a second account.
The Advisor has policies and procedures designed to manage these conflicts described above such as allocation of investment opportunities to achieve fair and equitable allocation of investment opportunities among its clients over time. For example, orders for the same equity security are aggregated on a continual basis throughout each trading day consistent with the Advisor’s duty of best execution for its clients. If aggregated trades are fully executed, accounts participating in the trade will be allocated their pro rata share on an average price basis. Partially completed orders generally will be allocated among the participating accounts on a pro-rata average price basis, subject to certain limited exceptions. For example, accounts that would receive a de minimis allocation
10
relative to their size may be excluded from the allocation. Another exception may occur when thin markets or price volatility require that an aggregated order be completed in multiple executions over several days. If partial completion of the order would result in an uneconomic allocation to an account due to fixed transaction or custody costs, the dealer may have the discretion to complete and exclude the small orders.
Purchases of money market instruments and fixed income securities cannot always be allocated pro-rata across the accounts with the same investment strategy and objective. However, the Advisor attempts to mitigate any potential unfairness by basing non-pro rata allocations upon an objective predetermined criteria for the selection of investments and a disciplined process for allocating securities with similar duration, credit quality and liquidity in the good faith judgment of the Advisor so that fair and equitable allocation will occur over time.
(a)(3) Portfolio Managers Compensation
The Fund’s portfolio managers participate in a competitive compensation program that is designed to attract and retain outstanding people and closely link their performance to client investment objectives. The total compensation program includes a base salary fixed from year to year and a variable performance bonus consisting of cash incentives and restricted stock and, in some cases, mandatory deferred compensation. These elements reflect individual performance and the performance of the Advisor’s business as a whole.
Each portfolio manager’s performance is formally evaluated annually based on a variety of factors including the aggregate size and blended performance of the portfolios that he manages. Individual contribution relative to client goals carries the highest impact. The compensation is primarily driven by meeting or exceeding clients’ risk and return objectives, relative performance to competitors or competitive indices and compliance with firm policies and regulatory requirements. In evaluating the portfolio manager’s performance with respect to the mutual funds (including the Fund) he manages, the funds’ pre-tax performance is compared to the appropriate market peer group and to each fund’s benchmark index listed in the fund’s prospectus over one, three and five year periods (or such shorter time as the portfolio manager has managed the fund). Investment performance is generally more heavily weighted to the long-term.
Stock awards are granted as the annual performance bonus and comprise from 0% to 35% of each portfolio manager’s total award. As the level of incentive compensation increases, the percentage of compensation awarded in restricted stock also increases.
ITEM 9. PURCHASE OF EQUITY SECURITIES BY CLOSED-END MANAGEMENT INVESTMENT COMPANY AND AFFILIATED PURCHASERS.
Not applicable to the Fund.
ITEM 10. SUBMISSION OF MATTERS TO A VOTE OF SECURITY HOLDERS.
There have been no material changes to the procedures by which the shareholders may recommend nominees to the Fund’s board of directors since the Fund filed its last form NCSR
ITEM 11. CONTROLS AND PROCEDURES.
(a) The Fund’s principal executive and principal financial officers have concluded that the Fund’s disclosure controls and procedures (as defined in Rule 30a-3(c) under the Investment Company Act of 1940, as amended (the “1940 Act”) (17 CFR 270.30a-3(c))) are effective, as of a date within 90 days of the filing date of this Form N-CSR based on their evaluation of these controls and procedures required by Rule 30a-3(b) under the 1940 Act (17 CFR 270.30a-3(b)) and Rules 13a-15(b) or 15d-15(b) under the 1934 Act (17 CFR 240.13a-15(b) or 240.15d-15(b)).
(b) There were no changes in the Fund’s internal control over financial reporting (as defined in Rule 30a-3(d) under the 1940 Act (17 CFR 270.30a-3(d))) that occurred during the Fund’s fiscal year that has materially affected, or is reasonably likely to materially affect, the Fund’s internal control over financial reporting.
ITEM 12. EXHIBITS.
(a)(1) Code of Ethics is attached hereto in response to Item 2(f).
(a)(2) Certifications pursuant to Rule 30a-2(a) under the Investment Company Act of 1940.
(a)(3) Not applicable.
(a)(4) Proxy voting policies and procedures of the Fund and its investment advisor are attached hereto in response to Item 7.
(b) The certifications required by Rule 30a-2(b) of the 1940 Act and Section 906 of the Sarbanes-Oxley Act of 2002 are attached hereto.
11
SIGNATURES
Pursuant to the requirements of the Securities Exchange Act of 1934 and the Investment Company Act of 1940, the registrant has duly caused this report to be signed on its behalf by the undersigned, thereunto duly authorized.
JPMorgan China Region Fund, Inc.
| | |
| By: | | /s/ Simon Crinage |
| | Simon Crinage |
| | President and Principal Executive Officer |
| | March 9, 2015 |
Pursuant to the requirements of the Securities Exchange Act of 1934 and the Investment Company Act of 1940, this report has been signed below by the following persons on behalf of the registrant and in the capacities and on the dates indicated.
| | |
| By: | | /s/ Simon Crinage |
| | Simon Crinage |
| | President and Principal Executive Officer |
| | March 9, 2015 |
| | |
| By: | | /s/ Neil S. Martin |
| | Neil S. Martin |
| | Treasurer and Chief Operating Officer |
| | March 9, 2015 |