UNITED STATES
SECURITIES AND EXCHANGE COMMISSION
Washington, D.C. 20549
FORM N-CSR
CERTIFIED SHAREHOLDER REPORT OF REGISTERED
MANAGEMENT INVESTMENT COMPANIES
Investment Company Act file number: 811-06686
JPMorgan China Region Fund, Inc.
(Exact name of registrant as specified in charter)
One Beacon Street, 18th Floor
Boston, MA 02108
(Address of principal executive offices) (Zip code)
Dechert LLP
1095 Avenue of the Americas
New York, NY 10036
(Name and Address of Agent for Service)
Registrant’s telephone number, including area code: (800) 441-9800
Date of fiscal year end: December 31
Date of reporting period: January 1, 2015 through December 31, 2015
ITEM 1. REPORTS TO STOCKHOLDERS.
The following is a copy of the report transmitted to shareholders pursuant to Rule 30e-1 under the Investment Company Act of 1940 (17 CFR 270.30e-1).
This report, including the financial statements herein, is sent to the stockholders of the Fund for their information. It is not a prospectus, circular or representation intended for use in the purchase or sale of shares of the Fund or of any securities mentioned in this report.

Annual Report
December 31, 2015


CONTENTS
OBJECTIVES (Unaudited)
JPMorgan China Region Fund, Inc. (the ‘Fund’) seeks to achieve long-term capital appreciation through investments primarily in equity securities of companies with substantial assets in, or revenues derived from, the People’s Republic of China (‘China’), Hong Kong, Taiwan and Macau — collectively, the ‘China Region’.
The Fund provides investors with an opportunity to participate in the growing economies of the China Region where the economies of China, Hong Kong, Taiwan and Macau have become increasingly linked over recent years. Hong Kong enterprises have made substantial investments in China, particularly where labor and land prices are lower than in Hong Kong. Similarly, many Chinese companies have Hong Kong based subsidiaries with securities listed on the Hong Kong Stock Exchange (H-shares). Renminbi denominated China A-shares, which are listed in China, are available for acquisition by the Fund by direct investment up to $20m, as measured at the time of original investment. The current value of these holdings reflects any capital appreciation or depreciation since the initial investment and, therefore, there may be times when the Fund’s China A-share investments exceed $20m. In addition, the Fund can make indirect China A-share investments up to 10% of the Fund’s total assets through exposure to China A-share investment companies. Further details on China A-shares are provided in note 7(iii) of the Notes to Financial Statements on page 28.
The Fund invests to take advantage of the many opportunities that result from this linkage among the markets of the China Region.
MANAGEMENT (Unaudited)
JF International Management Inc. (‘JFIMI’) is the investment management company appointed to advise and manage the Fund’s portfolio (the ‘Investment Advisor’). JFIMI is part of JPMorgan Chase & Co. (‘JPMC’), one of the world’s premier financial services institutions. In asset management, JPMC operates globally under the name of J.P. Morgan Asset Management (‘JPMAM’). Funds under management for the global asset management business of JPMAM were US$1.7 trillion as of December 31, 2015.
The Fund’s lead portfolio manager is Emerson Yip, a Senior Portfolio Manager within JPMAM’s Greater China investment team in Hong Kong.
| | | | | | | | |
| | | |
| DECEMBER 31, 2015 | | JPMORGAN CHINA REGION FUND, INC. | | | | | 1 | |
FORWARD-LOOKING STATEMENTS (Unaudited)
This report contains certain forward-looking statements within the meaning of Section 21E of the Securities Exchange Act of 1934. Forward-looking statements include statements regarding the goals, beliefs, plans or current expectations of the Fund and JFIMI and their respective representatives, taking into account the information currently available to them. Forward-looking statements include all statements that do not relate solely to current or historical fact. For example, forward-looking statements include the use of words such as ‘anticipate,’ ‘estimate,’ ‘intend,’ ‘expect,’ ‘believe,’ ‘plan,’ ‘may,’ ‘should,’ ‘would,’ or other words that convey uncertainty of future events or outcomes. Forward-looking statements involve known and unknown risks, uncertainties and other factors that may cause the actual results, performance or achievements of the Fund to be materially different from any future results, performance or achievements expressed or implied by the forward-looking statements. Factors that could materially and negatively affect the results, performance or achievements of the Fund include changes in economic, political, legal and regulatory conditions in the China Region and elsewhere, changes in interest and exchange rates and related policies and other risks. When evaluating the information included in this report, you are cautioned not to place undue reliance on these forward-looking statements, which reflect the judgment of the Fund, JFIMI or its respective representatives only as of the date hereof. The Fund, JFIMI and their respective representatives undertake no obligation to publicly revise or update these forward-looking statements to reflect events and circumstances that arise after the date hereof.
|
| MARKET INFORMATION |
The Fund is listed on the New York Stock Exchange (symbol JFC). The share price is published in • The Wall Street Journal (daily online at www.WSJ.com/Free) |
The estimated net asset value is published in • The Wall Street Journal under “Closed-End Funds” (every Saturday) • www.jpmchinaregionfund.com |
| | | | | | |
| | | |
| 2 | | | | JPMORGAN CHINA REGION FUND, INC. | | DECEMBER 31, 2015 |
HIGHLIGHTS (unaudited, except as indicated)
| | | | | | | | |
| | | DECEMBER 31, 2015
US$ (Audited) | | | DECEMBER 31, 2014
US$ (Audited) | |
Net Assets | | | $113.2 million | | | | $125.0 million | |
Net Asset Value Per Share | | | $17.55 | | | | $19.39 | |
| | |
Market Data | | | | | | | | |
Share Price on the New York Stock Exchange | | | $15.32 | | | | $16.91 | |
Discount to Net Asset Value | | | 12.7% | | | | 12.8% | |
| | |
Total Return for the Year Ended December 31, 2015 | | | | | | | | |
Net Asset Value | | | | | | | (4.5)% | |
Share Price | | | | | | | (3.6)% | |
| | |
JFC Benchmark Index* | | | | | | | (5.3)% | |
MSCI Hong Kong Index | | | | | | | (0.5)% | |
MSCI China Index | | | | | | | (7.6)% | |
MSCI Taiwan Index | | | | | | | (11.0)% | |
CSI 300 Index | | | | | | | 2.3% | |
| | |
Net Asset Value and Share Price vs. Benchmark Index | | | | | | | | |
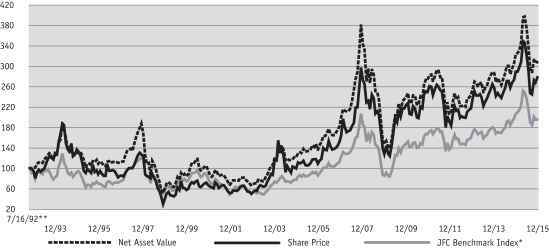
| * | | JFC Benchmark Index: 80% MSCI Golden Dragon Index (Net) 20% CSI 300 Index (Net). Prior to October 1, 2013, 80% MSCI Golden Dragon Index (GDR) +20% CSI 300 Index (Total). Prior to April 13, 2012, the MSCI Golden Dragon Index (Total). At December 31, 2011 the MSCI Golden Dragon Index (Total) comprised 24.1% of the MSCI Hong Kong Index (Total), 42.7% of the MSCI China Index (Total) and 33.2% of the MSCI Taiwan Index (Total). Prior to March 2001, 25% Taiwan Weighted Index, 20% BNP Paribas China Index, 50% MSCI Hong Kong, 5% HSBC; Prior to March 1999, 60% Hong Kong All Ordinaries, 30% Credit Lyonnais Securities Asia All China B Index, 10% Taiwan Weighted Index. Prior to January 1997, Peregrine Greater China Index. |
| ** | | Commencement of operations. |
Source: J.P. Morgan Asset Management.
| | | | | | | | |
| | | |
| DECEMBER 31, 2015 | | JPMORGAN CHINA REGION FUND, INC. | | | | | 3 | |
CHAIRMAN’S STATEMENT
DECEMBER 31, 2015 (Unaudited)
Dear Fellow Stockholder
Performance
Against a background of what was a very volatile and uncertain year for Greater China markets, the Fund’s total return at net asset value (‘NAV’) fell by 4.5% during the year ended December 31, 2015, marginally outperforming our benchmark1, which fell by 5.3%. Over the same period, the Fund’s share price total return fell by 3.6%. The Fund’s relative out performance was primarily attributable to stock selection.
China A-shares
As previously reported, the Fund has $20m of China A-share quota which provides exposure to a market otherwise restricted to foreign investors. This serves as a differentiating factor for the Fund when compared to its peer group of other New York listed Greater China region closed ended funds. As at December 31, 2015, the Fund held 22.1% of its total assets in China A-share investments.
Leverage
The Fund’s credit facility with Scotiabank (Ireland) Ltd (’Scotiabank’) matures on February 24, 2017 at which point the Board will consider another gearing facility. This facility was increased from US$17.5m to US$22m on July 10, 2015 due to the growth in the Fund’s net assets. This financing arrangement with Scotiabank gives the Investment Advisor the flexibility to tactically manage leverage at its discretion under the scrutiny of your Board. During the year to December 31, 2015, the Fund’s leverage2 ranged from 1.2% to 12.1% and at the time of writing is 10.3%, reflecting the Investment Advisor’s current view on the market. The Investment Advisor does not receive a management fee on any cash held when borrowings are drawn under the leverage facility.
Share Repurchases and Discount Management
Your Board currently has authority to repurchase up to 644,764 shares (equal to 10% of the Fund’s issued share capital). Although there have been no share repurchases since January 2003, your Board continues to believe that the power to repurchase shares is of ongoing benefit to shareholders. Share repurchases are a useful tool for decreasing discount volatility and this approach will be used when considered to be appropriate by the Board.
During the year the Board established a Share Repurchase Committee with the objective to consider from time-to-time whether the Fund’s share repurchase policy should be amended, take action or make recommendations to the Board as it sees fit. Discussions of this Committee will be recorded and reported in the Fund’s Proxy Statement each year which will give shareholders greater transparency on the frequency of discussions on the Fund’s discount and demonstrate that the Board has been proactive in
monitoring the Fund’s discount outside of its regular quarterly meetings.
Board Succession
As mentioned in last year’s report, the Board through its Nomination Committee, considered succession planning and it was agreed that Mr Alexander Hamilton and Mr John Rettberg will retire from the Board at the conclusion of the Annual Stockholders’ Meeting in May 2016. On behalf of the Board, I would like to thank both Mr Hamilton and Mr Rettberg for their valuable insight and support to the Fund over the past 22 and 8 years respectively. The Board is currently in the process of recruiting two new Directors to maintain the right balance of skills. It is intended that they will be nominated for election by shareholders at the May 2016 Annual Meeting.
Outlook
The domestic Chinese markets got off to a volatile start to 2016, with the circuit breaker triggered twice in the first week. Investor sentiment was visibly fragile and the panic selling exacerbated the market sell-offs on both counts. Our Investment Advisor believes volatility could remain in the near term, and uncertainty and profit-taking pressures could also continue to weigh on the market before investors return their attention to state-owned enterprise (SOE) reforms and other market catalysts. It is the Investment Advisor’s view that we should expect to see ongoing macroeconomic challenges but accommodative monetary and fiscal policies, particularly as inflation is likely to remain at relatively low levels. They also expect more reforms will be implemented in 2016. Overall they believe that the liquidity situation should stay relatively loose and overall leverage in the stock market should not be as high as in 2015 given tighter regulatory control over grey market leverage.
As such, our Investment Advisor remains focused on the investment opportunities in “New China” that are fuelling the new growth engine in both onshore and offshore markets. There are plenty of companies that would be beneficiaries of long-term secular trends, in areas such as consumer-related businesses in autos and media, healthcare firms and environmental services. In Taiwan, headwinds may remain in the first half of 2016, though the Investment Advisor believes there is value to be found with select Apple supply chain names, which are well-positioned for market share gain. In contrast, the Investment Advisor remains cautious on the structural slowdown in the Hong Kong economy and sees fewer opportunities in the domestic businesses there.
Respectfully submitted
The Rt. Hon. The Earl of Cromer Chairman
February 29, 2016
| 1. | | 80% MSCI Golden Dragon Index (net) and 20% CSI 300 Index (net). |
| 2. | | Calculated as the sum of Total Investments less Net Assets divided by Net Assets. |
For more information please refer to the Fund’s website at www.jpmchinaregionfund.com
| | | | | | |
| | | |
| 4 | | | | JPMORGAN CHINA REGION FUND, INC. | | DECEMBER 31, 2015 |
INVESTMENT ADVISOR’S REPORT
For the twelve months ending December 2015, the Fund delivered a total return on net asset value of –4.5% (in USD terms), outperforming the benchmark return of –5.3%. Positive stock selection in all three of the Fund’s primary markets, particularly China, contributed to returns. Asset allocation added to returns as well, helped by our overweight exposure to China A-shares, which rallied the most, at the expense of Taiwan, which declined the most. The 8% average leverage in the Fund slightly detracted from performance on the back of significant market volatility and mixed equity returns.
Our quality Chinese financials overweights in insurance (Ping An), property developers (China Vanke) and mid-sized banks (Industrial Bank) contributed to returns. Ping An benefitted from growth in its life insurance business. China Vanke, the largest property developer, continued to gain share with margin stabilization and declining funding cost supporting ROE improvement. Industrial Bank has navigated the year’s volatility well and we believe in its growth opportunities as a well-run bank. Additionally, our underweights in large cap, index heavy banks, such as Bank of China and ICBC, also helped performance as they lagged the sector due to concerns over growth deceleration and the impact on the level of non-performing loans. Equally key, our secular growth holdings also added value, across areas such as internet (Tencent), healthcare (Sino Biopharmaceutical) and consumer discretionary (Regina Miracle and IMAX China). We expect Tencent to continue benefitting from mobile monetization of gaming, payment and advertising. Sino Biopharmaceutical enjoyed strong earnings and remains well-positioned to gain from favorable healthcare trends. Furthermore, continued consumption upgrades should provide tailwind to multi-year growth for Regina Miracle, the textile maker, and, IMAX China, the cinematic technology provider.
On the negative side, somewhat offsetting the positive impact of the financials that outperformed, a
few holdings in the sector put up poor returns and were the biggest detractors for the year. Sunac China traded down on disappointing earnings and concerns over potential acquisitions, raising concerns over management governance. China Minsheng Banking was hurt by the resignation of its President to cooperate in an anti-corruption investigation; and China Pacific Insurance fell short against competitors in growing its property and casualty book of business. We exited all three positions on deteriorated fundamentals when they no longer met our investment criteria. Additionally, the crackdown on margin financing presented headwinds for brokers, such as Huatai Securities and Haitong Securities where we were overweight. Our telecom underweight in China Mobile also struggled as the stock held up better in the volatile market environment given its defensive earnings stream. Moreover, the government’s tariff cut on wind and solar power and tempered support for renewable energy imposed downside risks for the largest wind power generator, China Longyuan Power, and our overweight there detracted. In Hong Kong, weakening retail trends continued to put downward pressure on the consumer discretionary sector, particularly the higher-end market, where we had positions in Chow Tai Fook Jewellery and Lifestyle International.
China
Market Performance
Chinese equities rallied in the first quarter of 2015, with offshore-listed equities up 8%, continuing the rally of the final quarter of 2014. The key catalysts were accommodative policy in terms of both cyclical stimulus (easing monetary/fiscal policies) and structural reforms (pertaining to Local Government Finance Vehicle (LGFV) debt swaps and deposit insurance, for example), despite the macroeconomic backdrop remaining weak. The gains were led by both cyclical names (beneficiaries of policy easing) as well as growth
| | | | | | | | |
| | | |
| DECEMBER 31, 2015 | | JPMORGAN CHINA REGION FUND, INC. | | | | | 5 | |
INVESTMENT ADVISOR’S REPORT (continued)
sectors. Meanwhile, macro indicators remained weak. January-February industrial production (up 6.8% year-on-year) and fixed-asset investment (up 13.9% year-on-year) both reached new post 2008-09 global financial crisis lows, due to still very high real interest rates as well as muted infrastructure spending (affected by anti-corruption campaigns). January’s consumer price inflation falling below 1% (posing a potential deflection risk) prompted more monetary easing. The People’s Bank of China (PBOC) implemented one more rate cut (since November 2014) as well as a first reduction in reserve ratio requirements, both in February. Money supply growth in February at 12.5% year-on-year marked an improvement from January’s 10.8% year-on-year levels. Earnings revisions continued to be negative, led by energy (due to the global oil price declines), materials, and staples, as a result of demand headwinds. Sectors seeing positive earnings revisions included non-bank financials (benefiting from underlying equity market strength) and transportation (also a beneficiary of oil price weakness).
Despite a rollercoaster second quarter, Chinese equities ended the year with offshore-listed equities up 4.2%. Stocks traded down sharply in June with A-shares falling in response to fears of a government crackdown on grey market margin financing, and offshore markets dragged down both by A-shares and renewed concerns over Greece. Macro indicators showed some signs of stabilisation from a very low base, thanks to monetary easing. Earnings revisions remained negative, in line with weak economic conditions, with industrials and materials representing the main detractors. Sectors where companies have seen positive revisions were led by brokers and insurance as underlying fundamentals continued to strengthen.
Chinese equities ended sharply down in the third quarter, with offshore-listed equities falling 23.2%. This was due to the higher risk premium created by the government crackdown on margin financing, the
sudden devaluation of the renminbi and weaker earnings potential due to further macro weakness. The government’s less coordinated crackdown of grey market financing resulted in a sharp share price fall after forced selling and dried-up market liquidity, despite support from buying by quasi-government funds. On the macro front, the unexpected 3% devaluation of the renminbi on 11 August surprised the market on the downside. Market worries about the currency move could potentially tie the government’s hands when it comes to further monetary easing. At 6.1%, August’s industrial production figure marked another fall from June’s 6.8% figure, and was close to the Global Financial Crisis low of 5.7%, despite supportive monetary policy. Money supply in August increased by 13.3% showed a continued rebound from April’s near-term low of 10.1% year-on-year growth. Meanwhile, the PBOC cut interest rates by 25 basis points (bps) and reduced the reserve requirement ratio by 50bps in late August/early September. Earnings revisions remained negative, as expected, led by economically sensitive sectors such as materials and technology. Even staples were hurt by weak demand. Positive revisions came from structural growth sectors like insurance, as well as beneficiaries of lower input costs such as utilities.
Chinese equities made modest gains in the fourth quarter, with offshore-listed equities (MSCI China Index) gaining 4%. Further loosening in monetary policy, including another 25 basis points (bps) reduction in interest rates and a 50 bps reduction in the reserve requirement ratio, supported domestic liquidity. However, the government has also taken some measures to offset some upward momentum in domestic equity market, including tightening the margin financing ratio, resuming IPOs and announcing the long-awaited registration system for IPOs. Macro numbers have shown some signs of stabilisation after more accommodative policies have been implemented. Industrial production value growth recovered from 5.6% year-on-year in October
| | | | | | |
| | | |
| 6 | | | | JPMORGAN CHINA REGION FUND, INC. | | DECEMBER 31, 2015 |
to 6.2% year-on-year in November, mainly driven by stronger growth from the automobile sector, after the government reduced the consumption tax for small engine passenger vehicles to stimulate sales. Nominal fixed asset investment growth accelerated to 10.2% year-on-year in November from 9.5% year-on-year in October, largely led by the faster growth of government-led investment and some recovery in manufacturing investment growth to 9.4% year-on-year from 8.3% year-on-year in October. The IMF announced its decision to include China’s RMB in the Special Drawing Rights currency basket in November. However, with the Federal Reserve starting to raise interest rates, RMB traded weaker to US dollar again since November, by around 2% during the quarter. Progress on the reform of state-owned enterprises has been made after the announcement of the merger and reorganisation of some shipping groups: COSCO Group with China Shipping Group and Sinotrans with China Merchants. Attention is then on insurance companies raising significant stakes in some bigger-cap value stocks in the A-share market and triggering a response from corporate management, such as at real estate developer Vanke. Regulators have started to look into the potential risk exposure of such leveraged and concentrated investment by insurance companies but with further reduction of interest rates and tightening of domestic bond yields, demand for high yielding equities should remain strong.
A-Shares
In the first quarter of 2015, the domestic A-share market (CSI 300 Index) rallied, up 15% over the period. Despite a correction in January after regulators suspended new margin account openings, A-shares rebounded in February and continued their strength in March. Expectations of further relaxation of monetary policies and additional fiscal stimulus including domestic infrastructure investment and increasing external demand from the new “One Belt One Road” initiative pushed the market higher.
Onshore A-shares finished up 10.4% in the second quarter of 2015. The market surged in April and May as the Chinese government continued its monetary easing and fiscal stimulus measures. The progress on mutual recognition to sell mutual funds cross-border between Hong Kong and China also encouraged liquidity provision that buoyed mainland stock markets. The gains were somewhat offset by sharp corrections that came in the second half of June after touching new highs in the middle of the month as regulators increased scrutiny on margin financing. The government stepped in to support the market but market sentiment took a hit. Valuations, however, for certain secular growth names became more attractive.
In the third quarter of 2015, however, the onshore A-share market fell nearly 30%. We saw panic selling following the correction in late June and unwinding of margin loans and subsequent various government actions to stabilize the market, including establishing government-controlled equity funds. However, the measures were inadequate to save sufficient investor confidence and worries over a potential exit by the government led to another round of broader base selling towards the end of July. Ensuing declines in August were driven by a surprise RMB devaluation of 2% mid-month in what authorities claimed was a technical adjustment, aligning the currency with its market-implied value, which the markets interpreted as both an acknowledgment of China’s economic weakness and a step towards a substantial competitive devaluation. Further OTC margin account cleanup drove additional weakness in September. As risk reduction by investors weighed on growth stocks amidst a scarcity of economic growth, valuation in those names became more reasonable.
Domestic A-shares (CSI 300) showed stronger recovery in the last quarter of the year by gaining 16% in RMB (or 14% in US dollar terms). Equities rose on further fiscal stimulus measures and monetary easing.
| | | | | | | | |
| | | |
| DECEMBER 31, 2015 | | JPMORGAN CHINA REGION FUND, INC. | | | | | 7 | |
INVESTMENT ADVISOR’S REPORT (continued)
More importantly, 3Q results showed a broader and deeper deterioration in traditional corporate earnings while new industries marked little acceleration in earnings growth. This divergence in earnings results was reflected in respective performance of the “old economy” and “new economy” businesses. However, risk appetite dampened around mid November after regulators tightened regulatory measures around margin financing to prevent the market’s sharp rise. Despite weakness in other regional equities markets, the onshore market recovered in December and new growth stocks in areas such as entertainment and media continued to outperform.
Market Outlook
While the recently concluded Central Economic Working Conference did not set a concrete growth target, it has outlined five key tasks for 2016: reducing overcapacity, lowering costs for businesses, cutting housing inventory, expanding effective supply and preventing financial risks. The meeting also highlighted how fiscal policy will become more expansionary, with an emphasis on supply-side reforms. This should set broad policy direction in 2016, especially for the property sector, and we expect more industry reforms to be launched. Monetary policy should remain accommodative and flexible as inflationary pressure stays low. Onshore stock markets might see more volatility in first quarter as the new IPO registration system commences and major shareholders can also start selling down their stake from 8th January after a six-month ban since the market correction in mid-2015. This might have stronger pressure on the small and medium enterprises and ChiNext boards in the near term, given their outperformance and more demanding valuation. But we believe in the medium to long term, equities with structural growth potential should continue to outperform. Offshore equities should also offer opportunities, as current valuation should now reflect concern over economic growth outlook and RMB trend.
Hong Kong
Market Performance
Most of the gains in Hong Kong equities during the first quarter happened during January, driven by proposed corporate restructuring. The market witnessed explosive growth in turnover towards the end of the quarter, spurred by rule clarifications regarding easier participation from mainland-based mutual funds in the Stock Connect programme. However, the prime beneficiaries of the ensuing stock rally were China-related stocks rather than Hong Kong equities. The surprise announcement of the re-organisation of Cheung Kong and Hutchison Whampoa led to a re-rating due to the elimination of a holding company discount and the enhanced ability to undertake corporate actions following the restructure. Moreover, companies with similar restructuring potential also benefited from market speculation. As largely expected, the Hong Kong Monetary Authority announced further tightening measures at the end of February, primarily targeting mortgages on homes selling for under HKD 7 million. However, new property launches following the announcement of these measures were positively received as developers were able to take on additional financing while secondary property volumes were reduced. Retail sales in Hong Kong appear to be in structural decline, with weakness in overnight visitor growth and per capita spending. Hong Kong appears to be losing its share of mainland tourists to Japan, Korea, and Taiwan, owing in part to relative currency strength. Gaming revenues continued on their recent downward spiral, with declines worse than expected for each of the three months.
Hong Kong equities began the second quarter with a sharp rally sparked ostensibly by the clarification of the rules on domestic mainland China funds investing in Hong Kong equities under the Stock Connect programme. Market turnover set record highs on multiple fronts, including full utilisation of the southbound quota for the first time. However, at
| | | | | | |
| | | |
| 8 | | | | JPMORGAN CHINA REGION FUND, INC. | | DECEMBER 31, 2015 |
quarter end, the market sold off on concerns over Greece’s potential exit from the eurozone, coupled with a substantial market correction in the domestic China equity market. The de-listing of Hutchison Whampoa as part of the group reorganisation was positively received by the market. BOC Hong Kong also announced a sweeping re-focus — officially announcing its intention to sell its China operation in order to deploy more resources into growing its Southeast Asian business in conjunction with China’s “One Belt, One Road” initiative. The failure to pass the electoral reform package proposed by Beijing had little immediate impact on the market, with popular reaction rather muted. The retail sector in Hong Kong took another hit with the announcement of once-a-week restriction on visitors with Shenzhen resident visas. While this is targeted at parallel traders and should help to improve relations between local residents and mainland tourists, the change will nonetheless affect near-term tourist sales. Additionally, the Macau government surprised the market with a relaxation of transit visa restrictions, exactly a year after they were first tightened. While the near-term impact will be modest, this represents the first positive policy to be introduced over the past year or so.
In the third quarter, Hong Kong equities suffered a steep decline after a government crackdown on margin financing caused a sharp correction in the China A-share market. However, government measures — both on the supply and demand side — failed to stem the correction. Investor sentiment was further dented by a surprise 2% renminbi devaluation, sparking fears of a further competitive devaluation, which failed to materialise. Equities were also weighed down by global growth worries, culminating in the US Federal Reserve’s decision to delay an interest rate rise. The utilities sector bucked the trend based on its defensive nature and the delayed US rate hike. The proposed merger of Power Assets into Cheung Kong Infrastructure was also well received at the time, although it failed to
materialise due to an unattractive offer price. On the property front, primary sales projects continued to achieve decent volumes, although on a more selective basis, while secondary prices and rentals have started to pull back. There has been a more pronounced slide in retail rentals, given the continued decline in retail sales as tourist numbers have fallen, especially among overnight mainland tourists, and the strengthening of the Hong Kong dollar. Macau gaming shares started the quarter with a strong rally on the back of a relaxation of the transit visa rules — the first positive policy change in over a year. However, the sector suffered a sharp correction in line with that experienced by the Chinese stock market, which heightened concerns over potential new restrictions on capital outflows. Subsequently, new regulations were announced on casino junket operations and cash transfers from mainland China. The news of a junket manager absconding with client money also contributed to nervous sentiment, causing a further dip in gaming revenues during the middle of September.
Hong Kong equities staged a rally in October as the US rate hike was delayed, while China undertook further monetary easing. However, they retraced some of the gains approaching the rate hike in December, while the Chinese regulators continued to conduct broker investigations affecting sentiments on the domestic market. Despite the US rate increase, the Hong Kong banks did not raise their best lending or deposit rates due to ample system liquidity, partially owing to conversion out of renminbi deposits due to depreciation concerns. Residential property prices fell by 7.5% during the quarter, more than expected, owing to pressures from the falling equity market during the summer, coupled with concerns over the impending US rate hike. The speed of the downturn was exacerbated by the lack of liquidity in the secondary market, with the full-year activity level 10% below that of 2003 during SARS. New project launches also came under pressure, as sell-through rates continued to decline.
| | | | | | | | |
| | | |
| DECEMBER 31, 2015 | | JPMORGAN CHINA REGION FUND, INC. | | | | | 9 | |
INVESTMENT ADVISOR’S REPORT (continued)
The retail sector, especially the high-end and tourist-driven segments, remained under pressure. For example, jewellers reported profit declines of over 40% while the total number of visitor arrivals fell 10% year-on-year in November (with mainland tourist arrivals down 15%). Macau gaming shares rallied on the back of strong National Day gaming volumes as well as better than expected third-quarter results. While gaming revenue growth remained negative year-on-year, the decline narrowed from 34% in the third quarter to 21% in the fourth quarter. However, the announcement of a renewed crackdown on UnionPay usage led to further worries over capital outflow restrictions.
Market Outlook
The impact of the US interest rate normalisation, including ramifications on the renminbi and capital flows, will be closely followed. Indeed, if the pace of interest rate increases turns out to be slower than expected, this could be a positive surprise for rate-sensitive sectors such as the Hong Kong property firms. Though delayed for longer due to market volatility, the eventual launch of the Shenzhen Hong Kong Stock Connect would also boost sentiments. We remain cautious on the structural slowdown in the Hong Kong economy. Valuations in the property sector have discounted significant price reductions, with potential positive surprises from less negative price performance or higher activity levels due to pent-up demand. In contrast, the office sector may witness less upward momentum if multinational and mainland Chinese financial firms are less active. The retail segment remains under pressure, although the mass end of the market should continue to generate modest growth. For Macau gaming, it appears that supportive measures are unlikely to be introduced soon, provided the market remains stable. The stimulus for outperformance will stem from sequential gaming revenue growth in excess of the property additions during last year and this year. The stocks appear to be fairly valued but a growth turnaround would lead to a re-rating cycle.
Taiwan
Market Performance
The Taiex Index gained 3% in the first quarter. The Taiwanese market saw profit taking in the technology sector at the start of the year, particularly in stocks that are part of the Apple supply chain, following a very strong iPhone 6 launch late in the third quarter of last year, as well as concerns that the consumer technology product cycle will be much more moderate in 2015. However, the selling reversed quickly, with qualified foreign institutional investors (QFIIs) becoming strong net buyers of Taiwanese stocks again. This trend reversal started in mid January as the Taiwanese market continued to deliver the best earnings revisions in the region (+5% vs. –2%), while still being seen as one of the most defensive of emerging markets, with a high dividend yield and a high current account surplus-to-GDP ratio of 12-13%. However, there was a shift in technology sentiment again in the final two weeks of the quarter after softer guidance from Taiwan Semiconductor Manufacturing Company as well as concerns about Mediatek’s margins. Foreign investors led the selling in upstream technology stocks in late March. Domestically, the government decided to postpone the implementation of the big player tax until 2018. The tax was seen as an impediment to trading volume as high net worth investors had been avoiding the market ahead of the implementation of the tax. The Government policy on capital markets has remained supportive, with more proposals to enhance retail participation and market turnover, which provided some support for the over the counter (OTC) market and domestic sectors. Most notably, Taiwan’s Financial Supervisory Commission (FSC) allowed more stocks for day trading and stock borrowing/lending (SBL) while removing the current cap on retail margin trading. At the same time, FSC announced a widening of the daily stock up/down limit from 7% to 10% on 3 February. The margin maintenance ratio was raised to 130%
| | | | | | |
| | | |
| 10 | | | | JPMORGAN CHINA REGION FUND, INC. | | DECEMBER 31, 2015 |
from 120%, along with higher price limits. The new daily limit is the first major revision to the stock limit in the past 25 years. The Central Bank of the Republic of China (CBC) kept the policy rate unchanged at 1.875%, marking the fourteenth consecutive quarter that the CBC has kept the rate unchanged — one of the longest periods of an unchanged policy rate in history. On the exchange rate, the CBC said that it would keep the currency dynamically stable. It would not intentionally support either the appreciation or the depreciation of the currency.
During the second quarter, the Taiex trended higher in April, but failed to sustain this momentum in latter sessions. The TWSE finished down 2.7% quarter on quarter. The strength in April was boosted by speculation over the establishment of a stock trading link between Taipei and Shanghai. Unsurprisingly, financials were one of the strongest performers for the quarter. Besides being the biggest beneficiaries of a stock connect, financials reported stronger-than-expected first-quarter 2015 results. The market turned weak in May and June, with investors locking in profits ahead of the summer. Technology wrapped up the quarter with 4.5% quarter-on-quarter decline, with weakness in most sub-sectors on concerns over slower-than-expected first-half momentum. Besides weak sales of PCs and notebooks, sluggish smartphone demand from China and the emerging markets meant inventory digestion was taking longer than expected. Non-technology fared better in comparison, with gains in energy, textile, financials and food. The textile sub-sector was helped by the fast-growing leisurewear market in the US, while the China Securities Finance Corporation’s new Renminbi Qualified Foreign Institutional Investor measure is expected to benefit Taiwan’s financial institutions. Exports and domestic demand started the year softly, with total export orders declining by 5.9% year-on-year in US dollar terms in May. Taiwan industrial production was weaker than expected,
down 3.2% year-on-year in May. The Central Bank of the Republic of China (Taiwan) kept the policy rate at 1.875%, shrugging off negative headline CPI inflation and demonstrating its confidence on the economic outlook.
The Taiwan Stock Exchange Index fell 13% in the third quarter — its biggest quarterly decline in the last four years. The index trended steadily down in July and August on strong selling following the worst slump in Chinese stocks since the global financial crisis. The market stabilised in September despite concerns of weak global growth after US Federal Reserve’s (the Fed’s) delay in interest rate rise. The market was supported by the launch of the National Stabilization Fund, which is to remain active until April 15, 2016. Defensive sectors like food outperformed. Owing to Taiwan new dollar weakness and an interest rate cut by Taiwan’s central bank, the financial sector came under heavy selling pressure. Weak technology demand and relatively high inventory levels not only led to a disappointing results season in the second quarter, but also to a weaker outlook for the technology sector in the third quarter. For example, most of the stocks in the Apple iPhone supply chain lost ground as investors worried about sales of the new phones this year. On the macro front, the Taiwanese government lowered its 2015 GDP growth forecast from 3.3% to 1.6%. The weakness in Taiwan’s second-quarter GDP was mainly a result of the poor performance of the export and manufacturing sectors. On the domestic front, GDP expenditure data showed decent growth in private consumption. Meanwhile, fixed investment growth rebounded in the second quarter, indicating the potential for moderate economic recovery going into the second half.
The Taiex traded well initially in the fourth quarter but the market fell heavily in November after the presidential summit between Taiwan and China failed to produce any substantial economic incentives and on increasing concerns over weaker
| | | | | | | | |
| | | |
| DECEMBER 31, 2015 | | JPMORGAN CHINA REGION FUND, INC. | | | | | 11 | |
INVESTMENT ADVISOR’S REPORT (continued)
than expected iPhone sales. This continued into December, when the index fell below the 8000 mark, before closing up 1.9% for the fourth quarter. The index shed 10.41% for the year, its steepest yearly drop since 2011. The foundry sector saw inflow from foreign institutional investors, driven by near-term rebound of Taiwan Semiconductor Manufacturing Company’s use of 28nm technology and a solid long-term outlook of widening technological advantage. Healthcare also gained traction thanks to better earnings results and new drug approvals, as well as the market expectation of favourable government policies — the Democratic Progressive Party (DPP) has made biotech one of its focus industries. Meanwhile, financials, materials and information technology (PCs) continued to be out of favour. The Taiwan government released third quarter real GDP falling 0.6% year-on-year. The breakdown of third quarter GDP by expenditure showed that while the economy is still contracting, exports posted a smaller drag. As external macro uncertainty lingered and consumer price index inflation remained muted, Taiwan’s central bank cut a key policy rate twice to 1.625%. With inflation pressure likely to remain muted in 2016 on weak growth, there could be room for further easing in the first quarter of 2016.
Market Outlook
The Taiwan market is likely to face a couple of headwinds going into the first half of 2016. Both
economic growth and corporate earnings would face a tough base comparison. Besides the first quarter being seasonally weak, the tech sector is likely to see slow iPhones shipment, on weaker than expected demand. Meanwhile there is a lack of new tech product cycle to offset the speed bump from Apple. Additionally, the Democratic Progress Party won presidential and legislative elections decisively, as anticipated. There could be a policy vacuum as the president-elect, Tsai Ing-Wen, is not likely to take over until late in the second quarter of 2016. However, Taiwan’s underperformance in 2015 could have already reflected any concerns over policy discontinuity and the DPP’s pro-independence stance. The first half of 2016 is likely to see anaemic tech growth, but the second half will likely accelerate on easy base comparisons, tech restocking and the launch of the iPhone 7. Negative earnings revisions have slowed, and recent merger and acquisitions activity in the technology sector is likely to continue. Valuation remains attractive on 12x 2016 earnings, with above regional-average dividend yield.
Emerson Yip
JF International Management, Inc
February 29, 2016
| | | | | | |
| | | |
| 12 | | | | JPMORGAN CHINA REGION FUND, INC. | | DECEMBER 31, 2015 |
TOP TEN HOLDINGS
AT DECEMBER 31, 2015 (Unaudited)
| | | | |
| | | % OF
NET ASSETS | |
Tencent Holdings Ltd. | | | 7.2 | |
| Provides internet, mobile, and telecommunication value-added services in China. The company has an instant messaging community in China. Tencent also provides online advertising services. | | | | |
| |
Taiwan Semiconductor Manufacturing Co., Ltd. (‘TSMC’) | | | 6.2 | |
| Manufactures and markets integrated circuits. The company provides the following services: wafer manufacturing, wafer probing, assembly and testing, mask production and design services. The company’s integrated circuits are used in computer, communication, consumer electronics, automotive and industrial equipment industries. | | | | |
| |
China Construction Bank Corp. ‘H’ | | | 5.6 | |
| Provides a complete range of banking services and other financial services to individual and corporate customers. The bank’s services include retail banking, international settlement, project finance and credit card services. | | | | |
| |
AIA Group Ltd. | | | 4.6 | |
| Offers insurance and financial services. The company writes life insurance for individuals and businesses, accident and health insurance, retirement planning, and wealth management services. | | | | |
| |
China Merchants Bank Co., Ltd. ‘H’ | | | 4.2 | |
| Provides a wide range of commercial banking services including deposits, loan, bill discount, government bonds underwriting and trading, interbank lending, letter of credit, bank guarantee, and other related services. | | | | |
| |
Ping An Insurance Group Co. Ltd. ‘A’ | | | 4.1 | |
| Provides a variety of insurance service in China. The Company writes property, casualty, and life insurance. Ping An Insurance also offers financial services. | | | | |
| |
Industrial Bank Co., Ltd. ‘A’ | | | 3.3 | |
| Provides personal, corporate, institutional and electronic banking services. The Bank’s businesses include residential mortgage, loan, savings and time deposit, RMB money management, foreign currency management advisory service and trading, and debit and credit cards. | | | | |
| |
China Vanke Co., Ltd. ‘H’ | | | 3.0 | |
| A property development company, which develops residential properties in Shenzhen, Shanghai, Beijing, Tianjin, Shenyang, Nanjing, and other big cities in China. | | | | |
| |
CK Hutchison Holdings Ltd. | | | 2.5 | |
| Holds all of the non-property businesses of the Cheung Kong Group and the Hutchison Group, including ports and related services, telecommunications, retail, infrastructure, energy and movable assets leasing operations. | | | | |
| |
Sino Biopharmaceutical Ltd. | | | 2.4 | |
| Through its subsidiaries, researches, develops, produces, and sells biopharmaceautical products for the medical treatment of ophthalmia, as well as modernized Chinese medicine and chemical medicine for the treatment of hepatitis. | | | | |
| | | | | | | | |
| | | |
| DECEMBER 31, 2015 | | JPMORGAN CHINA REGION FUND, INC. | | | | | 13 | |
INVESTMENT PORTFOLIO
AT DECEMBER 31, 2015
| | | | | | | | |
| DESCRIPTION | | HOLDINGS
(IN SHARES) | | | VALUE
(IN US$) | |
COMMON STOCK | |
CHINA (63.1%) | |
Aerospace & Defense (0.5%) | |
Avic Aviation Engine Corp. plc, ‘A’ | | | 74,801 | | | | 518,709 | |
| | | | | | | | |
Airlines (1.1%) | |
Spring Airlines Co., Ltd., ‘A’ | | | 135,129 | | | | 1,269,384 | |
| | | | | | | | |
Automobiles (1.1%) | |
Chongqing Changan Automobile Co., Ltd., ‘A’ | | | 493,602 | | | | 1,289,951 | |
| | | | | | | | |
Banks (13.0%) | |
China Construction Bank Corp. | | | 9,206,000 | | | | 6,307,554 | |
China Merchants Bank Co., Ltd. | | | 2,000,000 | | | | 4,722,550 | |
Industrial Bank Co., Ltd., ‘A’ | | | 1,404,500 | | | | 3,692,069 | |
| | | | | | | | |
| | | | | | | 14,722,173 | |
| | | | | | | | |
Beverages (0.9%) | |
Kweichow Moutai Co., Ltd., ‘A’ | | | 29,580 | | | | 993,911 | |
| | | | | | | | |
Capital Markets (2.1%) | |
Huatai Securities Co., Ltd., ‘A’ | | | 781,250 | | | | 2,372,528 | |
| | | | | | | | |
Chemicals (1.1%) | |
Jiangsu Kangde Xin Composite Material Co., Ltd., ‘A’ | | | 221,597 | | | | 1,300,180 | |
| | | | | | | | |
Commercial Services & Supplies (0.6%) | |
Beijing Originwater Technology Co., Ltd., ‘A’ | | | 86,100 | | | | 686,429 | |
| | | | | | | | |
Construction & Engineering (1.5%) | |
China Communications Construction Co., Ltd. | | | 1,661,000 | | | | 1,697,424 | |
| | | | | | | | |
Diversified Consumer Services (0.7%) | |
China Maple Leaf Educational Systems Ltd. | | | 1,582,000 | | | | 777,727 | |
| | | | | | | | |
Diversified Telecommunication Services (2.3%) | |
China Telecom Corp., Ltd. | | | 5,456,000 | | | | 2,562,544 | |
| | | | | | | | |
Electronic Equipment, Instruments & Components (3.0%) | |
AAC Technologies Holdings, Inc. | | | 297,000 | | | | 1,937,194 | |
Hangzhou Hikvision Digital Technology Co., Ltd., ‘A’ | | | 285,580 | | | | 1,512,427 | |
| | | | | | | | |
| | | | | | | 3,449,621 | |
| | | | | | | | |
Health Care Providers & Services (0.8%) | |
Phoenix Healthcare Group Co., Ltd. | | | 787,000 | | | | 920,023 | |
| | | | | | | | |
| | | | | | | | |
| DESCRIPTION | | HOLDINGS
(IN SHARES) | | | VALUE
(IN US$) | |
Hotels, Restaurants & Leisure (1.9%) | |
China CYTS Tours Holding Co., Ltd., ‘A’ | | | 286,200 | | | | 1,027,369 | |
Wynn Macau Ltd. | | | 937,600 | | | | 1,096,077 | |
| | | | | | | | |
| | | | | | | 2,123,446 | |
| | | | | | | | |
Independent Power & Renewable Electricity Producers (0.7%) | |
China Longyuan Power Group Corp., Ltd. | | | 1,083,000 | | | | 817,485 | |
| | | | | | | | |
Insurance (5.4%) | |
PICC Property & Casualty Co., Ltd. | | | 694,000 | | | | 1,380,827 | |
Ping An Insurance Group Co. of China Ltd., ‘A’ | | | 841,752 | | | | 4,666,606 | |
| | | | | | | | |
| | | | | | | 6,047,433 | |
| | | | | | | | |
Internet Software & Services (10.5%) | |
Alibaba Group Holding Ltd. (a) | | | 24,700 | | | | 2,007,369 | |
Tencent Holdings Ltd. | | | 414,800 | | | | 8,162,141 | |
Wangsu Science & Technology Co., Ltd., ‘A’ | | | 186,091 | | | | 1,719,169 | |
| | | | | | | | |
| | | | | | | 11,888,679 | |
| | | | | | | | |
Leisure Products (1.2%) | |
Guangdong Alpha Animation and Culture Co., Ltd., ‘A’ | | | 163,925 | | | | 1,305,372 | |
| | | | | | | | |
Machinery (2.0%) | |
China Conch Venture Holdings Ltd. | | | 467,000 | | | | 967,738 | |
Han’s Laser Technology Industry Group Co., Ltd., ‘A’ | | | 165,700 | | | | 660,646 | |
Shenzhen Inovance Technology Co., Ltd., ‘A’ | | | 92,702 | | | | 673,823 | |
| | | | | | | | |
| | | | | | | 2,302,207 | |
| | | | | | | | |
Media (1.1%) | |
Zhejiang Huace Film & TV Co., Ltd., ‘A’ | | | 263,950 | | | | 1,210,895 | |
| | | | | | | | |
Oil, Gas & Consumable Fuels (3.0%) | |
China Petroleum & Chemical Corp. | | | 1,857,400 | | | | 1,121,623 | |
CNOOC Ltd. | | | 2,217,000 | | | | 2,308,526 | |
| | | | | | | | |
| | | | | | | 3,430,149 | |
| | | | | | | | |
Pharmaceuticals (0.9%) | |
Jiangsu Hengrui Medicine Co., Ltd., ‘A’ | | | 132,594 | | | | 1,002,990 | |
| | | | | | | | |
SEE ACCOMPANYING NOTES TO FINANCIAL STATEMENTS.
| | | | | | |
| | | |
| 14 | | | | JPMORGAN CHINA REGION FUND, INC. | | DECEMBER 31, 2015 |
| | | | | | | | |
| DESCRIPTION | | HOLDINGS
(IN SHARES) | | | VALUE
(IN US$) | |
COMMON STOCK — continued | |
Real Estate Management & Development (5.0%) | |
China Vanke Co., Ltd. | | | 1,148,200 | | | | 3,392,724 | |
Poly Real Estate Group Co., Ltd., ‘A’ | | | 1,363,650 | | | | 2,234,390 | |
| | | | | | | | |
| | | | | | | 5,627,114 | |
| | | | | | | | |
Road & Rail (1.2%) | |
CAR, Inc. (a) | | | 785,000 | | | | 1,300,559 | |
| | | | | | | | |
Software (0.3%) | |
Aisino Co., Ltd., ‘A’ | | | 42,500 | | | | 382,353 | |
| | | | | | | | |
Specialty Retail (1.1%) | |
China Harmony New Energy Auto Holding Ltd. | | | 1,818,000 | | | | 1,283,148 | |
| | | | | | | | |
Trading Companies & Distributors (0.1%) | |
Xiamen C & D, Inc., ‘A’ | | | 73,208 | | | | 158,172 | |
| | | | | | | | |
TOTAL CHINA | | | | | | | 71,440,606 | |
| | | | | | | | |
HONG KONG (31.5%) | |
Auto Components (0.8%) | |
Nexteer Automotive Group Ltd. | | | 831,000 | | | | 924,281 | |
| | | | | | | | |
Banks (2.8%) | |
BOC Hong Kong Holdings Ltd. | | | 672,500 | | | | 2,056,535 | |
Dah Sing Banking Group Ltd. | | | 602,800 | | | | 1,067,144 | |
| | | | | | | | |
| | | | | | | 3,123,679 | |
| | | | | | | | |
Commercial Services & Supplies (1.2%) | |
China Everbright International Ltd. | | | 1,073,000 | | | | 1,378,969 | |
| | | | | | | | |
Communications Equipment (0.7%) | |
VTech Holdings Ltd. | | | 81,200 | | | | 841,855 | |
| | | | | | | | |
Diversified Financial Services (2.3%) | |
Hong Kong Exchanges and Clearing Ltd. | | | 101,354 | | | | 2,595,953 | |
| | | | | | | | |
Gas Utilities (1.6%) | |
China Resources Gas Group Ltd. | | | 594,000 | | | | 1,774,324 | |
| | | | | | | | |
Household Durables (0.8%) | |
Man Wah Holdings Ltd. | | | 773,600 | | | | 910,347 | |
| | | | | | | | |
Industrial Conglomerates (3.2%) | |
CK Hutchison Holdings Ltd. | | | 205,500 | | | | 2,773,569 | |
Shun Tak Holdings Ltd. | | | 2,256,000 | | | | 849,997 | |
| | | | | | | | |
| | | | | | | 3,623,566 | |
| | | | | | | | |
| | | | | | | | |
| DESCRIPTION | | HOLDINGS
(IN SHARES) | | | VALUE
(IN US$) | |
Insurance (6.3%) | |
AIA Group Ltd. | | | 866,600 | | | | 5,210,748 | |
China Taiping Insurance Holdings Co., Ltd. (a) | | | 617,000 | | | | 1,910,698 | |
| | | | | | | | |
| | | | | | | 7,121,446 | |
| | | | | | | | |
Pharmaceuticals (2.3%) | |
Sino Biopharmaceutical Ltd. | | | 2,926,000 | | | | 2,665,474 | |
| | | | | | | | |
Real Estate Management & Development (4.5%) | |
Cheung Kong Property Holdings Ltd. | | | 357,500 | | | | 2,324,888 | |
New World Development Co., Ltd. | | | 1,444,053 | | | | 1,427,274 | |
Sun Hung Kai Properties Ltd. | | | 108,000 | | | | 1,304,353 | |
| | | | | | | | |
| | | | | | | 5,056,515 | |
| | | | | | | | |
Textiles, Apparel & Luxury Goods (2.6%) | |
Pacific Textiles Holdings Ltd. | | | 561,000 | | | | 865,744 | |
Regina Miracle International Holdings Ltd. (a) (e) | | | 703,000 | | | | 1,025,013 | |
Samsonite International S.A. | | | 361,800 | | | | 1,087,727 | |
| | | | | | | | |
| | | | | | | 2,978,484 | |
| | | | | | | | |
Water Utilities (0.6%) | |
Beijing Enterprises Water Group Ltd. (a) | | | 922,000 | | | | 645,991 | |
| | | | | | | | |
Wireless Telecommunication Services (1.8%) | |
China Mobile Ltd. | | | 178,000 | | | | 2,009,664 | |
| | | | | | | | |
TOTAL HONG KONG | | | | | | | 35,650,548 | |
| | | | | | | | |
TAIWAN (15.4%) | |
Banks (1.4%) | |
E.Sun Financial Holding Co., Ltd. | | | 2,768,833 | | | | 1,614,246 | |
| | | | | | | | |
Diversified Financial Services (1.4%) | |
Fubon Financial Holding Co., Ltd. | | | 1,142,989 | | | | 1,565,881 | |
| | | | | | | | |
Electronic Equipment, Instruments & Components (1.4%) | |
Delta Electronics, Inc. | | | 14,965 | | | | 70,846 | |
Largan Precision Co., Ltd. | | | 21,000 | | | | 1,451,274 | |
| | | | | | | | |
| | | | | | | 1,522,120 | |
| | | | | | | | |
Food & Staples Retailing (0.9%) | |
President Chain Store Corp. | | | 161,000 | | | | 1,007,261 | |
| | | | | | | | |
Semiconductors & Semiconductor Equipment (8.9%) | |
Advanced Semiconductor Engineering, Inc. | | | 1,647,802 | | | | 1,906,307 | |
Chipbond Technology Corp. | | | 322,000 | | | | 466,134 | |
Silicon Motion Technology Corp. | | | 23,205 | | | | 727,709 | |
SEE ACCOMPANYING NOTES TO FINANCIAL STATEMENTS.
| | | | | | | | |
| | | |
| DECEMBER 31, 2015 | | JPMORGAN CHINA REGION FUND, INC. | | | | | 15 | |
INVESTMENT PORTFOLIO
AT DECEMBER 31, 2015 (continued)
| | | | | | | | |
| DESCRIPTION | | HOLDINGS
(IN SHARES) | | | VALUE
(IN US$) | |
COMMON STOCK — continued | |
Semiconductors & Semiconductor Equipment — continued | |
Taiwan Semiconductor Manufacturing Co., Ltd. | | | 1,606,057 | | | | 6,991,998 | |
| | | | | | | | |
| | | | | | | 10,092,148 | |
| | | | | | | | |
Technology Hardware, Storage & Peripherals (1.4%) | |
Catcher Technology Co., Ltd. | | | 189,000 | | | | 1,588,090 | |
| | | | | | | | |
TOTAL TAIWAN | | | | | | | 17,389,746 | |
| | | | | | | | |
TOTAL INVESTMENTS
(110.0% of Net Assets)
(Cost $110,769,590) | | | | 124,480,900 | |
| | | | | | | | |
Liabilities in excess of other assets
(-10.0% of Net Assets) | | | | (11,293,531 | ) |
| | | | | | | | |
NET ASSETS (100.0%) | | | | | | | 113,187,369 | |
| | | | | | | | |
| | | | |
As of December 31, 2015, aggregate cost for Federal income tax purposes was $111,287,759. The aggregate unrealized gain for all securities is as follows: | |
Excess of market value over cost | | | 21,268,660 | |
Excess of cost over market value | | | (8,075,519 | ) |
| | | | |
Net unrealized gain | | | 13,193,141 | |
| | | | |
NOTES TO SCHEDULE OF PORTFOLIO INVESTMENTS :
| (a) | Non-income producing security. |
| (e) | Security is exempt from registration under Rule 144A of the Securities Act of 1933, as amended. Unless otherwise indicated, this security has been determined to be liquid under procedures established by the Board of Directors and may be resold in transactions exempt from registration, normally to qualified institutional buyers. |
| A | China A - shares. (See Note 7.iii on page 28) |
SEE ACCOMPANYING NOTES TO FINANCIAL STATEMENTS.
| | | | | | |
| | | |
| 16 | | | | JPMORGAN CHINA REGION FUND, INC. | | DECEMBER 31, 2015 |
STATEMENT OF ASSETS AND LIABILITIES
AT DECEMBER 31, 2015
| | | | |
| | | (in US$) | |
ASSETS: | |
Investments in non-affiliates, at value (cost $110,769,590) | | | 124,480,900 | |
Cash | | | 3,088,950 | |
Foreign currency, at value (cost $6,541,954) | | | 6,520,020 | |
Deposits at broker (See Note 7.iii.) | | | 27,163 | |
Receivable for securities sold | | | 138,074 | |
Dividends receivable | | | 28,955 | |
Other assets | | | 10,000 | |
| | | | |
Total Assets | | | 134,294,062 | |
| | | | |
| |
LIABILITIES: | | | | |
Loan payable to bank (See Note 6) | | | 15,000,000 | |
Payables | | | | |
Distributions | | | 4,748,169 | |
Payable for securities purchased | | | 1,001,302 | |
Accrued Liabilities | | | | |
Deferred China capital gains tax | | | 117,697 | |
Custodian and accounting fees | | | 75,093 | |
Administration fees | | | 29,167 | |
Investment advisory fees | | | 25,300 | |
Interest on loan | | | 7,058 | |
Directors’ fees and expenses | | | 1,703 | |
Other | | | 101,204 | |
| | | | |
Total Liabilities | | | 21,106,693 | |
| | | | |
Net Assets | | | 113,187,369 | |
| | | | |
| |
| Net assets consist of: | | | | |
Common stock, $0.01 par value
(100,000,000 shares authorized; 6,447,637 shares issued and outstanding) | | | 64,476 | |
Paid-in capital | | | 98,994,144 | |
Accumulated undistributed (distributions in excess of) net investment income | | | (7,906 | ) |
Accumulated realized gain on investments and foreign currency transactions | | | 447,855 | |
Accumulated net unrealized appreciation on investments, foreign currency holdings, and other
assets and liabilities denominated in foreign currencies | | | 13,688,800 | |
| | | | |
Net Assets | | | 113,187,369 | |
| | | | |
Net Asset Value Per Share ($113,187,369 ÷ 6,447,637) | | | 17.55 | |
| | | | |
SEE ACCOMPANYING NOTES TO FINANCIAL STATEMENTS.
| | | | | | | | |
| | | |
| DECEMBER 31, 2015 | | JPMORGAN CHINA REGION FUND, INC. | | | | | 17 | |
STATEMENT OF OPERATIONS
FOR THE YEAR ENDED DECEMBER 31, 2015
| | | | |
| | | (in US$) | |
INVESTMENT INCOME: | |
Dividends from non-affiliates (net of foreign withholding tax of $318,859) | | | 3,265,120 | |
Interest income from non-affiliates | | | 3,059 | |
Interest income from affiliates | | | 2,583 | |
| | | | |
Total Investment Income | | | 3,270,762 | |
| | | | |
| |
EXPENSES: | | | | |
Investment advisory fees | | | 1,469,088 | |
Directors’ fees and expenses | | | 310,177 | |
Custodian and accounting fees | | | 289,858 | |
Interest expense to non-affiliates (See Note 6) | | | 180,967 | |
Legal fees | | | 90,730 | |
Administration fees | | | 87,500 | |
Audit fees | | | 81,934 | |
Shareholder report fees | | | 46,022 | |
Insurance fees | | | 43,428 | |
NYSE listing fees | | | 24,570 | |
Shareholder service fees | | | 19,257 | |
Interest expense to affiliates | | | 3 | |
Other expenses | | | 26,984 | |
| | | | |
Total Expenses | | | 2,670,518 | |
| | | | |
Less amounts waived (See Note 4) | | | (62,646 | ) |
| | | | |
Net expenses | | | 2,607,872 | |
| | | | |
Net Investment Income | | | 662,890 | |
| | | | |
| |
REALIZED AND UNREALIZED GAIN (LOSS) ON INVESTMENTS, FOREIGN CURRENCY
HOLDINGS AND OTHER ASSETS AND LIABILITIES DENOMINATED IN FOREIGN CURRENCIES: | | | | |
Net realized gain (loss) | | | | |
Investments in non-affiliates* | | | 8,148,602 | |
Foreign currency transactions | | | (193,073 | ) |
| | | | |
Net realized gain (loss) | | | 7,955,529 | |
| | | | |
Net change in unrealized appreciation/depreciation | | | | |
Investments in non-affiliates | | | (14,152,977 | ) |
Foreign currency translations | | | (24,121 | ) |
| | | | |
Change in net unrealized appreciation/depreciation | | | (14,177,098 | ) |
| | | | |
Net realized and unrealized gain (loss) on investments, foreign currency holdings and other
assets and liabilities denominated in foreign currencies | | | (6,221,569 | ) |
| | | | |
Net decrease in net assets resulting from operations | | | (5,558,679 | ) |
| | | | |
| * | Net of a reduction of China capital gain tax accrual of $378,724. (See Note 2) |
SEE ACCOMPANYING NOTES TO FINANCIAL STATEMENTS.
| | | | | | |
| | | |
| 18 | | | | JPMORGAN CHINA REGION FUND, INC. | | DECEMBER 31, 2015 |
STATEMENT OF CHANGES IN NET ASSETS
FOR THE PERIODS INDICATED
| | | | | | | | |
| | | Year Ended
December 31, 2015
(in US$) | | | Year Ended
December 31, 2014
(in US$) | |
INCREASE IN NET ASSETS: | |
Operations | | | | | | | | |
Net investment income | | | 662,890 | | | | 907,437 | |
Net realized gain (loss) on investment transactions | | | 7,955,529 | | | | 8,321,030 | |
Net change in unrealized appreciation (depreciation) on investments, foreign currency holdings and other assets and liabilities denominated in foreign currencies | | | (14,177,098 | ) | | | 5,177,093 | |
| | | | | | | | |
Net increase (decrease) in net assets resulting from operations | | | (5,558,679 | ) | | | 14,405,560 | |
| | | | | | | | |
| | |
DISTRIBUTIONS TO STOCKHOLDERS: | | | | | | | | |
Net investment income | | | (2,134,575 | ) | | | (818,850 | ) |
Net realized gain | | | (4,141,684 | ) | | | — | |
| | | | | | | | |
Total distributions to shareholders | | | (6,276,259 | ) | | | (818,850 | ) |
| | | | | | | | |
Total increase (decrease) in net assets | | | (11,834,938 | ) | | | 13,586,710 | |
| | | | | | | | |
| | |
NET ASSETS: | | | | | | | | |
Beginning of period | | | 125,022,307 | | | | 111,435,597 | |
| | | | | | | | |
End of period (including undistributed (distributions in excess of) net investment income of $(7,906) and $1,491,587, respectively) | | | 113,187,369 | | | | 125,022,307 | |
| | | | | | | | |
| | |
SHARE TRANSACTIONS | | | | | | | | |
Opening number of shares | | | 6,447,637 | | | | 6,447,637 | |
| | | | | | | | |
Closing number of shares | | | 6,447,637 | | | | 6,447,637 | |
| | | | | | | | |
SEE ACCOMPANYING NOTES TO FINANCIAL STATEMENTS.
| | | | | | | | |
| | | |
| DECEMBER 31, 2015 | | JPMORGAN CHINA REGION FUND, INC. | | | | | 19 | |
STATEMENT OF CASH FLOWS
FOR THE YEAR ENDED DECEMBER 31, 2015
| | | | |
| | | (in US$) | |
INCREASE (DECREASE) IN CASH | | | | |
Cash flows provided (used) by operating activities: | | | | |
Decrease in net assets resulting from operations | | | (5,558,679 | ) |
Adjustments to reconcile net increase/decrease in net assets resulting
from operations to net cash provided (used) by operating activities: | | | | |
Purchase of investment securities | | | (148,297,709 | ) |
Proceeds from disposition of investment securities | | | 156,811,863 | |
Change in unrealized (appreciation)/depreciation on investments in non-affiliates | | | 14,152,977 | |
Net realized (gain)/loss on investments | | | (8,148,602 | ) |
Decrease in deposits at broker | | | 1,268 | |
Decrease in dividends receivable | | | 20,273 | |
Increase in other assets | | | (10,000 | ) |
Decrease in accrued expenses and other liabilities | | | (103,368 | ) |
| | | | |
Net cash provided (used) by operating activities | | | 8,868,023 | |
| | | | |
| |
Cash flows provided (used) by financing activities: | | | | |
Proceeds from borrowings | | | 2,500,000 | |
Repayment of borrowings | | | (2,500,000 | ) |
Cash distributions paid to shareholders | | | (1,528,090 | ) |
| | | | |
Net cash provided (used) by financing activities | | | (1,528,090 | ) |
| | | | |
Net increase in cash | | | 7,339,933 | |
| | | | |
| |
Cash: | | | | |
Beginning of year (including foreign currency of $1,162,989) | | | 2,269,037 | |
| | | | |
End of year (including foreign currency of $6,520,020) | | | 9,608,970 | |
| | | | |
Supplemental disclosure of cash flow information:
During 2015, the Fund paid $190,342 in interest expense, including $3 to affiliates.
For purposes of reporting the Statement of Cash Flows, the Fund considers all cash accounts that are not subject to withdrawal restrictions or penalties to be cash.
SEE ACCOMPANYING NOTES TO FINANCIAL STATEMENTS.
| | | | | | |
| | | |
| 20 | | | | JPMORGAN CHINA REGION FUND, INC. | | DECEMBER 31, 2015 |
FINANCIAL HIGHLIGHTS
FOR THE PERIODS INDICATED
| | | | | | | | | | | | | | | | | | | | |
| | | For the
Year Ended
December 31,
2015
(in US$) | | | For the
Year Ended
December 31,
2014
(in US$) | | | For the
Year Ended
December 31,
2013
(in US$) | | | For the
Year Ended
December 31,
2012
(in US$) | | | For the
Year Ended
December 31,
2011
(in US$) | |
For a share outstanding
throughout each year: | | | | | | | | | | | | | | | | | | | | |
Net asset value, beginning of period | | | 19.39 | | | | 17.28 | | | | 15.47 | | | | 12.75 | | | | 17.41 | |
| | | | | | | | | | | | | | | | | | | | |
Net investment income (loss) | | | 0.10 | | | | 0.14 | | | | 0.10 | | | | 0.08 | | | | 0.14 | |
Net realized and unrealized gain (loss) | | | (0.97 | ) | | | 2.10 | | | | 1.84 | | | | 2.74 | | | | (4.70 | ) |
| | | | | | | | | | | | | | | | | | | | |
Total from investment operations | | | (0.87 | ) | | | 2.24 | | | | 1.94 | | | | 2.82 | | | | (4.56 | ) |
| | | | | | | | | | | | | | | | | | | | |
Dividends from net investment income | | | (0.34 | ) | | | (0.13 | ) | | | (0.13 | ) | | | (0.10 | ) | | | (0.10 | ) |
Distributions from net realized gains | | | (0.63 | ) | | | — | | | | — | | | | — | | | | — | |
| | | | | | | | | | | | | | | | | | | | |
Total distributions | | | (0.97 | ) | | | (0.13 | ) | | | (0.13 | ) | | | (0.10 | ) | | | (0.10 | ) |
| | | | | | | | | | | | | | | | | | | | |
Net asset value, end of period | | | 17.55 | | | | 19.39 | | | | 17.28 | | | | 15.47 | | | | 12.75 | |
| | | | | | | | | | | | | | | | | | | | |
Market value, end of period | | | 15.32 | | | | 16.91 | | | | 15.16 | | | | 14.00 | | | | 11.02 | |
| | | | | | | | | | | | | | | | | | | | |
Total Investment Return | | | | | | | | | | | | | | | | | | | | |
Per share market value* | | | (3.6 | )% | | | 12.5 | % | | | 9.2 | % | | | 28.2 | % | | | (29.6 | )% |
| | | | | |
RATIOS/SUPPLEMENTAL DATA | | | | | | | | | | | | | | | | | | | | |
Net assets, end of period | | | 113,187,369 | | | | 125,022,307 | | | | 111,435,597 | | | | 99,728,043 | | | | 82,226,478 | |
Ratio of net expenses to average net assets** | | | 2.00 | % | | | 2.14 | % | | | 2.26 | % | | | 2.11 | % | | | 1.89 | % |
Ratio of net expenses to average net assets, excluding interest expense** | | | 1.86 | % | | | 1.94 | % | | | 2.05 | % | | | 2.04 | % | | | 1.89 | % |
Ratio of total expenses to average net assets, without waivers and reimbursements** | | | 2.05 | % | | | 2.16 | % | | | 2.28 | % | | | 2.12 | % | | | 1.89 | % |
Ratio of total expenses to average net assets, without waivers and reimbursements, excluding interest expense** | | | 1.91 | % | | | 1.96 | % | | | 2.07 | % | | | 2.04 | % | | | 1.89 | % |
Ratio of net investment income to average net assets | | | 0.51 | % | | | 0.82 | % | | | 0.61 | % | | | 0.54 | %�� | | | 0.87 | % |
Portfolio turnover rate | | | 106.0 | % | | | 86.7 | % | | | 66.6 | % | | | 85.8 | % | | | 66.8 | % |
Number of shares outstanding at end of period (in thousands) | | | 6,448 | | | | 6,448 | | | | 6,448 | | | | 6,448 | | | | 6,448 | |
| * | The total investment return excludes the effect of commissions. Dividends and distributions, if any, are assumed for the purpose of this calculation to be reinvested at prices obtained under the Fund’s dividend reinvestment plan or if specified in accordance with the terms of the distribution. |
| ** | The presentation of the expense ratios for the fiscal years ended December 31, 2012 through December 31, 2014 have been revised to correct for an immaterial error in the presentation of expense waivers in those prior periods’ Statements of Operations, which are not presented herein. Certain amounts in those prior years were treated as reductions of total investment advisory fees, whereas the correction treats them as voluntary waivers. The impact of the revision is the inclusion of the total expense ratio for each period presented to reflect contractual expenses prior to the voluntary waiver. Previously only the net expense ratio was presented. |
SEE ACCOMPANYING NOTES TO FINANCIAL STATEMENTS.
| | | | | | | | |
| | | |
| DECEMBER 31, 2015 | | JPMORGAN CHINA REGION FUND, INC. | | | | | 21 | |
NOTES TO FINANCIAL STATEMENTS
AT DECEMBER 31, 2015
1. Organization and Capital
JPMorgan China Region Fund, Inc. (the ‘Fund’) was incorporated in the State of Maryland on May 22, 1992, and is registered as a non-diversified, closed-end management investment company under the Investment Company Act of 1940 (‘1940 Act’). The Fund commenced operations on July 16, 1992.
The Fund seeks to achieve long-term capital appreciation through investments primarily in equity securities of companies with substantial assets in, or revenues derived from, the People’s Republic of China (‘China’), Hong Kong, Taiwan and Macau — collectively, the ‘China Region’.
2. Significant Accounting Policies
The following significant accounting policies, which are in conformity with U.S. generally accepted accounting principles (‘GAAP’), are consistently followed by the Fund in the preparation of its financial statements.
The Fund is an investment company and, accordingly, follows the investment company accounting and reporting guidance of the Financial Accounting Standards Board Accounting Standards Codification Topic 946 — Investment Companies, which is part of GAAP.
The preparation of financial statements in conformity with GAAP requires management to make estimates and assumptions that affect the reported amounts of assets and liabilities and disclosure of contingent assets and liabilities at the date of the financial statements and the reported amounts of increases and decreases in net assets from operations during the reported period. Actual results could differ from these estimates.
i) Security Valuation — The valuation of investments is in accordance with GAAP and the Fund’s valuation policies set forth by and under the supervision and responsibility of the Board of Directors (the “Board”), which established the following approach to valuation, as described more fully below.
All securities for which market quotations are readily available are valued at the last sales price prior to the time of determination or, if no sales price is available at that time, at the mean between the last current bid and ask prices. Securities that are traded over-the-counter are valued, if bid and ask quotations are available, at the mean between the current bid and ask prices. Certain investments of the Fund may, depending upon market conditions, trade in relatively thin markets and/or in markets that experience significant volatility. As a result of these conditions, the prices used by the Fund to value securities may differ from the value that would be realized if these securities were sold and the differences could be material. All other securities and assets are valued at fair value as determined in good faith by the Board of Directors. It is possible that the estimated values may differ significantly from the values that would have been used had a ready market for the investments existed, and such differences could be material. In valuing the Fund’s assets, quotations of foreign securities in a foreign currency are translated to United States (‘U.S.’) dollar equivalents at the prevailing exchange rate in effect on the valuation date. Investments in open ended mutual funds are valued at current day’s closing net asset value per share (‘NAV’).
JF International Management Inc. (the Investment ‘Advisor’), an indirect wholly-owned subsidiary of JPMorgan Chase & Co. (‘JPMorgan’) has established the Asian Fair Valuation Committee (“AFVC”) to assist the Board with the oversight and monitoring of the valuation of the Fund’s investments. The Advisor implements the valuation policies for the valuation of investments, as directed by the Board. The AFVC oversees and carries out the policies for the valuation of investments held in the Fund. This includes monitoring the appropriateness of fair values based on results of ongoing valuation oversight, including but not limited to consideration of macro or security specific events, market events and pricing vendor and broker due diligence. The Advisor is responsible for discussing and assessing the potential impacts of the fair values on an ongoing basis, and at least on a quarterly basis with the AFVC and the Board.
Valuations reflected in this report are as of the report date. As a result, changes in valuation due to market events and/or issuer related events after the report date and prior to issuance of the report are not reflected herein.
| | | | | | |
| | | |
| 22 | | | | JPMORGAN CHINA REGION FUND, INC. | | DECEMBER 31, 2015 |
NOTES TO FINANCIAL STATEMENTS
AT DECEMBER 31, 2015 (continued)
The various inputs that are used in determining the fair value of the Fund’s investments are summarized into the three broad levels listed below.
| • | | Level 1 — quoted prices in active markets for identical securities |
| • | | Level 2 — other significant observable inputs (including quoted prices for similar securities, interest rates, prepayment speeds, credit risk, etc.) |
| • | | Level 3 — significant unobservable inputs (including the Fund’s own assumptions in determining the fair value of investments) |
See the table on “Quantitative Information about Level 3 Fair Value Measurements” for information on the valuation techniques and inputs used to value Level 3 securities held by the Fund at December 31, 2015.
A financial instrument’s level within the fair value hierarchy is based on the lowest level of any input, both individually and in the aggregate, that is significant to the fair value measurement. The inputs or methodology used for valuing securities are not necessarily an indication of the risk associated with investing in those securities.
The following table represents each valuation input as presented on the Investment Portfolio:
| | | | | | | | | | | | | | | | |
| | | Level 1 Quoted prices | | | Level 2 Other significant
observable inputs | | | Level 3 Significant
unobservable inputs | | | Total | |
Investments in Securities | |
Common Stocks | | | | | | | | | | | | | | | | |
China | | $ | 67,507,357 | | | $ | 3,392,724 | | | $ | 540,525 | | | $ | 71,440,606 | |
Hong Kong | | | 35,650,548 | | | | — | | | | — | | | | 35,650,548 | |
Taiwan | | | 17,389,746 | | | | — | | | | — | | | | 17,389,746 | |
| | | | | | | | | | | | | | | | |
Total Common Stocks | | | 120,547,651 | | | | 3,392,724 | | | | 540,525 | | | | 124,480,900 | |
| | | | | | | | | | | | | | | | |
Total Investments in Securities | | $ | 120,547,651 | | | $ | 3,392,724 | | | $ | 540,525 | | | $ | 124,480,900 | |
| | | | | | | | | | | | | | | | |
The transfer from Level 1 to Level 2 of a security valued at $1,809,945 at the beginning of the year was due to the halting of the security’s trading as of December 18, 2015. The security resumed trading on January 6, 2016.
The following is a summary of investments for which significant unobservable inputs (Level 3) were used in determining fair value:
| | | | | | | | | | | | | | | | | | | | | | | | | | | | | | | | | | | | |
| | | Balance
as of
December 31,
2014 | | | Realized
gain
(loss) | | | Change in
unrealized
appreciation
(depreciation) | | | Net
accretion
(amortization) | | | Purchases1 | | | Sales2 | | | Transfers
into
Level 3 | | | Transfers
out of
Level 3 | | | Balance
as of
December 31,
2015 | |
Investments in Securities | | | | | | | | | | | | | | | | | | | | | | | | | | | | | | | | | | | | |
China | | | | | | | | | | | | | | | | | | | | | | | | | | | | | | | | | | | | |
Common Stocks — Software | | $ | — | | | $ | 59,712 | | | $ | 164,210 | | | $ | — | | | $ | 58,115 | | | $ | (160,327 | ) | | $ | 260,643 | | | $ | — | | | $ | 382,353 | |
Common Stocks — Trading Companies & Distributors | | | — | | | | 22,347 | | | | 9,288 | | | | — | | | | 333,939 | | | | (207,402 | ) | | | — | | | | — | | | | 158,172 | |
| | | | | | | | | | | | | | | | | | | | | | | | | | | | | | | | | | | | |
Total | | $ | — | | | $ | 82,059 | | | $ | 173,498 | | | $ | — | | | $ | 392,054 | | | $ | (367,729 | ) | | $ | 260,643 | | | $ | — | | | $ | 540,525 | |
| | | | | | | | | | | | | | | | | | | | | | | | | | | | | | | | | | | | |
| 1 | Purchases include all purchases of securities and securities received in corporate actions. |
| 2 | Sales include all sales of securities, maturities, paydowns and securities tendered in corporate actions. |
| | | | | | | | |
| | | |
| DECEMBER 31, 2015 | | JPMORGAN CHINA REGION FUND, INC. | | | | | 23 | |
NOTES TO FINANCIAL STATEMENTS
AT DECEMBER 31, 2015 (continued)
Transfers between fair value levels are valued utilizing values as of the beginning of the period.
Transfers from Level 2 to Level 3 or from Level 3 to Level 2 are due to a decline or an increase in market activity (e.g. frequency of trades), which resulted in a lack of or increase in available market inputs to determine price.
The changes in net unrealized appreciation (depreciation) attributable to securities owned at December 31, 2015, which were valued using significant unobservable inputs (Level 3) amounted to approximately $ 173,498.
Quantitative Information about Level 3 Fair Value Measurements
| | | | | | | | | | | | |
| | | Fair Value at
December 31, 2015 | | | Valuation Technique(s) | | Unobservable Input(s) | | Range of
Unobservable
Inputs | |
China | | | | | | | | | | | | |
Common Stocks — Software | | $ | 382,353 | | | Last Price (a)
Adjusted by
Proxy Factor (c) | | Proxy Factor (c) | | | 4.5 | % |
China | | | | | | | | | | | | |
Common Stocks — Trading Companies & Distributors | | | 158,172 | | | Last Price (b)
Adjusted by
Proxy Factor (c) | | Proxy Factor (c) | | | (19.9 | %) |
| | | | | | | | | | | | |
Total | | $ | 540,525 | | | | | | | | | |
| | | | | | | | | | | | |
| (a) | Last price could include closing price, last reported sales price, or last fair valued price as described in Note 2i. Security last traded on October 9, 2015. |
| (b) | Last price could include closing price, last reported sales price, or last fair valued price as described in Note 2i. Security last traded on June 26, 2015. |
| (c) | Proxy factor considers movement of the CSI 300 and Shanghai Stock Exchange A Share Index |
The significant unobservable inputs used in the fair value measurement of the Fund’s investments are listed above. Generally, a change in the assumptions used in any input in isolation may be accompanied by a change in another input. Significant changes in any of the unobservable inputs may significantly impact the fair value measurement. The impact is based on the relationship between each unobservable input and the fair value measurement. Significant increases (decreases) in the proxy factor may significantly increase (decrease) the fair value measurement.
ii) Foreign Currency Translation — The books and records of the Fund are maintained in U.S. dollars. Foreign currency amounts are translated into U.S. dollars at the mid-market price of such currencies against U.S. dollars as follows:
| • | | investments, other assets, and liabilities at the prevailing rates of exchange on the valuation date; |
| • | | investment transactions and investment income at the prevailing rates of exchange on the dates of such transactions. |
Although the net assets of the Fund are presented at the foreign exchange rates and market values at the close of the period, the Fund does not isolate that portion of the results of operations arising as a result of changes in the foreign exchange rates from the fluctuations arising from changes in the market prices of the securities held. Similarly, the Fund does not isolate the effect of changes in foreign exchange rates from the fluctuations arising from changes in the market prices of securities sold during the period. Accordingly, realized and unrealized foreign currency gains (losses) are included in the reported net unrealized appreciation/depreciation on investments. The Fund does isolate the effect of changes in foreign exchange rates from fluctuations when determining realized gain or loss for sales of fixed income securities.
Unrealized currency gains (losses) resulting from valuing foreign currency denominated assets and liabilities at period-end exchange rates are reflected as a component of accumulated net unrealized gain (loss) on investments, foreign currency holdings, and other assets and liabilities denominated in foreign currencies.
| | | | | | |
| | | |
| 24 | | | | JPMORGAN CHINA REGION FUND, INC. | | DECEMBER 31, 2015 |
NOTES TO FINANCIAL STATEMENTS
AT DECEMBER 31, 2015 (continued)
iii) Restricted and Illiquid Securities — Certain securities held by the Fund may be subject to legal or contractual restrictions on resale or are illiquid. Restricted securities generally may be resold in transactions exempt from registration under the Securities Act of 1933 (the ‘Securities Act’). Illiquid securities are securities which cannot be disposed of promptly (within seven days) and in the usual course of business at approximately its fair value and include, but are not limited to, repurchase agreements maturing in excess of seven days, time deposits with a withdrawal penalty, non-negotiable instruments and instruments for which no market exists. Disposal of these securities may involve time-consuming negotiations and expense. Prompt sale at the current valuation may be difficult and could adversely affect the net assets of the Fund.
As of December 31, 2015, the Fund had no investments in restricted securities other than securities sold to the Fund under Rule 144A under the Securities Act, as identified in the Investment Portfolio.
iv) Distribution of Income and Gains — The Fund intends to distribute to stockholders, at least annually, substantially all of its net investment income and expects to distribute annually any net long-term capital gains in excess of net short-term capital losses.
Income and capital gain distributions are determined in accordance with Federal income tax regulations and may differ from those determined in accordance with GAAP.
v) Other — Security transactions are accounted for on trade date. Realized gains and losses on the sale of investment securities are determined on the identified cost basis. Interest income is recognized on the accrual basis. Dividend income, net of foreign taxes withheld, if any, is recorded on the ex-dividend date or when the Fund first learns of the dividend.
vi) Foreign Taxes — The Fund may be subject to foreign taxes on income, gains on investments or currency purchases/repatriation, a point of which may be recoverable. The Fund will accrue such taxes and recoveries as applicable, based upon its current interpretation of tax rules and regulations that exist in the markets in which it invests.
As described in Note 7.iii, the Fund invests in China A-shares and can also invest in China B-shares, both of which are separately identified in the Investment Portfolio. Following the announcements made on November 14, 2014 by the People’s Republic of China (‘PRC’) Ministry of Finance, State Administration of Taxation and China Securities Regulatory Commission the Fund no longer provides for 10% capital gains tax (CGT) on realized and unrealized gains made in respect of transactions in China A-shares and China B-shares made on or after November 17, 2014.
Based on further guidance by the Chinese tax authorities in 2015, in September 2015 the QFII filed with the relevant Chinese tax authorities a tax reporting package, which includes disclosures and tax calculations in respect of the Fund’s realized gains from the sale of China A-shares up to and including November 14, 2014. This tax reporting package has been filed using the tax benefits available to the QFII under the China-Hong Kong tax treaty. While the Chinese tax authorities have not formally accepted this tax reporting package as final and no tax has been paid, based on the practice of the Chinese tax authorities and interpretation of PRC tax rules, the Fund has reduced its tax accrual in respect of realized gains made on China A-shares to $66,022, the amount payable per the tax reporting package. No tax return has been requested by, or filed with, the PRC tax authorities in respect of the realized gains made on the sale of China B-shares, but the Fund has calculated its accrual for CGT on these gains using the same methodology as used in the China A-share tax reporting package. The accrual made in respect of realized gains made on the sale of China B-shares is $51,675.
The Advisor believes that the tax positions taken, based on their technical merits, are more likely than not to be sustained if challenged by the relevant Chinese tax authorities. However, various uncertainties do remain until the Chinese tax authorities formally accept this tax reporting package and the Fund pays the tax liability contained therein. Therefore the accruals made in respect of CGT due on gains made on the sales of both China A-shares and China B-shares are kept under constant review by the Advisor and the Board and it is reasonably possible that the CGT accruals could increase in the next
| | | | | | | | |
| | | |
| DECEMBER 31, 2015 | | JPMORGAN CHINA REGION FUND, INC. | | | | | 25 | |
NOTES TO FINANCIAL STATEMENTS
AT DECEMBER 31, 2015 (continued)
12 months depending on the updates received from the Chinese tax authorities and/or advice from the Advisor. Based on the Advisor’s estimate, the range of such reasonably possible increase is $0 to $386,500.
3. Investment Transactions
During the year ended December 31, 2015, the Fund made purchases of $148,189,063 and sales of $156,100,323 of investment securities other than short-term investments. There were no purchases or sales of U.S. Government securities.
4. Related party, Other Service Provider Transactions and Directors
i) JF International Management Inc. (the Investment ‘Advisor’), an indirect wholly-owned subsidiary of JPMorgan Chase & Co. (‘JPMorgan’) provides investment advisory services to the Fund under the terms of an investment advisory agreement. The Advisor is paid a fee, computed weekly and payable monthly, at the annual rate of 1.00% of the Fund’s weekly managed gross assets. Investments in funds on which the Advisor or its affiliates charge a management fee are excluded from the calculation. Additionally, the Advisor has voluntarily agreed to waive its Investment Advisory fee on any cash held when borrowings are drawn under a borrowing facility. For the year ended December 31, 2015, the Advisor waived Investment Advisory fees of $55,646, related to such holdings of cash.
ii) On June 1, 2015, the Fund entered into an agreement with Pristine Advisers (“Pristine”), an entity unaffiliated with the Fund. Under this agreement, Pristine provides certain investor relations and public relations services for the Fund, which is in effect for one year and automatically renews for an additional one-year term until either the Fund or Pristine advises the other of its intent to cancel. In consideration of these services, Pristine receives a monthly retainer fee equal to $2,000 per month, which was paid by the Fund for the entire one-year period on June 1, 2015, plus certain customary out-of-pocket expenses billed periodically.
The Advisor has agreed to voluntarily reimburse the Fund for one half of the Pristine monthly retainer fees through a waiver of the Investment Advisory fees owed by the Fund to the Advisor, during the initial one-year period of the Pristine agreement. For the year ended December 31, 2015, the Advisor waived Investment Advisory fees of $7,000.
iii) During the year ended December 31, 2015, the Fund did not pay any brokerage commissions to JPMorgan companies or affiliated brokers/dealers.
iv) Other Service Providers — Pursuant to an Administration Agreement, JPMorgan Chase Bank, N.A. (‘JPMCB’), an indirect, wholly-owned subsidiary of JPMorgan (the ‘Administrator’), provides certain services to the Fund. The Fund pays a flat annual fee of $87,500 per the Administration Agreement. Such amounts are included in Administration fees on the Statement of Operations.
JPMCB also provides portfolio custody and accounting services for the Fund. In consideration of the accounting services, JPMCB receives a fee accrued daily and paid monthly at the annual rate of 0.0025% of the first $75.0 billion of the average daily net assets of all funds in the JPMorgan Mutual Fund Complex (non-Money Market Funds), 0.002% of the average daily assets of all such funds between $75.0 billion and $150.0 billion and 0.0015% of the average daily net assets of all such funds in excess of $150.0 billion, subject to a minimum annual fee of $20,000 per fund. The Fund bears its pro rata portion of the total accounting services fee and also pays certain transaction-based charges. The custodian fees are split between safekeeping and transaction charges and vary by market. The amounts paid directly to JPMCB by the Fund for custody and accounting services are included in Custodian and accounting fees on the Statement of Operations.
v) Directors — The Fund pays each of its Directors who is not a director, officer or employee of the Advisor, Administrator or any affiliate thereof, an annual fee of $24,100, the Audit Committee Chairman $28,500 and the Chairman $35,000 plus a $3,300 attendance fee for each Board meeting, Management Engagement Committee meeting and Audit Committee meeting
| | | | | | |
| | | |
| 26 | | | | JPMORGAN CHINA REGION FUND, INC. | | DECEMBER 31, 2015 |
NOTES TO FINANCIAL STATEMENTS
AT DECEMBER 31, 2015 (continued)
attended. A per diem allowance of $2,000 per day, or $1,000 per half day, is paid to Directors in respect of time spent by Directors on Fund business outside normal Board and Committee meetings. The per diem allowance is subject to Board approval in advance. In addition, the Fund reimburses all Directors for travel and out-of-pocket expenses incurred in connection with Board of Directors meetings. Under normal circumstances, in order to minimize expenses, the Board expects to hold two meetings a year by telephone.
vi) As of December 31, 2015, the Fund had two shareholders, each holding more than 5% of the Fund’s outstanding shares, who held in aggregate approximately 62.7% of the Fund’s outstanding shares.
5. Capital Share Transactions
The Fund offers an optional Distribution Reinvestment and Cash Purchase Plan (the “Plan”) to its shareholders. Pursuant to the Plan, when the Fund declares income or capital gains distributions, the Fund will either issue new shares, or buy existing shares, to reinvest such distributions for shareholders that elect to participate in the Plan. During the years ended December 31, 2015 and 2014, the Fund did not issue shares under the Plan.
On September 14, 2015, the Board of Directors renewed an authority for the Fund to repurchase up to 644,764 shares (10% of its then issued and outstanding shares) of its common stock in the open market through September 12, 2016. Repurchases can be made only when the Fund’s shares are trading at less than NAV and at such times and amounts as it is believed to be in the best interest of the Fund’s stockholders. When shares trade at a discount to NAV, any purchase of shares by the Fund has the effect of increasing the NAV of the Fund’s remaining shares outstanding. All shares purchased by the Fund are thereafter considered authorized and unissued.
During the years ended December 31, 2015 and 2014, the Fund did not repurchase any shares under the share repurchase program.
6. Borrowings
On February 25, 2015, the Fund renewed its financing arrangement with Scotiabank (Ireland) Ltd (the ‘Lender’) which was originally entered into on February 27, 2012 and renewed and amended on February 25, 2013. Under this arrangement, the Lender provides a secured, committed credit facility in the aggregate amount of $17.5 million to the Fund. No compensating balances are required. The Fund has paid an upfront loan arrangement fee of $8,750 and has a flat commitment fee of 0.25% on the aggregate amount, as required under this agreement. Interest on borrowings, if any, will be payable at 0.85% plus the London Interbank Offered Rate (‘LIBOR’). Prior to February 25, 2015, under the previous agreement with the Lender, interest on unutilized amounts was payable at 0.25% if the unutilized amounts were equal to or less than 50% of the committed amount and 0.35% if the unutilized amounts were greater than 50% of the committed amount. On July 10, 2015, the Fund increased its financing arrangement with the Lender to an amount of $22 million which, subject to the Lender’s approval, allows future increases up to $32 million. The agreement is in place until February 24, 2017. The Fund has paid an upfront loan arrangement fee of $2,250. The credit agreement governing the credit facility includes usual and customary covenants for this type of transaction. At December 31, 2015, the interest rate on outstanding borrowings was 1.21%.
Borrowings outstanding from the secured, committed credit facility and average borrowings from the credit facility for the year ended December 31, 2015, were as follows:
| | | | | | | | | | | | | | | | | | | | |
Outstanding
Borrowings at
December 31,
2015 | | Weighted
Average
Borrowings
For Days Drawn Upon | | | Average
Interest
Rate on
Borrowings | | | Number of
Days
Outstanding | | | Interest
Expense on
Borrowings | | | Interest
Expense on
Unutilized Amounts | |
$15,000,000 | | $ | 15,357,143 | | | | 1.13 | % | | | 365 | | | $ | 173,474 | | | $ | 7,493 | |
| | | | | | | | |
| | | |
| DECEMBER 31, 2015 | | JPMORGAN CHINA REGION FUND, INC. | | | | | 27 | |
NOTES TO FINANCIAL STATEMENTS
AT DECEMBER 31, 2015 (continued)
The maximum borrowings during the year ended December 31, 2015 were as follows; $15,000,000, from January 1, 2015 to May 20, 2015, $17,500,000, from May 21, 2015 to July 22, 2015 and $15,000,000 from July 23, 2015 to December 31, 2015. Interest expense to non-affiliates on the Statement of Operations includes interest expense on borrowings and unutilized amounts during the year ended December 31, 2015.
7. Risks and Uncertainties
i) China Region — Investing in securities of ‘China Region companies’ may include certain risks and considerations not typically associated with investing in U.S. securities. In general, China Region companies are companies organized in the People’s Republic of China, the Hong Kong Special Administrative Region, the Macau Special Administrative Region or Taiwan (the ‘China Region’) or for which the principal securities trading market is in the China Region; or companies, regardless of where organized, which have 50% or more of their assets in, or derive 50% or more of their revenues or profits from, the China Region. Such risks include fluctuating currency values and changing local and regional economic, political and social conditions, which may result in greater market volatility. In addition, these securities may not be as liquid as U.S. securities. At December 31, 2015, the Fund had 63.1%, 31.5% and 15.4%, based on net assets, of its total investments invested in China, Hong Kong and Taiwan, respectively.
ii) Foreign Transactions — Foreign security and currency transactions may involve certain considerations and risks not typically associated with those of U.S. dollar denominated transactions as a result of, among other factors, the level of governmental supervision and regulation of foreign securities markets and the possibility of political or economic instability.
iii) Direct Investments in China A-share securities — The China Securities Regulatory Commission (‘CSRC’) may grant qualified foreign institutional investor (‘QFII’) licenses, which allow foreign investments in A-shares on the Shanghai and Shenzhen Stock Exchanges and certain other securities historically not eligible for investment by non-Chinese investors. Each QFII is authorized to invest in China A-shares only up to a specified quota established by the Chinese State Administration of Foreign Exchange (‘SAFE’). JF Asset Management Limited has a QFII license permitting it to invest a specific portion of the assets of certain funds (which may include the Fund) in local Chinese securities. Although the laws of China permit the use of nominee accounts for clients of QFIIs, the Chinese regulators require the general securities trading and settlement accounts to be maintained in the name of the QFII. As the Fund is permitted to invest in China A-shares, the Fund’s local custodian bank maintains a specific sub-account for the A-share investments in the name of the Fund. This amount is included in Deposits at broker on the Statement of Assets and Liabilities. However, there is a risk that creditors of the QFII and its affiliates (each, a ‘JP Morgan Affiliate’) may assert that a JP Morgan Affiliate, and not the Fund, has recourse against the securities and other assets in the account and/or sub-accounts. If a court upholds such an assertion, creditors of a JP Morgan Affiliate could seek payment from the Fund’s A-share investments.
Additional risks for the Fund’s A-share investments include a potential lack of liquidity, greater price volatility, and restrictions on the repatriation of invested capital. Because of low trading volume and various restrictions on the free flow of capital into the A-share market, the China A-share market could be less liquid and trading prices of A-shares could be more volatile than other local securities markets. In addition, net realized profits on fund investments in A-shares may only be repatriated under certain conditions and upon the approval of SAFE. Rules regarding taxation of investments in mainland China may be subject to change and such changes in the taxation of A-shares could materially affect the Fund’s performance.
iv) Other — In the normal course of business, the Fund may enter into contracts that provide general indemnifications. The maximum exposure under these arrangements is dependent on future claims that may be made against the Fund and, therefore, cannot be estimated; however, based on experience, the risk of any loss from such claims is considered remote.
| | | | | | |
| | | |
| 28 | | | | JPMORGAN CHINA REGION FUND, INC. | | DECEMBER 31, 2015 |
NOTES TO FINANCIAL STATEMENTS
AT DECEMBER 31, 2015 (continued)
8. Tax Status
U.S. Federal Income Taxes — No provision for federal income taxes is required since the Fund intends to continue to qualify as a regulated investment company under subchapter M of the Internal Revenue Code and distribute substantially all of its taxable income. Management has reviewed the Fund’s tax positions for all open tax years and has determined that as of December 31, 2015, no liability for income tax is required in the Fund’s financial statements for net unrecognized tax benefits. However, management’s conclusions may be subject to future review based on changes in, or the interpretation of, the accounting standards or tax laws and regulations. The Fund’s Federal tax returns for the prior three fiscal years remain subject to examination by the Internal Revenue Service.
The tax character of distributions paid for the year ended December 31, 2015 was as follows:
| | | | | | | | | | | | |
| | | Ordinary
Income | | | Net
Long-Term
Capital Gains | | | Total
Distributions
Paid | |
| | $ | 3,879,628 | | | $ | 2,396,631 | | | $ | 6,276,259 | |
The tax character of distributions paid for the year ended December 31, 2014 was $818,850 from ordinary income.
At December 31, 2015, the components of net assets (excluding paid-in capital) on a tax basis were as follows:
| | | | |
Tax Basis Long-Term Capital Gain | | $ | 2,221,758 | |
Tax Unrealized Appreciation on Investments and Foreign Currencies | | $ | 13,170,632 | |
| | | | |
Net Assets (Excluding Paid-In-Capital) | | $ | 15,392,390 | |
| | | | |
The cumulative timing differences primarily consist of China capital gains tax, post-October capital loss deferrals and wash sale loss deferrals.
During the year ended December 31, 2015, the Fund reclassified $27,808 from accumulated undistributed (distributions in excess of) net investment income to accumulated realized gains (losses) on investments, as a result of permanent book and tax differences primarily relating to foreign currency, China capital gains tax and PFICs gains and losses. Net assets were not affected by the reclassifications.
Under the Regulated Investment Company Modernization Act of 2010 (the ‘Act’), net capital losses recognized by the Fund after December 31, 2010, are carried forward indefinitely, and retain their character as short-term and/or long-term losses. Prior to the Act, pre-enactment net capital losses incurred by the Fund were carried forward for eight years and treated as short-term losses. The Act requires that post-enactment net capital losses be used before pre-enactment net capital losses.
During the year ended December 31, 2015, the Fund utilized pre-enactment capital loss carryforwards of $2,552,688. At December 31, 2015, the Fund had no capital loss carryforwards.
Specified ordinary losses and net capital losses and other late year losses incurred after October 31, and within the taxable year are deemed to arise on the first business day of the Fund’s next taxable year. For the year ended December 31, 2015, the Fund deferred to January 1, 2016, specified ordinary loss of $7,907 and net short-term capital loss of $1,204,061.
| | | | | | | | |
| | | |
| DECEMBER 31, 2015 | | JPMORGAN CHINA REGION FUND, INC. | | | | | 29 | |
REPORT OF INDEPENDENT REGISTERED PUBLIC ACCOUNTING FIRM
To the Board of Directors and Shareholders of
JPMorgan China Region Fund, Inc.:
In our opinion, the accompanying statement of assets and liabilities, including the investment portfolio, and the related statements of operations, of changes in net assets and of cash flows and the financial highlights present fairly, in all material respects, the financial position of JPMorgan China Region Fund, Inc. (the “Fund”) at December 31, 2015, the results of its operations and its cash flows for the year then ended, the changes in its net assets for each of the two years in the period then ended and the financial highlights for each of the five years in the period then ended, in conformity with accounting principles generally accepted in the United States of America. These financial statements and financial highlights (hereafter referred to as “financial statements”) are the responsibility of the Fund’s management. Our responsibility is to express an opinion on these financial statements based on our audits. We conducted our audits of these financial statements in accordance with the standards of the Public Company Accounting Oversight Board (United States). Those standards require that we plan and perform the audit to obtain reasonable assurance about whether the financial statements are free of material misstatement. An audit includes examining, on a test basis, evidence supporting the amounts and disclosures in the financial statements, assessing the accounting principles used and significant estimates made by management, and evaluating the overall financial statement presentation. We believe that our audits, which included confirmation of securities at December 31, 2015 by correspondence with the custodian and brokers, provide a reasonable basis for our opinion.
PricewaterhouseCoopers LLP
New York, New York
February 29, 2016
| | | | | | |
| | | |
| 30 | | | | JPMORGAN CHINA REGION FUND, INC. | | DECEMBER 31, 2015 |
RESULTS OF THE ANNUAL STOCKHOLDERS‘ MEETING (Unaudited)
The Fund held its annual stockholders’ meeting on May 14, 2015. At this meeting, stockholders re-elected The Rt. Hon. The Earl of Cromer and Mr. Simon J. Crinage to the Fund’s Board of Directors, the results of which are set out below.
I) Election of Director
| | | | | | | | | | | | | | | | | | | | |
| Nominee | | Votes For | | | Votes Against | | | Votes Withheld | | | Shares Not
Voted | | | Total Voting Shares | |
The Rt. Hon. The Earl of Cromer | | | 5,177,498 | | | | 207,352 | | | | — | | | | 1,062,787 | | | | 6,447,637 | |
Mr. Simon J. Crinage | | | 5,171,924 | | | | 212,927 | | | | — | | | | 1,062,786 | | | | 6,447,637 | |
OTHER INFORMATION
Fundamental Investment Restriction on Borrowing
On May 12, 2011, shareholders of the Fund approved a change to the Fund’s fundamental investment restrictions to permit, inter alia, the Fund to borrow up to 20% of its net assets for investment purposes.
This gives the Investment Advisor flexibility to take advantage of additional investment opportunities when it believes that the return from the additional investment would exceed the cost of borrowing. If the Fund borrows money, it may be exposed to additional risks. If the return on securities purchased with borrowed funds is less than the borrowing costs of those funds, then the use of borrowing will detract from Fund performance. In particular, borrowing will magnify losses in times of negative performance. Nonetheless, the Investment Advisor may maintain leverage if it expects that the long-term benefits to investors of maintaining leverage outweigh any current reduced return. Borrowing may also increase the Fund’s interest and other expenses. Finally, the use of borrowing would subject the Fund to additional restrictions imposed by lenders and the Investment Company Act of 1940 on the Fund’s investments.
The Investment Advisor will utilize borrowed monies at its discretion and under the supervision of the Board. The Investment Advisor has agreed to waive any entitlement to a management fee on any cash held when borrowings are drawn under a borrowing facility.
The entire text of the Fund’s fundamental investment restriction on borrowing is as follows:
“Under its fundamental investment restrictions, the Fund may not: Issue senior securities, borrow or pledge its assets, except that the Fund may (i) borrow from a bank for the purpose of obtaining amounts necessary to make distributions for qualification as a registered investment company to avoid imposition of an excise tax under United States tax law; and (ii) borrow money (including through reverse repurchase agreements) up to the maximum amount permitted under the Investment Company Act of 1940 (a) for temporary or emergency purposes, (b) for such short-term credits as may be necessary for the clearance or settlement of transactions, (c) for repurchases of its Common Stock and (d) for investment purposes, provided that amounts borrowed under this clause shall not exceed 20% on the net assets of the Fund. The Fund may also pledge its assets to secure such borrowings. Notwithstanding the above, initial and variation margin in respect of futures contracts and options thereon and any collateral arrangement in respect of options on securities or indexes will not be prohibited by this paragraph 3 or any other investment restrictions.”
Information About Portfolio Holdings
The Fund files its complete schedule of portfolio holdings with the U.S. Securities and Exchange Commission (the ‘Commission’) for the first and third quarters of each fiscal year on Form N-Q. The Fund’s Forms N-Q are available on the Commission’s website at http://www.sec.gov and may be reviewed and copied at the Commission’s Public Reference Room in Washington, DC. Information on the operation of the Public Reference Room may be obtained by calling 1-800-SEC-0330. The Fund’s Forms N-Q are also available on the Fund’s website at www.jpmchinaregionfund.com.
| | | | | | | | |
| | | |
| DECEMBER 31, 2015 | | JPMORGAN CHINA REGION FUND, INC. | | | | | 31 | |
OTHER INFORMATION (Unaudited)
(continued)
Tax Letter (Unaudited)
We are providing this information as required by the Internal Revenue Code. The amounts shown may differ from those elsewhere in this report because of differences between tax and financial reporting requirements. For the fiscal year ended December 31, 2015, certain dividends paid by the Fund may be subject to a maximum tax rate of 15%. The Fund distributed $2,396,631, or maximum allowable amount, of long-term capital gain dividends for the fiscal year ended December 31, 2015. For the fiscal year ended December 31, 2015, the Fund intends to elect to pass through to shareholders the income tax credit for taxes paid to foreign countries. Gross foreign source income and foreign tax expenses are $3,575,308 and $318,859, respectively.
Proxy Voting Policies and Procedures and Proxy Voting Record
A description of the policies and procedures that are used by the Fund’s investment advisor to vote proxies relating to the Fund’s portfolio securities is available (1) without
charge, upon request, by calling +44 20 7742 3735; and (2) as an exhibit to the Fund’s annual report on Form N-CSR which is available on the website of the Securities and Exchange Commission (the ‘Commission’) at http://www.sec.gov. Information regarding how the investment advisor votes these proxies is now available by calling the same number and on the Commission’s website. The Fund has filed its report on Form N-PX covering the Fund’s proxy voting record for the 12 month period ended June 30, 2015.
Certifications
Simon J. Crinage, as the Fund’s President, has certified to the New York Stock Exchange that, as of June 15, 2015, he was not aware of any violation by the Fund of applicable NYSE corporate governance listing standards. The Fund’s reports to the Commission on Forms N-CSR and N-CSRS contain certifications by the Fund’s principal executive officer and principal financial officer that relate to the Fund’s disclosure in such reports and that are required by Rule 30a-2(a) under the 1940 Act.
| | | | | | |
| | | |
| 32 | | | | JPMORGAN CHINA REGION FUND, INC. | | DECEMBER 31, 2015 |
APPROVAL OF INVESTMENT ADVISORY CONTRACT (Unaudited)
On November 9, 2015, the Fund’s Board considered and approved the renewal of the Investment Advisory Agreement (the ‘Agreement’) between the Fund and JFIMI for an additional term of twelve (12) months. At this meeting, the directors reviewed extensive materials prepared by JFIMI and discussed these materials with representatives of JFIMI. The directors considered the recommendation of the Management Engagement Committee (the ‘Committee’) that the Agreement be renewed, noting that the Committee had discussed, in an executive session with independent counsel, the nature, extent and quality of the advisory services provided to the Fund by JFIMI, the level of advisory fees, the costs of the services provided and the profits realized by JFIMI, the Fund’s expense ratio, its relative and absolute performance, any economies of scale with respect to the management of the Fund, any ancillary benefits received by JFIMI and its affiliates as a result of their relationship with the Fund, and various other matters included in the materials provided by JFIMI.
In approving the renewal of the Agreement, the Committee, and the Board, concluded that:
| • | | The annual investment advisory fee rate paid by the Fund to JFIMI for investment advisory services was reasonable relative to the Fund’s peer group and relative to other China Region funds managed by JFIMI. |
| • | | The Committee and the Board were generally satisfied with the nature, quality and extent of other services provided by JFIMI. In reaching this conclusion, the Committee and the Board reviewed, among other things, JFIMI’s investment experience in the China region markets and the background and experience of JFIMI’s senior management. They further evaluated the structure and size of JFIMI’s management team serving the Fund and noted the team’s responsiveness to the Board. |
| • | | The Fund’s performance in the one (1) and three (3) year periods had outperformed its benchmark, the 80% MSCI Golden Dragon Index (net) and 20% CSI 300 Index (net). (The Board and the Committee reviewed the Fund’s performance in comparison to the peer group and the benchmark for the 1 year, 3 year, 5 year and since inception periods.) Although five (5) year performance lagged, it was noted that for certain longer-term periods, the Fund’s performance surpassed the benchmark. |
| • | | In light of the costs of providing advisory services to the Fund, the profits and ancillary benefits that JFIMI received, with respect to providing investment advisory services to the Fund, were reasonable. The Board and the Committee noted that beginning in May 2005, the Fund discontinued using JFIMI’s affiliates to effect Fund securities trades, unless in exceptional circumstances, effectively eliminating brokerage commissions as an ancillary benefit for JFIMI. |
| • | | The Fund’s expense ratio remained at an acceptable level. |
| | | | | | | | |
| | | |
| DECEMBER 31, 2015 | | JPMORGAN CHINA REGION FUND, INC. | | | | | 33 | |
FUND MANAGEMENT (Unaudited)
Information pertaining to the Directors and officers of the Fund is set forth below.
| | | | | | | | |
Name, (YOB), Address and
Position(s) with Fund | | Term of
Office and
Length of
Time Served | | Principal Occupation(s) During
Past 5 Years | | Number of
Portfolios in
Fund Complex
Overseen by
Director* | | Other Trusteeships/
Directorships Held by Director |
Independent Directors | | | | |
| | | | |
The Rt. Hon. The Earl of Cromer (1946) 60 Victoria Embankment London EC4Y 0JP United Kingdom | | Three year term ends in 2018; Chairman and Director since 1994. | | Chairman of the Board of the Fund; Chairman of the Board, Western Provident Association (insurance), LG India Plus Fund Ltd (financial), Pedder Street Asia Absolute Return Fund Limited (financial); LG Asia Plus Fund Limited (financial); Director, Cheetah Korea Value Fund Ltd (financial) and Chief Executive Officer, Cromer Associates Limited (family business). | | 1 | | See Principal Occupation. |
| | | | |
Alexander R. Hamilton (1941) P.O. Box 12343 General Post Office Hong Kong Class II Director | | Three year term ends in 2016; Director since 1994. | | Director of Cosco International Holdings Limited (shipping), Esprit Holdings Limited (clothing retail), Shangri-La Asia Limited (hotels) and Octopus Cards Limited (financial services). Former Director of China Cosco Holdings Co. Limited (shipping) (retired May 2011), CITIC Limited (infrastructure) (retired June 2015), and DBS Bank (Hong Kong) Ltd (financial) (retired April 2015). | | 1 | | See Principal Occupation. |
| | | | |
Julian M. I. Reid (1944) 60 Victoria Embankment London EC4Y 0JP United Kingdom | | Three year term ends in 2017; Director since 1998. | | Chief Executive Officer of 3a Funds Group (financial); Director and Chairman of Morgan’s Walk Properties Limited (property); Director and Chairman of The Korea Fund, Inc. (financial); Director and Chairman of Prosperity Voskhod Fund (financial); Director and Chairman of ASA Limited (financial) and Director of J M Properties Limited (property). | | 1 | | See Principal Occupation. |
| | | | | | |
| | | |
| 34 | | | | JPMORGAN CHINA REGION FUND, INC. | | DECEMBER 31, 2015 |
FUND MANAGEMENT (Unaudited)
(continued)
| | | | | | | | |
Name, (YOB), Address and
Position(s) with Fund | | Term of
Office and
Length of
Time Served | | Principal Occupation(s) During
Past 5 Years | | Number of
Portfolios in
Fund Complex
Overseen by
Director* | | Other Trusteeships/
Directorships Held by Director |
Independent Directors (continued) | | | | |
| | | | |
John R. Rettberg (1937) 1 Beacon St. Boston, MA 02108
USA
Class II Director | | Three year term ends in 2016; Director since 2008 | | Former Trustee, JPMorgan Alternative Products mutual fund Board (1997-2009). | | 1 | | None. |
Interested Director & President of the Fund | | | | |
| | | | |
Simon J. Crinage (1965) 60 Victoria Embankment London, EC4Y 0JP United Kingdom Class I Director and President | | Three year term ends in 2018; Director since 2009 & President since 2003** | | Managing Director, J.P. Morgan. | | 1 | | Director of The Association of Investment Companies Limited and JF International Management Inc. |
| * | | The Fund is the only fund in the Fund Complex. |
| ** | | The officers of the Fund serve at the discretion of the Board of Directors. |
| | | | | | | | |
| | | |
| DECEMBER 31, 2015 | | JPMORGAN CHINA REGION FUND, INC. | | | | | 35 | |
FUND MANAGEMENT (Unaudited)
(continued)
Information pertaining to the officers of the Fund is set forth below.
| | | | |
Name, (YOB), Address and
Position(s) with Fund | | Term of Office and
Length of Time Served | | Principal Occupation(s) During Past 5 Years |
Officers who are not Directors |
| | |
Neil S. Martin
(1971)
60 Victoria Embankment
London EC4Y 0JP
United Kingdom | | Since 2014** | | Chief Operating Officer and Treasurer of the Fund; Executive Director, J.P. Morgan. |
| | |
Lucy J. Dina
(1977)
60 Victoria Embankment
London EC4Y 0JP
United Kingdom
Secretary | | Since 2013** | | Secretary of the Fund; Vice President, J.P. Morgan. |
| | |
Steve M. Ungerman
(1953)
270 Park Avenue
New York
Chief Compliance Officer | | Since 2014** | | Chief Compliance Officer of the Fund;
Managing Director, J.P. Morgan Chase Bank NA. |
| ** | | The officers of the Fund serve at the discretion of the Board of Directors. |
| | | | | | |
| | | |
| 36 | | | | JPMORGAN CHINA REGION FUND, INC. | | DECEMBER 31, 2015 |
DIVIDEND REINVESTMENT AND CASH PURCHASE PLAN
(Unaudited)
The Fund operates an optional Dividend Reinvestment and Cash Purchase Plan (the ‘Plan’) whereby:
| | a) | shareholders may elect to receive dividend and capital gain distributions in the form of additional shares of the Fund (the Share Distribution Plan). |
| | b) | shareholders may make optional payments (any amount between $100 and $3,000) which will be used to purchase additional shares in the open market (the Share Purchase Plan). |
For a copy of the Plan brochure, as well as a dividend reinvestment authorization card, please contact the Plan Agent:
Computershare Trust Company, N.A.
P. O. Box 30170
College Station, TX 77842-3170
USA Telephone No.: 800-426-5523 (toll-free)
www.computershare.com
The following should be noted with respect to the Plan:
If you participate in the Share Distribution Plan, whenever the Board of Directors of the Fund declares an income dividend or net capital gain distribution, you will automatically receive your distribution in newly issued shares (cash will be paid in lieu of fractional shares) if the market price of the shares on the date of the distribution is at or above the net asset value of the shares. The number of shares to be issued to you by the Fund will be determined by dividing the amount of the cash distribution to which you are entitled (net of any applicable withholding taxes) by the greater of the net asset value (‘NAV’) per share on such date or 95% of the market price of a share on such date. If the market price of the shares on such a distribution date is below the NAV, the Plan Agent will, as agent for the participants, buy shares on the open market, on the New York Stock Exchange or elsewhere, for
the participant’s account on, or after, the payment date. There is no service charge for purchases under this Plan.
For U.S. federal income tax purposes, shareholders receiving newly issued shares pursuant to the Share Distribution Plan will be treated as receiving income or capital gains in an amount equal to the fair market value (determined as of the distribution date) of the shares received and will have a cost basis equal to such fair market value. Shareholders receiving a distribution in the form of shares purchased in the open market pursuant to the Plan will be treated as receiving a distribution of the cash distribution that such shareholder would have received had the shareholder not elected to have such distribution reinvested and will have a cost basis in such shares equal to the amount of the distribution.
There will be no brokerage charge to participants for shares issued directly by the Fund under the Plan. Each participant will pay a pro rata share of brokerage commissions incurred with respect to the Plan Agent’s open market purchases of shares in connection with the Plan. The Fund will pay the fees of the Plan Agent for handling the Plan.
You may terminate your account under the Share Distribution Plan by notifying the Plan Agent in writing. The Plan may be terminated by the Plan Agent or the Fund with notice to you at least 30 days prior to any record date for the payment of any distribution by the Fund. Upon any termination, the Plan Agent will deliver a certificate or certificates for the full shares held for you under the Plan and a cash adjustment for any fractional shares.
You also have the option of instructing the Plan Agent to make semi-annual cash purchases of shares in the open market. There is a service charge of $1.25 for each purchase under this Share Purchase Plan.
| | | | | | | | |
| | | |
| DECEMBER 31, 2015 | | JPMORGAN CHINA REGION FUND, INC. | | | | | 37 | |
DIRECTORS AND ADMINISTRATION
(Unaudited)
| | |
| Officers and Directors | | The Rt. Hon. The Earl of Cromer — Director and Chairman of the Board and Management Engagement Committee Simon J. Crinage — Director and President Alexander R. Hamilton — Director and Chairman of the Audit Committee and Pricing Committee Julian M. I. Reid — Director John R. Rettberg — Director Neil S. Martin — Chief Operating Officer and Treasurer Lucy J. Dina — Secretary Steve M. Ungerman — Chief Compliance Officer |
| |
| Investment Advisor | | JF International Management Inc. P.O. Box 3151 Road Town, Tortola British Virgin Islands |
| |
| Administrator | | JPMorgan Chase Bank, N.A. 1 Beacon Street, 18th Floor Boston, Massachusetts 02108 U.S.A. |
| |
| Custodian | | JPMorgan Chase Bank N.A. 1 Beacon Street, 18th Floor Boston, Massachusetts 02108 U.S.A. |
| |
Independent Registered Public Accounting Firm | | PricewaterhouseCoopers LLP 300 Madison Avenue New York, New York 10017 U.S.A. |
| |
| Legal Counsel | | Dechert LLP New York: 1095 Avenue of the Americas New York, New York 10036 U.S.A. |
| |
| | Hong Kong: 27/F Henley Building 5 Queens Road Central Hong Kong |
| |
| Registrar, Transfer Agent, and Dividend Paying Agent | | Computershare Trust Company, N.A. P. O. Box 30170 College Station, TX 77842-3170 U.S.A. |
Notice is hereby given in accordance with Section 23(c) of the Investment Company Act of 1940, as amended, that from time to time the Fund may purchase shares of its common stock in the open market.
www.jpmchinaregionfund.com
| | | | | | |
| | | |
| 38 | | | | JPMORGAN CHINA REGION FUND, INC. | | DECEMBER 31, 2015 |

This report, including the financial statements herein, is sent to the stockholders of the Fund for their information. It is not a prospectus, circular or representation intended for use in the purchase or sale of shares of the Fund or of any securities mentioned in this report.
© JPMorgan Chase & Co., 2016 All rights reserved. December 31.
ITEM 2. CODE OF ETHICS.
| (a) | The JPMorgan China Region Fund, Inc. (the “Fund”) has adopted a Code of Ethics that applies to the Fund’s principal executive officer and principal financial officer. |
| (c) | There have been no amendments to the Fund’s Code of Ethics during the reporting period for this Form N-CSR. |
| (d) | There have been no waivers granted by the Fund to individuals covered by the Fund’s Code of Ethics during the reporting period for this Form N-CSR. |
| (f) | A copy of the Fund’s Code of Ethics is attached as exhibit 12(a)(1) to this Form N-CSR. |
ITEM 3. AUDIT COMMITTEE FINANCIAL EXPERT.
(a) (1) The Board of Directors of the Fund has determined that the Fund has one member serving on the Fund’s Audit Committee that possesses the attributes identified in Instruction 2(b) of Item 3 to Form N-CSR to qualify as “audit committee financial expert.”
(2) The name of the audit committee financial expert is John R. Rettberg. Mr. Rettberg has been deemed to be “independent” as that term is defined in Item 3(a)(2) of Form N-CSR.
ITEM 4. PRINCIPAL ACCOUNTANT FEES AND SERVICES.
a) Audit Fees
For the fiscal years ended December 31, 2015 and 2014, PricewaterhouseCoopers, LLP (“PwC”), the Fund’s independent registered public accounting firm, billed the Fund aggregate fees of US$55,000 and $55,000, respectively, for professional services rendered for the audit of the Fund’s annual financial statements.
(b) Audit-Related Fees
For the fiscal years ended December 31, 2015 and 2014, PwC billed the Fund aggregate fees of US$11,000 and $10,500, respectively, for security count procedures performed as required under Rule 17f-2 of the Investment Company Act of 1940.
(c) Tax Fees
For the fiscal years ended December 31, 2015 and 2014, PwC billed the Fund aggregate fees of US$8,975 and $8,975, respectively, for professional services rendered for tax compliance, tax advice, and tax planning. The nature of the services comprising the Tax Fees was the review of the Fund’s income tax returns and tax distribution requirements.
(d) All Other Fees
For the fiscal year ended December 31, 2015, PwC did not bill the Fund any other fees. For the fiscal year ended December 31, 2014, PwC did not bill the Fund any other fees.
(e) The Fund’s Audit Committee Charter requires the Audit Committee pre-approve all audit and non-audit services to be provided by the independent registered public accounting firm to the Fund, and all non-audit services to be provided by the auditors to the Fund’s Investment Advisor and any service providers controlling, controlled by or under common control with the Fund’s Investment Advisor that provide on-going services to the Fund, if the engagement relates directly to the operations and financial reporting of the Fund. All of the audit, audit-related and tax services described above for which PwC billed the Fund for the fiscal years ended December 31, 2015 and December 31, 2014 were pre-approved by the Audit Committee.
For the fiscal years ended December 31, 2015 and December 31, 2014, the Fund’s Audit Committee did not waive the pre-approval requirement of any non-audit services to be provided to the Fund by PwC.
(f) Not applicable to the Fund.
(g) For the fiscal years ended December 31, 2015 and 2014, the aggregate non-audit fees for services rendered by PwC to the Fund, the Fund’s investment advisor and any entity controlling, controlled by, or under common control with the investment advisor that provided ongoing services to the Fund were $7.1 million and $6.9 million, respectively.
(h) The Fund’s Audit Committee has considered whether the provision of non-audit services that were rendered to Fund’s investment advisor and any entity controlling, controlled by, or under common control with the investment advisor that provides ongoing services to the Fund that were not pre-approved pursuant to paragraph (c)(7)(ii) of Rule 2-01 of Regulation S-X is compatible with maintaining the principal accountant’s independence.
ITEM 5. AUDIT COMMITTEE OF LISTED REGISTRANTS.
(a) The Fund has a separately-designated audit committee established in accordance with Section 3(a)(58)(A) of the Exchange Act. The members of the Fund’s audit committee are: The Rt. Hon. The Earl of Cromer, Alexander R. Hamilton, John R. Rettberg and Julian M. I. Reid.
ITEM 6. SCHEDULE OF INVESTMENTS
| (a) | Schedule of Investments is included as part of Item 1. |
| (b) | Not applicable to the Fund. |
ITEM 7. DISCLOSURE OF PROXY VOTING POLICIES AND PROCEDURES FOR CLOSED-END MANAGEMENT INVESTMENT COMPANIES.
Attached to this Form N-CSR as exhibit 12(a)(4) are copies of the proxy voting policies and procedures of the Fund and J.P. Morgan Asset Management (“JPMAM”) (formerly JF Asset Management), parent company of the Fund’s advisor, JF International Management Inc. (the “Advisor”).
J.P. MORGAN ASSET MANAGEMENT (Voting policy and corporate governance guidelines)
| | | | |
Table of contents | | | | |
I. Principles | | | 3 | |
II. Policy and Procedures | | | 4 | |
III. Voting Guidelines | | | 6 | |
Reports & Accounts | | | 6 | |
Dividends | | | 6 | |
Auditors | | | 6 | |
Boards | | | 6 | |
Directors | | | 7 | |
Non-Executive Directors | | | 8 | |
Issue of Capital | | | 8 | |
Mergers/Acquisitions | | | 9 | |
Voting Rights | | | 9 | |
Share Options/L-TIPs | | | 10 | |
Others | | | 10 | |
IV. Activism | | | 12 | |
V. Sustainability | | | 13 | |
I. PRINCIPLES
J.P. Morgan Asset Management (“JPMAM”) is committed to delivering superior investment performance to its clients worldwide. We believe that one of the drivers of investment performance is an assessment of the corporate governance principles and practices of the companies in which we invest our clients’ assets and we expect those companies to demonstrate high standards of governance in the management of their business.
We have set out below the principles which provide the framework for our corporate governance activity. Although the policies and guidelines set out in this document apply to Hong Kong and therefore principally concern accounts managed from the Hong Kong office, our colleagues in London, New York and Tokyo have similar standards, consistent with law and best practice in these different locations.
| | 1. | Fiduciary priority. Our clients appoint us to manage their assets in order to maximise the likelihood of meeting or exceeding their investment objectives at acceptable risk levels. Every decision to buy, hold or sell any security will be consistent with that overriding objective. |
| | 2. | Evaluation. Our clients expect us, as their delegates, to monitor the governance of companies in which we have invested their assets. |
| | 3. | Engagement. We encourage excellence in the management of companies through the considered application of our corporate governance policies and guidelines. We welcome consultation by companies with their leading shareholders on corporate governance issues. |
| | 4. | Proxy voting. Company management is accountable to the shareholders, our clients. It is our responsibility to ensure this is recognized through the considered use of our clients’ votes. |
| | 5. | Litigation and Joint Working Parties. JPMAM will align itself with other shareholders, for example, by joining class action suits or working parties as local practice dictates, where we are convinced that this is in the best interests of our clients. |
| | 6. | Disclosure. JPMAM’s corporate governance guidelines and policies are available to clients and companies alike. We believe that they conform to best practice and we are prepared to discuss them openly with other interested parties. |
| | 7. | Ongoing commitment. JPMAM is committed to reviewing its corporate governance principles, policies and guidelines to ensure that they fully reflect our interpretation of best market practice. |
II. POLICY and PROCEDURES
J.P. Morgan Asset Management (“JPMAM”) manages the voting rights of the shares entrusted to it as it would manage any other asset. It is the policy of JPMAM to vote in a prudent and diligent manner, based exclusively on our reasonable judgment of what will best serve the financial interests of the beneficial owners of the security.
1. Proxy Committee
The JPMAM Proxy Committee has been established to oversee the proxy voting process in the Asia ex Japan region on an ongoing basis. It is composed of the Proxy Administrator and senior officers from the Investment, Compliance and Risk Management Departments. The main functions of the Proxy Committee are to review the Proxy Voting Guidelines (“Guidelines”) to ensure they are aligned with best practice; to determine the independence of any third-party vendor which it has delegated proxy voting responsibilities and to conclude that there are no conflicts of interest that would prevent such vendor from providing such proxy voting services prior to delegating proxy responsibilities; and to provide advice and recommendations on general proxy voting matters as well as on specific voting issues as they occur. The Proxy Committee may delegate certain of its responsibilities to subgroups composed of Proxy Committee members. It meets quarterly or more frequently as circumstances dictate and its minutes are circulated to senior management including the Asia Risk Committee to whom it reports.
2. Voting
As these Guidelines represent what we consider to be in the best financial interests of our clients, we would normally expect clients to allow us to use them as a template for voting. However, we recognise that in certain circumstances further analysis may be required.
In view our overriding fiduciary duty to act in the best interest of our clients, the Guidelines are an indication only of JPMAM’s voting policy. The portfolio manager has discretion to override the policy should individual circumstances dictate.
Our Guidelines are primarily targeted at companies listed on main stock exchanges. It is sometimes difficult for smaller companies to apply the same corporate governance standards and we would look at any issues for such companies on a case-by-case basis. We would, however, encourage them to apply the highest possible standards of governance.
For markets in Asia ex Japan, we will generally abstain from voting at AGMs on the grounds that the matters normally considered at such meetings are of a routine and non-contentious nature. To ensure we fulfil our fiduciary obligation to always act in our clients best interests, we will review each AGM notice to check whether there are any non-routine matters such as company reorganisations/ restructurings, takeover/ merger and senior management compensation plans included therein. If any such matters are identified then we will consider each one individually so that our clients’ best interests are served. The major routine matters in AGM are as follows:
| | 1. | Accept Financial Statement and Statutory Reports |
| | 3. | Election and re-election of directors |
| | 4. | Fix remuneration of directors |
| | 5. | Appoint auditors and fix remunerations |
| | 6. | Approve issuance of Equity or Equity-Linked Securities without pre-emptive rights |
| | 7. | Approve repurchase of shares (up to 20% of issued capital) |
| | 8. | Authorise reissuance of repurchased shares |
Also, certain markets require that shares are blocked from trading in order to be tendered for voting purposes. In these instances, it may be in our clients’ best interests to abstain from voting in order to preserve the ability to trade. For these countries, a decision will be taken on a case-by-case basis by the research analyst in conjunction with the portfolio manager in order to determine how our clients’ best interests are served.
To assist JPMAM investment professionals with public companies’ proxy voting proposals, we have retained the services of an independent proxy voting service, Institutional Shareholder Services Inc. (ISS). ISS is assigned responsibility for various functions, which may include one or more of the following: coordinating with client custodians to ensure that all proxy materials are processed in a timely fashion; providing JPMAM with a comprehensive analysis of each proxy proposal and providing JPMAM with recommendations on how to vote each proxy proposal based on the Guidelines or, where no Guideline exists or where the Guidelines require a case-by-case analysis, on ISS’ analysis; and executing the voting of the proxies in accordance with Guidelines and its recommendation, except when a recommendation is overridden by JPMAM, as described below. The Proxy Voting Committee has adopted procedures to recall shares on loan if a proposed major corporate event contemplates a shareholder vote to approve or to take other action. (The Proxy Voting Committee may determine: (a) not to recall securities on loan if, in its judgment, the negative consequences to clients of recalling the loaned securities would outweigh the benefits of voting in the particular instance or (b) not to vote certain foreign securities positions if, in its judgment, the expense and administrative inconvenience or other burdens outweigh the benefits to clients of voting the securities.) Situations can sometimes arise where more than one JPMAM client invests in the same company or in which a single client may invest in the same company but in multiple accounts. In those situations, two or more clients, or one client with different accounts, may be invested in strategies having different investment objectives, investment styles, or portfolio managers. As a result, JPMAM may cast different votes on behalf of different clients or on behalf of the same client with different accounts.
In the event a JPMAM investment professional makes a recommendation in connection with an override, the investment professional must provide the appropriate Proxy Administrator with a written certification (“Certification”) which shall contain an analysis supporting his or her recommendation and a certification that he or she (A) received no communication in regard to the proxy that would violate either the JPMorgan Chase (“JPMC”) Safeguard Policy or written policy on information barriers, or received any communication in connection with the proxy solicitation or otherwise that would suggest the existence of an actual or potential conflict between JPMAM’s interests and that of its clients and (B) was not aware of any personal or other relationship that could present an actual or potential conflict of interest with the clients’ interests.
3. Engagement
We regard regular, systematic and direct contact with senior company management, both executive and non-executive, as crucially important. We consider that these dialogues have been useful and plan to expand this approach.
4. Conflicts of Interest
In order to maintain the integrity and independence of JPMAM’s proxy-voting decisions, JPMorgan Chase (including JPMAM) has established formal barriers designed to restrict the flow of information between JPMC’s securities, lending, investment banking and other divisions to JPMAM investment professionals. Where a potential material conflict of interest has been identified, the Proxy Administrator, in consultation with the Proxy Committee, evaluates the potential conflict and determines whether an actual conflict exists. In the event that this is the case, they make a recommendation on how to vote the proxy. A record of such decisions is available to clients on request. Finally, it should be pointed out that this document is intended as an overview only. Specific issues should always be directed to your account administrator or portfolio manager.
III. VOTING GUIDELINES
1. REPORTS & ACCOUNTS
1a. Annual Report
Reports and accounts should be both detailed and transparent, and should be submitted to shareholders for approval. They should meet accepted reporting standards, and company accounts should employ Generally Accepted Accounting Practices (GAAP). Reports should meet with the spirit as well as the letter of reporting standards, including the most recent recommendations of the International Accounting Standards Board (IASB).
The annual report should include a statement of compliance with relevant codes of best practice, in markets where they exist.
Legal disclosure varies from market to market. If, in our opinion, a company’s standards of disclosure (whilst meeting minimum legal requirements) are insufficient in any particular area, we will inform company management of our concerns. Depending on the circumstances, we will either abstain or vote against the resolution concerned. Similar consideration would relate to the use of inappropriate accounting methods.
2. DIVIDENDS
Proposals for the payment of dividends should be presented to shareholders for approval, and should be fully disclosed in advance of the meeting. We will vote against dividend proposals if we feel that payment of the proposed dividend would prejudice the solvency or future prospects of the company.
3. AUDITORS
3a. Auditor Independence
Auditors must provide an independent and objective check on the way in which the financial statements have been prepared and presented. JPMAM will vote against the appointment or re-appointment of auditors who are not perceived as being independent.
3b. Auditor Remuneration
Companies should be encouraged to distinguish clearly between audit and non-audit fees. Audit fees should never be excessive.
4. BOARDS
4a. Chairman & CEO
JPMAM believes that it is best practice for the roles of Chairman and Chief Executive Officer to be separate.
4b. Board Structure
JPMAM is in favour of unitary boards of the type found in Hong Kong, as opposed to tiered board structures.
4c. Board Size
Boards with more than 20 directors are considered to be excessively large.
4d. Board Independence
JPMAM believes that a strong independent element to a board is essential to the effective running of a company. The calibre and number of non-executive directors on a board should be such that their views will carry significant weight in the board’s decisions.
We believe that as a minimum, all boards should have at least three non-executive directors, unless the company is of such a size that sustaining such a number would be an excessive burden.
JPMAM will use its voting powers to encourage appropriate levels of board independence, taking into account local market practice.
4e. Board Committees
Where appropriate, boards should delegate key oversight functions to independent committees. The Chairman and members of any Committee should be clearly identified in the annual report.
5. DIRECTORS
5a. Executive Director’s Remuneration
Executive remuneration is and will remain a contentious issue, particularly the overall quantum of remuneration.
JPMAM will generally vote against shareholder proposals to restrict arbitrarily the compensation of executives or other employees.
5b. Director’s Liability
In certain markets, this proposal asks shareholders to give blanket discharge from responsibility for all decisions made during the previous financial year. Depending on the market, this resolution may or may not be legally binding, and may not release the board from its legal responsibility.
JPMAM will usually vote against discharging the board from responsibility in cases of pending litigation, or if there is evidence of wrongdoing for which the board must be held accountable.
5c. Directors over 70
JPMAM considers that a similar standard of care should be applied to the selection of a director over 70 as would be applied to that of any other director, although we would expect to see such a director offer him or herself for re-election each year.
5d. Directors’ Contract
Generally, we encourage contracts of one year or less and vote accordingly.
6. NON-EXECUTIVE DIRECTORS
6a. Role of Non-Executive Directors
As stated earlier in these guidelines, JPMAM believes that a strong independent element to a board is important to the effective running of a company.
In determining our vote, we will always consider independence issues on a case-by-case basis, taking into account any exceptional individual circumstances, together with local markets’ differing attitudes to director independence.
In order to help assess their contribution to the company, the time spent by each non-executive director should be disclosed to shareholders, as well as their attendance at board and committee meetings.
Audit and Remuneration Committees should be composed exclusively of independent directors.
6b. Director Independence
We consider that a director will generally be deemed to be independent if he or she has no significant financial, familial or other ties with the company which might pose a conflict, and has not been employed in an executive capacity by the company for at least the previous ten years.
6c. Multiple Directorships
In order to be able to devote sufficient time to his or her duties, we would not normally expect a non-executive to hold more than five significant directorships at any one time. For executives, only one additional non-executive post would normally be considered appropriate without further explanation.
6d. Non-Executive Director Remuneration
Non-executive directors should be paid but should not be awarded options.
6e. Bonuses for Retiring Directors and Internal Statutory Auditors
JPMAM will generally vote Against proposals for retirement bonuses which will be paid to retirees including one or more directors or statutory auditors designated by companies as an outsider.
7. ISSUE OF CAPITAL
7a. Issue of Equity
In most countries, company law requires that shareholder approval be obtained in order to increase the authorised share capital of the company. Proposals for equity issues will also specify whether pre-emptive rights are to be retained or suppressed or partially suppressed for the issue. As a general rule, JPMAM believes that any new issue of equity should first be offered to existing shareholders on a pre-emptive basis.
JPMAM will vote in favour of increases in capital which enhance a company’s long-term prospects.
7b. Issue of Debt
Reasons for increased bank borrowing powers are many and varied, including allowing normal growth of the company, the financing of acquisitions, and allowing increased financial leverage. Management may also attempt to borrow as part of a takeover defence.
JPMAM will vote in favour of proposals which will enhance a company’s long-term prospects. We will vote against an increase in bank borrowing powers which would result in the company reaching an unacceptable level of financial leverage, where such borrowing is expressly intended as part of a takeover defence, or where there is a material reduction in shareholder value.
7c. Share Repurchase Programmes
Boards may instigate share repurchase or stock buy-back programs for a number of reasons. JPMAM will vote in favour of such programmes where the repurchase would be in the best interests of shareholders, and where the company is not thought to be able to use the cash in a more useful way.
We will vote against such programmes when shareholders’ interests could be better served by deployment of the cash for alternative uses, or where the repurchase is a defensive manoeuvre or an attempt to entrench management.
8. MERGERS / ACQUISITIONS
Mergers and acquisitions are always reviewed on a case-by-case basis by the investment analyst in conjunction with portfolio managers and, in exceptional circumstances, the Proxy Committee. Individual circumstances will always apply. However, as a general rule, JPMAM will favour mergers and acquisitions where the proposed acquisition price represents fair value, where shareholders cannot realise greater value through other means, and where all shareholders receive fair and equal treatment under the merger/acquisition terms.
9. VOTING RIGHTS
JPMAM believes in the fundamental principle of “one share, one vote”. Accordingly, we will vote to phase out dual voting rights or classes of share with restricted voting rights, and will oppose attempts to introduce new ones. We are opposed to mechanisms that skew voting rights, such as cumulative voting; directors should represent all shareholders equally, and voting rights should accrue in accordance with the shareholder’s equity capital commitment to the company.
10. SHARE OPTIONS / LONG-TERM INCENTIVE PLANS (L-TIPs)
10a. Share Options
Best practice requires that share options be fully expensed, so that shareholders can assess their true cost to the company. The assumptions and methodology behind the expensing calculation should also be explained to shareholders.
We will generally vote against the cancellation and re-issue, re-pricing, of underwater options.
10b. Long-Term Incentive Plans (L-TIPs)
A Long-Term Incentive Plan (“L-TIP”) can be defined as any arrangement, other than deferred bonuses and retirement benefit plans, which require one or more conditions in respect of service and/or performance to be satisfied over more than one financial year.
JPMAM normally will vote in favour of schemes with keen incentives and challenging performance criteria, which are fully disclosed to shareholders in advance, and vote against payments which are excessive or performance criteria which are undemanding.
11. OTHERS
11a. Charitable Issues
Charitable donations are generally acceptable, provided they are within reasonable limits and fully disclosed to shareholders.
11b. Political Issues
JPMAM does not normally support the use of shareholder funds for political donations, and would require the fullest explanation as to why this would be beneficial to shareholders.
11c. Poison Pills
Poison pills, or shareholder rights plans, are designed to give shareholders of a target company the right to purchase shares of the acquiring company, the target company, or both at a substantial discount from market value. These rights are exercisable once a pre-defined “triggering event” occurs, generally a hostile takeover offer or an outsider’s acquisition of a certain percentage of stock. Corporations may or may not be able to adopt poison pills without shareholder approval, depending on the market.
In reaching its voting position, the Committee has reviewed and continues to review current takeover events. However, it has concluded that there is no clear evidence that poison pills deter takeover offers or defeat takeover attempts and are, in fact, sometimes used as tools to entrench management.
JPMAM will generally vote against anti-takeover devices and support proposals aimed at revoking existing plans. Where anti-takeover devices exist, they should be fully disclosed to shareholders and shareholders should be given the opportunity to review them periodically.
11d. Composite Resolutions
Agenda items at shareholder meetings should be presented in such a way that they can be voted upon clearly, distinctly and unambiguously. We normally oppose deliberately vague, composite or “bundled” resolutions, depending on the context.
11e. Amendments to company articles
i. Limitation on Directors’ Liability – review on a case by case basis
ii. Changes in business activities/ Expansion of business line – generally vote For
iii. Relaxation of Quorum Requirement - generally vote Against
iv. Shares Repurchase at discretion of the Board of Directors – review on a case by case basis
v. Changes of shareholders record date at discretion of the Board of Directors – generally vote Against
IV. ACTIVISM
Activism Policy
1. Discharge of Responsibilities
| | a) | Our primary responsibility is to protect our clients’ interests and, as active managers, we therefore absolutely reserve the right to dispose of an investment where a company fails to meet our expectations. |
| | b) | Our investment managers and analysts have explicit responsibilities for monitoring the companies in the universe of stocks from which clients’ portfolios are constructed. Whilst we attach considerable importance to meetings with management (and several hundred take place in Asia ex Japan each year), we also emphasise the benefits of fundamental research into companies in our investment processes. Industry research, balance sheet analysis and company news flow all have a role to varying degrees in our company monitoring. |
| | c) | Our approach to dealing with conflicts of interest is described fully in our Corporate Governance Policies and Procedures. We seek to minimise conflicts by controlling information flows between different parts of JPMorgan Chase. Where a material conflict does arise we require investors who make the voting decision to certify that they have acted solely in the clients’ best interests. |
2. Monitor Performance
Monitoring of company performance is a key part of our investment processes. We maintain a record of all private meetings held with companies. We regard these meetings as confidential and will not comment on them outside JPMAM.
3. Evaluating and Reporting
We are convinced that a strong governance culture leads ultimately to a better business and a better stock market rating. As investors we scrutinise companies’ governance policies as a part of our investment research and take comfort from good governance.
4. Intervening when necessary
We do not normally intervene directly in the management of companies . However where a company has failed to meet our expectations and it is not clear what action is being taken to remedy the situation , but we believe the potential of the company still justifies retention in our clients’ portfolios , we will arrange to meet senior management in order to express our concerns. Intervention at companies is never publicised. In the small capitalisation end of the market , more aggressive intervention is more common , but still infrequent , as we may hold a significant percentage of a company’s equity.
V. Sustainability
Where JPMAM engages with companies on broader social, environmental and sustainability issues, we have adopted a positive engagement approach. Thus, specific assets or types of assets are not excluded on purely social, environmental or ethical criteria (unless specifically requested by clients). Rather, analysts take such issues into account as part of the mainstream analytical process. Where appropriate, JPMAM will also engage with company management on specific issues at company one-to-one meetings. This engagement activity can then be reported to clients as required.
Where social or environmental issues are the subject of a proxy vote, JPMAM will consider the issue on a case-by-case basis, keeping in mind at all times the best financial interests of our clients.
It is anticipated that our sustainability program will continue to expand both in terms of scope and market coverage as client demand and availability of suitable resources dictate.
ITEM 8. PORTFOLIO MANAGERS OF CLOSED-END MANAGEMENT INVESTMENT COMPANIES.
(a)(1) The day-to-day management of the Fund’s portfolio is handled by the Greater China investment team of JPMAM. The Greater China Investment Team is based in Hong Kong. The head of this team is Howard Wang and Emerson Yip, Lillian Leung, Song Shen and Shumin Huang are portfolio managers.
Mr. Wang joined JPMAM in Hong Kong in 2005. Prior to his appointment, Mr. Wang spent eight years with Goldman Sachs, where in 2004, he was appointed Managing Director, Equities and General Manager of the Taipei branch office.
Mr. Yip joined JPMAM in Hong Kong in 2006. Prior to his appointment, Mr. Yip was a director of Newbridge Capital where, since 1998, he held various positions of responsibility.
Ms. Leung joined JPMAM in Hong Kong in 2010. Prior to her appointment, Ms. Leung worked as the Associate Director of China Research and later the Chief Representative of Shanghai Representative Office with Alliance Bernstein.
Mr. Shen joined JPMAM in Hong Kong in 2010. Prior to his appointment, Mr. Shen worked as a research analyst in China commodities in Goldman Sachs from 1994.
Ms. Huang joined JPMAM in Hong Kong in 2006. Prior to her appointment, Ms. Huang worked as a managing director of the Global Investment Research team of Goldman Sachs from 1997.
The chart below shows the number, type and market value as of December 31, 2015 of the accounts other than the Fund that are managed by each of the Fund’s portfolio managers. The potential for conflicts of interest exists when a portfolio manager manages other accounts with similar or different investment objectives and strategies as the Fund (“Other Accounts”). Potential conflicts may include, for example, conflicts between investment strategies and conflicts in the allocation of investment opportunities.
(a) (2)
Howard Wang
(a)(2)(ii)
| | | | | | | | | | | | | | | | | | | | | | |
| Registered Investment companies | | | Other Pooled Investment Vehicles | | | Other Accounts | |
Number of
accounts | | | Total Assets
(USD) | | | Number of
accounts | | | Total Assets
(USD) | | | Number of
accounts | | | Total Assets
(USD) | |
| | 1 | | | | 28m | | | | 5 | | | | 2,426 | | | | Nil | | | | Nil | |
(a)(2)(iii) - Performance fee
| | | | | | | | | | | | | | | | | | | | | | |
| Registered Investment companies | | | Other Pooled Investment Vehicles | | | Other Accounts | |
Number of
accounts | | | Total Assets
(USD) | | | Number of
accounts | | | Total Assets
(USD) | | | Number of
accounts | | | Total Assets
(USD) | |
| | Nil | | | | Nil | | | | Nil | | | | Nil | | | | Nil | | | | Nil | |
Emerson Yip
(a)(2)(ii)
| | | | | | | | | | | | | | | | | | | | | | |
| Registered Investment companies | | | Other Pooled Investment Vehicles | | | Other Accounts | |
Number of
accounts | | | Total Assets
(USD) | | | Number of
accounts | | | Total Assets
(USD) | | | Number of
accounts | | | Total Assets
(USD) | |
| | Nil | | | | Nil | | | | 4 | | | | 1,009m | | | | 3 | | | | 934m | |
(a)(2)(iii) - Performance fee
| | | | | | | | | | | | | | | | | | | | | | |
| Registered Investment companies | | | Other Pooled Investment Vehicles | | | Other Accounts | |
Number of
accounts | | | Total Assets
(USD) | | | Number of
accounts | | | Total Assets
(USD) | | | Number of
accounts | | | Total Assets
(USD) | |
| | Nil | | | | Nil | | | | Nil | | | | Nil | | | | Nil | | | | Nil | |
Lillian Leung
(a)(2)(ii)
| | | | | | | | | | | | | | | | | | | | | | |
| Registered Investment companies | | | Other Pooled Investment Vehicles | | | Other Accounts | |
Number of
accounts | | | Total Assets
(USD) | | | Number of
accounts | | | Total Assets
(USD) | | | Number of
accounts | | | Total Assets
(USD) | |
| | Nil | | | | Nil | | | | 1 | | | | 37 | | | | 1 | | | | 32m | |
(a)(2)(iii) - Performance fee
| | | | | | | | | | | | | | | | | | | | | | |
| Registered Investment companies | | | Other Pooled Investment Vehicles | | | Other Accounts | |
Number of
accounts | | | Total Assets
(USD) | | | Number of
accounts | | | Total Assets
(USD) | | | Number of
accounts | | | Total Assets
(USD) | |
| | Nil | | | | Nil | | | | Nil | | | | Nil | | | | Nil | | | | Nil | |
Song Shen
(a)(2)(ii)
| | | | | | | | | | | | | | | | | | | | | | |
| Registered Investment companies | | | Other Pooled Investment Vehicles | | | Other Accounts | |
Number of
accounts | | | Total Assets
(USD) | | | Number of
accounts | | | Total Assets
(USD) | | | Number of
accounts | | | Total Assets
(USD) | |
| | Nil | | | | Nil | | | | 9 | | | | 1,162m | | | | Nil | | | | Nil | |
(a)(2)(iii) - Performance fee
| | | | | | | | | | | | | | | | | | | | | | |
| Registered Investment companies | | | Other Pooled Investment Vehicles | | | Other Accounts | |
Number of
accounts | | | Total Assets
(USD) | | | Number of
accounts | | | Total Assets
(USD) | | | Number of
accounts | | | Total Assets
(USD) | |
| | Nil | | | | Nil | | | | Nil | | | | Nil | | | | Nil | | | | Nil | |
Shumin Huang
(a)(2)(ii)
| | | | | | | | | | | | | | | | | | | | | | |
| Registered Investment companies | | | Other Pooled Investment Vehicles | | | Other Accounts | |
Number of
accounts | | | Total Assets
(USD) | | | Number of
accounts | | | Total Assets
(USD) | | | Number of
accounts | | | Total Assets
(USD) | |
| | 1 | | | | 138m | | | | Nil | | | | Nil | | | | Nil | | | | Nil | |
(a)(2)(iii) - Performance fee
| | | | | | | | | | | | | | | | | | | | | | |
| Registered Investment companies | | | Other Pooled Investment Vehicles | | | Other Accounts | |
Number of
accounts | | | Total Assets
(USD) | | | Number of
accounts | | | Total Assets
(USD) | | | Number of
accounts | | | Total Assets
(USD) | |
| | Nil | | | | Nil | | | | Nil | | | | Nil | | | | Nil | | | | Nil | |
Responsibility for managing the client portfolios of the Advisor and the Advisor’s participating affiliates is organized according to the mandates of each account. The Fund’s portfolio managers manage other accounts with similar objectives, approach and philosophy to the Fund. The portfolio holdings, relative position sizes and industry and sector exposures tend to be similar across these similar portfolios, which minimizes the potential for conflicts of interest. For Howard Wang, these similar portfolios include one registered investment company and five other pooled investment vehicles as described under ITEM 8 (a)(2)(ii) above that invest in the Greater China/China/Hong Kong markets and only take long positions in securities.
For Emerson Yip, the similar portfolios include four other pooled investment vehicles and three other accounts as described under ITEM 8 (a)(2)(ii) above that invest in Greater China/Hong Kong markets and only take long positions in securities.
For Lilian Leung, these similar portfolios include one pooled investment vehicle and one other accounts as described under ITEM 8 (a)(2)(ii) above that invest in China/Hong Kong markets and only take long positions in securities.
For Song Shen, these similar portfolios include nine pooled investment vehicle as described under ITEM 8 (a)(2)(ii) above that invest in China/Hong Kong markets and only take long positions in securities.
For Shumin Huang, these similar portfolios include one registered investment company as described under ITEM 8 (a)(2)(ii) above that invest in Taiwan markets and only take long positions in securities.
Upon managing multiple accounts, conflicts of interest may arise with both the aggregation and allocation of securities transactions and allocation of limited investment opportunities. Allocations of aggregated trades, particularly trade orders that were only partially completed due to limited availability, and allocation of investment opportunities generally, could raise a potential conflict of interest, as the Advisor or the portfolio managers may have an incentive to allocate securities that are expected to increase in value to favored accounts. Initial public offerings, in particular, are frequently of very limited availability. The portfolio managers may be perceived as causing accounts they manage to participate in an offering to increase the Advisor’s overall allocation of securities in that offering. A potential conflict of interest also may be perceived to arise if transactions in one account closely follow related transactions in a different account, such as when a purchase increases the value of securities previously purchased by another account, or when a sale in one account lowers the sale price received in a sale by a second account.
The Advisor has policies and procedures designed to manage these conflicts described above such as allocation of investment opportunities to achieve fair and equitable allocation of investment opportunities among its clients over time. For example, orders for the same equity security are aggregated on a continual basis throughout each trading day consistent with the Advisor’s duty of best execution for its clients. If aggregated trades are fully executed, accounts participating in the trade will be allocated their pro rata share on an average price basis. Partially completed orders generally will be allocated among the participating accounts on a pro-rata average price basis, subject to certain limited exceptions. For example, accounts that would receive a de minimis allocation relative to their size may be excluded from the allocation. Another exception may occur when thin markets or price volatility require that an aggregated order be completed in multiple executions over several days. If partial completion of the order would result in an uneconomic allocation to an account due to fixed transaction or custody costs, the dealer may have the discretion to complete and exclude the small orders.
Purchases of money market instruments and fixed income securities cannot always be allocated pro-rata across the accounts with the same investment strategy and objective. However, the Advisor attempts to mitigate any potential unfairness by basing non-pro rata allocations upon an objective predetermined criteria for the selection of investments and a disciplined process for allocating securities with similar duration, credit quality and liquidity in the good faith judgment of the Advisor so that fair and equitable allocation will occur over time.
(a)(3) Portfolio Managers Compensation
The Fund’s portfolio managers participate in a competitive compensation program that is designed to attract and retain outstanding people and closely link their performance to client investment objectives. The total compensation program includes a base salary fixed from year to year and a variable performance bonus consisting of cash incentives and restricted stock and, in some cases, mandatory deferred compensation. These elements reflect individual performance and the performance of the Advisor’s business as a whole.
Each portfolio manager’s performance is formally evaluated annually based on a variety of factors including the aggregate size and blended performance of the portfolios that he manages. Individual contribution relative to client goals carries the highest impact. The compensation is primarily driven by meeting or exceeding clients’ risk and return objectives, relative performance to competitors or competitive indices and compliance with firm policies and regulatory requirements. In evaluating the portfolio manager’s performance with respect to the mutual funds (including the Fund) he manages, the funds’ pre-tax performance is compared to the appropriate market peer group and to each fund’s benchmark index listed in the fund’s prospectus over one, three and five year periods (or such shorter time as the portfolio manager has managed the fund). Investment performance is generally more heavily weighted to the long-term.
Stock awards are granted as the annual performance bonus and comprise from 0% to 35% of each portfolio manager’s total award. As the level of incentive compensation increases, the percentage of compensation awarded in restricted stock also increases.
ITEM 9. PURCHASE OF EQUITY SECURITIES BY CLOSED-END MANAGEMENT INVESTMENT COMPANY AND AFFILIATED PURCHASERS.
Not applicable to the Fund.
ITEM 10. SUBMISSION OF MATTERS TO A VOTE OF SECURITY HOLDERS.
There have been no material changes to the procedures by which the shareholders may recommend nominees to the Fund’s board of directors since the Fund filed its last form NCSR
ITEM 11. CONTROLS AND PROCEDURES.
(a) The Fund’s principal executive and principal financial officers have concluded that the Fund’s disclosure controls and procedures (as defined in Rule 30a-3(c) under the Investment Company Act of 1940, as amended (the “1940 Act”) (17 CFR 270.30a-3(c))) are effective, as of a date within 90 days of the filing date of this Form N-CSR based on their evaluation of these controls and procedures required by Rule 30a-3(b) under the 1940 Act (17 CFR 270.30a-3(b)) and Rules 13a-15(b) or 15d-15(b) under the 1934 Act (17 CFR 240.13a-15(b) or 240.15d-15(b)).
(b) There were no changes in the Fund’s internal control over financial reporting (as defined in Rule 30a-3(d) under the 1940 Act (17 CFR 270.30a-3(d))) that occurred during the Fund’s fiscal year that has materially affected, or is reasonably likely to materially affect, the Fund’s internal control over financial reporting.
ITEM 12. EXHIBITS.
(a)(1) Code of Ethics is attached hereto in response to Item 2(f).
(a)(2) Certifications pursuant to Rule 30a-2(a) under the Investment Company Act of 1940.
(a)(3) Not applicable.
(a)(4) Proxy voting policies and procedures of the Fund and its investment advisor are attached hereto in response to Item 7.
(b) The certifications required by Rule 30a-2(b) of the 1940 Act and Section 906 of the Sarbanes-Oxley Act of 2002 are attached hereto.
SIGNATURES
Pursuant to the requirements of the Securities Exchange Act of 1934 and the Investment Company Act of 1940, the registrant has duly caused this report to be signed on its behalf by the undersigned, thereunto duly authorized.
JPMorgan China Region Fund, Inc.
| | |
| By: | | /s/ Simon Crinage |
| | Simon Crinage |
| | President and Principal Executive Officer |
| | March 9, 2016 |
Pursuant to the requirements of the Securities Exchange Act of 1934 and the Investment Company Act of 1940, this report has been signed below by the following persons on behalf of the registrant and in the capacities and on the dates indicated.
| | |
| By: | | /s/ Simon Crinage |
| | Simon Crinage |
| | President and Principal Executive Officer |
| | March 9, 2016 |
| |
| By: | | /s/ Neil S. Martin |
| | Neil S. Martin |
| | Treasurer and Chief Operating Officer |
| | March 9, 2016 |