LIFE IS COMPLEX.
Nuveen makes things e-simple.
It only takes a minute to sign up for e-Reports. Once enrolled, you’ll receive an e-mail as soon as your Nuveen Fund information is ready. No more waiting for delivery by regular mail. Just click on the link within the e-mail to see the report and save it on your computer if you wish.
If you receive your Nuveen Fund distributions and statements from your financial advisor or brokerage account.
If you receive your Nuveen Fund distributions and statements directly from Nuveen.
Investors have many reasons to remain cautious. The challenges in the Euro area continue to cast a shadow over global economies and financial markets. The political support for addressing fiscal issues is eroding as the economic and social impacts become more visible. Despite strong action by the European Central Bank, member nations appear unwilling to surrender sufficient sovereignty to unify the Euro area financial system or strengthen its banks. The gains made in reducing deficits, and the hard-won progress on winning popular acceptance of the need for economic austerity, are at risk. To their credit, European political leaders press on to find compromise solutions, but there is increasing concern that time is running out.
In the U.S., the extended period of increasing corporate earnings that enabled the equity markets to withstand the downward pressures coming from weakening job creation and slower economic growth appears to be coming to an end. The Fed remains committed to low interest rates and announced a third phase of quantitative easing (QE3) scheduled to continue until mid-2015. The recent election results have removed a major element of uncertainty in the U.S. political picture, but it remains to be seen whether the outcome will reduce the highly partisan atmosphere in Congress and enable progress on the many pressing fiscal and budgetary issues that must be resolved in the coming months.
During the last twelve months, U.S. investors have experienced a solid recovery in the domestic equity markets with increasing volatility as the ‘fiscal cliff’ approaches. The experienced investment teams at Nuveen keep their eye on a longer time horizon and use their practiced investment disciplines to negotiate through market peaks and valleys to achieve long-term goals for investors. Experienced professionals pursue investments that will weather short-term volatility and at the same time, seek opportunities that are created by markets that overreact to negative developments. Monitoring this process is an important consideration for the Fund Board as it oversees your Nuveen Fund on your behalf.
As always, I encourage you to contact your financial consultant if you have any questions about your investment in a Nuveen Fund. On behalf of the other members of your Fund Board, we look forward to continuing to earn your trust in the months and years ahead.
Robert P. Bremner
Portfolio managers Tom Spalding and Scott Romans examine key investment strategies and the six-month performance of the Nuveen Select Portfolios. Tom has managed the three national Portfolios since 1999. Scott, who joined Nuveen in 2000, has managed NXC since 2003 and NXN since January 2011.
What key strategies were used to manage the Nuveen Select Portfolios during the six-month reporting period ended September 30, 2012?
During this reporting period, municipal bond prices generally rallied, as strong demand and tight supply combined to create favorable market conditions for municipal bonds. Although the total volume of tax-exempt supply improved over that of the same six-month period a year earlier, the issuance pattern remained light compared with long-term historical trends. This supply/demand dynamic served as a key driver of performance. Concurrent with rising prices, yields continued to decline across most maturities, especially at the longer end of the municipal yield curve and the yield curve flattened. During this period, we saw an increased number of borrowers come to market seeking to take advantage of the low rate environment through refunding activity, with approximately 60% of new municipal paper issued by borrowers that were calling existing debt and refinancing at lower rates.
In this environment, we continued to take a bottom-up approach to discovering sectors that appeared undervalued as well as individual credits that we believe the potential to perform well over the long-term. The national Portfolios, NXP, NXQ and NXR, were generally well-positioned going into the period and had only modest turnover during these six months. Our main goal was the reinvestment of proceeds from this turnover across a range of sectors to keep these Portfolios fully invested.
During this period, NXC found value in several areas of the market, including health care, tobacco and California state general obligation (GO) bonds. The purchase of state GOs rather than local GOs helped to minimize NXC’s exposure to some of the fiscal problems faced by local governments in California, including local real estate valuations and Proposition 13’s constraints on property taxes, as well as pension issues. NXC also continued to add exposure to redevelopment agency (RDA) bonds in the secondary
Certain statements in this report are forward-looking statements. Discussions of specific investments are for illustration only and are not intended as recommendations of individual investments. The forward-looking statements and other views expressed herein are those of the portfolio managers as of the date of this report. Actual future results or occurrences may differ significantly from those anticipated in any forward-looking statements, and the views expressed herein are subject to change at any time, due to numerous market and other factors. The Funds disclaim any obligation to update publicly or revise any forward-looking statements or views expressed herein.
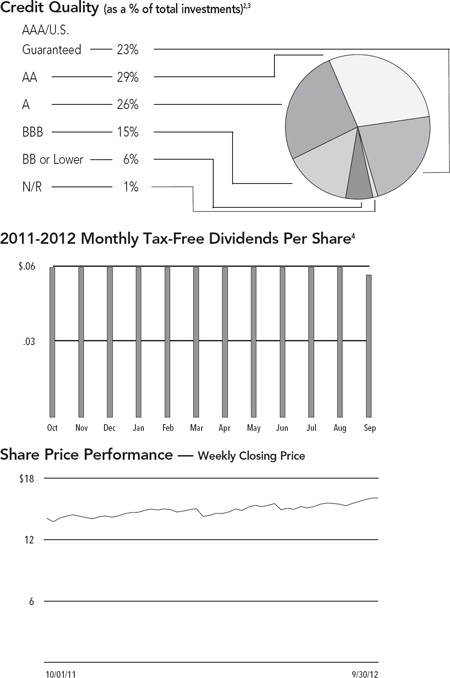
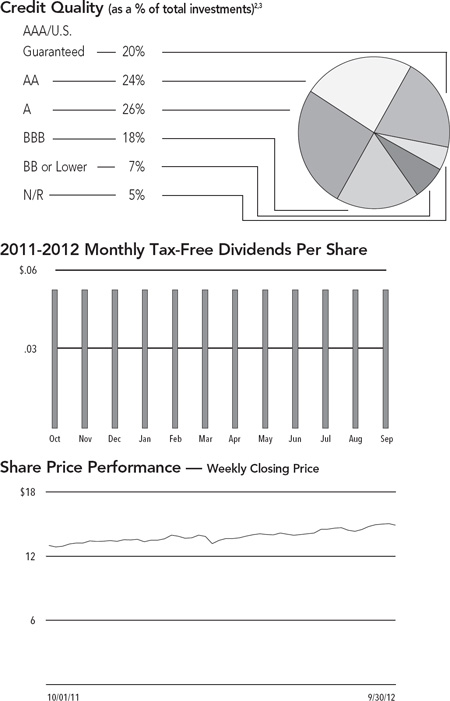
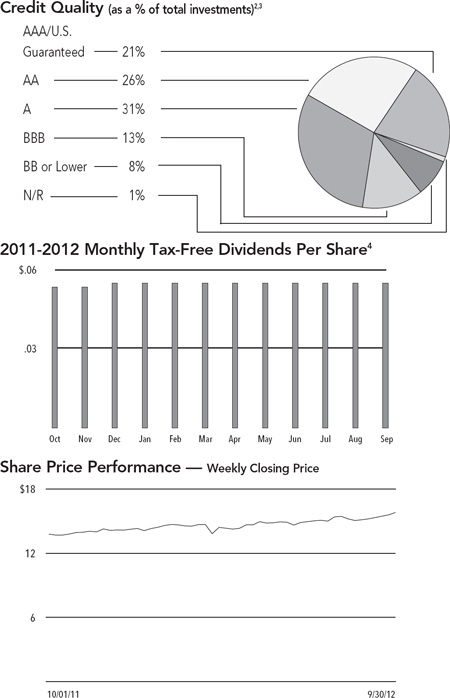
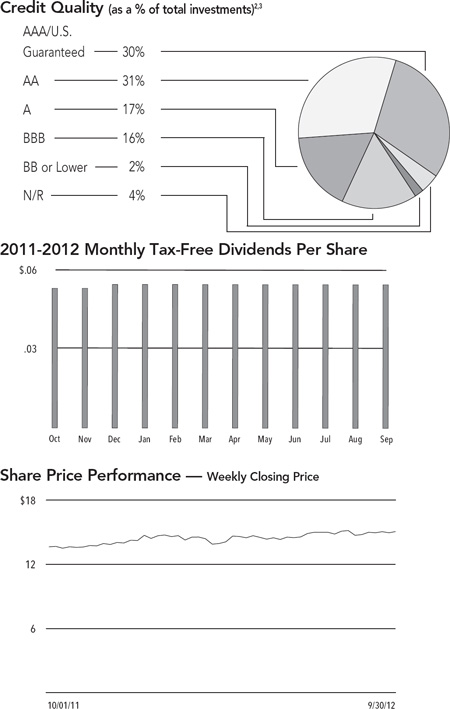
Ratings shown are the highest rating given by one of the following national rating agencies: Standard & Poor’s, Moody’s Investors Service, Inc. or Fitch, Inc. Credit ratings are subject to change. AAA, AA, A, and BBB are investment grade ratings; BB, B, CCC, CC, C and D are below-investment grade ratings. Certain bonds backed by U.S. Government or agency securities are regarded as having an implied rating equal to the rating of such securities. Holdings designated N/R are not rated by these national rating agencies.
market. Because of recent changes to the RDA program, we remained very selective in our purchases in this area, evaluating issuers on a case by case basis. (In 2011, as part of cost saving measures to close gaps in the California state budget, all 400 RDAs in the state were ordered to dissolve by February 1, 2012, and successor agencies and oversight boards were created to manage obligations that were in place prior to the dissolution and take title to the RDAs’ housing and other assets.)
In NXN, we added to our positions in New York City GOs. In general, issuance in New York tends to be concentrated in a few major issuers. During this period, we actively sought to diversify our holdings by purchasing bonds with more unusual structures from other strong issuers, for example, bonds with higher coupons and shorter calls. We also took advantage of short-term market opportunities created by supply/demand dynamics in the municipal market. While demand for tax-exempt paper remained consistently strong throughout the period, supply fluctuated widely. We found that periods of substantial supply provided good short-term buying opportunities not only because of the increased number of issues available, but also because some investors became more hesitant in their buying as supply grew, causing spreads to widen temporarily. At times when supply was more plentiful, we focused on anticipating cashflows from bond calls and maturing bonds and closely monitored opportunities for reinvestment.
In general during this period, we emphasized bonds with longer maturities. This enabled us to take advantage of more attractive yields at the longer end of the municipal yield curve and also provided some protection for the Portfolios’ duration and yield curve positioning. We also purchased lower rated bonds when we found attractive opportunities, especially in NXN, as we believed these bonds continued to offer relative value. Our opportunities in these areas were somewhat constrained by the structure of bonds typically issued as part of refinancing deals, which tended to be characterized by higher quality and shorter maturities.
Cash for new purchases during this period was generated primarily by the proceeds from an increased number of bond calls resulting from the increase in refinancings. During this period, we worked to redeploy these proceeds as well as those from maturing bonds to keep the Portfolios as fully invested as possible. Overall, selling was minimal because the bonds in our portfolios generally offered higher yields than those available in the current marketplace.
As of September 30, 2012, all five of these Portfolios continued to use inverse floating rate securities. We employ inverse floaters for a variety of reasons, including duration management, income enhancement and total return enhancement.
Individual results for the Nuveen Select Portfolios, as well as for relevant index and peer group information, are presented in the accompanying table.
For the six months ended September 30, 2012, the cumulative returns on net asset value (NAV) for all five Select Portfolios exceeded the returns for their respective S&P Municipal Bond Index. For this same period, NXP and NXR performed in line with the average return for the Lipper General and Insured Unleveraged Municipal Debt Funds Classification Average, while NXQ trailed this Lipper average. Both NXC and NXN underperformed their respective state Lipper averages. One of the reasons behind the underperformance of NXC and NXN relative to their Lipper averages was the fact that these Portfolios do not use regulatory leverage (however, they may use effective leverage), while the majority of funds in the Lipper California and New York classifications are leveraged.
Key management factors that influenced the Portfolios’ returns during this period included yield curve and duration positioning, credit exposure and sector allocation.
In an environment of declining rates and flattening yield curve, municipal bonds with longer maturities generally outperformed those with shorter maturities during this period. Overall, credits at the longest end of the municipal yield curve posted the strongest returns, while bonds at the shortest end produced the weakest results. For this period, duration and yield curve positioning was a positive contributor to the performance of these Portfolios, with the net impact varying according to each Portfolio’s individual weightings along the yield curve. For example, NXQ had the shortest duration among the
three national Portfolios, which impacted its performance, while NXN’s performance was hurt by its overweighting of bonds at the shortest end of the yield curve. All five of the Portfolios benefited from their overweighting in zero coupon bonds, which generally outperformed the market during this period due to their longer durations.
Credit exposure was another important factor in the Portfolios’ performance during these six months, as lower quality bonds generally outperformed higher quality bonds. This outperformance was due in part to the greater demand for lower rated bonds as investors looked for investment vehicles offering higher yields. As investors became more comfortable taking on additional investment risk, credit spreads, or the difference in yield spreads between U.S. Treasury securities and comparable investments such as municipal bonds, narrowed through a variety of rating categories. As a result of this spread compression, the Portfolios generally benefited from their holdings of lower rated credits, with good weightings of bonds rated A and BBB across the board. In NXN, this was offset to some degree by a heavier weighting in bonds rated AAA and AA.
During this period, revenue bonds as a whole outperformed the general municipal market. Holdings that generally made positive contributions to the Portfolios’ returns included health care (together with hospitals), education, transportation, and water and sewer bonds. Appropriation and dedicated tax bonds also exceeded the overall market return. NXP, NXQ, NXR and NXN all had strong contributions from their overweighting in health care, while NXC benefited from its overweighting in appropriation and dedicated tax bonds. Tobacco credits backed by the 1998 master tobacco settlement agreement also performed very well, helped in part by their longer effective durations. These bonds also benefited from market developments, including increased demand for higher yielding investments by investors who had become less risk averse. In addition, based on recent data showing that cigarette sales had fallen less steeply than anticipated, the 46 states participating in the agreement, including California and New York, stand to receive increased payments from the tobacco companies. As of September 30, 2012, all of the Portfolios held tobacco credits, which benefited their performance as tobacco bonds rallied.
In contrast, pre-refunded bonds, which are often backed by U.S. Treasury securities, were the poorest performing market segment during this period. The underperformance of these bonds can be attributed primarily to their shorter effective maturities and higher credit quality. As of September 30, 2012, the three national Portfolios were overweight in pre-refunded bonds relative to the market average, which detracted from their investment performance. NXC and NXN held smaller amounts of pre-refunded bonds, which lessened the negative impact. General obligation (GO) bonds and utilities and housing credits slightly lagged the performance of the general municipal market for this period. Although GOs generally tended to trail the market during this period, bonds issued by the states of California and Illinois, which represented the two largest state holdings in the national Portfolios, performed well as they benefited from the spread compression discussed earlier. This in turn benefited the performance of the three national Portfolios as well as NXC.
Fund shares are not guaranteed or endorsed by any bank or other insured depository institution, and are not federally insured by the Federal Deposit Insurance Corporation. Past performance is no guarantee of future results. Fund common shares are subject to a variety of risks, including:
During the six-month reporting period ended September 30, 2012, NXP had one monthly dividend reduction, while the dividends of NXQ, NXR, NXC and NXN remained stable.
All of these Portfolios seek to pay stable dividends at rates that reflect each Portfolio’s past results and projected future performance. During certain periods, each Portfolio may pay dividends at a rate that may be more or less than the amount of net investment income actually earned by the Portfolio during the period. If a Portfolio has cumulatively earned more than it has paid in dividends, it holds the excess in reserve as undistributed net investment income (UNII) as part of the Portfolio’s NAV. Conversely, if a Portfolio has cumulatively paid dividends in excess of its earnings, the excess constitutes negative UNII that is likewise reflected in the Portfolio’s NAV. Each Portfolio will, over time, pay all of its net investment income as dividends to shareholders. As of September 30, 2012, all of the Portfolios in this report had positive UNII balances, based upon our best estimate, for tax purposes and positive UNII balances for financial reporting purposes.
Since the inception of the Portfolios’ repurchase programs, the Portfolios have not repurchased any of their outstanding shares.
As of September 30, 2012, and during the six-month reporting period, the share prices of the Portfolios were trading at (+)premiums and/or (-) discounts to their NAVs as shown in the accompanying table.
| | | Statement of |
| | | Assets & Liabilities |
September 30, 2012 (Unaudited)
| | | | Select | | | Select | | | Select | | | California | | | New York | |
| | | Tax-Free | | Tax-Free 2 | | Tax-Free 3 | | Select Tax-Free | | Select Tax-Free | |
| | | | (NXP | ) | | (NXQ | ) | | (NXR | ) | | (NXC | ) | | (NXN | ) |
| Assets | | | | | | | | | | | | | | | | |
| Investments, at value (cost $218,015,911, $228,682,480, $170,525,522, $87,266,210 and $54,548,487, respectively) | | $ | 242,258,028 | | $ | 245,643,785 | | $ | 187,180,997 | | $ | 98,293,255 | | $ | 58,993,504 | |
| Cash | | | 4,759,981 | | | 1,127,533 | | | 2,785,684 | | | — | | | 157,560 | |
| Receivables: | | | | | | | | | | | | | | | | |
| Interest | | | 2,656,736 | | | 3,095,301 | | | 2,150,108 | | | 1,119,601 | | | 768,624 | |
| Investments sold | | | — | | | 4,926,070 | | | 4,750,000 | | | 1,000,000 | | | — | |
| Other assets | | | 45,933 | | | 48,304 | | | 36,136 | | | 19,239 | | | 13,030 | |
| Total assets | | | 249,720,678 | | | 254,840,993 | | | 196,902,925 | | | 100,432,095 | | | 59,932,718 | |
| Liabilities | | | | | | | | | | | | | | | | |
| Cash overdraft | | | — | | | — | | | — | | | 798,595 | | | — | |
| Floating rate obligations | | | — | | | 1,000,000 | | | — | | | 1,540,000 | | | 1,005,000 | |
| Payables: | | | | | | | | | | | | | | | | |
| Dividends | | | 863,985 | | | 876,439 | | | 679,579 | | | 317,567 | | | 201,380 | |
| Investments purchased | | | — | | | — | | | 1,575,686 | | | — | | | — | |
| Accrued expenses: | | | | | | | | | | | | | | | | |
| Management fees | | | 43,299 | | | 54,308 | | | 42,104 | | | 21,471 | | | 12,903 | |
| Trustees fees | | | 50,243 | | | 52,774 | | | 38,690 | | | 19,099 | | | 11,854 | |
| Other | | | 87,973 | | | 92,343 | | | 74,472 | | | 45,130 | | | 37,100 | |
| Total liabilities | | | 1,045,500 | | | 2,075,864 | | | 2,410,531 | | | 2,741,862 | | | 1,268,237 | |
| Net assets | | $ | 248,675,178 | | $ | 252,765,129 | | $ | 194,492,394 | | $ | 97,690,233 | | $ | 58,664,481 | |
| Shares outstanding | | | 16,558,966 | | | 17,706,419 | | | 13,038,998 | | | 6,268,833 | | | 3,919,031 | |
| Net asset value per share outstanding | | $ | 15.02 | | $ | 14.28 | | $ | 14.92 | | $ | 15.58 | | $ | 14.97 | |
| Net assets consist of: | | | | | | | | | | | | | | | | |
| Shares, $.01 par value per share | | $ | 165,590 | | $ | 177,064 | | $ | 130,390 | | $ | 62,688 | | $ | 39,190 | |
| Paid-in surplus | | | 230,186,697 | | | 247,027,665 | | | 179,437,451 | | | 87,291,285 | | | 53,769,405 | |
| Undistributed (Over-distribution of) net investment income | | | 1,284,246 | | | 927,988 | | | 1,110,405 | | | 282,058 | | | 174,910 | |
| Accumulated net realized gain (loss) | | | (7,203,472 | ) | | (12,328,893 | ) | | (2,841,327 | ) | | (972,843 | ) | | 235,959 | |
| Net unrealized appreciation (depreciation) | | | 24,242,117 | | | 16,961,305 | | | 16,655,475 | | | 11,027,045 | | | 4,445,017 | |
| Net assets | | $ | 248,675,178 | | $ | 252,765,129 | | $ | 194,492,394 | | $ | 97,690,233 | | $ | 58,664,481 | |
| Authorized shares | | | Unlimited | | | Unlimited | | | Unlimited | | | Unlimited | | | Unlimited | |
See accompanying notes to financial statements.
| | Six Months Ended September 30, 2012 |
| | (Unaudited) |
| | | | Select | | | Select | | | Select | | | California | | | New York | |
| | | Tax-Free | | Tax-Free 2 | | Tax-Free 3 | | Select Tax-Free | | Select Tax-Free | |
| | | | (NXP | ) | | (NXQ | ) | | (NXR | ) | | (NXC | ) | | (NXN | ) |
| Investment Income | | $ | 6,279,218 | | $ | 6,252,701 | | $ | 4,769,807 | | $ | 2,368,764 | | $ | 1,392,674 | |
| Expenses | | | | | | | | | | | | | | | | |
| Management fees | | | 264,558 | | | 331,899 | | | 256,462 | | | 131,143 | | | 78,807 | |
| Shareholders servicing agent fees and expense | | | 10,620 | | | 9,815 | | | 8,223 | | | 3,123 | | | 2,849 | |
| Interest expense on floating rate obligations | | | — | | | 3,511 | | | — | | | 4,673 | | | 2,343 | |
| Custodian’s fees and expenses | | | 23,111 | | | 23,865 | | | 18,037 | | | 11,115 | | | 7,681 | |
| Trustees fees and expenses | | | 3,269 | | | 3,330 | | | 2,552 | | | 1,289 | | | 767 | |
| Professional fees | | | 11,391 | | | 11,511 | | | 10,243 | | | 8,153 | | | 7,352 | |
| Shareholder reporting expenses | | | 20,540 | | | 22,439 | | | 17,960 | | | 9,111 | | | 10,622 | |
| Stock exchange listing fees | | | 4,257 | | | 4,231 | | | 4,235 | | | 4,227 | | | 4,227 | |
| Investor relations expense | | | 14,843 | | | 15,340 | | | 11,277 | | | 5,119 | | | 3,407 | |
| Other expenses | | | 7,399 | | | 7,658 | | | 4,560 | | | 4,758 | | | 4,163 | |
| Total expenses before custodian fee credit | | | 359,988 | | | 433,599 | | | 333,549 | | | 182,711 | | | 122,218 | |
| Custodian fee credit | | | (3,272 | ) | | (2,986 | ) | | (3,476 | ) | | (446 | ) | | (409 | ) |
| Net expenses | | | 356,716 | | | 430,613 | | | 330,073 | | | 182,265 | | | 121,809 | |
| Net investment income (loss) | | | 5,922,502 | | | 5,822,088 | | | 4,439,734 | | | 2,186,499 | | | 1,270,865 | |
| Realized and Unrealized Gain (Loss) | | | | | | | | | | | | | | | | |
| Net realized gain (loss) from investments | | | 375,313 | | | 402,856 | | | 205,117 | | | (259,609 | ) | | 62,419 | |
| Change in net unrealized appreciation (depreciation) of investments | | | 7,254,829 | | | 6,251,528 | | | 6,009,858 | | | 3,436,088 | | | 1,414,974 | |
| Net realized and unrealized gain (loss) | | | 7,630,142 | | | 6,654,384 | | | 6,214,975 | | | 3,176,479 | | | 1,477,393 | |
| Net increase (decrease) in net assets from operations | | $ | 13,552,644 | | $ | 12,476,472 | | $ | 10,654,709 | | $ | 5,362,978 | | $ | 2,748,258 | |
See accompanying notes to financial statements.
| | | Statement of |
| | | Changes in Net Assets (Unaudited) |
| | | Select Tax-Free (NXP) | | Select Tax-Free 2 (NXQ) | | Select Tax-Free 3 (NXR) | |
| | | | Six Months | | | Year | | | Six Months | | | Year | | | Six Months | | | Year | |
| | | | Ended | | | Ended | | | Ended | | | Ended | | | Ended | | | Ended | |
| | | | 9/30/12 | | | 3/31/12 | | | 9/30/12 | | | 3/31/12 | | | 9/30/12 | | | 3/31/12 | |
| Operations | | | | | | | | | | | | | | | | | | | |
| Net investment income (loss) | | $ | 5,922,502 | | $ | 12,041,194 | | $ | 5,822,088 | | $ | 11,722,663 | | $ | 4,439,734 | | $ | 8,989,157 | |
| Net realized gain (loss) from investments | | | 375,313 | | | (7,139,651 | ) | | 402,856 | | | (10,714,709 | ) | | 205,117 | | | (2,503,311 | ) |
| Change in net unrealized appreciation (depreciation) of investments | | | 7,254,829 | | | 22,982,613 | | | 6,251,528 | | | 27,951,803 | | | 6,009,858 | | | 14,571,245 | |
| Net increase (decrease) in net assets from operations | | | 13,552,644 | | | 27,884,156 | | | 12,476,472 | | | 28,959,757 | | | 10,654,709 | | | 21,057,091 | |
| Distributions to Shareholders | | | | | | | | | | | | | | | | | | | |
| From net investment income | | | (5,859,046 | ) | | (11,856,344 | ) | | (5,576,326 | ) | | (11,255,497 | ) | | (4,301,697 | ) | | (8,498,394 | ) |
| From accumulated net realized gains | | | — | | | — | | | — | | | — | | | — | | | (560,019 | ) |
| Decrease in net assets from distributions to shareholders | | | (5,859,046 | ) | | (11,856,344 | ) | | (5,576,326 | ) | | (11,255,497 | ) | | (4,301,697 | ) | | (9,058,413 | ) |
| Capital Share Transactions | | | | | | | | | | | | | | | | | | | |
| Net proceeds from shares issued to shareholders due to reinvestment of distributions | | | 290,195 | | | 395,626 | | | 80,896 | | | 64,229 | | | 129,433 | | | 165,224 | |
| Net increase (decrease) in net assets from capital share transactions | | | 290,195 | | | 395,626 | | | 80,896 | | | 64,229 | | | 129,433 | | | 165,224 | |
| Net increase (decrease) in net assets | | | 7,983,793 | | | 16,423,438 | | | 6,981,042 | | | 17,768,489 | | | 6,482,445 | | | 12,163,902 | |
| Net assets at the beginning of period | | | 240,691,385 | | | 224,267,947 | | | 245,784,087 | | | 228,015,598 | | | 188,009,949 | | | 175,846,047 | |
| Net assets at the end of period | | $ | 248,675,178 | | $ | 240,691,385 | | $ | 252,765,129 | | $ | 245,784,087 | | $ | 194,492,394 | | $ | 188,009,949 | |
| Undistributed (Over-distribution of) net investment income at the end of period | | $ | 1,284,246 | | $ | 1,220,790 | | $ | 927,988 | | $ | 682,226 | | $ | 1,110,405 | | $ | 972,368 | |
See accompanying notes to financial statements.
| | | California Select Tax-Free (NXC) | | New York Select Tax-Free (NXN) | |
| | | | Six Months | | | Year | | | Six Months | | | Year | |
| | | | Ended | | | Ended | | | Ended | | | Ended | |
| | | | 9/30/12 | | | 3/31/12 | | | 9/30/12 | | | 3/31/12 | |
| Operations | | | | | | | | | | | | | |
| Net investment income (loss) | | $ | 2,186,499 | | $ | 4,370,484 | | $ | 1,270,865 | | $ | 2,583,551 | |
| Net realized gain (loss) from investments | | | (259,609 | ) | | (403,104 | ) | | 62,419 | | | 279,185 | |
| Change in net unrealized appreciation (depreciation) of investments | | | 3,436,088 | | | 10,548,676 | | | 1,414,974 | | | 3,092,158 | |
| Net increase (decrease) in net assets from operations | | | 5,362,978 | | | 14,516,056 | | | 2,748,258 | | | 5,954,894 | |
| Distributions to Shareholders | | | | | | | | | | | | | |
| From net investment income | | | (2,143,633 | ) | | (4,268,024 | ) | | (1,281,124 | ) | | (2,498,852 | ) |
| From accumulated net realized gains | | | — | | | — | | | — | | | — | |
| Decrease in net assets from distributions to shareholders | | | (2,143,633 | ) | | (4,268,024 | ) | | (1,281,124 | ) | | (2,498,852 | ) |
| Capital Share Transactions | | | | | | | | | | | | | |
| Net proceeds from shares issued to shareholders due to reinvestment of distributions | | | 23,823 | | | — | | | 27,204 | | | 8,959 | |
| Net increase (decrease) in net assets from capital share transactions | | | 23,823 | | | — | | | 27,204 | | | 8,959 | |
| Net increase (decrease) in net assets | | | 3,243,168 | | | 10,248,032 | | | 1,494,338 | | | 3,465,001 | |
| Net assets at the beginning of period | | | 94,447,065 | | | 84,199,033 | | | 57,170,143 | | | 53,705,142 | |
| Net assets at the end of period | | $ | 97,690,233 | | $ | 94,447,065 | | $ | 58,664,481 | | $ | 57,170,143 | |
| Undistributed (Over-distribution of) net investment income at the end of period | | $ | 282,058 | | $ | 239,192 | | $ | 174,910 | | $ | 185,169 | |
See accompanying notes to financial statements.
| | | Financial |
| | | Highlights (Unaudited) |
| | | |
| | Selected data for a Common share outstanding throughout each period: |
| | | | | Investment Operations | | Less Distributions | | | | | |
| | | Beginning Net Asset Value | | Net Investment Income (Loss) | | Net Realized/ Unrealized Gain (Loss) | | Total | | Net Investment Income | | Capital Gains | | Total | | Ending Net Asset Value | | Ending Market Value | |
| Select Tax-Free (NXP) | | | | | | | | | | | | | | | | | | | | | | | | |
| Year Ended 3/31: | | | | | | | | | | | | | | | | | | | | | | | | |
| 2013(d) | | $ | 14.55 | | $ | .36 | | $ | .46 | | $ | .82 | | $ | (.35 | ) | $ | — | | $ | (.35 | ) | $ | 15.02 | | $ | 16.06 | |
| 2012 | | | 13.58 | | | .73 | | | .96 | | | 1.69 | | | (.72 | ) | | — | | | (.72 | ) | | 14.55 | | | 14.57 | |
| 2011 | | | 14.19 | | | .71 | | | (.61 | ) | | .10 | | | (.71 | ) | | — | | | (.71 | ) | | 13.58 | | | 13.25 | |
| 2010 | | | 13.52 | | | .73 | | | .66 | | | 1.39 | | | (.72 | ) | | — | | | (.72 | ) | | 14.19 | | | 14.74 | |
| 2009 | | | 14.30 | | | .71 | | | (.81 | ) | | (.10 | ) | | (.68 | ) | | — | | | (.68 | ) | | 13.52 | | | 13.67 | |
| 2008 | | | 14.72 | | | .70 | | | (.44 | ) | | .26 | | | (.68 | ) | | — | | | (.68 | ) | | 14.30 | | | 14.24 | |
| | | | | | | | | | | | | | | | | | | | | | | | | | | | | |
| Select Tax-Free 2 (NXQ) | | | | | | | | | | | | | | | | | | | | | | | | |
| Year Ended 3/31: | | | | | | | | | | | | | | | | | | | | | | | | |
| 2013(d) | | | 13.89 | | | .33 | | | .38 | | | .71 | | | (.32 | ) | | — | | | (.32 | ) | | 14.28 | | | 14.88 | |
| 2012 | | | 12.89 | | | .66 | | | .98 | | | 1.64 | | | (.64 | ) | | — | | | (.64 | ) | | 13.89 | | | 13.63 | |
| 2011 | | | 13.53 | | | .64 | | | (.61 | ) | | .03 | | | (.67 | ) | | — | | | (.67 | ) | | 12.89 | | | 12.40 | |
| 2010 | | | 12.63 | | | .68 | | | .89 | | | 1.57 | | | (.67 | ) | | — | | | (.67 | ) | | 13.53 | | | 13.81 | |
| 2009 | | | 13.93 | | | .67 | | | (1.30 | ) | | (.63 | ) | | (.67 | ) | | — | | | (.67 | ) | | 12.63 | | | 13.14 | |
| 2008 | | | 14.60 | | | .66 | | | (.69 | ) | | (.03 | ) | | (.64 | ) | | — | | | (.64 | ) | | 13.93 | | | 13.79 | |
| | | | Ratios/Supplemental Data |
| | Total Returns | | | | Ratios to Average Net Assets(b) | | | |
| | Based on Market Value | (a) | Based on Net Asset Value | (a) | Ending Net Assets (000) | | Expenses | (c) | Net Investment Income (Loss) | | Portfolio Turnover Rate | |
| | | | | | | | | | | | | | | | | | | |
| | | | | | | | | | | | | | | | | | | |
| | | 12.85 | % | | 5.71 | % | $ | 248,675 | | | .29 | %* | | 4.82 | %* | | 12 | % |
| | | 15.72 | | | 12.72 | | | 240,691 | | | .31 | | | 5.18 | | | 19 | |
| | | (5.40 | ) | | .69 | | | 224,268 | | | .32 | | | 5.05 | | | 6 | |
| | | 13.45 | | | 10.45 | | | 233,869 | | | .32 | | | 5.20 | | | 3 | |
| | | .89 | | | (.65 | ) | | 222,114 | | | .33 | | | 5.12 | | | 11 | |
| | | .61 | | | 1.83 | | | 234,494 | | | .32 | | | 4.83 | | | 4 | |
| | | | | | | | | | | | | | | | | | | |
| | | | | | | | | | | | | | | | | | | |
| | | 11.61 | | | 5.12 | | | 252,765 | | | .35 | * | | 4.65 | * | | 11 | |
| | | 15.32 | | | 12.97 | | | 245,784 | | | .35 | | | 4.94 | | | 20 | |
| | | (5.56 | ) | | .13 | | | 228,016 | | | .39 | | | 4.81 | | | 6 | |
| | | 10.45 | | | 12.62 | | | 239,100 | | | .37 | | | 5.12 | | | 4 | |
| | | .24 | | | (4.63 | ) | | 222,771 | | | .39 | | | 5.08 | | | 6 | |
| | | 2.69 | | | (.24 | ) | | 245,244 | | | .40 | | | 4.58 | | | 7 | |
| (a) | Total Return Based on Market Value is the combination of changes in the market price per share and the effect of reinvested dividend income and reinvested capital gains distributions, if any, at the average price paid per share at the time of reinvestment. The last dividend declared in the period, which is typically paid on the first business day of the following month, is assumed to be reinvested at the ending market price. The actual reinvestment for the last dividend declared in the period may take place over several days, and in some instances may not be based on the market price, so the actual reinvestment price may be different from the price used in the calculation. Total returns are not annualized. |
| | Total Return Based on Net Asset Value is the combination of changes in net asset value, reinvested dividend income at net asset value and reinvested capital gains distributions at net asset value, if any. The last dividend declared in the period, which is typically paid on the first business day of the following month, is assumed to be reinvested at the ending net asset value. The actual reinvest price for the last dividend declared in the period may often be based on the Fund’s market price (and not its net asset value), and therefore may be different from the price used in the calculation. Total returns are not annualized. |
| (b) | Ratios do not reflect the effect of custodian fee credits earned on the Fund’s net cash on deposit with the custodian bank, where applicable. |
| (c) | The expense ratios reflect, among other things, the interest expense deemed to have been paid by the Fund on the floating rate certificates issued by the special purpose trusts for the self-deposited inverse floaters held by the Fund, where applicable, as described in Footnote 1 – General Information and Significant Accounting Policies, Inverse Floating Rate Securities as follows: |
| Select Tax-Free (NXP) | | | | |
| Year Ended 3/31: | | | | |
| 2013(d) | | | — | % |
| 2012 | | | — | |
| 2011 | | | — | |
| 2010 | | | — | |
| 2009 | | | — | |
| 2008 | | | — | |
| | | | | |
| Select Tax-Free 2 (NXQ) | | | | |
| Year Ended 3/31: | | | | |
| 2013(d) | | | — | %*** |
| 2012 | | | — | ** |
| 2011 | | | — | |
| 2010 | | | — | |
| 2009 | | | .01 | |
| 2008 | | | .04 | |
| (d) | For the six months ended September 30, 2012. |
| * | Annualized. |
| ** | Rounds to less than .01%. |
| *** | Rounds to less than .01% annualized. |
See accompanying notes to financial statements.
| | | Financial |
| | | Highlights (Unaudited) (continued) |
| | | |
| | Selected data for a Common share outstanding throughout each period: |
| | | | | Investment Operations | | Less Distributions | | | | | |
| | | Beginning Net Asset Value | | Net Investment Income (Loss) | | Net Realized/ Unrealized Gain (Loss) | | Total | | Net Investment Income | | Capital Gains | | Total | | Ending Net Asset Value | | Ending Market Value | |
| Select Tax-Free 3 (NXR) | | | | | | | | | | | | | | | | | | | | | | | | |
| Year Ended 3/31: | | | | | | | | | | | | | | | | | | | | | | | | |
| 2013(d) | | $ | 14.43 | | $ | .34 | | $ | .48 | | $ | .82 | | $ | (.33 | ) | $ | — | | $ | (.33 | ) | $ | 14.92 | | $ | 15.82 | |
| 2012 | | | 13.51 | | | .69 | | | .92 | | | 1.61 | | | (.65 | ) | | (.04 | ) | | (.69 | ) | | 14.43 | | | 14.34 | |
| 2011 | | | 14.06 | | | .66 | | | (.57 | ) | | .09 | | | (.64 | ) | | — | ** | | (.64 | ) | | 13.51 | | | 13.03 | |
| 2010 | | | 13.38 | | | .67 | | | .65 | | | 1.32 | | | (.64 | ) | | — | ** | | (.64 | ) | | 14.06 | | | 14.22 | |
| 2009 | | | 13.98 | | | .66 | | | (.62 | ) | | .04 | | | (.64 | ) | | — | | | (.64 | ) | | 13.38 | | | 13.57 | |
| 2008 | | | 14.42 | | | .64 | | | (.44 | ) | | .20 | | | (.64 | ) | | — | | | (.64 | ) | | 13.98 | | | 13.75 | |
| | | | | | | | | | | | | | | | | | | | | | | | | | | | | |
| California Select Tax-Free (NXC) | | | | | | | | | | | | | | | | | | | | | |
| Year Ended 3/31: | | | | | | | | | | | | | | | | | | | | | | | | |
| 2013(d) | | | 15.07 | | | .35 | | | .50 | | | .85 | | | (.34 | ) | | — | | | (.34 | ) | | 15.58 | | | 15.98 | |
| 2012 | | | 13.43 | | | .70 | | | 1.62 | | | 2.32 | | | (.68 | ) | | — | | | (.68 | ) | | 15.07 | | | 14.80 | |
| 2011 | | | 13.97 | | | .68 | | | (.55 | ) | | .13 | | | (.67 | ) | | — | | | (.67 | ) | | 13.43 | | | 12.59 | |
| 2010 | | | 13.24 | | | .67 | | | .73 | | | 1.40 | | | (.67 | ) | | — | | | (.67 | ) | | 13.97 | | | 13.08 | |
| 2009 | | | 14.09 | | | .66 | | | (.84 | ) | | (.18 | ) | | (.67 | ) | | — | | | (.67 | ) | | 13.24 | | | 12.00 | |
| 2008 | | | 14.73 | | | .66 | | | (.65 | ) | | .01 | | | (.64 | ) | | (.01 | ) | | (.65 | ) | | 14.09 | | | 14.08 | |
| | | | Ratios/Supplemental Data |
| | Total Returns | | | | Ratios to Average Net Assets(b) | | | |
| | Based on Market Value | (a) | Based on Net Asset Value | (a) | Ending Net Assets (000) | | Expenses | (c) | Net Investment Income (Loss) | | Portfolio Turnover Rate | |
| | | | | | | | | | | | | | | | | | | |
| | | | | | | | | | | | | | | | | | | |
| | | 12.79 | % | | 5.73 | % | $ | 194,492 | | | .35 | %* | | 4.62 | %* | | 17 | % |
| | | 15.69 | | | 12.23 | | | 188,010 | | | .38 | | | 4.94 | | | 16 | |
| | | (3.98 | ) | | .62 | | | 175,846 | | | .37 | | | 4.75 | | | 4 | |
| | | 9.70 | | | 10.05 | | | 182,779 | | | .38 | | | 4.81 | | | 3 | |
| | | 3.51 | | | .34 | | | 173,678 | | | .39 | | | 4.83 | | | 5 | |
| | | 2.91 | | | 1.42 | | | 181,288 | | | .38 | | | 4.49 | | | 2 | |
| | | | | | | | | | | | | | | | | | | |
| | | | | | | | | | | | | | | | | | | |
| | | 10.40 | | | 5.70 | | | 97,690 | | | .38 | * | | 4.53 | * | | 9 | |
| | | 23.56 | | | 17.64 | | | 94,447 | | | .42 | | | 4.87 | | | 11 | |
| | | 1.18 | | | .83 | | | 84,199 | | | .38 | | | 4.89 | | | 8 | |
| | | 14.71 | | | 10.71 | | | 87,548 | | | .41 | | | 4.87 | | | 4 | |
| | | (10.34 | ) | | (1.30 | ) | | 82,953 | | | .43 | | | 4.85 | | | 12 | |
| | | 3.68 | | | .05 | | | 88,224 | | | .44 | | | 4.52 | | | 8 | |
| (a) | Total Return Based on Market Value is the combination of changes in the market price per share and the effect of reinvested dividend income and reinvested capital gains distributions, if any, at the average price paid per share at the time of reinvestment. The last dividend declared in the period, which is typically paid on the first business day of the following month, is assumed to be reinvested at the ending market price. The actual reinvestment for the last dividend declared in the period may take place over several days, and in some instances may not be based on the market price, so the actual reinvestment price may be different from the price used in the calculation. Total returns are not annualized. |
| | Total Return Based on Net Asset Value is the combination of changes in net asset value, reinvested dividend income at net asset value and reinvested capital gains distributions at net asset value, if any. The last dividend declared in the period, which is typically paid on the first business day of the following month, is assumed to be reinvested at the ending net asset value. The actual reinvest price for the last dividend declared in the period may often be based on the Fund’s market price (and not its net asset value), and therefore may be different from the price used in the calculation. Total returns are not annualized. |
| (b) | Ratios do not reflect the effect of custodian fee credits earned on the Fund’s net cash on deposit with the custodian bank, where applicable. |
| (c) | The expense ratios reflect, among other things, the interest expense deemed to have been paid by the Fund on the floating rate certificates issued by the special purpose trusts for the self-deposited inverse floaters held by the Fund, where applicable, as described in Footnote 1 – General Information and Significant Accounting Policies, Inverse Floating Rate Securities as follows: |
| Select Tax-Free 3 (NXR) | | | | |
| Year Ended 3/31: | | | | |
| 2013(d) | | | — | % |
| 2012 | | | — | |
| 2011 | | | — | |
| 2010 | | | — | |
| 2009 | | | — | |
| 2008 | | | .02 | |
| | | | | |
| California Select Tax-Free (NXC) | | | | |
| Year Ended 3/31: | | | | |
| 2013(d) | | | .01 | %* |
| 2012 | | | .01 | |
| 2011 | | | .01 | |
| 2010 | | | .02 | |
| 2009 | | | .02 | |
| 2008 | | | .06 | |
| (d) | For the six months ended September 30, 2012. |
| * | Annualized. |
| ** | Rounds to less than $.01 per share. |
See accompanying notes to financial statements.
| | | Financial |
| | | Highlights (Unaudited) (continued) |
| | | |
| | Selected data for a Common share outstanding throughout each period: |
| | | | | Investment Operations | | Less Distributions | | | | | |
| | | Beginning Net Asset Value | | Net Investment Income (Loss) | | Net Realized/ Unrealized Gain (Loss) | | Total | | Net Investment Income | | Capital Gains | | Total | | Ending Net Asset Value | | Ending Market Value | |
| New York Select Tax-Free (NXN) | | | | | | | | | | | | | | | | | | | | | |
| Year Ended 3/31: | | | | | | | | | | | | | | | | | | | | | | | | |
| 2013(d) | | $ | 14.59 | | $ | .32 | | $ | .39 | | $ | .71 | | $ | (.33 | ) | $ | — | | $ | (.33 | ) | $ | 14.97 | | $ | 15.07 | |
| 2012 | | | 13.71 | | | .66 | | | .86 | | | 1.52 | | | (.64 | ) | | — | | | (.64 | ) | | 14.59 | | | 14.10 | |
| 2011 | | | 14.06 | | | .64 | | | (.38 | ) | | .26 | | | (.61 | ) | | — | | | (.61 | ) | | 13.71 | | | 13.06 | |
| 2010 | | | 13.37 | | | .62 | | | .68 | | | 1.30 | | | (.61 | ) | | — | | | (.61 | ) | | 14.06 | | | 13.80 | |
| 2009 | | | 13.79 | | | .62 | | | (.43 | ) | | .19 | | | (.61 | ) | | — | | | (.61 | ) | | 13.37 | | | 13.08 | |
| 2008 | | | 14.28 | | | .62 | | | (.49 | ) | | .13 | | | (.61 | ) | | (.01 | ) | | (.62 | ) | | 13.79 | | | 13.79 | |
| | | | Ratios/Supplemental Data |
| | Total Returns | | | | Ratios to Average Net Assets(b) | | | |
| | Based on Market Value | (a) | Based on Net Asset Value | (a) | Ending Net Assets (000) | | Expenses | (c) | Net Investment Income (Loss) | | Portfolio Turnover Rate | |
| | | | | | | | | | | | | | | | | | | |
| | | | | | | | | | | | | | | | | | | |
| | | 9.27 | % | | 4.89 | % | $ | 58,664 | | | .42 | %* | | 4.38 | %* | | 13 | % |
| | | 13.05 | | | 11.25 | | | 57,170 | | | .50 | | | 4.62 | | | 19 | |
| | | (1.08 | ) | | 1.84 | | | 53,705 | | | .41 | | | 4.55 | | | 3 | |
| | | 10.31 | | | 9.89 | | | 55,007 | | | .44 | | | 4.50 | | | 1 | |
| | | (.57 | ) | | 1.47 | | | 52,268 | | | .47 | | | 4.57 | | | 1 | |
| | | 2.06 | | | .94 | | | 53,908 | | | .46 | | | 4.35 | | | 20 | |
| (a) | Total Return Based on Market Value is the combination of changes in the market price per share and the effect of reinvested dividend income and reinvested capital gains distributions, if any, at the average price paid per share at the time of reinvestment. The last dividend declared in the period, which is typically paid on the first business day of the following month, is assumed to be reinvested at the ending market price. The actual reinvestment for the last dividend declared in the period may take place over several days, and in some instances may not be based on the market price, so the actual reinvestment price may be different from the price used in the calculation. Total returns are not annualized. |
| | Total Return Based on Net Asset Value is the combination of changes in net asset value, reinvested dividend income at net asset value and reinvested capital gains distributions at net asset value, if any. The last dividend declared in the period, which is typically paid on the first business day of the following month, is assumed to be reinvested at the ending net asset value. The actual reinvest price for the last dividend declared in the period may often be based on the Fund’s market price (and not its net asset value), and therefore may be different from the price used in the calculation. Total returns are not annualized. |
| (b) | Ratios do not reflect the effect of custodian fee credits earned on the Fund’s net cash on deposit with the custodian bank, where applicable. |
| (c) | The expense ratios reflect, among other things, the interest expense deemed to have been paid by the Fund on the floating rate certificates issued by the special purpose trusts for the self-deposited inverse floaters held by the Fund, where applicable, as described in Footnote 1 – General Information and Significant Accounting Policies, Inverse Floating Rate Securities as follows: |
| New York Select Tax-Free (NXN) | | | | |
| Year Ended 3/31: | | | | |
| 2013(d) | | | .01 | %* |
| 2012 | | | .01 | |
| 2011 | | | .01 | |
| 2010 | | | .02 | |
| 2009 | | | .02 | |
| 2008 | | | .03 | |
| (d) | For the six months ended September 30, 2012. |
| * | Annualized. |
See accompanying notes to financial statements.
| | | Notes to |
| | | Financial Statements (Unaudited) |
1. General Information and Significant Accounting Policies
General Information
The funds covered in this report and their corresponding New York Stock Exchange (“NYSE”) symbols are Nuveen Select Tax-Free Income Portfolio (NXP), Nuveen Select Tax-Free Income Portfolio 2 (NXQ), Nuveen Select Tax-Free Income Portfolio 3 (NXR), Nuveen California Select Tax-Free Income Portfolio (NXC) and Nuveen New York Select Tax-Free Income Portfolio (NXN) (each a “Fund” and collectively, the “Funds”). The Funds are registered under the Investment Company Act of 1940, as amended, as closed-end registered investment companies.
Each Fund seeks to provide current income and stable dividends, exempt from regular federal and designated state income taxes, where applicable, consistent with the preservation of capital by investing primarily in a portfolio of municipal obligations.
Significant Accounting Policies
The following is a summary of significant accounting policies followed by the Funds in the preparation of their financial statements in accordance with U.S. generally accepted accounting principles (“U.S. GAAP”).
Investment Valuation
Prices of municipal bonds are provided by a pricing service approved by the Funds’ Board of Trustees. These securities are generally classified as Level 2 for fair value measurement purposes. The pricing service establishes a security’s fair value using methods that may include consideration of the following: yields or prices of investments of comparable quality, type of issue, coupon, maturity and rating, market quotes or indications of value from security dealers, evaluations of anticipated cash flows or collateral, general market conditions and other information and analysis, including the obligor’s credit characteristics considered relevant. In pricing certain securities, particularly less liquid and lower quality securities, the pricing service may consider information about a security, its issuer, or market activity, provided by Nuveen Fund Advisors, Inc. (the “Adviser”), a wholly-owned subsidiary of Nuveen Investments, Inc. (“Nuveen”). These securities are generally classified as Level 2 or Level 3 depending on the priority of the significant inputs.
Certain securities may not be able to be priced by the pre-established pricing methods as described above. Such securities may be valued by the Funds’ Board of Trustees or its designee at fair value. These securities generally include, but are not limited to, restricted securities (securities which may not be publicly sold without registration under the Securities Act of 1933, as amended) for which a pricing service is unable to provide a market price; securities whose trading has been formally suspended; debt securities that have gone into default and for which there is no current market quotation; a security whose market price is not available from a pre-established pricing source; a security with respect to which an event has occurred that is likely to materially affect the value of the security after the market has closed but before the calculation of a Fund’s net asset value (as may be the case in non-U.S. markets on which the security is primarily traded) or make it difficult or impossible to obtain a reliable market quotation; and a security whose price, as provided by the pricing service, is not deemed to reflect the security’s fair value. As a general principle, the fair value of a security would appear to be the amount that the owner might reasonably expect to receive for it in a current sale. A variety of factors may be considered in determining the fair value of such securities, which may include consideration of the following: yields or prices of investments of comparable quality, type of issue, coupon, maturity and rating, market quotes or indications of value from security dealers, evaluations of anticipated cash flows or collateral, general market conditions and other information and analysis, including the obligor’s credit characteristics considered relevant. These securities are generally classified as Level 2 or Level 3 depending on the priority of the significant inputs. Regardless of the method employed to value a particular security, all valuations are subject to review by the Funds’ Board of Trustees or its designee.
Refer to Footnote 2 – Fair Value Measurements for further details on the leveling of securities held by the Funds as of the end of the reporting period.
Investment Transactions
Investment transactions are recorded on a trade date basis. Realized gains and losses from transactions are determined on the specific identification method, which is the same basis used for federal income tax purposes. Investments purchased on a when-issued/delayed delivery basis may have extended settlement periods. Any investments so purchased are subject to market fluctuation during this period. The Funds have instructed the
custodian to earmark securities in the Funds’ portfolio with a current value at least equal to the amount of the when-issued/delayed delivery purchase commitments. At September 30, 2012, NXR had outstanding delayed delivery purchase commitments of $1,575,686. There were no such outstanding purchase commitments in any of the other Funds.
Investment Income
Investment income, which reflects the amortization of premiums and includes accretion of discounts for financial reporting purposes, is recorded on an accrual basis. Investment income also reflects paydown gains and losses, if any.
Professional Fees
Professional fees presented on the Statement of Operations consist of legal fees incurred in the normal course of operations, audit fees, tax consulting fees and, in some cases, workout expenditures. Workout expenditures are incurred in an attempt to protect or enhance an investment, or to pursue other claims or legal actions on behalf of Fund shareholders.
Income Taxes
Each Fund is a separate taxpayer for federal income tax purposes. Each Fund intends to distribute substantially all of its net investment income and net capital gains to shareholders and to otherwise comply with the requirements of Subchapter M of the Internal Revenue Code applicable to regulated investment companies. Therefore, no federal income tax provision is required. Furthermore, each Fund intends to satisfy conditions that will enable interest from municipal securities, which is exempt from regular federal and designated state income taxes, to retain such tax-exempt status when distributed to shareholders of the Funds. Net realized capital gains and ordinary income distributions paid by the Funds are subject to federal taxation.
For all open tax years and all major taxing jurisdictions, management of the Funds has concluded that there are no significant uncertain tax positions that would require recognition in the financial statements. Open tax years are those that are open for examination by taxing authorities (i.e., generally the last four tax year ends and the interim tax period since then). Furthermore, management of the Funds is also not aware of any tax positions for which it is reasonably possible that the total amounts of unrecognized tax benefits will significantly change in the next twelve months.
Dividends and Distributions to Shareholders
Dividends from net investment income are declared monthly. Net realized capital gains and/or market discount from investment transactions, if any, are distributed to shareholders at least annually. Furthermore, capital gains are distributed only to the extent they exceed available capital loss carryforwards.
Distributions to shareholders of net investment income, net realized capital gains and/or market discount, if any, are recorded on the ex-dividend date. The amount and timing of distributions are determined in accordance with federal income tax regulations, which may differ from U.S. GAAP.
Inverse Floating Rate Securities
Each Fund is authorized to invest in inverse floating rate securities. An inverse floating rate security is created by depositing a municipal bond, typically with a fixed interest rate, into a special purpose trust created by a broker-dealer. In turn, this trust (a) issues floating rate certificates, in face amounts equal to some fraction of the deposited bond’s par amount or market value, that typically pay short-term tax-exempt interest rates to third parties, and (b) issues to a long-term investor (such as one of the Funds) an inverse floating rate certificate (sometimes referred to as an “inverse floater”) that represents all remaining or residual interest in the trust. The income received by the inverse floater holder varies inversely with the short-term rate paid to the floating rate certificates’ holders, and in most circumstances the inverse floater holder bears substantially all of the underlying bond’s downside investment risk and also benefits disproportionately from any potential appreciation of the underlying bond’s value. The price of an inverse floating rate security will be more volatile than that of the underlying bond because the interest rate is dependent on not only the fixed coupon rate of the underlying bond but also on the short-term interest paid on the floating rate certificates, and because the inverse floating rate security essentially bears the risk of loss of the greater face value of the underlying bond.
A Fund may purchase an inverse floating rate security in a secondary market transaction without first owning the underlying bond (referred to as an “externally-deposited inverse floater”), or instead by first selling a fixed-rate bond to a broker-dealer for deposit into the special purpose trust and receiving in turn the residual interest in the trust (referred to as a “self-deposited inverse floater”). The inverse floater held by a Fund gives the Fund the right (a) to cause the holders of the floating rate certificates to tender their notes at par, and (b) to have the broker transfer the fixed-rate bond held by the trust to the Fund, thereby collapsing the trust. An investment in an externally-deposited inverse floater is identified in the Portfolio of Investments as “(IF) – Inverse floating rate investment.” An investment in a self-deposited inverse floater is accounted for as a financing transaction. In such instances, a fixed-rate bond deposited into a special purpose trust is identified in the Portfolio of Investments as “(UB) – Underlying bond of an inverse floating rate trust reflected as a financing transaction,” with the Fund accounting for the short-term floating rate certificates issued by the trust as “Floating rate obligations” on the Statement of Assets and Liabilities. In addition, the Fund reflects in “Investment Income” the entire earnings of
| | | Notes to |
| | | Financial Statements (Unaudited) (continued) |
the underlying bond and the related interest paid to the holders of the short-term floating rate certificates as a component of “Interest expense and amortization of offering costs” on the Statement of Operations.
During the six months ended September 30, 2012, each Fund invested in externally deposited inverse floaters and/or self-deposited inverse floaters.
Each Fund may also enter into shortfall and forbearance agreements (sometimes referred to as a “recourse trust” or “credit recovery swap”) (such agreements referred to herein as “Recourse Trusts”) with a broker-dealer by which a Fund agrees to reimburse the broker-dealer, in certain circumstances, for the difference between the liquidation value of the fixed-rate bond held by the trust and the liquidation value of the floating rate certificates issued by the trust plus any shortfalls in interest cash flows. Under these agreements, a Fund’s potential exposure to losses related to or on inverse floaters may increase beyond the value of a Fund’s inverse floater investments as a Fund may potentially be liable to fulfill all amounts owed to holders of the floating rate certificates. At period end, any such shortfall is recognized as “Unrealized depreciation on Recourse Trusts” on the Statement of Assets and Liabilities.
At September 30, 2012, each Fund’s maximum exposure to externally-deposited Recourse Trusts was as follows:
| | | | | | | | | | | | | California | | | New York | |
| | | | Select | | | Select | | | Select | | | Select | | | Select | |
| | | | Tax-Free | | | Tax-Free 2 | | | Tax-Free 3 | | | Tax-Free | | | Tax-Free | |
| | | | (NXP | ) | | (NXQ | ) | | (NXR | ) | | (NXC | ) | | (NXN | ) |
| Maximum exposure to Recourse Trusts | | $ | — | | $ | — | | $ | — | | $ | — | | $ | 2,000,000 | |
The average floating rate obligations outstanding and average annual interest rate and fees related to self-deposited inverse floaters for the following Funds during the six months ended September 30, 2012, were as follows:
| | | | | | | | | | | |
| | | | | | | California | | | New York | |
| | | | Select | | | Select | | | Select | |
| | | | Tax-Free 2 | | | Tax-Free | | | Tax-Free | |
| | | | (NXQ | ) | | (NXC | ) | | (NXN | ) |
| Average floating rate obligations outstanding | | $ | 1,000,000 | | $ | 1,540,000 | | $ | 1,005,000 | |
| Average annual interest rate and fees | | | .70 | % | | .61 | % | | .46 | % |
Derivative Financial Instruments
Each Fund is authorized to invest in certain derivative instruments, including foreign currency forwards, futures, options and swap contracts. Although the Funds are authorized to invest in such derivative instruments, and may do so in the future, they did not make any such investments during the six months ended September 30, 2012.
Market and Counterparty Credit Risk
In the normal course of business each Fund may invest in financial instruments and enter into financial transactions where risk of potential loss exists due to changes in the market (market risk) or failure of the other party to the transaction to perform (counterparty credit risk). The potential loss could exceed the value of the financial assets recorded on the financial statements. Financial assets, which potentially expose each Fund to counterparty credit risk, consist principally of cash due from counterparties on forward, option and swap transactions, when applicable. The extent of each Fund’s exposure to counterparty credit risk in respect to these financial assets approximates their carrying value as recorded on the Statement of Assets and Liabilities. Futures contracts, when applicable, expose a Fund to minimal counterparty credit risk as they are exchange traded and the exchange’s clearinghouse, which is counterparty to all exchange traded futures, guarantees the futures contracts against default.
Each Fund helps manage counterparty credit risk by entering into agreements only with counterparties the Adviser believes have the financial resources to honor their obligations and by having the Adviser monitor the financial stability of the counterparties. Additionally, counterparties may be required to pledge collateral daily (based on the daily valuation of the financial asset) on behalf of each Fund with a value approximately equal to the amount of any unrealized gain above a pre-determined threshold. Reciprocally, when each Fund has an unrealized loss, the Funds have instructed the custodian to pledge assets of the Funds as collateral with a value approximately equal to the amount of the unrealized loss above a pre-determined threshold. Collateral pledges are monitored and subsequently adjusted if and when the valuations fluctuate, either up or down, by at least the predetermined threshold amount.
Zero Coupon Securities
Each Fund is authorized to invest in zero coupon securities. A zero coupon security does not pay a regular interest coupon to its holders during the life of the security. Income to the holder of the security comes from accretion of the difference between the original purchase price of the security at issuance and the par value of the security at maturity and is effectively paid at maturity. The market prices of zero coupon securities generally are more volatile than the market prices of securities that pay interest periodically.
Custodian Fee Credit
Each Fund has an arrangement with the custodian bank whereby certain custodian fees and expenses are reduced by net credits earned on each Fund’s cash on deposit with the bank. Such deposit arrangements are an alternative to overnight investments. Credits for cash balances may be offset by charges for any days on which a Fund overdraws its account at the custodian bank.
Indemnifications
Under the Funds’ organizational documents, their officers and trustees are indemnified against certain liabilities arising out of the performance of their duties to the Funds. In addition, in the normal course of business, the Funds enter into contracts that provide general indemnifications to other parties. The Funds’ maximum exposure under these arrangements is unknown as this would involve future claims that may be made against the Funds that have not yet occurred. However, the Funds have not had prior claims or losses pursuant to these contracts and expect the risk of loss to be remote.
Use of Estimates
The preparation of financial statements in conformity with U.S. GAAP requires management to make estimates and assumptions that affect the reported amounts of assets and liabilities at the date of the financial statements and the reported amounts of increases and decreases in net assets from operations during the reporting period. Actual results may differ from those estimates.
2. Fair Value Measurements
Fair value is defined as the price that the Funds would receive upon selling an investment or transferring a liability in an orderly transaction to an independent buyer in the principal or most advantageous market for the investment. A three-tier hierarchy is used to maximize the use of observable market data and minimize the use of unobservable inputs and to establish classification of fair value measurements for disclosure purposes. Observable inputs reflect the assumptions market participants would use in pricing the asset or liability. Observable inputs are based on market data obtained from sources independent of the reporting entity. Unobservable inputs reflect the reporting entity’s own assumptions about the assumptions market participants would use in pricing the asset or liability. Unobservable inputs are based on the best information available in the circumstances. The following is a summary of the three-tiered hierarchy of valuation input levels.
| Level 1 – | Inputs are unadjusted and prices are determined using quoted prices in active markets for identical securities. |
| Level 2 – | Prices are determined using other significant observable inputs (including quoted prices for similar securities, interest rates, prepayment speeds, credit risk, etc.). |
| Level 3 – | Prices are determined using significant unobservable inputs (including management’s assumptions in determining the fair value of investments). |
The inputs or methodologies used for valuing securities are not an indication of the risks associated with investing in those securities. The following is a summary of each Fund’s fair value measurements as of the end of the reporting period:
| | | | | | | | | | | | | | |
| Select Tax-Free (NXP) | | | Level 1 | | | Level 2 | | | Level 3 | | | Total | |
| Long-Term Investments*: | | | | | | | | | | | | | |
| Municipal Bonds | | $ | — | | $ | 242,258,028 | | $ | — | | $ | 242,258,028 | |
| | | | | | | | | | | | | | |
| Select Tax-Free 2 (NXQ) | | | Level 1 | | | Level 2 | | | Level 3 | | | Total | |
| Long-Term Investments*: | | | | | | | | | | | | | |
| Municipal Bonds | | $ | — | | $ | 245,643,785 | | $ | — | | $ | 245,643,785 | |
| | | | | | | | | | | | | | |
| Select Tax-Free 3 (NXR) | | | Level 1 | | | Level 2 | | | Level 3 | | | Total | |
| Long-Term Investments*: | | | | | | | | | | | | | |
| Municipal Bonds | | $ | — | | $ | 187,180,997 | | $ | — | | $ | 187,180,997 | |
| | | | | | | | | | | | | | |
| California Select Tax-Free (NXC) | | | Level 1 | | | Level 2 | | | Level 3 | | | Total | |
| Long-Term Investments*: | | | | | | | | | | | | | |
| Municipal Bonds | | $ | — | | $ | 98,293,255 | | $ | — | | $ | 98,293,255 | |
| | | | | | | | | | | | | | |
| New York Select Tax-Free (NXN) | | | Level 1 | | | Level 2 | | | Level 3 | | | Total | |
| Long-Term Investments*: | | | | | | | | | | | | | |
| Municipal Bonds | | $ | — | | $ | 58,993,504 | | $ | — | | $ | 58,993,504 | |
* Refer to the Fund’s Portfolio of Investments for industry/state classifications.
The Nuveen funds’ Board of Directors/Trustees is responsible for the valuation process and has delegated the oversight of the daily valuation process to the Adviser’s Valuation Committee. The Valuation Committee, pursuant to the valuation policies and procedures adopted by the Board of Directors/Trustees, is responsible for making fair value determinations, evaluating the effectiveness of the funds’ pricing policies, and reporting to the
| | | Notes to |
| | | Financial Statements (Unaudited) (continued) |
Board of Directors/Trustees. The Valuation Committee is aided in its efforts by the Adviser’s dedicated Securities Valuation Team, which is responsible for administering the daily valuation process and applying fair value methodologies as approved by the Valuation Committee. When determining the reliability of independent pricing services for investments owned by the funds, the Valuation Committee, among other things, conducts due diligence reviews of the pricing services and monitors the quality of security prices received through various testing reports conducted by the Securities Valuation Team.
The Valuation Committee will consider pricing methodologies it deems relevant and appropriate when making fair value determinations. Examples of possible methodologies include, but are not limited to, multiple of earnings; discount from market of a similar freely traded security; discounted cash-flow analysis; book value or a multiple thereof; risk premium/yield analysis; yield to maturity; and/or fundamental investment analysis. The Valuation Committee will also consider factors it deems relevant and appropriate in light of the facts and circumstances. Examples of possible factors include, but are not limited to, the type of security; the issuer’s financial statements; the purchase price of the security; the discount from market value of unrestricted securities of the same class at the time of purchase; analysts’ research and observations from financial institutions; information regarding any transactions or offers with respect to the security; the existence of merger proposals or tender offers affecting the security; the price and extent of public trading in similar securities of the issuer or comparable companies; and the existence of a shelf registration for restricted securities.
For each portfolio security that has been fair valued pursuant to the policies adopted by the Board of Directors/Trustees, the fair value price is compared against the last available and next available market quotations. The Valuation Committee reviews the results of such testing and fair valuation occurrences are reported to the Board of Directors/Trustees.
3. Derivative Instruments and Hedging Activities
The Funds record derivative instruments at fair value, with changes in fair value recognized on the Statement of Operations, when applicable. Even though the Funds’ investments in derivatives may represent economic hedges, they are not considered to be hedge transactions for financial reporting purposes. The Funds did not invest in derivative instruments during the six months ended September 30, 2012.
4. Fund Shares
Since the inception of the Funds’ repurchase programs, the Funds have not repurchased any of their outstanding shares. Transactions in shares were as follows:
| | | | | | | | | | | | | | | | | | | | |
| | | | Select | | | Select | | | Select | |
| | | | Tax-Free (NXP) | | | Tax-Free 2 (NXQ) | | | Tax-Free 3 (NXR) | |
| | | | Six Months | | | Year | | | Six Months | | | Year | | | Six Months | | | Year | |
| | | | Ended | | | Ended | | | Ended | | | Ended | | | Ended | | | Ended | |
| | | | 9/30/12 | | | 3/31/12 | | | 9/30/12 | | | 3/31/12 | | | 9/30/12 | | | 3/31/12 | |
| Shares issued to shareholders due to reinvestment of distributions | | | 19,636 | | | 27,913 | | | 5,706 | | | 4,774 | | | 8,824 | | | 11,716 | |
| | | | | | | | | | California Select | | | New York Select | |
| | | | | | | | | | Tax-Free (NXC) | | | Tax-Free (NXN) | |
| | | | | | | | | | Six Months | | | Year | | | Six Months | | | Year | |
| | | | | | | | | | Ended | | | Ended | | | Ended | | | Ended | |
| | | | | | | | | | 9/30/12 | | | 3/31/12 | | | 9/30/12 | | | 3/31/12 | |
| Shares issued to shareholders due to reinvestment of distributions | | | | | | | | | 1,542 | | | — | | | 1,832 | | | 607 | |
5. Investment Transactions
Purchases and sales (including maturities but excluding short-term investments, where applicable) during the six months ended September 30, 2012, were as follows:
| | | | | | | | | | | | | | | | | |
| | | | | | | | | | | | | California | | | New York | |
| | | | Select | | | Select | | | Select | | | Select | | | Select | |
| | | | Tax-Free | | | Tax-Free 2 | | | Tax-Free 3 | | | Tax-Free | | | Tax-Free | |
| | | | (NXP | ) | | (NXQ | ) | | (NXR | ) | | (NXC | ) | | (NXN | ) |
| Purchases | | $ | 27,764,903 | | $ | 25,467,493 | | $ | 31,104,979 | | $ | 9,501,419 | | $ | 8,341,034 | |
| Sales and maturities | | | 29,774,250 | | | 28,934,250 | | | 31,574,225 | | | 8,327,415 | | | 7,400,664 | |
6. Income Tax Information
The following information is presented on an income tax basis. Differences between amounts for financial statement and federal income tax purposes are primarily due to timing differences in recognizing taxable market discount, timing differences in recognizing certain gains and losses on investment transactions and the treatment of investments in inverse floating rate securities reflected as financing transactions, if any. To the extent that differences arise that are permanent in nature, such amounts are reclassified within the capital accounts as detailed below. Temporary differences do not require reclassification. Temporary and permanent differences do not impact the net asset values of the Funds.
At September 30, 2012, the cost and unrealized appreciation (depreciation) of investments, as determined on a federal income tax basis, were as follows:
| | | | | | | | | | | | | | | | | |
| | | | | | | | | | | | | California | | | New York | |
| | | | Select | | | Select | | | Select | | | Select | | | Select | |
| | | | Tax-Free | | | Tax-Free 2 | | | Tax-Free 3 | | | Tax-Free | | | Tax-Free | |
| | | | (NXP | ) | | (NXQ | ) | | (NXR | ) | | (NXC | ) | | (NXN | ) |
| Cost of investments | | $ | 217,309,126 | | $ | 227,233,502 | | $ | 169,971,771 | | $ | 85,708,150 | | $ | 53,536,585 | |
| Gross unrealized: | | | | | | | | | | | | | | | | |
| Appreciation | | $ | 25,228,072 | | $ | 18,501,966 | | $ | 17,607,320 | | $ | 11,303,308 | | $ | 4,510,790 | |
| Depreciation | | | (279,170 | ) | | (1,091,683 | ) | | (398,094 | ) | | (262,991 | ) | | (55,038 | ) |
| Net unrealized appreciation (depreciation) of investments | | $ | 24,948,902 | | $ | 17,410,283 | | $ | 17,209,226 | | $ | 11,040,317 | | $ | 4,455,752 | |
Permanent differences, primarily due to federal taxes paid and taxable market discount, resulted in reclassifications among the Funds’ components of net assets at March 31, 2012, the Funds’ last tax year end, as follows:
| | | | | | | | | | | | | | | | | |
| | | | | | | | | | | | | California | | | New York | |
| | | | Select | | | Select | | | Select | | | Select | | | Select | |
| | | | Tax-Free | | | Tax-Free 2 | | | Tax-Free 3 | | | Tax-Free | | | Tax-Free | |
| | | | (NXP | ) | | (NXQ | ) | | (NXR | ) | | (NXC | ) | | (NXN | ) |
| Paid-in-surplus | | $ | (293 | ) | $ | 3,433 | | $ | 459 | | $ | — | | $ | — | |
| Undistributed (Over-distribution of) net investment income | | | (24,482 | ) | | (43,172 | ) | | (16,790 | ) | | (550 | ) | | (4,027 | ) |
| Accumulated net realized gain (loss) | | | 24,775 | | | 39,739 | | | 16,331 | | | 550 | | | 4,027 | |
The tax components of undistributed net tax-exempt income, net ordinary income and net long-term capital gains at March 31, 2012, the Funds’ last tax year end, were as follows:
| | | | | | | | | | | | | | | | | |
| | | | | | | | | | | | | California | | | New York | |
| | | | Select | | | Select | | | Select | | | Select | | | Select | |
| | | | Tax-Free | | | Tax-Free 2 | | | Tax-Free 3 | | | Tax-Free | | | Tax-Free | |
| | | | (NXP | ) | | (NXQ | ) | | (NXR | ) | | (NXC | ) | | (NXN | ) |
| Undistributed net tax-exempt income* | | $ | 1,435,740 | | $ | 1,198,377 | | $ | 1,277,071 | | $ | 588,588 | | $ | 386,521 | |
| Undistributed net ordinary income** | | | 7,724 | | | 26,267 | | | 411 | | | — | | | — | |
| Undistributed net long-term capital gains | | | — | | | — | | | — | | | — | | | 167,392 | |
| * | Undistributed net tax-exempt income (on a tax basis) has not been reduced for the dividend declared on March 1, 2012, paid on April 2, 2012. |
| ** | Net ordinary income consists of taxable market discount income and net short-term capital gains, if any. |
The tax character of distributions paid during the Funds’ last tax year ended March 31, 2012, was designated for purposes of the dividends paid deduction as follows:
| | | | | | | | | | | | | | | | | |
| | | | | | | | | | | | | California | | | New York | |
| | | | Select | | | Select | | | Select | | | Select | | | Select | |
| | | | Tax-Free | | | Tax-Free 2 | | | Tax-Free 3 | | | Tax-Free | | | Tax-Free | |
| | | | (NXP | ) | | (NXQ | ) | | (NXR | ) | | (NXC | ) | | (NXN | ) |
| Distributions from net tax-exempt income | | $ | 11,795,179 | | $ | 11,308,334 | | $ | 8,418,313 | | $ | 4,258,623 | | $ | 2,485,111 | |
| Distributions from net ordinary income ** | | | 59,504 | | | — | | | 60,476 | | | — | | | — | |
| Distributions from net long-term capital gains | | | — | | | — | | | 559,452 | | | — | | | — | |
| ** | Net ordinary income consists of taxable market discount income and net short-term capital gains, if any. |
| | | Notes to |
| | | Financial Statements (Unaudited) (continued) |
At March 31, 2012, the Funds’ last tax year end, the following Funds had unused capital loss carryforwards available for federal income tax purposes to be applied against future capital gains, if any. If not applied, the carryforwards will expire as follows:
| | | | | | | | | | | |
| | | | | | | | | | California | |
| | | | Select | | | Select | | | Select | |
| | | | Tax-Free | | | Tax-Free 2 | | | Tax-Free | |
| | | | (NXP | ) | | (NXQ | ) | | (NXC | ) |
| Expiration: | | | | | | | | | | |
| March 31, 2015 | | $ | 260,316 | | $ | 862,250 | | $ | — | |
| March 31, 2016 | | | — | | | 7,597 | | | 29,942 | |
| March 31, 2017 | | | — | | | 400,800 | | | 107,619 | |
| March 31, 2019 | | | — | | | 335,742 | | | 173,121 | |
| Total | | $ | 260,316 | | $ | 1,606,389 | | $ | 310,682 | |
During the Funds’ last tax year ended March 31, 2012, the following Funds utilized their capital loss carryforwards as follows:
| | | | | | | | | | | |
| | | | | | | | | | New York | |
| | | | Select | | | Select | | | Select | |
| | | | Tax-Free | | | Tax-Free 2 | | | Tax-Free | |
| | | | (NXP | ) | | (NXQ | ) | | (NXN | ) |
| Utilized capital loss carryforwards | | $ | 205,014 | | $ | 455,309 | | $ | 92,679 | |
Under the Regulated Investment Company Modernization Act of 2010 (the “Act”), capital losses incurred by the Funds after December 31, 2010 will not be subject to expiration. Capital losses incurred that will be carried forward under the provisions of the Act are as follows:
| | | | California | |
| | | | Select | |
| | | | Tax-Free | |
| | | | (NXC | ) |
| Post-enactment losses: | | | | |
| Short-term | | $ | — | |
| Long-term | | | 148,537 | |
The Funds have elected to defer losses incurred from November 1, 2011 through March 31, 2012, the Funds’ last tax year end, in accordance with federal income tax rules. These losses are treated as having arisen on the first day of the current fiscal year. The following Funds have elected to defer losses as follows:
| | | | | | | | | | | | | | |
| | | | | | | | | | | | | California | |
| | | | Select | | | Select | | | Select | | | Select | |
| | | | Tax-Free | | | Tax-Free 2 | | | Tax-Free 3 | | | Tax-Free | |
| | | | (NXP | ) | | (NXQ | ) | | (NXR | ) | | (NXC | ) |
| Post-October capital losses | | $ | 7,319,890 | | $ | 11,130,279 | | $ | 3,046,588 | | $ | 254,017 | |
| Late-year ordinary losses | | | — | | | — | | | — | | | — | |
7. Management Fees and Other Transactions with Affiliates
Each Fund’s management fee consists of two components – a fund-level fee, based only on the amount of assets within the Fund, and a complex-level fee, based on the aggregate amount of all eligible fund assets managed by the Adviser. This pricing structure enables Fund shareholders to benefit from growth in the assets within their respective Fund as well as from growth in the amount of complex-wide assets managed by the Adviser.
The annual fund-level fee for each Fund, payable monthly, is calculated according to the following schedule:
| | | | Select Tax-Free 2 (NXQ) |
| | | | Select Tax-Free 3 (NXR) |
| | | | California Select Tax-Free (NXC) |
| | Select Tax-Free (NXP) | New York Select Tax-Free (NXN) |
| Average Daily Managed Assets* | Fund-Level Fee Rate | Fund-Level Fee Rate |
| For the first $125 million | .0500 | % | .1000 | % |
| For the next $125 million | .0375 | | .0875 | |
| For the next $250 million | .0250 | | .0750 | |
| For the next $500 million | .0125 | | .0625 | |
The annual complex-level fee for each Fund, payable monthly, is calculated according to the following schedule:
| Complex-Level Managed Asset Breakpoint Level* | Effective Rate at Breakpoint Level |
| $55 billion | .2000 | % |
| $56 billion | .1996 | |
| $57 billion | .1989 | |
| $60 billion | .1961 | |
| $63 billion | .1931 | |
| $66 billion | .1900 | |
| $71 billion | .1851 | |
| $76 billion | .1806 | |
| $80 billion | .1773 | |
| $91 billion | .1691 | |
| $125 billion | .1599 | |
| $200 billion | .1505 | |
| $250 billion | .1469 | |
| $300 billion | .1445 | |
| * | For the fund-level and complex-level fees, managed assets include closed-end fund assets managed by the Adviser that are attributable to financial leverage. For these purposes, financial leverage includes the funds’ use of preferred stock and borrowings and certain investments in the residual interest certificates (also called inverse floating rate securities) in tender option bond (TOB) trusts, including the portion of assets held by a TOB trust that has been effectively financed by the trust’s issuance of floating rate securities, subject to an agreement by the Adviser as to certain funds to limit the amount of such assets for determining managed assets in certain circumstances. The complex-level fee is calculated based upon the aggregate daily managed assets of all Nuveen Funds that constitute “eligible assets.” Eligible assets do not include assets attributable to investments in other Nuveen Funds or assets in excess of $2 billion added to the Nuveen Fund complex in connection with the Adviser’s assumption of the management of the former First American Funds effective January 1, 2011. As of September 30, 2012, the complex-level fee rate for each of these Funds was .1695%. |
The management fee compensates the Adviser for overall investment advisory and administrative services and general office facilities. The Adviser is responsible for each Fund’s overall strategy and asset allocation decisions. The Adviser has entered into sub-advisory agreements with Nuveen Asset Management, LLC (the “Sub-Adviser”), a wholly-owned subsidiary of the Adviser, under which the Sub-Adviser manages the investment portfolios of the Funds. The Sub-Adviser is compensated for its services to the Funds from the management fees paid to the Adviser.
The Funds pay no compensation directly to those of its trustees who are affiliated with the Adviser or to its officers, all of whom receive remuneration for their services to the Funds from the Adviser or its affiliates. The Board of Trustees has adopted a deferred compensation plan for independent trustees that enables trustees to elect to defer receipt of all or a portion of the annual compensation they are entitled to receive from certain Nuveen-advised funds. Under the plan, deferred amounts are treated as though equal dollar amounts had been invested in shares of select Nuveen-advised funds.
| | | Notes to |
| | | Financial Statements (Unaudited) (continued) |
8. New Accounting Pronouncements
Financial Accounting Standards Board (“FASB”) Balance Sheet (Topic 210): Disclosures about Offsetting Assets and Liabilities
In December 2011, the FASB issued Accounting Standards Update (“ASU”) No. 2011-11 (“ASU No. 2011-11”) to enhance disclosures about financial instruments and derivative instruments that are subject to offsetting (“netting”) on the Statement of Assets and Liabilities. This information will enable users of the entity’s financial statements to evaluate the effect or potential effect of netting arrangements on the entity’s financial position. ASU No. 2011-11 is effective prospectively during interim or annual periods beginning on or after January 1, 2013. At this time, management is evaluating the implications of this guidance and the impact it will have to the financial statements amounts and footnote disclosures, if any.
Annual Investment Management
Agreement Approval Process (Unaudited)
The Board of Trustees (each, a “Board” and each Trustee, a “Board Member”) of the Funds, including the Board Members who are not parties to the Funds’ advisory or sub-advisory agreements or “interested persons” of any such parties (the “Independent Board Members”), is responsible for approving the advisory agreements (each, an “Investment Management Agreement”) between each Fund and Nuveen Fund Advisors, Inc. (the “Advisor”) and the sub-advisory agreements (each, a “Sub-Advisory Agreement”) between the Advisor and Nuveen Asset Management, LLC (the “Sub-Advisor”) (the Investment Management Agreements and the Sub-Advisory Agreements are referred to collectively as the “Advisory Agreements”) and their periodic continuation. Pursuant to the Investment Company Act of 1940, as amended (the “1940 Act”), the Board is required to consider the continuation of the Advisory Agreements on an annual basis. Accordingly, at an in-person meeting held on May 21-23, 2012 (the “May Meeting”), the Board, including a majority of the Independent Board Members, considered and approved the continuation of the Advisory Agreements for the Funds for an additional one-year period.
In preparation for its considerations at the May Meeting, the Board requested and received extensive materials prepared in connection with the review of the Advisory Agreements. The materials provided a broad range of information regarding the Funds, the Advisor and the Sub-Advisor (the Advisor and the Sub-Advisor are collectively, the “Fund Advisers” and each, a “Fund Adviser”). As described in more detail below, the information provided included, among other things, a review of Fund performance, including Fund investment performance assessments against peer groups and appropriate benchmarks, a comparison of Fund fees and expenses relative to peers, a description and assessment of shareholder service levels for the Funds, a summary of the performance of certain service providers, a review of product initiatives and shareholder communications and an analysis of the Advisor’s profitability with comparisons to comparable peers in the managed fund business. As part of its annual review, the Board also held a separate meeting on April 18-19, 2012, to review the Funds’ investment performance and consider an analysis provided by the Advisor of the Sub-Advisor which generally evaluated the Sub-Advisor’s investment team, investment mandate, organizational structure and history, investment philosophy and process, performance of the applicable Fund, and significant changes to the foregoing. As a result of its review of the materials and discussions, the Board presented the Advisor with questions and the Advisor responded.
The materials and information prepared in connection with the annual review of the Advisory Agreements supplement the information and analysis provided to the Board
Annual Investment Management Agreement
Approval Process (Unaudited) (continued)
during the year. In this regard, throughout the year, the Board, acting directly or through its committees, regularly reviews the performance and various services provided by the Advisor and the Sub-Advisor. The Board meets at least quarterly as well as at other times as the need arises. At its quarterly meetings, the Board reviews reports by the Advisor which include, among other things, Fund performance, a review of the investment teams and reports on compliance, regulatory matters and risk management. The Board also meets with key investment personnel managing the Fund portfolios during the year. In October 2011, the Board also created two new standing committees (the Open-end Fund Committee and the Closed-end Fund Committee) to assist the full Board in monitoring and gaining a deeper insight into the distinctive issues and business practices of open-end and closed-end funds.
In addition, the Board continues its program of seeking to have the Board Members or a subset thereof visit each sub-advisor to the Nuveen funds at least once over a multiple year rotation, meeting with key investment and business personnel. In this regard, the Board visited with the Sub-Advisor’s municipal team in Minneapolis in September 2011, and with the Sub-Advisor’s municipal team in Chicago in November 2011. Further, an ad hoc committee of the Board visited the then-current transfer agents of the Nuveen funds in 2011 and the audit committee of the Board visited the various pricing agents for the Nuveen funds in January 2012. The Board considers factors and information that are relevant to its annual consideration of the renewal of the Advisory Agreements at the meetings held throughout the year. Accordingly, the Board considers the information provided and knowledge gained at these meetings when performing its annual review of the Advisory Agreements. The Independent Board Members are assisted throughout the process by independent legal counsel who provided materials describing applicable law and the duties of directors or trustees in reviewing advisory contracts and met with the Independent Board Members in executive sessions without management present. In addition, it is important to recognize that the management arrangements for the Nuveen funds are the result of many years of review and discussion between the Independent Board Members and fund management and that the Board Members’ conclusions may be based, in part, on their consideration of fee arrangements and other factors developed in previous years.
The Board considered all factors it believed relevant with respect to each Fund, including among other factors: (a) the nature, extent and quality of the services provided by the Fund Advisers, (b) the investment performance of the Fund and Fund Advisers, (c) the advisory fees and costs of the services to be provided to the Fund and the profitability of the Fund Advisers, (d) the extent of any economies of scale, (e) any benefits derived by the Fund Advisers from the relationship with the Fund and (f) other factors. Each Board Member may have accorded different weight to the various factors in reaching his or her conclusions with respect to a Fund’s Advisory Agreements. The Independent Board Members did not identify any single factor as all important or controlling. The Independent Board Members’ considerations were instead based on a
comprehensive consideration of all the information presented. The principal factors considered by the Board and its conclusions are described below.
A. Nature, Extent and Quality of Services
In considering renewal of the Advisory Agreements, the Independent Board Members considered the nature, extent and quality of the Fund Adviser’s services, including advisory services and the resulting Fund performance and administrative services. The Independent Board Members further considered the overall reputation and capabilities of the Advisor and its affiliates, the commitment of the Advisor to provide high quality service to the Funds, their overall confidence in the Advisor’s integrity and the Advisor’s responsiveness to questions and concerns raised by them. The Independent Board Members reviewed materials outlining, among other things, the Fund Adviser’s organization and business; the types of services that the Fund Adviser or its affiliates provide to the Funds; the performance record of the applicable Fund (as described in further detail below); and any initiatives Nuveen had taken for the applicable fund product line.
In considering advisory services, the Board recognized that the Advisor provides various oversight, administrative, compliance and other services for the Funds and the Sub-Advisor generally provides the portfolio investment management services to the Funds. In reviewing the portfolio management services provided to each Fund, the Board reviewed the materials provided by the Nuveen Investment Services Oversight Team analyzing, among other things, the Sub-Advisor’s investment team and changes thereto, organization and history, assets under management, Fund objectives and mandate, the investment team’s philosophy and strategies in managing the Fund, developments affecting the Sub-Advisor or Fund and Fund performance. The Independent Board Members also reviewed portfolio manager compensation arrangements to evaluate each Fund Adviser’s ability to attract and retain high quality investment personnel, preserve stability, and reward performance but not provide an inappropriate incentive to take undue risks. In addition, the Board considered the Advisor’s execution of its oversight responsibilities over the Sub-Advisor. Given the importance of compliance, the Independent Board Members also considered Nuveen’s compliance program, including the report of the chief compliance officer regarding the Funds’ compliance policies and procedures; the resources dedicated to compliance; and the record of compliance with the policies and procedures.
In addition to advisory services, the Board considered the quality and extent of administrative and other non-investment advisory services the Advisor and its affiliates provide to the Funds, including product management, investment services (such as oversight of investment policies and procedures, risk management, and pricing), fund administration, oversight of service providers, shareholder services and communications, administration of Board relations, regulatory and portfolio compliance, legal support, managing leverage and promoting an orderly secondary market for common shares. The Board further recognized Nuveen’s additional investments in personnel, including in compliance and risk management.
Annual Investment Management Agreement
Approval Process (Unaudited) (continued)
In reviewing the services provided, the Board also reviewed materials describing various notable initiatives and projects the Advisor performed in connection with the closed-end fund product line. These initiatives included completion of the refinancing of auction rate preferred securities; efforts to eliminate product overlap with fund mergers; elimination of the insurance mandate on several funds; ongoing services to manage leverage that has become increasingly complex; continued secondary market offerings, share repurchases and other support initiatives for certain funds; and continued communications efforts with shareholders, fund analysts and financial advisers. With respect to the latter, the Independent Board Members noted Nuveen’s continued commitment to supporting the secondary market for the common shares of its closed-end funds through a comprehensive secondary market communication program designed to raise investor and analyst awareness and understanding of closed-end funds. Nuveen’s support services included, among other things: continuing communications concerning the refinancing efforts related to auction rate preferred securities; supporting and promoting munifund term preferred shares (MTP) including by launching a microsite dedicated to MTP shares; sponsoring and participating in conferences; communicating with closed-end fund analysts covering the Nuveen funds throughout the year; providing marketing and product updates for the closed-end funds; and maintaining and enhancing a closed-end fund website.
Based on their review, the Independent Board Members found that, overall, the nature, extent and quality of services provided to the respective Funds under each applicable Advisory Agreement were satisfactory.
B. The Investment Performance of the Funds and Fund Advisers
The Board, including the Independent Board Members, reviewed and considered the performance history of each Fund over various time periods. The Board reviewed, among other things, each Fund’s historic investment performance as well as information comparing the Fund’s performance information with that of other funds (the “Performance Peer Group”) based on data compiled by Nuveen that was provided by an independent provider of mutual fund data and with recognized and/or customized benchmarks (i.e., benchmarks derived from multiple recognized benchmarks).
The Board reviewed reports, including a comprehensive analysis of the Funds’ performance and the applicable investment team. In this regard, the Board reviewed each Fund’s total return information compared to its Performance Peer Group for the quarter, one-, three- and five-year periods ending December 31, 2011, as well as performance information reflecting the first quarter of 2012. In addition, the Board reviewed each Fund’s total return information compared to recognized and/or customized benchmarks for the quarter, one- and three-year periods ending December 31, 2011, as well as performance information reflecting the first quarter of 2012.
The Independent Board Members also reviewed historic premium and discount levels, including a summary of actions taken to address or discuss other developments affecting the secondary market discounts of various funds. This information supplemented the fund performance information provided to the Board at each of its quarterly meetings.
In reviewing performance comparison information, the Independent Board Members recognized that the usefulness of the comparisons of the performance of certain funds with the performance of their respective Performance Peer Group may be limited because the Performance Peer Group may not adequately represent the objectives and strategies of the applicable funds or may be limited in size or number. In this regard, the Independent Board Members noted that the Performance Peer Group of each Fund was classified as having significant differences from the respective Fund based on various considerations such as special fund objectives, potential investable universe and the composition of the peer set (e.g., the number and size of competing funds and number of competing managers). The Independent Board Members also noted that the investment experience of a particular shareholder in the Nuveen funds will vary depending on when such shareholder invests in the applicable fund, the class held (if multiple classes are offered in a fund) and the performance of the fund (or respective class) during that shareholder’s investment period. In addition, although the performance below reflects the performance results for the time periods ending as of the most recent calendar year end (unless otherwise indicated), the Board also recognized that selecting a different ending time period may derive different results. Furthermore, while the Board is cognizant of the relevant performance of a fund’s peer set and/or benchmark(s), the Board evaluated fund performance in light of the respective fund’s investment objectives, investment parameters and guidelines and recognized that the objectives, investment parameters and guidelines of peers and/or benchmarks may differ to some extent, thereby resulting in differences in performance results. Nevertheless, with respect to any Nuveen funds that the Board considers to have underperformed their peers and/or benchmarks from time to time, the Board monitors such funds closely and considers any steps necessary or appropriate to address such issues.
As noted above, each Fund had significant differences from its respective Performance Peer Group. Therefore, the Independent Board Members considered the Funds’ performance compared to their benchmarks. In this regard, the Independent Board Members noted that the Nuveen New York Select Tax-Free Income Portfolio and the Nuveen California Select Tax-Free Income Portfolio outperformed their respective benchmarks in the one- and three-year periods, while the Nuveen Select Tax-Free Income Portfolio, the Nuveen Select Tax-Free Income Portfolio 2 and the Nuveen Select Tax-Free Income Portfolio 3 underperformed their respective benchmarks in the one-and three-year periods, but outperformed their respective benchmarks in the first quarter of 2012.
Based on their review, the Independent Board Members determined that each Fund’s investment performance had been satisfactory.
Annual Investment Management Agreement
Approval Process (Unaudited) (continued)
C. Fees, Expenses and Profitability
1. Fees and Expenses
The Board evaluated the management fees and expenses of each Fund reviewing, among other things, such Fund’s gross management fees, net management fees and net expense ratios in absolute terms as well as compared to the fee and expenses of a comparable universe of funds provided by an independent fund data provider (the “Peer Universe”) and any expense limitations.
The Independent Board Members further reviewed the methodology regarding the construction of the applicable Peer Universe. In reviewing the comparisons of fee and expense information, the Independent Board Members took into account that in certain instances various factors such as: the limited size and particular composition of the Peer Universe (including the inclusion of other Nuveen funds in the peer set); expense anomalies; changes in the funds comprising the Peer Universe from year to year; levels of reimbursement or fee waivers; the timing of information used; the differences in the type and use of leverage; and differences in the states reflected in the Peer Universe may impact the comparative data, thereby limiting somewhat the ability to make a meaningful comparison with peers.
In reviewing the fee schedule for a Fund, the Independent Board Members also considered the fund-level and complex-wide breakpoint schedules (described in further detail below) and any fee waivers and reimbursements provided by Nuveen (applicable, in particular, for certain closed-end funds launched since 1999). In reviewing fees and expenses (excluding leverage costs and leveraged assets), the Board considered the expenses and fees to be higher if they were over 10 basis points higher, slightly higher if they were approximately 6 to 10 basis points higher, in line if they were within approximately 5 basis points higher than the peer average and below if they were below the peer average of the Peer Universe. In reviewing the reports, the Board noted that the overwhelming majority of the Nuveen funds were at, close to or below their peer set average based on the net total expense ratio.
The Independent Board Members noted that the Funds each had net management fees and net expense ratios (including fee waivers and expense reimbursements) below their respective peer averages.
Based on their review of the fee and expense information provided, the Independent Board Members determined that each Fund’s management fees were reasonable in light of the nature, extent and quality of services provided to the Fund.
2. Comparisons with the Fees of Other Clients
The Independent Board Members further reviewed information regarding the nature of services and range of fees offered by the Advisor to other clients, including municipal separately managed accounts and passively managed exchange traded funds (ETFs) sub-advised by the Advisor. In evaluating the comparisons of fees, the Independent Board Members noted that the fee rates charged to the Funds and other clients vary, among other things, because of the different services involved
and the additional regulatory and compliance requirements associated with registered investment companies, such as the Funds. Accordingly, the Independent Board Members considered the differences in the product types, including, but not limited to, the services provided, the structure and operations, product distribution and costs thereof, portfolio investment policies, investor profiles, account sizes and regulatory requirements. The Independent Board Members noted, in particular, that the range of services provided to the Funds (as discussed above) is much more extensive than that provided to separately managed accounts. Given the inherent differences in the various products, particularly the extensive services provided to the Funds, the Independent Board Members believe such facts justify the different levels of fees.
In considering the fees of the Sub-Advisor, the Independent Board Members also considered the pricing schedule or fees that the Sub-Advisor charges for similar investment management services for other Nuveen funds, funds of other sponsors (if any), and other clients (such as retail and/or institutional managed accounts).
3. Profitability of Fund Advisers
In conjunction with their review of fees, the Independent Board Members also considered the profitability of Nuveen for its advisory activities and its financial condition. The Independent Board Members reviewed the revenues and expenses of Nuveen’s advisory activities for the last two calendar years, the allocation methodology used in preparing the profitability data and an analysis of the key drivers behind the changes in revenues and expenses that impacted profitability in 2011. The Independent Board Members noted this information supplemented the profitability information requested and received during the year to help keep them apprised of developments affecting profitability (such as changes in fee waivers and expense reimbursement commitments). In this regard, the Independent Board Members noted that they have an Independent Board Member serve as a point person to review and keep them apprised of changes to the profitability analysis and/or methodologies during the year. The Independent Board Members also considered Nuveen’s revenues for advisory activities, expenses, and profit margin compared to that of various unaffiliated management firms with comparable assets under management (based on asset size and asset composition).
In reviewing profitability, the Independent Board Members recognized the Advisor’s continued investment in its business to enhance its services, including capital improvements to investment technology, updated compliance systems, and additional personnel in compliance, risk management, and product development as well as its ability to allocate resources to various areas of the Advisor as the need arises. In addition, in evaluating profitability, the Independent Board Members also recognized the subjective nature of determining profitability which may be affected by numerous factors including the allocation of expenses. Further, the Independent Board Members recognized the difficulties in making comparisons as the profitability of other advisers generally is not publicly available and the profitability information
Annual Investment Management Agreement
Approval Process (Unaudited) (continued)
that is available for certain advisers or management firms may not be representative of the industry and may be affected by, among other things, the adviser’s particular business mix, capital costs, types of funds managed and expense allocations. Notwithstanding the foregoing, the Independent Board Members reviewed Nuveen’s methodology and assumptions for allocating expenses across product lines to determine profitability. In reviewing profitability, the Independent Board Members recognized Nuveen’s investment in its fund business. Based on their review, the Independent Board Members concluded that the Advisor’s level of profitability for its advisory activities was reasonable in light of the services provided.
With respect to sub-advisers affiliated with Nuveen, including the Sub-Advisor, the Independent Board Members reviewed the sub-adviser’s revenues, expenses and profitability margins (pre- and post-tax) for its advisory activities and the methodology used for allocating expenses among the internal sub-advisers. Based on their review, the Independent Board Members were satisfied that the Sub-Advisor’s level of profitability was reasonable in light of the services provided.
In evaluating the reasonableness of the compensation, the Independent Board Members also considered other amounts paid to a Fund Adviser by the Funds as well as any indirect benefits (such as soft dollar arrangements, if any) the Fund Adviser and its affiliates receive, or are expected to receive, that are directly attributable to the management of the Funds, if any. See Section E below for additional information on indirect benefits a Fund Adviser may receive as a result of its relationship with the Funds. Based on their review of the overall fee arrangements of each Fund, the Independent Board Members determined that the advisory fees and expenses of the respective Fund were reasonable.
D. Economies of Scale and Whether Fee Levels Reflect These Economies of Scale
With respect to economies of scale, the Independent Board Members have recognized the potential benefits resulting from the costs of a fund being spread over a larger asset base, although economies of scale are difficult to measure and predict with precision, particularly on a fund-by-fund basis. One method to help ensure the shareholders share in these benefits is to include breakpoints in the advisory fee schedule. Generally, management fees for funds in the Nuveen complex are comprised of a fund-level component and a complex-level component, subject to certain exceptions. Accordingly, the Independent Board Members reviewed and considered the applicable fund-level breakpoints in the advisory fee schedules that reduce advisory fees as asset levels increase. Further, the Independent Board Members noted that although closed-end funds may from time-to-time make additional share offerings, the growth of their assets will occur primarily through the appreciation of such funds’ investment portfolio.
In addition to fund-level advisory fee breakpoints, the Board also considered the Funds’ complex-wide fee arrangement. Pursuant to the complex-wide fee arrangement, the fees of the funds in the Nuveen complex are generally reduced as the assets in the fund complex reach certain levels. The complex-wide fee arrangement seeks to provide the benefits of economies of scale to fund shareholders when total fund complex assets increase, even if assets of a particular fund are unchanged or have decreased. The approach reflects the notion that some of Nuveen’s costs are attributable to services provided to all its funds in the complex and therefore all funds benefit if these costs are spread over a larger asset base. In addition, with the acquisition of the funds previously advised by FAF Advisors, Inc., the Board noted that a portion of such funds’ assets at the time of acquisition were deemed eligible to be included in the complex-wide fee calculation in order to deliver fee savings to shareholders in the combined complex and such funds were subject to differing complex-level fee rates.
Based on their review, the Independent Board Members concluded that the breakpoint schedules and complex-wide fee arrangement were acceptable and reflect economies of scale to be shared with shareholders when assets under management increase.
E. Indirect Benefits
In evaluating fees, the Independent Board Members received and considered information regarding potential “fall out” or ancillary benefits the respective Fund Adviser or its affiliates may receive as a result of its relationship with each Fund. In this regard, the Independent Board Members considered any revenues received by affiliates of the Advisor for serving as co-manager in initial public offerings of new closed-end funds as well as revenues received in connection with secondary offerings.
In addition to the above, the Independent Board Members considered whether the Fund Advisers received any benefits from soft dollar arrangements whereby a portion of the commissions paid by a Fund for brokerage may be used to acquire research that may be useful to the Fund Adviser in managing the assets of the Funds and other clients. The Independent Board Members recognized that each Fund Adviser has the authority to pay a higher commission in return for brokerage and research services if it determines in good faith that the commission paid is reasonable in relation to the value of the brokerage and research services provided and may benefit from such soft dollar arrangements. Similarly, the Board recognized that the research received pursuant to soft dollar arrangements by a Fund Adviser may also benefit a Fund and shareholders to the extent the research enhances the ability of the Fund Adviser to manage the Fund. The Independent Board Members noted that the Fund Advisers’ profitability may be somewhat lower if they did not receive the research services pursuant to the soft dollar arrangements and had to acquire such services directly.
Based on their review, the Independent Board Members concluded that any indirect benefits received by a Fund Adviser as a result of its relationship with the Funds were reasonable and within acceptable parameters.
Annual Investment Management Agreement
Approval Process (Unaudited) (continued)
F. Other Considerations
The Independent Board Members did not identify any single factor discussed previously as all-important or controlling. The Board Members, including the Independent Board Members, unanimously concluded that the terms of each Advisory Agreement are fair and reasonable, that the respective Fund Adviser’s fees are reasonable in light of the services provided to each Fund and that the Advisory Agreements be renewed.
Reinvest Automatically,
Easily and Conveniently
Nuveen makes reinvesting easy. A phone call is all it takes to set up your reinvestment account.
Nuveen Closed-End Funds Automatic Reinvestment Plan
Your Nuveen Closed-End Fund allows you to conveniently reinvest distributions in additional Fund shares.
By choosing to reinvest, you’ll be able to invest money regularly and automatically, and watch your investment grow through the power of compounding. Just like distributions in cash, there may be times when income or capital gains taxes may be payable on distributions that are reinvested.
It is important to note that an automatic reinvestment plan does not ensure a profit, nor does it protect you against loss in a declining market.
Easy and convenient
To make recordkeeping easy and convenient, each month you’ll receive a statement showing your total distributions, the date of investment, the shares acquired and the price per share, and the total number of shares you own.
How shares are purchased
The shares you acquire by reinvesting will either be purchased on the open market or newly issued by the Fund. If the shares are trading at or above net asset value at the time of valuation, the Fund will issue new shares at the greater of the net asset value or 95% of the then-current market price. If the shares are trading at less than net asset value, shares for your account will be purchased on the open market. If the Plan Agent begins purchasing Fund shares on the open market while shares are trading below net asset value, but the Fund’s shares subsequently trade at or above their net asset value before the Plan Agent is able to complete its purchases, the Plan Agent may cease open-market purchases and may invest the uninvested portion of the distribution in newly-issued Fund shares at a price equal to the greater of the shares’ net asset value or 95% of the shares’ market value on the last business day immediately prior to the purchase date. Distributions received to purchase shares in the open market will normally be invested shortly after the distribution payment date. No interest will be paid on distributions awaiting reinvestment. Because the market price of the shares may increase before purchases are completed, the average purchase price per share may
Reinvest Automatically,
Easily and Conveniently (continued)
exceed the market price at the time of valuation, resulting in the acquisition of fewer shares than if the distribution had been paid in shares issued by the Fund. A pro rata portion of any applicable brokerage commissions on open market purchases will be paid by Plan participants. These commissions usually will be lower than those charged on individual transactions.
Flexible
You may change your distribution option or withdraw from the Plan at any time, should your needs or situation change.
You can reinvest whether your shares are registered in your name, or in the name of a brokerage firm, bank, or other nominee. Ask your investment advisor if his or her firm will participate on your behalf. Participants whose shares are registered in the name of one firm may not be able to transfer the shares to another firm and continue to participate in the Plan.
The Fund reserves the right to amend or terminate the Plan at any time. Although the Fund reserves the right to amend the Plan to include a service charge payable by the participants, there is no direct service charge to participants in the Plan at this time.
Call today to start reinvesting distributions
For more information on the Nuveen Automatic Reinvestment Plan or to enroll in or withdraw from the Plan, speak with your financial advisor or call us at (800) 257-8787.
Glossary of Terms
Used in this Report
| ■ | Auction Rate Bond: An auction rate bond is a security whose interest payments are adjusted periodically through an auction process, which process typically also serves as a means for buying and selling the bond. Auctions that fail to attract enough buyers for all the shares offered for sale are deemed to have “failed,” with current holders receiving a formula-based interest rate until the next scheduled auction. |
| | |
| ■ | Average Annual Total Return: This is a commonly used method to express an investment’s performance over a particular, usually multi-year time period. It expresses the return that would have been necessary each year to equal the investment’s actual cumulative performance (including change in NAV or market price and reinvested dividends and capital gains distributions, if any) over the time period being considered. |
| | |
| ■ | Effective Leverage: Effective leverage is a Fund’s effective economic leverage, and includes both regulatory leverage and the leverage (see below) effects of certain derivative investments in the Fund’s portfolio. Currently, the leverage effects of Tender Option Bond (TOB) inverse floater holdings are included in effective leverage values, in addition to any regulatory leverage. |
| | |
| ■ | Inverse Floating Rate Securities: Inverse floating rate securities, also known as inverse floaters or tender option bonds (TOBs), are created by depositing a municipal bond, typically with a fixed interest rate, into a special purpose trust created by a broker-dealer. This trust, in turn, (a) issues floating rate certificates typically paying short-term tax-exempt interest rates to third parties in amounts equal to some fraction of the deposited bond’s par amount or market value, and (b) issues an inverse floating rate certificate (sometimes referred to as an “inverse floater”) to an investor (such as a Fund) interested in gaining investment exposure to a long-term municipal bond. The income received by the holder of the inverse floater varies inversely with the short-term rate paid to the floating rate certificates’ holders, and in most circumstances the holder of the inverse floater bears substantially all of the underlying bond’s downside investment risk. The holder of the inverse floater typically also benefits disproportionately from any potential appreciation of the underlying bond’s value. Hence, an inverse floater essentially represents an investment in the underlying bond on a leveraged basis. |
| | |
| ■ | Leverage: Using borrowed money to invest in securities or other assets, seeking to increase the return of an investment or portfolio. |
| | |
| ■ | Lipper California Municipal Debt Funds Classification Average: Calculated using the returns of all closed-end funds in this category. Lipper returns account for the effects of management fees and assume reinvestment of distributions, but do not reflect any applicable sales charges or management fees. |
Glossary of Terms
Used in this Report (continued)
| ■ | Lipper General and Insured Unleveraged Municipal Debt Funds Classification Average: Calculated using the returns of all closed-end funds in this category. Lipper returns account for the effects of management fees and assume reinvestment of distributions, but do not reflect any applicable sales charges or management fees. |
| | |
| ■ | Lipper New York Municipal Debt Funds Classification Average: Calculated using the returns of all closed-end funds in this category. Lipper returns account for the effects of management fees and assume reinvestment of distributions, but do not reflect any applicable sales charges or management fees. |
| | |
| ■ | Market Yield (also known as Dividend Yield or Current Yield): An investment’s current annualized dividend divided by its current market price. |
| | |
| ■ | Net Asset Value (NAV): The net market value of all securities held in a portfolio. |
| | |
| ■ | Net Asset Value (NAV) Per Share: The market value of one share of a mutual fund or closed-end fund. For a Fund, the NAV is calculated daily by taking the Fund’s total assets (securities, cash, and accrued earnings), subtracting the Fund’s liabilities, and dividing by the number of shares outstanding. |
| | |
| ■ | Pre-Refunding: Pre-Refunding, also known as advanced refundings or refinancings, is a procedure used by state and local governments to refinance municipal bonds to lower interest expenses. The issuer sells new bonds with a lower yield and uses the proceeds to buy U.S. Treasury securities, the interest from which is used to make payments on the higher-yielding bonds. Because of this collateral, pre-refunding generally raises a bond’s credit rating and thus its value. |
| | |
| ■ | Regulatory Leverage: Regulatory Leverage consists of preferred shares issued by or borrowings of a Fund. Both of these are part of a Fund’s capital structure. Regulatory leverage is sometimes referred to as “’40 Act Leverage” and is subject to asset coverage limits set in the Investment Company Act of 1940. |
| | |
| ■ | S&P California Municipal Bond Index: An unleveraged, market value weighted index designed to measure the performance of the tax-exempt, investment grade California municipal bond market. Index returns assume reinvestment of distributions, but do not reflect any applicable sales charges or management fees. |
| | |
| ■ | S&P Municipal Bond Index: An unleveraged, market value weighted index designed to measure the performance of the tax-exempt, investment grade U.S. municipal bond market. Index returns assume reinvestment of distributions, but do not reflect any applicable sales charges or management fees. |
| | |
| ■ | S&P New York Municipal Bond Index: An unleveraged, market value weighted index designed to measure the performance of the tax-exempt, investment grade New York municipal bond market. Index returns assume reinvestment of distributions, but do not reflect any applicable sales charges or management fees. |
| ■ | Taxable-Equivalent Yield: The yield necessary from a fully taxable investment to equal, on an after-tax basis, the yield of a municipal bond investment. |
| | |
| ■ | Zero Coupon Bond: A zero coupon bond does not pay a regular interest coupon to its holders during the life of the bond. Tax-exempt income to the holder of the bond comes from accretion of the difference between the original purchase price of the bond at issuance and the par value of the bond at maturity and is effectively paid at maturity. The market prices of zero coupon bonds generally are more volatile than the market prices of bonds that pay interest periodically. |
Notes
Additional Fund Information
| Board of Trustees |
| John P. Amboian |
| Robert P. Bremner |
| Jack B. Evans |
| William C. Hunter |
| David J. Kundert |
| William J. Schneider |
| Judith M. Stockdale |
| Carole E. Stone |
| Virginia L. Stringer |
| Terence J. Toth |
| |
| Fund Manager |
| Nuveen Fund Advisors, Inc. |
| 333 West Wacker Drive |
| Chicago, IL 60606 |
| |
| Custodian |
| State Street Bank |
| & Trust Company |
| Boston, MA |
| |
| Transfer Agent and |
| Shareholder Services |
| State Street Bank |
| & Trust Company |
| Nuveen Funds |
| P.O. Box 43071 |
| Providence, RI 02940-3071 |
| (800) 257-8787 |
| |
| Legal Counsel |
| Chapman and Cutler LLP |
| Chicago, IL |
| |
| Independent Registered |
| Public Accounting Firm |
| Ernst & Young LLP |
| Chicago, IL |
Quarterly Portfolio of Investments and Proxy Voting Information
You may obtain (i) each Fund’s quarterly portfolio of investments, (ii) information regarding how the Funds voted proxies relating to portfolio securities held during the most recent twelve-month period ended June 30, and (iii) a description of the policies and procedures that the Funds used to determine how to vote proxies relating to portfolio securities without charge, upon request, by calling Nuveen Investments toll-free at (800) 257-8787 or on Nuveen’s website at www.nuveen.com.
You may also obtain this and other Fund information directly from the Securities and Exchange Commission (SEC). The SEC may charge a copying fee for this information. Visit the SEC on-line at http://www.sec.gov or in person at the SEC’s Public Reference Room in Washington, D.C. Call the SEC at (202) 942-8090 for room hours and operation. You may also request Fund information by sending an e-mail request to publicinfo@sec.gov or by writing to the SEC’s Public References Section at 100 F Street NE, Washington, D.C. 20549.
CEO Certification Disclosure
Each Fund’s Chief Executive Officer has submitted to the New York Stock Exchange (NYSE) the annual CEO certification as required by Section 303A.12(a) of the NYSE Listed Company Manual.
Each Fund has filed with the SEC the certification of its Chief Executive Officer and Chief Financial Officer required by Section 302 of the Sarbanes-Oxley Act.
Share Information
Each Fund intends to repurchase shares of its own common stock in the future at such times and in such amounts as is deemed advisable. During the period covered by this report, the Funds did not repurchase any of their common shares.
Any future repurchases will be reported to shareholders in the next annual or semiannual report.
Nuveen Investments:
Serving Investors for Generations
Since 1898, financial advisors and their clients have relied on Nuveen Investments to provide dependable investment solutions through continued adherence to proven, long-term investing principles. Today, we offer a range of high quality equity and fixed-income solutions designed to be integral components of a well-diversified core portfolio.
Focused on meeting investor needs.
Nuveen Investments provides high-quality investment services designed to help secure the long-term goals of institutional and individual investors as well as the consultants and financial advisors who serve them. Nuveen Investments markets a wide range of specialized investment solutions which provide investors access to capabilities of its high-quality boutique investment affiliates—Nuveen Asset Management, Symphony Asset Management, NWQ Investment Management Company, Santa Barbara Asset Management, Tradewinds Global Investors, Winslow Capital Management and Gresham Investment Management. In total, Nuveen Investments managed $220 billion as of September 30, 2012.
Find out how we can help you.
To learn more about how the products and services of Nuveen Investments may be able to help you meet your financial goals, talk to your financial advisor, or call us at (800) 257-8787. Please read the information provided carefully before you invest. Investors should consider the investment objective and policies, risk considerations, charges and expenses of any investment carefully. Where applicable, be sure to obtain a prospectus, which contains this and other relevant information. To obtain a prospectus, please contact your securities representative or Nuveen Investments, 333 W. Wacker Dr., Chicago, IL 60606. Please read the prospectus carefully before you invest or send money.
Learn more about Nuveen Funds at: www.nuveen.com/cef
Distributed by
Nuveen Securities, LLC
333 West Wacker Drive
Chicago, IL 60606
www.nuveen.com
ESA-B-0912D