Washington, D.C. 20549
Kevin J. McCarthy
Form N-CSR is to be used by management investment companies to file reports with the Commission not later than 10 days after the transmission to stockholders of any report that is required to be transmitted to stockholders under Rule 30e-1 under the Investment Company Act of 1940 (17 CFR 270.30e-1). The Commission may use the information provided on Form N-CSR in its regulatory, disclosure review, inspection, and policymaking roles.
A registrant is required to disclose the information specified by Form N-CSR, and the Commission will make this information public. A registrant is not required to respond to the collection of information contained in Form N-CSR unless the Form displays a currently valid Office of Management and Budget ("OMB") control number. Please direct comments concerning the accuracy of the information collection burden estimate and any suggestions for reducing the burden to Secretary, Securities and Exchange Commission, 450 Fifth Street, NW, Washington, DC 20549-0609. The OMB has reviewed this collection of information under the clearance requirements of 44 U.S.C. ss. 3507.
ITEM 1. REPORTS TO STOCKHOLDERS.
Life is Complex
Nuveen makes things e-simple.
It only takes a minute to sign up for e-Reports. Once enrolled, you’ll receive an e-mail as soon as your Nuveen Investments Fund information is ready—no more waiting for delivery by regular mail. Just click on the link within the e-mail to see the report and save it on your computer if you wish.
Free e-Reports right to your e-mail!
www.investordelivery.com
If you receive your Nuveen Fund dividends and statements from your financial advisor or brokerage account.
or
www.nuveen.com/accountaccess
If you receive your Nuveen Fund dividends and statements directly from Nuveen.
Table of Contents
| Chairman’s Letter to Shareholders | 4 |
| | |
| Portfolio Managers’ Comments | 5 |
| | |
| Fund Leverage | 10 |
| | |
| Share Information | 11 |
| | |
| Risk Considerations | 13 |
| | |
| Performance Overview and Holding Summaries | 14 |
| | |
| Shareholder Meeting Report | 19 |
| | |
| Portfolios of Investments | 20 |
| | |
| Statement of Assets and Liabilities | 53 |
| | |
| Statement of Operations | 54 |
| | |
| Statement of Changes in Net Assets | 55 |
| | |
| Financial Highlights | 58 |
| | |
| Notes to Financial Statements | 64 |
| | |
| Annual Investment Management Agreement Approval Process | 72 |
| | |
| Reinvest Automatically, Easily and Conveniently | 81 |
| | |
| Glossary of Terms Used in this Report | 82 |
| | |
| Additional Fund Information | 87 |
Chairman’s Letter to Shareholders
Dear Shareholders,
I am pleased to have this opportunity to introduce myself to you as the new independent chairman of the Nuveen Fund Board, effective July 1, 2013. I am honored to have been selected as chairman, with its primary responsibility to serve the interests of the Nuveen Fund shareholders. My predecessor, Robert Bremner, was the first independent director to serve as chairman of the Board and I, and my fellow Board members, plan to continue his legacy of strong independent oversight of your funds.
The global economy has hit major turning points over the last several months to a year. The developed world is gradually recovering from their financial crisis while the emerging markets appear to be struggling with the downshift of China’s growth potential. Japan is entering a new era of growth after decades of economic stagnation and many of the Eurozone nations appear to be exiting their recession. Despite the positive events, there are still potential risks. Middle East tensions, rising oil prices, defaults in Europe and fallout from the financial stress in emerging markets could all reverse the recent progress in the global economy.
On the domestic front, the U.S. economy is experiencing sustainable slow growth. Corporate fundamentals are strong as earnings per share and corporate cash are at the highest level in two decades. Unemployment is trending down and the housing market has experienced a rebound, each assisting the positive economic scenario. However, there are some issues to be watched. Interest rates are expected to increase but significant uncertainty about the timing remains. Partisan politics in Washington D.C. with their troublesome outcome add to the uncertainties that could cause problems for the economy going forward.
In the near term, governments are focused on economic recovery and the growth of their economies, which could lead to an environment of attractive investment opportunities. Over the long term, the uncertainties mentioned earlier could hinder the potential growth. Because of this, Nuveen’s investment management teams work hard to balance return and risk with a range of investment strategies. I encourage you to read the following commentary on the management of your fund.
On behalf of the other members of the Nuveen Fund Board, we look forward to continuing to earn your trust in the months and years ahead.
Sincerely,
William J. Schneider
Chairman of the Nuveen Fund Board
November 22, 2013
Portfolio Managers’ Comments
Nuveen Select Tax-Free Income Portfolio (NXP)
Nuveen Select Tax-Free Income Portfolio 2 (NXQ)
Nuveen Select Tax-Free Income Portfolio 3 (NXR)
Nuveen California Select Tax-Free Income Portfolio (NXC)
Nuveen New York Select Tax-Free Income Portfolio (NXN)
These Portfolios feature management by Nuveen Asset Management, LLC, an affiliate of Nuveen Investments. Portfolio managers Thomas C. Spalding, CFA, and Scott R. Romans, PhD, review key investment strategies and the six-month performance of the Nuveen Select Portfolios. Tom has managed the three national Portfolios since 1999, while Scott has managed NXC since 2003 and NXN since 2011.
What key strategies were used to manage the Nuveen Select Portfolios during the six-month reporting period ended September 30, 2013?
During this reporting period, uncertainty about the next step for the Federal Reserve’s quantitative easing program and the potential impact on the economy and financial markets led to increased market volatility. Ongoing political debate over federal spending and headline credit stories involving Detroit and Puerto Rico also contributed to an unsettled environment and prompted an increase in selling by bondholders across the municipal market. Given this backdrop, municipal bond prices generally declined during this period, while the yield curve steepened. We continued to take a bottom-up approach to discovering sectors that appeared undervalued as well as individual credits that had the potential to perform well over the long term and helped us keep our Portfolios fully invested.
During this reporting period, NXP, NXQ and NXR found value in diversified areas of the market and included adding bonds with competitive yields to help support the Portfolios’ income streams. As part of this strategy we participated in the $2 billion new offering of bonds issued for the Grand Parkway in Houston, Texas, which, when completed will be the longest beltway in the U.S., at 184 miles. The BBB+ rated bonds provided funding for construction of 55 miles of new tollway, with traffic projected to be 90% commuter-based. The new section of tollway, which is expected to be completed in 2016, will provide congestion relief for the Houston area, currently the sixth most congested urban area in the country. All three Portfolios also purchased BB-rated bonds that were part of the $1.2 billion new issue by the Iowa Finance Authority for the Iowa Fertilizer Company project. These bonds will fund the construction of a nitrogen fertilizer plant located in southeast Iowa with a production capacity of 1.6 million tons per year. With growing demand
| Certain statements in this report are forward-looking statements. Discussions of specific investments are for illustration only and are not intended as recommendations of individual investments. The forward-looking statements and other views expressed herein are those of the portfolio managers as of the date of this report. Actual future results or occurrences may differ significantly from those anticipated in any forward-looking statements, and the views expressed herein are subject to change at any time, due to numerous market and other factors. The Funds disclaim any obligation to update publicly or revise any forward-looking statements or views expressed herein. |
Ratings shown are the highest rating given by one of the following national rating agencies: Standard & Poor’s, Moody’s Investors Service, Inc. or Fitch, Inc. Credit ratings are subject to change. AAA, AA, A, and BBB are investment grade ratings; BB, B, CCC, CC, C and D are below investment grade ratings. Certain bonds backed by U.S. government or agency securities are regarded as having an implied rating equal to the rating of such securities. Holdings designated N/R are not rated by these national rating agencies.
Portfolio Managers’ Comments (continued)
for nitrogen fertilizer in the U.S., 50% of which is currently supplied by imports, we believe this project is well positioned competitively because it is U.S. based, will offer reduced transportation costs and has access to cheaper sources of natural gas than foreign producers. During this reporting period, these Portfolios also added BBB-rated bonds issued by the Dallas based Love Field Airport Modernization Corporation for the Southwest Airlines project, which fund renovations at Love Field, including a new centralized concourse with 20 gates, a remodeled lobby, expanded baggage claim area and new ticketing wing. Aside from these new issues, our purchases for these Portfolios were largely made in the secondary market.
In NXC and NXN, we primarily focused on three strategies intended to enhance these Portfolios’ positioning and potentially increase income distribution. The first of these strategies involved purchasing bonds that we believed had the best prospects for advanced refunding, that is, bonds with higher coupons or slightly shorter calls. Carrying out this strategy did not involve selling bonds from our portfolios; instead we were reinvesting the proceeds from called bonds. The addition of these bonds enhanced the credit quality of our portfolios, provided higher levels of liquidity and reduced interest rate sensitivity. Once interest rates started to rise, our focus shifted to bond swaps. Virtually all of the bonds we added to our portfolios in 2012 and early 2013 were purchased at significant premiums. Because tax laws require that premiums be amortized, this reduces the amount of income available for distribution from the coupon. By executing a bond swap in a rising interest rate environment, the expense of amortization is basically converted into a capital loss, so that more of the income from the coupon can be distributed to shareholders. Most of the bonds we swapped offered similar risk characteristics and often involved the same credit, but with different maturity dates. An additional benefit of this strategy was the tax loss carry-forwards that can be used to offset future capital gains.
The third strategy involved an approach known as “couponing up.” Couponing up is the process of working to improve the book yields on the Portfolios’ holdings, which enables us to maintain and potentially improve the dividend stream. During this reporting period we sold some of the Portfolios’ holdings with 5% coupons in the 20-year maturity range at attractive prices into strong retail demand. We then used the proceeds from these sales to purchase more recent issuance from 2010-2011 with higher coupons (e.g., 5.75% to 6.50%). These bonds ultimately provide a more defensive structure and potentially enable us to increase income distributions. Strong retail bids for redevelopment agency and community facilities district bonds in California and general issuers such as Metropolitan Transportation Authority in New York helped us execute this strategy in NXC and NXN.
During this reporting period, NXP, NXQ and NXR also focused on bonds with longer maturities to take advantage of a steep municipal yield curve. This enabled these Portfolios to add more attractive yields further out on the curve and also supplied some protection for the Portfolios’ duration and yield curve positioning. The bond calls also had an impact on the Portfolios’ durations, since the bonds called as part of current refundings were priced to short calls and therefore had negligible durations. Although it was not a strategy, reinvesting these call proceeds in anything other than cash had the effect of extending durations. In terms of credit quality, the national Portfolios generally found better opportunities in single-A and BBB-rated bonds and we reinvested much of our call proceeds into these
categories. NXC and NXN also added to lower rated holdings, specifically bonds rated A and BBB and lower in NXC and single-A and BB-rated bonds and lower in NXN.
Activity during this reporting period was driven primarily by the reinvestment of proceeds from called and matured bonds, which was aimed at keeping the Portfolios fully invested and supporting their income streams. During the first part of this reporting period, we experienced an increased number of current bond calls as a result of an increase in refinancings, which provided a meaningful source of cash flow. In the latter months of the reporting period, as interest rates rose, refinancing activity declined. However, we continued to receive cash generated by maturing bonds, which we were able to reinvest at higher yields and lower prices in the rising rate environment. As the supply of new paper associated with the refinancings declined, we focused on the secondary market for the majority of our purchases. Other than the sales involved in NXC’s and NXN’s execution of the strategies described above, selling was minimal during this reporting period.
As of September 30, 2013, all five of these Portfolios continued to use inverse floating rate securities. We employ inverse floaters for a variety of reasons, including duration management, income enhancement and total return enhancement.
How did the Portfolios perform during the six-month reporting period ended September 30, 2013?
The tables in each Portfolio’s Performance Overview and Holding Summaries section of this report provide the Portfolios’ returns for the six-month, one-year, five-year and ten-year periods ended September 30, 2013. Each Portfolio’s returns are compared with the performance of a corresponding market index and Lipper classification average.
For the six months ended September 30, 2013, the cumulative returns on net asset value (NAV) for the three national Select Portfolios underperformed the return for the national S&P Municipal Bond Index, and NXC and NXN underper-formed the returns on their respective state’s S&P Municipal Bond Index. For this same period, NXP, NXQ and NXR trailed the average return for the Lipper General and Insured Unleveraged Municipal Debt Funds Classification Average, while both NXC and NXN exceeded the returns on their respective state Lipper averages. Key management factors that influenced the Portfolios’ returns during this reporting period included yield curve and duration positioning, credit exposure and sector allocation.
As interest rates rose and the yield curve steepened, municipal bonds with shorter maturities generally outperformed those with longer maturities. Overall, credits at the shortest end of the municipal yield curve posted the best returns, while bonds at the longest end produced the weakest results. For the reporting period, the durations of all these Portfolios exceeded their duration targets. As a result, duration and yield curve positioning was the major factor detracting from the Portfolios’ performance.
Credit exposure also factored into the Portfolios’ performance, as events in the municipal market led investors to avoid risk and credit spreads, or the difference in yield spreads between U.S. Treasury securities and comparable investments such as municipal bonds, began to widen. For the reporting period, higher quality bonds generally outperformed lower quality bonds, specifically bonds rated single-A, BBB or lower. In NXC and NXN, allocations of
Portfolio Managers’ Comments (continued)
bonds rated B and those rated BB, respectively, had the largest negative impact on performance. Credit exposure was less of a performance factor in the three national Portfolios.
After underperforming for many months, pre-refunded bonds, which are often backed by U.S. Treasury securities, were among the best performing market segments. The outperformance of these bonds can be attributed primarily to their shorter effective maturities and higher credit quality. During this reporting period, the three national Portfolios tended to be overweighted in pre-refunded bonds relative to the market average, which helped their investment performance, while NXC and NXN had smaller allocations of pre-refunded bonds. General obligation credits, housing bonds, and in the California market, redevelopment agency (RDA) and tax increment financing (TIF) district bonds also typically outperformed the general municipal market. NXC’s overweight in TIF credits benefited its performance during the reporting period.
In contrast, revenue bonds as a whole underperformed the municipal market. Among the revenue sectors that generally lagged municipal market performance by the widest margins for this reporting period were industrial development revenue (IDR), health care (including hospitals), utilities, transportation and water and sewer. Tobacco credits backed by the 1998 master tobacco settlement agreement also were among the poorest performing market sectors, due in part to their longer effective durations, lower credit ratings and the tendency of investors to avoid risk. As of September 30, 2013, NXQ and NXR had the heaviest weightings of lower rated tobacco bonds and NXN held the fewest of these credits.
During this reporting period, two noteworthy credit events weighed on the municipal market. On July 18, 2013, the City of Detroit filed for Chapter 9 in federal bankruptcy court. Detroit, burdened by decades of population loss, changes in the auto manufacturing industry and significant tax base deterioration, has been under severe financial stress for an extended period. Detroit’s bankruptcy filing will likely be a lengthy one, given the complexity of its debt portfolio, number of creditors, numerous union contracts, and significant legal questions that must be addressed. It is not yet clear how this bankruptcy will impact the actual creditworthiness, or the market’s perception of that creditwor-thiness, of other municipalities in Michigan. None of the Portfolios had any exposure to Detroit general obligation (GO) bonds, while the three national Portfolios have small holdings of Detroit water and sewer credits. NXP, NXQ and NXR also purchased additional Detroit water and sewer bonds during the reporting period The recently purchased credits are insured, which adds security and liquidity. During this reporting period, the water and sewer holdings had a negligible impact on the Portfolios’ investment performance due to the Detroit bankruptcy.
Shareholders also should be aware of issues impacting the Portfolios’ Puerto Rico holdings. In 2012, Moody’s downgraded Puerto Rico GO bonds to Baa3 from Baa1 and Puerto Rico Sales Tax Financing Corporation (COFINA) senior sales tax revenue bonds to Aa3 from Aa2 and COFINA subordinate sales tax revenue bonds to A3 from A1. (In October 2013, subsequent to the end of this reporting period, Moody’s further downgraded the COFINA senior sales tax bonds to A2, while affirming the subordinate bonds at A3.) These downgrades were based on Puerto Rico’s ongoing economic problems and, in the case of the COFINA bonds, the impact of these problems on the projected growth of sales tax revenues. However, the COFINA bonds were able to maintain a higher credit rating than the GOs because, unlike the revenue streams supporting some Puerto Rican issues, the sales taxes supporting the COFINA
bonds cannot be diverted and used to support Puerto Rico’s GO bonds. For the reporting period ended September 30, 2013, Puerto Rico paper generally underperformed the municipal market as a whole. NXP, NXQ, NXR and NXC have limited exposure to Puerto Rico bonds, the majority of which are the subordinate sales tax bonds issued by COFINA, which we believe are the best of the Puerto Rico issuance. In addition, much of the Portfolios’ COFINA exposure is insured, which we believe adds a measure of value. NXQ also holds a small position in Puerto Rico housing bonds, and NXR holds insured highway bonds issued by the commonwealth. NXN does not have any exposure to paper issued by Puerto Rico. No Puerto Rico bonds were purchased or sold in the Portfolios during this reporting period. The small nature of their exposure helped to limit the impact of the Puerto Rico bonds’ underperformance on the Portfolios.
Fund Leverage
IMPACT OF THE PORTFOLIOS’ LEVERAGE STRATEGIES ON PERFORMANCE
One important factor impacting the returns of NXP, NXQ, NXR, NXC and NXN relative to their benchmarks was the Portfolios’ use of leverage. The Portfolios use leverage because their managers believe that, over time, leveraging provides opportunities for additional income and total return for shareholders. However, use of leverage also can expose shareholders to additional volatility. For example, as the prices of securities held by a Portfolio decline, the negative impact of these valuation changes on NAV and shareholder total return is magnified by the use of leverage. Conversely, leverage may enhance share returns during periods when the prices of securities held by a Portfolio generally are rising. Leverage had a negative impact on the performance of the Portfolios over this reporting period.
As of September 30, 2013, the Portfolios’ percentages of effective leverage are as shown in the accompanying table.
| | NXP | NXQ | NXR | NXC | NXN | |
| Effective Leverage* | 1.40% | 2.38% | 0.57% | 1.65% | 8.91% | |
| * | Effective Leverage is a Fund’s effective economic leverage, and includes both regulatory leverage and the leverage effects of certain derivative and other investments in a Fund’s portfolio that increase the Fund’s investment exposure. Currently, the leverage effects of Tender Option Bond (TOB) inverse floater holdings are included in effective leverage values. |
Share Information
DIVIDEND INFORMATION
During the current reporting period ended September 30, 2013, the Funds’ monthly dividends to shareholders were as shown in the accompanying table.
| | | Per Share Amounts | |
| | | | NXP | | | NXQ | | | NXR | | | NXC | | | NXN | |
| April | | $ | 0.0525 | | $ | 0.0525 | | $ | 0.0525 | | $ | 0.0570 | | $ | 0.0525 | |
| May | | | 0.0525 | | | 0.0525 | | | 0.0525 | | | 0.0570 | | | 0.0525 | |
| June | | | 0.0525 | | | 0.0525 | | | 0.0525 | | | 0.0570 | | | 0.0525 | |
| July | | | 0.0525 | | | 0.0525 | | | 0.0525 | | | 0.0570 | | | 0.0525 | |
| August | | | 0.0525 | | | 0.0525 | | | 0.0525 | | | 0.0570 | | | 0.0525 | |
| September | | | 0.0525 | | | 0.0525 | | | 0.0525 | | | 0.0570 | | | 0.0525 | |
| | | | | | | | | | | | | | | | | |
| Market Yield** | | | 4.83 | % | | 5.04 | % | | 4.91 | % | | 5.05 | % | | 4.84 | % |
| Taxable-Equivalent Yield** | | | 6.71 | % | | 7.00 | % | | 6.82 | % | | 7.73 | % | | 7.20 | % |
| ** | Market Yield is based on the Fund’s current annualized monthly dividend divided by the Fund’s current market price as of the end of the reporting period. Taxable-Equivalent Yield represents the yield that must be earned on a fully taxable investment in order to equal the yield of the Fund on an after-tax basis. It is based on a combined federal and state income tax rate of 28.0%, 34.7%, and 32.8% for National, California and New York Funds, respectively. When comparing a Fund to investments that generate qualified dividend income, the Taxable-Equivalent Yield is lower. |
All of these Portfolios seek to pay stable dividends at rates that reflect each Portfolio’s past results and projected future performance. During certain periods, each Portfolio may pay dividends at a rate that may be more or less than the amount of net investment income actually earned by the Portfolio during the period. If a Portfolio has cumulatively earned more than it has paid in dividends, it holds the excess in reserve as undistributed net investment income (UNII) as part of the Portfolio’s NAV. Conversely, if a Portfolio has cumulatively paid dividends in excess of its earnings, the excess constitutes negative UNII that is likewise reflected in the Portfolio’s NAV. Each Portfolio will, over time, pay all of its net investment income as dividends to shareholders. As of September 30, 2013, all of the Portfolios in this report had positive UNII balances, based upon our best estimate, for tax purposes and positive UNII balances for financial reporting purposes.
EQUITY SHELF PROGRAMS
The following Portfolios are authorized to issue additional shares through their ongoing equity shelf program. Under this program, each Portfolio, subject to market conditions, may raise additional capital from time to time in varying amounts and offering methods at a net price at or above the Portfolio’s NAV per share.
| | NXP | NXQ | NXR | |
| Additional Shares Authorized | 1,600,000 | 1,700,000 | 1,300,000 | |
During the current reporting period NXP, NXQ and NXR did not sell shares through their equity shelf programs.
Share Information (continued)
Refer to Notes to Financial Statements, Note 1 – General Information and Significant Accounting Policies for further details on the Portfolios’ Equity Shelf Programs.
SHARE REPURCHASES
Since the inception of the Portfolios’ repurchase programs, the Portfolios have not repurchased any of their outstanding shares.
OTHER SHARE INFORMATION
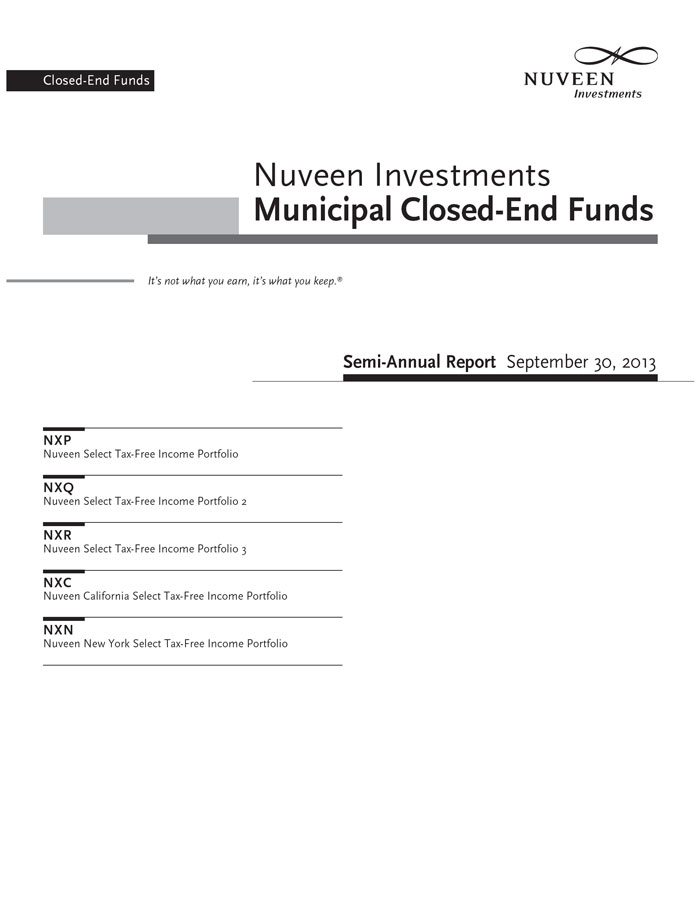
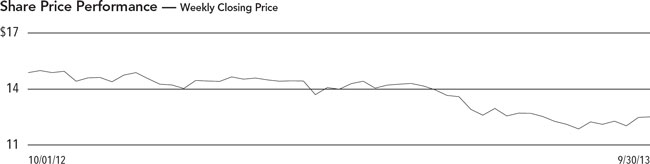
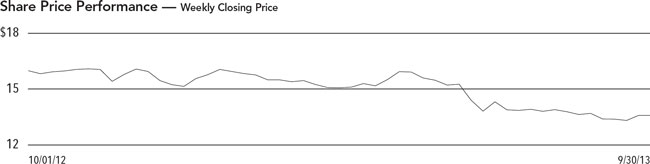
As of September 30, 2013, and during the current reporting period, the share prices of the Portfolios were trading at a premium/(discount) to their NAVs as shown in the accompanying table.
| | | | NXP | | | NXQ | | | NXR | | | NXC | | | NXN | |
| NAV | | $ | 14.02 | | $ | 13.41 | | $ | 13.93 | | $ | 14.62 | | $ | 13.68 | |
| Share Price | | $ | 13.04 | | $ | 12.51 | | $ | 12.82 | | $ | 13.55 | | $ | 13.01 | |
| Premium/(Discount) to NAV | | | (6.99 | )% | | (6.71 | )% | | (7.97 | )% | | (7.32 | )% | | (4.90 | )% |
| 6-Month Average Premium/(Discount) to NAV | | | (5.83 | )% | | (5.28 | )% | | (5.62 | )% | | (4.27 | )% | | (3.57 | )% |
Risk Considerations
Fund shares are not guaranteed or endorsed by any bank or other insured depository institution, and are not federally insured by the Federal Deposit Insurance Corporation. Past performance is no guarantee of future results. Fund shares are subject to a variety of risks, including:
Investment, Price and Market Risk. An investment in shares is subject to investment risk, including the possible loss of the entire principal amount that you invest. Your investment in shares represents an indirect investment in the municipal securities owned by the Fund, which generally trade in the over-the-counter markets. Shares of closed-end investment companies like these Funds frequently trade at a discount to their net asset value (NAV). Your shares at any point in time may be worth less than your original investment, even after taking into account the reinvestment of Fund dividends and distributions.
Tax Risk. The tax treatment of Fund distributions may be affected by new IRS interpretations of the Internal Revenue Code and future changes in tax laws and regulations.
Issuer Credit Risk. This is the risk that a security in a Fund’s portfolio will fail to make dividend or interest payments when due.
Interest Rate Risk. Fixed-income securities such as bonds, preferred, convertible and other debt securities will decline in value if market interest rates rise.
Reinvestment Risk. If market interest rates decline, income earned from a Fund’s portfolio may be reinvested at rates below that of the original bond that generated the income.
Call Risk or Prepayment Risk. Issuers may exercise their option to prepay principal earlier than scheduled, forcing a Fund to reinvest in lower-yielding securities.
Inverse Floater Risk. The Funds may invest in inverse floaters. Due to their leveraged nature, these investments can greatly increase a Fund’s exposure to interest rate risk and credit risk. In addition, investments in inverse floaters involve the risk that the Fund could lose more than its original principal investment.
Leverage Risk. Each Fund’s use of effective leverage creates the possibility of higher volatility for the Fund’s per share NAV, market price, distributions and returns. There is no assurance that a Fund’s leveraging strategy will be successful.
| NXP | |
| | Nuveen Select Tax-Free Income Portfolio |
| | Performance Overview and Holding Summaries as of September 30, 2013 |
Average Annual Total Returns as of September 30, 2013
| | Cumulative | | Average Annual | |
| | 6-Month | | 1-Year | 5-Year | 10-Year | |
| NXP at NAV | (4.65)% | | (2.45)% | 5.73% | 4.50% | |
| NXP at Share Price | (8.76)% | | (15.01)% | 5.00% | 4.47% | |
| S&P Municipal Bond Index | (3.47)% | | (2.25)% | 6.00% | 4.47% | |
| Lipper General and Insured Unleveraged | | | | | | |
| Municipal Debt Funds Classification Average | (4.23)% | | (1.98)% | 5.56% | 4.36% | |
Past performance is not predictive of future results. Current performance may be higher or lower than the data shown. Returns do not reflect the deduction of taxes that shareholders may have to pay on Fund distributions or upon the sale of Fund shares. Comparative index and Lipper return information is provided for the Fund’s shares at NAV only. Indexes and Lipper averages are not available for direct investment.
Portfolio Composition1 | |
| (as a % of total investments) | |
| Health Care | 20.3% |
| Tax Obligation/Limited | 18.4% |
| Transportation | 17.7% |
| U.S. Guaranteed | 12.1% |
| Tax Obligation/General | 11.0% |
| Consumer Staples | 6.2% |
| Utilities | 6.0% |
| Other | 8.3% |
Credit Quality1,2,3 | |
| (as a % of total investment exposure) | |
| AAA/U.S. Guaranteed | 16.0% |
| AA | 30.4% |
| A | 31.4% |
| BBB | 13.2% |
| BB or Lower | 7.0% |
| N/R | 1.3% |
States1 | |
| (as a % of total investments) | |
| California | 14.1% |
| Illinois | 12.8% |
| Texas | 12.7% |
| Colorado | 7.7% |
| New Jersey | 6.5% |
| New York | 5.7% |
| Virginia | 4.1% |
| Michigan | 2.6% |
| Iowa | 2.5% |
| Nevada | 2.4% |
| Missouri | 2.4% |
| Oklahoma | 2.2% |
| New Mexico | 2.2% |
| Florida | 2.2% |
| Other | 19.9% |
Refer to the Glossary of Terms Used in this Report for further definition of the terms used within this page.
| 1 | Holdings are subject to change. |
| 2 | Ratings shown are the highest rating given by one of the following national rating agencies: Standard & Poor’s Group, Moody’s Investors Service, Inc. or Fitch, Inc. Credit ratings are subject to change. AAA, AA, A and BBB are investment grade ratings; BB, B, CCC, CC, C and D are below-investment grade ratings. Certain bonds backed by U.S. Government or agency securities are regarded as having an implied rating equal to the rating of such securities. Holdings designated N/R are not rated by these national rating agencies. |
| 3 | Percentages may not add to 100% due to the exclusion of other assets less liabilities from the table. |
| NXQ | |
| | Nuveen Select Tax-Free Income Portfolio 2 |
| | Performance Overview and Holding Summaries as of September 30, 2013 |
Average Annual Total Returns as of September 30, 2013
| | Cumulative | | Average Annual |
| | 6-Month | | 1-Year | 5-Year | 10-Year | |
| NXQ at NAV | (4.58)% | | (1.78)% | 5.55% | 4.11% | |
| NXQ at Share Price | (8.38)% | | (11.94)% | 4.41% | 4.47% | |
| S&P Municipal Bond Index | (3.47)% | | (2.25)% | 6.00% | 4.47% | |
| Lipper General and Insured Unleveraged | | | | | | |
| Municipal Debt Funds Classification Average | (4.23)% | | (1.98)% | 5.56% | 4.36% | |
Past performance is not predictive of future results. Current performance may be higher or lower than the data shown. Returns do not reflect the deduction of taxes that shareholders may have to pay on Fund distributions or upon the sale of Fund shares. Comparative index and Lipper return information is provided for the Fund’s shares at NAV only. Indexes and Lipper averages are not available for direct investment.
Portfolio Composition1 | |
| (as a % of total investments) | |
| Health Care | 18.0% |
| Tax Obligation/General | 15.7% |
| Transportation | 15.7% |
| Tax Obligation/Limited | 14.0% |
| U.S. Guaranteed | 11.2% |
| Consumer Staples | 7.7% |
| Utilities | 6.6% |
| Other | 11.1% |
Credit Quality1,2,3 | |
| (as a % of total investment exposure) | |
| AAA/U.S. Guaranteed | 19.0% |
| AA | 20.4% |
| A | 33.3% |
| BBB | 13.8% |
| BB or Lower | 6.9% |
| N/R | 5.1% |
States1 | |
| (as a % of total investments) | |
| Texas | 13.4% |
| California | 12.9% |
| Illinois | 12.6% |
| Colorado | 8.1% |
| New York | 7.4% |
| Indiana | 4.8% |
| Ohio | 3.5% |
| Virginia | 3.4% |
| Michigan | 3.1% |
| New Mexico | 3.1% |
| South Carolina | 3.0% |
| Nevada | 2.9% |
| Rhode Island | 2.4% |
| Other | 19.4% |
Refer to the Glossary of Terms Used in this Report for further definition of the terms used within this page.
| 1 | Holdings are subject to change. |
| 2 | Ratings shown are the highest rating given by one of the following national rating agencies: Standard & Poor’s Group, Moody’s Investors Service, Inc. or Fitch, Inc. Credit ratings are subject to change. AAA, AA, A and BBB are investment grade ratings; BB, B, CCC, CC, C and D are below-investment grade ratings. Certain bonds backed by U.S. Government or agency securities are regarded as having an implied rating equal to the rating of such securities. Holdings designated N/R are not rated by these national rating agencies. |
| 3 | Percentage may not add to 100% due to the exclusion of other assets less liabilities from the table. |
| NXR | |
| | Nuveen Select Tax-Free Income Portfolio 3 |
| | Performance Overview and Holding Summaries as of September 30, 2013 |
Average Annual Total Returns as of September 30, 2013
| | Cumulative | | Average Annual |
| | 6-Month | | 1-Year | 5-Year | 10-Year | |
| NXR at NAV | (4.68)% | | (2.45)% | 5.73% | 4.55% | |
| NXR at Share Price | (9.36)% | | (15.20)% | 5.10% | 4.79% | |
| S&P Municipal Bond Index | (3.47)% | | (2.25)% | 6.00% | 4.47% | |
| Lipper General and Insured Unleveraged | | | | | | |
| Municipal Debt Funds Classification Average | (4.23)% | | (1.98)% | 5.56% | 4.36% | |
Past performance is not predictive of future results. Current performance may be higher or lower than the data shown. Returns do not reflect the deduction of taxes that shareholders may have to pay on Fund distributions or upon the sale of Fund shares. Comparative index and Lipper return information is provided for the Fund’s shares at NAV only. Indexes and Lipper averages are not available for direct investment.
Portfolio Composition1 | |
| (as a % of total investments) | |
| Health Care | 18.4% |
| Tax Obligation/Limited | 18.2% |
| Tax Obligation/General | 14.7% |
| Transportation | 14.5% |
| U.S. Guaranteed | 9.9% |
| Consumer Staples | 7.2% |
| Utilities | 6.5% |
| Other | 10.6% |
Credit Quality1,2,3 | |
| (as a % of total investment exposure) | |
| AAA/U.S. Guaranteed | 17.1% |
| AA | 29.1% |
| A | 31.5% |
| BBB | 11.7% |
| BB or Lower | 9.4% |
| N/R | 0.5% |
States1 | |
| (as a % of total investments) | |
| California | 17.6% |
| Illinois | 13.4% |
| Texas | 11.5% |
| Colorado | 7.0% |
| New York | 6.4% |
| Indiana | 4.6% |
| Ohio | 3.9% |
| Virginia | 3.3% |
| Nevada | 2.8% |
| Washington | 2.8% |
| New Mexico | 2.8% |
| Iowa | 2.7% |
| Puerto Rico | 2.4% |
| Other | 18.8% |
Refer to the Glossary of Terms Used in this Report for further definition of the terms used within this page.
| 1 | Holdings are subject to change. |
| 2 | Ratings shown are the highest rating given by one of the following national rating agencies: Standard & Poor’s Group, Moody’s Investors Service, Inc. or Fitch, Inc. Credit ratings are subject to change. AAA, AA, A and BBB are investment grade ratings; BB, B, CCC, CC, C and D are below-investment grade ratings. Certain bonds backed by U.S. Government or agency securities are regarded as having an implied rating equal to the rating of such securities. Holdings designated N/R are not rated by these national rating agencies. |
| 3 | Percentage may not add to 100% due to the exclusion of other assets less liabilities from the table. |
| NXC | |
| | Nuveen California Select Tax-Free Income Portfolio |
| | Performance Overview and Holding Summaries as of September 30, 2013 |
Average Annual Total Returns as of September 30, 2013
| | Cumulative | | Average Annual |
| | 6-Month | | 1-Year | 5-Year | 10-Year | |
| NXC at NAV | (4.85)% | | (1.90)% | 6.73% | 4.91% | |
| NXC at Share Price | (7.91)% | | (11.24)% | 7.28% | 5.15% | |
| S&P Municipal Bond California Index | (3.14)% | | (1.37)% | 6.41% | 4.75% | |
| S&P Municipal Bond Index | (3.47)% | | (2.25)% | 6.00% | 4.47% | |
| Lipper California Municipal Debt Funds Classification Average | (7.28)% | | (4.62)% | 8.20% | 5.10% | |
Past performance is not predictive of future results. Current performance may be higher or lower than the data shown. Returns do not reflect the deduction of taxes that shareholders may have to pay on Fund distributions or upon the sale of Fund shares. Comparative index and Lipper return information is provided for the Fund’s shares at NAV only. Indexes and Lipper averages are not available for direct investment.
Portfolio Composition1 | |
| (as a % of total investments) | |
| Tax Obligation/General | 39.0% |
| Tax Obligation/Limited | 27.0% |
| Health Care | 9.4% |
| Utilities | 6.9% |
| Education and Civic Organizations | 4.0% |
| Other | 13.7% |
Credit Quality1,2,3 | |
| (as a % of total investment exposure) | |
| AAA/U.S. Guaranteed | 3.9% |
| AA | 27.3% |
| A | 47.8% |
| BBB | 9.3% |
| BB or Lower | 4.3% |
| N/R | 4.0% |
Refer to the Glossary of Terms Used in this Report for further definition of the terms used within this page.
| 1 | Holdings are subject to change. |
| 2 | Ratings shown are the highest rating given by one of the following national rating agencies: Standard & Poor’s Group, Moody’s Investors Service, Inc. or Fitch, Inc. Credit ratings are subject to change. AAA, AA, A and BBB are investment grade ratings; BB, B, CCC, CC, C and D are below-investment grade ratings. Certain bonds backed by U.S. Government or agency securities are regarded as having an implied rating equal to the rating of such securities. Holdings designated N/R are not rated by these national rating agencies. |
| 3 | Percentage may not add to 100% due to the exclusion of other assets less liabilities from the table. |
| NXN | |
| | Nuveen New York Select Tax-Free Income Portfolio |
| | Performance Overview and Holding Summaries as of September 30, 2013 |
Average Annual Total Returns as of September 30, 2013
| | Cumulative | | Average Annual |
| | 6-Month | | 1-Year | 5-Year | 10-Year | |
| NXN at NAV | (4.82)% | | (4.13)% | 5.44% | 4.15% | |
| NXN at Share Price | (10.44)% | | (9.35)% | 5.45% | 4.47% | |
| S&P Municipal Bond New York Index | (2.86)% | | (1.89)% | 5.88% | 4.46% | |
| S&P Municipal Bond Index | (3.47)% | | (2.25)% | 6.00% | 4.47% | |
| Lipper New York Municipal Debt Funds Classification Average | (7.40)% | | (6.59)% | (7.05)% | 4.60% | |
Past performance is not predictive of future results. Current performance may be higher or lower than the data shown. Returns do not reflect the deduction of taxes that shareholders may have to pay on Fund distributions or upon the sale of Fund shares. Comparative index and Lipper return information is provided for the Fund’s shares at NAV only. Indexes and Lipper averages are not available for direct investment.
Portfolio Composition1 | |
| (as a % of total investments) | |
| Tax Obligation/Limited | 34.6% |
| Education and Civic Organizations | 15.9% |
| Health Care | 9.1% |
| Utilities | 7.5% |
| Tax Obligation/General | 6.7% |
| Transportation | 5.1% |
| Housing/Single Family | 4.6% |
| U.S. Guaranteed | 4.2% |
| Other | 12.3% |
Credit Quality1,2,3 | |
| (as a % of total investment exposure) | |
| AAA/U.S. Guaranteed | 30.0% |
| AA | 27.6% |
| A | 21.2% |
| BBB | 5.9% |
| BB or Lower | 7.0% |
| N/R | 1.5% |
Refer to the Glossary of Terms Used in this Report for further definition of the terms used within this page.
| 1 | Holdings are subject to change. |
| 2 | Ratings shown are the highest rating given by one of the following national rating agencies: Standard & Poor’s Group, Moody’s Investors Service, Inc. or Fitch, Inc. Credit ratings are subject to change. AAA, AA, A and BBB are investment grade ratings; BB, B, CCC, CC, C and D are below-investment grade ratings. Certain bonds backed by U.S. Government or agency securities are regarded as having an implied rating equal to the rating of such securities. Holdings designated N/R are not rated by these national rating agencies. |
| 3 | Percentage may not add to 100% due to the exclusion of other assets less liabilities from the table. |
| NXP | |
| NXQ | Shareholder Meeting Report The annual meeting of shareholders was held in the offices of Nuveen Investments on August 7, 2013; at this meeting the shareholders were asked to vote on the election of Board Members. |
| NXR |
| NXC |
| NXN | |
| | | | NXP | | | NXQ | | | NXR | | | NXC | | | NXN | |
| | | | Common | | | Common | | | Common | | | Common | | | Common | |
| | | | shares | | | shares | | | shares | | | shares | | | shares | |
| Approval of the Board Members was reached as follows: | | | | | | | | | | | | | | | | |
| William C. Hunter | | | | | | | | | | | | | | | | |
| For | | | 13,705,695 | | | 15,989,558 | | | 11,172,342 | | | 4,653,854 | | | 3,260,743 | |
| Withhold | | | 435,170 | | | 378,497 | | | 282,826 | | | 214,009 | | | 51,565 | |
| Total | | | 14,140,865 | | | 16,368,055 | | | 11,455,168 | | | 4,867,863 | | | 3,312,308 | |
| Judith M. Stockdale | | | | | | | | | | | | | | | | |
| For | | | 13,739,113 | | | 15,939,252 | | | 11,134,348 | | | 4,657,382 | | | 3,257,355 | |
| Withhold | | | 401,752 | | | 428,803 | | | 320,820 | | | 210,481 | | | 54,953 | |
| Total | | | 14,140,865 | | | 16,368,055 | | | 11,455,168 | | | 4,867,863 | | | 3,312,308 | |
| Carole E. Stone | | | | | | | | | | | | | | | | |
| For | | | 13,737,123 | | | 15,958,773 | | | 11,142,190 | | | 4,657,214 | | | 3,257,355 | |
| Withhold | | | 403,742 | | | 409,282 | | | 312,978 | | | 210,649 | | | 54,953 | |
| Total | | | 14,140,865 | | | 16,368,055 | | | 11,455,168 | | | 4,867,863 | | | 3,312,308 | |
| Virginia L. Stringer | | | | | | | | | | | | | | | | |
| For | | | 13,735,471 | | | 15,976,750 | | | 11,150,845 | | | 4,650,196 | | | 3,257,355 | |
| Withhold | | | 405,394 | | | 391,305 | | | 304,323 | | | 217,667 | | | 54,953 | |
| Total | | | 14,140,865 | | | 16,368,055 | | | 11,455,168 | | | 4,867,863 | | | 3,312,308 | |
| NXP | |
| | Nuveen Select Tax-Free Income Portfolio |
| | Portfolio of Investments |
| | September 30, 2013 (Unaudited) |
| | Principal | | | | Optional Call | | | | | |
| | Amount (000) | | Description (1) | | Provisions (2) | Ratings (3) | | | Value | |
| | | | LONG-TERM INVESTMENTS – 99.3% | | | | | | | |
| | | | MUNICIPAL BONDS – 99.3% | | | | | | | |
| | | | Alaska – 1.9% | | | | | | | |
| $ | 2,475 | | Alaska Municipal Bond Bank Authority, General Obligation Bonds, Series 2003E, 5.250%, 12/01/23 (Pre-refunded 12/01/13) – NPFG Insured | | 12/13 at 100.00 | AA (4) | | $ | 2,496,409 | |
| | 2,675 | | Northern Tobacco Securitization Corporation, Alaska, Tobacco Settlement Asset-Backed Bonds, Series 2006A, 5.000%, 6/01/46 | | 6/14 at 100.00 | B2 | | | 1,863,512 | |
| | 5,150 | | Total Alaska | | | | | | 4,359,921 | |
| | | | Arizona – 1.4% | | | | | | | |
| | 2,500 | | Arizona Health Facilities Authority, Hospital Revenue Bonds, Catholic Healthcare West, Series 2011B-1&2, 5.250%, 3/01/39 | | 3/21 at 100.00 | A | | | 2,540,550 | |
| | 625 | | Pima County Industrial Development Authority, Arizona, Revenue Bonds, Tucson Electric Power Company, Series 2010A, 5.250%, 10/01/40 | | 10/20 at 100.00 | BBB | | | 620,538 | |
| | 3,125 | | Total Arizona | | | | | | 3,161,088 | |
| | | | Arkansas – 0.4% | | | | | | | |
| | 5,915 | | Arkansas Development Finance Authority, Tobacco Settlement Revenue Bonds, Arkansas Cancer Research Center Project, Series 2006, 0.000%, 7/01/46 – AMBAC Insured | | No Opt. Call | Aa2 | | | 973,372 | |
| | | | California – 14.0% | | | | | | | |
| | 2,000 | | Alameda Corridor Transportation Authority, California, Revenue Bonds, Refunding Subordinate Lien Series 2004A, 5.450%, 10/01/25 – AMBAC Insured | | 10/17 at 100.00 | BBB+ | | | 2,128,340 | |
| | 4,195 | | Anaheim City School District, Orange County, California, General Obligation Bonds, Election 2002 Series 2007, 0.000%, 8/01/31 – AGM Insured | | No Opt. Call | AA– | | | 1,587,136 | |
| | 2,340 | | Anaheim Public Finance Authority, California, Subordinate Lease Revenue Bonds, Public Improvement Project, Series 1997C, 0.000%, 9/01/30 – AGM Insured | | No Opt. Call | AA– | | | 910,120 | |
| | 3,000 | | Bay Area Toll Authority, California, Revenue Bonds, San Francisco Bay Area Toll Bridge, Series 2013S-4, 5.000%, 4/01/38 | | 4/23 at 100.00 | A+ | | | 3,077,580 | |
| | 2,310 | | California Health Facilities Financing Authority, Revenue Bonds, Saint Joseph Health System, Series 2013A, 5.000%, 7/01/33 | | 7/23 at 100.00 | AA– | | | 2,372,647 | |
| | 895 | | California Statewide Community Development Authority, Revenue Bonds, Methodist Hospital Project, Series 2009, 6.750%, 2/01/38 | | 8/19 at 100.00 | Aa2 | | | 1,040,661 | |
| | 3,790 | | Coast Community College District, Orange County, California, General Obligation Bonds, Series 2006C, 0.000%, 8/01/36 – AGM Insured | | 8/16 at 33.78 | Aa1 | | | 1,115,587 | |
| | 2,645 | | Cypress Elementary School District, Orange County, California, General Obligation Bonds, Series 2009A, 0.000%, 5/01/34 – AGM Insured | | No Opt. Call | AA | | | 841,718 | |
| | 2,130 | | Golden State Tobacco Securitization Corporation, California, Enhanced Tobacco Settlement Asset-Backed Revenue Bonds, Series 2005A, 0.000%, 6/01/28 – AMBAC Insured | | No Opt. Call | A2 | | | 1,096,183 | |
| | 2,350 | | Golden Valley Unified School District, Madera County, California, General Obligation Bonds, Election 2006 Series 2007A, 0.000%, 8/01/29 – AGM Insured | | 8/17 at 56.07 | AA– | | | 979,974 | |
| | 3,030 | | Grossmont Union High School District, San Diego County, California, General Obligation Bonds, Series 2006, 0.000%, 8/01/25 – NPFG Insured | | No Opt. Call | Aa2 | | | 1,876,206 | |
| | 365 | | Los Angeles, California, Parking System Revenue Bonds, Series 1999A, 5.250%, 5/01/29 – AMBAC Insured | | No Opt. Call | AA– | | | 366,106 | |
| | 1,000 | | Moreno Valley Unified School District, Riverside County, California, General Obligation Bonds, Series 2007, 0.000%, 8/01/23 – NPFG Insured | | No Opt. Call | AA– | | | 638,570 | |
| | 1,160 | | Mount San Antonio Community College District, Los Angeles County, California, General Obligation Bonds, Election of 2008, Series 2013A, 0.000%, 8/01/43 | | 8/35 at 100.00 | AA | | | 546,000 | |
| | Principal | | | | Optional Call | | | | | |
| | Amount (000) | | Description (1) | | Provisions (2) | Ratings (3) | | | Value | |
| | | | California (continued) | | | | | | | |
| $ | 5,395 | | Napa Valley Community College District, Napa and Sonoma Counties, California, General Obligation Bonds, Election 2002 Series 2007C, 0.000%, 8/01/32 – NPFG Insured | | 8/17 at 46.57 | Aa2 | | $ | 2,083,549 | |
| | 3,000 | | New Haven Unified School District, Alameda County, California, General Obligation Bonds, Series 2004A, 0.000%, 8/01/28 – NPFG Insured | | No Opt. Call | Aa3 | | | 1,405,920 | |
| | 590 | | Palomar Pomerado Health Care District, California, Certificates of Participation, Series 2009, 6.750%, 11/01/39 | | 11/19 at 100.00 | Baa3 | | | 608,007 | |
| | 4,390 | | Pittsburg Redevelopment Agency, California, Tax Allocation Bonds, Los Medanos Community Development Project, Series 1999, 0.000%, 8/01/29 – AMBAC Insured | | No Opt. Call | A | | | 1,762,936 | |
| | 1,700 | | Placentia-Yorba Linda Unified School District, Orange County, California, Certificates of Participation, Series 2006, 0.000%, 10/01/34 – FGIC Insured | | No Opt. Call | A+ | | | 504,356 | |
| | 8,000 | | Poway Unified School District, San Diego County, California, School Facilities Improvement District 2007-1 General Obligation Bonds, Series 2009A, 0.000%, 8/01/33 | | No Opt. Call | Aa2 | | | 2,764,080 | |
| | 2,930 | | San Joaquin Hills Transportation Corridor Agency, Orange County, California, Toll Road Revenue Refunding Bonds, Series 1997A, 0.000%, 1/15/27 – NPFG Insured | | No Opt. Call | A | | | 1,299,719 | |
| | 1,250 | | San Jose, California, Airport Revenue Bonds, Series 2004D, 5.000%, 3/01/28 – NPFG Insured | | 3/14 at 100.00 | A | | | 1,263,950 | |
| | 2,110 | | Sierra Sands Unified School District, Kern County, California, General Obligation Bonds, Election of 2006, Series 2006A, 0.000%, 11/01/28 – FGIC Insured | | No Opt. Call | AA | | | 936,165 | |
| | 1,195 | | Tobacco Securitization Authority of Northern California, Tobacco Settlement Asset-Backed Bonds, Series 2005A-1, 5.500%, 6/01/45 | | 6/15 at 100.00 | B– | | | 907,148 | |
| | 1,150 | | Woodside Elementary School District, San Mateo County, California, General Obligation Bonds, Series 2007, 0.000%, 10/01/30 – AMBAC Insured | | No Opt. Call | AAA | | | 489,555 | |
| | 62,920 | | Total California | | | | | | 32,602,213 | |
| | | | Colorado – 7.6% | | | | | | | |
| | 2,950 | | Colorado Department of Transportation, Revenue Anticipation Bonds, Series 2003A, 5.250%, 12/15/15 (Pre-refunded 12/15/13) – AMBAC Insured | | 12/13 at 100.00 | AA (4) | | | 2,981,241 | |
| | 3,000 | | Colorado Health Facilities Authority, Colorado, Revenue Bonds, Catholic Health Initiatives, Series 2006A, 4.500%, 9/01/38 | | 9/16 at 100.00 | AA– | | | 2,779,470 | |
| | 1,000 | | Colorado Health Facilities Authority, Colorado, Revenue Bonds, Sisters of Charity of Leavenworth Health Services Corporation, Series 2010A, 5.000%, 1/01/40 | | 1/20 at 100.00 | AA | | | 1,004,190 | |
| | 1,900 | | Denver City and County, Colorado, Airport System Revenue Bonds, Series 1991D, 7.750%, 11/15/13 (Alternative Minimum Tax) | | No Opt. Call | A+ | | | 1,917,290 | |
| | 1,935 | | Denver City and County, Colorado, Airport System Revenue Bonds, Subordinate Lien Series 2013B, 5.000%, 11/15/43 | | 11/23 at 100.00 | A | | | 1,936,413 | |
| | 3,000 | | Denver Convention Center Hotel Authority, Colorado, Revenue Bonds, Convention Center Hotel, Senior Lien Series 2003A, 5.000%, 12/01/23
(Pre-refunded 12/01/13) – SYNCORA GTY Insured | | 12/13 at 100.00 | N/R (4) | | | 3,024,420 | |
| | 500 | | Denver, Colorado, Airport System Revenue Refunding Bonds, Series 2003B, 5.000%, 11/15/33 (Pre-refunded 11/15/13) – SYNCORA GTY Insured | | 11/13 at 100.00 | A+ (4) | | | 503,035 | |
| | 160 | | E-470 Public Highway Authority, Colorado, Senior Revenue Bonds, Series 2000B, 0.000%, 9/01/29 – NPFG Insured | | No Opt. Call | A | | | 67,139 | |
| | 2,000 | | E-470 Public Highway Authority, Colorado, Toll Revenue Bonds, Series 2004B, 0.000%, 9/01/32 – NPFG Insured | | 9/20 at 50.83 | A | | | 686,800 | |
| | 12,500 | | E-470 Public Highway Authority, Colorado, Toll Revenue Bonds, Series 2006A, 0.000%, 9/01/38 – NPFG Insured | | 9/26 at 54.77 | A | | | 2,865,000 | |
| | 28,945 | | Total Colorado | | | | | | 17,764,998 | |
| | | | Florida – 2.2% | | | | | | | |
| | 3,125 | | Collier County, Florida, Special Obligation Revenue Bonds, Refunding Series 2012, 4.000%, 10/01/13 | | No Opt. Call | AA | | | 3,125,344 | |
| | 2,000 | | Halifax Hospital Medical Center, Florida, Revenue Bonds, Series 2006, 5.375%, 6/01/46 | | 6/16 at 100.00 | A– | | | 1,863,200 | |
| | 5,125 | | Total Florida | | | | | | 4,988,544 | |
| NXP | Nuveen Select Tax-Free Income Portfolio (continued) |
| | Portfolio of Investments September 30, 2013 (Unaudited) |
| | Principal | | | | Optional Call | | | | | |
| | Amount (000) | | Description (1) | | Provisions (2) | Ratings (3) | | | Value | |
| | | | Georgia – 0.9% | | | | | | | |
| $ | 2,000 | | Franklin County Industrial Building Authority, Georgia, Revenue Bonds, Ty Cobb Regional Medical Center Project, Series 2010, 8.125%, 12/01/45 | | 12/20 at 100.00 | N/R | | $ | 2,069,140 | |
| | | | Illinois – 12.7% | | | | | | | |
| | | | Board of Trustees of Southern Illinois University, Housing and Auxiliary Facilities System Revenue Bonds, Series 1999A: | | | | | | | |
| | 2,465 | | 0.000%, 4/01/20 – NPFG Insured | | No Opt. Call | A | | | 1,887,500 | |
| | 2,000 | | 0.000%, 4/01/23 – NPFG Insured | | No Opt. Call | A | | | 1,269,320 | |
| | 735 | | Chicago Board of Education, Cook County, Illinois, General Obligation Bonds, Dedicated Revenues Series 2011A, 5.000%, 12/01/41 | | 12/21 at 100.00 | A+ | | | 655,679 | |
| | 2,000 | | Chicago, Illinois, Third Lien General Airport Revenue Bonds, O’Hare International Airport, Series 2003F, 5.500%, 1/01/15 – CIFG Insured | | 1/14 at 100.00 | AA– | | | 2,025,920 | |
| | | | DuPage County Community School District 200, Wheaton, Illinois, General Obligation Bonds, Series 2003B:Insured | | | | | | | |
| | 805 | | 5.250%, 11/01/20 (Pre-refunded 11/01/13) – AGM Insured | | 11/13 at 100.00 | AA3 (4) | | | 808,526 | |
| | 195 | | 5.250%, 11/01/20 (Pre-refunded 1/01/14) – AGM Insured | | 1/14 at 100.00 | AA (4) | | | 197,500 | |
| | 750 | | Illinois Educational Facilities Authority, Revenue Bonds, Northwestern University, Series 2003, 5.000%, 12/01/38 | | 12/13 at 100.00 | AAA | | | 753,930 | |
| | 1,050 | | Illinois Finance Authority, Revenue Bonds, Loyola University of Chicago, Tender Option Bond Trust 1137, 9.242%, 7/01/15 (IF) | | No Opt. Call | AA+ | | | 1,063,041 | |
| | 4,000 | | Illinois Finance Authority, Revenue Bonds, Northwestern Memorial Hospital, Series 2004A, 5.500%, 8/15/43 (Pre-refunded 8/15/14) | | 8/14 at 100.00 | N/R (4) | | | 4,183,440 | |
| | 260 | | Illinois Finance Authority, Revenue Bonds, Rehabilitation Institute of Chicago, Series 2013A, 6.000%, 7/01/43 | | 7/23 at 100.00 | A– | | | 268,793 | |
| | 1,000 | | Illinois Finance Authority, Revenue Bonds, Silver Cross Hospital and Medical Centers, Series 2009, 6.875%, 8/15/38 | | 8/19 at 100.00 | BBB+ | | | 1,080,370 | |
| | 2,100 | | Illinois Finance Authority, Revenue Refunding Bonds, Silver Cross Hospital and Medical Centers, Series 2008A, 5.500%, 8/15/30 | | 8/18 at 100.00 | BBB+ | | | 2,147,082 | |
| | 2,275 | | Illinois Health Facilities Authority, Revenue Refunding Bonds, Elmhurst Memorial Healthcare, Series 2002, 6.250%, 1/01/17 | | 11/13 at 100.00 | Baa2 | | | 2,283,759 | |
| | 2,190 | | Illinois State, General Obligation Bonds, Refunding Series 2012, 5.000%, 8/01/23 | | No Opt. Call | A– | | | 2,311,808 | |
| | 1,000 | | Kendall, Kane, and Will Counties Community Unit School District 308 Oswego, Illinois, General Obligation Bonds, Series 2008, 0.000%, 2/01/24 – AGM Insured | | No Opt. Call | Aa2 | | | 629,600 | |
| | 1,990 | | Metropolitan Pier and Exposition Authority, Illinois, Revenue Bonds, McCormick Place Expansion Project, Series 1993A, 0.010%, 6/15/17 – FGIC Insured | | No Opt. Call | A | | | 1,840,452 | |
| | | | Metropolitan Pier and Exposition Authority, Illinois, Revenue Bonds, McCormick Place Expansion Project, Series 2002A: | | | | | | | |
| | 1,720 | | 0.000%, 12/15/29 – NPFG Insured | | No Opt. Call | AAA | | | 706,008 | |
| | 810 | | 0.000%, 6/15/30 – NPFG Insured | | No Opt. Call | AAA | | | 318,257 | |
| | 6,070 | | 0.000%, 12/15/31 – NPFG Insured | | No Opt. Call | AAA | | | 2,154,607 | |
| | 5,000 | | 0.000%, 12/15/36 – NPFG Insured | | No Opt. Call | AAA | | | 1,267,950 | |
| | 1,300 | | Schaumburg, Illinois, General Obligation Bonds, Series 2004B, 5.250%, 12/01/34 (Pre-refunded 12/01/14) – FGIC Insured | | 12/14 at 100.00 | AAA | | | 1,375,660 | |
| | 310 | | University of Illinois, Health Services Facilities System Revenue Bonds, Series 2013, 6.000%, 10/01/42 | | 10/23 at 100.00 | A | | | 314,948 | |
| | 40,025 | | Total Illinois | | | | | | 29,544,150 | |
| | | | Indiana – 1.5% | | | | | | | |
| | 1,000 | | Franklin Community Multi-School Building Corporation, Johnson County, Indiana, First Mortgage Revenue Bonds, Series 2004, 5.000%, 7/15/22 (Pre-refunded 7/15/14) – FGIC Insured | | 7/14 at 100.00 | A+ (4) | | | 1,038,220 | |
| | 670 | | Indiana Health Facility Financing Authority, Hospital Revenue Refunding Bonds, Columbus Regional Hospital, Series 1993, 7.000%, 8/15/15 – AGM Insured | | No Opt. Call | AA– | | | 714,769 | |
| | 1,000 | | Indiana Health Facility Financing Authority, Revenue Bonds, Community Foundation of Northwest Indiana, Series 2007, 5.500%, 3/01/37 | | 3/17 at 100.00 | A– | | | 1,017,850 | |
| | 750 | | West Clark 2000 School Building Corporation, Clark County, Indiana, First Mortgage Bonds, Series 2005, 5.000%, 7/15/22 – NPFG Insured | | 1/15 at 100.00 | AA+ | | | 791,498 | |
| | 3,420 | | Total Indiana | | | | | | 3,562,337 | |
| | Principal | | | | Optional Call | | | | | |
| | Amount (000) | | Description (1) | | Provisions (2) | Ratings (3) | | | Value | |
| | | | Iowa – 2.5% | | | | | | | |
| $ | 1,665 | | Iowa Finance Authority, Iowa, Midwestern Disaster Area Revenue Bonds, Iowa Fertilizer Company Project, Series 2013, 5.000%, 12/01/19 | | No Opt. Call | BB– | | $ | 1,621,810 | |
| | 1,000 | | Iowa Tobacco Settlement Authority, Asset Backed Settlement Revenue Bonds, Series 2005C, 5.375%, 6/01/38 | | 6/15 at 100.00 | B+ | | | 802,350 | |
| | 4,000 | | Iowa Tobacco Settlement Authority, Tobacco Asset-Backed Revenue Bonds, Series 2005B, 5.600%, 6/01/34 | | 6/17 at 100.00 | B+ | | | 3,392,520 | |
| | 6,665 | | Total Iowa | | | | | | 5,816,680 | |
| | | | Kansas – 0.5% | | | | | | | |
| | 500 | | Lawrence, Kansas, Hospital Revenue Bonds, Lawrence Memorial Hospital, Refunding Series 2006, 4.875%, 7/01/36 | | 7/16 at 100.00 | A1 | | | 496,565 | |
| | 750 | | Wamego, Kansas, Pollution Control Revenue Bonds, Kansas Gas and Electric Company, Series 2004, 5.300%, 6/01/31 – NPFG Insured | | 6/14 at 100.00 | A | | | 754,710 | |
| | 1,250 | | Total Kansas | | | | | | 1,251,275 | |
| | | | Kentucky – 1.1% | | | | | | | |
| | 2,500 | | Kentucky Economic Development Finance Authority, Hospital Revenue Bonds, Baptist Healthcare System Obligated Group, Series 2011, 5.250%, 8/15/46 | | 8/21 at 100.00 | AA– | | | 2,542,575 | |
| | | | Massachusetts – 1.0% | | | | | | | |
| | 500 | | Massachusetts Health and Educational Facilities Authority, Revenue Bonds, CareGroup Inc., Series 2008E-1 &2, 5.000%, 7/01/28 | | 7/18 at 100.00 | A– | | | 509,805 | |
| | 1,865 | | Massachusetts Housing Finance Agency, Housing Bonds, Series 2009F, 5.700%, 6/01/40 | | 12/18 at 100.00 | AA– | | | 1,910,040 | |
| | 2,365 | | Total Massachusetts | | | | | | 2,419,845 | |
| | | | Michigan – 2.6% | | | | | | | |
| | 355 | | Detroit Water and Sewerage Department, Michigan, Sewage Disposal System Revenue Bonds, Refunding Senior Lien Series 2012A, 5.250%, 7/01/39 | | 7/22 at 100.00 | BBB+ | | | 321,563 | |
| | 1,500 | | Detroit, Michigan, Sewer Disposal System Revenue Bonds, Second Lien, Series 2001E, 5.750%, 7/01/31 – BHAC Insured | | 7/18 at 100.00 | AA+ | | | 1,536,750 | |
| | 2,450 | | Detroit, Michigan, Sewer Disposal System Revenue Bonds, Second Lien, Series 2006B, 5.000%, 7/01/33 – FGIC Insured | | 7/16 at 100.00 | A | | | 2,229,133 | |
| | 2,075 | | Detroit, Michigan, Water Supply System Senior Lien Revenue Bonds, Series 2004A, 4.500%, 7/01/25 – NPFG Insured | | 7/16 at 100.00 | A | | | 1,908,793 | |
| | 6,380 | | Total Michigan | | | | | | 5,996,239 | |
| | | | Missouri – 2.3% | | | | | | | |
| | 360 | | Bi-State Development Agency of the Missouri-Illinois Metropolitan District, Mass Transit Sales Tax Appropriation Bonds, Refunding Combined Lien Series 2013A, 5.000%, 10/01/28 | | 10/18 at 100.00 | AA+ | | | 384,876 | |
| | | | Kansas City Municipal Assistance Corporation, Missouri, Leasehold Revenue Bonds, Series 2004B-1: | | | | | | | |
| | 1,165 | | 0.000%, 4/15/23 – AMBAC Insured | | No Opt. Call | AA– | | | 837,775 | |
| | 5,000 | | 0.000%, 4/15/30 – AMBAC Insured | | No Opt. Call | AA– | | | 2,216,100 | |
| | 2,000 | | Missouri State Health and Educational Facilities Authority, Health Facilities Revenue Bonds, CoxHealth, Series 2013A, 5.000%, 11/15/38 | | 11/23 at 100.00 | A2 | | | 2,008,560 | |
| | 8,525 | | Total Missouri | | | | | | 5,447,311 | |
| | | | Nevada – 2.3% | | | | | | | |
| | 750 | | Clark County, Nevada, Airport Revenue Bonds, Tender Option Bond Trust Series 11823, 20.185%, 1/01/18 (IF) | | 1/20 at 100.00 | A+ | | | 1,076,550 | |
| | 1,000 | | Clark County, Nevada, Passenger Facility Charge Revenue Bonds, Las Vegas-McCarran International Airport, Series 2010A, 5.250%, 7/01/42 | | 1/20 at 100.00 | A+ | | | 1,027,790 | |
| | 1,500 | | Las Vegas Redevelopment Agency, Nevada, Tax Increment Revenue Bonds, Series 2009A, 8.000%, 6/15/30 | | 6/19 at 100.00 | BBB– | | | 1,616,745 | |
| | 1,600 | | Las Vegas Valley Water District, Nevada, General Obligation Bonds, Series 2005A, 5.000%, 6/01/18 – FGIC Insured | | 6/15 at 100.00 | AA+ | | | 1,716,464 | |
| | 4,850 | | Total Nevada | | | | | | 5,437,549 | |
| NXP | Nuveen Select Tax-Free Income Portfolio (continued) |
| | Portfolio of Investments September 30, 2013 (Unaudited) |
| | Principal | | | | Optional Call | | | | | |
| | Amount (000) | | Description (1) | | Provisions (2) | Ratings (3) | | | Value | |
| | | | New Jersey – 6.4% | | | | | | | |
| $ | 2,500 | | New Jersey Health Care Facilities Financing Authority, Revenue Bonds, Somerset Medical Center, Series 2003, 5.500%, 7/01/23 | | 12/13 at 100.00 | Ba2 | | $ | 2,500,700 | |
| | 35,000 | | New Jersey Transportation Trust Fund Authority, Transportation System Bonds, Series 2006C, 0.000%, 12/15/34 – AGM Insured | | No Opt. Call | AA– | | | 10,670,800 | |
| | 2,500 | | Tobacco Settlement Financing Corporation, New Jersey, Tobacco Settlement Asset-Backed Bonds, Series 2007-1A, 5.000%, 6/01/41 | | 6/17 at 100.00 | B2 | | | 1,797,500 | |
| | 40,000 | | Total New Jersey | | | | | | 14,969,000 | |
| | | | New Mexico – 2.2% | | | | | | | |
| | 1,000 | | New Mexico Mortgage Finance Authority, Multifamily Housing Revenue Bonds, St Anthony, Series 2007A, 5.250%, 9/01/42 (Alternative Minimum Tax) | | 9/17 at 100.00 | N/R | | | 968,180 | |
| | 4,000 | | University of New Mexico, FHA-Insured Hospital Mortgage Revenue Bonds, University of Mexico Hospital Project, Series 2004, 4.625%, 7/01/25 – AGM Insured | | 7/14 at 100.00 | AA– | | | 4,033,560 | |
| | 5,000 | | Total New Mexico | | | | | | 5,001,740 | |
| | | | New York – 5.7% | | | | | | | |
| | 1,000 | | Dormitory Authority of the State of New York, FHA-Insured Mortgage Revenue Bonds, Kaleida Health, Series 2004, 5.050%, 2/15/25 (Pre-refunded 2/15/14) | | 2/14 at 100.00 | AAA | | | 1,017,830 | |
| | 500 | | Hudson Yards Infrastructure Corporation, New York, Revenue Bonds, Senior Fiscal 2012 Series 2011A, 5.250%, 2/15/47 | | 2/21 at 100.00 | A | | | 511,140 | |
| | 1,810 | | Hudson Yards Infrastructure Corporation, New York, Revenue Bonds, Series 2006A, 5.000%, 2/15/47 – FGIC Insured | | 2/17 at 100.00 | A | | | 1,816,263 | |
| | 3,750 | | Long Island Power Authority, New York, Electric System General Revenue Bonds, Series 2004A, 5.000%, 9/01/34 – BHAC Insured | | 9/14 at 100.00 | AA+ | | | 3,852,563 | |
| | 2,385 | | Long Island Power Authority, New York, Electric System Revenue Bonds, Refunding Series 2010A, 5.000%, 5/01/14 | | No Opt. Call | A– | | | 2,447,249 | |
| | 2,500 | | New York City Transitional Finance Authority, New York, Future Tax Secured Bonds, Fiscal Series 2007B, 4.750%, 11/01/27 | | 5/17 at 100.00 | AAA | | | 2,664,125 | |
| | 780 | | Port Authority of New York and New Jersey, Special Project Bonds, JFK International Air Terminal LLC Project, Eighth Series 2010, 6.000%, 12/01/42 | | 12/20 at 100.00 | BBB | | | 838,110 | |
| | 12,725 | | Total New York | | | | | | 13,147,280 | |
| | | | North Carolina – 0.5% | | | | | | | |
| | 1,000 | | North Carolina Eastern Municipal Power Agency, Power System Revenue Bonds, Series 2008C, 6.750%, 1/01/24 | | 1/19 at 100.00 | A– | | | 1,176,810 | |
| | | | Ohio – 2.1% | | | | | | | |
| | | | Buckeye Tobacco Settlement Financing Authority, Ohio, Tobacco Settlement Asset-Backed Revenue Bonds, Senior Lien, Series 2007A-2: | | | | | | | |
| | 1,670 | | 6.000%, 6/01/42 | | 6/17 at 100.00 | BB+ | | | 1,281,257 | |
| | 1,000 | | 6.500%, 6/01/47 | | 6/17 at 100.00 | B | | | 820,810 | |
| | 1,975 | | Buckeye Tobacco Settlement Financing Authority, Ohio, Tobacco Settlement Asset-Backed Revenue Bonds, Senior Lien, Series 2007A-3, 6.250%, 6/01/37 | | 6/22 at 100.00 | B | | | 1,575,161 | |
| | 1,105 | | Ohio Turnpike Commission, Turnpike Revenue Bonds, Infrastructure Project, Junior Lien Series 2013A-1, 5.000%, 2/15/48 | | 2/23 at 100.00 | A+ | | | 1,116,039 | |
| | 5,750 | | Total Ohio | | | | | | 4,793,267 | |
| | | | Oklahoma – 2.2% | | | | | | | |
| | 1,000 | | Norman Regional Hospital Authority, Oklahoma, Hospital Revenue Bonds, Series 2005, 5.375%, 9/01/36 | | 9/16 at 100.00 | BBB– | | | 948,250 | |
| | 4,000 | | Oklahoma Development Finance Authority, Revenue Bonds, St. John Health System, Series 2004, 5.000%, 2/15/24 (Pre-refunded 2/15/14) | | 2/14 at 100.00 | A+ (4) | | | 4,071,360 | |
| | 5,000 | | Total Oklahoma | | | | | | 5,019,610 | |
| | Principal | | | | Optional Call | | | | | |
| | Amount (000) | | Description (1) | | Provisions (2) | Ratings (3) | | | Value | |
| | | | Pennsylvania – 1.1% | | | | | | | |
| $ | 500 | | Pennsylvania Higher Educational Facilities Authority, Revenue Bonds, Widener University, Series 2003, 5.250%, 7/15/24 | | 11/13 at 100.00 | A– | | $ | 501,570 | |
| | 1,490 | | Pennsylvania Turnpike Commission, Motor License Fund-Enhanced Subordinate Special Revenue Bonds, Series 2010B, 0.000%, 12/01/30 | | 12/20 at 100.00 | AA | | | 1,359,238 | |
| | 700 | | Pennsylvania Turnpike Commission, Turnpike Revenue Bonds, Series 2004A, 5.500%, 12/01/31 – AMBAC Insured | | 12/14 at 100.00 | A+ | | | 726,047 | |
| | 2,690 | | Total Pennsylvania | | | | | | 2,586,855 | |
| | | | Puerto Rico – 1.9% | | | | | | | |
| | 1,000 | | Puerto Rico Sales Tax Financing Corporation, Sales Tax Revenue Bonds, First Subordinate Series 2009A, 6.000%, 8/01/42 | | 8/19 at 100.00 | A+ | | | 815,830 | |
| | | | Puerto Rico Sales Tax Financing Corporation, Sales Tax Revenue Bonds, Series 2007A: | | | | | | | |
| | 17,500 | | 0.000%, 8/01/41 – NPFG Insured | | No Opt. Call | AA– | | | 2,880,325 | |
| | 1,000 | | 0.000%, 8/01/43 – NPFG Insured | | No Opt. Call | AA– | | | 144,210 | |
| | 7,000 | | 0.000%, 8/01/54 – AMBAC Insured | | No Opt. Call | AA– | | | 480,410 | |
| | 26,500 | | Total Puerto Rico | | | | | | 4,320,775 | |
| | | | Rhode Island – 0.5% | | | | | | | |
| | 1,125 | | Rhode Island Economic Development Corporation, Airport Revenue Bonds, Refunding Series 2005A, 4.625%, 7/01/26 – NPFG Insured (Alternative Minimum Tax) | | 7/15 at 100.00 | A | | | 1,109,509 | |
| | | | South Carolina – 1.2% | | | | | | | |
| | 1,250 | | Dorchester County School District 2, South Carolina, Installment Purchase Revenue Bonds, GROWTH, Series 2004, 5.250%, 12/01/20 (Pre-refunded 12/01/14) | | 12/14 at 100.00 | AA– (4) | | | 1,322,050 | |
| | 1,500 | | Lexington County Health Service District, South Carolina, Hospital Revenue Refunding and Improvement Bonds, Series 2003, 6.000%, 11/01/18 (Pre-refunded 11/01/13) | | 11/13 at 100.00 | AA– (4) | | | 1,507,545 | |
| | 2,750 | | Total South Carolina | | | | | | 2,829,595 | |
| | | | Texas – 12.6% | | | | | | | |
| | 1,000 | | Central Texas Regional Mobility Authority, Revenue Bonds, Senior Lien Series 2005, 5.000%, 1/01/35 (Pre-refunded 1/01/15) – FGIC Insured | | 1/15 at 100.00 | A (4) | | | 1,058,400 | |
| | 250 | | Central Texas Regional Mobility Authority, Revenue Bonds, Senior Lien Series 2011, 6.000%, 1/01/41 | | 1/21 at 100.00 | Baa2 | | | 253,195 | |
| | 5,565 | | Grand Parkway Transportation Corporation, Texas, System Toll Revenue Bonds, First Tier Series 2013A, 5.500%, 4/01/53 | | 10/23 at 100.00 | BBB+ | | | 5,556,096 | |
| | 2,300 | | Harris County Health Facilities Development Corporation, Texas, Thermal Utility Revenue Bonds, TECO Project, Series 2003, 5.000%, 11/15/30 (Pre-refunded 11/15/13) – NPFG Insured | | 11/13 at 100.00 | AA (4) | | | 2,313,731 | |
| | 3,415 | | Harris County-Houston Sports Authority, Texas, Revenue Bonds, Junior Lien Series 2001H, 0.000%, 11/15/30 – NPFG Insured | | No Opt. Call | A | | | 1,155,329 | |
| | 4,165 | | Harris County-Houston Sports Authority, Texas, Revenue Bonds, Third Lien Series 2004A-3, 0.000%, 11/15/35 – NPFG Insured | | 11/24 at 52.47 | A | | | 979,566 | |
| | 4,015 | | Harris County-Houston Sports Authority, Texas, Senior Lien Revenue Refunding Bonds, Series 2001A, 0.000%, 11/15/38 – NPFG Insured | | 11/30 at 61.17 | A | | | 806,814 | |
| | 1,780 | | Leander Independent School District, Williamson and Travis Counties, Texas, General Obligation Bonds, Series 2007, 0.000%, 8/15/37 | | 8/16 at 35.23 | AAA | | | 545,018 | |
| | 2,260 | | Love Field Airport Modernization Corporation, Texas, Special Facilities Revenue Bonds, Southwest Airlines Company, Series 2010, 5.250%, 11/01/40 | | 11/20 at 100.00 | BBB– | | | 2,234,123 | |
| | 2,000 | | North Texas Tollway Authority, First Tier System Revenue Refunding Bonds, Capital Appreciation Series 2008I, 0.000%, 1/01/43 | | 1/25 at 100.00 | A2 | | | 2,082,860 | |
| | 4,500 | | Richardson Hospital Authority, Texas, Revenue Bonds, Richardson Regional Medical Center, Series 2004, 6.000%, 12/01/34 | | 12/13 at 100.00 | A+ | | | 4,528,935 | |
| | 5,000 | | Texas Municipal Gas Acquisition and Supply Corporation III, Gas Supply Revenue Bonds, Series 2012, 5.000%, 12/15/26 | | No Opt. Call | A3 | | | 5,064,850 | |
| NXP | Nuveen Select Tax-Free Income Portfolio (continued) |
| | Portfolio of Investments September 30, 2013 (Unaudited) |
| | Principal | | | | Optional Call | | | | | |
| | Amount (000) | | Description (1) | | Provisions (2) | Ratings (3) | | | Value | |
| | | | Texas (continued) | | | | | | | |
| $ | 1,750 | | Texas, General Obligation Bonds, Water Financial Assistance Program, Series 2003A, 5.125%, 8/01/42 (Alternative Minimum Tax) | | 12/13 at 100.00 | AAA | | $ | 1,750,385 | |
| | 830 | | Wood County Central Hospital District, Texas, Revenue Bonds, East Texas Medical Center Quitman Project, Series 2011, 6.000%, 11/01/41 | | 11/21 at 100.00 | Baa2 | | | 866,935 | |
| | 38,830 | | Total Texas | | | | | | 29,196,237 | |
| | | | Virginia – 4.1% | | | | | | | |
| | 1,000 | | Fairfax County Economic Development Authority, Virginia, Residential Care Facilities Mortgage Revenue Bonds, Goodwin House, Inc., Series 2007A, 5.125%, 10/01/42 | | 10/17 at 100.00 | BBB | | | 1,002,870 | |
| | 1,000 | | Henrico County Economic Development Authority, Virginia, Residential Care Facility Revenue Bonds, Westminster Canterbury of Richmond, Series 2006, 5.000%, 10/01/35 | | 11/13 at 100.00 | BBB | | | 990,130 | |
| | 2,000 | | Metropolitan Washington Airports Authority, Virginia, Dulles Toll Road Revenue Bonds, Dulles Metrorail Capital Appreciation, Series 2010B, 0.000%, 10/01/44 | | 10/28 at 100.00 | BBB+ | | | 1,586,200 | |
| | 1,935 | | Route 460 Funding Corporation, Virginia, Toll Road Revenue Bonds, Series 2012A, 5.125%, 7/01/49 | | No Opt. Call | BBB– | | | 1,709,843 | |
| | 400 | | Stafford County Economic Development Authority, Virginia, Hospital Facilities Revenue Bonds, MediCorp Health System, Series 2006, 5.250%, 6/15/37 | | 6/16 at 100.00 | Baa1 | | | 382,472 | |
| | | | Virginia Small Business Financing Authority, Senior Lien Revenue Bonds, Elizabeth River Crossing, Opco LLC Project, Series 2012: | | | | | | | |
| | 1,000 | | 5.250%, 1/01/32 (Alternative Minimum Tax) | | 7/22 at 100.00 | BBB– | | | 943,850 | |
| | 650 | | 6.000%, 1/01/37 (Alternative Minimum Tax) | | 7/22 at 100.00 | BBB– | | | 652,119 | |
| | 1,010 | | 5.500%, 1/01/42 (Alternative Minimum Tax) | | 7/22 at 100.00 | BBB– | | | 948,087 | |
| | 1,390 | | Virginia Small Business Financing Authority, Wellmont Health System Project Revenue Bonds, Series 2007A, 5.250%, 9/01/37 | | 9/17 at 100.00 | BBB+ | | | 1,339,529 | |
| | 10,385 | | Total Virginia | | | | | | 9,555,100 | |
| | | | Washington – 1.7% | | | | | | | |
| | 990 | | Washington Health Care Facilities Authority, Revenue Bonds, Fred Hutchinson Cancer Research Center, Series 2011A, 5.625%, 1/01/35 | | 1/21 at 100.00 | A | | | 1,015,968 | |
| | 1,790 | | Washington State Tobacco Settlement Authority, Tobacco Settlement Asset-Backed Revenue Bonds, Series 2002, 6.500%, 6/01/26 | | 11/13 at 100.00 | A3 | | | 1,785,507 | |
| | 2,115 | | Washington State, Motor Vehicle Fuel Tax General Obligation Bonds, Series 2003F, 0.000%, 12/01/27 – NPFG Insured | | No Opt. Call | AA+ | | | 1,232,516 | |
| | 4,895 | | Total Washington | | | | | | 4,033,991 | |
| | | | West Virginia – 0.9% | | | | | | | |
| | 500 | | West Virginia Hospital Finance Authority, Hospital Revenue Bonds, United Hospital Center Inc. Project, Series 2006A, 4.500%, 6/01/26 – AMBAC Insured | | 6/16 at 100.00 | A | | | 504,585 | |
| | 1,500 | | West Virginia Hospital Finance Authority, Hospital Revenue Bonds, West Virginia United Health System Obligated Group, Refunding and Improvement Series 2013A, 5.500%, 6/01/44 (WI/DD, Settling 10/03/13) | | 6/23 at 100.00 | A | | | 1,529,740 | |
| | 2,000 | | Total West Virginia | | | | | | 2,034,325 | |
| | | | Wisconsin – 1.3% | | | | | | | |
| | 1,645 | | Wisconsin Health and Educational Facilities Authority, Revenue Bonds, Mercy Alliance, Inc., Series 2012, 5.000%, 6/01/39 | | 6/22 at 100.00 | A2 | | | 1,622,644 | |
| | 1,325 | | Wisconsin, General Obligation Refunding Bonds, Series 2003-3, 5.000%, 11/01/26 | | 11/13 at 100.00 | AA | | | 1,330,327 | |
| | 2,970 | | Total Wisconsin | | | | | | 2,952,971 | |
| $ | 350,780 | | Total Municipal Bonds (cost $224,574,685) | | | | | | 230,664,302 | |
| | Principal | | | | | | | | | | |
| | Amount (000) | | Description (1) | | Coupon | Maturity | Ratings (3) | | | Value | |
| | | | CORPORATE BONDS – 0.0% | | | | | | | | |
| | | | Transportation – 0.0% | | | | | | | | |
| $ | 193 | | Las Vegas Monorail Company, Senior Interest Bonds (5), (6) | | 5.500% | 7/15/19 | N/R | | $ | 29,201 | |
| | 56 | | Las Vegas Monorail Company, Senior Interest Bonds (5), (6) | | 3.000% | 7/15/55 | N/R | | | 5,638 | |
| $ | 249 | | Total Corporate Bonds (cost $7,312) | | | | | | | 34,839 | |
| | | | Total Long-Term Investments (cost $224,581,997) | | | | | | | 230,699,141 | |
| | | | Other Assets Less Liabilities – 0.7% | | | | | | | 1,614,662 | |
| | | | Net Assets – 100% | | | | | | $ | 232,313,803 | |
| (1) | All percentages shown in the Portfolio of Investments are based on net assets. |
| (2) | Optional Call Provisions: Dates (month and year) and prices of the earliest optional call or redemption. There may be other call provisions at varying prices at later dates. Certain mortgage-backed securities may be subject to periodic principal paydowns. |
| (3) | Ratings: Using the highest of Standard & Poor’s Group (“Standard & Poor’s”), Moody’s Investors Service, Inc. (“Moody’s”) or Fitch, Inc. (“Fitch”) rating. Ratings below BBB by Standard & Poor’s, Baa by Moody’s or BBB by Fitch are considered to be below investment grade. Holdings designated N/R are not rated by any of these national rating agencies. |
| (4) | Backed by an escrow or trust containing sufficient U.S. Government or U.S. Government agency securities which ensure the timely payment of principal and interest. Certain bonds backed by U.S. Government or agency securities are regarded as having an implied rating equal to the rating of such securities. |
| (5) | Investment valued at fair value using methods determined in good faith by, or at the discretion of, the Board of Trustees. For fair value measurement disclosure purposes, investment classified as Level 3. See Notes to Financial Statements, Note 2 – Investment Valuation and Fair Value Measurements for more information. |
| (6) | During January 2010, Las Vegas Monorail Company (“Las Vegas Monorail”) filed for federal bankruptcy protection. During March 2012, Las Vegas Monorail emerged from federal bankruptcy with the acceptance of a reorganization plan assigned by the Federal Bankruptcy Court. Under the reorganization plan, the Fund surrendered its Las Vegas Monorail Project Revenue Bonds, First Tier, Series 2000 and in turn received two senior interest corporate bonds: the first with an annual coupon rate of 5.500% maturing on July 15, 2019 and the second with an annual coupon rate of 3.000% (5.500% after December 31, 2015) maturing on July 15, 2055. The Fund’s custodian is not accruing income on the Fund’s records for either senior interest corporate bond. |
| WI/DD | Investment, or portion of investment, purchased on a when-issued or delayed delivery basis. |
| (IF) | Inverse floating rate investment. |
See accompanying notes to financial statements.
| NXQ | |
| | Nuveen Select Tax-Free Income Portfolio 2 |
| | Portfolio of Investments |
| | September 30, 2013 (Unaudited) |
| | Principal | | | | Optional Call | | | | | |
| | Amount (000) | | Description (1) | | Provisions (2) | Ratings (3) | | | Value | |
| | | | LONG-TERM INVESTMENTS – 98.8% | | | | | | | |
| | | | MUNICIPAL BONDS – 98.8% | | | | | | | |
| | | | Alaska – 0.3% | | | | | | | |
| $ | 1,000 | | Northern Tobacco Securitization Corporation, Alaska, Tobacco Settlement Asset-Backed Bonds, Series 2006A, 5.000%, 6/01/32 | | 6/14 at 100.00 | B2 | | $ | 767,450 | |
| | | | Arizona – 2.3% | | | | | | | |
| | 2,500 | | Arizona Health Facilities Authority, Hospital Revenue Bonds, Catholic Healthcare West, Series 2011B-1&2, 5.250%, 3/01/39 | | 3/21 at 100.00 | A | | | 2,540,550 | |
| | 600 | | Pima County Industrial Development Authority, Arizona, Revenue Bonds, Tucson Electric Power Company, Series 2010A, 5.250%, 10/01/40 | | 10/20 at 100.00 | BBB | | | 595,716 | |
| | 2,250 | | Salt Verde Financial Corporation, Arizona, Senior Gas Revenue Bonds, Citigroup Energy Inc Prepay Contract Obligations, Series 2007, 5.000%, 12/01/37 | | No Opt. Call | A– | | | 2,220,773 | |
| | 215 | | Sedona Wastewater Municipal Property Corporation, Arizona, Excise Tax Revenue Bonds, Series 1998, 0.000%, 7/01/20 – NPFG Insured | | No Opt. Call | A | | | 170,377 | |
| | 5,565 | | Total Arizona | | | | | | 5,527,416 | |
| | | | California – 12.8% | | | | | | | |
| | 1,000 | | Alameda Corridor Transportation Authority, California, Revenue Bonds, Refunding Subordinate Lien Series 2004A, 5.450%, 10/01/25 – AMBAC Insured | | 10/17 at 100.00 | BBB+ | | | 1,064,170 | |
| | 11,000 | | Alhambra Unified School District, Los Angeles County, California, General Obligation Bonds, Capital Appreciation Series 2009B, 0.000%, 8/01/41 – AGC Insured | | No Opt. Call | AA– | | | 2,174,150 | |
| | 3,600 | | Arcadia Unified School District, Los Angeles County, California, General Obligation Bonds, Election 2006 Series 2007A, 0.000%, 8/01/33 – AGM Insured | | 2/17 at 44.77 | Aa2 | | | 1,242,036 | |
| | 500 | | California State Public Works Board, Lease Revenue Refunding Bonds, Community Colleges Projects, Series 1998A, 5.250%, 12/01/16 | | 12/13 at 100.00 | A2 | | | 501,950 | |
| | 540 | | California State Public Works Board, Lease Revenue Refunding Bonds, Various University of California Projects, Series 1993A, 5.500%, 6/01/14 | | No Opt. Call | Aa2 | | | 559,273 | |
| | 2,500 | | California State, General Obligation Bonds, Series 2005, 5.000%, 3/01/31 | | 3/16 at 100.00 | A1 | | | 2,575,650 | |
| | 60 | | California, General Obligation Bonds, Series 1997, 5.000%, 10/01/18 – AMBAC Insured | | 11/13 at 100.00 | A1 | | | 60,236 | |
| | 2,440 | | Eureka Unified School District, Humboldt County, California, General Obligation Bonds, Series 2002, 0.000%, 8/01/27 – AGM Insured | | No Opt. Call | AA– | | | 1,240,838 | |
| | 3,290 | | Folsom Cordova Unified School District, Sacramento County, California, General Obligation Bonds, School Facilities Improvement District 4, Series 2007A, 0.000%, 10/01/24 – NPFG Insured | | No Opt. Call | A+ | | | 1,935,540 | |
| | 1,000 | | Golden State Tobacco Securitization Corporation, California, Tobacco Settlement Asset-Backed Bonds, Series 2007A-1, 5.125%, 6/01/47 | | 6/17 at 100.00 | B | | | 700,660 | |
| | 3,030 | | Grossmont Union High School District, San Diego County, California, General Obligation Bonds, Series 2006, 0.000%, 8/01/25 – NPFG Insured | | No Opt. Call | Aa2 | | | 1,876,206 | |
| | 1,495 | | Huntington Beach Union High School District, Orange County, California, General Obligation Bonds, Series 2007, 0.000%, 8/01/33 – FGIC Insured | | No Opt. Call | Aa2 | | | 509,257 | |
| | 1,160 | | Mount San Antonio Community College District, Los Angeles County, California, General Obligation Bonds, Election of 2008, Series 2013A, 0.000%, 8/01/43 | | 8/35 at 100.00 | AA | | | 546,000 | |
| | 450 | | M-S-R Energy Authority, California, Gas Revenue Bonds, Series 2009C, 6.500%, 11/01/39 | | No Opt. Call | A | | | 519,831 | |
| | 1,195 | | Palmdale Elementary School District, Los Angeles County, California, General Obligation Bonds, Series 2003, 0.000%, 8/01/28 – AGM Insured | | No Opt. Call | AA– | | | 582,718 | |
| | 590 | | Palomar Pomerado Health Care District, California, Certificates of Participation, Series 2009, 6.750%, 11/01/39 | | 11/19 at 100.00 | Baa3 | | | 608,007 | |
| | 4,620 | | Palomar Pomerado Health, California, General Obligation Bonds, Election of 2004, Series 2007A, 0.000%, 8/01/24 – NPFG Insured | | No Opt. Call | A+ | | | 2,862,552 | |
| | Principal | | | | Optional Call | | | | | |
| | Amount (000) | | Description (1) | | Provisions (2) | Ratings (3) | | | Value | |
| | | | California (continued) | | | | | | | |
| $ | 4,400 | | Pittsburg Redevelopment Agency, California, Tax Allocation Bonds, Los Medanos Community Development Project, Series 1999, 0.000%, 8/01/29 – AMBAC Insured | | No Opt. Call | A | | $ | 1,766,952 | |
| | 2,500 | | Placentia-Yorba Linda Unified School District, Orange County, California, Certificates of Participation, Series 2006, 0.000%, 10/01/34 – FGIC Insured | | No Opt. Call | A+ | | | 741,700 | |
| | 2,755 | | Sacramento City Unified School District, Sacramento County, California, General Obligation Bonds, Series 2007, 0.000%, 7/01/25 – AGM Insured | | No Opt. Call | A1 | | | 1,576,797 | |
| | | | San Joaquin Delta Community College District, California, General Obligation Bonds, Election 2004 Series 2008B: | | | | | | | |
| | 1,000 | | 0.000%, 8/01/30 – AGM Insured | | 8/18 at 50.12 | Aa2 | | | 393,870 | |
| | 1,890 | | 0.000%, 8/01/31 – AGM Insured | | 8/18 at 47.14 | Aa2 | | | 679,096 | |
| | 1,500 | | San Jose, California, Airport Revenue Bonds, Series 2004D, 5.000%, 3/01/28 – NPFG Insured | | 3/14 at 100.00 | A | | | 1,516,740 | |
| | 6,025 | | Simi Valley Unified School District, Ventura County, California, General Obligation Bonds, Series 2007C, 0.000%, 8/01/30 | | No Opt. Call | AA– | | | 2,514,112 | |
| | 2,080 | | Tobacco Securitization Authority of Northern California, Tobacco Settlement Asset-Backed Bonds, Series 2005A-1, 5.500%, 6/01/45 | | 6/15 at 100.00 | B– | | | 1,578,970 | |
| | 60,620 | | Total California | | | | | | 30,327,311 | |
| | | | Colorado – 8.0% | | | | | | | |
| | 500 | | Colorado Health Facilities Authority, Colorado, Revenue Bonds, Catholic Health Initiatives, Series 2009A, 5.500%, 7/01/34 | | 7/19 at 100.00 | AA– | | | 544,355 | |
| | 1,975 | | Colorado Health Facilities Authority, Colorado, Revenue Bonds, Sisters of Charity of Leavenworth Health Services Corporation, Series 2010A, 5.000%, 1/01/40 | | 1/20 at 100.00 | AA | | | 1,983,275 | |
| | 1,000 | | Colorado Health Facilities Authority, Colorado, Revenue Bonds, Valley View Hospital Association, Series 2007, 5.250%, 5/15/42 | | 5/17 at 100.00 | BBB+ | | | 986,090 | |
| | 565 | | Denver City and County, Colorado, Airport System Revenue Bonds, Series 1991D, 7.750%, 11/15/13 (Alternative Minimum Tax) | | No Opt. Call | A+ | | | 570,142 | |
| | 1,935 | | Denver City and County, Colorado, Airport System Revenue Bonds, Subordinate Lien Series 2013B, 5.000%, 11/15/43 | | 11/23 at 100.00 | A | | | 1,936,413 | |
| | 3,000 | | Denver Convention Center Hotel Authority, Colorado, Revenue Bonds, Convention Center Hotel, Senior Lien Series 2003A, 5.000%, 12/01/23
(Pre-refunded 12/01/13) – SYNCORA GTY Insured | | 12/13 at 100.00 | N/R (4) | | | 3,024,420 | |
| | 2,230 | | Denver Convention Center Hotel Authority, Colorado, Revenue Bonds, Convention Center Hotel, Senior Lien Series 2006, 4.750%, 12/01/35 – SYNCORA GTY Insured | | 11/16 at 100.00 | BBB– | | | 2,051,912 | |
| | | | E-470 Public Highway Authority, Colorado, Senior Revenue Bonds, Series 2000B: | | | | | | | |
| | 5,140 | | 0.000%, 9/01/24 – NPFG Insured | | No Opt. Call | A | | | 3,080,659 | |
| | 8,100 | | 0.000%, 9/01/29 – NPFG Insured | | No Opt. Call | A | | | 3,398,922 | |
| | 4,475 | | 0.000%, 9/01/33 – NPFG Insured | | No Opt. Call | A | | | 1,432,761 | |
| | 28,920 | | Total Colorado | | | | | | 19,008,949 | |
| | | | Florida – 1.5% | | | | | | | |
| | 1,000 | | Hillsborough County Industrial Development Authority, Florida, Hospital Revenue Bonds, Tampa General Hospital, Series 2006, 5.250%, 10/01/41 | | 10/16 at 100.00 | A3 | | | 1,008,140 | |
| | 2,500 | | JEA, Florida, Electric System Revenue Bonds, Series Three 2006A, 5.000%, 10/01/41 – AGM Insured | | 4/15 at 100.00 | Aa2 | | | 2,550,300 | |
| | 3,500 | | Total Florida | | | | | | 3,558,440 | |
| | | | Georgia – 0.4% | | | | | | | |
| | 1,000 | | Franklin County Industrial Building Authority, Georgia, Revenue Bonds, Ty Cobb Regional Medical Center Project, Series 2010, 8.125%, 12/01/45 | | 12/20 at 100.00 | N/R | | | 1,034,570 | |
| | | | Illinois – 12.5% | | | | | | | |
| | 1,400 | | Board of Trustees of Southern Illinois University, Housing and Auxiliary Facilities System Revenue Bonds, Series 1999A, 0.000%, 4/01/23 – NPFG Insured | | No Opt. Call | A | | | 888,524 | |
| | 735 | | Chicago Board of Education, Cook County, Illinois, General Obligation Bonds, Dedicated Revenues Series 2011A, 5.000%, 12/01/41 | | 12/21 at 100.00 | A+ | | | 655,679 | |
| | 190 | | Chicago Metropolitan Housing Development Corporation, Illinois, FHA-Insured Section 8 Assisted Housing Development Revenue Refunding Bonds, Series 1992, 6.800%, 7/01/17 | | 1/14 at 100.00 | AA | | | 190,705 | |
| NXQ | Nuveen Select Tax-Free Income Portfolio 2 (continued) |
| | Portfolio of Investments September 30, 2013 (Unaudited) |
| | Principal | | | | Optional Call | | | | | |
| | Amount (000) | | Description (1) | | Provisions (2) | Ratings (3) | | | Value | |
| | | | Illinois (continued) | | | | | | | |
| $ | 1,000 | | Chicago, Illinois, General Obligation Bonds, Project & Refunding Series 2006A, 4.625%, 1/01/31 – AGM Insured | | 1/16 at 100.00 | AA– | | $ | 948,050 | |
| | 590 | | Chicago, Illinois, Motor Fuel Tax Revenue Bonds, Series 2003A, 5.000%, 1/01/33 – AMBAC Insured | | 11/13 at 100.00 | AA+ | | | 590,124 | |
| | 1,665 | | Chicago, Illinois, Third Lien General Airport Revenue Bonds, O’Hare International Airport, Series 2005A, 5.000%, 1/01/33 – FGIC Insured | | 1/16 at 100.00 | A | | | 1,638,593 | |
| | 1,050 | | Illinois Finance Authority, Revenue Bonds, Loyola University of Chicago, Tender Option Bond Trust 1137, 9.242%, 7/01/15 (IF) | | No Opt. Call | Aa1 | | | 1,063,041 | |
| | 200 | | Illinois Finance Authority, Revenue Bonds, Palos Community Hospital, Series 2007A, 5.000%, 5/15/32 – NPFG Insured | | 5/17 at 100.00 | AA– | | | 200,546 | |
| | 2,185 | | Illinois Finance Authority, Revenue Bonds, YMCA of Southwest Illinois, Series 2005, 5.000%, 9/01/31 – RAAI Insured | | 9/15 at 100.00 | Aa3 | | | 1,795,720 | |
| | 1,750 | | Illinois Finance Authority, Revenue Refunding Bonds, Silver Cross Hospital and Medical Centers, Series 2008A, 5.500%, 8/15/30 | | 8/18 at 100.00 | BBB+ | | | 1,789,235 | |
| | 1,035 | | Illinois Finance Authority, Student Housing Revenue Bonds, Educational Advancement Fund Inc., University Center Project, Series 2006B, 5.000%, 5/01/25 | | 11/16 at 100.00 | BBB+ | | | 1,024,195 | |
| | 1,000 | | Illinois Housing Development Authority, Housing Finance Bonds, Series 2005E, 4.750%, 7/01/30 – FGIC Insured | | 1/15 at 100.00 | AA | | | 1,038,580 | |
| | 2,190 | | Illinois State, General Obligation Bonds, Refunding Series 2012, 5.000%, 8/01/23 | | No Opt. Call | A– | | | 2,311,808 | |
| | | | Metropolitan Pier and Exposition Authority, Illinois, Revenue Bonds, McCormick Place Expansion Project, Series 2002A: | | | | | | | |
| | 6,350 | | 0.000%, 12/15/31 – NPFG Insured | | No Opt. Call | AAA | | | 2,253,996 | |
| | 1,350 | | 0.000%, 6/15/35 – NPFG Insured | | No Opt. Call | AAA | | | 374,882 | |
| | 5,000 | | 0.000%, 12/15/36 – NPFG Insured | | No Opt. Call | AAA | | | 1,267,950 | |
| | 9,170 | | 0.000%, 6/15/39 – NPFG Insured | | No Opt. Call | AAA | | | 2,000,986 | |
| | 5,045 | | Sauk Village, Illinois, General Obligation Alternate Revenue Source Bonds, Tax Increment, Series 2002A, 5.000%, 6/01/22 – RAAI Insured | | 11/13 at 100.00 | N/R | | | 4,575,109 | |
| | | | Sauk Village, Illinois, General Obligation Alternate Revenue Source Bonds, Tax Increment, Series 2002B: | | | | | | | |
| | 1,060 | | 0.000%, 12/01/17 – RAAI Insured | | No Opt. Call | N/R | | | 869,401 | |
| | 1,135 | | 0.000%, 12/01/18 – RAAI Insured | | No Opt. Call | N/R | | | 871,578 | |
| | 1,100 | | Schaumburg, Illinois, General Obligation Bonds, Series 2004B, 5.250%, 12/01/34 (Pre-refunded 12/01/14) – FGIC Insured | | 12/14 at 100.00 | AAA | | | 1,164,020 | |
| | 2,000 | | Springfield, Illinois, Electric Revenue Bonds, Senior Lien Series 2007, 5.000%, 3/01/22 – NPFG Insured | | 3/17 at 100.00 | A | | | 2,077,560 | |
| | 47,200 | | Total Illinois | | | | | | 29,590,282 | |
| | | | Indiana – 4.7% | | | | | | | |
| | 1,000 | | Franklin Community Multi-School Building Corporation, Johnson County, Indiana, First Mortgage Revenue Bonds, Series 2004, 5.000%, 7/15/22 (Pre-refunded 7/15/14) – FGIC Insured | | 7/14 at 100.00 | A+ (4) | | | 1,038,220 | |
| | 1,600 | | Indiana Bond Bank, Special Program Bonds, Carmel Junior Waterworks Project, Series 2008B, 0.000%, 6/01/30 – AGM Insured | | No Opt. Call | AA– | | | 741,184 | |
| | 825 | | Indiana Health and Educational Facilities Financing Authority, Revenue Bonds, Ascension Health, Series 2006B-5, 5.000%, 11/15/36 | | 11/16 at 100.00 | AA+ | | | 829,686 | |
| | 670 | | Indiana Health Facility Financing Authority, Hospital Revenue Bonds, Methodist Hospitals Inc., Series 2001, 5.375%, 9/15/22 | | 3/14 at 100.00 | BBB | | | 670,784 | |
| | 1,000 | | Indiana Health Facility Financing Authority, Revenue Bonds, Community Foundation of Northwest Indiana, Series 2007, 5.500%, 3/01/37 | | 3/17 at 100.00 | A– | | | 1,017,850 | |
| | 2,000 | | Indiana Municipal Power Agency, Power Supply Revenue Bonds, Series 2007A, 5.000%, 1/01/42 – NPFG Insured | | 1/17 at 100.00 | A+ | | | 2,006,980 | |
| | 750 | | West Clark 2000 School Building Corporation, Clark County, Indiana, First Mortgage Bonds, Series 2005, 5.000%, 7/15/22 – NPFG Insured | | 1/15 at 100.00 | AA+ | | | 791,498 | |
| | 3,840 | | Whiting Redevelopment District, Indiana, Tax Increment Revenue Bonds, Lakefront Development Project, Series 2010, 6.000%, 1/15/19 | | No Opt. Call | N/R | | | 4,102,656 | |
| | 11,685 | | Total Indiana | | | | | | 11,198,858 | |
| | Principal | | | | Optional Call | | | | | |
| | Amount (000) | | Description (1) | | Provisions (2) | Ratings (3) | | | Value | |
| | | | Iowa – 1.6% | | | | | | | |
| $ | 1,665 | | Iowa Finance Authority, Iowa, Midwestern Disaster Area Revenue Bonds, Iowa Fertilizer Company Project, Series 2013, 5.000%, 12/01/19 | | No Opt. Call | BB– | | $ | 1,621,810 | |
| | 1,645 | | Iowa Tobacco Settlement Authority, Asset Backed Settlement Revenue Bonds, Series 2005C, 5.375%, 6/01/38 | | 6/15 at 100.00 | B+ | | | 1,319,866 | |
| | 1,000 | | Iowa Tobacco Settlement Authority, Tobacco Asset-Backed Revenue Bonds, Series 2005B, 5.600%, 6/01/34 | | 6/17 at 100.00 | B+ | | | 848,130 | |
| | 4,310 | | Total Iowa | | | | | | 3,789,806 | |
| | | | Kansas – 0.5% | | | | | | | |
| | 795 | | Lawrence, Kansas, Hospital Revenue Bonds, Lawrence Memorial Hospital, Refunding Series 2006, 4.875%, 7/01/36 | | 7/16 at 100.00 | A1 | | | 789,538 | |
| | 380 | | Overland Park Development Corporation, Kansas, Second Tier Revenue Bonds, Overland Park Convention Center, Series 2007B, 5.125%, 1/01/22 – AMBAC Insured | | 1/17 at 100.00 | BB+ | | | 378,833 | |
| | 1,175 | | Total Kansas | | | | | | 1,168,371 | |
| | | | Kentucky – 1.1% | | | | | | | |
| | 2,500 | | Kentucky Economic Development Finance Authority, Hospital Revenue Bonds, Baptist Healthcare System Obligated Group, Series 2011, 5.250%, 8/15/46 | | 8/21 at 100.00 | AA– | | | 2,542,575 | |
| | | | Louisiana – 0.9% | | | | | | | |
| | 2,020 | | Louisiana Public Facilities Authority, Revenue Bonds, Baton Rouge General Hospital, Series 2004, 5.250%, 7/01/24 (Pre-refunded 7/01/14) – NPFG Insured | | 7/14 at 100.00 | A (4) | | | 2,092,538 | |
| | | | Massachusetts – 0.9% | | | | | | | |
| | 500 | | Massachusetts Health and Educational Facilities Authority, Revenue Bonds, CareGroup Inc., Series 2008E-1 &2, 5.000%, 7/01/28 | | 7/18 at 100.00 | A– | | | 509,805 | |
| | 970 | | Massachusetts Water Resources Authority, General Revenue Bonds, Series 1993C, 5.250%, 12/01/15 – NPFG Insured (ETM) | | No Opt. Call | A (4) | | | 1,022,729 | |
| | 635 | | Massachusetts Water Resources Authority, General Revenue Bonds, Series 1993C, 5.250%, 12/01/15 – NPFG Insured | | No Opt. Call | Aa1 | | | 668,680 | |
| | 2,105 | | Total Massachusetts | | | | | | 2,201,214 | |
| | | | Michigan – 3.1% | | | | | | | |
| | 355 | | Detroit Water and Sewerage Department, Michigan, Sewage Disposal System Revenue Bonds, Refunding Senior Lien Series 2012A, 5.250%, 7/01/39 | | 7/22 at 100.00 | BBB+ | | | 321,563 | |
| | 2,500 | | Detroit, Michigan, Sewer Disposal System Revenue Bonds, Second Lien, Series 2001E, 5.750%, 7/01/31 – BHAC Insured | | 7/18 at 100.00 | AA+ | | | 2,561,250 | |
| | 2,450 | | Detroit, Michigan, Sewer Disposal System Revenue Bonds, Second Lien, Series 2006B, 5.000%, 7/01/33 – FGIC Insured | | 7/16 at 100.00 | A | | | 2,229,133 | |
| | 2,060 | | Detroit, Michigan, Water Supply System Senior Lien Revenue Bonds, Series 2004A, 4.500%, 7/01/25 – NPFG Insured | | 7/16 at 100.00 | A | | | 1,894,994 | |
| | 250 | | Royal Oak Hospital Finance Authority, Michigan, Hospital Revenue Bonds, William Beaumont Hospital, Refunding Series 2009V, 8.250%, 9/01/39 | | 9/18 at 100.00 | A1 | | | 300,555 | |
| | 7,615 | | Total Michigan | | | | | | 7,307,495 | |
| | | | Minnesota – 0.5% | | | | | | | |
| | 1,210 | | Minnesota Housing Finance Agency, Residential Housing Finance Bonds, Series 2007-I, 4.850%, 7/01/38 (Alternative Minimum Tax) | | 7/16 at 100.00 | AA+ | | | 1,206,455 | |
| | | | Mississippi – 0.2% | | | | | | | |
| | 500 | | Mississippi Development Bank, Revenue Bonds, Mississippi Municipal Energy Agency, Mississippi Power, Series 2006A, 5.000%, 3/01/21 – SYNCORA GTY Insured | | 3/16 at 100.00 | Baa1 | | | 517,380 | |
| | | | Missouri – 0.1% | | | | | | | |
| | 270 | | Bi-State Development Agency of the Missouri-Illinois Metropolitan District, Mass Transit Sales Tax Appropriation Bonds, Refunding Combined Lien Series 2013A, 5.000%, 10/01/28 | | 10/18 at 100.00 | AA+ | | | 288,657 | |
| NXQ | Nuveen Select Tax-Free Income Portfolio 2 (continued) |
| | Portfolio of Investments September 30, 2013 (Unaudited) |
| | Principal | | | | Optional Call | | | | | |
| | Amount (000) | | Description (1) | | Provisions (2) | Ratings (3) | | | Value | |
| | | | Nevada – 2.9% | | | | | | | |
| $ | 1,250 | | Clark County, Nevada, Airport Revenue Bonds, Tender Option Bond Trust Series 11823, 20.185%, 1/01/36 (IF) | | 1/20 at 100.00 | A+ | | $ | 1,794,250 | |
| | 1,000 | | Clark County, Nevada, Passenger Facility Charge Revenue Bonds, Las Vegas-McCarran International Airport, Series 2010A, 5.250%, 7/01/42 | | 1/20 at 100.00 | A+ | | | 1,027,790 | |
| | 1,600 | | Las Vegas Valley Water District, Nevada, General Obligation Bonds, Series 2005A, 5.000%, 6/01/18 – FGIC Insured | | 6/15 at 100.00 | AA+ | | | 1,716,464 | |
| | 2,500 | | North Las Vegas, Nevada, General Obligation Bonds, Series 2006, 5.000%, 5/01/36 – NPFG Insured | | 5/16 at 100.00 | A | | | 2,307,450 | |
| | 6,350 | | Total Nevada | | | | | | 6,845,954 | |
| | | | New Jersey – 1.1% | | | | | | | |
| | 2,500 | | New Jersey Health Care Facilities Financing Authority, Revenue Bonds, Somerset Medical Center, Series 2003, 5.500%, 7/01/23 | | 11/13 at 100.00 | Ba2 | | | 2,500,700 | |
| | | | New Mexico – 3.0% | | | | | | | |
| | 1,000 | | New Mexico Mortgage Finance Authority, Multifamily Housing Revenue Bonds, St Anthony, Series 2007A, 5.250%, 9/01/42 (Alternative Minimum Tax) | | 9/17 at 100.00 | N/R | | | 968,180 | |
| | | | University of New Mexico, FHA-Insured Hospital Mortgage Revenue Bonds, University of Mexico Hospital Project, Series 2004: | | | | | | | |
| | 555 | | 4.625%, 1/01/25 – AGM Insured | | 7/14 at 100.00 | AA– | | | 559,840 | |
| | 660 | | 4.625%, 7/01/25 – AGM Insured | | 7/14 at 100.00 | AA– | | | 665,537 | |
| | 2,000 | | 4.750%, 7/01/27 – AGM Insured | | 7/14 at 100.00 | AA– | | | 2,013,640 | |
| | 3,000 | | 4.750%, 1/01/28 – AGM Insured | | 7/14 at 100.00 | AA– | | | 3,016,020 | |
| | 7,215 | | Total New Mexico | | | | | | 7,223,217 | |
| | | | New York – 7.3% | | | | | | | |
| | 1,700 | | Dormitory Authority of the State of New York, FHA Insured Mortgage Hospital Revenue Bonds, Kaleida Health, Series 2006, 4.700%, 2/15/35 | | 8/16 at 100.00 | AAA | | | 1,665,099 | |
| | 2,075 | | Dormitory Authority of the State of New York, State Personal Income Tax Revenue Bonds, Education Series 2007C, 5.000%, 3/15/14 | | No Opt. Call | AAA | | | 2,121,501 | |
| | 500 | | Hudson Yards Infrastructure Corporation, New York, Revenue Bonds, Senior Fiscal 2012 Series 2011A, 5.250%, 2/15/47 | | 2/21 at 100.00 | A | | | 511,140 | |
| | 1,805 | | Hudson Yards Infrastructure Corporation, New York, Revenue Bonds, Series 2006A, 5.000%, 2/15/47 – FGIC Insured | | 2/17 at 100.00 | A | | | 1,811,245 | |
| | 1,250 | | Metropolitan Transportation Authority, New York, Transportation Revenue Bonds, Refunding Series 2012F, 5.000%, 11/15/26 | | 11/22 at 100.00 | A | | | 1,368,875 | |
| | 2,000 | | New York City Municipal Water Finance Authority, New York, Water and Sewerage System Revenue Bonds, Series 2004B, 5.000%, 6/15/36 – AGM Insured (UB) | | 12/14 at 100.00 | AAA | | | 2,018,660 | |
| | 3,000 | | New York City Transitional Finance Authority, New York, Future Tax Secured Bonds, Subordinate Fiscal 2013 Series I, 5.000%, 5/01/38 | | 5/23 at 100.00 | AAA | | | 3,149,010 | |
| | 3,485 | | New York City Transitional Finance Authority, New York, Future Tax Secured Revenue Bonds, Subordinate Lien Series 2011E, 5.000%, 11/01/13 | | No Opt. Call | AAA | | | 3,499,707 | |
| | 1,135 | | Port Authority of New York and New Jersey, Special Project Bonds, JFK International Air Terminal LLC Project, Eighth Series 2010, 6.000%, 12/01/42 | | 12/20 at 100.00 | BBB | | | 1,219,558 | |
| | 16,950 | | Total New York | | | | | | 17,364,795 | |
| | | | Ohio – 3.5% | | | | | | | |
| | | | Buckeye Tobacco Settlement Financing Authority, Ohio, Tobacco Settlement Asset-Backed Revenue Bonds, Senior Lien, Series 2007A-2: | | | | | | | |
| | 2,080 | | 5.375%, 6/01/24 | | 6/17 at 100.00 | B– | | | 1,821,560 | |
| | 795 | | 5.125%, 6/01/24 | | 6/17 at 100.00 | B– | | | 678,827 | |
| | 2,475 | | 5.875%, 6/01/30 | | 6/17 at 100.00 | B | | | 1,975,768 | |
| | 775 | | 5.750%, 6/01/34 | | 6/17 at 100.00 | B | | | 590,457 | |
| | 2,680 | | 5.875%, 6/01/47 | | 6/17 at 100.00 | B | | | 2,018,522 | |
| | 1,105 | | Ohio Turnpike Commission, Turnpike Revenue Bonds, Infrastructure Project, Junior Lien Series 2013A-1, 5.000%, 2/15/48 | | 2/23 at 100.00 | A+ | | | 1,116,039 | |
| | 9,910 | | Total Ohio | | | | | | 8,201,173 | |
| | Principal | | | | Optional Call | | | | | |
| | Amount (000) | | Description (1) | | Provisions (2) | Ratings (3) | | | Value | |
| | | | Oklahoma – 1.7% | | | | | | | |
| $ | 1,000 | | Norman Regional Hospital Authority, Oklahoma, Hospital Revenue Bonds, Series 2005, 5.375%, 9/01/36 | | 9/16 at 100.00 | BBB– | | $ | 948,250 | |
| | 3,000 | | Oklahoma Development Finance Authority, Revenue Bonds, Saint John Health System, Series 2007, 5.000%, 2/15/42 | | 2/17 at 100.00 | A+ | | | 3,041,160 | |
| | 4,000 | | Total Oklahoma | | | | | | 3,989,410 | |
| | | | Pennsylvania – 0.6% | | | | | | | |
| | 1,500 | | Pennsylvania Turnpike Commission, Motor License Fund-Enhanced Subordinate Special Revenue Bonds, Series 2010B, 0.000%, 12/01/30 | | 12/20 at 100.00 | AA | | | 1,368,360 | |
| | | | Puerto Rico – 1.7% | | | | | | | |
| | 1,035 | | Puerto Rico Housing Finance Authority, Capital Fund Program Revenue Bonds, Series 2003, 5.000%, 12/01/20 | | 12/13 at 100.00 | AA– | | | 1,043,384 | |
| | 1,965 | | Puerto Rico Housing Finance Authority, Capital Fund Program Revenue Bonds, Series 2003, 5.000%, 12/01/20 (Pre-refunded 12/01/13) | | 12/13 at 100.00 | Aaa | | | 1,981,192 | |
| | 15,000 | | Puerto Rico Sales Tax Financing Corporation, Sales Tax Revenue Bonds, Series 2007A, 0.000%, 8/01/54 – AMBAC Insured | | No Opt. Call | AA– | | | 1,029,450 | |
| | 18,000 | | Total Puerto Rico | | | | | | 4,054,026 | |
| | | | Rhode Island – 2.4% | | | | | | | |
| | 5,835 | | Rhode Island Tobacco Settlement Financing Corporation, Tobacco Settlement Asset-Backed Bonds, Series 2002A, 6.250%, 6/01/42 | | 11/13 at 100.00 | BBB– | | | 5,712,582 | |
| | | | South Carolina – 3.0% | | | | | | | |
| | 475 | | College of Charleston, South Carolina, Academic and Administrative Facilities Revenue Bonds, Series 2004B, 5.125%, 4/01/30 (Pre-refunded 4/01/14) – SYNCORA GTY Insured | | 4/14 at 100.00 | A1 (4) | | | 486,652 | |
| | 700 | | Dorchester County School District 2, South Carolina, Installment Purchase Revenue Bonds, GROWTH, Series 2004, 5.250%, 12/01/20 (Pre-refunded 12/01/14) | | 12/14 at 100.00 | AA– (4) | | | 740,348 | |
| | 2,500 | | Lexington County Health Service District, South Carolina, Hospital Revenue Refunding and Improvement Bonds, Series 2003, 6.000%, 11/01/18 (Pre-refunded 11/01/13) | | 11/13 at 100.00 | AA– (4) | | | 2,512,575 | |
| | | | Medical University Hospital Authority, South Carolina, FHA-Insured Mortgage Revenue Bonds, Series 2004A: | | | | | | | |
| | 500 | | 5.250%, 8/15/20 (Pre-refunded 8/15/14) – NPFG Insured | | 8/14 at 100.00 | A (4) | | | 521,520 | |
| | 2,735 | | 5.250%, 2/15/21 (Pre-refunded 8/15/14) – NPFG Insured | | 8/14 at 100.00 | A (4) | | | 2,852,714 | |
| | 6,910 | | Total South Carolina | | | | | | 7,113,809 | |
| | | | South Dakota – 0.4% | | | | | | | |
| | 1,000 | | South Dakota Health and Educational Facilities Authority, Revenue Bonds, Sioux Valley Hospitals, Series 2004A, 5.250%, 11/01/34 | | 11/14 at 100.00 | A+ | | | 1,003,560 | |
| | | | Texas – 13.3% | | | | | | | |
| | 1,500 | | Central Texas Regional Mobility Authority, Revenue Bonds, Senior Lien Series 2005, 5.000%, 1/01/45 (Pre-refunded 1/01/15) – FGIC Insured | | 1/15 at 100.00 | A (4) | | | 1,587,600 | |
| | 250 | | Central Texas Regional Mobility Authority, Revenue Bonds, Senior Lien Series 2011, 6.000%, 1/01/41 | | 1/21 at 100.00 | Baa2 | | | 253,195 | |
| | 5,560 | | Grand Parkway Transportation Corporation, Texas, System Toll Revenue Bonds, First Tier Series 2013A, 5.500%, 4/01/53 | | 10/23 at 100.00 | BBB+ | | | 5,551,104 | |
| | 2,500 | | Harris County Health Facilities Development Corporation, Texas, Hospital Revenue Bonds, Texas Children’s Hospital, Series 1995, 5.500%, 10/01/16 – NPFG Insured (ETM) | | No Opt. Call | A (4) | | | 2,722,850 | |
| | 3,000 | | Harris County Health Facilities Development Corporation, Texas, Thermal Utility Revenue Bonds, TECO Project, Series 2003, 5.000%, 11/15/30 (Pre-refunded 11/15/13) – NPFG Insured | | 11/13 at 100.00 | AA (4) | | | 3,017,910 | |
| | | | Harris County-Houston Sports Authority, Texas, Revenue Bonds, Junior Lien Series 2001H: | | | | | | | |
| | 510 | | 0.000%, 11/15/24 – NPFG Insured | | No Opt. Call | A | | | 265,639 | |
| | 12,050 | | 0.000%, 11/15/41 – NPFG Insured | | 11/31 at 53.78 | A | | | 1,862,569 | |
| | 575 | | Houston, Texas, Hotel Occupancy Tax and Special Revenue Bonds, Convention and Entertainment Project, Series 2001B, 0.000%, 9/01/24 – AMBAC Insured | | No Opt. Call | A2 | | | 343,160 | |
| | 1,400 | | Kerrville Health Facilities Development Corporation, Texas, Revenue Bonds, Sid Peterson Memorial Hospital Project, Series 2005, 5.375%, 8/15/35 | | 2/16 at 100.00 | BBB– | | | 1,401,456 | |
| NXQ | Nuveen Select Tax-Free Income Portfolio 2 (continued) |
| | Portfolio of Investments September 30, 2013 (Unaudited) |
| | Principal | | | | Optional Call | | | | | |
| | Amount (000) | | Description (1) | | Provisions (2) | Ratings (3) | | | Value | |
| | | | Texas (continued) | | | | | | | |
| $ | 335 | | Live Oak, Texas, General Obligation Bonds, Series 2004, 5.250%, 8/01/20 – NPFG Insured | | 8/14 at 100.00 | Aa3 | | $ | 342,166 | |
| | 2,255 | | Love Field Airport Modernization Corporation, Texas, Special Facilities Revenue Bonds, Southwest Airlines Company, Series 2010, 5.250%, 11/01/40 | | 11/20 at 100.00 | BBB– | | | 2,229,180 | |
| | 2,500 | | Richardson Hospital Authority, Texas, Revenue Bonds, Richardson Regional Medical Center, Series 2004, 6.000%, 12/01/34 | | 12/13 at 100.00 | A+ | | | 2,516,075 | |
| | 1,000 | | San Antonio, Texas, Water System Revenue Bonds, Series 2005, 4.750%, 5/15/37 – NPFG Insured | | 5/15 at 100.00 | AA+ | | | 1,035,020 | |
| | 5,000 | | Texas Municipal Gas Acquisition and Supply Corporation III, Gas Supply Revenue Bonds, Series 2012, 5.000%, 12/15/26 | | No Opt. Call | A3 | | | 5,064,850 | |
| | 1,425 | | Texas State University System, Financing Revenue Bonds, Refunding Series 2006, 5.000%, 3/15/28 – AGM Insured | | 3/16 at 100.00 | Aa2 | | | 1,522,356 | |
| | 945 | | Texas Turnpike Authority, Central Texas Turnpike System Revenue Bonds, Second Tier Series 2002, 0.000%, 8/15/35 – AMBAC Insured | | 8/14 at 28.37 | A– | | | 255,434 | |
| | 1,560 | | Texas, General Obligation Bonds, Water Financial Assistance Program, Series 2003A, 5.125%, 8/01/42 (Alternative Minimum Tax) | | 11/13 at 100.00 | AAA | | | 1,560,343 | |
| | 42,365 | | Total Texas | | | | | | 31,530,907 | |
| | | | Utah – 1.3% | | | | | | | |
| | 1,435 | | Salt Lake City and Sandy Metropolitan Water District, Utah, Water Revenue Bonds, Series 2004, 5.000%, 7/01/21 (Pre-refunded 7/01/14) – AMBAC Insured | | 7/14 at 100.00 | AA+ (4) | | | 1,487,277 | |
| | 5,465 | | Utah Transit Authority, Sales Tax Revenue Bonds, Series 2007A, 0.000%, 6/15/36 | | 6/17 at 38.77 | A1 | | | 1,518,450 | |
| | 6,900 | | Total Utah | | | | | | 3,005,727 | |
| | | | Vermont – 0.0% | | | | | | | |
| | 85 | | Vermont Housing Finance Agency, Multifamily Housing Bonds, Series 1999C, 5.800%, 8/15/16 – AGM Insured | | 2/14 at 100.00 | AA– | | | 85,257 | |
| | | | Virginia – 3.3% | | | | | | | |
| | 1,000 | | Henrico County Economic Development Authority, Virginia, Residential Care Facility Revenue Bonds, Westminster Canterbury of Richmond, Series 2006, 5.000%, 10/01/35 | | 11/13 at 100.00 | BBB | | | 990,130 | |
| | 1,500 | | Metropolitan Washington Airports Authority, Virginia, Dulles Toll Road Revenue Bonds, Series 2009C, 0.000%, 10/01/41 – AGC Insured | | 10/26 at 100.00 | AA– | | | 1,385,160 | |
| | 2,500 | | Route 460 Funding Corporation, Virginia, Toll Road Revenue Bonds, Series 2012A, 5.125%, 7/01/49 | | No Opt. Call | BBB– | | | 2,209,100 | |
| | | | Virginia Small Business Financing Authority, Senior Lien Revenue Bonds, Elizabeth River Crossing, Opco LLC Project, Series 2012: | | | | | | | |
| | 1,000 | | 5.250%, 1/01/32 (Alternative Minimum Tax) | | 7/22 at 100.00 | BBB– | | | 943,850 | |
| | 500 | | 6.000%, 1/01/37 (Alternative Minimum Tax) | | 7/22 at 100.00 | BBB– | | | 501,630 | |
| | 1,010 | | 5.500%, 1/01/42 (Alternative Minimum Tax) | | 7/22 at 100.00 | BBB– | | | 948,080 | |
| | 1,000 | | Virginia Small Business Financing Authority, Wellmont Health System Project Revenue Bonds, Series 2007A, 5.250%, 9/01/37 | | 9/17 at 100.00 | BBB+ | | | 963,690 | |
| | 8,510 | | Total Virginia | | | | | | 7,941,640 | |
| | | | Washington – 0.4% | | | | | | | |
| | 990 | | Washington Health Care Facilities Authority, Revenue Bonds, Fred Hutchinson Cancer Research Center, Series 2011A, 5.625%, 1/01/35 | | 1/21 at 100.00 | A | | | 1,015,968 | |
| | | | Wisconsin – 1.5% | | | | | | | |
| | 2,000 | | Wisconsin Health and Educational Facilities Authority, Revenue Bonds, Gundersen Lutheran, Series 2011A, 5.250%, 10/15/39 | | 10/21 at 100.00 | A+ | | | 2,034,720 | |
| | 1,646 | | Wisconsin Health and Educational Facilities Authority, Revenue Bonds, Mercy Alliance, Inc., Series 2012, 5.000%, 6/01/39 | | 6/22 at 100.00 | A2 | | | 1,622,644 | |
| | 3,646 | | Total Wisconsin | | | | | | 3,657,364 | |
| $ | 323,861 | | Total Municipal Bonds (cost $233,191,090) | | | | | | 234,742,216 | |
| | Principal | | | | | | | | | | |
| | Amount (000) | | Description (1) | | Coupon | Maturity | Ratings (3) | | | Value | |
| | | | CORPORATE BONDS – 0.0% | | | | | | | | |
| | | | Transportation – 0.0% | | | | | | | | |
| $ | 302 | | Las Vegas Monorail Company, Senior Interest Bonds (5), (6) | | 5.500% | 7/15/19 | N/R | | $ | 45,671 | |
| | 87 | | Las Vegas Monorail Company, Senior Interest Bonds (5), (6) | | 3.000% | 7/15/55 | N/R | | | 8,818 | |
| $ | 389 | | Total Corporate Bonds (cost $11,438) | | | | | | | 54,489 | |
| | | | Total Long-Term Investments (cost $233,202,528) | | | | | | | 234,796,705 | |
| | | | Floating Rate Obligations – (0.4)% | | | | | | | (1,000,000 | ) |
| | | | Other Assets Less Liabilities – 1.6% | | | | | | | 3,801,794 | |
| | | | Net Assets – 100% | | | | | | $ | 237,598,499 | |
| (1) | All percentages shown in the Portfolio of Investments are based on net assets. |
| (2) | Optional Call Provisions: Dates (month and year) and prices of the earliest optional call or redemption. There may be other call provisions at varying prices at later dates. Certain mortgage-backed securities may be subject to periodic principal paydowns. |
| (3) | Ratings: Using the highest of Standard & Poor’s Group (“Standard & Poor’s”), Moody’s Investors Service, Inc. (“Moody’s”) or Fitch, Inc. (“Fitch”) rating. Ratings below BBB by Standard & Poor’s, Baa by Moody’s or BBB by Fitch are considered to be below investment grade. Holdings designated N/R are not rated by any of these national rating agencies. |
| (4) | Backed by an escrow or trust containing sufficient U.S. Government or U.S. Government agency securities which ensure the timely payment of principal and interest. Certain bonds backed by U.S. Government or agency securities are regarded as having an implied rating equal to the rating of such securities. |
| (5) | Investment valued at fair value using methods determined in good faith by, or at the discretion of, the Board of Trustees. For fair value measurement disclosure purposes, investment classified as Level 3. See Notes to Financial Statements, Note 2 – Investment Valuation and Fair Value Measurements for more information. |
| (6) | During January 2010, Las Vegas Monorail Company (“Las Vegas Monorail”) filed for federal bankruptcy protection. During March 2012, Las Vegas Monorail emerged from federal bankruptcy with the acceptance of a reorganization plan assigned by the Federal Bankruptcy Court. Under the reorganization plan, the Fund surrendered its Las Vegas Monorail Project Revenue Bonds, First Tier, Series 2000 and in turn received two senior interest corporate bonds: the first with an annual coupon rate of 5.500% maturing on July 15, 2019 and the second with an annual coupon rate of 3.000% (5.500% after December 31, 2015) maturing on July 15, 2055. The Fund’s custodian is not accruing income on the Fund’s records for either senior interest corporate bond. |
| (ETM) | Escrowed to maturity. |
| (IF) | Inverse floating rate investment. |
| (UB) | Underlying bond of an inverse floating rate trust reflected as a financing transaction. See Notes to Financial Statements, Note 3 – Portfolio Securities and Investments in Derivatives, Inverse Floating Rate Securities for more information. |
See accompanying notes to financial statements.
| NXR | |
| | Nuveen Select Tax-Free Income Portfolio 3 |
| | Portfolio of Investments |
| | September 30, 2013 (Unaudited) |
| | Principal | | | | Optional Call | | | | | |
| | Amount (000) | | Description (1) | | Provisions (2) | Ratings (3) | | | Value | |
| | | | LONG-TERM INVESTMENTS – 99.4% | | | | | | | |
| | | | MUNICIPAL BONDS – 99.4% | | | | | | | |
| | | | Alaska – 1.1% | | | | | | | |
| $ | 2,675 | | Northern Tobacco Securitization Corporation, Alaska, Tobacco Settlement Asset-Backed Bonds, Series 2006A, 5.000%, 6/01/32 | | 6/14 at 100.00 | B2 | | $ | 2,052,929 | |
| | | | California – 17.5% | | | | | | | |
| | 12,500 | | Anaheim Public Finance Authority, California, Subordinate Lease Revenue Bonds, Public Improvement Project, Series 1997C, 0.000%, 9/01/35 – AGM Insured | | No Opt. Call | AA– | | | 3,406,375 | |
| | 1,000 | | California County Tobacco Securitization Agency, Tobacco Settlement Asset-Backed Bonds, Los Angeles County Securitization Corporation, Series 2006A, 5.600%, 6/01/36 | | 12/18 at 100.00 | BB– | | | 817,590 | |
| | 1,125 | | California County Tobacco Securitization Agency, Tobacco Settlement Asset-Backed Bonds, Sonoma County Tobacco Securitization Corporation, Series 2005, 5.000%, 6/01/26 | | 6/15 at 100.00 | B– | | | 1,016,786 | |
| | 2,595 | | California Health Facilities Financing Authority, Revenue Bonds, Kaiser Permanante System, Series 2006, 5.000%, 4/01/37 | | 4/16 at 100.00 | A+ | | | 2,599,515 | |
| | 890 | | California Statewide Community Development Authority, Revenue Bonds, Methodist Hospital Project, Series 2009, 6.750%, 2/01/38 | | 8/19 at 100.00 | Aa2 | | | 1,034,848 | |
| | 290 | | California Statewide Financing Authority, Tobacco Settlement Asset-Backed Bonds, Pooled Tobacco Securitization Program, Series 2002A, 5.625%, 5/01/29 | | 11/13 at 100.00 | BBB | | | 280,181 | |
| | 2,275 | | Folsom Cordova Unified School District, Sacramento County, California, General Obligation Bonds, School Facilities Improvement District 4, Series 2007A, 0.000%, 10/01/28 – NPFG Insured | | No Opt. Call | A+ | | | 1,005,072 | |
| | 2,885 | | Golden State Tobacco Securitization Corporation, California, Enhanced Tobacco Settlement Asset-Backed Revenue Bonds, Series 2005A, 0.000%, 6/01/28 – AMBAC Insured | | No Opt. Call | A2 | | | 1,484,736 | |
| | | | Golden State Tobacco Securitization Corporation, California, Tobacco Settlement Asset-Backed Bonds, Series 2007A-1: | | | | | | | |
| | 750 | | 4.500%, 6/01/27 | | 6/17 at 100.00 | B | | | 649,178 | |
| | 2,090 | | 5.000%, 6/01/33 | | 6/17 at 100.00 | B | | | 1,619,144 | |
| | 4,055 | | Kern Community College District, California, General Obligation Bonds, Series 2003A, 0.000%, 3/01/28 – FGIC Insured | | No Opt. Call | Aa2 | | | 2,017,606 | |
| | 1,160 | | Mount San Antonio Community College District, Los Angeles County, California, General Obligation Bonds, Election of 2008, Series 2013A, 0.000%, 8/01/43 | | 8/35 at 100.00 | AA | | | 546,000 | |
| | 11,985 | | Norwalk La Mirada Unified School District, Los Angeles County, California, General Obligation Bonds, Election of 2002, Series 2007C, 0.000%, 8/01/32 – AGM Insured | | No Opt. Call | AA– | | | 4,328,982 | |
| | 3,000 | | Palomar Pomerado Health, California, General Obligation Bonds, Election of 2004, Series 2007A, 0.000%, 8/01/25 – NPFG Insured | | No Opt. Call | A+ | | | 1,728,930 | |
| | 8,040 | | Placentia-Yorba Linda Unified School District, Orange County, California, Certificates of Participation, Series 2006, 0.000%, 10/01/34 – FGIC Insured | | No Opt. Call | A+ | | | 2,385,307 | |
| | 1,500 | | Placer Union High School District, Placer County, California, General Obligation Bonds, Series 2004C, 0.000%, 8/01/32 – AGM Insured | | No Opt. Call | AA | | | 548,790 | |
| | 8,000 | | Poway Unified School District, San Diego County, California, School Facilities Improvement District 2007-1 General Obligation Bonds, Series 2009A, 0.000%, 8/01/32 | | No Opt. Call | Aa2 | | | 2,964,720 | |
| | 3,940 | | Rancho Mirage Redevelopment Agency, California, Tax Allocation Bonds, Combined Whitewater and 1984 Project Areas, Series 2003A, 0.000%, 4/01/35 – NPFG Insured | | No Opt. Call | A+ | | | 1,116,754 | |
| | 1,030 | | Riverside Public Financing Authority, California, Tax Allocation Bonds, University Corridor, Series 2007C, 5.000%, 8/01/37 – NPFG Insured | | 8/17 at 100.00 | A | | | 945,983 | |
| | 1,250 | | San Jose, California, Airport Revenue Bonds, Series 2004D, 5.000%, 3/01/28 – NPFG Insured | | 3/14 at 100.00 | A | | | 1,263,950 | |
| | 70,360 | | Total California | | | | | | 31,760,447 | |
| | Principal | | | | Optional Call | | | | | |
| | Amount (000) | | Description (1) | | Provisions (2) | Ratings (3) | | | Value | |
| | | | Colorado – 7.0% | | | | | | | |
| $ | 1,540 | | Arkansas River Power Authority, Colorado, Power Revenue Bonds, Series 2006, 5.250%, 10/01/40 – SYNCORA GTY Insured | | 10/16 at 100.00 | BBB– | | $ | 1,415,337 | |
| | 400 | | Colorado Department of Transportation, Certificates of Participation, Series 2004, 5.000%, 6/15/34 (Pre-refunded 6/15/14) – NPFG Insured | | 6/14 at 100.00 | AA– (4) | | | 413,688 | |
| | 2,000 | | Colorado Health Facilities Authority, Colorado, Revenue Bonds, Sisters of Charity of Leavenworth Health Services Corporation, Series 2010A, 5.000%, 1/01/40 | | 1/20 at 100.00 | AA | | | 2,008,380 | |
| | 1,000 | | Colorado Health Facilities Authority, Colorado, Revenue Bonds, Valley View Hospital Association, Series 2007, 5.250%, 5/15/42 | | 5/17 at 100.00 | BBB+ | | | 986,090 | |
| | 475 | | Denver City and County, Colorado, Airport System Revenue Bonds, Series 1991D, 7.750%, 11/15/13 (Alternative Minimum Tax) | | No Opt. Call | A+ | | | 479,323 | |
| | 1,935 | | Denver City and County, Colorado, Airport System Revenue Bonds, Subordinate Lien Series 2013B, 5.000%, 11/15/43 | | 11/23 at 100.00 | A | | | 1,936,413 | |
| | 3,000 | | Denver Convention Center Hotel Authority, Colorado, Revenue Bonds, Convention Center Hotel, Senior Lien Series 2003A, 5.000%, 12/01/24
(Pre-refunded 12/01/13) – SYNCORA GTY Insured | | 12/13 at 100.00 | N/R (4) | | | 3,024,420 | |
| | 5,520 | | E-470 Public Highway Authority, Colorado, Toll Revenue Bonds, Series 2004B, 0.000%, 9/01/28 – NPFG Insured | | 9/20 at 63.98 | A | | | 2,439,564 | |
| | 15,870 | | Total Colorado | | | | | | 12,703,215 | |
| | | | District of Columbia – 0.1% | | | | | | | |
| | 240 | | District of Columbia Tobacco Settlement Corporation, Tobacco Settlement Asset-Backed Bonds, Series 2001, 6.250%, 5/15/24 | | 11/13 at 100.00 | A1 | | | 242,347 | |
| | | | Florida – 1.8% | | | | | | | |
| | 2,340 | | Collier County, Florida, Special Obligation Revenue Bonds, Refunding Series 2012, 4.000%, 10/01/13 | | No Opt. Call | AA | | | 2,340,257 | |
| | 1,000 | | Hillsborough County Industrial Development Authority, Florida, Hospital Revenue Bonds, Tampa General Hospital, Series 2006, 5.250%, 10/01/41 | | 10/16 at 100.00 | A3 | | | 1,008,140 | |
| | 3,340 | | Total Florida | | | | | | 3,348,397 | |
| | | | Illinois – 13.3% | | | | | | | |
| | 3,500 | | Chicago Board of Education, Illinois, General Obligation Bonds, Series 1999A, 0.000%, 12/01/28 – FGIC Insured | | No Opt. Call | A+ | | | 1,379,035 | |
| | 15 | | Chicago Metropolitan Housing Development Corporation, Illinois, FHA-Insured Section 8 Assisted Housing Development Revenue Refunding Bonds, Series 1992, 6.850%, 7/01/22 | | 1/14 at 100.00 | AA | | | 15,038 | |
| | 2,000 | | Chicago, Illinois, General Obligation Bonds, Project & Refunding Series 2006A, 4.625%, 1/01/31 – AGM Insured | | 1/16 at 100.00 | AA– | | | 1,896,100 | |
| | 1,050 | | Illinois Finance Authority, Revenue Bonds, Loyola University of Chicago, Tender Option Bond Trust 1137, 9.242%, 7/01/15 (IF) | | No Opt. Call | Aa1 | | | 1,063,041 | |
| | 260 | | Illinois Finance Authority, Revenue Bonds, Rehabilitation Institute of Chicago, Series 2013A, 6.000%, 7/01/43 | | 7/23 at 100.00 | A– | | | 268,793 | |
| | 2,185 | | Illinois Finance Authority, Revenue Bonds, YMCA of Southwest Illinois, Series 2005, 5.000%, 9/01/31 – RAAI Insured | | 9/15 at 100.00 | Aa3 | | | 1,795,720 | |
| | 750 | | Illinois Finance Authority, Student Housing Revenue Bonds, Educational Advancement Fund Inc., University Center Project, Series 2006B, 5.000%, 5/01/25 | | 11/16 at 100.00 | BBB+ | | | 742,170 | |
| | 1,500 | | Illinois Health Facilities Authority, Revenue Bonds, Evangelical Hospitals Corporation, Series 1992C, 6.250%, 4/15/22 (ETM) | | No Opt. Call | N/R (4) | | | 1,857,255 | |
| | 2,255 | | Illinois Health Facilities Authority, Revenue Refunding Bonds, Elmhurst Memorial Healthcare, Series 2002, 6.250%, 1/01/17 | | 11/13 at 100.00 | Baa2 | | | 2,263,682 | |
| | 1,675 | | Illinois Housing Development Authority, Homeowner Mortgage Revenue Bonds, Series 2006C2, 5.050%, 8/01/27 (Alternative Minimum Tax) | | 2/16 at 100.00 | AA | | | 1,700,996 | |
| | 2,190 | | Illinois State, General Obligation Bonds, Refunding Series 2012, 5.000%, 8/01/23 | | No Opt. Call | A– | | | 2,311,808 | |
| | 1,000 | | Kankakee & Will Counties Community Unit School District 5, Illinois, General Obligation Bonds, Series 2006, 0.000%, 5/01/23 – AGM Insured | | No Opt. Call | Aa3 | | | 671,380 | |
| NXR | Nuveen Select Tax-Free Income Portfolio 3 (continued) |
| | Portfolio of Investments September 30, 2013 (Unaudited) |
| | Principal | | | | Optional Call | | | | | |
| | Amount (000) | | Description (1) | | Provisions (2) | Ratings (3) | | | Value | |
| | | | Illinois (continued) | | | | | | | |
| | | | Metropolitan Pier and Exposition Authority, Illinois, Revenue Bonds, McCormick Place Expansion Project, Series 2002A: | | | | | | | |
| $ | 2,500 | | 0.000%, 12/15/30 – NPFG Insured | | No Opt. Call | AAA | | $ | 955,200 | |
| | 4,775 | | 0.000%, 12/15/31 – NPFG Insured | | No Opt. Call | AAA | | | 1,694,934 | |
| | 5,000 | | 0.000%, 12/15/36 – NPFG Insured | | No Opt. Call | AAA | | | 1,267,950 | |
| | 2,000 | | 0.000%, 6/15/37 – NPFG Insured | | No Opt. Call | AAA | | | 491,280 | |
| | 1,300 | | Schaumburg, Illinois, General Obligation Bonds, Series 2004B, 5.250%, 12/01/34 (Pre-refunded 12/01/14) – FGIC Insured | | 12/14 at 100.00 | AAA | | | 1,375,660 | |
| | 2,000 | | Springfield, Illinois, Electric Revenue Bonds, Senior Lien Series 2007, 5.000%, 3/01/22 – NPFG Insured | | 3/17 at 100.00 | A | | | 2,077,560 | |
| | 310 | | University of Illinois, Health Services Facilities System Revenue Bonds, Series 2013, 6.000%, 10/01/42 | | 10/23 at 100.00 | A | | | 314,948 | |
| | 36,265 | | Total Illinois | | | | | | 24,142,550 | |
| | | | Indiana – 4.6% | | | | | | | |
| | 1,000 | | Franklin Community Multi-School Building Corporation, Johnson County, Indiana, First Mortgage Revenue Bonds, Series 2004, 5.000%, 7/15/22 (Pre-refunded 7/15/14) – FGIC Insured | | 7/14 at 100.00 | A+ (4) | | | 1,038,220 | |
| | 3,520 | | Indiana Health Facility Financing Authority, Hospital Revenue Bonds, Methodist Hospitals Inc., Series 2001, 5.375%, 9/15/22 | | 3/14 at 100.00 | BBB | | | 3,524,118 | |
| | 840 | | Indiana Health Facility Financing Authority, Hospital Revenue Refunding Bonds, Columbus Regional Hospital, Series 1993, 7.000%, 8/15/15 – AGM Insured | | No Opt. Call | AA– | | | 896,129 | |
| | 2,295 | | Shelbyville Central Renovation School Building Corporation, Indiana, First Mortgage Bonds, Series 2005, 4.375%, 7/15/25 – NPFG Insured | | 7/15 at 100.00 | AA+ | | | 2,365,984 | |
| | 1,000 | | Zionsville Community Schools Building Corporation, Indiana, First Mortgage Bonds, Series 2005Z, 0.000%, 7/15/28 – AGM Insured | | No Opt. Call | AA– | | | 523,790 | |
| | 8,655 | | Total Indiana | | | | | | 8,348,241 | |
| | | | Iowa – 2.7% | | | | | | | |
| | 2,745 | | Iowa Finance Authority, Health Facility Revenue Bonds, Care Initiatives Project, Series 2006A, 5.000%, 7/01/20 | | 7/16 at 100.00 | BB+ | | | 2,762,321 | |
| | 1,330 | | Iowa Finance Authority, Iowa, Midwestern Disaster Area Revenue Bonds, Iowa Fertilizer Company Project, Series 2013, 5.000%, 12/01/19 | | No Opt. Call | BB– | | | 1,295,500 | |
| | 950 | | Iowa Tobacco Settlement Authority, Tobacco Asset-Backed Revenue Bonds, Series 2005B, 5.600%, 6/01/34 | | 6/17 at 100.00 | B+ | | | 805,724 | |
| | 5,025 | | Total Iowa | | | | | | 4,863,545 | |
| | | | Kansas – 1.2% | | | | | | | |
| | | | Lawrence, Kansas, Hospital Revenue Bonds, Lawrence Memorial Hospital, Refunding Series 2006: | | | | | | | |
| | 1,425 | | 5.125%, 7/01/26 | | 7/16 at 100.00 | A1 | | | 1,455,495 | |
| | 700 | | 4.875%, 7/01/36 | | 7/16 at 100.00 | A1 | | | 695,191 | |
| | 2,125 | | Total Kansas | | | | | | 2,150,686 | |
| | | | Maryland – 0.3% | | | | | | | |
| | 550 | | Baltimore, Maryland, Senior Lien Convention Center Hotel Revenue Bonds, Series 2006A, 5.250%, 9/01/23 – SYNCORA GTY Insured | | 9/16 at 100.00 | BB+ | | | 549,973 | |
| | | | Michigan – 2.3% | | | | | | | |
| | 355 | | Detroit Water and Sewerage Department, Michigan, Sewage Disposal System Revenue Bonds, Refunding Senior Lien Series 2012A, 5.250%, 7/01/39 | | 7/22 at 100.00 | BBB+ | | | 321,563 | |
| | 3,510 | | Detroit, Michigan, Sewer Disposal System Revenue Bonds, Second Lien, Series 2006B, 4.625%, 7/01/34 – FGIC Insured | | 7/16 at 100.00 | A | | | 3,027,094 | |
| | 640 | | Detroit, Michigan, Water Supply System Second Lien Revenue Refunding Bonds, Series 2006C, 5.000%, 7/01/33 – AGM Insured | | No Opt. Call | AA– | | | 589,382 | |
| | 250 | | Royal Oak Hospital Finance Authority, Michigan, Hospital Revenue Bonds, William Beaumont Hospital, Refunding Series 2009V, 8.250%, 9/01/39 | | 9/18 at 100.00 | A1 | | | 300,555 | |
| | 4,755 | | Total Michigan | | | | | | 4,238,594 | |
| | Principal | | | | Optional Call | | | | | |
| | Amount (000) | | Description (1) | | Provisions (2) | Ratings (3) | | | Value | |
| | | | Mississippi – 0.4% | | | | | | | |
| $ | 725 | | Mississippi Hospital Equipment and Facilities Authority, Revenue Bonds, Baptist Memorial Healthcare, Series 2004B-1, 5.000%, 9/01/24 | | 9/14 at 100.00 | AA– | | $ | 750,571 | |
| | | | Missouri – 0.2% | | | | | | | |
| | 270 | | Bi-State Development Agency of the Missouri-Illinois Metropolitan District, Mass Transit Sales Tax Appropriation Bonds, Refunding Combined Lien Series 2013A, 5.000%, 10/01/28 | | 10/18 at 100.00 | AA+ | | | 288,657 | |
| | | | Montana – 0.8% | | | | | | | |
| | 1,440 | | Montana Facilities Finance Authority, Revenue Bonds, Sisters of Charity of Leavenworth Health Services Corporation, Camposite Deal Series 2010A, 4.750%, 1/01/40 | | 1/20 at 100.00 | AA | | | 1,443,758 | |
| | | | Nevada – 2.8% | | | | | | | |
| | 1,000 | | Clark County, Nevada, Passenger Facility Charge Revenue Bonds, Las Vegas-McCarran International Airport, Series 2010A, 5.250%, 7/01/42 | | 1/20 at 100.00 | A+ | | | 1,027,790 | |
| | 1,625 | | Las Vegas Valley Water District, Nevada, General Obligation Bonds, Series 2005A, 5.000%, 6/01/18 – FGIC Insured | | 6/15 at 100.00 | AA+ | | | 1,743,284 | |
| | 2,500 | | North Las Vegas, Nevada, General Obligation Bonds, Series 2006, 5.000%, 5/01/36 – NPFG Insured | | 5/16 at 100.00 | A | | | 2,307,450 | |
| | 5,125 | | Total Nevada | | | | | | 5,078,524 | |
| | | | New Jersey – 1.2% | | | | | | | |
| | 4,570 | | New Jersey Transportation Trust Fund Authority, Transportation System Bonds, Series 2006C, 0.000%, 12/15/28 – AMBAC Insured | | No Opt. Call | A+ | | | 2,099,595 | |
| | | | New Mexico – 2.8% | | | | | | | |
| | 1,000 | | New Mexico Mortgage Finance Authority, Multifamily Housing Revenue Bonds, St Anthony, Series 2007A, 5.250%, 9/01/42 (Alternative Minimum Tax) | | 9/17 at 100.00 | N/R | | | 968,180 | |
| | 4,000 | | University of New Mexico, FHA-Insured Hospital Mortgage Revenue Bonds, University of Mexico Hospital Project, Series 2004, 4.625%, 1/01/25 – AGM Insured | | 7/14 at 100.00 | AA– | | | 4,034,880 | |
| | 5,000 | | Total New Mexico | | | | | | 5,003,060 | |
| | | | New York – 6.4% | | | | | | | |
| | 1,025 | | Dormitory Authority of the State of New York, FHA Insured Mortgage Hospital Revenue Bonds, Kaleida Health, Series 2006, 4.700%, 2/15/35 | | 8/16 at 100.00 | AAA | | | 1,003,957 | |
| | 3,750 | | Long Island Power Authority, New York, Electric System General Revenue Bonds, Series 2004A, 5.000%, 9/01/34 – BHAC Insured | | 9/14 at 100.00 | AA+ | | | 3,852,563 | |
| | 2,385 | | Long Island Power Authority, New York, Electric System Revenue Bonds, Refunding Series 2010A, 5.000%, 5/01/14 | | No Opt. Call | A– | | | 2,447,249 | |
| | 1,250 | | Metropolitan Transportation Authority, New York, Transportation Revenue Bonds, Refunding Series 2012F, 5.000%, 11/15/26 | | 11/22 at 100.00 | A | | | 1,368,875 | |
| | 2,500 | | New York City Transitional Finance Authority, New York, Future Tax Secured Bonds, Fiscal Series 2007B, 4.750%, 11/01/27 | | 5/17 at 100.00 | AAA | | | 2,664,125 | |
| | 265 | | Port Authority of New York and New Jersey, Special Project Bonds, JFK International Air Terminal LLC Project, Eighth Series 2010, 6.000%, 12/01/42 | | 12/20 at 100.00 | BBB | | | 284,743 | |
| | 11,175 | | Total New York | | | | | | 11,621,512 | |
| | | | Ohio – 3.9% | | | | | | | |
| | | | Buckeye Tobacco Settlement Financing Authority, Ohio, Tobacco Settlement Asset-Backed Revenue Bonds, Senior Lien, Series 2007A-2: | | | | | | | |
| | 1,345 | | 5.375%, 6/01/24 | | 6/17 at 100.00 | B– | | | 1,177,884 | |
| | 1,465 | | 6.000%, 6/01/42 | | 6/17 at 100.00 | BB+ | | | 1,123,977 | |
| | 435 | | 5.875%, 6/01/47 | | 6/17 at 100.00 | B | | | 327,633 | |
| | 3,720 | | Buckeye Tobacco Settlement Financing Authority, Ohio, Tobacco Settlement Asset-Backed Revenue Bonds, Senior Lien, Series 2007A-3, 6.250%, 6/01/37 | | 6/22 at 100.00 | B | | | 2,966,886 | |
| | 1,475 | | Ohio Turnpike Commission, Turnpike Revenue Bonds, Infrastructure Project, Junior Lien Series 2013A-1, 5.000%, 2/15/48 | | 2/23 at 100.00 | A+ | | | 1,489,735 | |
| | 8,440 | | Total Ohio | | | | | | 7,086,115 | |
| NXR | Nuveen Select Tax-Free Income Portfolio 3 (continued) |
| | Portfolio of Investments September 30, 2013 (Unaudited) |
| | Principal | | | | Optional Call | | | | | |
| | Amount (000) | | Description (1) | | Provisions (2) | Ratings (3) | | | Value | |
| | | | Oklahoma – 1.7% | | | | | | | |
| $ | 3,000 | | Oklahoma Development Finance Authority, Revenue Bonds, St. John Health System, Series 2004, 5.000%, 2/15/24 (Pre-refunded 2/15/14) | | 2/14 at 100.00 | A+ (4) | | $ | 3,053,520 | |
| | | | Pennsylvania – 2.3% | | | | | | | |
| | 2,435 | | Dauphin County Industrial Development Authority, Pennsylvania, Water Development Revenue Refunding Bonds, Dauphin Consolidated Water Supply Company, Series 1992B, 6.700%, 6/01/17 | | No Opt. Call | A– | | | 2,821,873 | |
| | 500 | | Pennsylvania Higher Educational Facilities Authority, Revenue Bonds, Widener University, Series 2003, 5.250%, 7/15/24 | | 11/13 at 100.00 | A– | | | 501,570 | |
| | 1,000 | | Pennsylvania Turnpike Commission, Motor License Fund-Enhanced Subordinate Special Revenue Bonds, Series 2010B, 0.000%, 12/01/30 | | 12/20 at 100.00 | AA | | | 912,240 | |
| | 3,935 | | Total Pennsylvania | | | | | | 4,235,683 | |
| | | | Puerto Rico – 2.4% | | | | | | | |
| | 945 | | Puerto Rico Highway and Transportation Authority, Highway Revenue Bonds, Series 2007N, 5.250%, 7/01/31 – AMBAC Insured | | No Opt. Call | BBB | | | 728,123 | |
| | 1,000 | | Puerto Rico Sales Tax Financing Corporation, Sales Tax Revenue Bonds, First Subordinate Series 2009A, 6.000%, 8/01/42 | | 8/19 at 100.00 | A+ | | | 815,830 | |
| | | | Puerto Rico Sales Tax Financing Corporation, Sales Tax Revenue Bonds, Series 2007A: | | | | | | | |
| | 1,170 | | 0.000%, 8/01/40 – NPFG Insured | | No Opt. Call | AA– | | | 205,043 | |
| | 12,000 | | 0.000%, 8/01/41 – NPFG Insured | | No Opt. Call | AA– | | | 1,975,080 | |
| | 9,015 | | 0.000%, 8/01/54 – AMBAC Insured | | No Opt. Call | AA– | | | 618,699 | |
| | 24,130 | | Total Puerto Rico | | | | | | 4,342,775 | |
| | | | Rhode Island – 0.6% | | | | �� | | | |
| | 1,150 | | Rhode Island Economic Development Corporation, Airport Revenue Bonds, Refunding Series 2005A, 4.625%, 7/01/26 – NPFG Insured (Alternative Minimum Tax) | | 7/15 at 100.00 | A | | | 1,134,165 | |
| | | | South Carolina – 1.7% | | | | | | | |
| | 1,500 | | Lexington County Health Service District, South Carolina, Hospital Revenue Refunding and Improvement Bonds, Series 2003, 6.000%, 11/01/18 (Pre-refunded 11/01/13) | | 11/13 at 100.00 | AA– (4) | | | 1,507,545 | |
| | 1,500 | | Medical University Hospital Authority, South Carolina, FHA-Insured Mortgage Revenue Bonds, Series 2004A, 5.250%, 8/15/20 (Pre-refunded 8/15/14) – NPFG Insured | | 8/14 at 100.00 | A (4) | | | 1,564,560 | |
| | 3,000 | | Total South Carolina | | | | | | 3,072,105 | |
| | | | South Dakota – 0.5% | | | | | | | |
| | 1,000 | | South Dakota Health and Educational Facilities Authority, Revenue Bonds, Sioux Valley Hospitals, Series 2004A, 5.250%, 11/01/34 | | 11/14 at 100.00 | A+ | | | 1,003,560 | |
| | | | Texas – 11.5% | | | | | | | |
| | 1,500 | | Central Texas Regional Mobility Authority, Revenue Bonds, Senior Lien Series 2005, 5.000%, 1/01/45 (Pre-refunded 1/01/15) – FGIC Insured | | 1/15 at 100.00 | A (4) | | | 1,587,600 | |
| | 250 | | Central Texas Regional Mobility Authority, Revenue Bonds, Senior Lien Series 2011, 6.000%, 1/01/41 | | 1/21 at 100.00 | Baa2 | | | 253,195 | |
| | 4,640 | | Grand Parkway Transportation Corporation, Texas, System Toll Revenue Bonds, First Tier Series 2013A, 5.500%, 4/01/53 | | 10/23 at 100.00 | BBB+ | | | 4,632,576 | |
| | 2,500 | | Harris County Health Facilities Development Corporation, Texas, Thermal Utility Revenue Bonds, TECO Project, Series 2003, 5.000%, 11/15/30 (Pre-refunded 11/15/13) – NPFG Insured | | 11/13 at 100.00 | AA (4) | | | 2,514,925 | |
| | | | Harris County-Houston Sports Authority, Texas, Revenue Bonds, Junior Lien Series 2001H: | | | | | | | |
| | 1,095 | | 0.000%, 11/15/32 – NPFG Insured | | 11/31 at 94.05 | A | | | 319,817 | |
| | 2,510 | | 0.000%, 11/15/36 – NPFG Insured | | 11/31 at 73.51 | A | | | 548,008 | |
| | Principal | | | | Optional Call | | | | | |
| | Amount (000) | | Description (1) | | Provisions (2) | Ratings (3) | | | Value | |
| | | | Texas (continued) | | | | | | | |
| $ | 2,035 | | Harris County-Houston Sports Authority, Texas, Revenue Bonds, Third Lien Series 2004A-3, 0.000%, 11/15/32 – NPFG Insured | | 11/24 at 62.70 | A | | $ | 594,362 | |
| | | | Harris County-Houston Sports Authority, Texas, Senior Lien Revenue Refunding Bonds, Series 2001A: | | | | | | | |
| | 2,695 | | 0.000%, 11/15/34 – NPFG Insured | | 11/30 at 78.27 | A | | | 728,405 | |
| | 4,095 | | 0.000%, 11/15/38 – NPFG Insured | | 11/30 at 61.17 | A | | | 822,890 | |
| | 1,275 | | Kerrville Health Facilities Development Corporation, Texas, Revenue Bonds, Sid Peterson Memorial Hospital Project, Series 2005, 5.375%, 8/15/35 | | 2/16 at 100.00 | BBB– | | | 1,276,326 | |
| | 2,255 | | Love Field Airport Modernization Corporation, Texas, Special Facilities Revenue Bonds, Southwest Airlines Company, Series 2010, 5.250%, 11/01/40 | | 11/20 at 100.00 | BBB– | | | 2,229,180 | |
| | 290 | | North Texas Tollway Authority, First Tier System Revenue Refunding Bonds, Capital Appreciation Series 2008I, 0.000%, 1/01/42 – AGC Insured | | 1/25 at 100.00 | AA– | | | 303,807 | |
| | 2,000 | | Texas Municipal Gas Acquisition and Supply Corporation III, Gas Supply Revenue Bonds, Series 2012, 5.000%, 12/15/32 | | No Opt. Call | A3 | | | 1,897,940 | |
| | 2,410 | | Texas Turnpike Authority, Central Texas Turnpike System Revenue Bonds, First Tier Series 2002A, 0.000%, 8/15/25 – AMBAC Insured | | No Opt. Call | A– | | | 1,358,903 | |
| | 1,750 | | Texas, General Obligation Bonds, Water Financial Assistance Program, Series 2003A, 5.125%, 8/01/42 (Alternative Minimum Tax) | | 11/13 at 100.00 | AAA | | | 1,750,385 | |
| | 31,300 | | Total Texas | | | | | | 20,818,319 | |
| | | | Utah – 0.8% | | | | | | | |
| | 5,465 | | Utah Transit Authority, Sales Tax Revenue Bonds, Series 2007A, 0.000%, 6/15/36 | | 6/17 at 38.77 | A1 | | | 1,518,450 | |
| | | | Virginia – 3.3% | | | | | | | |
| | 3,500 | | Chesapeake, Virginia, Transportation System Senior Toll Road Revenue Bonds, Capital Appreciation Series 2012B, 0.000%, 7/15/32 | | 7/28 at 100.00 | BBB | | | 1,719,795 | |
| | 1,000 | | Henrico County Economic Development Authority, Virginia, Residential Care Facility Revenue Bonds, Westminster Canterbury of Richmond, Series 2006, 5.000%, 10/01/35 | | 11/13 at 100.00 | BBB | | | 990,130 | |
| | 1,500 | | Route 460 Funding Corporation, Virginia, Toll Road Revenue Bonds, Series 2012A, 5.125%, 7/01/49 | | No Opt. Call | BBB– | | | 1,325,460 | |
| | | | Virginia Small Business Financing Authority, Senior Lien Revenue Bonds, Elizabeth River Crossing, Opco LLC Project, Series 2012: | | | | | | | |
| | 500 | | 6.000%, 1/01/37 (Alternative Minimum Tax) | | 7/22 at 100.00 | BBB– | | | 501,630 | |
| | 1,510 | | 5.500%, 1/01/42 (Alternative Minimum Tax) | | 7/22 at 100.00 | BBB– | | | 1,417,437 | |
| | 8,010 | | Total Virginia | | | | | | 5,954,452 | |
| | | | Washington – 2.8% | | | | | | | |
| | 990 | | Washington Health Care Facilities Authority, Revenue Bonds, Fred Hutchinson Cancer Research Center, Series 2011A, 5.625%, 1/01/35 | | 1/21 at 100.00 | A | | | 1,015,968 | |
| | 4,000 | | Washington Health Care Facilities Authority, Revenue Bonds, Providence Health & Services, Series 2012A, 5.000%, 10/01/32 | | 10/22 at 100.00 | AA | | | 4,049,880 | |
| | 4,990 | | Total Washington | | | | | | 5,065,848 | |
| | | | Wisconsin – 1.4% | | | | | | | |
| | 1,250 | | Wisconsin Health and Educational Facilities Authority, Revenue Bonds, Marshfield Clinic, Series 2012B, 5.000%, 2/15/32 | | 2/22 at 100.00 | A– | | | 1,246,213 | |
| | 1,325 | | Wisconsin, General Obligation Refunding Bonds, Series 2003-3, 5.000%, 11/01/26 | | 11/13 at 100.00 | AA | | | 1,330,321 | |
| | 2,575 | | Total Wisconsin | | | | | | 2,576,534 | |
| $ | 275,160 | | Total Municipal Bonds (cost $176,864,784) | | | | | | 180,548,127 | |
| NXR | Nuveen Select Tax-Free Income Portfolio 3 (continued) |
| | Portfolio of Investments September 30, 2013 (Unaudited) |
| | Principal | | | | | | | | | | |
| | Amount (000) | | Description (1) | | Coupon | Maturity | Ratings (3) | | | Value | |
| | | | CORPORATE BONDS – 0.0% | | | | | | | | |
| | | | Transportation – 0.0% | | | | | | | | |
| $ | 85 | | Las Vegas Monorail Company, Senior Interest Bonds (5), (6) | | 5.500% | 7/15/19 | N/R | | $ | 12,870 | |
| | 25 | | Las Vegas Monorail Company, Senior Interest Bonds (5), (6) | | 3.000% | 7/15/55 | N/R | | | 2,485 | |
| $ | 110 | | Total Corporate Bonds (cost $3,223) | | | | | | | 15,355 | |
| | | | Total Long-Term Investments (cost $176,868,007) | | | | | | | 180,563,482 | |
| | | | Other Assets Less Liabilities – 0.6% | | | | | | | 1,170,236 | |
| | | | Net Assets – 100% | | | | | | $ | 181,733,718 | |
| (1) | All percentages shown in the Portfolio of Investments are based on net assets. |
| (2) | Optional Call Provisions: Dates (month and year) and prices of the earliest optional call or redemption. There may be other call provisions at varying prices at later dates. Certain mortgage-backed securities may be subject to periodic principal paydowns. |
| (3) | Ratings: Using the highest of Standard & Poor’s Group (“Standard & Poor’s”), Moody’s Investors Service, Inc. (“Moody’s”) or Fitch, Inc. (“Fitch”) rating. Ratings below BBB by Standard & Poor’s, Baa by Moody’s or BBB by Fitch are considered to be below investment grade. Holdings designated N/R are not rated by any of these national rating agencies. |
| (4) | Backed by an escrow or trust containing sufficient U.S. Government or U.S. Government agency securities which ensure the timely payment of principal and interest. Certain bonds backed by U.S. Government or agency securities are regarded as having an implied rating equal to the rating of such securities. |
| (5) | Investment valued at fair value using methods determined in good faith by, or at the discretion of, the Board of Trustees. For fair value measurement disclosure purposes, investment classified as Level 3. See Notes to Financial Statements, Note 2 – Investment Valuation and Fair Value Measurements for more information. |
| (6) | During January 2010, Las Vegas Monorail Company (“Las Vegas Monorail”) filed for federal bankruptcy protection. During March 2012, Las Vegas Monorail emerged from federal bankruptcy with the acceptance of a reorganization plan assigned by the Federal Bankruptcy Court. Under the reorganization plan, the Fund surrendered its Las Vegas Monorail Project Revenue Bonds, First Tier, Series 2000 and in turn received two senior interest corporate bonds: the first with an annual coupon rate of 5.500% maturing on July 15, 2019 and the second with an annual coupon rate of 3.000% (5.500% after December 31, 2015) maturing on July 15, 2055. The Fund’s custodian is not accruing income on the Fund’s records for either senior interest corporate bond. |
| (ETM) | Escrowed to maturity. |
| (IF) | Inverse floating rate investment. |
See accompanying notes to financial statements.
| NXC | |
| | Nuveen California Select Tax-Free Income Portfolio |
| | Portfolio of Investments |
| | September 30, 2013 (Unaudited) |
| | Principal | | | | Optional Call | | | | | |
| | Amount (000) | | Description (1) | | Provisions (2) | Ratings (3) | | | Value | |
| | | | LONG-TERM INVESTMENTS – 98.3% | | | | | | | |
| | | | MUNICIPAL BONDS – 98.3% | | | | | | | |
| | | | Consumer Staples – 3.8% | | | | | | | |
| $ | 95 | | California County Tobacco Securitization Agency, Tobacco Settlement Asset-Backed Bonds, Sonoma County Tobacco Securitization Corporation, Series 2005, 4.250%, 6/01/21 | | 6/15 at 100.00 | BB+ | | $ | 89,690 | |
| | 385 | | California County Tobacco Securitization Agency, Tobacco Settlement Asset-Backed Revenue Bonds, Fresno County Tobacco Funding Corporation, Series 2002, 5.625%, 6/01/23 | | 11/13 at 100.00 | A3 | | | 385,982 | |
| | | | Golden State Tobacco Securitization Corporation, California, Tobacco Settlement Asset-Backed Bonds, Series 2007A-1: | | | | | | | |
| | 1,065 | | 5.750%, 6/01/47 | | 6/17 at 100.00 | B | | | 821,477 | |
| | 1,885 | | 5.125%, 6/01/47 | | 6/17 at 100.00 | B | | | 1,320,744 | |
| | 1,095 | | Golden State Tobacco Securitization Corporation, California, Tobacco Settlement Asset-Backed Bonds, Series 2007A-2, 5.300%, 6/01/37 | | 6/22 at 100.00 | B | | | 825,028 | |
| | 4,525 | | Total Consumer Staples | | | | | | 3,442,921 | |
| | | | Education and Civic Organizations – 3.9% | | | | | | | |
| | 3,000 | | California Educational Facilities Authority, Revenue Bonds, Santa Clara University, Series 2008A, 5.625%, 4/01/37 | | 4/18 at 100.00 | Aa3 | | | 3,201,600 | |
| | 45 | | California Educational Facilities Authority, Revenue Bonds, University of Redlands, Series 2005A, 5.000%, 10/01/35 | | 10/15 at 100.00 | A3 | | | 45,362 | |
| | | | California Educational Facilities Authority, Revenue Bonds, University of the Pacific, Series 2006: | | | | | | | |
| | 35 | | 5.000%, 11/01/21 | | 11/15 at 100.00 | A2 | | | 36,683 | |
| | 45 | | 5.000%, 11/01/25 | | 11/15 at 100.00 | A2 | | | 46,496 | |
| | 250 | | California Statewide Communities Development Authority, School Facility Revenue Bonds, Alliance College-Ready Public Schools, Series 2011A, 7.000%, 7/01/46 | | 7/21 at 100.00 | BBB– | | | 261,350 | |
| | 3,375 | | Total Education and Civic Organizations | | | | | | 3,591,491 | |
| | | | Health Care – 9.3% | | | | | | | |
| | 235 | | California Health Facilities Financing Authority, Revenue Bonds, Rady Children’s Hospital – San Diego, Series 2011, 5.250%, 8/15/41 | | 8/21 at 100.00 | A+ | | | 241,775 | |
| | 2,550 | | California Health Facilities Financing Authority, Revenue Bonds, Sutter Health, Series 2007A, 5.250%, 11/15/46 (UB) | | 11/16 at 100.00 | AA– | | | 2,561,756 | |
| | 425 | | California Statewide Community Development Authority, Revenue Bonds, Childrens Hospital of Los Angeles, Series 2007, 5.000%, 8/15/47 | | 8/17 at 100.00 | BBB+ | | | 381,778 | |
| | 545 | | California Statewide Community Development Authority, Revenue Bonds, Kaiser Permanente System, Series 2001C, 5.250%, 8/01/31 | | 8/16 at 100.00 | A+ | | | 553,486 | |
| | 1,505 | | California Statewide Community Development Authority, Revenue Bonds, Kaiser Permanente System, Series 2007A, 4.750%, 4/01/33 | | 4/17 at 100.00 | A+ | | | 1,492,719 | |
| | 540 | | Loma Linda, California, Hospital Revenue Bonds, Loma Linda University Medical Center, Series 2008A, 8.250%, 12/01/38 | | 12/17 at 100.00 | BBB | | | 591,338 | |
| | 1,100 | | Palomar Pomerado Health Care District, California, Certificates of Participation, Series 2010, 6.000%, 11/01/41 | | 11/20 at 100.00 | Baa3 | | | 1,070,828 | |
| | 670 | | San Buenaventura, California, Revenue Bonds, Community Memorial Health System, Series 2011, 7.500%, 12/01/41 | | 12/21 at 100.00 | BB | | | 734,528 | |
| | 800 | | Upland, California, Certificates of Participation, San Antonio Community Hospital, Series 2011, 6.500%, 1/01/41 | | 1/21 at 100.00 | A | | | 877,008 | |
| | 8,370 | | Total Health Care | | | | | | 8,505,216 | |
| NXC | Nuveen California Select Tax-Free Income Portfolio (continued) |
| | Portfolio of Investments September 30, 2013 (Unaudited) |
| | Principal | | | | Optional Call | | | | | |
| | Amount (000) | | Description (1) | | Provisions (2) | Ratings (3) | | | Value | |
| | | | Housing/Multifamily – 0.8% | | | | | | | |
| $ | 375 | | California Municipal Finance Authority, Mobile Home Park Revenue Bonds, Caritas Projects Series 2010A, 6.400%, 8/15/45 | | 8/20 at 100.00 | BBB | | $ | 388,823 | |
| | 395 | | California Municipal Finance Authority, Mobile Home Park Revenue Bonds, Caritas Projects Series 2012A, 5.500%, 8/15/47 | | 8/22 at 100.00 | BBB | | | 385,492 | |
| | 770 | | Total Housing/Multifamily | | | | | | 774,315 | |
| | | | Housing/Single Family – 0.1% | | | | | | | |
| | 40 | | California Housing Finance Agency, Home Mortgage Revenue Bonds, Series 2006H, 5.750%, 8/01/30 – FGIC Insured (Alternative Minimum Tax) | | 2/16 at 100.00 | BBB | | | 41,829 | |
| | | | Industrials – 1.2% | | | | | | | |
| | 1,015 | | California Pollution Control Financing Authority, Solid Waste Disposal Revenue Bonds, Republic Services Inc., Series 2002C, 5.250%, 6/01/23 (Mandatory put 12/01/17) (Alternative Minimum Tax) | | No Opt. Call | BBB | | | 1,089,623 | |
| | | | Tax Obligation/General – 38.3% | | | | | | | |
| | 750 | | California State, General Obligation Bonds, Series 2004, 5.000%, 2/01/23 | | 2/14 at 100.00 | A1 | | | 760,853 | |
| | 1,650 | | California State, General Obligation Bonds, Various Purpose Series 2009, 5.500%, 11/01/39 | | 11/19 at 100.00 | A1 | | | 1,776,011 | |
| | 1,965 | | California State, General Obligation Bonds, Various Purpose Series 2011, 5.000%, 10/01/41 | | 10/21 at 100.00 | A1 | | | 2,011,846 | |
| | 2,000 | | California State, General Obligation Bonds, Various Purpose Series 2012, 5.250%, 4/01/35 | | 4/22 at 100.00 | A1 | | | 2,120,960 | |
| | 6,225 | | Escondido Union High School District, San Diego County, California, General Obligation Refunding Bonds, Series 2009, 0.000%, 8/01/36 – AGM Insured | | No Opt. Call | Aa2 | | | 1,795,166 | |
| | | | Golden West Schools Financing Authority, California, General Obligation Revenue Refunding Bonds, School District Program, Series 1999A: | | | | | | | |
| | 4,650 | | 0.000%, 8/01/16 – NPFG Insured | | No Opt. Call | A | | | 4,267,766 | |
| | 1,750 | | 0.000%, 2/01/17 – NPFG Insured | | No Opt. Call | A | | | 1,561,893 | |
| | 2,375 | | 0.000%, 8/01/17 – NPFG Insured | | No Opt. Call | A | | | 2,075,703 | |
| | 2,345 | | 0.000%, 2/01/18 – NPFG Insured | | No Opt. Call | A | | | 2,008,539 | |
| | | | Mountain View-Los Altos Union High School District, Santa Clara County, California, General Obligation Capital Appreciation Bonds, Series 1995C: | | | | | | | |
| | 1,015 | | 0.000%, 5/01/17 – NPFG Insured | | No Opt. Call | Aa1 | | | 962,870 | |
| | 1,080 | | 0.000%, 5/01/18 – NPFG Insured | | No Opt. Call | Aa1 | | | 991,084 | |
| | | | Palomar Pomerado Health, California, General Obligation Bonds, Convertible Capital Appreciation, Election 2004 Series 2010A: | | | | | | | |
| | 10,825 | | 0.000%, 8/01/34 | | No Opt. Call | A+ | | | 3,322,407 | |
| | 3,250 | | 0.000%, 8/01/35 | | No Opt. Call | A+ | | | 936,520 | |
| | 3,220 | | Sacramento City Unified School District, Sacramento County, California, General Obligation Bonds, Series 2005, 5.000%, 7/01/27 – NPFG Insured | | 7/15 at 100.00 | A1 | | | 3,378,358 | |
| | 8,075 | | San Bernardino Community College District, California, General Obligation Bonds, Election of 2008 Series 2009B, 0.000%, 8/01/44 | | No Opt. Call | Aa2 | | | 1,236,121 | |
| | 7,560 | | Southwestern Community College District, San Diego County, California, General Obligation Bonds, Election of 2008, Series 2011C, 0.000%, 8/01/46 | | No Opt. Call | Aa2 | | | 1,103,231 | |
| | 2,565 | | Sunnyvale School District, Santa Clara County, California, General Obligation Bonds, Series 2005A, 5.000%, 9/01/26 – AGM Insured | | 9/15 at 100.00 | AA | | | 2,749,295 | |
| | 4,250 | | West Hills Community College District, California, General Obligation Bonds, School Facilities Improvement District 3, 2008 Election Series 2011, 0.000%, 8/01/38 – AGM Insured | | 8/31 at 100.00 | AA– | | | 2,108,085 | |
| | 65,550 | | Total Tax Obligation/General | | | | | | 35,166,708 | |
| | | | Tax Obligation/Limited – 26.5% | | | | | | | |
| | 1,000 | | Bell Community Redevelopment Agency, California, Tax Allocation Bonds, Bell Project Area, Series 2003, 5.625%, 10/01/33 – RAAI Insured | | 11/13 at 100.00 | N/R | | | 844,650 | |
| | 2,190 | | California State Public Works Board, Lease Revenue Bonds, Department of Corrections, Calipatria State Prison, Series 1991A, 6.500%, 9/01/17 – NPFG Insured | | No Opt. Call | A | | | 2,409,986 | |
| | 1,500 | | California State Public Works Board, Lease Revenue Bonds, Various Capital Projects, Series 2009-I, 6.375%, 11/01/34 | | 11/19 at 100.00 | A2 | | | 1,727,250 | |
| | 120 | | Capistrano Unified School District, Orange County, California, Special Tax Bonds, Community Facilities District, Series 2005, 5.000%, 9/01/24 – FGIC Insured | | 9/15 at 100.00 | A | | | 120,944 | |
| | Principal | | | | Optional Call | | | | | |
| | Amount (000) | | Description (1) | | Provisions (2) | Ratings (3) | | | Value | |
| | | | Tax Obligation/Limited (continued) | | | | | | | |
| $ | 360 | | Chino Redevelopment Agency, California, Merged Chino Redevelopment Project Area Tax Allocation Bonds, Series 2006, 5.000%, 9/01/38 – AMBAC Insured | | 9/16 at 101.00 | A– | | $ | 349,502 | |
| | 2,000 | | Escondido Joint Powers Financing Authority, California, Lease Revenue Bonds, Water System Financing, Series 2012, 5.000%, 9/01/41 | | 3/22 at 100.00 | AA– | | | 2,006,740 | |
| | 1,000 | | Fontana Public Financing Authority, California, Tax Allocation Revenue Bonds, North Fontana Redevelopment Project, Series 2005A, 5.000%, 10/01/32 – AMBAC Insured | | 10/15 at 100.00 | A | | | 990,320 | |
| | 270 | | Fontana Redevelopment Agency, California, Jurupa Hills Redevelopment Project, Tax Allocation Refunding Bonds, 1997 Series A, 5.500%, 10/01/27 | | 11/13 at 100.00 | A– | | | 270,716 | |
| | 250 | | Inglewood Redevelopment Agency, California, Tax Allocation Bonds, Merged Redevelopment Project, Subordinate Lien Series 2007A-1, 5.000%, 5/01/23 – AMBAC Insured | | 5/17 at 100.00 | BB+ | | | 242,945 | |
| | | | Irvine Unified School District, California, Special Tax Bonds, Community Facilities District Series 2006A: | | | | | | | |
| | 55 | | 5.000%, 9/01/26 | | 9/16 at 100.00 | N/R | | | 55,013 | |
| | 130 | | 5.125%, 9/01/36 | | 9/16 at 100.00 | N/R | | | 124,995 | |
| | 1,215 | | Los Angeles Community Redevelopment Agency, California, Lease Revenue Bonds, Manchester Social Services Project, Series 2005, 5.000%, 9/01/37 – AMBAC Insured | | 9/15 at 100.00 | A1 | | | 1,234,161 | |
| | 135 | | National City Community Development Commission, California, Tax Allocation Bonds, National City Redevelopment Project, Series 2011, 6.500%, 8/01/24 | | 8/21 at 100.00 | A– | | | 160,627 | |
| | 280 | | Norco Redevelopment Agency, California, Tax Allocation Bonds, Project Area 1, Refunding, School District Pass-Through, Series 2004, 5.000%, 3/01/32 – RAAI Insured | | 3/14 at 100.00 | N/R | | | 258,714 | |
| | 1,000 | | Norco Redevelopment Agency, California, Tax Allocation Bonds, Project Area 1, Series 2009, 7.000%, 3/01/34 | | 3/18 at 100.00 | A | | | 1,110,550 | |
| | 50 | | Novato Redevelopment Agency, California, Tax Allocation Bonds, Hamilton Field Redevelopment Project, Series 2011, 6.750%, 9/01/40 | | 9/21 at 100.00 | BBB+ | | | 54,806 | |
| | 1,300 | | Orange County, California, Special Tax Bonds, Community Facilities District 03-1 of Ladera Ranch, Series 2004A, 5.625%, 8/15/34 | | 11/13 at 100.00 | N/R | | | 1,300,988 | |
| | | | Patterson Public Finance Authority, California, Revenue Bonds, Community Facilities District 2001-1, Senior Series 2013A: | | | | | | | |
| | 350 | | 5.250%, 9/01/30 | | 9/23 at 100.00 | N/R | | | 341,933 | |
| | 320 | | 5.750%, 9/01/39 | | 9/23 at 100.00 | N/R | | | 317,850 | |
| | 60 | | Patterson Public Finance Authority, California, Revenue Bonds, Community Facilities District 2001-1, Subordinate Lien Series 2013B , 5.875%, 9/01/39 | | 9/23 at 100.00 | N/R | | | 59,017 | |
| | | | Perris Union High School District Financing Authority, Riverside County, California, Revenue Bonds, Series 2011: | | | | | | | |
| | 50 | | 6.000%, 9/01/33 | | 11/13 at 100.00 | N/R | | | 50,720 | |
| | 100 | | 6.125%, 9/01/41 | | 11/13 at 100.00 | N/R | | | 100,710 | |
| | 415 | | Pittsburg Redevelopment Agency, California, Tax Allocation Bonds, Los Medanos Community Development Project, Refunding Series 2008A, 6.500%, 9/01/28 | | 9/18 at 100.00 | BBB– | | | 427,521 | |
| | 160 | | Rancho Santa Fe CSD Financing Authority, California, Revenue Bonds, Superior Lien Series 2011A, 5.750%, 9/01/30 | | 9/21 at 100.00 | BBB+ | | | 169,154 | |
| | 30 | | Riverside County Redevelopment Agency, California, Tax Allocation Bonds, Jurupa Valley Project Area, Series 2011B, 6.500%, 10/01/25 | | 10/21 at 100.00 | A– | | | 33,094 | |
| | 605 | | Sacramento City Financing Authority, California, Lease Revenue Refunding Bonds, Series 1993A, 5.400%, 11/01/20 – NPFG Insured | | No Opt. Call | A | | | 679,597 | |
| | 1,365 | | San Diego County Regional Transportation Commission, California, Sales Tax Revenue Bonds, Series 2012A, 5.000%, 4/01/42 | | 4/22 at 100.00 | AAA | | | 1,432,445 | |
| | 25 | | San Francisco Redevelopment Finance Authority, California, Tax Allocation Revenue Bonds, Mission Bay North Redevelopment Project, Series 2011C, 6.750%, 8/01/41 | | 2/21 at 100.00 | A– | | | 27,934 | |
| | | | San Francisco Redevelopment Financing Authority, California, Tax Allocation Revenue Bonds, Mission Bay South Redevelopment Project, Series 2011D: | | | | | | | |
| | 25 | | 7.000%, 8/01/33 | | 2/21 at 100.00 | BBB | | | 27,125 | |
| | 30 | | 7.000%, 8/01/41 | | 2/21 at 100.00 | BBB | | | 32,077 | |
| | 615 | | San Jose Redevelopment Agency, California, Tax Allocation Bonds, Merged Area Redevelopment Project, Series 2006C, 5.000%, 8/01/25 – NPFG Insured | | 8/17 at 100.00 | A | | | 616,445 | |
| | 3,000 | | San Mateo County Transit District, California, Sales Tax Revenue Bonds, Series 2005A, 5.000%, 6/01/21 – NPFG Insured | | 6/15 at 100.00 | AA | | | 3,218,578 | |
| NXC | Nuveen California Select Tax-Free Income Portfolio (continued) |
| | Portfolio of Investments September 30, 2013 (Unaudited) |
| | Principal | | | | Optional Call | | | | | |
| | Amount (000) | | Description (1) | | Provisions (2) | Ratings (3) | | | Value | |
| | | | Tax Obligation/Limited (continued) | | | | | | | |
| $ | 1,000 | | Santa Clara County Board of Education, California, Certificates of Participation, Series 2002, 5.000%, 4/01/25 – NPFG Insured | | 11/13 at 100.00 | A | | $ | 999,570 | |
| | 1,000 | | Santa Clara Valley Transportation Authority, California, Sales Tax Revenue Bonds, Series 2007A, 5.000%, 4/01/36 – AMBAC Insured | | 4/17 at 100.00 | AA+ | | | 1,036,720 | |
| | 40 | | Signal Hill Redevelopment Agency, California, Project 1 Tax Allocation Bonds, Series 2011, 7.000%, 10/01/26 | | 4/21 at 100.00 | N/R | | | 41,509 | |
| | 1,000 | | Travis Unified School District, Solano County, California, Certificates of Participation, Series 2006, 5.000%, 9/01/26 – FGIC Insured | | 9/16 at 100.00 | Baa1 | | | 1,004,940 | |
| | 360 | | Turlock Public Financing Authority, California, Tax Allocation Revenue Bonds, Series 2011, 7.500%, 9/01/39 | | 3/21 at 100.00 | BBB+ | | | 381,298 | |
| | 70 | | Yorba Linda Redevelopment Agency, Orange County, California, Tax Allocation Revenue Bonds, Yorba Linda Redevelopment Project, Subordinate Lien Series 2011A, 6.500%, 9/01/32 | | 9/21 at 100.00 | A– | | | 79,188 | |
| | 23,475 | | Total Tax Obligation/Limited | | | | | | 24,340,332 | |
| | | | Transportation – 2.2% | | | | | | | |
| | 1,150 | | Foothill/Eastern Transportation Corridor Agency, California, Toll Road Revenue Bonds, Series 1995A, 5.000%, 1/01/35 | | 1/14 at 100.00 | BBB– | | | 1,026,732 | |
| | 955 | | Port of Oakland, California, Revenue Refunding Bonds, Series 2012P, 5.000%, 5/01/31 (Alternative Minimum Tax) | | No Opt. Call | A+ | | | 972,983 | |
| | 2,105 | | Total Transportation | | | | | | 1,999,715 | |
| | | | U.S. Guaranteed – 2.4% (4) | | | | | | | |
| | 1,000 | | California State Public Works Board, Lease Revenue Bonds, Department of Mental Health, Coalinga State Hospital, Series 2004A, 5.500%, 6/01/23 (Pre-refunded 6/01/14) | | 6/14 at 100.00 | AAA | | | 1,035,550 | |
| | 800 | | California State, General Obligation Bonds, Series 2004, 5.125%, 2/01/27 (Pre-refunded 2/01/14) | | 2/14 at 100.00 | AAA | | | 813,352 | |
| | 100 | | Roseville Joint Union High School District, Placer County, California, General Obligation Bonds, Series 2006B, 5.000%, 8/01/27 (Pre-refunded 8/01/15) – FGIC Insured | | 8/15 at 100.00 | AA (4) | | | 108,605 | |
| | 225 | | San Mateo Union High School District, San Mateo County, California, Certificates of Participation, Phase 1, Series 2007A, 5.000%, 12/15/30 (Pre-refunded 12/15/17) – AMBAC Insured | | 12/17 at 100.00 | AA- (4) | | | 262,557 | |
| | 2,125 | | Total U.S. Guaranteed | | | | | | 2,220,064 | |
| | | | Utilities – 6.8% | | | | | | | |
| | 1,000 | | Imperial Irrigation District, California, Electric System Revenue Bonds, Refunding Series 2011A, 5.500%, 11/01/41 | | 11/20 at 100.00 | AA– | | | 1,048,310 | |
| | 645 | | Long Beach Bond Finance Authority, California, Natural Gas Purchase Revenue Bonds, Series 2007A, 5.500%, 11/15/37 | | No Opt. Call | A | | | 668,330 | |
| | 7,600 | | Merced Irrigation District, California, Certificates of Participation, Water and Hydroelectric Series 2008B, 0.000%, 9/01/23 | | 9/16 at 64.56 | A | | | 4,267,094 | |
| | 215 | | Merced Irrigation District, California, Electric System Revenue Bonds, Series 2005, 5.125%, 9/01/31 – SYNCORA GTY Insured | | 9/15 at 100.00 | N/R | | | 215,320 | |
| | 9,460 | | Total Utilities | | | | | | 6,199,054 | |
| | | | Water and Sewer – 3.0% | | | | | | | |
| | 1,000 | | Bay Area Water Supply and Conservation Agency, California, Revenue Bonds, Capital Cost Recovery Prepayment Program, Series 2013A, 5.000%, 10/01/34 | | 4/23 at 100.00 | AA– | | | 1,058,130 | |
| | | | California Pollution Control Financing Authority, Water Furnishing Revenue Bonds, Poseidon Resources Channelside LP Desalination Project, Series 2012: | | | | | | | |
| | 535 | | 5.000%, 7/01/37 (Alternative Minimum Tax) | | No Opt. Call | Baa3 | | | 480,136 | |
| | 1,000 | | 5.000%, 11/21/45 (Alternative Minimum Tax) | | No Opt. Call | Baa3 | | | 839,620 | |
| | Principal | | | | Optional Call | | | | | |
| | Amount (000) | | Description (1) | | Provisions (2) | Ratings (3) | | | Value | |
| | | | Water and Sewer (continued) | | | | | | | |
| $ | 150 | | Healdsburg Public Financing Authority, California, Wastewater Revenue Bonds, Series 2006, 5.000%, 4/01/36 – NPFG Insured | | 4/16 at 100.00 | AA– | | $ | 152,139 | |
| | 250 | | Sacramento County Sanitation District Financing Authority, California, Revenue Bonds, Series 2006, 5.000%, 12/01/31 – FGIC Insured | | 6/16 at 100.00 | AA | | | 262,718 | |
| | 2,935 | | Total Water and Sewer | | | | | | 2,792,743 | |
| $ | 123,745 | | Total Long-Term Investments (cost $87,451,665) | | | | | | 90,164,011 | |
| | | | Floating Rate Obligations – (1.7)% | | | | | | (1,540,000 | ) |
| | | | Other Assets Less Liabilities – 3.4% | | | | | | 3,088,392 | |
| | | | Net Assets – 100% | | | | | $ | 91,712,403 | |
| (1) | All percentages shown in the Portfolio of Investments are based on net assets. |
| (2) | Optional Call Provisions: Dates (month and year) and prices of the earliest optional call or redemption. There may be other call provisions at varying prices at later dates. Certain mortgage-backed securities may be subject to periodic principal paydowns. |
| (3) | Ratings: Using the highest of Standard & Poor’s Group (“Standard & Poor’s”), Moody’s Investors Service, Inc. (“Moody’s”) or Fitch, Inc. (“Fitch”) rating. Ratings below BBB by Standard & Poor’s, Baa by Moody’s or BBB by Fitch are considered to be below investment grade. Holdings designated N/R are not rated by any of these national rating agencies. |
| (4) | Backed by an escrow or trust containing sufficient U.S. Government or U.S. Government agency securities which ensure the timely payment of principal and interest. Certain bonds backed by U.S. Government or agency securities are regarded as having an implied rating equal to the rating of such securities. |
| (UB) | Underlying bond of an inverse floating rate trust reflected as a financing transaction. See Notes to Financial Statements, Note 3 – Portfolio Securities and Investments in Derivatives, Inverse Floating Rate Securities for more information. |
See accompanying notes to financial statements.
| NXN | |
| | Nuveen New York Select Tax-Free Income Portfolio |
| | Portfolio of Investments |
| | September 30, 2013 (Unaudited) |
| | Principal | | | | Optional Call | | | | | |
| | Amount (000) | | Description (1) | | Provisions (2) | Ratings (3) | | | Value | |
| | | | LONG-TERM INVESTMENTS – 94.4% | | | | | | | |
| | | | MUNICIPAL BONDS – 94.4% | | | | | | | |
| | | | Consumer Discretionary – 0.2% | | | | | | | |
| $ | 100 | | New York City Industrial Development Agency, New York, Liberty Revenue Bonds, IAC/InterActiveCorp, Series 2005, 5.000%, 9/01/35 | | 9/15 at 100.00 | BBB | | $ | 95,324 | |
| | | | Consumer Staples – 1.5% | | | | | | | |
| | | | TSASC Inc., New York, Tobacco Asset-Backed Bonds, Series 2006: | | | | | | | |
| | 335 | | 4.750%, 6/01/22 | | 6/16 at 100.00 | BBB– | | | 327,992 | |
| | 540 | | 5.000%, 6/01/26 | | 6/16 at 100.00 | BB– | | | 477,149 | |
| | 875 | | Total Consumer Staples | | | | | | 805,141 | |
| | | | Education and Civic Organizations – 15.0% | | | | | | | |
| | 100 | | Albany Industrial Development Agency, New York, Revenue Bonds, Albany Law School, Series 2007A, 5.000%, 7/01/31 | | 7/17 at 100.00 | BBB | | | 100,094 | |
| | 165 | | Albany Industrial Development Agency, New York, Revenue Bonds, Brighter Choice Charter Schools, Series 2007A, 5.000%, 4/01/37 | | 4/17 at 100.00 | BB+ | | | 138,876 | |
| | 280 | | Buffalo and Erie County Industrial Land Development Corporation, New York, Tax-Exempt Revenue Bonds, Enterprise Charter School Project, Series 2011A, 7.500%, 12/01/40 | | 12/20 at 100.00 | BB | | | 299,110 | |
| | 30 | | Cattaraugus County Industrial Development Agency, New York, Revenue Bonds, St. Bonaventure University, Series 2006, 5.000%, 5/01/23 | | 5/16 at 100.00 | BBB– | | | 30,194 | |
| | 430 | | Dormitory Authority of the State of New York, General Revenue Bonds, Manhattan College, Series 2007A, 5.000%, 7/01/41 – RAAI Insured | | 7/17 at 100.00 | N/R | | | 402,153 | |
| | 1,000 | | Dormitory Authority of the State of New York, Housing Revenue Bonds, Fashion Institute of Technology, Series 2007, 5.250%, 7/01/34 – FGIC Insured | | No Opt. Call | A | | | 1,018,990 | |
| | 50 | | Dormitory Authority of the State of New York, Lease Revenue Bonds, State University Dormitory Facilities, Series 2004A, 5.000%, 7/01/29 – NPFG Insured | | 7/15 at 100.00 | Aa2 | | | 52,185 | |
| | 1,000 | | Dormitory Authority of the State of New York, Revenue Bonds, Columbia University, Series 2011A, 5.000%, 10/01/41 | | 4/21 at 100.00 | AAA | | | 1,062,270 | |
| | 120 | | Dormitory Authority of the State of New York, Revenue Bonds, St. Joseph’s College, Series 2010, 5.250%, 7/01/35 | | 7/20 at 100.00 | Baa1 | | | 120,803 | |
| | 815 | | Dutchess County Industrial Development Agency, New York, Civic Facility Revenue Bonds, Bard College Refunding, Series 2007-A1, 5.000%, 8/01/46 | | 8/17 at 100.00 | Baa1 | | | 784,087 | |
| | 100 | | Hempstead Town Industrial Development Agency, New York, Revenue Bonds, Adelphi University, Civic Facility Project, Series 2005, 5.000%, 10/01/35 | | 10/15 at 100.00 | A | | | 100,446 | |
| | 2,000 | | Monroe County Industrial Development Corporation, New York, Revenue Bonds, University of Rochester Project, Series 2011B, 5.000%, 7/01/41 | | 7/21 at 100.00 | AA– | | | 2,043,680 | |
| | 100 | | New York City Industrial Development Agency, New York, Civic Facility Revenue Bonds, St. Francis College, Series 2004, 5.000%, 10/01/34 | | 10/14 at 100.00 | A– | | | 100,422 | |
| | 100 | | New York City Industrial Development Agency, New York, Civic Facility Revenue Bonds, Vaughn College of Aeronautics, Series 2006A, 5.000%, 12/01/28 | | 12/16 at 100.00 | BB | | | 92,278 | |
| | | | New York City Industrial Development Agency, New York, PILOT Revenue Bonds, Queens Baseball Stadium Project, Series 2006: | | | | | | | |
| | 500 | | 5.000%, 1/01/31 – AMBAC Insured | | 1/17 at 100.00 | Ba1 | | | 466,260 | |
| | 430 | | 4.750%, 1/01/42 – AMBAC Insured | | 1/17 at 100.00 | Ba1 | | | 357,493 | |
| | | | New York City Industrial Development Authority, New York, PILOT Revenue Bonds, Yankee Stadium Project, Series 2006: | | | | | | | |
| | 590 | | 4.500%, 3/01/39 – FGIC Insured | | 9/16 at 100.00 | BBB | | | 540,647 | |
| | 300 | | 4.750%, 3/01/46 – NPFG Insured | | 9/16 at 100.00 | A | | | 289,824 | |
| | 65 | | Seneca County Industrial Development Authority, New York, Revenue Bonds, New York Chiropractic College, Series 2007, 5.000%, 10/01/27 | | 10/17 at 100.00 | BBB | | | 65,798 | |
| | 8,175 | | Total Education and Civic Organizations | | | | | | 8,065,610 | |
| | Principal | | | | Optional Call | | | | | |
| | Amount (000) | | Description (1) | | Provisions (2) | Ratings (3) | | | Value | |
| | | | Financials – 3.0% | | | | | | | |
| $ | 1,050 | | Liberty Development Corporation, New York, Goldman Sachs Headquarter Revenue Bonds, Series 2005, 5.250%, 10/01/35 | | No Opt. Call | A | | $ | 1,113,767 | |
| | 435 | | Liberty Development Corporation, New York, Goldman Sachs Headquarters Revenue Bonds Series 2007, 5.500%, 10/01/37 | | No Opt. Call | A | | | 474,842 | |
| | 1,485 | | Total Financials | | | | | | 1,588,609 | |
| | | | Health Care – 8.5% | | | | | | | |
| | 1,000 | | California Statewide Community Development Authority, Revenue Bonds, Kaiser Permanente System, Series 2006, 5.000%, 3/01/41 | | 3/16 at 100.00 | A+ | | | 1,001,200 | |
| | 450 | | Dormitory Authority of the State of New York, FHA-Insured Mortgage Revenue Bonds, Montefiore Hospital, Series 2004, 5.000%, 8/01/29 – FGIC Insured | | 2/15 at 100.00 | A | | | 455,526 | |
| | 100 | | Dormitory Authority of the State of New York, Highland Hospital of Rochester Revenue Bonds, Series 2010, 5.200%, 7/01/32 | | 7/20 at 100.00 | A2 | | | 102,886 | |
| | | | Dormitory Authority of the State of New York, Orange Regional Medical Center Obligated Group Revenue Bonds, Series 2008: | | | | | | | |
| | 250 | | 6.000%, 12/01/15 | | No Opt. Call | Ba1 | | | 253,315 | |
| | 160 | | 6.500%, 12/01/21 | | 12/18 at 100.00 | Ba1 | | | 166,152 | |
| | 305 | | 6.250%, 12/01/37 | | 12/18 at 100.00 | Ba1 | | | 304,588 | |
| | 950 | | Dormitory Authority of the State of New York, Revenue Bonds, Memorial Sloan Kettering Cancer Center, Series 2006-1, 5.000%, 7/01/35 | | 7/16 at 100.00 | AA | | | 953,800 | |
| | 350 | | Dormitory Authority of the State of New York, Revenue Bonds, New York and Presbyterian Hospital, Series 2004A, 5.250%, 8/15/15 – AGM Insured | | 8/14 at 100.00 | AA– | | | 364,336 | |
| | 750 | | Dormitory Authority of the State of New York, Revenue Bonds, NYU Hospitals Center, Series 2011A, 6.000%, 7/01/40 | | 7/20 at 100.00 | A– | | | 807,818 | |
| | | | Madison County Industrial Development Agency, New York, Civic Facility Revenue Bonds, Oneida Health System, Series 2007A: | | | | | | | |
| | 100 | | 5.250%, 2/01/27 | | 2/17 at 100.00 | BBB– | | | 96,863 | |
| | 90 | | 5.500%, 2/01/32 | | 2/17 at 100.00 | BBB– | | | 85,172 | |
| | 4,505 | | Total Health Care | | | | | | 4,591,656 | |
| | | | Housing/Multifamily – 2.6% | | | | | | | |
| | 860 | | New Hartford-Sunset Woods Funding Corporation, New York, FHA-Insured Mortgage Revenue Bonds, Sunset Woods Apartments II Project, Series 2002, 5.350%, 2/01/20 | | 8/14 at 100.00 | AA+ | | | 871,008 | |
| | 250 | | New York City Housing Development Corporation, New York, Multifamily Housing Revenue Bonds, Series 2004A, 5.250%, 11/01/30 | | 5/14 at 100.00 | AA | | | 255,440 | |
| | 275 | | New York State Housing Finance Agency, Affordable Housing Revenue, Series 2007A, 5.250%, 11/01/38 (Alternative Minimum Tax) | | 11/17 at 100.00 | Aa2 | | | 276,977 | |
| | 1,385 | | Total Housing/Multifamily | | | | | | 1,403,425 | |
| | | | Housing/Single Family – 4.3% | | | | | | | |
| | 2,320 | | New York State Mortgage Agency, Mortgage Revenue Bonds, Thirty-First Series A, 5.300%, 10/01/31 (Alternative Minimum Tax) | | 4/14 at 100.00 | Aaa | | | 2,321,021 | |
| | | | Long-Term Care – 3.7% | | | | | | | |
| | 100 | | Dormitory Authority of the State of New York, Non-State Supported Debt, Ozanam Hall of Queens Nursing Home Revenue Bonds, Series 2006, 5.000%, 11/01/31 | | 11/16 at 100.00 | Ba3 | | | 85,215 | |
| | 50 | | Dormitory Authority of the State of New York, Revenue Bonds, Providence Rest, Series 2005, 5.000%, 7/01/35 – ACA Insured | | 7/15 at 100.00 | N/R | | | 42,989 | |
| | 1,390 | | East Rochester Housing Authority, New York, FHA-Insured Mortgage Revenue Refunding Bonds, Jewish Home of Rochester, Series 2002, 4.625%, 2/15/17 | | 8/14 at 100.00 | AAA | | | 1,400,773 | |
| | 185 | | Erie County Industrial Development Agency, New York, Revenue Bonds, Orchard Park CCRC Inc. Project, Series 2006A, 6.000%, 11/15/36 | | 11/16 at 100.00 | N/R | | | 166,665 | |
| | 25 | | Suffolk County Industrial Development Agency, New York, Civic Facility Revenue Bonds, Special Needs Facilities Pooled Program, Series 2008-B1, 5.500%, 7/01/18 | | 7/16 at 100.00 | N/R | | | 23,734 | |
| | 275 | | Yonkers Industrial Development Agency, New York, Civic Facilities Revenue Bonds, Special Needs Facilities Pooled Program Bonds, Series 2008-C1, 5.500%, 7/01/18 | | 7/16 at 101.00 | N/R | | | 261,071 | |
| | 2,025 | | Total Long-Term Care | | | | | | 1,980,447 | |
| NXN | Nuveen New York Select Tax-Free Income Portfolio (continued) |
| | Portfolio of Investments September 30, 2013 (Unaudited) |
| | Principal | | | | Optional Call | | | | | |
| | Amount (000) | | Description (1) | | Provisions (2) | Ratings (3) | | | Value | |
| | | | Materials – 0.2% | | | | | | | |
| $ | 90 | | Jefferson County Industrial Development Agency, New York, Solid Waste Disposal Revenue Bonds, International Paper Company Project, Series 2003A, 5.200%, 12/01/20 (Alternative Minimum Tax) | | 12/13 at 100.00 | BBB | | $ | 90,021 | |
| | | | Tax Obligation/General – 6.3% | | | | | | | |
| | 1,260 | | New York City, New York, General Obligation Bonds, Fiscal 2008 Series D, 5.125%, 12/01/25 | | 12/17 at 100.00 | AA | | | 1,438,101 | |
| | 10 | | New York City, New York, General Obligation Bonds, Fiscal Series 2004C, 5.250%, 8/15/16 | | 8/14 at 100.00 | AA | | | 10,429 | |
| | 200 | | New York City, New York, General Obligation Bonds, Fiscal Series 2005J, 5.000%, 3/01/19 – FGIC Insured | | 3/15 at 100.00 | AA | | | 212,504 | |
| | 1,000 | | New York City, New York, General Obligation Bonds, Fiscal Series 2006J-1, 5.000%, 6/01/25 | | 6/16 at 100.00 | AA | | | 1,087,860 | |
| | 600 | | Yonkers, New York, General Obligation Bonds, Series 2011A, 5.000%, 10/01/24 – AGM Insured | | 10/21 at 100.00 | AA– | | | 655,878 | |
| | 3,070 | | Total Tax Obligation/General | | | | | | 3,404,772 | |
| | | | Tax Obligation/Limited – 32.6% | | | | | | | |
| | 600 | | Battery Park City Authority, New York, Lease Revenue Bonds, Senior Lien Series 2003A, 5.000%, 11/01/23 | | 11/13 at 100.00 | AAA | | | 602,448 | |
| | 1,050 | | Dormitory Authority of the State of New York, State Personal Income Tax Revenue Bonds, General Purpose Series 2012D, 5.000%, 2/15/37 | | No Opt. Call | AAA | | | 1,096,673 | |
| | 2,000 | | Hudson Yards Infrastructure Corporation, New York, Revenue Bonds, Senior Fiscal 2012 Series 2011A, 5.750%, 2/15/47 | | 2/21 at 100.00 | A | | | 2,119,820 | |
| | 1,500 | | Hudson Yards Infrastructure Corporation, New York, Revenue Bonds, Series 2006A, 5.000%, 2/15/47 | | 2/17 at 100.00 | A | | | 1,505,190 | |
| | 5,800 | | Metropolitan Transportation Authority, New York, Dedicated Tax Fund Bonds, Refunding Series 2012A, 0.000%, 11/15/32 | | No Opt. Call | AA | | | 2,409,610 | |
| | | | New York City Sales Tax Asset Receivable Corporation, New York, Dedicated Revenue Bonds, Local Government Assistance Corporation, Series 2004A: | | | | | | | |
| | 250 | | 5.000%, 10/15/25 – NPFG Insured | | 10/14 at 100.00 | AAA | | | 261,468 | |
| | 200 | | 5.000%, 10/15/26 – NPFG Insured | | 10/14 at 100.00 | AAA | | | 208,960 | |
| | 1,225 | | 5.000%, 10/15/29 – AMBAC Insured | | 10/14 at 100.00 | AAA | | | 1,271,452 | |
| | 600 | | New York City Transitional Finance Authority, New York, Building Aid Revenue Bonds, Fiscal Series 2007S-2, 5.000%, 1/15/28 – FGIC Insured | | 1/17 at 100.00 | AA– | | | 639,744 | |
| | 10 | | New York City Transitional Finance Authority, New York, Future Tax Secured Bonds, Fiscal Series 2003E, 5.000%, 2/01/23 – FGIC Insured | | 11/13 at 100.00 | AAA | | | 10,040 | |
| | 550 | | New York City Transitional Finance Authority, New York, Future Tax Secured Bonds, Fiscal Series 2007C-1, 5.000%, 11/01/27 | | 11/17 at 100.00 | AAA | | | 606,155 | |
| | 535 | | New York City Transitional Finance Authority, New York, Future Tax Secured Bonds, Tender Option Bond Trust 3545, 13.883%, 5/01/32 (IF) | | 5/19 at 100.00 | AAA | | | 595,824 | |
| | 1,000 | | New York City Transitional Finance Authority, New York, Future Tax Secured Revenue Bonds, SubSeries 2011D-1, 5.250%, 2/01/30 | | 2/21 at 100.00 | AAA | | | 1,108,220 | |
| | 775 | | New York State Environmental Facilities Corporation, State Personal Income Tax Revenue Bonds, Series 2008A, 5.000%, 12/15/26 (UB) | | 12/17 at 100.00 | AAA | | | 863,358 | |
| | 425 | | New York State Thruway Authority, Highway and Bridge Trust Fund Bonds, Series 2007, 5.000%, 4/01/27 | | 10/17 at 100.00 | AA | | | 459,353 | |
| | 570 | | New York State Thruway Authority, Highway and Bridge Trust Fund Bonds, Series 2005B, 5.500%, 4/01/20 – AMBAC Insured (UB) (4) | | No Opt. Call | AA | | | 687,420 | |
| | | | New York State Tobacco Settlement Financing Corporation, Tobacco Settlement Asset-Backed and State Contingency Contract-Backed Bonds, Series 2003A-1: | | | | | | | |
| | 1,000 | | 5.250%, 6/01/20 – AMBAC Insured | | 11/13 at 100.00 | AA– | | | 1,007,340 | |
| | 250 | | 5.250%, 6/01/21 – AMBAC Insured | | 11/13 at 100.00 | AA– | | | 250,753 | |
| | 1,000 | | New York State Urban Development Corporation, State Personal Income Tax Revenue Bonds, Tender Option Bond Trust 09-6W, 13.211%, 3/15/37 (IF) (4) | | 3/17 at 100.00 | AAA | | | 1,069,670 | |
| | 4,000 | | Puerto Rico Sales Tax Financing Corporation, Sales Tax Revenue Bonds, Senior Series 2011C, 0.000%, 8/01/39 | | No Opt. Call | AA– | | | 747,240 | |
| | 23,340 | | Total Tax Obligation/Limited | | | | | | 17,520,738 | |
| | Principal | | | | Optional Call | | | | | |
| | Amount (000) | | Description (1) | | Provisions (2) | Ratings (3) | | | Value | |
| | | | Transportation – 4.8% | | | | | | | |
| $ | 500 | | Metropolitan Transportation Authority, New York, Transportation Revenue Bonds, Series 2003A, 5.000%, 11/15/15 – FGIC Insured | | No Opt. Call | A | | $ | 546,550 | |
| | 1,000 | | New York City Industrial Development Agency, New York, Special Facilities Revenue Bonds, British Airways PLC, Series 1998, 5.250%, 12/01/32 (Alternative Minimum Tax) | | 12/13 at 100.00 | BB | | | 874,930 | |
| | 250 | | New York Liberty Development Corporation, Liberty Revenue Bonds, 4 World Trade Center Project, Series 2011, 5.000%, 11/15/44 | | 11/21 at 100.00 | A+ | | | 251,813 | |
| | 100 | | New York State Thruway Authority, General Revenue Bonds, Series 2005G, 5.000%, 1/01/30 – AGM Insured | | 7/15 at 100.00 | AA– | | | 104,460 | |
| | 105 | | Port Authority of New York and New Jersey, Consolidated Revenue Bonds, One Hundred Fortieth Series 2005, 5.000%, 12/01/31 – SYNCORA GTY Insured | | 6/15 at 101.00 | AA– | | | 110,306 | |
| | 120 | | Port Authority of New York and New Jersey, Consolidated Revenue Bonds, One Hundred Forty Eighth Series 2007, Tender Option Bond Trust 2920, 17.644%, 8/15/32 – AGM Insured (IF) | | 8/17 at 100.00 | AA– | | | 152,083 | |
| | | | Port Authority of New York and New Jersey, Special Project Bonds, JFK International Air Terminal LLC Project, Eighth Series 2010: | | | | | | | |
| | 290 | | 6.500%, 12/01/28 | | 12/15 at 100.00 | BBB | | | 304,648 | |
| | 215 | | 6.000%, 12/01/36 | | 12/20 at 100.00 | BBB | | | 232,372 | |
| | 2,580 | | Total Transportation | | | | | | 2,577,162 | |
| | | | U.S. Guaranteed – 4.0% (5) | | | | | | | |
| | 490 | | Dormitory Authority of the State of New York, Judicial Facilities Lease Revenue Bonds, Suffolk County Issue, Series 1986, 7.375%, 7/01/16 (ETM) | | No Opt. Call | Aaa | | | 544,816 | |
| | 500 | | Erie County Industrial Development Agency, New York, School Facility Revenue Bonds, Buffalo City School District, Series 2004, 5.750%, 5/01/26 (Pre-refunded 5/01/14) – AGM Insured | | 5/14 at 100.00 | AA– (5) | | | 516,240 | |
| | 290 | | New York City, New York, General Obligation Bonds, Fiscal Series 2004C, 5.250%, 8/15/16 (Pre-refunded 8/15/14) | | 8/14 at 100.00 | Aa2 (5) | | | 302,824 | |
| | 250 | | New York State Thruway Authority, Highway and Bridge Trust Fund Bonds, Second General, Series 2004A, 5.000%, 4/01/21 (Pre-refunded 4/01/14) – NPFG Insured | | 4/14 at 100.00 | AA (5) | | | 256,028 | |
| | 500 | | New York State Tobacco Settlement Financing Corporation, Tobacco Settlement Asset-Backed and State Contingency Contract-Backed Bonds, Series 2003B-1C, 5.500%, 6/01/21 (Pre-refunded 8/15/14) | | 8/14 at 100.00 | AA– (5) | | | 502,220 | |
| | 2,030 | | Total U.S. Guaranteed | | | | | | 2,122,128 | |
| | | | Utilities – 7.1% | | | | | | | |
| | 550 | | Chautauqua County Industrial Development Agency, New York, Exempt Facility Revenue Bonds, NRG Dunkirk Power Project, Series 2009, 5.875%, 4/01/42 | | 2/20 at 100.00 | Baa3 | | | 557,926 | |
| | 35 | | Guam Power Authority, Revenue Bonds, Series 2012A, 5.000%, 10/01/34 | | 10/22 at 100.00 | BBB | | | 33,636 | |
| | | | Long Island Power Authority, New York, Electric System General Revenue Bonds, Series 2006A: | | | | | | | |
| | 570 | | 5.000%, 12/01/23 – FGIC Insured | | 6/16 at 100.00 | A | | | 613,719 | |
| | 430 | | 5.000%, 12/01/25 – FGIC Insured | | 6/16 at 100.00 | A | | | 463,011 | |
| | 1,025 | | Long Island Power Authority, New York, Electric System Revenue Bonds, Refunding Series 2009A, 5.700%, 4/01/30 | | 4/19 at 100.00 | A– | | | 1,113,786 | |
| | 400 | | Long Island Power Authority, New York, Electric System Revenue Bonds, Series 2011A, 5.000%, 5/01/38 | | 5/21 at 100.00 | A– | | | 404,762 | |
| | 735 | | Niagara Area Development Corporation, New York, Solid Waste Disposal Facility Revenue Refunding Bonds, Covanta Energy Project, Series 2012A, 5.250%, 11/01/42 | | No Opt. Call | BB+ | | | 624,022 | |
| | 3,745 | | Total Utilities | | | | | | 3,810,862 | |
| NXN | Nuveen New York Select Tax-Free Income Portfolio (continued) |
| | Portfolio of Investments September 30, 2013 (Unaudited) |
| | Principal | | | | Optional Call | | | | | |
| | Amount (000) | | Description (1) | | Provisions (2) | Ratings (3) | | | Value | |
| | | | Water and Sewer – 0.6% | | | | | | | |
| $ | 275 | | New York City Municipal Water Finance Authority, New York, Water and Sewerage System Revenue Bonds, Tender Option Bond Trust 3484, 17.975%, 6/15/32 (IF) | | 6/18 at 100.00 | AA+ | | $ | 312,169 | |
| $ | 56,000 | | Total Long-Investments (cost $50,173,699) | | | | | | 50,689,085 | |
| | | | Floating Rate Obligations – (1.9)% | | | | | | (1,005,000 | ) |
| | | | Other Assets Less Liabilities – 7.5% | | | | | | 4,010,435 | |
| | | | Net Assets – 100% | | | | | $ | 53,694,520 | |
| (1) | All percentages shown in the Portfolio of Investments are based on net assets. |
| (2) | Optional Call Provisions: Dates (month and year) and prices of the earliest optional call or redemption. There may be other call provisions at varying prices at later dates. Certain mortgage-backed securities may be subject to periodic principal paydowns. |
| (3) | Ratings: Using the highest of Standard & Poor’s Group (“Standard & Poor’s”), Moody’s Investors Service, Inc. (“Moody’s”) or Fitch, Inc. (“Fitch”) rating. Ratings below BBB by Standard & Poor’s, Baa by Moody’s or BBB by Fitch are considered to be below investment grade. Holdings designated N/R are not rated by any of these national rating agencies. |
| (4) | Investment, or portion of investment, has been pledged to collateralize the net payment obligations for investments in inverse floating rate transactions. |
| (5) | Backed by an escrow or trust containing sufficient U.S. Government or U.S. Government agency securities which ensure the timely payment of principal and interest. Certain bonds backed by U.S. Government or agency securities are regarded as having an implied rating equal to the rating of such securities. |
| (ETM) | Escrowed to maturity. |
| (IF) | Inverse floating rate investment. |
| (UB) | Underlying bond of an inverse floating rate trust reflected as a financing transaction. See Notes to Financial Statements, Note 3 – Portfolio Securities and Investments in Derivatives, Inverse Floating Rate Securities for more information. |
See accompanying notes to financial statements.
| Statement of |
| | Assets & Liabilities |
September 30, 2013 (Unaudited)
| | | Select | | Select | | Select | | California | | New York | |
| | | Tax-Free | | Tax-Free 2 | | Tax-Free 3 | | Select Tax-Free | | Select Tax-Free | |
| | | | (NXP | ) | | (NXQ | ) | | (NXR | ) | | (NXC | ) | | (NXN | ) |
| Assets | | | | | | | | | | | | | | | | |
Investments, at value
(cost $224,581,997, $233,202,528, $176,868,007, $87,451,665 and $50,173,699, respectively) | | $ | 230,699,141 | | $ | 234,796,705 | | $ | 180,563,482 | | $ | 90,164,011 | | $ | 50,689,085 | |
| Cash | | | 1,332,455 | | | 1,934,813 | | | — | | | 2,572,904 | | | 3,432,769 | |
| Receivable for: | | | | | | | | | | | | | | | | |
| Interest | | | 2,465,574 | | | 2,795,101 | | | 1,990,328 | | | 1,032,560 | | | 755,780 | |
| Investments sold | | | 117,396 | | | 10,121 | | | 117,396 | | | — | | | 45,000 | |
| Deferred offering costs | | | 160,000 | | | 160,000 | | | 160,000 | | | — | | | — | |
| Other assets | | | 39,609 | | | 41,288 | | | 31,182 | | | 16,628 | | | 11,306 | |
| Total assets | | | 234,814,175 | | | 239,738,028 | | | 182,862,388 | | | 93,786,103 | | | 54,933,940 | |
| Liabilities | | | | | | | | | | | | | | | | |
| Cash overdraft | | | — | | | — | | | 260,496 | | | — | | | — | |
| Floating rate obligations | | | — | | | 1,000,000 | | | — | | | 1,540,000 | | | 1,005,000 | |
| Payable for: | | | | | | | | | | | | | | | | |
| Dividends | | | 804,393 | | | 883,251 | | | 653,495 | | | 337,056 | | | 195,114 | |
| Investments purchased | | | 1,456,635 | | | — | | | — | | | 131,207 | | | — | |
| Accrued expenses: | | | | | | | | | | | | | | | | |
| Management fees | | | 39,971 | | | 50,518 | | | 38,792 | | | 19,970 | | | 11,683 | |
| Shelf offering costs | | | 101,701 | | | 103,639 | | | 98,856 | | | — | | | — | |
| Trustees fees | | | 38,708 | | | 40,450 | | | 29,916 | | | 14,685 | | | 9,073 | |
| Other | | | 58,964 | | | 61,671 | | | 47,115 | | | 30,782 | | | 18,550 | |
| Total liabilities | | | 2,500,372 | | | 2,139,529 | | | 1,128,670 | | | 2,073,700 | | | 1,239,420 | |
| Net assets | | $ | 232,313,803 | | $ | 237,598,499 | | $ | 181,733,718 | | $ | 91,712,403 | | $ | 53,694,520 | |
| Shares outstanding | | | 16,570,310 | | | 17,713,727 | | | 13,045,560 | | | 6,272,729 | | | 3,923,976 | |
| Net asset value per share outstanding | | $ | 14.02 | | $ | 13.41 | | $ | 13.93 | | $ | 14.62 | | $ | 13.68 | |
| Net assets consist of: | | | | | | | | | | | | | | | | |
| Shares, $.01 par value per share | | $ | 165,703 | | $ | 177,137 | | $ | 130,456 | | $ | 62,727 | | $ | 39,240 | |
| Paid-in surplus | | | 230,367,741 | | | 247,159,308 | | | 179,537,064 | | | 87,352,066 | | | 53,843,094 | |
| Undistributed (Over-distribution of) net investment income | | | 1,435,609 | | | 848,459 | | | 982,737 | | | 260,545 | | | 66,436 | |
| Accumulated net realized gain (loss) | | | (5,772,394 | ) | | (12,180,582 | ) | | (2,612,014 | ) | | 1,324,719 | | | (769,636 | ) |
| Net unrealized appreciation (depreciation) | | | 6,117,144 | | | 1,594,177 | | | 3,695,475 | | | 2,712,346 | | | 515,386 | |
| Net assets | | $ | 232,313,803 | | $ | 237,598,499 | | $ | 181,733,718 | | $ | 91,712,403 | | $ | 53,694,520 | |
| Authorized shares | | | Unlimited | | | Unlimited | | | Unlimited | | | Unlimited | | | Unlimited | |
See accompanying notes to financial statements.
Six Months ended September 30, 2013 (Unaudited)
| | | Select | | Select | | Select | | California | | New York | |
| | | Tax-Free | | Tax-Free 2 | | Tax-Free 3 | | Select Tax-Free | | Select Tax-Free | |
| | | | (NXP | ) | | (NXQ | ) | | (NXR | ) | | (NXC | ) | | (NXN | ) |
| Investment Income | | $ | 5,729,254 | | $ | 5,924,877 | | $ | 4,418,984 | | $ | 2,301,473 | | $ | 1,305,845 | |
| Expenses | | | | | | | | | | | | | | | | |
| Management fees | | | 253,448 | | | 320,122 | | | 246,795 | | | 126,643 | | | 74,102 | |
| Shareholder servicing agent fees and expenses | | | 9,699 | | | 9,047 | | | 7,148 | | | 2,545 | | | 2,184 | |
| Interest expense and amortization of offering costs | | | — | | | 3,357 | | | — | | | 4,049 | | | 1,936 | |
| Custodian fees and expenses | | | 23,090 | | | 25,150 | | | 19,214 | | | 11,543 | | | 7,897 | |
| Trustees fees and expenses | | | 3,039 | | | 3,110 | | | 2,383 | | | 1,200 | | | 700 | |
| Professional fees | | | 13,301 | | | 13,393 | | | 12,520 | | | 11,133 | | | 10,569 | |
| Shareholder reporting expenses | | | 26,962 | | | 29,242 | | | 20,590 | | | 10,419 | | | 7,918 | |
| Stock exchange listing fees | | | 4,374 | | | 4,328 | | | 4,339 | | | 4,315 | | | 4,321 | |
| Investor relations expenses | | | 466 | | | 679 | | | — | | | 270 | | | 58 | |
| Other expenses | | | 7,845 | | | 8,277 | | | 5,138 | | | 5,782 | | | 5,309 | |
| Total expenses | | | 342,224 | | | 416,705 | | | 318,127 | | | 177,899 | | | 114,994 | |
| Net investment income (loss) | | | 5,387,030 | | | 5,508,172 | | | 4,100,857 | | | 2,123,574 | | | 1,190,851 | |
| Realized and Unrealized Gain (Loss) | | | | | | | | | | | | | | | | |
| Net realized gain (loss) from investments | | | 1,285,743 | | | 102,154 | | | 106,337 | | | (233,990 | ) | | (785,766 | ) |
| Change in net unrealized appreciation (depreciation) of investments | | | (18,273,720 | ) | | (17,126,049 | ) | | (13,283,808 | ) | | (6,626,783 | ) | | (3,167,332 | ) |
| Net realized and unrealized gain (loss) | | | (16,987,977 | ) | | (17,023,895 | ) | | (13,177,471 | ) | | (6,860,773 | ) | | (3,953,098 | ) |
| Net increase (decrease) in net assets from operations | | $ | (11,600,947 | ) | $ | (11,515,723 | ) | $ | (9,076,614 | ) | $ | (4,737,199 | ) | $ | (2,762,247 | ) |
See accompanying notes to financial statements.
| Statement of |
| | Changes in Net Assets (Unaudited) |
| | | Select Tax-Free (NXP) | | Select Tax-Free 2 (NXQ) | | Select Tax-Free 3 (NXR) | |
| | | | Six Months | | | Year | | | Six Months | | | Year | | | Six Months | | | Year | |
| | | | Ended | | | Ended | | | Ended | | | Ended | | | Ended | | | Ended | |
| | | | 9/30/13 | | | 3/31/13 | | | 9/30/13 | | | 3/31/13 | | | 9/30/13 | | | 3/31/13 | |
| Operations | | | | | | | | | | | | | | | | | | | |
| Net investment income (loss) | | $ | 5,387,030 | | $ | 11,499,102 | | $ | 5,508,172 | | $ | 11,465,877 | | $ | 4,100,857 | | $ | 8,618,606 | |
| Net realized gain (loss) from investments | | | 1,285,743 | | | 520,500 | | | 102,154 | | | 443,542 | | | 106,337 | | | 315,072 | |
| Change in net unrealized appreciation (depreciation) of investments | | | (18,273,720 | ) | | 7,403,576 | | | (17,126,049 | ) | | 8,010,449 | | | (13,283,808 | ) | | 6,333,666 | |
| Net increase (decrease) in net assets from operations | | | (11,600,947 | ) | | 19,423,178 | | | (11,515,723 | ) | | 19,919,868 | | | (9,076,614 | ) | | 15,267,344 | |
| Distributions to Shareholders | | | | | | | | | | | | | | | | | | | |
| From net investment income | | | (5,219,649 | ) | | (11,443,792 | ) | | (5,579,825 | ) | | (11,196,253 | ) | | (4,109,353 | ) | | (8,586,309 | ) |
| From accumulated net realized gains | | | — | | | — | | | — | | | — | | | — | | | — | |
| Decrease in net assets from distributions to shareholders | | | (5,219,649 | ) | | (11,443,792 | ) | | (5,579,825 | ) | | (11,196,253 | ) | | (4,109,353 | ) | | (8,586,309 | ) |
| Capital Share Transactions | | | | | | | | | | | | | | | | | | | |
| Net proceeds from shares issued to shareholders due to reinvestment of distributions | | | — | | | 463,628 | | | — | | | 186,345 | | | — | | | 228,701 | |
| Net increase (decrease) in net assets from capital share transactions | | | — | | | 463,628 | | | — | | | 186,345 | | | — | | | 228,701 | |
| Net increase (decrease) in net assets | | | (16,820,596 | ) | | 8,443,014 | | | (17,095,548 | ) | | 8,909,960 | | | (13,185,967 | ) | | 6,909,736 | |
| Net assets at the beginning of period | | | 249,134,399 | | | 240,691,385 | | | 254,694,047 | | | 245,784,087 | | | 194,919,685 | | | 188,009,949 | |
| Net assets at the end of period | | $ | 232,313,803 | | $ | 249,134,399 | | $ | 237,598,499 | | $ | 254,694,047 | | $ | 181,733,718 | | $ | 194,919,685 | |
| Undistributed (Over-distribution of) net investment income at the end of period | | $ | 1,435,609 | | $ | 1,268,228 | | $ | 848,459 | | $ | 920,112 | | $ | 982,737 | | $ | 991,233 | |
See accompanying notes to financial statements.
Statement of Changes in Net Assets (continued)
| | | California Select Tax-Free (NXC) | | New York Select Tax-Free (NXN) | |
| | | | Six Months | | | Year | | | Six Months | | | Year | |
| | | | Ended | | | Ended | | | Ended | | | Ended | |
| | | | 9/30/13 | | | 3/31/13 | | | 9/30/13 | | | 3/31/13 | |
| Operations | | | | | | | | | | | | | |
| Net investment income (loss) | | $ | 2,123,574 | | $ | 4,331,855 | | $ | 1,190,851 | | $ | 2,485,935 | |
| Net realized gain (loss) from investments | | | (233,990 | ) | | 2,271,936 | | | (785,766 | ) | | 55,939 | |
| Change in net unrealized appreciation (depreciation) of investments | | | (6,626,783 | ) | | 1,748,172 | | | (3,167,332 | ) | | 652,675 | |
| Net increase (decrease) in net assets from operations | | | (4,737,199 | ) | | 8,351,963 | | | (2,762,247 | ) | | 3,194,549 | |
| Distributions to Shareholders | | | | | | | | | | | | | |
| From net investment income | | | (2,145,273 | ) | | (4,288,796 | ) | | (1,236,052 | ) | | (2,555,601 | ) |
| From accumulated net realized gains | | | — | | | — | | | — | | | (217,215 | ) |
| Decrease in net assets from distributions to shareholders | | | (2,145,273 | ) | | (4,288,796 | ) | | (1,236,052 | ) | | (2,772,816 | ) |
| Capital Share Transactions | | | | | | | | | | | | | |
| Net proceeds from shares issued to shareholders due to reinvestment of distributions | | | — | | | 84,643 | | | 9,245 | | | 91,698 | |
| Net increase (decrease) in net assets from capital share transactions | | | — | | | 84,643 | | | 9,245 | | | 91,698 | |
| Net increase (decrease) in net assets | | | (6,882,472 | ) | | 4,147,810 | | | (3,989,054 | ) | | 513,431 | |
| Net assets at the beginning of period | | | 98,594,875 | | | 94,447,065 | | | 57,683,574 | | | 57,170,143 | |
| Net assets at the end of period | | $ | 91,712,403 | | $ | 98,594,875 | | $ | 53,694,520 | | $ | 57,683,574 | |
| Undistributed (Over-distribution of) net investment income at the end of period | | $ | 260,545 | | $ | 282,244 | | $ | 66,436 | | $ | 111,637 | |
See accompanying notes to financial statements.
THIS PAGE INTENTIONALLY LEFT BLANK
| Financial | |
| | Highlights (Unaudited) |
Selected data for a share outstanding throughout each period:
| | | | | Investment Operations | | Less Distributions | | | | | |
| | | Beginning Net Asset Value | | Net Investment Income (Loss) | | Net Realized/ Unrealized Gain (Loss) | | Total | | From Net Investment Income | | From Accumulated Net Realized Gains | | Total | | Ending Net Asset Value | | Ending Market Value | |
| Select Tax-Free (NXP) | | | | | | | | | | | | | | | | | | | | | | | | | |
| Year Ended 3/31: | | | | | | | | | | | | | | | | | | | | | | | | | |
| 2014(c) | | $ | 15.03 | | $ | .33 | | $ | (1.02 | ) | $ | (.69 | ) | $ | (.32 | ) | $ | — | | $ | (.32 | ) | $ | 14.02 | | $ | 13.04 | |
| 2013 | | | 14.55 | | | .69 | | | .48 | | | 1.17 | | | (.69 | ) | | — | | | (.69 | ) | | 15.03 | | | 14.63 | |
| 2012 | | | 13.58 | | | .73 | | | .96 | | | 1.69 | | | (.72 | ) | | — | | | (.72 | ) | | 14.55 | | | 14.57 | |
| 2011 | | | 14.19 | | | .71 | | | (.61 | ) | | .10 | | | (.71 | ) | | — | | | (.71 | ) | | 13.58 | | | 13.25 | |
| 2010 | | | 13.52 | | | .73 | | | .66 | | | 1.39 | | | (.72 | ) | | — | | | (.72 | ) | | 14.19 | | | 14.74 | |
| 2009 | | | 14.30 | | | .71 | | | (.81 | ) | | (.10 | ) | | (.68 | ) | | — | | | (.68 | ) | | 13.52 | | | 13.67 | |
| | | | | | | | | | | | | | | | | | | | | | | | | | | | | |
| Select Tax-Free 2 (NXQ) | | | | | | | | | | | | | | | | | | | | | | | | | |
| Year Ended 3/31: | | | | | | | | | | | | | | | | | | | | | | | | | |
| 2014(c) | | | 14.38 | | | .31 | | | (.96 | ) | | (.65 | ) | | (.32 | ) | | — | | | (.32 | ) | | 13.41 | | | 12.51 | |
| 2013 | | | 13.89 | | | .65 | | | .47 | | | 1.12 | | | (.63 | ) | | — | | | (.63 | ) | | 14.38 | | | 13.99 | |
| 2012 | | | 12.89 | | | .66 | | | .98 | | | 1.64 | | | (.64 | ) | | — | | | (.64 | ) | | 13.89 | | | 13.63 | |
| 2011 | | | 13.53 | | | .64 | | | (.61 | ) | | .03 | | | (.67 | ) | | — | | | (.67 | ) | | 12.89 | | | 12.40 | |
| 2010 | | | 12.63 | | | .68 | | | .89 | | | 1.57 | | | (.67 | ) | | — | | | (.67 | ) | | 13.53 | | | 13.81 | |
| 2009 | | | 13.93 | | | .67 | | | (1.30 | ) | | (.63 | ) | | (.67 | ) | | — | | | (.67 | ) | | 12.63 | | | 13.14 | |
| (a) | Total Return Based on Market Value is the combination of changes in the market price per share and the effect of reinvested dividend income and reinvested capital gains distributions, if any, at the average price paid per share at the time of reinvestment. The last dividend declared in the period, which is typically paid on the first business day of the following month, is assumed to be reinvested at the ending market price. The actual reinvestment for the last dividend declared in the period may take place over several days, and in some instances may not be based on the market price, so the actual reinvestment price may be different from the price used in the calculation. Total returns are not annualized. |
| | |
| | Total Return Based on Net Asset Value is the combination of changes in net asset value, reinvested dividend income at net asset value and reinvested capital gains distributions at net asset value, if any. The last dividend declared in the period, which is typically paid on the first business day of the following month, is assumed to be reinvested at the ending net asset value. The actual reinvest price for the last dividend declared in the period may often be based on the Fund’s market price (and not its net asset value), and therefore may be different from the price used in the calculation. Total returns are not annualized. |
| | | | Ratios/Supplemental Data | |
| | Total Returns | | | | | Ratios to Average Net Assets | | | | |
| | Based on Net Asset Value | (a) | Based on Market Value | (a) | Ending Net Assets (000) | | Expenses | (b) | Net Investment Income (Loss) | | Portfolio Turnover Rate | (d) |
| | | | | | | | | | | | | | | | | | | |
| | | | | | | | | | | | | | | | | | | |
| | | (4.65 | )% | | (8.76 | )% | $ | 232,314 | | | .29 | %* | | 4.50 | %* | | 22 | % |
| | | 8.16 | | | 5.14 | | | 249,134 | | | .28 | | | 4.64 | | | 24 | |
| | | 12.72 | | | 15.72 | | | 240,691 | | | .31 | | | 5.18 | | | 19 | |
| | | .69 | | | (5.40 | ) | | 224,268 | | | .32 | | | 5.05 | | | 6 | |
| | | 10.45 | | | 13.45 | | | 233,869 | | | .32 | | | 5.20 | | | 3 | |
| | | (.65 | ) | | .89 | | | 222,114 | | | .33 | | | 5.12 | | | 11 | |
| | | | | | | | | | | | | | | | | | | |
| | | | | | | | | | | | | | | | | | | |
| | | (4.58 | ) | | (8.38 | ) | | 237,598 | | | .34 | * | | 4.50 | * | | 12 | |
| | | 8.20 | | | 7.29 | | | 254,694 | | | .33 | | | 4.54 | | | 19 | |
| | | 12.97 | | | 15.32 | | | 245,784 | | | .35 | | | 4.94 | | | 20 | |
| | | .13 | | | (5.56 | ) | | 228,016 | | | .39 | | | 4.81 | | | 6 | |
| | | 12.62 | | | 10.45 | | | 239,100 | | | .37 | | | 5.12 | | | 4 | |
| | | (4.63 | ) | | .24 | | | 222,771 | | | .39 | | | 5.08 | | | 6 | |
| (b) | The expense ratios reflect, among other things, the interest expense deemed to have been paid by the Fund on the floating rate certificates issued by the special purpose trusts for the self-deposited inverse floaters held by the Fund, where applicable, as described in Note 3 – Portfolio Securities and Investments in Derivatives, Inverse Floating Rate Securities, as follows: |
| Select Tax-Free (NXP) | | | | |
| Year Ended 3/31: | | | | |
| 2014(c) | | | — | % |
| 2013 | | | — | |
| 2012 | | | — | |
| 2011 | | | — | |
| 2010 | | | — | |
| 2009 | | | — | |
| Select Tax-Free 2 (NXQ) | | | | |
| Year Ended 3/31: | | | | |
| 2014(c) | | | — | %*** |
| 2013 | | | — | ** |
| 2012 | | | — | ** |
| 2011 | | | — | |
| 2010 | | | — | |
| 2009 | | | .01 | |
| (c) | For the six months ended September 30, 2013. |
| (d) | Portfolio Turnover Rate is calculated based on the lesser of long-term purchases or sales (as disclosed in Note 5 – Investment Transactions) divided by the average long-term market value during the period. |
| * | Annualized. |
| ** | Rounds to less than .01%. |
| *** | Rounds to less than .01% annualized. |
See accompanying notes to financial statements.
Financial Highlights (Unaudited) (continued)
Selected data for a share outstanding throughout each period:
| | | | | Investment Operations | | Less Distributions | | | | | |
| | | Beginning Net Asset Value | | Net Investment Income (Loss) | | Net Realized/ Unrealized Gain (Loss) | | Total | | From Net Investment Income | | From Accumulated Net Realized Gains | | Total | | Ending Net Asset Value | | Ending Market Value | |
| Select Tax-Free 3 (NXR) | | | | | | | | | | | | | | | | | | | | | | | | | |
| Year Ended 3/31: | | | | | | | | | | | | | | | | | | | | | | | | | |
| 2014(c) | | $ | 14.94 | | $ | .31 | | $ | (1.00 | ) | $ | (.69 | ) | $ | (.32 | ) | $ | — | | $ | (.32 | ) | $ | 13.93 | | $ | 12.82 | |
| 2013 | | | 14.43 | | | .66 | | | .51 | | | 1.17 | | | (.66 | ) | | — | | | (.66 | ) | | 14.94 | | | 14.48 | |
| 2012 | | | 13.51 | | | .69 | | | .92 | | | 1.61 | | | (.65 | ) | | (.04 | ) | | (.69 | ) | | 14.43 | | | 14.34 | |
| 2011 | | | 14.06 | | | .66 | | | (.57 | ) | | .09 | | | (.64 | ) | | — | * | | (.64 | ) | | 13.51 | | | 13.03 | |
| 2010 | | | 13.38 | | | .67 | | | .65 | | | 1.32 | | | (.64 | ) | | — | * | | (.64 | ) | | 14.06 | | | 14.22 | |
| 2009 | | | 13.98 | | | .66 | | | (.62 | ) | | .04 | | | (.64 | ) | | — | | | (.64 | ) | | 13.38 | | | 13.57 | |
| | | | | | | | | | | | | | | | | | | | | | | | | | | | | |
| California Select Tax-Free (NXC) | | | | | | | | | | | | | | | | | | | | | | |
| Year Ended 3/31: | | | | | | | | | | | | | | | | | | | | | | | | | |
| 2014(c) | | | 15.72 | | | .34 | | | (1.10 | ) | | (.76 | ) | | (.34 | ) | | — | | | (.34 | ) | | 14.62 | | | 13.55 | |
| 2013 | | | 15.07 | | | .69 | | | .64 | | | 1.33 | | | (.68 | ) | | — | | | (.68 | ) | | 15.72 | | | 15.07 | |
| 2012 | | | 13.43 | | | .70 | | | 1.62 | | | 2.32 | | | (.68 | ) | | — | | | (.68 | ) | | 15.07 | | | 14.80 | |
| 2011 | | | 13.97 | | | .68 | | | (.55 | ) | | .13 | | | (.67 | ) | | — | | | (.67 | ) | | 13.43 | | | 12.59 | |
| 2010 | | | 13.24 | | | .67 | | | .73 | | | 1.40 | | | (.67 | ) | | — | | | (.67 | ) | | 13.97 | | | 13.08 | |
| 2009 | | | 14.09 | | | .66 | | | (.84 | ) | | (.18 | ) | | (.67 | ) | | — | | | (.67 | ) | | 13.24 | | | 12.00 | |
| (a) | Total Return Based on Market Value is the combination of changes in the market price per share and the effect of reinvested dividend income and reinvested capital gains distributions, if any, at the average price paid per share at the time of reinvestment. The last dividend declared in the period, which is typically paid on the first business day of the following month, is assumed to be reinvested at the ending market price. The actual reinvestment for the last dividend declared in the period may take place over several days, and in some instances may not be based on the market price, so the actual reinvestment price may be different from the price used in the calculation. Total returns are not annualized. |
| | |
| | Total Return Based on Net Asset Value is the combination of changes in net asset value, reinvested dividend income at net asset value and reinvested capital gains distributions at net asset value, if any. The last dividend declared in the period, which is typically paid on the first business day of the following month, is assumed to be reinvested at the ending net asset value. The actual reinvest price for the last dividend declared in the period may often be based on the Fund’s market price (and not its net asset value), and therefore may be different from the price used in the calculation. Total returns are not annualized. |
| | | | | | | | Ratios/Supplemental Data | |
| | Total Returns | | | | | Ratios to Average Net Assets | | | | |
| | Based on Net Asset Value | (a) | Based on Market Value | (a) | Ending Net Assets (000) | | Expenses | (b) | Net Investment Income (Loss) | | Portfolio Turnover Rate | (d) |
| | | | | | | | | | | | | | | | | | | |
| | | | | | | | | | | | | | | | | | | |
| | | (4.68 | )% | | (9.36 | )% | $ | 181,734 | | | .34 | %** | | 4.38 | %** | | 20 | % |
| | | 8.20 | | | 5.54 | | | 194,920 | | | .33 | | | 4.45 | | | 28 | |
| | | 12.23 | | | 15.69 | | | 188,010 | | | .38 | | | 4.94 | | | 16 | |
| | | .62 | | | (3.98 | ) | | 175,846 | | | .37 | | | 4.75 | | | 4 | |
| | | 10.05 | | | 9.70 | | | 182,779 | | | .38 | | | 4.81 | | | 3 | |
| | | .34 | | | 3.51 | | | 173,678 | | | .39 | | | 4.83 | | | 5 | |
| | | | | | | | | | | | | | | | | | | |
| | | | | | | | | | | | | | | | | | | |
| | | (4.85 | ) | | (7.91 | ) | | 91,712 | | | .38 | ** | | 4.49 | ** | | 7 | |
| | | 8.98 | | | 6.43 | | | 98,595 | | | .37 | | | 4.44 | | | 19 | |
| | | 17.64 | | | 23.56 | | | 94,447 | | | .42 | | | 4.87 | | | 11 | |
| | | .83 | | | 1.18 | | | 84,199 | | | .38 | | | 4.89 | | | 8 | |
| | | 10.71 | | | 14.71 | | | 87,548 | | | .41 | | | 4.87 | | | 4 | |
| | | (1.30 | ) | | (10.34 | ) | | 82,953 | | | .43 | | | 4.85 | | | 12 | |
| (b) | The expense ratios reflect, among other things, the interest expense deemed to have been paid by the Fund on the floating rate certificates issued by the special purpose trusts for the self-deposited inverse floaters held by the Fund, where applicable, as described in Note 3 – Portfolio Securities and Investments in Derivatives, Inverse Floating Rate Securities, as follows: |
| Select Tax-Free 3 (NXR) | | | | |
| Year Ended 3/31: | | | | |
| 2014(c) | | | — | % |
| 2013 | | | — | |
| 2012 | | | — | |
| 2011 | | | — | |
| 2010 | | | — | |
| 2009 | | | — | |
| California Select Tax-Free (NXC) | | | | |
| Year Ended 3/31: | | | | |
| 2014(c) | | | .01 | %** |
| 2013 | | | .01 | |
| 2012 | | | .01 | |
| 2011 | | | .01 | |
| 2010 | | | .02 | |
| 2009 | | | .02 | |
| (c) | For the six months ended September 30, 2013. |
| (d) | Portfolio Turnover Rate is calculated based on the lesser of long-term purchases or sales (as disclosed in Note 5 – Investment Transactions) divided by the average long-term market value during the period. |
| * | Rounds to less than $.01 per share. |
| ** | Annualized. |
See accompanying notes to financial statements.
Financial Highlights (Unaudited) (continued)
Selected data for a share outstanding throughout each period:
| | | | | Investment Operations | | Less Distributions | | | | | |
| | | Beginning Net Asset Value | | Net Investment Income (Loss) | | Net Realized/ Unrealized Gain (Loss) | | Total | | From Net Investment Income | | From Accumulated Net Realized Gains | | Total | | Ending Net Asset Value | | Ending Market Value | |
| New York Select Tax-Free (NXN) | | | | | | | | | | | | | | | | | | | | | | |
| Year Ended 3/31: | | | | | | | | | | | | | | | | | | | | | | | | | |
| 2014(c) | | $ | 14.70 | | $ | .30 | | $ | (1.00 | ) | $ | (.70 | ) | $ | (.32 | ) | $ | — | | $ | (.32 | ) | $ | 13.68 | | $ | 13.01 | |
| 2013 | | | 14.59 | | | .63 | | | .19 | | | .82 | | | (.65 | ) | | (.06 | ) | | (.71 | ) | | 14.70 | | | 14.87 | |
| 2012 | | | 13.71 | | | .66 | | | .86 | | | 1.52 | | | (.64 | ) | | — | | | (.64 | ) | | 14.59 | | | 14.10 | |
| 2011 | | | 14.06 | | | .64 | | | (.38 | ) | | .26 | | | (.61 | ) | | — | | | (.61 | ) | | 13.71 | | | 13.06 | |
| 2010 | | | 13.37 | | | .62 | | | .68 | | | 1.30 | | | (.61 | ) | | — | | | (.61 | ) | | 14.06 | | | 13.80 | |
| 2009 | | | 13.79 | | | .62 | | | (.43 | ) | | .19 | | | (.61 | ) | | — | | | (.61 | ) | | 13.37 | | | 13.08 | |
| (a) | Total Return Based on Market Value is the combination of changes in the market price per share and the effect of reinvested dividend income and reinvested capital gains distributions, if any, at the average price paid per share at the time of reinvestment. The last dividend declared in the period, which is typically paid on the first business day of the following month, is assumed to be reinvested at the ending market price. The actual reinvestment for the last dividend declared in the period may take place over several days, and in some instances may not be based on the market price, so the actual reinvestment price may be different from the price used in the calculation. Total returns are not annualized. |
| | |
| | Total Return Based on Net Asset Value is the combination of changes in net asset value, reinvested dividend income at net asset value and reinvested capital gains distributions at net asset value, if any. The last dividend declared in the period, which is typically paid on the first business day of the following month, is assumed to be reinvested at the ending net asset value. The actual reinvest price for the last dividend declared in the period may often be based on the Fund’s market price (and not its net asset value), and therefore may be different from the price used in the calculation. Total returns are not annualized. |
| | | | Ratios/Supplemental Data | |
| | Total Returns | | | | Ratios to Average Net Assets | | | |
| | Based on Net Asset Value | (a) | Based on Market Value | (a) | Ending Net Assets (000) | | Expenses | (b) | Net Investment Income (Loss) | | Portfolio Turnover Rate | (d) |
| | | | | | | | | | | | | | | | | | | |
| | | | | | | | | | | | | | | | | | | |
| | | (4.82 | )% | | (10.44 | )% | $ | 53,695 | | | .42 | %* | | 4.30 | %* | | 13 | % |
| | | 5.66 | | | 10.60 | | | 57,684 | | | .39 | | | 4.27 | | | 23 | |
| | | 11.25 | | | 13.05 | | | 57,170 | | | .50 | | | 4.62 | | | 19 | |
| | | 1.84 | | | (1.08 | ) | | 53,705 | | | .41 | | | 4.55 | | | 3 | |
| | | 9.89 | | | 10.31 | | | 55,007 | | | .44 | | | 4.50 | | | 1 | |
| | | 1.47 | | | (.57 | ) | | 52,268 | | | .47 | | | 4.57 | | | 1 | |
| (b) | The expense ratios reflect, among other things, the interest expense deemed to have been paid by the Fund on the floating rate certificates issued by the special purpose trusts for the self-deposited inverse floaters held by the Fund, where applicable, as described in Note 3 – Portfolio Securities and Investments in Derivatives, Inverse Floating Rate Securities, as follows: |
| New York Select Tax-Free (NXN) | | | | |
| Year Ended 3/31: | | | | |
| 2014(c) | | | .01 | %* |
| 2013 | | | .01 | |
| 2012 | | | .01 | |
| 2011 | | | .01 | |
| 2010 | | | .02 | |
| 2009 | | | .02 | |
| (c) | For the six months ended September 30, 2013. |
| (d) | Portfolio Turnover Rate is calculated based on the lesser of long-term purchases or sales (as disclosed in Note 5 – Investment Transactions) divided by the average long-term market value during the period. |
| * | Annualized. |
See accompanying notes to financial statements.
| Notes to | |
| | Financial Statements (Unaudited) |
1. General Information and Significant Accounting Policies
General Information
Fund Information
The funds covered in this report and their corresponding New York Stock Exchange (“NYSE”) or NYSE MKT symbols are as follows (each a “Fund” and collectively, the “Funds”):
• Nuveen Select Tax-Free Income Portfolio (NXP) (“Select Tax-Free (NXP)”)
• Nuveen Select Tax-Free Income Portfolio 2 (NXQ) (“Select Tax-Free 2 (NXQ)”)
• Nuveen Select Tax-Free Income Portfolio 3 (NXR) (“Select Tax-Free 3 (NXR)”)
• Nuveen California Select Tax-Free Income Portfolio (NXC) (“California Select Tax-Free (NXC)”)
• Nuveen New York Select Tax-Free Income Portfolio (NXN) (“New York Select Tax-Free (NXN)”)
The Funds are registered under the Investment Company Act of 1940, as amended, as diversified closed-end registered investment companies. Select Tax-Free (NXP), Select Tax-Free 2 (NXQ), Select Tax-Free 3 (NXR), California Select Tax-Free (NXC) and New York Select Tax-Free (NXN) were organized as Massachusetts business trusts on January 29, 1992, March 30, 1992, May 28, 1992, March 30, 1992 and March 30, 1992 respectively.
Each Fund seeks to provide current income and stable dividends, exempt from regular federal and designated state income taxes, where applicable, consistent with the preservation of capital by investing primarily in a portfolio of municipal obligations.
Investment Adviser
The Funds’ investment adviser is Nuveen Fund Advisors, LLC (the “Adviser”), a wholly-owned subsidiary of Nuveen Investments, Inc. (“Nuveen”). The Adviser is responsible for each Fund’s overall investment strategy and asset allocation decisions. The Adviser has entered into sub-advisory agreements with the Nuveen Asset Management, LLC, (the “Sub-Adviser”), a subsidiary of the Adviser, under which the Sub-Adviser manages the investment portfolios of the Funds.
Significant Accounting Policies
The following is a summary of significant accounting policies followed by the Funds in the preparation of their financial statements in accordance with U.S. generally accepted accounting principles (“U.S. GAAP”).
Investment Transactions
Investment transactions are recorded on a trade date basis. Realized gains and losses from investment transactions are determined on the specific identification method, which is the same basis used for federal income tax purposes. Investments purchased on a when-issued/delayed delivery basis may have extended settlement periods. Any investments so purchased are subject to market fluctuation during this period. The Funds have instructed the custodian to earmark securities in the Funds’ portfolios with a current value at least equal to the amount of the when-issued/delayed delivery purchase commitments. As of September 30, 2013, outstanding when-issued/delayed delivery purchase commitments were as follow:
| | | | | |
| | | | Select | |
| | | | Tax-Free | |
| | | | (NXP | ) |
| Outstanding when-issued/delayed delivery purchase commitments | | $ | 1,456,635 | |
Investment Income
Interest income, which reflects the amortization of premiums and includes accretion of discounts for financial reporting purposes, is recorded on an accrual basis. Investment income also reflects paydown gains and losses, if any.
Professional Fees
Professional fees presented on the Statement of Operations consist of legal fees incurred in the normal course of operations, audit fees, tax consulting fees and, in some cases, workout expenditures. Workout expenditures are incurred in an attempt to protect or enhance an investment, or to pursue
other claims or legal actions on behalf of Fund shareholders. Should a Fund receive a refund of workout expenditures paid in a prior reporting period, such amounts will be recognized as “Legal fee refund” on the Statement of Operations.
Dividends and Distributions to Shareholders
Dividends from net investment income are declared monthly. Net realized capital gains and/or market discount from investment transactions, if any, are distributed to shareholders at least annually. Furthermore, capital gains are distributed only to the extent they exceed available capital loss carryforwards.
Distributions to shareholders of net investment income, net realized capital gains and/or market discount, if any, are recorded on the ex-dividend date. The amount and timing of distributions are determined in accordance with federal income tax regulations, which may differ from U.S. GAAP.
Equity Shelf Programs and Offering Costs
During the prior reporting period, the following Funds each filed initial registration statements with the Securities and Exchange Commission (“SEC”) authorizing the Funds to issue additional shares through equity shelf programs (“Shelf Offerings”), which became effective with the SEC during the current fiscal period.
Under these Shelf Offerings, the Funds, subject to market conditions, may raise additional equity capital from time to time in varying amounts and offering methods at a net price at or above each Fund’s net asset value (“NAV”) per share.
Authorized shares, shares issued and offering proceeds, net of offering costs under each Fund’s shelf offering during the six months ended September 30, 2013, were as follows:
| | | | Select | | | Select | | | Select | |
| | | | Tax-Free | | | Tax-Free 2 | | | Tax-Free 3 | |
| | | | (NXP | ) | | (NXQ | ) | | (NXR | ) |
| Authorized shares | | | 1,600,000 | | | 1,700,000 | | | 1,300,000 | |
| Shares issued | | | — | | | — | | | — | |
| Offering proceeds, net of offering costs | | | — | | | — | | | — | |
Costs incurred by the Funds in connection with their initial Shelf Offerings are recorded as a deferred charge, which are amortized over the period such additional shares are sold not to exceed the one-year life of the Shelf Offering period and are recognized as a component of “Deferred offering costs” on the Statement of Assets and Liabilities. Ongoing Shelf Offering costs, and any additional costs the Funds may incur in connection with the Shelf Offerings, are expensed as incurred and recorded as a component of “Proceeds from shelf offering, net of offering costs” on the Statement of Changes in Net Assets.
Indemnifications
Under the Funds’ organizational documents, their officers and trustees are indemnified against certain liabilities arising out of the performance of their duties to the Funds. In addition, in the normal course of business, the Funds enter into contracts that provide general indemnifications to other parties. The Funds’ maximum exposure under these arrangements is unknown as this would involve future claims that may be made against the Funds that have not yet occurred. However, the Funds have not had prior claims or losses pursuant to these contracts and expect the risk of loss to be remote.
Netting Agreements
In the ordinary course of business, the Funds may enter into transactions subject to enforceable International Swaps and Derivative Association, Inc. (“ISDA”) master agreements or other similar arrangements (“netting agreements”). Generally, the right to offset in netting agreements allows each Fund to offset any exposure to a specific counterparty with any collateral received or delivered to that counterparty based on the terms of the agreements. Generally, a Fund manages its cash collateral and securities collateral on a counterparty basis. As of September 30, 2013, the Funds were not invested in any portfolio securities or derivative instruments that are subject to netting agreements.
Use of Estimates
The preparation of financial statements in conformity with U.S. GAAP requires management to make estimates and assumptions that affect the reported amounts of assets and liabilities at the date of the financial statements and the reported amounts of increases and decreases in net assets from operations during the reporting period. Actual results may differ from those estimates.
2. Investment Valuation and Fair Value Measurements
Investment Valuation
Prices of municipal bonds and other fixed income securities are provided by a pricing service approved by the Funds’ Board of Trustees. These securities are generally classified as Level 2 for fair value measurement purposes. The pricing service establishes a security’s fair value using methods that may include consideration of the following: yields or prices of investments of comparable quality, type of issue, coupon, maturity and rating, market quotes or indications of value from security dealers, evaluations of anticipated cash flows or collateral, general market conditions and other information and analysis, including the obligor’s credit characteristics considered relevant. In pricing certain securities, particularly less liquid and lower quality securities, the pricing service may consider information about a security, its issuer or market activity, provided by the Adviser. These securities are generally classified as Level 2 or Level 3 depending on the priority of the significant inputs.
Notes to Financial Statements (Unaudited) (continued)
Certain securities may not be able to be priced by the pre-established pricing methods as described above. Such securities may be valued by the Funds’ Board of Trustees or its designee at fair value. These securities generally include, but are not limited to, restricted securities (securities which may not be publicly sold without registration under the Securities Act of 1933, as amended) for which a pricing service is unable to provide a market price; securities whose trading has been formally suspended; debt securities that have gone into default and for which there is no current market quotation; a security whose market price is not available from a pre-established pricing source; a security with respect to which an event has occurred that is likely to materially affect the value of the security after the market has closed but before the calculation of a Fund’s net asset value (as may be the case in non-U.S. markets on which the security is primarily traded) or make it difficult or impossible to obtain a reliable market quotation; and a security whose price, as provided by the pricing service, is not deemed to reflect the security’s fair value. As a general principle, the fair value of a security would appear to be the amount that the owner might reasonably expect to receive for it in a current sale. A variety of factors may be considered in determining the fair value of such securities, which may include consideration of the following: yields or prices of investments of comparable quality, type of issue, coupon, maturity and rating, market quotes or indications of value from security dealers, evaluations of anticipated cash flows or collateral, general market conditions and other information and analysis, including the obligor’s credit characteristics considered relevant. These securities are generally classified as Level 2 or Level 3 depending on the priority of the significant inputs. Regardless of the method employed to value a particular security, all valuations are subject to review by the Funds’ Board of Trustees or its designee.
Fair Value Measurements
Fair value is defined as the price that the Funds would receive upon selling an investment or transferring a liability in an orderly transaction to an independent buyer in the principal or most advantageous market for the investment. A three-tier hierarchy is used to maximize the use of observable market data and minimize the use of unobservable inputs and to establish classification of fair value measurements for disclosure purposes. Observable inputs reflect the assumptions market participants would use in pricing the asset or liability. Observable inputs are based on market data obtained from sources independent of the reporting entity. Unobservable inputs reflect the reporting entity’s own assumptions about the assumptions market participants would use in pricing the asset or liability. Unobservable inputs are based on the best information available in the circumstances. The following is a summary of the three-tiered hierarchy of valuation input levels.
| Level 1 – | Inputs are unadjusted and prices are determined using quoted prices in active markets for identical securities. |
| | |
| Level 2 – | Prices are determined using other significant observable inputs (including quoted prices for similar securities, interest rates, prepayment speeds, credit risk, etc.). |
| | |
| Level 3 – | Prices are determined using significant unobservable inputs (including management’s assumptions in determining the fair value of investments). |
The inputs or methodologies used for valuing securities are not an indication of the risks associated with investing in those securities. The following is a summary of each Fund’s fair value measurements as of the end of the reporting period:
| | | | | | | | | | | | | | |
| Select Tax-Free (NXP) | | | Level 1 | | | Level 2 | | | Level 3 | | | Total | |
| Long-Term Investments*: | | | | | | | | | | | | | |
| Municipal Bonds | | $ | — | | $ | 230,664,302 | | $ | — | | $ | 230,664,302 | |
| Corporate Bonds | | | — | | | — | | | 34,839 | | | 34,839 | |
| Total | | $ | — | | $ | 230,664,302 | | $ | 34,839 | | $ | 230,699,141 | |
| | | | | | | | | | | | | | |
| Select Tax-Free 2 (NXQ) | | | Level 1 | | | Level 2 | | | Level 3 | | | Total | |
| Long-Term Investments*: | | | | | | | | | | | | | |
| Municipal Bonds | | $ | — | | $ | 234,742,216 | | $ | — | | $ | 234,742,216 | |
| Corporate Bonds | | | — | | | — | | | 54,489 | | | 54,489 | |
| Total | | $ | — | | $ | 234,742,216 | | $ | 54,489 | | $ | 234,796,705 | |
| | | | | | | | | | | | | | |
| Select Tax-Free 3 (NXR) | | | Level 1 | | | Level 2 | | | Level 3 | | | Total | |
| Long-Term Investments*: | | | | | | | | | | | | | |
| Municipal Bonds | | $ | — | | $ | 180,548,127 | | $ | — | | $ | 180,548,127 | |
| Corporate Bonds | | | — | | | — | | | 15,355 | | | 15,355 | |
| Total | | $ | — | | $ | 180,548,127 | | $ | 15,355 | | $ | 180,563,482 | |
| | | | | | | | | | | | | | |
| California Select Tax-Free (NXC) | | | Level 1 | | | Level 2 | | | Level 3 | | | Total | |
| Long-Term Investments*: | | | | | | | | | | | | | |
| Municipal Bonds | | $ | — | | $ | 90,164,011 | | $ | — | | $ | 90,164,011 | |
| | | | | | | | | | | | | | |
| New York Select Tax-Free (NXN) | | | Level 1 | | | Level 2 | | | Level 3 | | | Total | |
| Long-Term Investments*: | | | | | | | | | | | | | |
| Municipal Bonds | | $ | — | | $ | 50,689,085 | | $ | — | | $ | 50,689,085 | |
* Refer to the Fund’s Portfolio of Investments for industry/state classifications.
The Nuveen funds’ Board of Directors/Trustees is responsible for the valuation process and has delegated the oversight of the daily valuation process to the Adviser’s Valuation Committee. The Valuation Committee, pursuant to the valuation policies and procedures adopted by the Board of Directors/Trustees, is responsible for making fair value determinations, evaluating the effectiveness of the funds’ pricing policies and reporting to the Board of Directors/Trustees. The Valuation Committee is aided in its efforts by the Adviser’s dedicated Securities Valuation Team, which is responsible for administering the daily valuation process and applying fair value methodologies as approved by the Valuation Committee. When determining the reliability of independent pricing services for investments owned by the funds, the Valuation Committee, among other things, conducts due diligence reviews of the pricing services and monitors the quality of security prices received through various testing reports conducted by the Securities Valuation Team.
The Valuation Committee will consider pricing methodologies it deems relevant and appropriate when making a fair value determination, based on the facts and circumstances specific to the portfolio instrument. Fair value determinations generally will be derived as follows, using public or private market information:
| | (i) | If available, fair value determinations shall be derived by extrapolating from recent transactions or quoted prices for identical or comparable securities. |
| | | |
| | (ii) | If such information is not available, an analytical valuation methodology may be used based on other available information including, but not limited to: analyst appraisals, research reports, corporate action information, issuer financial statements and shelf registration statements. Such analytical valuation methodologies may include, but are not limited to: multiple of earnings, discount from market value of a similar freely-traded security, discounted cash flow analysis, book value or a multiple thereof, risk premium/yield analysis, yield to maturity and/or fundamental investment analysis. |
The purchase price of a portfolio instrument will be used to fair value the instrument only if no other valuation methodology is available or deemed appropriate, and it is determined that the purchase price fairly reflects the instrument’s current value.
For each portfolio security that has been fair valued pursuant to the policies adopted by the Board of Directors/Trustees, the fair value price is compared against the last available and next available market quotations. The Valuation Committee reviews the results of such testing and fair valuation occurrences are reported to the Board of Directors/Trustees.
3. Portfolio Securities and Investments in Derivatives
Portfolio Securities
Inverse Floating Rate Securities
Each Fund is authorized to invest in inverse floating rate securities. An inverse floating rate security is created by depositing a municipal bond, typically with a fixed interest rate, into a special purpose trust created by a broker-dealer. In turn, this trust (a) issues floating rate certificates, in face amounts equal to some fraction of the deposited bond’s par amount or market value, that typically pay short-term tax-exempt interest rates to third parties, and b) issues to a long-term investor (such as one of the Funds) an inverse floating rate certificate (sometimes referred to as an “inverse floater”) that represents all remaining or residual interest in the trust. The income received by the inverse floater holder varies inversely with the short-term rate paid to the floating rate certificates’ holders, and in most circumstances the inverse floater holder bears substantially all of the underlying bond’s downside investment risk and also benefits disproportionately from any potential appreciation of the underlying bond’s value. The price of an inverse floating rate security will be more volatile than that of the underlying bond because the interest rate is dependent on not only the fixed coupon rate of the underlying bond but also on the short-term interest paid on the floating rate certificates, and because the inverse floating rate security essentially bears the risk of loss of the greater face value of the underlying bond.
A Fund may purchase an inverse floating rate security in a secondary market transaction without first owning the underlying bond (referred to as an “externally-deposited inverse floater”), or instead by first selling a fixed-rate bond to a broker-dealer for deposit into the special purpose trust and receiving in turn the residual interest in the trust (referred to as a “self-deposited inverse floater”). The inverse floater held by a Fund gives the Fund the right (a) to cause the holders of the floating rate certificates to tender their notes at par, and (b) to have the broker transfer the fixed-rate bond held by the trust to the Fund, thereby collapsing the trust. An investment in an externally-deposited inverse floater is identified in the Portfolio of Investments as “(IF) – Inverse floating rate investment.” An investment in a self-deposited inverse floater is accounted for as a financing transaction. In such instances, a fixed-rate bond deposited into a special purpose trust is identified in the Portfolio of Investments as “(UB) – Underlying bond of an inverse floating rate trust reflected as a financing transaction,” with the Fund accounting for the short-term floating rate certificates issued by the trust, at their liquidation value, as “Floating rate obligations” on the Statement of Assets and Liabilities. In addition, the Fund reflects in “Investment Income” the entire earnings of the underlying bond and the related interest paid to the holders of the short-term floating rate certificates as a component of “Interest expense on floating rate obligations” on the Statement of Operations.
During the six months ended September 30, 2013, each Fund invested in externally deposited inverse floaters and/or self-deposited inverse floaters.
Each Fund may also enter into shortfall and forbearance agreements (sometimes referred to as a “recourse trust” or “credit recovery swap”) (such agreements referred to herein as “Recourse Trusts”) with a broker-dealer by which a Fund agrees to reimburse the broker-dealer, in certain
Notes to Financial Statements (Unaudited) (continued)
circumstances, for the difference between the liquidation value of the fixed-rate bond held by the trust and the liquidation value of the floating rate certificates issued by the trust plus any shortfalls in interest cash flows. Under these agreements, a Fund’s potential exposure to losses related to or on inverse floaters may increase beyond the value of a Fund’s inverse floater investments as a Fund may potentially be liable to fulfill all amounts owed to holders of the floating rate certificates. At period end, any such shortfall is recognized as “Unrealized depreciation on Recourse Trusts” on the Statement of Assets and Liabilities.
As of September 30, 2013, each Fund’s maximum exposure to the floating rate obligations issued by externally-deposited Recourse Trusts, was as follows:
| | | | | | | | | | | | | California | | | New York | |
| | | | Select | | | Select | | | Select | | | Select | | | Select | |
| | | | Tax-Free | | | Tax-Free 2 | | | Tax-Free 3 | | | Tax-Free | | | Tax-Free | |
| | | | (NXP | ) | | (NXQ | ) | | (NXR | ) | | (NXC | ) | | (NXN | ) |
| Maximum exposure to Recourse Trusts | | $ | — | | $ | — | | $ | — | | $ | — | | $ | 2,000,000 | |
The average floating rate obligations outstanding and average annual interest rate and fees related to self-deposited inverse floaters for the following Funds during the six months ended September 30, 2013, were as follows:
| | | | | | | California | | | New York | |
| | | | Select | | | Select | | | Select | |
| | | | Tax-Free 2 | | | Tax-Free | | | Tax-Free | |
| | | | (NXQ | ) | | (NXC | ) | | (NXN | ) |
| Average floating rate obligations outstanding | | $ | 1,000,000 | | $ | 1,540,000 | | $ | 1,005,000 | |
| Average annual interest rate and fees | | | .67 | % | | .52 | % | | .38 | % |
Zero Coupon Securities
Each Fund is authorized to invest in zero coupon securities. A zero coupon security does not pay a regular interest coupon to its holders during the life of the security. Income to the holder of the security comes from accretion of the difference between the original purchase price of the security at issuance and the par value of the security at maturity and is effectively paid at maturity. The market prices of zero coupon securities generally are more volatile than the market prices of securities that pay interest periodically.
Investments in Derivatives
Each Fund is authorized to invest in certain derivative instruments such as futures, options and swap contracts. Each Fund will limit its investments in futures, options on futures and swap contracts to the extent necessary for the Adviser to claim the exclusion from registration by the Commodity Futures Trading Commission as a commodity pool operator with respect to the Fund. The Funds record derivative instruments at fair value, with changes in fair value recognized on the Statement of Operations, when applicable. Even though the Funds’ investments in derivatives may represent economic hedges, they are not considered to be hedge transactions for financial reporting purposes. Although the Funds are authorized to invest in derivative instruments and may do so in future, they did not make any such investments during the six months ended September 30, 2013.
Market and Counterparty Credit Risk
In the normal course of business each Fund may invest in financial instruments and enter into financial transactions where risk of potential loss exists due to changes in the market (market risk) or failure of the other party to the transaction to perform (counterparty credit risk). The potential loss could exceed the value of the financial assets recorded on the financial statements. Financial assets, which potentially expose each Fund to counterparty credit risk, consist principally of cash due from counterparties on forward, option and swap transactions, when applicable. The extent of each Fund’s exposure to counterparty credit risk in respect to these financial assets approximates their carrying value as recorded on the Statement of Assets and Liabilities.
Each Fund helps manage counterparty credit risk by entering into agreements only with counterparties the Adviser believes have the financial resources to honor their obligations and by having the Adviser monitor the financial stability of the counterparties. Additionally, counterparties may be required to pledge collateral daily (based on the daily valuation of the financial asset) on behalf of each Fund with a value approximately equal to the amount of any unrealized gain above a pre-determined threshold. Reciprocally, when each Fund has an unrealized loss, the Funds have instructed the custodian to pledge assets of the Funds as collateral with a value approximately equal to the amount of the unrealized loss above a pre-determined threshold. Collateral pledges are monitored and subsequently adjusted if and when the valuations fluctuate, either up or down, by at least the pre-determined threshold amount.
4. Fund Shares
Since the inception of the Funds’ repurchase programs, the Funds have not repurchased any of their outstanding shares.
Transactions in shares were as follows:
| | | Select | | Select | | Select | |
| | | Tax-Free (NXP) | | Tax-Free 2 (NXQ) | | Tax-Free 3 (NXR) | |
| | | | Six Months | | | Year | | | Six Months | | | Year | | | Six Months | | | Year | |
| | | | Ended | | | Ended | | | Ended | | | Ended | | | Ended | | | Ended | |
| | | | 9/30/13 | | | 3/31/13 | | | 9/30/13 | | | 3/31/13 | | | 9/30/13 | | | 3/31/13 | |
| Shares issued to shareholders due to reinvestment of distributions | | | — | | | 30,980 | | | — | | | 13,014 | | | — | | | 15,386 | |
| | | California Select | | New York Select | |
| | | Tax-Free (NXC) | | Tax-Free (NXN) | |
| | | | Six Months | | | Year | | | Six Months | | | Year | |
| | | | Ended | | | Ended | | | Ended | | | Ended | |
| | | | 9/30/13 | | | 3/31/13 | | | 9/30/13 | | | 3/31/13 | |
| Shares issued to shareholders due to reinvestment of distributions | | | — | | | 5,438 | | | 628 | | | 6,149 | |
5. Investment Transactions
Purchases and sales (including maturities but excluding short-term investments, where applicable) during the six months ended September 30, 2013, were as follows:
| | | | | | | | | | | | | California | | | New York | |
| | | | Select | | | Select | | | Select | | | Select | | | Select | |
| | | | Tax-Free | | | Tax-Free 2 | | | Tax-Free 3 | | | Tax-Free | | | Tax-Free | |
| | | | (NXP | ) | | (NXQ | ) | | (NXR | ) | | (NXC | ) | | (NXN | ) |
| Purchases | | $ | 51,342,719 | | $ | 31,563,778 | | $ | 38,511,963 | | $ | 6,122,254 | | $ | 6,968,684 | |
| Sales and maturities | | | 52,090,521 | | | 30,005,000 | | | 36,510,000 | | | 9,281,345 | | | 9,521,849 | |
6. Income Tax Information
Each Fund is a separate taxpayer for federal income tax purposes. Each Fund intends to distribute substantially all of its net investment income and net capital gains to shareholders and to otherwise comply with the requirements of Subchapter M of the Internal Revenue Code applicable to regulated investment companies. Therefore, no federal income tax provision is required. Furthermore, each Fund intends to satisfy conditions that will enable interest from municipal securities, which is exempt from regular federal and designated state income taxes, to retain such tax-exempt status when distributed to shareholders of the Funds. Net realized capital gains and ordinary income distributions paid by the Funds are subject to federal taxation.
For all open tax years and all major taxing jurisdictions, management of the Funds has concluded that there are no significant uncertain tax positions that would require recognition in the financial statements. Open tax years are those that are open for examination by taxing authorities (i.e., generally the last four tax year ends and the interim tax period since then). Furthermore, management of the Funds is also not aware of any tax positions for which it is reasonably possible that the total amounts of unrecognized tax benefits will significantly change in the next twelve months.
The following information is presented on an income tax basis. Differences between amounts for financial statement and federal income tax purposes are primarily due to timing differences in recognizing taxable market discount, timing differences in recognizing certain gains and losses on investment transactions and the treatment of investments in inverse floating rate securities reflected as financing transactions, if any. To the extent that differences arise that are permanent in nature, such amounts are reclassified within the capital accounts as detailed below. Temporary differences do not require reclassification. Temporary and permanent differences do not impact the net asset values of the Funds.
As of September 30, 2013, the cost and unrealized appreciation (depreciation) of investments, as determined on a federal income tax basis, were as follows:
| | | | | | | | | | | | | California | | | New York | |
| | | | Select | | | Select | | | Select | | | Select | | | Select | |
| | | | Tax-Free | | | Tax-Free 2 | | | Tax-Free 3 | | | Tax-Free | | | Tax-Free | |
| | | | (NXP | ) | | (NXQ | ) | | (NXR | ) | | (NXC | ) | | (NXN | ) |
| Cost of investments | | $ | 223,578,604 | | $ | 231,561,029 | | $ | 176,014,290 | | $ | 85,882,284 | | $ | 49,150,840 | |
| Gross unrealized: | | | | | | | | | | | | | | | | |
| Appreciation | | $ | 11,573,059 | | $ | 8,095,275 | | $ | 8,491,664 | | $ | 5,007,380 | | $ | 1,673,973 | |
| Depreciation | | | (4,452,522 | ) | | (5,859,599 | ) | | (3,942,472 | ) | | (2,270,038 | ) | | (1,138,047 | ) |
| Net unrealized appreciation (depreciation) of investments | | $ | 7,120,537 | | $ | 2,235,676 | | $ | 4,549,192 | | $ | 2,737,342 | | $ | 535,926 | |
Notes to Financial Statements (Unaudited) (continued)
Permanent differences, primarily due to federal taxes paid and taxable market discount, resulted in reclassifications among the Funds’ components of net assets as of March 31, 2013, the Funds’ last tax year end, as follows:
| | | | | | | | | | | | | California | | | New York | |
| | | | Select | | | Select | | | Select | | | Select | | | Select | |
| | | | Tax-Free | | | Tax-Free 2 | | | Tax-Free 3 | | | Tax-Free | | | Tax-Free | |
| | | | (NXP | ) | | (NXQ | ) | | (NXR | ) | | (NXC | ) | | (NXN | ) |
| Paid-in-surplus | | $ | 6,304 | | $ | 21,349 | | $ | 349 | | $ | — | | $ | (6,147 | ) |
| Undistributed (Over-distribution of) net investment income | | | (7,871 | ) | | (31,737 | ) | | (13,432 | ) | | (7 | ) | | (3,866 | ) |
| Accumulated net realized gain (loss) | | | 1,567 | | | 10,388 | | | 13,083 | | | 7 | | | 10,013 | |
The tax components of undistributed net tax-exempt income, net ordinary income and net long-term capital gains as of March 31, 2013, the Funds’ last tax year end, were as follows:
| | | | | | | | | | | | | California | | | New York | |
| | | | Select | | | Select | | | Select | | | Select | | | Select | |
| | | | Tax-Free | | | Tax-Free 2 | | | Tax-Free 3 | | | Tax-Free | | | Tax-Free | |
| | | | (NXP | ) | | (NXQ | ) | | (NXR | ) | | (NXC | ) | | (NXN | ) |
Undistributed net tax-exempt income1 | | $ | 1,243,432 | | $ | 1,288,337 | | $ | 976,853 | | $ | 620,749 | | $ | 303,118 | |
Undistributed net ordinary income2 | | | — | | | — | | | — | | | — | | | 1,353 | |
| Undistributed net long-term capital gains | | | — | | | — | | | — | | | 1,558,707 | | | 16,129 | |
| 1 | Undistributed net tax-exempt income (on a tax basis) has not been reduced for the dividend declared on March 1, 2013, paid on April 1, 2013. |
| 2 | Net ordinary income consists of taxable market discount income and net short-term capital gains, if any. |
The tax character of distributions paid during the Funds’ last tax year ended March 31, 2013 was designated for purposes of the dividends paid deduction as follows:
| | | | | | | | | | | | | California | | | New York | |
| | | | Select | | | Select | | | Select | | | Select | | | Select | |
| | | | Tax-Free | | | Tax-Free 2 | | | Tax-Free 3 | | | Tax-Free | | | Tax-Free | |
| | | | (NXP | ) | | (NXQ | ) | | (NXR | ) | | (NXC | ) | | (NXN | ) |
| Distributions from net tax-exempt income | | $ | 11,324,975 | | $ | 11,155,080 | | $ | 8,604,761 | | $ | 4,288,487 | | $ | 2,563,112 | |
Distributions from net ordinary income2 | | | 232,966 | | | 40,490 | | | 13,316 | | | — | | | — | |
| Distributions from net long-term capital gains | | | — | | | — | | | — | | | — | | | 217,215 | |
| 2 | Net ordinary income consists of taxable market discount income and net short-term capital gains, if any. |
As of March 31, 2013, the Funds’ last tax year end, the following Funds had unused capital loss carryforwards available for federal income tax purposes to be applied against future capital gains, if any. If not applied, the carryforwards will expire as shown in the following table. The losses not subject to expiration retain the character reflected and will be utilized first by a Fund, while the losses subject to expiration are considered short-term.
| | | | Select | | | Select | | | Select | |
| | | | Tax-Free | | | Tax-Free 2 | | | Tax-Free 3 | |
| | | | (NXP | ) | | (NXQ | ) | | (NXR | ) |
| Expiration: | | | | | | | | | | |
| March 31, 2015 | | $ | 260,316 | | $ | 862,250 | | $ | — | |
| March 31, 2016 | | | — | | | 7,597 | | | — | |
| March 31, 2017 | | | — | | | 400,800 | | | — | |
| March 31, 2019 | | | — | | | 335,742 | | | — | |
| Not subject to expiration: | | | | | | | | | | |
| Short-term losses | | | — | | | — | | | — | |
| Long-term losses | | | 6,797,823 | | | 10,676,349 | | | 2,718,349 | |
| Total | | $ | 7,058,139 | | $ | 12,282,738 | | $ | 2,718,349 | |
During the Funds’ last tax year ended March 31, 2013, the following Fund utilized its capital loss carryforwards as follows:
| | | | California | |
| | | | Select | |
| | | | Tax-Free | |
| | | | (NXC | ) |
| Utilized capital loss carryforwards | | $ | 459,219 | |
7. Management Fees and Other Transactions with Affiliates
Each Fund’s management fee compensates the Adviser for overall investment advisory and administrative services and general office facilities. The Sub-Adviser is compensated for its services to the Funds from the management fees paid to the Adviser.
Each Fund’s management fee consists of two components – a fund-level fee, based only on the amount of assets within the Fund, and a complex-level fee, based on the aggregate amount of all eligible fund assets managed by the Adviser. This pricing structure enables Fund shareholders to benefit from growth in the assets within their respective Fund as well as from growth in the amount of complex-wide assets managed by the Adviser.
The annual fund-level fee for each Fund, payable monthly, is calculated according to the following schedule:
| | | | Select Tax-Free 2 (NXQ) |
| | | | Select Tax-Free 3 (NXR) |
| | | | California Select Tax-Free (NXC) |
| | Select Tax-Free (NXP) | New York Select Tax-Free (NXN) |
| Average Daily Managed Assets* | Fund-Level Fee Rate | Fund-Level Fee Rate |
| For the first $125 million | .0500 | % | .1000 | % |
| For the next $125 million | .0375 | | .0875 | |
| For the next $250 million | .0250 | | .0750 | |
| For the next $500 million | .0125 | | .0625 | |
The annual complex-level fee for each Fund, payable monthly, is calculated according to the following schedule:
| Complex-Level Managed Asset Breakpoint Level* | Effective Rate at Breakpoint Level |
| $55 billion | .2000 | % |
| $56 billion | .1996 | |
| $57 billion | .1989 | |
| $60 billion | .1961 | |
| $63 billion | .1931 | |
| $66 billion | .1900 | |
| $71 billion | .1851 | |
| $76 billion | .1806 | |
| $80 billion | .1773 | |
| $91 billion | .1691 | |
| $125 billion | .1599 | |
| $200 billion | .1505 | |
| $250 billion | .1469 | |
| $300 billion | .1445 | |
| * | For the fund-level and complex-level fees, managed assets include closed-end fund assets managed by the Adviser that are attributable to certain types of leverage. For these purposes, leverage includes the funds’ use of preferred stock and borrowings and certain investments in the residual interest certificates (also called inverse floating rate securities) in tender option bond (TOB) trusts, including the portion of assets held by a TOB trust that has been effectively financed by the trust’s issuance of floating rate securities, subject to an agreement by the Adviser as to certain funds to limit the amount of such assets for determining managed assets in certain circumstances. The complex-level fee is calculated based upon the aggregate daily managed assets of all Nuveen Funds that constitute “eligible assets.” Eligible assets do not include assets attributable to investments in other Nuveen Funds or assets in excess of $2 billion added to the Nuveen Fund complex in connection with the Adviser’s assumption of the management of the former First American Funds effective January 1, 2011. As of September 30, 2013, the complex-level fee rate for each of these Funds was .1686%. |
The Funds pay no compensation directly to those of its trustees who are affiliated with the Adviser or to its officers, all of whom receive remuneration for their services to the Funds from the Adviser or its affiliates. The Board of Trustees has adopted a deferred compensation plan for independent trustees that enables trustees to elect to defer receipt of all or a portion of the annual compensation they are entitled to receive from certain Nuveen-advised funds. Under the plan, deferred amounts are treated as though equal dollar amounts had been invested in shares of select Nuveen-advised funds.
Annual Investment Management
| | Agreement Approval Process (Unaudited) |
The Board of Trustees (each, a “Board” and each Trustee, a “Board Member”) of the Funds, including the Board Members who are not parties to the Funds’ advisory or sub-advisory agreements or “interested persons” of any such parties (the “Independent Board Members”), is responsible for approving the advisory agreements (each, an “Investment Management Agreement”) between each Fund and Nuveen Fund Advisors, LLC (the “Adviser”) and the sub-advisory agreements (each, a “Sub-Advisory Agreement”) between the Adviser and Nuveen Asset Management, LLC (the “Sub-Adviser”) (the Investment Management Agreements and the Sub-Advisory Agreements are referred to collectively as the “Advisory Agreements”) and their periodic continuation. Pursuant to the Investment Company Act of 1940, as amended (the “1940 Act”), the Board is required to consider the continuation of the Advisory Agreements on an annual basis. Accordingly, at an in-person meeting held on May 20-22, 2013 (the “May Meeting”), the Board, including a majority of the Independent Board Members, considered and approved the continuation of the Advisory Agreements for the Funds for an additional one-year period.
In preparation for its considerations at the May Meeting, the Board requested and received extensive materials prepared in connection with the review of the Advisory Agreements. The materials provided a broad range of information regarding the Funds, the Adviser and the Sub-Adviser (the Adviser and the Sub-Adviser are collectively, the “Fund Advisers” and each, a “Fund Adviser”). As described in more detail below, the information provided included, among other things, a review of Fund performance, including Fund investment performance assessments against peer groups and appropriate benchmarks; a comparison of Fund fees and expenses relative to peers; a description and assessment of shareholder service levels for the Funds; a summary of the performance of certain service providers; a review of product initiatives and shareholder communications; and an analysis of the Adviser’s profitability with comparisons to comparable peers in the managed fund business. As part of its annual review, the Board also held a separate meeting on April 17-18, 2013, to review the Funds’ investment performance and consider an analysis provided by the Adviser of the Sub-Adviser which generally evaluated the Sub-Adviser’s investment team, investment mandate, organizational structure and history, investment philosophy and process, performance of the applicable Fund, and significant changes to the foregoing. As a result of its review of the materials and discussions, the Board presented the Adviser with questions and the Adviser responded.
The materials and information prepared in connection with the annual review of the Advisory Agreements supplement the information and analysis provided to the Board during the year. In this regard, throughout the year, the Board, acting directly or through its committees, regularly reviews the performance and various services provided by the Adviser and the Sub-Adviser. The Board meets at least quarterly as well as at other times as the need arises. At its quarterly meetings, the Board reviews reports by the Adviser regarding, among other things, fund performance, fund expenses, premium and discount levels of closed-end funds, the performance of the investment teams, and compliance, regulatory and risk management matters. In addition to regular reports, the Adviser provides special reports to the Board or a committee thereof from time to time to enhance the Board’s understanding of various topics that impact some or all the Nuveen funds (such as accounting and financial statement presentations of the various forms
of leverage that may be used by a closed-end fund or an update on the valuation policies and procedures), to update the Board on regulatory developments impacting the investment company industry or to update the Board on the business plans or other matters impacting the Adviser. The Board also meets with key investment personnel managing the fund portfolios during the year. In October 2011, the Board also created two standing committees (the Open-End Fund Committee and the Closed-End Fund Committee) to assist the full Board in monitoring and gaining a deeper insight into the distinctive business practices of open-end and closed-end funds. These Committees meet prior to each quarterly Board meeting, and the Adviser provides presentations to these Committees permitting them to delve further into specific matters or initiatives impacting the respective product line.
In addition, the Board continues its program of seeking to have the Board Members or a subset thereof visit each sub-adviser to the Nuveen funds at least once over a multiple year rotation, meeting with key investment and business personnel. In this regard, the Independent Board Members visited certain of the Sub-Adviser’s investment teams in Minneapolis in September 2012, and the Sub-Adviser’s municipal team in November 2012. In addition, the ad hoc Securities Lending Committee of the Board met with certain service providers and the Audit Committee of the Board made a site visit to three pricing service providers.
The Board considers the information provided and knowledge gained at these meetings and visits during the year when performing its annual review of the Advisory Agreements. The Independent Board Members also are assisted throughout the process by independent legal counsel. Counsel provided materials describing applicable law and the duties of directors or trustees in reviewing advisory contracts. During the course of the year and during their deliberations regarding the review of advisory contracts, the Independent Board Members met with independent legal counsel in executive sessions without management present. In addition, it is important to recognize that the management arrangements for the Nuveen funds are the result of many years of review and discussion between the Independent Board Members and fund management and that the Board Members’ conclusions may be based, in part, on their consideration of fee arrangements and other factors developed in previous years.
The Board considered all factors it believed relevant with respect to each Fund, including among other factors: (a) the nature, extent and quality of the services provided by the Fund Advisers, (b) the investment performance of the Fund and Fund Advisers, (c) the advisory fees and costs of the services to be provided to the Fund and the profitability of the Fund Advisers, (d) the extent of any economies of scale, (e) any benefits derived by the Fund Advisers from the relationship with the Fund and (f) other factors. Each Board Member may have accorded different weight to the various factors in reaching his or her conclusions with respect to a Fund’s Advisory Agreements. The Independent Board Members did not identify any single factor as all important or controlling. The Independent Board Members’ considerations were instead based on a comprehensive consideration of all the information presented. The principal factors considered by the Board and its conclusions are described below.
A. Nature, Extent and Quality of Services
In considering renewal of the Advisory Agreements, the Independent Board Members considered the nature, extent and quality of the Fund Adviser’s services, including advisory services and the resulting Fund performance and administrative services. The Independent Board Members further considered the overall reputation and capabilities of the Adviser and its affiliates, the commitment of the Adviser to provide high quality service to the Funds, their overall confidence in the capability and integrity of the Adviser and its staff and the Adviser’s responsiveness to questions and concerns raised by
Annual Investment Management Agreement Approval Process (Unaudited) (continued)
them. The Independent Board Members reviewed materials outlining, among other things, the Fund Adviser’s organization and business; the types of services that the Fund Adviser or its affiliates provide to the Funds; the performance record of the applicable Fund (as described in further detail below); and any applicable initiatives Nuveen had taken for the closed-end fund product line.
In considering advisory services, the Board recognized that the Adviser provides various oversight, administrative, compliance and other services for the Funds and the Sub-Adviser generally provides the portfolio investment management services to the Funds. In reviewing the portfolio management services provided to each Fund, the Board reviewed the materials provided by the Nuveen Investment Services Oversight Team analyzing, among other things, the Sub-Adviser’s investment team and changes thereto, organization and history, assets under management, the investment team’s philosophy and strategies in managing the Fund, developments affecting the Sub-Adviser or Fund and Fund performance. The Independent Board Members also reviewed portfolio manager compensation arrangements to evaluate each Fund Adviser’s ability to attract and retain high quality investment personnel, preserve stability, and reward performance but not provide an inappropriate incentive to take undue risks. In addition, the Board considered the Adviser’s execution of its oversight responsibilities over the Sub-Adviser. Given the importance of compliance, the Independent Board Members also considered Nuveen’s compliance program, including the report of the chief compliance officer regarding the Funds’ compliance policies and procedures; the resources dedicated to compliance; and the record of compliance with the policies and procedures. Given the Adviser’s emphasis on business risk, the Board also appointed an Independent Board Member as a point person to review and keep the Board apprised of developments in this area during the year.
In addition to advisory services, the Board considered the quality and extent of administrative and other non-investment advisory services the Adviser and its affiliates provide to the Funds, including product management, investment services (such as oversight of investment policies and procedures, risk management, and pricing), fund administration, oversight of service providers, shareholder services and communications, administration of Board relations, regulatory and portfolio compliance, legal support, managing leverage and promoting an orderly secondary market for common shares. The Board further recognized Nuveen’s additional investments in personnel, including in compliance and risk management.
In reviewing the services provided, the Board considered the new services and service enhancements that the Adviser has implemented since the various advisory agreements were last reviewed. In reviewing the activities of 2012, the Board recognized the Adviser’s focus on product rationalization for both closed-end and open-end funds during the year, consolidating certain Nuveen funds through mergers that were designed to improve efficiencies and economies of scale for shareholders, repositioning various Nuveen funds through updates in their investment policies and guidelines with the expectation of bringing greater value to shareholders, and liquidating certain Nuveen funds. The Board recognized the Adviser’s significant investment in technology initiatives to, among other things, create a central repository for fund and other Nuveen product data, develop a group within the Adviser designed to handle and analyze fund performance data, and implement a data system to support the risk oversight group. The Board also recognized the enhancements in the valuation group within the Adviser, including upgrading the team and process and automating certain basic systems, and in the compliance group with the addition of personnel, particularly within the testing group. With the advent of the Open-End Fund Committee and Closed-End Fund Committee, the Board also noted the enhanced support and comprehensive in-depth presentations provided by the Adviser to these committees.
In addition to the foregoing actions, the Board also considered other initiatives related to the Nuveen closed-end funds, including the significant level of oversight and administration necessary to manage leverage that has become increasingly varied and complex and the ongoing redesign of technology systems to manage and track the various forms of leverage; continued capital management services, including developing shelf offering programs for various funds; the implementation of projects designed to enhance data integrity for information published on the web and to increase the use of data received from third parties to gain market intelligence; and the continued communication efforts with shareholders, fund analysts and financial advisers. With respect to the latter, the Independent Board Members noted Nuveen’s continued commitment to supporting the secondary market for the common shares of its closed-end funds through a comprehensive secondary market communication program and campaigns designed to raise investor and analyst awareness and understanding of closed-end funds. Nuveen’s support services included, among other things: developing materials covering the Nuveen closed-end fund product line and educational materials regarding closed-end funds; designing and executing various marketing campaigns; supporting and promoting the alternative minimum tax (AMT)-free funds; sponsoring and participating in conferences; communicating with closed-end fund analysts and financial advisers throughout the year; providing marketing and product updates for the closed-end funds; and maintaining and enhancing a closed-end fund website.
Based on their review, the Independent Board Members found that, overall, the nature, extent and quality of services provided to the respective Funds under each applicable Advisory Agreement were satisfactory.
B. The Investment Performance of the Funds and Fund Advisers
The Board, including the Independent Board Members, considered the performance history of each Fund over various time periods. The Board reviewed reports, including an analysis of the Funds’ performance and the applicable investment team. In general, in considering a fund’s performance, the Board recognized that a fund’s performance can be reviewed through various measures including the fund’s absolute return, the fund’s return compared to the performance of other peer funds, and the fund’s performance compared to its respective benchmark. Accordingly, the Board reviewed, among other things, each Fund’s historic investment performance as well as information comparing the Fund’s performance information with that of other funds (the “Performance Peer Group”) and with recognized and/or customized benchmarks (i.e., generally benchmarks derived from multiple recognized benchmarks) for the quarter, one-, three- and five-year periods ending December 31, 2012 as well as performance information reflecting the first quarter of 2013. In addition, with respect to closed-end funds (such as the Funds), the Independent Board Members also reviewed historic premium and discount levels, including a summary of actions taken to address or discuss other developments affecting the secondary market discounts of various funds. This information supplemented the fund performance information provided to the Board at each of its quarterly meetings.
In evaluating performance, the Board recognized several factors that may impact the performance data as well as the consideration given to particular performance data. The Board recognized that the performance data reflects a snapshot of time, in this case as of the end of the most recent calendar year or quarter. The Board noted that selecting a different performance period could derive significantly different results. Further, the Board recognized that it is possible that long-term performance can be adversely affected by even one period of significant underperformance so that a single investment decision or theme has the ability to disproportionately affect long-term performance. The Independent Board Members also noted that the investment experience of a particular shareholder in the Nuveen funds will vary
Annual Investment Management Agreement Approval Process (Unaudited) (continued)
depending on when such shareholder invests in the applicable fund, the class held (if multiple classes are offered in a fund) and the performance of the fund (or respective class) during that shareholder’s investment period.
With respect to the comparative performance information, the Board recognized that the usefulness of comparative performance data as a frame of reference to measure a fund’s performance may be limited because the Performance Peer Group, among other things, does not adequately reflect the objectives and strategies of the fund, has a different investable universe, or the composition of the peer set may be limited in size or number as well as other factors. In this regard, the Board noted that the Adviser classified, in relevant part, the Performance Peer Groups of certain funds as having significant differences from the funds but to still be somewhat relevant while the Performance Peer Groups of other funds (including the Funds) were classified as having such significant differences as to be irrelevant. Accordingly, while the Board is cognizant of the relative performance of a fund’s peer set and/or benchmark(s), the Board evaluated fund performance in light of the respective fund’s investment objectives, investment parameters and guidelines and considered that the variations between the objectives and investment parameters or guidelines of the funds with their peers and/or benchmarks result in differences in performance results. In addition, with respect to any Nuveen funds for which the Board has identified performance concerns, the Board monitors such funds closely until performance improves, discusses with the Adviser the reasons for such results, considers those steps necessary or appropriate to address such issues, and reviews the results of any efforts undertaken.
In considering the performance data for the Funds, given that, as noted above, the Performance Peer Group for each Fund was classified as irrelevant, thereby limiting the usefulness of the peer comparison data, the Independent Board Members also considered the Funds’ performance compared to their respective benchmarks and noted that the Nuveen Select Tax-Free Income Portfolio, the Nuveen Select Tax-Free Income Portfolio 3 and the Nuveen California Select Tax-Free Income Portfolio had outperformed their respective benchmarks for the one-, three- and five-year periods. In addition, the Independent Board Members observed that although the Nuveen Select Tax-Free Income Portfolio 2 underperformed its benchmark for the five-year period, such Fund outperformed its benchmark for the one- and three-year periods and that the Nuveen New York Select Tax-Free Income Portfolio outperformed its benchmark for the one- and three-year periods and provided generally comparable returns to its benchmark for the five-year period.
Based on their review, the Independent Board Members determined that each Fund’s investment performance had been satisfactory.
C. Fees, Expenses and Profitability
1. Fees and Expenses
The Board evaluated the management fees and expenses of each Fund reviewing, among other things, such Fund’s gross management fees, net management fees and net expense ratio in absolute terms as well as compared to the fees and expenses of a comparable universe of funds provided by an independent fund data provider (the “Peer Universe”) and any expense limitations.
The Independent Board Members further reviewed the methodology regarding the construction of the applicable Peer Universe. In reviewing the comparisons of fee and expense information, the Independent Board Members took into account that in certain instances various factors such as: the limited size and particular composition of the Peer Universe (including the inclusion of other Nuveen funds in the peer set); expense anomalies; changes in the funds
comprising the Peer Universe from year to year; levels of reimbursement or fee waivers; the timing of information used; the differences in the type and use of leverage; and differences in the states reflected in the Peer Universe may impact the comparative data, thereby limiting somewhat the ability to make a meaningful comparison with peers.
In reviewing the fee schedule for a Fund, the Independent Board Members also considered the fund-level and complex-wide breakpoint schedules (described in further detail below) and any fee waivers and reimbursements provided by Nuveen. In reviewing fees and expenses (excluding leverage costs and leveraged assets, as applicable), the Board considered the expenses and fees to be higher if they were over 10 basis points higher, slightly higher if they were approximately 6 to 10 basis points higher, in line if they were within approximately 5 basis points higher than the peer average and below if they were below the peer average of the Peer Universe. In reviewing the reports, the Board noted that the majority of the Nuveen funds were at, close to or below their peer set average based on the net total expense ratio.
The Independent Board Members noted that the Funds had net management fees and net expense ratios (including fee waivers and expense reimbursements) that were below their respective peer averages.
Based on their review of the fee and expense information provided, the Independent Board Members determined that each Fund’s management fees to a Fund Adviser were reasonable in light of the nature, extent and quality of services provided to the Fund.
2. Comparisons with the Fees of Other Clients
The Board recognized that all Nuveen funds have a sub-adviser (which, in the case of the Funds, is an affiliated sub-adviser), and therefore, the overall fund management fee can be divided into two components, the fee retained by the Adviser and the fee paid to the sub-adviser. In general terms, the fee to the Adviser reflects the administrative services it provides to support the funds, and while some administrative services may occur at the sub-adviser level, the fee generally reflects the portfolio management services provided by the sub-adviser. The Independent Board Members reviewed information regarding the nature of services provided by the Adviser, including through the Sub-Adviser, and the range of fees and average fee the Sub-Adviser assessed for such services to other clients. Such other clients include municipal separately managed accounts and passively managed exchange traded funds (ETFs) sub-advised by the Adviser. In evaluating the comparisons of fees, the Independent Board Members noted that the fee rates charged to the Funds and other clients vary, among other things, because of the different services involved and the additional regulatory and compliance requirements associated with registered investment companies, such as the Funds. Accordingly, the Independent Board Members considered the differences in the product types, including, but not limited to, the services provided, the structure and operations, product distribution and costs thereof, portfolio investment policies, investor profiles, account sizes and regulatory requirements. The Independent Board Members noted, in particular, that the range of services provided to the Funds (as discussed above) is much more extensive than that provided to separately managed accounts. Many of the additional administrative services provided by the Adviser are not required for institutional clients. Given the inherent differences in the various products, particularly the extensive services provided to the Funds, the Independent Board Members believe such facts justify the different levels of fees.
3. Profitability of Fund Advisers
In conjunction with their review of fees, the Independent Board Members also considered the profitability of Nuveen for its advisory activities and its financial condition. The Independent Board Members reviewed the revenues and expenses of Nuveen’s advisory activities for the last two calendar years, the allocation methodology
Annual Investment Management Agreement Approval Process (Unaudited) (continued)
used in preparing the profitability data and an analysis of the key drivers behind the changes in revenues and expenses that impacted profitability in 2012. The Independent Board Members noted this information supplemented the profitability information requested and received during the year to help keep them apprised of developments affecting profitability (such as changes in fee waivers and expense reimbursement commitments). In this regard, the Independent Board Members noted that they have an Independent Board Member serve as a point person to review and keep them apprised of changes to the profitability analysis and/or methodologies during the year. The Independent Board Members also considered Nuveen’s revenues for advisory activities, expenses, and profit margin compared to that of various unaffiliated management firms with comparable assets under management (based on asset size and asset composition).
In reviewing profitability, the Independent Board Members recognized the Adviser’s continued investment in its business to enhance its services, including capital improvements to investment technology, updated compliance systems, and additional personnel. In addition, in evaluating profitability, the Independent Board Members also recognized the subjective nature of determining profitability which may be affected by numerous factors including the allocation of expenses and that various allocation methodologies may each be reasonable but yield different results. Further, the Independent Board Members recognized the difficulties in making comparisons as the profitability of other advisers generally is not publicly available and the profitability information that is available for certain advisers or management firms may not be representative of the industry and may be affected by, among other things, the adviser’s particular business mix, capital costs, types of funds managed and expense allocations. Notwithstanding the foregoing, the Independent Board Members reviewed Nuveen’s methodology and assumptions for allocating expenses across product lines to determine profitability. Based on their review, the Independent Board Members concluded that the Adviser’s level of profitability for its advisory activities was reasonable in light of the services provided.
With respect to sub-advisers affiliated with Nuveen, including the Sub-Adviser, the Independent Board Members reviewed the sub-adviser’s revenues, expenses and profitability margins (pre- and post-tax) for its advisory activities and the methodology used for allocating expenses among the internal sub-advisers. Based on their review, the Independent Board Members were satisfied that the Sub-Adviser’s level of profitability was reasonable in light of the services provided.
In evaluating the reasonableness of the compensation, the Independent Board Members also considered other amounts paid to a Fund Adviser by the Funds as well as indirect benefits (such as soft dollar arrangements), if any, the Fund Adviser and its affiliates receive, or are expected to receive, that are directly attributable to the management of the Funds. See Section E below for additional information on indirect benefits a Fund Adviser may receive as a result of its relationship with the Funds. Based on their review of the overall fee arrangements of each Fund, the Independent Board Members determined that the advisory fees and expenses of the respective Fund were reasonable.
D. Economies of Scale and Whether Fee Levels Reflect These Economies of Scale
With respect to economies of scale, the Independent Board Members have recognized the potential benefits resulting from the costs of a fund being spread over a larger asset base, although economies of scale are difficult to measure and predict with precision, particularly on a fund-by-fund basis. One method to help ensure the shareholders share in these benefits is to include breakpoints in the advisory fee schedule. Generally, management fees for funds in the
Nuveen complex are comprised of a fund-level component and a complex-level component, subject to certain exceptions. Accordingly, the Independent Board Members reviewed and considered the applicable fund-level breakpoints in the advisory fee schedules that reduce advisory fees as asset levels increase. Further, the Independent Board Members noted that although closed-end funds may from time-to-time make additional share offerings, the growth of their assets will occur primarily through the appreciation of such funds’ investment portfolio.
In addition to fund-level advisory fee breakpoints, the Board also considered the Funds’ complex-wide fee arrangement. Pursuant to the complex-wide fee arrangement, the fees of the funds in the Nuveen complex are generally reduced as the assets in the fund complex reach certain levels. The complex-wide fee arrangement seeks to provide the benefits of economies of scale to fund shareholders when total fund complex assets increase, even if assets of a particular fund are unchanged or have decreased. The approach reflects the notion that some of Nuveen’s costs are attributable to services provided to all its funds in the complex and therefore all funds benefit if these costs are spread over a larger asset base. In addition, with the acquisition of the funds previously advised by FAF Advisors, Inc. at the end of 2010, the Board noted that a portion of such funds’ assets at the time of acquisition were deemed eligible to be included in the complex-wide fee calculation in order to deliver fee savings to shareholders in the combined complex and such funds were subject to differing complex-level fee rates.
Based on their review, the Independent Board Members concluded that the breakpoint schedules and complex-wide fee arrangement were acceptable and reflect economies of scale to be shared with shareholders when assets under management increase.
E. Indirect Benefits
In evaluating fees, the Independent Board Members received and considered information regarding potential “fall out” or ancillary benefits the respective Fund Adviser or its affiliates may receive as a result of its relationship with each Fund. In this regard, the Independent Board Members considered any revenues received by affiliates of the Adviser for serving as co-manager in initial public offerings of new closed-end funds as well as revenues received in connection with secondary offerings.
In addition to the above, the Independent Board Members considered whether the Fund Advisers received any benefits from soft dollar arrangements whereby a portion of the commissions paid by a Fund for brokerage may be used to acquire research that may be useful to the Fund Adviser in managing the assets of the Funds and other clients. The Funds’ portfolio transactions are determined by the Sub-Adviser. Accordingly, the Independent Board Members considered that the Sub-Adviser may benefit from its soft dollar arrangements pursuant to which it receives research from brokers that execute the Funds’ portfolio transactions. With respect to fixed income securities, however, the Board recognized that such securities generally trade on a principal basis that does not generate soft dollar credits. Nevertheless, the Sub-Adviser may also engage in soft dollar arrangements on behalf of other clients, and the Funds as well as the Sub-Adviser may benefit from the research or other services received. Similarly, the Board recognized that the research received pursuant to soft dollar arrangements by the Sub-Adviser may also benefit a Fund and shareholders to the extent the research enhances the ability of the Sub-Adviser to manage the Fund. The Independent Board Members noted that the Sub-Adviser’s profitability may be somewhat lower if it did not receive the research services pursuant to the soft dollar arrangements and had to acquire such services directly.
Annual Investment Management Agreement Approval Process (Unaudited) (continued)
Based on their review, the Independent Board Members concluded that any indirect benefits received by a Fund Adviser as a result of its relationship with the Funds were reasonable and within acceptable parameters.
F. Other Considerations
The Independent Board Members did not identify any single factor discussed previously as all-important or controlling. The Board Members, including the Independent Board Members, unanimously concluded that the terms of each Advisory Agreement are fair and reasonable, that the respective Fund Adviser’s fees are reasonable in light of the services provided to each Fund and that the Advisory Agreements be renewed.
Reinvest Automatically,
Nuveen makes reinvesting easy. A phone call is all it takes to set up your reinvestment account.
Nuveen Closed-End Funds Automatic Reinvestment Plan
Nuveen Closed-End Fund allows you to conveniently reinvest distributions in additional Fund shares. By choosing to reinvest, you’ll be able to invest money regularly and automatically, and watch your investment grow through the power of compounding. Just like distributions in cash, there may be times when income or capital gains taxes may be payable on distributions that are reinvested. It is important to note that an automatic reinvestment plan does not ensure a profit, nor does it protect you against loss in a declining market.
Easy and convenient
To make recordkeeping easy and convenient, each month you’ll receive a statement showing your total distributions, the date of investment, the shares acquired and the price per share, and the total number of shares you own.
How shares are purchased
The shares you acquire by reinvesting will either be purchased on the open market or newly issued by the Fund. If the shares are trading at or above net asset value at the time of valuation, the Fund will issue new shares at the greater of the net asset value or 95% of the then-current market price. If the shares are trading at less than net asset value, shares for your account will be purchased on the open market. If the Plan Agent begins purchasing Fund shares on the open market while shares are trading below net asset value, but the Fund’s shares subsequently trade at or above their net asset value before the Plan Agent is able to complete its purchases, the Plan Agent may cease open-market purchases and may invest the uninvested portion of the distribution in newly-issued Fund shares at a price equal to the greater of the shares’ net asset value or 95% of the shares’ market value on the last business day immediately prior to the purchase date. Distributions received to purchase shares in the open market will normally be invested shortly after the distribution payment date. No interest will be paid on distributions awaiting reinvestment. Because the market price of the shares may increase before purchases are completed, the average purchase price per share may exceed the market price at the time of valuation, resulting in the acquisition of fewer shares than if the distribution had been paid in shares issued by the Fund. A pro rata portion of any applicable brokerage commissions on open market purchases will be paid by Plan participants. These commissions usually will be lower than those charged on individual transactions.
Flexible
You may change your distribution option or withdraw from the Plan at any time, should your needs or situation change. You can reinvest whether your shares are registered in your name, or in the name of a brokerage firm, bank, or other nominee. Ask your investment advisor if his or her firm will participate on your behalf. Participants whose shares are registered in the name of one firm may not be able to transfer the shares to another firm and continue to participate in the Plan. The Fund reserves the right to amend or terminate the Plan at any time. Although the Fund reserves the right to amend the Plan to include a service charge payable by the participants, there is no direct service charge to participants in the Plan at this time.
Call today to start reinvesting distributions
For more information on the Nuveen Automatic Reinvestment Plan or to enroll in or withdraw from the Plan, speak with your financial advisor or call us at (800) 257-8787.
Glossary of Terms Used in this Report
| ■ | Auction Rate Bond: An auction rate bond is a security whose interest payments are adjusted periodically through an auction process, which process typically also serves as a means for buying and selling the bond. Auctions that fail to attract enough buyers for all the shares offered for sale are deemed to have “failed,” with current holders receiving a formula-based interest rate until the next scheduled auction. |
| | |
| ■ | Average Annual Total Return: This is a commonly used method to express an investment’s performance over a particular, usually multi-year time period. It expresses the return that would have been necessary each year to equal the investment’s actual cumulative performance (including change in NAV or market price and reinvested dividends and capital gains distributions, if any) over the time period being considered. |
| | |
| ■ | Duration: Duration is a measure of the expected period over which a bond’s principal and interest will be paid, and consequently is a measure of the sensitivity of a bond’s or bond fund’s value to changes when market interest rates change. Generally, the longer a bond’s or fund’s duration, the more the price of the bond or fund will change as interest rates change. |
| | |
| ■ | Effective Leverage: Effective leverage is a fund’s effective economic leverage, and includes both regulatory leverage (see leverage) and the leverage effects of certain derivative investments in the fund’s portfolio. Currently, the leverage effects of Tender Option Bond (TOB) inverse floater holdings are included in effective leverage values, in addition to any regulatory leverage. |
| | |
| ■ | Gross Domestic Product (GDP): The total market value of all final goods and services produced in a country/region in a given year, equal to total consumer, investment and government spending, plus the value of exports, minus the value of imports. |
| | |
| ■ | Inverse Floating Rate Securities: Inverse floating rate securities, also known as inverse floaters or tender option bonds (TOBs), are created by depositing a municipal bond, typically with a fixed interest rate, into a special purpose trust created by a broker-dealer. This trust, in turn, (a) issues floating rate certificates typically paying short-term tax-exempt interest rates to third parties in amounts equal to some fraction of the deposited bond’s par amount or market value, and (b) issues an inverse floating rate certificate (sometimes referred to as an “inverse floater”) to an investor (such as a fund) interested in gaining investment exposure to a long-term municipal bond. The income received by the holder of the inverse floater varies inversely with the short-term rate paid to the floating rate certificates’ holders, and in most circumstances the holder of the inverse floater bears substantially all of the underlying bond’s downside investment risk. The holder of the inverse floater typically also benefits disproportionately from any potential appreciation of the underlying bond’s value. Hence, an inverse floater essentially represents an investment in the underlying bond on a leveraged basis. |
| | |
| ■ | Leverage: Leverage is created whenever a fund has investment exposure (both reward and/or risk) equivalent to more than 100% of the investment capital. |
| | |
| ■ | Lipper California Municipal Debt Funds Classification Average: Calculated using the returns of all closed-end funds in this category. Lipper returns account for the effects of management fees and assume reinvestment of distributions, but do not reflect any applicable sales charges. |
| ■ | Lipper General and Insured Unleveraged Municipal Debt Funds Classification Average: Calculated using the returns of all closed-end funds in this category. Lipper returns account for the effects of management fees and assume reinvestment of distributions, but do not reflect any applicable sales charges. |
| | |
| ■ | Lipper New York Municipal Debt Funds Classification Average: Calculated using the returns of all closed-end funds in this category. Lipper returns account for the effects of management fees and assume reinvestment of distributions, but do not reflect any applicable sales charges. |
| | |
| ■ | Net Asset Value (NAV) Per Share: A fund’s Net Assets is equal to its total assets (securities, cash, accrued earnings and receivables) less its total liabilities. NAV per share is equal to the fund’s Net Assets divided by its number of shares outstanding. |
| | |
| ■ | Pre-Refunding: Pre-Refunding, also known as advanced refundings or refinancings, is a procedure used by state and local governments to refinance municipal bonds to lower interest expenses. The issuer sells new bonds with a lower yield and uses the proceeds to buy U.S. Treasury securities, the interest from which is used to make payments on the higher-yielding bonds. Because of this collateral, pre-refunding generally raises a bond’s credit rating and thus its value. |
| | |
| ■ | Regulatory Leverage: Regulatory Leverage consists of preferred shares issued by or borrowings of a fund. Both of these are part of a fund’s capital structure. Regulatory leverage is subject to asset coverage limits set in the Investment Company Act of 1940. |
| | |
| ■ | S&P Municipal Bond California Index: An unleveraged, market value-weighted index designed to measure the performance of the tax-exempt, investment grade California municipal bond market. Index returns assume reinvestment of distributions, but do not reflect any applicable sales charges or management fees. |
| | |
| ■ | S&P Municipal Bond Index: An unleveraged, market value-weighted index designed to measure the performance of the tax-exempt, investment grade U.S. municipal bond market. Index returns assume reinvestment of distributions, but do not reflect any applicable sales charges or management fees. |
| | |
| ■ | S&P Municipal Bond New York Index: An unleveraged, market value-weighted index designed to measure the performance of the tax-exempt, investment grade New York municipal bond market. Index returns assume reinvestment of distributions, but do not reflect any applicable sales charges or management fees. |
| | |
| ■ | Total Investment Exposure: Total investment exposure is a fund’s assets managed by the Adviser that are attributable to financial leverage. For these purposes, financial leverage includes a fund’s use of preferred stock and borrowings and investments in the residual interest certificates (also called inverse floating rate securities) in tender option bond (TOB) trusts, including the portion of assets held by a TOB trust that has been effectively financed by the trust’s issuance of floating rate securities. |
| | |
| ■ | Zero Coupon Bond: A zero coupon bond does not pay a regular interest coupon to its holders during the life of the bond. Tax-exempt income to the holder of the bond comes from accretion of the difference between the original purchase price of the bond at issuance and the par value of the bond at maturity and is effectively paid at maturity. The market prices of zero coupon bonds generally are more volatile than the market prices of bonds that pay interest periodically. |
Notes
Notes
Notes
Additional Fund Information
| Board of Trustees | | | | | | | | | | |
| William Adams IV* | | Robert P. Bremner | | Jack B. Evans | | William C. Hunter | | David J. Kundert | | John K. Nelson |
| William J. Schneider | | Thomas S. Schreier, Jr.* | | Judith M. Stockdale | | Carole E. Stone | | Virginia L. Stringer | | Terence J. Toth |
* Interested Board Member.
| Fund Manager | | Custodian | | Legal Counsel | | Independent Registered | | Transfer Agent and |
| Nuveen Fund Advisors, LLC | | State Street Bank | | Chapman and Cutler LLP | | Public Accounting Firm | | Shareholder Services |
| 333 West Wacker Drive | | & Trust Company | | Chicago, IL 60603 | | Ernst & Young LLP | | State Street Bank |
| Chicago, IL 60606 | | Boston, MA 02111 | | | | Chicago, IL 60606 | | & Trust Company |
| | | | | | | | | Nuveen Funds |
| | | | | | | | | P.O. Box 43071 |
| | | | | | | | | Providence, RI 02940-3071 |
| | | | | | | | | (800) 257-8787 |
Quarterly Form N-Q Portfolio of Investments Information
Each Fund is required to file its complete schedule of portfolio holdings with the Securities and Exchange Commission (SEC) for the first and third quarters of each fiscal year on Form N-Q. You may obtain this information directly from the SEC. Visit the SEC on-line at http://www.sec.gov or in person at the SEC’s Public Reference Room in Washington, D.C. Call the SEC toll-free at (800) SEC -0330 for room hours and operation.
Nuveen Funds’ Proxy Voting Information
You may obtain (i) information regarding how each fund voted proxies relating to portfolio securities held during the most recent twelve-month period ended June 30, without charge, upon request, by calling Nuveen Investments toll-free at (800) 257-8787 or on Nuveen’s website at www.nuveen.com and (ii) a description of the policies and procedures that each fund used to determine how to vote proxies relating to portfolio securities without charge, upon request, by calling Nuveen Investments toll free at (800) 257-8787. You may also obtain this information directly from the SEC. Visit the SEC on-line at http://www.sec.gov.
CEO Certification Disclosure
Each Fund’s Chief Executive Officer has submitted to the New York Stock Exchange (NYSE) the annual CEO certification as required by Section 303A.12(a) of the NYSE Listed Company Manual. Each Fund has filed with the SEC the certification of its Chief Executive Officer and Chief Financial Officer required by Section 302 of the Sarbanes-Oxley Act.
Share Information
Each Fund intends to repurchase shares of its own common stock at such times and in such amounts as is deemed advisable. During the period covered by this report, the Fund repurchased shares of its common stock as shown in the accompanying table. Any future repurchases will be reported to shareholders in the next annual or semi-annual report.
| | NXP | NXQ | NXR | NXC | NXN | |
| Shares repurchased | — | — | — | — | — | |
| Nuveen Investments: |
| | Serving Investors for Generations |
Since 1898, financial advisors and their clients have relied on Nuveen Investments to provide dependable investment solutions through continued adherence to proven, long-term investing principles. Today, we offer a range of high quality equity and fixed-income solutions designed to be integral components of a well-diversified core portfolio.
Focused on meeting investor needs.
Nuveen Investments provides high-quality investment services designed to help secure the long-term goals of institutional and individual investors as well as the consultants and financial advisors who serve them. Nuveen Investments markets a wide range of specialized investment solutions which provide investors access to capabilities of its high-quality boutique investment affiliates—Nuveen Asset Management, Symphony Asset Management, NWQ Investment Management Company, Santa Barbara Asset Management, Tradewinds Global Investors, Winslow Capital Management and Gresham Investment Management. In total, Nuveen Investments managed approximately $215 billion as of September 30, 2013.
Find out how we can help you.
To learn more about how the products and services of Nuveen Investments may be able to help you meet your financial goals, talk to your financial advisor, or call us at (800) 257-8787. Please read the information provided carefully before you invest. Investors should consider the investment objective and policies, risk considerations, charges and expenses of any investment carefully. Where applicable, be sure to obtain a prospectus, which contains this and other relevant information. To obtain a prospectus, please contact your securities representative or Nuveen Investments, 333 W. Wacker Dr., Chicago, IL 60606. Please read the prospectus carefully before you invest or send money.
Learn more about Nuveen Funds at: www.nuveen.com/cef
Distributed by Nuveen Investments, LLC | 333 West Wacker Drive | Chicago, IL 60606 | www.nuveen.com | |
ESA-B-0913D
ITEM 2. CODE OF ETHICS.
Not applicable to this filing.
ITEM 3. AUDIT COMMITTEE FINANCIAL EXPERT.
Not applicable to this filing.
ITEM 4. PRINCIPAL ACCOUNTANT FEES AND SERVICES.
Not applicable to this filing.
ITEM 5. AUDIT COMMITTEE OF LISTED REGISTRANTS.
Not applicable to this filing.
ITEM 6. SCHEDULE OF INVESTMENTS.
(a) See Portfolio of Investments in Item 1.
(b) Not applicable.
ITEM 7. DISCLOSURE OF PROXY VOTING POLICIES AND PROCEDURES FOR CLOSED-END MANAGEMENT INVESTMENT COMPANIES.
Not applicable to this filing.
ITEM 8. PORTFOLIO MANAGERS OF CLOSED-END MANAGEMENT INVESTMENT COMPANIES.
Not applicable to this filing.
ITEM 9. PURCHASES OF EQUITY SECURITIES BY CLOSED-END MANAGEMENT INVESTMENT COMPANY AND AFFILIATED PURCHASERS.
Not applicable.
ITEM 10. SUBMISSION OF MATTERS TO A VOTE OF SECURITY HOLDERS.
There have been no material changes to the procedures by which shareholders may recommend nominees to the registrant's Board implemented after the registrant last provided disclosure in response to this Item.
ITEM 11. CONTROLS AND PROCEDURES.
ITEM 12. EXHIBITS.
File the exhibits listed below as part of this Form.
Pursuant to the requirements of the Securities Exchange Act of 1934 and the Investment Company Act of 1940, the registrant has duly caused this report to be signed on its behalf by the undersigned, thereunto duly authorized.
Kevin J. McCarthy
Pursuant to the requirements of the Securities Exchange Act of 1934 and the Investment Company Act of 1940, this report has been signed below by the following persons on behalf of the registrant and in the capacities and on the dates indicated.
Gifford R. Zimmerman
Stephen D. Foy