| | UNITED STATES | | |
| | SECURITIES AND EXCHANGE COMMISSION |
| | Washington, D.C. 20549 | | |
| | | | |
| | FORM N-CSR | | |
| | | | |
| CERTIFIED SHAREHOLDER REPORT OF REGISTERED MANAGEMENT |
| | INVESTMENT COMPANIES | | |
| | | | |
| Investment Company Act file number 811-6718 | | |
| | | | |
| | DREYFUS INVESTMENT GRADE FUND |
| | (Exact name of Registrant as specified in charter) |
| | | | |
| | c/o The Dreyfus Corporation | | |
| | 200 Park Avenue | | |
| | New York, New York 10166 | | |
| | (Address of principal executive offices) | | (Zip code) |
| | | | |
| | Mark N. Jacobs, Esq. | | |
| | 200 Park Avenue | | |
| | New York, New York 10166 | | |
| | (Name and address of agent for service) |
| | | | |
| Registrant's telephone number, including area code: | | (212) 922-6000 |
| | | | |
| Date of fiscal year end: | 7/31 | | |
| | | | |
| Date of reporting period: | 1/31/04 | | |
FORM N-CSR
Item 1. Reports to Stockholders.
| Dreyfus |
| Institutional Yield |
| Advantage Fund |
The views expressed in this report reflect those of the portfolio manager only through the end of the period covered and do not necessarily represent the views of Dreyfus or any other person in the Dreyfus organization. Any such views are subject to change at any time based upon market or other conditions and Dreyfus disclaims any responsibility to update such views.These views may not be relied on as investment advice and, because investment decisions for a Dreyfus fund are based on numerous factors, may not be relied on as an indication of trading intent on behalf of any Dreyfus fund.
Not FDIC-Insured • Not Bank-Guaranteed • May Lose Value
Contents
THE FUND
2
| Letter from the Chairman
|
3
| Discussion of Fund Performance
|
6
| Statement of Investments
|
10
| Statement of Financial Futures
|
11
| Statement of Assets and Liabilities
|
12
| Statement of Operations
|
13
| Statement of Changes in Net Assets
|
15
| Financial Highlights
|
17
| Notes to Financial Statements
|
FOR MORE INFORMATION
|
Back Cover
|
Dreyfus Institutional Yield Advantage Fund
The Fund

LETTER FROM THE CHAIRMAN
Dear Shareholder:
This semiannual report for Dreyfus Institutional Yield Advantage Fund covers the six-month period from August 1, 2003, through January 31, 2004. Inside, you’ll find valuable information about how the fund was managed during the reporting period, including a discussion with Gerald E. Thunelius, portfolio manager and Director of the Dreyfus Taxable Fixed Income Team that manages the fund.
The bond market produced mixed results during the reporting period as investors adjusted to a stronger economic environment.As the U.S. economy gathered momentum, the more interest-rate-sensitive areas of the bond market began to retreat, giving back some of the gains achieved during the previous economic downturn. On the other hand, the bond market’s more credit-sensitive areas generally benefited from the stronger economy, producing more robust gains for corporate bonds.
While recent economic developments suggest to us that interest rates are more likely to rise in 2004 than to fall further, we continue to believe that bonds deserve a prominent place in most investors’ portfolios. As always, we urge you to speak regularly with your financial advisor, who may be in the best position to suggest the Dreyfus funds designed to meet your current needs, future goals and tolerance for risk.
Thank you for your continued confidence and support.
Sincerely,

| Stephen E. Canter |
| Chairman and Chief Executive Officer |
| The Dreyfus Corporation |
| February 17, 2004 |
2

DISCUSSION OF FUND PERFORMANCE
Gerald E. Thunelius, Senior Portfolio Manager Dreyfus Taxable Fixed Income Team
How did Dreyfus Institutional Yield Advantage Fund perform relative to its benchmark?
For the six-month period ended January 31, 2004, the fund’s Institutional shares achieved a total return of 0.06%, and its Investor shares achieved a total return of 0.47%.1 In comparison, the Salomon Smith Barney 1-Year Treasury Benchmark-on-the-Run Index, the fund’s benchmark, achieved a total return of 0.77% for the same period.2
In the absence of changes in monetary policy by the Federal Reserv Board (the “Fed”) during the reporting period, the fund continued to b influenced by low short-term interest rates. However, a strengthenin U.S. economy led to concerns among investors that short-term rate might begin to climb, potentially eroding fixed-income performance The fund produced lower returns than its benchmark, primarily becaus of relative weakness later in the reporting period among the fund’s short term corporate holdings, which are not represented in the benchmark.
What is the fund’s investment approach?
The fund seeks as high a level of current income as is consistent with the preservation of capital, with minimal changes in share price. To pursue its goal, the fund invests only in investment-grade fixed-income securities of U.S. and foreign issuers or the unrated equivalent as determined by Dreyfus. These securities may include U.S. government bonds and notes, corporate bonds, asset-backed securities and mortgage-related securities.
To help reduce share price fluctuations, the fund seeks to keep the average effective duration — a measure of sensitivity to changing interest rates — of its overall portfolio at one year or less.Although we expect the fund’s average effective duration and its average effective maturity — the amount of time until the fund’s holdings mature or
The Fund 3
DISCUSSION OF FUND PERFORMANCE (continued)
are redeemed, on average — to follow each other closely, we may invest in securities with effective final maturities of any length.
When choosing securities for the fund, we analyze many factors in various fixed-income market sectors.We then decide how to allocate the fund’s assets across these sectors and in which securities to invest.
What other factors influenced the fund’s performance?
The fund was primarily affected during the reporting period by fundamental changes in investors’ economic expectations and the impact of those changes on the various sectors of the short-term bond market in which the fund invests.
Just weeks before the reporting period began, the Fed reduced short term interest rates for the thirteenth consecutive time since January 2001 setting its target for the federal funds rate at 1%, a 45-year low. Howeve between the Fed’s interest-rate reduction in late June and the start of th reporting period on August 1, more definite signs of stronger economi growth emerged, and one of the most severe one-month declines in th history of the bond market ensued. Indeed, it was later revealed that th U.S. economy had expanded at a robust 8.2% annualized rate during th third quarter of 2003, lending credence to investors’ concerns that th Fed might raise short-term interest rates in an attempt to forestall poten tial inflationary pressures. These developments hurt U.S. governmen securities more severely than investment-grade corporate securities.
However, fixed-income investors’ inflation-related worries eased considerably during the fourth quarter, when it became clearer that the labor markets remained weak and the economic recovery was likely to be more moderate than many had feared. These expectations were later confirmed by the U.S. Commerce Department, which estimated that gross domestic product grew at an annualized 4.0% rate during the last quarter of 2003. For its part, the Fed repeatedly emphasized its intention to keep interest rates low “for a considerable period.” As investors’ inflation concerns waned, U.S. government securities rallied, outperforming their investment-grade corporate counterparts and causing the fund’s returns to lag its benchmark.
4
In this challenging market environment, we maintained the fund’s average duration in a range between 0.25 and 0.50 years, a strategy designed to limit the fund’s sensitivity to potentially rising interest rates. In addition, as investors’ inflation concerns ebbed, we positioned the fund to benefit from narrower yield differences along the short-term maturity spectrum, which helped boost the fund’s returns slightly.
What is the fund’s current strategy?
Although the economic recovery so far appears to be sustainable, we have seen few signs as of the end of the reporting period that the rate of inflation is poised to accelerate.A significant percentage of the U.S. economy’s manufacturing capacity reportedly remains unused, and the employment picture has improved only modestly. As a result, inflation concerns generally have remained muted, and short-term yields have hovered near historical lows.
We have continued to emphasize very short-term instruments, including corporate securities. However, we are monitoring the U.S. economy for signs of renewed inflationary pressures, and we may revise our strategies if inflation becomes more of a factor and interest rates begin to rise
February 17, 2004
1
| Total return includes reinvestment of dividends and any capital gains paid. Past performance is no guarantee of future results. Share price, yield and investment return fluctuate such that upon redemption, fund shares may be worth more or less than their original cost. Return figures provided reflect the absorption of fund expenses by The Dreyfus Corporation pursuant to an undertaking in effect that may be extended, terminated or modified at any time. Had these expenses not been absorbed, the fund’s returns would have been lower.
|
2
| SOURCE: BLOOMBERG L.P. — Reflects reinvestment of dividends and, where applicable, capital gain distributions.The Salomon Smith Barney 1-Year Treasury Benchmark-on-the-Run Index is an unmanaged index generally representative of the average yield on 1-year U.S. Treasury bills.The index does not take into account charges, fees and other expenses.Total return is calculated on a month-end basis.
|
The Fund 5
| STATEMENT OF INVESTMENTS |
| January 31, 2004 (Unaudited) |
| | Principal | | | |
| Bonds and Notes—73.4% | Amount ($) | Value ($) | |
|
|
| |
| Asset-Backed Ctfs./Health Care—1.7% | | | | |
| NPF XII, | | | | |
| Ser. 1999-1, Cl. A, 6.36%, 2005 | 6,000,000 | a,b,c | 1,291,200 | |
| Asset-Backed Ctfs./Home Equity Loans—5.6% | | | | |
| AAMES Mortgage Trust, | | | | |
| Ser. 1998-C, Cl. A2A, 5.912%, 2028 | 832,119 | | 849,988 | |
| ABFS Mortgage Loan Trust, | | | | |
| Ser. 1997-2, Cl. A5, 7.125%, 2029 | 1,309,565 | | 1,360,846 | |
| Conseco Finance Securitizations, | | | | |
| Ser. 2000-D, Cl. A3, 7.89%, 2018 | 536 | | 540 | |
| Long Beach Mortgage Loan Trust, | | | | |
| Ser. 2003-3, Cl. A, 1.42%, 2033 | 1,664,454 | d | 1,666,360 | |
| Residential Asset Securities, | | | | |
| Ser. 1998-KS3, Cl. AI7, 5.98%, 2029 | 375,633 | | 388,784 | |
| | | | 4,266,518 | |
| Automotive—1.4% | | | | |
| Ford Motor Credit, | | | | |
| Notes, 7.5%, 2005 | 500,000 | | 527,993 | |
| General Motors, | | | | |
| Notes, 6.25%, 2005 | 500,000 | | 520,069 | |
| | | | 1,048,062 | |
| Cable/Media—1.0% | | | | |
| Comcast Cable Communications, | | | | |
| Notes, 8.125%, 2004 | 750,000 | | 761,189 | |
| Commercial Mortgage Pass-Through Ctfs.—12.6% | | | | |
| Banc of America Structured Notes, | | | | |
| Ser. 2002-1A, Cl. B, 5.62%, 2014 | 1,100,000 | a,d | 1,000,141 | |
| COMM: | | | | |
| Ser. 2000-FL2A, Cl. E, 2.09%, 2011 | 4,336,000 | a,d | 4,297,067 | |
| Ser. 2001-FL5A, Cl. G, 2.17%, 2013 | 2,000,000 | a,d | 1,928,019 | |
| CS First Boston Mortgage Securities, | | | | |
| Ser. 2001-CK3, Cl. A1, 5.26%, 2034 | 497,203 | | 513,083 | |
| Morgan Stanley Dean Witter Capital I, | | | | |
| Ser. 2001-XLF, Cl. F, 3.06%, 2013 | 1,816,219 | a,d | 1,814,755 | |
| | | | 9,553,065 | |
| Financial Services—.6% | | | | |
| International Lease Finance, | | | | |
| Notes, 8.375%, 2004 | 425,000 | | 450,313 | |
6
| | Principal | | | |
| Bonds and Notes (continued) | Amount ($) | Value ($) | |
|
|
| |
| Insurance—9.7% | | | | |
| ACE INA, | | | | |
| Sr. Notes, 8.2%, 2004 | 960,000 | | 993,226 | |
| ASIF Global Financing, | | | | |
| Notes, 1.42%, 2006 | 4,866,000 | a,d | 4,868,433 | |
| MetLife, | | | | |
| Debs., 3.911%, 2005 | 750,000 | | 770,278 | |
| Nationwide Mutual Insurance, | | | | |
| Notes, 6.5%, 2004 | 745,000 | a | 746,246 | |
| | | | 7,378,183 | |
| Medical—.7% | | | | |
| Boston Scientific, | | | | |
| Notes, 6.625%, 2005 | 510,000 | | 537,105 | |
| Oil & Gas—1.0% | | | | |
| Occidental Petroleum, | | | | |
| Sr. Notes, 6.5%, 2005 | 695,000 | | 732,584 | |
| Real Estate Investment Trusts—1.2% | | | | |
| Developers Diversified Realty, | | | | |
| Medium-Term Notes, 6.94%, 2004 | 700,000 | | 716,568 | |
| Excel Realty Trust, | | | | |
| Sr. Notes, 6.875%, 2004 | 165,000 | | 170,499 | |
| | | | 887,067 | |
| Residential Mortgage Pass-Through Ctfs.—3.9% | | | | |
| Residential Funding Mortgage Securities I: | | | | |
| Ser. 2001-S4, Cl. M1, 7.25%, 2031 | 1,474,133 | | 1,523,811 | |
| Ser. 2001-S13, Cl. A1, 6.5%, 2016 | 144,510 | | 146,952 | |
| Structured Asset Securities, | | | | |
| Ser. 2001-5, Cl.1A3, 6%, 2031 | 1,324,402 | | 1,323,704 | |
| | | | 2,994,467 | |
| Structured Index—3.1% | | | | |
| HSBC TIGERS: | | | | |
| Medium-Term Notes, Ser. 2003-2, | | | | |
| 4.02%, 2008 | 1,000,000 | a,d,e | 995,500 | |
| Medium-Term Notes, Ser. 2003-3, | | | | |
| Cl. D-1, 4.02%, 2008 | 370,000 | a,d,e | 369,899 | |
| Medium-Term Notes, | | | | |
| Ser. 2003-4, 4.42%, 2008 | 1,000,000 | a,d,e | 1,002,000 | |
| | | | 2,367,399 | |
The Fund 7
STATEMENT OF INVESTMENTS (Unaudited) (continued)
| | | Principal | | | |
| Bonds and Notes (continued) | Amount ($) | Value ($) | |
|
|
| |
| Technology—7.0% | | | | |
| Meridian Funding, | | | | |
| Notes, 1.59%, 2009 | 5,300,000 | a,d | 5,299,237 | |
| U.S. Government Agencies—16.6% | | | | |
| Federal Home Loan Bank, | | | | |
| Bonds, 1.625%, 6/15/2005 | 4,605,000 | | 4,610,130 | |
| Federal National Mortgage Association, | | | | |
| Notes, 2%, 1/15/2006 | 8,000,000 | | 8,006,272 | |
| | | | | 12,616,402 | |
| U.S. Government Agencies/Mortgage-Backed—6.6% | | | | |
| Federal Home Loan Mortgage Corp., | | | | |
| REMIC Trust, Gtd. Multiclass Mortgage Participation Ctfs., | | | | |
| Ser. 2551, Cl. TA, 4.5%, 2/15/2018 | 2,093,331 | | 2,112,649 | |
| Federal National Mortgage Association: | | | | |
| Ser. 2002-55, Cl. GD, 5.5%, 11/25/2015 | 1,798,391 | | 1,834,793 | |
| Grantor Trust, | | | | |
| Ser. 1999-T1, Cl. A6, 6%, 1/25/2039 | 120,122 | | 120,197 | |
| Government National Mortgage Association, | | | | |
| Ser. 2002-52, Cl. AG, 6%, 9/20/2029 | 961,058 | | 974,558 | |
| | | | | 5,042,197 | |
| Utilities/Gas & Electric—.7% | | | | |
| KeySpan, | | | | | |
| Sr. Notes, 7.25%, 2005 | 500,000 | | 544,427 | |
| Total Bonds and Notes | | | | |
| (cost $ | 60,713,106) | | | 55,769,415 | |
|
|
|
|
| |
| | | | | | |
| Other Investments—6.6% | Shares | | Value ($) | |
|
|
|
| |
| Registered Investment Companies: | | | | |
| Dreyfus Institutional Cash Advantage Fund | 1,668,667 | f | 1,668,667 | |
| Dreyfus Institutional Cash Advantage Plus Fund | 1,668,667 | f | 1,668,667 | |
| Dreyfus Institutional Preferred Plus Money Market Fund | 1,668,666 | f | 1,668,666 | |
| Total Other Investments | | | | |
| (cost $ | 5,006,000) | | | 5,006,000 | |
8
| | | | Principal | | | |
| Short-Term Investments—19.8% | Amount ($) | Value ($) | |
|
|
| |
| Agency Discount Notes—19.7% | | | | |
| Federal National Mortgage Association: | | | | |
| 1.06%, 3/10/2004 | | 4,500,000 | | 4,494,965 | |
| 1.07%, 4/7/2004 | | 3,500,000 | | 3,493,134 | |
| 1.126%, 6/2/2004 | | 7,000,000 | | 6,973,312 | |
| | | | | | 14,961,411 | |
| U.S. Treasury Bills—.1% | | | | | |
| .91%, 5/20/2004 | | 60,000 | g | 59,838 | |
| .94%, 7/15/2004 | | 40,000 | g | 39,825 | |
| | | | | | 99,663 | |
| Total Short-Term Investments | | | | |
| (cost $ | 15,061,075) | | | | 15,061,074 | |
|
|
|
|
|
| |
| | | | | | | |
| Total Investments (cost $ | 80,780,181) | 99.8% | | 75,836,489 | |
| Cash and Receivables (Net) | .2% | | 170,522 | |
| Net Assets | | 100.0% | | 76,007,011 | |
a Securities exempt from registration under Rule 144A of the Securities Act of 1933.These securities may be resold in transactions exempt from registration, normally to qualified institutional buyers.At January 31, 2004, these securities amounted to $23,612,497 or 31.1% of net assets.
b
| Non-income producing—security in default.
|
c
| The value of this security has been determined in good faith under the direction of the Board of Directors.
|
d
| Variable rate security—interest rate subject to periodic change.
|
e
| Securities linked to a portfolio of debt securities.
|
f
| Investments in affiliated money market mutual funds—see Note 3(d).
|
g
| Held by a broker as collateral for open financial futures positions.
|
See notes to financial statements.
The Fund 9
| STATEMENT OF FINANCIAL FUTURES |
| January 31, 2004 (Unaudited) |
| | | | | | Unrealized | |
| | | | Market Value | | Appreciation | |
| | | | Covered by | | (Depreciation) | |
| | Contracts | | Contracts ($) | Expiration | at 1/31/2004 ($) | |
|
| |
|
|
| |
| Financial Futures Long | | | | | | |
| U.S. Treasury 5 Year Notes | 108 | | 12,131,438 | March 2004 | 5,102 | |
| U.S. Treasury 10 Year Notes | 29 | | 3,289,688 | March 2004 | (37,195) | |
| Financial Futures Short | | | | | | |
| 90 Day Euro | 76 | | 18,686,500 | September 2004 | (13,300) | |
| U.S. Treasury 2 Year Notes | 86 | | 18,447,000 | March 2004 | (26,789) | |
| | | | | | (72,182) | |
See notes to financial statements.
10
| STATEMENT OF ASSETS AND LIABILITIES |
| January 31, 2004 (Unaudited) |
| | | Cost | Value | |
|
|
|
| |
| Assets ($): | | | | |
| Investments in securities—See Statement of Investments | 80,780,181 | 75,836,489 | |
| Receivable for investment securities sold | | 563,145 | |
| Interest receivable | | 320,250 | |
| Paydowns receivable | | 93,126 | |
| Receivable for futures variation margin—Note 4 | | 80,541 | |
| Prepaid expenses | | 12,900 | |
| | | | 76,906,451 | |
|
|
|
| |
| Liabilities ($): | | | | |
| Due to The Dreyfus Corporation and affiliates | | 4,286 | |
| Cash overdraft due to Custodian | | 842,606 | |
| Payable for shares of Common Stock redeemed | | 18,304 | |
| Accrued expenses | | 34,244 | |
| | | | 899,440 | |
|
|
|
| |
| Net Assets ( | $) | | 76,007,011 | |
|
|
|
| |
| Composition of Net Assets ($): | | | |
| Paid-in capital | | | 85,175,202 | |
| Accumulated distributions in excess of investment income—net | | (71,167) | |
| Accumulated net realized gain (loss) on investments | | (4,081,150) | |
| Accumulated net unrealized appreciation (depreciation) | | | |
| on investments [including ($72,182) net unrealized | | | |
| (depreciation) on financial futures] | | (5,015,874) | |
|
|
| |
| Net Assets ( | $) | | 76,007,011 | |
| Net Asset Value Per Share | | | | |
| | Investor Shares | | Institutional Shares | |
|
| |
| |
| Net Assets ($) | 29,760,153 | | 46,246,858 | |
| Shares Outstanding | 15,362,193 | | 23,908,509 | |
|
| |
| |
| Net Asset Value Per Share ($) | 1.94 | | 1.93 | |
See notes to financial statements.
The Fund 11
| STATEMENT OF OPERATIONS |
| Six Months Ended January 31, 2004 (Unaudited) |
| Investment Income ($): | | |
| Interest | | 1,561,023 | |
| Cash dividends | | 29,225 | |
| Total Income | | 1,590,248 | |
| Expenses: | | | |
| Management fee—Note 3(a) | | 110,535 | |
| Service fees (Investor Shares)—Note 3(b) | 37,312 | |
| Registration fees | | 27,862 | |
| Prospectus and shareholders’ reports | 13,727 | |
| Auditing fees | | 13,456 | |
| Legal fees | | 8,356 | |
| Shareholder servicing costs—Note 3(b) | 5,995 | |
| Custodian fees—Note 3(b) | | 3,745 | |
| Directors’ fees and expenses—Note 3(c) | 1,612 | |
| Miscellaneous | | 8,877 | |
| Total Expenses | | 231,477 | |
| Less—reduction in management fee due to | | |
| undertaking—Note 3(a) | | (83,630) | |
| Net Expenses | | 147,847 | |
| Investment Income—Net | | 1,442,401 | |
|
|
| |
| Realized and Unrealized Gain (Loss) on Investments—Note 4 ($): | | |
| Net realized gain (loss) on investments | (1,354,234) | |
| Net realized gain (loss) on financial futures | 10,015 | |
| Net Realized Gain (Loss) | | (1,344,219) | |
| Net unrealized appreciation (depreciation) on investments | | |
| [including ($ | 472,550) net unrealized (depreciation) on financial futures] | 398,078 | |
| Net Realized and Unrealized Gain (Loss) on Investments | (946,141) | |
| Net Increase in Net Assets Resulting from Operations | 496,260 | |
See notes to financial statements.
12
STATEMENT OF CHANGES IN NET ASSETS
| | Six Months Ended | | | |
| | January 31, 2004 | | Year Ended | |
| | (Unaudited) | | July 31, 2003 | |
|
| |
| |
| Operations ($): | | | | |
| Investment income—net | 1,442,401 | | 10,110,249 | |
| Net realized gain (loss) on investments | (1,344,219) | | 1,446,627 | |
| Net unrealized appreciation | | | | |
| (depreciation) on investments | 398,078 | | (7,131,772) | |
| Net Increase (Decrease) in Net Assets | | | | |
| Resulting from Operations | 496,260 | | 4,425,104 | |
|
| |
| |
| Dividends to Shareholders from ($): | | | | |
| Investment income—net: | | | | |
| Investor Shares | (443,358) | | (1,933,626) | |
| Institutional Shares | (1,263,809) | | (10,067,831) | |
| Total Dividends | (1,707,167) | | (12,001,457) | |
|
| |
| |
| Capital Stock Transactions ($): | | | | |
| Net proceeds from shares sold: | | | | |
| Investor Shares | 2,725,033 | | 124,158,647 | |
| Institutional Shares | 13,176,171 | | 339,518,910 | |
| Dividends reinvested: | | | | |
| Investor Shares | 395,329 | | 1,796,515 | |
| Institutional Shares | 369,557 | | 1,750,406 | |
| Cost of shares redeemed: | | | | |
| Investor Shares | (3,370,554) | | (108,947,482) | |
| Institutional Shares | (132,466,238) | | (422,398,938) | |
| Increase (Decrease) in Net Assets from | | | | |
| Capital Stock Transactions | (119,170,702) | | (64,121,942) | |
| Total Increase (Decrease) in Net Assets | (120,381,609) | | (71,698,295) | |
|
| |
| |
| Net Assets ($): | | | | |
| Beginning of Period | 196,388,620 | | 268,086,915 | |
| End of Period | 76,007,011 | | 196,388,620 | |
| Undistributed (distributions in excess | | | | |
| of) investment income—net | (71,167) | | 193,599 | |
The Fund 13
STATEMENT OF CHANGES IN NET ASSETS (continued)
| | Six Months Ended | | | |
| | January 31, 2004 | | Year Ended | |
| | (Unaudited) | | July 31, 2003 | |
|
| |
| |
| Capital Share Transactions: | | | | |
| Investor Shares | | | | |
| Shares sold | 1,394,136 | | 62,409,279 | |
| Shares issued for dividends reinvested | 202,966 | | 909,366 | |
| Shares redeemed | (1,725,347) | | (55,249,523) | |
| Net Increase (Decrease) in Shares Outstanding | (128,245) | | 8,069,122 | |
|
| |
| |
| Institutional Shares | | | | |
| Shares sold | 6,750,657 | | 171,170,592 | |
| Shares issued for dividends reinvested | 189,571 | | 886,754 | |
| Shares redeemed | (67,763,625) | | (214,138,637) | |
| Net Increase (Decrease) in Shares Outstanding | (60,823,397) | | (42,081,291) | |
See notes to financial statements.
14
FINANCIAL HIGHLIGHTS
The following tables describe the performance for each share class for the fiscal periods indicated. All information (except portfolio turnover rate) reflects financial results for a single fund share.Total return shows how much your investment in the fund would have increased (or decreased) during each period, assuming you had reinvested all dividends and distributions.These figures have been derived from the fund’s financial statements.
| | Six Months Ended | | | | | |
| | January 31, 2004 | | Year Ended July 31, | |
| | | |
| |
| Investor Shares | (Unaudited) | | 2003 | | 2002a | |
|
| |
| |
| |
| Per Share Data ($): | | | | | | |
| Net asset value, beginning of period | 1.96 | | 2.00 | | 2.00 | |
| Investment Operations: | | | | | | |
| Investment income—netb | .02 | | .05 | | .05 | |
| Net realized and unrealized | | | | | | |
| gain (loss) on investments | (.01) | | (.03) | | .01 | |
| Total from Investment Operations | .01 | | .02 | | .06 | |
| Distributions: | | | | | | |
| Dividends from investment income—net | (.03) | | (.06) | | (.06) | |
| Net asset value, end of period | 1.94 | | 1.96 | | 2.00 | |
|
| |
| |
| |
| Total Return (%) | .47c | | 1.12 | | 2.82c | |
|
| |
| |
| |
| Ratios/Supplemental Data (%): | | | | | | |
| Ratio of expenses to average net assets | .45d | | .45 | | .45d | |
| Ratio of net investment income | | | | | | |
| to average net assets | 2.42d | | 2.55 | | 3.71d | |
| Decrease reflected in above expense ratios due | | | | | | |
| to undertakings by The Dreyfus Corporation | .16d | | .06 | | .44d | |
| Portfolio Turnover Rate | 125.07c | | 441.13 | | 98.01c | |
|
| |
| |
| |
| Net Assets, end of period ($ x 1,000) | 29,760 | | 30,368 | | 14,833 | |
a From November 15, 2001 (commencement of operations) to July 31, 2002.
b
| Based on average shares outstanding at each month end.
|
c
| Not annualized.
|
d
| Annualized.
|
See notes to financial statements.
The Fund 15
FINANCIAL HIGHLIGHTS (continued)
| | Six Months Ended | | | | | |
| | January 31, 2004 | | Year Ended July 31, | |
| | | |
| |
| Institutional Shares | (Unaudited) | | 2003 | | 2002a | |
|
| |
| |
| |
| Per Share Data ($): | | | | | | |
| Net asset value, beginning of period | 1.96 | | 2.00 | | 2.00 | |
| Investment Operations: | | | | | | |
| Investment income—netb | .02 | | .06 | | .06 | |
| Net realized and unrealized | | | | | | |
| gain (loss) on investments | (.02) | | (.03) | | — | |
| Total from Investment Operations | .00 | | .03 | | .06 | |
| Distributions: | | | | | | |
| Dividends from investment income—net | (.03) | | (.07) | | (.06) | |
| Net asset value, end of period | 1.93 | | 1.96 | | 2.00 | |
|
| |
| |
| |
| Total Return (%) | .06c | | 1.37 | | 3.00c | |
|
| |
| |
| |
| Ratios/Supplemental Data (%): | | | | | | |
| Ratio of expenses to average net assets | .20d | | .20 | | .20d | |
| Ratio of net investment income | | | | | | |
| to average net assets | 2.68d | | 2.77 | | 4.10d | |
| Decrease reflected in above expense ratios due | | | | | | |
| to undertakings by The Dreyfus Corporation | .15d | | .06 | | .17d | |
| Portfolio Turnover Rate | 125.07c | | 441.13 | | 98.01c | |
|
| |
| |
| |
| Net Assets, end of period ($ x 1,000) | 46,247 | | 166,020 | | 253,254 | |
a From November 15, 2001 (commencement of operations) to July 31, 2002.
b
| Based on average shares outstanding at each month end.
|
c
| Not annualized.
|
d
| Annualized.
|
See notes to financial statements.
16
NOTES TO FINANCIAL STATEMENTS (Unaudited)
NOTE 1—Significant Accounting Policies:
Dreyfus Institutional Yield Advantage Fund (the “fund”) is a separate diversified series of Dreyfus Investment Grade Funds, Inc. (the “Company”) which is registered under the Investment Company Act of 1940, as amended (the “Act”), as an open-end management investment company and operates as a series company currently offering five series, including the fund.The fund’s investment objective is to provide investors with as high a level of current income as is consistent with the preservation of capital with minimal changes in share price. The Dreyfus Corporation (the “Manager”) serves as the fund’s investment adviser. The Manager is a wholly-owned subsidiary of Mellon Bank, N.A. (“Mellon”), which is a wholly-owned subsidiary of Mellon Financial Corporation. Dreyfus Service Corporation (the “Distributor”), a wholly-owned subsidiary of the Manager, is the distributor of the fund’s shares which are sold to the public without a sales charge.
The fund is authorized to issue 500 million shares of $.001 par value Common Stock in each of the following classes of shares: Investor and Institutional. Investor shares are subject to a Service Plan adopted pursuant to Rule 12b-1 under the Act. Other differences between the classes include the services offered to and the expenses borne by each class, the minimum initial investment and certain voting rights. Income, expenses (other than expenses attributable to a specific class), and realized and unrealized gains or losses on investments are allocated to each class of shares based on its relative net assets.
The Company accounts separately for the assets, liabilities and operations of each series. Expenses directly attributable to each series are charged to that series’ operations; expenses which are applicable to all series are allocated among them on a pro rata basis.
The fund’s financial statements are prepared in accordance with accounting principles generally accepted in the United States, which may require the use of management estimates and assumptions.Actual results could differ from those estimates.
The Fund 17
NOTES TO FINANCIAL STATEMENTS (Unaudited) (continued)
(a) Portfolio valuation: Investments in securities (excluding short-term investments (other than U.S.Treasury Bills), financial futures and options) are valued each business day by an independent pricing service (the “Service”) approved by the Board of Directors. Investments for which quoted bid prices are readily available and are representative of the bid side of the market in the judgment of the Service are valued at the mean between the quoted bid prices (as obtained by the Service from dealers in such securities) and asked prices (as calculated by the Service based upon its evaluation of the market for such securities). Other investments (which constitute a majority of the portfolio securities) are carried at fair value as determined by the Service, based on methods which include consideration of: yields or prices of securities of comparable quality, coupon, maturity and type; indications as to values from dealers; and general market conditions. Securities for which there are no such valuations are valued at fair value as determined in good faith under the direction of the Board of Directors. Short-term investments, excluding U.S. Treasury Bills, are carried at amortized cost, which approximates value. Financial futures and options, which are traded on an exchange, are valued at the last sales price on the securities exchange on which such securities are primarily traded or at the last sales price on the national securities market on each business day. Options traded over-the-counter are priced at the mean between the bid prices and the asked prices.
(b) Securities transactions and investment income: Securities transactions are recorded on a trade date basis. Realized gain and loss from securities transactions are recorded on the identified cost basis. Dividend income is recognized on the ex-dividend date and interest income, including, where applicable, amortization of discount and premium on investments, is recognized on the accrual basis. Under the terms of the custody agreement, the fund receives net earnings credits based on available cash balances left on deposit.
(c) Dividends to shareholders: It is the policy of the fund to declare dividends daily from investment income-net. Such dividends are paid monthly. Dividends from net realized capital gain, if any, are normally declared and paid annually, but the fund may make distributions on a
18
more frequent basis to comply with the distribution requirements of the Internal Revenue Code of 1986, as amended (the “Code”).To the extent that net realized capital gain can be offset by capital loss carryovers, it is the policy of the fund not to distribute such gain. Income and capital gain distributions are determined in accordance with income tax regulations, which may differ from accounting principles generally accepted in the United States.
(d) Federal income taxes: It is the policy of the fund to continue to qualify as a regulated investment company, if such qualification is in the best interests of its shareholders, by complying with the applicable provisions of the Code, and to make distributions of taxable income sufficient to relieve it from substantially all federal income and excise taxes.
The fund has an unused capital loss carryover of $2,281,578 available for federal income tax purposes to be applied against future net securities profits, if any, realized subsequent to July 31, 2003. If not applied, the carryover expires in fiscal 2011.
The tax character of distributions paid to shareholders during the fiscal year ended July 31, 2003 was as follows: ordinary income $12,001,457. The tax character of current year distributions will be determined at the end of the current fiscal year.
(e) Indemnification: The fund enters into contracts that contain a variety of indemnification.The fund’s maximum exposure under these arrangements is unknown. The fund does not anticipate recognizing any loss related to the arrangements.
NOTE 2—Bank Line of Credit:
The fund participates with other Dreyfus-managed funds in a $100 million unsecured line of credit primarily to be utilized for temporary or emergency purposes, including the financing of redemptions. Interest is charged to the fund based on prevailing market rates in effect at the time of borrowings. During the period ended January 31, 2004, the fund did not borrow under the line of credit.
The Fund 19
NOTES TO FINANCIAL STATEMENTS (Unaudited) (continued)
NOTE 3—Management Fee and Other Transactions With Affiliates:
(a) Pursuant to a management agreement (“Agreement”) with the Manager, the management fee is computed at the annual rate of .20 of 1% of the value of the fund’s average daily net assets and is payable monthly. The Manager has undertaken from August 1, 2003 through January 31, 2004, to reduce the management fee paid by the fund, if the fund’s aggregate expenses, exclusive of taxes, brokerage fees, interest on borrowings, service plan fees and extraordinary expenses, exceed an annual rate of .20 of 1% of the value of the fund’s average daily net assets. The reduction in management fee, pursuant to the undertaking, amounted to $83,630 during the period ended January 31, 2004.
(b) Under the Investor Shares Service Plan (the “Plan”) adopted pursuant to Rule 12b-1 under the Act, the fund pays the Distributor for distributing the fund’s Investor Shares, for servicing shareholder accounts (“Servicing”) and for advertising and marketing relating to the fund’s Investor Shares.The Plan provides for payments to be made at an annual rate of .25 of 1% of the value of the average daily net assets of Investor Shares. The Distributor determines the amounts, if any, to be paid to Service Agents (a securities dealer, financial institution or other industry professional) under the Plan and the basis on which such payments are made. The fees payable under the Plan are payable without regard to actual expenses incurred. During the period ended January 31, 2004, Investor Shares were charged $37,312 pursuant to the Plan.
The fund compensates Dreyfus Transfer, Inc., a wholly-owned subsidiary of the Manager, under a transfer agency agreement for providing personnel and facilities to perform transfer agency services for the fund. During the period ended January 31, 2004, the fund was charged $2,659 pursuant to the transfer agency agreement.
The fund compensates Mellon under a custody agreement for providing custodial services for the fund. During the period ended January 31, 2004, the fund was charged $3,745 pursuant to the custody agreement.
(c) Each Board member also serves as a Board member of other funds within the Dreyfus complex. Annual retainer fees and attendance fees are allocated to each fund based on net assets.
20
(d) Pursuant to an exemptive order from the Securities and Exchange Commission, the fund may invest its available cash balances in affiliated money market mutual funds as shown in the fund’s Statement of Investments. Management fees are not charged to these money market mutual funds. During the period ended January 31, 2004, the fund derived $29,225 in income from these investments, which is included in dividend income in the fund’s Statement of Operations.
NOTE 4—Securities Transactions:
The aggregate amount of purchases and sales (including paydowns) of investment securities, excluding short-term securities and financial futures, during the period ended January 31, 2004, amounted to $129,003,789 and $267,386,538, respectively.
The fund may invest in financial futures contracts in order to gain exposure to or protect against changes in the market. The fund is exposed to market risk as a result of changes in the value of the underlying financial instruments. Investments in financial futures require the fund to “mark to market” on a daily basis, which reflects the change in market value of the contracts at the close of each day’s trading. Accordingly, variation margin payments are received or made to reflect daily unrealized gains and losses. When the contracts are closed, the fund recognizes a realized gain or loss.These investments require initial margin deposits with a broker, which consist of cash or cash equiv-alents.The amount of these deposits is determined by the exchange or Board of Trade on which the contract is traded and is subject to change. Contracts open at January 31, 2004, are set forth in the Statement of Financial Futures.
At January 31, 2004, accumulated net unrealized depreciation on investments was $4,943,692, consisting of $152,535 gross unrealized appreciation and $5,096,227 gross unrealized depreciation.
At January 31, 2004, the cost of investments for federal income tax purposes was substantially the same as the cost for financial reporting purposes (see the Statement of Investments).
The Fund 21
NOTES TO FINANCIAL STATEMENTS (Unaudited) (continued)
NOTE 5—Legal Matters:
Two class actions have been filed against Mellon Financial and Mellon Bank, N.A., and Dreyfus and Founders Asset Management LLC (the “Investment Advisers”), and the directors of all or substantially all of the Dreyfus Funds, alleging that the Investment Advisers improperly used assets of the Dreyfus Funds, in the form of directed brokerage commissions and 12b-1 fees, to pay brokers to promote sales of Dreyfus Funds, and that the use of fund assets to make these payments was not properly disclosed to investors.The complaints further allege that the directors breached their fiduciary duties to fund shareholders under the Investment Company Act of 1940 and at common law.The complaints seek unspecified compensatory and punitive damages, rescission of the funds’ contracts with the Investment Advisers, an accounting of all fees paid, and an award of attorneys’ fees and litigation expenses. Dreyfus and the funds believe the allegations to be totally without merit and will defend the actions vigorously.
Additional lawsuits arising out of these circumstances and presenting similar allegations and requests for relief may be filed against the defendants in the future. Neither Dreyfus nor the funds believe that any of the pending actions will have a material adverse affect on the funds or Dreyfus’ ability to perform its contract with the funds.
22
For More Information
| Dreyfus |
| Institutional Yield |
| Advantage Fund |
| 200 Park Avenue |
| New York, NY 10166 |
| |
| Manager |
| The Dreyfus Corporation |
| 200 Park Avenue |
|
| New York, NY 10166 |
| |
| Custodian |
| Mellon Bank, N.A. |
| One Mellon Bank Center |
| Pittsburgh, PA 15258 |
| |
| Transfer Agent & |
| Dividend Disbursing Agent |
| Dreyfus Transfer, Inc. |
| 200 Park Avenue |
| New York, NY 10166 |
| |
| Distributor |
| Dreyfus Service Corporation |
| 200 Park Avenue |
| New York, NY 10166 |
To obtain information:
| By telephone |
| Call 1-800-645-6561 |
| By mail Write to: |
| The Dreyfus Family of Funds |
| 144 Glenn Curtiss Boulevard |
| Uniondale, NY 11556-0144 |
| By E-mail Send your request |
| to info@dreyfus.com |
| On the Internet Information |
| can be viewed online or |
| downloaded from: |
| http://www.dreyfus.com |
A description of the policies and procedures that the fund uses to determine how to vote proxies relating to portfolio securities is available, without charge, by calling the telephone number listed above, or by visiting the SEC’s website at http://www.sec.gov
© 2004 Dreyfus Service Corporation 0049SA0104
| Dreyfus Premier |
| Yield Advantage Fund |
| |
| |
| SEMIANNUAL REPORT January 31, 2004 |

The views expressed in this report reflect those of the portfolio manager only through the end of the period covered and do not necessarily represent the views of Dreyfus or any other person in the Dreyfus organization. Any such views are subject to change at any time based upon market or other conditions and Dreyfus disclaims any responsibility to update such views.These views may not be relied on as investment advice and, because investment decisions for a Dreyfus fund are based on numerous factors, may not be relied on as an indication of trading intent on behalf of any Dreyfus fund.
Not FDIC-Insured • Not Bank-Guaranteed • May Lose Value
Contents
THE FUND
2
| Letter from the Chairman
|
3
| Discussion of Fund Performance
|
6
| Statement of Investments
|
13
| Statement of Financial Futures
|
14
| Statement of Assets and Liabilities
|
15
| Statement of Operations
|
16
| Statement of Changes in Net Assets
|
19
| Financial Highlights
|
24
| Notes to Financial Statements
|
FOR MORE INFORMATION
|
Back Cover
|
Dreyfus Premier Yield Advantage Fund
LETTER FROM THE CHAIRMAN
The Fund

Dear Shareholder:
This semiannual report for Dreyfus Premier Yield Advantage Fund covers the six-month period from August 1, 2003, through January 31, 2004. Inside, you’ll find valuable information about how the fund was managed during the reporting period, including a discussion with Gerald E. Thunelius, portfolio manager and Director of the Dreyfus Taxable Fixed Income Team that manages the fund.
The bond market produced mixed results during the reporting period as investors adjusted to a stronger economic environment.As the U.S. economy gathered momentum, the more interest-rate-sensitive areas of the bond market began to retreat, giving back some of the gains achieved during the previous economic downturn. On the other hand, the bond market’s more credit-sensitive areas generally benefited from the stronger economy, producing more robust gains for corporate bonds.
While recent economic developments suggest to us that interest rates are more likely to rise in 2004 than to fall further, we continue to believe that bonds deserve a prominent place in most investors’ portfolios. As always, we urge you to speak regularly with your financial advisor, who may be in the best position to suggest the Dreyfus funds designed to meet your current needs, future goals and tolerance for risk.
Thank you for your continued confidence and support.
Sincerely,

Stephen E. Canter
Chairman and Chief Executive Officer The Dreyfus Corporation
February 17, 2004
2

DISCUSSION OF FUND PERFORMANCE
Gerald E. Thunelius, Senior Portfolio Manager Dreyfus Taxable Fixed Income Team
How did Dreyfus Premier Yield Advantage Fund perform relative to its benchmark?
For the six-month period ended January 31, 2004, the fund achieved total returns of 0.06% for Class A shares, 0.18% for Class B shares, 0.05% for Class D shares, 0.55% for Class P shares and 0.43% for Class S shares.1 In comparison, the Salomon Smith Barney 1-Year Treasury Benchmark-on-the-Run Index, the fund’s benchmark, achieved a total return of 0.77% for the same period.2
In the absence of changes in monetary policy by the Federal Reserve Board (the “Fed”) during the reporting period, the fund continued to be influenced by low short-term interest rates. However, a strengthening U.S. economy led to concerns among investors that short-term rates might begin to climb, potentially eroding fixed-income performance. The fund produced lower returns than its benchmark, primarily because of relative weakness among the fund’s short-term corporate holdings, which are not represented in the benchmark.
What is the fund’s investment approach?
The fund seeks as high a level of current income as is consistent with the preservation of capital, with minimal changes in share price. To pursue its goal, the fund invests only in investment-grade fixed-income securities of U.S. and foreign issuers or the unrated equivalent as determined by Dreyfus. These securities may include U.S. government bonds and notes, corporate bonds, asset-backed securities and mortgage-related securities.
To help reduce share price fluctuations, the fund seeks to keep the average effective duration — a measure of sensitivity to changing interest rates — of its overall portfolio at one year or less.Although we expect the fund’s average effective duration and its average effective
The Fund 3
DISCUSSION OF FUND PERFORMANCE (continued)
maturity — the amount of time until the fund’s holdings mature or are redeemed, on average — to follow one another closely, we may invest in securities with effective final maturities of any length.
When choosing securities for the fund, we analyze many factors in various fixed-income market sectors.We then decide how to allocate the fund’s assets across these sectors and in which securities to invest.
What other factors influenced the fund’s performance?
The fund was primarily affected during the reporting period by fundamental changes in investors’ economic expectations and the impact of those changes on the various sectors of the short-term bond market in which the fund invests.
Just weeks before the reporting period began, the Fed reduced short-term interest rates for the thirteenth consecutive time since January 2001, setting its target for the federal funds rate at 1%, a 45-year low. However, between the Fed’s interest-rate reduction in late June and the start of the reporting period on August 1, 2003, more definite signs of stronger economic growth emerged, and one of the most severe one-month declines in the history of the bond market ensued. Indeed, it was later revealed that the U.S. economy had expanded at a robust 8.2% annualized rate during the third quarter of 2003, lending credence to investors’ concerns that the Fed might raise short-term interest rates in an attempt to forestall potential inflationary pressures. These developments hurt U.S. government securities more severely than investment-grade corporate securities.
However, fixed-income investors’ inflation-related worries eased considerably during the fourth quarter, when it became clearer that the labor markets remained weak and the economic recovery was likely to be more moderate than many had feared. These expectations were later confirmed by the U.S. Commerce Department, which estimated that gross domestic product grew at an annualized 4.0% rate during the last quarter of 2003. For its part, the Fed repeatedly emphasized its intention to keep interest rates low “for a considerable period.” As investors’ inflation concerns waned, U.S. government securities rallied,
4
outperforming their investment-grade corporate counterparts and causing the fund’s returns to lag its benchmark.
In this challenging market environment, we maintained the fund’s average duration in a range between 0.25 and 0.50 years, a strategy designed to limit the fund’s sensitivity to potentially rising interest rates. In addition, as investors’ inflation concerns ebbed, we positioned the fund to benefit from narrower yield differences along the short-term maturity spectrum, which helped boost the fund’s returns slightly.
What is the fund’s current strategy?
Although the economic recovery so far appears to be sustainable, we have seen few signs that the rate of inflation is poised to accelerate. A significant percentage of the U.S. economy’s manufacturing capacity reportedly remains unused, and the employment picture has improved only modestly. As a result, inflation concerns generally have remained muted, and short-term yields have hovered near historical lows.
As of the end of the reporting period, we have continued to emphasize very short-term instruments, including corporate securities. However, we are monitoring the U.S. economy for signs of renewed inflationary pressures, and we may revise our strategies if inflation becomes more of a factor and interest rates begin to rise.
February 17, 2004
1
| Total return includes reinvestment of dividends and any capital gains paid, and does not take into consideration the maximum initial sales charge in the case of Class A shares, or the applicable contingent deferred sales charge imposed on redemptions in the case of Class B and Class S shares. Had these charges been reflected, returns would have been lower. Past performance is no guarantee of future results. Share price, yield and investment return fluctuate such that upon redemption, fund shares may be worth more or less than their original cost. Return figures provided reflect the absorption of fund expenses by The Dreyfus Corporation pursuant to an agreement in effect through July 31, 2004, at which time it may be extended, terminated or modified. Had these expenses not been absorbed, the fund’s returns would have been lower.
|
2
| SOURCE: BLOOMBERG L.P. — Reflects reinvestment of dividends and, where applicable, capital gain distributions.The Salomon Smith Barney 1-Year Treasury Benchmark-on-the-Run Index is an unmanaged index generally representative of the average yield on 1-year U.S. Treasury bills.The index does not take into account charges, fees and other expenses.Total return is calculated on a month-end basis.
|
The Fund
5
| STATEMENT OF INVESTMENTS |
| January 31, 2004 (Unaudited) |
| | Principal | | | |
| Bonds and Notes—88.8% | Amount ($) | Value ($) | |
|
|
| |
| Aircraft & Aerospace—.5% | | | | |
| United Technologies, | | | | |
| Notes, 6.625%, 2004 | 2,000,000 | | 2,079,820 | |
| Asset-Backed Ctfs./Auto Loans—.1% | | | | |
| Navistar Financial Owner Trust, | | | | |
| Ser. 2001-A, Cl. B, 5.59%, 2008 | 312,423 | | 320,127 | |
| Asset-Backed Ctfs./Business—1.6% | | | | |
| ACAS Business Loan Trust: | | | | |
| Ser. 2002-1A, Cl. B, 2.6%, 2012 | 1,917,371 | a,b | 1,927,150 | |
| Ser. 2002-2A, Cl. B, 2.7%, 2015 | 1,500,000 | a,b | 1,500,000 | |
| CapitalSource Commercial Loan Trust, | | | | |
| Ser. 2003-1A, Cl. B, 2.25%, 2012 | 2,750,000 | a,b | 2,757,040 | |
| | | | 6,184,190 | |
| Asset-Backed Ctfs./Credit Cards—1.8% | | | | |
| Fingerhut Master Trust, | | | | |
| Ser. 2003-1, Cl. A, 2.72%, 2010 | 5,085,575 | a | 5,085,774 | |
| MBNA Master Credit Card Trust, | | | | |
| Ser. 1999-H, Cl. C, 7.45%, 2006 | 1,900,000 | a | 1,918,406 | |
| | | | 7,004,180 | |
| Asset-Backed Ctfs./Health Care—.3% | | | | |
| NPF XII, | | | | |
| Ser. 1999-1, Cl. A, 6.36%, 2005 | 4,905,000 | a,c,d | 1,055,556 | |
| Asset-Backed Ctfs./Home Equity Loans—4.3% | | | | |
| AAMES Mortgage Trust, | | | | |
| Ser. 1998-C, Cl. A2A, 5.912%, 2028 | 519,458 | | 530,614 | |
| ABFS Mortgage Loan Trust, | | | | |
| Ser. 1997-2, Cl. A5, 7.125%, 2029 | 897,052 | | 932,180 | |
| Conseco Finance Securitizations: | | | | |
| Ser. 2000-D, Cl. A3, 7.89%, 2018 | 49 | | 50 | |
| Ser. 2001-D, Cl. A4, 5.53%, 2032 | 11,000,000 | | 11,165,890 | |
| Long Beach Mortgage Loan Trust, | | | | |
| Ser. 2003-3, Cl. A, 1.42%, 2033 | 4,161,135 | b | 4,165,900 | |
| | | | 16,794,634 | |
| Automotive—1.9% | | | | |
| Delphi Automotive Systems, | | | | |
| Notes, 6.125%, 2004 | 600,000 | | 606,017 | |
| Ford Motor Credit, | | | | |
| Notes, 7.5%, 2005 | 2,925,000 | | 3,088,756 | |
| General Motors, | | | | |
| Notes, 6.25%, 2005 | 3,500,000 | | 3,640,483 | |
| | | | 7,335,256 | |
6
| | Principal | | | |
| Bonds and Notes (continued) | Amount ($) | Value ($) | |
|
|
| |
| Banking—5.0% | | | | |
| Abbey National, | | | | |
| Medium-Term Notes, 6.69%, 2005 | 4,000,000 | | 4,320,964 | |
| Deutsche Bank, | | | | |
| Notes, 2.13%, 2005 | 12,500,000 | b | 12,500,000 | |
| Washington Mutual, | | | | |
| Sr. Notes, 7.25%, 2005 | 2,500,000 | | 2,699,820 | |
| | | | 19,520,784 | |
| Cable/Media—1.7% | | | | |
| Comcast Cable Communications, | | | | |
| Notes, 8.125%, 2004 | 1,250,000 | | 1,268,649 | |
| TCI Communications, | | | | |
| Sr. Notes, 8%, 2005 | 3,145,000 | | 3,412,790 | |
| Turner Broadcasting, | | | | |
| Sr. Notes, 7.4%, 2004 | 1,850,000 | | 1,850,000 | |
| | | | 6,531,439 | |
| Commercial Mortgage Pass-Through Ctfs.—15.3% | | | | |
| Banc of America Large Loan: | | | | |
| Ser. 2002-FL1A, Cl. G, 2.62%, 2014 | 4,000,000 | a,b | 4,022,237 | |
| Ser. 2002-FL2A, Cl. H, 2.47%, 2014 | 2,204,005 | a,b | 2,187,475 | |
| Ser. 2002-FL2A, Cl. K1, 3.62%, 2014 | 1,037,575 | a,b | 1,013,257 | |
| Ser. 2002-FL2A, Cl. L1, 4.12%, 2014 | 5,839,535 | a,b | 5,644,275 | |
| Ser. 2003-BBA2, Cl. L, 2.311%, 2015 | 5,000,000 | a,b | 4,635,938 | |
| Banc of America Structured Notes: | | | | |
| Ser. 2002-1A, Cl. A, 4.12%, 2014 | 1,500,000 | a,b | 1,413,281 | |
| Ser. 2002-1A, Cl. B, 5.62%, 2014 | 2,200,000 | a,b | 2,000,281 | |
| Bear Stearns Commercial Mortgage Security, | | | | |
| Ser. 2003-BA1A, Cl. G, 2.7%, 2015 | 6,966,000 | a,b | 6,955,116 | |
| COMM: | | | | |
| Ser. 2000-FL2A, Cl. E, 2.09%, 2011 | 4,479,000 | a,b | 4,438,783 | |
| Ser. 2001-FL5A, Cl. G, 2.17%, 2013 | 3,700,000 | a,b | 3,566,835 | |
| Ser. 2002-FL7, Cl. G, 2.95%, 2014 | 9,000,000 | a,b | 8,969,275 | |
| CS First Boston Mortgage Securities, | | | | |
| Ser. 2001-CK3, Cl. A1, 5.26%, 2034 | 223,858 | | 231,008 | |
| Morgan Stanley Dean Witter Capital I, | | | | |
| Ser. 2001-XLF, Cl. F, 3.04%, 2013 | 4,247,158 | a,b | 4,243,735 | |
| Wachovia Bank Commercial Mortgage Trust: | | | | |
| Ser. 2002-WHL, Cl. L, 4.1%, 2015 | 6,000,000 | a,b | 5,717,462 | |
| Ser. 2003-WHL2, Cl. J, 3.6%, 2013 | 5,000,000 | a,b | 5,015,507 | |
| | | | 60,054,465 | |
The Fund 7
STATEMENT OF INVESTMENTS (Unaudited) (continued)
| | Principal | | | |
| Bonds and Notes (continued) | Amount ($) | Value ($) | |
|
|
| |
| Consumer—.6% | | | | |
| Gillette, | | | | |
| Notes, 3.75%, 2004 | 2,500,000 | a | 2,546,580 | |
| Financial Services—2.8% | | | | |
| Bombardier Capital, | | | | |
| Notes, 7.5%, 2004 | 2,550,000 | a | 2,634,619 | |
| Countrywide Home Loan, | | | | |
| Medium-Term Notes, Ser. F, 6.7%, 2005 | 4,000,000 | | 4,212,704 | |
| General Electric Capital, | | | | |
| Medium-Term Notes, Ser. A, 2.85%, 2006 | 2,500,000 | | 2,536,050 | |
| International Lease Finance, | | | | |
| Notes, 8.375%, 2004 | 850,000 | | 900,627 | |
| John Deere Capital, | | | | |
| Medium-Term Notes, Ser. D, 1.77%, 2004 | 714,000 | b | 716,350 | |
| | | | 11,000,350 | |
| Foreign/Governmental—6.0% | | | | |
| Export Development of Canada, | | | | |
| Notes, 2.375%, 2006 | 7,700,000 | | 7,748,287 | |
| Kingdom of Spain, | | | | |
| Notes, 7%, 2005 | 325,000 | | 348,701 | |
| Kingdom of Sweden, | | | | |
| Medium-Term Notes, 4.375%, 2005 | 3,883,000 | | 4,056,958 | |
| New Zealand Government, | | | | |
| Medium-Term Notes, Ser. 2082-1, 6.25%, 2004 | 2,800,000 | | 2,891,560 | |
| Province of Quebec, | | | | |
| Debs., Ser. NS, 8.625%, 2005 | 2,500,000 | | 2,663,717 | |
| Republic of Finland, | | | | |
| Debs., 7.875%, 2004 | 2,865,000 | | 2,958,614 | |
| United Mexican States, | | | | |
| Notes, 1.84%, 2009 | 3,000,000 | b | 3,022,500 | |
| | | | 23,690,337 | |
| Health Care—2.0% | | | | |
| Boston Scientific, | | | | |
| Notes, 6.625%, 2005 | 2,730,000 | | 2,875,091 | |
| Cardinal Health, | | | | |
| Notes, 6.5%, 2004 | 2,500,000 | | 2,503,912 | |
| United Healthcare, | | | | |
| Sr. Notes, 1.77%, 2004 | 2,655,000 | a,b | 2,657,671 | |
| | | | 8,036,674 | |
8
| | Principal | | | |
| Bonds and Notes (continued) | Amount ($) | Value ($) | |
|
|
| |
| Insurance—3.9% | | | | |
| ACE INA, | | | | |
| Sr. Notes, 8.2%, 2004 | 2,040,000 | | 2,110,604 | |
| ASIF Global Financing, | | | | |
| Notes, 1.42%, 2006 | 8,183,000 | a,b | 8,187,091 | |
| Marsh & McLennan, | | | | |
| Sr. Notes, 6.625%, 2004 | 1,450,000 | | 1,477,902 | |
| MetLife, | | | | |
| Debs., 3.911%, 2005 | 2,000,000 | | 2,054,074 | |
| Nationwide Mutual Insurance, | | | | |
| Notes, 6.5%, 2004 | 1,455,000 | a | 1,457,433 | |
| | | | 15,287,104 | |
| Oil & Gas—2.3% | | | | |
| Baker Hughes, | | | | |
| Notes, 8%, 2004 | 1,500,000 | | 1,527,045 | |
| Chevron, | | | | |
| Notes, 6.625%, 2004 | 3,000,000 | | 3,105,174 | |
| Occidental Petroleum, | | | | |
| Sr. Notes, 6.5%, 2005 | 4,000,000 | | 4,216,312 | |
| | | | 8,848,531 | |
| Real Estate Investment Trusts—1.4% | | | | |
| New Plan Excel Realty Trust, | | | | |
| Sr. Notes, 7.75%, 2005 | 1,120,000 | | 1,186,035 | |
| Summit Properties Partnerships, | | | | |
| Notes, 6.95%, 2004 | 4,250,000 | | 4,342,965 | |
| | | | 5,529,000 | |
| Residential Mortgage Pass-Through Ctfs.—3.5% | | | | |
| Residential Asset Mortgage Products, | | | | |
| Sec. 2002-SL1, Cl. AI1, 7%, 2032 | 415,190 | | 419,887 | |
| Residential Funding Mortgage Securities I: | | | | |
| Sec. 2001-S4, Cl. M1, 7.25%, 2031 | 1,925,083 | | 1,989,959 | |
| Sec. 2001-S4, Cl. M3, 7.25%, 2031 | 899,687 | | 899,443 | |
| Sec. 2001-S13, Cl. A1, 6.5%, 2016 | 391,563 | | 398,181 | |
| Structured Asset Securities: | | | | |
| Ser. 2000-3, Cl. 2A6, 8%, 2030 | 2,139,305 | | 2,139,239 | |
| Ser. 2001-5, Cl. 1A3, 6%, 2031 | 1,810,016 | | 1,809,062 | |
| Washington Mutual, | | | | |
| Ser. 2003-AR12, Cl. A3, 3.356%, 2034 | 4,400,000 | | 4,375,131 | |
The Fund 9
STATEMENT OF INVESTMENTS (Unaudited) (continued)
| | Principal | | | |
| Bonds and Notes (continued) | Amount ($) | Value ($) | |
|
|
| |
| Residential Mortgage Pass-Through Ctfs. (continued) | | | | |
| Wells Fargo Mortgage Backed Securities Trust, | | | | |
| Ser. 2001-22, Cl. B2, 6%, 2031 | 1,756,344 | | 1,773,662 | |
| | | | 13,804,564 | |
| Retail—1.1% | | | | |
| CVS, | | | | |
| Notes, 5.5%, 2004 | 3,000,000 | | 3,003,795 | |
| May Department Stores, | | | | |
| Notes, 7.15%, 2004 | 1,500,000 | | 1,544,852 | |
| | | | 4,548,647 | |
| Structured Index—1.4% | | | | |
| HSBC TIGERS: | | | | |
| Medium-Term Notes, | | | | |
| Ser. 2003-2, 4.02%, 2008 | 1,600,000 | a,b,e | 1,592,800 | |
| Medium-Term Notes, | | | | |
| Ser. 2003-3, Cl. D-1, 4.02%, 2008 | 593,000 | a,b,e | 592,838 | |
| Medium-Term Notes, | | | | |
| Ser. 2003-4, 4.42%, 2008 | 3,400,000 | a,b,e | 3,406,800 | |
| | | | 5,592,438 | |
| Technology—2.8% | | | | |
| Meridian Funding, | | | | |
| Notes, 1.59%, 2009 | 11,000,000 | a,b | 10,998,416 | |
| Telecommunications—1.8% | | | | |
| British Telecommunications, | | | | |
| Notes, 7.875%, 2005 | 4,000,000 | | 4,402,480 | |
| GTE Hawaiian Telephone, | | | | |
| First Mortgage Bonds, Ser. BB, 6.75%, 2005 | 2,750,000 | | 2,894,249 | |
| | | | 7,296,729 | |
| Textiles & Apparel—1.1% | | | | |
| Jones Apparel, | | | | |
| Sr. Notes, 7.5%, 2004 | 4,300,000 | | 4,381,124 | |
| U.S. Government Agencies—16.2% | | | | |
| Federal Home Loan Bank, | | | | |
| Bonds, 1.625%, 6/15/2005 | 17,720,000 | | 17,739,740 | |
| Federal National Mortgage Association, | | | | |
| Notes, 7%, 7/15/2005 | 25,000,000 | | 26,940,275 | |
| SLM, | | | | |
| Conv. Bonds, 1.07%, 7/25/2035 | 19,000,000 | a,b | 18,926,850 | |
| | | | 63,606,865 | |
10
| | | Principal | | | |
| Bonds and Notes (continued) | Amount ($) | Value ($) | |
|
|
| |
| U.S. Government Agencies/Mortgage-Backed—7.8% | | | | |
| Federal Home Loan Mortgage Corp., | | | | |
| REMIC Trust, Gtd. Multiclass Mortgage Participation Ctfs.: | | | | |
| Ser. 2143, Cl. CU, 5.75%, 12/15/2024 | 551,531 | | 551,987 | |
| Ser. 2551, Cl. TA, 4.5%, 2/15/2018 | 6,279,991 | | 6,337,947 | |
| Ser. 2603, Cl. AC, 2%, 12/15/2008 | 571,506 | | 571,414 | |
| Federal National Mortgage Association: | | | | |
| REMIC Trust, Gtd. Pass-Through Ctfs.: | | | | |
| Ser. 2002-55, Cl. GD, 5.5%, 11/25/2015 | 3,596,781 | | 3,669,586 | |
| Ser. 2003-24, Cl. PG, 3.5%, 11/25/2009 | 8,766,963 | | 8,876,679 | |
| Ser. 2003-49, Cl. JE, 3%, 4/25/2033 | 4,912,413 | | 4,861,755 | |
| Grantor Trust, Ser. 1999-T1, Cl. A6, 6%, 1/25/2039 | 432,438 | | 432,709 | |
| Government National Mortgage Association I, | | | | |
| Ser. 2002-52, Cl. AG, 6%, 9/20/2029 | 5,125,644 | | 5,197,643 | |
| | | | | 30,499,720 | |
| Utilities/Gas & Electric—1.6% | | | | |
| Duke Energy, | | | | |
| Sr. Notes, 1.63%, 2005 | 2,000,000 | b | 2,004,922 | |
| KeySpan, | | | | | |
| Sr. Notes, 7.25%, 2005 | 4,081,000 | | 4,443,613 | |
| | | | | 6,448,535 | |
| Total Bonds and Notes | | | | |
| (cost $ | 352,609,967) | | | 348,996,065 | |
|
|
|
|
| |
| | | | | | |
| Other Investments—.6% | Shares | | Value ($) | |
|
|
|
| |
| Registered Investment Companies: | | | | |
| Dreyfus Institutional Cash Advantage Fund | 808,667 | f | 808,667 | |
| Dreyfus Institutional Cash Advantage Plus Fund | 808,667 | f | 808,667 | |
| Dreyfus Institutional Preferred Plus Money Market Fund | 808,666 | f | 808,666 | |
| Total Other Investments | | | | |
| (cost $ | 2,426,000) | | | 2,426,000 | |
|
|
|
|
| |
| | | Principal | | | |
| Short-Term Investments—8.8% | Amount ($) | Value ($) | |
|
|
| |
| Agency Discount Notes—8.7% | | | | |
| Federal National Mortgage Association: | | | | |
| 1.08%, 5/5/2004 | 16,300,000 | | 16,254,034 | |
| 1.125%, 6/2/2004 | 18,000,000 | | 17,931,375 | |
| | | | | 34,185,409 | |
The Fund 11
STATEMENT OF INVESTMENTS (Unaudited) (continued)
| | | | Principal | | | |
| Short-Term Investments (continued) | Amount ($) | Value ($) | |
|
|
| |
| U.S. Treasury Bills—.1% | | | | | |
| .91%, 5/20/2004 | | 320,000 | g | 319,136 | |
| .94%, 6/3/2004 | | 200,000 | g | 199,386 | |
| | | | | | 518,522 | |
| Total Short-Term Investments | | | | |
| (cost $ | 34,703,882) | | | | 34,703,931 | |
|
|
|
|
|
| |
| | | | | | | |
| Total Investments (cost $ | 389,739,849) | 98.2% | | 386,125,996 | |
| Cash and Receivables (Net) | 1.8% | | 6,912,514 | |
| Net Assets | | 100.0% | | 393,038,510 | |
a Securities exempt from registration under Rule 144A of the Securities Act of 1933.These securities may be resold in transactions exempt from registration, normally to qualified institutional buyers.At January 31, 2004, these securities amounted to $127,068,481 or 32.3% of net assets.
b
| Variable rate security—interest rate subject to periodic change.
|
c
| Non-income producing—security in default.
|
d
| The value of this security has been determined in good faith under the direction of the Board of Directors.
|
e
| Securities linked to a portfolio of debt securities.
|
f
| Investments in affiliated money market mutual funds—See Note 3(e).
|
g
| Partially held by a broker as collateral for open financial futures positions.
|
See notes to financial statements.
12
| STATEMENT OF FINANCIAL FUTURES |
| January 31, 2004 (Unaudited) |
| | | | | | Unrealized | |
| | | | Market Value | | Appreciation | |
| | | | Covered by | | (Depreciation) | |
| | Contracts | | Contracts ($) | Expiration | at 1/31/2004 ($) | |
|
| |
|
|
| |
| Financial Futures Long | | | | | | |
| U.S. Treasury 5 Year Notes | 588 | | 66,048,937 | March 2004 | 22,261 | |
| U.S. Treasury 10 Year Notes | 146 | | 16,561,875 | March 2004 | (189,425) | |
| Financial Futures Short | | | | | | |
| 90 Day Euro | 693 | | 170,391,375 | September 2004 | (182,717) | |
| U.S. Treasury 2 Year Notes | 392 | | 84,084,000 | March 2004 | (146,125) | |
| | | | | | (496,006) | |
The Fund 13
| STATEMENT OF ASSETS AND LIABILITIES |
| January 31, 2004 (Unaudited) |
| | | | | | | Cost | Value | |
|
|
| |
|
|
|
| |
| Assets ($): | | | | | | | | |
| Investments in securities—See Statement of Investments | 389,739,849 | 386,125,996 | |
| Cash | | | | | | | 6,537,740 | |
| Interest receivable | | | | | | 2,610,100 | |
| Receivable for shares of Common Stock subscribed | | | 762,804 | |
| Receivable for futures variation margin—Note 4 | | | 28,878 | |
| Prepaid expenses | | | | | | 64,502 | |
| | | | | | | | 396,130,020 | |
|
|
| |
|
|
|
| |
| Liabilities ($): | | | | | | | |
| Due to The Dreyfus Corporation and affiliates | | | 271,891 | |
| Payable for shares of Common Stock redeemed | | | 2,745,929 | |
| Accrued expenses | | | | | | 73,690 | |
| | | | | | | | 3,091,510 | |
|
|
| |
|
|
|
| |
| Net Assets ( | $) | | | | | | 393,038,510 | |
|
|
| |
|
|
|
| |
| Composition of Net Assets ($): | | | | | | |
| Paid-in capital | | | | | | | 403,350,332 | |
| Accumulated distributions in excess of investment income—net | | | (864,105) | |
| Accumulated net realized gain (loss) on investments | | | (5,337,858) | |
| Accumulated net unrealized appreciation (depreciation) | | | | |
| on investments [including ($496,006) net unrealized | | | | |
| (depreciation) on financial futures] | | | | | (4,109,859) | |
| |
|
|
|
| |
| Net Assets ( | $) | | | | | | 393,038,510 | |
|
|
| |
|
|
|
| |
| | | | | | | | | |
| | | | | | | | | |
| Net Asset Value Per Share | | | | | | |
| | | Class A | | Class B | Class D | Class P | Class S | |
|
|
| |
|
|
|
| |
| Net Assets ($) | 7,733,419 | | 5,913,915 | 277,489,383 | 100,694,044 | 1,207,749 | |
| Shares Outstanding | 3,901,121 | | 3,001,362 | 141,261,024 | 51,105,647 | 612,969 | |
|
| |
|
|
|
| |
| Net Asset Value | | | | | | | |
| Per Share ( | $) | 1.98 | | 1.97 | 1.96 | 1.97 | 1.97 | |
| | | | | | | | | |
| See notes to financial statements. | | | | | | | |
14
| STATEMENT OF OPERATIONS |
| Six Months Ended January 31, 2004 (Unaudited) |
| Investment Income ($): | | |
| Interest | | 5,356,211 | |
| Cash dividends | | 146,916 | |
| Total Income | | 5,503,127 | |
| Expenses: | | | |
| Management fee—Note 3(a) | | 1,101,480 | |
| Shareholder servicing costs—Note 3(c) | 665,430 | |
| Registration fees | | 54,393 | |
| Professional fees | | 28,816 | |
| Distribution fees—Note 3(b) | | 24,047 | |
| Prospectus and shareholders’ reports | 16,116 | |
| Custodian fees—Note 3(c) | | 16,023 | |
| Directors’ fees and expenses—Note 3(d) | 6,989 | |
| Miscellaneous | | 9,819 | |
| Total Expenses | | 1,923,113 | |
| Less—reduction in management fee due to | | |
| undertaking—Note 3(a) | | (136,649) | |
| Net Expenses | | 1,786,464 | |
| Investment Income—Net | | 3,716,663 | |
|
|
| |
| Realized and Unrealized Gain (Loss) on Investments—Note 4 ($): | | |
| Net realized gain (loss) on investments | 320,332 | |
| Net realized gain (loss) on financial futures | (1,226,844) | |
| Net Realized Gain (Loss) | | (906,512) | |
| Net unrealized appreciation (depreciation) on investments [including | | |
| ($ | 1,074,030) net unrealized (depreciation) on financial futures] | (1,267,241) | |
| Net Realized and Unrealized Gain (Loss) on Investments | (2,173,753) | |
| Net Increase in Net Assets Resulting from Operations | 1,542,910 | |
See notes to financial statements.
The Fund 15
STATEMENT OF CHANGES IN NET ASSETS
| | Six Months Ended | | | |
| | January 31, 2004 | | Year Ended | |
| | (Unaudited) | | July 31, 2003a | |
|
| |
| |
| Operations ($): | | | | |
| Investment income—net | 3,716,663 | | 9,653,253 | |
| Net realized gain (loss) on investments | (906,512) | | 1,528,218 | |
| Net unrealized appreciation | | | | |
| (depreciation) on investments | (1,267,241) | | (5,457,634) | |
| Net Increase (Decrease) in Net Assets | | | | |
| Resulting from Operations | 1,542,910 | | 5,723,837 | |
|
| |
| |
| Dividends to Shareholders from ($): | | | | |
| Investment income—net: | | | | |
| Class A | (120,235) | | (152,563) | |
| Class B | (40,376) | | (39,740) | |
| Class D | (3,245,711) | | (10,872,139) | |
| Class P | (1,210,290) | | (1,478,188) | |
| Class S | (13,388) | | (20,036) | |
| Total Dividends | (4,630,000) | | (12,562,666) | |
|
| |
| |
| Capital Stock Transactions ($): | | | | |
| Net proceeds from shares sold: | | | | |
| Class A | 2,117,979 | | 21,802,281 | |
| Class B | 2,269,596 | | 9,466,309 | |
| Class D | 93,544,342 | | 352,218,739 | |
| Class P | 73,628,325 | | 215,788,350 | |
| Class S | 142,150 | | 4,335,681 | |
| Dividends reinvested: | | | | |
| Class A | 91,928 | | 114,190 | |
| Class B | 36,867 | | 33,986 | |
| Class D | 2,915,721 | | 9,693,475 | |
| Class P | 997,805 | | 1,250,597 | |
| Class S | 12,056 | | 19,554 | |
16
| | Six Months Ended | | | |
| | January 31, 2004 | | Year Ended | |
| | (Unaudited) | | July 31, 2003a | |
|
| |
| |
| Capital Stock Transactions ($) (continued): | | | | |
| Cost of shares redeemed: | | | | |
| Class A | (6,199,874) | | (10,034,432) | |
| Class B | (1,639,754) | | (4,189,483) | |
| Class D | (130,463,853) | | (384,741,553) | |
| Class P | (98,419,081) | | (91,052,922) | |
| Class S | (456,685) | | (2,816,941) | |
| Increase (Decrease) in Net Assets from | | | | |
| Capital Stock Transactions | (61,422,478) | | 121,887,831 | |
| Total Increase (Decrease) in Net Assets | (64,509,568) | | 115,049,002 | |
|
| |
| |
| Net Assets ($): | | | | |
| Beginning of Period | 457,548,078 | | 342,499,076 | |
| End of Period | 393,038,510 | | 457,548,078 | |
| Undistributed (distributions in | | | | |
| excess of) investment income—net | (864,105) | | 49,232 | |
The Fund 17
STATEMENT OF CHANGES IN NET ASSETS (continued)
| | Six Months Ended | | | |
| | January 31, 2004 | | Year Ended | |
| | (Unaudited) | | July 31, 2003a | |
|
| |
| |
| Capital Share Transactions: | | | | |
| Class Ab | | | | |
| Shares sold | 1,060,709 | | 10,867,599 | |
| Shares issued for dividends reinvested | 46,173 | | 57,092 | |
| Shares redeemed | (3,112,799) | | (5,017,653) | |
| Net Increase (Decrease) in Shares Outstanding | (2,005,917) | | 5,907,038 | |
|
| |
| |
| Class Bb | | | | |
| Shares sold | 1,146,591 | | 4,753,561 | |
| Shares issued for dividends reinvested | 18,635 | | 17,104 | |
| Shares redeemed | (829,223) | | (2,105,306) | |
| Net Increase (Decrease) in Shares Outstanding | 336,003 | | 2,665,359 | |
|
| |
| |
| Class D | | | | |
| Shares sold | 47,362,909 | | 176,389,077 | |
| Shares issued for dividends reinvested | 1,478,620 | | 4,867,872 | |
| Shares redeemed | (66,117,956) | | (193,378,919) | |
| Net Increase (Decrease) in Shares Outstanding | (17,276,427) | | (12,121,970) | |
|
| |
| |
| Class P | | | | |
| Shares sold | 37,242,598 | | 108,396,967 | |
| Shares issued for dividends reinvested | 504,731 | | 630,204 | |
| Shares redeemed | (49,801,126) | | (45,867,727) | |
| Net Increase (Decrease) in Shares Outstanding | (12,053,797) | | 63,159,444 | |
|
| |
| |
| Class S | | | | |
| Shares sold | 71,747 | | 2,178,964 | |
| Shares issued for dividends reinvested | 6,097 | | 9,859 | |
| Shares redeemed | (231,157) | | (1,422,541) | |
| Net Increase (Decrease) in Shares Outstanding | (153,313) | | 766,282 | |
a The fund commenced offering five classes of shares on November 1, 2002.The existing shares were redesignated Class D shares and the fund added Class A, Class B, Class P and Class S shares.
- During the period ended January 31, 2004, 34,833 Class B shares representing $69,067 were automatically converted to 34,646 Class A shares and during the period ended July 31, 2003, there were no shares converted from Class B to Class A.
See notes to financial statements.
18
FINANCIAL HIGHLIGHTS
The following tables describe the performance for each share class for the fiscal periods indicated. All information (except portfolio turnover rate) reflects financial results for a single fund share.Total return shows how much your investment in the fund would have increased (or decreased) during each period, assuming you had reinvested all dividends and distributions.These figures have been derived from the fund’s financial statements.
| | | Six Months Ended | | | |
| | | January 31, 2004 | | Year Ended | |
| Class A Shares | | (Unaudited) | | July 31, 2003a | |
|
|
| |
| |
| Per Share Data ($): | | | | |
| Net asset value, beginning of period | 2.00 | | 2.00 | |
| Investment Operations: | | | | |
| Investment income—netb | .02 | | .03 | |
| Net realized and unrealized | | | | |
| gain (loss) on investments | (.02) | | .01 | |
| Total from Investment Operations | .00 | | .04 | |
| Distributions: | | | | | |
| Dividends from investment income—net | (.02) | | (.04) | |
| Net asset value, end of period | 1.98 | | 2.00 | |
|
| |
| |
| Total Return (%) | c,d | .06 | | 1.88 | |
|
|
| |
| |
| Ratios/Supplemental Data (%): | | | | |
| Ratio of expenses to average net assetse | .80 | | .80 | |
| Ratio of net investment income to average net assetse | 1.75 | | 1.48 | |
| Decrease reflected in above expense ratios | | | | |
| due to undertaking by The Dreyfus Corporatione | .36 | | .21 | |
| Portfolio Turnover Rated | 138.35 | | 371.43 | |
|
| |
| |
| Net Assets, end of period ($ x 1,000) | 7,733 | | 11,802 | |
a From November 1, 2002 (commencement of initial offering) to July 31, 2003.
b
| Based on average shares outstanding at each month end.
|
c
| Exclusive of sales charge.
|
d
| Not annualized.
|
e
| Annualized.
|
See notes to financial statements.
The Fund 19
FINANCIAL HIGHLIGHTS (continued)
| | | Six Months Ended | | | |
| | | January 31, 2004 | | Year Ended | |
| Class B Shares | | (Unaudited) | | July 31, 2003a | |
|
|
| |
| |
| Per Share Data ($): | | | | |
| Net asset value, beginning of period | 1.98 | | 2.00 | |
| Investment Operations: | | | | |
| Investment income—netb | .01 | | .01 | |
| Net realized and unrealized | | | | |
| gain (loss) on investments | (.01) | | .00c | |
| Total from Investment Operations | .00 | | .01 | |
| Distributions: | | | | | |
| Dividends from investment income—net | (.01) | | (.03) | |
| Net asset value, end of period | 1.97 | | 1.98 | |
|
| |
| |
| Total Return (%) | d,e | .18 | | .29 | |
|
|
| |
| |
| Ratios/Supplemental Data (%): | | | | |
| Ratio of expenses to average net assetsf | 1.55 | | 1.55 | |
| Ratio of net investment income to average net assetsf | .93 | | .74 | |
| Decrease reflected in above expense ratios | | | | |
| due to undertaking by The Dreyfus Corporationf | .10 | | .19 | |
| Portfolio Turnover Ratee | 138.35 | | 371.43 | |
|
| |
| |
| Net Assets, end of period ($ x 1,000) | 5,914 | | 5,290 | |
a From November 1, 2002 (commencement of initial offering) to July 31, 2003.
b
| Based on average shares outstanding at each month end.
|
c
| Amount represents less than $.01 per share.
|
d
| Exclusive of sales charge.
|
e
| Not annualized.
|
f
| Annualized.
|
See notes to financial statements.
20
| | Six Months Ended | | | | | |
| | January 31, 2004 | | Year Ended July 31, | |
| | | |
| |
| Class D Shares | (Unaudited) | | 2003a | | 2002b | |
|
| |
| |
| |
| Per Share Data ($): | | | | | | |
| Net asset value, beginning of period | 1.98 | | 2.01 | | 2.00 | |
| Investment Operations: | | | | | | |
| Investment income—netc | .02 | | .04 | | .05 | |
| Net realized and unrealized | | | | | | |
| gain (loss) on investments | (.02) | | (.02) | | .01 | |
| Total from Investment Operations | .00 | | .02 | | .06 | |
| Distributions: | | | | | | |
| Dividends from investment income—net | (.02) | | (.05) | | (.05) | |
| Net asset value, end of period | 1.96 | | 1.98 | | 2.01 | |
|
| |
| |
| |
| Total Return (%) | .05d | | 1.16 | | 3.01d | |
|
| |
| |
| |
| Ratios/Supplemental Data (%): | | | | | | |
| Ratio of expenses to average net assets | .80e | | .80 | | .75e | |
| Ratio of net investment income | | | | | | |
| to average net assets | 1.70e | | 2.10 | | 3.37e | |
| Decrease reflected in above expense ratios | | | | | | |
| due to undertakings by The Dreyfus Corporation | .06e | | .05 | | .17e | |
| Portfolio Turnover Rate | 138.35d | | 371.43 | | 96.09d | |
|
| |
| |
| |
| Net Assets, end of period ($ x 1,000) | 277,489 | | 313,644 | | 342,499 | |
a The fund commenced offering five classes of shares on November 1, 2002.The existing shares were redesignated Class D shares.
b
| From November 15, 2001 (commencement of operations) to July 31, 2002.
|
c
| Based on average shares outstanding at each month end.
|
d
| Not annualized.
|
e
| Annualized.
|
See notes to financial statements.
The Fund 21
FINANCIAL HIGHLIGHTS (continued)
| | Six Months Ended | | | |
| | January 31, 2004 | | Year Ended | |
| Class P Shares | (Unaudited) | | July 31, 2003a | |
|
| |
| |
| Per Share Data ($): | | | | |
| Net asset value, beginning of period | 1.98 | | 2.00 | |
| Investment Operations: | | | | |
| Investment income—netb | .02 | | .03 | |
| Net realized and unrealized | | | | |
| gain (loss) on investments | (.01) | | (.01) | |
| Total from Investment Operations | .01 | | .02 | |
| Distributions: | | | | |
| Dividends from investment income—net | (.02) | | (.04) | |
| Net asset value, end of period | 1.97 | | 1.98 | |
|
| |
| |
| Total Return (%)c | .55 | | .85 | |
|
| |
| |
| Ratios/Supplemental Data (%): | | | | |
| Ratio of expenses to average net assetsd | .80 | | .80 | |
| Ratio of net investment income to average net assetsd | 1.69 | | 1.43 | |
| Decrease reflected in above expense ratios | | | | |
| due to undertaking by The Dreyfus Corporationd | .03 | | .06 | |
| Portfolio Turnover Ratec | 138.35 | | 371.43 | |
|
| |
| |
| Net Assets, end of period ($ x 1,000) | 100,694 | | 125,292 | |
a From November 1, 2002 (commencement of initial offering) to July 31, 2003.
b
| Based on average shares outstanding at each month end.
|
c
| Not annualized.
|
d
| Annualized.
|
See notes to financial statements.
22
| | | Six Months Ended | | | |
| | | January 31, 2004 | | Year Ended | |
| Class S Shares | | (Unaudited) | | July 31, 2003a | |
|
|
| |
| |
| Per Share Data ($): | | | | |
| Net asset value, beginning of period | 1.98 | | 2.00 | |
| Investment Operations: | | | | |
| Investment income—netb | .01 | | .02 | |
| Net realized and unrealized | | | | |
| gain (loss) on investments | .00c | | (.01) | |
| Total from Investment Operations | .01 | | .01 | |
| Distributions: | | | | | |
| Dividends from investment income—net | (.02) | | (.03) | |
| Net asset value, end of period | 1.97 | | 1.98 | |
|
| |
| |
| Total Return (%) | d,e | .43 | | .65 | |
|
|
| |
| |
| Ratios/Supplemental Data (%): | | | | |
| Ratio of expenses to average net assetsf | 1.05 | | 1.05 | |
| Ratio of net investment income to average net assetsf | 1.46 | | 1.05 | |
| Decrease reflected in above expense ratios | | | | |
| due to undertaking by The Dreyfus Corporationf | .15 | | .18 | |
| Portfolio Turnover Ratee | 138.35 | | 371.43 | |
|
| |
| |
| Net Assets, end of period ($ x 1,000) | 1,208 | | 1,520 | |
a From November 1, 2002 (commencement of initial offering) to July 31, 2003.
b
| Based on average shares outstanding at each month end.
|
c
| Amount represents less than $.01 per share.
|
d
| Exclusive of sales charge.
|
e
| Not annualized.
|
f
| Annualized.
|
See notes to financial statements.
The Fund 23
NOTES TO FINANCIAL STATEMENTS (Unaudited)
NOTE 1—Significant Accounting Policies:
Dreyfus Premier Yield Advantage Fund (the “fund”) is a separate non-diversified series of Dreyfus Investment Grade Funds, Inc. (the “Company”) which is registered under the Investment Company Act of 1940, as amended (the “Act”), as an open-end management investment company and operates as a series company currently offering five series, including the fund.The fund’s investment objective is to provide investors with as high a level of current income as is consistent with the preservation of capital with minimal changes in share price. The Dreyfus Corporation (the “Manager”) serves as the fund’s investment adviser. The Manager is a wholly-owned subsidiary of Mellon Bank, N.A. (“Mellon”), which is a wholly-owned subsidiary of Mellon Financial Corporation.
Dreyfus Service Corporation (the “Distributor”), a wholly-owned subsidiary of the Manager, is the distributor of the fund’s shares. The fund is authorized to issue 900 million shares of $.001 par value Common Stock.The fund currently offers five classes of shares: Class A (100 million shares authorized), Class B (50 million shares authorized), Class D (500 million shares authorized), Class P (200 million shares authorized) and Class S (50 million shares authorized). Class A shares are subject to a sales charge imposed at the time of purchase, Class B shares and Class S shares are subject to a contingent deferred sales charge (“CDSC”) imposed on Class B share and Class S share redemptions made within six years of purchase and Class B shares automatically convert to Class A shares after six years. Class D and Class P shares are sold at net asset value per share only to institutional investors. Class A shares purchased at net asset value (an investment of $250,000 or more) will have a CDSC imposed on redemptions made within eighteen months of purchase. Other differences between the classes include the services offered to and the expenses borne by each class and certain voting rights. Income, expenses (other than expenses attributable to a specific class), and realized and unrealized gains or losses on investments are allocated to each class of shares based on its relative net assets.
24
The Company accounts separately for the assets, liabilities and operations of each series. Expenses directly attributable to each series are charged to that series’ operations; expenses which are applicable to all series are allocated among them on a pro rata basis.
The fund’s financial statements are prepared in accordance with accounting principles generally accepted in the United States, which may require the use of management estimates and assumptions.Actual results could differ from those estimates.
(a) Portfolio valuation: Investments in securities (excluding short-term investments (other than U.S.Treasury Bills), financial futures and options) are valued each business day by an independent pricing service (the “Service”) approved by the Board of Directors. Investments for which quoted bid prices are readily available and are representative of the bid side of the market in the judgment of the Service are valued at the mean between the quoted bid prices (as obtained by the Service from dealers in such securities) and asked prices (as calculated by the Service based upon its evaluation of the market for such securities). Other investments (which constitute a majority of the portfolio securities) are carried at fair value as determined by the Service, based on methods which include consideration of: yields or prices of securities of comparable quality, coupon, maturity and type; indications as to values from dealers; and general market conditions. Securities for which there are no such valuations are valued at fair value as determined in good faith under the direction of the Board of Directors. Short-term investments, excluding U.S. Treasury Bills, are carried at amortized cost, which approximates value. Financial futures are valued at the last sales price on the securities exchange on which such securities are primarily traded or at the last sales price on the national securities market on each business day. Options traded over-the-counter are priced at the mean between the bid prices and the asked prices.
(b) Securities transactions and investment income: Securities transactions are recorded on a trade date basis. Realized gain and loss from securities transactions are recorded on the identified cost basis.
The Fund 25
NOTES TO FINANCIAL STATEMENTS (Unaudited) (continued)
Dividend income is recognized on the ex-dividend date and interest income, including, where applicable, amortization of discount and premium on investments, is recognized on the accrual basis. Under the terms of the custody agreement, the fund receives net earnings credits based on available cash balances left on deposit.
(c) Dividends to shareholders: It is the policy of the fund to declare dividends daily from investment income-net. Such dividends are paid monthly. Dividends from net realized capital gain, if any, are normally declared and paid annually, but the fund may make distributions on a more frequent basis to comply with the distribution requirements of the Internal Revenue Code of 1986, as amended (the “Code”).To the extent that net realized capital gain can be offset by capital loss carryovers, it is the policy of the fund not to distribute such gain. Income and capital gain distributions are determined in accordance with income tax regulations, which may differ from accounting principles generally accepted in the United States.
(d) Federal income taxes: It is the policy of the fund to continue to qualify as a regulated investment company, if such qualification is in the best interests of its shareholders, by complying with the applicable provisions of the Code, and to make distributions of taxable income sufficient to relieve it from substantially all federal income and excise taxes.
The fund has an unused capital loss carryover of $3,308,447 available for federal income tax purposes to be applied against future net securities profits, if any, realized subsequent to July 31, 2003. If not applied, the carryover expires in fiscal 2011.
The tax character of distributions paid to shareholders during the fiscal year ended July 31, 2003 was as follows: ordinary income $12,562,666. The tax character of current year distributions will be determined at the end of the current fiscal year.
(e) Indemnification: The fund enters into contracts that contain a variety of indemnifications. The fund’s maximum exposure under these arrangements is unknown.The fund does not anticipate recognizing any loss related to these arrangements.
26
NOTE 2—Bank Line of Credit:
The fund participates with other Dreyfus-managed funds in a $100 million unsecured line of credit primarily to be utilized for temporary or emergency purposes, including the financing of redemptions. Interest is charged to the fund based on prevailing market rates in effect at the time of borrowings. During the period ended January 31, 2004, the fund did not borrow under the line of credit.
NOTE 3—Management Fee and Other Transactions With Affiliates:
(a) Pursuant to a management agreement (“Agreement”) with the Manager, the management fee is computed at the annual rate of .50 of 1% of the value of the fund’s average daily net assets and is payable monthly. The Manager has undertaken from August 1, 2003 through July 31, 2004, that if the aggregated expenses of the fund, exclusive of taxes, brokerage fees, 12b-1 distribution fees, shareholder services plan fees and extraordinary expenses, exceed an annual rate of .55 of 1% of the value of the fund’s average daily net assets, the fund may deduct from the payment to be made to the Manager under the Agreement, or the Manager will bear, such excess expense.The reduction in management fee, pursuant to the undertaking, amounted to $136,649 during the period ended January 31, 2004.
During the period ended January 31, 2004, the Distributor retained $19,080 from commissions earned on sales of the fund’s Class A shares and $104,874 and $8,092 from contingent deferred sales charges on redemptions of the fund’s Class B and Class S shares, respectively.
(b) Under the Distribution Plan (the “Plan”) adopted pursuant to Rule 12b-1 under the Act, Class B and Class S shares pay the Distributor for distributing their shares at an annual rate of .75 of 1% of the value of the average daily net assets of Class B shares and .25 of 1% of the value of the average daily net assets of Class S shares. During the period ended January 31, 2004, Class B and Class S shares were charged $22,228 and $1,819, respectively, pursuant to the Plan.
The Fund 27
NOTES TO FINANCIAL STATEMENTS (Unaudited) (continued)
(c) Under the Shareholder Services Plan, Class A, Class B, Class D, Class P and Class S shares pay the Distributor at an annual rate of .25 of 1% of the value of their average daily net assets for the provision of certain services. The services provided may include personal services relating to shareholder accounts, such as answering shareholder inquiries regarding Class A, Class B, Class D, Class P and Class S shares and providing reports and other information, and services related to the maintenance of shareholder accounts. The Distributor may make payments to Service Agents (a securities dealer, financial institution or other industry professional) in respect of these services. The Distributor determines the amounts to be paid to Service Agents. During the period ended January 31, 2004, Class A, Class B, Class D, Class P and Class S shares were charged $14,189, $7,409, $383,147, $144,176 and $1,819, respectively, pursuant to the Shareholder Services Plan.
The fund compensates Dreyfus Transfer, Inc., a wholly-owned subsidiary of the Manager, under a transfer agency agreement for providing personnel and facilities to perform transfer agency services for the fund. During the period ended January 31, 2004, the fund was charged $35,789 pursuant to the transfer agency agreement.
The fund compensates Mellon under a custody agreement for providing custodial services for the fund. During the period ended January 31, 2004, the fund was charged $16,023 pursuant to the custody agreement.
(d) Each Board member also serves as a Board member of other funds within the Dreyfus complex. Annual retainer fees and attendance fees are allocated to each fund based on net assets.
(e) Pursuant to an exemptive order from the Securities and Exchange Commission, the fund may invest its available cash balances in affiliated money market mutual funds as shown in the fund’s Statement of Investments. Management fees are not charged to these money market mutual funds. During the period ended January 31, 2004, the fund derived $146,916 in income from these investments, which is included in dividend income in the fund’s Statement of Operations.
28
NOTE 4—Securities Transactions:
The aggregate amount of purchases and sales (including paydowns) of investment securities, excluding short-term securities and financial futures, during the period ended January 31, 2004, amounted to $528,923,616 and $601,600,000, respectively.
The fund may invest in financial futures contracts in order to gain exposure to or protect against changes in the market. The fund is exposed to market risk as a result of changes in the value of the underlying financial instruments. Investments in financial futures require the fund to “mark to market” on a daily basis, which reflects the change in market value of the contracts at the close of each day’s trading. Accordingly, variation margin payments are received or made to reflect daily unrealized gains and losses. When the contracts are closed, the fund recognizes a realized gain or loss.These investments require initial margin deposits with a broker, which consist of cash or cash equiv-alents.The amount of these deposits is determined by the exchange or Board of Trade on which the contract is traded and is subject to change. Contracts open at January 31, 2004, are set forth in the Statement of Financial Futures.
At January 31, 2004, accumulated net unrealized depreciation on investments was $3,613,853, consisting of $1,446,247 gross unrealized appreciation and $5,060,100 gross unrealized depreciation.
At January 31, 2004, the cost of investments for federal income tax purposes was substantially the same as the cost for financial reporting purposes (see the Statement of Investments).
NOTE 5—Legal Matters:
Two class actions have been filed against Mellon Financial and Mellon Bank, N.A., and Dreyfus and Founders Asset Management LLC (the “Investment Advisers”), and the directors of all or substantially all of the Dreyfus Funds, alleging that the Investment Advisers improperly
The Fund 29
NOTES TO FINANCIAL STATEMENTS (Unaudited) (continued)
used assets of the Dreyfus Funds, in the form of directed brokerage commissions and 12b-1 fees, to pay brokers to promote sales of Dreyfus Funds, and that the use of fund assets to make these payments was not properly disclosed to investors.The complaints further allege that the directors breached their fiduciary duties to fund shareholders under the Investment Company Act of 1940 and at common law.The complaints seek unspecified compensatory and punitive damages, rescission of the funds’ contracts with the Investment Advisers, an accounting of all fees paid, and an award of attorneys’ fees and litigation expenses. Dreyfus and the funds believe the allegations to be totally without merit and will defend the actions vigorously.
Additional lawsuits arising out of these circumstances and presenting similar allegations and requests for relief may be filed against the defendants in the future. Neither Dreyfus nor the funds believe that any of the pending actions will have a material adverse affect on the funds or Dreyfus’ ability to perform its contract with the funds.
30
For More Information
| Dreyfus Premier |
| Yield Advantage Fund |
| 200 Park Avenue |
| New York, NY 10166 |
| |
| Manager |
| The Dreyfus Corporation |
| 200 Park Avenue |
| New York, NY 10166 |
|
| |
| Custodian |
| Mellon Bank, N.A. |
| One Mellon Bank Center |
| Pittsburgh, PA 15258 |
| |
| Transfer Agent & |
| Dividend Disbursing Agent |
| Dreyfus Transfer, Inc. |
| 200 Park Avenue |
| New York, NY 10166 |
| |
| Distributor |
| Dreyfus Service Corporation |
| 200 Park Avenue |
| New York, NY 10166 |
To obtain information:
| By telephone |
| Call your financial |
| representative or |
| 1-800-554-4611 |
| By mail Write to: |
| The Dreyfus Premier |
| Family of Funds |
| 144 Glenn Curtiss Boulevard |
| Uniondale, NY 11556-0144 |
A description of the policies and procedures that the fund uses to determine how to vote proxies relating to portfolio securities is available, without charge, by calling the telephone number listed above, or by visiting the SEC’s website at http://www.sec.gov
© 2004 Dreyfus Service Corporation 0056SA0104
| Dreyfus |
| Inflation Adjusted |
| Securities Fund |
| |
| |
| SEMIANNUAL REPORT January 31, 2004 |

The views expressed in this report reflect those of the portfolio manager only through the end of the period covered and do not necessarily represent the views of Dreyfus or any other person in the Dreyfus organization. Any such views are subject to change at any time based upon market or other conditions and Dreyfus disclaims any responsibility to update such views.These views may not be relied on as investment advice and, because investment decisions for a Dreyfus fund are based on numerous factors, may not be relied on as an indication of trading intent on behalf of any Dreyfus fund.
Not FDIC-Insured • Not Bank-Guaranteed • May Lose Value
Contents
THE FUND
2
| Letter from the Chairman
|
3
| Discussion of Fund Performance
|
6
| Statement of Investments
|
7
| Statement of Financial Futures
|
8
| Statement of Assets and Liabilities
|
9
| Statement of Operations
|
10
| Statement of Changes in Net Assets
|
12
| Financial Highlights
|
14
| Notes to Financial Statements
|
FOR MORE INFORMATION
|
Back Cover
|
Dreyfus Inflation Adjusted Securities Fund
The Fund

Dear Shareholder:
This semiannual report for Dreyfus Inflation Adjusted Securities Fund covers the six-month period from August 1, 2003, through January 31, 2004. Inside, you’ll find valuable information about how the fund was managed during the reporting period, including a discussion with Gerald E. Thunelius, portfolio manager and Director of the Dreyfus Taxable Fixed Income Team that manages the fund.
The bond market produced mixed results during the reporting period as investors adjusted to a stronger economic environment.As the U.S. economy gathered momentum, the more interest-rate-sensitive areas of the bond market began to retreat, giving back some of the gains achieved during the previous economic downturn. On the other hand, the bond market’s more credit-sensitive areas generally benefited from the stronger economy, producing more robust gains for corporate bonds.
While recent economic developments suggest to us that interest rates are more likely to rise in 2004 than to fall further, we continue to believe that bonds deserve a prominent place in most investors’ portfolios. As always, we urge you to speak regularly with your financial advisor, who may be in the best position to suggest the Dreyfus funds designed to meet your current needs, future goals and tolerance for risk.
Thank you for your continued confidence and support.
Sincerely,

Stephen E. Canter
Chairman and Chief Executive Officer The Dreyfus Corporation
February 17, 2004
2

DISCUSSION OF FUND PERFORMANCE
Gerald E. Thunelius, Senior Portfolio Manager Dreyfus Taxable Fixed Income Team
How did Dreyfus Inflation Adjusted Securities Fund perform relative to its benchmark?
For the six-month period ended January 31, 2004, the fund’s Institutional shares achieved a total return of 6.92%, and its Investor shares achieved a total return of 6.79%.1 In comparison, the fund’s benchmark, the Lehman Brothers U.S. Treasury Inflation Protected Securities Index (the “Index”), achieved a total return of 8.10% for the same period.2
The market for inflation-protected securities experienced heightened volatility during the reporting period as the U.S. economy strengthened and investors’ inflation expectations rose sharply before easing more gradually.The fund produced lower returns than its benchmark, primarily because the fund had an overweight position of longer-term holdings relative to that of the Index during the summer of 2003, when the bond market experienced a sharp decline.
What is the fund’s investment approach?
The fund seeks returns that exceed the rate of inflation.To pursue this goal, the fund normally invests at least 80% of its assets in inflation-indexed securities, which are designed to protect investors from a loss of value due to inflation.
The fund invests primarily in high-quality, U.S. dollar-denominated, inflation-indexed securities.To a limited extent, the fund may invest in foreign currency-denominated, inflation-protected securities and other fixed-income securities not adjusted for inflation, including U.S. government bonds and notes, corporate bonds, mortgage-related securities and asset-backed securities.
While the fund seeks to keep its average effective duration — a measure of sensitivity to changing interest rates — between two and 10 years, it
The Fund 3
DISCUSSION OF FUND PERFORMANCE (continued)
may invest in securities with effective or final maturities of any length. Generally, we will adjust the fund’s holdings or its average duration based on actual or anticipated changes in interest rates or credit quality.
What other factors influenced the fund’s performance?
The fund was primarily affected during the reporting period by changes in the economic environment and resulting market volatility.
Just weeks before the reporting period began, the Federal Reserve Board (the “Fed”) reduced short-term interest rates for the thirteenth consecutive time since January 2001, and short-term rates fell to 1%, a 45-year low. However, between the Fed’s reduction of interest rates in late June and the start of the reporting period on August 1, 2003, more definite signs of stronger economic growth emerged, producing one of the most severe one-month declines in bond market history.As a result, both nominal U.S. Treasury securities and TIPS began the reporting period at prices reflecting investors’ concerns that the Fed might soon raise short-term interest rates in an attempt to forestall potential inflationary pressures. Indeed, it was later revealed that the U.S. economy had expanded at a robust 8.2% annualized rate during the third quarter of 2003.
However, fixed-income investors’ inflation-related worries eased considerably during the fourth quarter when it became clearer that the labor markets remained weak and the economic recovery was likely to be more moderate than many had feared. These expectations were later confirmed by the U.S. Commerce Department, which estimated that gross domestic product grew at an annualized 4.0% rate during the last quarter of 2003. For their part, the Fed repeatedly reiterated its commitment to keeping interest rates low “for a considerable period.” As inflation fears waned, nominal U.S.Treasury securities rallied, outperforming their inflation-protected counterparts.
In light of the Fed’s aggressively accommodative monetary policy, the fund began the reporting period with a “barbell” strategy in which inflation-protected bonds with 30-year maturities were balanced by shorter-term securities.This strategy was designed to take advantage of
4
what we believed to be more attractive values among longer-dated inflation-protected securities in a benign inflation environment. However, this posture increased the fund’s exposure to the market’s summertime decline.While this strategy also enabled the fund to more fully capture price gains as the market recovered, it was not enough to completely offset earlier underperformance.
What is the fund’s current strategy?
Although the economic recovery so far appears to be sustainable, we have seen few, if any, signs that the rate of inflation is poised to accelerate. A significant amount of manufacturing capacity in the U.S. economy reportedly remains unused, and the employment picture has improved only modestly. As a result, inflation concerns generally have continued to wane, and inflation-protected securities toward the shorter end of their maturity range appear to have fallen out of favor among investors.
Accordingly, by December 2003, we had removed our previous “barbell” strategy and put greater emphasis on shorter-term securities, which were selling at prices we considered relatively attractive.While we have continued to maintain our emphasis on shorter-term securities as of the end of the reporting period, we are monitoring the U.S. economy for signs of renewed inflationary pressures, and we may extend the fund’s average duration if inflation becomes more of a factor.
February 17, 2004
1
| Total return includes reinvestment of dividends and any capital gains paid. Past performance is no guarantee of future results. Share price, yield and investment return fluctuate such that upon redemption, fund shares may be worth more or less than their original cost. Return figures provided reflect the absorption of fund expenses by The Dreyfus Corporation pursuant to an agreement in effect through July 31, 2004, at which time it may be extended, terminated or modified. Had these expenses not been absorbed, the fund’s returns would have been lower.
|
2
| SOURCE: LEHMAN BROTHERS INC. — Reflects reinvestment of dividends and, where applicable, capital gain distributions.The Lehman Brothers U.S.Treasury Inflation Protected Securities Index is a sub-index of the U.S.Treasury component of the Lehman Brothers U.S. Government Index. Securities in the Lehman Brothers U.S.Treasury Inflation Protected Securities Index are dollar-denominated, non-convertible, publicly-issued, fixed-rate, investment-grade (Moody’s Baa3 or better) U.S.Treasury inflation notes, with at least one year to final maturity and at least $100 million par amount outstanding.
|
The Fund 5
STATEMENT OF INVESTMENTS
January 31, 2004 (Unaudited)
| | | | | Principal | | |
| Bonds and Notes—85.3% | | Amounta | Value ($) | |
|
|
|
| |
| Foreign/Governmental—1.7% | | | | |
| Iceland Rikisbref, | | | | | |
| Notes, 7.25%, 2013 | | ISK | 7,470,000 | 104,154 | |
| U.S. Treasury Principal Strips—.1% | | | | |
| 0%, 11/15/2026 | | | 20,000 | 5,874 | |
| U.S. Treasury Inflation Protection Securities—83.5% | | | | |
| 1.875%, 7/15/2013 | | | 753,480 b | 758,680 | |
| 2%, 1/15/2014 | | | 1,000,000 b | 1,013,594 | |
| 3.375%, 4/15/2032 | | | 519,765 b | 653,848 | |
| 3.625%, 4/15/2028 | | | 1,996,435 b,d | 2,514,264 | |
| Coupon Strips: | | | | | |
| 0%, 10/15/2028 | | | 10,000 b,c | 10,643 | |
| 0%, 4/15/2029 | | | 10,000 b,c | 10,657 | |
| Principal Strips, | | | | | |
| 0%, 4/15/2029 | | | 150,000 b | 97,728 | |
| | | | | | 5,059,414 | |
| Total Bonds and Notes | | | | | |
| (cost $ | 5,103,414) | | | | 5,169,442 | |
|
|
|
|
|
| |
| | | | | | | |
| Other Investments—14.5% | | Shares | Value ($) | |
|
|
|
| |
| Registered Investment Companies: | | | | |
| Dreyfus Institutional Cash Advantage Fund | | 292,334 e | 292,334 | |
| Dreyfus Institutional Cash Advantage Plus Fund | | 292,333 e | 292,333 | |
| Dreyfus Institutional Preferred Plus Money Market Fund | | 292,333 e | 292,333 | |
| Total Other Investments | | | | | |
| (cost $ | 877,000) | | | | 877,000 | |
|
|
|
|
|
| |
| | | | | | | |
| Total Investments (cost $ | 5,980,414) | | 99.8% | 6,046,442 | |
| Cash and Receivables (Net) | | .2% | 13,139 | |
| Net Assets | | | 100.0% | 6,059,581 | |
a Principal amount stated in U.S. Dollars unless otherwise noted.
ISK—Icelandic Krona
b
| Principal amount for accrual purposes is periodically adjusted based on changes in the Consumer Price Index.
|
c
| Notional face amount shown.
|
d
| Partially held by broker as collateral for open financial futures positions.
|
e
| Investments in affiliated money market mutual funds—See Note 3(d).
|
See notes to financial statements.
6
| STATEMENT OF FINANCIAL FUTURES |
| January 31, 2004 (Unaudited) |
| | | | Market Value | | Unrealized | |
| | | | Covered by | | (Depreciation) | |
| | Contracts | | Contracts ($) | Expiration | at 1/31/2004 ($) | |
|
| |
|
|
| |
| Financial Futures Long | | | | | | |
| U.S. Treasury 30 Year Bonds | 8 | | 890,750 | March 2004 | (7,124) | |
See notes to financial statements.
The Fund 7
| STATEMENT OF ASSETS AND LIABILITIES |
| January 31, 2004 (Unaudited) |
| | | Cost | Value | |
|
|
|
| |
| Assets ($): | | | | |
| Investments in securities—See Statement of Investments | 5,980,414 | 6,046,442 | |
| Interest receivable | | 34,746 | |
| Receivable for futures variation margin—Note 4 | | 6,000 | |
| Prepaid expenses | | 14,205 | |
| Due from The Dreyfus Corporation | | 3,212 | |
| | | | 6,104,605 | |
|
|
|
| |
| Liabilities ($): | | | | |
| Cash overdraft due to Custodian | | 25,879 | |
| Accrued expenses | | 19,145 | |
| | | | 45,024 | |
|
|
|
| |
| Net Assets ( | $) | | 6,059,581 | |
|
|
|
| |
| Composition of Net Assets ($): | | | |
| Paid-in capital | | | 6,072,174 | |
| Accumulated distributions in excess of investment income—net | | (22,356) | |
| Accumulated net realized gain (loss) on investments | | (49,483) | |
| Accumulated net unrealized appreciation (depreciation) on investments | | |
| [including ( | $7,124) net unrealized (depreciation) on financial futures] | 59,246 | |
|
|
| |
| Net Assets ( | $) | | 6,059,581 | |
| Net Asset Value Per Share | | | | |
| | Investor Shares | | Institutional Shares | |
|
| |
| |
| Net Assets ($) | 2,830,527 | | 3,229,054 | |
| Shares Outstanding | 226,749 | | 258,684 | |
|
| |
| |
| Net Asset Value Per Share ($) | 12.48 | | 12.48 | |
See notes to financial statements.
8
| STATEMENT OF OPERATIONS |
| Six Months Ended January 31, 2004 (Unaudited) |
| Investment Income ($): | | |
| Interest | 71,130 | |
| Cash dividends | 2,229 | |
| Total Income | 73,359 | |
| Expenses: | | |
| Management fee—Note 3(a) | 8,419 | |
| Registration fees | 13,127 | |
| Auditing fees | 13,038 | |
| Prospectus and shareholders' reports | 7,692 | |
| Shareholder servicing costs—Note 3(b) | 4,040 | |
| Custodian fees—Note 3(b) | 2,451 | |
| Directors' fees and expenses—Note 3(c) | 315 | |
| Legal fees | 42 | |
| Miscellaneous | 917 | |
| Total Expenses | 50,041 | |
| Less—expense reimbursement from The Dreyfus Corporation | | |
| due to undertaking—Note 3(a) | (38,144) | |
| Net Expenses | 11,897 | |
| Investment Income—Net | 61,462 | |
|
| |
| Realized and Unrealized Gain (Loss) on Investments—Note 4 ($): | | |
| Net realized gain (loss) on investments and foreign currency transactions | (50,524) | |
| Net realized gain (loss) on financial futures | 37,718 | |
| Net Realized Gain (Loss) | (12,806) | |
| Net unrealized appreciation (depreciation) on investments and | | |
| foreign currency transactions [including ($7,124) net unrealized | | |
| (depreciation) on financial futures] | 316,614 | |
| Net Realized and Unrealized Gain (Loss) on Investments | 303,808 | |
| Net Increase in Net Assets Resulting from Operations | 365,270 | |
See notes to financial statements.
The Fund 9
STATEMENT OF CHANGES IN NET ASSETS
| | Six Months Ended | | | |
| | January 31, 2004 | | Year Ended | |
| | (Unaudited) | | July 31, 2003a | |
|
| |
| |
| Operations ($): | | | | |
| Investment income—net | 61,462 | | 96,449 | |
| Net realized gain (loss) on investments | (12,806) | | 397,751 | |
| Net unrealized appreciation | | | | |
| (depreciation) on investments | 316,614 | | (257,368) | |
| Net Increase (Decrease) in Net Assets | | | | |
| Resulting from Operations | 365,270 | | 236,832 | |
|
| |
| |
| Dividends to Shareholders from ($): | | | | |
| Investment income—net: | | | | |
| Investor Shares | (43,574) | | (79,822) | |
| Institutional Shares | (46,612) | | (84,081) | |
| Net realized gain on investments: | | | | |
| lnvestor Shares | (181,230) | | — | |
| Institutional Shares | (179,376) | | — | |
| Total Dividends | (450,792) | | (163,903) | |
|
| |
| |
| Capital Stock Transactions ($): | | | | |
| Net proceeds from shares sold: | | | | |
| Investor Shares | — | | 2,534,293 | |
| Institutional Shares | 423,186 | | 2,500,000 | |
| Dividends reinvested: | | | | |
| Investor Shares | 224,804 | | 79,822 | |
| Institutional Shares | 225,988 | | 84,081 | |
| Increase (Decrease) in Net Assets from | | | | |
| Capital Stock Transactions | 873,978 | | 5,198,196 | |
| Total Increase (Decrease) in Net Assets | 788,456 | | 5,271,125 | |
|
| |
| |
| Net Assets ($): | | | | |
| Beginning of Period | 5,271,125 | | — | |
| End of Period | 6,059,581 | | 5,271,125 | |
| Undistributed (distributions in excess of) | | | | |
| investment income—net | (22,356) | | 6,368 | |
10
| | Six Months Ended | | | |
| | January 31, 2004 | | Year Ended | |
| | (Unaudited) | | July 31, 2003a | |
|
| |
| |
| Capital Share Transactions: | | | | |
| Investor Shares | | | | |
| Shares sold | — | | 202,636 | |
| Shares issued for dividends reinvested | 17,930 | | 6,183 | |
| Net Increase (Decrease) in Shares Outstanding | 17,930 | | 208,819 | |
|
| |
| |
| Institutional Shares | | | | |
| Shares sold | 34,151 | | 200,000 | |
| Shares issued for dividends reinvested | 18,018 | | 6,515 | |
| Net Increase (Decrease) in Shares Outstanding | 52,169 | | 206,515 | |
a From October 31, 2002 (commencement of operations) to July 31, 2003. See notes to financial statements.
The Fund 11
FINANCIAL HIGHLIGHTS
The following table describes the performance for each share class for the fiscal periods indicated.All information (except portfolio turnover rate) reflects financial results for a single fund share.Total return shows how much your investment in the fund would have increased (or decreased) during each period, assuming you had reinvested all dividends and distributions.These figures have been derived from the fund’s financial statements.
| | Six Months Ended | | | |
| | January 31, 2004 | | Period Ended | |
| Investor Shares | (Unaudited) | | July 31, 2003a | |
|
| |
| |
| Per Share Data ($): | | | | |
| Net asset value, beginning of period | 12.69 | | 12.50 | |
| Investment Operations: | | | | |
| Investment income—netb | .14 | | .23 | |
| Net realized and unrealized gain | | | | |
| (loss) on investments | .72 | | .35 | |
| Total from Investment Operations | .86 | | .58 | |
| Distributions: | | | | |
| Dividends from investment income-net | (.21) | | (.39) | |
| Dividends from net realized gain on investments | (.86) | | — | |
| Total Distributions | (1.07) | | (.39) | |
| Net asset value, end of period | 12.48 | | 12.69 | |
|
| |
| |
| Total Return (%)c | 6.79 | | 4.63 | |
|
| |
| |
| Ratios/Supplemental Data (%): | | | | |
| Ratio of expenses to average net assetsd | .55 | | .55 | |
| Ratio of net investment income | | | | |
| to average net assetsd | 2.17 | | 2.33 | |
| Decrease reflected in above expense | | | | |
| ratios due to undertakings by | | | | |
| The Dreyfus Corporationd | 1.36 | | 2.75 | |
| Portfolio Turnover Ratec | 492.04 | | 1,306.72 | |
|
| |
| |
| Net Assets, end of period ($ x 1,000) | 2,831 | | 2,650 | |
a From October 31, 2002 (commencement of operations) to July 31 ,2003.
b
| Based on average shares outstanding.
|
c
| Not annualized.
|
d
| Annualized.
|
See notes to financial statements.
12
| | Six Months Ended | | | |
| | January 31, 2004 | | Period Ended | |
| Institutional Shares | (Unaudited) | | July 31, 2003a | |
|
| |
| |
| Per Share Data ($): | | | | |
| Net asset value, beginning of period | 12.69 | | 12.50 | |
| Investment Operations: | | | | |
| Investment income—netb | .14 | | .25 | |
| Net realized and unrealized gain | | | | |
| (loss) on investments | .73 | | .35 | |
| Total from Investment Operations | .87 | | .60 | |
| Distributions: | | | | |
| Dividends from investment income-net | (.22) | | (.41) | |
| Dividends from net realized gain on investments | (.86) | | — | |
| Total Distributions | (1.08) | | (.41) | |
| Net asset value, end of period | 12.48 | | 12.69 | |
|
| |
| |
| Total Return (%)c | 6.92 | | 4.82 | |
|
| |
| |
| Ratios/Supplemental Data (%): | | | | |
| Ratio of expenses to average net assetsd | .30 | | .30 | |
| Ratio of net investment income | | | | |
| to average net assetsd | 2.21 | | 2.58 | |
| Decrease reflected in above expense | | | | |
| ratios due to undertakings by | | | | |
| The Dreyfus Corporationd | 1.36 | | 2.76 | |
| Portfolio Turnover Ratec | 492.04 | | 1,306.72 | |
|
| |
| |
| Net Assets, end of period ($ x 1,000) | 3,229 | | 2,621 | |
a From October 31, 2002 (commencement of operations) to July 31 ,2003.
b
| Based on average shares outstanding.
|
c
| Not annualized.
|
d
| Annualized.
|
See notes to financial statements.
The Fund 13
NOTES TO FINANCIAL STATEMENTS (Unaudited)
NOTE 1—Significant Accounting Policies:
Dreyfus Inflation Adjusted Securities Fund (the “fund”) is a separate diversified series of Dreyfus Investment Grade Funds, Inc. (the “Company”) which is registered under the Investment Company Act of 1940, as amended (the “Act”), as an open-end management investment company and operates as a series company currently offering five series, including the fund. The fund’s investment objective is to seek returns that exceed the rate of inflation.The Dreyfus Corporation (the “Manager”) serves as the fund’s investment adviser.The Manager is a wholly-owned subsidiary of Mellon Bank, N.A. (“Mellon”), which is a wholly-owned subsidiary of Mellon Financial Corporation. Dreyfus Service Corporation (the “Distributor”), a wholly-owned subsidiary of the Manager, is the distributor of the fund’s shares which are sold to the public without a sales charge.
The fund is authorized to issue 500 million shares of $.001 par value Common Stock in each of the following classes of shares: Investor and Institutional. Investor shares are subject to a shareholder services plan. Other differences between the classes include the services offered to and the expenses borne by each class, the minimum initial investment and certain voting rights. Income, expenses (other than expenses attributable to a specific class), and realized and unrealized gains or losses on investments are allocated to each class of shares based on its relative net assets.
As of January 31, 2004, MBC Investments Corp., an indirect subsidiary of Mellon Financial Corporation, held 223,827 Investor shares and 224,459 Institutional shares.
The Company accounts separately for the assets, liabilities and operations of each series. Expenses directly attributable to each series are charged to that series’ operations; expenses which are applicable to all series are allocated among them on a pro rata basis.
The fund’s financial statements are prepared in accordance with accounting principles generally accepted in the United States, which may require the use of management estimates and assumptions.Actual results could differ from those estimates.
14
(a) Portfolio valuation: Investments in securities (excluding short-term investments (other than U.S.Treasury Bills), financial futures and options) are valued each business day by an independent pricing service (the “Service”) approved by the Board of Directors. Investments for which quoted bid prices are readily available and are representative of the bid side of the market in the judgment of the Service are valued at the mean between the quoted bid prices (as obtained by the Service from dealers in such securities) and asked prices (as calculated by the Service based upon its evaluation of the market for such securities). Other investments (which constitute a majority of the portfolio securities) are carried at fair value as determined by the Service, based on methods which include consideration of: yields or prices of securities of comparable quality, coupon, maturity and type; indications as to values from dealers; and general market conditions. Securities for which there are no such valuations are valued at fair value as determined in good faith under the direction of the Board of Directors. Short-term investments, excluding U.S. Treasury Bills, are carried at amortized cost, which approximates value. Financial futures and options, which are traded on an exchange, are valued at the last sales price on the securities exchange on which such securities are primarily traded or at the last sales price on the national securities market on each business day. Options traded over-the-counter are priced at the mean between the bid prices and asked prices. Investments denominated in foreign currencies are translated to U.S. dollars at the prevailing rates of exchange. Forward currency exchange contracts are valued at the forward rate.
(b) Foreign currency transactions: The fund does not isolate that portion of the results of operations resulting from changes in foreign exchange rates on investments from the fluctuations arising from changes in the market prices of securities held. Such fluctuations are included with the net realized and unrealized gain or loss from investments.
Net realized foreign exchange gains or losses arise from sales and maturities of short-term securities, sales of foreign currencies, currency gains or losses realized on securities transactions and the differ-
The Fund 15
NOTES TO FINANCIAL STATEMENTS (Unaudited) (continued)
ence between the amount of dividends, interest and foreign withholding taxes recorded on the fund’s books and the U.S. dollar equivalent of the amounts actually received or paid. Net unrealized foreign exchange gains and losses arise from changes in the value of assets and liabilities other than investments in securities at fiscal year end, resulting from changes in exchange rates. Such gains and losses are included with net realized and unrealized gain or loss on investments.
(c) Securities transactions and investment income: Securities transactions are recorded on a trade date basis. Realized gain and loss from securities transactions are recorded on the identified cost basis. Dividend income is recognized on the ex-dividend date and interest income, including, where applicable, amortization of discount and premium on investments, is recognized on the accrual basis. Under the terms of the custody agreement, the fund receives net earnings credits based on available cash balances left on deposit.
(d) Dividends to shareholders: It is the policy of the fund to declare dividends daily from investment income-net. Such dividends are paid monthly. Dividends from net realized capital gain, if any, are normally declared and paid annually, but the fund may make distributions on a more frequent basis to comply with the distribution requirements of the Internal Revenue Code of 1986, as amended (the “Code”).To the extent that net realized capital gain can be offset by capital loss carryovers, if any, it is the policy of the fund not to distribute such gain. Income and capital gain distributions are determined in accordance with income tax regulations, which may differ from accounting principles generally accepted in the United States.
(e) Federal income taxes: It is the policy of the fund to continue to qualify as a regulated investment company, if such qualification is in the best interests of its shareholders, by complying with the applicable provisions of the Code, and to make distributions of taxable income sufficient to relieve it from substantially all federal income and excise taxes.
The tax character of distributions paid to shareholders during the fiscal year ended July 31, 2003 was as follows: ordinary income $163,903. The tax character of current year distributions will be determined at the end of the current fiscal year.
16
(f) Indemnification: The fund enters into contracts that contain a variety of indemnifications. The fund’s maximum exposure under these arrangements is unknown.The fund does not anticipate recognizing any loss related to the arrangements.
NOTE 2—Bank Line of Credit:
The fund participates with other Dreyfus-managed funds in a $350 million redemption credit facility (the “Facility”) to be utilized for temporary or emergency purposes, including the financing of redemptions. In connection therewith, the fund has agreed to pay commitment fees on its pro rata portion of the Facility. Interest is charged to the fund based on prevailing market rates in effect at the time of borrowings. During the period ended January 31, 2004, the fund did not borrow under the Facility.
NOTE 3—Management Fee and Other Transactions With Affiliates:
(a) Pursuant to a management agreement (“Agreement”) with the Manager, the management fee is computed at the annual rate of .30 of 1% of the value of the fund’s average daily net assets and is payable monthly. The Manager has undertaken from October 31, 2002 through July 31, 2004, that if the aggregated expenses of the fund, exclusive of taxes, brokerage fees, shareholder services plan fees and extraordinary expenses, exceed an annual rate of .30 of 1% of the value of the fund’s average daily net assets, the fund may deduct from the payment to be made to the Manager under the Agreement, or the Manager will bear, such excess expense.The expense reimbursement, pursuant to the undertaking, amounted to $38,144 during the period ended January 31, 2004.
(b) Under the Investor Shares Shareholder Services Plan, the fund pays the Distributor at an annual rate of .25 of 1% of the value of Investor Shares average daily net assets for the provision of certain services.The services provided may include personal services relating to shareholder accounts, such as answering shareholder inquiries regarding the fund
The Fund 17
NOTES TO FINANCIAL STATEMENTS (Unaudited) (continued)
and providing reports and other information, and services related to the maintenance of shareholder accounts. The Distributor may make payments to Service Agents (a securities dealer, financial institution or other industry professional) in respect of these services. The Distributor determines the amounts to be paid to Service Agents. During the period ended January 31, 2004, Investor Shares were charged $3,478 pursuant to the Shareholder Services Plan.
The fund compensates Dreyfus Transfer, Inc., a wholly-owned subsidiary of the Manager, under a transfer agency agreement for providing personnel and facilities to perform transfer agency services for the fund. During the period ended January 31, 2004, the fund was charged $29 pursuant to the transfer agency agreement.
The fund compensates Mellon under a custody agreement for providing custodial services for the fund. During the period ended January 31, 2004, the fund was charged $2,451 pursuant to the custody agreement.
(c) Each Board member also serves as a Board member of other funds within the Dreyfus complex. Annual retainer fees and attendance fees are allocated to each fund based on net assets.
(d) Pursuant to an exemptive order from the Securities and Exchange Comission, the fund may invest its available cash balances in affiliated money market mutual funds as shown in the fund’s Statement of Investments. Management fees are not charged to these money market mutual funds. During the period ended January 31, 2004, the fund derived $2,229 in income from these investments, which is included in dividend income in the fund’s Statement of Operations.
NOTE 4—Securities Transactions:
The aggregate amount of purchases and sales (including paydowns) of investment securities, excluding short-term securities, forward currency exchange contracts and financial futures, during the period ended January 31, 2004, amounted to $24,212,376 and $24,475,920, respectively.
18
The fund enters into forward currency exchange contracts in order to hedge its exposure to changes in foreign currency exchange rates on its foreign portfolio holdings and to settle foreign currency transac-tions.When executing forward currency exchange contracts, the fund is obligated to buy or sell a foreign currency at a specified rate on a certain date in the future. With respect to sales of forward currency exchange contracts, the fund would incur a loss if the value of the contract increases between the date the forward contract is opened and the date the forward contract is closed.The fund realizes a gain if the value of the contract decreases between those dates. With respect to purchases of forward currency exchange contracts, the fund would incur a loss if the value of the contract decreases between the date the forward contract is opened and the date the forward contract is closed. The fund realizes a gain if the value of the contract increases between those dates. The fund is also exposed to credit risk associated with counterparty nonperformance on these forward currency exchange contracts which is typically limited to the unrealized gain on each open contract. At January 31, 2004, there were no open forward currency exchange contracts.
The fund may invest in financial futures contracts in order to gain exposure to or protect against changes in the market. The fund is exposed to market risk as a result of changes in the value of the underlying financial instruments. Investments in financial futures require the fund to “mark to market” on a daily basis, which reflects the change in the market value of the contracts at the close of each day’s trading. Accordingly, variation margin payments are received or made to reflect daily unrealized gains or losses.When the contracts are closed, the fund recognizes a realized gain or loss.These investments require initial margin deposits with a broker, which consist of cash or cash equivalents. The amount of these deposits is determined by the exchange or Board of Trade on which the contract is traded and is subject to change.
The Fund 19
NOTES TO FINANCIAL STATEMENTS (Unaudited) (continued)
Contracts open at January 31, 2004, are set forth in the Statement of Financial Futures.
At January 31, 2004, accumulated net unrealized appreciation on investments was $66,028, consisting of $66,066 gross unrealized appreciation and $38 gross unrealized depreciation.
At January 31, 2004, the cost of investments for federal income tax purposes was substantially the same as the cost for financial reporting purposes (see the Statement of Investments).
NOTE 5—Legal Matters:
Two class actions have been filed against Mellon Financial and Mellon Bank, N.A., and Dreyfus and Founders Asset Management LLC (the “Investment Advisers”), and the directors of all or substantially all of the Dreyfus Funds, alleging that the Investment Advisers improperly used assets of the Dreyfus Funds, in the form of directed brokerage commissions and 12b-1 fees, to pay brokers to promote sales of Dreyfus Funds, and that the use of fund assets to make these payments was not properly disclosed to investors.The complaints further allege that the directors breached their fiduciary duties to fund shareholders under the Investment Company Act of 1940 and at common law.The complaints seek unspecified compensatory and punitive damages, rescission of the funds’ contracts with the Investment Advisers, an accounting of all fees paid, and an award of attorneys’ fees and litigation expenses. Dreyfus and the funds believe the allegations to be totally without merit and will defend the actions vigorously.
Additional lawsuits arising out of these circumstances and presenting similar allegations and requests for relief may be filed against the defendants in the future. Neither Dreyfus nor the funds believe that any of the pending actions will have a material adverse affect on the funds or Dreyfus’ ability to perform its contract with the funds.
20
For More Information
| Dreyfus |
| Inflation Adjusted |
| Securities Fund |
| 200 Park Avenue |
| New York, NY 10166 |
| |
| Investment Adviser |
| The Dreyfus Corporation |
| 200 Park Avenue |
|
| New York, NY 10166 |
| |
| Custodian |
| Mellon Bank, N.A. |
| One Mellon Bank Center |
| Pittsburgh, PA 15258 |
| |
| Transfer Agent & |
| Dividend Disbursing Agent |
| Dreyfus Transfer, Inc. |
| 200 Park Avenue |
| New York, NY 10166 |
| |
| Distributor |
| Dreyfus Service Corporation |
| 200 Park Avenue |
| New York, NY 10166 |
To obtain information:
| By telephone |
| Call 1-800-645-6561 |
| By mail Write to: |
| The Dreyfus Family of Funds |
| 144 Glenn Curtiss Boulevard |
| Uniondale, NY 11556-0144 |
| By E-mail Send your request |
| to info@dreyfus.com |
| On the Internet Information |
| can be viewed online or |
| downloaded from: |
| http://www.dreyfus.com |
A description of the policies and procedures that the fund uses to determine how to vote proxies relating to portfolio securities is available, without charge, by calling the telephone number listed above, or by visiting the SEC’s website at http://www.sec.gov
© 2004 Dreyfus Service Corporation 0588SA0104
| Dreyfus Premier |
| Short Term |
| Income Fund |
The views expressed in this report reflect those of the portfolio manager only through the end of the period covered and do not necessarily represent the views of Dreyfus or any other person in the Dreyfus organization. Any such views are subject to change at any time based upon market or other conditions and Dreyfus disclaims any responsibility to update such views.These views may not be relied on as investment advice and, because investment decisions for a Dreyfus fund are based on numerous factors, may not be relied on as an indication of trading intent on behalf of any Dreyfus fund.
Not FDIC-Insured • Not Bank-Guaranteed • May Lose Value
Contents
THE FUND
2
| Letter from the Chairman
|
3
| Discussion of Fund Performance
|
6
| Statement of Investments
|
14
| Statement of Financial Futures
|
15
| Statement of Assets and Liabilities
|
16
| Statement of Operations
|
17
| Statement of Changes in Net Assets
|
19
| Financial Highlights
|
23
| Notes to Financial Statements
|
FOR MORE INFORMATION
|
Back Cover
|
Dreyfus Premier Short Term Income Fund
The Fund

LETTER FROM THE CHAIRMAN
Dear Shareholder:
This semiannual report for Dreyfus Premier Short Term Income Fund covers the six-month period from August 1, 2003, through January 31, 2004. Inside, you’ll find valuable information about how the fund was managed during the reporting period, including a discussion with Gerald E. Thunelius, portfolio manager and Director of the Dreyfus Taxable Fixed Income Team that manages the fund.
The bond market produced mixed results during the reporting period as investors adjusted to a stronger economic environment.As the U.S. economy gathered momentum, the more interest-rate-sensitive areas of the bond market began to retreat, giving back some of the gains achieved during the previous economic downturn. On the other hand, the bond market’s more credit-sensitive areas generally benefited from the stronger economy, producing more robust gains for corporate bonds.
While recent economic developments suggest to us that interest rates are more likely to rise in 2004 than to fall further, we continue to believe that bonds deserve a prominent place in most investors’ portfolios. As always, we urge you to speak regularly with your financial advisor, who may be in the best position to suggest the Dreyfus funds designed to meet your current needs, future goals and tolerance for risk.
Thank you for your continued confidence and support.
Sincerely,

| Stephen E. Canter |
| Chairman and Chief Executive Officer |
| The Dreyfus Corporation |
| February 17, 2004 |
2

DISCUSSION OF FUND PERFORMANCE
Gerald E. Thunelius, Senior Portfolio Manager Dreyfus Taxable Fixed Income Team
How did Dreyfus Premier Short Term Income Fund perform relative to its benchmark?
For the six-month period ended January 31, 2004, the fund achieved total returns of 0.97% for Class A shares, 0.65% for Class B shares, 1.01% for Class D shares and 1.07% for Class P shares.1 In comparison, the fund’s benchmark, the Merrill Lynch Corporate and Government (1-5 years) Index (the “Index”), achieved a total return of 2.17% for the same period.2
After three years of above-average returns, the bond market’s performance moderated during the reporting period while the economy strengthened. The fund produced lower returns than the Index, primarily because of its relatively defensive duration posture, which was designed to manage risks in a volatile market.
What is the fund’s investment approach?
The fund seeks to maximize total returns consisting of capital appreciation and current income. At least 80% of the fund must be invested in investment-grade bonds, including U.S. government and agency securities, corporate bonds and mortgage- and asset-backed securities. Up to 20% of the fund may be invested in securities rated below investment grade, including emerging market securities. Average effective maturity and average effective duration are kept at three years or less.
When choosing investments for the fund, we evaluate four primary factors:
- The direction in which interest rates are likely to move under prevailing economic conditions. If interest rates appear to be rising, we generally reduce the fund’s average duration to capture higher-yielding securities as they become available. If interest rates appear to be declining, we may increase the fund’s average duration to lock in prevailing yields.
The Fund 3
DISCUSSION OF FUND PERFORMANCE (continued)
- The difference in yields — or spreads — between fixed-income securities of varying maturities.
- The mix of security types within the fund, including relative exposure to government securities, corporate securities and high-yield bonds.
- Credit and cash flow characteristics of individual securities, including the financial health of the issuer and the callability of the security.
What other factors influenced the fund’s performance?
The fund was primarily influenced during the reporting period by a strengthening economy and investors’ changing expectations regarding short-term interest rates. Indeed, after shifting from general weakness earlier in 2003 to a more robust rate of growth, investors spent much of the reporting period adjusting to a new economic climate. In July, just before the reporting period began, and in early August, after the start of the reporting period, expectations of stronger economic growth proved to be harmful to the prices of U.S. government securities. Fortunately, we set the fund’s average duration in a range that was shorter than average, helping to reduce its sensitivity to heightened market volatility. However, this relatively defensive duration posture also limited the fund’s participation in the rebound that followed the market’s summertime decline.
Corporate bonds remained strong through the end of the year as they generally respond more to investors’ perceptions of underlying business conditions than to interest-rate expectations. Gains were particularly robust for lower-rated corporate securities, including high-yield bonds. Because the fund emphasized corporate securities early in the reporting period, it participated in the sector’s overall strength.The fund’s corporate bond holdings were diversified across various industry groups, with less emphasis on sectors, such as banking, that tend to fare poorly when interest rates rise. However, the fund’s holdings were primarily comprised of investment-grade credits, and its high-yield holdings were relatively small. As a result, the fund did not participate fully in the rally at the lower end of the credit-quality spectrum.
4
The fund offset some of the weakness experienced in other market sectors with positive contributions to performance from its investments in foreign currency markets. Because the U.S. dollar weakened relative to most major currencies over the reporting period, the fund posted strong returns from its investments in the euro and the currencies of other nations, such as Canada, New Zealand and Australia. The fund also held a modest position in securities that are sensitive to changes in the prices of commercial mortgage-backed securities, enabling it to participate in that sector’s relative values.
What is the fund’s current strategy?
After their strong rally, corporate bonds reached price levels we considered fully valued.Accordingly, we have reduced the fund’s exposure to corporate bonds and increased its holdings of U.S. government securities, moving toward a sector-allocation strategy that more closely approximates the composition of the Index. In addition, we have eliminated most of the fund’s foreign currency investments, locking in their gains. Finally, because of the risk that stronger economic growth may lead to higher short-term interest rates, we have continued to maintain the fund’s average duration in a range we consider shorter than average. We believe that these strategies should enable the fund to weather potential volatility as the bond market continues to adjust to a more robust economic environment.
February 17, 2004
1
| Total return includes reinvestment of dividends and any capital gains paid, and does not take into consideration the maximum initial sales charge in the case of Class A shares, or the applicable contingent deferred sales charge imposed on redemptions in the case of Class B shares. Had these charges been reflected, returns would have been lower. Past performance is no guarantee of future results. Share price, yield and investment return fluctuate such that upon redemption, fund shares may be worth more or less than their original cost.
|
2
| SOURCE: LIPPER INC. — Reflects reinvestment of dividends and, where applicable, capital gain distributions.The Merrill Lynch Corporate and Government (1-5 years) Index is an unmanaged performance benchmark including U.S. government and fixed-coupon domestic investment-grade corporate bonds with maturities greater than or equal to one year and less than five years.
|
The Fund 5
| STATEMENT OF INVESTMENTS |
| January 31, 2004 (Unaudited) |
| | Principal | | |
| Bonds and Notes—79.1% | Amount a | Value ($) | |
|
|
| |
| Airlines—.3% | | | |
| American Airlines, | | | |
| Notes, 3.857%, 2010 | 2,309,515 | 2,323,742 | |
| USAir, | | | |
| Enhanced Equipment Notes, Ser. C, 8.93%, 2009 | 1,092,319 b | 10,923 | |
| | | 2,334,665 | |
| Asset-Backed Ctfs.—Automobile Receivables—.4% | | | |
| Navistar Financial Corp. Owner Trust, | | | |
| Ser. 2001-A, Cl. B, 5.59%, 2008 | 3,007,077 | 3,081,227 | |
| Asset-Backed Ctfs.—Credit Cards—1.0% | | | |
| MBNA Master Credit Card Trust, | | | |
| Ser. 1999-H, Cl. C, 7.45%, 2006 | 8,100,000 c | 8,178,469 | |
| Asset-Backed Ctfs.—Equipment—.0% | | | |
| Aircraft Lease Portfolio Securitization 1996-1, | | | |
| Pass-Through Trust, Ctfs., | | | |
| Cl. D, 12.75%, 2006 | 3,656,077 b | 36,561 | |
| Asset-Backed Ctfs.—Home Equity Loans—1.6% | | | |
| Ameriquest Mortgage Securities, | | | |
| Ser. 2003-IA1, Cl. A4, 4.965%, 2033 | 7,000,000 | 7,000,000 | |
| Conseco Finance Securitizations: | | | |
| Ser. 2000-D, Cl. A3, 7.89%, 2018 | 898 | 905 | |
| Ser. 2000-E, Cl. A5, 8.02%, 2031 | 5,592,243 | 5,758,053 | |
| | | 12,758,958 | |
| Asset-Backed Ctfs.—Other—1.2% | | | |
| ACAS Business Loan Trust: | | | |
| Ser. 2002-1A, Cl. B, 2.6%, 2012 | 4,260,825 c,d | 4,282,555 | |
| Ser. 2002-2A, Cl. B, 2.7%, 2015 | 2,500,000 c,d | 2,500,000 | |
| Capitalsource Commercial Loan Trust, | | | |
| Ser. 2003-1A, Cl. B, 2.25%, 2012 | 1,250,000 c,d | 1,253,250 | |
| NPF XII, | | | |
| Ser. 1999-1, Cl. A, 6.36%, 2005 | 9,700,000 b,c,e | 2,087,440 | |
| | | 10,123,245 | |
| Auto Manufacturing—.7% | | | |
| DaimlerChrysler, | | | |
| Notes, 6.4%, 2006 | 5,000,000 | 5,375,560 | |
| Banking—3.1% | | | |
| Abbey National, | | | |
| Capital Notes, 7.35%, 2049 | 4,403,000 | 4,875,794 | |
6
| | Principal | | |
| Bonds and Notes (continued) | Amounta | Value ($) | |
|
|
| |
| Banking (continued) | | | |
| Deutsche Bank: | | | |
| Deposit Notes, 2.13%, 2005 | 7,500,000 d | 7,500,000 | |
| Deposit Notes, 4.85%, 2006 | 10,000,000 | 9,950,000 | |
| Northern Trust, | | | |
| Notes, 2.875%, 2006 | 2,610,000 | 2,628,729 | |
| Regions Bank Of Alabama, | | | |
| Notes, 2.9%, 2006 | 250,000 | 251,811 | |
| | | 25,206,334 | |
| Commercial Mortgage Pass-Through Ctfs.—5.6% | | | |
| Bank of America Structured Notes, | | | |
| Ser. 2002-1A, Cl. B, 5.62%, 2014 | 12,700,000 c,d | 11,547,078 | |
| COMM, | | | |
| Ser. 2000-FL2A, Cl. E, 2.09%, 2011 | 10,150,000 c,d | 10,058,862 | |
| CS First Boston Mortgage Securities, | | | |
| Ser. 1998-C1, Cl. A1A, 6.26%, 2040 | 4,503,352 | 4,704,842 | |
| Commerical Mortgage Pass-Through Ctfs., | | | |
| Ser. 2001-ZC1A, Cl. A, 6.355%, 2006 | 9,697,796 c | 10,212,991 | |
| Morgan Stanley Dean Witter Capital I, | | | |
| Ser. 2001-XLF, Cl. F, 3.04%, 2013 | 6,199,068 c,d | 6,194,072 | |
| Wachovia Bank Commercial Mortgage Trust, | | | |
| Ser. 2002-WHL, Cl.L, 4.1%, 2015 | 2,900,000 c,d | 2,763,440 | |
| | | 45,481,285 | |
| Consumer Products—.3% | | | |
| Gillette, | | | |
| Notes, 5.75%, 2005 | 2,485,000 | 2,637,832 | |
| Diversified Financial Services—10.3% | | | |
| CIT Group, | | | |
| Sr. Notes, 3.875%, 2008 | 4,300,000 f | 4,319,531 | |
| Capital One Bank, | | | |
| Notes, 4.25%, 2008 | 5,000,000 f | 5,067,430 | |
| Fondo LatinoAmericano De Reservas, | | | |
| Notes, 3%, 2006 | 5,345,000 c | 5,381,325 | |
| Ford Motor Credit, | | | |
| Notes, 1.37%, 2007 | 7,570,000 d | 7,371,287 | |
| GMAC, | | | |
| Medium-Term Notes, 2.02%, 2007 | 5,000,000 d | 5,004,760 | |
The Fund 7
STATEMENT OF INVESTMENTS (Unaudited) (continued)
| | Principal | | | |
| Bonds and Notes (continued) | Amounta | | Value ($) | |
|
| |
| |
| Diversified Financial Services (continued) | | | | |
| Meridian Funding, | | | | |
| Notes, 1.59%, 2009 | 15,000,000 c,d | | 14,997,840 | |
| Power Receivable Finance, | | | | |
| Sr. Notes, 6.29%, 2012 | 6,462,618 c | | 6,853,671 | |
| SLM, | | | | |
| Bonds, 1.07%, 2035 | 34,000,000 c,d,f | | 33,869,100 | |
| Toyota Motor Credit, | | | | |
| Medium-Term Notes, 2.8%, 2006 | 500,000 | | 509,904 | |
| | | | 83,374,848 | |
| Electric Utilities—3.0% | | | | |
| Entergy Arkansas, | | | | |
| First Mortgage, 6.125%, 2005 | 4,900,000 | | 5,146,034 | |
| Florida Power & Light, | | | | |
| First Mortgage, 6.875%, 2005 | 6,525,000 | | 7,085,263 | |
| Monongahela Power, | | | | |
| First Mortgage, 5%, 2006 | 2,950,000 | | 3,012,687 | |
| Power Contract Financing, | | | | |
| Pass-Through Ctfs., 5.2%, 2006 | 5,000,000 c | | 5,114,385 | |
| SCANA, | | | | |
| Sr. Notes, 1.62%, 2006 | 3,950,000 d | | 3,952,492 | |
| | | | 24,310,861 | |
| Entertainment—.1% | | | | |
| International Game Technology, | | | | |
| Sr. Notes, 7.875%, 2004 | 881,000 | | 895,447 | |
| Food & Beverages—.9% | | | | |
| Brown-Forman, | | | | |
| Notes, 2.125%, 2006 | 2,425,000 | | 2,421,576 | |
| Tyson Foods, | | | | |
| Notes, 7.25%, 2006 | 4,835,000 | | 5,299,764 | |
| | | | 7,721,340 | |
| Foreign Governmental—9.1% | | | | |
| Export Development Canada, | | | | |
| Notes, 2.375%, 2006 | 13,120,000 | | 13,202,276 | |
| Kingdom of Sweden, | | | | |
| Notes, 4.375%, 2005 | 7,323,000 | | 7,651,070 | |
| Province of Quebec, | | | | |
| Debs., Ser. NS, 8.625%, 2005 | 4,230,000 | | 4,507,010 | |
8
| | | Principal | | | |
| Bonds and Notes (continued) | | Amounta | | Value ($) | |
|
|
| |
| |
| Foreign Governmental (continued) | | | | | |
| Republic of Argentina, | | | | | |
| Debs., 11.25%, 2004 | | 500 b | | 110 | |
| Republic of Austria, | | | | | |
| Sr. Notes, 5.5%, 2006 | | 3,600,000 | | 3,864,600 | |
| Republic of Chile | | | | | |
| Notes, 1.52%, 2008 | | 7,090,000 d,f | | 7,066,958 | |
| Republic of Finland, | | | | | |
| Debs., 7.875%, 2004 | | 5,402,000 | | 5,578,510 | |
| Spanish Treasury, | | | | | |
| Bonds, 3.2%, 2006 | EUR | 22,785,000 | | 28,764,145 | |
| United Mexican States, | | | | | |
| Notes, 1.84%, 2009 | | 3,000,000 d | | 3,022,500 | |
| | | | | 73,657,179 | |
| Gaming & Lodging—.2% | | | | | |
| Caesars Entertainment, | | | | | |
| Sr. Notes, 7%, 2004 | | 1,400,000 | | 1,433,250 | |
| Health Care—2.0% | | | | | |
| American Home Products, | | | | | |
| Notes, 5.875%, 2004 | | 925,000 d | | 930,006 | |
| Boston Scientific, | | | | | |
| Notes, 6.625%, 2005 | | 5,300,000 | | 5,581,679 | |
| HCA: | | | | | |
| Notes, 5.25%, 2008 | | 4,000,000 f | | 4,131,188 | |
| Notes, 7.15%, 2004 | | 1,610,000 | | 1,620,149 | |
| UnitedHealth, | | | | | |
| Sr. Notes, 3.3%, 2008 | | 3,875,000 | | 3,871,075 | |
| | | | | 16,134,097 | |
| Manufacturing—.5% | | | | | |
| Tyco International, | | | | | |
| Gtd. Notes, 5.8%, 2006 | | 3,494,000 | | 3,696,495 | |
| Media—2.7% | | | | | |
| America Online, | | | | | |
| Conv. Sub. Notes, 0%, 2019 | | 6,229,000 | | 3,947,629 | |
| British Sky Broadcasting, | | | | | |
| Notes, 7.3%, 2006 | | 4,880,000 | | 5,437,496 | |
| Grupo Televisa, | | | | | |
| Sr. Notes, 8.625%, 2005 | | 4,000,000 | | 4,395,000 | |
The Fund 9
STATEMENT OF INVESTMENTS (Unaudited) (continued)
| | Principal | | | |
| Bonds and Notes (continued) | Amounta | | Value ($) | |
|
| |
| |
| Media (continued) | | | | |
| Liberty Media, | | | | |
| Notes, 3.5%, 2006 | 2,500,000 f | | 2,514,620 | |
| Media General, | | | | |
| Notes, 6.95%, 2006 | 5,000,000 | | 5,368,750 | |
| | | | 21,663,495 | |
| Mining & Metal—.6% | | | | |
| Noranda, | | | | |
| Debs., 7%, 2005 | 4,550,000 | | 4,798,271 | |
| Oil & Gas—3.7% | | | | |
| BP Capital Markets, | | | | |
| Notes, 2.75%, 2006 | 4,600,000 f | | 4,627,499 | |
| ConocoPhillips, | | | | |
| Sr. Notes, 5.9%, 2004 | 10,000,000 | | 10,092,860 | |
| Occidental Petroleum, | | | | |
| Notes, 4%, 2007 | 3,115,000 | | 3,164,058 | |
| Sempra Energy, | | | | |
| Notes, 6.925%, 2004 | 5,000,000 | | 5,107,035 | |
| Transocean Sedco Forex, | | | | |
| Notes, 6.75%, 2005 | 7,000,000 | | 7,366,674 | |
| | | | 30,358,126 | |
| Paper & Forest Products—.6% | | | | |
| Weyerhaeuser, | | | | |
| Notes, 5.5%, 2005 | 4,750,000 | | 4,943,031 | |
| Property-Casualty Insurance—3.0% | | | | |
| ACE INA, | | | | |
| Gtd. Notes, 8.2%, 2004 | 4,000,000 | | 4,138,440 | |
| ASIF Global Financing, | | | | |
| Notes, 1.42%, 2006 | 13,255,000 c,d | | 13,261,627 | |
| CNA Financial, | | | | |
| Notes, 6.5%, 2005 | 5,129,000 | | 5,318,773 | |
| Nationwide Mutual Insurance, | | | | |
| Surplus Notes, 6.5%, 2004 | 1,800,000 c | | 1,803,010 | |
| | | | 24,521,850 | |
| Real Estate Investment Trusts—2.8% | | | | |
| Highwoods, | | | | |
| Exercisable Put Option Securities, 7.19%, 2004 | 7,500,000 c | | 7,559,738 | |
| New Plan Excel Realty Trust, | | | | |
| Sr. Notes, 6.875%, 2004 | 11,575,000 | | 11,960,783 | |
10
| | Principal | | |
| Bonds and Notes (continued) | Amounta | Value ($) | |
|
|
| |
| Real Estate Investment Trusts (continued) | | | |
| Rouse, | | | |
| Notes, 8.43%, 2005 | 2,700,000 | 2,884,613 | |
| Summit Properties Partnership, | | | |
| Notes, 6.95%, 2004 | 750,000 | 766,406 | |
| | | 23,171,540 | |
| Retail—.2% | | | |
| Dillard’s, | | | |
| Notes, 6.43%, 2004 | 1,950,000 | 1,969,500 | |
| Structured Index—2.5% | | | |
| AB Svensk Exportkredit, | | | |
| GSNE-ER Indexed Notes, 0%, 2007 | 11,690,000 c,g | 11,690,000 | |
| HSBC TIGERS: | | | |
| Medium-Term Notes, 4.42%, Ser. 2003-4, 2008 | 5,000,000 c,d,h | 5,010,000 | |
| Medium-Term Notes, 6.17%, Ser. 2003-7, 2008 | 3,500,000 c,d,h | 3,512,250 | |
| | | 20,212,250 | |
| Telecommunications—2.6% | | | |
| AT&T, | | | |
| Sr. Notes, 7.25%, 2006 | 5,082,000 d | 5,651,448 | |
| British Telecommunications, | | | |
| Notes, 7.875%, 2005 | 6,500,000 d | 7,154,030 | |
| France Telecom, | | | |
| Notes, 8.45%, 2006 | 4,000,000 d | 4,434,812 | |
| SBC Communications, | | | |
| Notes, 5.75%, 2006 | 4,000,000 f | 4,285,844 | |
| | | 21,526,134 | |
| Tobacco—.6% | | | |
| Altria, | | | |
| Notes, 7%, 2005 | 4,960,000 | 5,239,843 | |
| U.S. Government—.1% | | | |
| U.S. Treasury Notes: | | | |
| 4.25%, 11/15/2013 | 740,000 l | 746,934 | |
| U.S. Government Agencies—9.5% | | | |
| Federal Home Loan Banks, | | | |
| Bonds, 1.625%, 6/15/2005 | 28,490,000 | 28,521,738 | |
| Federal National Mortgage Association, | | | |
| Notes, 7%, 7/15/2005 | 45,000,000 | 48,492,495 | |
| | | 77,014,233 | |
The Fund 11
STATEMENT OF INVESTMENTS (Unaudited) (continued)
| | Principal | | |
| Bonds and Notes (continued) | Amounta | Value ($) | |
|
|
| |
| U.S. Government Agencies/Mortgage-Backed—9.9% | | | |
| Federal Home Loan Mortgage Corp., | | | |
| 6.5%, 3/1/2032-6/1/2032 | 2,614,470 | 2,746,815 | |
| REMIC, Gtd. Multiclass Mortgage Participation Cfts.: | | | |
| Ser. 2143, Cl. CU, 5.75%, 12/15/2024 | 1,103,063 | 1,103,975 | |
| Ser. 2603, Cl. AC, 5.5%, 12/15/2008 | 714,383 | 714,267 | |
| (Interest Only Obligation): | | | |
| Ser. 1987, Cl. PI, 7%, 9/15/2012 | 429,495 i | 51,187 | |
| Ser. 1999, Cl. PW, 7%, 8/15/2026 | 364,870 i | 4,247 | |
| Ser. 2048, Cl. PJ, 7%, 4/15/2028 | 679,914 i | 96,235 | |
| Ser. 2510, Cl. PI, 5.5%, 9/15/2020 | 1,748,601 i | 21,723 | |
| Ser. 2550, Cl. IO, 5.5%, 6/15/2027 | 18,934,377 i | 1,366,825 | |
| Ser. 2615, Cl. IE, 5.5%, 9/15/2029 | 10,945,908 i | 1,734,489 | |
| Ser. 2646, Cl. IL, 5%, 8/15/2023 | 32,882,388 i | 3,681,923 | |
| Federal National Mortgage Association: | | | |
| 3.5%, 12/1/2033 | 18,377,156 d | 18,589,963 | |
| 5% | 15,000,000 j | 14,906,250 | |
| 5.759%, 2/1/2029 | 94,325 d | 97,862 | |
| REMIC, Trust, Gtd. Pass-Through Ctfs.: | | | |
| Ser. 2003-49, Cl. JE, 3%, 3/1/2031 | 2,456,207 | 2,430,877 | |
| (Interest Only Obligation): | | | |
| Ser. 2001-27, Cl. BI, 6.5%, 8/25/2029 | 41,556 i | 18 | |
| Ser. 2001-72, Cl. IA, 6%, 3/25/2030 | 547,242 i | 30,000 | |
| Ser. 2002-55, Cl. IJ, 6%, 4/25/2028 | 3,878,388 i | 109,454 | |
| Ser. 2003-7, Cl. IQ, 5.5%, 3/25/2029 | 17,465,272 i | 3,765,100 | |
| Governmnet National Mortgage Association I: | | | |
| 5.5% | 10,000,000 j | 10,212,500 | |
| 6% | 14,000,000 j | 14,603,680 | |
| 6.5%, 6/15/2032 | 1,773,632 | 1,872,832 | |
| Project Loan, | | | |
| 8%, 9/15/2008 | 773,609 | 814,223 | |
| Government National Mortgage Association II: | | | |
| 3.25%, 4/20/2030 | 1,047,715 d | 1,047,966 | |
| 7%, 12/20/2030-4/20/2031 | 144,169 | 153,370 | |
| 7.5%, 11/20/2029-12/20/2030 | 146,351 | 156,094 | |
| | | 80,311,875 | |
| Total Bonds and Notes | | | |
| (cost $654,940,249) | | 642,914,735 | |
12
| Other Investments—17.5% | Shares | | Value ($) | |
|
|
|
| |
| Registered Investment Companies: | | | | |
| Dreyfus Institutional Cash Advantage Fund | 47,461,000 | k | 47,461,000 | |
| Dreyfus Institutional Cash Advantage Plus Fund | 47,461,000 | k | 47,461,000 | |
| Dreyfus Institutional Preferred Plus Money Market Fund | 47,461,000 | k | 47,461,000 | |
| Total Other Investments | | | | | |
| (cost $ | 142,383,000) | | | | 142,383,000 | |
|
|
|
|
|
| |
| | | | Principal | | | |
| Short-Term Investments—9.4% | Amount ($) | Value ($) | |
|
|
| |
| Agency Discount Notes; | | | | | |
| Federal National Mortgage Association: | | | | |
| 1.06%, 3/03/2004 | | 25,690,000 | | 25,666,551 | |
| 1.06%, 4/13/2004 | | 33,500,000 | | 33,428,980 | |
| 1.08%, 5/05/2004 | | 17,500,000 | | 17,450,650 | |
| Total Short-Term Investments | | | | |
| (cost $ | 76,546,181) | | | | 76,546,181 | |
|
|
|
|
|
| |
| Investment of Cash Collateral | | | | |
| for Securities Loaned—3.7% | Shares | | Value ($) | |
|
|
|
| |
| Registered Investment Company; | | | | |
| Dreyfus Institutional Preferred Money Market Fund | | | | |
| (cost $ | 29,795,320) | | 29,795,320 | j | 29,795,320 | |
|
|
|
|
|
| |
| | | | | | | |
| Total Investments (cost $ | 903,664,750) | 109.7% | | 891,639,236 | |
| Liabilities, Less Cash and Receivables | (9.7%) | | (78,723,449) | |
| Net Assets | | 100.0% | | 812,915,787 | |
a Principal amount stated in U.S Dollars unless otherwise noted.
EUR—Euro
|
b
| Non-income producing—security in default.
|
c
| Securities exempt from registration under Rule 144A of the Securities Act of 1933.These securities may be resold in transactions exempt from registration, normally to qualified institutional buyers.At January 31, 2004, these securities amounted to $168,131,103 or 20.7% of net assets.
|
d
| Variable rate security—interest rate subject to periodic change.
|
e
| The value of these securities has been determined in good faith under the direction of the Board of Trustees.
|
f
| All or a portion of these securities are on loan.At January 31, 2004, the total market value of the fund’s securities on loan is $29,159,465 and the total market value of the collateral held by the fund is $29,795,320.
|
g
| Security linked to the Goldman Sachs Non Energy-Excess Return Index.
|
h
| Security linked to a portfolio of debt securities.
|
i
| Notional face amount shown.
|
j
| Purchased on a forward commitment basis.
|
k
| Investments in affiliated money market mutual funds—See Note 3(e).
|
l
| Wholly held by broker as collateral for open financial futures positions.
|
See notes to financial statements.
The Fund 13
| STATEMENT OF FINANCIAL FUTURES |
| January 31, 2004 (Unaudited) |
| | | | | | Unrealized | |
| | | | Market Value | | Appreciation | |
| | | | Covered by | | (Depreciation) | |
| | Contracts | | Contracts ($) | Expiration | at 1/31/2004 ($) | |
|
| |
|
|
| |
| Financial Futures Long | | | | | | |
| U.S. Treasury 10 Year Note | 2,177 | | 246,953,438 | March 2004 | (812,424) | |
| U.S. Treasury 30 Year Bond | 633 | | 70,480,594 | March 2004 | (50,096) | |
| Financial Futures Short | | | | | | |
| Euro Dollar | 392 | | 96,383,000 | September 2004 | (151,654) | |
| U.S. Treasury 2 Year Note | 1,360 | | 291,720,000 | March 2004 | 14,409 | |
| U.S. Treasury 5 Year Note | 1,866 | | 209,604,281 | March 2004 | (931,094) | |
| | | | | | (1,930,859) | |
See notes to financial statements.
14
| STATEMENT OF ASSETS AND LIABILITIES |
| January 31, 2004 (Unaudited) |
| | | | Cost | Value | |
|
|
|
|
| |
| Assets ($): | | | | | |
| Investments in securities—See Statement of Investments | | | |
| (including securities on loan, valued at $ | 29,159,465) | 903,664,750 | 891,639,236 | |
| Cash denominated in foreign currencies | | 12,449 | 12,164 | |
| Receivable for investment securities sold | | | 36,890,237 | |
| Dividends and interest receivable | | | 5,412,340 | |
| Receivable for shares of Common Stock subscribed | | 1,332,089 | |
| Receivable for futures variation margin—Note 4 | | | 390,396 | |
| Prepaid expenses | | | 51,583 | |
| | | | | 935,728,045 | |
|
|
|
|
| |
| Liabilities ($): | | | | | |
| Due to The Dreyfus Corporation and affiliates | | | 593,140 | |
| Cash overdraft due to custodian | | | 29,608,298 | |
| Payable for investment securities purchased | | | 57,894,244 | |
| Liability for securities on loan—Note 1(c) | | | 29,795,320 | |
| Payable for shares of Common Stock redeemed | | | 3,129,442 | |
| Net unrealized depreciation on forward | | | | |
| currency exchange contracts—Note 4 | | | 1,088,280 | |
| Payable to broker for swaps closed | | | 285,027 | |
| Unrealized depreciation on swaps—Note 4 | | | 164,009 | |
| Accrued expenses and other liabilities | | | 254,498 | |
| | | | | 122,812,258 | |
|
|
|
|
| |
| Net Assets ( | $) | | | 812,915,787 | |
|
|
|
|
| |
| Composition of Net Assets ($): | | | | |
| Paid-in capital | | | | 877,839,215 | |
| Accumulated distributions in excess of investment income—net | | (4,988,040) | |
| Accumulated net realized gain (loss) on investments | | (44,705,913) | |
| Accumulated net unrealized appreciation (depreciation) on investments | | |
| and foreign currency transactions [including ($1,930,859) net unrealized | | |
| (depreciation) on financial futures and ($164,009) net unrealized | | |
| (depreciation) on swap transactions] | | | (15,229,475) | |
|
|
|
| |
| Net Assets ( | $) | | | 812,915,787 | |
| Net Asset Value Per Share | | | | | | | | |
| | Class A | | Class B | | Class D | | Class P | |
|
| |
| |
| |
| |
| Net Assets ($) | 19,699,465 | | 13,558,254 | | 741,474,111 | | 38,183,957 | |
| Shares Outstanding | 1,724,920 | | 1,187,995 | | 64,975,029 | | 3,342,775 | |
|
| |
| |
| |
| |
| Net Asset Value Per Share ($) | 11.42 | | 11.41 | | 11.41 | | 11.42 | |
See notes to financial statements.
The Fund 15
STATEMENT OF OPERATIONS
Six Months Ended January 31, 2004 (Unaudited)
| Investment Income ($): | | | |
| Interest | | 12,314,127 | |
| Cash dividends | | 298,078 | |
| Income from securities lending | | 42,152 | |
| Total Income | | 12,654,357 | |
| Expenses: | | | |
| Management fee—Note 3(a) | | 2,153,822 | |
| Shareholder servicing costs—Note 3(c) | | 1,263,702 | |
| Custodian fees—Note 3(c) | | 105,960 | |
| Registration fees | | 57,592 | |
| Professional fees | | 44,159 | |
| Distribution fees—Note 3(b) | | 32,856 | |
| Prospectus and shareholders’ reports | | 31,853 | |
| Interest expense—Note 2 | | 3,172 | |
| Directors’ fees and expenses—Note 3(d) | | 3,031 | |
| Miscellaneous | | 19,899 | |
| Total Expenses | | 3,716,046 | |
| Investment Income—Net | | 8,938,311 | |
|
|
| |
| Realized and Unrealized Gain (Loss) on Investments—Note 4 ($): | | |
| Net realized gain (loss) on investments and foreign currency transactions | 4,689,509 | |
| Net realized gain (loss) on forward currency exchange contracts | (2,343,445) | |
| Net realized gain (loss) on financial futures | | (8,591,840) | |
| Net realized gain (loss) on swaps | | (357,646) | |
| Net Realized Gain (Loss) | | (6,603,422) | |
| Net unrealized appreciation (depreciation) on investments and | | |
| foreign currency transactions [including ($ | 1,930,859) | | |
| net unrealized (depreciation) on financial futures and | | |
| ($ | 29,848) net unrealized (depreciation) on swap transactions] | 6,423,753 | |
| Net Realized and Unrealized Gain (Loss) on Investments | (179,669) | |
| Net Increase in Net Assets Resulting from Operations | 8,758,642 | |
See notes to financial statements.
16
STATEMENT OF CHANGES IN NET ASSETS
| | Six Months Ended | | | |
| | January 31, 2004 | | Year Ended | |
| | (Unaudited) | | July 31, 2003a | |
|
| |
| |
| Operations ($): | | | | |
| Investment income—net | 8,938,311 | | 33,505,611 | |
| Net realized gain (loss) on investments | (6,603,422) | | (4,221,344) | |
| Net unrealized appreciation | | | | |
| (depreciation) on investments | 6,423,753 | | (3,643,809) | |
| Net Increase (Decrease) in Net Assets | | | | |
| Resulting from Operations | 8,758,642 | | 25,640,458 | |
|
| |
| |
| Dividends to Shareholders from ($): | | | | |
| Investment income—net: | | | | |
| Class A | (333,039) | | (203,422) | |
| Class B | (178,059) | | (118,792) | |
| Class D | (13,798,228) | | (41,586,189) | |
| Class P | (450,824) | | (272,614) | |
| Net realized gain on investments: | | | | |
| Class A | (12,332) | | — | |
| Class B | (8,115) | | — | |
| Class D | (463,197) | | — | |
| Class P | (20,775) | | — | |
| Total Dividends | (15,264,569) | | (42,181,017) | |
|
| |
| |
| Capital Stock Transactions ($): | | | | |
| Net proceeds from shares sold: | | | | |
| Class A | 6,103,093 | | 21,978,408 | |
| Class B | 3,911,372 | | 12,172,638 | |
| Class D | 142,363,813 | | 482,638,456 | |
| Class P | 28,349,680 | | 27,651,185 | |
| Dividends reinvested: | | | | |
| Class A | 301,664 | | 132,906 | |
| Class B | 148,701 | | 93,896 | |
| Class D | 11,443,484 | | 34,036,463 | |
| Class P | 344,715 | | 199,621 | |
| Cost of shares redeemed: | | | | |
| Class A | (5,123,060) | | (3,393,628) | |
| Class B | (1,759,764) | | (808,446) | |
| Class D | (256,553,587) | | (772,025,338) | |
| Class P | (10,004,936) | | (7,923,279) | |
| Increase (Decrease) in Net Assets from | | | | |
| Capital Stock Transactions | (80,474,825) | | (205,247,118) | |
| Total Increase (Decrease) in Net Assets | (86,980,752) | | (221,787,677) | |
|
| |
| |
| Net Assets ($): | | | | |
| Beginning of Period | 899,896,539 | | 1,121,684,216 | |
| End of Period | 812,915,787 | | 899,896,539 | |
| Undistributed (distributions in excess of) | | | | |
| investment income—net | (4,988,040) | | 833,799 | |
The Fund 17
STATEMENT OF CHANGES IN NET ASSETS (continued)
| | Six Months Ended | | | |
| | January 31, 2004 | | Year Ended | |
| | (Unaudited) | | July 31, 2003a | |
|
| |
| |
| Capital Share Transactions: | | | | |
| Class Ab | | | | |
| Shares sold | 530,131 | | 1,894,466 | |
| Shares issued for dividends reinvested | 26,254 | | 11,451 | |
| Shares redeemed | (445,688) | | (291,694) | |
| Net Increase (Decrease) in Shares Outstanding | 110,697 | | 1,614,223 | |
|
| |
| |
| Class Bb | | | | |
| Shares sold | 340,065 | | 1,049,644 | |
| Shares issued for dividends reinvested | 12,949 | | 8,093 | |
| Shares redeemed | (153,147) | | (69,609) | |
| Net Increase (Decrease) in Shares Outstanding | 199,867 | | 988,128 | |
|
| |
| |
| Class D | | | | |
| Shares sold | 12,384,471 | | 41,519,397 | |
| Shares issued for dividends reinvested | 996,298 | | 2,931,135 | |
| Shares redeemed | (22,322,676) | | (66,474,665) | |
| Net Increase (Decrease) in Shares Outstanding | (8,941,907) | | (22,024,133) | |
|
| |
| |
| Class P | | | | |
| Shares sold | 2,465,243 | | 2,383,149 | |
| Shares issued for dividends reinvested | 30,018 | | 17,202 | |
| Shares redeemed | (869,284) | | (683,553) | |
| Net Increase (Decrease) in Shares Outstanding | 1,625,977 | | 1,716,798 | |
a The fund commenced offering four classes of shares on November 1, 2002.The existing shares were redesignated Class D shares and the fund added Class A, Class B and Class P.
- During the period ended January 31, 2004, 1,816 Class B shares representing $20,831 were automatically converted to 1,816 Class A shares and during the period ended July 31, 2003, 461 Class B shares representing $5,343 were automatically converted to 461 Class A shares.
See notes to financial statements.
18
FINANCIAL HIGHLIGHTS
The following tables describe the performance for each share class for the fiscal periods indicated. All information (except portfolio turnover rate) reflects financial results for a single fund share.Total return shows how much your investment in the fund would have increased (or decreased) during each period, assuming you had reinvested all dividends and distributions.These figures have been derived from the fund’s financial statements.
| | | Six Months Ended | | | |
| | | January 31, 2004 | | Period Ended | |
| Class A Shares | | (Unaudited) | | July 31, 2003a | |
|
|
| |
| |
| Per Share Data ($): | | | | |
| Net asset value, beginning of period | 11.51 | | 11.59 | |
| Investment Operations: | | | | |
| Investment income—netb | .12 | | .17 | |
| Net realized and unrealized gain | | | | |
| (loss) on investments | — | | .12 | |
| Total from Investment Operations | .12 | | .29 | |
| Distributions: | | | | | |
| Dividends from investment income—net | (.20) | | (.37) | |
| Dividends from net realized gain on investments | (.01) | | — | |
| Total Distributions | | (.21) | | (.37) | |
| Net asset value, end of period | 11.42 | | 11.51 | |
|
| |
| |
| Total Return (%) | c,d | .97 | | 2.52 | |
|
|
| |
| |
| Ratios/Supplemental Data (%): | | | | |
| Ratio of expenses to average net assetse | .90 | | .89 | |
| Ratio of net investment income | | | | |
| to average net assetse | 2.00 | | 2.09 | |
| Portfolio Turnover Rated | 357.56f | | 460.89 | |
|
| |
| |
| Net Assets, end of period ($ x 1,000) | 19,699 | | 18,578 | |
a From November 1, 2002 (commencement of initial offering) to July 31, 2003.
b
| Based on average shares outstanding at each month end.
|
c
| Exclusive of sales charge.
|
d
| Not annualized.
|
e
| Annualized.
|
f
| The portfolio turnover rate excluding mortgage dollar roll transactions was 339.22%.
|
See notes to financial statements.
The Fund 19
FINANCIAL HIGHLIGHTS (continued)
| | | Six Months Ended | | | |
| | | January 31, 2004 | | Period Ended | |
| Class B Shares | | (Unaudited) | | July 31, 2003a | |
|
|
| |
| |
| Per Share Data ($): | | | | |
| Net asset value, beginning of period | 11.50 | | 11.59 | |
| Investment Operations: | | | | |
| Investment income—netb | .08 | | .14 | |
| Net realized and unrealized gain | | | | |
| (loss) on investments | — | | .10 | |
| Total from Investment Operations | .08 | | .24 | |
| Distributions: | | | | | |
| Dividends from investment income—net | (.16) | | (.33) | |
| Dividends from net realized gain on investments | (.01) | | — | |
| Total Distributions | | (.17) | | (.33) | |
| Net asset value, end of period | 11.41 | | 11.50 | |
|
| |
| |
| Total Return (%) | c,d | .65 | | 2.11 | |
|
|
| |
| |
| Ratios/Supplemental Data (%): | | | | |
| Ratio of expenses to average net assetse | 1.56 | | 1.43 | |
| Ratio of net investment income | | | | |
| to average net assetse | 1.33 | | 1.67 | |
| Portfolio Turnover Rated | 357.56f | | 460.89 | |
|
| |
| |
| Net Assets, end of period ($ x 1,000) | 13,558 | | 11,367 | |
a From November 1, 2002 (commencement of initial offering) to July 31, 2003.
b
| Based on average shares outstanding at each month end.
|
c
| Exclusive of sales charge.
|
d
| Not annualized.
|
e
| Annualized.
|
f
| The portfolio turnover rate excluding mortgage dollar roll transactions was 339.22%.
|
See notes to financial statements.
20
| | Six Months Ended | | | | | | | | | | | |
| | January 31, 2004 | | | | Year Ended July 31, | | | | | |
| | | | | |
| | | | | |
| Class D Shares | (Unaudited) | | 2003a | | 2002b | | 2001 | | 2000 | | 1999 | |
|
| |
| |
| |
| |
| |
| |
| Per Share Data ($): | | | | | | | | | | | | |
| Net asset value, | | | | | | | | | | | | |
| beginning of period | 11.50 | | 11.69 | | 12.19 | | 11.70 | | 11.63 | | 12.12 | |
| Investment Operations: | | | | | | | | | | | | |
| Investment income—net | .12c | | .40c | | .64c | | .77 | | .71 | | .76 | |
| Net realized and unrealized | | | | | | | | | | | | |
| gain (loss) on investments | — | | (.09) | | (.47) | | .50 | | .07 | | (.47) | |
| Total from Investment Operations | .12 | | .31 | | .17 | | 1.27 | | .78 | | .29 | |
| Distributions: | | | | | | | | | | | | |
| Dividends from investment | | | | | | | | | | | | |
| income—net | (.20) | | (.50) | | (.67) | | (.78) | | (.71) | | (.78) | |
| Dividends from net realized | | | | | | | | | | | | |
| gain on investments | (.01) | | — | | — | | — | | — | | — | |
| Total Distributions | (.21) | | (.50) | | (.67) | | (.78) | | (.71) | | (.78) | |
| Net asset value, end of period | 11.41 | | 11.50 | | 11.69 | | 12.19 | | 11.70 | | 11.63 | |
|
| |
| |
| |
| |
| |
| |
| Total Return (%) | 1.01d | | 2.69 | | 1.46 | | 11.17 | | 7.50 | | 2.52 | |
|
| |
| |
| |
| |
| |
| |
| Ratios/Supplemental Data (%): | | | | | | | | | | | | |
| Ratio of expenses to | | | | | | | | | | | | |
| average net assets | .85e | | .88 | | .80 | | .84 | | .84 | | .87 | |
| Ratio of net investment income | | | | | | | | | | | | |
| to average net assets | 2.10e | | 3.45 | | 5.31 | | 6.46 | | 6.64 | | 6.54 | |
| Portfolio Turnover Rate | 357.56d,f | | 460.89 | | 220.23 | | 322.69 | | 272.46 | | 204.98 | |
|
| |
| |
| |
| |
| |
| |
| Net Assets, end of period | | | | | | | | | | | | |
| ($ x 1,000) | 741,474 | | 850,189 | | 1,121,684 | | 806,545 | | 428,093 | | 358,444 | |
a The fund commenced offering four classes of shares on November 1,2002.The existing shares were redesignated Class D shares.
b
| As required, effective August 1, 2001, the fund has adopted the provisions of the AICPA Audit and Accounting Guide for Investment Companies and began amortizing discount or premium on fixed income securities on a scientific basis and including paydown gains and losses in interest income.The effect of this change for the period ended July 31, 2002 was to decrease net investment income per share by $.04, increase net realized and unealized gain (loss) on investments per share by $.04 and decrease the ratio of net investment income to average net assets from 5.62% to 5.31%. Per share data and ratios/supplemental data for periods prior to August 1, 2001 have not been restated to reflect these changes in presentation.
|
c
| Based on average shares outstanding at each month end.
|
d
| Not annualized.
|
e
| Annualized.
|
f
| The portfolio turnover rate excluding mortgage dollar roll transactions was 339.22%.
|
See notes to financial statements.
The Fund 21
FINANCIAL HIGHLIGHTS (continued)
| | Six Months Ended | | | |
| | January 31, 2004 | | Period Ended | |
| Class P Shares | (Unaudited) | | July 31, 2003a | |
|
| |
| |
| Per Share Data ($): | | | | |
| Net asset value, beginning of period | 11.51 | | 11.59 | |
| Investment Operations: | | | | |
| Investment income—netb | .10 | | .20 | |
| Net realized and unrealized gain | | | | |
| (loss) on investments | .03 | | .09 | |
| Total from Investment Operations | .13 | | .29 | |
| Distributions: | | | | |
| Dividends from investment income—net | (.21) | | (.37) | |
| Dividends from net realized gain on investments | (.01) | | — | |
| Total Distributions | (.22) | | (.37) | |
| Net asset value, end of period | 11.42 | | 11.51 | |
|
| |
| |
| Total Return (%)c | 1.07 | | 2.53 | |
|
| |
| |
| Ratios/Supplemental Data (%): | | | | |
| Ratio of expenses to average net assetsd | .86 | | .85 | |
| Ratio of net investment income | | | | |
| to average net assetsd | 1.77 | | 2.33 | |
| Portfolio Turnover Ratec | 357.56e | | 460.89 | |
|
| |
| |
| Net Assets, end of period ($ x 1,000) | 38,184 | | 19,763 | |
a From November 1, 2002 (commencement of initial offering) to July 31, 2003.
b
| Based on average shares outstanding at each month end.
|
c
| Not annualized.
|
d
| Annualized.
|
e
| The portfolio turnover rate excluding mortgage dollar roll transactions was 339.22%.
|
See notes to financial statements.
22
NOTES TO FINANCIAL STATEMENTS (Unaudited)
NOTE 1—Significant Accounting Policies:
Dreyfus Premier Short Term Income Fund (the “fund”) is a separate non-diversified series of Dreyfus Investment Grade Funds, Inc. (the “Company”) which is registered under the Investment Company Act of 1940, as amended (the “Act”), as an open-end management investment company and operates as a series company currently offering five series, including the fund. The fund’s investment objective is to seek to maximize total return, consisting of capital appreciation and current income. The Dreyfus Corporation (the “Manager”) serves as the fund’s investment adviser. The Manager is a wholly-owned subsidiary of Mellon Bank, N.A. (“Mellon”), which is a wholly-owned subsidiary of Mellon Financial Corporation.
Dreyfus Service Corporation (the “Distributor”), a wholly-owned subsidiary of the Manager, is the distributor of the fund’s shares. The fund is authorized to issue 800 million shares of $.001 par value Common Stock.The fund currently offers four classes of shares: Class A (100 million shares authorized), Class B (100 million shares authorized), Class D (500 million shares authorized) and Class P (100 million shares authorized). Class A shares are subject to a sales charge imposed at the time of purchase, Class B shares are subject to a contingent deferred sales charge (“CDSC”) imposed on Class B share redemptions made within six years of purchase and automatically convert to Class A shares after six years. Class D and Class P shares are sold at net asset value per share only to institutional investors. Class A shares purchased at net asset value (an investment of $250,000 or more) will have a CDSC imposed on redemptions made within eighteen months of purchase. Other differences between the classes include the services offered to and the expenses borne by each class and certain voting rights. Income, expenses (other than expenses attributable to a specific class), and realized and unrealized gains or losses on investments are allocated to each class of shares based on its relative net assets.
The Company accounts separately for the assets, liabilities and operations of each series. Expenses directly attributable to each series are charged to that series’ operations; expenses which are applicable to all series are allocated among them on a pro rata basis.
The Fund 23
NOTES TO FINANCIAL STATEMENTS (Unaudited) (continued)
The fund’s financial statements are prepared in accordance with accounting principles generally accepted in the United States, which may require the use of management estimates and assumptions.Actual results could differ from those estimates.
(a) Portfolio valuation: Investments in securities (excluding short-term investments, other than U.S.Treasury Bills, financial futures, options and swap transactions) are valued each business day by an independent pricing service (“Service”) approved by the Board of Directors. Investments for which quoted bid prices are readily available and are representative of the bid side of the market in the judgment of the Service are valued at the mean between the quoted bid prices (as obtained by the Service from dealers in such securities) and asked prices (as calculated by the Service based upon its evaluation of the market for such securities). Other investments (which constitute a majority of the portfolio securities) are carried at fair value as determined by the Service, based on methods which include consideration of: yields or prices of securities of comparable quality, coupon, maturity and type; indications as to values from dealers; and general market conditions. Securities for which there are no such valuations are valued at fair value as determined in good faith under the direction of the Board of Directors. Short-term investments, excluding U.S.Treasury Bills, are carried at amortized cost, which approximates value. Financial futures, and options, which are traded on an exchange, are valued at the last sales price on the securities exchange on which such securities are primarily traded or at the last sales price on the national securities market on each business day. Options traded over-the-counter are priced at the mean between the bid prices and asked prices. Investments denominated in foreign currencies are translated to U.S. dollars at the prevailing rates of exchange. Swap transactions are valued based on future cash flows and other factors, such as interest rates and underlying securities.
(b) Foreign currency transactions: The fund does not isolate that portion of the results of operations resulting from changes in foreign exchange rates on investments from the fluctuations arising from changes in market prices of securities held. Such fluctuations are included with the net realized and unrealized gain or loss from investments.
24
Net realized foreign exchange gains or losses arise from sales and maturities of short-term securities, sales of foreign currencies, currency gains or losses realized on securities transactions and the difference between the amounts of dividends, interest, and foreign withholding taxes recorded on the fund’s books and the U.S. dollar equivalent of the amounts actually received or paid. Net unrealized foreign exchange gains and losses arise from changes in the value of assets and liabilities other than investments in securities, resulting from changes in exchange rates. Such gains and losses are included with net realized and unrealized gain or loss on investments.
(c) Securities transactions and investment income: Securities transactions are recorded on a trade date basis. Realized gain and loss from securities transactions are recorded on the identified cost basis. Dividend income is recognized on the ex-dividend date and interest income, including, where applicable, amortization of discount and premium on investments, is recognized on the accrual basis. Under the terms of the custody agreement, the fund receives net earnings credits based on available cash balances left on deposit.
The fund may lend securities to qualified institutions. At origination, all loans are secured by cash collateral of at least 102% of the value of U.S. securities loaned and 105% of the value of foreign securities loaned. Collateral equivalent to at least 100% of the market value of securities on loan will be maintained at all times. Cash collateral is invested in certain other money market mutual funds managed by the Manager as shown in the fund’s Statement of Investments. The fund will be entitled to receive all income on securities loaned, in addition to income earned as a result of the lending transaction.Although each security loaned is fully collateralized, the fund would bear the risk of delay in recovery of, or loss of rights in, the securities loaned should a borrower fail to return the securities in a timely manner.
(d) Dividends to shareholders: It is the policy of the fund to declare dividends daily from investment income-net. Such dividends are paid monthly. Dividends from net realized capital gain, if any, are normally
The Fund 25
NOTES TO FINANCIAL STATEMENTS (Unaudited) (continued)
declared and paid annually, but the fund may make distributions on a more frequent basis to comply with the distribution requirements of the Internal Revenue Code of 1986, as amended (the “Code”).To the extent that net realized capital gain can be offset by capital loss carryovers, it is the policy of the fund not to distribute such gain. Income and capital gain distributions are determined in accordance with income tax regulations, which may differ from accounting principles generally accepted in the United States.
(e) Federal income taxes: It is the policy of the fund to continue to qualify as a regulated investment company, if such qualification is in the best interests of its shareholders, by complying with the applicable provisions of the Code, and to make distributions of taxable income sufficient to relieve it from substantially all federal income and excise taxes.
The fund has an unused capital loss carryover of $36,488,131 available for federal income tax purposes to be applied against future net securities profits, if any, realized subsequent to July 31, 2003. If not applied, $1,643,654 of the carryover expires in fiscal 2004, $1,314,223 expires in fiscal 2005, $1,818,379 expires in fiscal 2007, $5,887,866 expires in fiscal 2008, $4,403,293 expires in fiscal 2010 and $21,420,716 expires in fiscal 2011.
The tax character of distributions paid to shareholders during the fiscal year ended July 31, 2003 was as follows: ordinary income $42,181,017. The tax character of current year distributions will be determined at the end of the current fiscal year.
(f) Indemnification: The fund enters into contracts that contain a variety of indemnifications. The fund’s maximum exposure under these arrangements is unknown.The fund does not anticipate recognizing any loss related to these arrangements.
NOTE 2—Bank Lines of Credit:
The fund may borrow up to $10 million for leveraging purposes under a short-term unsecured line of credit and participates with other Dreyfus-managed funds in a $100 million unsecured line of credit pri-
26
marily to be utilized for temporary or emergency purposes, including the financing of redemptions. Interest is charged to the fund based on prevailing market rates in effect at the time of borrowings.
The average daily amount of borrowings outstanding under the leveraging arrangement during the period ended January 31, 2004 was approximately $434,800, with a relative weighted average annualized interest of 1.45%.
NOTE 3—Management Fee and Other Transactions With Affiliates:
(a) Pursuant to a management agreement with the Manager, the management fee is computed at the annual rate of .50 of 1% of the value of the fund’s average daily net assets and is payable monthly.
During the period ended January 31, 2004, the Distributor retained $11,218 from commissions earned on sales of the fund’s Class A shares and $20,827 from contingent deferred sales charges on redemptions of the fund’s Class B shares.
(b) Under the Distribution Plan (the “Plan”) adopted pursuant to Rule 12b-1 under the Act, Class B shares pay the Distributor for distributing their shares at an annual rate of .50 of 1% of the value of the average daily net assets of Class B shares. During the period ended January 31, 2004, Class B shares were charged $32,856, pursuant to the Plan.
(c) Under the Shareholder Services Plan, Class A, Class B, Class D and Class P shares pay the Distributor at an annual rate of .25 of 1% of the value of the average daily net assets of Class A, Class B and Class P shares and .20 of 1% of the value of the average daily net assets of Class D shares, for the provision of certain services. The services provided may include personal services relating to shareholder accounts, such as answering shareholder inquiries regarding Class A, Class B, Class D and Class P shares and providing reports and other information, and services related to the maintenance of shareholder accounts. The Distributor may make payments to Service Agents (a securities dealer, financial institution or other industry professional) in respect of these
The Fund 27
NOTES TO FINANCIAL STATEMENTS (Unaudited) (continued)
services.The Distributor determines the amounts to be paid to Service Agents. During the period ended January 31, 2004, Class A, Class B, Class D and Class P shares were charged, $24,909, $16,428, $801,054 and $34,256, respectively, pursuant to the Shareholder Services Plan.
The fund compensates Dreyfus Transfer, Inc., a wholly-owned subsidiary of the Manager, under a transfer agency agreement for providing personnel and facilities to perform transfer agency services for the fund. During the period ended January 31, 2004, the fund was charged $272,534 pursuant to the transfer agency agreement.
The fund compensates Mellon under a custody agreement for providing custodial services for the fund. During the period ended January 31, 2004, the fund was charged $105,960 pursuant to the custody agreement.
(d) Each Board member also serves as a Board member of other funds within the Dreyfus complex. Annual retainer fees and attendance fees are allocated to each fund based on net assets.
(e) Pursuant to an exemptive order from the Securities and Exchange Commission, the fund may invest its available cash balances in affiliated money market mutual funds as shown in the fund’s Statement of Investments. Management fees are not charged to these money market mutual funds. During the period ended January 31, 2004, the fund derived $298,078 in income from these investments, which is included in dividend income in the fund’s Statement of Operations.
NOTE 4—Securities Transactions:
The aggregate amount of purchases and sales (including paydowns) of investment securities, excluding short-term securities, forward currency exchange contracts, financial futures, options transactions and swap transactions, during the period ended January 31, 2004, amounted to $2,884,410,953 and $3,130,448,312, respectively, of which $148,007,311 in purchases and $148,528,254 in sales were from mortgage dollar roll transactions.
28
The fund may invest in financial futures contracts in order to gain exposure to or protect against changes in the market. The fund is exposed to market risk as a result of changes in the value of the underlying financial instruments. Investments in financial futures require the fund to “mark to market” on a daily basis, which reflects the change in market value of the contracts at the close of each day’s trading. Accordingly, variation margin payments are received or made to reflect daily unrealized gains and losses. When the contracts are closed, the fund recognizes a realized gain or loss.These investments require initial margin deposits with a custodian, which consist of cash or cash equivalents. The amount of these deposits is determined by the exchange or Board of Trade on which the contract is traded and is subject to change. Contracts open at January 31, 2004, are set forth in the Statement of Financial Futures.
The fund enters into forward currency exchange contracts in order to hedge its exposure to changes in foreign currency exchange rates on its foreign portfolio holdings and to settle foreign currency transac-tions.When executing forward currency exchange contracts, the fund is obligated to buy or sell a foreign currency at a specified rate on a certain date in the future. With respect to sales of forward currency exchange contracts, the fund would incur a loss if the value of the contract increases between the date the forward contract is opened and the date the forward contract is closed.The fund realizes a gain if the value of the contract decreases between those dates. With respect to purchases of forward currency exchange contracts, the fund would incur a loss if the value of the contract decreases between the date the forward contract is opened and the date the forward contract is closed. The fund realizes a gain if the value of the contract increases between those dates. The fund is also exposed to credit risk associated with counter party nonperformance on these forward currency exchange
The Fund 29
NOTES TO FINANCIAL STATEMENTS (Unaudited) (continued)
contracts which is typically limited to the unrealized gain on each open contract. The following summarizes open forward currency exchange contracts at January 31, 2004:
| | Foreign | | | | | | | |
| Forward Currency | Currency | | | | | | Unrealized | |
| Exchange Contracts | Amounts | | Proceeds ($) | | Value ($) | | (Depreciation) ($) | |
|
| |
| |
| |
| |
| Sales; | | | | | | | | |
| Euro, | | | | | | | | |
| expiring 3/3/2004 | 12,000,000 | | 14,364,960 | | 14,954,400 | | (589,440) | |
| Euro, | | | | | | | | |
| expiring 3/4/2004 | 12,000,000 | | 14,454,360 | | 14,953,200 | | (498,840) | |
| Total | | | | | | | (1,088,280) | |
The fund may enter into swap agreements to exchange the interest rate on, or return generated by, one nominal instrument for the return generated by another nominal instrument.
Credit default swaps involve commitments to pay a fixed rate in exchange for payment if a credit event affecting a third party (the referenced company) occurs. Credit events may include a failure to pay interest or principal, bankruptcy, or restructuring. Net periodic interest payments to be received or paid are accrued daily and are recorded in the Statement of Operations as an adjustment to interest income Credit default swaps are marked-to-market daily and the change, if any is recorded as unrealized appreciation or depreciation in the Statement of Operations. The following summarizes open credit default swaps entered into by the fund at January 31, 2004:
30
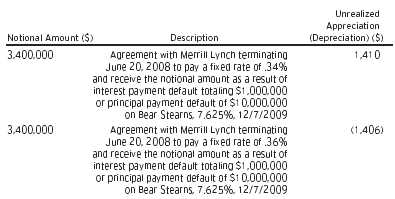
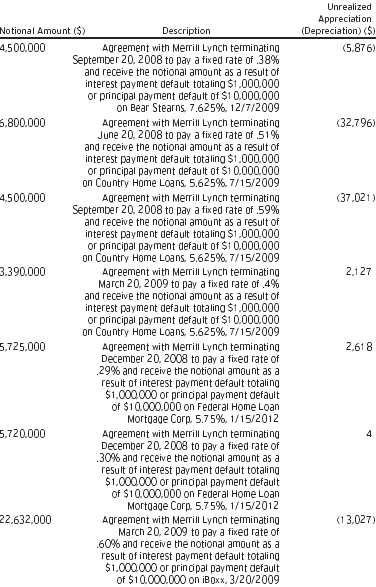
The Fund 31
NOTES TO FINANCIAL STATEMENTS (Unaudited) (continued)
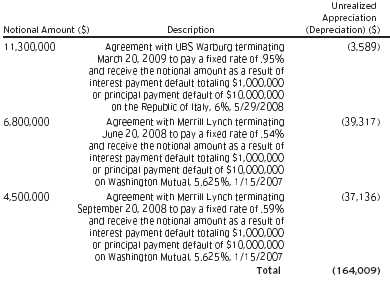
Realized gains or losses on maturity or termination of swaps are presented in the Statement of Operations. Risks may arise upon entering into these agreements from the potential inability of the counterparties to meet the terms of the agreement and are generally limited to the amount of net payments to be received, if any, at the date of default.
At January 31, 2004, accumulated net unrealized depreciation on investments was $12,025,514, consisting of $5,947,985 gross unrealized appreciation and $17,973,499 gross unrealized depreciation.
At January 31, 2004, the cost of investments for federal income tax purposes was substantially the same as the cost for financial reporting purposes (see the Statement of Investments).
32
NOTE 5—Legal Matters:
Two class actions have been filed against Mellon Financial and Mellon Bank, N.A., and Dreyfus and Founders Asset Management LLC (the “Investment Advisers”), and the directors of all or substantially all of the Dreyfus Funds, alleging that the Investment Advisers improperly used assets of the Dreyfus Funds, in the form of directed brokerage commissions and 12b-1 fees, to pay brokers to promote sales of Dreyfus Funds, and that the use of fund assets to make these payments was not properly disclosed to investors.The complaints further allege that the directors breached their fiduciary duties to fund shareholders under the Investment Company Act of 1940 and at common law.The complaints seek unspecified compensatory and punitive damages, rescission of the funds’ contracts with the Investment Advisers, an accounting of all fees paid, and an award of attorneys’ fees and litigation expenses. Dreyfus and the funds believe the allegations to be totally without merit and will defend the actions vigorously.
Additional lawsuits arising out of these circumstances and presenting similar allegations and requests for relief may be filed against the defendants in the future. Neither Dreyfus nor the funds believe that any of the pending actions will have a material adverse affect on the funds or Dreyfus’ ability to perform its contract with the funds.
The Fund 33
For More Information
| Dreyfus Premier |
| Short Term Income Fund |
| 200 Park Avenue |
| New York, NY 10166 |
| |
| Manager |
| The Dreyfus Corporation |
| 200 Park Avenue |
| New York, NY 10166 |
|
| |
| Custodian |
| Mellon Bank, N.A. |
| One Mellon Bank Center |
| Pittsburgh, PA 15258 |
| |
| Transfer Agent & |
| Dividend Disbursing Agent |
| Dreyfus Transfer, Inc. |
| 200 Park Avenue |
| New York, NY 10166 |
| |
| Distributor |
| Dreyfus Service Corporation |
| 200 Park Avenue |
| New York, NY 10166 |
To obtain information:
| By telephone |
| Call your financial |
| representative or |
| 1-800-554-4611 |
| By mail Write to: |
| The Dreyfus Premier |
| Family of Funds |
| 144 Glenn Curtiss Boulevard |
| Uniondale, NY 11556-0144 |
A description of the policies and procedures that the fund uses to determine how to vote proxies relating to portfolio securities is available, without charge, by calling the telephone number listed above, or by visiting the SEC’s website at http://www.sec.gov
© 2004 Dreyfus Service Corporation 0083SA0104
| Dreyfus |
| Intermediate |
| Term Income Fund |
The views expressed in this report reflect those of the portfolio manager only through the end of the period covered and do not necessarily represent the views of Dreyfus or any other person in the Dreyfus organization. Any such views are subject to change at any time based upon market or other conditions and Dreyfus disclaims any responsibility to update such views.These views may not be relied on as investment advice and, because investment decisions for a Dreyfus fund are based on numerous factors, may not be relied on as an indication of trading intent on behalf of any Dreyfus fund.
Not FDIC-Insured • Not Bank-Guaranteed • May Lose Value
Contents
T H E F U N D
2
| Letter from the Chairman
|
3
| Discussion of Fund Performance
|
6
| Statement of Investments
|
15
| Statement of Financial Futures
|
16
| Statement of Options Written
|
17
| Statement of Assets and Liabilities
|
18
| Statement of Operations
|
19
| Statement of Changes in Net Assets
|
21
| Financial Highlights
|
23
| Notes to Financial Statements
|
F O R M O R E I N F O R M AT I O N
|
Back Cover
|
| Dreyfus |
| Intermediate |
| Term Income Fund |
The Fund

LETTER FROM THE CHAIRMAN
Dear Shareholder:
This semiannual report for Dreyfus Intermediate Term Income Fund covers the six-month period from August 1, 2003, through January 31, 2004. Inside, you’ll find valuable information about how the fund was managed during the reporting period, including a discussion with Gerald E. Thunelius, portfolio manager and Director of the Dreyfus Taxable Fixed Income Team that manages the fund.
The bond market produced mixed results during the reporting period as investors adjusted to a stronger economic environment.As the U.S. economy gathered momentum, the more interest-rate-sensitive areas of the bond market began to retreat, giving back some of the gains achieved during the previous economic downturn. On the other hand, the bond market’s more credit-sensitive areas generally benefited from the stronger economy, producing more robust gains for corporate bonds.
While recent economic developments suggest to us that interest rates are more likely to rise in 2004 than to fall further, we continue to believe that bonds deserve a prominent place in most investors’ portfolios. As always, we urge you to speak regularly with your financial advisor, who may be in the best position to suggest the Dreyfus funds designed to meet your current needs, future goals and tolerance for risk.
Thank you for your continued confidence and support.
Sincerely,

| Stephen E. Canter |
| Chairman and Chief Executive Officer |
| The Dreyfus Corporation |
| February 17, 2004 |
2

DISCUSSION OF FUND PERFORMANCE
Gerald E. Thunelius, Senior Portfolio Manager Dreyfus Taxable Fixed Income Team
How did Dreyfus Intermediate Term Income Fund perform relative to its benchmark?
For the six-month period ended January 31, 2004, the fund’s Investor shares achieved a total return of 4.60%, and the fund’s Institutional shares achieved a total return of 4.76%.1 In comparison, the fund’s benchmark, the Lehman Brothers U.S. Aggregate Index, achieved a total return of 4.49% for the same period.2
After three years of above-average returns, the bond market’s performance moderated during the reporting period while the economy strengthened.The fund produced higher returns than its benchmark, primarily because of a relatively strong performance among its holdings of domestic investment-grade and high-yield corporate bonds.
What is the fund’s investment approach?
The fund seeks to maximize total returns consisting of capital appreciation and current income.At least 80% of the fund must be invested in investment-grade bonds, including U.S. government bonds and notes, corporate bonds, convertible securities, preferred stocks, asset-backed securities, mortgage-related securities and inflation-indexed bonds. Up to 20% of the fund may be invested in securities rated below investment grade, and up to 30% in foreign bonds.
When choosing investments for the fund, we evaluate four primary factors:
- The direction in which interest rates are likely to move under prevailing economic conditions. If interest rates appear to be rising, we generally reduce the fund’s average duration to capture higher-yielding securities as they become available. If interest rates appear to be declining, we may increase the fund’s average duration to lock in prevailing yields.
The Fund 3
DISCUSSION OF FUND PERFORMANCE (continued)
- The difference in yields — or spreads — between fixed-income securities of varying maturities.
- The mix of security types within the fund, including relative exposure to government securities, corporate securities and high-yield bonds.
- Credit characteristics of individual securities, including the financial health of the issuer and the callability of the security.
What other factors influenced the fund’s performance?
As the U.S. economy shifted from general weakness earlier in 2003 to a more robust growth rate, investors spent much of the reporting period adjusting to a new economic climate. In the stronger economic environment — including a robust 8.2% annualized growth rate for the third quarter of 2003 — corporate bond prices continued to rise through the end of the year as investors looked forward to better business conditions. Gains were particularly robust for lower-rated corporate securities, including high-yield bonds.
Because the fund emphasized corporate securities, it benefited from the sector’s overall strength during the reporting period. In addition, the fund’s holdings included both investment-grade and high-yield securities enabling the fund to participate more strongly in the rally at the lower end of the credit-rating spectrum relative to its benchmark. The fund’s corporate bond holdings were diversified across various industry groups, with less emphasis on sectors, such as banking, that tend to fare poorly when interest rates rise.
As might be expected, stronger economic growth and rising inflation concerns proved to be harmful to the prices of U.S. government securities, which tend to be more sensitive than corporate securities to changes in interest rates. We maintained relatively light exposure to U.S. Treasury and agency securities, and overall lowered interest-rate sensitivity in other holdings during the sharp market decline that occurred in July 2003, just before the start of the reporting period, and early August, after the reporting period had begun. A portion of the fund’s U.S. Treasury holdings were Treasury Inflation Protected
4
Securities (TIPS), which also helped cushion the adverse effects of a stronger economy early in the reporting period. In addition, we set the fund’s average duration in a range that was shorter than average, helping to reduce its sensitivity to a potential rise in interest rates.
Finally, the fund offset some of the weakness experienced in other market sectors with investments in foreign currency markets. Because the U.S. dollar weakened relative to most major currencies over the reporting period, the fund posted strong returns from its investments in the euro and the currencies of other nations, such as Canada, New Zealand and Australia.
What is the fund’s current strategy?
After their strong rally, corporate bonds reached price levels we considered fully valued.Accordingly, we have reduced the fund’s exposure to investment-grade and high-yield corporate bonds and increased its holdings of U.S. government securities, moving toward a sector-allocation strategy that more closely approximates the composition of the Lehman Brothers U.S. Aggregate Index. In addition, we have eliminated the fund’s holdings of TIPS and most of the foreign currencies, locking in their gains. Finally, because of the risk that stronger economic growth may lead to higher short-term interest rates, we have continued to maintain the fund’s average duration in a range we consider shorter than average. We believe that these strategies should enable the fund to potentially weather volatility as the bond market continues to adjust to a more robust economic environment.
February 17, 2004
1
| Total return includes reinvestment of dividends and any capital gains paid. Past performance is no guarantee of future results. Share price, yield and investment return fluctuate such that upon redemption, fund shares may be worth more or less than their original cost. Return figures provided reflect the absorption of fund expenses by The Dreyfus Corporation pursuant to an undertaking in effect that may be extended, terminated or modified at any time. Had these expenses not been absorbed, the fund's returns would have been lower.
|
2
| SOURCE: LIPPER INC. — Reflects reinvestment of dividends and, where applicable, capital gain distributions.The Lehman Brothers U.S.Aggregate Bond Index is a widely accepted, unmanaged total return index of corporate, U.S. government and U.S. government agency debt instruments, mortgage-backed securities and asset-backed securities with an average maturity of 1-10 years.
|
The Fund 5
| STATEMENT OF INVESTMENTS |
| January 31, 2004 (Unaudited) |
| | Principal | | | |
| Bonds and Notes—104.7% | Amount a | | Value ($) | |
|
| |
| |
| Airlines—.5% | | | | |
| American Airlines, | | | | |
| Pass-Through Ctfs., | | | | |
| Ser. 1999-1, 7.024%, 2009 | 1,413,000 | | 1,444,411 | |
| Continental Airlines, | | | | |
| Pass-Through Ctfs., Ser. 1998-1, Cl. A, 6.648%, 2017 | 1,300,257 | | 1,297,358 | |
| Delta Air Lines, | | | | |
| Pass Through Ctfs., Ser. 2001-1, 7.111%, 2011 | 1,408,000 | | 1,442,168 | |
| USAir, | | | | |
| Enhanced Equipment Notes, Ser. C, 8.93%, 2009 | 429,622 b | | 4,296 | |
| | | | 4,188,233 | |
| Asset-Backed Ctfs./Credit Cards—.7% | | | | |
| MBNA Master Credit Card Note Trust, | | | | |
| Ser. 2002-C1, Cl. C1, 6.8%, 2014 | 5,268,000 | | 5,818,809 | |
| Asset-Backed Ctfs./Equipment—.0% | | | | |
| Pegasus Aviation Lease Securitization, | | | | |
| Ser. 2001-1, Cl. A1, 1.725%, 2015 | 210,157 c,d | | 116,472 | |
| Asset-Backed Ctfs./Home Equity Loans—1.0% | | | | |
| Conseco Finance Securitizations: | | | | |
| Ser. 2000-B, Cl. AF5, 8.15%, 2031 | 4,750,000 | | 4,882,408 | |
| Ser. 2000-D, Cl. A3, 7.89%, 2018 | 304 | | 306 | |
| Ser. 2000-E, Cl. A5, 8.02%, 2031 | 2,306,800 | | 2,375,197 | |
| The Money Store Home Equity Trust, | | | | |
| Ser. 1998-B, Cl. AF8, 6.11%, 2010 | 135,418 | | 138,393 | |
| | | | 7,396,304 | |
| Banking—2.0% | | | | |
| Deutsche Bank, | | | | |
| Deposit Notes, 4.85%, 2006 | 10,000,000 d | | 9,950,000 | |
| Dresdner Funding Trust I, | | | | |
| Bonds, 8.151%, 2031 | 2,435,000 c | | 2,912,462 | |
| State Street Institutional Capital, | | | | |
| Capital Sec., Ser. A, 7.94%, 2026 | 2,888,000 c | | 3,335,906 | |
| | | | 16,198,368 | |
| Commercial Mortgage Pass-Through Ctfs.—4.2% | | | | |
| CS First Boston Mortgage Securities: | | | | |
| Ser. 1998-C1, Cl. A1A, 6.26%, 2040 | 883,991 | | 923,543 | |
| Ser. 1998-C1, Cl. C, 6.78%, 2040 | 3,877,000 | | 4,276,696 | |
6
| | Principal | | | |
| Bonds and Notes (continued) | Amount a | | Value ($) | |
|
| |
| |
| Commercial Mortgage Pass-Through Ctfs. (continued) | | | | |
| Chase Commerical Mortgage Securities, | | | | |
| Ser. 2001-245, Cl. A1, 6.173%, 2016 | 7,583,955 c,d | | 8,138,342 | |
| GS Mortgage Securities II: | | | | |
| Ser. 1998-C1, Cl. C, 6.91%, 2030 | 9,750,000 | | 10,871,640 | |
| Ser. 2001-LIBA, Cl. E, 6.733%, 2016 | 1,500,000 c | | 1,640,331 | |
| Ser. 2001-LIBA, Cl. F, 6.733%, 2016 | 2,330,000 | | 2,534,470 | |
| Salomon Brothers Mortgage Securities VII, | | | | |
| Ser. 1997-TXH, Cl. B, 7.491%, 2025 | 4,000,000 c | | 4,242,203 | |
| Structured Asset Securities, REMIC, | | | | |
| Ser. 1996-CFL, Cl. H, 7.75%, 2028 | 1,000,000 | | 1,174,933 | |
| | | | 33,802,158 | |
| Commercial Services—.6% | | | | |
| Cendant: | | | | |
| Notes, 6.25%, 2010 | 1,887,000 | | 2,063,372 | |
| Notes, 7.125%, 2015 | 2,563,000 | | 2,927,282 | |
| | | | 4,990,654 | |
| Diversified Financial Services—3.3% | | | | |
| American Express, | | | | |
| Notes, 4.875%, 2013 | 3,836,000 | | 3,896,053 | |
| Capital One Bank, | | | | |
| Sub. Notes, 6.5%, 2013 | 2,942,000 | | 3,187,872 | |
| Farmers Exchange Capital, | | | | |
| Trust Surplus Note Securities, | | | | |
| 7.05%, 2028 | 5,155,000 c | | 5,011,222 | |
| Ford Motor Credit: | | | | |
| Notes, 1.37%, 2007 | 4,366,000 d | | 4,251,392 | |
| Notes, 5.625%, 2008 | 4,141,000 | | 4,260,542 | |
| GMAC, | | | | |
| Medium-Term Notes, 2.02%, 2007 | 6,147,000 d | | 6,152,852 | |
| | | | 26,759,933 | |
| Electric Utilities—.7% | | | | |
| SCANA, | | | | |
| Sr. Notes, 1.62%, 2006 | 2,375,000 d | | 2,376,499 | |
| Salt River Project Agricultural Improvement & Power, | | | | |
| Bonds, 5%, 2012 | 2,900,000 | | 3,259,948 | |
| | | | 5,636,447 | |
The Fund 7
STATEMENT OF INVESTMENTS (Unaudited) (continued)
| | | Principal | | | |
| Bonds and Notes (continued) | | Amount a | | Value ($) | |
|
|
| |
| |
| Food & Beverages—.3% | | | | | |
| Miller Brewing, | | | | | |
| Notes, 4.25%, 2008 | | 2,365,000 c | | 2,421,254 | |
| Foreign/Governmental—13.4% | | | | | |
| Australia Government, | | | | | |
| Bonds, Ser. 513, 6.5%, 2013 | AUD | 69,651,000 | | 55,679,911 | |
| Bonos Y Obligacion Del Estado, | | | | | |
| Bonds, 3.2%, 2006 | EUR | 21,840,000 | | 27,571,930 | |
| Federative Republic of Brazil, | | | | | |
| Bonds, 8.25%, 2034 | | 3,286,000 | | 2,842,390 | |
| Republic of Argentina: | | | | | |
| Debs., 11.25%, 2004 | | 33,100 b | | 7,282 | |
| Gtd. Bonds, Ser. L-GP, 6%, 2023 | | 4,025,000 b | | 1,952,125 | |
| Republic of Chile, | | | | | |
| Notes, 1.52%, 2008 | | 7,040,000 d | | 7,017,120 | |
| Republic of Panama, | | | | | |
| Bonds, 9.375%, 2023 | | 11,178,000 | | 12,072,240 | |
| | | | | 107,142,998 | |
| Health Care—2.6% | | | | | |
| Bristol-Myers Squibb, | | | | | |
| Notes, 5.75%, 2011 | | 2,575,000 | | 2,802,932 | |
| HCA: | | | | | |
| Notes, 5.25%, 2008 | | 2,934,000 | | 3,030,226 | |
| Notes, 6.25%, 2013 | | 1,728,000 | | 1,814,844 | |
| IVAX, | | | | | |
| Conv. Sr. Sub. Notes, 4.5%, 2008 | | 3,968,000 | | 4,047,360 | |
| Manor Care, | | | | | |
| Notes, 6.25%, 2013 | | 2,932,000 | | 3,133,575 | |
| Medco Health Solutions, | | | | | |
| Sr. Notes, 7.25%, 2013 | | 3,276,000 | | 3,679,950 | |
| Wyeth, | | | | | |
| Notes, 5.25%, 2013 | | 1,850,000 c | | 1,912,149 | |
| | | | | 20,421,036 | |
| Manufacturing—1.0% | | | | | |
| General Electric, | | | | | |
| Notes, 5%, 2013 | | 3,982,000 | | 4,084,724 | |
| Tyco International, | | | | | |
| Notes, 5.8%, 2006 | | 3,727,000 | | 3,942,998 | |
| | | | | 8,027,722 | |
8
| | Principal | | | |
| Bonds and Notes (continued) | Amounta | | Value ($) | |
|
| |
| |
| Media—2.5% | | | | |
| British Sky Broadcasting: | | | | |
| Notes, 6.875%, 2009 | 1,725,000 | | 1,945,353 | |
| Sr. Notes, 8.2%, 2009 | 952,000 | | 1,137,044 | |
| Clear Channel Communications, | | | | |
| Sr. Notes, 5%, 2012 | 3,707,000 | | 3,771,357 | |
| Comcast, | | | | |
| Sr. Notes, 6.5%, 2015 | 3,860,000 | | 4,235,482 | |
| Cox Communications, | | | | |
| Notes, 6.75%, 2011 | 2,298,000 | | 2,610,530 | |
| InterActive, | | | | |
| Notes, 7%, 2013 | 2,944,000 | | 3,275,748 | |
| Shaw Communications, | | | | |
| Sr. Notes, 7.25%, 2011 | 2,897,000 | | 3,230,155 | |
| | | | 20,205,669 | |
| Mining & Metal—1.8% | | | | |
| Noranda, | | | | |
| Debs., 7%, 2005 | 2,405,000 | | 2,536,229 | |
| Placer Dome, | | | | |
| Debs., Ser. B, 8.5%, 2045 | 3,600,000 | | 4,170,056 | |
| Vale Overseas, | | | | |
| Bonds, 8.25%, 2034 | 8,060,000 | | 7,374,900 | |
| | | | 14,081,185 | |
| Municipals—1.0% | | | | |
| Golden State Tobacco Securitization, | | | | |
| Bonds, 5.5%, 2018 | 2,833,000 | | 2,922,919 | |
| State of Connecticut, | | | | |
| Bonds, 5%, 2010 | 1,950,000 | | 2,201,804 | |
| State of Maryland, | | | | |
| Bonds, 5%, 2011 | 2,700,000 | | 3,061,827 | |
| | | | 8,186,550 | |
| Oil & Gas—.1% | | | | |
| Petro-Canada, | | | | |
| Notes, 4%, 2013 | 1,238,000 | | 1,158,436 | |
| Property-Casual Insurance—.8% | | | | |
| Fund American Cos., | | | | |
| Notes, 5.875%, 2013 | 2,114,000 | | 2,174,440 | |
| Kingsway America, | | | | |
| Sr. Notes, 7.5%, 2014 | 2,010,000 c | | 1,995,590 | |
The Fund 9
STATEMENT OF INVESTMENTS (Unaudited) (continued)
| | Principal | | | |
| Bonds and Notes (continued) | Amounta | | Value ($) | |
|
| |
| |
| Property-Casual Insurance (continued) | | | | |
| Markel, | | | | |
| Notes, 6.8%, 2013 | 1,740,000 | | 1,853,890 | |
| | | | 6,023,920 | |
| Residential Mortgage Pass-Through Ctfs.—2.7% | | | | |
| Ameriquest Mortgage Securities, | | | | |
| Ser. 2003-IA1, Cl. A4, 4.965%, 2033 | 7,000,000 | | 7,000,000 | |
| Bank Of America Mortgage Securities II, | | | | |
| Ser. 2001-4, Cl. B3, 6.75%, 2031 | 503,636 | | 524,990 | |
| Cendant Mortgage: | | | | |
| Ser. 1999-8, Cl. B3, 6.25%, 2029 | 352,333 c | | 368,646 | |
| Ser. 1999-8, Cl. B4, 6.25%, 2029 | 251,667 c | | 257,983 | |
| Chase Mortgage Finance: | | | | |
| Ser. 1999-S13, Cl. B3, 6.5%, 2014 | 414,608 | | 426,880 | |
| Ser. 2003-S7, Cl. B3, 4.75%, 2018 | 391,047 c | | 337,644 | |
| Countrywide Home Loans: | | | | |
| Ser. 2003-8, Cl. B3, 5%, 2018 | 289,376 | | 250,166 | |
| Ser. 2003-15, Cl. B3, 4.87%, 2018 | 875,990 c | | 773,061 | |
| Ser. 2003-18, Cl. B3, 5.5%, 2033 | 694,017 | | 594,564 | |
| GMAC Mortgage Corp. Loan Trust: | | | | |
| Ser. 2003-J1, Cl. B1, 5.25%, 2018 | 431,309 c | | 387,639 | |
| Ser. 2003-J1, Cl. B2, 5.25%, 2018 | 431,309 c | | 335,343 | |
| Ser. 2003-J1, Cl. B3, 5.25%, 2018 | 431,312 c | | 144,489 | |
| Ser. 2003-J3, Cl. B1, 5%, 2018 | 289,781 c | | 250,371 | |
| Ser. 2003-J3, Cl. B2, 5%, 2018 | 289,781 c | | 212,844 | |
| MASTR Asset Securitization Trust: | | | | |
| Ser. 2003-1, Cl. 15B4, 5.25%, 2018 | 391,552 c | | 367,902 | |
| Ser. 2003-1, Cl. 15B5, 5.25%, 2018 | 196,731 c | | 165,057 | |
| Norwest Asset Securities, | | | | |
| Ser. 1999-22, Cl. B4, 6.5%, 2014 | 315,472 | | 332,855 | |
| Ocwen Residential MBS, | | | | |
| Ser. 1998-R1, Cl. B1, 7%, 2040 | 539,732 c | | 580,477 | |
| PNC Mortgage Securities, | | | | |
| Ser. 2000-1, Cl. 1B4, 7.46%, 2030 | 978,120 | | 1,021,549 | |
| Residential Funding Mortgage Securities I, REMIC: | | | | |
| Ser. 1998-S7, Cl. B1, 6.5%, 2013 | 276,649 c | | 289,071 | |
| Ser. 1998-S16, Cl. B1, 6.5%, 2013 | 197,943 c | | 204,238 | |
| Ser. 1999-S16, Cl. A3, 6.75%, 2029 | 2,474,838 | | 2,577,545 | |
| Ser. 2001-S13, Cl. B2, 6.5%, 2016 | 318,225 | | 310,365 | |
| Ser. 2001-S19, Cl. M3, 6.5%, 2016 | 276,221 | | 290,779 | |
| Ser. 2002-S11, Cl. B1, 5.75%, 2017 | 190,671 c | | 189,413 | |
| Ser. 2003-S3, Cl. B1, 5.25%, 2018 | 195,409 | | 171,315 | |
10
| | Principal | | |
| Bonds and Notes (continued) | Amounta | Value ($) | |
|
|
| |
| Residential Mortgage Pass-Through Ctfs. (continued) | | | |
| Structured Asset Securities, | | | |
| Ser. 2003-34A, Cl. 5A1, 1.87%, 2033 | 1,809,172 d | 1,806,911 | |
| Washington Mutual, | | | |
| Ser. 2002-S3, Cl. 2B4, 6%, 2017 | 230,165 c | 231,731 | |
| Wells Fargo Mortgage Securities, | | | |
| Ser. 2003-3, Cl. 1B4, 5.75%, 2033 | 991,179 c | 872,138 | |
| | | 21,275,966 | |
| Retail—.5% | | | |
| RadioShack, | | | |
| Notes, 7.375%, 2011 | 3,585,000 | 4,211,386 | |
| Saks, | | | |
| Notes, 8.25%, 2008 | 429 | 477 | |
| | | 4,211,863 | |
| Structured Index—6.4% | | | |
| AB Svensk Exportkredit, | | | |
| GSNE-ER Indexed Notes, 0%, 2007 | 29,350,000 c,e | 29,350,000 | |
| DJ Trac-X NA, | | | |
| Credit Linked Trust Ctfs., 6.05%, 2009 | 17,250,000 c,f | 17,444,063 | |
| HSBC TIGERS, | | | |
| Medium Term Notes, Ser. 2003-7, 6.17%, 2008 | 4,500,000 c,d,f | 4,515,750 | |
| | | 51,309,813 | |
| Technology—.5% | | | |
| IBM, | | | |
| Sr. Notes, 4.75%, 2012 | 3,575,000 | 3,637,952 | |
| Telecommunications—3.0% | | | |
| British Telecommunications, | | | |
| Notes, 8.375%, 2010 | 1,720,000 d | 2,087,707 | |
| Credit-Backed Steers Trust, | | | |
| Ser. 2001 Trust Ctfs., Ser. VZ-1, 5.565%, 2005 | 4,000,000 c | 4,194,000 | |
| France Telecom, | | | |
| Notes, 9%, 2011 | 1,506,000 | 1,815,704 | |
| Qwest: | | | |
| Bank Notes, Ser. A, 6.5%, 2007 | 3,900,000 d | 4,114,500 | |
| Bank Notes, Ser. B, 6.95%, 2010 | 2,322,000 d | 2,432,295 | |
| Sprint Capital, | | | |
| Notes, 8.75%, 2032 | 5,630,000 c | 6,861,602 | |
| Verizon Florida, | | | |
| Debs., 6.125%, 2013 | 2,333,000 | 2,517,606 | |
| | | 24,023,414 | |
The Fund 11
STATEMENT OF INVESTMENTS (Unaudited) (continued)
| | Principal | | | |
| Bonds and Notes (continued) | Amounta | | Value ($) | |
|
| |
| |
| Tobacco—.5% | | | | |
| Altria, | | | | |
| Notes, 7%, 2013 | 3,680,000 | | 4,011,233 | |
| Transportation—.2% | | | | |
| Puerto Rico Highway & Transportation Authority, | | | | |
| Bonds, 5.5%, 2012 | 1,155,000 | | 1,351,304 | |
| U.S. Government—12.2% | | | | |
| U.S. Treasury Bonds, | | | | |
| 5.375%, 2/15/2031 | 33,290,000 | | 35,318,360 | |
| U.S. Treasury Notes: | | | | |
| 3.25%, 5/31/2004 | 11,095,000 | | 11,179,433 | |
| 4.25%, 11/15/2013 | 591,000 | | 596,538 | |
| 6.5%, 2/15/2010 | 12,500,000 g | | 14,574,625 | |
| 7%, 7/15/2006 | 30,500,000 | | 34,085,885 | |
| 7.5%, 2/15/2005 | 1,526,000 | | 1,624,350 | |
| | | | 97,379,191 | |
| U.S. Government Agencies—11.7% | | | | |
| Federal Home Loan Banks: | | | | |
| Bonds, 1.625%, 6/15/2005 | 27,885,000 | | 27,916,064 | |
| Bonds, Ser. 432, 4.5%, 9/16/2013 | 12,785,000 | | 12,746,696 | |
| Federal National Mortgage Association, | | | | |
| Notes, 4.625%, 10/15/2013 | 53,000,000 | | 53,252,810 | |
| | | | 93,915,570 | |
| U.S. Government Agencies/Mortgage-Backed—30.5% | | | | |
| Federal Home Loan Mortgage Corp.: | | | | |
| 6.5%, 10/1/2031-5/1/2032 | 3,269,362 | | 3,434,858 | |
| REMIC, Multiclass Mortgage Participation Ctfs. | | | | |
| (Interest Only Obligation): | | | | |
| Ser. 1499, Cl. E, 7%, 4/15/2023 | 523,229 h | | 37,495 | |
| Ser. 1610, Cl. PW, 6.5%, 4/15/2022 | 103,001 h | | 6 | |
| Ser. 2550, Cl. IO, 5.5%, 6/15/2027 | 5,809,581 h | | 419,379 | |
| Federal National Mortgage Association: | | | | |
| 5% | 17,000,000 i | | 16,893,750 | |
| 5%, 1/1/2018-5/1/2018 | 2,902,226 | | 2,972,954 | |
| 5.5% | 23,000,000 i | | 23,409,630 | |
| 6% | 23,000,000 i | | 23,876,760 | |
| 6.406%, 1/1/2011 | 10,487,189 | | 11,663,033 | |
| 6.5%, 11/1/2010 | 2,690 | | 2,863 | |
| 6.88%, 2/1/2028 | 1,026,462 | | 1,141,938 | |
12
| | Principal | | | |
| Bonds and Notes (continued) | Amounta | | Value ($) | |
|
| |
| |
| U.S. Government Agencies/Mortgage-Backed (continued) | | | | |
| Federal National Mortgage Association (continued): | | | | |
| REMIC Trust, Gtd. Pass-Through Ctfs.: | | | | |
| Ser. 1999-T1, Cl. A6, 6%, 1/25/2039 | 552,561 | | 552,906 | |
| (Interest Only Obligation): | | | | |
| Ser. 2002-55, Cl. IJ, 6%, 4/25/2028 | 2,854,924 h | | 80,571 | |
| Ser. 2002-92, Cl. IA, 5.5%, 5/25/2031 | 8,895,054 h | | 610,145 | |
| Ser. 2003-13, Cl. PI, 5.5%, 2/25/2026 | 20,475,742 h | | 1,868,045 | |
| Government National Mortgage Association I: | | | | |
| 5.5%, 4/15/2033-5/15/2033 | 40,929,337 | | 41,840,671 | |
| 6% | 10,300,000 i | | 10,744,136 | |
| 6%, 1/15/2033-12/15/2033 | 49,552,713 | | 51,741,118 | |
| 6.5% | 41,926,000 i | | 44,244,927 | |
| 6.5%, 6/15/2032 | 857,398 | | 905,353 | |
| 7%, 12/20/2030 | | | | |
| Project Loan, | | | | |
| 6.5%, 9/15/2033 | 2,866,809 | | 3,135,480 | |
| (Interest Only Obligation) | | | | |
| Ser. 2001-24, Cl. CI, 7%, 11/20/2029 | 749,717 h | | 3,628 | |
| Government National Mortgage Association II: | | | | |
| 3%, 7/20/2030 | 273,871 d | | 272,414 | |
| 6.5%, 1/20/2028-9/20/2031 | 2,074,057 | | 2,185,538 | |
| 7%, 1/28/2028-7/20/2031 | 722,577 | | 768,790 | |
| 7.5%, 10/20/2030-8/20/2031 | 1,013,796 | | 1,081,212 | |
| | | | 243,887,600 | |
| Total Bonds and Notes | | | | |
| (cost $831,120,900) | | | 837,580,054 | |
| | |
| |
| Preferred Stocks—.6% | Shares | Value ($) | |
|
|
| |
| Electric Utilities—.4% | | | |
| BGE Capital Trust II, | | | |
| Cum., $ | 1.55 | 116,475 | 3,001,561 | |
| Telecommunications—.2% | | | |
| Motorola, | | | | |
| Cum. Conv., $3.50 (units) | 35,526 j | 1,699,208 | |
| Total Preferred Stocks | | | |
| (cost $ | 4,688,175) | | 4,700,769 | |
The Fund 13
STATEMENT OF INVESTMENTS (Unaudited) (continued)
| | | | Face Amount | | | |
| | | | Covered by | | | |
| Options—.1% | | Contracts ($) | Value ($) | |
|
|
|
| |
| Call Options; | | | | | |
| Interest Rate Swaption, | | | | | |
| March 2004 @ 4.37% | | | | | |
| (cost $ | 1,056,275) | | 63,250,000 | | 472,688 | |
|
|
|
|
|
| |
| | | | | | | |
| Other Investments—17.3% | Shares | | Value ($) | |
|
|
|
| |
| Registered Investment Companies: | | | | |
| Dreyfus Institutional Cash Advantage Fund | 46,271,333 | k | 46,271,333 | |
| Dreyfus Institutional Cash Advantage Plus Fund | 46,271,333 | k | 46,271,333 | |
| Dreyfus Institutional Preferred Plus Money Market Fund | 46,271,334 | k | 46,271,334 | |
| Total Other Investments | | | | | |
| (cost $ | 138,814,000) | | | | 138,814,000 | |
|
|
|
|
|
| |
| | | | Principal | | | |
| Short-Term Investments—2.1% | Amount | a | Value ($) | |
|
|
|
| |
| U.S. Treasury Bills; | | | | | |
| 1.026%, 5/13/2004 | | | | | |
| (cost $ | 16,951,593) | | 17,000,000 | g | 16,957,160 | |
|
|
|
|
|
| |
| | | | | | | |
| Total Investments (cost $ | 992,630,943) | 124.8% | | 998,524,671 | |
| Liabilities, Less Cash and Receivables | (24.8%) | | (198,307,821) | |
| Net Assets | | 100.0% | | 800,216,850 | |
a Principal amount stated in U.S Dollars unless otherwise noted.
AUD—Australian Dollars EUR—Euro
b
| Non-income producing—security in default.
|
c
| Securities exempt from registration under Rule 144A of the Securities Act of 1933.These securities may be resold in transactions exempt from registration, normally to qualified institutional buyers.At January 31, 2004, these securities amounted to $100,059,393 or 12.5% of net assets.
|
d
| Variable rate security—interest rate subject to periodic change.
|
e
| Security linked to Goldman Sachs Non Energy—Excess Return Index.
|
f
| Security linked to a portfolio of debt securities.
|
g
| Partially held by a broker as collateral for open financial futures position.
|
h
| Notional face amount shown.
|
i
| Purchased on a forward commitment basis.
|
j
| Units represent a contract to purchase shares of common stock for $50 on November 16, 2004 and a senior note with a principal of $50.
|
k
| Investments in affiliated money market mutual funds—See Note 3(d).
|
See notes to financial statements.
14
| STATEMENT OF FINANCIAL FUTURES |
| January 31, 2004 (Unaudited) |
| | | | Market Value | | Unrealized | |
| | | | Covered by | | (Depreciation) | |
| | Contracts | | Contracts ($) | Expiration | at 1/31/2004 ($) | |
|
| |
|
|
| |
| Financial Futures Long | | | | | | |
| U.S. Treasury 30 Year Bonds | 1,696 | | 188,839,000 | March 2004 | (1,201,950) | |
| Financial Futures Short | | | | | | |
| 90 Day Euro | 1,367 | | 336,111,125 | September 2004 | (528,851) | |
| U.S. Treasury 2 Year Notes | 547 | | 117,331,500 | March 2004 | (388,217) | |
| U.S. Treasury 5 Year Notes | 3,658 | | 410,896,281 | March 2004 | (1,343,182) | |
| | | | | | (3,462,200) | |
See notes to financial statements.
The Fund 15
| STATEMENT OF OPTIONS WRITTEN |
| January 31, 2004 (Unaudited) |
| | Face Amount | | | |
| | Covered by | | | |
| | Contracts ($) | | Value ($) | |
|
| |
| |
| Call Options | | | | |
| Interest Rate Swaption, | | | | |
| March 2004@ 3.87% | | | | |
| (Premium received $430,100) | 63,250,000 | | 44,099 | |
See notes to financial statements.
16
| STATEMENT OF ASSETS AND LIABILITIES |
| January 31, 2004 (Unaudited) |
| | | Cost | Value | |
|
|
|
| |
| Assets ($): | | | | |
| Investments in securities—See Statement of Investments | 992,630,943 | 998,524,671 | |
| Cash denominated in foreign currencies | 6,103 | 5,963 | |
| Receivable for investment securities sold | | 44,465,056 | |
| Dividends and interest receivable | | 8,174,269 | |
| Receivable for shares of Common Stock subscribed | | 682,127 | |
| Paydowns receivable | | 3,455 | |
| Prepaid expenses | | 36,433 | |
| | | | 1,051,891,974 | |
|
|
|
| |
| Liabilities ($): | | | |
| Due to The Dreyfus Corporation and affiliates | | 289,902 | |
| Cash overdraft due to Custodian | | 2,899,434 | |
| Payable for investment securities purchased | | 243,179,454 | |
| Net unrealized depreciation on forward | | | |
| currency exchange contracts—Note 4 | | 2,379,693 | |
| Payable for shares of Common Stock redeemed | | 1,778,161 | |
| Unrealized depreciation on swaps—Note 4 | | 327,428 | |
| Payable to broker for swaps opened—Note 4 | | 291,698 | |
| Payable for futures variation margin—Note 4 | | 145,709 | |
| Outstanding options written, at value (premiums received | | | |
| $430,100)—See Statement of Options Written | | 44,099 | |
| Accrued expenses | | 339,546 | |
| | | | 251,675,124 | |
|
|
|
| |
| Net Assets ( | $) | | 800,216,850 | |
|
|
|
| |
| Composition of Net Assets ($): | | | |
| Paid-in capital | | | 794,892,889 | |
| Accumulated distributions in excess of investment income—net | | (1,003,827) | |
| Accumulated net realized gain (loss) on investments | | 5,723,293 | |
| Accumulated net unrealized appreciation (depreciation) on investments | | |
| and foreign currency transactions [including ($3,462,200) net unrealized | | |
| (depreciation) on financial futures and ($327,428) net unrealized | | |
| (depreciation) on swap transactions] | | 604,495 | |
|
|
| |
| Net Assets ( | $) | | 800,216,850 | |
| Net Asset Value Per Share | | | | |
| | Investor Shares | | Institutional Shares | |
|
| |
| |
| Net Assets ($) | 796,417,402 | | 3,799,448 | |
| Shares Outstanding | 61,561,762 | | 293,799 | |
|
| |
| |
| Net Asset Value Per Share ($) | 12.94 | | 12.93 | |
See notes to financial statements.
The Fund 17
| STATEMENT OF OPERATIONS |
| Six Months Ended January 31, 2004 (Unaudited) |
| Investment Income ($): | | | |
| Interest | | 16,056,022 | |
| Cash dividends | | 645,945 | |
| Total Income | | 16,701,967 | |
| Expenses: | | | |
| Management fee—Note 3(a) | | 1,862,821 | |
| Shareholder servicing costs—Note 3(b) | | 1,543,073 | |
| Custodian fees—Note 3(b) | | 104,602 | |
| Prospectus and shareholders’ reports | | 68,806 | |
| Professional fees | | 32,170 | |
| Registration fees | | 24,552 | |
| Directors’ fees and expenses—Note 3(c) | | 12,380 | |
| Interest expense—Note 2 | | 5,433 | |
| Miscellaneous | | 43,137 | |
| Total Expenses | | 3,696,974 | |
| Less—reduction in management fee due to | | | |
| undertaking—Note 3(a) | | (390,708) | |
| Net Expenses | | 3,306,266 | |
| Investment Income—Net | | 13,395,701 | |
|
|
| |
| Realized and Unrealized Gain (Loss) on Investments—Note 4 ($): | | |
| Net realized gain (loss) on investments and foreign currency transactions | 26,413,266 | |
| Net realized gain (loss) on forward currency exchange contracts | (3,853,182) | |
| Net realized gain (loss) on financial futures | | (8,831,622) | |
| Net realized gain (loss) on options transactions | 134,406 | |
| Net realized gain (loss) on swaps | | (370,075) | |
| Net Realized Gain (Loss) | | 13,492,793 | |
| Net unrealized appreciation (depreciation) on investments and | | |
| foreign currency transactions [including ( | $3,253,865) net unrealized | | |
| (depreciation) on financial futures and ($93,319) net unrealized | | |
| (depreciation) on swap transactions transactions] | 10,426,664 | |
| Net Realized and Unrealized Gain (Loss) on Investments | 23,919,457 | |
| Net Increase in Net Assets Resulting from Operations | 37,315,158 | |
See notes to financial statements.
18
STATEMENT OF CHANGES IN NET ASSETS
| | Six Months Ended | | | |
| | January 31, 2004 | | Year Ended | |
| | (Unaudited) | | July 31, 2003 | |
|
| |
| |
| Operations ($): | | | | |
| Investment income—net | 13,395,701 | | 35,926,410 | |
| Net realized gain (loss) on investments | 13,492,793 | | 27,064,359 | |
| Net unrealized appreciation | | | | |
| (depreciation) on investments | 10,426,664 | | 4,751,590 | |
| Net Increase (Decrease) in Net Assets | | | | |
| Resulting from Operations | 37,315,158 | | 67,742,359 | |
|
| |
| |
| Dividends to Shareholders from ($): | | | | |
| Investment income—net: | | | | |
| Investor Shares | (16,674,930) | | (39,906,073) | |
| Institutional Shares | (87,031) | | (362,297) | |
| Net realized gain on investments: | | | | |
| lnvestor Shares | (14,934,446) | | — | |
| Institutional Shares | (65,767) | | — | |
| Total Dividends | (31,762,174) | | (40,268,370) | |
|
| |
| |
| Capital Stock Transactions ($): | | | | |
| Net proceeds from shares sold: | | | | |
| Investor Shares | 87,295,851 | | 334,357,115 | |
| Institutional Shares | 720,500 | | 962,752 | |
| Dividends reinvested: | | | | |
| Investor Shares | 26,785,930 | | 34,576,830 | |
| Institutional Shares | 46,463 | | 214,614 | |
| Cost of shares redeemed: | | | | |
| Investor Shares | (154,999,212) | | (302,883,485) | |
| Institutional Shares | (1,474,040) | | (5,007,209) | |
| Increase (Decrease) in Net Assets from | | | | |
| Capital Stock Transactions | (41,624,508) | | 62,220,617 | |
| Total Increase (Decrease) in Net Assets | (36,071,524) | | 89,694,606 | |
|
| |
| |
| Net Assets ($): | | | | |
| Beginning of Period | 836,288,374 | | 746,593,768 | |
| End of Period | 800,216,850 | | 836,288,374 | |
| Undistributed (distributions in excess of) | | | | |
| investment income—net | (1,003,827) | | 2,362,433 | |
The Fund 19
STATEMENT OF CHANGES IN NET ASSETS (continued)
| | Six Months Ended | | | |
| | January 31, 2004 | | Year Ended | |
| | (Unaudited) | | July 31, 2003 | |
|
| |
| |
| Capital Share Transactions: | | | | |
| Investor Shares | | | | |
| Shares sold | 6,671,078 | | 26,134,890 | |
| Shares issued for dividends reinvested | 2,054,674 | | 2,690,708 | |
| Shares redeemed | (11,869,589) | | (23,608,118) | |
| Net Increase (Decrease) in Shares Outstanding | (3,143,837) | | 5,217,480 | |
|
| |
| |
| Institutional Shares | | | | |
| Shares sold | 55,150 | | 75,863 | |
| Shares issued for dividends reinvested | 3,559 | | 16,768 | |
| Shares redeemed | (112,682) | | (387,437) | |
| Net Increase (Decrease) in Shares Outstanding | (53,973) | | (294,806) | |
See notes to financial statements.
20
FINANCIAL HIGHLIGHTS
The following tables describe the performance for each share class for the fiscal periods indicated. All information (except portfolio turnover rate) reflects financial results for a single fund share.Total return shows how much your investment in the fund would have increased (or decreased) during each period, assuming you had reinvested all dividends and distributions.These figures have been derived from the fund’s financial statements.
| | Six Months Ended | | | | | | | | | | | |
| | January 31, 2004 | | | | Year Ended July 31, | | | | | |
| | | | | |
| | | | | |
| Investor Shares | (Unaudited) | | 2003 | | 2002a | | 2001 | | 2000 | | 1999 | |
|
| |
| |
| |
| |
| |
| |
| Per Share Data ($): | | | | | | | | | | | | |
| Net asset value, | | | | | | | | | | | | |
| beginning of period | 12.86 | | 12.42 | | 13.22 | | 12.50 | | 12.43 | | 13.38 | |
| Investment Operations: | | | | | | | | | | | | |
| Investment income—net | .21b | | .56b | | .72b | | .84 | | .86 | | .87 | |
| Net realized and unrealized | | | | | | | | | | | | |
| gain (loss) on investments | .38 | | .51 | | (.64) | | .75 | | .22 | | (.36) | |
| Total from Investment Operations | .59 | | 1.07 | | .08 | | 1.59 | | 1.08 | | .51 | |
| Distributions: | | | | | | | | | | | | |
| Dividends from | | | | | | | | | | | | |
| investment income—net | (.27) | | (.63) | | (.76) | | (.84) | | (.87) | | (.88) | |
| Dividends from net realized | | | | | | | | | | | | |
| gain on investments | (.24) | | — | | (.12) | | (.03) | | (.14) | | (.58) | |
| Total Distributions | (.51) | | (.63) | | (.88) | | (.87) | | (1.01) | | (1.46) | |
| Net asset value, end of period | 12.94 | | 12.86 | | 12.42 | | 13.22 | | 12.50 | | 12.43 | |
|
| |
| |
| |
| |
| |
| |
| Total Return (%) | 4.60c | | 8.64 | | .64 | | 13.14 | | 9.05 | | 4.18 | |
|
| |
| |
| |
| |
| |
| |
| Ratios/Supplemental Data (%): | | | | | | | | | | | | |
| Ratio of operating expenses | | | | | | | | | | | | |
| to average net assets | .80d | | .82 | | .70 | | .67 | | .65 | | .65 | |
| Ratio of interest expense | | | | | | | | | | | | |
| to average net assets | .00d,e | | .00e | | .00e | | .00e | | .00e | | .08 | |
| Ratio of net investment income | | | | | | | | | | | | |
| to average net assets | 3.23d | | 4.34 | | 5.58 | | 6.44 | | 6.95 | | 6.79 | |
| Decrease reflected in above expense | | | | | | | | | | | |
| ratios due to undertakings by | | | | | | | | | | | | |
| The Dreyfus Corporation | .09d | | .08 | | .16 | | .27 | | .48 | | .51 | |
| Portfolio Turnover Rate | 421.05c,f | | 838.50 | | 474.20 | | 555.90 | | 566.57 | | 166.80 | |
|
| |
| |
| |
| |
| |
| |
| Net Assets, end of period | | | | | | | | | | | | |
| ($ x 1,000) | 796,417 | | 831,818 | | 738,618 | | 359,114 | | 60,541 | | 37,831 | |
a As required, effective August 1, 2001, the fund has adopted the provisions of the AICPA Audit and Accounting Guide for Investment Companies and began amortizing discount or premium on fixed income securities on a scientific basis and including paydown gains and losses in interest income.The effect of this change for the period ended July 31, 2002 was to decrease net investment income per share by $.04, increase net realized and unealized gain (loss) on investments per share by $.04 and decrease the ratio of net investment income to average net assets from 5.90% to 5.58%. Per share data and ratios/supplemental data for periods prior to August 1, 2001 have not been restated to reflect this change in presentation.
|
b
| Based on average shares outstanding at each month end. d Annualized. e Amount represent less than .01%.
|
c
| Not annualized.
|
f
| The portfolio turnover rate excluding mortgage dollar roll transactions was 378.03%.
|
See notes to financial statements.
The Fund 21
FINANCIAL HIGHLIGHTS (continued)
| | Six Months Ended | | | | | | | |
| | January 31, 2004 | | Year Ended July 31, | | | |
| | | |
| | | |
| Institutional Shares | (Unaudited) | | 2003 | | 2002a | | 2001b | |
|
| |
| |
| |
| |
| Per Share Data ($): | | | | | | | | |
| Net asset value, beginning of period | 12.85 | | 12.41 | | 13.22 | | 13.08 | |
| Investment Operations: | | | | | | | | |
| Investment income—net | .23c | | .63c | | .76c | | .14 | |
| Net realized and unrealized | | | | | | | | |
| gain (loss) on investments | .38 | | .48 | | (.66) | | .14 | |
| Total from Investment Operations | .61 | | 1.11 | | .10 | | .28 | |
| Distributions: | | | | | | | | |
| Dividends from investment income—net | (.29) | | (.67) | | (.79) | | (.14) | |
| Dividends from net realized gain on investments | (.24) | | — | | (.12) | | — | |
| Total Distributions | (.53) | | (.67) | | (.91) | | (.14) | |
| Net asset value, end of period | 12.93 | | 12.85 | | 12.41 | | 13.22 | |
|
| |
| |
| |
| |
| Total Return (%) | 4.76d | | 9.07 | | .81 | | 12.86e | |
|
| |
| |
| |
| |
| Ratios/Supplemental Data (%): | | | | | | | | |
| Ratio of operating expenses to average net assets | .53e | | .50 | | .45 | | .45e | |
| Ratio of interest expense to average net assets | .00e,f | | .00f | | .00f | | — | |
| Ratio of net investment income | | | | | | | | |
| to average net assets | 3.51e | | 4.88 | | 5.80 | | 6.56e | |
| Decrease reflected in above expense ratios due | | | | | | | | |
| to undertakings by The Dreyfus Corporation | — | | .03 | | .08 | | 1.21e | |
| Portfolio Turnover Rate | 421.05d,g | | 838.50 | | 474.20 | | 555.90 | |
|
| |
| |
| |
| |
| Net Assets, end of period ($ x 1,000) | 3,799 | | 4,470 | | 7,976 | | 676 | |
a As required, effective August 1, 2001, the fund has adopted the provisions of the AICPA Audit and Accounting Guide for Investment Companies and began amortizing discount or premium on fixed income securities on a scientific basis and including paydown gains and losses in interest income.The effect of this change for the period ended July 31, 2002 was to decrease net investment income per share by $.04, increase net realized and unealized gain (loss) on investments per share by $.04 and decrease the ratio of net investment income to average net assets from 6.12% to 5.80%. Per share data and ratios/supplemental data for periods prior to August 1, 2001 have not been restated to reflect this change in presentation.
b
| The fund commenced offering Institutional shares on May 31, 2001.
|
c
| Based on average shares outstanding at each month end.
|
d
| Not annualized.
|
e
| Annualized.
|
f
| Amount represent less than .01%.
|
g
| The portfolio turnover rate excluding mortgage dollar roll transactions was 378.03%.
|
See notes to financial statements.
22
NOTES TO FINANCIAL STATEMENTS (Unaudited)
NOTE 1—Significant Accounting Policies:
Dreyfus Intermediate Term Income Fund (the “fund”) is a separate diversified series of Dreyfus Investment Grade Funds, Inc. (the “Company”) which is registered under the Investment Company Act of 1940, as amended (the “Act”), as an open-end management investment company and operates as a series company currently offering five series, including the fund.The fund’s investment objective is to seek to maximize total return, consisting of capital appreciation and current income.The Dreyfus Corporation (the “Manager”) serves as the fund’s investment adviser. The Manager is a wholly-owned subsidiary of Mellon Bank, N.A. (“Mellon”), which is a wholly-owned subsidiary of Mellon Financial Corporation. Dreyfus Service Corporation (the “Distributor”), a wholly-owned subsidiary of the Manager, is the distributor of the fund’s shares which are sold to the public without a sales charge.
The fund is authorized to issue 500 million shares of $.001 par value Common Stock in each of the following classes of shares: Investor and Institutional. Investor shares are subject to a shareholder services plan. Other differences between the classes include the services offered to and the expenses borne by each class, the minimum initial investment and certain voting rights. Income, expenses (other than expenses attributable to a specific class), and realized and unrealized gain or losses on investments are allocated to each class of shares based on its relative net assets.
The Company accounts separately for the assets, liabilities and operations of each series. Expenses directly attributable to each series are charged to that series’ operations; expenses which are applicable to all series are allocated among them on a pro rata basis.
The fund’s financial statements are prepared in accordance with accounting principles generally accepted in the United States, which may require the use of management estimates and assumptions.Actual results could differ from those estimates.
The Fund 23
NOTES TO FINANCIAL STATEMENTS (Unaudited) (continued)
(a) Portfolio valuation: Investments in securities (excluding short-term investments (other than U.S.Treasury Bills), financial futures, forward currency exchange contracts, options and swaps) are valued each business day by an independent pricing service (the “Service”) approved by the Board of Directors. Investments for which quoted bid prices are readily available and are representative of the bid side of the market in the judgment of the Service are valued at the mean between the quoted bid prices (as obtained by the Service from dealers in such securities) and asked prices (as calculated by the Service based upon its evaluation of the market for such securities). Other investments (which constitute a majority of the portfolio securities) are carried at fair value as determined by the Service, based on methods which include consideration of: yields or prices of securities of comparable quality, coupon, maturity and type; indications as to values from dealers; and general market conditions. Securities for which there are no such valuations are valued at fair value as determined in good faith under the direction of the Board of Directors. Short-term investments, excluding U.S. Treasury Bills, are carried at amortized cost, which approximates value. Financial futures and options, which are traded on an exchange, are valued at the last sales price on the securities exchange on which such securities are primarily traded or at the last sales price on the national securities market on each business day. Options traded over-the-counter are priced at the mean between the bid prices and the asked prices. Investments denominated in foreign currencies are translated to U.S. dollars at the prevailing rates of exchange. Forward currency exchange contracts are valued at the forward rate. Swap transactions are valued based on future cash flows and other factors, such as interest rates and underlying securities.
(b) Foreign currency transactions: The fund does not isolate that portion of the results of operations resulting from changes in foreign exchange rates on investments from the fluctuations arising from changes in market prices of securities held. Such fluctuations are included with the net realized and unrealized gain or loss from investments.
24
Net realized foreign exchange gains or losses arise from sales and maturities of short-term securities, sales of foreign currencies, currency gains or losses realized on securities transactions and the difference between the amounts of dividends, interest, and foreign withholding taxes recorded on the fund’s books and the U.S. dollar equivalent of the amounts actually received or paid. Net unrealized foreign exchange gains and losses arise from changes in the value of assets and liabilities other than investments in securities, resulting from changes in exchange rates. Such gains and losses are included with net realized and unrealized gain or loss on investments.
(c) Securities transactions and investment income: Securities transactions are recorded on a trade date basis. Realized gain and loss from securities transactions are recorded on the identified cost basis. Dividend income is recognized on the ex-dividend date and interest income, including, where applicable, amortization of discount and premium on investments, is recognized on the accrual basis. Under the terms of the custody agreement, the fund receives net earnings credits based on available cash balances left on deposit.
(d) Dividends to shareholders: It is the policy of the fund to declare dividends daily from investment income-net. Such dividends are paid monthly. Dividends from net realized capital gain, if any, are normally declared and paid annually, but the fund may make distributions on a more frequent basis to comply with the distribution requirements of the Internal Revenue Code of 1986, as amended (the “Code”).To the extent that net realized capital gain can be offset by capital loss carryovers, if any, it is the policy of the fund not to distribute such gain. Income and capital gain distributions are determined in accordance with income tax regulations, which may differ from accounting principles generally accepted in the United States.
(e) Federal income taxes: It is the policy of the fund to continue to qualify as a regulated investment company, if such qualification is in the best interests of its shareholders, by complying with the applicable pro-
The Fund 25
NOTES TO FINANCIAL STATEMENTS (Unaudited) (continued)
visions of the Code, and to make distributions of taxable income sufficient to relieve it from substantially all federal income and excise taxes.
The tax character of distributions paid to shareholders during the fiscal year ended July 31, 2003 was as follows: ordinary income $40,268,370. The tax character of current year distributions will be determined at the end of the current fiscal year.
(f) Indemnification: The fund enters into contracts that contain a variety of indemnifications. The fund’s maximum exposure under these arrangements is unknown.The fund does not anticipate recognizing any loss related to the arrangements.
NOTE 2—Bank Lines of Credit:
The fund may borrow up to $10 million for leveraging purposes under a short-term unsecured line of credit and participates with other Dreyfus-managed funds in a $100 million unsecured line of credit primarily to be utilized for temporary or emergency purposes, including the financing of redemptions. Interest is charged to the fund based on prevailing market rates in effect at the time of borrowings.
The average daily amount of borrowings outstanding under the leveraging arrangement during the period ended January 31, 2004 was approximately $755,400, with a related weighted average annualized interest rate of 1.43%.
NOTE 3—Management Fee and Other Transactions With Affiliates:
(a) Pursuant to a management agreement (“Agreement”) with the Manager, the management fee is computed at the annual rate of .45 of 1% of the value of the fund’s average daily net assets and is payable monthly. The Manager has undertaken through January 31, 2004 to reduce the management fee paid by the fund, if the fund’s aggregate expenses, exclusive of taxes, brokerage fees, interest on borrowings, Shareholder Service Plan fees and extraordinary expenses exceed .55 of 1% of the value of the fund’s average daily net assets.The reduction in management fee, pursuant to the undertaking, amounted to
26
$390,708 during the period ended January 31, 2004.
(b) Under the Investor Shares Shareholder Services Plan, the fund pays the Distributor at an annual rate of .25 of 1% of the value of Investor Shares average daily net assets for the provision of certain services.The services provided may include personal services relating to shareholder accounts, such as answering shareholder inquiries regarding the fund and providing reports and other information, and services related to the maintenance of shareholder accounts. The Distributor may make payments to Service Agents (a securities dealer, financial institution or other industry professional) in respect of these services. The Distributor determines the amounts to be paid to Service Agents. During the period ended January 31, 2004, Investor Shares were charged $1,029,917 pursuant to the Shareholder Services Plan.
The fund compensates Dreyfus Transfer, Inc., a wholly-owned subsidiary of the Manager, under a transfer agency agreement for providing personnel and facilities to perform transfer agency services for the fund. During the period ended January 31, 2004, the fund was charged $99,648 pursuant to the transfer agency agreement.
The fund compensates Mellon under a custody agreement for providing custodial services for the fund. During the period ended January 31, 2004, the fund was charged $104,602 pursuant to the custody agreement.
(c) Each Board member also serves as a Board member of other funds within the Dreyfus complex. Annual retainer fees and attendance fees are allocated to each fund based on net assets.
(d) Pursuant to an exemptive order from the Securities and Exchange Commission, the fund may invest its available cash balances in affiliated money market mutual funds as shown in the fund’s Statement of Investments. Management fees are not charged to these money market mutual funds. During the period ended January 31, 2004, the fund derived $374,162 in income from these investments, which is included in dividend income in the fund’s Statement of Operations.
The Fund 27
NOTES TO FINANCIAL STATEMENTS (Unaudited) (continued)
NOTE 4—Securities Transactions:
The aggregate amount of purchases and sales (including paydowns) of investment securities, excluding short-term securities, option transactions, financial futures, forward currency exchange contracts and swap transactions, during the period ended January 31, 2004, amounted to $3,675,273,711 and $3,706,141,643, respectively, of which $375,461,444 in purchases and $376,397,849 in sales were from dollar roll transactions.
The fund is engaged in short-selling which obligates the fund to replace the security borrowed by purchasing the security at current market value.The fund would incur a loss if the price of the security increases between the date of the short sale and the date on which the fund replaces the borrowed security.The fund would realize a gain if the price of the security declines between those dates.The fund’s long security positions serve as collateral for the open short positions. At January 31, 2004, there were no securities sold short outsatanding.
The following summarizes the fund’s call/put options written for the period ended January 31, 2004:
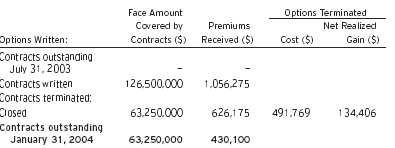
The fund may purchase and write (sell) put and call options in order to gain exposure to or to protect against changes in the market.
As a writer of call options, the fund receives a premium at the outset and then bears the market risk of unfavorable changes in the price of the financial instrument underlying the option. Generally, the fund would incur a gain, to the extent of the premium, if the price of the
28
underlying financial instrument decreases between the date the option is written and the date on which the option is terminated. Generally, the fund would realize a loss, if the price of the financial instrument increases between those dates.
As a writer of put options, the fund receives a premium at the outset and then bears the market risk of unfavorable changes in the price of the financial instrument underlying the option. Generally, the fund would incur a gain, to the extent of the premium, if the price of the underlying financial instrument increases between the date the option is written and the date on which the option is terminated. Generally, the fund would realize a loss, if the price of the financial instrument decreases between those dates.
The fund may invest in financial futures contracts in order to gain exposure to or protect against changes in the market. The fund is exposed to market risk as a result of changes in the value of the underlying financial instruments. Investments in financial futures require the fund to “mark to market” on a daily basis, which reflects the change in the market value of the contracts at the close of each day’s trading. Typically, variation margin payments are received or made to reflect daily unrealized gains or losses.When the contracts are closed, the fund recognizes a realized gain or loss. These investments require initial margin deposits with a broker, which consist of cash or cash equiva-lents.The amount of these deposits is determined by the exchange or Board of Trade on which the contract is traded and is subject to change. Contracts open at January 31, 2004 are set forth in the Statement of Financial Futures.
The fund enters into forward currency exchange contracts in order to hedge its exposure to changes in foreign currency exchange rates on its foreign portfolio holdings and to settle foreign currency transac-tions.When executing forward currency exchange contracts, the fund is obligated to buy or sell a foreign currency at a specified rate on a certain date in the future. With respect to sales of forward currency
The Fund 29
NOTES TO FINANCIAL STATEMENTS (Unaudited) (continued)
exchange contracts, the fund would incur a loss if the value of the contract increases between the date the forward contract is opened and the date the forward contract is closed.The fund realizes a gain if the value of the contract decreases between those dates. With respect to purchases of forward currency exchange contracts, the fund would incur a loss if the value of the contract decreases between the date the forward contract is opened and the date the forward contract is closed. The fund realizes a gain if the value of the contract increases between those dates. The fund is also exposed to credit risk associated with counter party nonperformance on these forward currency exchange contracts which is typically limited to the unrealized gain on each open contract. The following summarizes open forward currency exchange contracts at January 31, 2004:
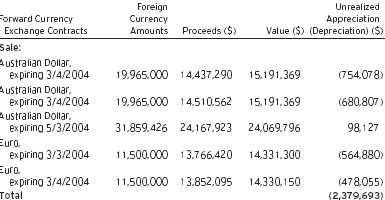
The fund may enter into swap agreements to exchange the interest rate on, or return generated by, one nominal instrument for the return generated by another nominal instrument.
The fund enters into credit default swaps to hedge its exposure to or to gain exposure to changes in the market on debt securities. Credit default swaps involve commitments to pay a fixed rate in exchange for payment if a credit event affecting a third party (the referenced company) occurs. Credit events may include a failure to pay interest, prin-
30
cipal, bankruptcy, or restructuring. Net periodic interest payments to be received or paid are accrued daily and are recorded in the Statement of Operations as an adjustment to interest income. Credit default swaps are marked-to-market daily and the change, if any is recorded as unrealized appreciation or depreciation in the Statement of Operations. The following summarizes open credit default swaps entered into by the fund at January 31, 2004:
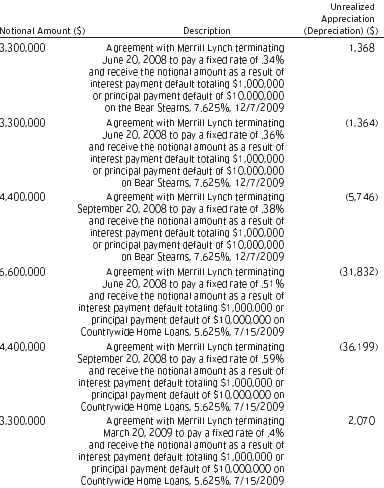
The Fund 31
NOTES TO FINANCIAL STATEMENTS (Unaudited) (continued)

32
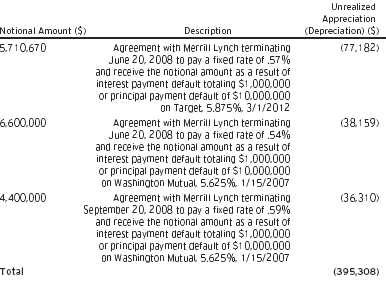
The fund may enter into interest rate swaps which involve the exchange of commitments to pay and receive interest based on a notional principal amount. Net periodic interest payments to be received or paid are accrued daily and are recorded in the Statement of Operations as an adjustment to interest income. Interest rate swaps are marked-to-market daily and change, if any, is recorded as unrealized appreciation or depreciation in the Statement of Operations.
The following summarizes interest rate swaps entered into by the fund at January 31, 2004:
Realized gains or losses on maturity or termination of swaps are presented in the Statement of Operations. Risks may arise upon entering into these agreements from the potential inability of the counterparties to meet the terms of the agreement and are generally limited to the amount of net payments to be received, if any, at the date of default.
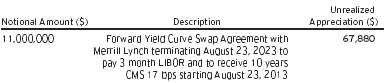
The Fund 33
NOTES TO FINANCIAL STATEMENTS (Unaudited) (continued)
At January 31, 2004, accumulated net unrealized appreciation on investments was $5,893,728, consisting of $13,308,474 gross unrealized appreciation and $7,414,746 gross unrealized depreciation.
At January 31, 2004, the cost of investments for federal income tax purposes was substantially the same as the cost for financial reporting purposes (see the Statement of Investments).
NOTE 5—Legal Matters:
Two class actions have been filed against Mellon Financial and Mellon Bank, N.A., and Dreyfus and Founders Asset Management LLC (the “Investment Advisers”), and the directors of all or substantially all of the Dreyfus Funds, alleging that the Investment Advisers improperly used assets of the Dreyfus Funds, in the form of directed brokerage commissions and 12b-1 fees, to pay brokers to promote sales of Dreyfus Funds, and that the use of fund assets to make these payments was not properly disclosed to investors.The complaints further allege that the directors breached their fiduciary duties to fund shareholders under the Investment Company Act of 1940 and at common law.The complaints seek unspecified compensatory and punitive damages, rescission of the funds’ contracts with the Investment Advisers, an accounting of all fees paid, and an award of attorneys’ fees and litigation expenses. Dreyfus and the funds believe the allegations to be totally without merit and will defend the actions vigorously.
Additional lawsuits arising out of these circumstances and presenting similar allegations and requests for relief may be filed against the defendants in the future. Neither Dreyfus nor the funds believe that any of the pending actions will have a material adverse affect on the funds or Dreyfus’ ability to perform its contract with the funds.
34
For More Information
| Dreyfus |
| Intermediate |
| Term Income Fund |
| 200 Park Avenue |
| New York, NY 10166 |
| |
| Manager |
| The Dreyfus Corporation |
| 200 Park Avenue |
|
| New York, NY 10166 |
| |
| Custodian |
| Mellon Bank, N.A. |
| One Mellon Bank Center |
| Pittsburgh, PA 15258 |
| |
| Transfer Agent & |
| Dividend Disbursing Agent |
| Dreyfus Transfer, Inc. |
| 200 Park Avenue |
| New York, NY 10166 |
| |
| Distributor |
| Dreyfus Service Corporation |
| 200 Park Avenue |
| New York, NY 10166 |
To obtain information:
| By telephone |
| Call 1-800-645-6561 |
| By mail Write to: |
| The Dreyfus Family of Funds |
| 144 Glenn Curtiss Boulevard |
| Uniondale, NY 11556-0144 |
| By E-mail Send your request |
| to info@dreyfus.com |
| On the Internet Information |
| can be viewed online or |
| downloaded from: |
| http://www.dreyfus.com |
A description of the policies and procedures that the fund uses to determine how to vote proxies relating to portfolio securities is available, without charge, by calling the telephone number listed above, or by visiting the SEC’s website at http://www.sec.gov
© 2004 Dreyfus Service Corporation 0082SA0104
Item 2. Code of Ethics.
Not applicable.
Item 3. Audit Committee Financial Expert.
Not applicable.
Item 4. Principal Accountant Fees and Services.
Not applicable.
Item 5. Audit Committee of Listed Registrants.
Not applicable.
Item 6. [Reserved]
Item 7. Disclosure of Proxy Voting Policies and Procedures for Closed-End Management Investment
Companies.
Not applicable.
Item 8. [Reserved]
Item 9. Controls and Procedures.
(a) The Registrant's principal executive and principal financial officers have concluded, based on their evaluation of the Registrant's disclosure controls and procedures as of a date within 90 days of the filing date of this report, that the Registrant's disclosure controls and procedures are reasonably designed to ensure that information required to be disclosed by the Registrant on Form N-CSR is recorded, processed, summarized and reported within the required time periods and that information required to be disclosed by the Registrant in the reports that it files or submits on Form N-CSR is accumulated and communicated to the Registrant's management, including its principal executive and principal financial officers, as appropriate to allow timely decisions regarding required disclosure.
(b) There were no changes to the Registrant's internal control over financial reporting that occurred during the Registrant's most recently ended fiscal half-year that has materially affected, or is reasonably likely to materially affect, the Registrant's internal control over financial reporting.
Item 10. Exhibits.
(a)(1) Not applicable.
(a)(2) Certifications of principal executive and principal financial officers as required by Rule 30a-2(a) under the Investment Company Act of 1940.
(b) Certification of principal executive and principal financial officers as required by Rule 30a-2(b) under the Investment Company Act of 1940.
SIGNATURES
Pursuant to the requirements of the Securities Exchange Act of 1934 and the Investment Company Act of 1940, the Registrant has duly caused this Report to be signed on its behalf by the undersigned, thereunto duly authorized.
DREYFUS INVESTMENT GRADE FUND
| By: | /s/ Stephen E. Canter |
| | Stephen E. Canter |
| | President |
| | |
| Date: | March 25, 2004 |
Pursuant to the requirements of the Securities Exchange Act of 1934 and the Investment Company Act of 1940, this Report has been signed below by the following persons on behalf of the Registrant and in the capacities and on the dates indicated.
| By: | /s/ Stephen E. Canter |
| | Stephen E. Canter |
| | Chief Executive Officer |
| | |
| Date: | March 25, 2004 |
| | |
| By: | /s/ James Windels |
| | James Windels |
| | Chief Financial Officer |
| | |
| Date: | March 25, 2004 |
EXHIBIT INDEX
(a)(2) Certifications of principal executive and principal financial officers as required by Rule 30a-2(a) under the Investment Company Act of 1940. (EX-99.CERT)
(b) Certification of principal executive and principal financial officers as required by Rule 30a-2(b) under the Investment Company Act of 1940. (EX-99.906CERT)