| | |
| | | UNITED STATES |
| | | SECURITIES AND EXCHANGE COMMISSION |
| | | Washington, D.C. 20549 |
| |
| |
| | | FORM N-CSR |
| |
| CERTIFIED SHAREHOLDER REPORT OF REGISTERED MANAGEMENT |
| | | INVESTMENT COMPANIES |
| |
| Investment Company Act file number 811-6718 |
| |
| | | DREYFUS INVESTMENT GRADE FUNDS, INC. |
| | | (Exact name of Registrant as specified in charter) |
| |
| |
| | | c/o The Dreyfus Corporation |
| | | 200 Park Avenue |
| | | New York, New York 10166 |
| | | (Address of principal executive offices) (Zip code) |
| |
| | | Mark N. Jacobs, Esq. |
| | | 200 Park Avenue |
| | | New York, New York 10166 |
| | | (Name and address of agent for service) |
| |
| Registrant's telephone number, including area code: (212) 922-6000 |
| |
| Date of fiscal year end: | | 7/31 |
| |
| Date of reporting period: | | 7/31/04 |
FORM N-CSR
Item 1. Reports to Stockholders.
| | Dreyfus
Institutional Yield
Advantage Fund
|

The views expressed in this report reflect those of the portfolio manager only through the end of the period covered and do not necessarily represent the views of Dreyfus or any other person in the Dreyfus organization. Any such views are subject to change at any time based upon market or other conditions and Dreyfus disclaims any responsibility to update such views.These views may not be relied on as investment advice and, because investment decisions for a Dreyfus fund are based on numerous factors, may not be relied on as an indication of trading intent on behalf of any Dreyfus fund.
Not FDIC-Insured • Not Bank-Guaranteed • May Lose Value
| Contents |
| |
| | | THE FUND |
| |
|
| 2 | | Letter from the Chairman |
| 3 | | Discussion of Fund Performance |
| 6 | | Fund Performance |
| 7 | | Understanding Your Fund's Expenses |
| 7 | | Comparing Your Fund's Expenses |
| With Those of Other Funds |
| 8 | | Statement of Investments |
| 13 | | Statement of Financial Futures |
| 14 | | Statement of Assets and Liabilities |
| 15 | | Statement of Operations |
| 16 | | Statement of Changes in Net Assets |
| 18 | | Financial Highlights |
| 20 | | Notes to Financial Statements |
| 27 | | Report of Independent Registered |
| | | Public Accounting Firm |
| 28 | | Board Members Information |
| 30 | | Officers of the Fund |
| FOR MORE INFORMATION |
|
| | | Back Cover |
| Dreyfus Institutional |
| Yield Advantage Fund |
The Fund

LETTER FROM THE CHAIRMAN
This annual report for Dreyfus Institutional Yield Advantage Fund covers the 12-month period from August 1, 2003, through July 31, 2004. Inside, you'll find valuable information about how the fund was managed during the reporting period, including a discussion with Gerald E. Thunelius, portfolio manager and Director of the Dreyfus Taxable Fixed Income Team that manages the fund.
The U.S. economy has increasingly shown signs of sustainable growth during the reporting period, causing heightened volatility in most sectors of the U.S. bond market. As it became clearer that a strong job market and higher energy prices might lead to renewed inflationary pressures,the Federal Reserve Board raised short-term interest rates by 25 basis points at its meeting in late June.This shift in monetary policy represents the first increase in short-term rates in more than four years, and many analysts believe that additional, gradual increases are likely to follow.
For many investors, the move to a less accommodative monetary policy marks the beginning of a new phase in the economic cycle. At times such as these, when market conditions are in a period of transition, we believe it is especially important for you to stay in close contact with your financial advisor, who can help you position your portfolio in a way that is designed to respond to the challenges and opportunities of today's changing investment environment.
Thank you for your continued confidence and support.
Stephen E. Canter
Chairman and Chief Executive Officer
The Dreyfus Corporation
August 16, 2004
|
2

DISCUSSION OF FUND PERFORMANCE
Gerald E. Thunelius, Director and Senior Portfolio Manager Dreyfus Taxable Fixed Income Team
How did Dreyfus Institutional Yield Advantage Fund perform relative to its benchmark?
For the 12-month period ended July 31, 2004, the fund's Institutional shares achieved a total return of 0.25%, and its Investor shares achieved a total return of 0.02% .1 In comparison, the Citigroup 1-Year Treasury Benchmark-on-the-Run Index, the fund's benchmark, achieved a total return of 0.98% for the same period.2
The fund and its holdings of short-term bonds were influenced during the reporting period by stronger economic growth and the increasing possibility of higher short-term interest rates. Indeed, in late June 2004, the Federal Reserve Board (the "Fed") implemented its first rate-hike in approximately four years.The fund produced lower returns than its benchmark, primarily due to its yield curve positioning during the second half of the reporting period.
What is the fund's investment approach?
The fund seeks as high a level of current income as is consistent with the preservation of capital, with minimal changes in share price. To pursue its goal, the fund invests only in investment-grade fixed-income securities of U.S. and foreign issuers or the unrated equivalent as determined by Dreyfus. These securities may include U.S. government bonds and notes, corporate bonds, asset-backed securities and mortgage-related securities.
To help reduce share price fluctuations, the fund seeks to keep the average effective duration — a measure of sensitivity to changing interest rates — of its overall portfolio at one year or less.Although we expect the fund's average effective duration and its average effective maturity — the amount of time until the fund's holdings mature or are redeemed, on average — to follow each other closely, we may invest in securities with effective final maturities of any length.
The Fund 3
DISCUSSION OF FUND PERFORMANCE (continued)
|
When choosing securities for the fund, we analyze many factors in various fixed-income market sectors.We then decide how to allocate the fund's assets across these sectors and in which securities to invest.
What other factors influenced the fund's performance?
The fund was affected by shifts in investor sentiment as the fixed-income markets adjusted to stronger economic conditions. In fact, reports of stronger economic growth and the possibility of renewed inflationary pressures led to a sharp decline in most bond prices during the summer of 2003. In the fall, however, it became apparent that investors' fears were overblown, and that sluggish labor markets were likely to keep a lid on inflationary pressures for the time being. As a result, the bond market rallied through year-end, erasing most of the summer's decline. Although short-term interest rates remained at 1%, their lowest level since 1958, the fund participated to a degree in the market's recovery over the final months of 2003.
At the start of 2004, new signs of economic strength appeared, leading to renewed concerns that the Fed might begin to raise interest rates if inflationary pressures intensified. In addition, some sectors of the short-term bond market appeared overvalued to us, including corporate bonds and Treasury Inflation Protected Securities ("TIPS"), which are not components of the benchmark.We reduced the fund's position in those areas and redeployed the assets to nominal U.S. Treasury securities. In addition, we reduced the fund's average duration and positioned the fund's holdings of U.S.Treasury securities for what we believed would be a narrowing of yield differences, or "yield spreads," between shorter-and longer-term securities.
These strategies produced mixed results during the spring and summer of 2004.As short-term interest rates rose in anticipation of the Fed's June rate-hike, the fund benefited from its modestly short average duration, which gave us flexibility to capture higher yields as they became available. However, instead of narrowing as expected, yield spreads widened when investors grew concerned about disappointing employment data,
high energy prices and ongoing instability in Iraq.As a result, the fund's "yield curve" positioning generally detracted from its performance. Our previous reduction of the fund's holdings of short-term corporate bonds and TIPS also hindered returns somewhat, as these securities continued to rally. On the other hand, the fund's holdings of mortgage-backed securities, which also are not components of the benchmark, proved beneficial to performance.
What is the fund's current strategy?
We have continued to maintain what we regard as a relatively defensive investment posture, including a modestly shorter-than-average duration and holdings of U.S.Treasury securities that are positioned for narrower yield spreads.The fund also continues to hold securities that are not part of the benchmark,including short-term corporate bonds and mortgage-backed securities, which we believe are likely to generate competitive levels of current income and hold more of their value as interest rates rise. Of course, we will continue to actively monitor the fixed-income markets and make portfolio changes as warranted.
1 Total return includes reinvestment of dividends and any capital gains paid. Past performance is no
guarantee of future results. Share price, yield and investment return fluctuate such that upon
redemption, fund shares may be worth more or less than their original cost. Return figures
provided reflect the absorption of fund expenses by The Dreyfus Corporation pursuant to an
undertaking in effect that may be extended, terminated or modified at any time. Had these
expenses not been absorbed, the fund's returns would have been lower.
2 SOURCE: BLOOMBERG L.P. — Reflects reinvestment of dividends and, where applicable,
capital gain distributions.The Citigroup 1-Year Treasury Benchmark-on-the-Run Index is an
unmanaged index generally representative of the average yield on 1-year U.S.Treasury bills.The
index does not take into account charges, fees and other expenses.Total return is calculated on a
month-end basis.
|
The Fund 5
FUND PERFORMANCE
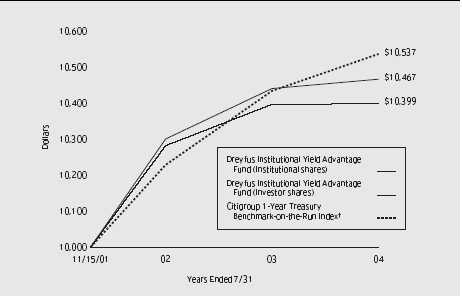
Comparison of change in value of $10,000 investment in Dreyfus Institutional Yield Advantage Fund Institutional shares and Investor shares and the Citigroup 1-Year Treasury Benchmark-on-the-Run Index
| Average Annual Total Returns | | as of 7/31/04 | | | | |
| | | Inception | | | | From |
| | | Date | | 1 Year | | Inception |
| |
| |
| |
|
| Institutional shares | | 11/15/01 | | 0.25% | | 1.70% |
| Investor shares | | 11/15/01 | | 0.02% | | 1.46% |
† Source: Bloomberg L.P.
Past performance is not predictive of future performance.The fund's performance shown in the graph and table does not reflect the deduction of taxes that a shareholder would pay on fund distributions or the redemption of fund shares. The above graph compares a $10,000 investment made in Institutional and Investor shares of Dreyfus Institutional Yield Advantage Fund on 11/15/01 (inception date) to a $10,000 investment made in the Citigroup 1-Year Treasury Benchmark-on-the-Run Index (the "Index") on that date. For comparative purposes, the value of the Index on 11/30/01 is used as the beginning value on 11/15/01.The fund's Institutional shares are not subject to a Rule 12b-1 fee.The fund's Investor shares are subject to a 0.25% annual Rule 12b-1 fee.All dividends and capital gain distributions are reinvested.
The fund invests primarily in investment-grade fixed-income securities of U.S. and foreign issuers and seeks to maintain an average effective duration of one year or less.The fund's performance shown in the line graph takes into account all applicable fees and expenses.The Index is an unmanaged index generally representative of the average yield on 1-year U.S.Treasury bills.The Index does not take into account charges, fees and other expenses. Further information relating to fund performance, including expense reimbursements, if applicable, is contained in the Financial Highlights section of the prospectus and elsewhere in this report.
6
UNDERSTANDING YOUR FUND'S EXPENSES
As a mutual fund investor, you pay ongoing expenses, such as management fees and other expenses. Using the information below, you can estimate how these expenses affect your investment and compare them with the expenses of other funds.You also may pay one-time transaction expenses, including sales charges (loads) and redemption fees, which are not shown in this section and would have resulted in higher total expenses. For more information, see your fund's prospectus or talk to your financial adviser.
Review your fund's expenses
The table below shows the expenses you would have paid on a $1,000 investment in Dreyfus Institutional Yield Advantage Fund from February 1, 2004 to July 31, 2004. It also shows how much a $1,000 investment would be worth at the close of the period, assuming actual returns and expenses.
| Expenses and Value of a $1,000 Investment | | |
| assuming actual returns for the six months ended July 31, 2004 | | |
| | | Investor Shares | | Institutional Shares |
| |
| |
|
| Expenses paid per $1,000 † | | $ 2.23 | | $ 1.00 |
| Ending value (after expenses) | | $ 995.60 | | $1,001.90 |
COMPARING YOUR FUND'S EXPENSES
WITH THOSE OF OTHER FUNDS
|
Using the SEC's method to compare expenses
The Securities and Exchange Commission (SEC) has established guidelines to help investors assess fund expenses. Per these guidelines, the table below shows your fund's expenses based on a $1,000 investment, assuming a hypothetical 5% annualized return. You can use this information to compare the ongoing expenses (but not transaction expenses or total costs) of investing in the fund with those of other funds.All mutual fund shareholder reports will provide this information to help you make this comparison. Please note that you cannot use this information to estimate your actual ending account balance and expenses paid during the period.
Expenses and Value of a $1,000 Investment
assuming a hypothetical 5% annualized return for the six months ended July 31, 2004
|
| | | Investor Shares | | Institutional Shares |
| |
| |
|
| Expenses paid per $1,000 † | | $ 2.26 | | $ 1.01 |
| Ending value (after expenses) | | $1,022.63 | | $1,023.87 |
† Expenses for each share class are calculated using the fund's annualized expense ratio for each class, which represents the ongoing expenses as a percentage of net assets for the six months ended 7/31/04.The expense ratio may differ for each share class. Expenses are calculated by multiplying the expense ratio by the average account value for the period; then multiplying the result by the number of days in the period; and then dividing that result by the number of days in the year.
The Fund 7
| | STATEMENT OF INVESTMENTS
July 31, 2004
|
| | | Principal | | | | |
| Bonds and Notes—73.1% | | Amount ($) | | Value ($) |
| |
| |
|
| Asset-Backed Ctfs./Home Equity Loans—7.4% | | | | |
| AAMES Mortgage Trust, | | | | | | |
| Ser. 1998-C, Cl. A2A, 5.912%, 2028 | | 667,744 | | | | 671,881 |
| ABFS Mortgage Loan Trust, | | | | | | |
| Ser. 1997-2, Cl. A5, 7.125%, 2029 | | 1,170,887 | | | | 1,189,479 |
| Conseco Finance Securitizations, | | | | | | |
| Ser. 2000-D, Cl. A3, 7.89%, 2018 | | 38 | | | | 39 |
| Long Beach Mortgage Loan Trust, | | | | | | |
| Ser. 2003-3, Cl. A, 1.77%, 2033 | | 1,087,760 | | a | | 1,089,811 |
| Residential Asset Securities, | | | | | | |
| Ser. 1998-KS3, Cl. AI7, 5.98%, 2029 | | 312,730 | | | | 318,803 |
| Residential Funding Mortgage Securities II, | | | | |
| Ser. 2004-HS2, Cl. AI3, 4.4%, 2019 | | 572,000 | | | | 575,575 |
| | | | | | | 3,845,588 |
| Automotive—6.0% | | | | | | |
| Ford Motor Credit, | | | | | | |
| Notes, 7.5%, 2005 | | 500,000 | | | | 515,276 |
| GMAC, | | | | | | |
| Notes, 2.56%, 2007 | | 1,652,000 | | a,b | | 1,651,982 |
| General Motors, | | | | | | |
| Notes, 6.25%, 2005 | | 500,000 | | | | 508,149 |
| Johnson Controls, | | | | | | |
| Notes, 1.59%, 2005 | | 400,000 | | a | | 400,430 |
| | | | | | | 3,075,837 |
| Commercial Mortgage Pass-Through Ctfs.—14.8% | | | | |
| Banc of America Structured Notes, | | | | | | |
| Ser. 2002-1A, Cl. B, 5.86%, 2014 | | 1,100,000 | | a,c | | 1,004,781 |
| COMM: | | | | | | |
| Ser. 2000-FL2A, Cl. E, 2.37%, 2011 | | 4,336,000 | | a,c | | 4,255,280 |
| Ser. 2001-FL5A, Cl. G, 2.243%, 2013 | | 2,000,000 | | a,c | | 1,981,476 |
| CS First Boston Mortgage Securities, | | | | | | |
| Ser. 2001-CK3, Cl. A1, 5.26%, 2034 | | 381,868 | | | | 389,561 |
| | | | | | | 7,631,098 |
| Financial Services—1.8% | | | | | | |
| CIT, | | | | | | |
| Notes, 1.48%, 2007 | | 478,000 | | a | | 478,310 |
| International Lease Finance, | | | | | | |
| Notes, 8.375%, 2004 | | 425,000 | | | | 435,126 |
| | | | | | | 913,436 |
8
| | | Principal | | |
| Bonds and Notes (continued) | | Amount ($) | | Value ($) |
| |
| |
|
| Food & Beverages—.9% | | | | |
| PepsiCo, | | | | |
| Notes, 3.2%, 2007 | | 485,000 b | | 484,277 |
| Health Care—1.0% | | | | |
| Boston Scientific, | | | | |
| Notes, 6.625%, 2005 | | 510,000 | | 522,753 |
| Industrial—1.9% | | | | |
| Tyco International: | | | | |
| Notes, 5.8%, 2006 | | 130,000 b | | 136,045 |
| Participation Certificate Trust, 4.436%, 2007 | | 817,000 c | | 824,103 |
| | | | | 960,148 |
| Insurance—9.2% | | | | |
| ACE INA, | | | | |
| Sr. Notes, 8.2%, 2004 | | 960,000 | | 961,904 |
| ASIF Global Financing, | | | | |
| Notes, 1.719%, 2007 | | 2,366,000 a,c | | 2,371,915 |
| Genworth Financial, | | | | |
| Notes, 1.67%, 2007 | | 260,000 a | | 260,335 |
| MetLife, | | | | |
| Debs., 3.911%, 2005 | | 750,000 | | 759,846 |
| Protective Life U.S. Funding Trust, | | | | |
| Sr. Secured Notes, 1.48%, 2006 | | 385,000 a,c | | 386,069 |
| | | | | 4,740,069 |
| Mining & Metals—.5% | | | | |
| Falconbridge, | | | | |
| Debs., 7.375%, 2005 | | 270,000 | | 281,759 |
| Oil & Gas—3.0% | | | | |
| EnCana, | | | | |
| Notes, 4.6%, 2009 | | 550,000 | | 554,019 |
| Occidental Petroleum, | | | | |
| Sr. Notes, 6.5%, 2005 | | 695,000 | | 714,270 |
| Ocean Energy, | | | | |
| Sr. Notes, 4.375%, 2007 | | 264,000 | | 267,918 |
| | | | | 1,536,207 |
| Real Estate Investment Trusts—.3% | | | | |
| New Plan Excel Realty Trust, | | | | |
| Sr. Notes, 6.875%, 2004 | | 165,000 | | 166,470 |
The Fund 9
S T A T E M E N T O F I N V E S T M E N T S (continued)
| | | Principal | | | | |
| Bonds and Notes (continued) | | Amount ($) | | Value ($) |
| |
| |
|
| Residential Mortgage Pass-Through Ctfs.—3.5% | | | | |
| Bank of America Mortgage Securities II, | | | | | | |
| Ser. 2004-D, Cl. 2A3, 1.62%, 2034 | | 850,167 | | a | | 847,378 |
| Countrywide Alternative Loan Trust, | | | | | | |
| Ser. 2004-7T1, Cl. A1, 5.75%, 2034 | | 928,849 | | | | 940,284 |
| | | | | | | 1,787,662 |
| Retail—.3% | | | | | | |
| May Department Stores, | | | | | | |
| Notes, 3.95%, 2007 | | 135,000 | | b,c | | 135,092 |
| Structured Index—3.6% | | | | | | |
| HSBC Bank USA, Tranched Investment-Grade | | | | |
| Enhanced Return Securities ("TIGERS"): | | | | | | |
| Medium Term Notes: | | | | | | |
| Ser. 2003-2, 4.4%, 2008 | | 500,000 | | a,c,d | | 490,500 |
| Ser. 2003-3, Cl. D-1, 4.4%, 2008 | | 370,000 | | a,c,d | | 369,970 |
| Ser. 2003-4, 4.8%, 2008 | | 1,000,000 | | a,c,d | | 1,002,909 |
| | | | | | | 1,863,379 |
| Telecommunications—.8% | | | | | | |
| Verizon Wireless Capital, | | | | | | |
| Notes, 1.35%, 2005 | | 390,000 | | a,c | | 389,911 |
| Transportation—.8% | | | | | | |
| MISC Capital, | | | | | | |
| Notes, 5%, 2009 | | 429,000 | | c | | 435,109 |
| U.S. Government—1.6% | | | | | | |
| U.S. Treasury Notes, | | | | | | |
| 1.5%, 3/31/2006 | | 837,000 | | | | 823,824 |
| U.S. Government Agencies—8.4% | | | | | | |
| Federal Home Loan Bank, | | | | | | |
| Bonds, Ser. 430, 2.875%, 9/15/2006 | | 1,205,000 | | | | 1,203,045 |
| Federal National Mortgage Association, | | | | | | |
| Notes, 2.375%, 2/15/2007 | | 3,170,000 | | | | 3,109,865 |
| | | | | | | 4,312,910 |
| U.S. Government Agencies/Mortgage-Backed—3.5% | | | | |
| Federal Home Loan Mortgage Corp: | | | | | | |
| REMIC Trust, Gtd. Multiclass Mortgage Participation Ctfs., | | | | |
| Ser. 2535, Cl. PL, 4%, 6/15/2029 | | 380,113 | | | | 383,087 |
| Structured Pass-Through Securities, | | | | | | |
| Ser. H005, Cl. A2, 2.55%, 8/15/2007 | | 307,247 | | | | 306,498 |
| | | Principal | | |
| Bonds and Notes (continued) | | Amount ($) | | Value ($) |
| |
| |
|
| U.S. Government Agencies/Mortgage-Backed (continued) | | |
| Federal National Mortgage Association, | | | | |
| REMIC Trust, Gtd. Pass-Through Ctfs., | | | | |
| Ser. 2002-55, Cl. GD, 5.5%, 11/25/2015 | | 582,743 | | 590,729 |
| Government National Mortgage Association I, | | | | |
| Ser. 2002-52, Cl. AG, 6%, 9/20/2029 | | 535,515 | | 545,005 |
| | | | | 1,825,319 |
| Utilities/Gas & Electric—3.8% | | | | |
| Appalachian Power, | | | | |
| Notes, 1.93%, 2007 | | 220,000 a | | 220,090 |
| FPL Group Capital, | | | | |
| Notes, 1.886%, 2005 | | 390,000 a | | 390,696 |
| KeySpan, | | | | |
| Sr. Notes, 7.25%, 2005 | | 500,000 | | 529,630 |
| TXU Energy, | | | | |
| Notes, 2.38%, 2006 | | 827,000 a,c | | 826,910 |
| | | | | 1,967,326 |
| Total Bonds and Notes | | | | |
| (cost $37,787,337) | | | | 37,698,174 |
| |
| |
|
| |
| Other Investments—23.9% | | Shares | | Value ($) |
| |
| |
|
| Registered Investment Company; | | | | |
| Dreyfus Institutional Preferred Plus Money Market Fund | | |
| (cost $12,345,000) | | 12,345,000 e | | 12,345,000 |
| |
| |
|
| | | Principal | | |
| Short-Term Investments—2.3% | | Amount ($) | | Value ($) |
| |
| |
|
| U.S. Treasury Bills; | | | | |
| .99%, 9/9/2004 | | | | |
| (cost $1,178,747) | | 1,180,000 f | | 1,178,419 |
The Fund 11
S T A T E M E N T O F I N V E S T M E N T S (continued)
| Investment of Cash Collateral | | | | |
| for Securities Loaned—4.1% | | Shares | | Value ($) |
| |
| |
|
| Registered Investment Company, | | | | |
| Dreyfus Institutional Cash Advantage Plus Fund | | | | |
| (cost $2,113,040) | | 2,113,040 e | | 2,113,040 |
| |
| |
|
| Total Investments (cost $53,424,124) | | 103.4% | | 53,334,633 |
| Liabilities, Less Cash and Receivables | | (3.4%) | | (1,735,059) |
| Net Assets | | 100.0% | | 51,599,574 |
a Variable rate security-interest rate subject to periodic change.
b All or a portion of these securities are on loan.At July 31, 2004, the total market value of the fund's securities on
loan is $2,066,791 and the total market value of the collateral held by the fund is $2,113,040.
c Securities exempt from registration under Rule 144A of the Securities Act of 1933.These securities may be resold in
transactions exempt from registration, normally to qualified institutional buyers.At July 31, 2004, these securities
amounted to $14,474,025 or 28.1% of net assets.
d Securities linked to a portfolio of debt securities.
e Investments in affiliated money market mutual funds.
f Partially held by a broker as collateral for open financial futures positions.
|
| Portfolio Summary † | | | | | | |
| |
| | | Value (%) | | | | Value (%) |
| |
| |
| |
|
| Corporate Bonds | | 30.3 | | U.S. Government/Agency securities | | 13.5 |
| Short-Term/Money | | | | Structured Index | | 3.6 |
| Market Investments | | 30.3 | | Futures contracts | | (.1) |
| Mortgage/Asset backed securities | | 25.7 | | | | 103.3 |
| | † Based on net assets.
See notes to financial statements.
|
12
STATEMENT OF FINANCIAL FUTURES
July 31, 2004
| | | | | Market Value | | | | Unrealized |
| | | | | Covered by | | | | (Depreciation) |
| | | Contracts | | Contracts ($) | | Expiration | | at 7/31/2004 ($) |
| |
| |
| |
| |
|
| Financial Futures Short | | | | | | | | |
| U.S. Treasury 2 Year Notes | | 9 | | 1,900,125 | | September 2004 | | (3,453) |
| U.S. Treasury 5 Year Notes | | 32 | | 3,504,000 | | September 2004 | | (22,969) |
| | | | | | | | | (26,422) |
See notes to financial statements.
|
The Fund 13
| | STATEMENT OF ASSETS AND LIABILITIES
July 31, 2004
|
| | | Cost | | Value |
| |
| |
|
| Assets ($): | | | | |
| Investments in securities— | | | | |
| See Statement of Investments (including securities | | |
| on loan, valued at $2,066,791)—Note 1(b): | | |
| Unaffiliated issuers | | 38,966,084 | | 38,876,593 |
| Affiliated issuers | | 14,458,040 | | 14,458,040 |
| Receivable for investment securities sold | | 1,746,199 |
| Interest receivable | | | | 255,139 |
| Paydowns receivable | | | | 35,304 |
| Prepaid expenses | | | | 17,858 |
| | | | | 55,389,133 |
| |
| |
|
| Liabilities ($): | | | | |
| Due to The Dreyfus Corporation and affiliates—Note 3(b) | | 15,881 |
| Cash overdraft due to Custodian | | 909,276 |
| Liability for securities on loan—Note 1(b) | | 2,113,040 |
| Payable for investment securities purchased | | 672,993 |
| Payable for futures variation margin—Note 4 | | 20,186 |
| Payable for shares of Common Stock redeemed | | 8,169 |
| Accrued expenses | | | | 50,014 |
| | | | | 3,789,559 |
| |
| |
|
| Net Assets ($) | | | | 51,599,574 |
| |
| |
|
| Composition of Net Assets ($): | | |
| Paid-in capital | | | | 61,524,613 |
| Accumulated undistributed investment income—net | | 144,416 |
| Accumulated net realized gain (loss) on investments | | (9,953,542) |
| Accumulated net unrealized appreciation (depreciation) | | |
| on investments [including ($26,422) net unrealized | | |
| (depreciation) on financial futures] | | (115,913) |
| |
|
| Net Assets ($) | | | | 51,599,574 |
| Net Asset Value Per Share | | | | |
| | | Investor Shares | | Institutional Shares |
| |
| |
|
| Net Assets ($) | | 28,925,575 | | 22,673,999 |
| Shares Outstanding | | 15,121,594 | | 11,860,525 |
| |
| |
|
| Net Asset Value Per Share ($) | | 1.91 | | 1.91 |
See notes to financial statements.
14
STATEMENT OF OPERATIONS
July 31, 2004
|
| Investment Income ($): | | |
| Interest | | 2,096,763 |
| Dividends; | | |
| Affiliated issuers | | 61,190 |
| Income from securities lending | | 3,350 |
| Total Income | | 2,161,303 |
| Expenses: | | |
| Management fee—Note 3(a) | | 169,209 |
| Service fees (Investor Shares)—Note 3(b) | | 75,866 |
| Registration fees | | 48,273 |
| Auditing fees | | 33,143 |
| Prospectus and shareholders' reports | | 23,090 |
| Custodian fees—Note 3(b) | | 9,573 |
| Legal fees | | 7,771 |
| Shareholder servicing costs—Note 3(b) | | 5,763 |
| Directors' fees and expenses—Note 3(c) | | 2,847 |
| Miscellaneous | | 9,929 |
| Total Expenses | | 385,464 |
| Less—reduction in management fee due to | | |
| undertaking—Note 3(a) | | (140,389) |
| Net Expenses | | 245,075 |
| Investment Income—Net | | 1,916,228 |
| |
|
| Realized and Unrealized Gain (Loss) on Investments—Note 4 ($): |
| Net realized gain (loss) on investments | | (6,683,524) |
| Net realized gain (loss) on financial futures | | (106,071) |
| Net Realized Gain (Loss) | | (6,789,595) |
| Net unrealized appreciation (depreciation) on investments | | |
| [including ($426,790) net unrealized (depreciation) on financial futures] | | 5,298,039 |
| Net Realized and Unrealized Gain (Loss) on Investments | | (1,491,556) |
| Net Increase in Net Assets Resulting from Operations | | 424,672 |
See notes to financial statements.
|
The Fund 15
STATEMENT OF CHANGES IN NET ASSETS
| | | | | Year Ended July 31, |
| |
| |
|
| | | 2004 | | 2003 |
| |
| |
|
| Operations ($): | | | | |
| Investment income—net | | 1,916,228 | | 10,110,249 |
| Net realized gain (loss) on investments | | (6,789,595) | | 1,446,627 |
| Net unrealized appreciation | | | | |
| (depreciation) on investments | | 5,298,039 | | (7,131,772) |
| Net Increase (Decrease) in Net Assets | | | | |
| Resulting from Operations | | 424,672 | | 4,425,104 |
| |
| |
|
| Dividends to Shareholders from ($): | | | | |
| Investment income—net: | | | | |
| Investor Shares | | (787,168) | | (1,933,626) |
| Institutional Shares | | (1,605,259) | | (10,067,831) |
| Total Dividends | | (2,392,427) | | (12,001,457) |
| |
| |
|
| Capital Stock Transactions ($): | | | | |
| Net proceeds from shares sold: | | | | |
| Investor Shares | | 10,795,418 | | 124,158,647 |
| Institutional Shares | | 13,685,303 | | 339,518,910 |
| Dividends reinvested: | | | | |
| Investor Shares | | 729,819 | | 1,796,515 |
| Institutional Shares | | 513,632 | | 1,750,406 |
| Cost of shares redeemed: | | | | |
| Investor Shares | | (12,197,986) | | (108,947,482) |
| Institutional Shares | | (156,347,477) | | (422,398,938) |
| Increase (Decrease) in Net Assets from | | | | |
| Capital Stock Transactions | | (142,821,291) | | (64,121,942) |
| Total Increase (Decrease) in Net Assets | | (144,789,046) | | (71,698,295) |
| |
| |
|
| Net Assets ($): | | | | |
| Beginning of Period | | 196,388,620 | | 268,086,915 |
| End of Period | | 51,599,574 | | 196,388,620 |
| Undistributed investment income—net | | 144,416 | | 193,599 |
| | | | | Year Ended July 31, |
| |
| |
|
| | | 2004 | | 2003 |
| |
| |
|
| Capital Share Transactions: | | | | |
| Investor Shares | | | | |
| Shares sold | | 5,554,270 | | 62,409,279 |
| Shares issued for dividends reinvested | | 377,108 | | 909,366 |
| Shares redeemed | | (6,300,222) | | (55,249,523) |
| Net Increase (Decrease) in Shares Outstanding | | (368,844) | | 8,069,122 |
| |
| |
|
| Institutional Shares | | | | |
| Shares sold | | 7,014,722 | | 171,170,592 |
| Shares issued for dividends reinvested | | 264,674 | | 886,754 |
| Shares redeemed | | (80,150,777) | | (214,138,637) |
| Net Increase (Decrease) in Shares Outstanding | | (72,871,381) | | (42,081,291) |
See notes to financial statements.
|
The Fund 17
The following tables describe the performance for each share class for the fiscal periods indicated.All information (except portfolio turnover rate) reflects financial results for a single fund share.Total return shows how much your investment in the fund would have increased (or decreased) during each period, assuming you had reinvested all dividends and distributions.These figures have been derived from the fund's financial statements.
| | | | | Year Ended July 31, |
| |
| |
|
| Investor Shares | | 2004 | | 2003 | | 2002 a |
| |
| |
| |
|
| Per Share Data ($): | | | | | | |
| Net asset value, beginning of period | | 1.96 | | 2.00 | | 2.00 |
| Investment Operations: | | | | | | |
| Investment income—net b | | .04 | | .05 | | .05 |
| Net realized and unrealized | | | | | | |
| gain (loss) on investments | | (.04) | | (.03) | | .01 |
| Total from Investment Operations | | .00 | | .02 | | .06 |
| Distributions: | | | | | | |
| Dividends from investment income—net | | (.05) | | (.06) | | (.06) |
| Net asset value, end of period | | 1.91 | | 1.96 | | 2.00 |
| |
| |
| |
|
| Total Return (%) | | .02 | | 1.12 | | 2.82c |
| |
| |
| |
|
| Ratios/Supplemental Data (%): | | | | | | |
| Ratio of total expenses to average net assets | | .63 | | .51 | | .89d |
| Ratio of net expenses to average net assets | | .45 | | .45 | | .45d |
| Ratio of net investment income | | | | | | |
| to average net assets | | 1.94 | | 2.55 | | 3.71d |
| Portfolio Turnover Rate | | 461.50 | | 441.13 | | 98.01c |
| |
| |
| |
|
| Net Assets, end of period ($ x 1,000) | | 28,926 | | 30,368 | | 14,833 |
| | a From November 15, 2001 (commencement of operations) to July 31, 2002.
b Based on average shares outstanding at each month end.
c Not annualized.
d Annualized.
|
See notes to financial statements.
18
| | | | | Year Ended July 31, |
| |
| |
|
| Institutional Shares | | 2004 | | 2003 | | 2002 a |
| |
| |
| |
|
| Per Share Data ($): | | | | | | |
| Net asset value, beginning of period | | 1.96 | | 2.00 | | 2.00 |
| Investment Operations: | | | | | | |
| Investment income—net b | | .04 | | .06 | | .06 |
| Net realized and unrealized | | | | | | |
| gain (loss) on investments | | (.04) | | (.03) | | — |
| Total from Investment Operations | | .00 | | .03 | | .06 |
| Distributions: | | | | | | |
| Dividends from investment income—net | | (.05) | | (.07) | | (.06) |
| Net asset value, end of period | | 1.91 | | 1.96 | | 2.00 |
| |
| |
| |
|
| Total Return (%) | | .25 | | 1.37 | | 3.00c |
| |
| |
| |
|
| Ratios/Supplemental Data (%): | | | | | | |
| Ratio of total expenses to average net assets | | .36 | | .26 | | .37d |
| Ratio of net expenses to average net assets | | .20 | | .20 | | .20d |
| Ratio of net investment income | | | | | | |
| to average net assets | | 2.45 | | 2.77 | | 4.10d |
| Portfolio Turnover Rate | | 461.50 | | 441.13 | | 98.01c |
| |
| |
| |
|
| Net Assets, end of period ($ x 1,000) | | 22,674 | | 166,020 | | 253,254 |
a From November 15, 2001 (commencement of operations) to July 31, 2002.
b Based on average shares outstanding at each month end.
c Not annualized.
d Annualized.
See notes to financial statements.
|
The Fund 19
NOTES TO FINANCIAL STATEMENTS
NOTE 1—Significant Accounting Policies:
Dreyfus Institutional Yield Advantage Fund (the "fund") is a separate diversified series of Dreyfus Investment Grade Funds, Inc. (the "Company") which is registered under the Investment Company Act of 1940, as amended (the "Act"), as an open-end management investment company and operates as a series company currently offering five series, including the fund. The fund's investment objective is to provide investors with as high a level of current income as is consistent with the preservation of capital with minimal changes in share price. The Dreyfus Corporation (the "Manager" or "Dreyfus") serves as the fund's investment adviser.The Manager is a wholly-owned subsidiary of Mellon Financial Corporation ("Mellon Financial"). Dreyfus Service Corporation (the "Distributor"), a wholly-owned subsidiary of the Manager, is the distributor of the fund's shares which are sold to the public without a sales charge.
The fund is authorized to issue 500 million shares of $.001 par value Common Stock in each of the following classes of shares: Investor and Institutional. Investor shares are subject to a Service Plan adopted pursuant to Rule 12b-1 under the Act. Other differences between the classes include the services offered to and the expenses borne by each class, the minimum initial investment and certain voting rights. Income, expenses (other than expenses attributable to a specific class), and realized and unrealized gains or losses on investments are allocated to each class of shares based on its relative net assets.
The Company accounts separately for the assets, liabilities and operations of each series. Expenses directly attributable to each series are charged to that series' operations; expenses which are applicable to all series are allocated among them on a pro rata basis.
The fund's financial statements are prepared in accordance with U.S. generally accepted accounting principles, which may require the use of management estimates and assumptions. Actual results could differ from those estimates.
20
The fund enters into contracts that contain a variety of indemnifications. The fund's maximum exposure under these arrangements is unknown.The fund does not anticipate recognizing any loss related to these arrangements.
(a) Portfolio valuation: Investments in securities (excluding short-term investments (other than U.S.Treasury Bills), and financial futures) are valued each business day by an independent pricing service (the "Service") approved by the Board of Directors. Investments for which quoted bid prices are readily available and are representative of the bid side of the market in the judgment of the Service are valued at the mean between the quoted bid prices (as obtained by the Service from dealers in such securities) and asked prices (as calculated by the Service based upon its evaluation of the market for such securities). Other investments (which constitute a majority of the portfolio securities) are valued as determined by the Service, based on methods which include consideration of: yields or prices of securities of comparable quality, coupon, maturity and type; indications as to values from dealers; and general market conditions. Securities for which there are no such valuations are valued at fair value as determined in good faith under the direction of the Board of Directors. Restricted securities, as well as securities or other assets for which recent market quotations are not readily available, that are not valued by a pricing service approved by the Board of Directors,or are determined by the fund not to reflect accurately fair value (such as when an event occurs after the close of the exchange on which the security is principally traded and that is determined by the fund to have changed the value of the security), are valued at fair value as determined in good faith under the direction of the Board of Directors.The factors that may be considered when fair valuing a security include fundamental analytical data, the nature and duration of restrictions on disposition, an evaluation of the forces that influence the market in which the securities are purchased and sold, and public trading in similar securities of the issuer or comparable issuers.Short-term investments,excluding U.S.Treasury Bills, are carried at amortized cost,which approximates value.Financial futures,
The Fund 21
| | NOTES TO FINANCIAL STATEMENTS (continued)
|
which are traded on an exchange, are valued at the last sales price on the securities exchange on which such securities are primarily traded or at the last sales price on the national securities market on each business day.
(b) Securities transactions and investment income: Securities transactions are recorded on a trade date basis. Realized gain and loss from securities transactions are recorded on the identified cost basis. Dividend income is recognized on the ex-dividend date and interest income, including, where applicable, amortization of discount and premium on investments, is recognized on the accrual basis.
The fund has an arrangement with the custodian bank whereby the fund receives earnings credits from the custodian when positive cash balances are maintained, which are used to offset custody fees. For financial reporting purposes, the fund includes net earnings credits as an expense offset in the Statement of Operations.
The fund may lend securities to qualified institutions.At origination, all loans are secured by collateral of at least 102% of the value of U.S. securities loaned and 105% of the value of foreign securities loaned. Collateral equivalent to at least 100% of the market value of securities on loan will be maintained at all times. Cash collateral is invested in certain money market mutual funds managed by the Manager. The fund will be entitled to receive all income on securities loaned, in addition to income earned as a result of the lending transaction. Although each security loaned is fully collateralized, the fund would bear the risk of delay in recovery of, or loss of rights in, the securities loaned should a borrower fail to return the securities in a timely manner.
(c) Affiliated issuers: Investments in other investment companies advised by the Manager are defined as "affiliated" in the Act.
(d) Dividends to shareholders: It is the policy of the fund to declare dividends daily from investment income-net. Such dividends are paid monthly. Dividends from net realized capital gain, if any, are normally declared and paid annually, but the fund may make distributions on a
22
more frequent basis to comply with the distribution requirements of the Internal Revenue Code of 1986, as amended (the "Code").To the extent that net realized capital gain can be offset by capital loss carryovers, it is the policy of the fund not to distribute such gain.Income and capital gain distributions are determined in accordance with income tax regulations, which may differ from U.S. generally accepted accounting principles.
(e) Federal income taxes: It is the policy of the fund to continue to qualify as a regulated investment company, if such qualification is in the best interests of its shareholders, by complying with the applicable provisions of the Code, and to make distributions of taxable income sufficient to relieve it from substantially all federal income and excise taxes.
At July 31, 2004, the components of accumulated earnings on a tax basis were as follows: undistributed ordinary income $143,758, accumulated capital losses $2,907,145 and unrealized depreciation $89,491. In addition, the fund had $7,072,819 of capital losses realized after October 31, 2003, which were deferred for tax purposes to the first day of the following fiscal year.
The accumulated capital loss carryover is available to be applied against future net securities profits, if any, realized subsequent to July 31, 2004. If not applied, $2,281,578 of the carryover expires in fiscal 2011 and $625,567 expires in fiscal 2012.
The tax character of distributions paid to shareholders during the fiscal periods ended July 31, 2004 and July 31, 2003 were as follows: ordinary income $2,392,427 and $12,001,457, respectively.
During the period ended July 31, 2004, as a result of permanent book to tax differences primarily from paydown gains and losses on mortgage backed securities and the sales treatment for treasury inflation protected securities, the fund increased accumulated undistributed investment income-net by $427,016 and decreased net realized gain (loss) on investments by the same amount. Net assets were not affected by this reclassification.
The Fund 23
| | NOTES TO FINANCIAL STATEMENTS (continued)
|
NOTE 2—Bank Line of Credit:
|
The fund participates with other Dreyfus-managed funds in a $100 million unsecured line of credit primarily to be utilized for temporary or emergency purposes, including the financing of redemptions. Interest is charged to the fund based on prevailing market rates in effect at the time of borrowings. During the period ended July 31, 2004, the fund did not borrow under the line of credit.
NOTE 3—Management Fee and Other Transactions With Affiliates:
(a) Pursuant to a management agreement ("Agreement") with the Manager, the management fee is computed at the annual rate of .20 of 1% of the value of the fund's average daily net assets and is payable monthly. The Manager has undertaken from August 1, 2003 through July 31, 2004, to reduce the management fee paid by the fund, if the fund's aggregate expenses, exclusive of taxes, brokerage fees, interest on borrowings, service plan fees and extraordinary expenses, exceed an annual rate of .20 of 1% of the value of the fund's average daily net assets.The reduction in management fee, pursuant to the undertaking, amounted to $140,389 during the period ended July 31, 2004.
(b) Under the Investor Shares Service Plan (the "Plan") adopted pursuant to Rule 12b-1 under the Act, the fund pays the Distributor for distributing the fund's Investor Shares, for servicing shareholder accounts ("Servicing") and for advertising and marketing relating to the fund's Investor Shares.The Plan provides for payments to be made at an annual rate of .25 of 1% of the value of the average daily net assets of Investor Shares.The Distributor determines the amounts, if any, to be paid to Service Agents (a securities dealer, financial institution or other industry professional) under the Plan and the basis on which such payments are made.The fees payable under the Plan are payable without regard to actual expenses incurred. During the period ended July 31, 2004, Investor Shares were charged $75,866 pursuant to the Plan.
The fund compensates Dreyfus Transfer,Inc.,a wholly-owned subsidiary of the Manager, under a transfer agency agreement for providing per-
24
sonnel and facilities to perform transfer agency services for the fund. During the period ended July 31, 2004, the fund was charged $1,970 pursuant to the transfer agency agreement.
The fund compensates Mellon Bank, N.A., an affiliate of the Manager, under a custody agreement for providing custodial services for the fund. During the period ended July 31, 2004, the fund was charged $9,573 pursuant to the custody agreement.
The components of Due to The Dreyfus Corporation and affiliates in the Statement of Assets and Liabilities consists of: management fees $8,714, custody fees $1,666, 12b-1 distribution plan fees $6,116 and transfer agency per account fees $276, which are offset against an expense reimbursement currently in effect in the amount of $891.
(c) Each Board member also serves as a Board member of other funds within the Dreyfus complex. Annual retainer fees and attendance fees are allocated to each fund based on net assets.
(d) Pursuant to an exemptive order from the Securities and Exchange Commission, the fund may invest its available cash balances in affiliated money market mutual funds. Management fees of the underlying money market mutual funds have been waived by the Manager.
NOTE 4—Securities Transactions:
The aggregate amount of purchases and sales (including paydowns) of investment securities, excluding short-term securities and financial futures, during the period ended July 31, 2004, amounted to $358,512,053 and $514,145,211, respectively.
The fund may invest in financial futures contracts in order to gain exposure to or protect against changes in the market. The fund is exposed to market risk as a result of changes in the value of the underlying financial instruments. Investments in financial futures require the fund to "mark to market" on a daily basis, which reflects the change in market value of the contracts at the close of each day's trading.Accordingly, variation margin payments are received or made to reflect daily unrealized gains and losses. When the contracts are
The Fund 25
NOTES TO FINANCIAL STATEMENTS (continued)
|
closed, the fund recognizes a realized gain or loss.These investments require initial margin deposits with a broker, which consist of cash or cash equivalents.The amount of these deposits is determined by the exchange or Board of Trade on which the contract is traded and is subject to change. Contracts open at July 31, 2004, are set forth in the Statement of Financial Futures.
At July 31, 2004, the cost of investments for federal income tax purposes was $53,424,124; accordingly, accumulated net unrealized depreciation on investments was $89,491, consisting of $85,878 gross unrealized appreciation and $175,369 gross unrealized depreciation.
Two class actions (which have been consolidated) have been filed against Mellon Financial and Mellon Bank, N.A., and Dreyfus and Founders Asset Management LLC (the "Investment Advisers"), and the directors of all or substantially all of the Dreyfus funds, alleging that the Investment Advisers improperly used assets of the Dreyfus funds, in the form of directed brokerage commissions and 12b-1 fees, to pay brokers to promote sales of Dreyfus funds,and that the use of fund assets to make these payments was not properly disclosed to investors.The complaints further allege that the directors breached their fiduciary duties to fund shareholders under the Investment Company Act of 1940 and at common law. The complaints seek unspecified compensatory and punitive damages, rescission of the funds' contracts with the Investment Advisers, an accounting of all fees paid, and an award of attorneys' fees and litigation expenses. Dreyfus and the Dreyfus funds believe the allegations to be totally without merit and will defend the actions vigorously.
Additional lawsuits arising out of these circumstances and presenting similar allegations and requests for relief may be filed against the defendants in the future. Neither Dreyfus nor the Dreyfus funds believe that any of the pending actions will have a material adverse effect on the Dreyfus funds or Dreyfus' ability to perform its contracts with the Dreyfus funds.
26
REPORT OF INDEPENDENT REGISTERED
PUBLIC ACCOUNTING FIRM
|
| | Shareholders and Board of Directors
Dreyfus Institutional Yield Advantage Fund
|
We have audited the accompanying statement of assets and liabilities, including the statements of investments and financial futures, of Dreyfus Institutional Yield Advantage Fund (one of the funds comprising Dreyfus Investment Grade Funds, Inc.), as of July 31, 2004, and the related statement of operations for the year then ended, the statement of changes in net assets for each of the two years in the period then ended, and financial highlights for each of the periods indicated therein.These financial statements and financial highlights are the responsibility of the Fund's management. Our responsibility is to express an opinion on these financial statements and financial highlights based on our audits.
We conducted our audits in accordance with the standards of the Public Company Accounting Oversight Board (United States).Those standards require that we plan and perform the audit to obtain reasonable assurance about whether the financial statements and financial highlights are free of material misstatement. An audit includes examining, on a test basis, evidence supporting the amounts and disclosures in the financial statements and financial highlights. Our procedures included verification by examination of securities held by the custodian as of July 31, 2004 and confirmation of securities not held by the custodian by correspondence with others.An audit also includes assessing the accounting principles used and significant estimates made by management, as well as evaluating the overall financial statement presentation. We believe that our audits provide a reasonable basis for our opinion.
In our opinion, the financial statements and financial highlights referred to above present fairly, in all material respects, the financial position of Dreyfus Institutional Yield Advantage Fund at July 31, 2004, the results of its operations for the year then ended, the changes in its net assets for each of the two years in the period then ended, and the financial highlights for each of the indicated periods, in conformity with U.S. generally accepted accounting principles.

| | New York, New York
September 15, 2004
|
The Fund 27
BOARD MEMBERS INFORMATION (Unaudited)
Joseph S. DiMartino (60)
Chairman of the Board (1995)
|
Principal Occupation During Past 5 Years:
• Corporate Director and Trustee
|
Other Board Memberships and Affiliations:
|
- The Muscular Dystrophy Association, Director
- Levcor International, Inc., an apparel fabric processor, Director
- Century Business Services, Inc., a provider of outsourcing functions for small and medium sizecompanies, Director
- The Newark Group, a provider of a national market of paper recovery facilities, paperboardmills and paperboard converting plants, Director
No. of Portfolios for which Board Member Serves: 186
Clifford L. Alexander, Jr. (70)
Board Member (2003)
|
Principal Occupation During Past 5 Years:
|
- President of Alexander & Associates, Inc., a management consulting firm ( January 1981-present)
- Chairman of the Board of Moody's Corporation (October 2000-October 2003)
- Chairman of the Board and Chief Executive Officer of The Dun and Bradstreet Corporation(October 1999-September 2000)
Other Board Memberships and Affiliations:
|
- Wyeth (formerly, American Home Products Corporation), a global leader in pharmaceuticals,consumer healthcare products and animal health products, Director
- Mutual of America Life Insurance Company, Director
No. of Portfolios for which Board Member Serves: 65
|
———————
Lucy Wilson Benson (76) Board Member (1994)
Principal Occupation During Past 5 Years:
• President of Benson and Associates, consultants to business and government (1980-present)
Other Board Memberships and Affiliations:
|
- The International Executive Services Corps., Director
- Citizens Network for Foreign Affairs,Vice Chairperson
- Council on Foreign Relations, Member
- Lafayette College Board of Trustees,Vice Chairperson Emeritus
- Atlantic Council of the U.S., Director
No. of Portfolios for which Board Member Serves: 39
|
David W. Burke (68) Board Member (1994)
Principal Occupation During Past 5 Years:
• Corporate Director and Trustee
Other Board Memberships and Affiliations:
- John F. Kennedy Library Foundation, Director
- U.S.S. Constitution Museum, Director
No. of Portfolios for which Board Member Serves: 83
Whitney I. Gerard (69) Board Member (1993)
Principal Occupation During Past 5 Years:
• Partner of Chadbourne & Parke LLP
No. of Portfolios for which Board Member Serves: 37
Arthur A. Hartman (78) Board Member (1992)
Principal Occupation During Past 5 Years:
- Chairman of First NIS Regional Fund (ING/Barings Management) and New Russia Fund
- Advisory Council Member to Barings-Vostok
Other Board Memberships and Affiliations:
• APCO Associates Inc., Senior Consultant
No. of Portfolios for which Board Member Serves: 37
George L. Perry (70) Board Member (1992)
Principal Occupation During Past 5 Years:
• Economist and Senior Fellow at Brookings Institution
Other Board Memberships and Affiliations:
- State Farm Mutual Automobile Association, Director
- State Farm Life Insurance Company, Director
No. of Portfolios for which Board Member Serves: 37
Once elected all Board Members serve for an indefinite term.The address of the Board Members and Officers is in c/o The Dreyfus Corporation, 200 Park Avenue, New York, New York 10166.Additional information about the Board Members is available in the fund's Statement of Additional Information which can be obtained from Dreyfus free of charge by calling this toll free number: 1-800-554-4611.
The Fund 29
OFFICERS OF THE FUND (Unaudited)
STEPHEN E. CANTER, President since March 2000.
Chairman of the Board, Chief Executive Officer and Chief Operating Officer of the Manager, and an officer of 97 investment companies (comprised of 190 portfolios) managed by the Manager. Mr. Canter also is a Board member and, where applicable, an Executive Committee Member of the other investment management subsidiaries of Mellon Financial Corporation, each of which is an affiliate of the Manager. He is 59 years old and has been an employee of the Manager since May 1995.
STEPHEN R. BYERS, Executive Vice President since November 2002.
Chief Investment Officer,Vice Chairman and a Director of the Manager, and an officer of 97 investment companies (comprised of 190 portfolios) managed by the Manager. Mr. Byers also is an officer, director or an Executive Committee Member of certain other investment management subsidiaries of Mellon Financial Corporation, each of which is an affiliate of the Manager. He is 50 years old and has been an employee of the Manager since January 2000. Prior to joining the Manager, he served as an Executive Vice President-Capital Markets, Chief Financial Officer and Treasurer at Gruntal & Co., L.L.C.
CHARLES CARDONA, Executive Vice President since November 2001.
Vice Chairman and a Director of the Manager, Executive Vice President of the Distributor, President of Dreyfus Institutional Services Division, and an officer of 14 investment companies (comprised of 18 portfolios) managed by the Manager. He is 48 years old and has been an employee of the Manager since February 1981.
MARK N. JACOBS, Vice President since March 2000.
Executive Vice President, Secretary and General Counsel of the Manager, and an officer of 98 investment companies (comprised of 206 portfolios) managed by the Manager. He is 58 years old and has been an employee of the Manager since June 1977.
MICHAEL A. ROSENBERG, Secretary since March 2000.
Associate General Counsel of the Manager, and an officer of 95 investment companies (comprised of 199 portfolios) managed by the Manager. He is 44 years old and has been an employee of the Manager since October 1991.
STEVEN F. NEWMAN, Assistant Secretary since March 2000.
Associate General Counsel and Assistant Secretary of the Manager, and an officer of 98 investment companies (comprised of 206 portfolios) managed by the Manager. He is 54 years old and has been an employee of the Manager since July 1980.
ROBERT R. MULLERY, Assistant Secretary since March 2000.
Associate General Counsel of the Manager, and an officer of 26 investment companies (comprised of 58 portfolios) managed by the Manager. He is 52 years old and has been an employee of the Manager since May 1986.
JEFF PRUSNOFSKY, Assistant Secretary since January 2003.
Associate General Counsel of the Manager, and an officer of 26 investment companies (comprised of 87 portfolios) managed by the Manager. He is 39 years old and has been an employee of the Manager since October 1990.
30
JAMES WINDELS, Treasurer since November 2001.
Director – Mutual Fund Accounting of the Manager, and an officer of 98 investment companies (comprised of 206 portfolios) managed by the Manager. He is 45 years old and has been an employee of the Manager since April 1985.
ERIK D. NAVILOFF, Assistant Treasurer since December 2002.
Senior Accounting Manager – Taxable Fixed
Income Funds of the Manager, and an officer
of 19 investment companies (comprised of 74
portfolios) managed by the Manager. He is 36
years old and has been an employee of the
Manager since November 1992.
|
KENNETH J. SANDGREN, Assistant
Treasurer since November 2001.
|
| | Mutual Funds Tax Director of the Manager,
and an officer of 98 investment companies
(comprised of 206 portfolios) managed by the
Manager. He is 49 years old and has been an
employee of the Manager since June 1993.
|
WILLIAM GERMENIS, Anti-Money Laundering Compliance Officer since August 2002.
Vice President and Anti-Money Laundering Compliance Officer of the Distributor, and the Anti-Money Laundering Compliance Officer of 93 investment companies (comprised of 201 portfolios) managed by the Manager. He is 33 years old and has been an employee of the Distributor since October 1998.
The Fund 31
| For More | | Information |
| |
|
| |
| Dreyfus | | Transfer Agent & |
| Institutional Yield | | Dividend Disbursing Agent |
| Advantage Fund | | |
| | | Dreyfus Transfer, Inc. |
| 200 Park Avenue | | |
| | | 200 Park Avenue |
| New York, NY 10166 | | |
| | | New York, NY 10166 |
| |
| Manager | | Distributor |
| The Dreyfus Corporation | | |
| | | Dreyfus Service Corporation |
| 200 Park Avenue | | |
| | | 200 Park Avenue |
| New York, NY 10166 | | |
| | | New York, NY 10166 |
| Custodian | | |
| Mellon Bank, N.A. | | |
| One Mellon Bank Center | | |
| Pittsburgh, PA 15258 | | |
Telephone 1-800-645-6561
Mail The Dreyfus Family of Funds, 144 Glenn Curtiss Boulevard, Uniondale, NY 11556-0144 E-mail Send your request to info@dreyfus.com Internet Information can be viewed online or downloaded at: http://www.dreyfus.com A description of the policies and procedures that the fund uses to determine how to vote proxies relating to portfolio securities, and information regarding how the fund voted these proxies for the 12-month period ended June 30, 2004, is available through the fund's website at http://www.dreyfus.com and on the SEC's website at http://www.sec.gov. The description of the policies and procedures is also available without charge, upon request, by calling 1-800-645-6561.
Beginning with the fund's fiscal quarter ending October 31, 2004, the fund will file its complete schedule of portfolio holdings with the SEC for the first and third quarters of each fiscal year on Form N-Q; the fund's Forms N-Q will be available on the SEC's website at http://www.sec.gov; and the fund's Forms N-Q may be reviewed and copied at the SEC's Public Reference Room in Washington, DC, and information on the operation of the Public Reference Room may be obtained by calling 1-800-SEC-0330.

© 2004 Dreyfus Service Corporation
| | Dreyfus Premier
Yield Advantage Fund
|

The views expressed in this report reflect those of the portfolio manager only through the end of the period covered and do not necessarily represent the views of Dreyfus or any other person in the Dreyfus organization. Any such views are subject to change at any time based upon market or other conditions and Dreyfus disclaims any responsibility to update such views.These views may not be relied on as investment advice and, because investment decisions for a Dreyfus fund are based on numerous factors, may not be relied on as an indication of trading intent on behalf of any Dreyfus fund.
Not FDIC-Insured • Not Bank-Guaranteed • May Lose Value
| Contents |
| |
| | | THE FUND |
| |
|
| 2 | | Letter from the Chairman |
| 3 | | Discussion of Fund Performance |
| 6 | | Fund Performance |
| 8 | | Understanding Your Fund's Expenses |
| 8 | | Comparing Your Fund's Expenses |
| With Those of Other Funds |
| 9 | | Statement of Investments |
| 15 | | Statement of Financial Futures |
| 16 | | Statement of Assets and Liabilities |
| 17 | | Statement of Operations |
| 18 | | Statement of Changes in Net Assets |
| 21 | | Financial Highlights |
| 26 | | Notes to Financial Statements |
| 34 | | Report of Independent Registered |
| | | Public Accounting Firm |
| 35 | | Board Members Information |
| 37 | | Officers of the Fund |
| FOR MORE INFORMATION |
|
| | | Back Cover |
| Dreyfus Premier |
| Yield Advantage Fund |
The Fund

LETTER FROM THE CHAIRMAN
This annual report for Dreyfus Premier Yield Advantage Fund covers the 12-month period from August 1, 2003, through July 31, 2004. Inside, you'll find valuable information about how the fund was managed during the reporting period, including a discussion with Gerald E. Thunelius, portfolio manager and Director of the Dreyfus Taxable Fixed Income Team that manages the fund.
The U.S. economy has increasingly shown signs of sustainable growth during the reporting period, causing heightened volatility in most sectors of the U.S. bond market. As it became clearer that a strong job market and higher energy prices might lead to renewed inflationary pressures,the Federal Reserve Board raised short-term interest rates by 25 basis points at its meeting in late June.This shift in monetary policy represents the first increase in short-term rates in more than four years, and many analysts believe that additional, gradual increases are likely to follow.
For many investors, the move to a less accommodative monetary policy marks the beginning of a new phase in the economic cycle. At times such as these, when market conditions are in a period of transition, we believe it is especially important for you to stay in close contact with your financial advisor, who can help you position your portfolio in a way that is designed to respond to the challenges and opportunities of today's changing investment environment.
Thank you for your continued confidence and support.
The Dreyfus Corporation
August 16, 2004
|
2

DISCUSSION OF FUND PERFORMANCE
Gerald E. Thunelius, Director and Senior Portfolio Manager Dreyfus Taxable Fixed Income Team
How did Dreyfus Premier Yield Advantage Fund perform relative to its benchmark?
For the 12-month period ended July 31, 2004, the fund achieved total returns of 0.49% for Class A shares, 0.23% for Class B shares, 0.48% for Class D shares, 0.98% for Class P shares and 0.76% for Class S shares.1 In comparison, the Citigroup 1-Year Treasury Benchmark-on-the-Run Index, the fund's benchmark, achieved a total return of 0.98% for the same period.2
The fund and its holdings of short-term bonds were influenced during the reporting period by stronger economic growth and the increasing possibility of higher short-term interest rates.The fund produced lower returns than its benchmark, primarily due to its yield curve positioning during the second half of the reporting period.
What is the fund's investment approach?
The fund seeks as high a level of current income as is consistent with the preservation of capital, with minimal changes in share price. To pursue its goal, the fund invests only in investment-grade fixed-income securities of U.S. and foreign issuers or the unrated equivalent as determined by Dreyfus. These securities may include U.S. government bonds and notes, corporate bonds, asset-backed securities and mortgage-related securities.
To help reduce share price fluctuations, the fund seeks to keep the average effective duration — a measure of sensitivity to changing interest rates — of its overall portfolio at one year or less.Although we expect the fund's average effective duration and its average effective maturity — the amount of time until the fund's holdings mature or are redeemed, on average — to follow one another closely, we may invest in securities with effective final maturities of any length.
The Fund 3
| | DISCUSSION OF FUND PERFORMANCE (continued)
|
When choosing securities for the fund, we analyze many factors in various fixed-income market sectors.We then decide how to allocate the fund's assets across these sectors and in which securities to invest.
What other factors influenced the fund's performance?
The fund was affected by shifts in investor sentiment as the fixed-income markets adjusted to stronger economic conditions. In fact, reports of stronger economic growth and the possibility of renewed inflationary pressures led to a sharp decline in most bond prices during the summer of 2003. In the fall, however, it became apparent that investors' fears were overblown, and that sluggish labor markets were likely to keep a lid on inflationary pressures for the time being. As a result, the bond market rallied through year-end, erasing most of the summer's decline. Although short-term interest rates remained at 1%, their lowest level since 1958, the fund participated to a degree in the market's recovery over the final months of 2003.
At the start of 2004, new signs of economic strength appeared, leading to renewed concerns that the Federal Reserve Board (the "Fed") might begin to raise interest rates if inflationary pressures intensified. In addition, some sectors of the short-term bond market appeared overvalued to us, including corporate bonds and Treasury Inflation Protected Securities ("TIPS"), which are not components of the benchmark.We reduced the fund's position in those areas and redeployed the assets to nominal U.S. Treasury securities. In addition, we reduced the fund's average duration and positioned the fund's holdings of U.S. Treasury securities for what we believed would be a narrowing of yield differences, or "yield spreads," between shorter- and longer-term securities.
These strategies produced mixed results during the spring and summer of 2004. As short-term interest rates rose in anticipation of the Fed's June rate hike, the fund benefited from its modestly short average duration, which gave us flexibility to capture higher yields as they became available. However, instead of narrowing as expected, yield spreads widened when investors grew concerned about disappointing employment data, high energy prices and ongoing instability in Iraq.
4
As a result, the fund's "yield curve" positioning generally detracted from its performance. Our previous reduction of the fund's holdings of short-term corporate bonds and TIPS also hindered returns somewhat, as these securities generally continued to rally. On the other hand, the fund's holdings of mortgage-backed securities, which also are not components of the benchmark, proved beneficial to performance.
What is the fund's current strategy?
We have continued to maintain what we regard as a relatively defensive investment posture, including a modestly shorter-than-average duration and holdings of U.S.Treasury securities that are positioned for narrower yield spreads.The fund also continues to hold securities that are not part of the benchmark,including short-term corporate bonds and mortgage-backed securities, which we believe are likely to generate competitive levels of current income and hold more of their value as interest rates rise. Of course, we will continue to actively monitor the fixed-income markets and make portfolio changes as warranted.
1 Total return includes reinvestment of dividends and any capital gains paid, and does not take into consideration the maximum initial sales charge in the case of Class A shares, or the applicable contingent deferred sales charges imposed on redemptions in the case of Class B and Class S shares. Had these charges been reflected, returns would have been lower. Past performance is no guarantee of future results. Share price, yield and investment return fluctuate such that upon redemption, fund shares may be worth more or less than their original cost. Return figures provided reflect the absorption of fund expenses by The Dreyfus Corporation pursuant to an agreement in effect through July 31, 2005, at which time it may be extended, terminated or modified. Had these expenses not been absorbed, the fund's returns would have been lower.
2 SOURCE: BLOOMBERG L.P. — Reflects reinvestment of dividends and, where applicable, capital gain distributions.The Citigroup 1-Year Treasury Benchmark-on-the-Run Index is an unmanaged index generally representative of the average yield on 1-year U.S.Treasury bills.The index does not take into account charges, fees and other expenses.Total return is calculated on a month-end basis.
The Fund 5
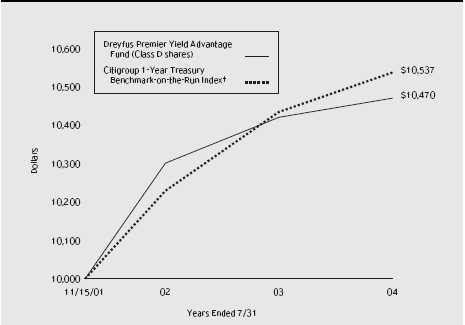
Comparison of change in value of $10,000 investment in Dreyfus Premier Yield Advantage Fund Class D shares and the Citigroup 1-Year Treasury Benchmark-on-the-Run Index
† Source: Bloomberg L.P.
Past performance is not predictive of future performance.
The above graph compares a $10,000 investment made in Class D shares of Dreyfus Premier Yield Advantage Fund on 11/15/01 (inception date) to a $10,000 investment made in the Citigroup 1-Year Treasury Benchmark-on-the-Run Index (the "Index") on that date. For comparative purposes, the value of the Index on 11/30/01 is used as the beginning value on 11/15/01.All dividends and capital gain distributions are reinvested. Performance for Class A, Class B, Class P and Class S shares will vary from the performance of Class D shares shown above due to differences in charges and expenses.
The fund invests primarily in investment-grade fixed-income securities of U.S. and foreign issuers and seeks to maintain an average effective duration of one year or less.The fund's performance shown in the line graph takes into account all applicable fees and expenses.The Index is an unmanaged index generally representative of the average yield on 1-year U.S.Treasury bills.The Index does not take into account charges, fees and other expenses. Further information relating to fund performance, including expense reimbursements, if applicable, is contained in the Financial Highlights section of the prospectus and elsewhere in this report.
| Average Annual Total Returns as of 7/31/04 | | | | |
| |
| | | Inception | | | | From |
| | | Date | | 1 Year | | Inception |
| |
| |
| |
|
| Class D shares | | 11/15/01 | | 0.48% | | 1.71% |
| Class A shares | | | | | | |
| with maximum sales charge (2.0%) | | 11/1/02 | | (1.48%) | | 0.21% |
| without sales charge | | 11/1/02 | | 0.49% | | 1.35% |
| Class B shares | | | | | | |
| with applicable redemption charge † | | 11/1/02 | | (3.73%) | | (1.96%) |
| without redemption | | 11/1/02 | | 0.23% | | 0.30% |
| Class P shares | | 11/1/02 | | 0.98% | | 1.05% |
| Class S shares | | | | | | |
| with applicable redemption charge †† | | 11/1/02 | | (1.72%) | | (0.60%) |
| without redemption | | 11/1/02 | | 0.76% | | 0.80% |
Past performance is not predictive of future performance.The fund's performance shown in the graph and table does not reflect the deduction of taxes that a shareholder would pay on fund distributions or the redemption of fund shares.
† The maximum contingent deferred sales charge for Class B shares is 4%.After six years Class B shares convert to
Class A shares.
The maximum contingent deferred sales charge for Class S shares is 2.50%.After six years Class S shares convert to
Class A shares.
|
The Fund 7
UNDERSTANDING YOUR FUND'S EXPENSES
As a mutual fund investor, you pay ongoing expenses, such as management fees and other expenses. Using the information below, you can estimate how these expenses affect your investment and compare them with the expenses of other funds.You also may pay one-time transaction expenses, including sales charges (loads) and redemption fees, which are not shown in this section and would have resulted in higher total expenses. For more information, see your fund's prospectus or talk to your financial adviser.
Review your fund's expenses
The table below shows the expenses you would have paid on a $1,000 investment in Dreyfus Premier Yield Advantage Fund from February 1, 2004 to July 31, 2004. It also shows how much a $1,000 investment would be worth at the close of the period, assuming actual returns and expenses.
Expenses and Value of a $1,000 Investment assuming actual returns for the six months ended July 31, 2004
| | | Class A | | Class B | | Class D | | Class P | | Class S |
| |
| |
| |
| |
| |
|
| Expenses paid per $1,000 † | | $ 3.99 | | $ 7.71 $ 3.99 $ 3.99 | | $ 5.23 |
| Ending value (after expenses) | | $1,004.30 | | $1,000.60 | | $1,004.30 | | $1,004.30 | | $1,003.20 |
COMPARING YOUR FUND'S EXPENSES
WITH THOSE OF OTHER FUNDS
|
Using the SEC's method to compare expenses
The Securities and Exchange Commission (SEC) has established guidelines to help investors assess fund expenses. Per these guidelines, the table below shows your fund's expenses based on a $1,000 investment, assuming a hypothetical 5% annualized return. You can use this information to compare the ongoing expenses (but not transaction expenses or total costs) of investing in the fund with those of other funds.All mutual fund shareholder reports will provide this information to help you make this comparison. Please note that you cannot use this information to estimate your actual ending account balance and expenses paid during the period.
| Expenses and Value of a $1,000 Investment | | | | | | |
| assuming a hypothetical 5% annualized return for the six months ended July 31, 2004 |
| | | Class A | | Class B | | Class D | | Class P | | Class S |
| |
| |
| |
| |
| |
|
| Expenses paid per $1,000 † | | $ 4.02 | | $ 7.77 $ 4.02 $ 4.02 | | $ 5.27 |
| Ending value (after expenses) | | $1,020.89 | | $1,017.16 | | $1,020.89 | | $1,020.89 | | $1,019.64 |
† Expenses for each share class are calculated using the fund's annualized expense ratio for each class, which represents the ongoing expenses as a percentage of net assets for the six months ended 7/31/04.The expense ratio may differ for each share class. Expenses are calculated by multiplying the expense ratio by the average account value for the period; then multiplying the result by the number of days in the period; and then dividing that result by the number of days in the year.
STATEMENT OF INVESTMENTS
July 31, 2004
|
| | | Principal | | | | |
| Bonds and Notes—99.3% | | Amount ($) | | Value ($) |
| |
| |
|
| Aircraft & Aerospace—.9% | | | | | | |
| United Technologies, | | | | | | |
| Notes, 6.625%, 2004 | | 2,000,000 | | | | 2,026,546 |
| Asset-Backed Ctfs./Auto Loans—.1% | | | | | | |
| Navistar Financial Owner Trust, | | | | | | |
| Ser. 2001-A, Cl. B, 5.59%, 2008 | | 254,773 | | | | 257,454 |
| Asset-Backed Ctfs./Business—1.0% | | | | | | |
| ACAS Business Loan Trust: | | | | | | |
| Ser. 2002-1A, Cl. B, 2.92%, 2012 | | 799,266 | | a,b | | 800,657 |
| Ser. 2002-2A, Cl. B, 3.02%, 2015 | | 1,500,000 | | a,b | | 1,517,054 |
| | | | | | | 2,317,711 |
| Asset-Backed Ctfs./Credit Cards—.1% | | | | |
| Fingerhut Master Trust, | | | | | | |
| Ser. 2003-1, Cl. A, 2.72%, 2010 | | 299,883 | | a | | 299,977 |
| Asset-Backed Ctfs./Home Equity Loans—3.5% | | | | |
| AAMES Mortgage Trust, | | | | | | |
| Ser. 1998-C, Cl. A2A, 5.912%, 2028 | | 416,846 | | | | 419,429 |
| ABFS Mortgage Loan Trust, | | | | | | |
| Ser. 1997-2, Cl. A5, 7.125%, 2029 | | 802,057 | | | | 814,793 |
| Conseco Finance Securitizations: | | | | | | |
| Ser. 2000-D, Cl. A3, 7.89%, 2018 | | 3 | | | | 4 |
| Ser. 2001-D, Cl. A4, 5.53%, 2032 | | 1,816,227 | | | | 1,857,227 |
| Long Beach Mortgage Loan Trust, | | | | | | |
| Ser. 2003-3, Cl. A, 1.77%, 2033 | | 2,719,400 | | b | | 2,724,528 |
| Residential Funding Mortgage Securities II, | | | | |
| Ser. 2004-HS2, Cl. AI3, 4.4%, 2019 | | 2,478,000 | | | | 2,493,487 |
| | | | | | | 8,309,468 |
| Automotive—7.1% | | | | | | |
| Ford Motor Credit, | | | | | | |
| Notes, 7.5%, 2005 | | 2,925,000 | | | | 3,014,365 |
| GMAC, | | | | | | |
| Notes, 2.56%, 2007 | | 7,864,000 | | b | | 7,863,913 |
| General Motors, | | | | | | |
| Notes, 6.25%, 2005 | | 3,500,000 | | | | 3,557,043 |
| Johnson Controls, | | | | | | |
| Notes, 1.59%, 2005 | | 2,315,000 | | b | | 2,317,486 |
| | | | | | | 16,752,807 |
The Fund 9
S T A T E M E N T O F I N V E S T M E N T S (continued)
| | | Principal | | | | |
| Bonds and Notes (continued) | | Amount ($) | | Value ($) |
| |
| |
|
| Banking—8.2% | | | | | | |
| Abbey National, | | | | | | |
| Sub. Notes, 6.69%, 2005 | | 4,000,000 | | | | 4,184,856 |
| Deutsche Bank, | | | | | | |
| Notes, 2.35%, 2005 | | 12,500,000 | | b | | 12,468,750 |
| Washington Mutual, | | | | | | |
| Sr. Notes, 7.25%, 2005 | | 2,500,000 | | | | 2,613,430 |
| | | | | | | 19,267,036 |
| Cable/Media—1.4% | | | | | | |
| TCI Communications, | | | | | | |
| Sr. Notes, 8%, 2005 | | 3,145,000 | | | | 3,301,794 |
| Commercial Mortgage Pass-Through Ctfs.—18.1% | | | | |
| Banc of America Large Loan: | | | | | | |
| Ser. 2002-FL1A, Cl. G, 2.86%, 2014 | | 4,000,000 | | a,b | | 4,031,931 |
| Ser. 2002-FL2A, Cl. H, 2.7%, 2014 | | 2,204,005 | | a,b | | 2,201,250 |
| Ser. 2002-FL2A, Cl. K1, 3.85%, 2014 | | 1,037,575 | | a,b | | 1,022,011 |
| Ser. 2003-BBA2, Cl. L, 2.387%, 2015 | | 5,000,000 | | a,b | | 4,821,592 |
| Banc of America Structured Notes: | | | | | | |
| Ser. 2002-1A, Cl. A, 4.36%, 2014 | | 1,500,000 | | a,b | | 1,447,969 |
| Ser. 2002-1A, Cl. B, 5.86%, 2014 | | 2,200,000 | | a,b | | 2,009,563 |
| Bear Stearns Commercial Mortgage Securities, | | | | |
| Ser. 2003-BA1A, Cl. G, 2.98%, 2015 | | 6,966,000 | | a,b | | 7,017,548 |
| COMM: | | | | | | |
| Ser. 2000-FL2A, Cl. E, 2.37%, 2011 | | 4,479,000 | | a,b | | 4,395,618 |
| Ser. 2001-FL5A, Cl. G, 2.24%, 2013 | | 3,700,000 | | a,b | | 3,665,731 |
| CS First Boston Mortgage Securities, | | | | | | |
| Ser. 2001-CK3, Cl. A1, 5.26%, 2034 | | 171,931 | | | | 175,395 |
| GS Mortgage Securities II, | | | | | | |
| Ser. 2003-C1, Cl. A1, 2.904%, 2040 | | 801,343 | | | | 788,457 |
| Wachovia Bank Commercial Mortgage Trust: | | | | |
| Ser. 2002-WHL, Cl. L, 4.38%, 2015 | | 6,000,000 | | a,b | | 5,980,433 |
| Ser. 2003-WHL2, Cl. J, 3.88%, 2013 | | 5,000,000 | | a,b | | 5,019,994 |
| | | | | | | 42,577,492 |
| Consumer—1.1% | | | | | | |
| Gillette, | | | | | | |
| Notes, 3.75%, 2004 | | 2,500,000 | | a | | 2,515,065 |
| Financial Services—5.6% | | | | | | |
| Bombardier Capital, | | | | | | |
| Notes, 7.5%, 2004 | | 2,550,000 | | a | | 2,553,070 |
| CIT, | | | | | | |
| Notes, 1.48%, 2007 | | 2,500,000 | | b | | 2,501,622 |
10
| | | Principal | | | | |
| Bonds and Notes (continued) | | Amount ($) | | Value ($) |
| |
| |
|
| Financial Services (continued) | | | | | | |
| Countrywide Home Loan, | | | | | | |
| Notes, Ser. F, 6.7%, 2005 | | 4,000,000 | | | | 4,104,296 |
| General Electric Capital, | | | | | | |
| Notes, Ser. A, 2.85%, 2006 | | 2,500,000 | | c | | 2,506,992 |
| International Lease Finance, | | | | | | |
| Notes, 8.375%, 2004 | | 850,000 | | | | 870,253 |
| John Deere Capital, | | | | | | |
| Notes, Ser. D, 2.16%, 2004 | | 714,000 | | b | | 714,351 |
| | | | | | | 13,250,584 |
| Food & Beverages—1.1% | | | | | | |
| PepsiCo, | | | | | | |
| Notes, 3.2%, 2007 | | 2,575,000 | | c | | 2,571,163 |
| Foreign/Governmental—1.3% | | | | | | |
| United Mexican States, | | | | | | |
| Notes, Ser. A, 2.29%, 2009 | | 3,000,000 | | b,c | | 3,045,750 |
| Health Care—2.3% | | | | | | |
| Boston Scientific, | | | | | | |
| Notes, 6.625%, 2005 | | 2,730,000 | | | | 2,798,264 |
| UnitedHealth, | | | | | | |
| Sr. Notes, 1.79%, 2004 | | 2,655,000 | | a,b | | 2,656,120 |
| | | | | | | 5,454,384 |
| Industrial—2.1% | | | | | | |
| Tyco International: | | | | | | |
| Notes, 5.8%, 2006 | | 700,000 | | | | 732,549 |
| Participation Certificate Trust, 4.436%, 2007 | | 4,183,000 | | a | | 4,219,367 |
| | | | | | | 4,951,916 |
| Insurance—5.9% | | | | | | |
| ASIF Global Financing, | | | | | | |
| Notes, 1.719%, 2007 | | 8,183,000 | | a,b | | 8,203,457 |
| Genworth Financial, | | | | | | |
| Notes, 1.67%, 2007 | | 1,335,000 | | b | | 1,336,719 |
| MetLife, | | | | | | |
| Debs., 3.911%, 2005 | | 2,000,000 | | | | 2,026,256 |
| Protective Life U.S. Funding Trust, | | | | | | |
| Sr. Secured Notes, 1.48%, 2006 | | 2,220,000 | | a,b | | 2,226,165 |
| | | | | | | 13,792,597 |
| Mining & Metals—.6% | | | | | | |
| Falconbridge, | | | | | | |
| Debs., 7.375%, 2005 | | 1,285,000 | | | | 1,340,966 |
The Fund 11
S T A T E M E N T O F I N V E S T M E N T S (continued)
| | | Principal | | | | |
| Bonds and Notes (continued) | | Amount ($) | | Value ($) |
| |
| |
|
| Oil & Gas—3.4% | | | | | | |
| EnCana, | | | | | | |
| Notes, 4.6%, 2009 | | 2,588,000 | | | | 2,606,913 |
| Occidental Petroleum, | | | | | | |
| Sr. Notes, 6.5%, 2005 | | 4,000,000 | | | | 4,110,908 |
| Ocean Energy, | | | | | | |
| Sr. Notes, 4.375%, 2007 | | 1,279,000 | | | | 1,297,980 |
| | | | | | | 8,015,801 |
| Real Estate Investment Trusts—2.3% | | | | | | |
| New Plan Excel Realty Trust, | | | | | | |
| Sr. Notes, 7.75%, 2005 | | 1,120,000 | | | | 1,154,412 |
| Summit Properties Partnership, | | | | | | |
| Notes, 6.95%, 2004 | | 4,250,000 | | | | 4,255,623 |
| | | | | | | 5,410,035 |
| Residential Mortgage Pass-Through Ctfs.—7.4% | | | | |
| Bank of America Mortgage Securities II, | | | | | | |
| Ser. 2004-D, Cl. 2A3, 1.62%, 2034 | | 5,951,172 | | b | | 5,931,645 |
| Countrywide Alternative Loan Trust, | | | | | | |
| Ser. 2004-7T1, Cl. A1, 5.75%, 2034 | | 6,501,946 | | | | 6,581,985 |
| Residential Asset Mortgage Products, | | | | | | |
| Ser. 2002-SL1, Cl. AI1, 7%, 2032 | | 160,569 | | | | 161,314 |
| Structured Asset Securities, | | | | | | |
| Ser. 2000-3, Cl. 2A6, 8%, 2030 | | 250,413 | | | | 250,762 |
| Washington Mutual, | | | | | | |
| Ser. 2003-AR12, Cl. A3, 3.36%, 2034 | | 4,400,000 | | | | 4,416,531 |
| | | | | | | 17,342,237 |
| Retail—.9% | | | | | | |
| May Department Stores: | | | | | | |
| Notes, 3.95%, 2007 | | 640,000 | | a | | 640,436 |
| Notes, 7.15%, 2004 | | 1,500,000 | | | | 1,502,061 |
| | | | | | | 2,142,497 |
| Structured Index—2.0% | | | | | | |
| HSBC Bank USA, Tranched Investment-Grade | | | | |
| Enhanced Return Securities ("TIGERS") | | | | | | |
| Medium Term Notes: | | | | | | |
| Ser. 2003-2, 4.4%, 2008 | | 800,000 | | a,b,d | | 784,800 |
| Ser. 2003-3, Cl. D-1, 4.4%, 2008 | | 593,000 | | a,b,d | | 592,953 |
| Ser. 2003-4, 4.8%, 2008 | | 3,400,000 | | a,b,d | | 3,409,891 |
| | | | | | | 4,787,644 |
12
| | | Principal | | |
| Bonds and Notes (continued) | | Amount ($) | | Value ($) |
| |
| |
|
| Technology—4.5% | | | | |
| Meridian Funding, | | | | |
| Notes, 2.07%, 2009 | | 10,546,250 a,b | | 10,555,721 |
| Telecommunications—2.9% | | | | |
| British Telecommunications, | | | | |
| Notes, 7.875%, 2005 | | 4,000,000 b | | 4,266,968 |
| Verizon Wireless Capital, | | | | |
| Notes, 1.35%, 2005 | | 2,450,000 a,b | | 2,449,439 |
| | | | | 6,716,407 |
| Transportation—.9% | | | | |
| MISC Capital, | | | | |
| Notes, 5%, 2009 | | 2,189,000 a | | 2,220,171 |
| U.S. Government—.3% | | | | |
| U.S. Treasury Notes, | | | | |
| 1.5%, 3/31/2006 | | 613,000 e | | 603,350 |
| U.S. Government Agencies—2.4% | | | | |
| SLM, | | | | |
| Conv. Bonds, 1.61%, 7/25/2035 | | 5,652,000 a,b,c | | 5,567,107 |
| U.S. Government Agencies/Mortgage-Backed—6.0% | | |
| Federal Home Loan Mortgage Corp.: | | | | |
| REMIC Trust, Gtd. Multiclass Mortgage Participation Ctfs., | | |
| Ser. 2535, Cl. PL, 4%, 6/15/2029 | | 2,660,793 | | 2,681,607 |
| Structured Pass-Through Securities, | | | | |
| Ser. H005, Cl. A2, 2.55%, 8/15/2007 | | 2,740,412 | | 2,733,733 |
| Federal National Mortgage Association, | | | | |
| REMIC Trust, Gtd. Pass-Through Ctfs.: | | | | |
| Ser. 2002-55, Cl. GD, 5.5%, 11/25/2015 | | 2,330,974 | | 2,362,914 |
| Ser. 2003-49, Cl. JE, 3%, 4/25/2033 | | 3,516,448 | | 3,353,093 |
| Government National Mortgage Association I, | | | | |
| Ser. 2002-52, Cl. AG, 6%, 9/20/2029 | | 2,856,082 | | 2,906,693 |
| | | | | 14,038,040 |
| Utilities/Gas & Electric—5.9% | | | | |
| Appalachian Power, | | | | |
| Notes, 1.93%, 2007 | | 1,125,000 b | | 1,125,460 |
| Duke Energy, | | | | |
| Sr. Notes, Ser. B, 1.824%, 2005 | | 2,000,000 b | | 2,004,546 |
| FPL Group Capital, | | | | |
| Notes, 1.886%, 2005 | | 2,450,000 b | | 2,454,371 |
The Fund 13
S T A T E M E N T O F I N V E S T M E N T S (continued)
| | | Principal | | |
| Bonds and Notes (continued) | | Amount ($) | | Value ($) |
| |
| |
|
| Utilities/Gas & Electric (continued) | | | | |
| KeySpan, | | | | |
| Sr. Notes, 7.25%, 2005 | | 4,081,000 | | 4,322,836 |
| TXU Energy, | | | | |
| Notes, 2.38%, 2006 | | 3,895,000 a,b | | 3,894,575 |
| | | | | 13,801,788 |
| Total Bonds and Notes | | | | |
| (cost $232,661,224) | | | | 233,233,508 |
| |
| |
|
| |
| Investment of Cash Collateral | | | | |
| for Securities Loaned—3.1% | | Shares | | Value ($) |
| |
| |
|
| Registered Investment Company, | | | | |
| Dreyfus Institutional Cash Advantage Plus Fund | | |
| (cost $7,426,200) | | 7,426,200 f | | 7,426,200 |
| |
| |
|
| Total Investments (cost $240,087,424) | | 102.4% | | 240,659,708 |
| Liabilities, Less Cash and Receivables | | (2.4%) | | (5,707,779) |
| Net Assets | | 100.0% | | 234,951,929 |
| | a Securities exempt from registration under Rule 144A of the Securities Act of 1933.These securities may be resold in
transactions exempt from registration, normally to qualified institutional buyers.At July 31, 2004, these securities
amounted to $96,719,665 or 41.2% of net assets.
b Variable rate security—interest rate subject to periodic change.
c A portion of these securities are on loan.At July 31, 2004, the total market value of the fund's securities on loan is
$7,246,102 and the total market value of the collateral held by the fund is $7,426,200.
d Securities linked to a portfolio of debt securities.
e Partially held by a broker as collateral for open financial futures positions.
f Investment in affiliated money market mutual fund.
|
| Portfolio Summary† | | | | | | |
| |
| | | Value (%) | | | | Value (%) |
| |
| |
| |
|
| Corporate Bonds | | 57.1 | | Structured Index | | 2.0 |
| Mortgage/Asset backed securities | | 30.2 | | Foreign/Governmental | | 1.3 |
| US Government/ | | | | Futures contracts | | (.1) |
| Agency securities | | 8.7 | | | | 102.3 |
| Short-Term/Money Market | | | | | | |
| Investments | | 3.1 | | | | |
| | † Based on net assets.
See notes to financial statements.
|
14
STATEMENT OF FINANCIAL FUTURES
July 31, 2004
| | | | | Market Value | | | | Unrealized |
| | | | | Covered by | | | | (Depreciation) |
| | | Contracts | | Contracts ($) | | Expiration | | at 7/31/2004 ($) |
| |
| |
| |
| |
|
| Financial Futures Short | | | | | | | | |
| U.S. Treasury 2 Year Notes | | 40 | | 8,445,000 | | September 2004 | | (15,297) |
| U.S. Treasury 5 Year Notes | | 178 | | 19,491,000 | | September 2004 | | (126,437) |
| | | | | | | | | (141,734) |
See notes to financial statements.
|
The Fund 15
| | STATEMENT OF ASSETS AND LIABILITIES
July 31, 2004
|
| | | Cost | | Value |
| |
| |
|
| Assets ($): | | | | |
| Investments in securities— | | | | |
| See Statement of Investments (including securities | | |
| on loan, valued at $7,246,102)—Note 1(b): | | |
| Unaffiliated issuers | | 232,661,224 | | 233,233,508 |
| Affiliated issuers | | 7,426,200 | | 7,426,200 |
| Receivable for investment securities sold | | 4,556,726 |
| Interest receivable | | | | 1,648,985 |
| Prepaid expenses | | | | 15,048 |
| | | | | 246,880,467 |
| |
| |
|
| Liabilities ($): | | | | |
| Due to The Dreyfus Corporation and affiliates—Note 3(c) | | 143,075 |
| Cash overdraft due to Custodian | | 323,956 |
| Liability for securities on loan—Note 1(b) | | 7,426,200 |
| Payable for investment securities purchased | | 2,709,739 |
| Payable for shares of Common Stock redeemed | | 1,136,259 |
| Payable for futures variation margin—Note 4 | | 110,097 |
| Accrued expenses | | | | 79,212 |
| | | | | 11,928,538 |
| |
| |
|
| Net Assets ($) | | | | 234,951,929 |
| |
| |
|
| Composition of Net Assets ($): | | |
| Paid-in capital | | | | 247,231,182 |
| Accumulated undistributed investment income—net | | 23,828 |
| Accumulated net realized gain (loss) on investments | | (12,733,631) |
| Accumulated net unrealized appreciation (depreciation) | | |
| on investments [including ($141,734) net unrealized | | |
| (depreciation) on financial futures] | | 430,550 |
| |
|
| Net Assets ($) | | | | 234,951,929 |
| Net Asset Value Per Share | | | | | | | | |
| | | Class A | | Class B | | Class D | | Class P | | Class S |
| |
| |
| |
| |
| |
|
| Net Assets ($) | | 7,338,646 | | 6,343,242 | | 177,227,601 | | 43,117,467 | | 924,973 |
| Shares Outstanding | | 3,723,319 | | 3,238,152 | | 90,726,348 | | 22,021,384 | | 472,357 |
| |
| |
| |
| |
| |
|
| Net Asset Value | | | | | | | | | | |
| Per Share ($) | | 1.97 | | 1.96 | | 1.95 | | 1.96 | | 1.96 |
See notes to financial statements.
16
STATEMENT OF OPERATIONS
Year Ended July 31, 2004
|
| Investment Income ($): | | |
| Income: | | |
| Interest | | 8,834,744 |
| Dividends: | | |
| Affiliated issuers | | 189,810 |
| Income from securities lending | | 13,779 |
| Total Income | | 9,038,333 |
| Expenses: | | |
| Management fee—Note 3(a) | | 1,873,475 |
| Shareholder servicing costs—Note 3(c) | | 1,123,568 |
| Registration fees | | 136,165 |
| Professional fees | | 53,078 |
| Distribution fees—Note 3(b) | | 48,263 |
| Prospectus and shareholders' reports | | 35,648 |
| Custodian fees—Note 3(c) | | 29,615 |
| Directors' fees and expenses—Note 3(d) | | 12,394 |
| Miscellaneous | | 21,168 |
| Total Expenses | | 3,333,374 |
| Less—reduction in management fee due to | | |
| undertaking—Note 3(a) | | (287,326) |
| Net Expenses | | 3,046,048 |
| Investment Income—Net | | 5,992,285 |
| |
|
| Realized and Unrealized Gain (Loss) on Investments—Note 4 ($): |
| Net realized gain (loss) on investments | | (4,177,438) |
| Net realized gain (loss) on financial futures | | (2,661,285) |
| Net Realized Gain (Loss) | | (6,838,723) |
| Net unrealized appreciation (depreciation) on investments [including |
| ($719,758) net unrealized (depreciation) on financial futures] | | 3,273,168 |
| Net Realized and Unrealized Gain (Loss) on Investments | | (3,565,555) |
| Net Increase in Net Assets Resulting from Operations | | 2,426,730 |
See notes to financial statements.
|
The Fund 17
STATEMENT OF CHANGES IN NET ASSETS
| | | | | Year Ended July 31, |
| |
| |
|
| | | 2004 | | 2003 a |
| |
| |
|
| Operations ($): | | | | |
| Investment income—net | | 5,992,285 | | 9,653,253 |
| Net realized gain (loss) on investments | | (6,838,723) | | 1,528,218 |
| Net unrealized appreciation | | | | |
| (depreciation) on investments | | 3,273,168 | | (5,457,634) |
| Net Increase (Decrease) in Net Assets | | |
| Resulting from Operations | | 2,426,730 | | 5,723,837 |
| |
| |
|
| Dividends to Shareholders from ($): | | | | |
| Investment income—net: | | | | |
| Class A | | (196,164) | | (152,563) |
| Class B | | (75,186) | | (39,740) |
| Class D | | (5,307,042) | | (10,872,139) |
| Class P | | (1,880,679) | | (1,478,188) |
| Class S | | (22,180) | | (20,036) |
| Total Dividends | | (7,481,251) | | (12,562,666) |
| |
| |
|
| Capital Stock Transactions ($): | | | | |
| Net proceeds from shares sold: | | | | |
| Class A | | 7,292,038 | | 21,802,281 |
| Class B | | 4,442,659 | | 9,466,309 |
| Class D | | 119,607,617 | | 352,218,739 |
| Class P | | 89,956,479 | | 215,788,350 |
| Class S | | 167,151 | | 4,335,681 |
| Dividends reinvested: | | | | |
| Class A | | 147,387 | | 114,190 |
| Class B | | 68,969 | | 33,986 |
| Class D | | 4,767,427 | | 9,693,475 |
| Class P | | 1,536,577 | | 1,250,597 |
| Class S | | 19,870 | | 19,554 |
| | | | | Year Ended July 31, |
| |
| |
|
| | | 2004 | | 2003 a |
| |
| |
|
| Capital Stock Transactions ($) (continued): | | |
| Cost of shares redeemed: | | | | |
| Class A | | (11,780,610) | | (10,034,432) |
| Class B | | (3,380,447) | | (4,189,483) |
| Class D | | (257,235,276) | | (384,741,553) |
| Class P | | (172,385,851) | | (91,052,922) |
| Class S | | (765,618) | | (2,816,941) |
| Increase (Decrease) in Net Assets | | | | |
| from Capital Stock Transactions | | (217,541,628) | | 121,887,831 |
| Total Increase (Decrease) in Net Assets | | (222,596,149) | | 115,049,002 |
| |
| |
|
| Net Assets ($): | | | | |
| Beginning of Period | | 457,548,078 | | 342,499,076 |
| End of Period | | 234,951,929 | | 457,548,078 |
| Undistributed investment income—net | | 23,828 | | 49,232 |
The Fund 19
STATEMENT OF CHANGES IN NET ASSETS (continued)
|
| | | | | Year Ended July 31, |
| |
| |
|
| | | 2004 | | 2003 a |
| |
| |
|
| Capital Share Transactions: | | | | |
| Class A b | | | | |
| Shares sold | | 3,685,593 | | 10,867,599 |
| Shares issued for dividends reinvested | | 74,285 | | 57,092 |
| Shares redeemed | | (5,943,597) | | (5,017,653) |
| Net Increase (Decrease) in Shares Outstanding | | (2,183,719) | | 5,907,038 |
| |
| |
|
| Class B b | | | | |
| Shares sold | | 2,252,897 | | 4,753,561 |
| Shares issued for dividends reinvested | | 35,007 | | 17,104 |
| Shares redeemed | | (1,715,111) | | (2,105,306) |
| Net Increase (Decrease) in Shares Outstanding | | 572,793 | | 2,665,359 |
| |
| |
|
| Class D | | | | |
| Shares sold | | 60,692,419 | | 176,389,077 |
| Shares issued for dividends reinvested | | 2,425,769 | | 4,867,872 |
| Shares redeemed | | (130,929,291) | | (193,378,919) |
| Net Increase (Decrease) in Shares Outstanding | | (67,811,103) | | (12,121,970) |
| |
| |
|
| Class P | | | | |
| Shares sold | | 45,543,345 | | 108,396,967 |
| Shares issued for dividends reinvested | | 779,176 | | 630,204 |
| Shares redeemed | | (87,460,581) | | (45,867,727) |
| Net Increase (Decrease) in Shares Outstanding | | (41,138,060) | | 63,159,444 |
| |
| |
|
| Class S | | | | |
| Shares sold | | 84,438 | | 2,178,964 |
| Shares issued for dividends reinvested | | 10,081 | | 9,859 |
| Shares redeemed | | (388,444) | | (1,422,541) |
| Net Increase (Decrease) in Shares Outstanding | | (293,925) | | 766,282 |
a The fund commenced offering five classes of shares on November 1, 2002.The existing shares were redesignated
Class D shares and the fund added Class A, Class B, Class P and Class S shares.
b During the period ended July 31, 2004, 155,565 Class B shares representing $306,308 were automatically
converted to 154,765 Class A shares and during the period ended July 31, 2003, there were no shares converted
from Class B to Class A.
See notes to financial statements.
|
The following tables describe the performance for each share class for the fiscal periods indicated.All information (except portfolio turnover rate) reflects financial results for a single fund share.Total return shows how much your investment in the fund would have increased (or decreased) during each period, assuming you had reinvested all dividends and distributions.These figures have been derived from the fund's financial statements.
| | | Year Ended July 31, |
| |
|
| Class A Shares | | 2004 | | 2003 a |
| |
| |
|
| Per Share Data ($): | | | | |
| Net asset value, beginning of period | | 2.00 | | 2.00 |
| Investment Operations: | | | | |
| Investment income—net b | | .03 | | .03 |
| Net realized and unrealized | | | | |
| gain (loss) on investments | | (.02) | | .01 |
| Total from Investment Operations | | .01 | | .04 |
| Distributions: | | | | |
| Dividends from investment income—net | | (.04) | | (.04) |
| Net asset value, end of period | | 1.97 | | 2.00 |
| |
| |
|
| Total Return (%) c | | .49 | | 1.88d |
| |
| |
|
| Ratios/Supplemental Data (%): | | | | |
| Ratio of total expenses to average net assets | | .90 | | 1.01e |
| Ratio of net expenses to average net assets | | .80 | | .80e |
| Ratio of net investment income | | | | |
| to average net assets | | 1.61 | | 1.48e |
| Portfolio Turnover Rate | | 309.23 | | 371.43 |
| |
| |
|
| Net Assets, end of period ($ x 1,000) | | 7,339 | | 11,802 |
a From November 1, 2002 (commencement of initial offering) to July 31, 2003.
b Based on average shares outstanding at each month end.
c Exclusive of sales charge.
d Not annualized.
e Annualized.
See notes to financial statements.
|
The Fund 21
| | FINANCIAL HIGHLIGHTS (continued)
|
| | | Year Ended July 31, |
| |
|
| Class B Shares | | 2004 | | 2003 a |
| |
| |
|
| Per Share Data ($): | | | | |
| Net asset value, beginning of period | | 1.98 | | 2.00 |
| Investment Operations: | | | | |
| Investment income—net b | | .02 | | .01 |
| Net realized and unrealized | | | | |
| gain (loss) on investments | | (.02) | | .00c |
| Total from Investment Operations | | — | | .01 |
| Distributions: | | | | |
| Dividends from investment income—net | | (.02) | | (.03) |
| Net asset value, end of period | | 1.96 | | 1.98 |
| |
| |
|
| Total Return (%) d | | .23 | | .29e |
| |
| |
|
| Ratios/Supplemental Data (%): | | | | |
| Ratio of total expenses to average net assets | | 1.64 | | 1.74f |
| Ratio of net expenses to average net assets | | 1.55 | | 1.55f |
| Ratio of net investment income | | | | |
| to average net assets | | .77 | | .74f |
| Portfolio Turnover Rate | | 309.23 | | 371.43 |
| |
| |
|
| Net Assets, end of period ($ x 1,000) | | 6,343 | | 5,290 |
a From November 1, 2002 (commencement of initial offering) to July 31, 2003.
b Based on average shares outstanding at each month end.
c Amount represents less than $.01 per share.
d Exclusive of sales charge.
e Not annualized.
f Annualized.
See notes to financial statements.
|
22
| | | | | Year Ended July 31, |
| |
| |
|
| Class D Shares | | 2004 | | 2003 a | | 2002 b |
| |
| |
| |
|
| Per Share Data ($): | | | | | | |
| Net asset value, beginning of period | | 1.98 | | 2.01 | | 2.00 |
| Investment Operations: | | | | | | |
| Investment income—net c | | .03 | | .04 | | .05 |
| Net realized and unrealized | | | | | | |
| gain (loss) on investments | | (.02) | | (.02) | | .01 |
| Total from Investment Operations | | .01 | | .02 | | .06 |
| Distributions: | | | | | | |
| Dividends from investment income—net | | (.04) | | (.05) | | (.05) |
| Net asset value, end of period | | 1.95 | | 1.98 | | 2.01 |
| |
| |
| |
|
| Total Return (%) | | .48 | | 1.16 | | 3.01d |
| |
| |
| |
|
| Ratios/Supplemental Data (%): | | | | | | |
| Ratio of total expenses to average net assets | | .88 | | .85 | | .92e |
| Ratio of net expenses to average net assets | | .80 | | .80 | | .75e |
| Ratio of net investment income | | | | | | |
| to average net assets | | 1.60 | | 2.10 | | 3.37e |
| Portfolio Turnover Rate | | 309.23 | | 371.43 | | 96.09d |
| |
| |
| |
|
| Net Assets, end of period ($ x 1,000) | | 177,228 | | 313,644 | | 342,499 |
a The fund commenced offering five classes of shares on November 1, 2002.The existing shares were redesignated
Class D shares.
b From November 15, 2001 (commencement of operations) to July 31, 2002.
c Based on average shares outstanding at each month end.
d Not annualized.
e Annualized.
See notes to financial statements.
|
The Fund 23
| | FINANCIAL HIGHLIGHTS (continued)
|
| | | Year Ended July 31, |
| |
|
| Class P Shares | | 2004 | | 2003 a |
| |
| |
|
| Per Share Data ($): | | | | |
| Net asset value, beginning of period | | 1.98 | | 2.00 |
| Investment Operations: | | | | |
| Investment income—net b | | .03 | | .03 |
| Net realized and unrealized | | | | |
| gain (loss) on investments | | (.01) | | (.01) |
| Total from Investment Operations | | .02 | | .02 |
| Distributions: | | | | |
| Dividends from investment income—net | | (.04) | | (.04) |
| Net asset value, end of period | | 1.96 | | 1.98 |
| |
| |
|
| Total Return (%) | | .98 | | .85c |
| |
| |
|
| Ratios/Supplemental Data (%): | | | | |
| Ratio of total expenses to average net assets | | .85 | | .86d |
| Ratio of net expenses to average net assets | | .80 | | .80d |
| Ratio of net investment income | | | | |
| to average net assets | | 1.64 | | 1.43d |
| Portfolio Turnover Rate | | 309.23 | | 371.43 |
| |
| |
|
| Net Assets, end of period ($ x 1,000) | | 43,117 | | 125,292 |
a From November 1, 2002 (commencement of initial offering) to July 31, 2003.
b Based on average shares outstanding at each month end.
c Not annualized.
d Annualized.
See notes to financial statements.
|
24
| | | Year Ended July 31, |
| |
|
| Class S Shares | | 2004 | | 2003 a |
| |
| |
|
| Per Share Data ($): | | | | |
| Net asset value, beginning of period | | 1.98 | | 2.00 |
| Investment Operations: | | | | |
| Investment income—net b | | .03 | | .02 |
| Net realized and unrealized | | | | |
| gain (loss) on investments | | (.02) | | (.01) |
| Total from Investment Operations | | .01 | | .01 |
| Distributions: | | | | |
| Dividends from investment income—net | | (.03) | | (.03) |
| Net asset value, end of period | | 1.96 | | 1.98 |
| |
| |
|
| Total Return (%) c | | .76 | | .65d |
| |
| |
|
| Ratios/Supplemental Data (%): | | | | |
| Ratio of total expenses to average net assets | | 1.18 | | 1.23e |
| Ratio of net expenses to average net assets | | 1.05 | | 1.05e |
| Ratio of net investment income | | | | |
| to average net assets | | 1.35 | | 1.05e |
| Portfolio Turnover Rate | | 309.23 | | 371.43 |
| |
| |
|
| Net Assets, end of period ($ x 1,000) | | 925 | | 1,520 |
a From November 1, 2002 (commencement of initial offering) to July 31, 2003.
b Based on average shares outstanding at each month end.
c Exclusive of sales charge.
d Not annualized.
e Annualized.
See notes to financial statements.
|
The Fund 25
NOTES TO FINANCIAL STATEMENTS
NOTE 1—Significant Accounting Policies:
Dreyfus Premier Yield Advantage Fund (the "fund") is a separate non-diversified series of Dreyfus Investment Grade Funds, Inc. (the "Company"), which is registered under the Investment Company Act of 1940, as amended (the "Act"), as an open-end management investment company and operates as a series company currently offering five series, including the fund. The fund's investment objective is to provide investors with as high a level of current income as is consistent with the preservation of capital with minimal changes in share price.The Dreyfus Corporation (the "Manager" or "Dreyfus") serves as the fund's investment adviser. The Manager is a wholly-owned subsidiary of Mellon Financial Corporation ("Mellon Financial").
Dreyfus Service Corporation (the "Distributor"), a wholly-owned subsidiary of the Manager, is the distributor of the fund's shares.The fund is authorized to issue 900 million shares of $.001 par value Common Stock.The fund currently offers five classes of shares: Class A (100 million shares authorized), Class B (50 million shares authorized), Class D (500 million shares authorized), Class P (200 million shares authorized) and Class S (50 million shares authorized). Class A shares are subject to a sales charge imposed at the time of purchase. Class B and Class S shares are subject to a contingent deferred sales charge ("CDSC") imposed on Class B share and Class S share redemptions made within six years of purchase and Class B shares automatically convert to Class A shares after six years. Class D and Class P shares are sold at net asset value per share only to institutional investors. Class A shares purchased at net asset value (an investment of $250,000 or more) will have a CDSC imposed on redemptions made within eighteen months of purchase. Other differences between the classes include the services offered to and the expenses borne by each class and certain voting rights. Income, expenses (other than expenses attributable to a specific class), and realized and unrealized gains or losses on investments are allocated to each class of shares based on its relative net assets.
26
The Company accounts separately for the assets, liabilities and operations of each series. Expenses directly attributable to each series are charged to that series' operations; expenses which are applicable to all series are allocated among them on a pro rata basis.
The fund's financial statements are prepared in accordance with U.S. generally accepted accounting principles, which may require the use of management estimates and assumptions. Actual results could differ from those estimates.
The fund enters into contracts that contain a variety of indemnifications. The fund's maximum exposure under these arrangements is unknown.The fund does not anticipate recognizing any loss related to these arrangements.
(a) Portfolio valuation: Investments in securities (excluding short-term investments (other than U.S. Treasury Bills), financial futures and options) are valued each business day by an independent pricing service (the "Service") approved by the Board of Directors. Investments for which quoted bid prices are readily available and are representative of the bid side of the market in the judgment of the Service are valued at the mean between the quoted bid prices (as obtained by the Service from dealers in such securities) and asked prices (as calculated by the Service based upon its evaluation of the market for such securities). Other investments (which constitute a majority of the portfolio securities) are valued as determined by the Service, based on methods which include consideration of: yields or prices of securities of comparable quality, coupon, maturity and type; indications as to values from dealers; and general market conditions. Securities for which there are no such valuations are valued at fair value as determined in good faith under the direction of the Board of Directors. Restricted securities, as well as securities or other assets for which recent market quotations are not readily available, that are not valued by a pricing service approved by the Board of Directors, or are determined by the fund not to reflect accurately fair
The Fund 27
| | NOTES TO FINANCIAL STATEMENTS (continued)
|
value (such as when an event occurs after the close of the exchange on which the security is principally traded and that is determined by the fund to have changed the value of the security), are valued at fair value as determined in good faith under the direction of the Board of Directors.The factors that may be considered when fair valuing a security include fundamental analytical data, the nature and duration of restrictions on disposition, an evaluation of the forces that influence the market in which the securities are purchased and sold and public trading in similar securities of the issuer or comparable issuers. Short-term investments, excluding U.S.Treasury Bills, are carried at amortized cost, which approximates value. Financial futures and options, which are traded on an exchange, are valued at the last sales price on the securities exchange on which such securities are primarily traded or at the last sales price on the national securities market on each business day. Options traded over-the-counter are priced at the mean between the bid prices and the asked prices.
(b) Securities transactions and investment income: Securities transactions are recorded on a trade date basis. Realized gain and loss from securities transactions are recorded on the identified cost basis. Dividend income is recognized on the ex-dividend date and interest income, including, where applicable, amortization of discount and premium on investments, is recognized on the accrual basis.
The fund has an arrangement with the custodian bank whereby the fund receives earnings credits from the custodian when positive cash balances are maintained, which are used to offset custody fees. For financial reporting purposes, the fund includes net earnings credits as an expense offset in the Statement of Operations.
The fund may lend securities to qualified institutions. At origination, all loans are secured by collateral of at least 102% of the value of U.S. securities loaned and 105% of the value of foreign securities loaned. Collateral equivalent to at least 100% of the market value of securities on loan will be maintained at all times. Cash collateral is invested in
28
certain money market mutual funds managed by the Manager. The fund will be entitled to receive all income on securities loaned, in addition to income earned as a result of the lending transaction. Although each security loaned is fully collateralized, the fund would bear the risk of delay in recovery of, or loss of rights in, the securities loaned should a borrower fail to return the securities in a timely manner.
(c) Affiliated issuers: Investments in other investment companies advised by the Manager are defined as "affiliated" in the Act.
(d) Dividends to shareholders: It is the policy of the fund to declare dividends daily from investment income-net. Such dividends are paid monthly. Dividends from net realized capital gain, if any, are normally declared and paid annually, but the fund may make distributions on a more frequent basis to comply with the distribution requirements of the Internal Revenue Code of 1986, as amended (the "Code").To the extent that net realized capital gain can be offset by capital loss carryovers, it is the policy of the fund not to distribute such gain. Income and capital gain distributions are determined in accordance with income tax regulations, which may differ from U.S. generally accepted accounting principles.
(e) Federal income taxes: It is the policy of the fund to continue to qualify as a regulated investment company, if such qualification is in the best interests of its shareholders, by complying with the applicable provisions of the Code, and to make distributions of taxable income sufficient to relieve it from substantially all federal income and excise taxes.
At July 31, 2004, the components of accumulated earnings on a tax basis were as follows: undistributed ordinary income $17,280, accumulated capital losses $4,941,555 and unrealized appreciation $572,284. In addition, the fund had $7,933,810 of capital losses realized after October 31, 2003, which were deferred for tax purposes to the first day of the following fiscal year.
The Fund 29
| | NOTES TO FINANCIAL STATEMENTS (continued)
|
The accumulated capital loss carryover is available to be applied against future net securities profits, if any, realized subsequent to July 31, 2004. If not applied, $3,308,447 expires in fiscal 2011 and $1,633,108 expires in fiscal 2012.
The tax character of distributions paid to shareholders during the fiscal periods ended July 31, 2004 and July 31, 2003 were as follows: ordinary income $7,481,251 and $12,562,666, respectively.
During the period ended July 31, 2004, as a result of permanent book to tax differences primarily from paydown gains and losses on mortgage backed securities and the sales treatment for treasury inflation protected securities, the fund increased accumulated undistributed investment income-net by $1,463,562 and decreased accumulated net realized gain (loss) on investments by the same amount. Net assets were not affected by this reclassification.
NOTE 2—Bank Line of Credit:
|
The fund participates with other Dreyfus-managed funds in a $100 million unsecured line of credit primarily to be utilized for temporary or emergency purposes, including the financing of redemptions. Interest is charged to the fund based on prevailing market rates in effect at the time of borrowings. During the period ended July 31, 2004, the fund did not borrow under the line of credit.
NOTE 3—Management Fee and Other Transactions With Affiliates:
(a) Pursuant to a management agreement ("Agreement") with the Manager, the management fee is computed at the annual rate of .50 of 1% of the value of the fund's average daily net assets and is payable monthly. The Manager has undertaken from August 1, 2003 through July 31, 2005, that if the aggregated expenses of the fund, exclusive of taxes, brokerage fees, Rule 12b-1 distribution plan fees, shareholder services plan fees and extraordinary expenses, exceed an annual rate of .55 of 1% of the value of the fund's average daily net assets, the fund may deduct from the payment to be made to the Manager under the
30
Agreement, or the Manager will bear, such excess expense.The reduction in management fee, pursuant to the undertaking, amounted to $287,326 during the period ended July 31, 2004.
During the period ended July 31, 2004, the Distributor retained $26,851 from commissions earned on sales of the fund's Class A shares and $123,045 and $16,008 from contingent deferred sales charges on redemptions of the fund's Class B and Class S shares, respectively.
(b) Under the Distribution Plan (the "Plan") adopted pursuant to Rule 12b-1 under the Act, Class B and Class S shares pay the Distributor for distributing their shares at an annual rate of .75 of 1% of the value of the average daily net assets of Class B shares and .25 of 1% of the value of the average daily net assets of Class S shares. During the period ended July 31, 2004, Class B and Class S shares were charged $45,127 and $3,136, respectively, pursuant to the Plan.
(c) Under the Shareholder Services Plan, Class A, Class B, Class D, Class P and Class S shares pay the Distributor at an annual rate of .25 of 1% of the value of their average daily net assets for the provision of certain services. The services provided may include personal services relating to shareholder accounts, such as answering shareholder inquiries regarding Class A, Class B, Class D, Class P and Class S shares and providing reports and other information, and services related to the maintenance of shareholder accounts.The Distributor may make payments to Service Agents (a securities dealer, financial institution or other industry professional) in respect of these services.The Distributor determines the amounts to be paid to Service Agents. During the period ended July 31, 2004, Class A, Class B, Class D, Class P and Class S shares were charged $24,163, $15,042, $659,538, $234,859 and $3,136, respectively, pursuant to the Shareholder Services Plan.
The fund compensates Dreyfus Transfer,Inc.,a wholly-owned subsidiary of the Manager, under a transfer agency agreement for providing personnel and facilities to perform transfer agency services for the fund. During the period ended July 31, 2004, the fund was charged $103,869 pursuant to the transfer agency agreement.
The Fund 31
| | NOTES TO FINANCIAL STATEMENTS (continued)
|
The fund compensates Mellon Bank, N.A., an affiliate of the Manager, under a custody agreement for providing custodial services for the fund. During the period ended July 31, 2004, the fund was charged $29,615 pursuant to the custody agreement.
The components of Due to The Dreyfus Corporation and affiliates in the Statement of Assets and Liabilities consist of: management fees $102,752, Rule 12b-1 distribution plan fees $4,248, shareholder services plan fees $51,389, custodian fees $7,218 and transfer agency per account fees $17,640, which are offset against an expense reimbursement currently in effect in the amount of $40,172.
(d) Each Board member also serves as a Board member of other funds within the Dreyfus complex. Annual retainer fees and attendance fees are allocated to each fund based on net assets.
(e) Pursuant to an exemptive order from the Securities and Exchange Commission, the fund may invest its available cash balances in affiliated money market mutual funds. Management fees of the underlying money market mutual funds have been waived by the Manager.
NOTE 4—Securities Transactions:
|
The aggregate amount of purchases and sales (including paydowns) of investment securities, excluding short-term securities and financial futures, during the period ended July 31, 2004, amounted to $1,044,750,245 and $1,230,768,366, respectively.
The fund may invest in financial futures contracts in order to gain exposure to or protect against changes in the market. The fund is exposed to market risk as a result of changes in the value of the underlying financial instruments. Investments in financial futures require the fund to "mark to market" on a daily basis, which reflects the change in market value of the contracts at the close of each day's trading.Accordingly, variation margin payments are received or made to reflect daily unrealized gains and losses. When the contracts are closed, the fund recognizes a realized gain or loss.These investments require initial margin deposits with a broker, which consist of cash or
32
cash equivalents.The amount of these deposits is determined by the exchange or Board of Trade on which the contract is traded and is subject to change. Contracts open at July 31, 2004, are set forth in the Statement of Financial Futures.
At July 31, 2004, the cost of investments for federal income tax purposes was $240,087,424; accordingly, accumulated net unrealized appreciation on investments was $572,284, consisting of $1,250,282 gross unrealized appreciation and $677,998 gross unrealized depreciation.
Two class actions (which have been consolidated) have been filed against Mellon Financial and Mellon Bank, N.A., and Dreyfus and Founders Asset Management LLC (the "Investment Advisers"), and the directors of all or substantially all of the Dreyfus funds, alleging that the Investment Advisers improperly used assets of the Dreyfus funds, in the form of directed brokerage commissions and 12b-1 fees, to pay brokers to promote sales of Dreyfus funds,and that the use of fund assets to make these payments was not properly disclosed to investors.The complaints further allege that the directors breached their fiduciary duties to fund shareholders under the Investment Company Act of 1940 and at common law. The complaints seek unspecified compensatory and punitive damages, rescission of the funds' contracts with the Investment Advisers, an accounting of all fees paid, and an award of attorneys' fees and litigation expenses. Dreyfus and the Dreyfus funds believe the allegations to be totally without merit and will defend the actions vigorously.
Additional lawsuits arising out of these circumstances and presenting similar allegations and requests for relief may be filed against the defendants in the future. Neither Dreyfus nor the Dreyfus funds believe that any of the pending actions will have a material adverse effect on the Dreyfus funds or Dreyfus' ability to perform its contracts with the Dreyfus funds.
The Fund 33
REPORT OF INDEPENDENT REGISTERED
PUBLIC ACCOUNTING FIRM
|
Shareholders and Board of Directors
Dreyfus Premier Yield Advantage Fund
|
We have audited the accompanying statement of assets and liabilities, including the statements of investments and financial futures, of Dreyfus Premier Yield Advantage Fund (one of the funds comprising Dreyfus Investment Grade Funds, Inc.), as of July 31, 2004, and the related statement of operations for the year then ended, the statement of changes in net assets for each of the two years in the period then ended, and financial highlights for each of the periods indicated therein. These financial statements and financial highlights are the responsibility of the Fund's management. Our responsibility is to express an opinion on these financial statements and financial highlights based on our audits.
We conducted our audits in accordance with the standards of the Public Company Accounting Oversight Board (United States).Those standards require that we plan and perform the audit to obtain reasonable assurance about whether the financial statements and financial highlights are free of material misstatement. An audit includes examining, on a test basis, evidence supporting the amounts and disclosures in the financial statements and financial highlights. Our procedures included verification by examination of securities held by the custodian as of July 31, 2004 and confirmation of securities not held by the custodian by correspondence with others. An audit also includes assessing the accounting principles used and significant estimates made by management, as well as evaluating the overall financial statement presentation.We believe that our audits provide a reasonable basis for our opinion.
In our opinion, the financial statements and financial highlights referred to above present fairly, in all material respects, the financial position of Dreyfus Premier Yield Advantage Fund at July 31, 2004, the results of its operations for the year then ended, the changes in its net assets for each of the two years in the period then ended, and the financial highlights for each of the indicated periods, in conformity with U.S. generally accepted accounting principles.

New York, New York
September 15, 2004
|
34
BOARD MEMBERS INFORMATION (Unaudited)
Joseph S. DiMartino (60)
Chairman of the Board (1994)
|
Principal Occupation During Past 5 Years:
• Corporate Director and Trustee
|
Other Board Memberships and Affiliations:
|
- The Muscular Dystrophy Association, Director
- Levcor International, Inc., an apparel fabric processor, Director
- Century Business Services, Inc., a provider of outsourcing functions for small and medium sizecompanies, Director
- The Newark Group, a provider of a national market of paper recovery facilities,paperboard mills and paperboard converting plants, Director
No. of Portfolios for which Board Member Serves: 186
Clifford L. Alexander, Jr. (70)
Board Member (2003)
|
Principal Occupation During Past 5 Years:
|
- President of Alexander & Associates, Inc., a management consulting firm ( January 1981-present)
- Chairman of the Board of Moody's Corporation (October 2000-October 2003)
- Chairman of the Board and Chief Executive Officer of The Dun and Bradstreet Corporation(October 1999-September 2000)
Other Board Memberships and Affiliations:
|
- Wyeth (formerly, American Home Products Corporation), a global leader in pharmaceuticals,consumer healthcare products and animal health products, Director
- Mutual of America Life Insurance Company, Director
No. of Portfolios for which Board Member Serves: 65
|
———————
Lucy Wilson Benson (76) Board Member (1994)
Principal Occupation During Past 5 Years:
• President of Benson and Associates, consultants to business and government (1980-present)
Other Board Memberships and Affiliations:
|
- The International Executive Services Corps., Director
- Citizens Network for Foreign Affairs,Vice Chairperson
- Council on Foreign Relations, Member
- Lafayette College Board of Trustees,Vice Chairperson Emeritus
- Atlantic Council of the U.S., Director
No. of Portfolios for which Board Member Serves: 39
|
The Fund 35
BOARD MEMBERS INFORMATION (Unaudited) (continued)
David W. Burke (68)
Board Member (1994)
|
Principal Occupation During Past 5 Years:
• Corporate Director and Trustee
|
Other Board Memberships and Affiliations:
|
- John F. Kennedy Library Foundation, Director
- U.S.S. Constitution Museum, Director
No. of Portfolios for which Board Member Serves: 83
Whitney I. Gerard (69)
Board Member (1993)
|
Principal Occupation During Past 5 Years:
• Partner of Chadbourne & Parke LLP
|
No. of Portfolios for which Board Member Serves: 37
Arthur A. Hartman (78)
Board Member (1992)
|
Principal Occupation During Past 5 Years:
|
- Chairman of First NIS Regional Fund (ING/Barings Management) and New Russia Fund
- Advisory Council Member to Barings-Vostok
Other Board Memberships and Affiliations:
• APCO Associates Inc., Senior Consultant
|
No. of Portfolios for which Board Member Serves: 37
George L. Perry (70)
Board Member (1992)
|
Principal Occupation During Past 5 Years:
• Economist and Senior Fellow at Brookings Institution
Other Board Memberships and Affiliations:
|
- State Farm Mutual Automobile Association, Director
- State Farm Life Insurance Company, Director
No. of Portfolios for which Board Member Serves: 37
Once elected all Board Members serve for an indefinite term.The address of the Board Members and Officers is in c/o The Dreyfus Corporation, 200 Park Avenue, New York, New York 10166.Additional information about the Board Members is available in the fund's Statement of Additional Information which can be obtained from Dreyfus free of charge by calling this toll free number: 1-800-554-4611.
OFFICERS OF THE FUND (Unaudited)
STEPHEN E. CANTER, President since March 2000.
Chairman of the Board, Chief Executive Officer and Chief Operating Officer of the Manager, and an officer of 97 investment companies (comprised of 190 portfolios) managed by the Manager. Mr. Canter also is a Board member and, where applicable, an Executive Committee Member of the other investment management subsidiaries of Mellon Financial Corporation, each of which is an affiliate of the Manager. He is 59 years old and has been an employee of the Manager since May 1995.
STEPHEN R. BYERS, Executive Vice President since October 2002.
Chief Investment Officer,Vice Chairman and a Director of the Manager, and an officer of 97 investment companies (comprised of 190 portfolios) managed by the Manager. Mr. Byers also is an officer, director or an Executive Committee Member of certain other investment management subsidiaries of Mellon Financial Corporation, each of which is an affiliate of the Manager. He is 50 years old and has been an employee of the Manager since January 2000. Prior to joining the Manager, he served as an Executive Vice President-Capital Markets, Chief Financial Officer and Treasurer at Gruntal & Co., L.L.C.
MARK N. JACOBS, Vice President since March 2000.
Executive Vice President, Secretary and General Counsel of the Manager, and an officer of 98 investment companies (comprised of 206 portfolios) managed by the Manager. He is 58 years old and has been an employee of the Manager since June 1977.
MICHAEL A. ROSENBERG, Secretary since March 2000.
Associate General Counsel of the Manager, and an officer of 95 investment companies (comprised of 199 portfolios) managed by the Manager. He is 44 years old and has been an employee of the Manager since October 1991.
ROBERT R. MULLERY, Assistant Secretary since March 2000.
Associate General Counsel of the Manager, and an officer of 26 investment companies (comprised of 58 portfolios) managed by the Manager. He is 52 years old and has been an employee of the Manager since May 1986.
STEVEN F. NEWMAN, Assistant Secretary since March 2000.
Associate General Counsel and Assistant Secretary of the Manager, and an officer of 98 investment companies (comprised of 206 portfolios) managed by the Manager. He is 54 years old and has been an employee of the Manager since July 1980.
JEFF PRUSNOFSKY, Assistant Secretary since January 2003.
Associate General Counsel of the Manager, and an officer of 26 investment companies (comprised of 87 portfolios) managed by the Manager. He is 39 years old and has been an employee of the Manager since October 1990.
The Fund 37
| | OFFICERS OF THE FUND (Unaudited) (continued)
|
JAMES WINDELS, Treasurer since November 2001.
Director – Mutual Fund Accounting of the Manager, and an officer of 98 investment companies (comprised of 206 portfolios) managed by the Manager. He is 45 years old and has been an employee of the Manager since April 1985.
ERIK D. NAVILOFF, Assistant Treasurer
since December 2002.
Senior Accounting Manager – Taxable Fixed
Income Funds of the Manager, and an officer
of 19 investment companies (comprised of 74
portfolios) managed by the Manager. He is 36
years old and has been an employee of the
Manager since November 1992.
|
| | KENNETH J. SANDGREN, Assistant
Treasurer since November 2001.
Mutual Funds Tax Director of the Manager,
and an officer of 98 investment companies
(comprised of 206 portfolios) managed by the
Manager. He is 49 years old and has been an
employee of the Manager since June 1993.
|
WILLIAM GERMENIS, Anti-Money Laundering Compliance Officer since August 2002.
Vice President and Anti-Money Laundering Compliance Officer of the Distributor, and the Anti-Money Laundering Compliance Officer of 93 investment companies (comprised of 201 portfolios) managed by the Manager. He is 33 years old and has been an employee of the Distributor since October 1998.
38
| For More | | Information |
| |
|
| |
| Dreyfus Premier | | Transfer Agent & |
| Yield Advantage Fund | | Dividend Disbursing Agent |
| 200 Park Avenue | | |
| | | Dreyfus Transfer, Inc. |
| New York, NY 10166 | | |
| | | 200 Park Avenue |
| Manager | | New York, NY 10166 |
| The Dreyfus Corporation | | Distributor |
| 200 Park Avenue | | |
| | | Dreyfus Service Corporation |
| New York, NY 10166 | | |
| | | 200 Park Avenue |
| Custodian | | New York, NY 10166 |
| Mellon Bank, N.A. | | |
| One Mellon Bank Center | | |
| Pittsburgh, PA 15258 | | |
Telephone Call your financial representative or 1-800-554-4611
| | Mail The Dreyfus Premier Family of Funds
144 Glenn Curtiss Boulevard, Uniondale, NY 11556-0144
|
A description of the policies and procedures that the fund uses to determine how to vote proxies relating to portfolio securities, and information regarding how the fund voted these proxies for the 12-month period ended June 30, 2004, is available through the fund's website at http://www.dreyfus.com and on the SEC's website at http://www.sec.gov. The description of the policies and procedures is also available without charge, upon request, by calling 1-800-645-6561.
Beginning with the fund's fiscal quarter ending October 31, 2004, the fund will file its complete schedule of portfolio holdings with the SEC for the first and third quarters of each fiscal year on Form N-Q; the fund's Forms N-Q will be available on the SEC's website at http://www.sec.gov; and the fund's Forms N-Q may be reviewed and copied at the SEC's Public Reference Room in Washington, DC, and information on the operation of the Public Reference Room may be obtained by calling 1-800-SEC-0330.

© 2004 Dreyfus Service Corporation
| | Dreyfus
Inflation Adjusted
Securities Fund
|
The views expressed in this report reflect those of the portfolio manager only through the end of the period covered and do not necessarily represent the views of Dreyfus or any other person in the Dreyfus organization. Any such views are subject to change at any time based upon market or other conditions and Dreyfus disclaims any responsibility to update such views.These views may not be relied on as investment advice and, because investment decisions for a Dreyfus fund are based on numerous factors, may not be relied on as an indication of trading intent on behalf of any Dreyfus fund.
Not FDIC-Insured • Not Bank-Guaranteed • May Lose Value
| Contents |
| |
| | | THE FUND |
| |
|
| 2 | | Letter from the Chairman |
| 3 | | Discussion of Fund Performance |
| 6 | | Fund Performance |
| 7 | | Understanding Your Fund's Expenses |
| 7 | | Comparing Your Fund's Expenses |
| With Those of Other Funds |
| 8 | | Statement of Investments |
| 9 | | Statement of Financial Futures |
| 10 | | Statement of Assets and Liabilities |
| 11 | | Statement of Operations |
| 12 | | Statement of Changes in Net Assets |
| 14 | | Financial Highlights |
| 16 | | Notes to Financial Statements |
| 24 | | Report of Independent Registered |
| | | Public Accounting Firm |
| 25 | | Board Members Information |
| 27 | | Officers of the Fund |
| FOR MORE INFORMATION |
|
| | | Back Cover |
| Dreyfus |
| Inflation Adjusted |
| Securities Fund |
The Fund

LETTER FROM THE CHAIRMAN
This annual report for Dreyfus Inflation Adjusted Securities Fund covers the 12-month period from August 1, 2003, through July 31, 2004. Inside, you'll find valuable information about how the fund was managed during the reporting period, including a discussion with Gerald E. Thunelius, portfolio manager and Director of the Dreyfus Taxable Fixed Income Team that manages the fund.
The U.S. economy has increasingly shown signs of sustainable growth during the reporting period, causing heightened volatility in most sectors of the U.S. bond market. As it became clearer that a strong job market and higher energy prices might lead to renewed inflationary pressures,the Federal Reserve Board raised short-term interest rates by 25 basis points at its meeting in late June.This shift in monetary policy represents the first increase in short-term rates in more than four years, and many analysts believe that additional, gradual increases are likely to follow.
For many investors, the move to a less accommodative monetary policy marks the beginning of a new phase in the economic cycle. At times such as these, when market conditions are in a period of transition, we believe it is especially important for you to stay in close contact with your financial advisor, who can help you position your portfolio in a way that is designed to respond to the challenges and opportunities of today's changing investment environment.
Thank you for your continued confidence and support.

Stephen E. Canter
Chairman and Chief Executive Officer
The Dreyfus Corporation
August 16, 2004
|
2

DISCUSSION OF FUND PERFORMANCE
Gerald E. Thunelius, Director and Senior Portfolio Manager Dreyfus Taxable Fixed Income Team
How did Dreyfus Inflation Adjusted Securities Fund perform relative to its benchmark?
For the 12-month period ended July 31, 2004, the fund's Institutional shares achieved a total return of 8.06%, and its Investor shares achieved a total return of 7.79% .1 In comparison, the fund's benchmark, the Lehman Brothers U.S. Treasury Inflation Protected Securities Index (the "Index"), achieved a total return of 9.91% for the same period.2
While a strengthening economy led to heightened volatility in most fixed-income markets during the reporting period, Treasury Inflation Protected Securities ("TIPS") fared relatively well as investors' inflation expectations intensified. The fund produced lower returns than its benchmark, primarily because the fund's holdings of nominal U.S. Treasury securities, which comprised approximately 10% of the fund's assets during the reporting period, underperformed TIPS, which constitute 100% of the benchmark.
What is the fund's investment approach?
The fund seeks returns that exceed the rate of inflation.To pursue this goal, the fund normally invests at least 80% of its assets in inflation-indexed securities, which are designed to protect investors from a loss of value due to inflation.
The fund invests primarily in high-quality, U.S. dollar-denominated, inflation-indexed securities. To a limited extent, the fund may invest in foreign currency-denominated, inflation-protected securities and other fixed-income securities not adjusted for inflation, including U.S. government bonds and notes, corporate bonds, mortgage-related securities and asset-backed securities.
The Fund 3
| | DISCUSSION OF FUND PERFORMANCE (continued)
|
While the fund seeks to keep its average effective duration — a measure of sensitivity to changing interest rates — between two and 10 years, it may invest in securities with effective or final maturities of any length. Generally,we will adjust the fund's holdings or its average duration based on actual or anticipated changes in interest rates or credit quality.
What other factors influenced the fund's performance?
The U.S. economy already had begun to improve at the beginning of the reporting period, with strength evident in both consumer and corporate spending. However, inflationary pressures appeared to remain low through the first quarter of 2004 when labor markets failed to improve. As a result, the Federal Reserve Board (the "Fed") kept interest rates at 1%, their lowest level since 1958.
While U.S. Treasury securities, including TIPS, generally continued to rally during the first half of the reporting period, the market experienced greater volatility as investors reacted to each new release of economic data,looking for signs that renewed inflationary pressures might cause the Fed to change course from the accommodative monetary policy that had been in place for approximately three years. In April 2004, evidence of mounting inflationary pressures finally appeared when new data showed that an unexpectedly high number of new jobs had been created in the recovering economy. In addition, sharply higher energy prices contributed to investors' growing concerns that the Fed was likely to raise short-term interest rates sooner than many previously had expected.As a result, investors turned to TIPS for inflation-protected returns, helping to support their prices compared to nominal U.S.Treasury securities during the reporting period's second half.
Because it seemed to us in January that the Fed was likely to begin raising interest rates in a strengthening economy, we adopted an investment posture reflecting our view that short-term interest rates probably would rise and yield differences among bonds of various maturities probably were likely to narrow. In addition, we allocated approximately 10% of the fund's assets to nominal U.S.Treasury securities, which we believed
4
represented more attractive values than TIPS. In hindsight, the timing of these strategies proved to be too early. Instead of narrowing as we had expected, yield differences have widened so far in 2004, contributing to the fund's lagging performance relative to its benchmark. In addition, TIPS have continued to gain value, and the fund's holdings of nominal Treasuries have prevented it from participating fully in their rally.
What is the fund's current strategy?
On June 30,2004,the Fed raised its target for the overnight federal funds rate by 25 basis points to 1.25% in what many investors believed was the first in a series of gradual increases. Therefore, we have continued to position the fund for narrower yield differences in the expectation that short-term interest rates will continue to rise. In addition, we have attempted to manage risks by setting the fund's average duration in a range we consider neutral. In our view, these are prudent strategies until the economy's strength and the Fed's intentions become clearer. Of course, we will continue to actively monitor the fixed-income markets and make portfolio changes as warranted.
1 Total return includes reinvestment of dividends and any capital gains paid. Past performance is no guarantee of future results. Share price, yield and investment return fluctuate such that upon redemption, fund shares may be worth more or less than their original cost. Return figures provided reflect the absorption of fund expenses by The Dreyfus Corporation pursuant to an agreement in effect through July 31, 2005, at which time it may be extended, terminated or modified. Had these expenses not been absorbed, the fund's returns would have been lower.
2 SOURCE: LEHMAN BROTHERS INC. — Reflects reinvestment of dividends and, where applicable, capital gain distributions.The Lehman Brothers U.S.Treasury Inflation Protected Securities Index is a sub-index of the U.S.Treasury component of the Lehman Brothers U.S. Government Index. Securities in the Lehman Brothers U.S.Treasury Inflation Protected Securities Index are dollar-denominated, non-convertible, publicly issued, fixed-rate, investment-grade (Moody's Baa3 or better) U.S.Treasury inflation notes, with at least one year to final maturity and at least $100 million par amount outstanding.
The Fund 5

Comparison of change in value of $10,000 investment in Dreyfus Inflation Adjusted Securities Fund Investor shares and Institutional shares and the Lehman Brothers U.S. Treasury Inflation Protected Securities Index
| Average Annual Total Returns as of 7/31/04 | | | | |
| | | Inception | | | | From |
| | | Date | | 1 Year | | Inception |
| |
| |
| |
|
| Investor shares | | 10/31/02 | | 7.79% | | 7.12% |
| Institutional shares | | 10/31/02 | | 8.06% | | 7.38% |
| | † Source: Lehman Brothers Inc.
Past performance is not predictive of future performance.The fund's performance shown in the graph and table does not
reflect the deduction of taxes that a shareholder would pay on fund distributions or the redemption of fund shares.
The above graph compares a $10,000 investment made in Investor and Institutional shares of Dreyfus Inflation
Adjusted Securities Fund on 10/31/02 (inception date) to a $10,000 investment made in the Lehman Brothers
U.S.Treasury Inflation Protected Securities Index (the "Index") on that date. All dividends and capital gain
distributions are reinvested.
The fund's performance shown in the line graph takes into account all applicable fees and expenses.The Index is a sub-
index of the U.S.Treasury component of the Lehman Brothers U.S. Government Index. Securities in the Index are
dollar-denominated, non-convertible, publicly-issued, fixed-rate, investment-grade (Moody's Baa3 or better) U.S.
Treasury inflation notes, with at least one year to final maturity and at least $100 million par amount outstanding.
The Index does not take into account charges, fees and other expenses. Further information relating to fund
performance, including expense reimbursements, if applicable, is contained in the Financial Highlights section of the
prospectus and elsewhere in this report.
|
6
UNDERSTANDING YOUR FUND'S EXPENSES
As a mutual fund investor, you pay ongoing expenses, such as management fees and other expenses. Using the information below, you can estimate how these expenses affect your investment and compare them with the expenses of other funds.You also may pay one-time transaction expenses, including sales charges (loads) and redemption fees, which are not shown in this section and would have resulted in higher total expenses. For more information, see your fund's prospectus or talk to your financial advisor.
Review your fund's expenses
The table below shows the expenses you would have paid on a $1,000 investment in Dreyfus Inflation Adjusted Securities Fund from February 1, 2004 to July 31, 2004. It also shows how much a $1,000 investment would be worth at the close of the period, assuming actual returns and expenses.
| Expenses and Value of a $1,000 Investment | | |
| assuming actual returns for the six months ended July 31, 2004 | | |
| | | Investor Shares | | Institutional Shares |
| |
| |
|
| Expenses paid per $1,000 † | | $ 2.75 | | $ 1.50 |
| Ending value (after expenses) | | $1,009.40 | | $1,010.60 |
COMPARING YOUR FUND'S EXPENSES
WITH THOSE OF OTHER FUNDS
|
Using the SEC's method to compare expenses
The Securities and Exchange Commission (SEC) has established guidelines to help investors assess fund expenses. Per these guidelines, the table below shows your fund's expenses based on a $1,000 investment, assuming a hypothetical 5% annualized return.You can use this information to compare the ongoing expenses (but not transaction expenses or total costs) of investing in the fund with those of other funds. All mutual fund shareholder reports will provide this information to help you make this comparison. Please note that you cannot use this information to estimate your actual ending account balance and expenses paid during the period.
Expenses and Value of a $1,000 Investment
assuming a hypothetical 5% annualized return for the six months ended July 31, 2004
|
| | | Investor Shares | | Institutional Shares |
| |
| |
|
| Expenses paid per $1,000 † | | $ 2.77 | | $ 1.51 |
| Ending value (after expenses) | | $1,022.13 | | $1,023.37 |
† Expenses for each share class are calculated using the fund's annualized expense ratio for each class, which represents the
ongoing expenses as a percentage of net assets for the six months ended 7/31/04.The expense ratio may differ for each
share class. Expenses are calculated by multiplying the expense ratio by the average account value for the period; then
multiplying the result by the number of days in the period; and then dividing that result by the number of days in the year.
|
The Fund 7
| | STATEMENT OF INVESTMENTS
July 31, 2004
|
| | | Principal | | |
| Bonds and Notes—87.5% | | Amount ($) | | Value ($) |
| |
| |
|
| U.S. Treasury Bonds—.6% | | | | |
| 5.375%, 2/15/2031 | | 35,000 | | 35,859 |
| U.S. Treasury Inflation Protected Securities—86.9% | | |
| 1.875%, 7/15/2013 | | 1,492,630 a | | 1,486,300 |
| 2%, 1/15/2014 | | 2,046,440 a | | 2,053,117 |
| 3.375%, 1/15/2012 | | 889,087 a | | 990,217 |
| 3.625%, 4/15/2028 | | 584,470 a,b | | 708,785 |
| Coupon Strips: | | | | |
| 0%, 10/15/2028 | | 10,000 a,c | | 10,086 |
| 0%, 4/15/2029 | | 10,000 a,c | | 10,079 |
| Principal Strips, | | | | |
| 0%, 4/15/2029 | | 150,000 a,c | | 92,861 |
| | | | | 5,351,445 |
| Total Bonds and Notes | | | | |
| (cost $5,333,122) | | | | 5,387,304 |
| |
| |
|
| Other Investments—7.7% | | Shares | | Value ($) |
| |
| |
|
| Registered Investment Company; | | | | |
| Dreyfus Institutional Preferred Plus Money Market Fund | | |
| (cost $472,000) | | 472,000 d | | 472,000 |
| |
| |
|
| Total Investments (cost $5,805,122) | | 95.2% | | 5,859,304 |
| Cash and Receivables (Net) | | 4.8% | | 294,082 |
| Net Assets | | 100.0% | | 6,153,386 |
| | a Principal amount for accrual purposes is periodically adjusted based on changes in the Consumer Price Index.
b Partially held by a broker as collateral for open financial futures positions.
c Notional face amount shown.
d Investment in affiliated money market mutual fund.
|
| Portfolio Summary † | | | | | | |
| |
| | | Value (%) | | | | Value (%) |
| |
| |
| |
|
| U.S. Treasury Inflation | | | | U.S. Treasury Bonds | | .6 |
| Protected Securities | | 86.9 | | Futures contracts | | (.1) |
| Money Market Investments | | 7.7 | | | | 95.1 |
| | † Based on net assets.
See notes to financial statements.
|
8
STATEMENT OF FINANCIAL FUTURES
July 31, 2004
|
| | | | | | | | | Unrealized |
| | | | | Market Value | | | | Appreciation |
| | | | | Covered by | | | | (Depreciation) |
| | | Contracts | | Contracts ($) | | Expiration | | at 7/31/2004 ($) |
| |
| |
| |
| |
|
| Financial Futures Long | | | | | | | | |
| U.S. Treasury 10 Year Notes | | 5 | | 553,594 | | September 2004 | | 5,078 |
| Financial Futures Short | | | | | | | | |
| U.S. Treasury 2 Year Notes | | 1 | | 211,125 | | September 2004 | | (390) |
| U.S. Treasury 5 Year Notes | | 15 | | 1,642,500 | | September 2004 | | (11,719) |
| | | | | | | | | (7,031) |
See notes to financial statements.
|
The Fund 9
| | STATEMENT OF ASSETS AND LIABILITIES
July 31, 2004
|
| | | Cost | | Value |
| |
| |
|
| Assets ($): | | | | |
| Investments in securities—See Statement of Investments: | | |
| Unaffiliated issuers | | 5,333,122 | | 5,387,304 |
| Affiliated issuers | | 472,000 | | 472,000 |
| Receivable for investment securities sold | | 439,760 |
| Interest receivable | | | | 11,945 |
| Prepaid expenses | | | | 12,399 |
| Due from The Dreyfus Corporation—Note 3(b) | | 1,440 |
| | | | | 6,324,848 |
| |
| |
|
| Liabilities ($): | | | | |
| Cash overdraft due to Custodian | | 17,489 |
| Payable for investment securities purchased | | 119,547 |
| Payable for futures variation margin—Note 4 | | 3,078 |
| Accrued expenses | | | | 31,348 |
| | | | | 171,462 |
| |
| |
|
| Net Assets ($) | | | | 6,153,386 |
| |
| |
|
| Composition of Net Assets ($): | | |
| Paid-in capital | | | | 6,277,436 |
| Accumulated distributions in excess of investment income—net | | (73,800) |
| Accumulated net realized gain (loss) on investments | | (97,401) |
| Accumulated net unrealized appreciation (depreciation) | | |
| on investments [including ($7,031) net unrealized | | |
| (depreciation) on financial futures] | | 47,151 |
| |
|
| Net Assets ($) | | | | 6,153,386 |
| Net Asset Value Per Share | | | | |
| | | Investor Shares | | Institutional Shares |
| |
| |
|
| Net Assets ($) | | 2,857,039 | | 3,296,347 |
| Shares Outstanding | | 233,165 | | 269,022 |
| |
| |
|
| Net Asset Value Per Share ($) | | 12.25 | | 12.25 |
See notes to financial statements.
10
STATEMENT OF OPERATIONS
Year Ended July 31, 2004
|
| Investment Income ($): | | |
| Interest | | 142,939 |
| Dividends; | | |
| Affiliated issuers | | 4,486 |
| Income from securities lending | | 240 |
| Total Income | | 147,665 |
| Expenses: | | |
| Management fee—Note 3(a) | | 17,494 |
| Auditing fees | | 27,895 |
| Registration fees | | 27,091 |
| Prospectus and shareholders' reports | | 9,791 |
| Shareholder servicing costs—Note 3(b) | | 7,457 |
| Custodian fees—Note 3(b) | | 3,987 |
| Directors' fees and expenses—Note 3(c) | | 623 |
| Miscellaneous | | 2,779 |
| Total Expenses | | 97,117 |
| Less—expense reimbursement from The Dreyfus Corporation | | |
| due to undertaking—Note 3(a) | | (72,611) |
| Net Expenses | | 24,506 |
| Investment Income—Net | | 123,159 |
| |
|
| Realized and Unrealized Gain (Loss) on Investments—Note 4 ($): |
| Net realized gain (loss) on investments and foreign currency transactions | | 2,405 |
| Net realized gain (loss) on forward currency exchange contracts | | (2,556) |
| Net realized gain (loss) on financial futures | | (283) |
| Net Realized Gain (Loss) | | (434) |
| Net unrealized appreciation (depreciation) on investments | | |
| and foreign currency transactions [including ($7,031) | | |
| net unrealized (depreciation) on financial futures] | | 304,519 |
| Net Realized and Unrealized Gain (Loss) on Investments | | 304,085 |
| Net Increase in Net Assets Resulting from Operations | | 427,244 |
See notes to financial statements.
|
The Fund 11
STATEMENT OF CHANGES IN NET ASSETS
| | | | | Year Ended July 31, |
| |
| |
|
| | | 2004 | | 2003 a |
| |
| |
|
| Operations ($): | | | | |
| Investment income—net | | 123,159 | | 96,449 |
| Net realized gain (loss) on investments | | (434) | | 397,751 |
| Net unrealized appreciation | | | | |
| (depreciation) on investments | | 304,519 | | (257,368) |
| Net Increase (Decrease) in Net Assets | | | | |
| Resulting from Operations | | 427,244 | | 236,832 |
| |
| |
|
| Dividends to Shareholders from ($): | | | | |
| Investment income—net: | | | | |
| Investor Shares | | (122,713) | | (79,822) |
| Institutional Shares | | (140,904) | | (84,081) |
| Net realized gain on investments: | | | | |
| lnvestor Shares | | (181,230) | | — |
| Institutional Shares | | (179,376) | | — |
| Total Dividends | | (624,223) | | (163,903) |
| |
| |
|
| Capital Stock Transactions ($): | | | | |
| Net proceeds from shares sold: | | | | |
| Investor Shares | | — | | 2,534,293 |
| Institutional Shares | | 487,542 | | 2,500,000 |
| Dividends reinvested: | | | | |
| Investor Shares | | 303,943 | | 79,822 |
| Institutional Shares | | 319,760 | | 84,081 |
| Cost of shares redeemed: | | | | |
| Institutional Shares | | (32,005) | | — |
| Increase (Decrease) in Net Assets from | | | | |
| Capital Stock Transactions | | 1,079,240 | | 5,198,196 |
| Total Increase (Decrease) in Net Assets | | 882,261 | | 5,271,125 |
| |
| |
|
| Net Assets ($): | | | | |
| Beginning of Period | | 5,271,125 | | — |
| End of Period | | 6,153,386 | | 5,271,125 |
| Undistributed (distributions in excess of) | | | | |
| investment income—net | | (73,800) | | 6,368 |
| | | | | Year Ended July 31, |
| |
| |
|
| | | 2004 | | 2003 a |
| |
| |
|
| Capital Share Transactions: | | | | |
| Investor Shares | | | | |
| Shares sold | | — | | 202,636 |
| Shares issued for dividends reinvested | | 24,346 | | 6,183 |
| Net Increase (Decrease) in Shares Outstanding | | 24,346 | | 208,819 |
| |
| |
|
| Institutional Shares | | | | |
| Shares sold | | 39,425 | | 200,000 |
| Shares issued for dividends reinvested | | 25,617 | | 6,515 |
| Shares redeemed | | (2,535) | | — |
| Net Increase (Decrease) in Shares Outstanding | | 62,507 | | 206,515 |
a From October 31, 2002 (commencement of operations) to July 31, 2003.
See notes to financial statements.
|
The Fund 13
The following table describes the performance for each share class for the fiscal periods indicated.All information (except portfolio turnover rate) reflects financial results for a single fund share.Total return shows how much your investment in the fund would have increased (or decreased) during each period, assuming you had reinvested all dividends and distributions.These figures have been derived from the fund's financial statements.
| | | Year Ended July 31, |
| |
|
| Investor Shares | | 2004 | | 2003 a |
| |
| |
|
| Per Share Data ($): | | | | |
| Net asset value, beginning of period | | 12.69 | | 12.50 |
| Investment Operations: | | | | |
| Investment income—net b | | .26 | | .23 |
| Net realized and unrealized gain | | | | |
| (loss) on investments | | .71 | | .35 |
| Total from Investment Operations | | .97 | | .58 |
| Distributions: | | | | |
| Dividends from investment income-net | | (.55) | | (.39) |
| Dividends from net realized gain on investments | | (.86) | | — |
| Total Distributions | | (1.41) | | (.39) |
| Net asset value, end of period | | 12.25 | | 12.69 |
| |
| |
|
| Total Return (%) | | 7.79 | | 4.63c |
| |
| |
|
| Ratios/Supplemental Data (%): | | | | |
| Ratio of total expenses to average net assets | | 1.80 | | 3.30d |
| Ratio of net expenses to average net assets | | .55 | | .55d |
| Ratio of net investment income | | | | |
| to average net assets | | 2.05 | | 2.33d |
| Portfolio Turnover Rate | | 951.51 | | 1,306.72c |
| |
| |
|
| Net Assets, end of period ($ x 1,000) | | 2,857 | | 2,650 |
| | a From October 31, 2002 (commencement of operations) to July 31 ,2003.
b Based on average shares outstanding.
c Not annualized.
d Annualized.
|
See notes to financial statements.
14
| | | Year Ended July 31, |
| |
|
| Institutional Shares | | 2004 | | 2003 a |
| |
| |
|
| Per Share Data ($): | | | | |
| Net asset value, beginning of period | | 12.69 | | 12.50 |
| Investment Operations: | | | | |
| Investment income—net b | | .27 | | .25 |
| Net realized and unrealized gain | | | | |
| (loss) on investments | | .73 | | .35 |
| Total from Investment Operations | | 1.00 | | .60 |
| Distributions: | | | | |
| Dividends from investment income-net | | (.58) | | (.41) |
| Dividends from net realized gain on investments | | (.86) | | — |
| Total Distributions | | (1.44) | | (.41) |
| Net asset value, end of period | | 12.25 | | 12.69 |
| |
| |
|
| Total Return (%) | | 8.06 | | 4.82c |
| |
| |
|
| Ratios/Supplemental Data (%): | | | | |
| Ratio of total expenses to average net assets | | 1.54 | | 3.06d |
| Ratio of net expenses to average net assets | | .30 | | .30d |
| Ratio of net investment income | | | | |
| to average net assets | | 2.17 | | 2.58d |
| Portfolio Turnover Rate | | 951.51 | | 1,306.72c |
| |
| |
|
| Net Assets, end of period ($ x 1,000) | | 3,296 | | 2,621 |
a From October 31, 2002 (commencement of operations) to July 31 ,2003.
b Based on average shares outstanding.
c Not annualized.
d Annualized.
|
See notes to financial statements.
The Fund 15
NOTES TO FINANCIAL STATEMENTS
NOTE 1—Significant Accounting Policies:
Dreyfus Inflation Adjusted Securities Fund (the "fund") is a separate diversified series of Dreyfus Investment Grade Funds, Inc. (the "Company") which is registered under the Investment Company Act of 1940, as amended (the "Act"), as an open-end management investment company and operates as a series company currently offering five series, including the fund. The fund's investment objective is to seek returns that exceed the rate of inflation. The Dreyfus Corporation (the "Manager" or "Dreyfus") serves as the fund's investment adviser. The Manager is a wholly-owned subsidiary of Mellon Financial Corporation ("Mellon Financial"). Dreyfus Service Corporation (the "Distributor"), a wholly-owned subsidiary of the Manager, is the distributor of the fund's shares which are sold to the public without a sales charge.
The fund is authorized to issue 500 million shares of $.001 par value Common Stock in each of the following classes of shares: Investor and Institutional. Investor shares are subject to a shareholder services plan. Other differences between the classes include the services offered to and the expenses borne by each class, the minimum initial investment and certain voting rights. Income, expenses (other than expenses attributable to a specific class), and realized and unrealized gains or losses on investments are allocated to each class of shares based on its relative net assets.
As of July 31, 2004, MBC Investments Corp., an indirect subsidiary of Mellon Financial, held 230,161 Investor shares and 231,160 Institutional shares.
The Company accounts separately for the assets, liabilities and operations of each series. Expenses directly attributable to each series are charged to that series' operations; expenses which are applicable to all series are allocated among them on a pro rata basis.
The fund's financial statements are prepared in accordance with U.S. generally accepted accounting principles, which may require the use of management estimates and assumptions. Actual results could differ from those estimates.
16
The fund enters into contracts that contain a variety of indemnifications. The fund's maximum exposure under these arrangements is unknown.The fund does not anticipate recognizing any loss related to these arrangements.
(a) Portfolio valuation: Investments in securities (excluding short-term investments (other than U.S.Treasury Bills), financial futures, options and foreign currency exchange contracts) are valued each business day by an independent pricing service (the "Service") approved by the Board of Directors. Investments for which quoted bid prices are readily available and are representative of the bid side of the market in the judgment of the Service are valued at the mean between the quoted bid prices (as obtained by the Service from dealers in such securities) and asked prices (as calculated by the Service based upon its evaluation of the market for such securities). Other investments (which constitute a majority of the portfolio securities) are valued as determined by the Service, based on methods which include consideration of: yields or prices of securities of comparable quality, coupon, maturity and type; indications as to values from dealers; and general market conditions. Securities for which there are no such valuations are valued at fair value as determined in good faith under the direction of the Board of Directors. Restricted securities, as well as securities or other assets for which recent market quotations are not readily available, that are not valued by a pricing service approved by the fund's Board of Directors,or are determined by the fund not to reflect accurately fair value (such as when an event occurs after the close of the exchange on which the security is principally traded and that is determined by the fund to have changed the value of the security), are valued at fair value as determined in good faith under the direction of the Board of Directors.The factors that may be considered when fair valuing a security include fundamental analytical data, the nature and duration of restrictions on disposition, an evaluation of the forces that influence the market in which the securities are purchased and sold, and public trading in similar securities of the issuer or comparable issuers.Short-term investments, excluding U.S.Treasury Bills, are carried at amortized cost, which
The Fund 17
| | NOTES TO FINANCIAL STATEMENTS (continued)
|
approximates value. Financial futures and options, which are traded on an exchange, are valued at the last sales price on the securities exchange on which such securities are primarily traded or at the last sales price on the national securities market on each business day. Options traded over-the-counter are priced at the mean between the bid prices and asked prices. Investments denominated in foreign currencies are translated to U.S. dollars at the prevailing rates of exchange. Forward currency exchange contracts are valued at the forward rate.
(b) Foreign currency transactions: The fund does not isolate that portion of the results of operations resulting from changes in foreign exchange rates on investments from the fluctuations arising from changes in the market prices of securities held. Such fluctuations are included with the net realized and unrealized gain or loss from investments.
Net realized foreign exchange gains or losses arise from sales and maturities of short-term securities, sales of foreign currencies, currency gains or losses realized on securities transactions and the difference between the amount of dividends, interest and foreign withholding taxes recorded on the fund's books and the U.S. dollar equivalent of the amounts actually received or paid. Net unrealized foreign exchange gains and losses arise from changes in the value of assets and liabilities other than investments in securities at fiscal year end, resulting from changes in exchange rates. Such gains and losses are included with net realized and unrealized gain or loss on investments.
(c) Securities transactions and investment income: Securities transactions are recorded on a trade date basis. Realized gain and loss from securities transactions are recorded on the identified cost basis. Dividend income is recognized on the ex-dividend date and interest income, including, where applicable, amortization of discount and premium on investments, is recognized on the accrual basis.
The fund has an arrangement with the custodian bank whereby the fund receives earnings credits from the custodian when positive cash balances are maintained, which are used to offset custody fees. For financial reporting purposes, the fund includes net earnings credits as an expense offset in the Statement of Operations.
18
(d) Affiliated issuers: Investments in other investment companies advised by the Manager are defined as "affiliated" in the Act.
(e) Dividends to shareholders: It is the policy of the fund to declare dividends daily from investment income-net. Such dividends are paid monthly. Dividends from net realized capital gain, if any, are normally declared and paid annually, but the fund may make distributions on a more frequent basis to comply with the distribution requirements of the Internal Revenue Code of 1986, as amended (the "Code").To the extent that net realized capital gain can be offset by capital loss carryovers, if any, it is the policy of the fund not to distribute such gain. Income and capital gain distributions are determined in accordance with income tax regulations, which may differ from U.S. generally accepted accounting principles.
(f) Federal income taxes: It is the policy of the fund to continue to qualify as a regulated investment company, if such qualification is in the best interests of its shareholders, by complying with the applicable provisions of the Code, and to make distributions of taxable income sufficient to relieve it from substantially all federal income and excise taxes.
At July 31, 2004, the components of accumulated earnings on a tax basis were as follows: undistributed ordinary income $11,245, accumulated capital losses $79,267 and unrealized depreciation $53,359. In addition, the fund had $2,669 of capital losses realized after October 31, 2003, which were deferred for tax purposes to the first day of the following fiscal year.
The accumulated capital loss carryover is available to be applied against future net securities profits, if any, realized subsequent to July 31, 2004. If not applied, the carryover expires in fiscal 2012.
The tax character of distributions paid to shareholders during the fiscal periods ended July 31, 2004 and July 31, 2003, were as follows: ordinary income $624,223 and $163,903, respectively.
During the period ended July 31, 2004, as a result of permanent book to tax differences primarily due to the sales treatment for treasury inflation protected securities, the fund increased accumulated undistributed
The Fund 19
NOTES TO FINANCIAL STATEMENTS (continued)
|
investment income-net by $60,290 and decreased accumulated net realized gain (loss) on investments by the same amount. Net assets were not affected by this reclassification.
NOTE 2—Bank Line of Credit:
|
The fund participates with other Dreyfus-managed funds in a $350 million redemption credit facility (the "Facility") to be utilized for temporary or emergency purposes, including the financing of redemptions. In connection therewith, the fund has agreed to pay commitment fees on its pro rata portion of the Facility. Interest is charged to the fund based on prevailing market rates in effect at the time of borrowings. During the period ended July 31, 2004, the fund did not borrow under the Facility.
NOTE 3—Management Fee and Other Transactions With Affiliates:
(a) Pursuant to a management agreement ("Agreement") with the Manager, the management fee is computed at the annual rate of .30 of 1% of the value of the fund's average daily net assets and is payable monthly.The Manager has undertaken from August 1, 2003 through July 31, 2005, that if the aggregated expenses of the fund, exclusive of taxes, brokerage fees, shareholder services plan fees and extraordinary expenses, exceed an annual rate of .30 of 1% of the value of the fund's average daily net assets, the fund may deduct from the payment to be made to the Manager under the Agreement, or the Manager will bear, such excess expense. The expense reimbursement, pursuant to the undertaking, amounted to $72,611 during the period ended July 31, 2004.
(b) Under the Investor Shares Shareholder Services Plan, the fund pays the Distributor at an annual rate of .25 of 1% of the value of Investor Shares average daily net assets for the provision of certain services.The services provided may include personal services relating to shareholder accounts, such as answering shareholder inquiries regarding the fund and providing reports and other information, and services related to the maintenance of shareholder accounts. The Distributor may make payments to Service Agents (a securities dealer, financial institution or
20
other industry professional) in respect of these services. The Distributor determines the amounts to be paid to Service Agents. During the period ended July 31, 2004, Investor Shares were charged $7,012 pursuant to the Shareholder Services Plan.
The fund compensates Dreyfus Transfer, Inc., a wholly-owned subsidiary of the Manager, under a transfer agency agreement for providing personnel and facilities to perform transfer agency services for the fund. During the period ended July 31, 2004, the fund was charged $97 pursuant to the transfer agency agreement.
The fund compensates Mellon Bank, N.A., an affiliate of the Manager, under a custody agreement for providing custodial services for the fund. During the period ended July 31, 2004, the fund was charged $3,987 pursuant to the custody agreement.
The components of Due from The Dreyfus Corporation and affiliates in the Statement of Assets and Liabilities consist of: management fees $1,558, shareholder services plan fees $603, custodian fees $955 and transfer agency per account fees $17, which are offset against an expense reimbursement currently in effect in the amount of $4,573.
(c) Each Board member also serves as a Board member of other funds within the Dreyfus complex. Annual retainer fees and attendance fees are allocated to each fund based on net assets.
(d) Pursuant to an exemptive order from the Securities and Exchange Commission, the fund may invest its available cash balances in affiliated money market mutual funds. Management fees of the underlying money market mutual funds have been waived by the Manager.
NOTE 4—Securities Transactions:
The aggregate amount of purchases and sales (including paydowns) of investment securities, excluding short-term securities, forward currency exchange contracts and financial futures, during the period ended July 31, 2004, amounted to $50,310,485 and $50,398,435, respectively.
The Fund 21
NOTES TO FINANCIAL STATEMENTS (continued)
|
The fund enters into forward currency exchange contracts in order to hedge its exposure to changes in foreign currency exchange rates on its foreign portfolio holdings and to settle foreign currency transactions. When executing forward currency exchange contracts, the fund is obligated to buy or sell a foreign currency at a specified rate on a certain date in the future. With respect to sales of forward currency exchange contracts, the fund would incur a loss if the value of the contract increases between the date the forward contract is opened and the date the forward contract is closed.The fund realizes a gain if the value of the contract decreases between those dates.With respect to purchases of forward currency exchange contracts, the fund would incur a loss if the value of the contract decreases between the date the forward contract is opened and the date the forward contract is closed. The fund realizes a gain if the value of the contract increases between those dates. The fund is also exposed to credit risk associated with counterparty nonperformance on these forward currency exchange contracts which is typically limited to the unrealized gain on each open contract. At July 31, 2004, there were no open forward currency exchange contracts.
The fund may invest in financial futures contracts in order to gain exposure to or protect against changes in the market. The fund is exposed to market risk as a result of changes in the value of the underlying financial instruments. Investments in financial futures require the fund to "mark to market" on a daily basis, which reflects the change in the market value of the contracts at the close of each day's trading. Accordingly, variation margin payments are received or made to reflect daily unrealized gains or losses.When the contracts are closed, the fund recognizes a realized gain or loss. These investments require initial margin deposits with a broker, which consist of cash or cash equiva-lents.The amount of these deposits is determined by the exchange or Board of Trade on which the contract is traded and is subject to change. Contracts open at July 31, 2004, are set forth in the Statement of Financial Futures.
22
At July 31, 2004, the cost of investments for federal income tax purposes was $5,912,663 accordingly, accumulated net unrealized depreciation on investments was $53,359, consisting of $83,509 gross unrealized appreciation and $136,868 gross unrealized depreciation.
Two class actions (which have been consolidated) have been filed against Mellon Financial and Mellon Bank, N.A., and Dreyfus and Founders Asset Management LLC (the "Investment Advisers"), and the directors of all or substantially all of the Dreyfus funds, alleging that the Investment Advisers improperly used assets of the Dreyfus funds, in the form of directed brokerage commissions and 12b-1 fees, to pay brokers to promote sales of Dreyfus funds, and that the use of fund assets to make these payments was not properly disclosed to investors. The complaints further allege that the directors breached their fiduciary duties to fund shareholders under the Investment Company Act of 1940 and at common law.The complaints seek unspecified compensatory and punitive damages, rescission of the funds' contracts with the Investment Advisers, an accounting of all fees paid, and an award of attorneys' fees and litigation expenses. Dreyfus and the Dreyfus funds believe the allegations to be totally without merit and will defend the actions vigorously.
Additional lawsuits arising out of these circumstances and presenting similar allegations and requests for relief may be filed against the defendants in the future. Neither Dreyfus nor the Dreyfus funds believe that any of the pending actions will have a material adverse effect on the Dreyfus funds or Dreyfus' ability to perform its contracts with the Dreyfus funds.
The Fund 23
| | REPORT OF INDEPENDENT REGISTERED
PUBLIC ACCOUNTING FIRM
|
Shareholders and Board of Directors Dreyfus Inflation Adjusted Securities Fund
We have audited the accompanying statement of assets and liabilities, including the statements of investments and financial futures, of Dreyfus Inflation Adjusted Securities Fund (one of the funds comprising Dreyfus Investment Grade Funds, Inc.), as of July 31, 2004, and the related statement of operations for the year then ended, the statement of changes in net assets for each of the two years in the period then ended, and financial highlights for each of the periods indicated therein.These financial statements and financial highlights are the responsibility of the Fund's management. Our responsibility is to express an opinion on these financial statements and financial highlights based on our audits.
We conducted our audits in accordance with the standards of the Public Company Accounting Oversight Board (United States).Those standards require that we plan and perform the audit to obtain reasonable assurance about whether the financial statements and financial highlights are free of material misstatement. An audit includes examining, on a test basis, evidence supporting the amounts and disclosures in the financial statements and financial highlights. Our procedures included verification by examination of securities held by the custodian as of July 31, 2004 and confirmation of securities not held by the custodian by correspondence with others. An audit also includes assessing the accounting principles used and significant estimates made by management, as well as evaluating the overall financial statement presentation.We believe that our audits provide a reasonable basis for our opinion.
In our opinion, the financial statements and financial highlights referred to above present fairly, in all material respects, the financial position of Dreyfus Inflation Adjusted Securities Fund at July 31, 2004, the results of its operations for the year then ended, the changes in its net assets for each of the two years in the period then ended, and the financial highlights for each of the indicated periods, in conformity with U.S. generally accepted accounting principles.

New York, New York
September 15, 2004
|
24
BOARD MEMBERS INFORMATION (Unaudited)
Joseph S. DiMartino (60)
Chairman of the Board (1994)
|
Principal Occupation During Past 5 Years:
• Corporate Director and Trustee
|
Other Board Memberships and Affiliations:
|
- The Muscular Dystrophy Association, Director
- Levcor International, Inc., an apparel fabric processor, Director
- Century Business Services, Inc., a provider of outsourcing functions for small and medium sizecompanies, Director
- The Newark Group, a provider of a national market of paper recovery facilities,paperboard mills and paperboard converting plants, Director
No. of Portfolios for which Board Member Serves: 186
Clifford L. Alexander, Jr. (70)
Board Member (2003)
|
Principal Occupation During Past 5 Years:
|
- President of Alexander & Associates, Inc., a management consulting firm ( January 1981-present)
- Chairman of the Board of Moody's Corporation (October 2000-October 2003)
- Chairman of the Board and Chief Executive Officer of The Dun and Bradstreet Corporation(October 1999-September 2000)
Other Board Memberships and Affiliations:
|
- Wyeth (formerly, American Home Products Corporation), a global leader in pharmaceuticals,consumer healthcare products and animal health products, Director
- Mutual of America Life Insurance Company, Director
No. of Portfolios for which Board Member Serves: 65
|
———————
Lucy Wilson Benson (76) Board Member (1994)
Principal Occupation During Past 5 Years:
• President of Benson and Associates, consultants to business and government (1980-present)
Other Board Memberships and Affiliations:
|
- The International Executive Services Corps., Director
- Citizens Network for Foreign Affairs,Vice Chairperson
- Council on Foreign Relations, Member
- Lafayette College Board of Trustees,Vice Chairperson Emeritus
- Atlantic Council of the U.S., Director
No. of Portfolios for which Board Member Serves: 39
|
The Fund 25
BOARD MEMBERS INFORMATION (Unaudited) (continued)
David W. Burke (68)
Board Member (1994)
|
Principal Occupation During Past 5 Years:
• Corporate Director and Trustee
|
Other Board Memberships and Affiliations:
|
- John F. Kennedy Library Foundation, Director
- U.S.S. Constitution Museum, Director
No. of Portfolios for which Board Member Serves: 83
Whitney I. Gerard (69)
Board Member (1993)
|
Principal Occupation During Past 5 Years:
• Partner of Chadbourne & Parke LLP
|
No. of Portfolios for which Board Member Serves: 37
Arthur A. Hartman (78)
Board Member (1992)
|
Principal Occupation During Past 5 Years:
|
- Chairman of First NIS Regional Fund (ING/Barings Management) and New Russia Fund
- Advisory Council Member to Barings-Vostok
Other Board Memberships and Affiliations:
• APCO Associates Inc., Senior Consultant
|
No. of Portfolios for which Board Member Serves: 37
George L. Perry (70)
Board Member (1992)
|
Principal Occupation During Past 5 Years:
• Economist and Senior Fellow at Brookings Institution
Other Board Memberships and Affiliations:
|
- State Farm Mutual Automobile Association, Director
- State Farm Life Insurance Company, Director
No. of Portfolios for which Board Member Serves: 37
Once elected all Board Members serve for an indefinite term.The address of the Board Members and Officers is in c/o The Dreyfus Corporation, 200 Park Avenue, New York, New York 10166.Additional information about the Board Members is available in the fund's Statement of Additional Information which can be obtained from Dreyfus free of charge by calling this toll free number: 1-800-554-4611.
OFFICERS OF THE FUND (Unaudited)
STEPHEN E. CANTER, President since March 2000.
Chairman of the Board, Chief Executive Officer and Chief Operating Officer of the Manager, and an officer of 97 investment companies (comprised of 190 portfolios) managed by the Manager. Mr. Canter also is a Board member and, where applicable, an Executive Committee Member of the other investment management subsidiaries of Mellon Financial Corporation, each of which is an affiliate of the Manager. He is 59 years old and has been an employee of the Manager since May 1995.
STEPHEN R. BYERS, Executive Vice President since October 2002.
Chief Investment Officer,Vice Chairman and a Director of the Manager, and an officer of 97 investment companies (comprised of 190 portfolios) managed by the Manager. Mr. Byers also is an officer, director or an Executive Committee Member of certain other investment management subsidiaries of Mellon Financial Corporation, each of which is an affiliate of the Manager. He is 50 years old and has been an employee of the Manager since January 2000. Prior to joining the Manager, he served as an Executive Vice President-Capital Markets, Chief Financial Officer and Treasurer at Gruntal & Co., L.L.C.
MARK N. JACOBS, Vice President since March 2000.
Executive Vice President, Secretary and General Counsel of the Manager, and an officer of 98 investment companies (comprised of 206 portfolios) managed by the Manager. He is 58 years old and has been an employee of the Manager since June 1977.
MICHAEL A. ROSENBERG, Secretary since March 2000.
Associate General Counsel of the Manager, and an officer of 95 investment companies (comprised of 199 portfolios) managed by the Manager. He is 44 years old and has been an employee of the Manager since October 1991.
ROBERT R. MULLERY, Assistant Secretary since March 2000.
Associate General Counsel of the Manager, and an officer of 26 investment companies (comprised of 58 portfolios) managed by the Manager. He is 52 years old and has been an employee of the Manager since May 1986.
STEVEN F. NEWMAN, Assistant Secretary since March 2000.
Associate General Counsel and Assistant Secretary of the Manager, and an officer of 98 investment companies (comprised of 206 portfolios) managed by the Manager. He is 54 years old and has been an employee of the Manager since July 1980.
JEFF PRUSNOFSKY, Assistant Secretary since January 2003.
Associate General Counsel of the Manager, and an officer of 26 investment companies (comprised of 87 portfolios) managed by the Manager. He is 39 years old and has been an employee of the Manager since October 1990.
The Fund 27
| | OFFICERS OF THE FUND (Unaudited) (continued)
|
JAMES WINDELS, Treasurer since November 2001.
Director – Mutual Fund Accounting of the Manager, and an officer of 98 investment companies (comprised of 206 portfolios) managed by the Manager. He is 45 years old and has been an employee of the Manager since April 1985.
ERIK D. NAVILOFF, Assistant Treasurer since December 2002.
Senior Accounting Manager – Taxable Fixed Income Funds of the Manager, and an officer of 19 investment companies (comprised of 74 portfolios) managed by the Manager. He is 36 years old and has been an employee of the Manager since November 1992.
KENNETH J. SANDGREN, Assistant Treasurer since November 2001.
Mutual Funds Tax Director of the Manager, and an officer of 98 investment companies (comprised of 206 portfolios) managed by the Manager. He is 49 years old and has been an employee of the Manager since June 1993.
WILLIAM GERMENIS, Anti-Money Laundering Compliance Officer since August 2002.
Vice President and Anti-Money Laundering Compliance Officer of the Distributor, and the Anti-Money Laundering Compliance Officer of 93 investment companies (comprised of 201 portfolios) managed by the Manager. He is 33 years old and has been an employee of the Distributor since October 1998.
28
| For More | | Information |
| |
|
| |
| Dreyfus | | Transfer Agent & |
| Inflation Adjusted | | Dividend Disbursing Agent |
| Securities Fund | | |
| | | Dreyfus Transfer, Inc. |
| 200 Park Avenue | | |
| | | 200 Park Avenue |
| New York, NY 10166 | | |
| | | New York, NY 10166 |
| |
| Investment Adviser | | Distributor |
| The Dreyfus Corporation | | |
| | | Dreyfus Service Corporation |
| 200 Park Avenue | | |
| | | 200 Park Avenue |
| New York, NY 10166 | | |
| | | New York, NY 10166 |
| Custodian | | |
| Mellon Bank, N.A. | | |
| One Mellon Bank Center | | |
| Pittsburgh, PA 15258 | | |
Telephone 1-800-645-6561
Mail The Dreyfus Family of Funds, 144 Glenn Curtiss Boulevard, Uniondale, NY 11556-0144 E-mail Send your request to info@dreyfus.com Internet Information can be viewed online or downloaded at: http://www.dreyfus.com A description of the policies and procedures that the fund uses to determine how to vote proxies relating to portfolio securities, and information regarding how the fund voted these proxies for the 12-month period ended June 30, 2004, is available through the fund's website at http://www.dreyfus.com and on the SEC's website at http://www.sec.gov. The description of the policies and procedures is also available without charge, upon request, by calling 1-800-645-6561.
Beginning with the fund's fiscal quarter ending October 31, 2004, the fund will file its complete schedule of portfolio holdings with the SEC for the first and third quarters of each fiscal year on Form N-Q; the fund's Forms N-Q will be available on the SEC's website at http://www.sec.gov; and the fund's Forms N-Q may be reviewed and copied at the SEC's Public Reference Room in Washington, DC, and information on the operation of the Public Reference Room may be obtained by calling 1-800-SEC-0330.

© 2004 Dreyfus Service Corporation
| Dreyfus | | |
| Intermediate | | |
| Term Income | | Fund |
| | ANNUAL REPORT July 31, 2004
|

The views expressed in this report reflect those of the portfolio manager only through the end of the period covered and do not necessarily represent the views of Dreyfus or any other person in the Dreyfus organization. Any such views are subject to change at any time based upon market or other conditions and Dreyfus disclaims any responsibility to update such views.These views may not be relied on as investment advice and, because investment decisions for a Dreyfus fund are based on numerous factors, may not be relied on as an indication of trading intent on behalf of any Dreyfus fund.
Not FDIC-Insured • Not Bank-Guaranteed • May Lose Value
| Contents |
| |
| | | THE FUND |
| |
|
| 2 | | Letter from the Chairman |
| 3 | | Discussion of Fund Performance |
| 6 | | Fund Performance |
| 7 | | Understanding Your Fund’s Expenses |
| 7 | | Comparing Your Fund’s Expenses |
| With Those of Other Funds |
| 8 | | Statement of Investments |
| 17 | | Statement of Financial Futures |
| 17 | | Statement of Options Written |
| 18 | | Statement of Assets and Liabilities |
| 19 | | Statement of Operations |
| 20 | | Statement of Changes in Net Assets |
| 22 | | Financial Highlights |
| 24 | | Notes to Financial Statements |
| 34 | | Report of Independent Registered |
| | | Public Accounting Firm |
| 35 | | Important Tax Information |
| 36 | | Board Members Information |
| 38 | | Officers of the Fund |
| |
| FOR MORE INFORMATION |
|
| | | Back Cover |
The Fund
Dreyfus Intermediate
Term Income Fund

LETTER FROM THE CHAIRMAN
This annual report for Dreyfus Intermediate Term Income Fund covers the 12-month period from August 1, 2003, through July 31, 2004. Inside, you’ll find valuable information about how the fund was managed during the reporting period, including a discussion with Gerald E. Thunelius, portfolio manager and Director of the Dreyfus Taxable Fixed Income Team that manages the fund.
The U.S. economy has increasingly shown signs of sustainable growth during the reporting period, causing heightened volatility in most sectors of the U.S. bond market. As it became clearer that a strong job market and higher energy prices might lead to renewed inflationary pressures,the Federal Reserve Board raised short-term interest rates by 25 basis points at its meeting in late June.This shift in monetary policy represents the first increase in short-term rates in more than four years, and many analysts believe that additional, gradual increases are likely to follow.
For many investors, the move to a less accommodative monetary policy marks the beginning of a new phase in the economic cycle. At times such as these, when market conditions are in a period of transition, we believe it is especially important for you to stay in close contact with your financial advisor, who can help you position your portfolio in a way that is designed to respond to the challenges and opportunities of today’s changing investment environment.
Thank you for your continued confidence and support.

The Dreyfus Corporation
August 16, 2004
|

DISCUSSION OF FUND PERFORMANCE
Gerald E. Thunelius, Director and Senior Portfolio Manager Dreyfus Taxable Fixed Income Team
How did Dreyfus Intermediate Term Income Fund perform relative to its benchmark?
For the 12-month period ended July 31, 2004, the fund’s Institutional shares achieved a total return of 3.88%, and the fund’s Investor shares achieved a total return of 3.59% .1 In comparison, the fund’s benchmark, the Lehman Brothers U.S. Aggregate Index, achieved a total return of 4.84% for the same period.2
In anticipation of stronger economic growth and higher interest rates from the Federal Reserve Board (the “Fed”), the fund adopted a generally defensive investment posture during much of the reporting period, including a relatively short average duration — a measure of sensitivity to changing interest rates.Although the Fed indeed began to raise short-term interest rates later in the reporting period, persistent economic and geopolitical concerns continued to support intermediate-term bond prices, causing the fund’s returns to lag the Index.
What is the fund’s investment approach?
The fund seeks to maximize total returns consisting of capital appreciation and current income.At least 80% of the fund must be invested in investment-grade bonds, including U.S. government bonds and notes, corporate bonds, convertible securities, preferred stocks, asset-backed securities, mortgage-related securities and inflation-indexed bonds. Up to 20% of the fund may be invested in securities rated below investment-grade, and up to 30% in non-dollar denominated bonds.
When choosing investments for the fund, we evaluate four primary factors:
- The direction in which interest rates are likely to move underprevailing economic conditions. If interest rates appear to be ris-ing, we generally reduce the fund’s average duration to capturehigher-yielding securities as they become available. If interest
| | DISCUSSION OF FUND PERFORMANCE (continued)
|
- rates appear to be declining, we may increase the fund’s averageduration to lock in prevailing yields.
- The difference in yields — or spreads — between fixed-incomesecurities of varying maturities.
- The mix of security types within the fund, including relativeexposure to government securities, corporate securities andhigh-yield bonds.
- Credit characteristics of individual securities, including thefinancial health of the issuer and the callability of the security.
What other factors influenced the fund’s performance?
The fund was affected by heightened volatility in the bond market as investors adjusted to stronger economic conditions. In fact, reports of stronger economic growth and the possibility of renewed inflationary pressures during the summer of 2003 led to a sharp decline in most bond prices, in which intermediate-term bonds were among the more severely affected. Because the fund at the time employed a shorter average duration relative to industry averages, and emphasized corporate bonds that historically have been more sensitive to changes in credit quality than interest rates, the fund weathered the market’s setback better than many comparable funds. As investors’ concerns eased over the remainder of 2003, however, the fund’s positioning prevented it from participating fully in the market’s subsequent gains.
At the start of 2004, new signs of economic strength made us more concerned that the Fed would begin to raise interest rates if inflationary pressures began to resurface. In addition, corporate bonds appeared overvalued to us after their sustained rally. Accordingly, we reduced the fund’s position in lower-rated corporate bonds and increased its holdings of securities that we believed would be relatively less sensitive to rising interest rates, including higher-quality corporate bonds, commercial mortgage-backed securities and asset-backed securities.We also further reduced the fund’s “average duration” and positioned the fund for narrower yield differences between short-term and long-term bonds.
In hindsight, these strategies proved premature, because lower-rated corporate bonds continued to outperform their higher-quality counterparts,
4
and U.S. government securities generally continued to rally through the first quarter of 2004 in response to weak U.S.labor markets and low inflation. In addition, yield differences between short-term and long-term bonds widened, detracting from the fund’s relative performance.
In April 2004, however, our earlier concerns appeared to be justified when higher energy prices and a strengthening job market suggested that inflationary pressures had begun to rise. Indeed, most investors began to anticipate higher interest rates from the Fed at its meeting in late June.The Fed did not disappoint them, implementing its first rate hike in approximately four years. Although the fund’s positioning helped protect it from the brunt of the market’s decline during the second quarter of 2004 as investors adjusted to a less accommodative monetary policy, the market again began to rally in July amid disappointing employment data and ongoing instability in Iraq.
What is the fund’s current strategy?
|
We have continued to maintain what we regard as a relatively defensive investment posture, setting the fund’s average duration in the neutral range and maintaining roughly equal allocations to intermediate-term U.S. government securities, higher-quality corporate bonds and mortgage-backed securities. We believe that these are prudent strategies in a rising interest-rate environment. Of course, we will continue to actively monitor the fixed-income markets and make portfolio changes as warranted.
| 1 | | Total return includes reinvestment of dividends and any capital gains paid. Past performance is no |
| | | guarantee of future results. Share price, yield and investment return fluctuate such that upon |
| | | redemption, fund shares may be worth more or less than their original cost. Return figures |
| | | provided reflect the absorption of fund expenses by The Dreyfus Corporation pursuant to an |
| | | undertaking in effect that may be extended, terminated or modified at any time. Had these |
| | | expenses not been absorbed, the fund's returns would have been lower. |
| 2 | | SOURCE: LIPPER INC. — Reflects reinvestment of dividends and, where applicable, capital |
| | | gain distributions.The Lehman Brothers U.S.Aggregate Index is a widely accepted, unmanaged |
| | | total return index of corporate, U.S. government and U.S. government agency debt instruments, |
| | | mortgage-backed securities and asset-backed securities with an average maturity of 1-10 years. |
The Fund 5
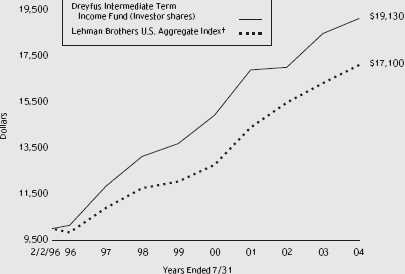
Comparison of change in value of $10,000 investment in Dreyfus Intermediate Term Income Fund Investor shares and the Lehman Brothers U.S. Aggregate Index
| Average Annual Total Returns as of 7/31/04 | | | | | | |
| | | Inception | | | | | | From |
| | | Date | | 1 Year | | 5 Years | | Inception |
| |
| |
| |
| |
|
| Investor shares | | 2/2/96 | | 3.59% | | 6.92% | | 7.93% |
| Institutional shares | | 5/31/01 | | 3.88% | | — | | 4.98% |
† Source: Lipper Inc.
Past performance is not predictive of future performance.The fund’s performance shown in the graph and table does not reflect the deduction of taxes that a shareholder would pay on fund distributions or the redemption of fund shares. The above graph compares a $10,000 investment made in Investor shares of Dreyfus Intermediate Term Income Fund on 2/2/96 (inception date) to a $10,000 investment made in the Lehman Brothers U.S. Aggregate Index (the “Index”) on that date. For comparative purposes, the value of the Index on 1/31/96 is used as the beginning value on 2/2/96. All dividends and capital gain distributions are reinvested.
The fund invests primarily in debt securities and securities with debt-like characteristics of domestic and foreign issuers and maintains an average effective maturity ranging between five and ten years and an average effective duration ranging between three and eight years.The fund’s performance shown in the line graph takes into account all applicable fees and expenses.The Index is a widely accepted, unmanaged total return index of corporate, U.S. government and U.S. government agency debt instruments, mortgage-backed securities and asset-backed securities with an average maturity of 1-10 years.The Index does not take into account charges, fees and other expenses. Further information relating to fund performance, including expense reimbursements, if applicable, is contained in the Financial Highlights section of the prospectus and elsewhere in this report.
6
UNDERSTANDING YOUR FUND’S EXPENSES
As a mutual fund investor, you pay ongoing expenses, such as management fees and other expenses. Using the information below, you can estimate how these expenses affect your investment and compare them with the expenses of other funds.You also may pay one-time transaction expenses, including sales charges (loads) and redemption fees, which are not shown in this section and would have resulted in higher total expenses. For more information, see your fund’s prospectus or talk to your financial adviser.
Review your fund’s expenses
The table below shows the expenses you would have paid on a $1,000 investment in Dreyfus Intermediate Term Income Fund from February 1, 2004 to July 31, 2004. It also shows how much a $1,000 investment would be worth at the close of the period, assuming actual returns and expenses.
| Expenses and Value of a $1,000 Investment | | |
| assuming actual returns for the six months ended July 31, 2004 | | |
| | | Investor Shares | | Institutional Shares |
| |
| |
|
| Expenses paid per $1,000 † | | $ 3.96 | | $ 2.57 |
| Ending value (after expenses) | | $ 990.30 | | $ 991.40 |
COMPARING YOUR FUND’S EXPENSES
WITH THOSE OF OTHER FUNDS
|
Using the SEC’s method to compare expenses
The Securities and Exchange Commission (SEC) has established guidelines to help investors assess fund expenses. Per these guidelines, the table below shows your fund’s expenses based on a $1,000 investment, assuming a hypothetical 5% annualized return. You can use this information to compare the ongoing expenses (but not transaction expenses or total costs) of investing in the fund with those of other funds.All mutual fund shareholder reports will provide this information to help you make this comparison. Please note that you cannot use this information to estimate your actual ending account balance and expenses paid during the period.
Expenses and Value of a $1,000 Investment assuming a hypothetical 5% annualized return for the six months ended July 31, 2004
| | | Investor Shares | | Institutional Shares |
| |
| |
|
| Expenses paid per $1,000 † | | $ 4.02 | | $ 2.61 |
| Ending value (after expenses) | | $1,020.89 | | $1,022.28 |
† Expenses for each share class are calculated using the fund’s annualized expense ratio for each class, which represents the ongoing expenses as a percentage of net assets for the six months ended 7/31/04.The expense ratio may differ for each share class. Expenses are calculated by multiplying the expense ratio by the average account value for the period; then multiplying the result by the number of days in the period; and then dividing that result by the number of days in the year.
| | STATEMENT OF INVESTMENTS
July 31, 2004
|
| | | Principal | | | | |
| Bonds and Notes—80.3% | | Amount ($) | | Value ($) |
| |
| |
|
| Agriculture—.3% | | | | | | |
| Altria, | | | | | | |
| Notes, 7%, 2013 | | 1,955,000 | | | | 2,021,486 |
| Airlines—.8% | | | | | | |
| American Airlines, | | | | | | |
| Pass-Through Ctfs., | | | | | | |
| Ser. 1999-1, 7.024%, 2009 | | 1,413,000 | | | | 1,387,845 |
| Continental Airlines, | | | | | | |
| Pass-Through Ctfs.: | | | | | | |
| Ser. 1998-1, Cl. A, 6.648%, 2017 | | 1,277,611 | | | | 1,189,011 |
| Ser. 1998-3, 6.32%, 2008 | | 2,835,000 | | | | 2,747,746 |
| USAir, | | | | | | |
| Enhanced Equipment Notes, | | | | | | |
| Ser. C, 8.93%, 2009 | | 429,622 | | a | | 4,296 |
| | | | | | | 5,328,898 |
| Asset-Backed Ctfs./Credit Cards—.8% | | | | |
| MBNA Master Credit Card Note Trust, | | | | | | |
| Ser. 2002-C1, Cl. C1, 6.8%, 2014 | | 5,268,000 | | | | 5,719,547 |
| Asset-Backed Ctfs./Equipment—.0% | | | | | | |
| Pegasus Aviation Lease Securitization, | | | | | | |
| Ser. 2000-1, Cl. A1, 2.075%, 2015 | | 207,270 | | b,c | | 102,153 |
| Asset-Backed Ctfs./Home Equity Loans—1.4% | | | | |
| Conseco Finance Securitizations: | | | | | | |
| Ser. 2000-B, Cl. AF5, 8.15%, 2031 | | 3,086,471 | | | | 3,156,288 |
| Ser. 2000-D, Cl. A3, 7.89%, 2018 | | 22 | | | | 22 |
| Ser. 2000-E, Cl. A5, 8.02%, 2031 | | 1,277,659 | | | | 1,281,543 |
| Equity One ABS, | | | | | | |
| Ser. 2004-3, Cl. AF3, 4.265%, 2034 | | 4,805,000 | | | | 4,806,502 |
| The Money Store Home Equity Trust, | | | | | | |
| Ser. 1998-B, Cl. AF8, 6.11%, 2010 | | 76,102 | | | | 76,718 |
| | | | | | | 9,321,073 |
| Auto Manufacturing—.2% | | | | | | |
| General Motors, | | | | | | |
| Debs., 8.375%, 2033 | | 1,128,000 | | d | | 1,182,562 |
| Auto Parts—1.5% | | | | | | |
| Dana, | | | | | | |
| Notes, 9%, 2011 | | 4,956,000 | | | | 5,872,860 |
| Lear, | | | | | | |
| Sr. Notes, Ser. B, 8.11%, 2009 | | 3,989,000 | | | | 4,571,346 |
| | | | | | | 10,444,206 |
8
| | | Principal | | | | |
| Bonds and Notes (continued) | | Amount ($) | | Value ($) |
| |
| |
|
| Banking—2.3% | | | | | | |
| Deutsche Bank, | | | | | | |
| Deposit Notes, 4.85%, 2006 | | 10,000,000 | | | | 9,675,000 |
| Mizuho Financial Group Cayman, | | | | | | |
| Sub. Bonds, 5.79%, 2014 | | 5,824,000 | | c | | 5,820,896 |
| | | | | | | 15,495,896 |
| Commercial Mortgage Pass-Through Ctfs.—8.9% | | | | |
| Banc of America Commercial Mortgage, | | | | | | |
| Ser. 2004-2, Cl. A1, 2.764%, 2038 | | 16,411,026 | | | | 16,025,979 |
| CS First Boston Mortgage Securities, | | | | | | |
| Ser. 1998-C1, Cl. A1A, 6.26%, 2040 | | 654,969 | | | | 671,915 |
| Chase Commercial Mortgage Securities, | | | | | | |
| Ser. 2001-245, Cl. A1, 5.974%, 2016 | | 7,060,007 | | c | | 7,446,895 |
| GE Capital Commercial Mortgage, | | | | | | |
| Ser. 2004-C2, Cl. A1, 3.111%, 2040 | | 9,457,967 | | | | 9,317,124 |
| Ser. 2004-C2, Cl. G, 5.326%, 2040 | | 4,750,000 | | c | | 4,618,633 |
| GS Mortgage Securities II: | | | | | | |
| Ser. 1998-C1, Cl. C, 6.91%, 2030 | | 9,750,000 | | | | 10,671,570 |
| Ser. 2001-LIBA, Cl. E, 6.733%, 2016 | | 1,500,000 | | c | | 1,597,829 |
| Ser. 2001-LIBA, Cl. F, 6.733%, 2016 | | 2,330,000 | | c | | 2,469,430 |
| Saxon Asset Securities Trust, | | | | | | |
| Ser. 2004-2, Cl. AF2, 4.15%, 2035 | | 6,950,000 | | | | 6,950,000 |
| Structured Asset Securities, REMIC, | | | | | | |
| Ser. 1996-CFL, Cl. H, 7.75%, 2028 | | 1,000,000 | | | | 1,138,703 |
| | | | | | | 60,908,078 |
| Commercial Services—.3% | | | | | | |
| Cendant, | | | | | | |
| Notes, 6.25%, 2010 | | 1,887,000 | | | | 2,035,669 |
| Diversified Financial Services—1.7% | | | | | | |
| American Express, | | | | | | |
| Notes, 4.875%, 2013 | | 1,911,000 | | d | | 1,877,280 |
| Capital One Bank, | | | | | | |
| Sub. Notes, 6.5%, 2013 | | 2,942,000 | | | | 3,078,465 |
| Farmers Exchange Capital, | | | | | | |
| Trust Surplus Note Securities, 7.05%, 2028 | | 2,815,000 | | c | | 2,765,194 |
| Ford Motor Credit, | | | | | | |
| Notes, 1.67%, 2007 | | 1,064,000 | | b | | 1,038,691 |
| Jefferies, | | | | | | |
| Sr. Notes, 5.5%, 2016 | | 2,855,000 | | | | 2,770,235 |
| | | | | | | 11,529,865 |
S T A T E M E N T O F I N V E S T M E N T S (continued)
| | | Principal | | | | |
| Bonds and Notes (continued) | | Amount ($) | | Value ($) |
| |
| |
|
| Electric Utilities—1.9% | | | | | | |
| Centerpoint Energy, | | | | | | |
| Sr. Notes, Ser. B, 7.25%, 2010 | | 5,000,000 | | d | | 5,489,370 |
| Jersey Central Power & Light, | | | | | | |
| First Mortgage, 5.625%, 2016 | | 2,552,000 | | c | | 2,583,270 |
| Pacific Gas & Electric, | | | | | | |
| First Mortgage, 4.8%, 2014 | | 2,601,000 | | | | 2,507,811 |
| SCANA, | | | | | | |
| Sr. Notes, 1.7%, 2006 | | 2,375,000 | | b | | 2,378,831 |
| | | | | | | 12,959,282 |
| Foreign/Governmental—1.8% | | | | | | |
| Republic of Argentina, | | | | | | |
| Debs., 11.25%, 2004 | | 33,100 | | a | | 8,606 |
| Republic of Chile, | | | | | | |
| Notes, 2.062%, 2008 | | 7,040,000 | | b | | 7,101,600 |
| Republic of Costa Rica: | | | | | | |
| Bonds, 6.548%, 2014 | | 1,307,000 | | | | 1,137,090 |
| Bonds, 9.995%, 2020 | | 2,810,000 | | | | 2,992,650 |
| Notes, 6.914%, 2008 | | 1,110,000 | | | | 1,110,000 |
| | | | | | | 12,349,946 |
| Gaming & Lodging—.5% | | | | | | |
| Harrah’s Operating, | | | | | | |
| Notes, 5.375%, 2013 | | 3,630,000 | | d | | 3,462,722 |
| Health Care—2.3% | | | | | | |
| Bristol-Myers Squibb, | | | | | | |
| Notes, 5.75%, 2011 | | 2,575,000 | | | | 2,707,211 |
| Cardinal Health, | | | | | | |
| Bonds, 4%, 2015 | | 2,711,000 | | | | 2,273,941 |
| IVAX, | | | | | | |
| Conv. Sr. Sub. Notes, 4.5%, 2008 | | 3,968,000 | | | | 3,943,200 |
| Manor Care, | | | | | | |
| Notes, 6.25%, 2013 | | 2,932,000 | | | | 3,038,285 |
| Medco Health Solutions, | | | | | | |
| Sr. Notes, 7.25%, 2013 | | 3,276,000 | | | | 3,538,080 |
| | | | | | | 15,500,717 |
| Manufacturing—.5% | | | | | | |
| Tyco International, | | | | | | |
| Notes, 5.8%, 2006 | | 3,497,000 | | | | 3,659,607 |
| Media—1.8% | | | | | | |
| AOL Time Warner, | | | | | | |
| Notes, 6.875%, 2012 | | 725,000 | | | | 791,327 |
| |
| 10 | | | | | | |
| | | Principal | | | | |
| Bonds and Notes (continued) | | Amount ($) | | Value ($) |
| |
| |
|
| Media (continued) | | | | | | |
| British Sky Broadcasting, | | | | | | |
| Notes, 6.875%, 2009 | | 1,725,000 | | | | 1,892,948 |
| Comcast: | | | | | | |
| Sr. Notes, 6.5%, 2015 | | 3,860,000 | | | | 4,069,027 |
| Sr. Notes, 8.375%, 2013 | | 1,922,000 | | | | 2,282,227 |
| Shaw Communications, | | | | | | |
| Sr. Notes, 7.25%, 2011 | | 2,897,000 | | | | 3,035,813 |
| | | | | | | 12,071,342 |
| Mining & Metals—1.2% | | | | | | |
| Noranda, | | | | | | |
| Notes, 6%, 2015 | | 8,315,000 | | | | 8,233,413 |
| Oil & Gas—.2% | | | | | | |
| Petro-Canada, | | | | | | |
| Notes, 4%, 2013 | | 1,238,000 | | | | 1,120,275 |
| Property-Casualty Insurance—.6% | | | | | | |
| Endurance Specialty, | | | | | | |
| Bonds, 7%, 2034 | | 1,400,000 | | | | 1,395,790 |
| Genworth Financial, | | | | | | |
| Notes, 6.5%, 2034 | | 1,000,000 | | | | 1,034,226 |
| Pennsylvania Mutual Life Insurance, | | | | | | |
| Notes, 6.65%, 2034 | | 1,380,000 | | c | | 1,395,173 |
| | | | | | | 3,825,189 |
| Real Estate Investment Trust—1.0% | | | | | | |
| EOP Operating, | | | | | | |
| Sr. Notes, 7%, 2011 | | 600,000 | | | | 660,588 |
| iStar Financial, | | | | | | |
| Sr. Notes, Ser. B, 5.7%, 2014 | | 6,250,000 | | | | 6,046,438 |
| | | | | | | 6,707,026 |
| Residential Mortgage | | | | | | |
| Pass-Through Ctfs.—3.5% | | | | | | |
| Ameriquest Mortgage Securities, | | | | | | |
| Ser. 2003-IA1, Cl. A4, 4.965%, 2033 | | 7,000,000 | | | | 6,979,937 |
| Bank Of America Mortgage Securities II, | | | | | | |
| Ser. 2001-4, Cl. B3, 6.75%, 2031 | | 497,959 | | | | 517,724 |
| Cendant Mortgage: | | | | | | |
| Ser. 1999-8, Cl. B3, 6.25%, 2029 | | 349,551 | | c | | 359,444 |
| Ser. 1999-8, Cl. B4, 6.25%, 2029 | | 249,680 | | c | | 255,323 |
| Chase Mortgage Finance: | | | | | | |
| Ser. 2003-S5, Cl. B3, 5.5%, 2033 | | 986,045 | | c | | 826,779 |
| Ser. 2003-S7, Cl. B3, 4.75%, 2018 | | 381,778 | | c | | 330,895 |
S T A T E M E N T O F I N V E S T M E N T S (continued)
| | | Principal | | | | |
| Bonds and Notes (continued) | | Amount ($) | | Value ($) |
| |
| |
|
| Residential Mortgage Pass-Through Ctfs. (continued) | | | | |
| Countrywide Home Loans: | | | | | | |
| Ser. 2003-8, Cl. B3, 5%, 2018 | | 282,423 | | c | | 260,507 |
| Ser. 2003-15, Cl. B3, 4.874%, 2018 | | 855,005 | | c | | 752,939 |
| Ser. 2003-18, Cl. B3, 5.5%, 2033 | | 689,458 | | | | 603,138 |
| GMAC Mortgage Corp Loan Trust: | | | | | | |
| Ser. 2003-J1, C. B1, 5.25%, 2018 | | 420,358 | | c | | 399,803 |
| Ser. 2003-J1, Cl. B2, 5.25%, 2018 | | 420,358 | | c | | 361,508 |
| Ser. 2003-J1, Cl. B3, 5.25%, 2018 | | 420,361 | | c | | 185,673 |
| Ser. 2003-J3, Cl. B2, 5%, 2018 | | 282,622 | | c | | 234,746 |
| Ser. 2003-J10, Cl. B1, 4.75%, 2019 | | 301,567 | | c | | 260,584 |
| Ser. 2004-J1, Cl. B2, 5.5%, 2034 | | 553,835 | | c | | 333,945 |
| Harborview Mortgage Loan Trust, | | | | | | |
| Ser. 2004-4, Cl. 3A, 2.975%, 2034 | | 7,771,051 | | b | | 7,615,630 |
| MASTR Asset Securitization Trust: | | | | | | |
| Ser. 2003-1, Cl. 15B4, 5.25%, 2018 | | 381,601 | | c | | 363,590 |
| Ser. 2003-1, Cl. 15B5, 5.25%, 2018 | | 191,731 | | c | | 165,407 |
| Ocwen Residential MBS, | | | | | | |
| Ser. 1998-R1, Cl. B1, 7%, 2040 | | 531,283 | | c | | 568,127 |
| Residential Funding Mortgage | | | | | | |
| Securities I, REMIC: | | | | | | |
| Ser. 2002-S11, Cl. B1, 5.75%, 2017 | | 185,867 | | c | | 183,544 |
| Ser. 2003-S3, Cl. B1, 5.25%, 2018 | | 190,758 | | | | 179,733 |
| Structured Asset Securities, | | | | | | |
| Ser. 2003-34A, Cl. 5A1, 1.87%, 2033 | | 694,451 | | b | | 692,666 |
| Washington Mutual, | | | | | | |
| Ser. 2002-S3, Cl. 2B4, 6%, 2017 | | 224,316 | | c | | 226,066 |
| Wells Fargo Mortgage Securities, | | | | | | |
| Ser. 2003-3, Cl. 1B4, 5.75%, 2033 | | 984,922 | | c | | 888,104 |
| | | | | | | 23,545,812 |
| Retail—.6% | | | | | | |
| RadioShack, | | | | | | |
| Notes, 7.375%, 2011 | | 3,585,000 | | | | 4,075,134 |
| Saks, | | | | | | |
| Notes, 8.25%, 2008 | | 429 | | d | | 466 |
| | | | | | | 4,075,600 |
| Structured Index—3.1% | | | | | | |
| AB Svensk Exportkredit, | | | | | | |
| GSNE-ER Indexed Notes, 0%, 2007 | | 14,675,000 | | c,e | | 13,860,538 |
| Dow Jones CDX.NA., | | | | | | |
| Credit Linked Notes, Ser. 3-1, 7.75%, 2009 | | 2,728,000 | | c,f | | 2,673,440 |
12
| | | Principal | | | | |
| Bonds and Notes (continued) | | Amount ($) | | Value ($) |
| |
| |
|
| Structured Index (continued) | | | | | | |
| HSBC Bank USA,Tranched Investment-Grade | | | | | | |
| Enhanced Return Securities (“TIGERS”), | | | | | | |
| Medium-Term Notes, Ser. 2003-7, 6.55%, 2008 | | 4,500,000 | | b,c,f | | 4,492,350 |
| | | | | | | 21,026,328 |
| Technology—.5% | | | | | | |
| InterActive, | | | | | | |
| Notes, 7%, 2013 | | 2,944,000 | | | | 3,206,905 |
| Telecommunications—4.5% | | | | | | |
| British Telecommunications, | | | | | | |
| Notes, 8.375%, 2010 | | 4,691,000 | | | | 5,535,783 |
| CenturyTel, | | | | | | |
| Sr. Notes, Ser. L, 7.875%, 2012 | | 2,710,000 | | | | 3,057,414 |
| Citizens Communications, | | | | | | |
| Debs., 7.05%, 2046 | | 1,180,000 | | | | 948,162 |
| Gazprom International, | | | | | | |
| Sr. Debs., 7.201%, 2020 | | 5,813,000 | | c | | 5,740,338 |
| Lucent Technologies, | | | | | | |
| Debs., Ser. B, 2.75%, 2025 | | 3,698,000 | | d | | 4,673,348 |
| Qwest: | | | | | | |
| Bank Note, Ser. A, 6.5%, 2007 | | 3,900,000 | | b | | 4,046,250 |
| Bank Note, Ser. B, 6.95%, 2010 | | 2,322,000 | | b | | 2,281,365 |
| Sprint Capital, | | | | | | |
| Notes, 6%, 2007 | | 1,647,000 | | | | 1,733,196 |
| Verizon Florida, | | | | | | |
| Debs., 6.125%, 2013 | | 2,333,000 | | | | 2,422,242 |
| | | | | | | 30,438,098 |
| Textiles & Apparel—.4% | | | | | | |
| Reebok International, | | | | | | |
| Debs., 2%, 2024 | | 2,750,000 | | c,d | | 2,695,000 |
| U.S. Government—13.9% | | | | | | |
| U.S. Treasury Bonds, | | | | | | |
| 5.375%, 2/15/2031 | | 28,875,000 | | | | 29,583,304 |
| U.S. Treasury Notes: | | | | | | |
| 4%, 6/15/2009 | | 2,400,000 | | | | 2,434,680 |
| 4.75%, 5/15/2014 | | 61,609,000 | | | | 62,948,996 |
| | | | | | | 94,966,980 |
| U.S. Government Agencies—3.3% | | | | | | |
| Federal Home Loan Banks, | | | | | | |
| Bonds, Ser. 432, 4.5%, 9/16/2013 | | 12,785,000 | | | | 12,375,791 |
The Fund 13
S T A T E M E N T O F I N V E S T M E N T S (continued)
| | | Principal | | | | |
| Bonds and Notes (continued) | | Amount ($) | | Value ($) |
| |
| |
|
| U.S. Government Agencies (continued) | | | | | | |
| Federal Home Loan Mortgage Corp., | | | | | | |
| Notes, 7%, 3/15/2010 | | 9,098,000 | | | | 10,343,334 |
| | | | | | | 22,719,125 |
| U.S. Government Agencies/Mortgage-Backed—20.5% | | | | |
| Federal Home Loan Mortgage Corp.: | | | | | | |
| 6.5%, 10/1/2031-5/1/2032 | | 2,379,225 | | | | 2,490,002 |
| REMIC Multiclass Mortgage Participation Ctfs.: | | | | |
| Ser. 2586, Cl. WE, 4%, 12/15/2032 | | 13,832,803 | | | | 13,788,779 |
| Ser. 2693, Cl. MH, 4%, 9/15/2027 | | 7,416,000 | | | | 7,080,511 |
| (Interest Only Obligation): | | | | | | |
| Ser. 1499, Cl. E, 7%, 4/15/2023 | | 367,226 | | g | | 53,718 |
| Ser. 2627, Cl. UI, 5%, 7/15/2023 | | 8,480,514 | | g | | 869,130 |
| Ser. 2640, Cl. UA, 5%, 11/15/2026 | | 20,000,000 | | g | | 2,346,520 |
| Ser. 2770, Cl. YI, 5%, 6/15/2022 | | 4,060,600 | | g | | 540,490 |
| Federal National Mortgage Association: | | | | | | |
| 5%, 1/1/2018-5/1/2018 | | 2,404,325 | | | | 2,426,495 |
| 6.2%, 1/1/2011 | | 10,423,775 | | | | 11,294,511 |
| 6.5%, 11/1/2010 | | 2,062 | | | | 2,183 |
| 6.88%, 2/1/2028 | | 1,018,642 | | | | 1,111,822 |
| REMIC Trust, Gtd. Pass-Through Ctfs., | | | | | | |
| Ser. 2004-58, Cl. LJ, 5%, 7/25/2034 | | 4,465,730 | | | | 4,553,348 |
| (Interest Only Obligation), | | | | | | |
| Ser. 2002-55, Cl. IJ, 6%, 4/25/2028 | | 1,070,158 | | g | | 19,733 |
| Government National Mortgage Association I: | | | | | | |
| 5.5%, 4/15/2033-2/15/2034 | | 38,916,005 | | | | 39,240,372 |
| 6%, 1/15/2033-1/15/2034 | | 37,063,922 | | | | 38,213,233 |
| 6.5%, 6/15/2032 | | 614,615 | | | | 643,999 |
| Project Loan, | | | | | | |
| 6.5%, 10/15/2033 | | 2,851,495 | | | | 3,072,885 |
| (Interest Only Obligation), | | | | | | |
| Ser. 2004-19, Cl. KI, 5%, 10/16/2027 | | 21,809,655 | | g | | 2,655,070 |
| Government National Mortgage Association II: | | | | | | |
| 3%, 7/20/2030 | | 227,540 | | b | | 227,883 |
| 6.5%, 1/20/2028-9/20/2031 | | 1,416,044 | | | | 1,481,537 |
| 7%, 1/20/2028-7/20/2031 | | 494,483 | | | | 525,092 |
| 7.5%, 10/20/2030-8/20/2031 | | 692,835 | | | | 745,058 |
| Ser. 2004-39, Cl. LC, 5.5%, 12/20/2029 | | 4,800,000 | | | | 4,962,000 |
| (Interest Only Obligation), | | | | | | |
| Ser. 2004-1, Cl. TK, 5%, 5/20/2026 | | 14,674,771 | | g | | 1,352,208 |
| | | | | | | 139,696,579 |
| Total Bonds and Notes | | | | | | |
| (cost $546,853,574) | | | | | | 546,349,379 |
14
| | | Face Amount | | |
| | | Covered by | | |
| Options—.1% | | Contracts ($) | | Value ($) |
| |
| |
|
| Call Options: | | | | |
| U.S. Treasury Bond, 5.375%, 2/15/2031, | | |
| October 2004 @ $104.24 | | 9,358,000 | | 114,782 |
| October 2004 @ $104.519 | | 9,358,000 | | 106,740 |
| | | | | 221,522 |
| Put Options; | | | | |
| U.S. Treasury Note, 2.5%, 5/31/2006, | | | | |
| September 2004 @ $99.39 | | 6,891,000 | | 8,614 |
| Total Options | | | | |
| (cost $260,742) | | | | 230,136 |
| |
| |
|
| |
| Other Investments—14.0% | | Shares | | Value ($) |
| |
| |
|
| Registered Investment Company; | | | | |
| Dreyfus Institutional Preferred Plus Money Market Fund | | |
| (cost $95,496,000) | | 95,496,000 h | | 95,496,000 |
| |
| |
|
| | | Principal | | |
| Short-Term Investments—1.2% | | Amount ($) | | Value ($) |
| |
| |
|
| Banking—1.0% | | | | |
| Deutsche Bank, Floating Rate Notes | | | | |
| 5.24%, 2/13/2005 | | 7,250,000 | | 7,159,375 |
| U.S. Treasury Bills—.2% | | | | |
| 1.26%, 9/16/2004 | | 1,100,000 i | | 1,098,218 |
| Total Short Term Investments | | | | |
| (cost $8,348,225) | | | | 8,257,593 |
S T A T E M E N T O F I N V E S T M E N T S (continued)
| Investment of Cash Collateral | | | | |
| for Securities Loaned—1.9% | | Shares | | Value ($) |
| |
| |
|
| Registered Investment Company; | | | | | | |
| Dreyfus Institutional Cash Advantage Plus Fund | | |
| (cost $13,034,209) | | | | 13,034,209 h | | 13,034,209 |
| |
| |
| |
|
| |
| Total Investments (cost $663,992,750) | | 97.5% | | 663,367,317 |
| |
| Cash and Receivables (Net) | | | | 2.5% | | 16,710,728 |
| |
| Net Assets | | | | 100.0% | | 680,078,045 |
| |
| a | | Non-income producing—security in default. | | | | |
| b | | Variable rate security—interest rate subject to periodic change. | | |
| c | | Securities exempt from registration under Rule 144A of the Securities Act of 1933.These securities may be resold in |
| | | transactions exempt from registration, normally to qualified institutional buyers.At July 31, 2004, these securities |
| | | amounted to $65,215,123 or 9.6% of net assets. | | | | |
| d | | All or a portion of these securities are on loan.At July 31, 2004, the total market value of the fund’s securities on |
| | | loan is $12,657,665 and the total market value of the collateral held by the fund is $13,034,209. |
| e | | Security linked to Goldman Sachs Non-Energy—Excess Return Index. | | |
| f | | Security linked to a portfolio of debt securities. | | | | |
| g | | Notional face amount shown. | | | | | | |
| h | | Investments in affiliated money market mutual funds. | | |
| i | | Held by a broker as collateral for open financial futures positions. | | |
| |
| |
|
| |
| |
| |
| |
| Portfolio Summary † | | | | | | |
| |
| | | | | Value (%) | | | | Value (%) |
| |
| |
| |
| |
|
| U.S. Government/Agency Securities | | 37.7 | | Structured Index | | 3.1 |
| Corporate Bonds | | 23.1 | | Foreign/Governmental | | 1.8 |
| Short-Term/ | | | | Futures and Options Contracts | | .1 |
| Money Market Investments | | 17.1 | | | | |
| Mortgage/Asset Backed Securities | | 14.6 | | | | 97.5 |
| |
| † | | Based on net assets. | | | | | | |
| See notes to financial statements. | | | | | | |
| | STATEMENT OF FINANCIAL FUTURES
July 31, 2004
|
| | | | | | | | | Unrealized |
| | | | | Market Value | | | | Appreciation |
| | | | | Covered by | | | | (Depreciation) |
| | | Contracts | | Contracts ($) | | Expiration | | at 7/31/2004 ($) |
| |
| |
| |
| |
|
| Financial Futures Long | | | | | | | | |
| U.S. Treasury 5 Year Notes | | 299 | | 32,740,500 | | September 2004 | | 177,328 |
| U.S. Treasury 10 Year Notes | | 189 | | 20,925,844 | | September 2004 | | 191,953 |
| U.S. Treasury 30 Year Bonds | | 7 | | 757,531 | | September 2004 | | 11,594 |
| Financial Futures Short | | | | | | | | |
| U.S. Treasury 2 Year Notes | | 593 | | 125,197,125 | | September 2004 | | (226,812) |
| | | | | | | | | 154,063 |
| | See notes to financial statements.
|
| | STATEMENT OF OPTIONS WRITTEN
July 31, 2004
|
| Call Options | | Face Amount | | |
| | | Covered by | | |
| | | Contracts ($) | | Value ($) |
| |
| |
|
| Issuer | | | | |
| Gazprom International | | | | |
| 7.201%, 2/1/2020, September 2004 @ 100% | | |
| (Premiums received $26,000) | | 4,000,000 | | 26,000 |
See notes to financial statements.
|
STATEMENT OF ASSETS AND LIABILITIES
July 31, 2004
|
| | | Cost | | Value |
| |
| |
|
| Assets ($): | | | | |
| Investments in securities—See Statement of Investments: | | |
| (including securities on loan, valued at $12,657,665): | | |
| Unaffiliated issuers | | 555,462,541 | | 554,837,108 |
| Affiliated issuers | | 108,530,209 | | 108,530,209 |
| Cash | | | | 6,623,327 |
| Receivable for investment securities sold | | 133,887,373 |
| Dividends and interest receivable | | | | 5,752,981 |
| Receivable for shares of Common Stock subscribed | | 364,593 |
| Receivable for futures variation margin—Note 4 | | 123,797 |
| Paydowns receivable | | | | 3,090 |
| Prepaid expenses | | | | 42,123 |
| | | | | 810,164,601 |
| |
| |
|
| Liabilities ($): | | | | |
| Due to The Dreyfus Corporation and affiliates—Note 3(b) | | 450,076 |
| Payable for investment securities purchased | | 114,846,406 |
| Liability for securities on loan—Note 1(c) | | 13,034,209 |
| Payable for shares of Common Stock redeemed | | 1,411,533 |
| Outstanding options written, at value (premiums received $26,000) | | |
| —See Statement of Options Written | | 26,000 |
| Unrealized depreciation on swaps—Note 4 | | 7,834 |
| Accrued expenses | | | | 310,498 |
| | | | | 130,086,556 |
| |
| |
|
| Net Assets ($) | | | | 680,078,045 |
| |
| |
|
| Composition of Net Assets ($): | | | | |
| Paid-in capital | | | | 699,235,808 |
| Accumulated undistributed investment income—net | | 1,381,045 |
| Accumulated net realized gain (loss) on investments | | (20,059,604) |
| Accumulated net unrealized appreciation (depreciation) on investments | | |
| and foreign currency transactions [including $154,063 net unrealized | | |
| appreciation on financial futures] | | (479,204) |
| |
|
| Net Assets ($) | | | | 680,078,045 |
| |
| |
|
| |
| |
| Net Asset Value Per Share | | | | |
| | | Investor Shares | | Institutional Shares |
| |
| |
|
| Net Assets ($) | | 677,227,963 | | 2,850,082 |
| Shares Outstanding | | 54,065,451 | | 227,557 |
| |
| |
|
| Net Asset Value Per Share ($) | | 12.53 | | 12.52 |
See notes to financial statements.
18
|
STATEMENT OF OPERATIONS
Year Ended July 31, 2004
|
| Investment Income ($): | | |
| Interest | | 32,923,651 |
| Dividends: | | |
| Unaffiliated issuers | | 302,868 |
| Affiliated issuers | | 593,156 |
| Income from securities lending | | 108,542 |
| Total Income | | 33,928,217 |
| Expenses: | | |
| Management fee—Note 3(a) | | 3,497,340 |
| Shareholder servicing costs—Note 3(b) | | 2,910,178 |
| Custodian fees—Note 3(b) | | 237,079 |
| Prospectus and shareholders’ reports | | 127,015 |
| Professional fees | | 59,032 |
| Registration fees | | 48,272 |
| Directors’ fees and expenses—Note 3(c) | | 23,412 |
| Interest expense—Note 2 | | 6,234 |
| Miscellaneous | | 40,670 |
| Total Expenses | | 6,949,232 |
| Less—reduction in management fee due to | | |
| undertaking—Note 3(a) | | (734,549) |
| Net Expenses | | 6,214,683 |
| Investment Income—Net | | 27,713,534 |
| |
|
| Realized and Unrealized Gain (Loss) on Investments—Note 4 ($): |
| Net realized gain (loss) on investments and foreign currency transactions | | 21,700,369 |
| Net realized gain (loss) on forward currency exchange transactions | | (9,515,701) |
| Net realized gain (loss) on financial futures | | (20,049,412) |
| Net realized gain (loss) on options transactions | | 1,057,856 |
| Net realized gain (loss) on swaps | | (1,388,568) |
| Net Realized Gain (Loss) | | (8,195,456) |
| Net unrealized appreciation (depreciation) on investments and foreign | | |
| currency transactions (including $362,398 net unrealized | | |
| appreciation on financial futures) | | 9,342,965 |
| Net Realized and Unrealized Gain (Loss) on Investments | | 1,147,509 |
| Net Increase in Net Assets Resulting from Operations | | 28,861,043 |
| |
| See notes to financial statements. | | |
STATEMENT OF CHANGES IN NET ASSETS
| | | | | Year Ended July 31, |
| |
| |
|
| | | 2004 | | 2003 |
| |
| |
|
| Operations ($): | | | | |
| Investment income—net | | 27,713,534 | | 35,926,410 |
| Net realized gain (loss) on investments | | (8,195,456) | | 27,064,359 |
| Net unrealized appreciation | | | | |
| (depreciation) on investments | | 9,342,965 | | 4,751,590 |
| Net Increase (Decrease) in Net Assets | | | | |
| Resulting from Operations | | 28,861,043 | | 67,742,359 |
| |
| |
|
| Dividends to Shareholders from ($): | | | | |
| Investment income—net: | | | | |
| Investor Shares | | (32,400,059) | | (39,906,073) |
| Institutional Shares | | (160,705) | | (362,297) |
| Net realized gain on investments: | | | | |
| lnvestor Shares | | (14,934,445) | | — |
| Institutional Shares | | (65,767) | | — |
| Total Dividends | | (47,560,976) | | (40,268,370) |
| |
| |
|
| Capital Stock Transactions ($): | | | | |
| Net proceeds from shares sold: | | | | |
| Investor Shares | | 155,725,230 | | 334,357,115 |
| Institutional Shares | | 894,260 | | 962,752 |
| Dividends reinvested: | | | | |
| Investor Shares | | 40,304,499 | | 34,576,830 |
| Institutional Shares | | 61,166 | | 214,614 |
| Cost of shares redeemed: | | | | |
| Investor Shares | | (331,987,819) | | (302,883,485) |
| Institutional Shares | | (2,507,732) | | (5,007,209) |
| Increase (Decrease) in Net Assets from | | | | |
| Capital Stock Transactions | | (137,510,396) | | 62,220,617 |
| Total Increase (Decrease) in Net Assets | | (156,210,329) | | 89,694,606 |
| |
| |
|
| Net Assets ($): | | | | |
| Beginning of Period | | 836,288,374 | | 746,593,768 |
| End of Period | | 680,078,045 | | 836,288,374 |
| Undistributed investment income—net | | 1,381,045 | | 2,362,433 |
STATEMENT OF CHANGES IN NET ASSETS (continued)
| | | | | Year Ended July 31, |
| |
| |
|
| | | 2004 | | 2003 |
| |
| |
|
| Capital Share Transactions: | | | | |
| Investor Shares | | | | |
| Shares sold | | 12,041,064 | | 26,134,890 |
| Shares issued for dividends reinvested | | 3,123,257 | | 2,690,708 |
| Shares redeemed | | (25,804,469) | | (23,608,118) |
| Net Increase (Decrease) in Shares Outstanding | | (10,640,148) | | 5,217,480 |
| |
| |
|
| Institutional Shares | | | | |
| Shares sold | | 68,653 | | 75,863 |
| Shares issued for dividends reinvested | | 4,719 | | 16,768 |
| Shares redeemed | | (193,587) | | (387,437) |
| Net Increase (Decrease) in Shares Outstanding | | (120,215) | | (294,806) |
| | See notes to financial statements.
|
FINANCIAL HIGHLIGHTS
The following tables describe the performance for each share class for the fiscal periods indicated.All information (except portfolio turnover rate) reflects financial results for a single fund share.Total return shows how much your investment in the fund would have increased (or decreased) during each period, assuming you had reinvested all dividends and distributions.These figures have been derived from the fund’s financial statements.
| | | | | | | Year Ended July 31, | | |
| | | |
| |
| |
|
| Investor Shares | | 2004 | | 2003 | | 2002 a | | 2001 | | 2000 |
| |
| |
| |
| |
| |
|
| Per Share Data ($): | | | | | | | | | | |
| Net asset value, beginning of period | | 12.86 | | 12.42 | | 13.22 | | 12.50 | | 12.43 |
| Investment Operations: | | | | | | | | | | |
| Investment income—net | | .46b | | .56b | | .72b | | .84 | | .86 |
| Net realized and unrealized | | | | | | | | | | |
| gain (loss) on investments | | (.01)c | | .51 | | (.64) | | .75 | | .22 |
| Total from Investment Operations | | .45 | | 1.07 | | .08 | | 1.59 | | 1.08 |
| Distributions: | | | | | | | | | | |
| Dividends from investment income—net | | (.54) | | (.63) | | (.76) | | (.84) | | (.87) |
| Dividends from net realized | | | | | | | | | | |
| gain on investments | | (.24) | | — | | (.12) | | (.03) | | (.14) |
| Total Distributions | | (.78) | | (.63) | | (.88) | | (.87) | | (1.01) |
| Net asset value, end of period | | 12.53 | | 12.86 | | 12.42 | | 13.22 | | 12.50 |
| |
| |
| |
| |
| |
|
| Total Return (%) | | 3.59 | | 8.64 | | .64 | | 13.14 | | 9.05 |
| |
| |
| |
| |
| |
|
| Ratios/Supplemental Data (%): | | | | | | | | | | |
| Ratio of total expenses | | | | | | | | | | |
| to average net assets | | .90 | | .90 | | .86 | | .94 | | 1.13 |
| Ratio of net expenses | | | | | | | | | | |
| to average net assets | | .80 | | .82 | | .70 | | .67 | | .65 |
| Ratio of net investment income | | | | | | | | | | |
| to average net assets | | 3.56 | | 4.34 | | 5.58 | | 6.44 | | 6.95 |
| Portfolio Turnover Rate | | 801.49 | | 838.50 | | 474.20 | | 555.90 | | 566.57 |
| |
| |
| |
| |
| |
|
| Net Assets, end of period ($ x 1,000) | | 677,228 | | 831,818 | | 738,618 | | 359,114 | | 60,541 |
| |
| a | | As required, effective August 1, 2001, the fund has adopted the provisions of the AICPA Audit and Accounting |
| | | Guide for Investment Companies and began amortizing discount or premium on fixed income securities on a |
| | | scientific basis and including paydown gains and losses in interest income.The effect of this change for the period |
| | | ended July 31, 2002 was to decrease net investment income per share by $.04, increase net realized and unealized |
| | | gain (loss) on investments per share by $.04 and decrease the ratio of net investment income to average net assets |
| | | from 5.90% to 5.58%. Per share data and ratios/supplemental data for periods prior to August 1, 2001 have not |
| | | been restated to reflect this change in presentation. | | | | | | | | |
| b | | Based on average shares outstanding at each month end. | | | | | | | | |
| c | | In addition to the net realized and unrealized gain on investments as shown in the Statement of Operations, this |
| | | amount includes a decrease in net asset value per share resulting from the timing of issuances and redemptions of |
| | | shares in relation to fluctuating market values for the fund’s investments. | | | | | | |
| d | | The portfolio turnover rate excluding mortgage dollar roll transactions for the year ended July 31, 2004, was 718.14%. |
| See notes to financial statements. | | | | | | | | | | |
| 22 | | | | | | | | | | | | |
| | | | | | | Year Ended July 31, | | |
| | | |
| |
| |
|
| Institutional Shares | | 2004 | | 2003 | | 2002 a | | 2001 b |
| |
| |
| |
| |
|
| Per Share Data ($): | | | | | | | | |
| Net asset value, beginning of period | | 12.85 | | 12.41 | | 13.22 | | 13.08 |
| Investment Operations: | | | | | | | | |
| Investment income—net | | .49c | | .63c | | .76c | | .14 |
| Net realized and unrealized | | | | | | | | |
| gain (loss) on investments | | .00d | | .48 | | (.66) | | .14 |
| Total from Investment Operations | | .49 | | 1.11 | | .10 | | .28 |
| Distributions: | | | | | | | | |
| Dividends from investment income—net | | (.58) | | (.67) | | (.79) | | (.14) |
| Dividends from net realized gain on investments | | (.24) | | — | | (.12) | | — |
| Total Distributions | | (.82) | | (.67) | | (.91) | | (.14) |
| Net asset value, end of period | | 12.52 | | 12.85 | | 12.41 | | 13.22 |
| |
| |
| |
| |
|
| Total Return (%) | | 3.88 | | 9.07 | | .81 | | 12.86e |
| |
| |
| |
| |
|
| Ratios/Supplemental Data (%): | | | | | | | | |
| Ratio of total expenses to average net assets | | .53 | | .53 | | .53 | | 1.66e |
| Ratio of net expenses to average net assets | | .52 | | .50 | | .45 | | .45e |
| Ratio of net investment income | | | | | | | | |
| to average net assets | | 3.85 | | 4.88 | | 5.80 | | 6.56e |
| Portfolio Turnover Rate | | 801.49f | | 838.50 | | 474.20 | | 555.90 |
| |
| |
| |
| |
|
| Net Assets, end of period ($ x 1,000) | | 2,850 | | 4,470 | | 7,976 | | 676 |
| |
| a | | As required, effective August 1, 2001, the fund has adopted the provisions of the AICPA Audit and Accounting |
| | | Guide for Investment Companies and began amortizing discount or premium on fixed income securities on a scientific |
| | | basis and including paydown gains and losses in interest income.The effect of this change for the period ended July |
| | | 31, 2002 was to decrease net investment income per share by $.04, increase net realized and unealized gain (loss) on |
| | | investments per share by $.04 and decrease the ratio of net investment income to average net assets from 6.12% to |
| | | 5.80%. Per share data and ratios/supplemental data for periods prior to August 1, 2001 have not been restated to |
| | | reflect this change in presentation. | | | | | | | | |
| b | | The fund commenced offering Institutional shares on May 31, 2001. | | | | | | |
| c | | Based on average shares outstanding at each month end. | | | | | | |
| d | | Amount represents less than $.01 per share. | | | | | | | | |
| e | | Annualized. | | | | | | | | |
| f | | The portfolio turnover rate excluding mortgage dollar roll transactions for the year ended July 31, 2004, |
| | | was 718.14%. | | | | | | | | |
| See notes to financial statements. | | | | | | | | |
The Fund 23
NOTES TO FINANCIAL STATEMENTS
NOTE 1—Significant Accounting Policies:
Dreyfus Intermediate Term Income Fund (the “fund”) is a separate diversified series of Dreyfus Investment Grade Funds, Inc. (the “Company”) which is registered under the Investment Company Act of 1940, as amended (the “Act”), as an open-end management investment company and operates as a series company currently offering five series, including the fund.The fund’s investment objective is to seek to maximize total return, consisting of capital appreciation and current income.The Dreyfus Corporation (the “Manager” or “Dreyfus”) serves as the fund’s investment adviser.The Manager is a wholly-owned subsidiary of Mellon Financial Corporation (“Mellon Financial”). Dreyfus Service Corporation (the “Distributor”), a wholly-owned subsidiary of the Manager, is the distributor of the fund’s shares which are sold to the public without a sales charge.
The fund is authorized to issue 500 million shares of $.001 par value Common Stock in each of the following classes of shares: Investor and Institutional. Investor shares are subject to a shareholder services plan. Other differences between the classes include the services offered to and the expenses borne by each class, the minimum initial investment and certain voting rights. Income, expenses (other than expenses attributable to a specific class), and realized and unrealized gains or losses on investments are allocated to each class of shares based on its relative net assets.
The Company accounts separately for the assets, liabilities and operations of each series. Expenses directly attributable to each series are charged to that series’ operations; expenses which are applicable to all series are allocated among them on a pro rata basis.
The fund’s financial statements are prepared in accordance with U.S. generally accepted accounting principles, which may require the use of management estimates and assumptions. Actual results could differ from those estimates.
The fund enters into contracts that contain a variety of indemnifications. The fund’s maximum exposure under these arrangements is unknown.The fund does not anticipate recognizing any loss related to these arrangements.
24
(a) Portfolio valuation: Investments in securities (excluding short-term investments (other than U.S.Treasury Bills),financial futures,forward currency exchange contracts,options and swaps) are valued each business day by an independent pricing service (the “Service”) approved by the Board of Directors.Investments for which quoted bid prices are readily available and are representative of the bid side of the market in the judgment of the Service are valued at the mean between the quoted bid prices (as obtained by the Service from dealers in such securities) and asked prices (as calculated by the Service based upon its evaluation of the market for such securities). Other investments (which constitute a majority of the portfolio securities) are valued as determined by the Service, based on methods which include consideration of: yields or prices of securities of comparable quality, coupon, maturity and type; indications as to values from dealers; and general market conditions. Securities for which there are no such valuations are valued at fair value as determined in good faith under the direction of the Board of Directors. Restricted securities, as well as securities or other assets for which recent market quotations are not readily available, that are not valued by a pricing service approved by the fund’s Board of Directors,or are determined by the fund not to reflect accurately fair value (such as when an event occurs after the close of the exchange on which the security is principally traded and that is determined by the fund to have changed the value of the security), are valued at fair value as determined in good faith under the direction of the Board of Directors.The factors that may be considered when fair valuing a security include fundamental analytical data, the nature and duration of restrictions on disposition, an evaluation of the forces that influence the market in which the securities are purchased and sold, and public trading in similar securities of the issuer or comparable issuers.Short-term investments, excluding U.S.Treasury Bills, are carried at amortized cost, which approximates value. Financial futures and options, which are traded on an exchange, are valued at the last sales price on the securities exchange on which such securities are primarily traded or at the last sales price on the national securities market on each business day. Options traded over-the-counter are priced at the mean between the bid prices and the asked prices. Investments denominated in foreign currencies are translated to
| | NOTES TO FINANCIAL STATEMENTS (continued)
|
U.S. dollars at the prevailing rates of exchange. Forward currency exchange contracts are valued at the forward rate. Swap transactions are valued based on future cash flows and other factors, such as interest rates and underlying securities.
(b) Foreign currency transactions: The fund does not isolate that portion of the results of operations resulting from changes in foreign exchange rates on investments from the fluctuations arising from changes in market prices of securities held. Such fluctuations are included with the net realized and unrealized gain or loss from investments.
Net realized foreign exchange gains or losses arise from sales and maturities of short-term securities, sales of foreign currencies, currency gains or losses realized on securities transactions and the difference between the amounts of dividends, interest, and foreign withholding taxes recorded on the fund’s books and the U.S. dollar equivalent of the amounts actually received or paid. Net unrealized foreign exchange gains and losses arise from changes in the value of assets and liabilities other than investments in securities, resulting from changes in exchange rates. Such gains and losses are included with net realized and unrealized gain or loss on investments.
(c) Securities transactions and investment income: Securities transactions are recorded on a trade date basis. Realized gain and loss from securities transactions are recorded on the identified cost basis. Dividend income is recognized on the ex-dividend date and interest income, including, where applicable, amortization of discount and premium on investments, is recognized on the accrual basis.
The fund has an arrangement with the custodian bank whereby the fund receives earnings credits from the custodian when positive cash balances are maintained, which are used to offset custody fees. For financial reporting purposes, the fund includes net earnings credits as an expense offset in the Statement of Operations.
The fund may lend securities to qualified institutions.At origination, all loans are secured by collateral of at least 102% of the value of U.S. securities loaned and 105% of the value of foreign securities loaned. Collateral equivalent to at least 100% of the market value of securities
26
on loan will be maintained at all times. Cash collateral is invested in certain money market mutual funds managed by the Manager.The fund will be entitled to receive all income on securities loaned, in addition to income earned as a result of the lending transaction.Although each security loaned is fully collateralized, the fund would bear the risk of delay in recovery of, or loss of rights in, the securities loaned should a borrower fail to return the securities in a timely manner.
(d) Affiliated issuers: Investments in other investment companies advised by the Manager are defined as “affiliated” in the Act.
(e) Dividends to shareholders: It is the policy of the fund to declare dividends daily from investment income-net. Such dividends are paid monthly. Dividends from net realized capital gain, if any, are normally declared and paid annually, but the fund may make distributions on a more frequent basis to comply with the distribution requirements of the Internal Revenue Code of 1986, as amended (the “Code”).To the extent that net realized capital gain can be offset by capital loss carryovers, it is the policy of the fund not to distribute such gain.Income and capital gain distributions are determined in accordance with income tax regulations, which may differ from U.S. generally accepted accounting principles.
(f) Federal income taxes: It is the policy of the fund to continue to qualify as a regulated investment company, if such qualification is in the best interests of its shareholders, by complying with the applicable provisions of the Code, and to make distributions of taxable income sufficient to relieve it from substantially all federal income and excise taxes.
At July 31, 2004, the components of accumulated earnings on a tax basis were as follows: undistributed ordinary income $1,573,451, accumulated capital losses $3,468,128 and unrealized depreciation $3,042,026. In addition, the fund had $14,639,370 of capital losses realized after October 31, 2003, which were deferred for tax purposes to the first day of the following fiscal year.
The accumulated capital loss carryover is available to be applied against future net securities profits, if any, realized subsequent to July 31, 2004. If not applied, the carryover expires in fiscal 2012.
NOTES TO FINANCIAL STATEMENTS (continued)
The tax character of distributions paid to shareholders during the fiscal periods ended July 31, 2004 and July 31, 2003, were as follows: ordinary income $47,560,976 and $40,268,370, respectively.
During the period ended July 31, 2004, as a result of permanent book to tax differences primarily due to amortization of premiums, paydown gains and losses on mortgage backed securities, the sales treatment for treasury inflation protected securities and structured index notes and dividend reclassification as a result of foreign currency transactions and swap transactions, the fund increased accumulated undistributed investment income-net by $3,865,842, decreased accumulated net realized gain (loss) on investments by $4,094,649 and increased paid-in capital by $228,807. Net assets were not affected by this reclassification.
| | NOTE 2—Bank Lines of Credit:
|
The fund may borrow up to $10 million for leveraging purposes under a short-term unsecured line of credit and participates with other Dreyfus-managed funds in a $100 million unsecured line of credit primarily to be utilized for temporary or emergency purposes, including the financing of redemptions. Interest is charged to the fund based on prevailing market rates in effect at the time of borrowings.
The average daily amount of borrowings outstanding under the leveraging arrangement during the period ended July 31, 2004 was approximately $434,400, with a related weighted average annualized interest rate of 1.43% ..
NOTE 3—Management Fee and Other Transactions With Affiliates:
(a) Pursuant to a management agreement (“Agreement”) with the Manager, the management fee is computed at the annual rate of .45 of 1% of the value of the fund’s average daily net assets and is payable monthly. The Manager has undertaken through July 31, 2004 to reduce the management fee paid by the fund, if the fund’s aggregate expenses, exclusive of taxes, brokerage fees, interest on borrowings, Shareholder Service Plan fees and extraordinary expenses exceed .55 of 1% of the value of the fund’s average daily net assets.The reduction
in management fee, pursuant to the undertaking, amounted to $734,549 during the period ended July 31, 2004.
(b) Under the Investor Shares Shareholder Services Plan, the fund pays the Distributor at an annual rate of .25 of 1% of the value of Investor Shares average daily net assets for the provision of certain services.The services provided may include personal services relating to shareholder accounts, such as answering shareholder inquiries regarding the fund and providing reports and other information, and services related to the maintenance of shareholder accounts. The Distributor may make payments to Service Agents (a securities dealer, financial institution or other industry professional) in respect of these services. The Distributor determines the amounts to be paid to Service Agents. During the period ended July 31, 2004, Investor Shares were charged $1,933,953 pursuant to the Shareholder Services Plan.
The fund compensates Dreyfus Transfer,Inc.,a wholly-owned subsidiary of the Manager, under a transfer agency agreement for providing personnel and facilities to perform transfer agency services for the fund. During the period ended July 31, 2004, the fund was charged $196,084 pursuant to the transfer agency agreement.
The fund compensates Mellon Bank, N.A., an affiliate of the Manager, under a custody agreement for providing custodial services for the fund. During the period ended July 31, 2004, the fund was charged $237,079 pursuant to the custody agreement.
The components of Due to The Dreyfus Corporation and affiliates in the Statement of Assets and Liabilities consist of: management fees $262,116, shareholder services plan fees $145,004, custodian fees $63,909 and transfer agency per account fees $32,064, which are offset against an expense reimbursement currently in effect in the amount of $53,017.
(c) Each Board member also serves as a Board member of other funds within the Dreyfus complex. Annual retainer fees and attendance fees are allocated to each fund based on net assets.
NOTES TO FINANCIAL STATEMENTS (continued)
(d) Pursuant to an exemptive order from the Securities and Exchange Commission, the fund may invest its available cash balances in affiliated money market mutual funds. Management fees of the underlying money market mutual funds have been waived by the Manager.
NOTE 4—Securities Transactions:
|
The following summarizes the aggregate amount of purchases and sales (including paydowns) of investment securities, excluding short-term securities, option transactions, financial futures, forward currency exchange contracts and swap transactions, during the period ended July 31, 2004, amounted to $6,362,371,598 and $6,676,780,615, respectively, of which $661,639,902 in purchases and $663,186,502 in sales were from dollar roll transactions:
The following summarizes the fund’s call/put options written for the period ended July 31, 2004:
| | | Face Amount | | | | Options Terminated |
| | | | | |
|
| | | Covered by | | Premiums | | | | Net Realized |
| Options Written: | | Contracts ($) | | Received ($) | | Cost ($) | | Gain ($) |
| |
| |
| |
| |
|
| Contracts outstanding | | | | | | | | |
| July 31, 2003 | | — | | — | | | | |
| Contracts written | | 130,500,000 | | 1,082,275 | | | | |
| Contracts terminated: | | | | | | | | |
| Closed | | 126,500,000 | | 1,056,275 | | 491,769 | | 564,506 |
| Contracts outstanding | | | | | | |
| July 31, 2004 | | 4,000,000 | | 26,000 | | | | |
The fund may purchase and write (sell) put and call options in order to gain exposure to or to protect against changes in the market.
As a writer of call options, the fund receives a premium at the outset and then bears the market risk of unfavorable changes in the price of the financial instrument underlying the option. Generally, the fund would incur a gain, to the extent of the premium, if the price of the underlying financial instrument decreases between the date the option is written and the date on which the option is terminated. Generally, the fund would realize a loss, if the price of the financial instrument increases between those dates.
30
As a writer of put options, the fund receives a premium at the outset and then bears the market risk of unfavorable changes in the price of the financial instrument underlying the option. Generally, the fund would incur a gain, to the extent of the premium, if the price of the underlying financial instrument increases between the date the option is written and the date on which the option is terminated. Generally, the fund would realize a loss, if the price of the financial instrument decreases between those dates.
The fund may invest in financial futures contracts in order to gain exposure to or protect against changes in the market.The fund is exposed to market risk as a result of changes in the value of the underlying financial instruments. Investments in financial futures require the fund to “mark to market” on a daily basis, which reflects the change in the market value of the contracts at the close of each day’s trading.Typically, variation margin payments are received or made to reflect daily unrealized gains or losses. When the contracts are closed, the fund recognizes a realized gain or loss. These investments require initial margin deposits with a broker, which consist of cash or cash equivalents.The amount of these deposits is determined by the exchange or Board of Trade on which the contract is traded and is subject to change. Contracts open at July 31, 2004 are set forth in the Statement of Financial Futures.
The fund enters into forward currency exchange contracts in order to hedge its exposure to changes in foreign currency exchange rates on its foreign portfolio holdings and to settle foreign currency transactions. When executing forward currency exchange contracts,the fund is obligated to buy or sell a foreign currency at a specified rate on a certain date in the future.With respect to sales of forward currency exchange contracts, the fund would incur a loss if the value of the contract increases between the date the forward contract is opened and the date the forward contract is closed.The fund realizes a gain if the value of the contract decreases between those dates.With respect to purchases of forward currency exchange contracts, the fund would incur a loss if the value of the contract decreases between the date the forward contract is opened
NOTES TO FINANCIAL STATEMENTS (continued)
and the date the forward contract is closed.The fund realizes a gain if the value of the contract increases between those dates. The fund is also exposed to credit risk associated with counter party nonperformance on these forward currency exchange contracts which is typically limited to the unrealized gain on each open contract.At July 31, 2004, there were no forward currency exchange contracts outstanding.
The fund may enter into swap agreements to exchange the interest rate on, or return generated by, one nominal instrument for the return generated by another nominal instrument.
Credit default swaps involve commitments to pay a fixed rate in exchange for payment if a credit event affecting a third party (the referenced company) occurs. Credit events may include a failure to pay interest, principal, bankruptcy, or restructuring. Net periodic interest payments to be received or paid are accrued daily and are recorded in net realized gain/loss on swap transactions in the Statement of Operations. Credit default swaps are marked-to-market daily and the change, if any is recorded as unrealized appreciation or depreciation in the Statement of Operations. The following summarizes open credit default swaps entered into by the fund at July 31, 2004:
| | | | | Unrealized |
| Notional Amount ($) | | Description | | (Depreciation) ($) |
| |
| |
|
| 5,500,000 | | Agreement with UBS terminating | | (7,834) |
| March 20, 2009 to pay a fixed rate of .095% |
| and receive the notional amount as a result of |
| interest payment default totaling $1,000,000 or |
| | | principal payment default of $10,000,000 | | |
| | | on Republic of Italy, 6%, 5/29/2008 | | |
Realized gains or losses on maturity or termination of swaps are presented in the Statement of Operations. Risks may arise upon entering into these agreements from the potential inability of the counterparties to meet the terms of the agreement and are generally limited to the amount of net payments to be received, if any, at the date of default.
Credit default swaps may involve greater risks than if the fund had invested in the referenced obligation directly. Credit default swaps are subject to general market risk, liquidity risk, counterparty risk and
credit risk. If the fund is a buyer and no credit event occurs, it will lose its investment. In addition, if the fund is a seller and a credit event occurs, the value of the referenced obligation received by the fund coupled with the periodic payments previously received, may be less than the notional amount it pays to the buyer, resulting in a loss to the fund.
At July 31, 2004, the cost of investments for federal income tax purposes was $665,952,236 accordingly, accumulated net unrealized depreciation on investments was $2,584,919, consisting of $8,151,798 gross unrealized appreciation and $10,736,717 gross unrealized depreciation.
Two class actions (which have been consolidated) have been filed against Mellon Financial and Mellon Bank, N.A., and Dreyfus and Founders Asset Management LLC (the “Investment Advisers”), and the directors of all or substantially all of the Dreyfus funds, alleging that the Investment Advisers improperly used assets of the Dreyfus funds, in the form of directed brokerage commissions and 12b-1 fees, to pay brokers to promote sales of Dreyfus funds,and that the use of fund assets to make these payments was not properly disclosed to investors.The complaints further allege that the directors breached their fiduciary duties to fund shareholders under the Investment Company Act of 1940 and at common law. The complaints seek unspecified compensatory and punitive damages, rescission of the funds’ contracts with the Investment Advisers, an accounting of all fees paid, and an award of attorneys’ fees and litigation expenses. Dreyfus and the Dreyfus funds believe the allegations to be totally without merit and will defend the actions vigorously.
Additional lawsuits arising out of these circumstances and presenting similar allegations and requests for relief may be filed against the defendants in the future. Neither Dreyfus nor the Dreyfus funds believe that any of the pending actions will have a material adverse effect on the Dreyfus funds or Dreyfus’ ability to perform its contracts with the Dreyfus funds.
| | REPORT OF INDEPENDENT REGISTERED
PUBLIC ACCOUNTING FIRM
|
Shareholders and Board of Directors Dreyfus Intermediate Term Income Fund
We have audited the accompanying statement of assets and liabilities, including the statements of investments, financial futures and options written, of Dreyfus Intermediate Term Income Fund (one of the funds comprising Dreyfus Investment Grade Funds, Inc.), as of July 31, 2004, and the related statement of operations for the year then ended, the statement of changes in net assets for each of the two years in the period then ended, and financial highlights for each of the periods indicated therein. These financial statements and financial highlights are the responsibility of the Fund’s management. Our responsibility is to express an opinion on these financial statements and financial highlights based on our audits.
We conducted our audits in accordance with the standards of the Public Company Accounting Oversight Board (United States).Those standards require that we plan and perform the audit to obtain reasonable assurance about whether the financial statements and financial highlights are free of material misstatement. An audit includes examining, on a test basis, evidence supporting the amounts and disclosures in the financial statements and financial highlights. Our procedures included verification by examination of securities held by the custodian as of July 31, 2004 and confirmation of securities not held by the custodian by correspondence with others.An audit also includes assessing the accounting principles used and significant estimates made by management, as well as evaluating the overall financial statement presentation. We believe that our audits provide a reasonable basis for our opinion.
In our opinion, the financial statements and financial highlights referred to above present fairly, in all material respects, the financial position of Dreyfus Intermediate Term Income Fund at July 31, 2004, the results of its operations for the year then ended, the changes in its net assets for each of the two years in the period then ended, and the financial highlights for each of the indicated periods, in conformity with U.S. generally accepted accounting principles.

| | New York, New York
September 15, 2004
|
34
IMPORTANT TAX INFORMATION (Unaudited)
The fund hereby designates 1.01% of the ordinary dividends paid during the fiscal year ended July 31, 2004 as qualifying for the corporate dividends received deduction. Shareholders will receive notification in January 2005 of the percentage applicable to the preparation of their 2004 income tax returns.
The Fund 35
BOARD MEMBERS INFORMATION (Unaudited)
Joseph S. DiMartino (60) Chairman of the Board (1995)
Principal Occupation During Past 5 Years:
• Corporate Director and Trustee
| | Other Board Memberships and Affiliations:
|
- The Muscular Dystrophy Association, Director
- Levcor International, Inc., an apparel fabric processor, Director
- Century Business Services, Inc., a provider of outsourcing functions for small and medium sizecompanies, Director
- The Newark Group, a provider of a national market of paper recovery facilities, paperboardmills and paperboard converting plants, Director
| | No. of Portfolios for which Board Member Serves: 186
|
| | Clifford L. Alexander, Jr. (70)
Board Member (2003)
|
| | Principal Occupation During Past 5 Years:
|
- President of Alexander & Associates, Inc., a management consulting firm (January 1981-present)
- Chairman of the Board of Moody’s Corporation (October 2000-October 2003)
- Chairman of the Board and Chief Executive Officer of The Dun and Bradstreet Corporation(October 1999-September 2000)
| | Other Board Memberships and Affiliations:
|
- Wyeth (formerly, American Home Products Corporation), a global leader in pharmaceuticals,consumer healthcare products and animal health products, Director
- Mutual of America Life Insurance Company, Director
| | No. of Portfolios for which Board Member Serves: 65
|
———————
Lucy Wilson Benson (76) Board Member (1994)
Principal Occupation During Past 5 Years:
• President of Benson and Associates, consultants to business and government (1980-present)
| | Other Board Memberships and Affiliations:
|
- The International Executive Services Corps., Director
- Citizens Network for Foreign Affairs,Vice Chairperson
- Council on Foreign Relations, Member
- Lafayette College Board of Trustees,Vice Chairperson Emeritus
- Atlantic Council of the U.S., Director
| | No. of Portfolios for which Board Member Serves: 39
|
David W. Burke (68)
Board Member (1994)
|
Principal Occupation During Past 5 Years:
• Corporate Director and Trustee
Other Board Memberships and Affiliations:
- John F. Kennedy Library Foundation, Director
- U.S.S. Constitution Museum, Director
No. of Portfolios for which Board Member Serves: 83
Whitney I. Gerard (69)
Board Member (1993)
|
Principal Occupation During Past 5 Years:
• Partner of Chadbourne & Parke LLP
No. of Portfolios for which Board Member Serves: 37
Arthur A. Hartman (78) Board Member (1992)
Principal Occupation During Past 5 Years:
- Chairman of First NIS Regional Fund (ING/Barings Management) and New Russia Fund
- Advisory Council Member to Barings-Vostok
Other Board Memberships and Affiliations:
• APCO Associates Inc., Senior Consultant
No. of Portfolios for which Board Member Serves: 37
George L. Perry (70)
Board Member (1992)
|
Principal Occupation During Past 5 Years:
• Economist and Senior Fellow at Brookings Institution
Other Board Memberships and Affiliations:
- State Farm Mutual Automobile Association, Director
- State Farm Life Insurance Company, Director
No. of Portfolios for which Board Member Serves: 37
Once elected all Board Members serve for an indefinite term.The address of the Board Members and Officers is in c/o The Dreyfus Corporation, 200 Park Avenue, New York, New York 10166.Additional information about the Board Members is available in the fund’s Statement of Additional Information which can be obtained from Dreyfus free of charge by calling this toll free number: 1-800-554-4611.
OFFICERS OF THE FUND (Unaudited)
STEPHEN E. CANTER, President since March 2000.
Chairman of the Board, Chief Executive Officer and Chief Operating Officer of the Manager, and an officer of 97 investment companies (comprised of 190 portfolios) managed by the Manager. Mr. Canter also is a Board member and, where applicable, an Executive Committee Member of the other investment management subsidiaries of Mellon Financial Corporation, each of which is an affiliate of the Manager. He is 59 years old and has been an employee of the Manager since May 1995.
STEPHEN R. BYERS, Executive Vice President since October 2002.
Chief Investment Officer,Vice Chairman and a Director of the Manager, and an officer of 97 investment companies (comprised of 190 portfolios) managed by the Manager. Mr. Byers also is an officer, director or an Executive Committee Member of certain other investment management subsidiaries of Mellon Financial Corporation, each of which is an affiliate of the Manager. He is 50 years old and has been an employee of the Manager since January 2000. Prior to joining the Manager, he served as an Executive Vice President-Capital Markets, Chief Financial Officer and Treasurer at Gruntal & Co., L.L.C.
MARK N. JACOBS, Vice President since March 2000.
Executive Vice President, Secretary and General Counsel of the Manager, and an officer of 98 investment companies (comprised of 206 portfolios) managed by the Manager. He is 58 years old and has been an employee of the Manager since June 1977.
MICHAEL A. ROSENBERG, Secretary since March 2000.
Associate General Counsel of the Manager, and an officer of 95 investment companies (comprised of 199 portfolios) managed by the Manager. He is 44 years old and has been an employee of the Manager since October 1991.
STEVEN F. NEWMAN, Assistant Secretary since March 2000.
Associate General Counsel and Assistant Secretary of the Manager, and an officer of 98 investment companies (comprised of 206 portfolios) managed by the Manager. He is 54 years old and has been an employee of the Manager since July 1980.
ROBERT R. MULLERY, Assistant Secretary since March 2000.
Associate General Counsel of the Manager, and an officer of 26 investment companies (comprised of 58 portfolios) managed by the Manager. He is 52 years old and has been an employee of the Manager since May 1986.
JEFF PRUSNOFSKY, Assistant Secretary since January 2003.
Associate General Counsel of the Manager, and an officer of 26 investment companies (comprised of 87 portfolios) managed by the Manager. He is 39 years old and has been an employee of the Manager since October 1990.
JAMES WINDELS, Treasurer since November 2001.
Director – Mutual Fund Accounting of the Manager, and an officer of 98 investment companies (comprised of 206 portfolios) managed by the Manager. He is 45 years old and has been an employee of the Manager since April 1985.
38
ERIK D. NAVILOFF, Assistant Treasurer since December 2002.
Senior Accounting Manager – Taxable Fixed Income Funds of the Manager, and an officer of 19 investment companies (comprised of 74 portfolios) managed by the Manager. He is 36 years old and has been an employee of the Manager since November 1992.
KENNETH J. SANDGREN, Assistant Treasurer since November 2001.
Mutual Funds Tax Director of the Manager, and an officer of 98 investment companies (comprised of 206 portfolios) managed by the Manager. He is 49 years old and has been an employee of the Manager since June 1993.
WILLIAM GERMENIS, Anti-Money Laundering Compliance Officer since August 2002.
Vice President and Anti-Money Laundering Compliance Officer of the Distributor, and the Anti-Money Laundering Compliance Officer of 93 investment companies (comprised of 201 portfolios) managed by the Manager. He is 33 years old and has been an employee of the Distributor since October 1998.
The Fund 39
NOTES
For More Information
| Dreyfus |
| Intermediate |
| Term Income Fund |
| 200 Park Avenue |
| New York, NY 10166 |
| |
| Manager |
| The Dreyfus Corporation |
| 200 Park Avenue |
| New York, NY 10166 |
| |
| Custodian |
| Mellon Bank, N.A. |
| One Mellon Bank Center |
| Pittsburgh, PA 15258 |
| Transfer Agent & |
| Dividend Disbursing Agent |
| Dreyfus Transfer, Inc. |
| 200 Park Avenue |
| New York, NY 10166 |
| |
| Distributor |
| Dreyfus Service Corporation |
| 200 Park Avenue |
| New York, NY 10166 |
Telephone 1-800-645-6561
Mail The Dreyfus Family of Funds, 144 Glenn Curtiss Boulevard, Uniondale, NY 11556-0144 E-mail Send your request to info@dreyfus.com Internet Information can be viewed online or downloaded at: http://www.dreyfus.com A description of the policies and procedures that the fund uses to determine how to vote proxies relating to portfolio securities, and information regarding how the fund voted these proxies for the 12-month period ended June 30, 2004, is available through the fund’s website at http://www.dreyfus.com and on the SEC’s website at http://www.sec.gov. The description of the policies and procedures is also available without charge, upon request, by calling 1-800-645-6561.
Beginning with the fund’s fiscal quarter ending October 31, 2004, the fund will file its complete schedule of portfolio holdings with the SEC for the first and third quarters of each fiscal year on Form N-Q; the fund’s Forms N-Q will be available on the SEC’s website at http://www.sec.gov; and the fund’s Forms N-Q may be reviewed and copied at the SEC’s Public Reference Room in Washington, DC, and information on the operation of the Public Reference Room may be obtained by calling 1-800-SEC-0330.

© 2004 Dreyfus Service Corporation
| Dreyfus Premier |
| Short Term |
| Income Fund |
| | ANNUAL REPORT July 31, 2004
|

The views expressed in this report reflect those of the portfolio manager only through the end of the period covered and do not necessarily represent the views of Dreyfus or any other person in the Dreyfus organization. Any such views are subject to change at any time based upon market or other conditions and Dreyfus disclaims any responsibility to update such views.These views may not be relied on as investment advice and, because investment decisions for a Dreyfus fund are based on numerous factors, may not be relied on as an indication of trading intent on behalf of any Dreyfus fund.
Not FDIC-Insured • Not Bank-Guaranteed • May Lose Value
| Contents |
| |
| | | THE FUND |
| |
|
| 2 | | Letter from the Chairman |
| 3 | | Discussion of Fund Performance |
| 6 | | Fund Performance |
| 8 | | Understanding Your Fund’s Expenses |
| 8 | | Comparing Your Fund’s Expenses |
| With Those of Other Funds |
| 9 | | Statement of Investments |
| 17 | | Statement of Financial Futures |
| 18 | | Statement of Options Written |
| 19 | | Statement of Assets and Liabilities |
| 20 | | Statement of Operations |
| 21 | | Statement of Changes in Net Assets |
| 23 | | Financial Highlights |
| 27 | | Notes to Financial Statements |
| 38 | | Report of Independent Registered |
| | | Public Accounting Firm |
| 39 | | Board Members Information |
| 41 | | Officers of the Fund |
| |
| FOR MORE INFORMATION |
|
| | | Back Cover |

Dreyfus Premier
Short Term Income Fund
|
The Fund
LETTER FROM THE CHAIRMAN
This annual report for Dreyfus Premier Short Term Income Fund covers the 12-month period from August 1, 2003, through July 31, 2004. Inside, you’ll find valuable information about how the fund was managed during the reporting period, including a discussion with Gerald E. Thunelius, portfolio manager and Director of the Dreyfus Taxable Fixed Income Team that manages the fund.
The U.S. economy has increasingly shown signs of sustainable growth during the reporting period, causing heightened volatility in most sectors of the U.S. bond market. As it became clearer that a strong job market and higher energy prices might lead to renewed inflationary pressures,the Federal Reserve Board raised short-term interest rates by 25 basis points at its meeting in late June.This shift in monetary policy represents the first increase in short-term rates in more than four years, and many analysts believe that additional, gradual increases are likely to follow.
For many investors, the move to a less accommodative monetary policy marks the beginning of a new phase in the economic cycle. At times such as these, when market conditions are in a period of transition, we believe it is especially important for you to stay in close contact with your financial advisor, who can help you position your portfolio in a way that is designed to respond to the challenges and opportunities of today’s changing investment environment.
Thank you for your continued confidence and support.

The Dreyfus Corporation
August 16, 2004
|
2

DISCUSSION OF FUND PERFORMANCE
Gerald E. Thunelius, Director and Senior Portfolio Manager Dreyfus Taxable Fixed Income Team
How did Dreyfus Premier Short Term Income Fund perform relative to its benchmark?
For the 12-month period ended July 31, 2004, the fund achieved total returns of 0.24% for Class A shares, –0.39% for Class B shares, 0.28% for Class D shares and 0.38% for Class P shares.1 In comparison, the fund’s benchmark, the Merrill Lynch Corporate and Government (1-5 years) Index (the “Index”), achieved a total return of 2.29% for the same period.2
In anticipation of stronger economic growth and higher interest rates from the Federal Reserve Board (the “Fed”), the fund adopted a generally defensive investment posture during much of the reporting period, including a relatively short average duration — a measure of sensitivity to changing interest rates.Although the Fed indeed began to raise short-term interest rates later in the reporting period, persistent economic and geopolitical concerns generally continued to support bond prices, causing the fund’s returns to lag the Index.
What is the fund’s investment approach?
The fund seeks to maximize total returns consisting of capital appreciation and current income.At least 80% of the fund must be invested in investment-grade bonds, including U.S. government and agency securities, corporate bonds and mortgage- and asset-backed securities. Up to 20% of the fund may be invested in securities rated below investment grade. Average effective maturity and average effective duration are kept at three years or less.
When choosing investments for the fund, we evaluate four primary factors:
- The direction in which interest rates are likely to move underprevailing economic conditions. If interest rates appear to be ris-ing, we generally reduce the fund’s average duration to capture
| | DISCUSSION OF FUND PERFORMANCE (continued)
|
- higher-yielding securities as they become available. If interestrates appear to be declining, we may increase the fund’s averageduration to lock in prevailing yields.
- The difference in yields — or spreads — between fixed-incomesecurities of varying maturities.
- The mix of security types within the fund, including relativeexposure to government securities, corporate securities andhigh-yield bonds.
- Credit and cash flow characteristics of individual securities,including the financial health of the issuer and the callability ofthe security.
What other factors influenced the fund’s performance?
The fund was affected by heightened volatility in the bond market as investors adjusted to stronger economic conditions. In fact, reports of stronger economic growth and the possibility of renewed inflationary pressures led to a sharp decline in most bond prices during the summer of 2003. Because the fund at the time employed a shorter average duration than industry averages and emphasized corporate bonds, which historically have been more sensitive to changes in credit quality than interest rates, it weathered the market’s setback better than many comparable funds. As investors’ concerns subsequently eased, however, the fund’s positioning prevented it from participating fully in the market’s recovery over the remainder of 2003.
At the start of 2004, new signs of economic strength made us more concerned that the Fed might begin to raise interest rates if inflationary pressures began to resurface.In addition,corporate bonds appeared over-valued to us after their sustained rally.Accordingly, we reduced the fund’s position in corporate bonds and increased its holdings of securities that we believed would be relatively less sensitive to rising interest rates, including commercial mortgage-backed securities and asset-backed securities. We also positioned the fund for narrower yield differences between short-term and intermediate-term bonds.
In hindsight, these strategies proved premature, because prices of corporate bonds and U.S. government securities generally continued to rally through the first quarter of 2004 in response to weak U.S. labor markets
and low inflation. In this environment, mortgage-backed securities fared particularly well as higher rates led fewer homeowners to refinance their mortgages. Because the fund invested a smaller percentage of its assets in mortgage-backed securities relative to the benchmark, its returns in this area lagged those of the Index. In addition, instead of narrowing as expected, yield differences between short-term and intermediate-term bonds widened, further detracting from the fund’s relative performance.
In April 2004, however, our earlier concerns appeared to be justified when higher energy prices and a strengthening job market suggested that inflationary pressures had begun to rise. Indeed, most investors began to anticipate higher interest rates from the Fed at its meeting in late June.The Fed did not disappoint them, implementing its first rate hike in approximately four years. Although the fund’s positioning helped protect it from the brunt of the market’s decline during the second quarter of 2004, the market again rallied in July amid disappointing employment data and ongoing instability in Iraq.
What is the fund’s current strategy?
|
We have continued to maintain what we regard as a relatively defensive investment posture, setting the fund’s average duration in the neutral range and maintaining roughly equal allocations to U.S. government securities, corporate bonds and mortgage-backed securities.We believe that these are prudent strategies in a rising interest-rate environment. Of course, we will continue to actively monitor the fixed-income markets and make portfolio changes as warranted.
| 1 | | Total return includes reinvestment of dividends and any capital gains paid, and does not take |
| | | consideration the maximum initial sales charge in the case of Class A shares, or the applicable |
| | | contingent deferred sales charge imposed on redemptions in the case of Class B shares. Had these |
| | | charges been reflected, returns would have been lower. Past performance is no guarantee of future |
| | | results. Share price, yield and investment return fluctuate such that upon redemption, fund shares |
| | | may be worth more or less than their original cost. |
| 2 | | SOURCE: LIPPER INC. — Reflects reinvestment of dividends and, where applicable, capital |
| | | gain distributions.The Merrill Lynch Corporate and Government (1-5 years) Index is an |
| | | unmanaged performance benchmark including U.S. government and fixed-coupon domestic |
| | | investment-grade corporate bonds with maturities greater than or equal to one year and less than |
| | | five years. |
The Fund 5
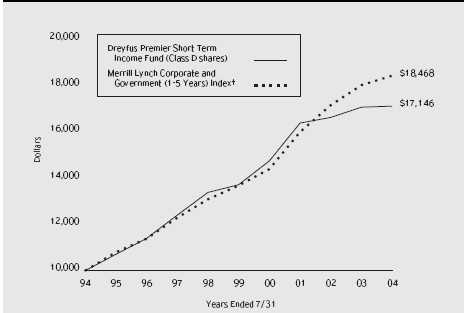
Comparison of change in value of $10,000 investment in Dreyfus Premier Short Term Income Fund Class D shares and the Merrill Lynch Corporate and Government (1-5 Years) Index
† Source: Lipper Inc.
Past performance is not predictive of future performance.
The above graph compares a $10,000 investment made in Class D shares of Dreyfus Premier Short Term Income Fund on 7/31/93 to a $10,000 investment made in the Merrill Lynch Corporate and Government (1-5 Years) Index (the “Index”) on that date.All dividends and capital gain distributions are reinvested. Performance for Class A, Class B and Class P shares will vary from the performance of Class D shares shown above due to differences in charges and expenses. The fund invests primarily in debt securities and securities with debt-like characteristics of domestic and foreign issuers and maintains an average effective maturity and an average effective duration of three years or less.The fund’s performance shown in the line graph takes into account all applicable fees and expenses.The Index is an unmanaged performance benchmark including U.S. government and fixed-coupon domestic investment-grade corporate bonds with maturities greater than or equal to one year and less than five years.The Index does not take into account charges, fees and other expenses. Further information relating to fund performance, including expense reimbursements, if applicable, is contained in the Financial Highlights section of the prospectus and elsewhere in this report.
| Average Annual Total Returns as of 7/31/04 | | | | | | |
| |
| | | Inception | | | | | | | | From |
| | | Date | | 1 Year | | 5 Years | | 10 Years | | Inception |
| |
| |
| |
| |
| |
|
| Class D shares | | | | 0.28% | | 4.54% | | 5.54% | | |
| Class A shares | | | | | | | | | | |
| with maximum sales charge (3.0%) | | 11/1/02 | | (2.80%) | | — | | — | | (0.19%) |
| without sales charge | | 11/1/02 | | 0.24% | | — | | — | | 1.57% |
| Class B shares | | | | | | | | | | |
| with applicable redemption charge † | | 11/1/02 | | (4.26%) | | — | | — | | (1.23%) |
| without redemption | | 11/1/02 | | (0.39%) | | — | | — | | 0.97% |
| Class P shares | | 11/1/02 | | 0.38% | | — | | — | | 1.65% |
Past performance is not predictive of future performance.The fund’s performance shown in the graph and table does not reflect the deduction of taxes that a shareholder would pay on fund distributions or the redemption of fund shares.
† The maximum contingent deferred sales charge for Class B shares is 4%.After six years Class B shares convert to Class A shares.
UNDERSTANDING YOUR FUND’S EXPENSES
As a mutual fund investor, you pay ongoing expenses, such as management fees and other expenses. Using the information below, you can estimate how these expenses affect your investment and compare them with the expenses of other funds.You also may pay one-time transaction expenses, including sales charges (loads) and redemption fees, which are not shown in this section and would have resulted in higher total expenses. For more information, see your fund’s prospectus or talk to your financial adviser.
Review your fund’s expenses
The table below shows the expenses you would have paid on a $1,000 investment in Dreyfus Premier Short Term Income Fund from February 1, 2004 to July 31, 2004. It also shows how much a $1,000 investment would be worth at the close of the period, assuming actual returns and expenses.
| Expenses and Value of a $1,000 Investment | | | | | | |
| assuming actual returns for the six months ended July 31, 2004 | | | | |
| | | Class A | | Class B | | Class D | | Class P |
| |
| |
| |
| |
|
| Expenses paid per $1,000 † | | $ 4.51 | | $ 7.52 | | $ 4.46 | | $ 4.21 |
| Ending value (after expenses) | | $ 992.80 | | $ 989.70 | | $ 992.80 | | $ 993.20 |
COMPARING YOUR FUND’S EXPENSES WITH THOSE OF OTHER FUNDS
Using the SEC’s method to compare expenses
The Securities and Exchange Commission (SEC) has established guidelines to help investors assess fund expenses. Per these guidelines, the table below shows your fund’s expenses based on a $1,000 investment, assuming a hypothetical 5% annualized return. You can use this information to compare the ongoing expenses (but not transaction expenses or total costs) of investing in the fund with those of other funds.All mutual fund shareholder reports will provide this information to help you make this comparison. Please note that you cannot use this information to estimate your actual ending account balance and expenses paid during the period.
Expenses and Value of a $1,000 Investment assuming a hypothetical 5% annualized return for the six months ended July 31, 2004
| | | Class A | | Class B | | Class D | | Class P |
| |
| |
| |
| |
|
| Expenses paid per $1,000 † | | $ 4.57 | | $ 7.62 | | $ 4.52 | | $ 4.27 |
| Ending value (after expenses) | | $1,020.34 | | $1,017.30 | | $1,020.39 | | $1,020.64 |
† Expenses for each share class are calculated using the fund’s annualized expense ratio for each class, which represents the ongoing expenses as a percentage of net assets for the six months ended 7/31/04.The expense ratio may differ for each share class. Expenses are calculated by multiplying the expense ratio by the average account value for the period; then multiplying the result by the number of days in the period; and then dividing that result by the number of days in the year.
8
STATEMENT OF INVESTMENTS
July 31, 2004
|
| | | Principal | | | | |
| Bonds and Notes—82.9% | | Amount ($) | | Value ($) |
| |
| |
|
| Aerospace & Defense—1.4% | | | | | | |
| RC Trust I, | | | | | | |
| Notes, 3.5%, 2006 | | 16,000,000 | | | | 8,800,000 |
| Agricultural—1.6% | | | | | | |
| Altria, | | | | | | |
| Notes, 7%, 2005 | | 4,960,000 | | a | | 5,131,998 |
| RJ Reynolds Tobacco, | | | | | | |
| Notes, 7.25%, 2012 | | 4,500,000 | | | | 4,387,500 |
| | | | | | | 9,519,498 |
| Airlines—.7% | | | | | | |
| American Airlines, | | | | | | |
| Pass-Through Ctfs., 3.857%, 2010 | | 2,176,140 | | | | 2,104,175 |
| Continental Airlines, | | | | | | |
| Pass-Through Ctfs., Ser. 1998-3, 6.32%, 2008 | | 2,500,000 | | | | 2,423,056 |
| US Airways, | | | | | | |
| Enhanced Equipment Notes, Ser. C, 8.93%, 2009 | | 1,092,319 | | b | | 10,923 |
| | | | | | | 4,538,154 |
| Asset-Backed-Automobile Receivables—.4% | | | | | | |
| Navistar Financial Corp. Owner Trust, | | | | | | |
| Ser. 2001-A, Cl. B, 5.59%, 2008 | | 2,452,189 | | | | 2,477,995 |
| Asset-Backed Ctfs.-Home Equity Loans—8.2% | | | | | | |
| Ameriquest Mortgage Securities: | | | | | | |
| Ser. 2003-IA1, Cl. A4, 4.965%, 2033 | | 7,000,000 | | | | 6,979,937 |
| Ser. 2004-FR1, Cl. A5, 4.455%, 2034 | | 16,500,000 | | | | 16,026,501 |
| Conseco Finance Securitizations: | | | | | | |
| Ser. 2000-D, Cl. A3, 7.89%, 2018 | | 64 | | | | 65 |
| Ser. 2000-E, Cl. A5, 8.02%, 2031 | | 3,097,356 | | | | 3,106,772 |
| Ser. 2001-D, Cl. A4, 5.53%, 2032 | | 3,027,046 | | | | 3,095,378 |
| Equity One ABS: | | | | | | |
| Ser. 2004-2, Cl. AF2, 2.829%, 2034 | | 6,000,000 | | | | 5,944,308 |
| Ser. 2004-2, Cl. AF3, 3.515%, 2034 | | 6,000,000 | | | | 5,931,244 |
| Ser. 2004-3, Cl. AF3, 4.265%, 2034 | | 4,406,000 | | | | 4,407,377 |
| Residential Funding Mortgage Securities II, | | | | | | |
| Ser. 2004-HS2, Cl. AI3, 4.4%, 2019 | | 4,922,000 | | | | 4,952,763 |
| | | | | | | 50,444,345 |
| Asset-Backed Ctfs.—Other—1.7% | | | | | | |
| ACAS Business Loan Trust: | | | | | | |
| Ser. 2002-1A, Cl. B, 2.92%, 2012 | | 1,776,147 | | c,d | | 1,779,237 |
| Ser. 2002-2A, Cl. B, 3.02%, 2015 | | 2,500,000 | | c,d | | 2,528,424 |
S T A T E M E N T O F I N V E S T M E N T S (continued)
| | | Principal | | | | |
| Bonds and Notes (continued) | | Amount ($) | | Value ($) |
| |
| |
|
| Asset-Backed Ctfs.—Other (continued) | | | | | | |
| Aircraft Lease Portfolio Securitization, | | | | | | |
| Pass-Through Trust, Ctfs., | | | | | | |
| Ser. 1996-1, Cl. DX, 12.75%, 2006 | | 3,656,077 | | b | | 36,561 |
| Saxon Asset Securities Trust, | | | | | | |
| Ser. 2004-2, Cl. AF2, 4.15%, 2035 | | 6,365,000 | | | | 6,365,000 |
| | | | | | | 10,709,222 |
| Banking—3.7% | | | | | | |
| Deutsche Bank: | | | | | | |
| Deposit Notes, 2.35%, 2005 | | 7,500,000 | | d | | 7,481,250 |
| Deposit Notes, 4.85%, 2006 | | 10,000,000 | | | | 9,675,000 |
| Independence Community Bank, | | | | | | |
| Sub. Notes, 3.75%, 2014 | | 3,000,000 | | | | 2,873,862 |
| Northern Trust, | | | | | | |
| Notes, 2.875%, 2006 | | 2,610,000 | | | | 2,595,152 |
| Regions Bank Of Alabama, | | | | | | |
| Notes, 2.9%, 2006 | | 250,000 | | | | 248,028 |
| | | | | | | 22,873,292 |
| Chemicals—1.1% | | | | | | |
| Sociedad Quimica y Minera de Chile, | | | | | | |
| Bonds, 7.7%, 2006 | | 6,000,000 | | c | | 6,437,508 |
| Commercial Mortgage Pass-Through Ctfs.—7.4% | | | | |
| Bank of America Structured Notes, | | | | | | |
| Ser. 2002-1A, Cl. B, 5.86%, 2014 | | 12,700,000 | | c,d | | 11,600,657 |
| COMM, | | | | | | |
| Ser. 2000-FL2A, Cl. E, 2.37%, 2011 | | 10,150,000 | | c,d | | 9,961,044 |
| CS First Boston Mortgage Securities, | | | | | | |
| Ser. 1998-C1, Cl. A1A, 6.26%, 2040 | | 3,336,636 | | | | 3,422,965 |
| Commerical Mortgage Pass-Through Ctfs., | | | | | | |
| Ser. 2001-ZC1A, Cl. A, 6.355%, 2006 | | 9,619,505 | | c | | 9,918,612 |
| GE Capital Commercial Mortgage, | | | | | | |
| Ser. 2004-C2, Cl. A1, 3.111%, 2040 | | 3,026,549 | | | | 2,981,479 |
| LB-UBS Commercial Mortgage Trust, | | | | | | |
| Ser. 2002-C4, Cl. A1, 3.268%, 2026 | | 5,010,069 | | | | 5,013,339 |
| Wachovia Bank Commercial Mortgage Trust, | | | | |
| Ser. 2002-WHL, Cl. L, 4.38%, 2015 | | 2,900,000 | | c,d | | 2,890,542 |
| | | | | | | 45,788,638 |
| Consumer Products—.4% | | | | | | |
| Gillette, | | | | | | |
| Notes, 5.75%, 2005 | | 2,485,000 | | | | 2,569,418 |
| |
| |
| 10 | | | | | | |
| | | Principal | | | | |
| Bonds and Notes (continued) | | Amount ($) | | Value ($) |
| |
| |
|
| Diversified Financial Services—9.6% | | | | |
| Bombardier Capital, | | | | | | |
| Notes, 3.93%, 2013 | | 3,500,000 | | c,d | | 3,484,499 |
| CIT, | | | | | | |
| Medium-Term Notes, 1.48%, 2007 | | 5,930,000 | | d | | 5,933,849 |
| Capital One Bank, | | | | | | |
| Notes, 4.25%, 2008 | | 5,000,000 | | | | 4,958,320 |
| Fondo LatinoAmericano De Reservas, | | | | | | |
| Notes, 3%, 2006 | | 5,345,000 | | c | | 5,332,183 |
| Ford Motor Credit, | | | | | | |
| Notes, 1.66875%, 2007 | | 5,928,000 | | d | | 5,786,991 |
| GMAC, | | | | | | |
| Notes, 2.51%, 2007 | | 5,000,000 | | d | | 5,010,980 |
| Meridian Funding, | | | | | | |
| Notes, 2.07%, 2009 | | 14,381,250 | | c,d | | 14,394,164 |
| Power Receivable Finance, | | | | | | |
| Sr. Notes, 6.29%, 2012 | | 6,304,246 | | c | | 6,462,003 |
| SLM, | | | | | | |
| Bonds, 1.61%, 2035 | | 7,348,000 | | c,d | | 7,237,633 |
| Toyota Motor Credit, | | | | | | |
| Notes, 2.8%, 2006 | | 500,000 | | | | 502,138 |
| | | | | | | 59,102,760 |
| Electric Utilities—3.4% | | | | | | |
| Entergy Arkansas, | | | | | | |
| First Mortgage, 6.125%, 2005 | | 4,900,000 | | | | 5,054,972 |
| Florida Power & Light, | | | | | | |
| First Mortgage, 6.875%, 2005 | | 6,525,000 | | | | 6,880,939 |
| Monongahela Power, | | | | | | |
| First Mortgage, 5%, 2006 | | 2,950,000 | | | | 3,030,225 |
| Power Contract Financing, | | | | | | |
| Pass-Through Ctfs., 5.2%, 2006 | | 4,365,296 | | c | | 4,391,082 |
| SCANA, | | | | | | |
| Sr. Notes, 1.7%, 2006 | | 1,787,000 | | d | | 1,789,882 |
| | | | | | | 21,147,100 |
| Food & Beverages—1.4% | | | | | | |
| Brown-Forman, | | | | | | |
| Notes, 2.125%, 2006 | | 2,425,000 | | | | 2,400,573 |
| PepsiCo, | | | | | | |
| Notes, 3.2%, 2007 | | 6,000,000 | | | | 5,991,060 |
| | | | | | | 8,391,633 |
S T A T E M E N T O F I N V E S T M E N T S (continued)
| | | Principal | | |
| Bonds and Notes (continued) | | Amount ($) | | Value ($) |
| |
| |
|
| Foreign/Governmental—2.4% | | | | |
| Republic of Argentina, | | | | |
| Deb., 11.25%, 2004 | | 500 b | | 130 |
| Republic of Chile, | | | | |
| Notes, 2.062%, 2008 | | 7,090,000 d | | 7,152,038 |
| Republic of Costa Rica: | | | | |
| Bonds, 6.548%, 2014 | | 1,879,000 | | 1,634,730 |
| Notes, 6.914%, 2008 | | 2,920,000 | | 2,920,000 |
| United Mexican States, | | | | |
| Notes, 2.29%, 2009 | | 3,000,000 d | | 3,045,750 |
| | | | | 14,752,648 |
| Health Care—1.5% | | | | |
| Boston Scientific, | | | | |
| Notes, 6.625%, 2005 | | 5,300,000 | | 5,432,526 |
| UnitedHealth, | | | | |
| Sr. Notes, 3.3%, 2008 | | 3,875,000 | | 3,808,920 |
| | | | | 9,241,446 |
| Manufacturing—1.1% | | | | |
| Tyco International, | | | | |
| Notes, 5.8%, 2006 | | 6,684,000 | | 6,994,799 |
| Media—2.4% | | | | |
| British Sky Broadcasting, | | | | |
| Notes, 7.3%, 2006 | | 4,880,000 | | 5,266,720 |
| Grupo Televisa, | | | | |
| Sr. Notes, 8.625%, 2005 | | 4,000,000 | | 4,250,000 |
| Media General, | | | | |
| Notes, 6.95%, 2006 | | 5,000,000 | | 5,245,510 |
| | | | | 14,762,230 |
| Mining & Metals—.9% | | | | |
| Noranda, | | | | |
| Debs., 7%, 2005 | | 5,000,000 | | 5,177,330 |
| Oil & Gas—2.4% | | | | |
| BP Capital Markets, | | | | |
| Notes, 2.75%, 2006 | | 4,600,000 | | 4,560,182 |
| EnCana, | | | | |
| Notes, 4.6%, 2009 | | 6,862,000 | | 6,912,148 |
| Ocean Energy, | | | | |
| Notes, 4.375%, 2007 | | 3,272,000 | | 3,320,556 |
| | | | | 14,792,886 |
| | | Principal | | | | |
| Bonds and Notes (continued) | | Amount ($) | | Value ($) |
| |
| |
|
| Paper & Forest Products—.2% | | | | | | |
| Weyerhaeuser, | | | | | | |
| Notes, 5.5%, 2005 | | 1,425,000 | | | | 1,452,340 |
| Property-Casualty Insurance—1.1% | | | | | | |
| CNA Financial, | | | | | | |
| Notes, 6.5%, 2005 | | 2,129,000 | | | | 2,180,937 |
| Protective Life US Funding Trust, | | | | | | |
| Notes, 1.48%, 2006 | | 4,550,000 | | c,d | | 4,562,635 |
| | | | | | | 6,743,572 |
| Real Estate Investment Trusts—2.5% | | | | |
| iStar Financial, | | | | | | |
| Sr. Notes, Ser. B, 4.875%, 2009 | | 5,000,000 | | | | 4,947,260 |
| New Plan Excel Realty Trust, | | | | | | |
| Sr. Notes, 6.875%, 2004 | | 6,575,000 | | | | 6,633,590 |
| Rouse, | | | | | | |
| Notes, 8.43%, 2005 | | 2,700,000 | | | | 2,798,577 |
| Summit Properties Partnership, | | | | | | |
| Notes, 6.95%, 2004 | | 750,000 | | | | 750,992 |
| | | | | | | 15,130,419 |
| Residential Mortgage Pass-Through Ctfs.—6.0% | | | | |
| Bank of America Mortgage Securities II, | | | | | | |
| Ser. 2004-D, Cl. A4, 2.543%, 2034 | | 12,192,000 | | d | | 12,125,207 |
| Countrywide Alternative Loan Trust, | | | | | | |
| Ser. 2004-7T1, Cl. A1, 5.75%, 2034 | | 16,719,289 | | | | 16,925,103 |
| Harborview Mortgage Loan Trust, | | | | | | |
| Ser. 2004-4, Cl. 3A, 2.975%, 2034 | | 7,771,051 | | d | | 7,615,630 |
| | | | | | | 36,665,940 |
| Retail—.3% | | | | | | |
| Dillard’s, | | | | | | |
| Notes, 6.43%, 2004 | | 1,950,000 | | | | 1,950,000 |
| Structured Index—3.6% | | | | | | |
| AB Svensk Export Kredit, | | | | | | |
| GSNE-ER Indexed Notes, 0%, 2007 | | 5,845,000 | | c,e | | 5,520,603 |
| Dow Jones CDX.NA., | | | | | | |
| Credit Linked Trust Ctfs.: | | | | | | |
| Ser. 3-1, 7.75%, 2009 | | 956,000 | | c,f | | 936,880 |
| Ser. 3-2, 6.375%, 2009 | | 7,115,000 | | c,f | | 7,026,063 |
S T A T E M E N T O F I N V E S T M E N T S (continued)
| | | Principal | | | | |
| Bonds and Notes (continued) | | Amount ($) | | Value ($) |
| |
| |
|
| Structured Index (continued) | | | | | | |
| HSBC Bank USA, Tranched Investment-Grade | | | | | | |
| Enhanced Return Securities (“TIGERS”): | | | | | | |
| Medium Term Notes, Ser. 2003-4, 4.42%, 2008 | | 5,000,000 | | c,d,f | | 5,014,545 |
| Medium Term Notes, Ser. 2003-7, 6.17%, 2008 | | 3,500,000 | | c,d,f | | 3,494,050 |
| | | | | | | 21,992,141 |
| Telecommunications—3.3% | | | | | | |
| British Telecommunications, | | | | | | |
| Notes, 8.375%, 2010 | | 6,884,000 | | | | 8,123,712 |
| Deutsche Telekom International Finance, | | | | | | |
| Notes, 8.25%, 2005 | | 6,450,000 | | | | 6,764,289 |
| Sprint Capital, | | | | | | |
| Notes, 6%, 2007 | | 5,187,000 | | | | 5,458,462 |
| | | | | | | 20,346,463 |
| U.S. Government Agencies—1.6% | | | | | | |
| Federal Home Loan Banks, | | | | | | |
| Bonds, Ser. 430, 2.875%, 9/15/2006 | | 2,185,000 | | a | | 2,181,456 |
| Federal National Mortgage Association, | | | | | | |
| Notes, 2.375%, 2/15/2007 | | 7,695,000 | | | | 7,549,026 |
| | | | | | | 9,730,482 |
| U.S. Government Agencies/Mortgage-Backed—6.4% | | | | |
| Federal Home Loan Mortgage Corp., | | | | | | |
| 6.5%, 3/1/2032-6/1/2032 | | 1,693,837 | | | | 1,772,702 |
| REMIC, Gtd. Multiclass Mortgage Participation Ctfs.: | | | | | | |
| Ser. 2535, Cl. PL, 4%, 6/15/2029 | | 5,701,700 | | | | 5,746,301 |
| Ser. 2567, Cl. OH, 4%, 3/15/2010 | | 3,920,464 | | | | 3,959,885 |
| Ser. 2612, Cl. LJ, 4%, 7/15/2022 | | 856,897 | | | | 866,169 |
| (Interest-Only Obligations): | | | | | | |
| Ser. 1987, Cl. PI, 7%, 9/15/2012 | | 342,315 | | g | | 47,780 |
| Ser. 1999, Cl. PW, 7%, 8/15/2026 | | 13,046 | | g | | 100 |
| Ser. 2048, Cl. PJ, 7%, 4/15/2028 | | 482,193 | | g | | 62,989 |
| Ser. 2615, Cl. IE, 5.5%, 9/15/2029 | | 10,945,908 | | g | | 1,820,086 |
| Ser. 2646, Cl. IL, 5%, 8/15/2023 | | 30,896,217 | | g | | 3,218,811 |
| Ser. 2752, Cl. PI, 5%, 4/15/2022 | | 32,598,700 | | g | | 4,039,233 |
| Federal National Mortgage Association: | | | | | | |
| 3.52%, 2/1/2029 | | 93,234 | | d | | 96,126 |
| REMIC, Trust, Gtd. Pass-Through Ctfs.: | | | | | | |
| Ser. 2003-49, Cl. JE, 3%, 4/25/2033 | | 1,758,224 | | | | 1,676,547 |
| (Interest-Only Obligations): | | | | | | |
| Ser. 2001-72, Cl. IA, 6%, 3/25/2030 | | 276,158 | | g | | 12,749 |
| Ser. 2002-55, Cl. IJ, 6%, 4/25/2028 | | 1,453,800 | | g | | 26,807 |
| Ser. 2003-7, Cl. IQ, 5.5%, 3/25/2029 | | 17,465,272 | | g | | 4,258,531 |
| Ser. 2003-40, Cl. NI, 5.5%, 11/25/2028 | | 5,842,144 | | g | | 684,576 |
| |
| 14 | | | | | | |
| | | Principal | | |
| Bonds and Notes (continued) | | Amount ($) | | Value ($) |
| |
| |
|
| U.S. Government Agencies/Mortgage-Backed (continued) | | |
| Government National Mortgage Association I: | | |
| 5.5%, 2/15/2034 | | 8,070,311 | | 8,130,838 |
| 6%, 12/15/2031-2/15/2034 | | 88,371 | | 96,904 |
| 6.5%, 6/15/2032 | | 1,271,404 | | 1,332,190 |
| Project Loan, | | | | |
| 8%, 9/15/2008 | | 579,554 | | 603,999 |
| Government National Mortgage Association II: | | |
| 3.25%, 4/20/2030 | | 925,703 d | | 918,576 |
| 7%, 12/20/2030-4/20/2031 | | 96,937 | | 102,918 |
| 7.5%, 11/20/2029-12/20/2030 | | 100,168 | | 107,745 |
| | | | | 39,582,562 |
| U.S. Government—6.2% | | | | |
| U.S. Treasury Notes: | | | | |
| 4%, 6/15/2009 | | 21,800,000 h | | 22,115,010 |
| 4.75%, 5/15/2014 | | 15,867,000 | | 16,212,107 |
| | | | | 38,327,117 |
| Total Bonds and Notes | | | | |
| (cost $517,617,508) | | | | 510,441,938 |
| |
| |
|
| |
| Other Investments—14.8% | | Shares | | Value ($) |
| |
| |
|
| Registered Investment Company; | | | | |
| Dreyfus Institutional Preferred Plus Money Market Fund | | |
| (cost $91,105,000) | | 91,105,000 i | | 91,105,000 |
| |
| |
|
| | | Principal | | |
| Short-Term Investments—1.3% | | Amount ($) | | Value ($) |
| |
| |
|
| Banking—1.2% | | | | |
| Deutsche Bank, | | | | |
| Floating Rate Notes, 5.24%, 2005 | | 7,500,000 d | | 7,406,250 |
| U.S. Treasury Bills—.1% | | | | |
| 1.29%, 9/16/2004 | | 700,000 h | | 698,866 |
| Total Short-Term Investments | | | | |
| (cost $8,198,846) | | | | 8,105,116 |
S T A T E M E N T O F I N V E S T M E N T S (continued)
| Investment of Cash Collateral | | | | | | |
| for Securities Loaned—.4% | | | | Shares | | Value ($) |
| |
| |
| |
|
| Registered Investment Company; | | | | | | |
| Dreyfus Institutional Cash Advantage Plus Fund | | | | |
| (cost $2,308,100) | | | | 2,308,100 i | | 2,308,100 |
| |
| |
| |
|
| |
| Total Investments (cost $619,229,454) | | 99.4% | | 611,960,154 |
| |
| Cash and Receivables (Net) | | | | .6% | | 3,455,521 |
| |
| Net Assets | | | | 100.0% | | 615,415,675 |
| |
| a | | A portion of these securities are on loan.At July 31, 2004, the total market value of the fund’s securities on loan is |
| | | $2,243,631 and the total market value of the collateral held by the fund is $2,308,100. | | |
| b | | Non-income producing—security in default. | | | | |
| c | | Securities exempt from registration under Rule 144A of the Securities Act of 1933.These securities may be resold in |
| | | transactions exempt from registration, normally to qualified institutional buyers.At July 31, 2004, these securities |
| | | amounted to $112,972,364 or 18.4% of net assets. | | | | |
| d | | Variable rate security—interest rate subject to periodic change. | | |
| e | | Security linked to Goldman Sachs Non Energy-Excess Return Index. | | |
| f | | Security linked to a portfolio of debt securities. | | | | |
| g | | Notional face amount shown. | | | | | | |
| h | | Partially or wholly held by a broker as collateral for open financial futures position. | | |
| i | | Investments in affiliated money market mutual funds. | | | | |
| |
| |
| |
|
| |
| |
| |
| Portfolio Summary † | | | | | | |
| |
| | | Value (%) | | | | Value (%) |
| |
| |
| |
|
| Corporate Bonds | | 39.0 | | Structured Index | | 3.6 |
| Mortgage/Asset Backed Securities | | 23.7 | | Foreign/Governmental | | 2.4 |
| Short-Term/Money Market Investments | | 16.5 | | Futures, Options and Swap Contracts .0 |
| U.S. Government/Agency Securities | | 14.2 | | | | 99.4 |
| |
| † | | Based on net assets. | | | | | | |
| See notes to financial statements. | | | | | | |
STATEMENT OF FINANCIAL FUTURES
July 31, 2004
| | | | | Market Value | | | | Unrealized |
| | | | | Covered by | | | | (Depreciation) |
| | | Contracts | | Contracts ($) | | Expiration | | at 7/31/2004 ($) |
| |
| |
| |
| |
|
| Financial Futures Short | | | | | | | | |
| U.S. Treasury 5 Year Note | | 41 | | 4,489,500 | | September 2004 | | (23,063) |
| U.S. Treasury 2 Year Note | | 51 | | 10,767,375 | | September 2004 | | (19,515) |
| | | | | | | | | (42,578) |
See notes to financial statements.
|
STATEMENT OF OPTIONS WRITTEN
July 31, 2004
| Call Options | | Face Amount | | |
| | | Covered by | | |
| | | Contracts ($) | | Value ($) |
| |
| |
|
| Issuer | | | | |
| RJ Reynolds Tobacco Holdings, Bond, | | | | |
| 7.25%, 6/1/2012, September 2004 @ 3% | | |
| (Premiums received $15,975) | | 4,500,000 | | 15,975 |
| | See notes to financial statements.
|
STATEMENT OF ASSETS AND LIABILITIES
July 31, 2004
| | | Cost | | Value |
| |
| |
|
| Assets ($): | | | | |
| Investments in securities—See Statement of Investments | | |
| (including securities on loan, valued at $2,243,631): | | |
| Unaffiliated issuers | | 525,816,354 | | 518,547,054 |
| Affiliated issuers | | 93,413,100 | | 93,413,100 |
| Cash denominated in foreign currencies | | 75,327 | | 74,380 |
| Receivable for investment securities sold | | | | 72,708,483 |
| Dividends and interest receivable | | | | 4,158,555 |
| Receivable for shares of Common Stock subscribed | | 211,895 |
| Unrealized appreciation on swaps—Note 4 | | | | 73,218 |
| Prepaid expenses | | | | 41,907 |
| | | | | 689,228,592 |
| |
| |
|
| Liabilities ($): | | | | |
| Due to The Dreyfus Corporation and affiliates—Note 3(b) | | 493,308 |
| Cash overdraft due to Custodian | | | | 3,522,685 |
| Payable for investment securities purchased | | | | 63,852,485 |
| Payable for shares of Common Stock redeemed | | 3,312,078 |
| Liability for securities on loan—Note 1(c) | | | | 2,308,100 |
| Payable for futures variation margin—Note 4 | | | | 26,555 |
| Outstanding options, written, at value (premiums | | |
| received $15,975)—See Statement of Options Written | | 15,975 |
| Unrealized depreciation on swaps—Note 4 | | | | 8,040 |
| Accrued expenses and other liabilities | | | | 273,691 |
| | | | | 73,812,917 |
| |
| |
|
| Net Assets ($) | | | | 615,415,675 |
| |
| |
|
| Composition of Net Assets ($): | | | | |
| Paid-in capital | | | | 697,112,765 |
| Accumulated undistributed investment income—net | | | | | | 455,128 |
| Accumulated net realized gain (loss) on investments | | | | (74,871,086) |
| Accumulated net unrealized appreciation (depreciation) on | | | | |
| investments and foreign currency transactions [including | | | | |
| ($42,578) net unrealized (depreciation) on financial futures] | | | | (7,281,132) |
| |
| |
|
| Net Assets ($) | | | | | | | | 615,415,675 |
| |
| |
| |
| |
|
| |
| |
| Net Asset Value Per Share | | | | | | | | |
| | | Class A | | Class B | | Class D | | Class P |
| |
| |
| |
| |
|
| Net Assets ($) | | 16,295,841 | | 13,323,202 | | 573,675,518 | | 12,121,114 |
| Shares Outstanding | | 1,462,534 | | 1,196,679 | | 51,522,640 | | 1,087,506 |
| |
| |
| |
| |
|
| Net Asset Value Per Share ($) | | 11.14 | | 11.13 | | 11.13 | | 11.15 |
See notes to financial statements.
|
| | STATEMENT OF OPERATIONS
Year Ended July 31, 2004
|
| Investment Income ($): | | |
| Interest | | 24,427,420 |
| Cash dividends: | | |
| Unaffiliated issuers | | 183,521 |
| Affiliated issuers | | 432,988 |
| Income from securities lending | | 135,461 |
| Total Income | | 25,179,390 |
| Expenses: | | |
| Management fee—Note 3(a) | | 3,896,189 |
| Shareholder servicing costs—Note 3(c) | | 2,417,474 |
| Custodian fees—Note 3(c) | | 159,930 |
| Registration fees | | 96,659 |
| Prospectus and shareholders’ reports | | 86,564 |
| Professional fees | | 86,140 |
| Distribution fees—Note 3(b) | | 66,271 |
| Directors’ fees and expenses—Note 3(d) | | 12,007 |
| Interest expense—Note 2 | | 9,214 |
| Miscellaneous | | 48,211 |
| Total Expenses | | 6,878,659 |
| Investment Income—Net | | 18,300,731 |
| |
|
| Realized and Unrealized Gain (Loss) on Investments—Note 4 ($): |
| Net realized gain (loss) on investments and foreign currency transactions | | (6,437,274) |
| Net realized gain (loss) on financial futures | | (17,922,823) |
| Net realized gain (loss) on forward currency exchange contracts | | (4,032,685) |
| Net realized gain (loss) on swaps | | (1,033,430) |
| Net Realized Gain (Loss) | | (29,426,212) |
| Net unrealized appreciation (depreciation) on investments | | |
| and foreign currency transactions [including ($42,578) | | |
| net unrealized (depreciation) on financial futures] | | 14,372,096 |
| Net Realized and Unrealized Gain (Loss) on Investments | | (15,054,116) |
| Net Increase in Net Assets Resulting from Operations | | 3,246,615 |
| | See notes to financial statements.
|
STATEMENT OF CHANGES IN NET ASSETS
| | | | | Year Ended July 31, |
| |
| |
|
| | | 2004 | | 2003 a |
| |
| |
|
| Operations ($): | | | | |
| Investment income—net | | 18,300,731 | | 33,505,611 |
| Net realized gain (loss) on investments | | (29,426,212) | | (4,221,344) |
| Net unrealized appreciation | | | | |
| (depreciation) on investments | | 14,372,096 | | (3,643,809) |
| Net Increase (Decrease) in Net Assets | | | | |
| Resulting from Operations | | 3,246,615 | | 25,640,458 |
| |
| |
|
| Dividends to Shareholders from ($): | | | | |
| Investment income—net: | | | | |
| Class A | | (656,682) | | (203,422) |
| Class B | | (372,255) | | (118,792) |
| Class D | | (25,021,374) | | (41,586,189) |
| Class P | | (917,256) | | (272,614) |
| Net realized gain on investments: | | | | |
| Class A | | (12,332) | | — |
| Class B | | (8,115) | | — |
| Class D | | (463,196) | | — |
| Class P | | (20,775) | | — |
| Total Dividends | | (27,471,985) | | (42,181,017) |
| |
| |
|
| Capital Stock Transactions ($): | | | | |
| Net proceeds from shares sold: | | | | |
| Class A | | 11,526,055 | | 21,978,408 |
| Class B | | 6,374,193 | | 12,172,638 |
| Class D | | 265,335,140 | | 482,638,456 |
| Class P | | 34,111,282 | | 27,651,185 |
| Dividends reinvested: | | | | |
| Class A | | 595,726 | | 132,906 |
| Class B | | 304,030 | | 93,896 |
| Class D | | 20,784,876 | | 34,036,463 |
| Class P | | 664,682 | | 199,621 |
| Cost of shares redeemed: | | | | |
| Class A | | (13,765,898) | | (3,393,628) |
| Class B | | (4,287,895) | | (808,446) |
| Class D | | (540,483,554) | | (772,025,338) |
| Class P | | (41,414,131) | | (7,923,279) |
| Increase (Decrease) in Net Assets | | | | |
| from Capital Stock Transactions | | (260,255,494) | | (205,247,118) |
| Total Increase (Decrease) in Net Assets | | (284,480,864) | | (221,787,677) |
| |
| |
|
| Net Assets ($): | | | | |
| Beginning of Period | | 899,896,539 | | 1,121,684,216 |
| End of Period | | 615,415,675 | | 899,896,539 |
| Undistributed investment income—net | | 455,128 | | 833,799 |
| |
| | | | | The Fund 21 |
| | STATEMENT OF CHANGES IN NET ASSETS (continued)
|
| | | | | | | Year Ended July 31, |
| | | |
| |
|
| | | | | 2004 | | 2003 a |
| |
| |
| |
|
| Capital Share Transactions: | | | | |
| Class Ab | | | | |
| Shares sold | | 1,013,712 | | 1,894,466 |
| Shares issued for dividends reinvested | | 52,405 | | 11,451 |
| Shares redeemed | | (1,217,806) | | (291,694) |
| Net Increase (Decrease) in Shares Outstanding | | (151,689) | | 1,614,223 |
| |
| |
|
| Class B b | | | | |
| Shares sold | | 559,984 | | 1,049,644 |
| Shares issued for dividends reinvested | | 26,791 | | 8,093 |
| Shares redeemed | | (378,224) | | (69,609) |
| Net Increase (Decrease) in Shares Outstanding | | 208,551 | | 988,128 |
| |
| |
|
| Class D | | | | |
| Shares sold | | 23,294,815 | | 41,519,397 |
| Shares issued for dividends reinvested | | 1,827,858 | | 2,931,135 |
| Shares redeemed | | (47,516,969) | | (66,474,665) |
| Net Increase (Decrease) in Shares Outstanding | | (22,394,296) | | (22,024,133) |
| |
| |
|
| Class P | | | | |
| Shares sold | | 2,972,798 | | 2,383,149 |
| Shares issued for dividends reinvested | | 58,399 | | 17,202 |
| Shares redeemed | | (3,660,489) | | (683,553) |
| Net Increase (Decrease) in Shares Outstanding | | (629,292) | | 1,716,798 |
| |
| a | | The fund commenced offering four classes of shares on November 1, 2002.The existing shares were redesignated |
| | | Class D shares and the fund added Class A, Class B and Class P. | | |
| b | | During the year ended July 31, 2004, 15,358 Class B shares representing $173,766 were automatically converted |
| | | to 15,347 Class A shares and during the period ended July 31, 2003, 461 Class B shares representing $5,343 |
| | | were automatically converted to 461 Class A shares. | | | | |
| See notes to financial statements. | | | | |
The following tables describe the performance for each share class for the fiscal periods indicated.All information (except portfolio turnover rate) reflects financial results for a single fund share.Total return shows how much your investment in the fund would have increased (or decreased) during each period, assuming you had reinvested all dividends and distributions.These figures have been derived from the fund’s financial statements.
| | | | | Year Ended July 31, |
| | | |
|
| Class A Shares | | 2004 | | 2003 a |
| |
| |
|
| Per Share Data ($): | | | | |
| Net asset value, beginning of period | | 11.51 | | 11.59 |
| Investment Operations: | | | | |
| Investment income—net b | | .26 | | .17 |
| Net realized and unrealized | | | | |
| gain (loss) on investments | | (.23) | | .12 |
| Total from Investment Operations | | .03 | | .29 |
| Distributions: | | | | |
| Dividends from investment income—net | | (.39) | | (.37) |
| Dividends from net realized gain on investments | | (.01) | | — |
| Total Distributions | | (.40) | | (.37) |
| Net asset value, end of period | | 11.14 | | 11.51 |
| |
| |
|
| Total Return (%) c | | .24 | | 2.52d |
| |
| |
|
| Ratios/Supplemental Data (%): | | | | |
| Ratio of total expenses to average net assets | | .90 | | .89e |
| Ratio of net investment income | | | | |
| to average net assets | | 2.31 | | 2.09e |
| Portfolio Turnover Rate | | 695.82f | | 460.89 |
| |
| |
|
| Net Assets, end of period ($ x 1,000) | | 16,296 | | 18,578 |
| |
| a | | From November 1, 2002 (commencement of initial offering) to July 31, 2003. | | |
| b | | Based on average shares outstanding at each month end. | | | | |
| c | | Exclusive of sales charge. | | | | |
| d | | Not annualized. | | | | |
| e | | Annualized. | | | | |
| f | | The portfolio turnover rate excluding mortgage dollar roll transactions for the year ended July 31, 2004 was |
| | | 665.12%. | | | | |
| See notes to financial statements. | | | | |
The Fund 23
| | FINANCIAL HIGHLIGHTS (continued)
|
| | | Year Ended July 31, |
| |
|
| Class B Shares | | 2004 | | 2003 a |
| |
| |
|
| Per Share Data ($): | | | | |
| Net asset value, beginning of period | | 11.50 | | 11.59 |
| Investment Operations: | | | | |
| Investment income—net b | | .19 | | .14 |
| Net realized and unrealized | | | | |
| gain (loss) on investments | | (.23) | | .10 |
| Total from Investment Operations | | (.04) | | .24 |
| Distributions: | | | | |
| Dividends from investment income—net | | (.32) | | (.33) |
| Dividends from net realized gain on investments | | (.01) | | — |
| Total Distributions | | (.33) | | (.33) |
| Net asset value, end of period | | 11.13 | | 11.50 |
| |
| |
|
| Total Return (%) c | | (.39) | | 2.11d |
| |
| |
|
| Ratios/Supplemental Data (%): | | | | |
| Ratio of total expenses to average net assets | | 1.54 | | 1.43e |
| Ratio of net investment income | | | | |
| to average net assets | | 1.64 | | 1.67e |
| Portfolio Turnover Rate | | 695.82f | | 460.89 |
| |
| |
|
| Net Assets, end of period ($ x 1,000) | | 13,323 | | 11,367 |
| |
| a From November 1, 2002 (commencement of initial offering) to July 31, 2003. | | |
| b Based on average shares outstanding at each month end. | | | | |
| c Exclusive of sales charge. | | | | |
| d Not annualized. | | | | |
| e Annualized. | | | | |
| f The portfolio turnover rate excluding mortgage dollar roll transactions for the year ended July 31, 2004 was |
| 665.12%. | | | | |
| See notes to financial statements. | | | | |
| | | | | | | | | Year Ended July 31, | | |
| | | |
| |
| |
| |
|
| Class D Shares | | 2004 | | 2003 a | | 2002 b | | 2001 | | 2000 |
| |
| |
| |
| |
| |
|
| Per Share Data ($): | | | | | | | | | | |
| Net asset value, beginning of period | | 11.50 | | 11.69 | | 12.19 | | 11.70 | | 11.63 |
| Investment Operations: | | | | | | | | | | |
| Investment income—net | | .27c | | .40c | | .64c | | .77 | | .71 |
| Net realized and unrealized | | | | | | | | | | |
| gain (loss) on investments | | (.23) | | (.09) | | (.47) | | .50 | | .07 |
| Total from Investment Operations | | .04 | | .31 | | .17 | | 1.27 | | .78 |
| Distributions: | | | | | | | | | | |
| Dividends from investment income—net | | (.40) | | (.50) | | (.67) | | (.78) | | (.71) |
| Dividends from net realized | | | | | | | | | | |
| gain on investments | | (.01) | | — | | — | | — | | — |
| Total Distributions | | (.41) | | (.50) | | (.67) | | (.78) | | (.71) |
| Net asset value, end of period | | 11.13 | | 11.50 | | 11.69 | | 12.19 | | 11.70 |
| |
| |
| |
| |
| |
|
| Total Return (%) | | .28 | | 2.69 | | 1.46 | | 11.17 | | 7.50 |
| |
| |
| |
| |
| |
|
| Ratios/Supplemental Data (%): | | | | | | | | | | |
| Ratio of total expenses | | | | | | | | | | |
| to average net assets | | .87 | | .88 | | .80 | | .84 | | .84 |
| Ratio of net investment income | | | | | | | | | | |
| to average net assets | | 2.36 | | 3.45 | | 5.31 | | 6.46 | | 6.64 |
| Portfolio Turnover Rate | | 695.82d | | 460.89 | | 220.23 | | 322.69 | | 272.46 |
| |
| |
| |
| |
| |
|
| Net Assets, end of period ($ x 1,000) | | 573,676 | | 850,189 | | 1,121,684 | | 806,545 | | 428,093 |
| |
| a | | The fund commenced offering four classes of shares on November 1, 2002.The existing shares were redesignated |
| | | Class D shares. | | | | | | | | | | |
| b | | As required, effective August 1, 2001, the fund has adopted the provisions of the AICPA Audit and Accounting |
| | | Guide for Investment Companies and began amortizing discount or premium on fixed income securities on a scientific |
| | | basis and including paydown gains and losses in interest income.The effect of this change for the period ended July |
| | | 31, 2002 was to decrease net investment income per share by $.04, increase net realized and unealized gain (loss) on |
| | | investments per share by $.04 and decrease the ratio of net investment income to average net assets from 5.62% to |
| | | 5.31%. Per share data and ratios/supplemental data for periods prior to August 1, 2001 have not been restated to |
| | | reflect these changes in presentation. | | | | | | | | | | |
| c | | Based on average shares outstanding at each month end. | | | | | | | | |
| d | | The portfolio turnover rate excluding mortgage dollar roll transactions for the year ended July 31, 2004 was |
| | | 665.12%. | | | | | | | | | | |
| See notes to financial statements. | | | | | | | | | | |
The Fund 25
| | FINANCIAL HIGHLIGHTS (continued)
|
| | | | | Year Ended July 31, |
| | | |
|
| Class P Shares | | 2004 | | 2003 a |
| |
| |
|
| Per Share Data ($): | | | | |
| Net asset value, beginning of period | | 11.51 | | 11.59 |
| Investment Operations: | | | | |
| Investment income—net b | | .28 | | .20 |
| Net realized and unrealized | | | | |
| gain (loss) on investments | | (.22) | | .09 |
| Total from Investment Operations | | .06 | | .29 |
| Distributions: | | | | |
| Dividends from investment income—net | | (.41) | | (.37) |
| Dividends from net realized gain on investments | | (.01) | | — |
| Total Distributions | | (.42) | | (.37) |
| Net asset value, end of period | | 11.15 | | 11.51 |
| |
| |
|
| Total Return (%) | | .38 | | 2.53c |
| |
| |
|
| Ratios/Supplemental Data (%): | | | | |
| Ratio of total expenses to average net assets | | .86 | | .85d |
| Ratio of net investment income | | | | |
| to average net assets | | 2.41 | | 2.33d |
| Portfolio Turnover Rate | | 695.82e | | 460.89c |
| |
| |
|
| Net Assets, end of period ($ x 1,000) | | 12,121 | | 19,763 |
| |
| a | | From November 1, 2002 (commencement of initial offering) to July 31, 2003. | | |
| b | | Based on average shares outstanding at each month end. | | | | |
| c | | Not annualized. | | | | |
| d | | Annualized. | | | | |
| e | | The portfolio turnover rate excluding mortgage dollar roll transactions for the year ended July 31, 2004, was |
| | | 665.12%. | | | | |
| See notes to financial statements. | | | | |
NOTES TO FINANCIAL STATEMENTS
NOTE 1—Significant Accounting Policies:
Dreyfus Premier Short Term Income Fund (the “fund”) is a separate non-diversified series of Dreyfus Investment Grade Funds, Inc. (the “Company”) which is registered under the Investment Company Act of 1940, as amended (the “Act”), as an open-end management investment company and operates as a series company currently offering five series, including the fund.The fund’s investment objective is to seek to maximize total return, consisting of capital appreciation and current income.The Dreyfus Corporation (the “Manager”or “Dreyfus”) serves as the fund’s investment adviser.The Manager is a wholly-owned subsidiary of Mellon Financial Corporation (“Mellon Financial”).
Dreyfus Service Corporation (the “Distributor”), a wholly-owned subsidiary of the Manager, is the distributor of the fund’s shares. The fund is authorized to issue 800 million shares of $.001 par value Common Stock. The fund currently offers four classes of shares: Class A (100 million shares authorized), Class B (100 million shares authorized), Class D (500 million shares authorized) and Class P (100 million shares authorized). Class A shares are subject to a sales charge imposed at the time of purchase, Class B shares are subject to a contingent deferred sales charge (“CDSC”) imposed on Class B share redemptions made within six years of purchase and automatically convert to Class A shares after six years. Class D and Class P shares are sold at net asset value per share only to institutional investors. Class A shares purchased at net asset value (an investment of $250,000 or more) will have a CDSC imposed on redemptions made within eighteen months of purchase. Other differences between the classes include the services offered to and the expenses borne by each class and certain voting rights. Income, expenses (other than expenses attributable to a specific class), and realized and unrealized gains or losses on investments are allocated to each class of shares based on its relative net assets.
The Company accounts separately for the assets, liabilities and operations of each series. Expenses directly attributable to each series are charged to that series’ operations; expenses which are applicable to all series are allocated among them on a pro rata basis.
| | NOTES TO FINANCIAL STATEMENTS (continued)
|
The fund’s financial statements are prepared in accordance with U.S. generally accepted accounting principles, which may require the use of management estimates and assumptions. Actual results could differ from those estimates.
The fund enters into contracts that contain a variety of indemnifications. The fund’s maximum exposure under these arrangements is unknown.The fund does not anticipate recognizing any loss related to these arrangements.
(a) Portfolio valuation: Investments in securities (excluding short-term investments (other than U.S. Treasury Bills), financial futures, options, swap transactions and foreign currency exchange contracts) are valued each business day by an independent pricing service (“Service”) approved by the Board of Directors. Investments for which quoted bid prices are readily available and are representative of the bid side of the market in the judgment of the Service are valued at the mean between the quoted bid prices (as obtained by the Service from dealers in such securities) and asked prices (as calculated by the Service based upon its evaluation of the market for such securities). Other investments (which constitute a majority of the portfolio securities) are valued as determined by the Service, based on methods which include consideration of: yields or prices of securities of comparable quality, coupon, maturity and type; indications as to values from dealers; and general market conditions. Securities for which there are no such valuations are valued at fair value as determined in good faith under the direction of the Board of Directors. Restricted securities, as well as securities or other assets for which recent market quotations are not readily available, that are not valued by a pricing service approved by the fund’s Board of Directors, or are determined by the fund not to reflect accurately fair value (such as when an event occurs after the close of the exchange on which the security is principally traded and that is determined by the fund to have changed the value of the security), are valued at fair value as determined in good faith under the direction of the Board of Directors.The factors that may be considered when fair valuing a security include fundamental analytical data, the nature and duration of restrictions on disposition, an evaluation of the forces that influence the market in which
the securities are purchased and sold, and public trading in similar securities of the issuer or comparable issuers. Short-term investments, excluding U.S. Treasury Bills, are carried at amortized cost, which approximates value. Financial futures, and options, which are traded on an exchange, are valued at the last sales price on the securities exchange on which such securities are primarily traded or at the last sales price on the national securities market on each business day. Options traded over-the-counter are priced at the mean between the bid prices and asked prices. Investments denominated in foreign currencies are translated to U.S. dollars at the prevailing rates of exchange. Swap transactions are valued based on future cash flows and other factors, such as interest rates and underlying securities.
(b) Foreign currency transactions: The fund does not isolate that portion of the results of operations resulting from changes in foreign exchange rates on investments from the fluctuations arising from changes in market prices of securities held. Such fluctuations are included with the net realized and unrealized gain or loss from investments.
Net realized foreign exchange gains or losses arise from sales and maturities of short-term securities, sales of foreign currencies, currency gains or losses realized on securities transactions and the difference between the amounts of dividends, interest, and foreign withholding taxes recorded on the fund’s books and the U.S. dollar equivalent of the amounts actually received or paid. Net unrealized foreign exchange gains and losses arise from changes in the value of assets and liabilities other than investments in securities, resulting from changes in exchange rates. Such gains and losses are included with net realized and unrealized gain or loss on investments.
(c) Securities transactions and investment income: Securities transactions are recorded on a trade date basis. Realized gain and loss from securities transactions are recorded on the identified cost basis. Dividend income is recognized on the ex-dividend date and interest income, including, where applicable, amortization of discount and premium on investments, is recognized on the accrual basis.
| | NOTES TO FINANCIAL STATEMENTS (continued)
|
The fund has an arrangement with the custodian bank whereby the fund receives earnings credits from the custodian when positive cash balances are maintained, which are used to offset custody fees. For financial reporting purposes, the fund includes net earnings credits as an expense offset in the Statement of Operations.
The fund may lend securities to qualified institutions.At origination, all loans are secured by collateral of at least 102% of the value of U.S. securities loaned and 105% of the value of foreign securities loaned.Collateral equivalent to at least 100% of the market value of securities on loan will be maintained at all times. Cash collateral is invested in certain other money market mutual funds managed by the Manager.The fund will be entitled to receive all income on securities loaned, in addition to income earned as a result of the lending transaction. Although each security loaned is fully collateralized, the fund would bear the risk of delay in recovery of, or loss of rights in, the securities loaned should a borrower fail to return the securities in a timely manner.
(d) Affiliated issuers: Investments in other investment companies advised by the Manager are defined as “affiliated” in the Act.
(e) Dividends to shareholders: It is the policy of the fund to declare dividends daily from investment income-net. Such dividends are paid monthly. Dividends from net realized capital gain, if any, are normally declared and paid annually, but the fund may make distributions on a more frequent basis to comply with the distribution requirements of the Internal Revenue Code of 1986, as amended (the “Code”).To the extent that net realized capital gain can be offset by capital loss carryovers, it is the policy of the fund not to distribute such gain.Income and capital gain distributions are determined in accordance with income tax regulations, which may differ from U.S generally accepted accounting principles.
(f) Federal income taxes: It is the policy of the fund to continue to qualify as a regulated investment company, if such qualification is in the best interests of its shareholders, by complying with the applicable provisions of the Code, and to make distributions of taxable income sufficient to relieve it from substantially all federal income and excise taxes.
At July 31, 2004, the components of accumulated earnings on a tax basis were as follows: undistributed ordinary income $523,437, accumulated capital losses $42,659,632 and unrealized depreciation $9,678,447. In addition, the fund had $31,814,794 of capital losses realized after October 31, 2003, which were deferred for tax purposes to the first day of the following fiscal year.
The fund has an unused capital loss carryover available to be applied against future net securities profits, if any, realized subsequent to July 31, 2004. If not applied, $1,314,223 of the carryover expires in fiscal 2005, $1,818,379 expires in fiscal 2007, $5,887,866 expires in fiscal 2008, $4,403,293 expires in fiscal 2010, $21,420,716 expires in fiscal 2011 and $7,815,155 expires in fiscal 2012.
The tax character of distributions paid to shareholders during the fiscal periods ended July 31, 2004 and July 31, 2003, were as follows: ordinary income $27,471,985 and $42,181,017, respectively.
During the period ended July 31, 2004, as a result of permanent book to tax differences primarily due to amortization of premiums, paydown gains and losses on mortgage backed securities and sales treatment for treasury inflation protected securities, the fund increased accumulated undistributed investment income-net by $8,288,165, decreased accumulated net realized gain (loss) on investments by $7,342,384 and decreased paid-in capital by $945,781. Net assets were not affected by this reclassification.
NOTE 2—Bank Lines of Credit:
|
The fund may borrow up to $10 million for leveraging purposes under a short-term unsecured line of credit and participates with other Dreyfus-managed funds in a $100 million unsecured line of credit primarily to be utilized for temporary or emergency purposes, including the financing of redemptions. Interest is charged to the fund based on prevailing market rates in effect at the time of borrowings.
The average daily amount of borrowings outstanding under the leveraging arrangement during the period ended July 31, 2004 was
| | NOTES TO FINANCIAL STATEMENTS (continued)
|
approximately $647,500, with a related weighted average annualized interest rate of 1.42% .
NOTE 3—Management Fee and Other Transactions With Affiliates:
(a) Pursuant to a management agreement with the Manager, the management fee is computed at the annual rate of .50 of 1% of the value of the fund’s average daily net assets and is payable monthly.
During the period ended July 31, 2004, the Distributor retained $21,590 from commissions earned on sales of the fund’s Class A shares and $58,393 from contingent deferred sales charges on redemptions of the fund’s Class B shares.
(b) Under the Distribution Plan (the “Plan”) adopted pursuant to Rule 12b-1 under the Act, Class B shares pay the Distributor for distributing their shares at an annual rate of .50 of 1% of the value of the average daily net assets of Class B shares. During the period ended July 31, 2004, Class B shares were charged $66,271, pursuant to the Plan.
(c) Under the Shareholder Services Plan, Class A, Class B, Class D and Class P shares pay the Distributor at an annual rate of .25 of 1% of the value of the average daily net assets of Class A, Class B and Class P shares and .20 of 1% of the value of the average daily net assets of Class D shares, for the provision of certain services. The services provided may include personal services relating to shareholder accounts, such as answering shareholder inquiries regarding Class A, Class B, Class D and Class P shares and providing reports and other information, and services related to the maintenance of shareholder accounts. The Distributor may make payments to Service Agents (a securities dealer, financial institution or other industry professional) in respect of these services. The Distributor determines the amounts to be paid to Service Agents. During the period ended July 31, 2004, Class A, Class B, Class D and Class P shares were charged, $47,840, $33,135, $1,439,959 and $67,224, respectively, pursuant to the Shareholder Services Plan.
The fund compensates Dreyfus Transfer,Inc.,a wholly-owned subsidiary of the Manager, under a transfer agency agreement for providing per-
sonnel and facilities to perform transfer agency services for the fund. During the period ended July 31, 2004, the fund was charged $440,694 pursuant to the transfer agency agreement.
The fund compensates Mellon Bank, N.A., an affiliate of the Manager under a custody agreement for providing custodial services for the fund. During the period ended July 31, 2004, the fund was charged $159,930 pursuant to the custody agreement.
The components of Due to The Dreyfus Corporation and affiliates in the Statement of Assets and Liabilities consist of: management fees $266,474, 12b-1 distribution fees $5,703, shareholder services plan fees $108,599, custodian fees $43,513 and transfer agency per account fees $69,019.
(d) Each Board member also serves as a Board member of other funds within the Dreyfus complex. Annual retainer fees and attendance fees are allocated to each fund based on net assets.
(e) Pursuant to an exemptive order from the Securities and Exchange Commission, the fund may invest its available cash balances in affiliated money market mutual funds. Management fees of the underlying money market mutual funds have been waived by the Manager.
NOTE 4—Securities Transactions:
|
The aggregate amount of purchases and sales (including paydowns) of investment securities, excluding short-term securities, forward currency exchange contracts, financial futures, options transactions and swap transactions, during the period ended July 31, 2004, amounted to $5,231,982,700 and $5,601,677,803, respectively, of which $230,819,713 in purchases and $231,611,275 in sales were from mortgage dollar roll transactions.
The fund may enter into dollar roll transactions with respect to mortgage-backed securities. In a dollar roll transaction, the fund sells mortgage-backed securities to a financial institution and simultaneously agrees to accept substantially similar (same type, coupon and maturity) securities at a later date, at an agreed upon price.
NOTES TO FINANCIAL STATEMENTS (continued)
The following table summarizes the fund’s call/put options written during the period ended July 31, 2004:
| | | Face Amount | | |
| | | Covered by | | Premiums |
| Options Written: | | Contracts ($) | | Received ($) |
| |
| |
|
| Contracts outstanding | | | | |
| July 31, 2003 | | — | | — |
| Contracts written | | 4,500,000 | | 15,975 |
| Contracts outstanding | | | | |
| July 31, 2004 | | 4,500,000 | | 15,975 |
The fund may purchase and write (sell) put and call options in order to gain exposure to or to protect against changes in the market.
As a writer of call options, the fund receives a premium at the outset and then bears the market risk of unfavorable changes in the price of the financial instrument underlying the option. Generally, the fund would incur a gain, to the extent of the premium, if the price of the underlying financial instrument decreases between the date the option is written and the date on which the option is terminated. Generally, the fund would realize a loss, if the price of the financial instrument increases between those dates.
As a writer of put options, the fund receives a premium at the outset and then bears the market risk of unfavorable changes in the price of the financial instrument underlying the option. Generally, the fund would incur a gain, to the extent of the premium, if the price of the underlying financial instrument increases between the date the option is written and the date on which the option is terminated. Generally, the fund would realize a loss, if the price of the financial instrument decreases between those dates.
The fund may invest in financial futures contracts in order to gain exposure to or protect against changes in the market.The fund is exposed to market risk as a result of changes in the value of the underlying financial instruments. Investments in financial futures require the fund to “mark to market” on a daily basis, which reflects the change in market value of the contracts at the close of each day’s trading.Accordingly, variation margin payments are received or made to reflect daily unrealized
34
gains and losses. When the contracts are closed, the fund recognizes a realized gain or loss. These investments require initial margin deposits with a custodian, which consist of cash or cash equivalents.The amount of these deposits is determined by the exchange or Board of Trade on which the contract is traded and is subject to change. Contracts open at July 31, 2004, are set forth in the Statement of Financial Futures.
The fund enters into forward currency exchange contracts in order to hedge its exposure to changes in foreign currency exchange rates on its foreign portfolio holdings and to settle foreign currency transactions. When executing forward currency exchange contracts, the fund is obligated to buy or sell a foreign currency at a specified rate on a certain date in the future.With respect to sales of forward currency exchange contracts, the fund would incur a loss if the value of the contract increases between the date the forward contract is opened and the date the forward contract is closed.The fund realizes a gain if the value of the contract decreases between those dates.With respect to purchases of forward currency exchange contracts, the fund would incur a loss if the value of the contract decreases between the date the forward contract is opened and the date the forward contract is closed.The fund realizes a gain if the value of the contract increases between those dates.The fund is also exposed to credit risk associated with counter party nonperformance on these forward currency exchange contracts which is typically limited to the unrealized gain on each open contract. At July 31, 2004, there were no forward currency exchange contracts outstanding.
The fund may enter into swap agreements to exchange the interest rate on, or return generated by, one nominal instrument for the return generated by another nominal instrument.
Credit default swaps involve commitments to pay or receive a fixed rate in exchange for payment if a credit event affecting a third party (the referenced company) occurs. Credit events may include a failure to pay interest or principal, bankruptcy, or restructuring. For those credit default swaps in which the fund is receiving a fixed rate, the fund
| | NOTES TO FINANCIAL STATEMENTS (continued)
|
is providing credit protection on the underlying instrument.The maximum payouts for these contracts are limited to the notional amount of each swap. Net periodic interest payments to be received or paid are accrued daily and are recorded in net realized gain/loss on swap transactions in the Statement of Operations. Credit default swaps are marked-to-market daily and the change, if any is recorded as unrealized appreciation or depreciation in the Statement of Operations.The following summarizes open credit default swaps entered into by the fund at July 31, 2004:
| | | | | Unrealized |
| | | | | Appreciation |
| Notional Amount ($) | | Description | | (Depreciation) ($) |
| |
| |
|
| 8,000,000 | | Agreement with UBS terminating | | 46,218 |
| March 20,2009 to receive a fixed rate of 1.12% |
| | | and pay the notional amount as a result of | | |
| interest payment default totaling $1,000,000 or |
| | | principal payment default of $10,000,000 on | | |
| | | CenterPoint Energy, Inc., 7.25%, 9/01/2010 | | |
| 10,000,000 | | Agreement with UBS terminating | | 27,000 |
| March 20,2009 to receive a fixed rate of 1.46% |
| | | and pay the notional amount as a result of | | |
| interest payment default totaling $1,000,000 or |
| | | principal payment default of $10,000,000 on | | |
| | | Dana Corporation, 9%, 8/15/2011 | | |
| 5,650,000 | | Agreement with UBS terminating | | (8,040) |
| | | March 20,2009 to pay a fixed rate of .095% | | |
| | | and receive the notional amount as a result of | | |
| interest payment default totaling $1,000,000 or |
| | | principal payment default of $10,000,000 on | | |
| | | Republic of Italy, 6%, 5/29/2008 | | |
| | | Total | | 65,178 |
Realized gains or losses on maturity or termination of swaps are presented in the Statement of Operations. Risks may arise upon entering into these agreements from the potential inability of the counterparties to meet the terms of the agreement and are generally limited to the amount of net payments to be received, if any, at the date of default.
Credit default swaps may involve greater risks than if the fund had invested in the referenced obligation directly. Credit default swaps are subject to general market risk, liquidity risk, counterparty risk and
36
credit risk. If the fund is a buyer and no credit event occurs, it will lose its investment. In addition, if the fund is a seller and a credit event occurs, the value of the referenced obligation received by the fund coupled with the periodic payments previously received, may be less than the notional amount it pays to the buyer, resulting in a loss to the fund.
At July 31, 2004, the cost of investments for federal income tax purposes was $621,442,512 accordingly, accumulated net unrealized depreciation on investments was $9,482,358, consisting of $2,990,420 gross unrealized appreciation and $12,472,778 gross unrealized depreciation.
Two class actions (which have been consolidated) have been filed against Mellon Financial and Mellon Bank, N.A., and Dreyfus and Founders Asset Management LLC (the “Investment Advisers”), and the directors of all or substantially all of the Dreyfus funds, alleging that the Investment Advisers improperly used assets of the Dreyfus funds, in the form of directed brokerage commissions and 12b-1 fees, to pay brokers to promote sales of Dreyfus funds,and that the use of fund assets to make these payments was not properly disclosed to investors.The complaints further allege that the directors breached their fiduciary duties to fund shareholders under the Investment Company Act of 1940 and at common law. The complaints seek unspecified compensatory and punitive damages, rescission of the funds’ contracts with the Investment Advisers, an accounting of all fees paid, and an award of attorneys’ fees and litigation expenses. Dreyfus and the Dreyfus funds believe the allegations to be totally without merit and will defend the actions vigorously.
Additional lawsuits arising out of these circumstances and presenting similar allegations and requests for relief may be filed against the defendants in the future. Neither Dreyfus nor the Dreyfus funds believe that any of the pending actions will have a material adverse effect on the Dreyfus funds or Dreyfus’ ability to perform its contracts with the Dreyfus funds.
| | REPORT OF INDEPENDENT REGISTERED
PUBLIC ACCOUNTING FIRM
|
Shareholders and Board of Directors Dreyfus Premier Short Term Income Fund
We have audited the accompanying statement of assets and liabilities, including the statements of investments, financial futures and options written, of Dreyfus Premier Short Term Income Fund (one of the funds comprising Dreyfus Investment Grade Funds, Inc.), as of July 31, 2004, and the related statement of operations for the year then ended, the statement of changes in net assets for each of the two years in the period then ended, and financial highlights for each of the periods indicated therein. These financial statements and financial highlights are the responsibility of the Fund’s management. Our responsibility is to express an opinion on these financial statements and financial highlights based on our audits.
We conducted our audits in accordance with the standards of the Public Company Accounting Oversight Board (United States).Those standards require that we plan and perform the audit to obtain reasonable assurance about whether the financial statements and financial highlights are free of material misstatement. An audit includes examining, on a test basis, evidence supporting the amounts and disclosures in the financial statements and financial highlights. Our procedures included verification by examination of securities held by the custodian as of July 31, 2004 and confirmation of securities not held by the custodian by correspondence with others. An audit also includes assessing the accounting principles used and significant estimates made by management, as well as evaluating the overall financial statement presentation. We believe that our audits provide a reasonable basis for our opinion.
In our opinion, the financial statements and financial highlights referred to above present fairly, in all material respects, the financial position of Dreyfus Premier Short Term Income Fund at July 31, 2004, the results of its operations for the year then ended, the changes in its net assets for each of the two years in the period then ended, and the financial highlights for each of the indicated periods, in conformity with U.S. generally accepted accounting principles.

New York, New York
September 15, 2004
|
38
BOARD MEMBERS INFORMATION (Unaudited)
Joseph S. DiMartino (60)
Chairman of the Board (1995)
|
Principal Occupation During Past 5 Years:
• Corporate Director and Trustee
|
Other Board Memberships and Affiliations:
|
- The Muscular Dystrophy Association, Director
- Levcor International, Inc., an apparel fabric processor, Director
- Century Business Services, Inc., a provider of outsourcing functions for small and medium sizecompanies, Director
- The Newark Group, a provider of a national market of paper recovery facilities, paperboardmills and paperboard converting plants, Director
No. of Portfolios for which Board Member Serves: 186
|
Clifford L. Alexander, Jr. (70)
Board Member (2003)
|
Principal Occupation During Past 5 Years:
|
- President of Alexander & Associates, Inc., a management consulting firm ( January 1981-present)
- Chairman of the Board of Moody’s Corporation (October 2000-October 2003)
- Chairman of the Board and Chief Executive Officer of The Dun and Bradstreet Corporation(October 1999-September 2000)
Other Board Memberships and Affiliations:
|
- Wyeth (formerly, American Home Products Corporation), a global leader in pharmaceuticals,consumer healthcare products and animal health products, Director
- Mutual of America Life Insurance Company, Director
No. of Portfolios for which Board Member Serves: 65
|
———————
Lucy Wilson Benson (76) Board Member (1994)
Principal Occupation During Past 5 Years:
• President of Benson and Associates, consultants to business and government (1980-present)
Other Board Memberships and Affiliations:
|
- The International Executive Services Corps., Director
- Citizens Network for Foreign Affairs,Vice Chairperson
- Council on Foreign Relations, Member
- Lafayette College Board of Trustees,Vice Chairperson Emeritus
- Atlantic Council of the U.S., Director
No. of Portfolios for which Board Member Serves: 39
|
BOARD MEMBERS INFORMATION (Unaudited) (continued)
David W. Burke (68)
Board Member (1994)
|
Principal Occupation During Past 5 Years:
• Corporate Director and Trustee
|
Other Board Memberships and Affiliations:
|
- John F. Kennedy Library Foundation, Director
- U.S.S. Constitution Museum, Director
No. of Portfolios for which Board Member Serves: 83
|
Whitney I. Gerard (69)
Board Member (1993)
|
Principal Occupation During Past 5 Years:
• Partner of Chadbourne & Parke LLP
|
No. of Portfolios for which Board Member Serves: 37
|
Arthur A. Hartman (78)
Board Member (1992)
|
Principal Occupation During Past 5 Years:
|
- Chairman of First NIS Regional Fund (ING/Barings Management) and New Russia Fund
- Advisory Council Member to Barings-Vostok
Other Board Memberships and Affiliations:
• APCO Associates, Inc., Senior Consultant
|
No. of Portfolios for which Board Member Serves: 37
|
George L. Perry (70)
Board Member (1992)
|
Principal Occupation During Past 5 Years:
• Economist and Senior Fellow at Brookings Institution
Other Board Memberships and Affiliations:
|
- State Farm Mutual Automobile Association, Director
- State Farm Life Insurance Company, Director
No. of Portfolios for which Board Member Serves: 37
|
Once elected all Board Members serve for an indefinite term.The address of the Board Members and Officers is in c/o The Dreyfus Corporation, 200 Park Avenue, New York, New York 10166.Additional information about the Board Members is available in the fund’s Statement of Additional Information which can be obtained from Dreyfus free of charge by calling this toll free number: 1-800-554-4611.
OFFICERS OF THE FUND (Unaudited)
STEPHEN E. CANTER, President since March 2000.
Chairman of the Board, Chief Executive Officer and Chief Operating Officer of the Manager, and an officer of 97 investment companies (comprised of 190 portfolios) managed by the Manager. Mr. Canter also is a Board member and, where applicable, an Executive Committee Member of the other investment management subsidiaries of Mellon Financial Corporation, each of which is an affiliate of the Manager. He is 59 years old and has been an employee of the Manager since May 1995.
STEPHEN R. BYERS, Executive Vice President since October 2002.
Chief Investment Officer,Vice Chairman and a Director of the Manager, and an officer of 97 investment companies (comprised of 190 portfolios) managed by the Manager. Mr. Byers also is an officer, director or an Executive Committee Member of certain other investment management subsidiaries of Mellon Financial Corporation, each of which is an affiliate of the Manager. He is 50 years old and has been an employee of the Manager since January 2000. Prior to joining the Manager, he served as an Executive Vice President-Capital Markets, Chief Financial Officer and Treasurer at Gruntal & Co., L.L.C.
MARK N. JACOBS, Vice President since March 2000.
Executive Vice President, Secretary and General Counsel of the Manager, and an officer of 98 investment companies (comprised of 206 portfolios) managed by the Manager. He is 58 years old and has been an employee of the Manager since June 1977.
MICHAEL A. ROSENBERG, Secretary since March 2000.
Associate General Counsel of the Manager, and an officer of 95 investment companies (comprised of 199 portfolios) managed by the Manager. He is 44 years old and has been an employee of the Manager since October 1991.
STEVEN F. NEWMAN, Assistant Secretary since March 2000.
Associate General Counsel and Assistant Secretary of the Manager, and an officer of 98 investment companies (comprised of 206 portfolios) managed by the Manager. He is 54 years old and has been an employee of the Manager since July 1980.
ROBERT R. MULLERY, Assistant Secretary since March 2000.
Associate General Counsel of the Manager, and an officer of 26 investment companies (comprised of 58 portfolios) managed by the Manager. He is 52 years old and has been an employee of the Manager since May 1986.
JEFF PRUSNOFSKY, Assistant Secretary since January 2003.
Associate General Counsel of the Manager, and an officer of 26 investment companies (comprised of 87 portfolios) managed by the Manager. He is 39 years old and has been an employee of the Manager since October 1990.
OFFICERS OF THE FUND (Unaudited) (continued)
JAMES WINDELS, Treasurer since November 2001.
Director – Mutual Fund Accounting of the Manager, and an officer of 98 investment companies (comprised of 206 portfolios) managed by the Manager. He is 45 years old and has been an employee of the Manager since April 1985.
ERIK D. NAVILOFF, Assistant Treasurer since December 2002.
Senior Accounting Manager – Taxable Fixed Income Funds of the Manager, and an officer of 19 investment companies (comprised of 74 portfolios) managed by the Manager. He is 36 years old and has been an employee of the Manager since November 1992.
KENNETH J. SANDGREN, Assistant Treasurer since November 2001.
Mutual Funds Tax Director of the Manager, and an officer of 98 investment companies (comprised of 206 portfolios) managed by the Manager. He is 49 years old and has been an employee of the Manager since June 1993.
WILLIAM GERMENIS, Anti-Money Laundering Compliance Officer since August 2002.
Vice President and Anti-Money Laundering Compliance Officer of the Distributor, and the Anti-Money Laundering Compliance Officer of 93 investment companies (comprised of 201 portfolios) managed by the Manager. He is 33 years old and has been an employee of the Distributor since October 1998.
42
| For More | | Information |
| |
|
| |
| Dreyfus Premier | | Transfer Agent & |
| Short Term Income Fund | | Dividend Disbursing Agent |
| 200 Park Avenue | | |
| | | Dreyfus Transfer, Inc. |
| New York, NY 10166 | | |
| | | 200 Park Avenue |
| Manager | | New York, NY 10166 |
| The Dreyfus Corporation | | Distributor |
| 200 Park Avenue | | |
| | | Dreyfus Service Corporation |
| New York, NY 10166 | | |
| | | 200 Park Avenue |
| Custodian | | New York, NY 10166 |
| Mellon Bank, N.A. | | |
| One Mellon Bank Center | | |
| Pittsburgh, PA 15258 | | |
Telephone Call your financial representative or 1-800-554-4611
| Mail | | The Dreyfus Premier Family of Funds |
| | | 144 Glenn Curtiss Boulevard, Uniondale, NY 11556-0144 |
A description of the policies and procedures that the fund uses to determine how to vote proxies relating to portfolio securities, and information regarding how the fund voted these proxies for the 12-month period ended June 30, 2004, is available through the fund’s website at http://www.dreyfus.com and on the SEC’s website at http://www.sec.gov. The description of the policies and procedures is also available without charge, upon request, by calling 1-800-645-6561.
Beginning with the fund’s fiscal quarter ending October 31, 2004, the fund will file its complete schedule of portfolio holdings with the SEC for the first and third quarters of each fiscal year on Form N-Q; the fund’s Forms N-Q will be available on the SEC’s website at http://www.sec.gov; and the fund’s Forms N-Q may be reviewed and copied at the SEC’s Public Reference Room in Washington, DC, and information on the operation of the Public Reference Room may be obtained by calling 1-800-SEC-0330.

© 2004 Dreyfus Service Corporation
Item 2. Code of Ethics.
The Registrant has adopted a code of ethics that applies to the Registrant's principal executive officer, principal financial officer, principal accounting officer or controller, or persons performing similar functions. There have been no amendments to, or waivers in connection with, the Code of Ethics during the period covered by this Report.
Item 3. Audit Committee Financial Expert.
The Registrant's Board has determined that Joseph DiMartino, a member of the Audit Committee of the Board, is an audit committee financial expert as defined by the Securities and Exchange Commission (the "SEC"). Joseph DiMartino is "independent" as defined by the SEC for purposes of audit committee financial expert determinations.
Item 4. Principal Accountant Fees and Services
(a) Audit Fees. The aggregate fees billed for each of the last two fiscal years (the "Reporting Periods") for professional services rendered by the Registrant's principal accountant (the "Auditor") for the audit of the Registrant's annual financial statements, or services that are normally provided by the Auditor in connection with the statutory and regulatory filings or engagements for the Reporting Periods, were $112,200 in 2003 and $123,060 in 2004.
(b) Audit-Related Fees. The aggregate fees billed in the Reporting Periods for assurance and related services by the Auditor that are reasonably related to the performance of the audit of the Registrant's financial statements and are not reported under paragraph (a) of this Item 4 were $18,000 in 2003 and $22,500 in 2004. These services consisted of (i) security counts required by Rule 17f-2 under the Investment Company Act of 1940, as amended.
The aggregate fees billed in the Reporting Periods for non-audit assurance and related services by the Auditor to the Registrant's investment adviser (not including any sub-investment adviser whose role is primarily portfolio management and is subcontracted with or overseen by another investment adviser), and any entity controlling, controlled by or under common control with the investment adviser that provides ongoing services to the Registrant ("Service Affiliates"), that were reasonably related to the performance of the annual audit of the Service Affiliate, which required pre-approval by the Audit Committee were $65,000 in 2003 and $238,520 in 2004.
Note: For the second paragraph in each of (b) through (d) of this Item 4, certain of such services were not pre-approved prior to May 6, 2003, when such services were required to be pre-approved. On and after May 6, 2003, 100% of all services provided by the Auditor were pre-approved as required. For comparative purposes, the fees shown assume that all such services were pre-approved, including services that were not pre-approved prior to the compliance date of the pre-approval requirement.
(c) Tax Fees. The aggregate fees billed in the Reporting Periods for professional services rendered by the Auditor for tax compliance, tax advice and tax planning ("Tax Services") were $41,595 in 2003 and $21,340 in 2004. These services consisted of (i) review or preparation of U.S. federal, state, local and excise tax returns; (ii) U.S. federal, state and local tax planning, advice and assistance regarding statutory, regulatory or
administrative developments, (iii) tax advice regarding tax qualification matters and/or treatment of various financial instruments held or proposed to be acquired or held, and (iv) determination of Passive Foreign Investment Companies.
The aggregate fees billed in the Reporting Periods for Tax Services by the Auditor to Service Affiliates which required pre-approval by the Audit Committee were $0 in 2003 and $0 in 2004.
(d) All Other Fees. The aggregate fees billed in the Reporting Periods for products and services provided by the Auditor, other than the services reported in paragraphs (a) through (c) of this Item, were $0 in 2003 and $1,707 in 2004. These services consisted of a review of the Registrant's anti-money laundering program.
The aggregate fees billed in the Reporting Periods for Non-Audit Services by the Auditor to Service Affiliates, other than the services reported in paragraphs (b) and (c) of this Item, which required pre-approval by the Audit Committee were $0 in 2003 and $0 in 2004.
Audit Committee Pre-Approval Policies and Procedures. The Registrant's Audit Committee has established policies and procedures (the "Policy") for pre-approval (within specified fee limits) of the Auditor's engagements for non-audit services to the Registrant and Service Affiliates without specific case-by-case consideration. Pre-approval considerations include whether the proposed services are compatible with maintaining the Auditor's independence. Pre-approvals pursuant to the Policy are considered annually.
Non-Audit Fees. The aggregate non-audit fees billed by the Auditor for services rendered to the Registrant, and rendered to Service Affiliates, for the Reporting Periods were $103,250 in 2003 and $632,202 in 2004.
Auditor Independence. The Registrant's Audit Committee has considered whether the provision of non-audit services that were rendered to Service Affiliates which were not pre-approved (not requiring pre-approval) is compatible with maintaining the Auditor's independence.
| | |
| Item 5. | | Audit Committee of Listed Registrants. |
| | | Not applicable. [CLOSED -END FUNDS ONLY] |
| Item 6. | | Schedule of Investments. |
| | | Not applicable. |
| Item 7. | | Disclosure of Proxy Voting Policies and Procedures for Closed-End Management |
| | | Investment Companies. |
| | | Not applicable. [CLOSED -END FUNDS ONLY] |
| Item 8. | | Purchases of Equity Securities by Closed-End Management Investment Companies and |
| | | Affiliated Purchasers. |
| | | Not applicable. [CLOSED -END FUNDS ONLY] |
| Item 9. | | Submission of Matters to a Vote of Security Holders. |
The Registrant has a Nominating Committee (the "Committee"), which is responsible for selecting and nominating persons for election or appointment by the Registrant's Board as Board members. The Committee has adopted a Nominating Committee Charter (the "Charter"). Pursuant to the Charter, the Committee will consider recommendations for nominees from shareholders submitted to the Secretary of the
Registrant, c/o The Dreyfus Corporation Legal Department, 200 Park Avenue, 8th Floor West, New York, New York 10166. A nomination submission must include information regarding the recommended nominee as specified in the Charter. This information includes all information relating to a recommended nominee that is required to be disclosed in solicitations or proxy statements for the election of Board members, as well as information sufficient to evaluate the factors to be considered by the Committee, including character and integrity, business and professional experience, and whether the person has the ability to apply sound and independent business judgment and would act in the interests of the Registrant and its shareholders.
Nomination submissions are required to be accompanied by a written consent of the individual to stand for election if nominated by the Board and to serve if elected by the shareholders, and such additional information must be provided regarding the recommended nominee as reasonably requested by the Committee.
Item 10. Controls and Procedures.
(a) The Registrant's principal executive and principal financial officers have concluded, based on their evaluation of the Registrant's disclosure controls and procedures as of a date within 90 days of the filing date of this report, that the Registrant's disclosure controls and procedures are reasonably designed to ensure that information required to be disclosed by the Registrant on Form N-CSR is recorded, processed, summarized and reported within the required time periods and that information required to be disclosed by the Registrant in the reports that it files or submits on Form N-CSR is accumulated and communicated to the Registrant's management, including its principal executive and principal financial officers, as appropriate to allow timely decisions regarding required disclosure.
(b) There were no changes to the Registrant's internal control over financial reporting that occurred during the Registrant's most recently ended fiscal half-year that have materially affected, or are reasonably likely to materially affect, the Registrant's internal control over financial reporting.
Item 11. Exhibits.
| | |
| (a)(1) | | Code of ethics referred to in Item 2. |
| (a)(2) | | Certifications of principal executive and principal financial officers as required by Rule 30a-2(a) |
| under the Investment Company Act of 1940. |
| (a)(3) | | Not applicable. |
| (b) | | Certification of principal executive and principal financial officers as required by Rule 30a-2(b) |
| under the Investment Company Act of 1940. |
SIGNATURES
Pursuant to the requirements of the Securities Exchange Act of 1934 and the Investment Company Act of 1940, the Registrant has duly caused this Report to be signed on its behalf by the undersigned, thereunto duly authorized.
| | DREYFUS INVESTMENT GRADE FUNDS, INC.
|
| | |
| By: | | /s/ Stephen E. Canter |
| | | Stephen E. Canter |
| | | President |
| |
| Date: | | September 27, 2004 |
Pursuant to the requirements of the Securities Exchange Act of 1934 and the Investment Company Act of 1940, this Report has been signed below by the following persons on behalf of the Registrant and in the capacities and on the dates indicated.
| | |
| By: | | /s/ Stephen E. Canter |
| | | Stephen E. Canter |
| | | Chief Executive Officer |
| |
| Date: | | September 27, 2004 |
| |
| By: | | /s/ James Windels |
| James Windels |
| | | Chief Financial Officer |
| |
| Date: | | September 27, 2004 |
EXHIBIT INDEX
(a)(1) Code of ethics referred to in Item 2.
(a)(2) Certifications of principal executive and principal financial officers as required by Rule 30a-2(a) under the Investment Company Act of 1940. (EX-99.CERT)
(b) Certification of principal executive and principal financial officers as required by Rule 30a-2(b) under the Investment Company Act of 1940. (EX-99.906CERT)