| UNITED STATES |
| SECURITIES AND EXCHANGE COMMISSION |
| Washington, D.C. 20549 |
| FORM N-CSR |
| CERTIFIED SHAREHOLDER REPORT OF REGISTERED MANAGEMENT |
| INVESTMENT COMPANIES |
| Investment Company Act file number 811-6718 |
| DREYFUS INVESTMENT GRADE FUNDS, INC. |
| (Exact name of Registrant as specified in charter) |
| c/o The Dreyfus Corporation |
| 200 Park Avenue |
| New York, New York 10166 |
| (Address of principal executive offices) (Zip code) |
| |
| Mark N. Jacobs, Esq. |
| 200 Park Avenue |
| New York, New York 10166 |
| (Name and address of agent for service) |
| |
| Registrant's telephone number, including area code: (212) 922-6000 |
| Date of fiscal year end: | | 7/31 |
| Date of reporting period: | | 7/31/05 |
| | | | | FORM N-CSR |
| Item 1. | | Reports to Stockholders. | | |
Dreyfus Premier Yield Advantage Fund
| | ANNUAL REPORT July 31, 2005
|

Save time. Save paper. View your next shareholder report online as soon as it’s available. Log into www.dreyfus.com and sign up for Dreyfus eCommunications. It’s simple and only takes a few minutes.
The views expressed in this report reflect those of the portfolio manager only through the end of the period covered and do not necessarily represent the views of Dreyfus or any other person in the Dreyfus organization. Any such views are subject to change at any time based upon market or other conditions and Dreyfus disclaims any responsibility to update such views.These views may not be relied on as investment advice and, because investment decisions for a Dreyfus fund are based on numerous factors, may not be relied on as an indication of trading intent on behalf of any Dreyfus fund.
Not FDIC-Insured • Not Bank-Guaranteed • May Lose Value
| | | Contents |
| |
| | | THE FUND |
| |
|
| 2 | | Letter from the Chairman |
| 3 | | Discussion of Fund Performance |
| 6 | | Fund Performance |
| 8 | | Understanding Your Fund’s Expenses |
| 8 | | Comparing Your Fund’s Expenses |
| | | With Those of Other Funds |
| 9 | | Statement of Investments |
| 15 | | Statement of Assets and Liabilities |
| 16 | | Statement of Operations |
| 17 | | Statement of Changes in Net Assets |
| 19 | | Financial Highlights |
| 24 | | Notes to Financial Statements |
| 33 | | Report of Independent Registered |
| | | Public Accounting Firm |
| 34 | | Information About the Review and Approval |
| | | of the Fund’s Management Agreement |
| 38 | | Board Members Information |
| 40 | | Officers of the Fund |
| | | FOR MORE INFORMATION |
| |
|
| | | Back Cover |
| Dreyfus Premier |
| Yield Advantage Fund |
The Fund

LETTER FROM THE CHAIRMAN
We are pleased to present this annual report for Dreyfus Premier Yield Advantage Fund, covering the 12-month period from August 1, 2004, through July 31, 2005. Inside, you’ll find valuable information about how the fund was managed during the reporting period, including a discussion with the fund’s primary portfolio manager, Laurie Carroll.
The past 12 months proved to be an unusual time for fixed-income securities. Although the Federal Reserve Board continued to raise short-term interest rates, yield differences between long- and short-term securities remained relatively narrow for most of the reporting period — contrary to historical norms. Strong demand from domestic and foreign investors, along with mild inflation concerns, helped support prices of U.S.Treasury securities. Corporate bonds also fared well during the reporting period generally due to stronger balance sheets, better business conditions and persistently low default rates.
In our view, these and other factors may have created new opportunities and challenges for fixed-income investors. Our economists currently expect the U.S. economy to continue to grow over the foreseeable future without significant new inflationary pressures, potentially setting the stage for market conditions that could affect the various sectors of the U.S. bond market in different ways. As always, we encourage you to talk with your financial advisor about the investment strategies that may best suit your current needs and future goals.
Thank you for your continued confidence and support.

DISCUSSION OF FUND PERFORMANCE
Laurie Carroll, Portfolio Manager
How did Dreyfus Premier Yield Advantage Fund perform relative to its benchmark?
For the 12-month period ended July 31, 2005, the fund achieved total returns of 2.13% for Class A shares, 1.37% for Class B shares, 2.13% for Class D shares, 2.14% for Class P shares and 1.88% for Class S shares.1 In comparison, the Citigroup 1-Year Treasury Benchmark-on-the-Run Index, the fund’s benchmark, achieved a total return of 1.46% for the same period.2
The Federal Reserve Board (the “Fed”) raised interest rates eight times during the reporting period, and yields of short-term fixed-income securities rose commensurately. The fund produced higher returns than its benchmark, primarily due to strong contributions from commercial mortgage-backed securities, corporate bonds and Treasury Inflation Protected Securities (“TIPS”).
What is the fund’s investment approach?
The fund seeks as high a level of current income as is consistent with the preservation of capital, with minimal changes in share price. To pursue its goal, the fund invests only in investment-grade fixed-income securities of U.S. and foreign issuers or the unrated equivalent as determined by Dreyfus. This may include: U.S. government bonds and notes; corporate bonds; municipal bonds; convertible securities; preferred stocks; inflation-indexed securities; asset-backed securities; mortgage-related securities (including CMOs); and foreign bonds.
To help reduce share price fluctuations, the fund seeks to keep the average effective duration of its overall portfolio at one year or less, and the fund may invest in securities with effective final maturities of any length.
The fund may also engage in risk management techniques, including short sales, futures contracts, swap agreements and other derivatives, in
DISCUSSION OF FUND PERFORMANCE (continued)
|
seeking to reduce share price volatility, increase income and otherwise manage the fund’s exposure to investment risks. The fund will focus primarily on U.S. securities, but may invest up to 10% of its total assets in fixed-income securities of foreign issuers.
What other factors influenced the fund’s performance?
When the reporting period began, investors had grown concerned that political uncertainty, surging energy prices and rising interest rates might be holding back the U.S. economic expansion. However, these concerns were alleviated to a large extent with the resolution of the presidential election in November 2004 and clearer signs that the economy was on strong footing.
As interest rates rose during the reporting period’s first half, so did yields of short-term fixed-income securities. At the time, the fund received especially strong contributions from short-duration commercial mortgage-backed securities and short-term corporate bonds, which gained value as business conditions improved.The fund’s TIPS positions also fared well amid stronger economic growth and, in early 2005, from intensifying inflation concerns.
However, investors’ inflation worries proved to be relatively short-lived. By the spring, it had become apparent that higher energy and commodity prices were being offset by lower prices in other areas of the economy, such as discounts from automobile manufacturers and apparel retailers. Employment gains proved to be more gradual than some investors had feared, suggesting that wage inflation remain contained. Nonetheless, the Fed continued to raise short-term interest rates, and the overnight federal funds rate reached 3.25% by the end of the reporting period.
After assuming responsibility for the fund’s management on January 31, 2005, we repositioned the fund slightly by adjusting its average duration toward a point that was slightly shorter than industry averages.We fine-tuned the fund’s sector allocation and security selection by upgrading its credit profile and increasing its exposure to higher-yielding asset-backed securities toward the lower end of the investment-grade range.
We also increased the fund’s holdings of floating-rate corporate securities on which yields are reset on a monthly or quarterly basis, which helped keep funds available for higher-yielding securities as they became available. While these strategies helped increase the fund’s exposure to some of the better-performing areas of the short-term fixed-income marketplace, the fund’s relative performance was compromised during market rallies by its slightly shorter-than-average duration.
What is the fund’s current strategy?
We recently have seen evidence that the U.S. economy continues to grow and interest rates are likely to rise further. Indeed, shortly after the reporting period’s end, the Fed implemented its tenth consecutive rate hike, and more are expected over the remainder of 2005. Accordingly, we have continued to set the fund’s average duration in a range that is slightly shorter than industry averages. We also focus on asset-backed securities and floating-rate corporate securities with solid credit characteristics. In our view, these are prudent strategies until the Fed signals that it is ready to move on to the next phase of the credit cycle.
| 1 | | Total return includes reinvestment of dividends and any capital gains paid, and does not take into |
| | | consideration the maximum initial sales charge in the case of Class A shares, or the applicable |
| | | contingent deferred sales charges imposed on redemptions in the case of Class B and Class S |
| | | shares. Had these charges been reflected, returns would have been lower. Past performance is no |
| | | guarantee of future results. Share price, yield and investment return fluctuate such that upon |
| | | redemption, fund shares may be worth more or less than their original cost. Return figures |
| | | provided reflect the absorption of certain fund expenses by The Dreyfus Corporation pursuant to |
| | | an agreement in effect through January 31, 2006, at which time it may be extended, terminated |
| | | or modified. Had these expenses not been absorbed, the fund’s returns would have been lower. |
| 2 | | SOURCE: BLOOMBERG L.P. — Reflects reinvestment of dividends and, where applicable, |
| | | capital gain distributions.The Citigroup 1-Year Treasury Benchmark-on-the-Run Index is an |
| | | unmanaged index generally representative of the average yield on 1-year U.S.Treasury bills.The |
| | | index does not take into account charges, fees and other expenses.Total return is calculated on a |
| | | month-end basis. |
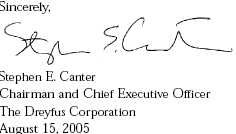
Comparison of change in value of $10,000 investment in Dreyfus Premier Yield Advantage Fund Class A shares, Class B shares, Class D shares, Class P shares and Class S shares and the Citigroup 1-Year Treasury Benchmark-on-the-Run Index
| † Source: Bloomberg L.P. |
| Past performance is not predictive of future performance. |
| The above graph compares a $10,000 investment made in Class A, Class B, Class D, Class P and Class S shares of |
| Dreyfus Premier Yield Advantage Fund on 11/15/01 (inception date for Class D) to a $10,000 investment made in |
| the Citigroup 1-Year Treasury Benchmark-on-the-Run Index (the “Index”) on that date. For comparative purposes, the |
| value of the Index on 11/30/01 is used as the beginning value on 11/15/01. All dividends and capital gain |
| distributions are reinvested. Performance for Class A, B, P and S shares of the fund shown above represent the |
| performance of the fund’s Class D shares from the inception date to November 1, 2002 (the inception date for Class A, |
| B, P and S shares), and are adjusted to reflect the applicable sales load of that class. Performance for each share class does |
| not include differences in distribution/servicing fees prior to November 1, 2002, which would have lowered the |
| performance for Class A, B, P and S shares. |
| The fund’s performance shown in the line graph above takes into account the maximum initial sales charge on Class A |
| shares, the applicable contingent deferred sales charge on Class B and Class S shares and all other applicable fees and |
| expenses on all classes.The fund invests primarily in investment-grade fixed-income securities of U.S. and foreign issuers |
| and seeks to maintain an average effective duration of one year or less.The Index is an unmanaged index generally |
| representative of the average yield on 1-year U.S.Treasury bills.The Index does not take into account charges, fees and |
| other expenses. Further information relating to fund performance, including expense reimbursements, if applicable, is |
| contained in the Financial Highlights section of the prospectus and elsewhere in this report. |
| Average Annual Total Returns as of 7/31/05 | | | | |
| |
| | | Inception | | | | From |
| | | Date | | 1 Year | | Inception |
| |
| |
| |
|
| Class A shares | | | | | | |
| with maximum sales charge (2.0%) | | 11/15/01 | | 0.10% | | 1.56% |
| without sales charge | | 11/15/01 | | 2.13% | | 2.10% |
| Class B shares | | | | | | |
| with applicable redemption charge † | | 11/15/01 | | (2.61%) | | 0.63% |
| without redemption | | 11/15/01 | | 1.37% | | 1.40% |
| Class D shares | | 11/15/01 | | 2.13% | | 1.82% |
| Class P shares | | 11/15/01 | | 2.14% | | 1.96% |
| Class S shares | | | | | | |
| with applicable redemption charge †† | | 11/15/01 | | (0.61%) | | 1.52% |
| without redemption | | 11/15/01 | | 1.88% | | 1.77% |
Past performance is not predictive of future performance.The fund’s performance shown in the graph and table does not reflect the deduction of taxes that a shareholder would pay on fund distributions or the redemption of fund shares.The performance figures for Class A, Class B, Class P and Class S shares shown in the table include the performance of Class D shares from November 15, 2001, to November 1, 2002, and are adjusted to reflect the applicable sales load of that class but do not include current distribution/servicing fees of each share class during that period.
| † | | The maximum contingent deferred sales charge for Class B shares is 4%. After six years Class B shares convert to |
| | | Class A shares. |
| †† | | The maximum contingent deferred sales charge for Class S shares is 2.50%. After six years Class S shares convert to |
| | | Class A shares. |
UNDERSTANDING YOUR FUND’S EXPENSES (Unaudited)
As a mutual fund investor, you pay ongoing expenses, such as management fees and other expenses. Using the information below, you can estimate how these expenses affect your investment and compare them with the expenses of other funds.You also may pay one-time transaction expenses, including sales charges (loads) and redemption fees, which are not shown in this section and would have resulted in higher total expenses. For more information, see your fund’s prospectus or talk to your financial adviser.
Review your fund’s expenses
The table below shows the expenses you would have paid on a $1,000 investment in Dreyfus Premier Yield Advantage Fund from February 1, 2005 to July 31, 2005. It also shows how much a $1,000 investment would be worth at the close of the period, assuming actual returns and expenses.
| Expenses and Value of a $1,000 Investment | | | | | | |
| assuming actual returns for the six months ended July 31, 2005 | | | | |
| | | Class A | | Class B | | Class D | | Class P | | Class S |
| |
| |
| |
| |
| |
|
| Expenses paid per $1,000 † | | $ 3.94 | | $ 7.66 | | $ 3.94 | | $ 3.94 | | $ 5.18 |
| Ending value (after expenses) | | $1,009.60 | | $1,005.80 | | $1,009.50 | | $1,009.60 | | $1,008.30 |
COMPARING YOUR FUND’S EXPENSES WITH THOSE OF OTHER FUNDS (Unaudited)
Using the SEC’s method to compare expenses
The Securities and Exchange Commission (SEC) has established guidelines to help investors assess fund expenses. Per these guidelines, the table below shows your fund’s expenses based on a $1,000 investment, assuming a hypothetical 5% annualized return. You can use this information to compare the ongoing expenses (but not transaction expenses or total cost) of investing in the fund with those of other funds.All mutual fund shareholder reports will provide this information to help you make this comparison. Please note that you cannot use this information to estimate your actual ending account balance and expenses paid during the period.
Expenses and Value of a $1,000 Investment assuming a hypothetical 5% annualized return for the six months ended July 31, 2005
| | | Class A | | Class B | | Class D | | Class P | | Class S |
| |
| |
| |
| |
| |
|
| Expenses paid per $1,000 † | | $ 3.96 | | $ 7.70 | | $ 3.96 | | $ 3.96 | | $ 5.21 |
| Ending value (after expenses) | | $1,020.88 | | $1,017.16 | | $1,020.88 | | $1,020.88 | | $1,019.64 |
† Expenses are equal to the fund’s annualized expense ratio of .79% for Class A, 1.54% for Class B, .79% for Class D, .79% for Class P and 1.04% for Class S; multiplied by the average account value over the period, multiplied by 181/365 (to reflect the one-half year period).
| STATEMENT OF INVESTMENTS |
| July 31, 2005 |
| | | Principal | | | | |
| Bonds and Notes—99.2% | | Amount ($) | | Value ($) |
| |
| |
|
| Aerospace & Defense—.5% | | | | | | |
| Raytheon, | | | | | | |
| Notes, 6.75%, 2007 | | 800,000 | | | | 832,627 |
| Asset-Backed Ctfs./Automobile Receivables—3.6% | | | | |
| Harley-Davidson Motorcycle Trust, | | | | | | |
| Ser. 2005-2, Cl. A2, 4.07%, 2012 | | 800,000 | | | | 793,375 |
| USAA Auto Owner Trust, | | | | | | |
| Ser. 2005-2, Cl. A4, 4.17%, 2011 | | 750,000 | | | | 743,004 |
| WFS Financial Owner Trust: | | | | | | |
| Ser. 2005-1, Cl. A3, 3.59%, 2009 | | 2,675,000 | | | | 2,644,559 |
| Ser. 2005-2, Cl. A4, 4.39%, 2012 | | 1,500,000 | | | | 1,499,087 |
| | | | | | | 5,680,025 |
| Asset-Backed Ctfs./Credit Cards—1.7% | | | | |
| Chase Issuance Trust, | | | | | | |
| Ser. 2005-C1, Cl. C1, 3.758%, 2012 | | 1,250,000 | | a | | 1,249,163 |
| Providian Gateway Master Trust, | | | | | | |
| Ser. 2004-DA, Cl. A, 3.35%, 2011 | | 1,480,000 | | b | | 1,446,006 |
| | | | | | | 2,695,169 |
| Asset-Backed Ctfs./Home Equity Loans—12.2% | | | | |
| ACE Securities, | | | | | | |
| Ser. 2005-HE2, Cl. A2B, 3.66%, 2035 | | 2,500,000 | | a | | 2,500,239 |
| Accredited Mortgage Loan Trust, | | | | | | |
| Ser. 2005-2, Cl. A2A, 3.56%, 2035 | | 1,902,203 | | a | | 1,902,779 |
| Asset-Backed Securities Corp. Home Equity, | | | | |
| Ser. 2004-HE3, Cl. M2, 4.58%, 2034 | | 1,750,000 | | a | | 1,770,055 |
| Bear Stearns Asset-Backed Securities, | | | | | | |
| Ser. 2005-HE4, Cl. 1A1, 3.56%, 2035 | | 1,684,249 | | a | | 1,685,389 |
| Centex Home Equity, | | | | | | |
| Ser. 2005-B, Cl. AF2, 4.24%, 2035 | | 655,000 | | | | 649,695 |
| Conseco Finance, | | | | | | |
| Ser. 2001-D, Cl. A4, 5.53%, 2032 | | 464,569 | | | | 466,065 |
| Fremont Home Loan Trust, | | | | | | |
| Ser. 2005-1, Cl. 2A1, 3.56%, 2035 | | 1,586,403 | | a | | 1,588,316 |
| GSAA Home Equity Trust: | | | | | | |
| Ser. 2004-5, Cl. AF2, 4.736%, 2034 | | 1,612,000 | | | | 1,610,049 |
| Ser. 2005-3, Cl. A1, 3.59%, 2034 | | 1,106,066 | | a | | 1,106,066 |
| Merrill Lynch Mortgage Investors, | | | | | | |
| Ser. 2004-HE2, Cl. A1A, 3.86%, 2035 | | 1,682,879 | | a | | 1,688,873 |
| | STATEMENT OF INVESTMENTS (continued)
|
| | | Principal | | | | |
| Bonds and Notes (continued) | | Amount ($) | | Value ($) |
| |
| |
|
| Asset-Backed Ctfs./Home Equity Loans (continued) | | | | |
| Option One Mortgage Loan Trust: | | | | | | |
| Ser. 2003-5, Cl. M1, 4.11%, 2033 | | 1,000,000 | | a | | 1,005,788 |
| Ser. 2004-1, Cl. A2, 3.75%, 2034 | | 1,442,785 | | a | | 1,444,627 |
| Residential Asset Securities, | | | | | | |
| Ser. 2005-EMX1, Cl. AI1, 3.56%, 2035 | | 1,619,932 | | a | | 1,621,145 |
| | | | | | | 19,039,086 |
| Asset-Backed Ctfs./Manufactured Housing—.7% | | | | |
| Green Tree Financial, | | | | | | |
| Ser. 1994-7, Cl. M1, 9.25%, 2020 | | 982,731 | | | | 1,045,451 |
| Asset-Backed Ctfs./Other—8.9% | | | | | | |
| Citigroup Mortgage Loan Trust, | | | | | | |
| Ser. 2005-OPT1, Cl. A1B, 3.67%, 2035 | | 2,500,000 | | a | | 2,503,723 |
| Morgan Stanley ABS Capital I: | | | | | | |
| Ser. 2004-NC8, Cl. A2A, 3.63%, 2013 | | 867,146 | | a | | 867,441 |
| Ser. 2004-WMC2, Cl. A2, 3.82%, 2034 | | 784,176 | | a | | 784,651 |
| Park Place Securities, | | | | | | |
| Ser. 2005-WHQ1, Cl. A3A, 3.57% 2035 | | 1,951,820 | | a | | 1,953,843 |
| Saxon Asset Securities Trust, | | | | | | |
| Ser. 2005-2, Cl. A2B, 3.62%, 2035 | | 1,700,000 | | a | | 1,700,624 |
| Securitized Asset-Backed Receivables Trust, | | | | |
| Ser. 2005-OP1, Cl. A2B, 3.64%, 2035 | | 4,500,000 | | a | | 4,502,802 |
| Specialty Underwriting & Residential Finance, | | | | |
| Ser. 2005-BC2, Cl. A2B, 3.68%, 2035 | | 1,700,000 | | a | | 1,703,366 |
| | | | | | | 14,016,450 |
| Asset-Backed Ctfs./Utilities—1.3% | | | | | | |
| PECO Energy Transition Trust, | | | | | | |
| Ser. 1999-A, Cl. A6, 6.05%, 2009 | | 955,000 | | | | 971,203 |
| PG&E Energy Recovery Funding, | | | | | | |
| Ser. 2005-1, Cl. A2, 3.87%, 2011 | | 1,000,000 | | | | 990,612 |
| | | | | | | 1,961,815 |
| Automotive—.6% | | | | | | |
| DaimlerChrysler, | | | | | | |
| Notes, 4.125%, 2007 | | 915,000 | | | | 906,542 |
| Banking—6.2% | | | | | | |
| Abbey National, | | | | | | |
| Sub. Notes, 6.69%, 2005 | | 4,000,000 | | | | 4,023,988 |
| City National Bank, | | | | | | |
| Sub. Notes, 6.375%, 2008 | | 721,000 | | | | 749,997 |
10
| | | Principal | | | | |
| Bonds and Notes (continued) | | Amount ($) | | Value ($) |
| |
| |
|
| Banking (continued) | | | | | | |
| Washington Mutual: | | | | | | |
| Notes, 3.36%, 2007 | | 2,500,000 | | a | | 2,499,175 |
| Sr. Notes, 7.25%, 2005 | | 2,500,000 | | | | 2,502,785 |
| | | | | | | 9,775,945 |
| Cable/Media—3.7% | | | | | | |
| News America, | | | | | | |
| Sr. Notes, 6.625%, 2008 | | 800,000 | | c | | 836,371 |
| TCI Communications, | | | | | | |
| Sr. Notes, 8%, 2005 | | 3,145,000 | | | | 3,145,000 |
| Univision Communications, | | | | | | |
| Sr. Notes, 2.875%, 2006 | | 1,900,000 | | | | 1,858,170 |
| | | | | | | 5,839,541 |
| Diversified Financial Services—18.1% | | | | |
| Amvescap, | | | | | | |
| Sr. Notes, 5.9%, 2007 | | 1,125,000 | | | | 1,147,195 |
| Bear Stearns, | | | | | | |
| Notes, Ser. B, 3.359%, 2008 | | 2,500,000 | | a | | 2,502,678 |
| CIT, | | | | | | |
| Notes, 3.49%, 2007 | | 2,500,000 | | a | | 2,507,995 |
| Capital One Bank, | | | | | | |
| Notes, 4.875%, 2008 | | 600,000 | | | | 603,702 |
| Countrywide Financial, | | | | | | |
| Notes, Ser. A, 3.71%, 2007 | | 2,000,000 | | | | 2,002,254 |
| Credit Suisse First Boston USA, | | | | | | |
| Sr. Notes, 4.625%, 2008 | | 845,000 | | | | 847,767 |
| Goldman Sachs, | | | | | | |
| Notes, 3.778%, 2010 | | 2,000,000 | | a | | 2,004,888 |
| HSBC Finance, | | | | | | |
| Notes, 3.48%, 2010 | | 1,800,000 | | a,c | | 1,801,913 |
| International Lease Finance, | | | | | | |
| Notes, Ser. P, 4%, 2010 | | 2,000,000 | | a,c | | 1,998,520 |
| John Deere Capital, | | | | | | |
| Notes, Ser. D, 3.875%, 2007 | | 1,000,000 | | | | 991,608 |
| Lehman Brothers: | | | | | | |
| Notes, Ser. G, 3.48%, 2009 | | 2,000,000 | | a | | 2,007,778 |
| Notes, Ser. G, 4.25%, 2010 | | 800,000 | | | | 785,766 |
| MBNA, | | | | | | |
| Notes, Ser. F, 3.64%, 2008 | | 1,000,000 | | a | | 1,009,040 |
| | STATEMENT OF INVESTMENTS (continued)
|
| | | Principal | | | | |
| Bonds and Notes (continued) | | Amount ($) | | Value ($) |
| |
| |
|
| Diversified Financial Services (continued) | | | | | | |
| Merrill Lynch & Co., | | | | | | |
| Notes, Ser. C, 3.439%, 2010 | | 1,900,000 | | a | | 1,904,197 |
| Morgan Stanley, | | | | | | |
| Sr. Notes, Ser. F, 3.734%, 2008 | | 2,000,000 | | a | | 2,002,090 |
| Residential Capital, | | | | | | |
| Notes, 4.835%, 2007 | | 1,190,000 | | a,b | | 1,191,883 |
| SLM, | | | | | | |
| Notes, Ser. A, 3.811%, 2009 | | 1,750,000 | | a | | 1,751,293 |
| Textron Financial, | | | | | | |
| Notes, Ser. E, 4.125%, 2008 | | 1,255,000 | | | | 1,242,835 |
| | | | | | | 28,303,402 |
| Food & Beverages—2.2% | | | | | | |
| Cadbury Schweppes, | | | | | | |
| Notes, 3.875%, 2008 | | 1,130,000 | | b | | 1,104,258 |
| Kroger, | | | | | | |
| Sr. Notes, 7.625%, 2006 | | 770,000 | | | | 795,900 |
| Miller Brewing, | | | | | | |
| Notes, 4.25%, 2008 | | 1,575,000 | | b | | 1,555,876 |
| | | | | | | 3,456,034 |
| Foreign Governmental—1.9% | | | | | | |
| United Mexican States, | | | | | | |
| Notes, Ser. A, 4.27%, 2009 | | 3,000,000 | | a,c | | 3,048,750 |
| Industrial—1.6% | | | | | | |
| Tyco International, | | | | | | |
| Notes, 5.8%, 2006 | | 2,500,000 | | | | 2,535,078 |
| Oil & Gas—4.7% | | | | | | |
| Atmos Energy, | | | | | | |
| Notes, 3.974%, 2007 | | 2,822,000 | | a | | 2,828,584 |
| Ocean Energy, | | | | | | |
| Sr. Notes, 4.375%, 2007 | | 1,279,000 | | | | 1,271,387 |
| Sempra Energy, | | | | | | |
| Sr. Notes, 4.621%, 2007 | | 1,500,000 | | | | 1,500,141 |
| Southern California Gas, | | | | | | |
| First Mortgage Bonds, Ser. I, 3.52%, 2009 | | 1,680,000 | | a | | 1,683,510 |
| | | | | | | 7,283,622 |
| Residential Mortgage Pass-Through Ctfs.—9.3% | | | | |
| Adjustable Rate Mortgage Trust: | | | | | | |
| Ser. 2005-3, Cl. 8A2, 3.7%, 2035 | | 1,749,357 | | a | | 1,750,496 |
| Ser. 2005-7, Cl. 7A21, 3.71%, 2035 | | 865,760 | | a | | 863,336 |
12
| | | Principal | | | | |
| Bonds and Notes (continued) | | Amount ($) | | Value ($) |
| |
| |
|
| Residential Mortgage Pass-Through Ctfs. (continued) | | | | |
| Countrywide Alternative Loan Trust: | | | | | | |
| Ser. 2004-7T1, Cl. A1, 5.75%, 2034 | | 3,896,772 | | | | 3,918,753 |
| Ser. 2005-J4, Cl. 2A1B, 3.58%, 2035 | | 1,387,396 | | a | | 1,386,261 |
| Countrywide Home Loans, | | | | | | |
| Ser. 2004-21, Cl. A8, 8%, 2034 | | 2,308,736 | | | | 2,354,911 |
| GSR Mortgage Loan Trust, | | | | | | |
| Ser. 2004-15F, Cl. 2A2, 5%, 2034 | | 2,176,937 | | | | 2,164,833 |
| Impac CMB Trust, | | | | | | |
| Ser. 2005-4, Ser. 1M3, 3.94%, 2035 | | 801,360 | | a | | 800,358 |
| Structured Adjustable Rate Mortgage Loan Trust, | | | | |
| Ser. 2005-8XS, Cl. A1, 3.56%, 2035 | | 1,383,502 | | a | | 1,383,502 |
| | | | | | | 14,622,450 |
| Telecommunications—2.6% | | | | | | |
| British Telecommunications, | | | | | | |
| Notes, 7.875%, 2005 | | 4,000,000 | | a | | 4,055,936 |
| Transportation—1.3% | | | | | | |
| Norfolk Southern, | | | | | | |
| Notes, Ser. A, 7.22%, 2006 | | 2,000,000 | | | | 2,065,954 |
| U.S. Government—5.6% | | | | | | |
| U.S. Treasury Inflation Protected Securities, | | | | | | |
| 3.625%, 1/15/2008 | | 8,375,316 | | d | | 8,778,086 |
| U.S. Government Agencies/Mortgage-Backed—9.2% | | | | |
| Federal Home Loan Mortgage Corp.: | | | | | | |
| REMIC Trust, Gtd. Multiclass Mortgage Participation Ctfs.: | | | | |
| Ser. 2443, Cl. TD, 6.5%, 10/15/2030 | | 2,540,070 | | | | 2,553,202 |
| Ser. 2503, Cl. VD, 6%, 2/15/2021 | | 3,000,000 | | | | 3,062,280 |
| Ser. 2535, Cl. PL, 4%, 6/15/2029 | | 983,377 | | | | 980,672 |
| Structured Pass-Through Securities, | | | | | | |
| Ser. H005, Cl. A2, 2.55%, 8/15/2007 | | 1,075,650 | | | | 1,070,091 |
| Federal National Mortgage Association: | | | | | | |
| REMIC Trust, Gtd. Pass-Through Ctfs.: | | | | | | |
| Ser. 2002-55, Cl. GD, 5.5%, 11/25/2015 | | 1,053,957 | | | | 1,056,452 |
| Ser. 2003-49, Cl. JE, 3%, 4/25/2033 | | 2,287,908 | | | | 2,166,326 |
| Ser. 2005-13, Cl. PA, 5%, 3/25/2027 | | 1,954,551 | | | | 1,965,842 |
| Government National Mortgage Association I: | | | | | | |
| Ser. 2005-50, Cl. A, 4.015%, 11/16/2010 | | 1,175,000 | | | | 1,151,867 |
| Ser. 2002-52, Cl. AG, 6%, 9/20/2029 | | 456,223 | | | | 456,680 |
| | | | | | | 14,463,412 |
| | STATEMENT OF INVESTMENTS (continued)
|
| | | Principal | | | | |
| Bonds and Notes (continued) | | Amount ($) | | Value ($) |
| |
| |
|
| Utilities/Gas & Electric—3.3% | | | | | | |
| Appalachian Power, | | | | | | |
| Notes, 3.81%, 2007 | | 1,125,000 | | a | | 1,128,409 |
| Duke Energy, | | | | | | |
| Sr. Notes, Ser. B, 3.82%, 2005 | | 2,000,000 | | a | | 2,000,398 |
| Georgia Power, | | | | | | |
| Notes, Ser. U, 3.45%, 2009 | | 2,000,000 | | a | | 2,006,110 |
| | | | | | | 5,134,917 |
| Total Bonds and Notes | | | | | | |
| (cost $156,201,205) | | | | | | 155,540,292 |
| |
| |
| |
|
| |
| Investment of Cash Collateral | | | | | | |
| for Securities Loaned—4.6% | | Shares | | | | Value ($) |
| |
| |
| |
|
| Registered Investment Company; | | | | | | |
| Dreyfus Institutional Cash Advantage Plus Fund | | | | |
| (cost $7,164,000) | | 7,164,000 | | e | | 7,164,000 |
| |
| |
| |
|
| |
| Total Investments (cost $163,365,205) | | 103.8% | | | | 162,704,292 |
| Liabilities, Less Cash and Receivables | | (3.8%) | | (5,954,950) |
| Net Assets | | 100.0% | | | | 156,749,342 |
| a | | Variable rate security-interest rate subject to periodic change. | | |
| b | | Securities exempt from registration under Rule 144A of the Securities Act of 1933.These securities may be resold in |
| | | transactions exempt from registration, normally to qualified institutional buyers. At July 31, 2005, these securities |
| | | amounted to $5,298,023 or 3.4% of net assets. | | | | |
| c | | All or a portion of these securities are on loan. At July 31, 2005, the total market value of the fund’s securities on |
| | | loan is $7,004,142 and the total market value of the collateral held by the fund is $7,164,000. | | |
| d | | Principal amount for accrual purposes is periodically adjusted based on changes in the Consumer Price Index. |
| e | | Investment in affiliated money market mutual fund. | | | | |
| |
| |
| |
|
| |
| |
| |
| |
| Portfolio Summary † | | | | | | |
| |
| | | | | Value (%) | | Value (%) |
| |
| |
| |
|
| Corporate Bonds | | 44.8 | | Short-Term/Money Market Investments | | 4.6 |
| Mortgage/Asset Backed Securities | | 37.7 | | Foreign Governmental | | 1.9 |
| U.S. Government/Agency Securities | | 14.8 | | | | 103.8 |
| |
| † | | Based on net assets. | | | | | | |
| See notes to financial statements. | | | | | | |
14
STATEMENT OF ASSETS AND LIABILITIES
July 31, 2005
| | | Cost | | Value |
| |
| |
|
| Assets ($): | | | | |
| Investments in securities— | | | | |
| See Statement of Investments (including securities | | |
| on loan, valued at $7,004,142)—Note 1(b): | | |
| Unaffiliated issuers | | 156,201,205 | | 155,540,292 |
| Affiliated issuers | | 7,164,000 | | 7,164,000 |
| Cash | | | | 114,465 |
| Receivable for investment securities sold | | 2,003,340 |
| Dividends and interest receivable | | 1,046,122 |
| Receivable for shares of Common Stock subscribed | | 250,000 |
| Prepaid expenses | | | | 22,960 |
| | | | | 166,141,179 |
| |
| |
|
| Liabilities ($): | | | | |
| Due to The Dreyfus Corporation and affiliates—Note 3(c) | | | | 101,090 |
| Liability for securities on loan—Note 1(b) | | | | | | 7,164,000 |
| Payable for investment securities purchased | | | | | | 1,750,000 |
| Payable for shares of Common Stock redeemed | | | | | | 313,543 |
| Accrued expenses | | | | | | | | | | 63,204 |
| | | | | | | | | | | 9,391,837 |
| |
| |
| |
| |
| |
|
| Net Assets ($) | | | | | | | | 156,749,342 |
| |
| |
| |
| |
|
| Composition of Net Assets ($): | | | | | | | | |
| Paid-in capital | | | | | | | | 170,125,608 |
| Accumulated distributions in excess of investment income—net | | | | (101,891) |
| Accumulated net realized gain (loss) on investments | | | | (12,613,462) |
| Accumulated net unrealized appreciation | | | | | | |
| (depreciation) on investments | | | | | | | | (660,913) |
| |
| |
| |
| |
|
| Net Assets ($) | | | | | | | | 156,749,342 |
| |
| |
| |
| |
|
| |
| |
| Net Asset Value Per Share | | | | | | | | |
| | | Class A | | Class B | | Class D | | Class P | | Class S |
| |
| |
| |
| |
| |
|
| Net Assets ($) | | 5,314,068 | | 4,224,574 | | 121,005,939 | | 25,681,720 | | 523,041 |
| Shares Outstanding | | 2,712,346 | | 2,171,472 | | 62,331,158 | | 13,201,411 | | 268,774 |
| |
| |
| |
| |
| |
|
| Net Asset Value | | | | | | | | | | |
| Per Share ($) | | 1.96 | | 1.95 | | 1.94 | | 1.95 | | 1.95 |
| |
| See notes to financial statements. | | | | | | | | |
The Fund 15
| STATEMENT OF OPERATIONS |
| Year Ended July 31, 2005 |
| Investment Income ($): | | |
| Income: | | |
| Interest | | 5,325,228 |
| Dividends; | | |
| Affiliated issuers | | 336,033 |
| Income from securities lending | | 7,420 |
| Total Income | | 5,668,681 |
| Expenses: | | |
| Management fee—Note 3(a) | | 949,745 |
| Shareholder servicing costs—Note 3(c) | | 589,125 |
| Registration fees | | 62,799 |
| Distribution fees—Note 3(b) | | 39,433 |
| Professional fees | | 29,167 |
| Prospectus and shareholders’ reports | | 20,883 |
| Custodian fees—Note 3(c) | | 20,835 |
| Directors’ fees and expenses—Note 3(d) | | 5,061 |
| Interest expense—Note 2 | | 2,476 |
| Miscellaneous | | 17,432 |
| Total Expenses | | 1,736,956 |
| Less—reduction in management fee | | |
| due to undertaking—Note 3(a) | | (175,457) |
| Less—reduction in custody fees | | |
| due to earnings credits—Note 1(b) | | (10,514) |
| Net Expenses | | 1,550,985 |
| Investment Income—Net | | 4,117,696 |
| |
|
| Realized and Unrealized Gain (Loss) on Investments—Note 4 ($): |
| Net realized gain (loss) on investments | | 1,462,601 |
| Net realized gain (loss) on financial futures | | (740,842) |
| Net realized gain (loss) on options transactions | | (4,225) |
| Net Realized Gain (Loss) | | 717,534 |
| Net unrealized appreciation (depreciation) on investments | | |
| (including $141,734 net unrealized appreciation on financial futures) | | (1,091,463) |
| Net Realized and Unrealized Gain (Loss) on Investments | | (373,929) |
| Net Increase in Net Assets Resulting from Operations | | 3,743,767 |
| | See notes to financial statements.
|
STATEMENT OF CHANGES IN NET ASSETS
| | | | | Year Ended July 31, |
| |
| |
|
| | | 2005 | | 2004 |
| |
| |
|
| Operations ($): | | | | |
| Investment income—net | | 4,117,696 | | 5,992,285 |
| Net realized gain (loss) on investments | | 717,534 | | (6,838,723) |
| Net unrealized appreciation | | | | |
| (depreciation) on investments | | (1,091,463) | | 3,273,168 |
| Net Increase (Decrease) in Net Assets | | | | |
| Resulting from Operations | | 3,743,767 | | 2,426,730 |
| |
| |
|
| Dividends to Shareholders from ($): | | | | |
| Investment income—net: | | | | |
| Class A | | (170,131) | | (196,164) |
| Class B | | (90,325) | | (75,186) |
| Class D | | (3,697,468) | | (5,307,042) |
| Class P | | (865,678) | | (1,880,679) |
| Class S | | (17,178) | | (22,180) |
| Total Dividends | | (4,840,780) | | (7,481,251) |
| |
| |
|
| Capital Stock Transactions ($): | | | | |
| Net proceeds from shares sold: | | | | |
| Class A | | 2,396,814 | | 7,292,038 |
| Class B | | 1,225,638 | | 4,442,659 |
| Class D | | 34,551,370 | | 119,607,617 |
| Class P | | 17,514,232 | | 89,956,479 |
| Class S | | 57,260 | | 167,151 |
| Dividends reinvested: | | | | |
| Class A | | 138,193 | | 147,387 |
| Class B | | 79,817 | | 68,969 |
| Class D | | 3,408,117 | | 4,767,427 |
| Class P | | 723,331 | | 1,536,577 |
| Class S | | 15,176 | | 19,870 |
| Cost of shares redeemed: | | | | |
| Class A | | (4,518,454) | | (11,780,610) |
| Class B | | (3,395,119) | | (3,380,447) |
| Class D | | (93,351,771) | | (257,235,276) |
| Class P | | (35,479,950) | | (172,385,851) |
| Class S | | (470,228) | | (765,618) |
| Increase (Decrease) in Net Assets from | | | | |
| Capital Stock Transactions | | (77,105,574) | | (217,541,628) |
| Total Increase (Decrease) in Net Assets | | (78,202,587) | | (222,596,149) |
| |
| |
|
| Net Assets ($): | | | | |
| Beginning of Period | | 234,951,929 | | 457,548,078 |
| End of Period | | 156,749,342 | | 234,951,929 |
| Undistributed (distributions in excess of) | | | | |
| investment income—net | | (101,891) | | 23,828 |
The Fund 17
| | STATEMENT OF CHANGES IN NET ASSETS (continued)
|
| | | | | Year Ended July 31, |
| |
| |
|
| | | 2005 | | 2004 |
| |
| |
|
| Capital Share Transactions: | | | | |
| Class A a | | | | |
| Shares sold | | 1,215,520 | | 3,685,593 |
| Shares issued for dividends reinvested | | 70,253 | | 74,285 |
| Shares redeemed | | (2,296,746) | | (5,943,597) |
| Net Increase (Decrease) in Shares Outstanding | | (1,010,973) | | (2,183,719) |
| |
| |
|
| Class B a | | | | |
| Shares sold | | 627,193 | | 2,252,897 |
| Shares issued for dividends reinvested | | 40,852 | | 35,007 |
| Shares redeemed | | (1,734,725) | | (1,715,111) |
| Net Increase (Decrease) in Shares Outstanding | | (1,066,680) | | 572,793 |
| |
| |
|
| Class D | | | | |
| Shares sold | | 17,705,733 | | 60,692,419 |
| Shares issued for dividends reinvested | | 1,747,815 | | 2,425,769 |
| Shares redeemed | | (47,848,738) | | (130,929,291) |
| Net Increase (Decrease) in Shares Outstanding | | (28,395,190) | | (67,811,103) |
| |
| |
|
| Class P | | | | |
| Shares sold | | 8,966,315 | | 45,543,345 |
| Shares issued for dividends reinvested | | 370,198 | | 779,176 |
| Shares redeemed | | (18,156,486) | | (87,460,581) |
| Net Increase (Decrease) in Shares Outstanding | | (8,819,973) | | (41,138,060) |
| |
| |
|
| Class S | | | | |
| Shares sold | | 29,214 | | 84,438 |
| Shares issued for dividends reinvested | | 7,766 | | 10,081 |
| Shares redeemed | | (240,563) | | (388,444) |
| Net Increase (Decrease) in Shares Outstanding | | (203,583) | | (293,925) |
| a | | During the period ended July 31, 2005, 164,339 Class B shares representing $321,680 were automatically |
| | | converted to 163,167 Class A shares and during the period ended July 31, 2004, 155,565 Class B shares |
| | | representing $306,308 were automatically converted to 154,765 Class A shares. |
| See notes to financial statements. |
FINANCIAL HIGHLIGHTS
The following tables describe the performance for each share class for the fiscal periods indicated.All information (except portfolio turnover rate) reflects financial results for a single fund share.Total return shows how much your investment in the fund would have increased (or decreased) during each period, assuming you had reinvested all dividends and distributions.These figures have been derived from the fund’s financial statements.
| | | | | | | Year Ended July 31, | | |
| | | |
| |
| |
|
| Class A Shares | | 2005 | | 2004 | | 2003 a |
| |
| |
| |
|
| Per Share Data ($): | | | | | | |
| Net asset value, beginning of period | | 1.97 | | 2.00 | | 2.00 |
| Investment Operations: | | | | | | |
| Investment income—net b | | .04 | | .03 | | .03 |
| Net realized and unrealized | | | | | | |
| gain (loss) on investments | | .00c | | (.02) | | .01 |
| Total from Investment Operations | | .04 | | .01 | | .04 |
| Distributions: | | | | | | |
| Dividends from investment income—net | | (.05) | | (.04) | | (.04) |
| Net asset value, end of period | | 1.96 | | 1.97 | | 2.00 |
| |
| |
| |
|
| Total Return (%) d | | 2.13 | | .49 | | 1.88e |
| |
| |
| |
|
| Ratios/Supplemental Data (%): | | | | | | |
| Ratio of total expenses to average net assets | | .91 | | .90 | | 1.01f |
| Ratio of net expenses to average net assets | | .80 | | .80 | | .80f |
| Ratio of net investment income | | | | | | |
| to average net assets | | 2.20 | | 1.61 | | 1.48f |
| Portfolio Turnover Rate | | 211.75 | | 309.23 | | 371.43 |
| |
| |
| |
|
| Net Assets, end of period ($ x 1,000) | | 5,314 | | 7,339 | | 11,802 |
| |
| a | | From November 1, 2002 (commencement of initial offering) to July 31, 2003. | | | | |
| b | | Based on average shares outstanding at each month end. | | | | |
| c | | Amount represents less than $.01 per share. | | | | | | |
| d | | Exclusive of sales charge. | | | | | | |
| e | | Not annualized. | | | | | | |
| f | | Annualized. | | | | | | |
| See notes to financial statements. | | | | | | |
FINANCIAL HIGHLIGHTS (continued)
|
| | | | | | | Year Ended July 31, | | |
| | | |
| |
| |
|
| Class B Shares | | 2005 | | 2004 | | 2003 a |
| |
| |
| |
|
| Per Share Data ($): | | | | | | |
| Net asset value, beginning of period | | 1.96 | | 1.98 | | 2.00 |
| Investment Operations: | | | | | | |
| Investment income—net b | | .03 | | .02 | | .01 |
| Net realized and unrealized | | | | | | |
| gain (loss) on investments | | .00c | | (.02) | | .00c |
| Total from Investment Operations | | .03 | | — | | .01 |
| Distributions: | | | | | | |
| Dividends from investment income—net | | (.04) | | (.02) | | (.03) |
| Net asset value, end of period | | 1.95 | | 1.96 | | 1.98 |
| |
| |
| |
|
| Total Return (%) d | | 1.37 | | .23 | | .29e |
| |
| |
| |
|
| Ratios/Supplemental Data (%): | | | | | | |
| Ratio of total expenses to average net assets | | 1.66 | | 1.64 | | 1.74f |
| Ratio of net expenses to average net assets | | 1.54 | | 1.55 | | 1.55f |
| Ratio of net investment income | | | | | | |
| to average net assets | | 1.42 | | .77 | | .74f |
| Portfolio Turnover Rate | | 211.75 | | 309.23 | | 371.43 |
| |
| |
| |
|
| Net Assets, end of period ($ x 1,000) | | 4,225 | | 6,343 | | 5,290 |
| |
| a | | From November 1, 2002 (commencement of initial offering) to July 31, 2003. | | | | |
| b | | Based on average shares outstanding at each month end. | | | | |
| c | | Amount represents less than $.01 per share. | | | | | | |
| d | | Exclusive of sales charge. | | | | | | |
| e | | Not annualized. | | | | | | |
| f | | Annualized. | | | | | | |
| See notes to financial statements. | | | | | | |
| | | | | Year Ended July 31, | | |
| |
| |
| |
|
| Class D Shares | | 2005 | | 2004 | | 2003 a | | 2002 b |
| |
| |
| |
| |
|
| Per Share Data ($): | | | | | | | | |
| Net asset value, beginning of period | | 1.95 | | 1.98 | | 2.01 | | 2.00 |
| Investment Operations: | | | | | | | | |
| Investment income—net c | | .04 | | .03 | | .04 | | .05 |
| Net realized and unrealized | | | | | | | | |
| gain (loss) on investments | | .00d | | (.02) | | (.02) | | .01 |
| Total from Investment Operations | | .04 | | .01 | | .02 | | .06 |
| Distributions: | | | | | | | | |
| Dividends from investment income—net | | (.05) | | (.04) | | (.05) | | (.05) |
| Net asset value, end of period | | 1.94 | | 1.95 | | 1.98 | | 2.01 |
| |
| |
| |
| |
|
| Total Return (%) | | 2.13 | | .48 | | 1.16 | | 3.01e |
| |
| |
| |
| |
|
| Ratios/Supplemental Data (%): | | | | | | | | |
| Ratio of total expenses to average net assets | | .90 | | .88 | | .85 | | .92f |
| Ratio of net expenses to average net assets | | .80 | | .80 | | .80 | | .75f |
| Ratio of net investment income | | | | | | | | |
| to average net assets | | 2.19 | | 1.60 | | 2.10 | | 3.37f |
| Portfolio Turnover Rate | | 211.75 | | 309.23 | | 371.43 | | 96.09e |
| |
| |
| |
| |
|
| Net Assets, end of period ($ x 1,000) | | 121,006 | | 177,228 | | 313,644 | | 342,499 |
| a | | The fund commenced offering five classes of shares on November 1, 2002.The existing shares were redesignated |
| | | Class D shares. |
| b | | From November 15, 2001 (commencement of operations) to July 31, 2002. |
| c | | Based on average shares outstanding at each month end. |
| d | | Amount represents less than $.01 per share. |
| e | | Not annualized. |
| f | | Annualized. |
| See notes to financial statements. |
FINANCIAL HIGHLIGHTS (continued)
|
| | | | | | | Year Ended July 31, |
| | | |
| |
|
| Class P Shares | | 2005 | | 2004 | | 2003 a |
| |
| |
| |
|
| Per Share Data ($): | | | | | | |
| Net asset value, beginning of period | | 1.96 | | 1.98 | | 2.00 |
| Investment Operations: | | | | | | |
| Investment income—net b | | .04 | | .03 | | .03 |
| Net realized and unrealized | | | | | | |
| gain (loss) on investments | | .00c | | (.01) | | (.01) |
| Total from Investment Operations | | .04 | | .02 | | .02 |
| Distributions: | | | | | | |
| Dividends from investment income—net | | (.05) | | (.04) | | (.04) |
| Net asset value, end of period | | 1.95 | | 1.96 | | 1.98 |
| |
| |
| |
|
| Total Return (%) | | 2.14 | | .98 | | .85d |
| |
| |
| |
|
| Ratios/Supplemental Data (%): | | | | | | |
| Ratio of total expenses to average net assets | | .87 | | .85 | | .86e |
| Ratio of net expenses to average net assets | | .80 | | .80 | | .80e |
| Ratio of net investment income | | | | | | |
| to average net assets | | 2.19 | | 1.64 | | 1.43e |
| Portfolio Turnover Rate | | 211.75 | | 309.23 | | 371.43 |
| |
| |
| |
|
| Net Assets, end of period ($ x 1,000) | | 25,682 | | 43,117 | | 125,292 |
| |
| a | | From November 1, 2002 (commencement of initial offering) to July 31, 2003. | | | | |
| b | | Based on average shares outstanding at each month end. | | | | |
| c | | Amount represents less than $.01 per share. | | | | | | |
| d | | Not annualized. | | | | | | |
| e | | Annualized. | | | | | | |
| See notes to financial statements. | | | | | | |
| | | | | | | Year Ended July 31, | | |
| | | |
| |
| |
|
| Class S Shares | | 2005 | | 2004 | | 2003 a |
| |
| |
| |
|
| Per Share Data ($): | | | | | | |
| Net asset value, beginning of period | | 1.96 | | 1.98 | | 2.00 |
| Investment Operations: | | | | | | |
| Investment income—net b | | .04 | | .03 | | .02 |
| Net realized and unrealized | | | | | | |
| gain (loss) on investments | | .00c | | (.02) | | (.01) |
| Total from Investment Operations | | .04 | | .01 | | .01 |
| Distributions: | | | | | | |
| Dividends from investment income—net | | (.05) | | (.03) | | (.03) |
| Net asset value, end of period | | 1.95 | | 1.96 | | 1.98 |
| |
| |
| |
|
| Total Return (%) d | | 1.88 | | .76 | | .65e |
| |
| |
| |
|
| Ratios/Supplemental Data (%): | | | | | | |
| Ratio of total expenses to average net assets | | 1.21 | | 1.18 | | 1.23f |
| Ratio of net expenses to average net assets | | 1.05 | | 1.05 | | 1.05f |
| Ratio of net investment income | | | | | | |
| to average net assets | | 1.95 | | 1.35 | | 1.05f |
| Portfolio Turnover Rate | | 211.75 | | 309.23 | | 371.43 |
| |
| |
| |
|
| Net Assets, end of period ($ x 1,000) | | 523 | | 925 | | 1,520 |
| |
| a | | From November 1, 2002 (commencement of initial offering) to July 31, 2003. | | | | |
| b | | Based on average shares outstanding at each month end. | | | | |
| c | | Amount represents less than $.01 per share. | | | | | | |
| d | | Exclusive of sales charge. | | | | | | |
| e | | Not annualized. | | | | | | |
| f | | Annualized. | | | | | | |
| See notes to financial statements. | | | | | | |
NOTES TO FINANCIAL STATEMENTS
NOTE 1—Significant Accounting Policies:
Dreyfus Premier Yield Advantage Fund (the “fund”) is a separate non-diversified series of Dreyfus Investment Grade Funds, Inc. (the “Company”), which is registered under the Investment Company Act of 1940, as amended (the “Act”), as an open-end management investment company and operates as a series company currently offering five series, including the fund.The fund’s investment objective is to provide investors with as high a level of current income as is consistent with the preservation of capital with minimal changes in share price. The Dreyfus Corporation (the “Manager” or “Dreyfus”) serves as the fund’s investment adviser. The Manager is a wholly-owned subsidiary of Mellon Financial Corporation (“Mellon Financial”).
Dreyfus Service Corporation (the “Distributor”), a wholly-owned subsidiary of the Manager, is the distributor of the fund’s shares.The fund is authorized to issue 900 million shares of $.001 par value Common Stock.The fund currently offers five classes of shares: Class A (100 million shares authorized), Class B (50 million shares authorized), Class D (500 million shares authorized), Class P (200 million shares authorized) and Class S (50 million shares authorized). Class A shares are subject to a sales charge imposed at the time of purchase. Class B and Class S shares are subject to a contingent deferred sales charge (“CDSC”) imposed on Class B and Class S share redemptions made within six years of purchase and Class B shares automatically convert to Class A shares after six years. Class D and Class P shares are sold at net asset value per share only to institutional investors. Class A shares purchased at net asset value (an investment of $250,000 or more) will have a CDSC imposed on redemptions made within eighteen months of purchase. Other differences between the classes include the services offered to and the expenses borne by each class and certain voting rights. Income, expenses (other than expenses attributable to a specific class), and realized and unrealized gains or losses on investments are allocated to each class of shares based on its relative net assets.
The Company accounts separately for the assets, liabilities and operations of each series. Expenses directly attributable to each series are charged to that series’ operations; expenses which are applicable to all series are allocated among them on a pro rata basis.
The fund’s financial statements are prepared in accordance with U.S. generally accepted accounting principles, which may require the use of management estimates and assumptions. Actual results could differ from those estimates.
The fund enters into contracts that contain a variety of indemnifications. The fund’s maximum exposure under these arrangements is unknown.The fund does not anticipate recognizing any loss related to these arrangements.
(a) Portfolio valuation: Investments in securities (excluding short-term investments (other than U.S. Treasury Bills), financial futures and options) are valued each business day by an independent pricing service (the “Service”) approved by the Board of Directors. Investments for which quoted bid prices are readily available and are representative of the bid side of the market in the judgment of the Service are valued at the mean between the quoted bid prices (as obtained by the Service from dealers in such securities) and asked prices (as calculated by the Service based upon its evaluation of the market for such securities). Other investments (which constitute a majority of the portfolio securities) are valued as determined by the Service, based on methods which include consideration of: yields or prices of securities of comparable quality, coupon, maturity and type; indications as to values from dealers; and general market conditions. Securities for which there are no such valuations are valued at fair value as determined in good faith under the direction of the Board of Directors. Restricted securities, as well as securities or other assets for which recent market quotations are not readily available, that are not valued by a pricing service approved by the Board of Directors, or are determined by the fund not to reflect accurately fair
NOTES TO FINANCIAL STATEMENTS (continued)
|
value (such as when an event occurs after the close of the exchange on which the security is principally traded and that is determined by the fund to have changed the value of the security), are valued at fair value as determined in good faith under the direction of the Board of Directors.The factors that may be considered when fair valuing a security include fundamental analytical data, the nature and duration of restrictions on disposition, an evaluation of the forces that influence the market in which the securities are purchased and sold and public trading in similar securities of the issuer or comparable issuers. Short-term investments, excluding U.S.Treasury Bills, are carried at amortized cost, which approximates value. Investments in registered investment companies are valued at their net asset value. Financial futures and options, which are traded on an exchange, are valued at the last sales price on the securities exchange on which such securities are primarily traded or at the last sales price on the national securities market on each business day. Options traded over-the-counter are priced at the mean between the bid and asked price.
(b) Securities transactions and investment income: Securities transactions are recorded on a trade date basis. Realized gain and loss from securities transactions are recorded on the identified cost basis. Dividend income is recognized on the ex-dividend date and interest income, including, where applicable, accretion of discount and amortization of premium on investments, is recognized on the accrual basis.
The fund has an arrangement with the custodian bank whereby the fund receives earnings credits from the custodian when positive cash balances are maintained, which are used to offset custody fees. For financial reporting purposes, the fund includes net earnings credits as an expense offset in the Statement of Operations.
Pursuant to a securities lending agreement with Mellon Bank, N.A., an affiliate of the Manager, the fund may lend securities to qualified institutions.At origination, all loans are secured by collateral of at least 102% of the value of U.S. securities loaned and 105% of the value of foreign securities loaned. Collateral equivalent to at least 100% of the
market value of securities on loan will be maintained at all times. Cash collateral is invested in certain money market mutual funds managed by the Manager. The fund will be entitled to receive all income on securities loaned, in addition to income earned as a result of the lending transaction. Although each security loaned is fully collateralized, the fund would bear the risk of delay in recovery of, or loss of rights in, the securities loaned should a borrower fail to return the securities in a timely manner.
(c) Affiliated issuers: Investments in other investment companies advised by the Manager are defined as “affiliated” in the Act.
(d) Dividends to shareholders: It is the policy of the fund to declare dividends daily from investment income-net. Such dividends are paid monthly. Dividends from net realized capital gain, if any, are normally declared and paid annually, but the fund may make distributions on a more frequent basis to comply with the distribution requirements of the Internal Revenue Code of 1986, as amended (the “Code”).To the extent that net realized capital gain can be offset by capital loss carryovers, it is the policy of the fund not to distribute such gain.Income and capital gain distributions are determined in accordance with income tax regulations, which may differ from U.S. generally accepted accounting principles.
(e) Federal income taxes: It is the policy of the fund to continue to qualify as a regulated investment company, if such qualification is in the best interests of its shareholders, by complying with the applicable provisions of the Code, and to make distributions of taxable income sufficient to relieve it from substantially all federal income and excise taxes.
At July 31, 2005, the components of accumulated earnings on a tax basis were as follows: undistributed ordinary income $64,760, accumulated capital losses $12,577,692 and unrealized depreciation $827,564. In addition, the fund had $35,770 of capital losses realized after October 31, 2004, which were deferred for tax purposes to the first day of the following fiscal year.
NOTES TO FINANCIAL STATEMENTS (continued)
|
The accumulated capital loss carryover is available to be applied against future net securities profits, if any, realized subsequent to July 31, 2005. If not applied, $3,308,447 of the carryover expires in fiscal 2011, $1,633,108 expires in fiscal 2012 and $7,636,137 expires in fiscal 2013.
The tax character of distributions paid to shareholders during the fiscal periods ended July 31, 2005 and July 31, 2004 were as follows: ordinary income $4,840,780 and $7,481,251, respectively.
During the period ended July 31, 2005, as a result of permanent book to tax differences primarily due to the tax treatment for treasury inflation protected securities and paydown gains and losses on mortgage-backed securities, the fund increased accumulated undistributed investment income-net by $597,365 and decreased accumulated net realized gain (loss) on investments by the same amount. Net assets were not affected by this reclassification.
NOTE 2—Bank Line of Credit:
The fund participates with other Dreyfus-managed funds in a $100 million unsecured line of credit primarily to be utilized for temporary or emergency purposes, including the financing of redemptions. Interest is charged to the fund based on prevailing market rates in effect at the time of borrowings.
The average daily amount of borrowings outstanding under the line of credit during the period ended July 31, 2005 was approximately $109,600, with a related weighted average annualized interest rate of 2.26% .
NOTE 3—Management Fee and Other Transactions With Affiliates:
(a) Pursuant to a management agreement (“Agreement”) with the Manager, the management fee is computed at the annual rate of .50 of 1% of the value of the fund’s average daily net assets and is payable monthly.The Manager has undertaken from August 1, 2004 through January 31, 2006, that, if the aggregate expenses of the fund, exclu-
sive of taxes, brokerage fees, Rule 12b-1 distribution plan fees, shareholder services plan fees and extraordinary expenses, exceed an annual rate of .55 of 1% of the value of the fund’s average daily net assets, the fund may deduct from the payment to be made to the Manager under the Agreement, or the Manager will bear, such excess expense. The reduction in management fee, pursuant to the undertaking, amounted to $175,457 during the period ended July 31, 2005.
During the period ended July 31, 2005, the Distributor retained $2,766 from commissions earned on sales of the fund’s Class A shares and $11,837 and $8,363 from contingent deferred sales charges on redemptions of the fund’s Class B and Class S shares, respectively.
(b) Under the Distribution Plan (the “Plan”) adopted pursuant to Rule 12b-1 under the Act, Class B and Class S shares pay the Distributor for distributing their shares at an annual rate of .75 of 1% of the value of the average daily net assets of Class B shares and .25 of 1% of the value of the average daily net assets of Class S shares. During the period ended July 31, 2005, Class B and Class S shares were charged $37,555 and $1,878, respectively, pursuant to the Plan.
(c) Under the Shareholder Services Plan, Class A, Class B, Class D, Class P and Class S shares pay the Distributor at an annual rate of .25 of 1% of the value of their average daily net assets for the provision of certain services.The services provided may include personal services relating to shareholder accounts, such as answering shareholder inquiries regarding Class A, Class B, Class D, Class P and Class S shares and providing reports and other information, and services related to the maintenance of shareholder accounts. The Distributor may make payments to Service Agents (a securities dealer, financial institution or other industry professional) in respect of these services.The Distributor determines the amounts to be paid to Service Agents. During the period ended July 31, 2005, Class A, Class B, Class D, Class P and Class S shares were charged $16,547, $12,518, $359,525, $84,404 and $1,878, respectively, pursuant to the Shareholder Services Plan.
NOTES TO FINANCIAL STATEMENTS (continued)
|
The fund compensates Dreyfus Transfer, Inc., a wholly-owned subsidiary of the Manager, under a transfer agency agreement for providing personnel and facilities to perform transfer agency services for the fund. During the period ended July 31, 2005, the fund was charged $69,369 pursuant to the transfer agency agreement.
The fund compensates Mellon Bank, N.A., an affiliate of the Manager, under a custody agreement for providing custodial services for the fund. During the period ended July 31, 2005, the fund was charged $20,835 pursuant to the custody agreement.
During the period ended July 31, 2005, the fund was charged $2,308 for services performed by the Chief Compliance Officer.
The components of Due to The Dreyfus Corporation and affiliates in the Statement of Assets and Liabilities consist of: management fees $68,293, Rule 12b-1 distribution plan fees $2,824, shareholder services plan fees $34,147, custodian fees $4, chief compliance officer fees $2,308 and transfer agency per account fees $11,300, which are offset against an expense reimbursement currently in effect in the amount of $17,786.
(d) Each Board member also serves as a Board member of other funds within the Dreyfus complex. Annual retainer fees and attendance fees are allocated to each fund based on net assets.
(e) Pursuant to an exemptive order from the Securities and Exchange Commission, the fund may invest its available cash balances in affiliated money market mutual funds. Management fees of the underlying money market mutual funds have been waived by the Manager.
NOTE 4—Securities Transactions:
The aggregate amount of purchases and sales (including paydowns) of investment securities, excluding short-term securities, financial futures and options transactions, during the period ended July 31, 2005, amounted to $349,731,832 and $426,003,189, respectively.
The fund may invest in financial futures contracts in order to gain exposure to or protect against changes in the market. The fund is exposed to market risk as a result of changes in the value of the underlying financial instruments. Investments in financial futures require the fund to “mark to market” on a daily basis, which reflects the change in market value of the contracts at the close of each day’s trading. Accordingly, variation margin payments are received or made to reflect daily unrealized gains and losses. When the contracts are closed, the fund recognizes a realized gain or loss.These investments require initial margin deposits with a broker, which consist of cash or cash equiva-lents.The amount of these deposits is determined by the exchange or Board of Trade on which the contract is traded and is subject to change. At July 31, 2005, there were no financial futures contracts outstanding.
At July 31, 2005, the cost of investments for federal income tax purposes was $163,531,856; accordingly, accumulated net unrealized depreciation on investments was $827,564, consisting of $133,895 gross unrealized appreciation and $961,459 gross unrealized depreciation.
NOTE 5—Legal Matters:
In early 2004, two purported class and derivative actions were filed against Mellon Financial, Mellon Bank, N.A., Dreyfus, Founders Asset Management LLC, and certain directors of the Dreyfus Funds and the Dreyfus Founders Funds (together, the “Funds”) in the United States District Court for the Western District of Pennsylvania. In September 2004, plaintiffs served a Consolidated Amended Complaint (the “Amended Complaint”) on behalf of a purported class of all persons who acquired interests in any of the Funds between January 30, 1999 and November 17, 2003, and derivatively on behalf of the Funds.The Amended Complaint in the newly styled In re Dreyfus Mutual Funds Fee Litigation also named the Distributor, Premier Mutual Fund Services, Inc. and two additional Fund directors as defendants and
NOTES TO FINANCIAL STATEMENTS (continued)
|
alleges violations of the Investment Company Act of 1940, the Investment Advisers Act of 1940, the Pennsylvania Unfair Trade Practices and Consumer Protection Law and common-law claims. Plaintiffs seek to recover allegedly improper and excessive Rule 12b-1 and advisory fees allegedly charged to the Funds for marketing and distribution services. More specifically, plaintiffs claim, among other things, that 12b-1 fees and directed brokerage were improperly used to pay brokers to recommend the Funds over other funds, and that such payments were not disclosed to investors. In addition, plaintiffs assert that economies of scale and soft-dollar benefits were not passed on to the Funds. Plaintiffs further allege that 12b-1 fees were improperly charged to certain of the Funds that were closed to new investors.The Amended Complaint seeks compensatory and punitive damages, rescission of the advisory contracts, and an accounting and restitution of any unlawful fees, as well as an award of attorneys’ fees and litigation expenses. As noted, some of the claims in this litigation are asserted derivatively on behalf of the Funds that have been named as nominal defendants. With respect to such derivative claims, no relief is sought against the Funds. Dreyfus believes the allegations to be totally without merit and intends to defend the action vigorously. In November 2004, all named defendants moved to dismiss the Amended Complaint in whole or substantial part. Briefing was completed in May 2005.
Additional lawsuits arising out of these circumstances and presenting similar allegations and requests for relief may be filed against the defendants in the future. Neither Dreyfus nor the Funds believe that any of the pending actions will have a material adverse effect on the Funds or Dreyfus’ ability to perform its contract with the Funds.
| REPORT OF INDEPENDENT REGISTERED |
| PUBLIC ACCOUNTING FIRM |
| Shareholders and Board of Directors |
| Dreyfus Premier Yield Advantage Fund |
We have audited the accompanying statement of assets and liabilities, including the statement of investments, of Dreyfus Premier Yield Advantage Fund (one of the funds comprising Dreyfus Investment Grade Funds, Inc.) as of July 31, 2005, and the related statement of operations for the year then ended, the statement of changes in net assets for each of the two years in the period then ended, and financial highlights for each of the periods indicated therein.These financial statements and financial highlights are the responsibility of the Fund’s management.Our responsibility is to express an opinion on these financial statements and financial highlights based on our audits.
We conducted our audits in accordance with the standards of the Public Company Accounting Oversight Board (United States).Those standards require that we plan and perform the audit to obtain reasonable assurance about whether the financial statements and financial highlights are free of material misstatement.We were not engaged to perform an audit of the Fund’s internal control over financial reporting.Our audits included consideration of internal control over financial reporting as a basis for designing audit procedures that are appropriate in the circumstances,but not for the purpose of expressing an opinion on the effectiveness of the Fund’s internal control over financial reporting.Accordingly, we express no such opinion.An audit also includes examining, on a test basis, evidence supporting the amounts and disclosures in the financial statements and financial highlights, assessing the accounting principles used and significant estimates made by management,and evaluating the overall financial statement presentation. Our procedures included verification by examination of securities held by the custodian as of July 31, 2005 and confirmation of securities not held by the custodian by correspondence with others. We believe that our audits provide a reasonable basis for our opinion.
In our opinion, the financial statements and financial highlights referred to above present fairly, in all material respects, the financial position of Dreyfus Premier Yield Advantage Fund at July 31, 2005, the results of its operations for the year then ended, the changes in its net assets for each of the two years in the period then ended, and the financial highlights for each of the indicated periods, in conformity with U.S. generally accepted accounting principles.

| | New York, New York
September 16, 2005
|
| INFORMATION ABOUT THE REVIEW | | |
| AND APPROVAL OF THE FUND’S | | |
| MANAGEMENT AGREEMENT | | (Unaudited) |
At separate meetings of the Board of Directors for the Fund held on July 12-13, 2005, the Board considered the re-approval, through its annual renewal date of July 29, 2006, of the Fund’s Management Agreement, pursuant to which the Manager provides the Fund with investment advisory and administrative services. The Board members who are not “interested persons” (as defined in the Investment Company Act of 1940, as amended) of the Fund were assisted in their review by independent legal counsel and met with counsel in executive session separate from representatives of the Manager.
Analysis of Nature, Extent and Quality of Services Provided to the Fund. The Board members received a presentation from representatives of the Manager regarding services provided to the Fund and other funds in the Dreyfus fund complex, and discussed the nature, extent and quality of the services provided to the Fund pursuant to its Management Agreement.The Manager’s representatives reviewed the Fund’s distribution of accounts and the relationships the Manager has with various intermediaries and the different needs of each. The Manager’s representatives noted the diversity of distribution of the Fund as well as among the funds in the Dreyfus complex, and the Manager’s corresponding need for broad, deep, and diverse resources to be able to provide ongoing shareholder services to each of the Fund’s distribution channels.The Board also reviewed the number of shareholder accounts in the Fund, as well as the Fund’s asset size.
The Board members also considered the Manager’s research and portfolio management capabilities and that the Manager also provides oversight of day-to-day Fund operations, including fund accounting and administration and assistance in meeting legal and regulatory requirements. The Board members also considered the Manager’s extensive administrative, accounting and compliance infrastructure.
Comparative Analysis of the Fund’s Performance and Management Fee and Expense Ratio. The Board members reviewed the Fund’s perfor-mance,management fee and expense ratios and placed significant emphasis on comparisons to a group of comparable funds and Lipper category averages, as applicable. The group of comparable funds was previously approved by the Board for this purpose, and was prepared using a Board-
approved selection methodology that was based, in part, on selecting non-affiliated funds reported in the same Lipper category as the Fund. The Board members discussed the results of the comparisons for various periods ended May 31,2005,and noted that the Fund’s income yield performance for the 3-year period was below the comparison group average but slightly above the Lipper category average, and for the 1-year period was below the comparison group average and slightly below the Lipper category average; while for both periods the Fund ranked in the bottom half of its comparison group for income yield performance, it ranked in the top half of its Lipper category.The Board noted that the Fund’s 3-year total return performance was below the comparison group and Lipper category averages, but that the Fund’s 1-year total return performance was above the comparison group and Lipper category averages, and that the Fund’s more recent 3-month and year-to-date total return performance was above the Lipper category average for each such period; while the Fund’s total return performance ranked in the bottom half of its comparison group for the 3-year period, it ranked in the top half of its comparison group for the 1-year, year-to-date and 3-month periods. The Board members noted that a new portfolio management team for the Fund was appointed in January 2005.The Board members also discussed the Fund’s expense ratio, noting that the current fee waiver and expense reimbursement arrangement undertaken by the Manager had caused the expense ratio for the Fund’s Class D shares to be lower than the Lipper category average, although it was higher than the comparison group average. The Board reviewed the range of management fees in the comparison group, noting that the Fund’s management fee ranked in the bottom half (i.e., higher than most others), although several funds had higher management fees.
Representatives of the Manager reviewed with the Board members the fees paid to the Manager or its affiliates by mutual funds managed by the Manager or its affiliates with similar investment objectives, policies and strategies as the Fund (the “Similar Funds”), and noted that there were no other accounts managed or sub-advised by the Manager or its affiliates with similar investment objectives, policies and strategies as the Fund.The Similar Funds were mutual funds included in the “ultra-short
| INFORMATION ABOUT THE | | REVIEW AND | | APPROVAL | | OF THE |
| FUND’S MANAGEMENT | | AGREEMENT | | (Unaudited) | | (continued) |
obligations” funds category by Lipper.The Manager’s representatives also reviewed the costs associated with distribution through intermediaries. The Board analyzed the differences in fees paid to the Manager and discussed the relationship of the advisory fees paid in light of the Manager’s performance and the services provided; it was noted that the Similar Funds had lower management fees than the fee borne by the Fund.The Board members considered the relevance of the fee information provided for the Similar Funds managed by the Manager to evaluate the appropriateness and reasonableness of the Fund’s advisory fees.
Analysis of Profitability and Economies of Scale. The Manager’s representatives reviewed the dollar amount of expenses allocated and profit received by the Manager and the method used to determine such expenses and profit.The Board received and considered information prepared by an independent consulting firm regarding Dreyfus’ approach to allocating costs to, and determining the profitability of, individual funds and the entire Dreyfus mutual fund complex.The consulting firm also analyzed where any economies of scale might emerge as assets grow.The Board members evaluated the analysis in light of the relevant circumstances for the Fund, including the decline in Fund assets and the extent to which economies of scale would be realized as the Fund grows and whether fee levels reflect these economies of scale for the benefit of Fund investors.The Board members also considered potential benefits to the Manager from acting as investment adviser and noted that there were no soft dollar arrangements with respect to trading the Fund’s portfolio.
It was noted that the Board members should consider the Manager’s profitability with respect to the Fund as part of their evaluation of whether the fee under the Management Agreement bears a reasonable relationship to the mix of services provided by the Manager, including the nature, extent and quality of such services and that a discussion of economies of scale are predicated on increasing assets and that, if a fund’s assets had been decreasing, the possibility that the Manager may have realized any economies of scale would be less. It also was noted that the profitability percentage for managing the Fund was within ranges determined by appropriate court cases to be reasonable given the services rendered and given the Fund’s overall performance and
generally superior service levels provided. The Board also noted the current fee waiver and expense reimbursement arrangement and its effect on the profitability of the Manager.
At the conclusion of these discussions, each of the Directors expressed the opinion that he or she had been furnished with sufficient information to make an informed business decision with respect to continuation of the Fund’s Management Agreement. Based on their discussions and considerations as described above, the Board made the following conclusions and determinations.
- The Board concluded that the nature, extent and quality of the ser- vices provided by the Manager are adequate and appropriate.
- The Board generally was satisfied with the Fund’s income yield performance as compared to the Lipper category averages, and the Fund’s improvement in its 1-year, year-to-date and 3-month total return performance, as well as with the change in the Fund’s port- folio management team which occurred in January 2005.
- The Board concluded that the fee paid by the Fund to the Manager was reasonable in light of comparative performance and expense and advisory fee information, including the Manager’s undertaking to waive or reimburse certain fees and expenses, costs of the services provided and profits to be realized and benefits derived or to be derived by the Manager from its relationship with the Fund.
- The Board determined that, given the current size and characteris- tics of the Fund, it was difficult to specifically identify any economies of scale that might be realized merely through an increase in the assets of the Fund.The Board noted that it appeared that the benefits of any economies of scale would be appropriately shared with shareholders through increased investment in fund management and administration resources.
The Board members considered these conclusions and determinations, along with information received on a routine and regular basis throughout the year, and, without any one factor being dispositive, the Board determined that re-approval of the Fund’s Management Agreement was in the best interests of the Fund and its shareholders.
BOARD MEMBERS INFORMATION (Unaudited)
Joseph S. DiMartino (61)
Chairman of the Board (1995)
|
Principal Occupation During Past 5 Years:
• Corporate Director and Trustee
|
Other Board Memberships and Affiliations:
|
- The Muscular Dystrophy Association, Director
- Levcor International, Inc., an apparel fabric processor, Director
- Century Business Services, Inc., a provider of outsourcing functions for small and medium size companies, Director
- The Newark Group, a provider of a national market of paper recovery facilities, paperboard mills and paperboard converting plants, Director
- Azimuth Trust, an institutional asset management firm, Member of Board of Managers and Advisory Board
No. of Portfolios for which Board Member Serves: 193
———————
Clifford L. Alexander, Jr. (71) Board Member (2003)
Principal Occupation During Past 5 Years:
|
- President of Alexander & Associates, Inc., a management consulting firm ( January 1981-present)
- Chairman of the Board of Moody’s Corporation (October 2000-October 2003)
- Chairman of the Board and Chief Executive Officer of The Dun and Bradstreet Corporation (October 1999-September 2000)
Other Board Memberships and Affiliations:
• Mutual of America Life Insurance Company, Director
No. of Portfolios for which Board Member Serves: 66
|
———————
Lucy Wilson Benson (77) Board Member (1994)
Principal Occupation During Past 5 Years:
• President of Benson and Associates, consultants to business and government (1980-present)
Other Board Memberships and Affiliations:
|
- The International Executive Services Corps., Director
- Citizens Network for Foreign Affairs,Vice Chairperson
- Council on Foreign Relations, Member
- Lafayette College Board of Trustees,Trustee Emeritus
- Atlantic Council of the U.S., Director
No. of Portfolios for which Board Member Serves: 40
|
David W. Burke (69)
Board Member (1994)
|
Principal Occupation During Past 5 Years:
• Corporate Director and Trustee
|
Other Board Memberships and Affiliations:
|
- John F. Kennedy Library Foundation, Director
- U.S.S. Constitution Museum, Director
No. of Portfolios for which Board Member Serves: 84
|
Whitney I. Gerard (70)
Board Member (1993)
|
Principal Occupation During Past 5 Years:
• Partner of Chadbourne & Parke LLP
|
No. of Portfolios for which Board Member Serves: 38
|
Arthur A. Hartman (79)
Board Member (1992)
|
Principal Occupation During Past 5 Years:
|
- Chairman of First NIS Regional Fund (ING/Barings Management) and New Russia Fund
- Advisory Council Member to Barings Vostok
Other Board Memberships and Affiliations:
• APCO Associates Inc., Senior Consultant
|
No. of Portfolios for which Board Member Serves: 38
|
George L. Perry (71)
Board Member (1992)
|
Principal Occupation During Past 5 Years:
• Economist and Senior Fellow at Brookings Institution
No. of Portfolios for which Board Member Serves: 38
|
Once elected all Board Members serve for an indefinite term.The address of the Board Members and Officers is in c/o The Dreyfus Corporation, 200 Park Avenue, New York, New York 10166. Additional information about the Board Members is available in the fund’s Statement of Additional Information which can be obtained from Dreyfus free of charge by calling this toll free number: 1-800-554-4611.
OFFICERS OF THE FUND (Unaudited)
STEPHEN E. CANTER, President since March 2000.
Chairman of the Board, Chief Executive Officer and Chief Operating Officer of the Manager, and an officer of 90 investment companies (comprised of 184 portfolios) managed by the Manager. Mr. Canter also is a Board member and, where applicable, an Executive Committee Member of the other investment management subsidiaries of Mellon Financial Corporation, each of which is an affiliate of the Manager. He is 60 years old and has been an employee of the Manager since May 1995.
STEPHEN R. BYERS, Executive Vice President since October 2002.
Chief Investment Officer,Vice Chairman and a director of the Manager, and an officer of 90 investment companies (comprised of 184 portfolios) managed by the Manager. Mr. Byers also is an officer, director or an Executive Committee Member of certain other investment management subsidiaries of Mellon Financial Corporation, each of which is an affiliate of the Manager. He is 51 years old and has been an employee of the Manager since January 2000.
MARK N. JACOBS, Vice President since March 2000.
Executive Vice President, Secretary and General Counsel of the Manager, and an officer of 91 investment companies (comprised of 200 portfolios) managed by the Manager. He is 59 years old and has been an employee of the Manager since June 1977.
MICHAEL A. ROSENBERG, Vice President and Secretary since August 2005.
Associate General Counsel of the Manager, and an officer of 91 investment companies (comprised of 200 portfolios) managed by the Manager. He is 45 years old and has been an employee of the Manager since October 1991.
JAMES BITETTO, Vice President and Assistant Secretary since August 2005.
Assistant General Counsel and Assistant Secretary of the Manager, and an officer of 91 investment companies (comprised of 200 portfolios) managed by the Manager. He is 39 years old and has been an employee of the Manager since December 1996.
JONI LACKS CHARATAN, Vice President and Assistant Secretary since August 2005.
Assistant General Counsel of the Manager, and an officer of 91investment companies (comprised of 200 portfolios) managed by the Manager. She is 49 years old and has been an employee of the Manager since October 1998.
JOSEPH M. CHIOFFI, Vice President and Assistant Secretary since August 2005.
Assistant General Counsel of the Manager, and an officer of 91 investment companies (comprised of 200 portfolios) managed by the Manager. He is 43 years old and has been an employee of the Manager since July 2000.
JANETTE E. FARRAGHER, Vice President and Assistant Secretary since August 2005.
Associate General Counsel of the Manager, and an officer of 91 investment companies (comprised of 200 portfolios) managed by the Manager. She is 42 years old and has been an employee of the Manager since February 1984.
JOHN B. HAMMALIAN, Vice President and Assistant Secretary since August 2005.
Associate General Counsel of the Manager, and an officer of 91 investment companies (comprised of 200 portfolios) managed by the Manager. He is 42 years old and has been an employee of the Manager since February 1991.
ROBERT R. MULLERY, Vice President and Assistant Secretary since August 2005.
Associate General Counsel of the Manager, and an officer of 91 investment companies (comprised of 200 portfolios) managed by the Manager. He is 53 years old and has been an employee of the Manager since May 1986.
JEFF PRUSNOFSKY, Vice President and Assistant Secretary since August 2005.
Associate General Counsel of the Manager, and an officer of 91 investment companies (comprised of 200 portfolios) managed by the Manager. He is 40 years old and has been an employee of the Manager since October 1990.
JAMES WINDELS, Treasurer since November 2001.
Director – Mutual Fund Accounting of the Manager, and an officer of 91 investment companies (comprised of 200 portfolios) managed by the Manager. He is 46 years old and has been an employee of the Manager since April 1985.
GREGORY S. GRUBER, Assistant Treasurer since August 2005.
Senior Accounting Manager – Municipal Bond Funds of the Manager, and an officer of 91 investment companies (comprised of 200 portfolios) managed by the Manager. He is 46 years old and has been an employee of the Manager since August 1981.
ERIK D. NAVILOFF, Assistant Treasurer since December 2002.
Senior Accounting Manager – Taxable Fixed Income Funds of the Manager, and an officer of 91 investment companies (comprised of 200 portfolios) managed by the Manager. He is 37 years old and has been an employee of the Manager since November 1992.
ROBERT ROBOL, Assistant Treasurer since August 2005.
Senior Accounting Manager – Money Market Funds of the Manager, and an officer of 91 investment companies (comprised of 200 portfolios) managed by the Manager. He is 41 years old and has been an employee of the Manager since October 1988.
ROBERT SVAGNA, Assistant Treasurer since August 2005.
Senior Accounting Manager – Equity Funds of the Manager, and an officer of 91 investment companies (comprised of 200 portfolios) managed by the Manager. He is 37 years old and has been an employee of the Manager since November 1990.
KENNETH J. SANDGREN, Assistant Treasurer since November 2001.
Mutual Funds Tax Director of the Manager, and an officer of 91 investment companies (comprised of 200 portfolios) managed by the Manager. He is 50 years old and has been an employee of the Manager since June 1993.
JOSEPH W. CONNOLLY, Chief Compliance Officer since October 2004.
Chief Compliance Officer of the Manager and The Dreyfus Family of Funds (91 investment companies, comprising 200 portfolios). From November 2001 through March 2004, Mr. Connolly was first Vice-President, Mutual Fund Servicing for Mellon Global Securities Services. In that capacity, Mr. Connolly was responsible for managing Mellon’s Custody, Fund Accounting and Fund Administration services to third-party mutual fund clients. He is 48 years old and has served in various capacities with the Manager since 1980, including manager of the firm’s Fund Accounting Department from 1997 through October 2001.
WILLIAM GERMENIS, Anti-Money Laundering Compliance Officer since August 2002.
Vice President and Anti-Money Laundering Compliance Officer of the Distributor, and the Anti-Money Laundering Compliance Officer of 87 investment companies (comprised of 196 portfolios) managed by the Manager. He is 34 years old and has been an employee of the Distributor since October 1998.
| For More | | Information |
| |
|
| |
| Dreyfus Premier | | Transfer Agent & |
| Yield Advantage Fund | | Dividend Disbursing Agent |
| 200 Park Avenue | | |
| | | Dreyfus Transfer, Inc. |
| New York, NY 10166 | | |
| | | 200 Park Avenue |
| Manager | | New York, NY 10166 |
| The Dreyfus Corporation | | Distributor |
| 200 Park Avenue | | |
| | | Dreyfus Service Corporation |
| New York, NY 10166 | | |
| | | 200 Park Avenue |
| Custodian | | New York, NY 10166 |
| Mellon Bank, N.A. | | |
| One Mellon Bank Center | | |
| Pittsburgh, PA 15258 | | |
Telephone Call your financial representative or 1-800-554-4611
| Mail | | The Dreyfus Premier Family of Funds |
| | | 144 Glenn Curtiss Boulevard, Uniondale, NY 11556-0144 |
The fund files its complete schedule of portfolio holdings with the Securities and Exchange Commission (“SEC”) for the first and third quarters of each fiscal year on Form N-Q. The fund’s Forms N-Q are available on the SEC’s website at http://www.sec.gov and may be reviewed and copied at the SEC’s Public Reference Room in Washington, DC. Information on the operation of the Public Reference Room may be obtained by calling 1-800-SEC-0330.
A description of the policies and procedures that the fund uses to determine how to vote proxies relating to portfolio securities, and information regarding how the fund voted these proxies for the 12-month period ended June 30, 2005, is available at http://www.dreyfus.com and on the SEC’s website at http://www.sec.gov. The description of the policies and procedures is also available without charge, upon request, by calling 1-800-645-6561.

Dreyfus Premier Short Term Income Fund
| | ANNUAL REPORT July 31, 2005
|

Save time. Save paper. View your next shareholder report online as soon as it’s available. Log into www.dreyfus.com and sign up for Dreyfus eCommunications. It’s simple and only takes a few minutes.
The views expressed in this report reflect those of the portfolio manager only through the end of the period covered and do not necessarily represent the views of Dreyfus or any other person in the Dreyfus organization. Any such views are subject to change at any time based upon market or other conditions and Dreyfus disclaims any responsibility to update such views.These views may not be relied on as investment advice and, because investment decisions for a Dreyfus fund are based on numerous factors, may not be relied on as an indication of trading intent on behalf of any Dreyfus fund.
Not FDIC-Insured • Not Bank-Guaranteed • May Lose Value
| | | Contents |
| |
| | | THE FUND |
| |
|
| 2 | | Letter from the Chairman |
| 3 | | Discussion of Fund Performance |
| 6 | | Fund Performance |
| 8 | | Understanding Your Fund’s Expenses |
| 8 | | Comparing Your Fund’s Expenses |
| | | With Those of Other Funds |
| 9 | | Statement of Investments |
| 21 | | Statement of Financial Futures |
| 22 | | Statement of Assets and Liabilities |
| 23 | | Statement of Operations |
| 24 | | Statement of Changes in Net Assets |
| 26 | | Financial Highlights |
| 30 | | Notes to Financial Statements |
| 42 | | Report of Independent Registered |
| | | Public Accounting Firm |
| 43 | | Information About the Review and Approval |
| | | of the Fund’s Management Agreement |
| 48 | | Board Members Information |
| 50 | | Officers of the Fund |
| |
| | | FOR MORE INFORMATION |
| |
|
| | | Back Cover |
| Dreyfus Premier |
| Short Term Income Fund |
The Fund

LETTER FROM THE CHAIRMAN
We are pleased to present this annual report for Dreyfus Premier Short Term Income Fund,covering the 12-month period from August 1,2004, through July 31, 2005. Inside, you’ll find valuable information about how the fund was managed during the reporting period, including a discussion with the fund’s primary portfolio manager, Catherine Powers.
The past 12 months proved to be an unusual time for fixed-income securities. Although the Federal Reserve Board continued to raise short-term interest rates, yield differences between long- and short-term securities remained relatively narrow for most of the reporting period — contrary to historical norms. Strong demand from domestic and foreign investors, along with mild inflation concerns, helped support prices of U.S.Treasury securities. Corporate bonds also fared well during the reporting period generally due to stronger balance sheets, better business conditions and persistently low default rates.
In our view, these and other factors may have created new opportunities and challenges for fixed-income investors. Our economists currently expect the U.S. economy to continue to grow over the foreseeable future without significant new inflationary pressures, potentially setting the stage for market conditions that could affect the various sectors of the U.S. bond market in different ways.As always, we encourage you to talk with your financial advisor about the investment strategies that may best suit your current needs and future goals.
Thank you for your continued confidence and support.


DISCUSSION OF FUND PERFORMANCE
| Catherine Powers, Primary Portfolio Manager |
| |
| How did Dreyfus Premier Short Term Income Fund perform |
| relative to its benchmark? |
For the 12-month period ended July 31, 2005, the fund achieved total returns of 2.97% for Class A shares, 2.37% for Class B shares, 2.99% for Class D shares and 3.01% for Class P shares.1 In comparison, the fund’s benchmark, the Merrill Lynch Corporate and Government (1-5 years) Index (the “Index”), achieved a total return of 1.76% for the same period.2
During the reporting period, short-term interest rates rose amid additional rate hikes from the Federal Reserve Board (“the Fed”). Contrary to historical norms, for other reasons the yields of longer-term U.S. Treasury securities generally fell and prices rose. Broad market sectors posted stronger returns relative to Treasuries during the reporting period’s first half, while they posted lackluster excess returns over the second half of the reporting period. In particular, corporate bond returns proved to be disappointing due to greater event risk and ratings downgrades in the automotive industry. Although the market environment recently has been more difficult for non-Treasury assets, the fund produced higher returns than its benchmark, primarily due to its “barbell” yield-curve strategy as yield differences narrowed among U.S.Treasury securities of various maturities.
What is the fund’s investment approach?
The fund seeks to maximize total returns consisting of capital appreciation and current income.To pursue this goal, the fund invests at least 80% of its assets in fixed-income securities of U.S. or foreign issuers rated investment grade or the unrated equivalent as determined by Dreyfus. This may include: U.S. government bonds and notes; corporate bonds; municipal bonds; convertible securities; preferred stocks; inflation-indexed securities; asset-backed securities; mortgage-
DISCUSSION OF FUND PERFORMANCE (continued)
|
related securities (including CMOs) and foreign bonds. For additional yield, the fund may invest up to 20% of its assets in fixed-income securities rated below investment grade (“high yield” or “junk” bonds). Typically, the fund’s portfolio can be expected to have an average effective maturity and an average effective duration of three years or less.
What other factors affected the fund’s performance?
The Fed continued to raise short-term interest rates, implementing rate hikes at each of eight meetings of its Federal Open Market Committee (“FOMC”) over the reporting period. As a result, the federal funds rate climbed from 1.25% at the start of the reporting period to 3.25% at the end of the reporting period.As expected, rising interest rates eroded prices of most short-term fixed-income securities. Contrary to previous tightening cycles, however, prices of longer-term bonds rose, and the yield of the 10-year U.S. Treasury bond ended lower than where it began. Much of the drop in long-term Treasury yields has been attributed to the excess of global savings as evidenced by sizeable foreign purchases. At the same time, long maturity bonds benefited from the Fed’s inflation-fighting credibility, which has resulted in lower inflation expectations.
Corporate bonds rallied during the final months of 2004 as business conditions improved, and the sector began 2005 with historically narrow yield spreads, particularly among lower-quality bonds.This left little room for disappointment, and the corporate bond market sold off sharply in March and April when major U.S. automotive companies released disappointing financial results and General Motors’ unsecured debt was downgraded to below investment grade.
In this more challenging environment, we adopted a “barbell” yield curve strategy that emphasized holdings at both the short and long ends of the yield curve with an average duration that was slightly shorter than the benchmark index. This yield-curve positioning helped the fund participate more fully in the gains of longer-term bonds. In July, the fund’s defensive duration positioning produced better results as interest rates rose sharply in the wake of improving economic data.
The fund’s results were also supported by its defensive posture in most non-Treasury market sectors. Our emphasis on higher-rated corporate bonds helped boost the fund’s returns, as did our bottom-up security selection. Our overweight in higher-quality commercial mortgage-backed securities and asset-backed securities was also positive. However, the benefit of seasonally high inflation accruals among Treasury Inflation Protected Securities (“TIPS”) was mostly offset by declining inflation expectations, and TIPS failed to outperform nominal Treasuries.The fund’s modest underweight position in better-performing mortgage-backed securities also proved to be a slight drag over the reporting period.
What is the fund’s current strategy?
We have positioned the fund for the next phase of the economic cycle. Although we expect the Fed to continue raising interest rates, we believe that we are closer to the end of the tightening cycle than to the beginning. Accordingly, we recently adopted a more “bulleted” yield-curve positioning.We also have reduced the portfolio’s holdings of TIPS in favor of nominal U.S.Treasury securities.
As of the reporting period’s end, risk premiums in non-Treasury market sectors seem relatively rich to us. Consequently, we continue to believe that a generally defensive investment posture is warranted until valuations are more attractive.
| 1 | | Total return includes reinvestment of dividends and any capital gains paid. Past performance is no |
| | | guarantee of future results. Share price, yield and investment return fluctuate such that upon |
| | | redemption, fund shares may be worth more or less than their original cost. |
| 2 | | SOURCE: LIPPER INC. — Reflects reinvestment of dividends and, where applicable, capital |
| | | gain distributions.The Merrill Lynch Corporate and Government (1-5 years) Index is a market |
| | | value-weighted index that tracks the performance of publicly placed, non-convertible, fixed-rate, |
| | | coupon-bearing, investment-grade U.S. domestic debt. Maturities of the securities range from one to |
| | | five years. |

† Source: Lipper Inc.
Past performance is not predictive of future performance.
The above graph compares a $10,000 investment made in Class A, Class B, Class D and Class P shares of Dreyfus Premier Short Term Income Fund on 7/31/95 to a $10,000 investment made in the Merrill Lynch 1-5 Year Corporate/Government Index (the “Index”) on that date. All dividends and capital gain distributions are reinvested. Performance for Class A, B and P shares of the fund shown above represent the performance of the fund’s Class D shares for periods prior to November 1, 2002 (the inception date for Class A, B and P shares), and are adjusted to reflect the applicable sales load of that class. Performance for each share class does not include differences in distribution/servicing fees prior to November1, 2002, which would have lowered the performance for Class A, B and P shares.
The fund’s performance shown in the line graph above takes into account the maximum initial sales charge on Class A shares and all other applicable fees and expenses on all classes.The fund invests primarily in debt securities and securities with debt-like characteristics of domestic and foreign issuers and maintains an average effective maturity and an average effective duration of three years or less.The Index is an unmanaged performance benchmark including U.S. government and fixed-coupon domestic investment-grade corporate bonds with maturities greater than or equal to one year and less than five years.The Index does not take into account charges, fees and other expenses. Further information relating to fund performance, including expense reimbursements, if applicable, is contained in the Financial Highlights section of the prospectus and elsewhere in this report.
| Average Annual Total Returns as of 7/31/05 | | | | |
| | | 1 Year | | 5 Years | | 10 Years |
| |
| |
| |
|
| Class A shares | | | | | | |
| with maximum sales charge (3.0%) | | (0.08%) | | 3.04% | | 4.82% |
| without sales charge | | 2.97% | | 3.66% | | 5.14% |
| Class B shares | | | | | | |
| with applicable redemption charge † | | (1.60%) | | 3.00% | | 5.14% |
| without redemption | | 2.37% | | 3.33% | | 5.14% |
| Class D shares | | 2.99% | | 3.65% | | 5.13% |
| Class P shares | | 3.01% | | 3.70% | | 5.16% |
Past performance is not predictive of future performance.The fund’s performance shown in the graph and table does not reflect the deduction of taxes that a shareholder would pay on fund distributions or the redemption of fund shares.The performance figures for Class A, Class B and Class P shares shown in the table include the performance of Class D shares for periods prior to November 1, 2002, and are adjusted to reflect the applicable sales load of that class but do not include current distribution/servicing fees of each share class prior to that date. Performance for Class B shares assumes the conversion of Class B shares to Class A shares at the end of the sixth year following the date of purchase.
† The maximum contingent deferred sales charge for Class B shares is 4%. After six years Class B shares convert to Class A shares.
UNDERSTANDING YOUR FUND’S EXPENSES(Unaudited)
As a mutual fund investor, you pay ongoing expenses, such as management fees and other expenses. Using the information below, you can estimate how these expenses affect your investment and compare them with the expenses of other funds.You also may pay one-time transaction expenses, including sales charges (loads) and redemption fees, which are not shown in this section and would have resulted in higher total expenses. For more information, see your fund’s prospectus or talk to your financial adviser.
Review your fund’s expenses
The table below shows the expenses you would have paid on a $1,000 investment in Dreyfus Premier Short Term Income Fund from February 1, 2005 to July 31, 2005. It also shows how much a $1,000 investment would be worth at the close of the period, assuming actual returns and expenses.
| Expenses and Value of a $1,000 Investment | | | | | | |
| assuming actual returns for the six months ended July 31, 2005 | | | | |
| | | Class A | | Class B | | Class D | | Class P |
| |
| |
| |
| |
|
| Expenses paid per $1,000 † | | $ 4.57 | | $ 7.44 | | $ 4.37 | | $ 4.27 |
| Ending value (after expenses) | | $1,005.50 | | $1,001.70 | | $1,004.70 | | $1,004.80 |
COMPARING YOUR FUND’S EXPENSES WITH THOSE OF OTHER FUNDS (Unaudited)
Using the SEC’s method to compare expenses
The Securities and Exchange Commission (SEC) has established guidelines to help investors assess fund expenses. Per these guidelines, the table below shows your fund’s expenses based on a $1,000 investment, assuming a hypothetical 5% annualized return. You can use this information to compare the ongoing expenses (but not transaction expenses or total cost) of investing in the fund with those of other funds.All mutual fund shareholder reports will provide this information to help you make this comparison. Please note that you cannot use this information to estimate your actual ending account balance and expenses paid during the period.
Expenses and Value of a $1,000 Investment assuming a hypothetical 5% annualized return for the six months ended July 31, 2005
| | | Class A | | Class B | | Class D | | Class P |
| |
| |
| |
| |
|
| Expenses paid per $1,000 † | | $ 4.61 | | $ 7.50 | | $ 4.41 | | $ 4.31 |
| Ending value (after expenses) | | $1,020.23 | | $1,017.36 | | $1,020.43 | | $1,020.53 |
† Expenses are equal to the fund’s annualized expense ratio of .92% for Class A, 1.50% for Class B, .88% for Class D and .86% for Class P; multiplied by the average account value over the period, multiplied by 181/365 (to reflect the one-half year period).
STATEMENT OF INVESTMENTS
July 31, 2005
|
| | | Principal | | | | |
| Bonds and Notes—99.4% | | Amount a | | Value ($) |
| |
| |
|
| Aerospace & Defense—.1% | | | | | | |
| L-3 Communications, | | | | | | |
| Sr. Sub. Notes, 6.375%, 2015 | | 250,000 | | b | | 253,125 |
| Agricultural—.7% | | | | | | |
| Altria, | | | | | | |
| Notes, 7.2%, 2007 | | 3,035,000 | | | | 3,146,078 |
| Airlines—.0% | | | | | | |
| USAir, | | | | | | |
| Enhanced Equipment Notes, Ser. C, 8.93%, 2009 | | 1,092,319 | | c,d | | 109 |
| Asset-Backed Ctfs-Automobile Receivables—3.5% | | | | |
| Daimler Chrysler Auto Trust, | | | | | | |
| Ser. 2005-B, Cl. A4, 4.2%, 2010 | | 1,842,000 | | | | 1,829,336 |
| Ford Credit Auto Owner Trust, | | | | | | |
| Ser. 2005-B, Cl. B, 4.64%, 2010 | | 1,500,000 | | | | 1,498,825 |
| WFS Financial Owner Trust: | | | | | | |
| Ser. 2003-3, Cl. A4, 3.25%, 2011 | | 10,675,000 | | | | 10,526,753 |
| Ser. 2005-2, Cl. B, 4.57%, 2012 | | 2,500,000 | | | | 2,500,950 |
| | | | | | | 16,355,864 |
| Asset-Backed Ctfs.-Home Equity Loans—3.1% | | | | | | |
| Accredited Mortgage Loan Trust, | | | | | | |
| Ser. 2005-2, Cl. A2A, 3.56%, 2035 | | 1,165,099 | | e | | 1,165,452 |
| Ameriquest Mortgage Securities, | | | | | | |
| Ser. 2003-11, Cl. AF6, 5.14%, 2034 | | 1,225,000 | | | | 1,231,130 |
| Bayview Financial Acquisition Trust, | | | | | | |
| Ser. 2005-B, Cl. 1A6, 5.208%, 2039 | | 1,985,000 | | | | 1,997,716 |
| Bear Stearns Asset Backed Securities, | | | | | | |
| Ser. 2005-TC1, Cl. A1, 3.57%, 2035 | | 989,601 | | e | | 989,571 |
| Citigroup Mortgage Loan Trust, | | | | | | |
| Ser. 2005-HE1, Cl. A3A, 3.55%, 2035 | | 1,628,327 | | e | | 1,628,522 |
| Conseco Finance: | | | | | | |
| Ser. 2001-D, Cl. A4, 5.53%, 2032 | | 774,282 | | | | 776,774 |
| Home Equity Asset Trust, | | | | | | |
| Ser. 2005-4, Cl. 2A1, 3.55%, 2035 | | 2,720,398 | | e | | 2,721,992 |
| Morgan Stanley ABS Capital I, | | | | | | |
| Ser. 2005-WMC3 Cl. A2A, 3.55%, 2035 | | 1,434,136 | | e | | 1,434,250 |
| Morgan Stanley Home Equity Loans, | | | | | | |
| Ser. 2005-2, Cl. A2A, 3.55%, 2035 | | 2,258,772 | | e | | 2,257,032 |
| | | | | | | 14,202,439 |
| | STATEMENT OF INVESTMENTS (continued)
|
| | | Principal | | | | |
| Bonds and Notes (continued) | | Amount a | | Value ($) |
| |
| |
|
| Asset-Backed Ctfs.-Manufactured Housing—.3% | | | | |
| Green Tree Financial, | | | | | | |
| Ser. 1994-7, Cl. M1, 9.25%, 2020 | | 1,179,277 | | | | 1,254,541 |
| Asset-Backed Ctfs.-Other—6.2% | | | | | | |
| Carrington Mortgage Loan Trust, | | | | | | |
| Ser. 2005-OPT2, Cl. A1A, 3.55%, 2035 | | 1,140,146 | | e | | 1,140,169 |
| Conseco Finance, | | | | | | |
| Ser. 2000-E, Cl. A5, 8.02%, 2031 | | 2,282,427 | | | | 2,332,663 |
| Equity One ABS: | | | | | | |
| Ser. 2004-2, Cl. AF2, 2.829%, 2034 | | 6,000,000 | | | | 5,979,310 |
| Ser. 2004-2, Cl. AF3, 3.515%, 2034 | | 6,000,000 | | | | 5,962,329 |
| Merrill Lynch Mortgage Investors, | | | | | | |
| Ser. 2005-WMC2, Cl. A2A, 3.55%, 2036 | | 1,228,071 | | e | | 1,228,120 |
| Park Place Securities, | | | | | | |
| Ser. 2005-WHQ2, Cl. A2A, 3.56%, 2035 | | 2,819,348 | | e | | 2,821,436 |
| Residential Asset Mortgage Products: | | | | | | |
| Ser. 2003-RS9, Cl. MI1, 5.8%, 2033 | | 1,100,000 | | | | 1,104,633 |
| Ser. 2004-RS12, Cl. AII1, 3.59%, 2027 | | 1,887,676 | | e | | 1,889,586 |
| Saxon Asset Securities Trust, | | | | | | |
| Ser. 2004-2, Cl. AF2, 4.15%, 2035 | | 6,365,000 | | | | 6,293,104 |
| | | | | | | 28,751,350 |
| Auto Manufacturing—.3% | | | | | | |
| DaimlerChrysler: | | | | | | |
| Notes, 4.05%, 2008 | | 960,000 | | | | 940,795 |
| Notes, 4.875%, 2010 | | 285,000 | | | | 282,185 |
| | | | | | | 1,222,980 |
| Banking—9.0% | | | | | | |
| Chevy Chase Bank FSB, | | | | | | |
| Sub. Notes, 6.875%, 2013 | | 590,000 | | | | 613,600 |
| Fleet National Bank, | | | | | | |
| Sub. Notes, 5.75%, 2009 | | 4,750,000 | | f | | 4,931,569 |
| Marshall & Ilsley, | | | | | | |
| Notes, 4.375%, 2009 | | 5,300,000 | | | | 5,267,363 |
| Northern Trust, | | | | | | |
| Notes, 2.875%, 2006 | | 2,610,000 | | | | 2,563,967 |
| Sumitomo Mitsui Banking, | | | | | | |
| Notes, 5.625%, 2049 | | 685,000 | | b,f | | 683,734 |
| Suntrust Capital II, | | | | | | |
| Bonds, 7.9%, 2027 | | 2,270,000 | | | | 2,467,090 |
| Union Planters, | | | | | | |
| Notes, 4.375%, 2010 | | 1,625,000 | | | | 1,594,005 |
10
| | | Principal | | | | |
| Bonds and Notes (continued) | | Amount a | | Value ($) |
| |
| |
|
| Banking (continued) | | | | | | |
| US Bancorp, | | | | | | |
| Sub. Notes, 6.875%, 2007 | | 2,661,000 | | | | 2,790,663 |
| Washington Mutual, | | | | | | |
| Sr. Notes, 4%, 2009 | | 6,400,000 | | | | 6,275,245 |
| Wells Fargo & Co., | | | | | | |
| Sub. Notes, 6.375%, 2011 | | 5,575,000 | | | | 6,050,113 |
| Wells Fargo Capital B, | | | | | | |
| Bonds, 7.95%, 2026 | | 1,440,000 | | b | | 1,548,783 |
| World Savings Bank, | | | | | | |
| Sr. Notes, 4.125%, 2008 | | 4,875,000 | | | | 4,823,910 |
| Zions Bancorporation, | | | | | | |
| Sr. Notes, 2.7%, 2006 | | 2,215,000 | | | | 2,188,987 |
| | | | | | | 41,799,029 |
| Chemicals—1.0% | | | | | | |
| Lubrizol, | | | | | | |
| Sr. Notes, 4.625%, 2009 | | 2,945,000 | | f | | 2,920,668 |
| RPM International: | | | | | | |
| Bonds, 6.25%, 2013 | | 1,280,000 | | | | 1,329,242 |
| Sr. Notes, 4.45%, 2009 | | 625,000 | | | | 606,672 |
| | | | | | | 4,856,582 |
| Commercial & Professional Services—.6% | | | | |
| Aramark Services, | | | | | | |
| Notes, 5%, 2012 | | 1,800,000 | | | | 1,768,072 |
| Deluxe, | | | | | | |
| Notes, Ser. B, 3.5%, 2007 | | 235,000 | | | | 228,266 |
| Erac USA Finance, | | | | | | |
| Bonds, 5.6%, 2015 | | 720,000 | | b | | 729,446 |
| | | | | | | 2,725,784 |
| Commercial Mortgage Pass-Through Ctfs.—1.9% | | | | |
| Banc of America Commercial Mortgage, | | | | | | |
| Ser. 2005-2, Cl. A2, 4.247%, 2043 | | 1,900,000 | | | | 1,886,552 |
| Calwest Industrial Trust, | | | | | | |
| Ser. 2002-CALW, Cl. A, 6.127%, 2017 | | 2,325,000 | | b | | 2,496,863 |
| Crown Castle Towers, | | | | | | |
| Ser. 2005-1A, Cl. D, 5.612%, 2035 | | 565,000 | | b | | 557,540 |
| LB-UBS Commercial Mortgage Trust, | | | | | | |
| Ser. 2002-C4, Cl. A1, 3.268%, 2026 | | 3,716,103 | | | | 3,667,652 |
| | | | | | | 8,608,607 |
| | STATEMENT OF INVESTMENTS (continued)
|
| | | Principal | | |
| Bonds and Notes (continued) | | Amount a | | Value ($) |
| |
| |
|
| Diversified Financial Services—13.0% | | | | |
| Amvescap: | | | | |
| Notes, 5.375%, 2013 | | 1,300,000 | | 1,311,666 |
| Sr. Notes, 5.9%, 2007 | | 1,000,000 | | 1,019,729 |
| Bear Stearns & Cos., | | | | |
| Notes, 4.5%, 2010 | | 2,650,000 | | 2,618,256 |
| Boeing Capital, | | | | |
| Notes, 7.375%, 2010 | | 2,095,000 | | 2,358,763 |
| Citicorp, | | | | |
| Sub. Notes, 7.25%, 2008 | | 3,290,000 | | 3,536,105 |
| Countrywide Home Loans, | | | | |
| Notes, Ser. L, 4%, 2011 | | 1,850,000 | | 1,762,589 |
| Credit Suisse First Boston, | | | | |
| Notes, 4.625%, 2008 | | 4,000,000 | | 4,013,096 |
| Ford Motor Credit: | | | | |
| Global Landmark Securities, 6.5%, 2007 | | 1,955,000 f | | 1,976,141 |
| Notes, 7.75%, 2007 | | 445,000 | | 454,779 |
| General Electric Capital, | | | | |
| Notes, Ser A, 4.25%, 2008 | | 4,925,000 | | 4,906,058 |
| Goldman Sachs, | | | | |
| Notes, 5.7%, 2012 | | 2,500,000 | | 2,612,690 |
| HSBC Finance, | | | | |
| Bonds, 4.75%, 2010 | | 1,675,000 f | | 1,673,993 |
| International Lease Finance, | | | | |
| Notes, 4.75%, 2012 | | 2,020,000 | | 1,977,222 |
| JPMorgan Chase & Co., | | | | |
| Sr. Notes, 3.625%, 2008 | | 6,800,000 | | 6,657,866 |
| John Deere Capital, | | | | |
| Sr. Notes, Ser. D, 4.4%, 2009 | | 1,400,000 | | 1,390,593 |
| Lehman Brothers, | | | | |
| Notes, 3.5%, 2008 | | 4,100,000 | | 3,973,552 |
| Merrill Lynch & Co, | | | | |
| Notes, 4.125%, 2009 | | 5,400,000 | | 5,306,796 |
| Morgan Stanley, | | | | |
| Notes, 4%, 2010 | | 5,435,000 f | | 5,277,309 |
| Residential Capital, | | | | |
| Notes, 6.375%, 2010 | | 2,375,000 b | | 2,415,686 |
| USA Education, | | | | |
| Medium-Term Notes, Ser. A, 5.625%, 2007 | | 4,910,000 | | 5,002,200 |
| | | | | 60,245,089 |
12
| | | Principal | | |
| Bonds and Notes (continued) | | Amount a | | Value ($) |
| |
| |
|
| Diversified Metals & Mining—.2% | | | | |
| Ispat Inland, | | | | |
| Secured Notes, 9.75%, 2014 | | 345,000 | | 408,825 |
| Southern Peru Copper, | | | | |
| Notes, 7.5%, 2035 | | 625,000 b | | 620,661 |
| | | | | 1,029,486 |
| Electric Utilities—3.7% | | | | |
| Ameren, | | | | |
| Bonds, 4.263%, 2007 | | 1,200,000 | | 1,194,838 |
| FPL Energy National Wind, | | | | |
| Notes, 5.608%, 2024 | | 240,000 b | | 240,496 |
| FirstEnergy, | | | | |
| Notes, Ser. B, 6.45%, 2011 | | 665,000 | | 716,049 |
| Florida Power & Light, | | | | |
| First Mortgage, 6.875%, 2005 | | 6,525,000 | | 6,585,467 |
| Monongahela Power, | | | | |
| First Mortgage, 5%, 2006 | | 2,950,000 | | 2,963,178 |
| Sierra Pacific Power, | | | | |
| Mortgage Notes, 6.25%, 2012 | | 475,000 | | 498,750 |
| Virginia Electric and Power, | | | | |
| Sr. Notes, Ser. A, 5.75%, 2006 | | 4,930,000 | | 4,977,348 |
| | | | | 17,176,126 |
| Environmental Control—.5% | | | | |
| Waste Management, | | | | |
| Sr. Notes, 6.875%, 2009 | | 2,000,000 | | 2,139,498 |
| Food & Beverages—1.2% | | | | |
| Fred Meyer, | | | | |
| Notes, 7.45%, 2008 | | 3,500,000 | | 3,730,804 |
| Safeway, | | | | |
| Notes, 4.8%, 2007 | | 1,555,000 | | 1,557,465 |
| Stater Brothers, | | | | |
| Sr. Notes, 8.125%, 2012 | | 480,000 | | 487,200 |
| | | | | 5,775,469 |
| Foreign Governmental—6.1% | | | | |
| Argentina Bonos, | | | | |
| Bonds, 3.9506%, 2012 | | 655,000 e | | 608,325 |
| Banco Nacional de Desenvolvimento | | | | |
| Economico e Social, | | | | |
| Notes, 5.822%, 2008 | | 1,585,000 e | | 1,589,142 |
STATEMENT OF INVESTMENTS (continued)
|
| | | | | Principal | | |
| Bonds and Notes (continued) | | | | Amount a | | Value ($) |
| |
| |
| |
|
| Foreign Governmental (continued) | | | | |
| Deutsche Bundesrepublik: | | | | | | |
| Bonds, Ser. 03, 4.5%, 2013 | | EUR | | 3,625,000 | | 4,830,317 |
| Bonds, Ser. 98, 4.125%, 2008 | | EUR | | 3,700,000 | | 4,706,428 |
| Export-Import Bank Of Korea, | | | | | | |
| Sr. Notes, 4.5%, 2009 | | | | 1,425,000 | | 1,412,275 |
| Republic of Peru, | | | | | | |
| Bonds, 7.35%, 2025 | | | | 420,000 | | 419,370 |
| Republic of South Africa, | | | | | | |
| Notes, 9.125%, 2009 | | | | 1,720,000 | | 1,971,550 |
| Russian Federation, | | | | | | |
| Bonds, 10%, 2007 | | | | 2,305,000 b | | 2,538,381 |
| Swedish Government, | | | | | | |
| Bonds, Ser. 1045, 5.25%, 2011 | | SEK | | 63,480,000 | | 9,259,323 |
| United Mexican States, | | | | | | |
| Notes, 6.75%, 2034 | | | | 1,110,000 | | 1,172,715 |
| | | | | | | 28,507,826 |
| Gaming & Lodging—.5% | | | | | | |
| Harrah’s Operating, | | | | | | |
| Sr. Notes, 8%, 2011 | | | | 1,090,000 | | 1,236,177 |
| MGM Mirage, | | | | | | |
| Sr. Notes, 6%, 2009 | | | | 525,000 | | 528,938 |
| Mohegan Tribal Gaming Authority, | | | | | | |
| Sr. Notes, 6.125%, 2013 | | | | 775,000 | | 789,531 |
| | | | | | | 2,554,646 |
| Health Care—.4% | | | | | | |
| American Home Products, | | | | | | |
| Notes, 6.95%, 2011 | | | | 1,150,000 e | | 1,262,235 |
| Medco Health Solutions, | | | | | | |
| Sr. Notes, 7.25%, 2013 | | | | 350,000 | | 390,175 |
| | | | | | | 1,652,410 |
| Manufacturing—.3% | | | | | | |
| Bombardier, | | | | | | |
| Notes, 6.3%, 2014 | | | | 800,000 b,f | | 756,000 |
| Tyco International, | | | | | | |
| Notes, 6%, 2013 | | | | 770,000 | | 827,303 |
| | | | | | | 1,583,303 |
| | | Principal | | |
| Bonds and Notes (continued) | | Amount a | | Value ($) |
| |
| |
|
| Media—3.7% | | | | |
| AOL Time Warner, | | | | |
| Notes, 6.75%, 2011 | | 1,195,000 | | 1,308,088 |
| British Sky Broadcasting, | | | | |
| Notes, 7.3%, 2006 | | 4,880,000 | | 5,039,273 |
| Clear Channel Communications: | | | | |
| Sr. Notes, 5%, 2012 | | 1,350,000 | | 1,259,662 |
| Sr. Notes, 6%, 2006 | | 725,000 | | 734,231 |
| Comcast, | | | | |
| Notes, 5.5%, 2011 | | 1,240,000 | | 1,277,361 |
| Media General, | | | | |
| Notes, 6.95%, 2006 | | 5,000,000 | | 5,137,500 |
| Time Warner, | | | | |
| Notes, 6.15%, 2007 | | 2,450,000 f | | 2,521,663 |
| | | | | 17,277,778 |
| Oil & Gas—1.5% | | | | |
| Amerada Hess, | | | | |
| Notes, 6.65%, 2011 | | 530,000 | | 576,317 |
| BP Capital Markets, | | | | |
| Notes, 2.75%, 2006 | | 4,600,000 | | 4,507,154 |
| Enterprise Products Operating, | | | | |
| Sr. Notes, Ser. B, 4.625%, 2009 | | 2,045,000 | | 2,014,231 |
| | | | | 7,097,702 |
| Paper & Forest Products—1.4% | | | | |
| Celulosa Arauco y Constitucion, | | | | |
| Notes, 5.625%, 2015 | | 1,130,000 b | | 1,128,303 |
| Georgia-Pacific, | | | | |
| Sr. Notes, 8.875%, 2010 | | 1,795,000 | | 2,028,350 |
| International Paper, | | | | |
| Notes, 4.25%, 2009 | | 2,550,000 f | | 2,494,048 |
| Weyerhaeuser, | | | | |
| Debs., 7.25%, 2013 | | 625,000 | | 695,245 |
| | | | | 6,345,946 |
| Property-Casualty Insurance—.8% | | | | |
| AON Capital A, | | | | |
| Capital Securities, 8.205%, 2027 | | 1,100,000 | | 1,273,012 |
STATEMENT OF INVESTMENTS (continued)
|
| | | Principal | | | | |
| Bonds and Notes (continued) | | Amount a | | Value ($) |
| |
| |
|
| Property-Casualty Insurance (continued) | | | | | | |
| Metlife, | | | | | | |
| Sr. Notes, 5%, 2015 | | 1,200,000 | | | | 1,200,415 |
| Nippon Life Insurance, | | | | | | |
| Notes, 4.875%, 2010 | | 1,050,000 | | b | | 1,044,183 |
| | | | | | | 3,517,610 |
| Real Estate Investment Trusts—2.7% | | | | | | |
| Archstone-Smith Operating Trust, | | | | | | |
| Notes, 5.25%, 2015 | | 925,000 | | | | 925,575 |
| Arden Realty, | | | | | | |
| Notes, 5.25%, 2015 | | 475,000 | | | | 466,645 |
| Duke Realty, | | | | | | |
| Sr. Notes, 5.875%, 2012 | | 3,000,000 | | | | 3,104,547 |
| EOP Operating, | | | | | | |
| Sr. Notes, 7%, 2011 | | 1,450,000 | | | | 1,594,284 |
| ERP Operating, | | | | | | |
| Notes, 4.75%, 2009 | | 2,400,000 | | | | 2,389,178 |
| Healthcare Realty Trust, | | | | | | |
| Sr. Notes, 5.125%, 2014 | | 1,165,000 | | | | 1,127,443 |
| Mack-Cali Realty, | | | | | | |
| Notes, 5.05%, 2010 | | 550,000 | | | | 549,359 |
| Simon Property, | | | | | | |
| Notes, 4.875%, 2010 | | 2,275,000 | | | | 2,265,249 |
| | | | | | | 12,422,280 |
| Residential Mortgage Pass-Through Ctfs.—5.7% | | | | |
| Countrywide Alternative Loan Trust, | | | | | | |
| Ser. 2004-7T1, Cl. A1, 5.75%, 2034 | | 10,020,271 | | | | 10,076,793 |
| Ser. 2005-J4, Cl. 2A1B, 3.43438%, 2035 | | 2,312,326 | | e | | 2,310,436 |
| First Horizon Alternative Mortgage Securities I, | | | | |
| Ser. 2004-FA1, Cl. A1, 6.25%, 2034 | | 4,173,411 | | | | 4,260,855 |
| GSR Mortgage Loan Trust II, | | | | | | |
| Ser. 2004-12, Cl. A2, 3.554%, 2034 | | 3,554,483 | | e | | 3,492,757 |
| Nomura Asset Acceptance: | | | | | | |
| Ser. 2005-AP2, Cl. A5, 4.976%, 2035 | | 750,000 | | | | 739,678 |
| Ser. 2005-WF1, Cl. 2A5, 5.159%, 2035 | | 1,575,000 | | | | 1,565,991 |
| | | Principal | | | | |
| Bonds and Notes (continued) | | Amount a | | Value ($) |
| |
| |
|
| Residential Mortgage Pass-Through Ctfs. (continued) | | | | |
| Structured Adjustable Rate Mortgage Loan Trust, | | | | |
| Ser. 2005-8XS, Cl. A1, 3.56%, 2035 | | 1,037,627 | | e | | 1,037,627 |
| Washington Mutual, | | | | | | |
| Ser. 2005-AR4, Cl. A4B, 4.681%, 2035 | | 3,294,000 | | e | | 3,255,913 |
| | | | | | | 26,740,050 |
| Retail—.3% | | | | | | |
| May Department Stores, | | | | | | |
| Notes, 3.95%, 2007 | | 1,275,000 | | | | 1,260,325 |
| Structured Index—1.2% | | | | | | |
| AB Svensk Exportkredit, | | | | | | |
| GSNE-ER Indexed Notes, 0%, 2007 | | 5,845,000 | | b,g | | 5,473,843 |
| Technology—.1% | | | | | | |
| Freescale Semiconductor, | | | | | | |
| Sr. Notes, 6.875%, 2011 | | 415,000 | | | | 439,900 |
| Telecommunications—2.4% | | | | | | |
| Alltel, | | | | | | |
| Notes, 4.656%, 2007 | | 1,050,000 | | | | 1,053,780 |
| Deutsche Telekom International Finance, | | | | | | |
| Bonds, 8.75%, 2030 | | 775,000 | | e | | 1,039,880 |
| France Telecom, | | | | | | |
| Notes, 8%, 2011 | | 1,165,000 | | | | 1,335,688 |
| Nextel Communications, | | | | | | |
| Sr. Notes, 5.95%, 2014 | | 605,000 | | | | 628,444 |
| Sprint Capital, | | | | | | |
| Sr. Notes, 7.625%, 2011 | | 2,375,000 | | | | 2,683,434 |
| Verizon Global Funding, | | | | | | |
| Notes, 7.25%, 2010 | | 4,100,000 | | | | 4,572,833 |
| | | | | | | 11,314,059 |
| Transportation—.8% | | | | | | |
| Union Pacific: | | | | | | |
| Notes, 3.875%, 2009 | | 1,350,000 | | | | 1,314,279 |
| Notes, 5.75%, 2007 | | 2,510,000 | | | | 2,573,204 |
| | | | | | | 3,887,483 |
STATEMENT OF INVESTMENTS (continued)
|
| | | Principal | | | | |
| Bonds and Notes (continued) | | Amount a | | Value ($) |
| |
| |
|
| U.S. Government—12.0% | | | | | | |
| U.S.Treasury Inflation Protected Securities | | | | | | |
| .875%, 4/15/2010 | | 17,506,801 | | h | | 16,809,977 |
| U.S. Treasury Notes, | | | | | | |
| 3%, 12/31/2006 | | 12,300,000 | | | | 12,138,501 |
| 3.375%, 9/15/2009 | | 3,000,000 | | | | 2,914,923 |
| 3.5%, 2/15/2010 | | 510,000 | | | | 496,573 |
| 3.625%, 4/30/2007 | | 23,375,000 | | | | 23,230,543 |
| | | | | | | 55,590,517 |
| U.S. Government Agencies/Mortgage-Backed—14.2% | | | | |
| Federal Home Loan Mortgage Corp.: | | | | | | |
| 4%, 2/1/2010-4/1/2010 | | 25,581,626 | | | | 25,202,964 |
| 4.5%, 2/1/2010 | | 3,507,772 | | | | 3,505,562 |
| 6.5%, 3/1/2032 | | 1,138,211 | | | | 1,178,847 |
| REMIC, Gtd. Multiclass Mortgage Participation Ctfs., | | | | |
| Ser. 2535, Cl. PL, 4%, 6/15/2029 | | 2,247,720 | | | | 2,241,536 |
| Ser. 2567, Cl. OH, 4%, 3/15/2010 | | 794,641 | | | | 794,625 |
| (Interest Only Obligations) | | | | | | |
| Ser. 1987, Cl. PI, 7%, 9/15/2012 | | 243,292 | | i | | 28,643 |
| Federal National Mortgage Association: | | | | | | |
| 4%, 2/1/2010-5/1/2010 | | 3,902,853 | | | | 3,826,006 |
| 4.645%, 2/1/2029 | | 91,149 | | e | | 93,680 |
| 6% | | 7,200,000 | | j | | 7,436,232 |
| 6%, 9/1/2034 | | 872,657 | | | | 892,080 |
| REMIC Trust, Gtd. Pass-Through Ctfs.: | | | | | | |
| Ser. 2003-49, Cl. JE, 3%, 4/25/2033 | | 1,143,954 | | | | 1,083,163 |
| (Interest Only Obligations) | | | | | | |
| Ser. 2001-72, Cl. IA, 6%, 3/25/2030 | | 50,133 | | i | | 650 |
| Government National Mortgage Association I: | | | | | | |
| 5.5%, 2/15/2034-9/15/2034 | | 4,747,728 | | | | 4,811,490 |
| 6%, 12/15/2031-4/15/2033 | | 940,775 | | | | 968,194 |
| Project Loan, | | | | | | |
| 8%, 9/15/2008 | | 290,009 | | | | 295,447 |
| Gtd. Multifamily REMIC Pass-Through Securities: | | | | |
| Ser. 2005-29, Cl. A, 4.016%, 7/16/2027 | | 1,370,259 | | | | 1,341,717 |
| | | Principal | | |
| Bonds and Notes (continued) | | Amount a | | Value ($) |
| |
| |
|
| U.S. Government Agencies/Mortgage-Backed (continued) | | |
| Government National Mortgage Association I (continued): | | |
| Gtd. Multifamily REMIC Pass-Through Securities (continued): | | |
| Ser. 2005-32, Cl. B, 4.385%, 8/16/2030 | | 1,525,000 | | 1,508,942 |
| Ser. 2005-34, Cl. A, 3.956%, 9/16/2021 | | 2,582,659 | | 2,542,781 |
| Ser. 2005-42, Cl. A, 4.045%, 7/16/2020 | | 4,782,472 | | 4,685,866 |
| Ser. 2005-50, Cl. A, 4.287%, 1/16/2030 | | 1,240,000 | | 1,215,588 |
| Ser. 2005-52, Cl. A, 4.015%, 11/16/2030 | | 900,000 | | 892,440 |
| Ser. 2005-59, Cl. A, 4.32185%, 5/16/2010 | | 950,000 | | 943,172 |
| Government National Mortgage Association II: | | | | |
| 3.375%, 4/20/2030 | | 581,223 e | | 588,268 |
| 7%, 12/20/2030-4/20/2031 | | 54,147 | | 56,955 |
| 7.5%, 11/20/2029-12/20/2030 | | 56,328 | | 59,954 |
| | | | | 66,194,802 |
| Total Bonds and Notes | | | | |
| (cost $467,545,156) | | | | 461,402,636 |
| |
| |
|
| |
| Other Investment—.2% | | Shares | | Value ($) |
| |
| |
|
| Registered Investment Company; | | | | |
| Dreyfus Institutional Preferred Plus Money Market Fund | | |
| (cost $857,000) | | 857,000 k | | 857,000 |
| |
| |
|
| |
| | | Principal | | |
| Short-Term Investments—1.9% | | Amount a | | Value ($) |
| |
| |
|
| U.S. Government Agencies—1.8% | | | | |
| Federal National Mortgage Association: | | | | |
| 3.38%, 8/16/2005 | | 7,500,000 | | 7,490,073 |
| 3.47%, 8/30/2005 | | 950,000 | | 947,521 |
| | | | | 8,437,594 |
| U.S. Treasury Bills—.1% | | | | |
| 2.97%, 9/8/2005 | | 200,000 l | | 199,344 |
| Total Short-Term Investments | | | | |
| (cost $8,636,980) | | | | 8,636,938 |
STATEMENT OF INVESTMENTS (continued)
|
| Investment of Cash Collateral | | | | | | |
| for Securities Loaned—2.6% | | | | Shares | | Value ($) |
| |
| |
| |
|
| Registered Investment Company; | | | | | | |
| Dreyfus Institutional Cash Advantage Fund | | | | |
| (cost $12,004,210) | | | | 12,004,210 k | | 12,004,210 |
| |
| |
| |
|
| |
| Total Investments (cost $489,043,346) | | 104.1% | | 482,900,784 |
| |
| Liabilities, Less Cash and Receivables | | (4.1%) | | (19,046,415) |
| |
| Net Assets | | | | 100.0% | | 463,854,369 |
| |
| a | | Principal amount stated in U.S. Dollars unless otherwise noted. | | |
| | | EUR—Euro | | | | | | |
| | | SEK—Swedish Krona | | | | | | |
| b | | Securities exempt from registration under Rule 144A of the Securities Act of 1933.These securities may be resold in |
| | | transactions exempt from registration, normally to qualified institutional buyers. At July 31, 2005, these securities |
| | | amounted to $20,487,044 or 4.4% of net assets. | | | | |
| c | | The value of this security has been determined in good faith under the direction of the Board of Directors. |
| d | | Non-income producing—security in default. | | | | |
| e | | Variable rate security—interest rate subject to periodic change. | | |
| f | | All or a portion of these securities are on loan. At July 31, 2005, the total market value of the fund’s securities on |
| | | loan is $11,627,291 and the total market value of the collateral held by the fund is $12,004,210. |
| g | | Security linked to Goldman Sachs Non Energy—Excess Return Index. | | |
| h | | Principal amount for accrual purposes is periodically adjusted based on changes in the Consumer Price Index. |
| i | | Notional face amount shown. | | | | | | |
| j | | Purchased on a forward commitment basis. | | | | | | |
| k | | Investments in affiliated money market mutual funds. | | |
| l | | Held by a broker as collateral for open financial futures positions. | | |
| |
| |
|
| |
| |
| |
| |
| Portfolio Summary † | | | | | | |
| |
| | | Value (%) | | | | Value (%) |
| |
| |
| |
|
| Corporate Bonds | | 45.2 | | Structured Index | | 1.2 |
| U.S. Government & Agencies | | 26.2 | | Futures/Forward Currency | | |
| Asset/Mortgage Backed | | 20.7 | | Exchange Contracts | | .1 |
| Foreign Governmental | | 6.1 | | | | |
| Short-Term/Money Market Investments | | 4.7 | | | | 104.2 |
| |
| † | | Based on net assets. | | | | | | |
| See notes to financial statements. | | | | | | |
STATEMENT OF FINANCIAL FUTURES
July 31, 2005
| | | | | | | | | Unrealized |
| | | | | Market Value | | | | Appreciation |
| | | | | Covered by | | | | (Depreciation) |
| | | Contracts | | Contracts ($) | | Expiration | | at 7/31/2005 ($) |
| |
| |
| |
| |
|
| Financial Futures Long | | | | | | | | |
| U.S. Treasury 5 Year Notes | | 415 | | 44,489,297 | | September 2005 | | (537,813) |
| Financial Futures Short | | | | | | | | |
| U.S. Treasury 10 Year Notes | | 430 | | 47,723,281 | | September 2005 | | 865,547 |
| U.S. Treasury 30 Year Bonds | | 35 | | 4,035,938 | | September 2005 | | 36,250 |
| | | | | | | | | 363,984 |
See notes to financial statements.
|
STATEMENT OF ASSETS AND LIABILITIES
July 31, 2005
| | | | | | | Cost | | Value |
| |
| |
| |
| |
|
| Assets ($): | | | | | | | | |
| Investments in securities— | | | | | | | | |
| See Statement of Investments (including securities | | | | |
| on loan, valued at $11,627,291)—Note 1(c): | | | | | | |
| Unaffiliated issuers | | | | | | 476,182,136 | | 470,039,574 |
| Affiliated issuers | | | | | | 12,861,210 | | 12,861,210 |
| Cash | | | | | | | | 151,296 |
| Dividends and interest receivable | | | | | | | | 4,342,414 |
| Receivable for investment securities sold | | | | | | 110,907 |
| Receivable for futures variation margin—Note 4 | | | | | | 175,625 |
| Receivable for shares of Common Stock subscribed | | | | 83,461 |
| Net unrealized appreciation on forward | | | | | | |
| currency exchange contracts—Note 4 | | | | | | 1,718 |
| Prepaid expenses | | | | | | | | 28,489 |
| | | | | | | | | 487,794,694 |
| |
| |
| |
| |
|
| Liabilities ($): | | | | | | | | |
| Due to The Dreyfus Corporation and affiliates—Note 3(c) | | | | 377,825 |
| Liability for securities on loan—Note 1(c) | | | | | | 12,004,210 |
| Payable for investment securities purchased | | | | | | 9,512,073 |
| Payable for shares of Common Stock redeemed | | | | | | 1,807,424 |
| Accrued expenses | | | | | | | | 238,793 |
| | | | | | | | | 23,940,325 |
| |
| |
| |
| |
|
| Net Assets ($) | | | | | | | | 463,854,369 |
| |
| |
| |
| |
|
| Composition of Net Assets ($): | | | | | | | | |
| Paid-in capital | | | | | | | | 550,200,431 |
| Accumulated undistributed investment income—net | | | | 401,223 |
| Accumulated net realized gain (loss) on investments | | | | (80,964,662) |
| Accumulated net unrealized appreciation (depreciation) | | | | |
| on investments and foreign currency transactions (including | | | | |
| $363,984 net unrealized appreciation on financial futures) | | | | (5,782,623) |
| |
| |
|
| Net Assets ($) | | | | | | | | 463,854,369 |
| |
| |
| |
| |
|
| |
| |
| Net Asset Value Per Share | | | | | | | | |
| | | Class A | | Class B | | Class D | | Class P |
| |
| |
| |
| |
|
| Net Assets ($) | | 9,814,815 | | 11,586,014 | | 434,779,327 | | 7,674,213 |
| Shares Outstanding | | 889,108 | | 1,050,433 | | 39,410,894 | | 694,915 |
| |
| |
| |
| |
|
| Net Asset Value Per Share ($) | | 11.04 | | 11.03 | | 11.03 | | 11.04 |
| | See notes to financial statements.
|
STATEMENT OF OPERATIONS
Year Ended July 31, 2005
|
| Investment Income ($): | | |
| Interest | | 17,982,945 |
| Dividends; | | |
| Affiliated issuers | | 401,326 |
| Income from securities lending | | 21,867 |
| Total Income | | 18,406,138 |
| Expenses: | | |
| Management fee—Note 3(a) | | 2,709,598 |
| Shareholder servicing costs—Note 3(c) | | 1,677,940 |
| Custodian fees—Note 3(c) | | 97,718 |
| Professional fees | | 79,802 |
| Distribution fees—Note 3(b) | | 61,957 |
| Registration fees | | 59,823 |
| Prospectus and shareholders’ reports | | 59,044 |
| Interest expense—Note 2 | | 20,780 |
| Directors’ fees and expenses—Note 3(d) | | 16,552 |
| Miscellaneous | | 43,753 |
| Total Expenses | | 4,826,967 |
| Investment Income—Net | | 13,579,171 |
| |
|
| Realized and Unrealized Gain (Loss) on Investments—Note 4 ($): |
| Net realized gain (loss) on investments and foreign currency transactions | | 2,102,667 |
| Net realized gain (loss) on financial futures | | (179,124) |
| Net realized gain (loss) on options transactions | | 15,975 |
| Net realized gain (loss) on forward currency exchange contracts | | (95,973) |
| Net realized gain (loss) on swap transactions | | (278,334) |
| Net Realized Gain (Loss) | | 1,565,211 |
| Net unrealized appreciation (depreciation) on investments and | | |
| foreign currency transactions (including $406,562 net | | |
| unrealized appreciaton on financial futures) | | 1,498,509 |
| Net Realized and Unrealized Gain (Loss) on Investments | | 3,063,720 |
| Net Increase in Net Assets Resulting from Operations | | 16,642,891 |
See notes to financial statements.
|
STATEMENT OF CHANGES IN NET ASSETS
| | | | | Year Ended July 31, |
| |
| |
|
| | | 2005 | | 2004 |
| |
| |
|
| Operations ($): | | | | |
| Investment income—net | | 13,579,171 | | 18,300,731 |
| Net realized gain (loss) on investments | | 1,565,211 | | (29,426,212) |
| Net unrealized appreciation | | | | |
| (depreciation) on investments | | 1,498,509 | | 14,372,096 |
| Net Increase (Decrease) in Net Assets | | | | |
| Resulting from Operations | | 16,642,891 | | 3,246,615 |
| |
| |
|
| Dividends to Shareholders from ($): | | | | |
| Investment income—net: | | | | |
| Class A | | (495,023) | | (656,682) |
| Class B | | (390,647) | | (372,255) |
| Class D | | (18,965,299) | | (25,021,374) |
| Class P | | (388,681) | | (917,256) |
| Net realized gain on investments: | | | | |
| Class A | | (10,977) | | (12,332) |
| Class B | | (10,147) | | (8,115) |
| Class D | | (416,842) | | (463,196) |
| Class P | | (8,173) | | (20,775) |
| Total Dividends | | (20,685,789) | | (27,471,985) |
| |
| |
|
| Capital Stock Transactions ($): | | | | |
| Net proceeds from shares sold: | | | | |
| Class A | | 3,644,327 | | 11,526,055 |
| Class B | | 1,899,253 | | 6,374,193 |
| Class D | | 181,147,252 | | 265,335,140 |
| Class P | | 6,848,476 | | 34,111,282 |
| Dividends reinvested: | | | | |
| Class A | | 465,611 | | 595,726 |
| Class B | | 323,921 | | 304,030 |
| Class D | | 16,377,948 | | 20,784,876 |
| Class P | | 329,306 | | 664,682 |
| Cost of shares redeemed: | | | | |
| Class A | | (10,513,289) | | (13,765,898) |
| Class B | | (3,857,173) | | (4,287,895) |
| Class D | | (332,612,266) | | (540,483,554) |
| Class P | | (11,571,774) | | (41,414,131) |
| Increase (Decrease) in Net Assets | | | | |
| from Capital Stock Transactions | | (147,518,408) | | (260,255,494) |
| Total Increase (Decrease) in Net Assets | | (151,561,306) | | (284,480,864) |
| |
| |
|
| Net Assets ($): | | | | |
| Beginning of Period | | 615,415,675 | | 899,896,539 |
| End of Period | | 463,854,369 | | 615,415,675 |
| Undistributed investment income—net | | 401,223 | | 455,128 |
24
| | | | | Year Ended July 31, |
| |
| |
|
| | | 2005 | | 2004 |
| |
| |
|
| Capital Share Transactions: | | | | |
| Class A a | | | | |
| Shares sold | | 327,126 | | 1,013,712 |
| Shares issued for dividends reinvested | | 41,696 | | 52,405 |
| Shares redeemed | | (942,248) | | (1,217,806) |
| Net Increase (Decrease) in Shares Outstanding | | (573,426) | | (151,689) |
| |
| |
|
| Class B a | | | | |
| Shares sold | | 170,536 | | 559,984 |
| Shares issued for dividends reinvested | | 29,045 | | 26,791 |
| Shares redeemed | | (345,827) | | (378,224) |
| Net Increase (Decrease) in Shares Outstanding | | (146,246) | | 208,551 |
| |
| |
|
| Class D | | | | |
| Shares sold | | 16,247,622 | | 23,294,815 |
| Shares issued for dividends reinvested | | 1,468,307 | | 1,827,858 |
| Shares redeemed | | (29,827,675) | | (47,516,969) |
| Net Increase (Decrease) in Shares Outstanding | | (12,111,746) | | (22,394,296) |
| |
| |
|
| Class P | | | | |
| Shares sold | | 616,752 | | 2,972,798 |
| Shares issued for dividends reinvested | | 29,494 | | 58,399 |
| Shares redeemed | | (1,038,837) | | (3,660,489) |
| Net Increase (Decrease) in Shares Outstanding | | (392,591) | | (629,292) |
a During the period ended July 31, 2005, 47,924 Class B shares representing $534,112 were automatically converted to 47,882 Class A shares and during the year ended July 31, 2004, 15,358 Class B shares representing $173,766 were automatically converted to 15,347 Class A shares.
See notes to financial statements.
The following tables describe the performance for each share class for the fiscal periods indicated.All information (except portfolio turnover rate) reflects financial results for a single fund share.Total return shows how much your investment in the fund would have increased (or decreased) during each period, assuming you had reinvested all dividends and distributions.These figures have been derived from the fund’s financial statements.
| | | | | Year Ended July 31, |
| |
| |
|
| Class A Shares | | 2005 | | 2004 a | | 2003 b |
| |
| |
| |
|
| Per Share Data ($): | | | | | | |
| Net asset value, beginning of period | | 11.14 | | 11.51 | | 11.59 |
| Investment Operations: | | | | | | |
| Investment income—net c | | .28 | | .26 | | .17 |
| Net realized and unrealized | | | | | | |
| gain (loss) on investments | | .05 | | (.23) | | .12 |
| Total from Investment Operations | | .33 | | .03 | | .29 |
| Distributions: | | | | | | |
| Dividends from investment income—net | | (.42) | | (.39) | | (.37) |
| Dividends from net realized gain on investments | | (.01) | | (.01) | | — |
| Total Distributions | | (.43) | | (.40) | | (.37) |
| Net asset value, end of period | | 11.04 | | 11.14 | | 11.51 |
| |
| |
| |
|
| Total Return (%) d | | 2.97 | | .24 | | 2.52e |
| |
| |
| |
|
| Ratios/Supplemental Data (%): | | | | | | |
| Ratio of total expenses to average net assets | | .91 | | .90 | | .89f |
| Ratio of net investment income | | | | | | |
| to average net assets | | 2.53 | | 2.31 | | 2.09f |
| Portfolio Turnover Rate | | 494.93g | | 695.82g | | 460.89 |
| |
| |
| |
|
| Net Assets, end of period ($ x 1,000) | | 9,815 | | 16,296 | | 18,578 |
| a | | As of August 1, 2003, the fund has adopted the method of accounting for interim payments on swap contracts in |
| | | accordance with Financial Accounting Standards Board Statement No. 133.These interim payments are reflected |
| | | within net realized and unrealized gain (loss) on swap contracts, however, prior to August 1, 2003, these interim |
| | | payments were reflected within interest income/expense in the Statement of Operations.The effect of this change for |
| | | the period ended July 31, 2004, was to increase net investment income per share by less than $.01, decrease net |
| | | realized and unrealized gain (loss) on investments per share by less than $.01 and increase the ratio of net |
| | | investment income to average net assets from 2.27% to 2.31%. Per share data and ratios/supplemental data for |
| | | periods prior to August 1, 2003 have not been restated to reflect this change in presentation. |
| b | | From November 1, 2002 (commencement of initial offering) to July 31, 2003. |
| c | | Based on average shares outstanding at each month end. |
| d | | Exclusive of sales charge. |
| e | | Not annualized. |
| f | | Annualized. |
| g | | The portfolio turnover rates excluding mortgage dollar roll transactions for the periods ended July 31, 2005 and |
| | | July 31, 2004, were 463.30% and 665.12%, respectively. |
| See notes to financial statements. |
26
| | | | | Year Ended July 31, |
| |
| |
|
| Class B Shares | | 2005 | | 2004 a | | 2003 b |
| |
| |
| |
|
| Per Share Data ($): | | | | | | |
| Net asset value, beginning of period | | 11.13 | | 11.50 | | 11.59 |
| Investment Operations: | | | | | | |
| Investment income—net c | | .21 | | .19 | | .14 |
| Net realized and unrealized | | | | | | |
| gain (loss) on investments | | .05 | | (.23) | | .10 |
| Total from Investment Operations | | .26 | | (.04) | | .24 |
| Distributions: | | | | | | |
| Dividends from investment income—net | | (.35) | | (.32) | | (.33) |
| Dividends from net realized gain on investments | | (.01) | | (.01) | | — |
| Total Distributions | | (.36) | | (.33) | | (.33) |
| Net asset value, end of period | | 11.03 | | 11.13 | | 11.50 |
| |
| |
| |
|
| Total Return (%) d | | 2.37 | | (.39) | | 2.11e |
| |
| |
| |
|
| Ratios/Supplemental Data (%): | | | | | | |
| Ratio of total expenses to average net assets | | 1.50 | | 1.54 | | 1.43f |
| Ratio of net investment income | | | | | | |
| to average net assets | | 1.88 | | 1.64 | | 1.67f |
| Portfolio Turnover Rate | | 494.93g | | 695.82g | | 460.89 |
| |
| |
| |
|
| Net Assets, end of period ($ x 1,000) | | 11,586 | | 13,323 | | 11,367 |
| a As of August 1, 2003, the fund has adopted the method of accounting for interim payments on swap contracts in |
| accordance with Financial Accounting Standards Board Statement No. 133.These interim payments are reflected |
| within net realized and unrealized gain (loss) on swap contracts, however, prior to August 1, 2003, these interim |
| payments were reflected within interest income/expense in the Statement of Operations.The effect of this change for |
| the period ended July 31, 2004, was to increase net investment income per share by $.01, decrease net realized and |
| unrealized gain (loss) on investments per share by $.01 and increase the ratio of net investment income to average net |
| assets from 1.60% to 1.64%. Per share data and ratios/supplemental data for periods prior to August 1, 2003 have |
| not been restated to reflect this change in presentation. |
| b From November 1, 2002 (commencement of initial offering) to July 31, 2003. |
| c Based on average shares outstanding at each month end. |
| d Exclusive of sales charge. |
| e Not annualized. |
| f Annualized. |
| g The portfolio turnover rates excluding mortgage dollar roll transactions for the periods ended July 31, 2005 and |
| July 31, 2004, were 463.30% and 665.12%, respectively. |
See notes to financial statements.
The Fund 27
| | FINANCIAL HIGHLIGHTS (continued)
|
| | | | | Year Ended July 31, | | |
| |
| |
| |
|
| Class D Shares | | 2005 | | 2004 a | | 2003 b | | 2002 c | | 2001 |
| |
| |
| |
| |
| |
|
| Per Share Data ($): | | | | | | | | | | |
| Net asset value, beginning of period | | 11.13 | | 11.50 | | 11.69 | | 12.19 | | 11.70 |
| Investment Operations: | | | | | | | | | | |
| Investment income—net | | .28d | | .27d | | .40d | | .64d | | .77 |
| Net realized and unrealized | | | | | | | | | | |
| gain (loss) on investments | | .05 | | (.23) | | (.09) | | (.47) | | .50 |
| Total from Investment Operations | | .33 | | .04 | | .31 | | .17 | | 1.27 |
| Distributions: | | | | | | | | | | |
| Dividends from investment income—net | | (.42) | | (.40) | | (.50) | | (.67) | | (.78) |
| Dividends from net realized | | | | | | | | | | |
| gain on investments | | (.01) | | (.01) | | — | | — | | — |
| Total Distributions | | (.43) | | (.41) | | (.50) | | (.67) | | (.78) |
| Net asset value, end of period | | 11.03 | | 11.13 | | 11.50 | | 11.69 | | 12.19 |
| |
| |
| |
| |
| |
|
| Total Return (%) | | 2.99 | | .28 | | 2.69 | | 1.46 | | 11.17 |
| |
| |
| |
| |
| |
|
| Ratios/Supplemental Data (%): | | | | | | | | | | |
| Ratio of total expenses to average net assets .88 | | .87 | | .88 | | .80 | | .84 |
| Ratio of net investment income | | | | | | | | | | |
| to average net assets | | 2.52 | | 2.36 | | 3.45 | | 5.31 | | 6.46 |
| Portfolio Turnover Rate | | 494.93e | | 695.82e | | 460.89 | | 220.23 | | 322.69 |
| |
| |
| |
| |
| |
|
| Net Assets, end of period ($ x 1,000) | | 434,779 | | 573,676 | | 850,189 1,121,684 | | 806,545 |
| a | | As of August 1, 2003, the fund has adopted the method of accounting for interim payments on swap contracts in |
| | | accordance with Financial Accounting Standards Board Statement No. 133.These interim payments are reflected |
| | | within net realized and unrealized gain (loss) on swap contracts, however, prior to August 1, 2003, these interim |
| | | payments were reflected within interest income/expense in the Statement of Operations.The effect of this change for |
| | | the period ended July 31, 2004, was to increase net investment income per share by less than $.01, decrease net |
| | | realized and unrealized gain (loss) on investments per share by less than $.01 and increase the ratio of net |
| | | investment income to average net assets from 2.32% to 2.36%. Per share data and ratios/supplemental data for |
| | | periods prior to August 1, 2003 have not been restated to reflect this change in presentation. |
| b | | The fund commenced offering four classes of shares on November 1, 2002.The existing shares were redesignated |
| | | Class D shares. |
| c | | As required, effective August 1, 2001, the fund has adopted the provisions of the AICPA Audit and Accounting |
| | | Guide for Investment Companies and began accreting discount or amortizing premium on fixed income securities on |
| | | scientific basis and including paydown gains and losses in interest income.The effect of these changes for the period |
| | | ended July 31, 2002 was to decrease net investment income per share by $.04, increase net realized and unealized |
| | | gain (loss) on investments per share by $.04 and decrease the ratio of net investment income to average net assets |
| | | from 5.62% to 5.31%. Per share data and ratios/supplemental data for periods prior to August 1, 2001 have not |
| | | been restated to reflect these changes in presentation. |
| d | | Based on average shares outstanding at each month end. |
| e | | The portfolio turnover rates excluding mortgage dollar roll transactions for the periods ended July 31, 2005 and |
| | | July 31, 2004, were 463.30% and 665.12%, respectively. |
| See notes to financial statements. |
28
| | | | | Year Ended July 31, |
| |
| |
|
| Class P Shares | | 2005 | | 2004 a | | 2003 b |
| |
| |
| |
|
| Per Share Data ($): | | | | | | |
| Net asset value, beginning of period | | 11.15 | | 11.51 | | 11.59 |
| Investment Operations: | | | | | | |
| Investment income—net c | | .30 | | .28 | | .20 |
| Net realized and unrealized | | | | | | |
| gain (loss) on investments | | .02 | | (.22) | | .09 |
| Total from Investment Operations | | .32 | | .06 | | .29 |
| Distributions: | | | | | | |
| Dividends from investment income—net | | (.42) | | (.41) | | (.37) |
| Dividends from net realized gain on investments | | (.01) | | (.01) | | — |
| Total Distributions | | (.43) | | (.42) | | (.37) |
| Net asset value, end of period | | 11.04 | | 11.15 | | 11.51 |
| |
| |
| |
|
| Total Return (%) | | 3.01 | | .38 | | 2.53d |
| |
| |
| |
|
| Ratios/Supplemental Data (%): | | | | | | |
| Ratio of total expenses to average net assets | | .86 | | .86 | | .85e |
| Ratio of net investment income | | | | | | |
| to average net assets | | 2.59 | | 2.41 | | 2.33e |
| Portfolio Turnover Rate | | 494.93f | | 695.82f | | 460.89 |
| |
| |
| |
|
| Net Assets, end of period ($ x 1,000) | | 7,674 | | 12,121 | | 19,763 |
| a As of August 1, 2003, the fund has adopted the method of accounting for interim payments on swap contracts in |
| accordance with Financial Accounting Standards Board Statement No. 133.These interim payments are reflected |
| within net realized and unrealized gain (loss) on swap contracts, however, prior to August 1, 2003, these interim |
| payments were reflected within interest income/expense in the Statement of Operations.The effect of this change for |
| the period ended July 31, 2004, was to increase net investment income per share by less than $.01, decrease net |
| realized and unrealized gain (loss) on investments per share by less than $.01 and increase the ratio of net |
| investment income to average net assets from 2.37% to 2.41%. Per share data and ratios/supplemental data for |
| periods prior to August 1, 2003 have not been restated to reflect this change in presentation. |
| b From November 1, 2002 (commencement of initial offering) to July 31, 2003. |
| c Based on average shares outstanding at each month end. |
| d Not annualized. |
| e Annualized. |
| f The portfolio turnover rates excluding mortgage dollar roll transactions for the periods ended July 31, 2005 and |
| July 31, 2004, were 463.30% and 665.12%, respectively. |
See notes to financial statements.
The Fund 29
NOTES TO FINANCIAL STATEMENTS
NOTE 1—Significant Accounting Policies:
Dreyfus Premier Short Term Income Fund (the “fund”) is a separate non-diversified series of Dreyfus Investment Grade Funds, Inc. (the “Company”), which is registered under the Investment Company Act of 1940, as amended (the “Act”), as an open-end management investment company and operates as a series company currently offering five series, including the fund.The fund’s investment objective is to seek to maximize total return, consisting of capital appreciation and current income.The Dreyfus Corporation (the “Manager”or “Dreyfus”) serves as the fund’s investment adviser.The Manager is a wholly-owned subsidiary of Mellon Financial Corporation (“Mellon Financial”).
Dreyfus Service Corporation (the “Distributor”), a wholly-owned subsidiary of the Manager, is the distributor of the fund’s shares.The fund is authorized to issue 800 million shares of $.001 par value Common Stock.The fund currently offers four classes of shares: Class A (100 million shares authorized), Class B (100 million shares authorized), Class D (500 million shares authorized) and Class P (100 million shares authorized). Class A shares are subject to a sales charge imposed at the time of purchase. Class B shares are subject to a contingent deferred sales charge (“CDSC”) imposed on Class B share redemptions made within six years of purchase and automatically convert to Class A shares after six years. Class D and Class P shares are sold at net asset value per share only to institutional investors. Class A shares purchased at net asset value (an investment of $250,000 or more) will have a CDSC imposed on redemptions made within eighteen months of purchase. Other differences between the classes include the services offered to and the expenses borne by each class and certain voting rights. Income, expenses (other than expenses attributable to a specific class), and realized and unrealized gains or losses on investments are allocated to each class of shares based on its relative net assets.
The Company accounts separately for the assets, liabilities and operations of each series. Expenses directly attributable to each series are charged to that series’ operations; expenses which are applicable to all series are allocated among them on a pro rata basis.
The fund’s financial statements are prepared in accordance with U.S. generally accepted accounting principles, which may require the use of management estimates and assumptions. Actual results could differ from those estimates.
The fund enters into contracts that contain a variety of indemnifications. The fund’s maximum exposure under these arrangements is unknown.The fund does not anticipate recognizing any loss related to these arrangements.
(a) Portfolio valuation: Investments in securities (excluding short-term investments (other than U.S. Treasury Bills), financial futures, options, swaps and forward currency exchange contracts) are valued each business day by an independent pricing service (the “Service”) approved by the Board of Directors. Investments for which quoted bid prices are readily available and are representative of the bid side of the market in the judgment of the Service are valued at the mean between the quoted bid prices (as obtained by the Service from dealers in such securities) and asked prices (as calculated by the Service based upon its evaluation of the market for such securities). Other investments (which constitute a majority of the portfolio securities) are valued as determined by the Service, based on methods which include consideration of: yields or prices of securities of comparable quality, coupon, maturity and type; indications as to values from dealers; and general market conditions. Securities for which there are no such valuations are valued at fair value as determined in good faith under the direction of the Board of Directors. Restricted securities, as well as securities or other assets for which recent market quotations are not readily available,that are not valued by a pricing service approved by the Board of Directors, or are determined by the fund not to reflect accurately fair value (such as when an event occurs after the close of the exchange on which the security is principally traded and that is determined by the fund to have changed the value of the security), are valued at fair value as determined in good faith under the direction of the Board of Directors.The factors that may be considered when fair valuing a security include fundamental analytical data, the nature and duration of restrictions on disposition, an eval-
NOTES TO FINANCIAL STATEMENTS (continued)
|
uation of the forces that influence the market in which the securities are purchased and sold and public trading in similar securities of the issuer or comparable issuers. Short-term investments, excluding U.S.Treasury Bills, are carried at amortized cost, which approximates value. Investments in registered investment companies are valued at their net asset value. Financial futures and options, which are traded on an exchange, are valued at the last sales price on the securities exchange on which such securities are primarily traded or at the last sales price on the national securities market on each business day. Options traded over-the-counter are priced at the mean between the bid and asked price. Swap transactions are valued daily based upon future cash flows and other factors, such as interest rates and underlying securities. Investments denominated in foreign currencies are translated to U.S. dollars at the prevailing rates of exchange. Forward currency exchange contracts are valued at the forward rate.
(b) Foreign currency transactions: The fund does not isolate that portion of the results of operations resulting from changes in foreign exchange rates on investments from the fluctuations arising from changes in market prices of securities held. Such fluctuations are included with the net realized and unrealized gain or loss on investments.
Net realized foreign exchange gains or losses arise from sales and maturities of short-term securities, sales of foreign currencies, currency gains or losses realized on securities transactions and the difference between the amounts of dividends, interest, and foreign withholding taxes recorded on the fund’s books and the U.S. dollar equivalent of the amounts actually received or paid. Net unrealized foreign exchange gains and losses arise from changes in the value of assets and liabilities other than investments in securities, resulting from changes in exchange rates. Such gains and losses are included with net realized and unrealized gain or loss on investments.
(c) Securities transactions and investment income: Securities transactions are recorded on a trade date basis. Realized gain and loss from securities transactions are recorded on the identified cost basis.
Dividend income is recognized on the ex-dividend date and interest income, including, where applicable, accretion of discount and amortization of premium on investments, is recognized on the accrual basis.
The fund has an arrangement with the custodian bank whereby the fund receives earnings credits from the custodian when positive cash balances are maintained, which are used to offset custody fees. For financial reporting purposes, the fund includes net earnings credits, if any, as an expense offset in the Statement of Operations.
Pursuant to a securities lending agreement with Mellon Bank, N.A., an affiliate of the Manager, the fund may lend securities to qualified institutions.At origination, all loans are secured by collateral of at least 102% of the value of U.S. securities loaned and 105% of the value of foreign securities loaned. Collateral equivalent to at least 100% of the market value of securities on loan will be maintained at all times. Cash collateral is invested in certain other money market mutual funds managed by the Manager.The fund will be entitled to receive all income on securities loaned, in addition to income earned as a result of the lending transaction. Although each security loaned is fully collateralized, the fund would bear the risk of delay in recovery of, or loss of rights in, the securities loaned should a borrower fail to return the securities in a timely manner.
(d) Affiliated issuers: Investments in other investment companies advised by the Manager are defined as “affiliated” in the Act.
(e) Dividends to shareholders: It is the policy of the fund to declare dividends daily from investment income-net. Such dividends are paid monthly. Dividends from net realized capital gain, if any, are normally declared and paid annually, but the fund may make distributions on a more frequent basis to comply with the distribution requirements of the Internal Revenue Code of 1986, as amended (the “Code”).To the extent that net realized capital gain can be offset by capital loss carryovers, it is the policy of the fund not to distribute such gain. Income
NOTES TO FINANCIAL STATEMENTS (continued)
|
and capital gain distributions are determined in accordance with income tax regulations, which may differ from U.S. generally accepted accounting principles.
(f) Federal income taxes: It is the policy of the fund to continue to qualify as a regulated investment company, if such qualification is in the best interests of its shareholders, by complying with the applicable provisions of the Code, and to make distributions of taxable income sufficient to relieve it from substantially all federal income and excise taxes.
At July 31, 2005, the components of accumulated earnings on a tax basis were as follows: undistributed ordinary income $944,873, accumulated capital losses $70,757,951 and unrealized depreciation $8,582,743. In addition, the fund had $7,950,241 of capital losses realized after October 31, 2004, which were deferred for tax purposes to the first day of the following fiscal year.
The fund has an unused capital loss carryover available to be applied against future net securities profits, if any, realized subsequent to July 31, 2005. If not applied, $1,818,379 of the carryover expires in fiscal 2007, $5,887,866 expires in fiscal 2008, $4,403,293 expires in fiscal 2010, $21,420,716 expires in fiscal 2011, $7,815,155 expires in fiscal 2012 and $29,412,542 expires in fiscal 2013.
The tax character of distributions paid to shareholders during the fiscal periods ended July 31, 2005 and July 31, 2004, were as follows: ordinary income $20,685,789 and $27,471,985, respectively.
During the period ended July 31, 2005, as a result of permanent book to tax differences primarily due to the tax treatment for amortization of premiums, paydown gains and losses on mortgage backed securities, sales treatment for treasury inflation protected securities and foreign currency transactions, the fund increased accumulated undistributed investment income-net by $6,606,574, decreased accumulated net realized gain (loss) on investments by $7,212,648 and increased paid-in capital by $606,074. Net assets were not affected by this reclassification.
| | NOTE 2—Bank Lines of Credit:
|
The fund may borrow up to $10 million for leveraging purposes under a short-term unsecured line of credit and participates with other Dreyfus-managed funds in a $100 million unsecured line of credit primarily to be utilized for temporary or emergency purposes, including the financing of redemptions. Interest is charged to the fund based on prevailing market rates in effect at the time of borrowings.
The average daily amount of borrowings outstanding under the leveraging arrangement during the period ended July 31, 2005 was approximately $763,000, with a related weighted average annualized interest rate of 2.72% ..
NOTE 3—Management Fee and Other Transactions With Affiliates:
(a) Pursuant to a management agreement with the Manager, the management fee is computed at the annual rate of .50 of 1% of the value of the fund’s average daily net assets and is payable monthly.
During the period ended July 31, 2005, the Distributor retained $15,362 from commissions earned on sales of the fund’s Class A shares and $44,346 from contingent deferred sales charges on redemptions of the fund’s Class B shares.
(b) Under the Distribution Plan (the “Plan”) adopted pursuant to Rule 12b-1 under the Act, Class B shares pay the Distributor for distributing their shares at an annual rate of .50 of 1% of the value of the average daily net assets of Class B shares. During the period ended July 31, 2005, Class B shares were charged $61,957, pursuant to the Plan.
(c) Under the Shareholder Services Plan, Class A, Class B, Class D and Class P shares pay the Distributor at an annual rate of .25 of 1% of the value of the average daily net assets of Class A, Class B and Class P shares and .20 of 1% of the value of the average daily net assets of Class D shares, for the provision of certain services.The services provided may
NOTES TO FINANCIAL STATEMENTS (continued)
|
include personal services relating to shareholder accounts, such as answering shareholder inquiries regarding Class A, Class B, Class D and Class P shares and providing reports and other information, and services related to the maintenance of shareholder accounts.The Distributor may make payments to Service Agents (a securities dealer, financial institution or other industry professional) in respect of these services. The Distributor determines the amounts to be paid to Service Agents. During the period ended July 31, 2005, Class A, Class B, Class D and Class P shares were charged, $33,211, $30,978, $1,012,016 and $25,590, respectively, pursuant to the Shareholder Services Plan.
The fund compensates Dreyfus Transfer, Inc., a wholly-owned subsidiary of the Manager, under a transfer agency agreement for providing personnel and facilities to perform transfer agency services for the fund. During the period ended July 31, 2005, the fund was charged $332,499 pursuant to the transfer agency agreement.
The fund compensates Mellon Bank, N.A., an affiliate of the Manager, under a custody agreement for providing custodial services for the fund. During the period ended July 31, 2005, the fund was charged $97,718 pursuant to the custody agreement.
During the period ended July 31, 2005, the fund was charged $2,308 for services performed by the Chief Compliance Officer.
The components of Due to The Dreyfus Corporation and affiliates in the Statement of Assets and Liabilities consist of: management fees $198,843, Rule 12b-1 distribution plan fees $4,943, shareholder services plan fees $80,783, custodian fees $20,676, chief compliance officer fees $2,308 and transfer agency per account fees $70,272.
(d) Each Board member also serves as a Board member of other funds within the Dreyfus complex. Annual retainer fees and attendance fees are allocated to each fund based on net assets.
(e) Pursuant to an exemptive order from the Securities and Exchange Commission, the fund may invest its available cash balances in affiliated
money market mutual funds. Management fees of the underlying money market mutual funds have been waived by the Manager.
NOTE 4—Securities Transactions:
The aggregate amount of purchases and sales (including paydowns) of investment securities, excluding short-term securities, forward currency exchange contracts, financial futures, options transactions and swap transactions, during the period ended July 31, 2005, amounted to $2,529,818,220 and $2,576,784,457, respectively, of which $161,665,130 in purchases and $162,073,663 in sales were from mortgage dollar roll transactions.
A mortgage dollar roll transaction involves a sale by the fund of mortgage related securities that it holds with an agreement by the fund to repurchase similar securities at an agreed upon price and date. The securities purchased will bear the same interest rate as those sold, but generally will be collateralized by pools of mortgages with different prepayment histories than those securities sold.
The fund may purchase and write (sell) put and call options in order to gain exposure to or to protect against changes in the market.
As a writer of call options, the fund receives a premium at the outset and then bears the market risk of unfavorable changes in the price of the financial instrument underlying the option. Generally, the fund would incur a gain, to the extent of the premium, if the price of the underlying financial instrument decreases between the date the option is written and the date on which the option is terminated. Generally, the fund would realize a loss, if the price of the financial instrument increases between those dates.
As a writer of put options, the fund receives a premium at the outset and then bears the market risk of unfavorable changes in the price of the financial instrument underlying the option. Generally, the fund would incur a gain, to the extent of the premium, if the price of the
NOTES TO FINANCIAL STATEMENTS (continued)
|
underlying financial instrument increases between the date the option is written and the date on which the option is terminated. Generally, the fund would realize a loss, if the price of the financial instrument decreases between those dates. The following table summarizes the fund’s call/put options written during the period ended July 31, 2005:
| | | Face Amount | | | | Options Terminated |
| | | | | |
|
| | | Covered by | | Premiums | | | | Net Realized |
| Options Written: | | Contracts ($) | | Received ($) | | Cost ($) | | Gain ($) |
| |
| |
| |
| |
|
| Contracts outstanding | | | | | | | | |
| July 31, 2004 | | 4,500,000 | | 15,975 | | | | |
| Contracts terminated; | | | | | | | | |
| Contracts expired | | 4,500,000 | | 15,975 | | — | | 15,975 |
| Contracts outstanding | | | | | | |
| July 31, 2005 | | — | | — | | | | |
The fund may invest in financial futures contracts in order to gain exposure to or protect against changes in the market.The fund is exposed to market risk as a result of changes in the value of the underlying financial instruments. Investments in financial futures require the fund to “mark to market” on a daily basis, which reflects the change in market value of the contracts at the close of each day’s trading.Accordingly, variation margin payments are received or made to reflect daily unrealized gains and losses. When the contracts are closed, the fund recognizes a realized gain or loss. These investments require initial margin deposits with a broker, which consist of cash or cash equivalents.The amount of these deposits is determined by the exchange or Board of Trade on which the contract is traded and is subject to change. Contracts open at July 31, 2005, are set forth in the Statement of Financial Futures.
The fund enters into forward currency exchange contracts in order to hedge its exposure to changes in foreign currency exchange rates on its foreign portfolio holdings and to settle foreign currency transac-tions.When executing forward currency exchange contracts, the fund is obligated to buy or sell a foreign currency at a specified rate on a certain date in the future. With respect to sales of forward currency
exchange contracts, the fund would incur a loss if the value of the contract increases between the date the forward contract is opened and the date the forward contract is closed.The fund realizes a gain if the value of the contract decreases between those dates. With respect to purchases of forward currency exchange contracts, the fund would incur a loss if the value of the contract decreases between the date the forward contract is opened and the date the forward contract is closed. The fund realizes a gain if the value of the contract increases between those dates. The fund is also exposed to credit risk associated with counterparty nonperformance on these forward currency exchange contracts which is typically limited to the unrealized gain on each open contract. The following summarizes open forward currency exchange contracts at July 31, 2005:
| | | Foreign | | | | | | |
| Forward Currency | | Currency | | | | | | Unrealized |
| Exchange Contracts | | Amounts | | Proceeds ($) | | Value ($) | | Appreciation ($) |
| |
| |
| |
| |
|
| Sales; | | | | | | | | |
| Euro, | | | | | | | | |
| expiring 9/21/2005 | | 7,910,000 | | 9,615,712 | | 9,614,605 | | 1,107 |
| Swedish Krona, | | | | | | | | |
| expiring 9/21/2005 | | 73,250,000 | | 9,462,846 | | 9,462,235 | | 611 |
| Total | | | | | | | | 1,718 |
The fund may enter into swap agreements to exchange the interest rate on, or return generated by, one nominal instrument for the return generated by another nominal instrument.
The fund accounts for swap contracts in accordance with Financial Accounting Standards Board Statement No. 133.The fund accrues for the interim payments on swap contracts on a daily basis, with the net amount recorded within unrealized appreciation (depreciation) of swap contracts in the Statement of Assets and Liabilities. Once the interim payments are settled in cash, the net amount is recorded as realized gain (loss) on swaps, in addition to realized gain (loss) recorded upon the termination of swap contracts in the Statement of Operations.
NOTES TO FINANCIAL STATEMENTS (continued)
|
Fluctuations in the value of swap contracts are recorded as a component of net change in unrealized appreciation (depreciation) on investments.
Credit default swaps involve commitments to pay a fixed interest rate in exchange for payment if a credit event affecting a third party (the referenced company) occurs. Credit events may include a failure to pay interest or principal, bankruptcy, or restructuring. For those credit default swaps in which the portfolio is receiving a fixed rate, the portfolio is providing credit protection on the underlying instrument.The maximum payouts for these contracts are limited to the notional amount of each swap. At July 31, 2005, there were no credit default swaps outstanding.
Risks may arise upon entering into these agreements from the potential inability of the counterparties to meet the terms of the agreement and are generally limited to the amount of net payments to be received, if any, at the date of default.
At July 31, 2005, the cost of investments for federal income tax purposes was $491,477,764; accordingly, accumulated net unrealized depreciation on investments was $8,576,980, consisting of $243,321 gross unrealized appreciation and $8,820,301 gross unrealized depreciation.
In early 2004, two purported class and derivative actions were filed against Mellon Financial, Mellon Bank, N.A., Dreyfus, Founders Asset Management LLC, and certain directors of the Dreyfus Funds and the Dreyfus Founders Funds (together, the “Funds”) in the United States District Court for the Western District of Pennsylvania. In September 2004, plaintiffs served a Consolidated Amended Complaint (the “Amended Complaint”) on behalf of a purported class of all persons who acquired interests in any of the Funds between January 30, 1999 and November 17, 2003, and derivatively on behalf of the Funds.The Amended Complaint in the newly styled In re Dreyfus Mutual Funds Fee Litigation also named the Distributor, Premier Mutual Fund
Services, Inc. and two additional Fund directors as defendants and alleges violations of the Investment Company Act of 1940, the Investment Advisers Act of 1940, the Pennsylvania Unfair Trade Practices and Consumer Protection Law and common-law claims. Plaintiffs seek to recover allegedly improper and excessive Rule 12b-1 and advisory fees allegedly charged to the Funds for marketing and distribution services. More specifically, plaintiffs claim, among other things, that 12b-1 fees and directed brokerage were improperly used to pay brokers to recommend the Funds over other funds, and that such payments were not disclosed to investors. In addition, plaintiffs assert that economies of scale and soft-dollar benefits were not passed on to the Funds. Plaintiffs further allege that 12b-1 fees were improperly charged to certain of the Funds that were closed to new investors.The Amended Complaint seeks compensatory and punitive damages, rescission of the advisory contracts, and an accounting and restitution of any unlawful fees, as well as an award of attorneys’ fees and litigation expenses. As noted, some of the claims in this litigation are asserted derivatively on behalf of the Funds that have been named as nominal defendants. With respect to such derivative claims, no relief is sought against the Funds. Dreyfus believes the allegations to be totally without merit and intends to defend the action vigorously. In November 2004, all named defendants moved to dismiss the Amended Complaint in whole or substantial part. Briefing was completed in May 2005.
Additional lawsuits arising out of these circumstances and presenting similar allegations and requests for relief may be filed against the defendants in the future. Neither Dreyfus nor the Funds believe that any of the pending actions will have a material adverse effect on the Funds or Dreyfus’ ability to perform its contract with the Funds.
REPORT OF INDEPENDENT REGISTERED PUBLIC ACCOUNTING FIRM
Shareholders and Board of Directors Dreyfus Premier Short Term Income Fund
We have audited the accompanying statement of assets and liabilities, including the statements of investments and financial futures, of Dreyfus Premier Short Term Income Fund (one of the funds comprising Dreyfus Investment Grade Funds, Inc.) as of July 31, 2005, and the related statement of operations for the year then ended, the statement of changes in net assets for each of the two years in the period then ended, and financial highlights for each of the periods indicated therein.These financial statements and financial highlights are the responsibility of the Fund’s management. Our responsibility is to express an opinion on these financial statements and financial highlights based on our audits.
We conducted our audits in accordance with the standards of the Public Company Accounting Oversight Board (United States).Those standards require that we plan and perform the audit to obtain reasonable assurance about whether the financial statements and financial highlights are free of material misstatement.We were not engaged to perform an audit of the Fund’s internal control over financial reporting. Our audits included consideration of internal control over financial reporting as a basis for designing audit procedures that are appropriate in the circumstances, but not for the purpose of expressing an opinion on the effectiveness of the Fund’s internal control over financial reporting.Accordingly, we express no such opinion. An audit also includes examining, on a test basis, evidence supporting the amounts and disclosures in the financial statements and financial highlights,assessing the accounting principles used and significant estimates made by management,and evaluating the overall financial statement presentation. Our procedures included verification by examination of securities held by the custodian as of July 31, 2005 and confirmation of securities not held by the custodian by correspondence with others.We believe that our audits provide a reasonable basis for our opinion.
In our opinion, the financial statements and financial highlights referred to above present fairly, in all material respects, the financial position of Dreyfus Premier Short Term Income Fund at July 31, 2005, the results of its operations for the year then ended,the changes in its net assets for each of the two years in the period then ended, and the financial highlights for each of the indicated periods, in conformity with U.S. generally accepted accounting principles.

New York, New York
September 16, 2005
|
| INFORMATION ABOUT THE REVIEW | | |
| AND APPROVAL OF THE FUND’S | | |
| M A N A G E M E N T A G R E E M E N T | | (Unaudited) |
At separate meetings of the Board of Directors for the Fund held on July 12-13, 2005, the Board considered the re-approval, through its annual renewal date of July 29, 2006, of the Fund’s Management Agreement, pursuant to which the Manager provides the Fund with investment advisory and administrative services. The Board members who are not “interested persons” (as defined in the Investment Company Act of 1940, as amended) of the Fund were assisted in their review by independent legal counsel and met with counsel in executive session separate from representatives of the Manager.
Analysis of Nature, Extent and Quality of Services Provided to the Fund. The Board members received a presentation from representatives of the Manager regarding services provided to the Fund and other funds in the Dreyfus fund complex, and discussed the nature, extent and quality of the services provided to the Fund pursuant to its Management Agreement.The Manager’s representatives reviewed the Fund’s distribution of accounts and the relationships the Manager has with various intermediaries and the different needs of each. The Manager’s representatives noted the diversity of distribution of the Fund as well as among the funds in the Dreyfus complex, and the Manager’s corresponding need for broad, deep, and diverse resources to be able to provide ongoing shareholder services to each of the Fund’s distribution channels.The Board also reviewed the number of shareholder accounts in the Fund, as well as the Fund’s asset size.
The Board members also considered the Manager’s research and portfolio management capabilities and that the Manager also provides oversight of day-to-day Fund operations, including fund accounting and administration and assistance in meeting legal and regulatory requirements. The Board members also considered the Manager’s extensive administrative, accounting and compliance infrastructure.
Comparative Analysis of the Fund’s Performance and Management Fee and Expense Ratio. The Board members reviewed the Fund’s performance, management fee and expense ratios and placed significant emphasis on comparisons to a group of comparable funds and Lipper
INFORMATION ABOUT THE REVIEW AND APPROVAL OF THE FUND’S MANAGEMENT AGREEMENT (Unaudited) (continued )
category averages, as applicable.The group of comparable funds was previously approved by the Board for this purpose, and was prepared using a Board-approved selection methodology that was based, in part, on selecting non-affiliated funds reported in the same Lipper category as the Fund.The Board members discussed the results of the comparisons for various periods ended May 31, 2005, and noted that the Fund’s income yield performance for each of the 1-year, 3-year, 5-year and 10-year periods was above the comparison group and Lipper category averages for those periods, and ranked in the top half of the comparison group and Lipper category for such periods.The Board noted that the Fund’s total return performance for the 1-year and 10-year periods was above the comparison group and Lipper category averages and ranked in the top half of the comparison group and Lipper category for such periods,but that for the 3-year and 5-year periods the Fund’s total return performance was below the comparison group and Lipper category averages and ranked in the bottom half of the comparison group and the Lipper category for those periods.The Board also noted that the Fund’s year-to-date total return performance was below the Lipper category average and ranked in the bottom half of the comparison group, but that the Fund’s more recent 3-month total return performance was above the Lipper category average and ranked in the top half of the comparison group.The Board members noted that a new portfolio management team for the Fund was appointed in January 2005.The Board members also discussed the Fund’s expense ratio, noting that the Fund’s expense ratio was lower than the Lipper category and comparison group averages. The Board reviewed the range of management fees in the comparison group,noting that the Fund’s management fee ranked in the middle,with several funds having the same or higher management fee.
Representatives of the Manager reviewed with the Board members the fees paid to the Manager or its affiliates by mutual funds managed by the Manager or its affiliates with similar investment objectives, policies and strategies as the Fund (the “Similar Funds”), of which there was one, and by other accounts managed or sub-advised by the Manager or its affiliates with similar investment objectives, policies and
strategies as the Fund (the “Separate Accounts” and, collectively with the Similar Funds, the “Similar Accounts”).The Manager’s representatives explained the nature of the Similar Accounts and the differences, from Dreyfus’ perspective, in management of the Similar Accounts as compared to managing and providing services to the Fund; it was noted that the Similar Fund was a mutual fund included in the same Lipper category as the Fund. The Manager’s representatives also reviewed the costs associated with distribution through intermediaries. The Board analyzed the differences in fees paid to the Manager and discussed the relationship of the advisory fees paid in light of the Manager’s performance and the services provided; it was noted that the Similar Fund had lower management fees than the fee borne by the Fund.The Board members considered the relevance of the fee information provided for the Similar Accounts managed by the Manager to evaluate the appropriateness and reasonableness of the Fund’s advisory fees. The Board acknowledged that differences in fees paid by the Similar Accounts seemed to be consistent with the services provided.
Analysis of Profitability and Economies of Scale. The Manager’s representatives reviewed the dollar amount of expenses allocated and profit received by the Manager and the method used to determine such expenses and profit.The Board received and considered information prepared by an independent consulting firm regarding Dreyfus’ approach to allocating costs to, and determining the profitability of, individual funds and the entire Dreyfus mutual fund complex. The consulting firm also analyzed where any economies of scale might emerge as assets grow. The Board members evaluated the analysis in light of the relevant circumstances for the Fund, including the decline in Fund assets and the extent to which economies of scale would be realized as the Fund grows and whether fee levels reflect these economies of scale for the benefit of Fund investors.The Board members also considered potential benefits to the Manager from acting as investment adviser and noted that there were no soft dollar arrangements with respect to trading the Fund’s portfolio.
INFORMATION ABOUT THE REVIEW AND APPROVAL OF THE FUND’S MANAGEMENT AGEEMENT (Unaudited) (continued )
It was noted that the Board members should consider the Manager’s profitability with respect to the Fund as part of their evaluation of whether the fee under the Management Agreement bears a reasonable relationship to the mix of services provided by the Manager, including the nature, extent and quality of such services and that a discussion of economies of scale are predicated on increasing assets and that, if a fund’s assets had been decreasing, the possibility that the Manager may have realized any economies of scale would be less. It also was noted that the profitability percentage for managing the Fund was within ranges determined by appropriate court cases to be reasonable given the services rendered and given the Fund’s overall performance and generally superior service levels provided.
At the conclusion of these discussions, each of the Directors expressed the opinion that he or she had been furnished with sufficient information to make an informed business decision with respect to continuation of the Fund’s Management Agreement. Based on their discussions and considerations as described above, the Board made the following conclusions and determinations.
- The Board concluded that the nature, extent and quality of the ser- vices provided by the Manager are adequate and appropriate.
- The Board generally was satisfied with the Fund’s income yield per- formance and the Fund’s 3-month, 1-year, and 10-year total return performance, as well as with the change in the Fund’s portfolio management team which occurred in January 2005.
- The Board concluded that the fee paid by the Fund to the Manager was reasonable in light of comparative performance and expense and advisory fee information, costs of the services provided and profits to be realized and benefits derived or to be derived by the Manager from its relationship with the Fund.
- The Board determined that, given the current size and characteris- tics of the Fund, it was difficult to specifically identify any economies of scale that might be realized merely through an increase in the assets of the Fund.The Board noted that it appeared that the benefits of any economies of scale would be appropriately shared with shareholders through increased investment in fund management and administration resources.
The Board members considered these conclusions and determinations, along with information received on a routine and regular basis throughout the year, and, without any one factor being dispositive, the Board determined that re-approval of the Fund’s Management Agreement was in the best interests of the Fund and its shareholders.
BOARD MEMBERS INFORMATION (Unaudited)
Joseph S. DiMartino (61)
Chairman of the Board (1995)
|
Principal Occupation During Past 5 Years:
• Corporate Director and Trustee
|
Other Board Memberships and Affiliations:
|
- The Muscular Dystrophy Association, Director
- Levcor International, Inc., an apparel fabric processor, Director
- Century Business Services, Inc., a provider of outsourcing functions for small and medium size companies, Director
- The Newark Group, a provider of a national market of paper recovery facilities, paperboard mills and paperboard converting plants, Director
- Azimuth Trust, an institutional asset management firm, Member of Board of Managers and Advisory Board
No. of Portfolios for which Board Member Serves: 193
———————
Clifford L. Alexander, Jr. (71) Board Member (2003)
Principal Occupation During Past 5 Years:
|
- President of Alexander & Associates, Inc., a management consulting firm (January 1981-present)
- Chairman of the Board of Moody’s Corporation (October 2000-October 2003)
- Chairman of the Board and Chief Executive Officer of The Dun and Bradstreet Corporation (October 1999-September 2000)
Other Board Memberships and Affiliations:
• Mutual of America Life Insurance Company, Director
No. of Portfolios for which Board Member Serves: 66
|
———————
Lucy Wilson Benson (77) Board Member (1994)
Principal Occupation During Past 5 Years:
• President of Benson and Associates, consultants to business and government (1980-present)
Other Board Memberships and Affiliations:
|
- The International Executive Services Corps., Director
- Citizens Network for Foreign Affairs,Vice Chairperson
- Council on Foreign Relations, Member
- Lafayette College Board of Trustees,Trustee Emeritus
- Atlantic Council of the U.S., Director
No. of Portfolios for which Board Member Serves: 40
|
David W. Burke (69)
Board Member (1994)
|
Principal Occupation During Past 5 Years:
• Corporate Director and Trustee
|
Other Board Memberships and Affiliations:
|
- John F. Kennedy Library Foundation, Director
- U.S.S. Constitution Museum, Director
No. of Portfolios for which Board Member Serves: 84
|
Whitney I. Gerard (70)
Board Member (1993)
|
Principal Occupation During Past 5 Years:
• Partner of Chadbourne & Parke LLP
|
No. of Portfolios for which Board Member Serves: 38
|
Arthur A. Hartman (79)
Board Member (1992)
|
Principal Occupation During Past 5 Years:
|
- Chairman of First NIS Regional Fund (ING/Barings Management) and New Russia Fund
- Advisory Council Member to Barings Vostok
Other Board Memberships and Affiliations:
• APCO Associates Inc., Senior Consultant
|
No. of Portfolios for which Board Member Serves: 38
|
George L. Perry (71)
Board Member (1992)
|
Principal Occupation During Past 5 Years:
• Economist and Senior Fellow at Brookings Institution
No. of Portfolios for which Board Member Serves: 38
|
Once elected all Board Members serve for an indefinite term.The address of the Board Members and Officers is in c/o The Dreyfus Corporation, 200 Park Avenue, New York, New York 10166. Additional information about the Board Members is available in the fund’s Statement of Additional Information which can be obtained from Dreyfus free of charge by calling this toll free number: 1-800-554-4611.
OFFICERS OF THE FUND (Unaudited)
STEPHEN E. CANTER, President since March 2000.
Chairman of the Board, Chief Executive Officer and Chief Operating Officer of the Manager, and an officer of 90 investment companies (comprised of 184 portfolios) managed by the Manager. Mr. Canter also is a Board member and, where applicable, an Executive Committee Member of the other investment management subsidiaries of Mellon Financial Corporation, each of which is an affiliate of the Manager. He is 60 years old and has been an employee of the Manager since May 1995.
STEPHEN R. BYERS, Executive Vice President since October 2002.
Chief Investment Officer,Vice Chairman and a director of the Manager, and an officer of 90 investment companies (comprised of 184 portfolios) managed by the Manager. Mr. Byers also is an officer, director or an Executive Committee Member of certain other investment management subsidiaries of Mellon Financial Corporation, each of which is an affiliate of the Manager. He is 51 years old and has been an employee of the Manager since January 2000.
MARK N. JACOBS, Vice President since March 2000.
Executive Vice President, Secretary and General Counsel of the Manager, and an officer of 91 investment companies (comprised of 200 portfolios) managed by the Manager. He is 59 years old and has been an employee of the Manager since June 1977.
MICHAEL A. ROSENBERG, Vice President and Secretary since August 2005.
Associate General Counsel of the Manager, and an officer of 91 investment companies (comprised of 200 portfolios) managed by the Manager. He is 45 years old and has been an employee of the Manager since October 1991.
JAMES BITETTO, Vice President and Assistant Secretary since August 2005.
Assistant General Counsel and Assistant Secretary of the Manager, and an officer of 91 investment companies (comprised of 200 portfolios) managed by the Manager. He is 39 years old and has been an employee of the Manager since December 1996.
JONI LACKS CHARATAN, Vice President and Assistant Secretary since August 2005.
Assistant General Counsel of the Manager, and an officer of 91investment companies (comprised of 200 portfolios) managed by the Manager. She is 49 years old and has been an employee of the Manager since October 1998.
JOSEPH M. CHIOFFI, Vice President and Assistant Secretary since August 2005.
Assistant General Counsel of the Manager, and an officer of 91 investment companies (comprised of 200 portfolios) managed by the Manager. He is 43 years old and has been an employee of the Manager since July 2000.
JANETTE E. FARRAGHER, Vice President and Assistant Secretary since August 2005.
Associate General Counsel of the Manager, and an officer of 91 investment companies (comprised of 200 portfolios) managed by the Manager. She is 42 years old and has been an employee of the Manager since February 1984.
JOHN B. HAMMALIAN, Vice President and Assistant Secretary since August 2005.
Associate General Counsel of the Manager, and an officer of 91 investment companies (comprised of 200 portfolios) managed by the Manager. He is 42 years old and has been an employee of the Manager since February 1991.
ROBERT R. MULLERY, Vice President and Assistant Secretary since August 2005.
Associate General Counsel of the Manager, and an officer of 91 investment companies (comprised of 200 portfolios) managed by the Manager. He is 53 years old and has been an employee of the Manager since May 1986.
JEFF PRUSNOFSKY, Vice President and Assistant Secretary since August 2005.
Associate General Counsel of the Manager, and an officer of 91 investment companies (comprised of 200 portfolios) managed by the Manager. He is 40 years old and has been an employee of the Manager since October 1990.
JAMES WINDELS, Treasurer since November 2001.
Director – Mutual Fund Accounting of the Manager, and an officer of 91 investment companies (comprised of 200 portfolios) managed by the Manager. He is 46 years old and has been an employee of the Manager since April 1985.
GREGORY S. GRUBER, Assistant Treasurer since August 2005.
Senior Accounting Manager – Municipal Bond Funds of the Manager, and an officer of 91 investment companies (comprised of 200 portfolios) managed by the Manager. He is 46 years old and has been an employee of the Manager since August 1981.
ERIK D. NAVILOFF, Assistant Treasurer since December 2002.
Senior Accounting Manager – Taxable Fixed Income Funds of the Manager, and an officer of 91 investment companies (comprised of 200 portfolios) managed by the Manager. He is 37 years old and has been an employee of the Manager since November 1992.
ROBERT ROBOL, Assistant Treasurer since August 2005.
Senior Accounting Manager – Money Market Funds of the Manager, and an officer of 91 investment companies (comprised of 200 portfolios) managed by the Manager. He is 41 years old and has been an employee of the Manager since October 1988.
ROBERT SVAGNA, Assistant Treasurer since August 2005.
Senior Accounting Manager – Equity Funds of the Manager, and an officer of 91 investment companies (comprised of 200 portfolios) managed by the Manager. He is 37 years old and has been an employee of the Manager since November 1990.
KENNETH J. SANDGREN, Assistant Treasurer since November 2001.
Mutual Funds Tax Director of the Manager, and an officer of 91 investment companies (comprised of 200 portfolios) managed by the Manager. He is 50 years old and has been an employee of the Manager since June 1993.
JOSEPH W. CONNOLLY, Chief Compliance Officer since October 2004.
Chief Compliance Officer of the Manager and The Dreyfus Family of Funds (91 investment companies, comprising 200 portfolios). From November 2001 through March 2004, Mr. Connolly was first Vice-President, Mutual Fund Servicing for Mellon Global Securities Services. In that capacity, Mr. Connolly was responsible for managing Mellon’s Custody, Fund Accounting and Fund Administration services to third-party mutual fund clients. He is 48 years old and has served in various capacities with the Manager since 1980, including manager of the firm’s Fund Accounting Department from 1997 through October 2001.
WILLIAM GERMENIS, Anti-Money Laundering Compliance Officer since August 2002.
Vice President and Anti-Money Laundering Compliance Officer of the Distributor, and the Anti-Money Laundering Compliance Officer of 87 investment companies (comprised of 196 portfolios) managed by the Manager. He is 34 years old and has been an employee of the Distributor since October 1998.
NOTES
| For More | | Information |
| |
|
| |
| Dreyfus Premier | | Transfer Agent & |
| Short Term Income Fund | | Dividend Disbursing Agent |
| 200 Park Avenue | | |
| | | Dreyfus Transfer, Inc. |
| New York, NY 10166 | | |
| | | 200 Park Avenue |
| Manager | | New York, NY 10166 |
| The Dreyfus Corporation | | Distributor |
| 200 Park Avenue | | |
| | | Dreyfus Service Corporation |
| New York, NY 10166 | | |
| | | 200 Park Avenue |
| Custodian | | New York, NY 10166 |
| Mellon Bank, N.A. | | |
| One Mellon Bank Center | | |
| Pittsburgh, PA 15258 | | |
Telephone Call your financial representative or 1-800-554-4611
| Mail | | The Dreyfus Premier Family of Funds |
| | | 144 Glenn Curtiss Boulevard, Uniondale, NY 11556-0144 |
The fund files its complete schedule of portfolio holdings with the Securities and Exchange Commission (“SEC”) for the first and third quarters of each fiscal year on Form N-Q. The fund’s Forms N-Q are available on the SEC’s website at http://www.sec.gov and may be reviewed and copied at the SEC’s Public Reference Room in Washington, DC. Information on the operation of the Public Reference Room may be obtained by calling 1-800-SEC-0330.
A description of the policies and procedures that the fund uses to determine how to vote proxies relating to portfolio securities, and information regarding how the fund voted these proxies for the 12-month period ended June 30, 2005, is available at http://www.dreyfus.com and on the SEC’s website at http://www.sec.gov. The description of the policies and procedures is also available without charge, upon request, by calling 1-800-645-6561.

Dreyfus
Institutional Yield Advantage Fund
| | ANNUAL REPORT July 31, 2005
|

The views expressed in this report reflect those of the portfolio manager only through the end of the period covered and do not necessarily represent the views of Dreyfus or any other person in the Dreyfus organization. Any such views are subject to change at any time based upon market or other conditions and Dreyfus disclaims any responsibility to update such views.These views may not be relied on as investment advice and, because investment decisions for a Dreyfus fund are based on numerous factors, may not be relied on as an indication of trading intent on behalf of any Dreyfus fund.
Not FDIC-Insured • Not Bank-Guaranteed • May Lose Value
| | | Contents |
| |
| | | THE FUND |
| |
|
| 2 | | Letter from the Chairman |
| 3 | | Discussion of Fund Performance |
| 6 | | Fund Performance |
| 7 | | Understanding Your Fund’s Expenses |
| 7 | | Comparing Your Fund’s Expenses |
| | | With Those of Other Funds |
| 8 | | Statement of Investments |
| 12 | | Statement of Financial Futures |
| 13 | | Statement of Assets and Liabilities |
| 14 | | Statement of Operations |
| 15 | | Statement of Changes in Net Assets |
| 17 | | Financial Highlights |
| 19 | | Notes to Financial Statements |
| 27 | | Report of Independent Registered |
| | | Public Accounting Firm |
| 28 | | Information About the Review and Approval |
| | | of the Fund’s Management Agreement |
| 32 | | Board Members Information |
| 34 | | Officers of the Fund |
| |
| | | FOR MORE INFORMATION |
| |
|
| | | Back Cover |
| Dreyfus Institutional |
| Yield Advantage Fund |
The Fund

LETTER FROM THE CHAIRMAN
Dear Shareholder:
We are pleased to present this annual report for Dreyfus Institutional Yield Advantage Fund, covering the 12-month period from August 1, 2004, through July 31, 2005. Inside, you’ll find valuable information about how the fund was managed during the reporting period, including a discussion with the fund’s primary portfolio manager, Laurie Carroll.
The past 12 months proved to be an unusual time for fixed-income securities.Although the Federal Reserve Board continued to raise short-term interest rates, yield differences between long- and short-term securities remained relatively narrow for most of the reporting period — contrary to historical norms. Strong demand from domestic and foreign investors, along with mild inflation concerns, helped support prices of U.S. Treasury securities. Corporate bonds also fared well during the reporting period generally due to stronger balance sheets, better business conditions and persistently low default rates.
In our view, these and other factors may have created new opportunities and challenges for fixed-income investors. Our economists currently expect the U.S. economy to continue to grow over the foreseeable future without significant new inflationary pressures, potentially setting the stage for market conditions that could affect the various sectors of the U.S. bond market in different ways.
Thank you for your continued confidence and support.


DISCUSSION OF FUND PERFORMANCE
Laurie Carroll, Portfolio Manager
How did Dreyfus Institutional Yield Advantage Fund perform relative to its benchmark?
For the 12-month period ended July 31, 2005, the fund’s Institutional shares achieved a total return of 1.94%, and the fund’s Investor shares achieved a total return of 2.20% .1 In comparison, the Citigroup 1-Year Treasury Benchmark-on-the-Run Index, the fund’s benchmark, achieved a total return of 1.46% for the same period.2
The Federal Reserve Board (the “Fed”) raised short-term interest rates eight times during the reporting period, and yields of short-term fixed-income securities rose commensurately. The fund produced higher returns than its benchmark, primarily due to strong contributions from commercial mortgage-backed securities, corporate bonds and Treasury Inflation Protected Securities (“TIPS”).
At a meeting of the fund’s Board of Directors held on July 13, 2005, the Board approved the liquidation of the fund effective on or about September 30, 2005.
What other factors influenced the fund’s performance?
When the reporting period began, investors had grown concerned that political uncertainty, surging energy prices and rising interest rates might be holding back the U.S. economic expansion. However, these concerns were alleviated to a large extent with the resolution of the presidential election in November 2004 and clearer signs that the economy was on strong footing.
As interest rates rose during the reporting period’s first half, so did yields of short-term fixed-income securities. At the time, the fund received especially strong contributions from short-duration commer-
DISCUSSION OF FUND PERFORMANCE (continued)
|
cial mortgage-backed securities and short-term corporate bonds, which gained value as business conditions improved.The fund’s TIPS positions also fared well amid stronger economic growth and, in early 2005, from intensifying inflation concerns.
However, investors’ inflation worries proved to be relatively short-lived. By the spring, it had become apparent that higher energy and commodity prices were being offset by lower prices in other areas of the economy, such as discounts from automobile manufacturers and apparel retailers. Employment gains proved to be more gradual than some investors had feared, suggesting that wage inflation remain contained. Nonetheless, the Fed continued to raise short-term interest rates, and the overnight federal funds rate reached 3.25% by the end of the reporting period.
After assuming responsibility for the fund’s management on January 31, 2005, we repositioned the fund slightly by adjusting its average duration toward a point that was slightly shorter than industry averages.We fine-tuned the fund’s sector allocation and security selection by upgrading its credit profile and increasing its exposure to higher-yielding asset-backed securities toward the lower end of the investment-grade range.We also increased the fund’s holdings of floating-rate corporate securities on which yields are reset on a monthly or quarterly basis, which helped keep funds available for higher-yielding securities as they became available. While these strategies helped increase the fund’s exposure to
some of the better-performing areas of the short-term fixed-income marketplace, the fund’s relative performance was compromised during market rallies by its slightly shorter-than-average duration.
| 1 | | Total return includes reinvestment of dividends and any capital gains paid. Past performance is no |
| | | guarantee of future results. Share price, yield and investment return fluctuate such that upon |
| | | redemption, fund shares may be worth more or less than their original cost. Return figures |
| | | provided reflect the absorption of certain fund expenses by The Dreyfus Corporation pursuant to |
| | | an agreement in effect through the fund’s liquidation. Had these expenses not been absorbed, the |
| | | fund’s returns would have been lower. |
| 2 | | SOURCE: BLOOMBERG L.P. — Reflects reinvestment of dividends and, where applicable, |
| | | capital gain distributions.The Citigroup 1-Year Treasury Benchmark-on-the-Run Index is an |
| | | unmanaged index generally representative of the average yield on 1-year U.S.Treasury bills.The |
| | | index does not take into account charges, fees and other expenses.Total return is calculated on a |
| | | month-end basis. |

Comparison of change in value of $10,000 investment in Dreyfus Institutional Yield Advantage Fund Institutional shares and Investor shares and the Citigroup 1-Year Treasury Benchmark-on-the-Run Index
| Average Annual Total Returns | | as of 7/31/05 | | | | |
| | | Inception | | | | From |
| | | Date | | 1 Year | | Inception |
| |
| |
| |
|
| Institutional shares | | 11/15/01 | | 1.94% | | 1.76% |
| Investor shares | | 11/15/01 | | 2.20% | | 1.66% |
† Source: Bloomberg L.P.
Past performance is not predictive of future performance.The fund’s performance shown in the graph and table does not reflect the deduction of taxes that a shareholder would pay on fund distributions or the redemption of fund shares. The above graph compares a $10,000 investment made in Institutional and Investor shares of Dreyfus Institutional Yield Advantage Fund on 11/15/01 (inception date) to a $10,000 investment made in the Citigroup 1-Year Treasury Benchmark-on-the-Run Index (the “Index”) on that date. For comparative purposes, the value of the Index on 11/30/01 is used as the beginning value on 11/15/01.The fund’s Institutional shares are not subject to a Rule 12b-1 fee.The fund’s Investor shares are subject to a 0.25% annual Rule 12b-1 fee.All dividends and capital gain distributions are reinvested. The fund invests primarily in investment-grade fixed-income securities of U.S. and foreign issuers and seeks to maintain an average effective duration of one year or less.The fund’s performance shown in the line graph takes into account all applicable fees and expenses.The Index is an unmanaged index generally representative of the average yield on 1-year U.S.Treasury bills.The Index does not take into account charges, fees and other expenses. Further information relating to fund performance, including expense reimbursements, if applicable, is contained in the Financial Highlights section of the prospectus and elsewhere in this report.
6
U N D E R S TA N D I N G YO U R F U N D ’ S E X P E N S E S ( U n a u d i t e d )
As a mutual fund investor, you pay ongoing expenses, such as management fees and other expenses. Using the information below, you can estimate how these expenses affect your investment and compare them with the expenses of other funds.You also may pay one-time transaction expenses, including sales charges (loads) and redemption fees, which are not shown in this section and would have resulted in higher total expenses. For more information, see your fund’s prospectus or talk to your financial adviser.
Review your fund’s expenses
The table below shows the expenses you would have paid on a $1,000 investment in Dreyfus Institutional Yield Advantage Fund from February 1, 2005 to July 31, 2005. It also shows how much a $1,000 investment would be worth at the close of the period, assuming actual returns and expenses.
| Expenses and Value of a $1,000 Investment | | |
| assuming actual returns for the six months ended July 31, 2005 | | |
| | | Investor Shares | | Institutional Shares |
| |
| |
|
| Expenses paid per $1,000 † | | $ 1.99 | | $ .75 |
| Ending value (after expenses) | | $1,005.80 | | $1,007.10 |
COMPARING YOUR FUND’S EXPENSES WITH THOSE OF OTHER FUNDS (Unaudited)
Using the SEC’s method to compare expenses
The Securities and Exchange Commission (SEC) has established guidelines to help investors assess fund expenses. Per these guidelines, the table below shows your fund’s expenses based on a $1,000 investment, assuming a hypothetical 5% annualized return. You can use this information to compare the ongoing expenses (but not transaction expenses or total cost) of investing in the fund with those of other funds.All mutual fund shareholder reports will provide this information to help you make this comparison. Please note that you cannot use this information to estimate your actual ending account balance and expenses paid during the period.
Expenses and Value of a $1,000 Investment assuming a hypothetical 5% annualized return for the six months ended July 31, 2005
| | | Investor Shares | | Institutional Shares |
| |
| |
|
| Expenses paid per $1,000 † | | $ 2.01 | | $ .75 |
| Ending value (after expenses) | | $1,022.81 | | $1,024.05 |
† Expenses are equal to the fund’s annualized expense ratio of .40% for Investor shares and .15% for Institutional shares; multiplied by the average account value over the period, multiplied by 181/365 (to reflect the one-half year period).
| | STATEMENT OF INVESTMENTS
July 31, 2005
|
| | | Principal | | | | |
| Bonds and Notes—38.1% | | Amount ($) | | Value ($) |
| |
| |
|
| Aerospace & Defense—.5% | | | | | | |
| Raytheon, | | | | | | |
| Notes, 6.75%, 2007 | | 100,000 | | | | 104,078 |
| Asset-Backed Ctfs./Automobile Receivables—3.5% | | | | |
| Harley-Davidson Motorcycle Trust, | | | | | | |
| Ser. 2005-2, Cl. A2, 4.07%, 2012 | | 100,000 | | | | 99,172 |
| Hyundai Auto Receivables Trust, | | | | | | |
| Ser. 2005-A, Cl. A3, 3.98%, 2009 | | 200,000 | | | | 198,594 |
| USAA Auto Owner Trust, | | | | | | |
| Ser. 2005-2, Cl. A4, 4.17%, 2011 | | 185,000 | | | | 183,274 |
| WFS Financial Owner Trust, | | | | | | |
| Ser. 2004-1, Cl. A4, 2.81%, 2011 | | 250,000 | | | | 244,893 |
| | | | | | | 725,933 |
| Asset-Backed Ctfs./Home Equity Loans—10.0% | | | | |
| Accredited Mortgage Loan Trust, | | | | | | |
| Ser. 2005-2, Cl. A2A, 3.56%, 2035 | | 285,330 | | a | | 285,417 |
| Asset-Backed Securities Corp. Home Equity, | | | | |
| Ser. 2004-HE3, Cl. M2, 4.58%, 2034 | | 250,000 | | a | | 252,865 |
| Countrywide Asset-Backed Certificates, | | | | | | |
| Ser. 2005-7, Cl. 3AV1, 3.58%, 2035 | | 156,803 | | a | | 156,885 |
| Fremont Home Loan Trust, | | | | | | |
| Ser. 2005-B, Cl. 2A1, 3.55%, 2035 | | 271,469 | | a | | 271,671 |
| Home Equity Asset Trust, | | | | | | |
| Ser. 2005-5, Cl. 2A1, 3.62%, 2035 | | 300,000 | | a | | 299,970 |
| Residential Asset Securities, | | | | | | |
| Ser. 2005-KS4, Cl. A2, 3.66%, 2035 | | 200,000 | | a | | 199,964 |
| Saxon Asset Securities Trust, | | | | | | |
| Ser. 2005-2, Cl. A2B, 3.62%, 2035 | | 300,000 | | a | | 300,110 |
| Specialty Underwriting & Residential Finance, | | | | |
| Ser. 2005-BC2, Cl. A2B, 3.68%, 2035 | | 300,000 | | a | | 300,594 |
| | | | | | | 2,067,476 |
| Banking—.6% | | | | | | |
| Washington Mutual, | | | | | | |
| Sr. Notes, 5.625%, 2007 | | 125,000 | | | | 127,026 |
| Diversified Financial Services—8.5% | | | | | | |
| American General Finance, | | | | | | |
| Sr. Notes, Ser. I, 3.53%, 2007 | | 300,000 | | a | | 300,069 |
| Amvescap, | | | | | | |
| Sr. Notes, 5.9%, 2007 | | 150,000 | | | | 152,959 |
8
| | | Principal | | | | |
| Bonds and Notes (continued) | | Amount ($) | | Value ($) |
| |
| |
|
| Diversified Financial Services (continued) | | | | |
| Bear Stearns, | | | | | | |
| Sr. Notes, 4%, 2008 | | 225,000 | | | | 222,550 |
| Capital One Bank, | | | | | | |
| Notes, 4.875%, 2008 | | 100,000 | | | | 100,617 |
| Countrywide Home Loan, | | | | | | |
| Notes, Ser. K, 5.5%, 2007 | | 155,000 | | | | 157,332 |
| Goldman Sachs, | | | | | | |
| Notes, 3.778%, 2010 | | 300,000 | | a | | 300,733 |
| HSBC Finance, | | | | | | |
| Notes, 3.48%, 2010 | | 200,000 | | a | | 200,213 |
| Merrill Lynch & Co., | | | | | | |
| Notes, Ser. C, 3.519%, 2008 | | 200,000 | | a | | 200,230 |
| Residential Capital, | | | | | | |
| Notes, 4.835%, 2007 | | 140,000 | | a,b | | 140,221 |
| | | | | | | 1,774,924 |
| Food & Beverages—1.2% | | | | | | |
| Kroger, | | | | | | |
| Sr. Notes, 7.625%, 2006 | | 100,000 | | | | 103,364 |
| Miller Brewing, | | | | | | |
| Notes, 4.25%, 2008 | | 150,000 | | b | | 148,179 |
| | | | | | | 251,543 |
| Manufacturing—1.5% | | | | | | |
| Tyco International, | | | | | | |
| Notes, 5.8%, 2006 | | 315,000 | | | | 319,420 |
| Media—.5% | | | | | | |
| News America, | | | | | | |
| Sr. Notes, 6.625%, 2008 | | 100,000 | | c | | 104,546 |
| Oil & Gas—1.1% | | | | | | |
| Ocean Energy, | | | | | | |
| Sr. Notes, 4.375%, 2007 | | 45,000 | | | | 44,732 |
| Sempra Energy, | | | | | | |
| Sr. Notes, 4.621%, 2007 | | 190,000 | | | | 190,018 |
| | | | | | | 234,750 |
| Residential Mortgage Pass-Through Ctfs.—.5% | | | | |
| Adjustable Rate Mortgage Trust, | | | | | | |
| Ser. 2005-7, Cl. 7A21, 3.71%, 2035 | | 96,196 | | a | | 95,926 |
| | STATEMENT OF INVESTMENTS (continued)
|
| | | Principal | | |
| Bonds and Notes (continued) | | Amount ($) | | Value ($) |
| |
| |
|
| U.S. Government—6.1% | | | | |
| U.S. Treasury Inflation Protected Securities, | | | | |
| 3.625%, 1/15/2008 | | 1,203,350 d,e | | 1,261,219 |
| U.S. Government Agencies—2.9% | | | | |
| Federal Home Loan Bank, | | | | |
| Bonds, 4.125%, 4/18/2008 | | 250,000 | | 248,958 |
| Federal National Mortgage Association, | | | | |
| Notes, 3.625%, 3/15/2007 | | 350,000 | | 347,281 |
| | | | | 596,239 |
| U.S. Government Agencies/Mortgage-Backed—1.2% | | |
| Federal National Mortgage Association, | | | | |
| Ser. 2005-47, Cl. PA, 5.5%, 9/25/2024 | | 250,000 | | 253,865 |
| Total Bonds and Notes | | | | |
| (cost $7,946,017) | | | | 7,916,945 |
| |
| |
|
| |
| Other Investment—25.0% | | Shares | | Value ($) |
| |
| |
|
| Registered Investment Company; | | | | |
| Dreyfus Institutional Preferred Plus Money Market Fund | | |
| (cost $5,180,000) | | 5,180,000 f | | 5,180,000 |
| |
| |
|
| | | Principal | | |
| Short-Term Investments—20.7% | | Amount ($) | | Value ($) |
| |
| |
|
| Agency Discount Notes—9.6% | | | | |
| Federal Home Loan Mortgage Corp., | | | | |
| 3.25%, 9/20/2005 | | 1,000,000 | | 995,486 |
| Federal National Mortgage Association, | | | | |
| 3.25%, 9/16/2005 | | 1,008,000 | | 1,003,814 |
| | | | | 1,999,300 |
| Commercial Paper—1.5% | | | | |
| Danske, | | | | |
| 3.23%, 8/3/2005 | | 300,000 | | 299,946 |
| U.S. Treasury Bills—9.6% | | | | |
| 3.03%, 9/15/2005 | | 2,000,000 | | 1,992,160 |
| Total Short-Term Investments | | | | |
| (cost $4,291,827) | | | | 4,291,406 |
| Investment of Cash Collateral | | | | |
| for Securities Loaned—.5% | | | | Shares | | Value ($) |
| |
| |
| |
|
| Registered Investment Company; | | | | | | |
| Dreyfus Institutional Cash Advantage Plus Fund | | | | |
| (cost $108,000) | | | | 108,000 f | | 108,000 |
| |
| |
| |
|
| |
| Total Investments (cost $17,525,844) | | 84.3% | | 17,496,351 |
| |
| Cash and Receivables (Net) | | | | 15.7% | | 3,269,977 |
| |
| Net Assets | | | | 100.0% | | 20,766,328 |
| |
| a | | Variable rate security—interest rate subject to periodic change. | | |
| b | | Securities exempt from registration under Rule 144A of the Securities Act of 1933.These securities may be resold in |
| | | transactions exempt from registration, normally to qualified institutional buyers. At July 31, 2005, these securities |
| | | amounted to $288,400 or 1.4% of net assets. | | | | |
| c | | All of this security is on loan. At July 31, 2005, the total market value of the fund’s security on loan is $104,546 |
| | | and the total market value of the collateral held by the fund is $108,000. | | |
| d | | Partially held by a broker as collateral for open financial futures positions. | | |
| e | | Principal amount for accrual purposes is periodically adjusted based on changes in the Consumer Price Index. |
| f | | Investments in affiliated money market mutual funds. | | | | |
| |
| |
| |
|
| |
| |
| Portfolio Summary † | | | | | | |
| |
| | | | | Value (%) | | | | Value (%) |
| |
| |
| |
| |
|
| Short-Term/ | | | | U.S. Government/Agency Securities 10.2 |
| Money Market Investments | | 46.2 | | Futures Contracts | | (.1) |
| Mortgage/Asset Backed Securities | | 14.0 | | | | |
| Corporate Bonds | | 13.9 | | | | 84.2 |
| |
| † | | Based on net assets. | | | | | | |
| See notes to financial statements. | | | | | | |
STATEMENT OF FINANCIAL FUTURES
July 31, 2005
| | | | | Market Value | | | | Unrealized |
| | | | | Covered | | | | (Depreciation) |
| | | Contracts | | by Contracts ($) | | Expiration | | at 7/31/2005 ($) |
| |
| |
| |
| |
|
| |
| Financial Futures Long | | | | | | | | |
| U.S. Treasury 2 Year Notes | | 12 | | 2,477,813 | | September 2005 | | (14,062) |
| U.S. Treasury 5 Year Notes | | 3 | | 321,609 | | September 2005 | | (4,125) |
| | | | | | | | | (18,187) |
See notes to financial statements.
|
STATEMENT OF ASSETS AND LIABILITIES
July 31, 2005
| | | Cost | | Value |
| |
| |
|
| Assets ($): | | | | |
| Investments in securities—See Statement | | |
| of Investments (including securities on loan, | | |
| valued at $104,546)—Note 1(b): | | | | |
| Unaffiliated issuers | | 12,237,844 | | 12,208,351 |
| Affiliated issuers | | 5,288,000 | | 5,288,000 |
| Cash | | | | 3,656,316 |
| Dividends and interest receivable | | | | 61,184 |
| Prepaid expenses | | | | 16,552 |
| | | | | 21,230,403 |
| |
| |
|
| Liabilities ($): | | | | |
| Due to The Dreyfus Corporation and affiliates—Note 3(b) | | 2,508 |
| Liability for securities on loan—Note 1(b) | | 108,000 |
| Payable for investment securities purchased | | 300,029 |
| Payable for shares of Common Stock redeemed | | 9,809 |
| Payable for futures variation margin—Note 4 | | 3,469 |
| Accrued expenses | | | | 40,260 |
| | | | | 464,075 |
| |
| |
|
| Net Assets ($) | | | | 20,766,328 |
| |
| |
|
| Composition of Net Assets ($): | | | | |
| Paid-in capital | | | | 30,794,055 |
| Accumulated undistributed investment income—net | | 173,034 |
| Accumulated net realized gain (loss) on investments | | (10,153,081) |
| Accumulated net unrealized appreciation | | |
| (depreciation) on investments [including ($18,187) | | |
| net unrealized (depreciation) on financial futures] | | (47,680) |
| |
|
| Net Assets ($) | | | | 20,766,328 |
| |
| |
|
| |
| |
| Net Asset Value Per Share | | | | |
| | | Investor Shares | | Institutional Shares |
| |
| |
|
| Net Assets ($) | | 18,858,962 | | 1,907,366 |
| Shares Outstanding | | 9,880,766 | | 1,001,614 |
| |
| |
|
| Net Asset Value Per Share ($) | | 1.91 | | 1.90 |
| | See notes to financial statements.
|
| | STATEMENT OF OPERATIONS
Year Ended July 31, 2005
|
| Investment Income ($): | | |
| Income: | | |
| Interest | | 618,866 |
| Dividends; | | |
| Affiliated issuers | | 110,028 |
| Income from securities lending | | 101 |
| Total Income | | 728,995 |
| Expenses: | | |
| Management fee—Note 3(a) | | 64,757 |
| Service fees (Investor Shares)—Note 3(b) | | 60,027 |
| Auditing fees | | 29,094 |
| Registration fees | | 25,872 |
| Custodian fees—Note 3(b) | | 7,004 |
| Prospectus and shareholders’ reports | | 5,600 |
| Directors’ fees and expenses—Note 3(c) | | 1,197 |
| Legal fees | | 78 |
| Miscellaneous | | 5,589 |
| Total Expenses | | 199,218 |
| Less—expense reimbursement from The Dreyfus | | |
| Corporation due to undertaking—Note 3(a) | | (74,435) |
| Less—reduction in custody fees due to | | |
| earnings credits—Note 1(b) | | (7,004) |
| Net Expenses | | 117,779 |
| Investment Income—Net | | 611,216 |
| |
|
| Realized and Unrealized Gain (Loss) on Investments—Note 4 ($): |
| Net realized gain (loss) on investments | | 24,546 |
| Net realized gain (loss) on financial futures | | (85,056) |
| Net realized gain (loss) on options transactions | | (884) |
| Net Realized Gain (Loss) | | (61,394) |
| Net unrealized appreciation (depreciation) on investments | | |
| (including $8,235 net unrealized appreciation on financial futures) | | 68,233 |
| Net Realized and Unrealized Gain (Loss) on Investments | | 6,839 |
| Net Increase in Net Assets Resulting from Operations | | 618,055 |
| | See notes to financial statements.
|
STATEMENT OF CHANGES IN NET ASSETS
| | | | | Year Ended July 31, |
| |
| |
|
| | | 2005 | | 2004 |
| |
| |
|
| Operations ($): | | | | |
| Investment income—net | | 611,216 | | 1,916,228 |
| Net realized gain (loss) on investments | | (61,394) | | (6,789,595) |
| Net unrealized appreciation | | | | |
| (depreciation) on investments | | 68,233 | | 5,298,039 |
| Net Increase (Decrease) in Net Assets | | | | |
| Resulting from Operations | | 618,055 | | 424,672 |
| |
| |
|
| Dividends to Shareholders from ($): | | | | |
| Investment income—net: | | | | |
| Investor Shares | | (521,446) | | (787,168) |
| Institutional Shares | | (199,297) | | (1,605,259) |
| Total Dividends | | (720,743) | | (2,392,427) |
| |
| |
|
| Capital Stock Transactions ($): | | | | |
| Net proceeds from shares sold: | | | | |
| Investor Shares | | 330,566 | | 10,795,418 |
| Institutional Shares | | 143,387 | | 13,685,303 |
| Dividends reinvested: | | | | |
| Investor Shares | | 521,446 | | 729,819 |
| Institutional Shares | | 86,746 | | 513,632 |
| Cost of shares redeemed: | | | | |
| Investor Shares | | (10,915,611) | | (12,197,986) |
| Institutional Shares | | (20,897,092) | | (156,347,477) |
| Increase (Decrease) in Net Assets from | | | | |
| Capital Stock Transactions | | (30,730,558) | | (142,821,291) |
| Total Increase (Decrease) in Net Assets | | (30,833,246) | | (144,789,046) |
| |
| |
|
| Net Assets ($): | | | | |
| Beginning of Period | | 51,599,574 | | 196,388,620 |
| End of Period | | 20,766,328 | | 51,599,574 |
| Undistributed investment income—net | | 173,034 | | 144,416 |
STATEMENT OF CHANGES IN NET ASSETS (continued)
|
| | | | | Year Ended July 31, |
| |
| |
|
| | | 2005 | | 2004 |
| |
| |
|
| Capital Share Transactions: | | | | |
| Investor Shares | | | | |
| Shares sold | | 173,223 | | 5,554,270 |
| Shares issued for dividends reinvested | | 273,074 | | 377,108 |
| Shares redeemed | | (5,687,125) | | (6,300,222) |
| Net Increase (Decrease) in Shares Outstanding | | (5,240,828) | | (368,844) |
| |
| |
|
| Institutional Shares | | | | |
| Shares sold | | 75,279 | | 7,014,722 |
| Shares issued for dividends reinvested | | 45,418 | | 264,674 |
| Shares redeemed | | (10,979,608) | | (80,150,777) |
| Net Increase (Decrease) in Shares Outstanding | | (10,858,911) | | (72,871,381) |
See notes to financial statements.
|
The following tables describe the performance for each share class for the fiscal periods indicated.All information (except portfolio turnover rate) reflects financial results for a single fund share.Total return shows how much your investment in the fund would have increased (or decreased) during each period, assuming you had reinvested all dividends and distributions.These figures have been derived from the fund’s financial statements.
| | | | | | | Year Ended July 31, | | |
| | | |
| |
| |
|
| Investor Shares | | 2005 | | 2004 | | 2003 | | 2002a |
| |
| |
| |
| |
|
| Per Share Data ($): | | | | | | | | |
| Net asset value, beginning of period | | 1.91 | | 1.96 | | 2.00 | | 2.00 |
| Investment Operations: | | | | | | | | |
| Investment income—net b | | .03 | | .04 | | .05 | | .05 |
| Net realized and unrealized | | | | | | | | |
| gain (loss) on investments | | .01 | | (.04) | | (.03) | | .01 |
| Total from Investment Operations | | .04 | | .00 | | .02 | | .06 |
| Distributions: | | | | | | | | |
| Dividends from investment income—net | | (.04) | | (.05) | | (.06) | | (.06) |
| Net asset value, end of period | | 1.91 | | 1.91 | | 1.96 | | 2.00 |
| |
| |
| |
| |
|
| Total Return (%) | | 2.20 | | .02 | | 1.12 | | 2.82c |
| |
| |
| |
| |
|
| Ratios/Supplemental Data (%): | | | | | | | | |
| Ratio of total expenses to average net assets | | .69 | | .63 | | .51 | | .89d |
| Ratio of net expenses to average net assets | | .42 | | .45 | | .45 | | .45d |
| Ratio of net investment income | | | | | | | | |
| to average net assets | | 1.80 | | 1.94 | | 2.55 | | 3.71d |
| Portfolio Turnover Rate | | 322.79 | | 461.50 | | 441.13 | | 98.01c |
| |
| |
| |
| |
|
| Net Assets, end of period ($ x 1,000) | | 18,859 | | 28,926 | | 30,368 | | 14,833 |
| a | | From November 15, 2001 (commencement of operations) to July 31, 2002. | | | | |
| b | | Based on average shares outstanding at each month end. | | | | | | |
| c | | Not annualized. | | | | | | | | |
| d | | Annualized. | | | | | | | | |
| See notes to financial statements. | | | | | | | | |
FINANCIAL HIGHLIGHTS (continued)
|
| | | | | | | Year Ended July 31, | | |
| | | |
| |
| |
|
| Institutional Shares | | 2005 | | 2004 | | 2003 | | 2002 a |
| |
| |
| |
| |
|
| Per Share Data ($): | | | | | | | | |
| Net asset value, beginning of period | | 1.91 | | 1.96 | | 2.00 | | 2.00 |
| Investment Operations: | | | | | | | | |
| Investment income—net b | | .04 | | .04 | | .06 | | .06 |
| Net realized and unrealized gain (loss) | | | | | | | | |
| on investments | | .00c | | (.04) | | (.03) | | .00c |
| Total from Investment Operations | | .04 | | .00 | | .03 | | .06 |
| Distributions: | | | | | | | | |
| Dividends from investment income—net | | (.05) | | (.05) | | (.07) | | (.06) |
| Net asset value, end of period | | 1.90 | | 1.91 | | 1.96 | | 2.00 |
| |
| |
| |
| |
|
| Total Return (%) | | 1.94 | | .25 | | 1.37 | | 3.00d |
| |
| |
| |
| |
|
| Ratios/Supplemental Data (%): | | | | | | | | |
| Ratio of total expenses to average net assets | | .40 | | .36 | | .26 | | .37e |
| Ratio of net expenses to average net assets | | .19 | | .20 | | .20 | | .20e |
| Ratio of net investment income | | | | | | | | |
| to average net assets | | 2.14 | | 2.45 | | 2.77 | | 4.10e |
| Portfolio Turnover Rate | | 322.79 | | 461.50 | | 441.13 | | 98.01d |
| |
| |
| |
| |
|
| Net Assets, end of period ($ x 1,000) | | 1,907 | | 22,674 | | 166,020 | | 253,254 |
| |
| a | | From November 15, 2001 (commencement of operations) to July 31, 2002. | | | | |
| b | | Based on average shares outstanding at each month end. | | | | | | |
| c | | Amount represents less than $.01 per share. | | | | | | | | |
| d | | Not annualized. | | | | | | | | |
| e | | Annualized. | | | | | | | | |
| See notes to financial statements. | | | | | | | | |
NOTES TO FINANCIAL STATEMENTS
NOTE 1—Significant Accounting Policies:
Dreyfus Institutional Yield Advantage Fund (the “fund”) is a separate diversified series of Dreyfus Investment Grade Funds, Inc. (the “Company”) which is registered under the Investment Company Act of 1940, as amended (the “Act”), as an open-end management investment company and operates as a series company currently offering five series, including the fund.The fund’s investment objective is to provide investors with as high a level of current income as is consistent with the preservation of capital with minimal changes in share price. The Dreyfus Corporation (the “Manager” or “Dreyfus”) serves as the fund’s investment adviser. The Manager is a wholly-owned subsidiary of Mellon Financial Corporation (“Mellon Financial”).
On July 13, 2005, the fund’s Board of Directors approved the liquidation of the fund, on or about September 30, 2005. Effective July 18, 2005, the fund was closed to new investment accounts. Current investors can continue to purchase fund shares in open accounts.
Dreyfus Service Corporation (the “Distributor”), a wholly-owned subsidiary of the Manager, is the distributor of the fund’s shares which are sold to the public without a sales charge.The fund is authorized to issue 500 million shares of $.001 par value Common Stock in each of the following classes of shares: Investor and Institutional. Investor shares are subject to a Service Plan adopted pursuant to Rule 12b-1 under the Act. Other differences between the classes include the services offered to and the expenses borne by each class, the minimum initial investment and certain voting rights. Income, expenses (other than expenses attributable to a specific class), and realized and unrealized gains or losses on investments are allocated to each class of shares based on its relative net assets.
The Company accounts separately for the assets, liabilities and operations of each series. Expenses directly attributable to each series are charged to that series’ operations; expenses which are applicable to all series are allocated among them on a pro rata basis.
NOTES TO FINANCIAL STATEMENTS (continued)
|
The fund’s financial statements are prepared in accordance with U.S. generally accepted accounting principles, which may require the use of management estimates and assumptions. Actual results could differ from those estimates.
The fund enters into contracts that contain a variety of indemnifications. The fund’s maximum exposure under these arrangements is unknown.The fund does not anticipate recognizing any loss related to these arrangements.
(a) Portfolio valuation: Investments in securities (excluding short-term investments (other than U.S.Treasury Bills), financial futures and options) are valued each business day by an independent pricing service (the “Service”) approved by the Board of Directors. Investments for which quoted bid prices are readily available and are representative of the bid side of the market in the judgment of the Service are valued at the mean between the quoted bid prices (as obtained by the Service from dealers in such securities) and asked prices (as calculated by the Service based upon its evaluation of the market for such securities). Other investments (which constitute a majority of the portfolio securities) are valued as determined by the Service, based on methods which include consideration of: yields or prices of securities of comparable quality, coupon, maturity and type; indications as to values from dealers; and general market conditions. Securities for which there are no such valuations are valued at fair value as determined in good faith under the direction of the Board of Directors. Restricted securities, as well as securities or other assets for which recent market quotations are not readily available, that are not valued by a pricing service approved by the Board of Directors, or are determined by the fund not to reflect accurately fair value (such as when an event occurs after the close of the exchange on which the security is principally traded and that is determined by the fund to have changed the value of the security), are valued at fair value as determined in good faith under the direction of the Board of Directors.The factors that may be considered when fair valuing a security include fundamental analytical data, the nature and duration of restrictions on disposition, an evaluation of the forces that
influence the market in which the securities are purchased and sold and public trading in similar securities of the issuer or comparable issuers. Short-term investments, excluding U.S. Treasury Bills, are carried at amortized cost, which approximates value. Investments in registered investment companies are valued at their net asset value. Financial futures and options, which are traded on an exchange, are valued at the last sales price on the securities exchange on which such securities are primarily traded or at the last sales price on the national securities market on each business day. Options traded over-the-counter are priced at the mean between the bid and asked price.
(b) Securities transactions and investment income: Securities transactions are recorded on a trade date basis. Realized gain and loss from securities transactions are recorded on the identified cost basis. Dividend income is recognized on the ex-dividend date and interest income, including, where applicable, accretion of discount and amortization of premium on investments, is recognized on the accrual basis.
The fund has an arrangement with the custodian bank whereby the fund receives earnings credits from the custodian when positive cash balances are maintained, which are used to offset custody fees. For financial reporting purposes, the fund includes net earnings credits as an expense offset in the Statement of Operations.
Pursuant to a securities lending agreement with Mellon Bank, N.A., an affiliate of the Manager, the fund may lend securities to qualified institu-tions.At origination, all loans are secured by collateral of at least 102% of the value of U.S. securities loaned and 105% of the value of foreign securities loaned. Collateral equivalent to at least 100% of the market value of securities on loan will be maintained at all times. Cash collateral is invested in certain money market mutual funds managed by the Manager. The fund will be entitled to receive all income on securities loaned, in addition to income earned as a result of the lending transac-tion.Although each security loaned is fully collateralized, the fund would bear the risk of delay in recovery of, or loss of rights in, the securities loaned should a borrower fail to return the securities in a timely manner.
NOTES TO FINANCIAL STATEMENTS (continued)
|
(c) Affiliated issuers: Investments in other investment companies advised by the Manager are defined as “affiliated” in the Act.
(d) Dividends to shareholders: It is the policy of the fund to declare dividends daily from investment income-net. Such dividends are paid monthly. Dividends from net realized capital gain, if any, are normally declared and paid annually, but the fund may make distributions on a more frequent basis to comply with the distribution requirements of the Internal Revenue Code of 1986, as amended (the “Code”).To the extent that net realized capital gain can be offset by capital loss carryovers, it is the policy of the fund not to distribute such gain. Income and capital gain distributions are determined in accordance with income tax regulations, which may differ from U.S. generally accepted accounting principles.
(e) Federal income taxes: It is the policy of the fund to continue to qualify as a regulated investment company, if such qualification is in the best interests of its shareholders, by complying with the applicable provisions of the Code, and to make distributions of taxable income sufficient to relieve it from substantially all federal income and excise taxes.
At July 31, 2005, the components of accumulated earnings on a tax basis were as follows: undistributed ordinary income $192,804, accumulated capital losses $9,912,300 and unrealized depreciation $49,263. In addition, the fund had $258,968 of capital losses realized after October 31, 2004, which were deferred for tax purposes to the first day of the following fiscal year.
The accumulated capital loss carryover is available to be applied against future net securities profits, if any, realized subsequent to July 31, 2005. If not applied, $2,281,578 of the carryover expires in fiscal 2011, $625,567 expires in fiscal 2012 and $7,005,155 expires in fiscal 2013.
The tax character of distributions paid to shareholders during the fiscal periods ended July 31, 2005 and July 31, 2004 were as follows: ordinary income $720,743 and $2,392,427, respectively.
During the period ended July 31, 2005, as a result of permanent book to tax differences primarily due to the tax treatment for paydown gains and losses on mortgage-backed securities and the sales treatment for treasury inflation protected securities, the fund increased accumulated undistributed investment income-net by $138,145 and decreased accumulated net realized gain (loss) on investments by the same amount. Net assets were not affected by this reclassification.
NOTE 2—Bank Line of Credit:
The fund participates with other Dreyfus-managed funds in a $100 million unsecured line of credit primarily to be utilized for temporary or emergency purposes, including the financing of redemptions. Interest is charged to the fund based on prevailing market rates in effect at the time of borrowings. During the period ended July 31, 2005, the fund did not borrow under the line of credit.
NOTE 3—Management Fee and Other Transactions With Affiliates:
(a) Pursuant to a management agreement (“Agreement”) with the Manager, the management fee is computed at the annual rate of .20 of 1% of the value of the fund’s average daily net assets and is payable monthly. The Manager has undertaken from August 1, 2004 through July 31, 2005, to reduce the management fee paid by the fund, if the fund’s aggregate expenses, exclusive of taxes, brokerage fees, interest on borrowings, service plan fees and extraordinary expenses, exceed an annual rate of .20 of 1% of the value of the fund’s average daily net assets. The expense reimbursement, pursuant to the undertaking, amounted to $74,435 during the period ended July 31, 2005.
(b) Under the Investor Shares Service Plan (the “Plan”) adopted pursuant to Rule 12b-1 under the Act, the fund pays the Distributor for distributing the fund’s Investor Shares, for servicing shareholder accounts (“Servicing”) and for advertising and marketing relating to the
NOTES TO FINANCIAL STATEMENTS (continued)
|
fund’s Investor Shares.The Plan provides for payments to be made at an annual rate of .25 of 1% of the value of the average daily net assets of Investor Shares.The Distributor determines the amounts, if any, to be paid to Service Agents (a securities dealer, financial institution or other industry professional) under the Plan and the basis on which such payments are made.The fees payable under the Plan are payable without regard to actual expenses incurred. During the period ended July 31, 2005, Investor Shares were charged $60,027 pursuant to the Plan.
The fund compensates Dreyfus Transfer, Inc., a wholly-owned subsidiary of the Manager, under a transfer agency agreement for providing personnel and facilities to perform transfer agency services for the fund. During the period ended July 31, 2005, the fund was charged $761 pursuant to the transfer agency agreement.
The fund compensates Mellon Bank, N.A., an affiliate of the Manager, under a custody agreement for providing custodial services for the fund. During the period ended July 31, 2005, the fund was charged $7,004 pursuant to the custody agreement.
During the period ended July 31, 2005, the fund was charged $2,308 for services performed by the Chief Compliance Officer.
The components of Due to The Dreyfus Corporation and affiliates in the Statement of Assets and Liabilities consist of: management fees $3,530, service fees $4,003, chief compliance officer fees $2,308 and transfer agency per account fees $150, which are offset against an expense reimbursement currently in effect in the amount of $7,483.
(c) Each Board member also serves as a Board member of other funds within the Dreyfus complex. Annual retainer fees and attendance fees are allocated to each fund based on net assets.
(d) Pursuant to an exemptive order from the Securities and Exchange Commission, the fund may invest its available cash balances in affiliated money market mutual funds. Management fees of the underlying money market mutual funds have been waived by the Manager.
NOTE 4—Securities Transactions:
The aggregate amount of purchases and sales (including paydowns) of investment securities, excluding short-term securities, financial futures and options transactions, during the period ended July 31, 2005, amounted to $61,746,422 and $91,068,702, respectively.
The fund may invest in financial futures contracts in order to gain exposure to or protect against changes in the market.The fund is exposed to market risk as a result of changes in the value of the underlying financial instruments. Investments in financial futures require the fund to “mark to market” on a daily basis, which reflects the change in market value of the contracts at the close of each day’s trading.Accordingly, variation margin payments are received or made to reflect daily unrealized gains and losses. When the contracts are closed, the fund recognizes a realized gain or loss. These investments require initial margin deposits with a broker, which consist of cash or cash equivalents.The amount of these deposits is determined by the exchange or Board of Trade on which the contract is traded and is subject to change. Contracts open at July 31, 2005, are set forth in the Statement of Financial Futures.
At July 31, 2005, the cost of investments for federal income tax purposes was $17,545,614; accordingly, accumulated net unrealized depreciation on investments was $49,263, consisting of $2,822 gross unrealized appreciation and $52,085 gross unrealized depreciation.
In early 2004, two purported class and derivative actions were filed against Mellon Financial, Mellon Bank, N.A., Dreyfus, Founders Asset Management LLC, and certain directors of the Dreyfus Funds and the Dreyfus Founders Funds (together, the “Funds”) in the United States District Court for the Western District of Pennsylvania. In September 2004, plaintiffs served a Consolidated Amended Complaint (the “Amended Complaint”) on behalf of a purported class of all persons who acquired interests in any of the Funds between January 30, 1999
NOTES TO FINANCIAL STATEMENTS (continued)
|
and November 17, 2003, and derivatively on behalf of the Funds.The Amended Complaint in the newly styled In re Dreyfus Mutual Funds Fee Litigation also named the Distributor, Premier Mutual Fund Services, Inc. and two additional Fund directors as defendants and alleges violations of the Investment Company Act of 1940, the Investment Advisers Act of 1940, the Pennsylvania Unfair Trade Practices and Consumer Protection Law and common-law claims. Plaintiffs seek to recover allegedly improper and excessive Rule 12b-1 and advisory fees allegedly charged to the Funds for marketing and distribution services. More specifically, plaintiffs claim, among other things, that 12b-1 fees and directed brokerage were improperly used to pay brokers to recommend the Funds over other funds, and that such payments were not disclosed to investors. In addition, plaintiffs assert that economies of scale and soft-dollar benefits were not passed on to the Funds. Plaintiffs further allege that 12b-1 fees were improperly charged to certain of the Funds that were closed to new investors.The Amended Complaint seeks compensatory and punitive damages, rescission of the advisory contracts, and an accounting and restitution of any unlawful fees, as well as an award of attorneys’ fees and litigation expenses. As noted, some of the claims in this litigation are asserted derivatively on behalf of the Funds that have been named as nominal defendants. With respect to such derivative claims, no relief is sought against the Funds. Dreyfus believes the allegations to be totally without merit and intends to defend the action vigorously. In November 2004, all named defendants moved to dismiss the Amended Complaint in whole or substantial part. Briefing was completed in May 2005.
Additional lawsuits arising out of these circumstances and presenting similar allegations and requests for relief may be filed against the defendants in the future. Neither Dreyfus nor the Funds believe that any of the pending actions will have a material adverse effect on the Funds or Dreyfus’ ability to perform its contract with the Funds.
REPORT OF INDEPENDENT REGISTERED PUBLIC ACCOUNTING FIRM
Shareholders and Board of Directors Dreyfus Institutional Yield Advantage Fund
We have audited the accompanying statement of assets and liabilities, including the statements of investments and financial futures, of Dreyfus Institutional Yield Advantage Fund (one of the funds comprising Dreyfus Investment Grade Funds, Inc.) as of July 31, 2005, and the related statement of operations for the year then ended, the statement of changes in net assets for each of the two years in the period then ended, and financial highlights for each of the periods indicated therein.These financial statements and financial highlights are the responsibility of the Fund’s management. Our responsibility is to express an opinion on these financial statements and financial highlights based on our audits.
We conducted our audits in accordance with the standards of the Public Company Accounting Oversight Board (United States).Those standards require that we plan and perform the audit to obtain reasonable assurance about whether the financial statements and financial highlights are free of material misstatement.We were not engaged to perform an audit of the Fund’s internal control over financial reporting.Our audits included consideration of internal control over financial reporting as a basis for designing audit procedures that are appropriate in the circumstances,but not for the purpose of expressing an opinion on the effectiveness of the Fund’s internal control over financial reporting.Accordingly, we express no such opinion.An audit also includes examining, on a test basis, evidence supporting the amounts and disclosures in the financial statements and financial highlights, assessing the accounting principles used and significant estimates made by management, and evaluating the overall financial statement presentation. Our procedures included verification by examination of securities held by the custodian as of July 31, 2005 and confirmation of securities not held by the custodian by correspondence with others. We believe that our audits provide a reasonable basis for our opinion.
In our opinion, the financial statements and financial highlights referred to above present fairly, in all material respects, the financial position of Dreyfus Institutional Yield Advantage Fund at July 31, 2005, the results of its operations for the year then ended, the changes in its net assets for each of the two years in the period then ended, and the financial highlights for each of the indicated periods, in conformity with U.S. generally accepted accounting principles.

| | New York, New York
September 16, 2005
|
| INFORMATION ABOUT THE REVIEW | | |
| AND APPROVAL OF THE FUND’S | | |
| M A N A G E M E N T A G R E E M E N T | | (Unaudited) |
At separate meetings of the Board of Directors for the Fund held on July 12-13, 2005, the Board considered the re-approval, through its annual renewal date of July 29, 2006, of the Fund’s Management Agreement, pursuant to which the Manager provides the Fund with investment advisory and administrative services.The Board members who are not “interested persons” (as defined in the Investment Company Act of 1940, as amended) of the Fund were assisted in their review by independent legal counsel and met with counsel in executive session separate from representatives of the Manager.
Analysis of Nature, Extent and Quality of Services Provided to the Fund. The Board members received a presentation from representatives of the Manager regarding services provided to the Fund and other funds in the Dreyfus fund complex, and discussed the nature, extent and quality of the services provided to the Fund pursuant to its Management Agreement.The Manager’s representatives reviewed the Fund’s distribution of accounts and the relationships the Manager has with the Fund’s intermediaries.The Board noted that the Fund’s shares were offered only to institutions.The Manager’s representatives noted the diversity of distribution among the funds in the Dreyfus complex, and the Manager’s corresponding need for broad, deep, and diverse resources to be able to provide ongoing shareholder services to each distribution channel, including that of the Fund. The Board also reviewed the number of shareholder accounts in the Fund, as well as the Fund’s asset size.
The Board members also considered the Manager’s research and portfolio management capabilities and that the Manager also provides oversight of day-to-day Fund operations, including fund accounting and administration and assistance in meeting legal and regulatory requirements. The Board members also considered the Manager’s extensive administrative, accounting and compliance infrastructure.
Comparative Analysis of the Fund’s Performance and Management Fee and Expense Ratio. The Board members reviewed the Fund’s perfor-mance,management fee and expense ratios and placed significant emphasis on comparisons to a group of comparable funds and Lipper category averages, as applicable. The group of comparable funds was previously
approved by the Board for this purpose, and was prepared using a Board-approved selection methodology that was based, in part, on selecting non-affiliated funds reported in the same Lipper category as the Fund. The Board members discussed the results of the comparisons for various periods ended May 31,2005,and noted that the Fund’s income yield performance for the 3-year period was above the comparison group and Lipper category averages, and for the 1-year period was above the comparison group average but slightly below the Lipper category average; the Fund ranked in the top half of the comparison group for income yield performance for each such period.The Board noted that the Fund’s 3-year total return performance was below the comparison group and Lipper category averages, but that the Fund’s 1-year total return performance was above the comparison group average and slightly below the Lipper category average and the Fund’s year-to-date total return performance was above the comparison group and Lipper category averages; while the Fund’s total return performance ranked in the bottom half of the comparison group for the 3-year period, it ranked in the top half of its comparison group for the 1-year and year-to-date periods.The Board noted that the Fund’s total return performance for the three-month period ended May 31, 2005, however, had slipped to below the comparison group and Lipper category averages for such period. The Board members noted that a new portfolio management team for the Fund was appointed in January 2005.The Board members also discussed the Fund’s expense ratio, noting that the current fee waiver and expense reimbursement arrangement undertaken by the Manager had caused the Fund’s expense ratio to be lower than the Lipper category and comparison group averages.The Board reviewed the range of management fees in the comparison group, noting that the Fund’s management fee ranked in the bottom half (i.e., lower than most others).
Representatives of the Manager reviewed with the Board members the fees paid to the Manager or its affiliates by mutual funds managed by the Manager or its affiliates with similar investment objectives, policies and strategies as the Fund (the “Similar Funds”), and noted that there were no other accounts managed or sub-advised by the Manager or its
INFORMATION ABOUT THE REVIEW AND APPROVAL OF THE FUND’S MANAGEMENT AGREEMENT (Unaudited) (continued )
affiliates with similar investment objectives, policies and strategies as the Fund. The Similar Funds were mutual funds included in the “ultra-short obligations” funds category by Lipper. The Board analyzed the differences in fees paid to the Manager and discussed the relationship of the advisory fees paid in light of the Manager’s performance and the services provided; it was noted that the Similar Funds had the same or higher management fees than the fee borne by the Fund. The Board members considered the relevance of the fee information provided for the Similar Funds managed by the Manager to evaluate the appropriateness and reasonableness of the Fund’s advisory fees.
Analysis of Profitability and Economies of Scale. The Manager’s representatives reviewed the dollar amount of expenses allocated and profit received by the Manager and the method used to determine such expenses and profit.The Board received and considered information prepared by an independent consulting firm regarding Dreyfus’ approach to allocating costs to, and determining the profitability of, individual funds and the entire Dreyfus mutual fund complex.The consulting firm also analyzed where any economies of scale might emerge as assets grow.The Board members evaluated the analysis in light of the relevant circumstances for the Fund, including the decline in Fund assets and the extent to which economies of scale would be realized as the Fund grows and whether fee levels reflect these economies of scale for the benefit of Fund investors.The Board members also considered potential benefits to the Manager from acting as investment adviser and noted that there were no soft dollar arrangements with respect to trading the Fund’s portfolio.
It was noted that the Board members should consider the Manager’s profitability with respect to the Fund as part of their evaluation of whether the fee under the Management Agreement bears a reasonable relationship to the mix of services provided by the Manager, including the nature, extent and quality of such services and that a discussion of economies of scale are predicated on increasing assets and that, if a fund’s assets had been decreasing, the possibility that the Manager may have realized any economies of scale would be less. It also was noted that the profitability percentage for managing the Fund was within ranges determined by appropriate court cases to be reasonable given
the services rendered and given the Fund’s overall performance and generally superior service levels provided. The Board also noted the current fee waiver and expense reimbursement arrangement and its effect on the profitability of the Manager.
At the conclusion of these discussions, each of the Directors expressed the opinion that he or she had been furnished with sufficient information to make an informed business decision with respect to continuation of the Fund’s Management Agreement. Based on their discussions and considerations as described above, the Board made the following conclusions and determinations.
- The Board concluded that the nature, extent and quality of the ser- vices provided by the Manager are adequate and appropriate.
- The Board generally was satisfied with the Fund’s income yield per- formance and the Fund’s improvement in its 1-year and year-to-date total return performance, as well as with the change in the Fund’s portfolio management team which occurred in January 2005.
- The Board concluded that the fee paid by the Fund to the Manager was reasonable in light of comparative performance and expense and advisory fee information, including the Manager’s undertaking to waive or reimburse certain fess and expenses, costs of the services provided and profits to be realized and benefits derived or to be derived by the Manager from its relationship with the Fund.
- The Board determined that, given the current size and characteris- tics of the Fund, it was difficult to specifically identify any economies of scale that might be realized merely through an increase in the assets of the Fund.The Board noted that it appeared that the benefits of any economies of scale would be appropriately shared with shareholders through increased investment in fund management and administration resources.
The Board members considered these conclusions and determinations, along with information received on a routine and regular basis throughout the year, and, without any one factor being dispositive, the Board determined that re-approval of the Fund’s Management Agreement was in the best interests of the Fund and its shareholders.
BOARD MEMBERS INFORMATION (Unaudited)
Joseph S. DiMartino (61)
Chairman of the Board (1995)
|
Principal Occupation During Past 5 Years:
• Corporate Director and Trustee
|
Other Board Memberships and Affiliations:
|
- The Muscular Dystrophy Association, Director
- Levcor International, Inc., an apparel fabric processor, Director
- Century Business Services, Inc., a provider of outsourcing functions for small and medium size companies, Director
- The Newark Group, a provider of a national market of paper recovery facilities, paperboard mills and paperboard converting plants, Director
- Azimuth Trust, an institutional asset management firm, Member of Board of Managers and Advisory Board
No. of Portfolios for which Board Member Serves: 193
———————
Clifford L. Alexander, Jr. (71) Board Member (2003)
Principal Occupation During Past 5 Years:
|
- President of Alexander & Associates, Inc., a management consulting firm ( January 1981-present)
- Chairman of the Board of Moody’s Corporation (October 2000-October 2003)
- Chairman of the Board and Chief Executive Officer of The Dun and Bradstreet Corporation (October 1999-September 2000)
Other Board Memberships and Affiliations:
• Mutual of America Life Insurance Company, Director
No. of Portfolios for which Board Member Serves: 66
|
———————
Lucy Wilson Benson (77) Board Member (1994)
Principal Occupation During Past 5 Years:
• President of Benson and Associates, consultants to business and government (1980-present)
Other Board Memberships and Affiliations:
|
- The International Executive Services Corps., Director
- Citizens Network for Foreign Affairs,Vice Chairperson
- Council on Foreign Relations, Member
- Lafayette College Board of Trustees,Trustee Emeritus
- Atlantic Council of the U.S., Director
No. of Portfolios for which Board Member Serves: 40
|
BOARD MEMBERS INFORMATION (Unaudited) (continued)
David W. Burke (69)
Board Member (1994)
|
Principal Occupation During Past 5 Years:
• Corporate Director and Trustee
|
Other Board Memberships and Affiliations:
|
- John F. Kennedy Library Foundation, Director
- U.S.S. Constitution Museum, Director
No. of Portfolios for which Board Member Serves: 84
|
Whitney I. Gerard (70)
Board Member (1993)
|
Principal Occupation During Past 5 Years:
• Partner of Chadbourne & Parke LLP
|
No. of Portfolios for which Board Member Serves: 38
|
Arthur A. Hartman (79)
Board Member (1992)
|
Principal Occupation During Past 5 Years:
|
- Chairman of First NIS Regional Fund (ING/Barings Management) and New Russia Fund
- Advisory Council Member to Barings Vostok
Other Board Memberships and Affiliations:
• APCO Associates Inc., Senior Consultant
|
No. of Portfolios for which Board Member Serves: 38
|
George L. Perry (71)
Board Member (1992)
|
Principal Occupation During Past 5 Years:
• Economist and Senior Fellow at Brookings Institution
No. of Portfolios for which Board Member Serves: 38
|
Once elected all Board Members serve for an indefinite term.The address of the Board Members and Officers is in c/o The Dreyfus Corporation, 200 Park Avenue, New York, New York 10166. Additional information about the Board Members is available in the fund’s Statement of Additional Information which can be obtained from Dreyfus free of charge by calling this toll free number: 1-800-554-4611.
OFFICERS OF THE FUND (Unaudited)
STEPHEN E. CANTER, President since March 2000.
Chairman of the Board, Chief Executive Officer and Chief Operating Officer of the Manager, and an officer of 90 investment companies (comprised of 184 portfolios) managed by the Manager. Mr. Canter also is a Board member and, where applicable, an Executive Committee Member of the other investment management subsidiaries of Mellon Financial Corporation, each of which is an affiliate of the Manager. He is 60 years old and has been an employee of the Manager since May 1995.
STEPHEN R. BYERS, Executive Vice President since October 2002.
Chief Investment Officer,Vice Chairman and a director of the Manager, and an officer of 90 investment companies (comprised of 184 portfolios) managed by the Manager. Mr. Byers also is an officer, director or an Executive Committee Member of certain other investment management subsidiaries of Mellon Financial Corporation, each of which is an affiliate of the Manager. He is 51 years old and has been an employee of the Manager since January 2000.
CHARLES CARDONA, Executive Vice President since March 2000.
Vice Chairman and a Director of the Manager, Executive Vice President of the Distributor, President of Dreyfus Institutional Services Division, and an officer of 13 investment companies (comprised of 17 portfolios) managed by the Manager. He is 49 years old and has been an employee of the Manager since February 1981.
MARK N. JACOBS, Vice President since March 2000.
Executive Vice President, Secretary and General Counsel of the Manager, and an officer of 91 investment companies (comprised of 200 portfolios) managed by the Manager. He is 59 years old and has been an employee of the Manager since June 1977.
MICHAEL A. ROSENBERG, Vice President and Secretary since August 2005.
Associate General Counsel of the Manager, and an officer of 91 investment companies (comprised of 200 portfolios) managed by the Manager. He is 45 years old and has been an employee of the Manager since October 1991.
JAMES BITETTO, Vice President and Assistant Secretary since August 2005.
Assistant General Counsel and Assistant Secretary of the Manager, and an officer of 91 investment companies (comprised of 200 portfolios) managed by the Manager. He is 39 years old and has been an employee of the Manager since December 1996.
JONI LACKS CHARATAN, Vice President and Assistant Secretary since August 2005.
Assistant General Counsel of the Manager, and an officer of 91investment companies (comprised of 200 portfolios) managed by the Manager. She is 49 years old and has been an employee of the Manager since October 1998.
JOSEPH M. CHIOFFI, Vice President and Assistant Secretary since August 2005.
Assistant General Counsel of the Manager, and an officer of 91 investment companies (comprised of 200 portfolios) managed by the Manager. He is 43 years old and has been an employee of the Manager since July 2000.
JANETTE E. FARRAGHER, Vice President and Assistant Secretary since August 2005.
Associate General Counsel of the Manager, and an officer of 91 investment companies (comprised of 200 portfolios) managed by the Manager. She is 42 years old and has been an employee of the Manager since February 1984.
JOHN B. HAMMALIAN, Vice President and Assistant Secretary since August 2005.
Associate General Counsel of the Manager, and an officer of 91 investment companies (comprised of 200 portfolios) managed by the Manager. He is 42 years old and has been an employee of the Manager since February 1991
ROBERT R. MULLERY, Vice President and Assistant Secretary since August 2005.
Associate General Counsel of the Manager, and an officer of 91 investment companies (comprised of 200 portfolios) managed by the Manager. He is 53 years old and has been an employee of the Manager since May 1986.
JEFF PRUSNOFSKY, Vice President and Assistant Secretary since August 2005.
Associate General Counsel of the Manager, and an officer of 91 investment companies (comprised of 200 portfolios) managed by the Manager. He is 40 years old and has been an employee of the Manager since October 1990.
JAMES WINDELS, Treasurer since November 2001.
Director – Mutual Fund Accounting of the Manager, and an officer of 91 investment companies (comprised of 200 portfolios) managed by the Manager. He is 46 years old and has been an employee of the Manager since April 1985.
GREGORY S. GRUBER, Assistant Treasurer since August 2005.
Senior Accounting Manager – Municipal Bond Funds of the Manager, and an officer of 91 investment companies (comprised of 200 portfolios) managed by the Manager. He is 46 years old and has been an employee of the Manager since August 1981.
ERIK D. NAVILOFF, Assistant Treasurer since December 2002.
Senior Accounting Manager – Taxable Fixed Income Funds of the Manager, and an officer of 91 investment companies (comprised of 200 portfolios) managed by the Manager. He is 37 years old and has been an employee of the Manager since November 1992.
ROBERT ROBOL, Assistant Treasurer since August 2005.
Senior Accounting Manager – Money Market Funds of the Manager, and an officer of 91 investment companies (comprised of 200 portfolios) managed by the Manager. He is 41 years old and has been an employee of the Manager since October 1988.
ROBERT SVAGNA, Assistant Treasurer since August 2005.
Senior Accounting Manager – Equity Funds of the Manager, and an officer of 91 investment companies (comprised of 200 portfolios) managed by the Manager. He is 37 years old and has been an employee of the Manager since November 1990.
KENNETH J. SANDGREN, Assistant Treasurer since November 2001.
Mutual Funds Tax Director of the Manager, and an officer of 91 investment companies (comprised of 200 portfolios) managed by the Manager. He is 50 years old and has been an employee of the Manager since June 1993.
JOSEPH W. CONNOLLY, Chief Compliance Officer since October 2004.
Chief Compliance Officer of the Manager and The Dreyfus Family of Funds (91 investment companies, comprising 200 portfolios). From November 2001 through March 2004, Mr. Connolly was first Vice-President, Mutual Fund Servicing for Mellon Global Securities Services. In that capacity, Mr. Connolly was responsible for managing Mellon’s Custody, Fund Accounting and Fund Administration services to third-party mutual fund clients. He is 48 years old and has served in various capacities with the Manager since 1980, including manager of the firm’s Fund Accounting Department from 1997 through October 2001.
WILLIAM GERMENIS, Anti-Money Laundering Compliance Officer since August 2002.
Vice President and Anti-Money Laundering Compliance Officer of the Distributor, and the Anti-Money Laundering Compliance Officer of 87 investment companies (comprised of 196 portfolios) managed by the Manager. He is 34 years old and has been an employee of the Distributor since October 1998.
NOTES
| For More | | Information |
| |
|
| |
| Dreyfus | | Transfer Agent & |
| Institutional Yield | | Dividend Disbursing Agent |
| Advantage Fund | | |
| | | Dreyfus Transfer, Inc. |
| 200 Park Avenue | | |
| | | 200 Park Avenue |
| New York, NY 10166 | | |
| | | New York, NY 10166 |
| |
| Manager | | Distributor |
| The Dreyfus Corporation | | |
| | | Dreyfus Service Corporation |
| 200 Park Avenue | | |
| | | 200 Park Avenue |
| New York, NY 10166 | | |
| | | New York, NY 10166 |
| Custodian | | |
| Mellon Bank, N.A. | | |
| One Mellon Bank Center | | |
| Pittsburgh, PA 15258 | | |
| |
|
| |
| |
| Telephone 1-800-645-6561 | | |
| Mail The Dreyfus Family of Funds, 144 Glenn Curtiss Boulevard, Uniondale, NY 11556-0144 |
| E-mail Send your request to info@dreyfus.com |
| Internet Information can be viewed online or downloaded at: http://www.dreyfus.com |
The fund files its complete schedule of portfolio holdings with the Securities and Exchange Commission (“SEC”) for the first and third quarters of each fiscal year on Form N-Q. The fund’s Forms N-Q are available on the SEC’s website at http://www.sec.gov and may be reviewed and copied at the SEC’s Public Reference Room in Washington, DC. Information on the operation of the Public Reference Room may be obtained by calling 1-800-SEC-0330.
A description of the policies and procedures that the fund uses to determine how to vote proxies relating to portfolio securities, and information regarding how the fund voted these proxies for the 12-month period ended June 30, 2005, is available through the fund’s website at http://www.dreyfus.com and on the SEC’s website at http://www.sec.gov. The description of the policies and procedures is also available without charge, upon request, by calling 1-800-645-6561.

| Dreyfus | | |
| Intermediate | | |
| Term Income | | Fund |
| | ANNUAL REPORT July 31, 2005
|

Save time. Save paper. View your next shareholder report online as soon as it’s available. Log into www.dreyfus.com and sign up for Dreyfus eCommunications. It’s simple and only takes a few minutes.
The views expressed in this report reflect those of the portfolio manager only through the end of the period covered and do not necessarily represent the views of Dreyfus or any other person in the Dreyfus organization. Any such views are subject to change at any time based upon market or other conditions and Dreyfus disclaims any responsibility to update such views.These views may not be relied on as investment advice and, because investment decisions for a Dreyfus fund are based on numerous factors, may not be relied on as an indication of trading intent on behalf of any Dreyfus fund.
Not FDIC-Insured • Not Bank-Guaranteed • May Lose Value
| | | Contents |
| |
| | | THE FUND |
| |
|
| 2 | | Letter from the Chairman |
| 3 | | Discussion of Fund Performance |
| 6 | | Fund Performance |
| 7 | | Understanding Your Fund’s Expenses |
| 7 | | Comparing Your Fund’s Expenses |
| | | With Those of Other Funds |
| 8 | | Statement of Investments |
| 22 | | Statement of Financial Futures |
| 22 | | Statement of Options Written |
| 23 | | Statement of Assets and Liabilities |
| 24 | | Statement of Operations |
| 25 | | Statement of Changes in Net Assets |
| 27 | | Financial Highlights |
| 29 | | Notes to Financial Statements |
| 45 | | Report of Independent Registered |
| | | Public Accounting Firm |
| 46 | | Important Tax Information |
| 47 | | Information About the Review and Approval |
| | | of the Fund’s Management Agreement |
| 52 | | Board Members Information |
| 54 | | Officers of the Fund |
| |
| | | FOR MORE INFORMATION |
| |
|
| | | Back Cover |
| Dreyfus Intermediate |
| Term Income Fund |
The Fund

LETTER FROM THE CHAIRMAN
Dear Shareholder:
We are pleased to present this annual report for Dreyfus Intermediate Term Income Fund,covering the 12-month period from August 1,2004, through July 31, 2005. Inside, you’ll find valuable information about how the fund was managed during the reporting period, including a discussion with the fund’s primary portfolio manager, Kent Wosepka.
The past 12 months proved to be an unusual time for fixed-income securities. Although the Federal Reserve Board continued to raise short-term interest rates, yield differences between long- and short-term securities remained relatively narrow for most of the reporting period — contrary to historical norms. Strong demand from domestic and foreign investors, along with mild inflation concerns, helped support prices of U.S.Treasury securities. Corporate bonds also fared well during the reporting period generally due to stronger balance sheets, better business conditions and persistently low default rates.
In our view, these and other factors may have created new opportunities and challenges for fixed-income investors. Our economists currently expect the U.S.economy to continue to grow over the foreseeable future without significant new inflationary pressures, potentially setting the stage for market conditions that could affect the various sectors of the U.S. bond market in different ways. As always, we encourage you to talk with your financial advisor about the investment strategies that may best suit your current needs and future goals.
Thank you for your continued confidence and support.


DISCUSSION OF FUND PERFORMANCE
Kent Wosepka, Primary Portfolio Manager
How did Dreyfus Intermediate Term Income Fund perform relative to its benchmark?
For the 12-month period ended July 31, 2005, the fund’s Institutional shares achieved a total return of 6.40%, and the fund’s Investor shares achieved a total return of 6.24% .1 In comparison, the fund’s benchmark, the Lehman Brothers U.S. Aggregate Index, achieved a total return of 4.79% for the same period.2
The bond market remained surprisingly resilient over the reporting period despite rising short-term interest rates, surging energy prices and disappointing financial results from some corporate issuers. The fund’s returns were higher than its benchmark for the reporting period overall.The fund’s relative performance was supported during the first half of the reporting period by strong contributions from foreign bonds and Treasury Inflation Protected Securities (“TIPS”), which are not part of the benchmark. During the reporting period’s second half, the fund’s “barbelled” yield curve strategy helped boost returns.
What is the fund’s investment approach?
The fund seeks to maximize total return, consisting of capital appreciation and current income.To pursue this goal, the fund normally invests at least 80% of its assets in fixed-income securities of U.S. and foreign issuers rated investment grade or the unrated equivalent as determined by Dreyfus.These securities include U.S. government bonds and notes, corporate bonds, municipal bonds, convertible securities, preferred stocks, inflation-indexed securities, asset-backed securities, mortgage-related securities and foreign bonds. Typically, the fund’s portfolio can expect to have an average effective maturity ranging from five to 10 years, and an average effective duration ranging between three and eight years. For additional yield, the fund may invest up to 20% of its assets in fixed-income securities rated below investment grade.
DISCUSSION OF FUND PERFORMANCE (continued)
|
What other factors influenced the fund’s performance?
Contrary to historical trends, intermediate-term U.S. government securities gained value over the reporting period despite eight increases in short-term interest rates from the Federal Reserve Board (the “Fed”). The Fed raised the overnight federal funds rate by 200 basis points to 3.25% .Yet, yields of 10-year Treasury bonds fell from 4.50% at the start of the reporting period to 4.28% at the end of the reporting period. As we had a shorter duration than the benchmark, the decline in 10-year Treasury yields had a small negative impact on relative portfolio performance.
During the first half of the reporting period, the fund’s results also were supported by rallies among corporate and emerging-market bonds. In addition, the fund’s holdings of TIPS fared well at the time, as inflationary pressures appeared to intensify.
After the current management team assumed responsibility for the fund on January 31, 2005, we repositioned its holdings to reflect our view of the changing market environment. For example, we reconfigured the fund’s exposure to corporate bonds, maintaining a slightly overweighted position with an emphasis on relatively short-term corporate securities. This change helped protect the fund from the full brunt of the corporate sector’s sharp decline in March and April 2005, when earnings from General Motors and Ford Motor Company fell short of analysts’ expectations, and some of the major rating agencies downgraded the major carmakers’ credit ratings. Later, however, after Ford and General Motors’ bonds had fallen to levels we considered attractive, we increased the fund’s positions in shorter-term securities from automobile companies.
In addition, we adopted a “barbelled” yield curve strategy that emphasized holdings at the short and long ends of the fund’s maturity range to achieve an average duration that was slightly shorter than industry aver-ages.This positioning helped the fund participate more fully in the gains of longer-term bonds without incurring greater interest-rate risks. Nonetheless, the fund’s relatively defensive average duration hindered its
relative performance somewhat as longer-term bond yields continued to fall through the end of June.The fund’s modestly short average duration produced better results in July, and any duration-related weakness for the reporting period overall was more than offset by the success of our yield-curve, sector allocation and security selection strategies.
What is the fund’s current strategy?
Because the yield curve has flattened well beyond historical norms, we have moved away from a “barbelled” yield-curve strategy toward one that more closely approximates that of the fund’s benchmark. However, we expect the Fed to continue raising short-term interest rates, so we have maintained the portfolio’s relatively short average duration. Indeed, soon after the end of the reporting period, the Fed raised interest rates for the tenth consecutive time, increasing the federal funds rate to 3.5% .
Changes to the fund’s composition have included a reduction in its TIPS holdings, which we believe have become more fully valued.We have maintained relatively light exposure to mortgage-backed securities, which appear to us to be priced with little room for error for a low-volatility market environment.While we have continued to find a number of attractive opportunities among corporate bonds, we have attempted to manage credit risk by focusing on shorter-term securities.
| 1 | | Total return includes reinvestment of dividends and any capital gains paid. Past performance is no |
| | | guarantee of future results. Share price, yield and investment return fluctuate such that upon |
| | | redemption, fund shares may be worth more or less than their original cost. Return figures |
| | | provided reflect the absorption of certain fund expenses by The Dreyfus Corporation pursuant to |
| | | an undertaking in effect that may be extended, terminated or modified at any time. Had these |
| | | expenses not been absorbed, the fund’s returns would have been lower. |
| 2 | | SOURCE: LIPPER INC. — Reflects reinvestment of dividends and, where applicable, capital |
| | | gain distributions.The Lehman Brothers U.S. Aggregate Index is a widely accepted, unmanaged |
| | | total return index of corporate, U.S. government and U.S. government agency debt instruments, |
| | | mortgage-backed securities and asset-backed securities with an average maturity of 1-10 years. |
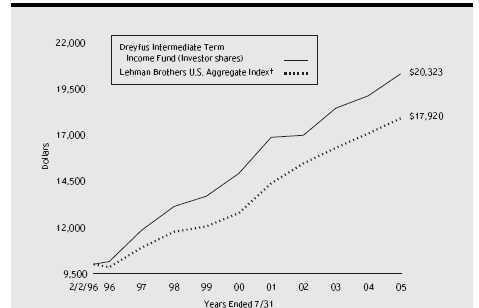
Comparison of change in value of $10,000 investment in Dreyfus Intermediate Term Income Fund Investor shares and the Lehman Brothers U.S. Aggregate Index
| Average Annual Total Returns as of 7/31/05 | | | | | | |
| | | Inception | | | | | | From |
| | | Date | | 1 Year | | 5 Years | | Inception |
| |
| |
| |
| |
|
| Investor shares | | 2/2/96 | | 6.24% | | 6.37% | | 7.76% |
| Institutional shares | | 5/31/01 | | 6.40% | | — | | 5.33% |
† Source: Lipper Inc.
Past performance is not predictive of future performance.The fund’s performance shown in the graph and table does not reflect the deduction of taxes that a shareholder would pay on fund distributions or the redemption of fund shares. The above graph compares a $10,000 investment made in Investor shares of Dreyfus Intermediate Term Income Fund on 2/2/96 (inception date) to a $10,000 investment made in the Lehman Brothers U.S. Aggregate Index (the “Index”) on that date. For comparative purposes, the value of the Index on 1/31/96 is used as the beginning value on 2/2/96. All dividends and capital gain distributions are reinvested.
The fund invests primarily in debt securities and securities with debt-like characteristics of domestic and foreign issuers and maintains an average effective maturity ranging between five and ten years and an average effective duration ranging between three and eight years.The fund’s performance shown in the line graph takes into account all applicable fees and expenses.The Index is a widely accepted, unmanaged total return index of corporate, U.S. government and U.S. government agency debt instruments, mortgage-backed securities and asset-backed securities with an average maturity of 1-10 years.The Index does not take into account charges, fees and other expenses. Further information relating to fund performance, including expense reimbursements, if applicable, is contained in the Financial Highlights section of the prospectus and elsewhere in this report.
6
U N D E R S TA N D I N G YO U R F U N D ’ S E X P E N S E S ( U n a u d i t e d )
As a mutual fund investor, you pay ongoing expenses, such as management fees and other expenses. Using the information below, you can estimate how these expenses affect your investment and compare them with the expenses of other funds.You also may pay one-time transaction expenses, including sales charges (loads) and redemption fees, which are not shown in this section and would have resulted in higher total expenses. For more information, see your fund’s prospectus or talk to your financial adviser.
Review your fund’s expenses
The table below shows the expenses you would have paid on a $1,000 investment in Dreyfus Intermediate Term Income Fund from February 1, 2005 to July 31, 2005. It also shows how much a $1,000 investment would be worth at the close of the period, assuming actual returns and expenses.
| Expenses and Value of a $1,000 Investment | | |
| assuming actual returns for the six months ended July 31, 2005 | | |
| | | Investor Shares | | Institutional Shares |
| |
| |
|
| Expenses paid per $1,000 † | | $ 3.99 | | $ 2.64 |
| Ending value (after expenses) | | $1,010.00 | | $1,011.10 |
COMPARING YOUR FUND’S EXPENSES WITH THOSE OF OTHER FUNDS (Unaudited)
Using the SEC’s method to compare expenses
The Securities and Exchange Commission (SEC) has established guidelines to help investors assess fund expenses. Per these guidelines, the table below shows your fund’s expenses based on a $1,000 investment, assuming a hypothetical 5% annualized return. You can use this information to compare the ongoing expenses (but not transaction expenses or total cost) of investing in the fund with those of other funds.All mutual fund shareholder reports will provide this information to help you make this comparison. Please note that you cannot use this information to estimate your actual ending account balance and expenses paid during the period.
Expenses and Value of a $1,000 Investment assuming a hypothetical 5% annualized return for the six months ended July 31, 2005
| | | Investor Shares | | Institutional Shares |
| |
| |
|
| Expenses paid per $1,000 † | | $ 4.01 | | $ 2.66 |
| Ending value (after expenses) | | $1,020.83 | | $1,022.17 |
- Expenses are equal to the fund’s annualized expense ratio of .80% for Investor shares and .53% for Institutional shares, multiplied by the average account value over the period, multiplied by 181/365 (to reflect the one-half year period).
| | STATEMENT OF INVESTMENTS
July 31, 2005
|
| | | Principal | | | | |
| Bonds and Notes—108.4% | | Amount a | | Value ($) |
| |
| |
|
| Aerospace/Defense—.1% | | | | | | |
| L-3 Communications, | | | | | | |
| Conv. Bonds, 3%, 2035 | | 440,000 | | b | | 451,550 |
| Agricultural—.9% | | | | | | |
| Altria: | | | | | | |
| Debs., 7.75%, 2027 | | 1,245,000 | | c | | 1,455,905 |
| Notes, 7.2%, 2007 | | 3,445,000 | | | | 3,571,084 |
| | | | | | | 5,026,989 |
| Airlines—.0% | | | | | | |
| USAir, | | | | | | |
| Enhanced Equipment Notes, Ser. C, 8.93%, 2009 | | 429,622 | | d,e | | 43 |
| Asset-Backed-Ctfs-Automobile Receivables—1.1% | | | | |
| Capital Auto Receivables Asset Trust, | | | | | | |
| Ser. 2005-1, Cl. D, 6.5%, 2012 | | 900,000 | | b | | 885,960 |
| Ford Credit Auto Owner Trust: | | | | | | |
| Ser. 2004-A, Cl. C, 4.19%, 2009 | | 1,000,000 | | | | 989,847 |
| Ser. 2005-B, Cl. B, 4.64%, 2010 | | 1,405,000 | | | | 1,403,899 |
| WFS Financial Owner Trust: | | | | | | |
| Ser. 2004-3, Cl. B, 3.51%, 2012 | | 287,986 | | | | 283,253 |
| Ser. 2004-4, Cl. B, 3.13%, 2012 | | 294,492 | | | | 289,774 |
| Ser. 2005-2, Cl. B, 4.57%, 2012 | | 2,065,000 | | | | 2,065,785 |
| | | | | | | 5,918,518 |
| Asset-Backed Ctfs.—Credit Cards—1.2% | | | | | | |
| Credit-Based Asset Servicing and Securitization, | | | | | | |
| Ser. 2005-CB4, Cl. AV1, 3.61875%, 2035 | | 1,000,000 | | f | | 1,000,195 |
| MBNA Master Credit Card Note Trust, | | | | | | |
| Ser. 2002-C1, Cl. C1, 6.8%, 2014 | | 5,268,000 | | | | 5,762,267 |
| | | | | | | 6,762,462 |
| Asset-Backed Ctfs.-Home Equity Loans—8.1% | | | | | | |
| ACE Securities: | | | | | | |
| Ser. 2005-HE1, Cl. A2A, 3.58%, 2035 | | 6,185,959 | | f | | 6,190,570 |
| Ser. 2005-HE2, Cl. A2A, 3.55%, 2035 | | 3,806,154 | | f | | 3,808,676 |
| Accredited Mortgage Loan Trust: | | | | | | |
| Ser. 2005-1, Cl. A2A, 3.56%, 2035 | | 3,827,021 | | f | | 3,829,926 |
| Ser. 2005-2, Cl. A2A, 3.56%, 2035 | | 1,902,203 | | f | | 1,902,779 |
| Bayview Financial Acquisition Trust, | | | | | | |
| Ser. 2005-B, Cl. 1A6, 5.208%, 2039 | | 1,795,000 | | | | 1,806,499 |
| Bear Stearns Asset Backed Securities: | | | | | | |
| Ser. 2005-HE2, Cl. A1, 3.57%, 2035 | | 1,397,124 | | f | | 1,398,152 |
| Ser. 2005-HE3, Cl. A1, 3.54%, 2035 | | 1,131,192 | | f | | 1,131,950 |
| Ser. 2005-HE4, Cl. 1A1, 3.56%, 2035 | | 1,418,980 | | f | | 1,419,940 |
| Ser. 2005-TC1, Cl. A1, 3.57%, 2035 | | 1,397,811 | | f | | 1,397,769 |
8
| | | Principal | | | | |
| Bonds and Notes (continued) | | Amount a | | Value ($) |
| |
| |
|
| Asset-Backed Ctfs.-Home Equity Loans (continued) | | | | |
| Citigroup Mortgage Loan Trust, | | | | | | |
| Ser. 2005-HE1, Cl. A3A, 3.55%, 2035 | | 1,554,937 | | f | | 1,555,124 |
| Equifirst Mortgage Loan Trust, | | | | | | |
| Ser. 2005-1, Cl. A1, 3.52%, 2035 | | 5,381,410 | | f | | 5,385,269 |
| Fremont Home Loan Trust II, | | | | | | |
| Ser. 2005-1, Cl. A1, 3.56%, 2035 | | 1,380,171 | | f | | 1,381,835 |
| Home Equity Asset Trust, | | | | | | |
| Ser. 2005-5, Cl. 2A1, 3.51%, 2035 | | 2,925,000 | | f | | 2,924,710 |
| Mastr Asset Backed Securities Trust, | | | | | | |
| Ser. 2005-NC2, Cl. A3A, 3.54%, 2035 | | 4,560,554 | | f | | 4,563,295 |
| Morgan Stanley ABS Capital I: | | | | | | |
| Ser. 2005-WMC1, Cl. A3, 3.56%, 2035 | | 1,345,901 | | f | | 1,346,103 |
| Ser. 2005-WMC3, Cl. A2A, 3.55%, 2035 | | 1,502,632 | | f | | 1,502,752 |
| Morgan Stanley Home Equity Loans, | | | | | | |
| Ser. 2005-2, Cl. A2A, 3.55%, 2035 | | 2,244,800 | | f | | 2,243,072 |
| Residential Asset Securities, | | | | | | |
| Ser. 2005-EMX1, Cl. AI1, 3.56%, 2035 | | 1,364,793 | | f | | 1,365,815 |
| | | | | | | 45,154,236 |
| Asset-Backed Ctfs.—Manufactured Housing—.5% | | | | |
| Green Tree Financial, | | | | | | |
| Ser. 1994-7, Cl. M1, 9.25%, 2020 | | 2,604,236 | | | | 2,770,445 |
| Asset-Backed Ctfs.—Other—6.9% | | | | | | |
| Carrington Mortgage Loan Trust, | | | | | | |
| Ser. 2005-OPT2, Cl. A1A, 3.55%, 2035 | | 1,403,257 | | f | | 1,403,285 |
| Citigroup Mortgage Loan Trust, | | | | | | |
| Ser. 2005-OPT3, Cl. A1A, 3.43%, 2035 | | 1,500,000 | | f | | 1,499,685 |
| Conseco Finance Home Loan Trust, | | | | | | |
| Ser. 2000-E, Cl. A5, 8.02%, 2031 | | 941,501 | | | | 962,224 |
| Countrywide Asset-Backed Ctfs. II, | | | | | | |
| Ser. 2005-2, Cl. A1, 3.55%, 2035 | | 787,675 | | f | | 787,746 |
| Merrill Lynch Mortgage Investors, | | | | | | |
| Ser. 2005-WMC2, Cl. A2A, 3.55%, 2036 | | 986,842 | | f | | 986,882 |
| Morgan Stanley ABS Capital I: | | | | | | |
| Ser. 2005-WMC2, Cl. A2A, 3.54%, 2014 | | 3,329,341 | | f | | 3,331,417 |
| Ser. 2005-WMC6, Cl. A2A, 3.573%, 2035 | | 2,450,000 | | f | | 2,450,000 |
| Park Place Securities: | | | | | | |
| Ser. 2005-WHQ1, Cl. A3A, 3.57%, 2035 | | 2,911,464 | | f | | 2,914,483 |
| Ser. 2005-WHQ2, Cl. A2A, 3.56%, 2035 | | 2,470,086 | | f | | 2,471,915 |
| Residential Asset Mortgage Products: | | | | | | |
| Ser. 2004-RS12, Cl. AI6, 3.56%, 2034 | | 1,230,000 | | | | 1,206,166 |
| Ser. 2004-RS12, Cl. AII1, 3.59%, 2027 | | 3,528,367 | | f | | 3,531,936 |
| | STATEMENT OF INVESTMENTS (continued)
|
| | | Principal | | | | |
| Bonds and Notes (continued) | | Amount a | | Value ($) |
| |
| |
|
| Asset-Backed Ctfs.—Other (continued) | | | | | | |
| Residential Asset Mortgage Products (continued): | | | | |
| Ser. 2005-RS2, Cl. AII1, 3.57%, 2035 | | 1,926,102 | | f | | 1,927,849 |
| Ser. 2005-RS2, Cl. M2, 3.94%, 2035 | | 1,585,000 | | f | | 1,596,312 |
| Ser, 2005-RS2, Cl, M3, 4.01%, 2035 | | 490,000 | | f | | 491,887 |
| Ser. 2005-RS3, Cl. AIA1, 3.56%, 2035 | | 2,041,436 | | f | | 2,042,911 |
| Ser. 2005-RZ1, Cl. A1, 2.95%, 2034 | | 1,397,187 | | f | | 1,398,274 |
| Saxon Asset Securities Trust, | | | | | | |
| Ser. 2004-2, Cl. AF2, 4.15%, 2035 | | 6,950,000 | | | | 6,871,496 |
| Specialty Underwriting & Residential Finance: | | | | |
| Ser. 2005-BC1, Cl. A1A, 3.57%, 2035 | | 1,259,174 | | f | | 1,260,052 |
| Ser. 2005-BC2, Cl. A2A, 3.56%, 2035 | | 1,341,825 | | f | | 1,342,611 |
| | | | | | | 38,477,131 |
| Auto Manufacturing—.1% | | | | | | |
| DaimlerChrysler, | | | | | | |
| Notes, 4.875%, 2010 | | 800,000 | | | | 792,099 |
| Banking—3.6% | | | | | | |
| Chevy Chase Bank FSB, | | | | | | |
| Sub. Notes, 6.875%, 2013 | | 650,000 | | | | 676,000 |
| Chuo Mitsui Trust & Banking, | | | | | | |
| Sub. Notes, 5.506%, 2049 | | 2,185,000 | | b | | 2,114,418 |
| City National, | | | | | | |
| Sr. Notes, 5.125%, 2013 | | 550,000 | | | | 553,676 |
| Credit Suisse First Boston, | | | | | | |
| Sub, Notes, 7.75%, 2006 | | 2,000,000 | | b | | 2,052,940 |
| Crestar Capital Trust I, | | | | | | |
| Capital Sec., 8.16%, 2026 | | 2,655,000 | | | | 2,867,695 |
| Dresdner Bank, | | | | | | |
| Sub. Notes, 3.2%, 2005 | | 2,151,000 | | f | | 2,149,122 |
| Hibernia, | | | | | | |
| Sub. Notes, 5.35%, 2014 | | 1,230,000 | | | | 1,235,186 |
| Industrial Bank Of Korea, | | | | | | |
| Sub. Notes, 4%, 2014 | | 800,000 | | b | | 770,045 |
| Sumitomo Mitsui Banking, | | | | | | |
| Notes, 5.625%, 2049 | | 1,560,000 | | b | | 1,557,117 |
| Washington Mutual, | | | | | | |
| Notes, 2.4%, 2005 | | 2,120,000 | | | | 2,111,804 |
| Zions Bancorporation: | | | | | | |
| Sr. Notes, 2.7%, 2006 | | 2,845,000 | | | | 2,811,588 |
| Sub. Notes, 6%, 2015 | | 1,335,000 | | | | 1,422,543 |
| | | | | | | 20,322,134 |
10
| | | Principal | | | | |
| Bonds and Notes (continued) | | Amount a | | Value ($) |
| |
| |
|
| Building & Construction—.5% | | | | | | |
| DR Horton, | | | | | | |
| Sr. Notes, 5.875%, 2013 | | 1,365,000 | | | | 1,362,046 |
| Schuler Homes, | | | | | | |
| Sr. Sub. Notes, 10.5%, 2011 | | 1,260,000 | | | | 1,389,150 |
| | | | | | | 2,751,196 |
| Chemicals—1.5% | | | | | | |
| ICI Wilmington, | | | | | | |
| Notes, 5.625%, 2013 | | 1,115,000 | | | | 1,135,671 |
| International Flavors & Fragrances, | | | | | | |
| Notes, 6.45%, 2006 | | 2,900,000 | | | | 2,943,001 |
| Lubrizol, | | | | | | |
| Debs., 6.5%, 2034 | | 1,335,000 | | | | 1,446,697 |
| RPM International: | | | | | | |
| Bonds, 6.25%, 2013 | | 1,385,000 | | | | 1,438,280 |
| Sr. Notes, 4.45%, 2009 | | 1,500,000 | | | | 1,456,013 |
| | | | | | | 8,419,662 |
| Commercial & Professional Services—.9% | | | | |
| Aramark Services, | | | | | | |
| Sr. Notes, 6.375%, 2008 | | 1,900,000 | | | | 1,972,698 |
| Deluxe, | | | | | | |
| Notes, Ser. B, 3.5%, 2007 | | 1,247,000 | | | | 1,211,266 |
| Erac USA Finance, | | | | | | |
| Notes, 7.95%, 2009 | | 760,000 | | b | | 846,767 |
| RR Donnelley & Sons, | | | | | | |
| Notes, 5%, 2006 | | 800,000 | | | | 803,728 |
| | | | | | | 4,834,459 |
| Commercial Mortgage | | | | | | |
| Pass-Through Ctfs.—.8% | | | | | | |
| Bear Stearns Commercial Mortgage Securities, | | | | |
| Ser. 2005-T18, Cl. A2, 4.556%, 2042 | | 1,365,000 | | | | 1,358,179 |
| Calwest Industrial Trust, | | | | | | |
| Ser. 2002-CALW, Cl. A, 6.127%, 2017 | | 1,460,000 | | b | | 1,567,923 |
| Crown Castle Towers, | | | | | | |
| Ser. 2005-1A, Cl. D, 5.612%, 2035 | | 1,290,000 | | b | | 1,272,968 |
| | | | | | | 4,199,070 |
| Consumer Products—.2% | | | | | | |
| Sony Capital, | | | | | | |
| Notes, 4.95%, 2006 | | 1,390,000 | | b | | 1,395,213 |
| | STATEMENT OF INVESTMENTS (continued)
|
| | | Principal | | |
| Bonds and Notes (continued) | | Amount a | | Value ($) |
| |
| |
|
| Diversified Financial Services—7.8% | | | | |
| Amvescap, | | | | |
| Sr. Notes, 5.9%, 2007 | | 1,005,000 | | 1,024,828 |
| Capital One Bank, | | | | |
| Sub. Notes, 6.5%, 2013 | | 1,807,000 | | 1,962,021 |
| Countrywide Home Loans: | | | | |
| Medium-Term Notes, Ser. J, 5.5%, 2006 | | 875,000 | | 885,142 |
| Medium-Term Notes, Ser. L, 2.875%, 2007 | | 2,500,000 | | 2,439,725 |
| Notes, 4.125%, 2009 | | 1,445,000 | | 1,408,739 |
| Fondo LatinoAmericano De Reservas, | | | | |
| Notes, 3%, 2006 | | 3,220,000 b | | 3,183,421 |
| Ford Motor Credit: | | | | |
| Notes, 4.30813%, 2007 | | 2,325,000 f | | 2,277,793 |
| Notes, 4.38938%, 2007 | | 420,000 f | | 415,460 |
| Notes, 6.5%, 2007 | | 3,275,000 c | | 3,310,416 |
| Sr. Notes, 7.2%, 2007 | | 2,330,000 | | 2,370,721 |
| GMAC: | | | | |
| Notes, 4.50875%, 2007 | | 3,280,000 c,f | | 3,245,511 |
| Notes, 4.55875%, 2007 | | 1,480,000 f | | 1,447,890 |
| Glencore Funding, | | | | |
| Notes, 6%, 2014 | | 2,885,000 b | | 2,769,268 |
| HSBC, | | | | |
| Notes, 5.75%, 2007 | | 1,755,000 | | 1,790,461 |
| Jefferies, | | | | |
| Sr. Notes, 7.75%, 2012 | | 365,000 | | 410,702 |
| Lehman Brothers, | | | | |
| Notes, 8.5%, 2007 | | 2,000,000 | | 2,133,800 |
| Leucadia National, | | | | |
| Sr. Notes, 7%, 2013 | | 1,100,000 | | 1,119,250 |
| MBNA Capital, | | | | |
| Capital Sec., Ser. A, 8.278%, 2026 | | 905,000 | | 977,717 |
| Pemex Finance, | | | | |
| Bonds, 9.69%, 2009 | | 2,550,000 | | 2,765,335 |
| Residential Capital: | | | | |
| Notes, 4.835%, 2007 | | 3,215,000 b,f | | 3,220,086 |
| Notes, 6.375%, 2010 | | 2,790,000 b | | 2,837,795 |
| Textron Financial, | | | | |
| Notes, 2.75%, 2006 | | 1,635,000 | | 1,617,571 |
| | | | | 43,613,652 |
| | | Principal | | |
| Bonds and Notes (continued) | | Amount a | | Value ($) |
| |
| |
|
| Diversified Metals & Mining—.5% | | | | |
| International Steel, | | | | |
| Sr. Notes, 6.5%, 2014 | | 1,205,000 | | 1,205,000 |
| Ispat Inland, | | | | |
| Secured Notes, 9.75%, 2014 | | 390,000 | | 462,150 |
| Southern Peru Copper, | | | | |
| Notes, 7.5%, 2035 | | 1,430,000 b | | 1,420,073 |
| | | | | 3,087,223 |
| Electric Utilities—2.9% | | | | |
| Allegheny Energy, | | | | |
| Notes, 7.75%, 2005 | | 1,925,000 | | 1,925,000 |
| Ameren, | | | | |
| Bonds, 4.263%, 2007 | | 595,000 | | 592,440 |
| FPL Energy National Wind, | | | | |
| Notes, 5.608%, 2024 | | 550,000 b | | 551,137 |
| FirstEnergy, | | | | |
| Notes, Ser. B, 6.45%, 2011 | | 1,315,000 | | 1,415,946 |
| Jersey Central Power & Light, | | | | |
| First Mortgage Notes, 5.625%, 2016 | | 1,560,000 | | 1,633,679 |
| Northern States Power, | | | | |
| First Mortgage, 2.875%, 2006 | | 1,490,000 | | 1,469,614 |
| PPL Capital Funding Trust I, | | | | |
| Sub. Notes, 7.29%, 2006 | | 130,000 | | 132,507 |
| Pacific Gas & Electric, | | | | |
| First Mortgage, 4.8%, 2014 | | 2,601,000 | | 2,574,077 |
| Sierra Pacific Power, | | | | |
| Mortgage Notes, 6.25%, 2012 | | 770,000 | | 808,500 |
| TXU: | | | | |
| Notes, 4.8%, 2009 | | 2,335,000 b | | 2,300,003 |
| Notes, 5.55%, 2014 | | 1,520,000 b | | 1,489,413 |
| Sr. Notes, Ser. J, 6.375%, 2006 | | 1,278,000 | | 1,303,338 |
| | | | | 16,195,654 |
| Entertainment—.4% | | | | |
| Carnival, | | | | |
| Notes, 7.3%, 2007 | | 1,305,000 | | 1,363,947 |
| Mohegan Tribal Gaming Authority, | | | | |
| Sr. Notes, 6.125%, 2013 | | 1,000,000 | | 1,018,750 |
| | | | | 2,382,697 |
| | STATEMENT OF INVESTMENTS (continued)
|
| | | | | Principal | | |
| Bonds and Notes (continued) | | | | Amount a | | Value ($) |
| |
| |
| |
|
| Environmental Control—.4% | | | | | | |
| Waste Management: | | | | | | |
| Sr. Notes, 6.5%, 2008 | | | | 950,000 | | 997,879 |
| Sr. Notes, 7%, 2028 | | | | 1,000,000 | | 1,132,518 |
| | | | | | | 2,130,397 |
| Food & Beverages—.9% | | | | | | |
| Kraft Foods, | | | | | | |
| Notes, 4.625%, 2006 | | | | 2,800,000 | | 2,809,489 |
| Safeway, | | | | | | |
| Notes, 4.125%, 2008 | | | | 930,000 | | 909,400 |
| Stater Brothers, | | | | | | |
| Sr. Notes, 8.125%, 2012 | | | | 1,100,000 | | 1,116,500 |
| | | | | | | 4,835,389 |
| Foreign Governmental—5.9% | | | | | | |
| Argentina Bonos, | | | | | | |
| Bonds, 3.01%, 2012 | | | | 3,420,000 f | | 3,176,294 |
| Banco Nacional de Desenvolvimento | | | | | | |
| Economico e Social, | | | | | | |
| Notes, 5.822%, 2008 | | | | 2,845,000 f | | 2,852,434 |
| Deutsche Bundesrepublik: | | | | | | |
| Bonds, Ser. 03, 4.5%, 2013 | | EUR | | 1,845,000 | | 2,458,465 |
| Bonds, Ser. 03, 4.75%, 2034 | | EUR | | 3,940,000 | | 5,627,603 |
| Bonds, Ser. 98, 4.125%, 2008 | | EUR | | 6,520,000 | | 8,293,490 |
| Mexican Bonos, | | | | | | |
| Bonds, Ser. M, 9%, 2011 | | MXN | | 17,060,000 | | 1,591,411 |
| Russian Government: | | | | | | |
| Bonds, 10%, 2007 | | | | 5,115,000 b | | 5,632,894 |
| Notes, 12.75%, 2028 | | | | 1,800,000 | | 3,242,678 |
| | | | | | | 32,875,269 |
| Gaming & Lodging—.2% | | | | | | |
| MGM Mirage, | | | | | | |
| Sr. Notes, 6%, 2009 | | | | 950,000 | | 957,125 |
| Health Care—1.0% | | | | | | |
| Medco Health Solutions, | | | | | | |
| Sr. Notes, 7.25%, 2013 | | | | 3,276,000 | | 3,652,039 |
| UnitedHealth: | | | | | | |
| Notes, 5.2%, 2007 | | | | 900,000 | | 909,342 |
| Notes, 7.5%, 2005 | | | | 1,100,000 | | 1,109,462 |
| | | | | | | 5,670,843 |
| | | Principal | | |
| Bonds and Notes (continued) | | Amount a | | Value ($) |
| |
| |
|
| Manufacturing—.8% | | | | |
| Bombardier: | | | | |
| Notes, 6.3%, 2014 | | 1,720,000 b,c | | 1,625,400 |
| Notes, 7.45%, 2034 | | 3,350,000 b | | 2,931,250 |
| | | | | 4,556,650 |
| Media—1.8% | | | | |
| Clear Channel Communications: | | | | |
| Notes, 4.25%, 2009 | | 1,235,000 | | 1,180,755 |
| Notes, 4.5%, 2010 | | 1,700,000 | | 1,612,377 |
| Liberty Media, | | | | |
| Notes, 3.5%, 2006 | | 2,490,000 | | 2,451,684 |
| Media General, | | | | |
| Notes, 6.95%, 2006 | | 490,000 | | 503,475 |
| Reed Elsevier Capital, | | | | |
| Sr. Notes, 6.125%, 2006 | | 2,700,000 | | 2,731,636 |
| Univision Communications, | | | | |
| Sr. Notes, 2.875%, 2006 | | 1,495,000 | | 1,462,086 |
| | | | | 9,942,013 |
| Oil & Gas—1.5% | | | | |
| Amerada Hess, | | | | |
| Notes, 6.65%, 2011 | | 1,310,000 | | 1,424,481 |
| Colorado Interstate Gas, | | | | |
| Sr. Notes, 5.95%, 2015 | | 780,000 b | | 774,639 |
| Enterprise Products Operating, | | | | |
| Sr. Notes, Ser. B, 4.625%, 2009 | | 2,845,000 | | 2,802,194 |
| Pemex Project Funding Master Trust, | | | | |
| Notes, 7.375%, 2014 | | 2,140,000 | | 2,370,050 |
| Sempra Energy, | | | | |
| Sr. Notes, 4.621%, 2007 | | 995,000 | | 995,094 |
| | | | | 8,366,458 |
| Packaging & Containers—.3% | | | | |
| Sealed Air, | | | | |
| Bonds, 6.875%, 2033 | | 1,290,000 b | | 1,409,454 |
| Paper & Forest Products—1.7% | | | | |
| Celulosa Arauco y Constitucion, | | | | |
| Notes, 5.625%, 2015 | | 1,350,000 b | | 1,347,972 |
| Georgia-Pacific: | | | | |
| Sr. Notes, 8%, 2014 | | 1,300,000 | | 1,488,500 |
| Sr. Notes, 8.875%, 2010 | | 1,250,000 | | 1,412,500 |
| | STATEMENT OF INVESTMENTS (continued)
|
| | | Principal | | |
| Bonds and Notes (continued) | | Amount a | | Value ($) |
| |
| |
|
| Paper & Forest Products (continued) | | |
| Sappi Papier, | | | | |
| Notes, 6.75%, 2012 | | 2,400,000 b | | 2,491,802 |
| Temple-Inland, | | | | |
| Notes, 5.003%, 2007 | | 3,000,000 | | 3,005,083 |
| | | | | 9,745,857 |
| Property-Casualty Insurance—1.4% | | |
| Ace Capital Trust II, | | | | |
| Bonds, 9.7%, 2030 | | 1,625,000 | | 2,165,394 |
| American International, | | | | |
| Notes, Ser. F, 2.85%, 2005 | | 1,460,000 | | 1,455,216 |
| Cincinnati Financial, | | | | |
| Sr. Notes, 6.125%, 2034 | | 1,370,000 | | 1,449,221 |
| Nippon Life Insurance, | | | | |
| Notes, 4.875%, 2010 | | 1,350,000 b | | 1,342,521 |
| North Front Pass-Through Trust, | | | | |
| Notes, 5.81%, 2024 | | 1,385,000 b | | 1,410,010 |
| | | | | 7,822,362 |
| Real Estate Investment Trusts—2.6% | | |
| Archstone-Smith Operating Trust: | | | | |
| Notes, 3%, 2008 | | 1,000,000 | | 952,316 |
| Notes, 5.25%, 2015 | | 500,000 | | 500,311 |
| Arden Realty, | | | | |
| Notes, 5.25%, 2015 | | 1,250,000 | | 1,228,013 |
| Duke Realty: | | | | |
| Notes, 4.625%, 2013 | | 1,055,000 | | 1,018,585 |
| Sr. Notes, 5.25%, 2010 | | 1,750,000 | | 1,772,866 |
| EOP Operating: | | | | |
| Bonds, 7.875%, 2031 | | 1,010,000 | | 1,245,878 |
| Sr. Notes, 7%, 2011 | | 600,000 | | 659,703 |
| ERP Operating, | | | | |
| Notes, 4.75%, 2009 | | 560,000 | | 557,475 |
| Healthcare Realty Trust, | | | | |
| Sr. Notes, 5.125%, 2014 | | 2,820,000 | | 2,729,089 |
| Mack-Cali Realty, | | | | |
| Notes, 5.05%, 2010 | | 1,600,000 | | 1,598,134 |
| Regency Centers, | | | | |
| Bonds, 5.25%, 2015 | | 1,450,000 b | | 1,443,769 |
| Simon Property, | | | | |
| Notes, 4.6%, 2010 | | 1,098,000 b | | 1,081,710 |
| | | | | 14,787,849 |
16
| | | Principal | | | | |
| Bonds and Notes (continued) | | Amount a | | Value ($) |
| |
| |
|
| Residential Mortgage Pass—Through Ctfs.—5.0% | | | | |
| Bank Of America Mortgage Securities II, | | | | | | |
| Ser. 2001-4, Cl. B3, 6.75%, 2031 | | 244,061 | | | | 244,405 |
| Citigroup Mortgage Loan Trust, | | | | | | |
| Ser. 2005-WF1, Cl. A5, 5.01%, 2035 | | 1,700,000 | | | | 1,677,594 |
| Countrywide Alternative Loan Trust II, | | | | | | |
| Ser. 2005-J4, Cl. A1B, 3.58%, 2035 | | 2,969,026 | | f | | 2,966,600 |
| Countrywide Home Loans: | | | | | | |
| Ser. 2003-8, Cl. B3, 5%, 2018 | | 267,605 | | b | | 248,386 |
| Ser. 2003-15, Cl. B3, 4.8724%, 2018 | | 810,229 | | b | | 741,600 |
| First Horizon Alternative Mortgage Securities I, | | | | |
| Ser. 2004-FA1, Cl. A1, 6.25%, 2034 | | 10,381,602 | | | | 10,599,124 |
| JP Morgan Mortgage Trust V, | | | | | | |
| Ser. 2005-A1 Cl. A1, 4.484%, 2035 | | 919,600 | | f | | 901,484 |
| Nomura Asset Acceptance: | | | | | | |
| Ser. 2005-AP2, Cl. A5, 4.976%, 2035 | | 1,725,000 | | | | 1,701,260 |
| Ser. 2005-WF1, Cl. 2A5, 5.159%, 2035 | | 1,195,000 | | | | 1,188,165 |
| Ocwen Residential MBS, | | | | | | |
| Ser. 1998-R1, Cl. B1, 7%, 2040 | | 510,086 | | b | | 521,872 |
| Residential Funding Mtg. Sec. I, | | | | | | |
| Ser. 2003-S3, Cl. B1, 5.25%, 2018 | | 180,712 | | | | 172,680 |
| Structured Adjustable Rate Mortgage Loan Trust, | | | | |
| Ser. 2005-8XS, Cl. A1, 3.56%, 2035 | | 3,413,792 | | f | | 3,413,792 |
| Washington Mutual, | | | | | | |
| Ser. 2005-AR4, Cl. A4B, 4.684%, 2035 | | 3,325,000 | | f | | 3,286,554 |
| | | | | | | 27,663,516 |
| Retail—.2% | | | | | | |
| May Department Stores: | | | | | | |
| Notes, 3.95%, 2007 | | 500,000 | | | | 494,245 |
| Notes, 5.95%, 2008 | | 760,000 | | | | 786,152 |
| Saks, | | | | | | |
| Notes, 8.25%, 2008 | | 429 | | | | 446 |
| | | | | | | 1,280,843 |
| State Government—1.9% | | | | | | |
| New Jersey Tobacco Settlement Financing: | | | | | | |
| Notes, 5.75%, 2032 | | 1,250,000 | | | | 1,319,563 |
| Note, 6.125%, 2042 | | 8,400,000 | | | | 9,082,332 |
| | | | | | | 10,401,895 |
| Structured Index—2.5% | | | | | | |
| AB Svensk Exportkredit, | | | | | | |
| GSNE-ER Indexed Notes, 0%, 2007 | | 14,675,000 | | b,g | | 13,743,138 |
| | STATEMENT OF INVESTMENTS (continued)
|
| | | Principal | | | | |
| Bonds and Notes (continued) | | Amount a | | Value ($) |
| |
| |
|
| Technology—.5% | | | | | | |
| Freescale Semiconductor, | | | | | | |
| Sr. Notes, 6.875%, 2011 | | 860,000 | | | | 911,600 |
| Hewlett-Packard, | | | | | | |
| Notes, 5.75%, 2006 | | 1,925,000 | | | | 1,959,475 |
| | | | | | | 2,871,075 |
| Telecommunications—4.6% | | | | | | |
| Alltel: | | | | | | |
| Debs., 6.75%, 2005 | | 1,050,000 | | | | 1,053,403 |
| Notes, 4.656%, 2007 | | 1,670,000 | | | | 1,676,012 |
| BellSouth, | | | | | | |
| Notes, 4.258%, 2006 | | 2,750,000 | | b | | 2,750,074 |
| British Telecommunications, | | | | | | |
| Notes, 7.625%, 2005 | | 1,364,000 | | f | | 1,383,074 |
| Deutsche Telekom International Finance, | | | | |
| Bonds, 8.75%, 2030 | | 3,190,000 | | f | | 4,280,278 |
| France Telecom: | | | | | | |
| Notes, 7.95%, 2006 | | 3,140,000 | | f | | 3,196,234 |
| Notes, 8.5%, 2011 | | 1,280,000 | | f | | 1,467,537 |
| Nextel Communications, | | | | | | |
| Sr. Notes, 5.95%, 2014 | | 1,035,000 | | | | 1,075,106 |
| Qwest: | | | | | | |
| Bank Note, Ser. A, 6.5%, 2007 | | 1,560,000 | | f | | 1,614,600 |
| Bank Note, Ser. B, 6.95%, 2010 | | 2,322,000 | | f | | 2,316,195 |
| Sr. Notes, 7.875%, 2011 | | 710,000 | | | | 743,725 |
| SBC Communications, | | | | | | |
| Notes, 5.625%, 2016 | | 945,000 | | | | 981,217 |
| Sprint Capital: | | | | | | |
| Notes, 8.75%, 2032 | | 1,075,000 | | | | 1,483,868 |
| Sr. Notes, 6.125%, 2008 | | 1,800,000 | | | | 1,874,215 |
| | | | | | | 25,895,538 |
| U.S. Government—6.1% | | | | | | |
| U.S. Treasury Bonds, | | | | | | |
| 6.25%, 5/15/2031 | | 4,290,000 | | | | 5,393,645 |
| U.S. Treasury Inflation Protected Securities, | | | | |
| 3%, 7/15/2012 | | 10,325,842 | | h | | 11,127,297 |
| | | Principal | | |
| Bonds and Notes (continued) | | Amount a | | Value ($) |
| |
| |
|
| U.S. Government (continued) | | | | |
| U.S. Treasury Notes: | | | | |
| 4%, 4/15/2010 | | 2,540,000 | | 2,523,729 |
| 4%, 2/15/2015 | | 390,000 | | 381,179 |
| 4.75%, 5/15/2014 | | 14,375,000 | | 14,881,431 |
| | | | | 34,307,281 |
| U.S. Government Agencies/Mortgage-Backed—31.1% | | |
| Federal Home Loan Mortgage Corp.: | | | | |
| 6.5%, 10/1/2031-5/1/2032 | | 1,601,428 | | 1,658,475 |
| Ser. 2586, Cl. WE, 4%, 12/15/2032 | | 8,526,502 | | 8,240,369 |
| Federal National Mortgage Association: | | | | |
| 4.5% | | 22,875,000 i | | 22,503,281 |
| 5% | | 51,290,000 i | | 50,911,338 |
| 5%, 1/1/2018-8/1/2018 | | 1,894,776 | | 1,901,380 |
| 5.5% | | 11,400,000 i | | 11,631,534 |
| 5.5%, 8/1/2034-5/1/2035 | | 14,029,759 | | 14,111,808 |
| 6% | | 15,975,000 i | | 16,499,139 |
| 6.5%, 11/1/2010 | | 1,238 | | 1,288 |
| Ser. 2004-58, Ser. L, 5%, 7/25/2034 | | 4,075,030 | | 4,121,812 |
| Government National Mortgage Association: | | | | |
| 5.5%, 6/15/2033 | | 21,908 | | 22,203 |
| 6%, 1/15/2033-1/15/2034 | | 22,427,343 | | 23,079,082 |
| Ser. 2004-39, Cl. LC, 5.5%, 12/20/2029 | | 4,800,000 | | 4,922,200 |
| Ser. 2005-29, Cl. A, 4.016%, 7/16/2027 | | 1,933,044 | | 1,892,779 |
| Ser. 2005-32, Cl. B, 4.385%, 8/16/2030 | | 3,420,000 | | 3,383,987 |
| Ser. 2005-34, Cl. A, 3.956%, 9/16/2021 | | 1,961,827 | | 1,931,535 |
| Ser. 2005-42, Cl. A, 4.045%, 7/16/2020 | | 1,793,427 | | 1,757,200 |
| Ser. 2005-50, Cl. A, 4.015%, 11/16/2010 | | 1,500,000 | | 1,470,469 |
| Ser. 2005-59, Cl. A, 4.321%, 5/16/2010 | | 1,650,000 | | 1,638,140 |
| Government National Mortgage Association II: | | | | |
| 3.5%, 7/20/2030 | | 158,248 f | | 159,279 |
| 6%, 6/20/2035 | | 249,292 | | 255,757 |
| 6.5%, 2/20/2031-9/20/2031 | | 829,557 | | 863,777 |
| 7%, 11/29/2029-7/20/2031 | | 277,048 | | 291,425 |
| 7.5%, 10/20/2030-8/20/2031 | | 374,606 | | 398,697 |
| | | | | 173,646,954 |
| Total Bonds and Notes | | | | |
| (cost $608,175,226) | | | | 605,464,339 |
STATEMENT OF INVESTMENTS (continued)
|
| Preferred Stocks—.1% | | Shares | | Value ($) |
| |
| |
|
| Banking; | | | | |
| Sovereign Capital Trust II, | | | | |
| Cum. Conv., $2.18754 | | | | |
| (cost $465,313) | | 15,500 | | 722,688 |
| |
| |
|
| | | Face Amount | | |
| | | Covered by | | |
| Options—0% | | Contracts ($) | | Value ($) |
| |
| |
|
| Call Options—0% | | | | |
| Dow Jones CDX.NA.IG.4 | | | | |
| September 2005 @ .575 | | 14,000,000 | | 40,600 |
| U.S. Treasury Notes, 4%, 2/15/2015 | | | | |
| August 2005 @ 98.453125 | | 11,120,000 | | 6,672 |
| U.S. Treasury Notes, 4.125%, 5/15/2015 | | |
| August 2005 @ 101.328125 | | 11,300,000 | | 678 |
| Total Options | | | | |
| (cost $312,597) | | | | 47,950 |
| |
| |
|
| |
| Other Investment—.6% | | Shares | | Value ($) |
| |
| |
|
| Registered Investment Company; | | | | |
| Dreyfus Institutional Preferred Plus Money Market Fund | | |
| (cost $3,397,000) | | 3,397,000 j | | 3,397,000 |
| |
| |
|
| | | Principal | | |
| Short-Term Investments—10.3% | | Amount a | | Value ($) |
| |
| |
|
| U.S. Government Agencies—3.9% | | | | |
| Federal National Mortgage Association: | | | | |
| 3.4773%, 8/11/2005 | | 20,095,000 | | 20,077,427 |
| 3.4758%, 8/30/2005 | | 1,650,000 | | 1,645,694 |
| | | | | 21,723,121 |
| U.S. Treasury Bills—6.4% | | | | |
| 2.97%, 9/8/2005 | | 350,000 k | | 348,852 |
| 3.23%, 12/29/2005 | | 36,011,000 | | 35,497,483 |
| | | | | 35,846,335 |
| Total Short-Term Investments | | | | |
| (cost $57,567,624) | | | | 57,569,456 |
| Investment of Cash Collateral | | | | |
| for Securities Loaned—1.8% | | Shares | | Value ($) |
| |
| |
|
| Registered Investment Company; | | | | |
| Dreyfus Institutional Cash Advantage Fund | | | | |
| (cost $9,910,850) | | 9,910,850 j | | 9,910,850 |
| |
| |
|
| Total Investments (cost $679,828,610) | | 121.2% | | 677,112,283 |
| Liabilities, Less Cash and Receivables | | (21.2%) | | (118,479,391) |
| Net Assets | | 100.0% | | 558,632,892 |
| a Principal amount stated in U.S. Dollars unless otherwise noted. |
| EUR—Euro |
| MXN—Mexican Peso |
| b Securities exempt from registration under Rule 144A of the Securities Act of 1933.These securities may be resold in |
| transactions exempt from registration, normally to qualified institutional buyers. At July 31, 2005, these securities |
| amounted to $70,182,591 or 12.6% of net assets. |
| c All or a portion of these securities are on loan. At July 31, 2005, the total market value of the fund’s securities on |
| loan is $9,637,232 and the total market value of the collateral held by the fund is $9,910,850. |
| d Non-income producing-security in default. |
| e The value of this security has been determined in good faith under the direction of the Board of Directors. |
| f Variable rate security—interest rate subject to periodic change. |
| g Security linked to Goldman Sachs Non-Energy—Excess Return Index. |
| h Principal amount for accrual purposes is periodically adjusted based on changes in the Consumer Price Index. |
| i Purchased on a forward commitment basis. |
| j Investments in affiliated money market mutual funds. |
| k Held by a broker as collateral for open financial futures positions. |
| Portfolio Summary † | | | | | | |
| |
| | | Value (%) | | | | Value (%) |
| |
| |
| |
|
| Corporate Bonds | | 37.3 | | Structured Index | | 2.5 |
| U.S. Government & Agencies | | 37.2 | | State Government | | 1.9 |
| Asset/Mortgage Backed | | 23.6 | | Preferred Stock | | .1 |
| Short-Term/ | | | | Futures/Options/Swaps/Forward | | |
| Money Market Investments | | 12.7 | | Exchange Currency Contracts | | (.2) |
| Foreign Governmental | | 5.9 | | | | 121.0 |
| |
| † Based on net assets. | | | | | | |
| See notes to financial statements. | | | | | | |
STATEMENT OF FINANCIAL FUTURES
July 31, 2005
| | | | | | | | | Unrealized |
| | | | | Market Value | | | | Appreciation |
| | | | | Covered by | | | | (Depreciation) |
| | | Contracts | | Contracts ($) | | Expiration | | at 7/31/2005 ($) |
| |
| |
| |
| |
|
| Financial Futures Long | | | | | | | | |
| U.S. Treasury 2 Year Notes | | 37 | | 7,639,922 | | September 2005 | | (43,359) |
| U.S. Treasury 5 Year Notes | | 520 | | 55,745,625 | | September 2005 | | (805,743) |
| U.S. Treasury 10 Year Notes | | 55 | | 6,104,141 | | September 2005 | | (13,414) |
| Financial Futures Short | | | | | | | | |
| U.S. Treasury 30 Year Bonds | | 65 | | 7,495,313 | | September 2005 | | 106,250 |
| | | | | | | | | (756,266) |
| | See notes to financial statements.
|
STATEMENT OF OPTIONS WRITTEN
July 31, 2005
| | | Face Amount | | |
| | | Covered by | | |
| Call Options | | Contracts ($) | | Value ($) |
| |
| |
|
| Issuer | | | | |
| Dow Jones CDX.NA.IG.4 | | | | |
| September 2005 @ .52 | | 28,000,000 | | 39,200 |
| U.S. Treasury Notes, 4%, 2/15/2015 | | | | |
| August 2005 @ 100 | | 22,600,000 | | 226 |
| U.S. Treasury Notes, 4.125%, 5/15/2015 | | | | |
| August 2005 @ 102.859375 | | 22,240,000 | | 1,779 |
| (Premiums received $319,547) | | | | 41,205 |
| | See notes to financial statements.
|
STATEMENT OF ASSETS AND LIABILITIES
July 31, 2005
| | | Cost | | Value |
| |
| |
|
| Assets ($): | | | | |
| Investments in securities—See Statement of Investments | | |
| (including securities on loan, valued at $9,637,232)—Note 1(c): | | |
| Unaffiliated issuers | | 666,520,760 | | 663,804,433 |
| Affiliated issuers | | 13,307,850 | | 13,307,850 |
| Dividends and interest receivable | | | | 4,287,545 |
| Receivable for shares of Common Stock subscribed | | 942,013 |
| Receivable for investment securities sold | | 602,790 |
| Unrealized appreciation on swaps—Note 4 | | 398,011 |
| Receivable from broker for swap transactions—Note 4 | | 71,994 |
| Unrealized appreciation on forward currency exchange contracts—Note 4 | | 1,953 |
| Prepaid expenses | | | | 35,185 |
| | | | | 683,451,774 |
| |
| |
|
| Liabilities ($): | | | | |
| Due to The Dreyfus Corporation and affiliates—Note 3(b) | | 361,912 |
| Cash overdraft due to Custodian | | | | 1,459,922 |
| Payable for investment securities purchased | | 111,472,673 |
| Liability for securities on loan—Note 1(c) | | 9,910,850 |
| Unrealized depreciation on swaps—Note 4 | | 640,541 |
| Payable for shares of Common Stock redeemed | | 552,359 |
| Payable for futures variation margin—Note 4 | | 155,328 |
| Outstanding options written, at value (premiums received | | |
| $319,547)—See Statement of Options Written | | 41,205 |
| Accrued expenses | | | | 224,092 |
| | | | | 124,818,882 |
| |
| |
|
| Net Assets ($) | | | | 558,632,892 |
| |
| |
|
| Composition of Net Assets ($): | | | | |
| Paid-in capital | | | | 565,762,770 |
| Accumulated undistributed investment income—net | | 5,286,274 |
| Accumulated net realized gain (loss) on investments | | (8,986,035) |
| Accumulated net unrealized appreciation (depreciation) on investments | | |
| and foreign currency transactions [including ($756,266) | | |
| net unrealized (depreciation) on financial futures] | | (3,430,117) |
| |
|
| Net Assets ($) | | | | 558,632,892 |
| |
| |
|
| |
| |
| Net Asset Value Per Share | | | | |
| | | Investor Shares | | Institutional Shares |
| |
| |
|
| Net Assets ($) | | 531,231,977 | | 27,400,915 |
| Shares Outstanding | | 41,669,654 | | 2,149,618 |
| |
| |
|
| Net Asset Value Per Share ($) | | 12.75 | | 12.75 |
See notes to financial statements. The Fund 23
STATEMENT OF OPERATIONS
Year Ended July 31, 2005
|
| Investment Income ($): | | |
| Interest | | 25,880,941 |
| Dividends: | | |
| Unaffiliated issuers | | 187,378 |
| Affiliated issuers | | 985,373 |
| Income from securities lending | | 72,889 |
| Total Income | | 27,126,581 |
| Expenses: | | |
| Management fee—Note 3(a) | | 2,755,269 |
| Shareholder servicing costs—Note 3(b) | | 2,185,095 |
| Custodian fees—Note 3(b) | | 162,545 |
| Prospectus and shareholders’ reports | | 95,962 |
| Professional fees | | 53,440 |
| Registration fees | | 45,037 |
| Directors’ fees and expenses—Note 3(c) | | 17,607 |
| Interest expense—Note 2 | | 2,075 |
| Miscellaneous | | 55,503 |
| Total Expenses | | 5,372,533 |
| Less—reduction in management fee due to | | |
| undertaking—Note 3(a) | | (527,393) |
| Net Expenses | | 4,845,140 |
| Investment Income—Net | | 22,281,441 |
| |
|
| Realized and Unrealized Gain (Loss) on Investments—Note 4 ($): |
| Net realized gain (loss) on investments and foreign currency transactions | | 20,080,178 |
| Net realized gain (loss) on forward currency exchange transactions | | (1,801,609) |
| Net realized gain (loss) on financial futures | | 1,480,656 |
| Net realized gain (loss) on options transactions | | 144,597 |
| Net realized gain (loss) on swaps | | (300,455) |
| Net Realized Gain (Loss) | | 19,603,367 |
| Net unrealized appreciation (depreciation) on investments, options | | |
| transactions, swap transactions and foreign currency transactions | | |
| [including ($910,329) net unrealized (depreciation) on financial futures] | | (2,950,913) |
| Net Realized and Unrealized Gain (Loss) on Investments | | 16,652,454 |
| Net Increase in Net Assets Resulting from Operations | | 38,933,895 |
See notes to financial statements.
|
STATEMENT OF CHANGES IN NET ASSETS
| | | | | Year Ended July 31, |
| |
| |
|
| | | 2005 | | 2004 |
| |
| |
|
| Operations ($): | | | | |
| Investment income—net | | 22,281,441 | | 27,713,534 |
| Net realized gain (loss) on investments | | 19,603,367 | | (8,195,456) |
| Net unrealized appreciation | | | | |
| (depreciation) on investments | | (2,950,913) | | 9,342,965 |
| Net Increase (Decrease) in Net Assets | | | | |
| Resulting from Operations | | 38,933,895 | | 28,861,043 |
| |
| |
|
| Dividends to Shareholders from ($): | | | | |
| Investment income—net: | | | | |
| Investor Shares | | (25,488,232) | | (32,400,059) |
| Institutional Shares | | (1,014,518) | | (160,705) |
| Net realized gain on investments: | | | | |
| lnvestor Shares | | — | | (14,934,445) |
| Institutional Shares | | — | | (65,767) |
| Total Dividends | | (26,502,750) | | (47,560,976) |
| |
| |
|
| Capital Stock Transactions ($): | | | | |
| Net proceeds from shares sold: | | | | |
| Investor Shares | | 98,988,495 | | 155,725,230 |
| Institutional Shares | | 26,171,379 | | 894,260 |
| Dividends reinvested: | | | | |
| Investor Shares | | 23,228,324 | | 40,304,499 |
| Institutional Shares | | 20,981 | | 61,166 |
| Cost of shares redeemed: | | | | |
| Investor Shares | | (280,490,905) | | (331,987,819) |
| Institutional Shares | | (1,794,572) | | (2,507,732) |
| Increase (Decrease) in Net Assets | | | | |
| from Capital Stock Transactions | | (133,876,298) | | (137,510,396) |
| Total Increase (Decrease) in Net Assets | | (121,445,153) | | (156,210,329) |
| |
| |
|
| Net Assets ($): | | | | |
| Beginning of Period | | 680,078,045 | | 836,288,374 |
| End of Period | | 558,632,892 | | 680,078,045 |
| Undistributed investment income—net | | 5,286,274 | | 1,381,045 |
STATEMENT OF CHANGES IN NET ASSETS (continued)
|
| | | | | Year Ended July 31, |
| |
| |
|
| | | 2005 | | 2004 |
| |
| |
|
| Capital Share Transactions: | | | | |
| Investor Shares | | | | |
| Shares sold | | 7,749,229 | | 12,041,064 |
| Shares issued for dividends reinvested | | 1,815,876 | | 3,123,257 |
| Shares redeemed | | (21,960,902) | | (25,804,469) |
| Net Increase (Decrease) in Shares Outstanding | | (12,395,797) | | (10,640,148) |
| |
| |
|
| Institutional Shares | | | | |
| Shares sold | | 2,061,115 | | 68,653 |
| Shares issued for dividends reinvested | | 1,641 | | 4,719 |
| Shares redeemed | | (140,695) | | (193,587) |
| Net Increase (Decrease) in Shares Outstanding | | 1,922,061 | | (120,215) |
See notes to financial statements.
|
The following tables describe the performance for each share class for the fiscal periods indicated.All information (except portfolio turnover rate) reflects financial results for a single fund share.Total return shows how much your investment in the fund would have increased (or decreased) during each period, assuming you had reinvested all dividends and distributions.These figures have been derived from the fund’s financial statements.
| | | | | Year Ended July 31, | | |
| |
| |
| |
|
| Investor Shares | | 2005 | | 2004 a | | 2003 | | 2002 b | | 2001 |
| |
| |
| |
| |
| |
|
| Per Share Data ($): | | | | | | | | | | |
| Net asset value, beginning of period | | 12.53 | | 12.86 | | 12.42 | | 13.22 | | 12.50 |
| Investment Operations: | | | | | | | | | | |
| Investment income—net | | .46c | | .46c | | .56c | | .72c | | .84 |
| Net realized and unrealized | | | | | | | | | | |
| gain (loss) on investments | | .31 | | (.01)d | | .51 | | (.64) | | .75 |
| Total from Investment Operations | | .77 | | .45 | | 1.07 | | .08 | | 1.59 |
| Distributions: | | | | | | | | | | |
| Dividends from investment income—net | | (.55) | | (.54) | | (.63) | | (.76) | | (.84) |
| Dividends from net realized | | | | | | | | | | |
| gain on investments | | — | | (.24) | | — | | (.12) | | (.03) |
| Total Distributions | | (.55) | | (.78) | | (.63) | | (.88) | | (.87) |
| Net asset value, end of period | | 12.75 | | 12.53 | | 12.86 | | 12.42 | | 13.22 |
| |
| |
| |
| |
| |
|
| Total Return (%) | | 6.24 | | 3.59 | | 8.64 | | .64 | | 13.14 |
| |
| |
| |
| |
| |
|
| Ratios/Supplemental Data (%): | | | | | | | | | | |
| Ratio of total expenses to average net assets .89 | | .90 | | .90 | | .86 | | .94 |
| Ratio of net expenses to average net assets | | .80 | | .80 | | .82 | | .70 | | .67 |
| Ratio of net investment income | | | | | | | | | | |
| to average net assets | | 3.63 | | 3.56 | | 4.34 | | 5.58 | | 6.44 |
| Portfolio Turnover Rate | | 644.23e | | 801.49e | | 838.50 | | 474.20 | | 555.90 |
| |
| |
| |
| |
| |
|
| Net Assets, end of period ($ x 1,000) | | 531,232 | | 677,228 | | 831,818 | | 738,618 | | 359,114 |
| a | | As of August 1, 2003, the fund has adopted the method of accounting for interim payments on swap contracts in |
| | | accordance with Financial Accounting Standards Board Statement No. 133.These interim payments are reflected |
| | | within net realized and unrealized gain (loss) on swap contracts, however, prior to August 1, 2003, these interim |
| | | payments were reflected within interest income/expense in the Statement of Operations.The effect of this change for |
| | | the fiscal year ended July 31, 2004, was to increase net investment income per share by $.01, decrease net realized |
| | | and unrealized gain (loss) on investments per share by $.01 and increase the ratio of net investment income to |
| | | average net assets from 3.51% to 3.56%. Per share data and ratios/supplemental data for periods prior to August 1, |
| | | 2003 have not been restated to reflect this change in presentation. |
| b | | As required, effective August 1, 2001, the fund has adopted the provisions of the AICPA Audit and Accounting |
| | | Guide for Investment Companies and began accreting discount or amortizing premium on fixed income securities on a |
| | | scientific basis and including paydown gains and losses in interest income.The effect of these changes for the period |
| | | ended July 31, 2002 was to decrease net investment income per share by $.04, increase net realized and unrealized |
| | | gain (loss) on investments per share by $.04 and decrease the ratio of net investment income to average net assets |
| | | from 5.90% to 5.58%. Per share data and ratios/supplemental data for periods prior to August 1, 2001 have not |
| | | been restated to reflect these changes in presentation. |
| c | | Based on average shares outstanding at each month end. |
| d | | In addition to the net realized and unrealized gain on investments as shown in the Statement of Operations, this |
| | | amount includes a decrease in net asset value per share resulting from the timing of issuances and redemptions of |
| | | shares in relation to fluctuating market values for the fund’s investments. |
| e | | The portfolio turnover rates excluding mortgage dollar roll transactions for the periods ended July 31, 2005 and |
| | | July 31, 2004, were 521.83% and 718.14%, respectively. |
| |
| See notes to financial statements. The Fund 27 |
| | FINANCIAL HIGHLIGHTS (continued)
|
| | | | | Year Ended July 31, | | |
| |
| |
| |
|
| Institutional Shares | | 2005 | | 2004 a | | 2003 | | 2002 b | | 2001 c |
| |
| |
| |
| |
| |
|
| Per Share Data ($): | | | | | | | | | | |
| Net asset value, beginning of period | | 12.52 | | 12.85 | | 12.41 | | 13.22 | | 13.08 |
| Investment Operations: | | | | | | | | | | |
| Investment income—net | | .51d | | .49d | | .63d | | .76d | | .14 |
| Net realized and unrealized | | | | | | | | | | |
| gain (loss) on investments | | .30 | | .00e | | .48 | | (.66) | | .14 |
| Total from Investment Operations | | .81 | | .49 | | 1.11 | | .10 | | .28 |
| Distributions: | | | | | | | | | | |
| Dividends from investment income—net | | (.58) | | (.58) | | (.67) | | (.79) | | (.14) |
| Dividends from net realized | | | | | | | | | | |
| gain on investments | | — | | (.24) | | — | | (.12) | | — |
| Total Distributions | | (.58) | | (.82) | | (.67) | | (.91) | | (.14) |
| Net asset value, end of period | | 12.75 | | 12.52 | | 12.85 | | 12.41 | | 13.22 |
| |
| |
| |
| |
| |
|
| Total Return (%) | | 6.40 | | 3.88 | | 9.07 | | .81 | | 12.86f |
| |
| |
| |
| |
| |
|
| Ratios/Supplemental Data (%): | | | | | | | | | | |
| Ratio of total expenses to average net assets | | .55 | | .53 | | .53 | | .53 | | 1.66f |
| Ratio of net expenses to average net assets | | .53 | | .52 | | .50 | | .45 | | .45f |
| Ratio of net investment income | | | | | | | | | | |
| to average net assets | | 3.86 | | 3.85 | | 4.88 | | 5.80 | | 6.56f |
| Portfolio Turnover Rate | | 644.23g | | 801.49g | | 838.50 | | 474.20 | | 555.90 |
| |
| |
| |
| |
| |
|
| Net Assets, end of period ($ x 1,000) | | 27,401 | | 2,850 | | 4,470 | | 7,976 | | 676 |
| a | | As of August 1, 2003, the fund has adopted the method of accounting for interim payments on swap contracts in |
| | | accordance with Financial Accounting Standards Board Statement No. 133.These interim payments are reflected |
| | | within net realized and unrealized gain (loss) on swap contracts, however, prior to August 1, 2003, these interim |
| | | payments were reflected within interest income/expense in the Statement of Operations.The effect of this change for |
| | | the fiscal year ended July 31, 2004, was to increase net investment income per share by less than $.01, decrease net |
| | | realized and unrealized gain (loss) on investments per share by less than $.01 and increase the ratio of net |
| | | investment income to average net assets from 3.80% to 3.85%. Per share data and ratios/supplemental data for |
| | | periods prior to August 1, 2003 have not been restated to reflect this change in presentation. |
| b | | As required, effective August 1, 2001, the fund has adopted the provisions of the AICPA Audit and Accounting |
| | | Guide for Investment Companies and began accreting discount or amortizing premium on fixed income securities on |
| | | scientific basis and including paydown gains and losses in interest income.The effect of these changes for the period |
| | | ended July 31, 2002 was to decrease net investment income per share by $.04, increase net realized and unrealized |
| | | gain (loss) on investments per share by $.04 and decrease the ratio of net investment income to average net assets |
| | | from 6.12% to 5.80%. Per share data and ratios/supplemental data for periods prior to August 1, 2001 have not |
| | | been restated to reflect these changes in presentation. |
| c | | The fund commenced offering Institutional shares on May 31, 2001. |
| d | | Based on average shares outstanding at each month end. |
| e | | Amount represents less than $.01 per share. |
| f | | Annualized. |
| g | | The portfolio turnover rates excluding mortgage dollar roll transactions for the periods ended July 31, 2005 and |
| | | July 31, 2004, were 521.83% and 718.14%, respectively. |
| See notes to financial statements. |
28
NOTES TO FINANCIAL STATEMENTS
NOTE 1—Significant Accounting Policies:
Dreyfus Intermediate Term Income Fund (the “fund”) is a separate diversified series of Dreyfus Investment Grade Funds, Inc. (the “Company”) which is registered under the Investment Company Act of 1940, as amended (the “Act”), as an open-end management investment company and operates as a series company currently offering five series, including the fund.The fund’s investment objective is to seek to maximize total return, consisting of capital appreciation and current income.The Dreyfus Corporation (the “Manager” or “Dreyfus”) serves as the fund’s investment adviser.The Manager is a wholly-owned subsidiary of Mellon Financial Corporation (“Mellon Financial”).
Dreyfus Service Corporation (the “Distributor”), a wholly-owned subsidiary of the Manager, is the distributor of the fund’s shares which are sold to the public without a sales charge. The fund is authorized to issue 500 million shares of $.001 par value Common Stock in each of the following classes of shares: Investor and Institutional. Investor shares are subject to a shareholder services plan. Other differences between the classes include the services offered to and the expenses borne by each class, the minimum initial investment and certain voting rights. Income, expenses (other than expenses attributable to a specific class), and realized and unrealized gains or losses on investments are allocated to each class of shares based on its relative net assets.
The Company accounts separately for the assets, liabilities and operations of each series. Expenses directly attributable to each series are charged to that series’ operations; expenses which are applicable to all series are allocated among them on a pro rata basis.
The fund’s financial statements are prepared in accordance with U.S. generally accepted accounting principles, which may require the use of management estimates and assumptions. Actual results could differ from those estimates.
NOTES TO FINANCIAL STATEMENTS (continued)
|
The fund enters into contracts that contain a variety of indemnifications. The fund’s maximum exposure under these arrangements is unknown.The fund does not anticipate recognizing any loss related to these arrangements.
(a) Portfolio valuation: Investments in securities (excluding short-term investments (other than U.S. Treasury Bills), financial futures, options, swap transactions and forward currency exchange contracts) are valued each business day by an independent pricing service (the “Service”) approved by the Board of Directors. Investments for which quoted bid prices are readily available and are representative of the bid side of the market in the judgment of the Service are valued at the mean between the quoted bid prices (as obtained by the Service from dealers in such securities) and asked prices (as calculated by the Service based upon its evaluation of the market for such securities). Other investments (which constitute a majority of the portfolio securities) are valued as determined by the Service, based on methods which include consideration of: yields or prices of securities of comparable quality, coupon, maturity and type; indications as to values from dealers; and general market conditions. Securities for which there are no such valuations are valued at fair value as determined in good faith under the direction of the Board of Directors. Restricted securities, as well as securities or other assets for which recent market quotations are not readily available, that are not valued by a pricing service approved by the Board of Directors, or determined by the fund not to reflect accurately fair value (such as when an event occurs after the close of the exchange on which the security is principally traded and that is determined by the fund to have changed the value of the security), are valued at fair value as determined in good faith under the direction of the Board of Directors.The factors that may be considered when fair valuing a security include fundamental analytical data, the nature and duration of restrictions on disposition, an evaluation of the forces that influence the market in which the securities are purchased and sold and public trading in similar securities of the issuer or comparable issuers. Short-term investments, excluding U.S.Treasury Bills, are car-
ried at amortized cost, which approximates value. Investments in registered investment companies are valued at their net asset value. Financial futures and options, which are traded on an exchange, are valued at the last sales price on the securities exchange on which such securities are primarily traded or at the last sales price on the national securities market on each business day. Options traded over-the-counter are priced at the mean between the bid and the asked price. Swap transactions are valued daily based upon future cash flows and other factors such as interest rates and underlying securities. Investments denominated in foreign currencies are translated to U.S. dollars at the prevailing rates of exchange. Forward currency exchange contracts are valued at the forward rate.
(b) Foreign currency transactions: The fund does not isolate that portion of the results of operations resulting from changes in foreign exchange rates on investments from the fluctuations arising from changes in market prices of securities held. Such fluctuations are included with the net realized and unrealized gain or loss on investments.
Net realized foreign exchange gains or losses arise from sales and maturities of short-term securities, sales of foreign currencies, currency gains or losses realized on securities transactions and the difference between the amounts of dividends, interest, and foreign withholding taxes recorded on the fund’s books and the U.S. dollar equivalent of the amounts actually received or paid. Net unrealized foreign exchange gains and losses arise from changes in the value of assets and liabilities other than investments in securities, resulting from changes in exchange rates. Such gains and losses are included with net realized and unrealized gain or loss on investments.
(c) Securities transactions and investment income: Securities transactions are recorded on a trade date basis. Realized gain and loss from securities transactions are recorded on the identified cost basis. Dividend income is recognized on the ex-dividend date and interest income, including, where applicable, accretion of discount and amortization of premium on investments, is recognized on the accrual basis.
NOTES TO FINANCIAL STATEMENTS (continued)
|
The fund has an arrangement with the custodian bank whereby the fund receives earnings credits from the custodian when positive cash balances are maintained, which are used to offset custody fees. For financial reporting purposes, the fund includes net earnings credits, if any, as an expense offset in the Statement of Operations.
Pursuant to a securities lending agreement with Mellon Bank, N.A., an affiliate of the Manager, the fund may lend securities to qualified institutions.At origination, all loans are secured by collateral of at least 102% of the value of U.S. securities loaned and 105% of the value of foreign securities loaned. Collateral equivalent to at least 100% of the market value of securities on loan will be maintained at all times. Cash collateral is invested in certain money market mutual funds managed by the Manager. The fund will be entitled to receive all income on securities loaned, in addition to income earned as a result of the lending transaction. Although each security loaned is fully collateralized, the fund would bear the risk of delay in recovery of, or loss of rights in, the securities loaned should a borrower fail to return the securities in a timely manner.
(d) Affiliated issuers: Investments in other investment companies advised by the Manager are defined as “affiliated” in the Act.
(e) Dividends to shareholders: It is the policy of the fund to declare dividends daily from investment income-net. Such dividends are paid monthly. Dividends from net realized capital gain, if any, are normally declared and paid annually, but the fund may make distributions on a more frequent basis to comply with the distribution requirements of the Internal Revenue Code of 1986, as amended (the “Code”).To the extent that net realized capital gain can be offset by capital loss carryovers, it is the policy of the fund not to distribute such gain.Income and capital gain distributions are determined in accordance with income tax regulations, which may differ from U.S. generally accepted accounting principles.
(f) Federal income taxes: It is the policy of the fund to continue to qualify as a regulated investment company, if such qualification is in the best interests of its shareholders, by complying with the applicable pro-
visions of the Code, and to make distributions of taxable income sufficient to relieve it from substantially all federal income and excise taxes.
At July 31, 2005, the components of accumulated earnings on a tax basis were as follows:undistributed ordinary income $5,953,824,accumulated capital losses $8,856,845 and unrealized depreciation $4,232,561.
The fund has an unused capital loss carryover available to be applied against future net securities profits, if any, realized subsequent to July 31, 2005. If not applied, $3,468,128 of the carryover expires in fiscal 2012 and $5,388,717 expires in fiscal 2013.
The tax character of distributions paid to shareholders during the fiscal periods ended July 31, 2005 and July 31, 2004, were as follows: ordinary income $26,502,750 and $47,560,976, respectively.
During the period ended July 31, 2005, as a result of permanent book to tax differences primarily due to the tax treatment for amortization of premiums, paydown gains and losses on mortgage backed securities, sales treatment for treasury inflation protected securities, and foreign currency transactions, the fund increased accumulated undistributed investment income-net by $8,126,538, decreased accumulated net realized gain (loss) on investments by $8,529,798 and increased paid-in capital by $403,260. Net assets were not affected by this reclassification.
NOTE 2—Bank Lines of Credit:
The fund may borrow up to $10 million for leveraging purposes under a short-term unsecured line of credit and participates with other Dreyfus-managed funds in a $100 million unsecured line of credit primarily to be utilized for temporary or emergency purposes, including the financing of redemptions. Interest is charged to the fund based on prevailing market rates in effect at the time of borrowings.
The average daily amount of borrowings outstanding under the leveraging arrangement during the period ended July 31, 2005 was approximately $82,200, with a related weighted average annualized interest rate of 2.52% ..
NOTES TO FINANCIAL STATEMENTS (continued)
|
NOTE 3—Management Fee and Other Transactions With Affiliates:
(a) Pursuant to a management agreement (“Agreement”) with the Manager, the management fee is computed at the annual rate of .45 of 1% of the value of the fund’s average daily net assets and is payable monthly. The Manager has undertaken through July 31, 2005 to reduce the management fee paid by the fund, if the fund’s aggregate expenses, exclusive of taxes, brokerage fees, interest on borrowings, Shareholder Service Plan fees and extraordinary expenses exceed .55 of 1% of the value of the fund’s average daily net assets.The reduction in management fee, pursuant to the undertaking, amounted to $527,393 during the period ended July 31, 2005.
(b) Under the Investor Shares Shareholder Services Plan, the fund pays the Distributor at an annual rate of .25 of 1% of the value of Investor Shares average daily net assets for the provision of certain services.The services provided may include personal services relating to shareholder accounts, such as answering shareholder inquiries regarding the fund and providing reports and other information, and services related to the maintenance of shareholder accounts. The Distributor may make payments to Service Agents (a securities dealer, financial institution or other industry professional) in respect of these services. The Distributor determines the amounts to be paid to Service Agents. During the period ended July 31, 2005, Investor Shares were charged $1,474,799 pursuant to the Shareholder Services Plan.
The fund compensates Dreyfus Transfer, Inc., a wholly-owned subsidiary of the Manager, under a transfer agency agreement for providing personnel and facilities to perform transfer agency services for the fund. During the period ended July 31, 2005, the fund was charged $171,382 pursuant to the transfer agency agreement.
The fund compensates Mellon Bank, N.A., an affiliate of the Manager, under a custody agreement for providing custodial services for the fund. During the period ended July 31, 2005, the fund was charged $162,545 pursuant to the custody agreement.
During the period ended July 31, 2005, the fund was charged $2,308 for services performed by the Chief Compliance Officer.
The components of Due to The Dreyfus Corporation and affiliates in the Statement of Assets and Liabilities consist of: management fees $214,583, shareholder services plan fees $113,370, custodian fees $34,800, chief compliance officer fees $2,308 and transfer agency per account fees $32,430, which are offset against an expense reimbursement currently in effect in the amount of $35,579.
(c) Each Board member also serves as a Board member of other funds within the Dreyfus complex. Annual retainer fees and attendance fees are allocated to each fund based on net assets.
(d) Pursuant to an exemptive order from the Securities and Exchange Commission, the fund may invest its available cash balances in affiliated money market mutual funds. Management fees of the underlying money market mutual funds have been waived by the Manager.
NOTE 4—Securities Transactions:
The aggregate amount of purchases and sales (including paydowns) of investment securities, excluding short-term securities, option transactions, financial futures, forward currency exchange contracts and swap transactions, during the period ended July 31, 2005, amounted to $4,114,875,734 and $4,070,919,024, respectively, of which $771,806,388 in purchases and $773,444,884 in sales were from dollar roll transactions.
A mortgage dollar roll transaction involves a sale by the fund of mortgage related securities that it holds with an agreement by the fund to repurchase similar securities at an agreed upon price and date. The securities purchased will bear the same interest rate as those sold, but generally will be collateralized by pools of mortgages with different prepayment histories than those securities sold.
The fund may purchase and write (sell) put and call options in order to gain exposure to or to protect against changes in the market.
NOTES TO FINANCIAL STATEMENTS (continued)
|
As a writer of call options, the fund receives a premium at the outset and then bears the market risk of unfavorable changes in the price of the financial instrument underlying the option. Generally, the fund would incur a gain, to the extent of the premium, if the price of the underlying financial instrument decreases between the date the option is written and the date on which the option is terminated. Generally, the fund would realize a loss, if the price of the financial instrument increases between those dates.
As a writer of put options, the fund receives a premium at the outset and then bears the market risk of unfavorable changes in the price of the financial instrument underlying the option. Generally, the fund would incur a gain, to the extent of the premium, if the price of the underlying financial instrument increases between the date the option is written and the date on which the option is terminated. Generally, the fund would realize a loss, if the price of the financial instrument decreases between those dates.
The following summarizes the fund’s call/put options written for the period ended July 31, 2005:
| | | Face Amount | | | | Options Terminated |
| | | | | |
|
| | | Covered by | | Premiums | | | | Net Realized |
| Options Written: | | Contracts ($) | | Received ($) | | Cost ($) | | Gain/(Loss) ($) |
| |
| |
| |
| |
|
| Contracts outstanding | | | | | | | | |
| July 31, 2004 | | 4,000,000 | | 26,000 | | | | |
| Contracts written | | 184,405,000 | | 1,002,239 | | | | |
| Contracts terminated: | | | | | | | | |
| Closed | | 71,290,000 | | 476,376 | | 536,267 | | (59,891) |
| Exercised | | 8,760,000 | | 28,044 | | 28,044 | | — |
| Expired | | 35,515,000 | | 204,272 | | — | | 204,272 |
| Total contracts | | | | | | | | |
| terminated | | 115,565,000 | | 708,692 | | 564,311 | | 144,381 |
| Contracts outstanding | | | | | | |
| July 31, 2005 | | 72,840,000 | | 319,547 | | | | |
The fund may invest in financial futures contracts in order to gain exposure to or protect against changes in the market.The fund is exposed to market risk as a result of changes in the value of the underlying financial instruments. Investments in financial futures require the fund to “mark to
market” on a daily basis, which reflects the change in the market value of the contracts at the close of each day’s trading.Typically, variation margin payments are received or made to reflect daily unrealized gains or losses. When the contracts are closed, the fund recognizes a realized gain or loss. These investments require initial margin deposits with a broker, which consist of cash or cash equivalents.The amount of these deposits is determined by the exchange or Board of Trade on which the contract is traded and is subject to change. Contracts open at July 31, 2005 are set forth in the Statement of Financial Futures.
The fund enters into forward currency exchange contracts in order to hedge its exposure to changes in foreign currency exchange rates on its foreign portfolio holdings and to settle foreign currency transac-tions.When executing forward currency exchange contracts, the fund is obligated to buy or sell a foreign currency at a specified rate on a certain date in the future. With respect to sales of forward currency exchange contracts, the fund would incur a loss if the value of the contract increases between the date the forward contract is opened and the date the forward contract is closed.The fund realizes a gain if the value of the contract decreases between those dates. With respect to purchases of forward currency exchange contracts, the fund would incur a loss if the value of the contract decreases between the date the forward contract is opened and the date the forward contract is closed. The fund realizes a gain if the value of the contract increases between those dates. The fund is also exposed to credit risk associated with counter party nonperformance on these forward currency exchange contracts which is typically limited to the unrealized gain on each open contract. The following summarizes open forward currency exchange contracts at July 31, 2005:
| | | Foreign | | | | | | |
| Forward Currency | | Currency | | | | | | Unrealized |
| Exchange Contracts | | Amounts | | Proceeds ($) | | Value ($) | | Appreciation ($) |
| |
| |
| |
| |
|
| Sales; | | | | | | | | |
| Euro, | | | | | | | | |
| expiring 9/21/2005 | | 13,950,000 | | 16,958,178 | | 16,956,225 | | 1,953 |
NOTES TO FINANCIAL STATEMENTS (continued)
|
The fund may enter into swap agreements to exchange the interest rate on, or return generated by, one nominal instrument for the return generated by another nominal instrument.
The fund accounts for swap contracts in accordance with Financial Accounting Standards Board Statement No. 133.The fund accrues for the interim payments on swap contracts on a daily basis, with the net amount recorded within unrealized appreciation (depreciation) of swap contracts in the Statement of Assets and Liabilities. Once the interim payments are settled in cash, the net amount is recorded as realized gain (loss) on swaps, in addition to realized gain (loss) recorded upon the termination of swaps contracts in the Statement of Operations. Fluctuations in the value of swap contracts are recorded as a component of net change in unrealized appreciation (depreciation) on investments.
Credit default swaps involve commitments to pay a fixed interest rate in exchange for payment if a credit event affecting a third party (the referenced company) occurs. Credit events may include a failure to pay interest or principal, bankruptcy, or restructuring. For those credit default swaps in which the portfolio is receiving a fixed rate, the portfolio is providing credit protection on the underlying instrument.The following summarizes open credit default swaps entered into by the fund at July 31, 2005:
| | | | | Unrealized |
| | | | | Appreciation |
| Notional Amount ($) | | Description | | (Depreciation) ($) |
| |
| |
|
| 2,850,000 | | Agreement with Morgan Stanley terminating | | 19,222 |
| | | March 20, 2006 to receive a fixed rate of | | |
| | | 1.625% and pay the notional amount as a | | |
| | | result of interest payment default totaling | | |
| | | $1,000,000 or principal payment default of | | |
| | | $10,000,000 on Republic of Argentina, | | |
| | | 3.01%, 8/3/2012 | | |
| 2,813,000 | | Agreement with Bear Stearns terminating | | 38,216 |
| | | June 20, 2008 to receive a fixed rate of | | |
| | | 2.7% and pay the notional amount | | |
| | | as a result of interest payment default | | |
| | | totaling $1,000,000 or principal payment | | |
| | | default of $10,000,000 on Republic of | | |
| | | Argentina, 8.28%, 12/31/2033 | | |
| | | | | Unrealized |
| | | | | Appreciation |
| Notional Amount ($) | | Description | | (Depreciation) ($) |
| |
| |
|
| 2,813,000 | | Agreement with UBS terminating | | (30,033) |
| | | June 20, 2010 to pay a fixed rate of .52% | | |
| and receive the notional amount as a result of |
| interest payment default totaling $1,000,000 |
| or principal payment default of $10,000,000 |
| | | on Alcoa, 6.5%, 6/1/2011 | | |
| 2,166,000 | | Agreement with Bear Stearns terminating | | 16,409 |
| June 20, 2010 to receive a fixed rate of 1.2% |
| | | and pay the notional amount as a result of | | |
| interest payment default totaling $1,000,000 |
| or principal payment default of $10,000,000 |
| | | on Altria, 7%, 11/4/2013 | | |
| 1,341,000 | | Agreement with Bear Stearns terminating | | 1,623 |
| June 20, 2010 to receive a fixed rate of .27% |
| | | and pay the notional amount as a result of | | |
| interest payment default totaling $1,000,000 |
| or principal payment default of $10,000,000 |
| on Berkshire Hathaway, 4.625%, 10/15/2013 |
| 2,298,000 | | Agreement with UBS terminating | | 5,771 |
| June 20, 2010 to receive a fixed rate of .28% |
| | | and pay the notional amount as a result of | | |
| interest payment default totaling $1,000,000 |
| or principal payment default of $10,000,000 |
| | | on Berkshire Hathaway, 4.85%, 1/15/2015 | | |
| 2,014,000 | | Agreement with Bear Stearns terminating | | 7,901 |
| June 20, 2010 to receive a fixed rate of .33% |
| | | and pay the notional amount as a result of | | |
| interest payment default totaling $1,000,000 |
| or principal payment default of $10,000,000 |
| on Berkshire Hathaway, 4.625%, 10/15/2013 |
| 1,469,000 | | Agreement with UBS terminating | | (45,406) |
| March 20, 2008 to pay a fixed rate of 3.92% |
| and receive the notional amount as a result of |
| interest payment default totaling $1,000,000 |
| or principal payment default of $10,000,000 |
| | | on Bombardier, 6.75%, 5/1/2012 | | |
| 626,000 | | Agreement with Morgan Stanley terminating | | (1,357) |
| September 20, 2015 to pay a fixed rate of 1.15% |
| and receive the notional amount as a result of |
| interest payment default totaling $1,000,000 |
| or principal payment default of $10,000,000 |
| | | on CenturyTel, 7.875%, 8/15/2012 | | |
| 2,161,000 | | Agreement with Citibank terminating | | (17,003) |
| September 20, 2015 to pay a fixed rate of 1.16% |
| and receive the notional amount as a result of |
| interest payment default totaling $1,000,000 |
| or principal payment default of $10,000,000 |
| | | on CenturyTel, 7.875%, 8/15/2012 | | |
The Fund 39
NOTES TO FINANCIAL STATEMENTS (continued)
|
| | | | | Unrealized |
| | | | | Appreciation |
| Notional Amount ($) | | Description | | (Depreciation) ($) |
| |
| |
|
| 2,813,000 | | Agreement with UBS terminating | | (2,140) |
| | | June 20, 2010 to pay a fixed rate of .29% | | |
| and receive the notional amount as a result of |
| interest payment default totaling $1,000,000 |
| or principal payment default of $10,000,000 |
| | | on ConocoPhillips, 4.75%, 10/15/2012 | | |
| 2,560,000 | | Agreement with Morgan Stanley terminating | | (46,231) |
| | | June 20, 2010 to pay a fixed rate of .685% | | |
| and receive the notional amount as a result of |
| interest payment default totaling $1,000,000 |
| or principal payment default of $10,000,000 |
| | | on Dow Jones CDX.NA.IG.4 | | |
| 2,580,000 | | Agreement with Citigroup terminating | | (40,983) |
| | | June 20, 2010 to pay a fixed rate of .685% | | |
| and receive the notional amount as a result of |
| interest payment default totaling $1,000,000 |
| or principal payment default of $10,000,000 |
| | | on Dow Jones CDX.NA.IG.4 | | |
| 3,918,000 | | Agreement with Citigroup terminating | | (65,759) |
| | | June 20, 2010 to pay a fixed rate of .705% | | |
| and receive the notional amount as a result of |
| interest payment default totaling $1,000,000 |
| or principal payment default of $10,000,000 |
| | | on Dow Jones CDX.NA.IG.4 | | |
| 2,826,000 | | Agreement with Citigroup terminating | | 92,019 |
| June 20, 2008 to receive a fixed rate of 4% |
| | | and pay the notional amount as a result of | | |
| interest payment default totaling $1,000,000 |
| or principal payment default of $10,000,000 |
| | | on Ford Motor, 7%, 10/1/2013 | | |
| 1,943,000 | | Agreement with Citigroup terminating | | (96,677) |
| | | June 20, 2010 to pay a fixed rate of 4.5% | | |
| and receive the notional amount as a result of |
| interest payment default totaling $1,000,000 |
| or principal payment default of $10,000,000 |
| | | on Ford Motor, 7%, 10/1/2013 | | |
| 2,802,000 | | Agreement with Bear Stearns terminating | | 55,400 |
| June 20, 2006 to receive a fixed rate of 2.9% |
| | | and pay the notional amount as a result of | | |
| interest payment default totaling $1,000,000 |
| or principal payment default of $10,000,000 |
| | | on GMAC, 6.875%, 8/28/2012 | | |
| 1,109,000 | | Agreement with Morgan Stanley terminating | | 33,565 |
| June 20, 2006 to receive a fixed rate of 4.15% |
| | | and pay the notional amount as a result of | | |
| interest payment default totaling $1,000,000 |
| or principal payment default of $10,000,000 |
| | | on GMAC, 6.875%, 8/28/2012 | | |
| | | | | Unrealized |
| | | | | Appreciation |
| Notional Amount ($) | | Description | | (Depreciation) ($) |
| |
| |
|
| 4,450,000 | | Agreement with Bear Stearns terminating | | 6,578 |
| March 20, 2015 to pay a fixed rate of .155% |
| and receive the notional amount as a result of |
| interest payment default totaling $1,000,000 |
| or principal payment default of $10,000,000 |
| | | on HSBC Bank, 3.61%, 4/12/2006 | | |
| 2,828,000 | | Agreement with UBS terminating | | 40,082 |
| June 20, 2010 to receive a fixed rate of .78% |
| | | and pay the notional amount as a result of | | |
| interest payment default totaling $1,000,000 |
| or principal payment default of $10,000,000 |
| | | on MBIA, 6.625%, 10/1/2028 | | |
| 5,618,000 | | Agreement with UBS terminating | | (78,037) |
| | | June 20, 2015 to pay a fixed rate of .62% | | |
| and receive the notional amount as a result of |
| interest payment default totaling $1,000,000 |
| or principal payment default of $10,000,000 |
| | | on Morgan Stanley, 6.6%, 4/1/2012 | | |
| 1,317,000 | | Agreement with Bear Stearns terminating | | (4,094) |
| | | June 20, 2010 to pay a fixed rate of .4% | | |
| and receive the notional amount as a result of |
| interest payment default totaling $1,000,000 |
| or principal payment default of $10,000,000 |
| | | on Nucor, 4.875%, 10/1/2012 | | |
| 1,341,000 | | Agreement with JP Morgan terminating | | 1,904 |
| | | June 20, 2010 to pay a fixed rate of .30% | | |
| and receive the notional amount as a result of |
| interest payment default totaling $1,000,000 |
| or principal payment default of $10,000,000 |
| | | on St. Paul Cos., 8.125%, 4/15/2010 | | |
| 2,298,000 | | Agreement with UBS terminating | | (789) |
| | | June 20, 2010 to pay a fixed rate of .31% | | |
| and receive the notional amount as a result of |
| interest payment default totaling $1,000,000 |
| or principal payment default of $10,000,000 |
| | | on St. Paul Cos., 8.125%, 4/15/2010 | | |
| 2,014,000 | | Agreement with Bear Stearns terminating | | (4,429) |
| | | June 20, 2010 to pay a fixed rate of .37% | | |
| and receive the notional amount as a result of |
| interest payment default totaling $1,000,000 |
| or principal payment default of $10,000,000 |
| | | on St. Paul Cos., 5.0%, 3/15/2013 | | |
| 2,916,000 | | Agreement with Bear Stearns terminating | | 638 |
| March 20, 2010 to receive a fixed rate of .35% |
| | | and pay the notional amount as a result of | | |
| interest payment default totaling $1,000,000 |
| or principal payment default of $10,000,000 |
| | | on Tyco, 6%, 11/15/2013 | | |
The Fund 41
NOTES TO FINANCIAL STATEMENTS (continued)
|
| | | | | Unrealized |
| | | | | Appreciation |
| Notional Amount ($) | | Description | | (Depreciation) ($) |
| |
| |
|
| 5,195,000 | | Agreement with UBS terminating | | (28,898) |
| March 20, 2015 to receive a fixed rate of .53% |
| | | and pay the notional amount as a result of | | |
| interest payment default totaling $1,000,000 |
| or principal payment default of $10,000,000 |
| | | on Washington Mutual, 4%, 1/15/2009 | | |
| 3,705,000 | | Agreement with Citigroup terminating | | (31,122) |
| March 20, 2015 to receive a fixed rate of .53% |
| | | and pay the notional amount as a result of | | |
| interest payment default totaling $1,000,000 |
| or principal payment default of $10,000,000 |
| | | on Washington Mutual, 4%, 1/15/2009 | | |
| Total | | | | (173,630) |
The fund may enter into interest rate swaps which involve the exchange of commitments to pay and receive interest based on a notional principal amount.The following summarizes open interest rate swaps entered into by the fund at July 31, 2005:
| | | | | Unrealized |
| | | | | Appreciation |
| Notional Amount ($) | | Description | | (Depreciation) ($) |
| |
| |
|
| 28,088,000 | | Interest Rate Swap Agreement with | | (147,583) |
| | | Merrill Lynch terminating May 13, 2008 | | |
| | | to pay 3 month LIBOR and receive a | | |
| | | fixed rate of 4.1725% | | |
| 28,088,000 | | Interest Rate Swap Agreement with | | 78,683 |
| | | Merrill Lynch terminating May 13, 2015 | | |
| | | to pay 3 month LIBOR and receive a | | |
| | | fixed rate of 4.6425% | | |
| Total | | | | (68,900) |
Risks may arise upon entering into these agreements from the potential inability of the counterparties to meet the terms of the agreement and are generally limited to the amount of net payments to be received, if any, at the date of default.
At July 31, 2005, the cost of investments for federal income tax purposes was $681,379,245; accordingly, accumulated net unrealized depreciation on investments was $4,266,962, consisting of $3,274,945 gross unrealized appreciation and $7,541,907 gross unrealized depreciation.
NOTE 5—Legal Matters:
In early 2004, two purported class and derivative actions were filed against Mellon Financial, Mellon Bank, N.A., Dreyfus, Founders Asset Management LLC, and certain directors of the Dreyfus Funds and the Dreyfus Founders Funds (together, the “Funds”) in the United States District Court for the Western District of Pennsylvania. In September 2004, plaintiffs served a Consolidated Amended Complaint (the “Amended Complaint”) on behalf of a purported class of all persons who acquired interests in any of the Funds between January 30, 1999 and November 17, 2003, and derivatively on behalf of the Funds.The Amended Complaint in the newly styled In re Dreyfus Mutual Funds Fee Litigation also named the Distributor, Premier Mutual Fund Services, Inc. and two additional Fund directors as defendants and alleges violations of the Investment Company Act of 1940, the Investment Advisers Act of 1940, the Pennsylvania Unfair Trade Practices and Consumer Protection Law and common-law claims. Plaintiffs seek to recover allegedly improper and excessive Rule 12b-1 and advisory fees allegedly charged to the Funds for marketing and distribution services. More specifically, plaintiffs claim, among other things, that 12b-1 fees and directed brokerage were improperly used to pay brokers to recommend the Funds over other funds, and that such payments were not disclosed to investors. In addition, plaintiffs assert that economies of scale and soft-dollar benefits were not passed on to the Funds. Plaintiffs further allege that 12b-1 fees were improperly charged to certain of the Funds that were closed to new investors.The Amended Complaint seeks compensatory and punitive damages, rescission of the advisory contracts, and an accounting and restitution of any unlawful fees, as well as an award of attorneys’ fees and litigation expenses. As noted, some of the claims in this litigation are asserted derivatively on behalf of the Funds that have been named as nominal defendants. With respect to such derivative claims, no relief is sought
NOTES TO FINANCIAL STATEMENTS (continued)
|
against the Funds. Dreyfus believes the allegations to be totally without merit and intends to defend the action vigorously. In November 2004, all named defendants moved to dismiss the Amended Complaint in whole or substantial part. Briefing was completed in May 2005.
Additional lawsuits arising out of these circumstances and presenting similar allegations and requests for relief may be filed against the defendants in the future. Neither Dreyfus nor the Funds believe that any of the pending actions will have a material adverse effect on the Funds or Dreyfus’ ability to perform its contract with the Funds.
REPORT OF INDEPENDENT REGISTERED PUBLIC ACCOUNTING FIRM
Shareholders and Board of Directors Dreyfus Intermediate Term Income Fund
We have audited the accompanying statement of assets and liabilities, including the statements of investments, financial futures and options written, of Dreyfus Intermediate Term Income Fund (one of the funds comprising Dreyfus Investment Grade Funds, Inc.) as of July 31, 2005, and the related statement of operations for the year then ended, the statement of changes in net assets for each of the two years in the period then ended, and financial highlights for each of the periods indicated therein.These financial statements and financial highlights are the responsibility of the Fund’s management. Our responsibility is to express an opinion on these financial statements and financial highlights based on our audits.
We conducted our audits in accordance with the standards of the Public Company Accounting Oversight Board (United States).Those standards require that we plan and perform the audit to obtain reasonable assurance about whether the financial statements and financial highlights are free of material misstatement.We were not engaged to perform an audit of the Fund’s internal control over financial reporting.Our audits included consideration of internal control over financial reporting as a basis for designing audit procedures that are appropriate in the circumstances,but not for the purpose of expressing an opinion on the effectiveness of the Fund’s internal control over financial reporting.Accordingly, we express no such opinion.An audit also includes examining, on a test basis, evidence supporting the amounts and disclosures in the financial statements and financial highlights, assessing the accounting principles used and significant estimates made by management, and evaluating the overall financial statement presentation. Our procedures included verification by examination of securities held by the custodian as of July 31, 2005 and confirmation of securities not held by the custodian by correspondence with others. We believe that our audits provide a reasonable basis for our opinion. In our opinion, the financial statements and financial highlights referred to above present fairly, in all material respects, the financial position of Dreyfus Intermediate Term Income Fund at July 31, 2005, the results of its operations for the year then ended, the changes in its net assets for each of the two years in the period then ended, and the financial highlights for each of the indicated periods, in conformity with U.S. generally accepted accounting principles.

| | New York, New York
September 16, 2005
|
IMPORTANT TAX INFORMATION (Unaudited)
For federal tax purposes the fund hereby designates .60% of the ordinary dividends paid during the fiscal year ended July 31, 2005 as qualifying for the corporate dividends received deduction. Also certain dividends paid by the fund may be subject to a maximum tax rate of 15%, as provided for by the Jobs and Growth Tax Relief Reconciliation Act of 2003. Of the distributions paid during the fiscal year, $178,901 represents the maximum amount that may be considered qualified dividend income. Shareholders will receive notification in January 2006 of the percentage applicable to the preparation of their 2005 income tax returns.
| INFORMATION ABOUT THE REVIEW | | |
| AND APPROVAL OF THE FUND’S | | |
| M A N A G E M E N T A G R E E M E N T | | (Unaudited) |
At separate meetings of the Board of Directors for the Fund held on July 12-13, 2005, the Board considered the re-approval, through its annual renewal date of July 29, 2006, of the Fund’s Management Agreement, pursuant to which the Manager provides the Fund with investment advisory and administrative services. The Board members who are not “interested persons” (as defined in the Investment Company Act of 1940, as amended) of the Fund were assisted in their review by independent legal counsel and met with counsel in executive session separate from representatives of the Manager.
Analysis of Nature, Extent and Quality of Services Provided to the Fund. The Board members received a presentation from representatives of the Manager regarding services provided to the Fund and other funds in the Dreyfus fund complex, and discussed the nature, extent and quality of the services provided to the Fund pursuant to its Management Agreement.The Manager’s representatives reviewed the Fund’s distribution of accounts and the relationships the Manager has with various intermediaries and the different needs of each. The Manager’s representatives noted the diversity of distribution of the Fund as well as among the funds in the Dreyfus complex, and the Manager’s corresponding need for broad, deep, and diverse resources to be able to provide ongoing shareholder services to each of the Fund’s distribution channels.The Board also reviewed the number of shareholder accounts in the Fund, as well as the Fund’s asset size.
The Board members also considered the Manager’s research and portfolio management capabilities and that the Manager also provides oversight of day-to-day Fund operations, including fund accounting and administration and assistance in meeting legal and regulatory requirements. The Board members also considered the Manager’s extensive administrative, accounting and compliance infrastructure.
Comparative Analysis of the Fund’s Performance and Management Fee and Expense Ratio. The Board members reviewed the Fund’s performance, management fee and expense ratios and placed significant emphasis on comparisons to a group of comparable funds and Lipper
INFORMATION ABOUT THE REVIEW AND APPROVAL OF THE FUND’S MANAGEMENT AGREEMENT (Unaudited) ( c o n t i n u e d )
category averages, as applicable. The group of comparable funds was previously approved by the Board for this purpose, and was prepared using a Board-approved selection methodology that was based, in part, on selecting non-affiliated funds reported in the same Lipper category as the Fund.The Board members discussed the results of the comparisons for various periods ended May 31, 2005, and noted that the Fund’s income yield performance for the 1-year, 3-year and 5-year periods was above the comparison group and Lipper category averages for those periods and ranked in the top half of the comparison group and Lipper category for such periods.The Board noted that the Fund’s 1-year total return performance was above the comparison group and Lipper category averages and ranked in the top half of the comparison group and Lipper category, and that the Fund’s total return performance for the 3-year and 5-year periods was above the Lipper category averages and ranked in the top half of the Lipper category, but it was below the comparison group averages for such periods. It was noted that while the Fund’s year-to-date total return performance was below the Lipper category average and ranked in the bottom half of the comparison group, the Fund’s more recent 3-month total return performance was the same as the Lipper category average and ranked in the top half of the comparison group. The Board members noted that a new portfolio management team for the Fund was appointed in January 2005. The Board members also discussed the Fund’s expense ratio, noting that it was lower than the Lipper category average and that the current fee waiver and expense reimbursement arrangement undertaken by the Manager had caused the Fund’s expense ratio for its Investor shares to be lower than the comparison group average. The Board reviewed the range of management fees in the comparison group, noting that the Fund’s management fee ranked in the top half (i.e., lower than most others).
Representatives of the Manager reviewed with the Board members the fees paid to the Manager or its affiliates by mutual funds managed by the Manager or its affiliates with similar investment objectives, policies and strategies as the Fund (the “Similar Funds”), and by other accounts managed or sub-advised by the Manager or its affiliates with similar invest-
ment objectives, policies and strategies as the Fund (the “Separate Accounts” and, collectively with the Similar Funds, the “Similar Accounts”). The Manager’s representatives explained the nature of the Similar Accounts and the differences, from Dreyfus’ perspective, in management of the Similar Accounts as compared to managing and providing services to the Fund; it was noted that the Similar Funds were mutual funds included in the “intermediate investment grade debt” funds category by Lipper. The Manager’s representatives also reviewed the costs associated with distribution through intermediaries.The Board analyzed the differences in fees paid to the Manager and discussed the relationship of the advisory fees paid in light of the Manager’s performance and the services provided; it was noted that the Similar Funds generally had higher management fees than the fee borne by the Fund. The Board members considered the relevance of the fee information provided for the Similar Accounts managed by the Manager to evaluate the appropriateness and reasonableness of the Fund’s advisory fees.The Board acknowledged that differences in fees paid by the Similar Accounts seemed to be consistent with the services provided.
Analysis of Profitability and Economies of Scale. The Manager’s representatives reviewed the dollar amount of expenses allocated and profit received by the Manager and the method used to determine such expenses and profit.The Board received and considered information prepared by an independent consulting firm regarding Dreyfus’ approach to allocating costs to, and determining the profitability of, individual funds and the entire Dreyfus mutual fund complex. The consulting firm also analyzed where any economies of scale might emerge as assets grow. The Board members evaluated the analysis in light of the relevant circumstances for the Fund, including the decline in Fund assets and the extent to which economies of scale would be realized as the Fund grows and whether fee levels reflect these economies of scale for the benefit of Fund investors.The Board members also considered potential benefits to the Manager from acting as investment adviser and noted that there were no soft dollar arrangements with respect to trading the Fund’s portfolio.
INFORMATION ABOUT THE REVIEW AND APPROVAL OF THE FUND’S MANAGEMENT AGREEMENT (Unaudited) (continued )
It was noted that the Board members should consider the Manager’s profitability with respect to the Fund as part of their evaluation of whether the fee under the Management Agreement bears a reasonable relationship to the mix of services provided by the Manager, including the nature, extent and quality of such services and that a discussion of economies of scale are predicated on increasing assets and that, if a fund’s assets had been decreasing, the possibility that the Manager may have realized any economies of scale would be less. It also was noted that the profitability percentage for managing the Fund was within ranges determined by appropriate court cases to be reasonable given the services rendered and given the Fund’s overall performance and generally superior service levels provided. The Board also noted the current fee waiver and expense reimbursement arrangement and its effect on the profitability of the Manager.
At the conclusion of these discussions, each of the Directors expressed the opinion that he or she had been furnished with sufficient information to make an informed business decision with respect to continuation of the Fund’s Management Agreement. Based on their discussions and considerations as described above, the Board made the following conclusions and determinations.
- The Board concluded that the nature, extent and quality of the ser- vices provided by the Manager are adequate and appropriate.
- The Board generally was satisfied with the Fund’s income yield per- formance, and the Fund’s 3-month, 1-year, and 3-year total return performance, as well as with the change in the Fund’s portfolio management team which occurred in January 2005.
- The Board concluded that the fee paid by the Fund to the Manager was reasonable in light of comparative performance and expense and advisory fee information, including the Manager’s current undertak- ing to waive or reimburse certain fees and expenses, costs of the ser- vices provided and profits to be realized and benefits derived or to be derived by the Manager from its relationship with the Fund.
- The Board determined that, given the current size and characteris- tics of the Fund, it was difficult to specifically identify any economies of scale that might be realized merely through an increase in the assets of the Fund.The Board noted that it appeared that the benefits of any economies of scale would be appropriately shared with shareholders through increased investment in fund management and administration resources.
The Board members considered these conclusions and determinations, along with information received on a routine and regular basis throughout the year, and, without any one factor being dispositive, the Board determined that re-approval of the Fund’s Management Agreement was in the best interests of the Fund and its shareholders.
BOARD MEMBERS INFORMATION (Unaudited)
Joseph S. DiMartino (61)
Chairman of the Board (1995)
|
Principal Occupation During Past 5 Years:
• Corporate Director and Trustee
|
Other Board Memberships and Affiliations:
|
- The Muscular Dystrophy Association, Director
- Levcor International, Inc., an apparel fabric processor, Director
- Century Business Services, Inc., a provider of outsourcing functions for small and medium size companies, Director
- The Newark Group, a provider of a national market of paper recovery facilities, paperboard mills and paperboard converting plants, Director
- Azimuth Trust, an institutional asset management firm, Member of Board of Managers and Advisory Board
No. of Portfolios for which Board Member Serves: 193
———————
Clifford L. Alexander, Jr. (71) Board Member (2003)
Principal Occupation During Past 5 Years:
|
- President of Alexander & Associates, Inc., a management consulting firm ( January 1981-present)
- Chairman of the Board of Moody’s Corporation (October 2000-October 2003)
- Chairman of the Board and Chief Executive Officer of The Dun and Bradstreet Corporation (October 1999-September 2000)
Other Board Memberships and Affiliations:
• Mutual of America Life Insurance Company, Director
No. of Portfolios for which Board Member Serves: 66
|
———————
Lucy Wilson Benson (77) Board Member (1994)
Principal Occupation During Past 5 Years:
• President of Benson and Associates, consultants to business and government (1980-present)
Other Board Memberships and Affiliations:
|
- The International Executive Services Corps., Director
- Citizens Network for Foreign Affairs,Vice Chairperson
- Council on Foreign Relations, Member
- Lafayette College Board of Trustees,Trustee Emeritus
- Atlantic Council of the U.S., Director
No. of Portfolios for which Board Member Serves: 40
|
David W. Burke (69)
Board Member (1994)
|
Principal Occupation During Past 5 Years:
• Corporate Director and Trustee
|
Other Board Memberships and Affiliations:
|
- John F. Kennedy Library Foundation, Director
- U.S.S. Constitution Museum, Director
No. of Portfolios for which Board Member Serves: 84
|
Whitney I. Gerard (70)
Board Member (1993)
|
Principal Occupation During Past 5 Years:
• Partner of Chadbourne & Parke LLP
|
No. of Portfolios for which Board Member Serves: 38
|
Arthur A. Hartman (79)
Board Member (1992)
|
Principal Occupation During Past 5 Years:
|
- Chairman of First NIS Regional Fund (ING/Barings Management) and New Russia Fund
- Advisory Council Member to Barings Vostok
Other Board Memberships and Affiliations:
• APCO Associates Inc., Senior Consultant
|
No. of Portfolios for which Board Member Serves: 38
|
George L. Perry (71)
Board Member (1992)
|
Principal Occupation During Past 5 Years:
• Economist and Senior Fellow at Brookings Institution
No. of Portfolios for which Board Member Serves: 38
|
Once elected all Board Members serve for an indefinite term.The address of the Board Members and Officers is in c/o The Dreyfus Corporation, 200 Park Avenue, New York, New York 10166. Additional information about the Board Members is available in the fund’s Statement of Additional Information which can be obtained from Dreyfus free of charge by calling this toll free number: 1-800-554-4611.
OFFICERS OF THE FUND (Unaudited)
STEPHEN E. CANTER, President since March 2000.
Chairman of the Board, Chief Executive Officer and Chief Operating Officer of the Manager, and an officer of 90 investment companies (comprised of 184 portfolios) managed by the Manager. Mr. Canter also is a Board member and, where applicable, an Executive Committee Member of the other investment management subsidiaries of Mellon Financial Corporation, each of which is an affiliate of the Manager. He is 60 years old and has been an employee of the Manager since May 1995.
STEPHEN R. BYERS, Executive Vice President since October 2002.
Chief Investment Officer,Vice Chairman and a director of the Manager, and an officer of 90 investment companies (comprised of 184 portfolios) managed by the Manager. Mr. Byers also is an officer, director or an Executive Committee Member of certain other investment management subsidiaries of Mellon Financial Corporation, each of which is an affiliate of the Manager. He is 51 years old and has been an employee of the Manager since January 2000.
MARK N. JACOBS, Vice President since March 2000.
Executive Vice President, Secretary and General Counsel of the Manager, and an officer of 91 investment companies (comprised of 200 portfolios) managed by the Manager. He is 59 years old and has been an employee of the Manager since June 1977.
MICHAEL A. ROSENBERG, Vice President and Secretary since August 2005.
Associate General Counsel of the Manager, and an officer of 91 investment companies (comprised of 200 portfolios) managed by the Manager. He is 45 years old and has been an employee of the Manager since October 1991.
JAMES BITETTO, Vice President and Assistant Secretary since August 2005.
Assistant General Counsel and Assistant Secretary of the Manager, and an officer of 91 investment companies (comprised of 200 portfolios) managed by the Manager. He is 39 years old and has been an employee of the Manager since December 1996.
JONI LACKS CHARATAN, Vice President and Assistant Secretary since August 2005.
Assistant General Counsel of the Manager, and an officer of 91investment companies (comprised of 200 portfolios) managed by the Manager. She is 49 years old and has been an employee of the Manager since October 1998.
JOSEPH M. CHIOFFI, Vice President and Assistant Secretary since August 2005.
Assistant General Counsel of the Manager, and an officer of 91 investment companies (comprised of 200 portfolios) managed by the Manager. He is 43 years old and has been an employee of the Manager since July 2000.
JANETTE E. FARRAGHER, Vice President and Assistant Secretary since August 2005.
Associate General Counsel of the Manager, and an officer of 91 investment companies (comprised of 200 portfolios) managed by the Manager. She is 42 years old and has been an employee of the Manager since February 1984.
JOHN B. HAMMALIAN, Vice President and Assistant Secretary since August 2005.
Associate General Counsel of the Manager, and an officer of 91 investment companies (comprised of 200 portfolios) managed by the Manager. He is 42 years old and has been an employee of the Manager since February 1991.
ROBERT R. MULLERY, Vice President and Assistant Secretary since August 2005.
Associate General Counsel of the Manager, and an officer of 91 investment companies (comprised of 200 portfolios) managed by the Manager. He is 53 years old and has been an employee of the Manager since May 1986.
JEFF PRUSNOFSKY, Vice President and Assistant Secretary since August 2005.
Associate General Counsel of the Manager, and an officer of 91 investment companies (comprised of 200 portfolios) managed by the Manager. He is 40 years old and has been an employee of the Manager since October 1990.
JAMES WINDELS, Treasurer since November 2001.
Director – Mutual Fund Accounting of the Manager, and an officer of 91 investment companies (comprised of 200 portfolios) managed by the Manager. He is 46 years old and has been an employee of the Manager since April 1985.
GREGORY S. GRUBER, Assistant Treasurer since August 2005.
Senior Accounting Manager – Municipal Bond Funds of the Manager, and an officer of 91 investment companies (comprised of 200 portfolios) managed by the Manager. He is 46 years old and has been an employee of the Manager since August 1981.
ERIK D. NAVILOFF, Assistant Treasurer since December 2002.
Senior Accounting Manager – Taxable Fixed Income Funds of the Manager, and an officer of 91 investment companies (comprised of 200 portfolios) managed by the Manager. He is 37 years old and has been an employee of the Manager since November 1992.
ROBERT ROBOL, Assistant Treasurer since August 2005.
Senior Accounting Manager – Money Market Funds of the Manager, and an officer of 91 investment companies (comprised of 200 portfolios) managed by the Manager. He is 41 years old and has been an employee of the Manager since October 1988.
ROBERT SVAGNA, Assistant Treasurer since August 2005.
Senior Accounting Manager – Equity Funds of the Manager, and an officer of 91 investment companies (comprised of 200 portfolios) managed by the Manager. He is 37 years old and has been an employee of the Manager since November 1990.
KENNETH J. SANDGREN, Assistant Treasurer since November 2001.
Mutual Funds Tax Director of the Manager, and an officer of 91 investment companies (comprised of 200 portfolios) managed by the Manager. He is 50 years old and has been an employee of the Manager since June 1993.
JOSEPH W. CONNOLLY, Chief Compliance Officer since October 2004.
Chief Compliance Officer of the Manager and The Dreyfus Family of Funds (91 investment companies, comprising 200 portfolios). From November 2001 through March 2004, Mr. Connolly was first Vice-President, Mutual Fund Servicing for Mellon Global Securities Services. In that capacity, Mr. Connolly was responsible for managing Mellon’s Custody, Fund Accounting and Fund Administration services to third-party mutual fund clients. He is 48 years old and has served in various capacities with the Manager since 1980, including manager of the firm’s Fund Accounting Department from 1997 through October 2001.
WILLIAM GERMENIS, Anti-Money Laundering Compliance Officer since August 2002.
Vice President and Anti-Money Laundering Compliance Officer of the Distributor, and the Anti-Money Laundering Compliance Officer of 87 investment companies (comprised of 196 portfolios) managed by the Manager. He is 34 years old and has been an employee of the Distributor since October 1998.
NOTES
| For More | | Information |
| |
|
| |
| Dreyfus | | | | Transfer Agent & |
| Intermediate | | | | Dividend Disbursing Agent |
| Term Income Fund | | |
| | | | | Dreyfus Transfer, Inc. |
| 200 Park Avenue | | |
| | | | | 200 Park Avenue |
| New York, NY | | 10166 | | |
| | | | | New York, NY 10166 |
| |
| Manager | | | | Distributor |
| The Dreyfus Corporation | | |
| | | | | Dreyfus Service Corporation |
| 200 Park Avenue | | |
| | | | | 200 Park Avenue |
| New York, NY | | 10166 | | |
| | | | | New York, NY 10166 |
| Custodian | | | | |
| Mellon Bank, N.A. | | |
| One Mellon Bank Center | | |
| Pittsburgh, PA 15258 | | |
| |
|
| |
| |
| Telephone 1-800-645-6561 | | |
| Mail The Dreyfus Family of Funds, 144 Glenn Curtiss Boulevard, Uniondale, NY 11556-0144 |
| E-mail Send your request to info@dreyfus.com |
| Internet Information can be viewed online or downloaded at: http://www.dreyfus.com |
The fund files its complete schedule of portfolio holdings with the Securities and Exchange Commission (“SEC”) for the first and third quarters of each fiscal year on Form N-Q. The fund’s Forms N-Q are available on the SEC’s website at http://www.sec.gov and may be reviewed and copied at the SEC’s Public Reference Room in Washington, DC. Information on the operation of the Public Reference Room may be obtained by calling 1-800-SEC-0330.
A description of the policies and procedures that the fund uses to determine how to vote proxies relating to portfolio securities, and information regarding how the fund voted these proxies for the 12-month period ended June 30, 2005, is available at http://www.dreyfus.com and on the SEC’s website at http://www.sec.gov. The description of the policies and procedures is also available without charge, upon request, by calling 1-800-645-6561.


Save time. Save paper. View your next shareholder report online as soon as it’s available. Log into www.dreyfus.com and sign up for Dreyfus eCommunications. It’s simple and only takes a few minutes.
The views expressed in this report reflect those of the portfolio manager only through the end of the period covered and do not necessarily represent the views of Dreyfus or any other person in the Dreyfus organization. Any such views are subject to change at any time based upon market or other conditions and Dreyfus disclaims any responsibility to update such views.These views may not be relied on as investment advice and, because investment decisions for a Dreyfus fund are based on numerous factors, may not be relied on as an indication of trading intent on behalf of any Dreyfus fund.
Not FDIC-Insured • Not Bank-Guaranteed • May Lose Value
| | | Contents |
| |
| | | THE FUND |
| |
|
| 2 | | Letter from the Chairman |
| 3 | | Discussion of Fund Performance |
| 6 | | Fund Performance |
| 7 | | Understanding Your Fund’s Expenses |
| 7 | | Comparing Your Fund’s Expenses |
| | | With Those of Other Funds |
| 8 | | Statement of Investments |
| 9 | | Statement of Financial Futures |
| 10 | | Statement of Assets and Liabilities |
| 11 | | Statement of Operations |
| 12 | | Statement of Changes in Net Assets |
| 14 | | Financial Highlights |
| 16 | | Notes to Financial Statements |
| 25 | | Report of Independent Registered |
| | | Public Accounting Firm |
| 26 | | Important Tax Information |
| 27 | | Information About the Review and Approval |
| | | of the Fund’s Management Agreement |
| 31 | | Board Members Information |
| 33 | | Officers of the Fund |
| | | FOR MORE INFORMATION |
| |
|
| | | Back Cover |
| Dreyfus |
| Inflation Adjusted |
| Securities Fund |
The Fund

LETTER FROM THE CHAIRMAN
We are pleased to present this annual report for Dreyfus Inflation Adjusted Securities Fund, covering the 12-month period from August 1, 2004, through July 31, 2005. Inside, you’ll find valuable information about how the fund was managed during the reporting period, including a discussion with the fund’s primary portfolio manager, Robert Bayston.
The past 12 months proved to be an unusual time for fixed-income securities. Although the Federal Reserve Board continued to raise short-term interest rates, yield differences between long- and short-term securities remained relatively narrow for most of the reporting period — contrary to historical norms. Strong demand from domestic and foreign investors, along with mild inflation concerns, helped support prices of U.S.Treasury securities. Corporate bonds also fared well during the reporting period generally due to stronger balance sheets, better business conditions and persistently low default rates.
In our view, these and other factors may have created new opportunities and challenges for fixed-income investors. Our economists currently expect the U.S.economy to continue to grow over the foreseeable future without significant new inflationary pressures, potentially setting the stage for market conditions that could affect the various sectors of the U.S. bond market in different ways. As always, we encourage you to talk with your financial advisor about the investment strategies that may best suit your current needs and future goals.
Thank you for your continued confidence and support.


DISCUSSION OF FUND PERFORMANCE
Robert Bayston, Primary Portfolio Manager
How did Dreyfus Inflation Adjusted Securities Fund perform relative to its benchmark?
For the 12-month period ended July 31, 2005, the fund’s Institutional shares achieved a total return of 5.60%, and its Investor shares achieved a total return of 5.39% .1 In comparison, the fund’s benchmark, the Lehman Brothers U.S. Treasury Inflation Protected Securities Index (the “Index”), achieved a total return of 6.05% for the same period.2
Despite a strong U.S. economy, higher short-term interest rates, rising energy prices and occasional signs of mounting inflationary pressures, inflation remained relatively low over the reporting period, and Treasury Inflation Protected Securities (“TIPS”) tended to produce slightly lower returns than nominal U.S.Treasury securities.The fund’s returns lagged its benchmark, primarily because its relatively defensive duration management and yield curve strategies prevented it from participating more fully in market rallies.
What is the fund’s investment approach?
The fund seeks returns that exceed the rate of inflation.To pursue this goal, the fund normally invests at least 80% of its assets in inflation-indexed securities, which are fixed-income securities designed to protect investors from a loss of value due to inflation by periodically adjusting their principal and/or coupon according to the rate of inflation.
The fund invests primarily in high-quality, U.S. dollar-denominated, inflation-indexed securities.To a limited extent, the fund may invest in foreign currency-denominated, inflation-protected securities and other fixed-income securities not adjusted for inflation, including U.S. government bonds and notes, corporate bonds, mortgage-related securities and asset-backed securities. The fund seeks to keep its average effective duration between two and ten years, and the fund may invest in securities with effective or final maturities of any length.
DISCUSSION OF FUND PERFORMANCE (continued)
|
What other factors influenced the fund’s performance?
When the reporting period began, investors had grown concerned that political uncertainty, surging energy prices and rising interest rates might be holding back the U.S. economic expansion. However, these worries were mostly alleviated with the resolution of the presidential election in November 2004 and clearer signs that the economy was on strong footing.
While short-term interest rates rose during the reporting period’s first half, long-term yields fell, lending credence to the view that investors were not concerned about longer-term inflation. In this environment, the fund received stronger contributions from its holdings at the longer end of the maturity range. In addition, the prior portfolio managers maintained the fund’s average effective duration in a range they considered to be in line with that of the fund’s benchmark. These strategies generally supported the fund’s relative performance earlier in the reporting period.
Although higher energy and commodity prices led to greater inflation worries during the winter of 2005, these concerns proved to be relatively short-lived. By the spring, it had become apparent that the effects of high energy and commodity prices were being offset by lower prices in other areas of the economy, such as discounts from automobile manufacturers and apparel retailers. In addition, employment growth proved to be more gradual than some investors had feared, suggesting that wage inflation would remain contained.
After assuming responsibility for the fund’s management on January 31, 2005, we repositioned the fund by reducing its average duration in anticipation of higher interest rates. We also revised the fund’s yield-curve strategy to focus on shorter-term maturities, which we believed would provide greater protection in the event of a declining market in which longer-term yields might rise sharply.These strategies also were designed to keep funds available for higher-yielding securities as short-term interest rates continued to rise. In fact, the Fed implemented four additional rate hikes between February and July 2005, and the overnight federal funds rate reached 3.25% by the end of the reporting period.
However, our shift to these relatively defensive strategies may have been premature. Contrary to historical norms, long-term bond yields continued to fall even as short-term rates rose, and the yield curve continued to flatten through June 2005. Although our strategies worked better during July, when longer-term yields began to rise, it was not enough to fully offset earlier weakness.
What is the fund’s current strategy?
We recently have seen evidence that the U.S. economy continues to grow, inflation remains contained and the Fed can be expected to raise short-term interest rates further. Indeed, shortly after the reporting period’s end, the Fed implemented its tenth consecutive rate hike, and more are expected over the remainder of 2005. Accordingly, we have continued to set the fund’s average duration in a range that is slightly shorter than industry averages.We also have maintained our focus on specific maturity ranges that, in our judgment, should fare relatively well if yield differences widen from today’s historically narrow levels. In our view, these are prudent strategies until the Fed signals that it is ready to move on to the next phase of the credit cycle.
| 1 | | Total return includes reinvestment of dividends and any capital gains paid. Past performance is no |
| | | guarantee of future results. Share price, yield and investment return fluctuate such that upon |
| | | redemption, fund shares may be worth more or less than their original cost. Return figures |
| | | provided reflect the absorption of certain fund expenses by The Dreyfus Corporation pursuant to |
| | | an agreement in effect through January 31, 2006, at which time it may be extended, terminated |
| | | or modified. Had these expenses not been absorbed, the fund’s returns would have been lower. |
| 2 | | SOURCE: LEHMAN BROTHERS INC. — Reflects reinvestment of dividends and, where |
| | | applicable, capital gain distributions.The Lehman Brothers U.S.Treasury Inflation Protected |
| | | Securities Index is a sub-index of the U.S.Treasury component of the Lehman Brothers U.S. |
| | | Government Index. Securities in the Lehman Brothers U.S.Treasury Inflation Protected Securities |
| | | Index are dollar-denominated, non-convertible, publicly issued, fixed-rate, investment-grade |
| | | (Moody’s Baa3 or better) U.S.Treasury inflation notes, with at least one year to final maturity |
| | | and at least $100 million par amount outstanding. |
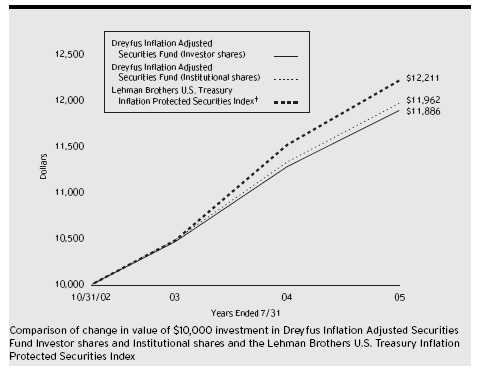
| Average Annual Total Returns as of 7/31/05 | | | | |
| | | Inception | | | | From |
| | | Date | | 1 Year | | Inception |
| |
| |
| |
|
| Investor shares | | 10/31/02 | | 5.39% | | 6.48% |
| Institutional shares | | 10/31/02 | | 5.60% | | 6.73% |
† Source: Lehman Brothers Inc.
Past performance is not predictive of future performance.The fund’s performance shown in the graph and table does not reflect the deduction of taxes that a shareholder would pay on fund distributions or the redemption of fund shares. The above graph compares a $10,000 investment made in Investor and Institutional shares of Dreyfus Inflation Adjusted Securities Fund on 10/31/02 (inception date) to a $10,000 investment made in the Lehman Brothers U.S.Treasury Inflation Protected Securities Index (the “Index”) on that date.All dividends and capital gain distributions are reinvested The fund’s performance shown in the line graph takes into account all applicable fees and expenses.The Index is a sub-index of the U.S.Treasury component of the Lehman Brothers U.S. Government Index. Securities in the Index are dollar-denominated, non-convertible, publicly-issued, fixed-rate, investment-grade (Moody’s Baa3 or better) U.S. Treasury inflation notes, with at least one year to final maturity and at least $100 million par amount outstanding. The Index does not take into account charges, fees and other expenses. Further information relating to fund performance, including expense reimbursements, if applicable, is contained in the Financial Highlights section of the prospectus and elsewhere in this report.
6
U N D E R S TA N D I N G YO U R F U N D ’ S E X P E N S E S ( U n a u d i t e d )
As a mutual fund investor, you pay ongoing expenses, such as management fees and other expenses. Using the information below, you can estimate how these expenses affect your investment and compare them with the expenses of other funds.You also may pay one-time transaction expenses, including sales charges (loads) and redemption fees, which are not shown in this section and would have resulted in higher total expenses. For more information, see your fund’s prospectus or talk to your financial adviser.
Review your fund’s expenses
The table below shows the expenses you would have paid on a $1,000 investment in Dreyfus Inflation Adjusted Securities Fund from February 1, 2005 to July 31, 2005. It also shows how much a $1,000 investment would be worth at the close of the period, assuming actual returns and expenses.
| Expenses and Value of a $1,000 Investment | | |
| assuming actual returns for the six months ended July 31, 2005 | | |
| | | Investor Shares | | Institutional Shares |
| |
| |
|
| Expenses paid per $1,000 † | | $ 2.72 | | $ 1.49 |
| Ending value (after expenses) | | $998.20 | | $998.90 |
COMPARING YOUR FUND’S EXPENSES WITH THOSE OF OTHER FUNDS (Unaudited)
Using the SEC’s method to compare expenses
The Securities and Exchange Commission (SEC) has established guidelines to help investors assess fund expenses. Per these guidelines, the table below shows your fund’s expenses based on a $1,000 investment, assuming a hypothetical 5% annualized return. You can use this information to compare the ongoing expenses (but not transaction expenses or total cost) of investing in the fund with those of other funds.All mutual fund shareholder reports will provide this information to help you make this comparison. Please note that you cannot use this information to estimate your actual ending account balance and expenses paid during the period.
Expenses and Value of a $1,000 Investment assuming a hypothetical 5% annualized return for the six months ended July 31, 2005
| | | Investor Shares | | Institutional Shares |
| |
| |
|
| Expenses paid per $1,000 † | | $ 2.76 | | $ 1.51 |
| Ending value (after expenses) | | $1,022.07 | | $1,023.31 |
† Expenses are equal to the fund’s annualized expense ratio of .55% for Investor shares and .30% for Institutional shares, multiplied by the average account value over the period, multiplied by 181/365 (to reflect the one-half year period).

| | | | | | | Principal | | |
| Bonds and Notes—97.5% | | Amount ($) | | Value ($) |
| |
| |
|
| U.S. Treasury Inflation Protected Securities: | | | | |
| 1.875%, 7/15/2013 | | | | 370,472 a | | 371,528 |
| 2%, 1/15/2014 | | | | 110,474 a | | 111,635 |
| 3%, 7/15/2012 | | | | 1,173,145 a | | 1,264,201 |
| 3.375%, 1/15/2012 | | | | 859,457 a | | 942,011 |
| 3.375%, 4/15/2032 | | | | 41,620 a | | 54,117 |
| 3.5%, 1/15/2011 | | | | 1,044,386 a | | 1,137,197 |
| 3.625%, 4/15/2028 | | | | 490,404 a,b | | 633,136 |
| 3.875%, 4/15/2029 | | | | 543,982 a | | 734,181 |
| 4.25%, 1/15/2010 | | | | 907,068 a | | 1,004,755 |
| Total Bonds and Notes | | | | | | |
| (cost $6,268,950) | | | | | | 6,252,761 |
| |
| |
| |
|
| |
| |
| Other Investment—2.5% | | Shares | | Value ($) |
| |
| |
|
| Registered Investment Company; | | | | |
| Dreyfus Institutional Preferred Plus Money Market Fund | | |
| (cost $162,000) | | | | 162,000 c | | 162,000 |
| |
| |
| |
|
| |
| Total Investments (cost $6,430,950) | | 100.0% | | 6,414,761 |
| |
| Liabilities, Less Cash and Receivables | | (.0%) | | (1,314) |
| |
| Net Assets | | | | 100.0% | | 6,413,447 |
| |
| a | | Principal amount for accrual purposes is periodically adjusted based on changes in the Consumer Price Index. |
| b | | Partially held by a broker as collateral for open financial futures position. | | |
| c | | Investment in affiliated money market mutual fund. | | | | |
| |
| |
| |
|
| |
| |
| |
| |
| Portfolio Summary † | | | | | | |
| |
| | | | | Value (%) | | | | Value (%) |
| |
| |
| |
| |
|
| U.S. Treasury Inflation | | | | Futures Contracts | | (.1) |
| Protected Securities | | 97.5 | | | | |
| Money Market Investments | | 2.5 | | | | 99.9 |
| |
| † | | Based on net assets. | | | | | | |
| See notes to financial statements. | | | | | | |
| STATEMENT OF FINANCIAL FUTURES |
| July 31, 2005 |
| | | | | Market Value | | | | Unrealized |
| | | | | Covered by | | | | (Depreciation) |
| | | Contracts | | Contracts ($) | | Expiration | | at 7/31/2005 ($) |
| |
| |
| |
| |
|
| |
| Financial Futures Long | | | | | | | | |
| U.S. Treasury 5 Year Notes | | 4 | | 428,813 | | September 2005 | | (5,063) |
See notes to financial statements.
|
| STATEMENT OF ASSETS AND LIABILITIES |
| July 31, 2005 |
| | | Cost | | Value |
| |
| |
|
| Assets ($): | | | | |
| Investments in securities—See Statement of Investments: | | |
| Unaffiliated issuers | | 6,268,950 | | 6,252,761 |
| Affiliated issuers | | 162,000 | | 162,000 |
| Dividends and interest receivable | | | | 18,310 |
| Prepaid expenses | | | | 11,651 |
| | | | | 6,444,722 |
| |
| |
|
| Liabilities ($): | | | | |
| Due to The Dreyfus Corporation and affiliates | | 943 |
| Cash overdraft due to Custodian | | | | 840 |
| Payable for futures variation margin—Note 4 | | 1,375 |
| Accrued expenses | | | | 28,117 |
| | | | | 31,275 |
| |
| |
|
| Net Assets ($) | | | | 6,413,447 |
| |
| |
|
| Composition of Net Assets ($): | | | | |
| Paid-in capital | | | | 6,496,648 |
| Accumulated distributions in excess of investment income—net | | (140,266) |
| Accumulated net realized gain (loss) on investments | | 78,317 |
| Accumulated net unrealized appreciation (depreciation) | | |
| on investments [including ($5,063) net unrealized | | |
| (depreciation) on financial futures] | | (21,252) |
| |
|
| Net Assets ($) | | | | 6,413,447 |
| |
| |
|
| |
| |
| Net Asset Value Per Share | | | | |
| | | Investor Shares | | Institutional Shares |
| |
| |
|
| Net Assets ($) | | 3,008,618 | | 3,404,829 |
| Shares Outstanding | | 243,740 | | 275,718 |
| |
| |
|
| Net Asset Value Per Share ($) | | 12.34 | | 12.35 |
See notes to financial statements.
|
| STATEMENT OF OPERATIONS |
| Year Ended July 31, 2005 |
| Investment Income ($): | | |
| Interest | | 159,288 |
| Dividends; | | |
| Affiliated issuers | | 3,383 |
| Total Income | | 162,671 |
| Expenses: | | |
| Management fee—Note 3(a) | | 19,116 |
| Registration fees | | 27,746 |
| Auditing fees | | 27,345 |
| Prospectus and shareholders’ reports | | 11,155 |
| Shareholder servicing costs—Note 3(b) | | 8,930 |
| Custodian fees—Note 3(b) | | 3,925 |
| Directors’ fees and expenses—Note 3(c) | | 580 |
| Legal fees | | 222 |
| Loan commitment fees—Note 2 | | 29 |
| Miscellaneous | | 3,518 |
| Total Expenses | | 102,566 |
| Less—expense reimbursement from | | |
| The Dreyfus Corporation due to undertaking—Note 3(a) | | (76,114) |
| Less—reduction in custody fees due to earnings credits—Note 1(c) | | (14) |
| Net Expenses | | 26,438 |
| Investment Income—Net | | 136,233 |
| |
|
| Realized and Unrealized Gain (Loss) on Investments—Note 4 ($): |
| Net realized gain (loss) on investments and foreign currency transactions | | 285,603 |
| Net realized gain (loss) on forward currency exchange contracts | | (2,452) |
| Net realized gain (loss) on financial futures | | (17,722) |
| Net realized gain (loss) on options transactions | | (120) |
| Net Realized Gain (Loss) | | 265,309 |
| Net unrealized appreciation (depreciation) on investments | | |
| (including $1,968 net unrealized appreciation on financial futures) | | (68,403) |
| Net Realized and Unrealized Gain (Loss) on Investments | | 196,906 |
| Net Increase in Net Assets Resulting from Operations | | 333,139 |
| | See notes to financial statements.
|
STATEMENT OF CHANGES IN NET ASSETS
| | | | | Year Ended July 31, |
| |
| |
|
| | | 2005 | | 2004 |
| |
| |
|
| Operations ($): | | | | |
| Investment income—net | | 136,233 | | 123,159 |
| Net realized gain (loss) on investments | | 265,309 | | (434) |
| Net unrealized appreciation | | | | |
| (depreciation) on investments | | (68,403) | | 304,519 |
| Net Increase (Decrease) in Net Assets | | | | |
| Resulting from Operations | | 333,139 | | 427,244 |
| |
| |
|
| Dividends to Shareholders from ($): | | | | |
| Investment income—net: | | | | |
| Investor Shares | | (133,634) | | (122,713) |
| Institutional Shares | | (158,656) | | (140,904) |
| Net realized gain on investments: | | | | |
| lnvestor Shares | | — | | (181,230) |
| Institutional Shares | | — | | (179,376) |
| Total Dividends | | (292,290) | | (624,223) |
| |
| |
|
| Capital Stock Transactions ($): | | | | |
| Net proceeds from shares sold: | | | | |
| Investor Shares | | 45 | | — |
| Institutional Shares | | 52,126 | | 487,542 |
| Dividends reinvested: | | | | |
| Investor Shares | | 133,634 | | 303,943 |
| Institutional Shares | | 141,075 | | 319,760 |
| Cost of shares redeemed: | | | | |
| Institutional Shares | | (107,668) | | (32,005) |
| Increase (Decrease) in Net Assets | | | | |
| from Capital Stock Transactions | | 219,212 | | 1,079,240 |
| Total Increase (Decrease) in Net Assets | | 260,061 | | 882,261 |
| |
| |
|
| Net Assets ($): | | | | |
| Beginning of Period | | 6,153,386 | | 5,271,125 |
| End of Period | | 6,413,447 | | 6,153,386 |
| Distributions in excess of | | | | |
| investment income—net | | (140,266) | | (73,800) |
| | | | | Year Ended July 31, |
| |
| |
|
| | | 2005 | | 2004 |
| |
| |
|
| Capital Share Transactions: | | | | |
| Investor Shares | | | | |
| Shares sold | | 3 | | — |
| Shares issued for dividends reinvested | | 10,572 | | 24,346 |
| Net Increase (Decrease) in Shares Outstanding | | 10,575 | | 24,346 |
| |
| |
|
| Institutional Shares | | | | |
| Shares sold | | 4,180 | | 39,425 |
| Shares issued for dividends reinvested | | 11,164 | | 25,617 |
| Shares redeemed | | (8,648) | | (2,535) |
| Net Increase (Decrease) in Shares Outstanding | | 6,696 | | 62,507 |
See notes to financial statements.
|
The following table describes the performance for each share class for the fiscal periods indicated.All information (except portfolio turnover rate) reflects financial results for a single fund share.Total return shows how much your investment in the fund would have increased (or decreased) during each period, assuming you had reinvested all dividends and distributions.These figures have been derived from the fund’s financial statements.
| | | | | | | Year Ended July 31, |
| | | |
| |
|
| Investor Shares | | 2005 | | 2004 | | 2003 a |
| |
| |
| |
|
| Per Share Data ($): | | | | | | |
| Net asset value, beginning of period | | 12.25 | | 12.69 | | 12.50 |
| Investment Operations: | | | | | | |
| Investment income—net b | | .25 | | .26 | | .23 |
| Net realized and unrealized | | | | | | |
| gain (loss) on investments | | .40 | | .71 | | .35 |
| Total from Investment Operations | | .65 | | .97 | | .58 |
| Distributions: | | | | | | |
| Dividends from investment income—net | | (.56) | | (.55) | | (.39) |
| Dividends from net realized gain on investments | | — | | (.86) | | — |
| Total Distributions | | (.56) | | (1.41) | | (.39) |
| Net asset value, end of period | | 12.34 | | 12.25 | | 12.69 |
| |
| |
| |
|
| Total Return (%) | | 5.39 | | 7.79 | | 4.63c |
| |
| |
| |
|
| Ratios/Supplemental Data (%): | | | | | | |
| Ratio of total expenses to average net assets | | 1.74 | | 1.80 | | 3.30d |
| Ratio of net expenses to average net assets | | .55 | | .55 | | .55d |
| Ratio of net investment income | | | | | | |
| to average net assets | | 2.00 | | 2.05 | | 2.33d |
| Portfolio Turnover Rate | | 118.91 | | 951.51 | | 1,306.72c |
| |
| |
| |
|
| Net Assets, end of period ($ x 1,000) | | 3,009 | | 2,857 | | 2,650 |
| |
| a | | From October 31, 2002 (commencement of operations) to July 31, 2003. | | | | |
| b | | Based on average shares outstanding at each month end. | | | | |
| c | | Not annualized. | | | | | | |
| d | | Annualized. | | | | | | |
| See notes to financial statements. | | | | | | |
| | | | | | | Year Ended July 31, |
| | | |
| |
|
| Institutional Shares | | 2005 | | 2004 | | 2003 a |
| |
| |
| |
|
| Per Share Data ($): | | | | | | |
| Net asset value, beginning of period | | 12.25 | | 12.69 | | 12.50 |
| Investment Operations: | | | | | | |
| Investment income—net b | | .28 | | .27 | | .25 |
| Net realized and unrealized | | | | | | |
| gain (loss) on investments | | .41 | | .73 | | .35 |
| Total from Investment Operations | | .69 | | 1.00 | | .60 |
| Distributions: | | | | | | |
| Dividends from investment income—net | | (.59) | | (.58) | | (.41) |
| Dividends from net realized gain on investments | | — | | (.86) | | — |
| Total Distributions | | (.59) | | (1.44) | | (.41) |
| Net asset value, end of period | | 12.35 | | 12.25 | | 12.69 |
| |
| |
| |
|
| Total Return (%) | | 5.60 | | 8.06 | | 4.82c |
| |
| |
| |
|
| Ratios/Supplemental Data (%): | | | | | | |
| Ratio of total expenses to average net assets | | 1.49 | | 1.54 | | 3.06d |
| Ratio of net expenses to average net assets | | .30 | | .30 | | .30d |
| Ratio of net investment income | | | | | | |
| to average net assets | | 2.26 | | 2.17 | | 2.58d |
| Portfolio Turnover Rate | | 118.91 | | 951.51 | | 1,306.72c |
| |
| |
| |
|
| Net Assets, end of period ($ x 1,000) | | 3,405 | | 3,296 | | 2,621 |
| |
| a | | From October 31, 2002 (commencement of operations) to July 31, 2003. | | | | |
| b | | Based on average shares outstanding at each month end. | | | | |
| c | | Not annualized. | | | | | | |
| d | | Annualized. | | | | | | |
| See notes to financial statements. | | | | | | |
NOTES TO FINANCIAL STATEMENTS
NOTE 1—Significant Accounting Policies:
Dreyfus Inflation Adjusted Securities Fund (the “fund”) is a separate diversified series of Dreyfus Investment Grade Funds, Inc. (the “Company”) which is registered under the Investment Company Act of 1940, as amended (the “Act”), as an open-end management investment company and operates as a series company currently offering five series, including the fund. The fund’s investment objective is to seek returns that exceed the rate of inflation. The Dreyfus Corporation (the “Manager” or “Dreyfus”) serves as the fund’s investment adviser. The Manager is a wholly-owned subsidiary of Mellon Financial Corporation (“Mellon Financial”). Dreyfus Service Corporation (the “Distributor”), a wholly-owned subsidiary of the Manager, is the distributor of the fund’s shares which are sold to the public without a sales charge.
The fund is authorized to issue 500 million shares of $.001 par value Common Stock in each of the following classes of shares: Investor and Institutional. Investor shares are subject to a shareholder services plan. Other differences between the classes include the services offered to and the expenses borne by each class, the minimum initial investment and certain voting rights. Income, expenses (other than expenses attributable to a specific class), and realized and unrealized gains or losses on investments are allocated to each class of shares based on its relative net assets.
As of July 31, 2005, MBC Investments Corp., an indirect subsidiary of Mellon Financial, held 240,600 Investor shares and 242,138 Institutional shares.
The Company accounts separately for the assets, liabilities and operations of each series. Expenses directly attributable to each series are charged to that series’ operations; expenses which are applicable to all series are allocated among them on a pro rata basis.
The fund’s financial statements are prepared in accordance with U.S. generally accepted accounting principles, which may require the use of management estimates and assumptions. Actual results could differ from those estimates.
The fund enters into contracts that contain a variety of indemnifications. The fund’s maximum exposure under these arrangements is unknown.The fund does not anticipate recognizing any loss related to these arrangements.
(a) Portfolio valuation: Investments in securities (excluding short-term investments (other than U.S. Treasury Bills), financial futures, options, and foreign currency exchange contracts) are valued each business day by an independent pricing service (the “Service”) approved by the Board of Directors. Investments for which quoted bid prices are readily available and are representative of the bid side of the market in the judgment of the Service are valued at the mean between the quoted bid prices (as obtained by the Service from dealers in such securities) and asked prices (as calculated by the Service based upon its evaluation of the market for such securities). Other investments (which constitute a majority of the portfolio securities) are valued as determined by the Service, based on methods which include consideration of: yields or prices of securities of comparable quality, coupon, maturity and type; indications as to values from dealers; and general market conditions. Securities for which there are no such valuations are valued at fair value as determined in good faith under the direction of the Board of Directors. Restricted securities, as well as securities or other assets for which recent market quotations are not readily available, that are not valued by a pricing service approved by the Board of Directors, or are determined by the fund not to reflect accurately fair value (such as when an event occurs after the close of the exchange on which the security is principally traded and that is determined by the fund to have changed the value of the security), are valued at fair value as determined in good faith under the direction of the Board of Directors.The factors that may be considered when fair valuing a security include fundamental analytical data, the nature and duration of restrictions on disposition, an evaluation of the forces that influence the market in which the securities are purchased and sold and public trading in similar securities of the issuer or comparable issuers. Short-term investments, excluding U.S. Treasury Bills, are carried at amortized cost, which
NOTES TO FINANCIAL STATEMENTS (continued)
|
approximates value. Investments in registered investment companies are valued at their net asset value. Financial futures and options, which are traded on an exchange, are valued at the last sales price on the securities exchange on which such securities are primarily traded or at the last sales price on the national securities market on each business day. Options traded over-the-counter are priced at the mean between the bid and asked price. Investments denominated in foreign currencies are translated to U.S. dollars at the prevailing rates of exchange. Forward currency exchange contracts are valued at the forward rate.
(b) Foreign currency transactions: The fund does not isolate that portion of the results of operations resulting from changes in foreign exchange rates on investments from the fluctuations arising from changes in the market prices of securities held. Such fluctuations are included with the net realized and unrealized gain or loss on investments.
Net realized foreign exchange gains or losses arise from sales and maturities of short-term securities, sales of foreign currencies, currency gains or losses realized on securities transactions and the difference between the amounts of dividends, interest and foreign withholding taxes recorded on the fund’s books and the U.S. dollar equivalent of the amounts actually received or paid. Net unrealized foreign exchange gains and losses arise from changes in the value of assets and liabilities other than investments in securities at fiscal year end, resulting from changes in exchange rates. Such gains and losses are included with net realized and unrealized gain or loss on investments.
(c) Securities transactions and investment income: Securities transactions are recorded on a trade date basis. Realized gain and loss from securities transactions are recorded on the identified cost basis. Dividend income is recognized on the ex-dividend date and interest income, including, where applicable, accretion of discount and amortization of premium on investments, is recognized on the accrual basis.
The fund has an arrangement with the custodian bank whereby the fund receives earnings credits from the custodian when positive cash balances are maintained, which are used to offset custody fees. For
financial reporting purposes, the fund includes net earnings credits, as an expense offset in the Statement of Operations.
(d) Affiliated issuers: Investments in other investment companies advised by the Manager are defined as “affiliated” in the Act.
(e) Dividends to shareholders: It is the policy of the fund to declare dividends daily from investment income-net. Such dividends are paid monthly. Dividends from net realized capital gain, if any, are normally declared and paid annually, but the fund may make distributions on a more frequent basis to comply with the distribution requirements of the Internal Revenue Code of 1986, as amended (the “Code”).To the extent that net realized capital gain can be offset by capital loss carryovers, it is the policy of the fund not to distribute such gain. Income and capital gain distributions are determined in accordance with income tax regulations, which may differ from U.S. generally accepted accounting principles.
(f) Federal income taxes: It is the policy of the fund to continue to qualify as a regulated investment company, if such qualification is in the best interests of its shareholders, by complying with the applicable provisions of the Code, and to make distributions of taxable income sufficient to relieve it from substantially all federal income and excise taxes.
At July 31, 2005, the components of accumulated earnings on a tax basis were as follows: undistributed ordinary income $42,418, accumulated capital gains $48,298 and unrealized depreciation $173,917.
The tax character of distributions paid to shareholders during the fiscal periods ended July 31, 2005 and July 31, 2004, were as follows: ordinary income $292,290 and $624,223, respectively.
During the period ended July 31, 2005, as a result of permanent book to tax differences primarily due to the tax treatment for treasury inflation protected securities, the fund increased accumulated undistributed investment income-net by $89,591 and decreased accumulated net realized gain (loss) on investments by the same amount. Net assets were not affected by this reclassification.
NOTES TO FINANCIAL STATEMENTS (continued)
|
NOTE 2—Bank Line of Credit:
|
The fund participates with other Dreyfus-managed funds in a $350 million redemption credit facility (the “Facility”) to be utilized for temporary or emergency purposes, including the financing of redemptions. In connection therewith, the fund has agreed to pay commitment fees on its pro rata portion of the Facility. Interest is charged to the fund based on prevailing market rates in effect at the time of borrowings. During the period ended July 31, 2005, the fund did not borrow under the Facility.
NOTE 3—Management Fee and Other Transactions With Affiliates:
(a) Pursuant to a management agreement (“Agreement”) with the Manager, the management fee is computed at the annual rate of .30 of 1% of the value of the fund’s average daily net assets and is payable monthly. The Manager has undertaken from August 1, 2004 through January 31, 2006, that if the aggregate expenses of the fund, exclusive of taxes, brokerage fees, shareholder services plan fees and extraordinary expenses, exceed an annual rate of .30 of 1% of the value of the fund’s average daily net assets, the fund may deduct from the payment to be made to the Manager under the Agreement, or the Manager will bear, such excess expense.The expense reimbursement, pursuant to the undertaking, amounted to $76,114 during the period ended July 31, 2005.
(b) Under the Investor Shares Shareholder Services Plan, the fund pays the Distributor at an annual rate of .25 of 1% of the value of Investor Shares average daily net assets for the provision of certain services.The services provided may include personal services relating to shareholder accounts, such as answering shareholder inquiries regarding the fund and providing reports and other information, and services related to the maintenance of shareholder accounts. The Distributor may make payments to Service Agents (a securities dealer, financial institution or
other industry professional) in respect of these services. The Distributor determines the amounts to be paid to Service Agents. During the period ended July 31, 2005, Investor Shares were charged $7,460 pursuant to the Shareholder Services Plan.
The fund compensates Dreyfus Transfer, Inc., a wholly-owned subsidiary of the Manager, under a transfer agency agreement for providing personnel and facilities to perform transfer agency services for the fund. During the period ended July 31, 2005, the fund was charged $168 pursuant to the transfer agency agreement.
The fund compensates Mellon Bank, N.A., an affiliate of the Manager, under a custody agreement for providing custodial services for the fund. During the period ended July 31, 2005, the fund was charged $3,925 pursuant to the custody agreement.
During the period ended July 31, 2005, the fund was charged $2,308 for services performed by the Chief Compliance Officer.
The components of Due to The Dreyfus Corporation and affiliates in the Statement of Assets and Liabilities consist of: management fees $1,643, shareholder services plan fees $642, custodian fees $821, chief compliance officer fees $2,308 and transfer agency per account fees $27, which are offset against an expense reimbursement currently in effect in the amount of $4,498.
(c) Each Board member also serves as a Board member of other funds within the Dreyfus complex. Annual retainer fees and attendance fees are allocated to each fund based on net assets.
(d) Pursuant to an exemptive order from the Securities and Exchange Commission, the fund may invest its available cash balances in affiliated money market mutual funds. Management fees of the underlying money market mutual funds have been waived by the Manager.
NOTES TO FINANCIAL STATEMENTS (continued)
|
NOTE 4—Securities Transactions:
|
The aggregate amount of purchases and sales (including paydowns) of investment securities, excluding short-term securities, forward currency exchange contracts, financial futures and options transactions during the period ended July 31, 2005, amounted to $7,963,895 and $7,305,944, respectively.
The fund enters into forward currency exchange contracts in order to hedge its exposure to changes in foreign currency exchange rates on its foreign portfolio holdings and to settle foreign currency transactions. When executing forward currency exchange contracts, the fund is obligated to buy or sell a foreign currency at a specified rate on a certain date in the future.With respect to sales of forward currency exchange contracts, the fund would incur a loss if the value of the contract increases between the date the forward contract is opened and the date the forward contract is closed.The fund realizes a gain if the value of the contract decreases between those dates.With respect to purchases of forward currency exchange contracts, the fund would incur a loss if the value of the contract decreases between the date the forward contract is opened and the date the forward contract is closed.The fund realizes a gain if the value of the contract increases between those dates.The fund is also exposed to credit risk associated with counterparty nonperformance on these forward currency exchange contracts which is typically limited to the unrealized gain on each open contract.At July 31, 2005, there were no open forward currency exchange contracts.
The fund may invest in financial futures contracts in order to gain exposure to or protect against changes in the market. The fund is exposed to market risk as a result of changes in the value of the underlying financial instruments. Investments in financial futures require the fund to “mark to market” on a daily basis, which reflects the change in the market value of the contracts at the close of each day’s trading. Accordingly, variation margin payments are received or made to reflect daily unrealized gains or losses.When the contracts are closed, the fund
recognizes a realized gain or loss.These investments require initial margin deposits with a broker, which consist of cash or cash equivalents. The amount of these deposits is determined by the exchange or Board of Trade on which the contract is traded and is subject to change. Contracts open at July 31, 2005, are set forth in the Statement of Financial Futures.
At July 31, 2005, the cost of investments for federal income tax purposes was $6,588,678; accordingly, accumulated net unrealized depreciation on investments was $173,917, consisting of $58,092 gross unrealized appreciation and $232,009 gross unrealized depreciation.
NOTE 5—Legal Matters:
In early 2004, two purported class and derivative actions were filed against Mellon Financial, Mellon Bank, N.A., Dreyfus, Founders Asset Management LLC, and certain directors of the Dreyfus Funds and the Dreyfus Founders Funds (together, the “Funds”) in the United States District Court for the Western District of Pennsylvania. In September 2004, plaintiffs served a Consolidated Amended Complaint (the “Amended Complaint”) on behalf of a purported class of all persons who acquired interests in any of the Funds between January 30, 1999 and November 17, 2003, and derivatively on behalf of the Funds.The Amended Complaint in the newly styled In re Dreyfus Mutual Funds Fee Litigation also named the Distributor, Premier Mutual Fund Services, Inc. and two additional Fund directors as defendants and alleges violations of the Investment Company Act of 1940, the Investment Advisers Act of 1940, the Pennsylvania Unfair Trade Practices and Consumer Protection Law and common-law claims. Plaintiffs seek to recover allegedly improper and excessive Rule 12b-1 and advisory fees allegedly charged to the Funds for marketing and distribution services. More specifically, plaintiffs claim, among other things, that 12b-1 fees and directed brokerage were improperly used to pay brokers to recommend the Funds over other funds, and that such payments were not disclosed to investors. In addition, plaintiffs assert
NOTES TO FINANCIAL STATEMENTS (continued)
|
that economies of scale and soft-dollar benefits were not passed on to the Funds. Plaintiffs further allege that 12b-1 fees were improperly charged to certain of the Funds that were closed to new investors.The Amended Complaint seeks compensatory and punitive damages, rescission of the advisory contracts, and an accounting and restitution of any unlawful fees, as well as an award of attorneys’ fees and litigation expenses. As noted, some of the claims in this litigation are asserted derivatively on behalf of the Funds that have been named as nominal defendants. With respect to such derivative claims, no relief is sought against the Funds. Dreyfus believes the allegations to be totally without merit and intends to defend the action vigorously. In November 2004, all named defendants moved to dismiss the Amended Complaint in whole or substantial part. Briefing was completed in May 2005.
Additional lawsuits arising out of these circumstances and presenting similar allegations and requests for relief may be filed against the defendants in the future. Neither Dreyfus nor the Funds believe that any of the pending actions will have a material adverse effect on the Funds or Dreyfus’ ability to perform its contract with the Funds.
| REPORT OF INDEPENDENT REGISTERED |
| PUBLIC ACCOUNTING FIRM |
| Shareholders and Board of Directors |
| Dreyfus Inflation Adjusted Securities Fund |
We have audited the accompanying statement of assets and liabilities, including the statements of investments and financial futures, of Dreyfus Inflation Adjusted Securities Fund (one of the funds comprising Dreyfus Investment Grade Funds, Inc.) as of July 31, 2005, and the related statement of operations for the year then ended, the statement of changes in net assets for each of the two years in the period then ended, and financial highlights for each of the periods indicated therein.These financial statements and financial highlights are the responsibility of the Fund’s management. Our responsibility is to express an opinion on these financial statements and financial highlights based on our audits.
We conducted our audits in accordance with the standards of the Public Company Accounting Oversight Board (United States).Those standards require that we plan and perform the audit to obtain reasonable assurance about whether the financial statements and financial highlights are free of material misstatement.We were not engaged to perform an audit of the Fund’s internal control over financial reporting.Our audits included consideration of internal control over financial reporting as a basis for designing audit procedures that are appropriate in the circumstances,but not for the purpose of expressing an opinion on the effectiveness of the Fund’s internal control over financial reporting.Accordingly, we express no such opinion.An audit also includes examining, on a test basis, evidence supporting the amounts and disclosures in the financial statements and financial highlights, assessing the accounting principles used and significant estimates made by management,and evaluating the overall financial statement presentation. Our procedures included verification by examination of securities held by the custodian as of July 31, 2005 and confirmation of securities not held by the custodian by correspondence with others. We believe that our audits provide a reasonable basis for our opinion. In our opinion, the financial statements and financial highlights referred to above present fairly, in all material respects, the financial position of Dreyfus Inflation Adjusted Securities Fund at July 31, 2005, the results of its operations for the year then ended, the changes in its net assets for each of the two years in the period then ended, and the financial highlights for each of the indicated periods, in conformity with U.S. generally accepted accounting principles.

| | New York, New York
September 16, 2005
|
IMPORTANT TAX INFORMATION (Unaudited)
For state individual income tax purposes, the fund hereby designates 99.02% of the ordinary income dividends paid during the fiscal year ended July 31, 2005 as attributable to interest income from direct obligations of the United States. Such dividends are currently exempt from taxation for individual income tax purposes in most states, including New York, California and the District of Columbia.
| INFORMATION ABOUT THE REVIEW | | |
| AND APPROVAL OF THE FUND’S | | |
| M A N A G E M E N T A G R E E M E N T | | (Unaudited) |
At separate meetings of the Board of Directors for the Fund held on July 12-13, 2005, the Board considered the re-approval, through its annual renewal date of July 29, 2006, of the Fund’s Management Agreement, pursuant to which the Manager provides the Fund with investment advisory and administrative services. The Board members who are not “interested persons” (as defined in the Investment Company Act of 1940, as amended) of the Fund were assisted in their review by independent legal counsel and met with counsel in executive session separate from representatives of the Manager.
Analysis of Nature, Extent and Quality of Services Provided to the Fund. The Board members received a presentation from representatives of the Manager regarding services provided to the Fund and other funds in the Dreyfus fund complex, and discussed the nature, extent and quality of the services provided to the Fund pursuant to its Management Agreement. The Manager’s representatives reviewed the Fund’s distribution of accounts and the relationships the Manager has with various intermediaries and the different needs of each, noting that most of the Fund’s shares were owned by the Manager or an affiliate of the Manager.The Manager’s representatives noted the diversity of distribution among the funds in the Dreyfus complex, and the Manager’s corresponding need for broad, deep, and diverse resources to be able to provide ongoing shareholder services to each distribution channel, including that of the Fund. The Board also reviewed the number of shareholder accounts in the Fund, as well as the Fund’s asset size.
The Board members also considered the Manager’s research and portfolio management capabilities and that the Manager also provides oversight of day-to-day Fund operations, including fund accounting and administration and assistance in meeting legal and regulatory requirements. The Board members also considered the Manager’s extensive administrative, accounting and compliance infrastructure.
INFORMATION ABOUT THE REVIEW AND APPROVAL OF THE FUND’S MANAGEMENT AGREEMENT (Unaudited) ( c o n t i n u e d )
Comparative Analysis of the Fund’s Performance and Management Fee and Expense Ratio. The Board members reviewed the Fund’s performance, management fee and expense ratios and placed significant emphasis on comparisons to a group of comparable funds and Lipper category averages, as applicable. The group of comparable funds was previously approved by the Board for this purpose, and was prepared using a Board-approved selection methodology that was based, in part, on selecting non-affiliated funds reported in the same Lipper category as the Fund.The Board members discussed the results of the comparisons for various periods ended May 31, 2005, and noted that the Fund’s income yield performance for the 1-year and 2-year periods was above the comparison group and Lipper category averages and ranked in the top half of the comparison group and Lipper category. The Board noted that the Fund’s 1-year total return performance was above the comparison group and Lipper category averages and ranked in the top half of the comparison group and Lipper category, but that the Fund’s 2-year total return performance was below the comparison group average and ranked in the bottom half of the comparison group and Lipper category, although it was above the Lipper category aver-age.The Board noted that the Fund’s 3-month and year-to-date total return performance was above the Lipper category average and ranked the Fund in the top half of the comparison group for each period.The Board members noted that a new portfolio management team for the Fund was appointed in January 2005. The Board members also discussed the Fund’s expense ratio, noting that the current fee waiver and expense reimbursement arrangement undertaken by the Manager had caused the Fund’s expense ratio to be lower than the Lipper category and comparison group averages. The Board reviewed the range of management fees in the comparison group, noting that the Fund’s management fee ranked in the top half (i.e., lower than most others).
Representatives of the Manager noted that the Manager or its affiliates do not manage other mutual funds or accounts with similar investment objectives, policies and strategies as the Fund.
Analysis of Profitability and Economies of Scale. The Manager’s representatives reviewed the dollar amount of expenses allocated and profit received by the Manager and the method used to determine such expenses and profit.The Board received and considered information prepared by an independent consulting firm regarding Dreyfus’ approach to allocating costs to, and determining the profitability of, individual funds and the entire Dreyfus mutual fund complex.The consulting firm also analyzed where any economies of scale might emerge as assets grow.The Board members evaluated the analysis in light of the relevant circumstances for the Fund, including the extent to which economies of scale would be realized as the Fund grows and whether fee levels reflect these economies of scale for the benefit of Fund investors.The Board members also considered potential benefits to the Manager from acting as investment adviser and noted that there were no soft dollar arrangements with respect to trading the Fund’s portfolio.
It was noted that the Board members should consider the Manager’s profitability with respect to the Fund as part of their evaluation of whether the fee under the Management Agreement bears a reasonable relationship to the mix of services provided by the Manager, including the nature, extent and quality of such services and that a discussion of economies of scale are predicated on increasing assets and that, if a fund’s assets had been decreasing, the possibility that the Manager may have realized any economies of scale would be less. It also was noted that the profitability percentage for managing the Fund was within ranges determined by appropriate court cases to be reasonable given the services rendered and given the Fund’s overall performance and generally superior service levels provided. The Board also noted the current fee waiver and expense reimbursement arrangement and its effect on the profitability of the Manager.
At the conclusion of these discussions, each of the Directors expressed the opinion that he or she had been furnished with sufficient information to make an informed business decision with respect to continua-
INFORMATION ABOUT THE REVIEW AND APPROVAL OF THE FUND ’S MANAGEMENT AGREEMENT (Unaudited) (continued )
tion of the Fund’s Management Agreement. Based on their discussions and considerations as described above, the Board made the following conclusions and determinations.
- The Board concluded that the nature, extent and quality of the ser- vices provided by the Manager are adequate and appropriate.
- The Board generally was satisfied with the Fund’s income yield performance, and the Fund’s 3-month, year-to-date and 1-year total return performance, as well as with the change in the Fund’s portfolio management team which occurred in January 2005.
- The Board concluded that the fee paid by the Fund to the Manager was reasonable in light of comparative performance and expense and advisory fee information, including the Manager’s current undertaking to waive or reimburse certain fees and expenses, costs of the services provided and profits to be realized and benefits derived or to be derived by the Manager from its relationship with the Fund.
- The Board determined that, given the current size and characteris- tics of the Fund, it was difficult to specifically identify any economies of scale that might be realized merely through an increase in the assets of the Fund.The Board noted that it appeared that the benefits of any economies of scale would be appropriately shared with shareholders through increased investment in fund management and administration resources.
The Board members considered these conclusions and determinations, along with information received on a routine and regular basis throughout the year, and, without any one factor being dispositive, the Board determined that re-approval of the Fund’s Management Agreement was in the best interests of the Fund and its shareholders.
BOARD MEMBERS INFORMATION (Unaudited)
Joseph S. DiMartino (61)
Chairman of the Board (1995)
|
Principal Occupation During Past 5 Years:
• Corporate Director and Trustee
|
Other Board Memberships and Affiliations:
|
- The Muscular Dystrophy Association, Director
- Levcor International, Inc., an apparel fabric processor, Director
- Century Business Services, Inc., a provider of outsourcing functions for small and medium size companies, Director
- The Newark Group, a provider of a national market of paper recovery facilities, paperboard mills and paperboard converting plants, Director
- Azimuth Trust, an institutional asset management firm, Member of Board of Managers and Advisory Board
No. of Portfolios for which Board Member Serves: 193
———————
Clifford L. Alexander, Jr. (71) Board Member (2003)
Principal Occupation During Past 5 Years:
|
- President of Alexander & Associates, Inc., a management consulting firm ( January 1981-present)
- Chairman of the Board of Moody’s Corporation (October 2000-October 2003)
- Chairman of the Board and Chief Executive Officer of The Dun and Bradstreet Corporation (October 1999-September 2000)
Other Board Memberships and Affiliations:
• Mutual of America Life Insurance Company, Director
No. of Portfolios for which Board Member Serves: 66
|
———————
Lucy Wilson Benson (77) Board Member (1994)
Principal Occupation During Past 5 Years:
• President of Benson and Associates, consultants to business and government (1980-present)
Other Board Memberships and Affiliations:
|
- The International Executive Services Corps., Director
- Citizens Network for Foreign Affairs,Vice Chairperson
- Council on Foreign Relations, Member
- Lafayette College Board of Trustees,Trustee Emeritus
- Atlantic Council of the U.S., Director
No. of Portfolios for which Board Member Serves: 40
|
BOARD MEMBERS INFORMATION (Unaudited) (continued)
David W. Burke (69)
Board Member (1994)
|
Principal Occupation During Past 5 Years:
• Corporate Director and Trustee
|
Other Board Memberships and Affiliations:
|
- John F. Kennedy Library Foundation, Director
- U.S.S. Constitution Museum, Director
No. of Portfolios for which Board Member Serves: 84
Whitney I. Gerard (70)
Board Member (1993)
|
Principal Occupation During Past 5 Years:
• Partner of Chadbourne & Parke LLP
|
No. of Portfolios for which Board Member Serves: 38
Arthur A. Hartman (79)
Board Member (1992)
|
Principal Occupation During Past 5 Years:
|
- Chairman of First NIS Regional Fund (ING/Barings Management) and New Russia Fund
- Advisory Council Member to Barings Vostok
Other Board Memberships and Affiliations:
• APCO Associates Inc., Senior Consultant
|
No. of Portfolios for which Board Member Serves: 38
George L. Perry (71)
Board Member (1992)
|
Principal Occupation During Past 5 Years:
• Economist and Senior Fellow at Brookings Institution
No. of Portfolios for which Board Member Serves: 38
Once elected all Board Members serve for an indefinite term.The address of the Board Members and Officers is in c/o The Dreyfus Corporation, 200 Park Avenue, New York, New York 10166. Additional information about the Board Members is available in the fund’s Statement of Additional Information which can be obtained from Dreyfus free of charge by calling this toll free number: 1-800-554-4611.
OFFICERS OF THE FUND (Unaudited)
STEPHEN E. CANTER, President since March 2000.
Chairman of the Board, Chief Executive Officer and Chief Operating Officer of the Manager, and an officer of 90 investment companies (comprised of 184 portfolios) managed by the Manager. Mr. Canter also is a Board member and, where applicable, an Executive Committee Member of the other investment management subsidiaries of Mellon Financial Corporation, each of which is an affiliate of the Manager. He is 60 years old and has been an employee of the Manager since May 1995.
STEPHEN R. BYERS, Executive Vice President since October 2002.
Chief Investment Officer,Vice Chairman and a director of the Manager, and an officer of 90 investment companies (comprised of 184 portfolios) managed by the Manager. Mr. Byers also is an officer, director or an Executive Committee Member of certain other investment management subsidiaries of Mellon Financial Corporation, each of which is an affiliate of the Manager. He is 51 years old and has been an employee of the Manager since January 2000.
MARK N. JACOBS, Vice President since March 2000.
Executive Vice President, Secretary and General Counsel of the Manager, and an officer of 91 investment companies (comprised of 200 portfolios) managed by the Manager. He is 59 years old and has been an employee of the Manager since June 1977.
MICHAEL A. ROSENBERG, Vice President and Secretary since August 2005.
Associate General Counsel of the Manager, and an officer of 91 investment companies (comprised of 200 portfolios) managed by the Manager. He is 45 years old and has been an employee of the Manager since October 1991.
JAMES BITETTO, Vice President and Assistant Secretary since August 2005.
Assistant General Counsel and Assistant Secretary of the Manager, and an officer of 91 investment companies (comprised of 200 portfolios) managed by the Manager. He is 39 years old and has been an employee of the Manager since December 1996.
JONI LACKS CHARATAN, Vice President and Assistant Secretary since August 2005.
Assistant General Counsel of the Manager, and an officer of 91investment companies (comprised of 200 portfolios) managed by the Manager. She is 49 years old and has been an employee of the Manager since October 1998.
JOSEPH M. CHIOFFI, Vice President and Assistant Secretary since August 2005.
Assistant General Counsel of the Manager, and an officer of 91 investment companies (comprised of 200 portfolios) managed by the Manager. He is 43 years old and has been an employee of the Manager since July 2000.
JANETTE E. FARRAGHER, Vice President and Assistant Secretary since August 2005.
Associate General Counsel of the Manager, and an officer of 91 investment companies (comprised of 200 portfolios) managed by the Manager. She is 42 years old and has been an employee of the Manager since February 1984.
JOHN B. HAMMALIAN, Vice President and Assistant Secretary since August 2005.
Associate General Counsel of the Manager, and an officer of 91 investment companies (comprised of 200 portfolios) managed by the Manager. He is 42 years old and has been an employee of the Manager since February 1991.
OFFICERS OF THE FUND (Unaudited) (continued)
ROBERT R. MULLERY, Vice President and Assistant Secretary since August 2005.
Associate General Counsel of the Manager, and an officer of 91 investment companies (comprised of 200 portfolios) managed by the Manager. He is 53 years old and has been an employee of the Manager since May 1986.
JEFF PRUSNOFSKY, Vice President and Assistant Secretary since August 2005.
Associate General Counsel of the Manager, and an officer of 91 investment companies (comprised of 200 portfolios) managed by the Manager. He is 40 years old and has been an employee of the Manager since October 1990.
JAMES WINDELS, Treasurer since November 2001.
Director – Mutual Fund Accounting of the Manager, and an officer of 91 investment companies (comprised of 200 portfolios) managed by the Manager. He is 46 years old and has been an employee of the Manager since April 1985.
GREGORY S. GRUBER, Assistant Treasurer since August 2005.
Senior Accounting Manager – Municipal Bond Funds of the Manager, and an officer of 91 investment companies (comprised of 200 portfolios) managed by the Manager. He is 46 years old and has been an employee of the Manager since August 1981.
ERIK D. NAVILOFF, Assistant Treasurer since December 2002.
Senior Accounting Manager – Taxable Fixed Income Funds of the Manager, and an officer of 91 investment companies (comprised of 200 portfolios) managed by the Manager. He is 37 years old and has been an employee of the Manager since November 1992.
ROBERT ROBOL, Assistant Treasurer since August 2005.
Senior Accounting Manager – Money Market Funds of the Manager, and an officer of 91 investment companies (comprised of 200 portfolios) managed by the Manager. He is 41 years old and has been an employee of the Manager since October 1988.
ROBERT SVAGNA, Assistant Treasurer since August 2005.
Senior Accounting Manager – Equity Funds of the Manager, and an officer of 91 investment companies (comprised of 200 portfolios) managed by the Manager. He is 37 years old and has been an employee of the Manager since November 1990.
KENNETH J. SANDGREN, Assistant Treasurer since November 2001.
Mutual Funds Tax Director of the Manager, and an officer of 91 investment companies (comprised of 200 portfolios) managed by the Manager. He is 50 years old and has been an employee of the Manager since June 1993.
JOSEPH W. CONNOLLY, Chief Compliance Officer since October 2004.
Chief Compliance Officer of the Manager and The Dreyfus Family of Funds (91 investment companies, comprising 200 portfolios). From November 2001 through March 2004, Mr. Connolly was first Vice-President, Mutual Fund Servicing for Mellon Global Securities Services. In that capacity, Mr. Connolly was responsible for managing Mellon’s Custody, Fund Accounting and Fund Administration services to third-party mutual fund clients. He is 48 years old and has served in various capacities with the Manager since 1980, including manager of the firm’s Fund Accounting Department from 1997 through October 2001.
WILLIAM GERMENIS, Anti-Money Laundering Compliance Officer since August 2002.
Vice President and Anti-Money Laundering Compliance Officer of the Distributor, and the Anti-Money Laundering Compliance Officer of 87 investment companies (comprised of 196 portfolios) managed by the Manager. He is 34 years old and has been an employee of the Distributor since October 1998.
NOTES
| For More | | Information |
| |
|
| |
| Dreyfus | | Transfer Agent & |
| Inflation Adjusted | | Dividend Disbursing Agent |
| Securities Fund | | |
| | | Dreyfus Transfer, Inc. |
| 200 Park Avenue | | |
| | | 200 Park Avenue |
| New York, NY 10166 | | |
| | | New York, NY 10166 |
| |
| Investment Adviser | | Distributor |
| The Dreyfus Corporation | | |
| | | Dreyfus Service Corporation |
| 200 Park Avenue | | |
| | | 200 Park Avenue |
| New York, NY 10166 | | |
| | | New York, NY 10166 |
| Custodian | | |
| Mellon Bank, N.A. | | |
| One Mellon Bank Center | | |
| Pittsburgh, PA 15258 | | |
| |
|
| |
| |
| Telephone 1-800-645-6561 | | |
| Mail The Dreyfus Family of Funds, 144 Glenn Curtiss Boulevard, Uniondale, NY 11556-0144 |
| E-mail Send your request to info@dreyfus.com |
| Internet Information can be viewed online or downloaded at: http://www.dreyfus.com |
The fund files its complete schedule of portfolio holdings with the Securities and Exchange Commission (“SEC”) for the first and third quarters of each fiscal year on Form N-Q. The fund’s Forms N-Q are available on the SEC’s website at http://www.sec.gov and may be reviewed and copied at the SEC’s Public Reference Room in Washington, DC. Information on the operation of the Public Reference Room may be obtained by calling 1-800-SEC-0330.
A description of the policies and procedures that the fund uses to determine how to vote proxies relating to portfolio securities, and information regarding how the fund voted these proxies for the 12-month period ended June 30, 2005, is available at http://www.dreyfus.com and on the SEC’s website at http://www.sec.gov. The description of the policies and procedures is also available without charge, upon request, by calling 1-800-645-6561.

Item 2. Code of Ethics.
The Registrant has adopted a code of ethics that applies to the Registrant's principal executive officer, principal financial officer, principal accounting officer or controller, or persons performing similar functions There have been no amendments to, or waivers in connection with, the Code of Ethics during the period covered by this Report.
Item 3. Audit Committee Financial Expert.
The Registrant's Board has determined that Joseph S. DiMartino, a member of the Audit Committee of Board, is an audit committee financial expert as defined by the Securities and Exchange Commission (the "SEC"). Joseph S. DiMartino is "independent" as defined by the SEC for purposes of audit committee financial expert determinations.
Item 4. Principal Accountant Fees and Services
(a) Audit Fees. The aggregate fees billed for each of the last two fiscal years (the "Reporting Periods") for professional services rendered by the Registrant's principal accountant (the "Auditor") for the audit of the Registrant's annual financial statements, or services that are normally provided by the Auditor in connection with the statutory and regulatory filings or engagements for the Reporting Periods, were $123,060 in 2004 and $133,397 in 2005.
(b) Audit-Related Fees. The aggregate fees billed in the Reporting Periods for assurance and related services by the Auditor that are reasonably related to the performance of the audit of the Registrant's financial statements and are not reported under paragraph (a) of this Item 4 were $22,500 in 2004 and $23,625 in 2005. These services consisted of security counts required by Rule 17f-2 under the Investment Company Act of 1940.
The aggregate fees billed in the Reporting Periods for non-audit assurance and related services by the Auditor to the Registrant's investment adviser (not including any sub-investment adviser whose role is primarily portfolio management and is subcontracted with or overseen by another investment adviser), and any entity controlling, controlled by or under common control with the investment adviser that provides ongoing services to the Registrant ("Service Affiliates"), that were reasonably related to the performance of the annual audit of the Service Affiliate, which required pre-approval by the Audit Committee were $238,500 in 2004 and $0 in 2005.
Note: For the second paragraph in each of (b) through (d) of this Item 4, certain of such services were not pre-approved prior to May 6, 2003, when such services were required to be pre-approved. On and after May 6, 2003, 100% of all services provided by the Auditor were pre-approved as required. For comparative purposes, the fees shown assume that all such services were pre-approved, including services that were not pre-approved prior to the compliance date of the pre-approval requirement.
(c) Tax Fees. The aggregate fees billed in the Reporting Periods for professional services rendered by the Auditor for tax compliance, tax advice and tax planning ("Tax Services") were $21,340 in 2004 and $14,053 in 2005. These services consisted of (i) review or preparation of U.S. federal, state, local and excise tax returns; (ii) U.S. federal, state and local tax planning, advice and assistance regarding statutory, regulatory or
administrative developments, (iii) tax advice regarding tax qualification matters and/or treatment of various financial instruments held or proposed to be acquired or held, and (iv) determination of Passive Foreign Investment Companies.
The aggregate fees billed in the Reporting Periods for Tax Services by the Auditor to Service Affiliates which required pre-approval by the Audit Committee were $0 in 2004 and $0 in 2005.
(d) All Other Fees. The aggregate fees billed in the Reporting Periods for products and services provided by the Auditor, other than the services reported in paragraphs (a) through (c) of this Item, were $1,707 in 2004 and $1,205 in 2005. These services consisted of a review of the Registrant's anti-money laundering program.
The aggregate fees billed in the Reporting Periods for Non-Audit Services by the Auditor to Service Affiliates, other than the services reported in paragraphs (b) through (c) of this Item, which required pre-approval by the Audit Committee were $0 in 2004 and $0 in 2005.
Audit Committee Pre-Approval Policies and Procedures. The Registrant's Audit Committee has established policies and procedures (the "Policy") for pre-approval (within specified fee limits) of the Auditor's engagements for non-audit services to the Registrant and Service Affiliates without specific case-by-case consideration. Pre-approval considerations include whether the proposed services are compatible with maintaining the Auditor's independence. Pre-approvals pursuant to the Policy are considered annually.
Non-Audit Fees. The aggregate non-audit fees billed by the Auditor for services rendered to the Registrant, and rendered to Service Affiliates, for the Reporting Periods were $632,202 in 2004 and $902,237 in 2005.
Auditor Independence. The Registrant's Audit Committee has considered whether the provision of non-audit services that were rendered to Service Affiliates which were not pre-approved (not requiring pre-approval) is compatible with maintaining the Auditor's independence.
| Item 5. | | Audit Committee of Listed Registrants. |
| | | Not applicable. | | [CLOSED-END FUNDS ONLY] |
| Item 6. | | Schedule of Investments. |
| | | Not applicable. | | |
| Item 7. | | Disclosure of Proxy Voting Policies and Procedures for Closed-End Management |
| | | Investment Companies. |
| | | Not applicable. | | [CLOSED-END FUNDS ONLY] |
| Item 8. | | Portfolio Managers of Closed-End Management Investment Companies. |
| | | Not applicable. | | [CLOSED-END FUNDS ONLY, beginning with reports for periods ended |
| | | | | on and after December 31, 2005] |
| Item 9. | | Purchases of Equity Securities by Closed-End Management Investment Companies and |
| | | Affiliated Purchasers. |
| | | Not applicable. | | [CLOSED-END FUNDS ONLY] |
| Item 10. | | Submission of Matters to a Vote of Security Holders. |
| |
| - |
The Registrant has a Nominating Committee (the "Committee"), which is responsible for selecting and nominating persons for election or appointment by the Registrant's Board as Board members. The Committee has adopted a Nominating Committee Charter (the "Charter"). Pursuant to the Charter, the Committee will consider recommendations for nominees from shareholders submitted to the Secretary of the Registrant, c/o The Dreyfus Corporation Legal Department, 200 Park Avenue, 8th Floor East, New York, New York 10166. A nomination submission must include information regarding the recommended nominee as specified in the Charter. This information includes all information relating to a recommended nominee that is required to be disclosed in solicitations or proxy statements for the election of Board members, as well as information sufficient to evaluate the factors to be considered by the Committee, including character and integrity, business and professional experience, and whether the person has the ability to apply sound and independent business judgment and would act in the interests of the Registrant and its shareholders.
Nomination submissions are required to be accompanied by a written consent of the individual to stand for election if nominated by the Board and to serve if elected by the shareholders, and such additional information must be provided regarding the recommended nominee as reasonably requested by the Committee.
Item 11. Controls and Procedures.
(a) The Registrant's principal executive and principal financial officers have concluded, based on their evaluation of the Registrant's disclosure controls and procedures as of a date within 90 days of the filing date of this report, that the Registrant's disclosure controls and procedures are reasonably designed to ensure that information required to be disclosed by the Registrant on Form N-CSR is recorded, processed, summarized and reported within the required time periods and that information required to be disclosed by the Registrant in the reports that it files or submits on Form N-CSR is accumulated and communicated to the Registrant's management, including its principal executive and principal financial officers, as appropriate to allow timely decisions regarding required disclosure.
(b) There were no changes to the Registrant's internal control over financial reporting that occurred during the second fiscal quarter of the period covered by this report that have materially affected, or are reasonably likely to materially affect, the Registrant's internal control over financial reporting.
Item 12. Exhibits.
| (a)(1) | | Code of ethics referred to in Item 2. |
| (a)(2) | | Certifications of principal executive and principal financial officers as required by Rule 30a-2(a) |
| under the Investment Company Act of 1940. |
| (a)(3) | | Not applicable. |
| (b) | | Certification of principal executive and principal financial officers as required by Rule 30a-2(b) |
| under the Investment Company Act of 1940. |
Pursuant to the requirements of the Securities Exchange Act of 1934 and the Investment Company Act of 1940, the Registrant has duly caused this Report to be signed on its behalf by the undersigned, thereunto duly authorized.
DREYFUS INVESTMENT GRADE FUNDS, INC.
| By: | | /s/ Stephen E. Canter |
| | | Stephen E. Canter |
| | | President |
| |
| Date: | | September 28, 2005 |
Pursuant to the requirements of the Securities Exchange Act of 1934 and the Investment Company Act of 1940, this Report has been signed below by the following persons on behalf of the Registrant and in the capacities and on the dates indicated.
| By: | | /s/ Stephen E. Canter |
| | | Stephen E. Canter |
| | | Chief Executive Officer |
| Date: | | September 28, 2005 |
| By: | | /s/ James Windels |
| | | James Windels |
| | | Chief Financial Officer |
| Date: | | September 28, 2005 |
| EXHIBIT INDEX |
| | | (a)(1) | | Code of ethics referred to in Item 2. |
| | | (a)(2) | | Certifications of principal executive and principal financial officers as required by Rule 30a- |
| | | 2(a) under the Investment Company Act of 1940. (EX-99.CERT) |
| | | (b) | | Certification of principal executive and principal financial officers as required by Rule 30a- |
| | | 2(b) under the Investment Company Act of 1940. (EX-99.906CERT) |
| THE DREYFUS FAMILY OF FUNDS |
| CODE OF ETHICS FOR PRINCIPAL EXECUTIVE |
| AND SENIOR FINANCIAL OFFICERS |
| | 1. Covered Officers/Purpose of the Code
|
This code of ethics (the "Code") for the investment companies within the complex (each, a "Fund") applies to each Fund's Principal Executive Officer, Principal Financial Officer, Principal Accounting Officer or Controller, or other persons performing similar functions, each of whom is listed on Exhibit A (the "Covered Officers"), for the purpose of promoting:
- honest and ethical conduct, including the ethical handling of actual or apparent conflicts of interest between personal and professional relationships;
- full, fair, accurate, timely and understandable disclosure in reports and documents that the Fund files with, or submits to, the Securities and Exchange Commission (the "SEC") and in other public communications made by the Fund;
- compliance with applicable laws and governmental rules and regulations;
- the prompt internal reporting of violations of the Code to an appropriate person or persons identified in the Code; and
- accountability for adherence to the Code.
Each Covered Officer should adhere to a high standard of business ethics and should be sensitive situations that may give rise to actual as well as apparent conflicts of interest.
2. Covered Officers Should Handle Ethically Actual and Apparent Conflicts of Interest
Overview. A "conflict of interest" occurs when a Covered Officer's private interest interferes with the interests of, or his service to, the Fund. For example, a conflict of interest would arise if a Covered Officer, or a member of his family, receives improper personal benefits as a result of his position with the Fund.
Certain conflicts of interest arise out of the relationships between Covered Officers and the Fund and already are subject to conflict of interest provisions in the Investment Company Act of 1940, as amended (the "Investment Company Act"), and the Investment Advisers Act of 1940, as amended (the "Investment Advisers Act"). For example, Covered Officers may not individually engage in certain transactions (such as the purchase or sale of securities or other property) with the Fund because of their status as "affiliated persons" of the Fund. The compliance programs and procedures of the Fund and the Fund's investment adviser (the "Adviser") are designed to prevent, or identify and correct, violations of these provisions. The Code does not, and is not intended to, repeat or replace these programs and procedures, and the circumstances they cover fall outside of the parameters of the Code.
Although typically not presenting an opportunity for improper personal benefit, conflicts arise from, or as a result of, the contractual relationship between the Fund and the Adviser of which the Covered Officers are also officers or employees. As a result, the Code recognizes that the Covered Officers, in the ordinary course of their duties (whether formally for the Fund or for the Adviser, or for both), will be involved in establishing policies and implementing decisions that will have different effects on the Adviser and the Fund. The participation of the Covered Officers in such activities is inherent in the contractual relationship between the Fund and the Adviser and is consistent with the performance by the Covered Officers of their duties as officers of the Fund and, if addressed in conformity with the provisions of the Investment Company Act and the Investment Advisers Act, will be deemed to have been handled ethically. In addition, it is recognized by the Fund's Board that the Covered Officers also may be officers or employees of one or more other investment companies covered by this or other codes of ethics.
Other conflicts of interest are covered by the Code, even if such conflicts of interest are not subject to provisions in the Investment Company Act and the Investment Advisers Act. Covered Officers should keep in mind that the Code cannot enumerate every possible scenario. The overarching principle of the Code is that the personal interest of a Covered Officer should not be placed improperly before the interest of the Fund.
| | Each Covered Officer must:
|
| not use his personal influence or personal relationships improperly to influence investment decisions or financial reporting by the Fund whereby the Covered Officer would benefit personally to the detriment of the Fund; |
| |
| not cause the Fund to take action, or fail to take action, for the individual personal benefit of the Covered Officer rather than the benefit of the Fund; and |
| |
| not retaliate against any employee or Covered Officer for reports of potential violations that are made in good faith. |
| |
| | 3. | Disclosure and Compliance |
| |
| Each Covered Officer should familiarize himself with the disclosure requirements generally applicable to the Fund within his area of responsibility; |
| |
| each Covered Officer should not knowingly misrepresent, or cause others to misrepresent, facts about the Fund to others, whether within or outside the Fund, including to the Fund's Board members and auditors, and to governmental regulators and self-regulatory organizations; and |
| |
| each Covered Officer should, to the extent appropriate within his area of responsibility, consult with other officers and employees of the Fund and the Adviser with the goal of promoting full, fair, accurate, timely and understandable disclosure in the reports and documents the Fund files with, or submits to, the SEC and in other public communications made by the Fund; and |
| |
| it is the responsibility of each Covered Officer to promote compliance with the standards and restrictions imposed by applicable laws, rules and regulations. |
| |
| | 4. | Reporting and Accountability |
| |
| | Each Covered Officer must:
|
- upon adoption of the Code (or thereafter, as applicable, upon becoming a Covered Officer), affirm in writing to the Board that he has received, read, and understands the Code;
- annually thereafter affirm to the Board that he has complied with the requirements of the Code; and
- notify the Adviser's General Counsel (the "General Counsel") promptly if he knows of any violation of the Code. Failure to do so is itself a violation of the Code.
The General Counsel is responsible for applying the Code to specific situations in which questions are presented under it and has the authority to interpret the Code in any particular situation. However, waivers sought by any Covered Officer will be considered by the Fund's Board.
The Fund will follow these procedures in investigating and enforcing the Code:
- the General Counsel will take all appropriate action to investigate any potential violations reported to him;
- if, after such investigation, the General Counsel believes that no violation has occurred, the General Counsel is not required to take any further action;
- any matter that the General Counsel believes is a violation will be reported to the Board;
- if the Board concurs that a violation has occurred, it will consider appropriate action, which include: review of, and appropriate modifications to, applicable policies and procedures; notification to appropriate personnel of the Adviser or its board; or dismissal of the Covered Officer;
- the Board will be responsible for granting waivers, as appropriate; and
- any waivers of or amendments to the Code, to the extent required, will be disclosed as provided by SEC rules.
5. Other Policies and Procedures
The Code shall be the sole code of ethics adopted by the Fund for purposes of Section 406 of the Sarbanes-Oxley Act of 2002 and the rules and forms applicable to registered investment companies thereunder. The Fund's, its principal underwriter's and the Adviser's codes of ethics under Rule 17j-1 under the Investment Company Act and the Adviser's additional policies and procedures, including its Code of Conduct, are separate requirements applying to the Covered Officers and others, and are not part of the Code.
6. Amendments
The Code may not be amended except in written form which is specifically approved or ratified by a majority vote of the Fund's Board, including a majority of independent Board members.
7. Confidentiality
All reports and records prepared or maintained pursuant to the Code will be considered confidential and shall be maintained and protected accordingly. Except as otherwise required by law or the Code, such
matters shall not be disclosed to anyone other than the appropriate Funds and their counsel, the appropriate Boards (or Committees) and their counsel and the Adviser.
8. Internal Use
The Code is intended solely for the internal use by the Fund and does not constitute an admission, by or on behalf of the Fund, as to any fact, circumstance, or legal conclusion.
| Dated as of: | | July 1, 2003 |
| | | | | Exhibit A | | |
| Persons Covered by the Code of Ethics | | | | |
| |
| Stephen E. Canter | | President | | | | (Principal Executive Officer) |
| | | | | | | (Principal Financial and |
| James Windels | | Treasurer | | | | Accounting Officer) |