We are pleased to present this annual report for Dreyfus Inflation Adjusted Securities Fund, covering the 12-month period from August 1, 2016 through July 31, 2017. For information about how the fund performed during the reporting period, as well as general market perspectives, we provide a Discussion of Fund Performance on the pages that follow.
Stocks set a series of new record highs and bonds produced mixed results over the past year in response to changing economic and political conditions. Financial markets during the final months of 2016 were dominated by the election of a new U.S. presidential administration. Equities surged higher in anticipation of more business-friendly regulatory, tax, and fiscal policies, but high-quality bonds generally lost value due to expectations of rising interest rates and accelerating inflation in a stronger economy. Despite a series of short-term interest-rate hikes, bonds recovered over the first seven months of 2017 when it became clearer that major tax and fiscal reforms would take time and political capital to enact. Stocks continued to rally, led by large, growth-oriented companies, as corporate earnings grew and global economic conditions improved.
The markets’ strong recent performance has been supported by solid underlying fundamentals. While we currently expect these favorable conditions to persist, we remain watchful for economic and political developments that could derail the rallies. As always, we encourage you to discuss the risks and opportunities of today’s investment environment with your financial advisor.
Thank you for your continued confidence and support.
DISCUSSION OF FUND PERFORMANCE
For the period from August 1, 2016 through July 31, 2017, as provided by Robert Bayston, CFA, David Horsfall, CFA, and Nate Pearson, CFA, Portfolio Managers
Market and Fund Performance Overview
For the 12-month period ended July 31, 2017, Dreyfus Inflation Adjusted Securities Fund’s Class I shares produced a total return of -0.39%, Investor shares returned -0.60%, and Class Y shares returned -0.24%.1 In comparison, the fund’s benchmark, the Bloomberg Barclays U.S. TIPS 1-10 Year Index (the “Index”), produced a -0.08% total return for the same period.2
Treasury Inflation Protected Securities (TIPS) produced roughly flat returns over the reporting period when longer-term interest rates climbed in the wake of the U.S. presidential election, offsetting the more positive impact of a modest rise in inflationary pressures.
The Fund’s Investment Approach
The fund seeks returns that exceed the rate of inflation. To pursue its goal, the fund normally invests at least 80% of its net assets, plus any borrowings for investment purposes, in inflation-indexed securities. These are fixed-income securities designed to protect investors from a loss of value due to inflation by periodically adjusting their principal and/or coupon according to the rate of inflation.
The fund invests primarily in high-quality, U.S. dollar-denominated, inflation-indexed securities. To a limited extent, the fund may invest in foreign currency-denominated, inflation-protected securities and other fixed-income securities not adjusted for inflation, which are rated investment grade or the unrated equivalent as determined by Dreyfus. Such other fixed-income securities may include: U.S. government bonds and notes, corporate bonds, mortgage-related securities, and asset-backed securities. The fund seeks to keep its average effective duration between 2 and 10 years, and the fund may invest in securities of any maturity without restriction.
Interest Rates Climbed in Anticipation of Greater Growth
Longer-term interest rates rose sharply in the weeks following the U.S. presidential election in November 2016, causing prices of high-quality bonds, including TIPS, to decline. Rates moved higher in response to expectations that a new presidential administration’s more business-friendly regulatory, tax, and fiscal policies would boost U.S. economic growth and inflationary pressures. In addition, the Federal Reserve Board (the “Fed”) implemented a long-awaited increase in short-term interest rates in December 2017.
Despite continued robust labor markets and healthy consumer and business confidence, investors’ optimistic economic expectations moderated in early 2017 when it became clear that the enactment of government policy reforms was far from certain. Consequently, long-term U.S. interest rates moderated, giving back some, but not all, of the post-election spike.
Meanwhile, despite a tightening U.S. labor market, inflationary pressures remained more muted than many analysts had anticipated as energy prices declined and wage growth proved sluggish. Still, the Consumer Price Index (CPI) posted a modest increase for the reporting period overall. Indeed, the prospect of full employment and modestly accelerating inflation prompted the Fed to raise short-term interest rates twice more during the reporting period’s second half, sending the federal funds to a rate range between 1.00% and 1.25%. While the mild rise in inflation proved advantageous for TIPS, its benefits were offset by the detrimental effects of higher interest rates.
3
DISCUSSION OF FUND PERFORMANCE (continued)
Interest-Rate Strategies Bolstered Relative Results
While we are never satisfied with negative absolute or relative returns, it is worth noting that the fund’s performance was supported during the reporting period by our interest-rate strategies. We shifted the fund’s duration posture to a slightly longer-than-average position after interest rates spiked in late 2016, enabling the fund to participate more fully in the benefits of moderating long-term rates over the first half of 2017.
Our security selection strategy also added a degree of value: the fund held overweighted exposure to TIPS with maturities in the 7- to 10-year range, which generally fared better than their shorter-term counterparts. Finally, when opportunities to do so became available, we took advantage of trading opportunities to purchase TIPS at relatively attractive prices.
Maintaining a Generally Constructive Investment Posture
The U.S. and global economies have continued to expand, and many analysts expect U.S. economic growth to gain momentum over the second half of the year. Inflationary pressures are expected to increase, and most analysts expect additional rate hikes from the Fed in the months ahead. These conditions could prove more positive for TIPS than nominal U.S. Treasury securities. TIPS ended the reporting period at valuations reflecting inflation expectations that we believe may be too low. The Fed’s unwinding of its quantitative easing program also could put upward pressure on some long-term U.S. government bond yields, potentially creating opportunities to benefit from wider yield differences across the market’s maturity spectrum.
As of the end of the reporting period, we have maintained the fund’s average duration in a roughly neutral position compared to the Index while we await clearer evidence of the economy’s strength. We also have remained watchful for trading opportunities in response to bouts of heightened market volatility. In our judgment, these are prudent strategies during a time of transition for U.S. monetary and fiscal policies.
August 15, 2017
Bonds are subject generally to interest-rate, credit, liquidity, and market risks, to varying degrees, all of which are more fully described in the fund’s prospectus. Generally, all other factors being equal, bond prices are inversely related to interest-rate changes, and rate increases can cause price declines.
Interest payments on inflation-protected bonds will vary as the bond’s principal value is periodically adjusted based on the rate of inflation. If the index measuring inflation falls, the interest payable on these securities will be reduced. Any increase in the principal amount of an inflation-protected bond (which follows a rise in the relevant inflation index) will be considered taxable ordinary income, even though investors do not receive their principal until maturity.
During periods of rising interest rates and flat or declining inflation rates, inflation-protected bonds can underperform. Inflation-protected bonds issued by corporations generally do not guarantee repayment of principal.
Investing internationally involves special risks, including changes in currency exchange rates, political, economic, and social instability, a lack of comprehensive company information, differing auditing and legal standards, and less market liquidity.
Investments in foreign currencies are subject to the risk that those currencies will decline in value relative to the U.S. dollar, or, in the case of hedged positions, that the U.S. dollar will decline relative to the currency being hedged. Each of these risks could increase the fund’s volatility.
The fund may use derivative instruments, such as options, futures, options on futures, forward contracts, swaps (including credit default swaps on corporate bonds and asset-backed securities), options on swaps, and other credit derivatives. A small investment in derivatives could have a potentially large impact on the fund’s performance. The use of derivatives involves risks different from, or possibly greater than, the risks associated with investing directly in the underlying assets.
1 Total return includes reinvestment of dividends and any capital gains paid. Past performance is no guarantee of future results. Share price, yield, and investment return fluctuate such that upon redemption, fund shares may be worth more or less than their original cost.
2 Source: Lipper Inc. —The Bloomberg Barclays U.S. TIPS 1-10 Year Index measures the performance of the U.S. Treasury Inflation Protected Securities (TIPS) market with a maturity greater than 1 year and less than 10 years. Federal Reserve holdings of U.S. TIPS are not index-eligible and are excluded from the face amount outstanding of each bond in the index. Investors cannot invest directly in any index.
4
FUND PERFORMANCE
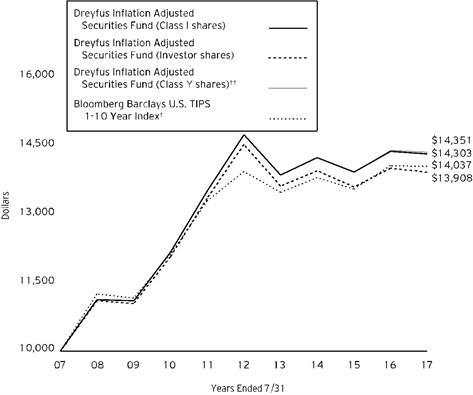
Comparison of change in value of $10,000 investment in Dreyfus Inflation Adjusted Securities Fund Class I shares, Investor Shares and Class Y shares and the Bloomberg Barclays U.S. TIPS 1-10 Year Index (the “Index”)
† Source: Lipper Inc.
†† The total return figures presented for Class Y shares of the fund reflect the performance of the fund’s Class I shares for the period prior to 7/1/13 (the inception date for Class Y shares).
Past performance is not predictive of future performance.
The above graph compares a $10,000 investment made in each of the Class I, Investor and Class Y shares of Dreyfus Inflation Adjusted Securities Fund on 7/31/07 to a $10,000 investment made in the Index on that date. All dividends and capital gain distributions are reinvested.
The fund’s performance shown in the line graph above takes into account all applicable fees and expenses on all classes. The Index measures the performance of the U.S. Treasury Inflation Protected Securities (TIPS) market with a maturity greater than 1 year and less than 10 years. Federal Reserve holdings of U.S. TIPS are not Index eligible and are excluded from the face amount outstanding of each bond in the Index. Investors cannot invest directly in any index. Further information relating to fund performance, including expense reimbursements, if applicable, is contained in the Financial Highlights section of the prospectus and elsewhere in this report.
5
FUND PERFORMANCE (continued)
| | | | | |
Average Annual Total Returns as of 7/31/17 |
| Inception Date | 1 Year | 5 Years | 10 Years |
Class I shares | 10/31/02 | -0.39% | -0.58% | 3.64% |
Investor shares | 10/31/02 | -0.60% | -0.85% | 3.35% |
Class Y shares | 7/1/13 | -0.24% | -0.52%† | 3.68%† |
Bloomberg Barclays U.S. TIPS 1-10 Year Index | | -0.08% | 0.17% | 3.45% |
Past performance is not predictive of future performance. The fund’s performance shown in the graph and table does not reflect the deduction of taxes that a shareholder would pay on fund distributions or the redemption of fund shares.
† The total return performance figures presented for Class Y shares of the fund reflect the performance of the fund’s Class I shares for the period prior to 7/1/13 (the inception date for Class Y shares).
6
UNDERSTANDING YOUR FUND’S EXPENSES (Unaudited)
As a mutual fund investor, you pay ongoing expenses, such as management fees and other expenses. Using the information below, you can estimate how these expenses affect your investment and compare them with the expenses of other funds. You also may pay one-time transaction expenses, including sales charges (loads) and redemption fees, which are not shown in this section and would have resulted in higher total expenses. For more information, see your fund’s prospectus or talk to your financial adviser.
Review your fund’s expenses
The table below shows the expenses you would have paid on a $1,000 investment in Dreyfus Inflation Adjusted Securities Fund from February 1, 2017 to July 31, 2017. It also shows how much a $1,000 investment would be worth at the close of the period, assuming actual returns and expenses.
| | | | | | | | | |
Expenses and Value of a $1,000 Investment | | |
assuming actual returns for the six months ended July 31, 2017 | |
| | | Class I | Investor Shares | Class Y |
Expenses paid per $1,000† | | $2.33 | | $3.52 | | $1.94 |
Ending value (after expenses) | | $1,002.60 | | $1,001.70 | | $1,003.80 |
COMPARING YOUR FUND’S EXPENSES
WITH THOSE OF OTHER FUNDS (Unaudited)
Using the SEC’s method to compare expenses
The Securities and Exchange Commission (SEC) has established guidelines to help investors assess fund expenses. Per these guidelines, the table below shows your fund’s expenses based on a $1,000 investment, assuming a hypothetical 5% annualized return. You can use this information to compare the ongoing expenses (but not transaction expenses or total cost) of investing in the fund with those of other funds. All mutual fund shareholder reports will provide this information to help you make this comparison. Please note that you cannot use this information to estimate your actual ending account balance and expenses paid during the period.
| | | | | | | | | |
Expenses and Value of a $1,000 Investment | | |
assuming a hypothetical 5% annualized return for the six months ended July 31, 2017 |
| | | Class I | Investor Shares | Class Y |
Expenses paid per $1,000† | | $2.36 | | $3.56 | | $1.96 |
Ending value (after expenses) | | $1,022.46 | | $1,021.27 | | $1,022.86 |
† Expenses are equal to the fund’s annualized expense ratio of .47% for Class I, .71% for Investor Shares and .39% for Class Y, multiplied by the average account value over the period, multiplied by 181/365 (to reflect the one-half year period).
7
STATEMENT OF INVESTMENTS
July 31, 2017
| | | | | | | | | | |
| |
Description | Coupon
Rate (%) | | Maturity
Date | | Principal
Amount ($) | | Value ($) | |
Bonds and Notes - 100.0% | | | | | |
U.S. Government Securities - 100.0% | | | | | |
U.S. Treasury Inflation Protected Securities,
Bonds | | 2.38 | | 1/15/25 | | 10,386,400 | a | 11,891,026 | |
U.S. Treasury Inflation Protected Securities,
Bonds | | 2.00 | | 1/15/26 | | 7,243,993 | a | 8,162,197 | |
U.S. Treasury Inflation Protected Securities,
Notes | | 0.13 | | 4/15/19 | | 7,472,754 | a,b | 7,484,560 | |
U.S. Treasury Inflation Protected Securities,
Notes | | 0.13 | | 4/15/20 | | 11,902,892 | a | 11,950,349 | |
U.S. Treasury Inflation Protected Securities,
Notes | | 1.25 | | 7/15/20 | | 11,698,518 | a | 12,201,192 | |
U.S. Treasury Inflation Protected Securities,
Notes | | 0.13 | | 4/15/21 | | 6,066,349 | a | 6,078,967 | |
U.S. Treasury Inflation Protected Securities,
Notes | | 0.63 | | 7/15/21 | | 3,306,322 | a | 3,399,858 | |
U.S. Treasury Inflation Protected Securities,
Notes | | 0.13 | | 1/15/22 | | 8,633,861 | a | 8,660,203 | |
U.S. Treasury Inflation Protected Securities,
Notes | | 0.13 | | 4/15/22 | | 2,706,920 | a,b | 2,707,545 | |
U.S. Treasury Inflation Protected Securities,
Notes | | 0.13 | | 7/15/22 | | 2,139,042 | a | 2,150,766 | |
U.S. Treasury Inflation Protected Securities,
Notes | | 0.13 | | 1/15/23 | | 4,755,176 | a | 4,740,088 | |
U.S. Treasury Inflation Protected Securities,
Notes | | 0.38 | | 7/15/23 | | 7,508,424 | a | 7,602,902 | |
U.S. Treasury Inflation Protected Securities,
Notes | | 0.63 | | 1/15/24 | | 12,024,951 | a,b | 12,273,254 | |
U.S. Treasury Inflation Protected Securities,
Notes | | 0.13 | | 7/15/24 | | 9,002,815 | a,b | 8,901,452 | |
U.S. Treasury Inflation Protected Securities,
Notes | | 0.38 | | 7/15/25 | | 2,848,237 | a,b | 2,846,819 | |
U.S. Treasury Inflation Protected Securities,
Notes | | 0.63 | | 1/15/26 | | 12,004,105 | a | 12,156,702 | |
U.S. Treasury Inflation Protected Securities,
Notes | | 0.13 | | 7/15/26 | | 969,912 | a | 941,894 | |
U.S. Treasury Inflation Protected Securities,
Notes | | 0.38 | | 1/15/27 | | 2,765,790 | a,b | 2,732,659 | |
Total Bonds and Notes
(cost $126,961,345) | | 126,882,433 | |
8
| | | | | | | | | | |
| |
Description | | | | | Shares | | Value ($) | |
Other Investment - .4% | | | | | |
Registered Investment Company; | | | | | |
Dreyfus Institutional Preferred Government Plus Money Market Fund
(cost $486,016) | | | | | | 486,016 | c | 486,016 | |
Total Investments (cost $127,447,361) | | 100.4% | 127,368,449 | |
Liabilities, Less Cash and Receivables | | (0.4%) | (485,599) | |
Net Assets | | 100.0% | 126,882,850 | |
a Principal amount for accrual purposes is periodically adjusted based on changes in the Consumer Price Index.
b Security, or portion thereof, on loan. At July 31, 2017, the value of the fund’s securities on loan was $32,872,492 and the value of the collateral held by the fund was $33,545,941, consisting of U.S. Government & Agency securities.
c Investment in affiliated money market mutual fund.
| | |
Portfolio Summary (Unaudited) † | Value (%) |
U.S. Government & Agencies | 100.0 |
Money Market Investment | .4 |
| | 100.4 |
† Based on net assets.
See notes to financial statements.
9
STATEMENT OF INVESTMENTS IN AFFLIATED ISSUERS
| | | | | | | |
Registered Investment Companies | Value
7/31/2016 ($) | Purchases ($) | Sales ($) | Value
7/31/2017 ($) | Net
Assets (%) | Dividends/
Distributions |
Dreyfus Institutional Preferred Government Plus Money Market Fund† | 632,389 | 25,819,431 | 25,965,804 | 486,016 | .4 | 2,783 |
† Formerly Dreyfus Institutional Preferred Plus Money Market Fund.
See notes to financial statements.
10
STATEMENT OF ASSETS AND LIABILITIES
July 31, 2017
| | | | | | | |
| | | | | | |
| | | Cost | | Value | |
Assets ($): | | | | |
Investments in securities—See Statement of Investments
(including securities on loan, valued at $32,872,492)—Note 1(b): | | | | |
Unaffiliated issuers | | 126,961,345 | | 126,882,433 | |
Affiliated issuers | | 486,016 | | 486,016 | |
Receivable for investment securities sold | | | | | 5,147,636 | |
Receivable for shares of Common Stock subscribed | | | | | 95,163 | |
Dividends, interest and securities lending income receivable | | | | | 49,176 | |
Prepaid expenses | | | | | 15,222 | |
| | | | | 132,675,646 | |
Liabilities ($): | | | | |
Due to The Dreyfus Corporation and affiliates—Note 3(b) | | | | | 43,065 | |
Cash overdraft due to Custodian | | | | | 255,885 | |
Payable for investment securities purchased | | | | | 5,377,190 | |
Payable for shares of Common Stock redeemed | | | | | 55,137 | |
Accrued expenses | | | | | 61,519 | |
| | | | | 5,792,796 | |
Net Assets ($) | | | 126,882,850 | |
Composition of Net Assets ($): | | | | |
Paid-in capital | | | | | 142,254,672 | |
Accumulated undistributed investment income—net | | | | | 708,509 | |
Accumulated net realized gain (loss) on investments | | | | | (16,001,419) | |
Accumulated net unrealized appreciation (depreciation)
on investments | | | | (78,912) | |
Net Assets ($) | | | 126,882,850 | |
| | | | | |
Net Asset Value Per Share | Class I | Investor Shares | Class Y | |
Net Assets ($) | 19,525,344 | 15,236,339 | 92,121,167 | |
Shares Outstanding | 1,548,012 | 1,211,250 | 7,296,170 | |
Net Asset Value Per Share ($) | 12.61 | 12.58 | 12.63 | |
| | | | | |
See notes to financial statements. | | | | |
11
STATEMENT OF OPERATIONS
Year Ended July 31, 2017
| | | | | | | |
| | | | | | |
| | | | | | |
Investment Income ($): | | | | |
Income: | | | | |
Interest | | | 2,868,539 | |
Dividends from affiliated issuers | | | 2,783 | |
Income from securities lending—Note 1(b) | | | 15,172 | |
Total Income | | | 2,886,494 | |
Expenses: | | | | |
Management fee—Note 3(a) | | | 399,006 | |
Shareholder servicing costs—Note 3(b) | | | 71,819 | |
Professional fees | | | 62,709 | |
Registration fees | | | 48,650 | |
Directors’ fees and expenses—Note 3(c) | | | 21,758 | |
Custodian fees—Note 3(b) | | | 8,768 | |
Prospectus and shareholders’ reports | | | 6,841 | |
Loan commitment fees—Note 2 | | | 2,453 | |
Miscellaneous | | | 22,520 | |
Total Expenses | | | 644,524 | |
Less—reduction in fees due to earnings credits—Note 3(b) | | | (334) | |
Net Expenses | | | 644,190 | |
Investment Income—Net | | | 2,242,304 | |
Realized and Unrealized Gain (Loss) on Investments—Note 4 ($): | | |
Net realized gain (loss) on investments | (120,697) | |
Net unrealized appreciation (depreciation) on investments | | | (2,496,826) | |
Net Realized and Unrealized Gain (Loss) on Investments | | | (2,617,523) | |
Net (Decrease) in Net Assets Resulting from Operations | | (375,219) | |
| | | | | | | |
See notes to financial statements. | | | | | |
12
STATEMENT OF CHANGES IN NET ASSETS
| | | | | | | | | | |
| | | | Year Ended July 31, |
| | | | 2017 | | | | 2016 | |
Operations ($): | | | | | | | | |
Investment income—net | | | 2,242,304 | | | | 1,281,023 | |
Net realized gain (loss) on investments | | (120,697) | | | | (4,253,856) | |
Net unrealized appreciation (depreciation)
on investments | | (2,496,826) | | | | 6,917,554 | |
Net Increase (Decrease) in Net Assets
Resulting from Operations | (375,219) | | | | 3,944,721 | |
Distributions to Shareholders from ($): | | | | | | | | |
Investment income—net: | | | | | | | | |
Class I | | | (279,302) | | | | (99,864) | |
Investor Shares | | | (207,460) | | | | (103,794) | |
Class Y | | | (1,499,313) | | | | (679,906) | |
Total Distributions | | | (1,986,075) | | | | (883,564) | |
Capital Stock Transactions ($): | | | | | | | | |
Net proceeds from shares sold: | | | | | | | | |
Class I | | | 7,806,313 | | | | 7,652,011 | |
Investor Shares | | | 1,116,979 | | | | 2,202,821 | |
Class Y | | | 23,528,838 | | | | 12,472,469 | |
Distributions reinvested: | | | | | | | | |
Class I | | | 263,963 | | | | 81,791 | |
Investor Shares | | | 198,426 | | | | 100,424 | |
Class Y | | | 227,257 | | | | 113,553 | |
Cost of shares redeemed: | | | | | | | | |
Class I | | | (5,817,004) | | | | (10,610,085) | |
Investor Shares | | | (5,095,726) | | | | (4,902,475) | |
Class Y | | | (25,528,453) | | | | (59,658,859) | |
Increase (Decrease) in Net Assets
from Capital Stock Transactions | (3,299,407) | | | | (52,548,350) | |
Total Increase (Decrease) in Net Assets | (5,660,701) | | | | (49,487,193) | |
Net Assets ($): | | | | | | | | |
Beginning of Period | | | 132,543,551 | | | | 182,030,744 | |
End of Period | | | 126,882,850 | | | | 132,543,551 | |
Undistributed investment income—net | 708,509 | | | | 452,280 | |
13
STATEMENT OF CHANGES IN NET ASSETS (continued)
| | | | | | | | | | |
| | | | Year Ended July 31, |
| | | | 2017 | | | | 2016 | |
Capital Share Transactions (Shares): | | | | | | | | |
Class Ia | | | | | | | | |
Shares sold | | | 616,365 | | | | 609,204 | |
Shares issued for distributions reinvested | | | 20,902 | | | | 6,511 | |
Shares redeemed | | | (458,785) | | | | (852,581) | |
Net Increase (Decrease) in Shares Outstanding | 178,482 | | | | (236,866) | |
Investor Shares | | | | | | | | |
Shares sold | | | 88,524 | | | | 176,121 | |
Shares issued for distributions reinvested | | | 15,752 | | | | 8,019 | |
Shares redeemed | | | (403,059) | | | | (393,433) | |
Net Increase (Decrease) in Shares Outstanding | (298,783) | | | | (209,293) | |
Class Ya | | | | | | | | |
Shares sold | | | 1,858,498 | | | | 1,001,808 | |
Shares issued for distributions reinvested | | | 17,978 | | | | 9,078 | |
Shares redeemed | | | (2,015,456) | | | | (4,801,016) | |
Net Increase (Decrease) in Shares Outstanding | (138,980) | | | | (3,790,130) | |
| | | | | | | | | | |
aDuring the period ended July 31, 2017, 117,128 Class Y shares representing $1,489,210 were exchanged for 117,226 Class I shares and during the period ended July 31, 2016, 66,199 Class Y shares representing $840,988 were exchanged for 67,147 Class I shares. | |
See notes to financial statements. | | | | | | | | |
14
FINANCIAL HIGHLIGHTS
The following tables describe the performance for each share class for the fiscal periods indicated. All information (except portfolio turnover rate) reflects financial results for a single fund share. Total return shows how much your investment in the fund would have increased (or decreased) during each period, assuming you had reinvested all dividends and distributions. These figures have been derived from the fund’s financial statements.
| | | | | | | |
| | | |
| | Year Ended July 31, |
Class I Shares | | 2017 | 2016 | 2015 | 2014 | 2013a |
Per Share Data ($): | | | | | | |
Net asset value, beginning of period | | 12.85 | 12.51 | 12.89 | 12.80 | 14.42 |
Investment Operations: | | | | | | |
Investment income—netb | | .21 | .10 | .01 | .28 | .26 |
Net realized and unrealized
gain (loss) on investments | | (.26) | .31 | (.30) | .07 | (1.07) |
Total from Investment Operations | | (.05) | .41 | (.29) | .35 | (.81) |
Distributions: | | | | | | |
Dividends from
investment income-net | | (.19) | (.07) | (.09) | (.26) | (.28) |
Dividends from net realized
gain on investments | | - | - | - | - | (.53) |
Total Distributions | | (.19) | (.07) | (.09) | (.26) | (.81) |
Net asset value, end of period | | 12.61 | 12.85 | 12.51 | 12.89 | 12.80 |
Total Return (%) | | (.39) | 3.27 | (2.24) | 2.76 | (6.01) |
Ratios/Supplemental Data (%): | | | | | | |
Ratio of total expenses
to average net assets | | .51 | .54 | .52 | .40 | .37 |
Ratio of net expenses
to average net assets | | .51 | .54 | .52 | .40 | .37 |
Ratio of net investment income
to average net assets | | 1.67 | .80 | .05 | 2.23 | 1.85 |
Portfolio Turnover Rate | | 51.76 | 59.68 | 53.54 | 74.65 | 131.32 |
Net Assets, end of period ($ x 1,000) | | 19,525 | 17,594 | 20,099 | 33,537 | 305,695 |
a Effective July 1, 2013, the existing Institutional shares were redesignated as Class I shares.
b Based on average shares outstanding.
See notes to financial statements.
15
FINANCIAL HIGHLIGHTS (continued)
| | | | | | | |
| | | |
| | Year Ended July 31, |
Investor Shares | | 2017 | 2016 | 2015 | 2014 | 2013 |
Per Share Data ($): | | | | | | |
Net asset value, beginning of period | | 12.81 | 12.50 | 12.90 | 12.81 | 14.42 |
Investment Operations: | | | | | | |
Investment income (loss)—neta | | .18 | .07 | (.03) | .24 | .20 |
Net realized and unrealized
gain (loss) on investments | | (.26) | .30 | (.29) | .07 | (1.05) |
Total from Investment Operations | | (.08) | .37 | (.32) | .31 | (.85) |
Distributions: | | | | | | |
Dividends from
investment income-net | | (.15) | (.06) | (.08) | (.22) | (.23) |
Dividends from net realized
gain on investments | | - | - | - | - | (.53) |
Total Distributions | | (.15) | (.06) | (.08) | (.22) | (.76) |
Net asset value, end of period | | 12.58 | 12.81 | 12.50 | 12.90 | 12.81 |
Total Return (%) | | (.60) | 3.00 | (2.52) | 2.44 | (6.26) |
Ratios/Supplemental Data (%): | | | | | | |
Ratio of total expenses
to average net assets | | .76 | .76 | .74 | .72 | .70 |
Ratio of net expenses
to average net assets | | .76 | .76 | .74 | .72 | .70 |
Ratio of net investment income
(loss) to average net assets | | 1.41 | .58 | (.25) | 1.92 | 1.40 |
Portfolio Turnover Rate | | 51.76 | 59.68 | 53.54 | 74.65 | 131.32 |
Net Assets, end of period ($ x 1,000) | | 15,236 | 19,343 | 21,488 | 26,864 | 36,559 |
a Based on average shares outstanding.
See notes to financial statements.
16
| | | | | | |
| | | |
| | Year Ended July 31, |
Class Y Shares | 2017 | 2016 | 2015 | 2014 | 2013a |
Per Share Data ($): | | | | | |
Net asset value, beginning of period | 12.86 | 12.51 | 12.89 | 12.81 | 12.76 |
Investment Operations: | | | | | |
Investment income—netb | .22 | .11 | .01 | .28 | .03 |
Net realized and unrealized
gain (loss) on investments | (.25) | .31 | (.29) | .06 | .05 |
Total from Investment Operations | (.03) | .42 | (.28) | .34 | .08 |
Distributions: | | | | | |
Dividends from
investment income-net | (.20) | (.07) | (.10) | (.26) | (.03) |
Net asset value, end of period | 12.63 | 12.86 | 12.51 | 12.89 | 12.81 |
Total Return (%) | (.24) | 3.36 | (2.19) | 2.72 | .60c |
Ratios/Supplemental Data (%): | | | | | |
Ratio of total expenses
to average net assets | .43 | .44 | .41 | .39 | .36d |
Ratio of net expenses
to average net assets | .43 | .44 | .41 | .39 | .36d |
Ratio of net investment income
to average net assets | 1.74 | .90 | .11 | 2.24 | 2.36d |
Portfolio Turnover Rate | 51.76 | 59.68 | 53.54 | 74.65 | 131.32 |
Net Assets, end of period ($ x 1,000) | 92,121 | 95,606 | 140,443 | 170,021 | 1 |
a From July 1, 2013 (commencement of initial offering) to July 31, 2013.
b Based on average shares outstanding.
c Not annualized.
d Annualized.
See notes to financial statements.
17
NOTES TO FINANCIAL STATEMENTS
NOTE 1—Significant Accounting Policies:
Dreyfus Inflation Adjusted Securities Fund (the “fund”) is a separate diversified series of Dreyfus Investment Grade Funds, Inc. (the “Company”), which is registered under the Investment Company Act of 1940, as amended (the “Act”), as an open-end management investment company and operates as a series company currently offering three series, including the fund. The fund’s investment objective is to seek returns that exceed the rate of inflation. The Dreyfus Corporation (the “Manager” or “Dreyfus”), a wholly-owned subsidiary of The Bank of New York Mellon Corporation (“BNY Mellon”), serves as the fund’s investment adviser.
MBSC Securities Corporation (the “Distributor”), a wholly-owned subsidiary of Dreyfus, is the distributor of the fund’s shares. The fund is authorized to issue 1.1 billion shares of $.001 par value Common Stock. The fund currently has authorized three classes of shares: Class I (500 million shares authorized), Investor (500 million shares authorized) and Class Y (100 million shares authorized). Class I and Class Y shares are sold at net asset value per share generally to institutional investors. Investor shares are subject to a Shareholder Services Plan fee. Other differences between the classes include the services offered to and the expenses borne by each class, the allocation of certain transfer agency costs, and certain voting rights. Income, expenses (other than expenses attributable to a specific class), and realized and unrealized gains or losses on investments are allocated to each class of shares based on its relative net assets.
The Company accounts separately for the assets, liabilities and operations of each series. Expenses directly attributable to each series are charged to that series’ operations; expenses which are applicable to all series are allocated among them on a pro rata basis.
The Financial Accounting Standards Board (“FASB”) Accounting Standards Codification is the exclusive reference of authoritative U.S. generally accepted accounting principles (“GAAP”) recognized by the FASB to be applied by nongovernmental entities. Rules and interpretive releases of the Securities and Exchange Commission (“SEC”) under authority of federal laws are also sources of authoritative GAAP for SEC registrants. The fund’s financial statements are prepared in accordance with GAAP, which may require the use of management estimates and assumptions. Actual results could differ from those estimates.
The Company enters into contracts that contain a variety of indemnifications. The fund’s maximum exposure under these
18
arrangements is unknown. The fund does not anticipate recognizing any loss related to these arrangements.
(a) Portfolio valuation: The fair value of a financial instrument is the amount that would be received to sell an asset or paid to transfer a liability in an orderly transaction between market participants at the measurement date (i.e., the exit price). GAAP establishes a fair value hierarchy that prioritizes the inputs of valuation techniques used to measure fair value. This hierarchy gives the highest priority to unadjusted quoted prices in active markets for identical assets or liabilities (Level 1 measurements) and the lowest priority to unobservable inputs (Level 3 measurements).
Additionally, GAAP provides guidance on determining whether the volume and activity in a market has decreased significantly and whether such a decrease in activity results in transactions that are not orderly. GAAP requires enhanced disclosures around valuation inputs and techniques used during annual and interim periods.
Various inputs are used in determining the value of the fund’s investments relating to fair value measurements. These inputs are summarized in the three broad levels listed below:
Level 1—unadjusted quoted prices in active markets for identical investments.
Level 2—other significant observable inputs (including quoted prices for similar investments, interest rates, prepayment speeds, credit risk, etc.).
Level 3—significant unobservable inputs (including the fund’s own assumptions in determining the fair value of investments).
The inputs or methodology used for valuing securities are not necessarily an indication of the risk associated with investing in those securities.
Changes in valuation techniques may result in transfers in or out of an assigned level within the disclosure hierarchy. Valuation techniques used to value the fund’s investments are as follows:
Registered investment companies that are not traded on an exchange are valued at their net asset value and are generally categorized within Level 1 of the fair value hierarchy.
Investments in securities, excluding short-term investments (other than U.S. Treasury Bills), are valued each business day by an independent pricing service (the “Service”) approved by the Company’s Board of Directors (the “Board”). Investments for which quoted bid prices are readily available and are representative of the bid side of the market in the
19
NOTES TO FINANCIAL STATEMENTS (continued)
judgment of the Service are valued at the mean between the quoted bid prices (as obtained by the Service from dealers in such securities) and asked prices (as calculated by the Service based upon its evaluation of the market for such securities). Other investments (which constitute a majority of the portfolio securities) are valued as determined by the Service, based on methods which include consideration of the following: yields or prices of securities of comparable quality, coupon, maturity and type; indications as to values from dealers; and general market conditions. These securities are generally categorized within Level 2 of the fair value hierarchy.
The Service is engaged under the general supervision of the Board.
When market quotations or official closing prices are not readily available, or are determined not to reflect accurately fair value, such as when the value of a security has been significantly affected by events after the close of the exchange or market on which the security is principally traded (for example, a foreign exchange or market), but before the fund calculates its net asset value, the fund may value these investments at fair value as determined in accordance with the procedures approved by the Board. Certain factors may be considered when fair valuing investments such as: fundamental analytical data, the nature and duration of restrictions on disposition, an evaluation of the forces that influence the market in which the securities are purchased and sold, and public trading in similar securities of the issuer or comparable issuers. These securities are either categorized within Level 2 or 3 of the fair value hierarchy depending on the relevant inputs used.
For restricted securities where observable inputs are limited, assumptions about market activity and risk are used and are generally categorized within Level 3 of the fair value hierarchy.
The following is a summary of the inputs used as of July 31, 2017 in valuing the fund’s investments:
| | | | | |
| | Level 1 - Unadjusted Quoted Prices | Level 2 - Other Significant Observable Inputs | Level 3 - Significant Unobservable Inputs | Total |
Assets($) Investments in Securities: | | | | |
Registered
Investment Company | 486,016 | - | - | 486,016 |
U.S. Treasury | - | 126,882,433 | - | 126,882,433 |
At July 31, 2017, there were no transfers between levels of the fair value hierarchy.
20
(b) Securities transactions and investment income: Securities transactions are recorded on a trade date basis. Realized gains and losses from securities transactions are recorded on the identified cost basis. Dividend income is recognized on the ex-dividend date and interest income, including, where applicable, accretion of discount and amortization of premium on investments, is recognized on the accrual basis.
Pursuant to a securities lending agreement with The Bank of New York Mellon, a subsidiary of BNY Mellon and an affiliate of Dreyfus, the fund may lend securities to qualified institutions. It is the fund’s policy that, at origination, all loans are secured by collateral of at least 102% of the value of U.S. securities loaned and 105% of the value of foreign securities loaned. Collateral equivalent to at least 100% of the market value of securities on loan is maintained at all times. Collateral is either in the form of cash, which can be invested in certain money market mutual funds managed by Dreyfus, or U.S. Government and Agency securities. The fund is entitled to receive all dividends, interest and distributions on securities loaned, in addition to income earned as a result of the lending transaction. Should a borrower fail to return the securities in a timely manner, The Bank of New York Mellon is required to replace the securities for the benefit of the fund or credit the fund with the market value of the unreturned securities and is subrogated to the fund’s rights against the borrower and the collateral. Additionally, the contractual maturity of security lending transactions are on an overnight and continuous basis. During the period ended July 31, 2017, The Bank of New York Mellon earned $3,272 from lending portfolio securities, pursuant to the securities lending agreement.
(c) Affiliated issuers: Investments in other investment companies advised by Dreyfus are defined as “affiliated” under the Act.
(d) Dividends and distributions to shareholders: It is the policy of the fund to declare dividends daily from investment income-net. Such dividends are paid monthly. Dividends from net realized capital gains, if any, are normally declared and paid annually, but the fund may make distributions on a more frequent basis to comply with the distribution requirements of the Internal Revenue Code of 1986, as amended (the “Code”). To the extent that net realized capital gains can be offset by capital loss carryovers, it is the policy of the fund not to distribute such gains. Income and capital gain distributions are determined in accordance with income tax regulations, which may differ from GAAP.
(e) Federal income taxes: It is the policy of the fund to continue to qualify as a regulated investment company, if such qualification is in the
21
NOTES TO FINANCIAL STATEMENTS (continued)
best interests of its shareholders, by complying with the applicable provisions of the Code, and to make distributions of taxable income sufficient to relieve it from substantially all federal income and excise taxes.
As of and during the period ended July 31, 2017, the fund did not have any liabilities for any uncertain tax positions. The fund recognizes interest and penalties, if any, related to uncertain tax positions as income tax expense in the Statement of Operations. During the period ended July 31, 2017, the fund did not incur any interest or penalties.
Each tax year in the four-year period ended July 31, 2017 remains subject to examination by the Internal Revenue Service and state taxing authorities.
At July 31, 2017, the components of accumulated earnings on a tax basis were as follows: undistributed ordinary income $708,509, accumulated capital losses $15,308,366 and unrealized depreciation $771,965.
Under the Regulated Investment Company Modernization Act of 2010, the fund is permitted to carry forward capital losses for an unlimited period. Furthermore, capital loss carryovers retain their character as either short-term or long-term capital losses.
The accumulated capital loss carryover is available for federal income tax purposes to be applied against future net realized capital gains, if any, realized subsequent to July 31, 2017. The fund has $8,027,239 of short-term capital losses and $7,281,127 of long-term capital losses which can be carried forward for an unlimited period.
The tax character of distributions paid to shareholders during the fiscal periods ended July 31, 2017 and July 31, 2016 were as follows: ordinary income $1,986,075 and $883,564, respectively.
NOTE 2—Bank Lines of Credit:
The fund participates with other Dreyfus-managed funds in an $810 million unsecured credit facility led by Citibank, N.A. and a $300 million unsecured credit facility provided by The Bank of New York Mellon (each, a “Facility”), each to be utilized primarily for temporary or emergency purposes, including the financing of redemptions. Prior to October 5, 2016, the unsecured credit facility with Citibank, N.A. was $555 million. In connection therewith, the fund has agreed to pay its pro rata portion of commitment fees for each Facility. Interest is charged to the fund based on rates determined pursuant to the terms of the respective Facility at the time of borrowing. During the period ended July 31, 2017, the fund did not borrow under the Facilities.
22
NOTE 3—Management Fee and Other Transactions with Affiliates:
(a) Pursuant to a management agreement with Dreyfus, the management fee is computed at the annual rate of .30% of the value of the fund’s average daily net assets and is payable monthly.
(b) Under the Shareholder Services Plan, Investor shares pay the Distributor at an annual rate of .25% of the value of its average daily net assets for the provision of certain services. The services provided may include personal services relating to shareholder accounts, such as answering shareholder inquiries regarding the fund and providing reports and other information, and services related to the maintenance of shareholder accounts, such as recordkeeping and sub-accounting services. The Distributor may make payments to Service Agents (securities dealers, financial institutions or other industry professionals) with respect to these services. The Distributor determines the amounts to be paid to Service Agents. During the period ended July 31, 2017, the fund was charged $42,948 pursuant to the Shareholder Services Plan.
The fund has arrangements with the transfer agent and the custodian whereby the fund may receive earnings credits when positive cash balances are maintained, which are used to offset transfer agency and custody fees. For financial reporting purposes, the fund includes net earnings credits as an expense offset in the Statement of Operations.
The fund compensates Dreyfus Transfer, Inc., a wholly-owned subsidiary of Dreyfus, under a transfer agency agreement for providing transfer agency and cash management services for the fund. The majority of transfer agency fees are comprised of amounts paid on a per account basis, while cash management fees are related to fund subscriptions and redemptions. During the period ended July 31, 2017, the fund was charged $6,417 for transfer agency services and $365 for cash management services. These fees are included in Shareholder servicing costs in the Statement of Operations. Cash management fees were partially offset by earnings credits of $334.
The fund compensates The Bank of New York Mellon under a custody agreement for providing custodial services for the fund. These fees are determined based on net assets, geographic region and transaction activity. During the period ended July 31, 2017, the fund was charged $8,768 pursuant to the custody agreement.
During the period ended July 31, 2017, the fund was charged $11,180 for services performed by the Chief Compliance Officer and his staff.
23
NOTES TO FINANCIAL STATEMENTS (continued)
The components of “Due to The Dreyfus Corporation and affiliates” in the Statement of Assets and Liabilities consist of: management fees $32,514, Shareholder Services Plan fees $3,296, custodian fees $2,475, Chief Compliance Officer fees $3,736 and transfer agency fees $1,044.
(c) Each Board member also serves as a Board member of other funds within the Dreyfus complex. Annual retainer fees and attendance fees are allocated to each fund based on net assets.
NOTE 4—Securities Transactions:
The aggregate amount of purchases and sales of investment securities, excluding short-term securities during the period ended July 31, 2017, amounted to $68,422,291 and $71,006,890, respectively.
At July 31, 2017, the cost of investments for federal income tax purposes was $128,140,414; accordingly, accumulated net unrealized depreciation on investments was $771,965, consisting of $538,271 gross unrealized appreciation and $1,310,236 gross unrealized depreciation.
24
REPORT OF INDEPENDENT REGISTERED
PUBLIC ACCOUNTING FIRM
Shareholders and Board of Directors
Dreyfus Inflation Adjusted Securities Fund
We have audited the accompanying statement of assets and liabilities, including the statement of investments and investments in affiliated issuers, of Dreyfus Inflation Adjusted Securities Fund (one of the series comprising Dreyfus Investment Grade Funds, Inc.) as of July 31, 2017, and the related statement of operations for the year then ended, the statement of changes in net assets for each of the two years in the period then ended, and the financial highlights for each of the periods indicated therein. These financial statements and financial highlights are the responsibility of the Fund’s management. Our responsibility is to express an opinion on these financial statements and financial highlights based on our audits.
We conducted our audits in accordance with the standards of the Public Company Accounting Oversight Board (United States). Those standards require that we plan and perform the audit to obtain reasonable assurance about whether the financial statements and financial highlights are free of material misstatement. We were not engaged to perform an audit of the Fund’s internal control over financial reporting. Our audits included consideration of internal control over financial reporting as a basis for designing audit procedures that are appropriate in the circumstances, but not for the purpose of expressing an opinion on the effectiveness of the Fund’s internal control over financial reporting. Accordingly, we express no such opinion. An audit also includes examining, on a test basis, evidence supporting the amounts and disclosures in the financial statements and financial highlights, assessing the accounting principles used and significant estimates made by management, and evaluating the overall financial statement presentation. Our procedures included confirmation of securities owned as of July 31, 2017 by correspondence with the custodian and others. We believe that our audits provide a reasonable basis for our opinion.
In our opinion, the financial statements and financial highlights referred to above present fairly, in all material respects, the financial position of Dreyfus Inflation Adjusted Securities Fund at July 31, 2017, the results of its operations for the year then ended, the changes in its net assets for each of the two years in the period then ended, and the financial highlights for each of the indicated periods, in conformity with U.S. generally accepted accounting principles.

New York, New York
September 27, 2017
25
IMPORTANT TAX INFORMATION (Unaudited)
For federal tax purposes the fund hereby reports 100% of ordinary income dividends paid during the fiscal year ended July 31, 2017 as qualifying “interest related dividends.” Also, for state individual income tax purposes, the Fund hereby reports 100% of the ordinary income dividends paid during its fiscal year ended July 31, 2017 as attributable to interest income from direct obligations of the United States. Such dividends are currently exempt from taxation for individual income tax purposes in most states, including New York, California, Connecticut and the District of Columbia.
26
INFORMATION ABOUT THE RENEWAL OF THE FUND’S MANAGEMENT AGREEMENT (Unaudited)
At a meeting of the fund’s Board of Directors held on July 25-26, 2017, the Board considered the renewal of the fund’s Management Agreement pursuant to which Dreyfus provides the fund with investment advisory and administrative services (the “Agreement”). The Board members, a majority of whom are not “interested persons” (as defined in the Investment Company Act of 1940, as amended) of the fund, were assisted in their review by independent legal counsel and met with counsel in executive session separate from Dreyfus representatives. In considering the renewal of the Agreement, the Board considered all factors that it believed to be relevant, including those discussed below. The Board did not identify any one factor as dispositive, and each Board member may have attributed different weights to the factors considered.
Analysis of Nature, Extent, and Quality of Services Provided to the Fund. The Board considered information provided to them at the meeting and in previous presentations from Dreyfus representatives regarding the nature, extent, and quality of the services provided to funds in the Dreyfus fund complex. Dreyfus provided the number of open accounts in the fund, the fund’s asset size and the allocation of fund assets among distribution channels. Dreyfus also had previously provided information regarding the diverse intermediary relationships and distribution channels of funds in the Dreyfus fund complex (such as retail direct or intermediary, in which intermediaries typically are paid by the fund and/or Dreyfus) and Dreyfus’ corresponding need for broad, deep, and diverse resources to be able to provide ongoing shareholder services to each intermediary or distribution channel, as applicable to the fund.
The Board also considered research support available to, and portfolio management capabilities of, the fund’s portfolio management personnel and that Dreyfus also provides oversight of day-to-day fund operations, including fund accounting and administration and assistance in meeting legal and regulatory requirements. The Board also considered Dreyfus’ extensive administrative, accounting and compliance infrastructures.
Comparative Analysis of the Fund’s Performance and Management Fee and Expense Ratio. The Board reviewed reports prepared by Broadridge Financial Solutions, Inc. (“Broadridge”), an independent provider of investment company data, which included information comparing (1) the fund’s performance with the performance of a group of comparable funds (the “Performance Group”) and with a broader group of funds (the “Performance Universe”), all for various periods ended May 31, 2017, and (2) the fund’s actual and contractual management fees and total expenses with those of a group of comparable funds (the “Expense Group”) and with a broader group of funds (the “Expense Universe”), the information for which was derived in part from fund financial statements available to Broadridge as of the date of its analysis. Dreyfus previously had furnished the Board with a description of the methodology Broadridge used to select the Performance Group and Performance Universe and the Expense Group and Expense Universe.
Dreyfus representatives stated that the usefulness of performance comparisons may be affected by a number of factors, including different investment limitations that may be
27
INFORMATION ABOUT THE RENEWAL OF THE FUND’S MANAGEMENT AGREEMENT (Unaudited) (continued)
applicable to the fund and comparison funds. The Board discussed with representatives of Dreyfus and/or its affiliates the results of the comparisons and considered that the fund’s total return performance was below the Performance Group and Performance Universe medians for all periods. The Board also considered that the fund’s yield performance was at or above the Performance Group median, and was above the Performance Universe median, for seven of the ten one-year periods ended May 31st. Dreyfus also provided a comparison of the fund’s calendar year total returns to the returns of the fund’s benchmark index, and it was noted that the fund’s total return was above the return of the index in five of the ten years shown.
The Board also reviewed the range of actual and contractual management fees and total expenses of the Expense Group and Expense Universe funds and discussed the results of the comparisons. The Board considered that the fund’s contractual management fee was below the Expense Group median (lowest in the Expense Group), the fund’s actual management fee was slightly above the Expense Group and Expense Universe medians, and the fund’s total expense ratio was above the Expense Group and Expense Universe medians.
Dreyfus representatives reviewed with the Board the management or investment advisory fees (1) paid by funds advised or administered by Dreyfus that are in the same Broadridge category as the fund and (2) paid to Dreyfus or the Dreyfus-affiliated primary employer of the fund’s primary portfolio manager(s) for advising any separate accounts and/or other types of client portfolios that are considered to have similar investment strategies and policies as the fund (the “Similar Clients”), and explained the nature of the Similar Clients. They discussed differences in fees paid and the relationship of the fees paid in light of any differences in the services provided and other relevant factors. The Board considered the relevance of the fee information provided for the Similar Clients to evaluate the appropriateness of the fund’s management fee.
Analysis of Profitability and Economies of Scale. Dreyfus representatives reviewed the expenses allocated and profit received by Dreyfus and its affiliates and the resulting profitability percentage for managing the fund and the aggregate profitability percentage to Dreyfus and its affiliates for managing the funds in the Dreyfus fund complex, and the method used to determine the expenses and profit. The Board concluded that the profitability results were not unreasonable, given the services rendered and service levels provided by Dreyfus. The Board also had been provided with information prepared by an independent consulting firm regarding Dreyfus’ approach to allocating costs to, and determining the profitability of, individual funds and the entire Dreyfus fund complex. The consulting firm also had analyzed where any economies of scale might emerge in connection with the management of a fund.
The Board considered, on the advice of its counsel, the profitability analysis (1) as part of its evaluation of whether the fees under the Agreement, considered in relation to the mix of services provided by Dreyfus, including the nature, extent and quality of such services, supported the renewal of the Agreement and (2) in light of the relevant circumstances for the fund and the extent to which economies of scale would be realized if the fund grows and whether fee levels reflect these economies of scale for the
28
benefit of fund shareholders. Dreyfus representatives stated that a discussion of economies of scale is predicated on a fund having achieved a substantial size with increasing assets and that, if a fund’s assets had been stable or decreasing, the possibility that Dreyfus may have realized any economies of scale would be less. Dreyfus representatives also stated that, as a result of shared and allocated costs among funds in the Dreyfus fund complex, the extent of economies of scale could depend substantially on the level of assets in the complex as a whole, so that increases and decreases in complex-wide assets can affect potential economies of scale in a manner that is disproportionate to, or even in the opposite direction from, changes in the fund’s asset level. The Board also considered potential benefits to Dreyfus from acting as investment adviser and took into consideration that there were no soft dollar arrangements in effect for trading the fund’s investments.
At the conclusion of these discussions, the Board agreed that it had been furnished with sufficient information to make an informed business decision with respect to the renewal of the Agreement. Based on the discussions and considerations as described above, the Board concluded and determined as follows.
· The Board concluded that the nature, extent and quality of the services provided by Dreyfus are adequate and appropriate.
· The Board generally was satisfied with the fund’s yield performance, but expressed concern about the fund’s total return performance and agreed to closely monitor performance.
· The Board concluded that the fee paid to Dreyfus supported the renewal of the Agreement in light of the considerations described above.
· The Board determined that the economies of scale which may accrue to Dreyfus and its affiliates in connection with the management of the fund had been adequately considered by Dreyfus in connection with the fee rate charged to the fund pursuant to the Agreement and that, to the extent in the future it were determined that material economies of scale had not been shared with the fund, the Board would seek to have those economies of scale shared with the fund.
In evaluating the Agreement, the Board considered these conclusions and determinations and also relied on its previous knowledge, gained through meetings and other interactions with Dreyfus and its affiliates, of Dreyfus and the services provided to the fund by Dreyfus. The Board also relied on information received on a routine and regular basis throughout the year relating to the operations of the fund and the investment management and other services provided under the Agreement, including information on the investment performance of the fund in comparison to similar mutual funds and benchmark performance indices; general market outlook as applicable to the fund; and compliance reports. In addition, the Board’s consideration of the contractual fee arrangements for this fund had the benefit of a number of years of reviews of the Agreement for the fund, or substantially similar agreements for other Dreyfus funds that the Board oversees, during which lengthy discussions took place
29
INFORMATION ABOUT THE RENEWAL OF THE FUND’S MANAGEMENT AGREEMENT (Unaudited) (continued)
between the Board and Dreyfus representatives. Certain aspects of the arrangements may receive greater scrutiny in some years than in others, and the Board’s conclusions may be based, in part, on their consideration of the fund’s arrangements, or similar arrangements for other Dreyfus funds that the Board oversees, in prior years. The Board determined to renew the Agreement.
30
BOARD MEMBERS INFORMATION (Unaudited)
INDEPENDENT BOARD MEMBERS
Joseph S. DiMartino (73)
Chairman of the Board (1995)
Principal Occupation During Past 5 Years:
· Corporate Director and Trustee (1995-present)
Other Public Company Board Memberships During Past 5 Years:
· CBIZ (formerly, Century Business Services, Inc.), a provider of outsourcing functions for small and medium size companies, Director (1997-present)
No. of Portfolios for which Board Member Serves: 130
———————
Francine J. Bovich (65)
Board Member (2015)
Principal Occupation During Past 5 Years:
· Trustee, The Bradley Trusts, private trust funds (2011-present)
Other Public Company Board Membership During Past 5 Years:
· Annaly Capital Management, Inc., Board Member (May 2014-present)
No. of Portfolios for which Board Member Serves: 76
———————
Isabel P. Dunst (70)
Board Member (2014)
Principal Occupation During Past 5 Years:
· Of Counsel to the law firm of Hogan Lovells LLP (2015-present; previously, Partner, 1990-2014)
No. of Portfolios for which Board Member Serves: 34
———————
Nathan Leventhal (74)
Board Member (2009)
Principal Occupation During Past 5 Years:
· President Emeritus of Lincoln Center for the Performing Arts (2001-present)
· Chairman of the Avery Fisher Artist Program (1997-2014)
· Commissioner, NYC Planning Commission (2007-2011)
Other Public Company Board Membership During Past 5 Years:
· Movado Group, Inc., Director (2003-present)
No. of Portfolios for which Board Member Serves: 48
———————
31
BOARD MEMBERS INFORMATION (Unaudited) (continued)
INDEPENDENT BOARD MEMBERS (continued)
Robin A. Melvin (53)
Board Member (2014)
Principal Occupation During Past 5 Years:
· Co-chairman, Illinois Mentoring Partnership, non-profit organization dedicated to increasing the quantity and quality of mentoring services in Illinois (2014-present; board member since 2013)
· Director, Boisi Family Foundation, a private family foundation that supports youth-serving organizations that promote the self sufficiency of youth from disadvantaged circumstances (1995-2012)
No. of Portfolios for which Board Member Serves: 102
———————
Roslyn M. Watson (67)
Board Member (2014)
Principal Occupation During Past 5 Years:
· Principal, Watson Ventures, Inc., a real estate investment company (1993-present)
No. of Portfolios for which Board Member Serves: 62
———————
Benaree Pratt Wiley (71)
Board Member (2009)
Principal Occupation During Past 5 Years:
· Principal, The Wiley Group, a firm specializing in strategy and business development (2005-present)
Other Public Company Board Membership During Past 5 Years:
· CBIZ (formerly, Century Business Services, Inc.), a provider of outsourcing functions for small and medium size companies, Director (2008-present)
No. of Portfolios for which Board Member Serves: 83
———————
32
INTERESTED BOARD MEMBERS
J. Charles Cardona (61)
Board Member (2014)
Principal Occupation During Past 5 Years:
· Retired. President and a Director of the Manager (2008-2016), Chairman of the Distributor (2013-2016, Executive Vice President, 1997-2013), No. of Portfolios for which Board Member Serves: 34
J. Charles Cardona is deemed to be an “interested person” (as defined under the Act) of the Company as a result of his previous affiliation with The Dreyfus Corporation.
———————
Gordon J. Davis (75)
Board Member (2012)
Principal Occupation During Past 5 Years:
· Partner in the law firm of Venable LLP (2012-present)
· Partner in the law firm of Dewey & LeBoeuf LLP (1994-2012)
Other Public Company Board Membership During Past 5 Years:
· Consolidated Edison, Inc., a utility company, Director (1997-2014)
· The Phoenix Companies, Inc., a life insurance company, Director (2000-2014)
No. of Portfolios for which Board Member Serves: 55
Gordon J. Davis is deemed to be an “interested person” (as defined under the Act) of the Company as a result of his affiliation with Venable LLP, which provides legal services to the Company.
———————
Once elected all Board Members serve for an indefinite term, but achieve Emeritus status upon reaching age 80. The address of the Board Members and Officers is c/o The Dreyfus Corporation, 200 Park Avenue, New York, New York 10166. Additional information about the Board Members is available in the fund’s Statement of Additional Information which can be obtained from Dreyfus free of charge by calling this toll free number: 1-800-DREYFUS.
Clifford L. Alexander, Jr., Emeritus Board Member
Whitney I. Gerald, Emeritus Board Member
George L. Perry, Emeritus Board Member
33
OFFICERS OF THE FUND (Unaudited)
BRADLEY J. SKAPYAK, President since January 2010.
Chief Operating Officer and a director of the Manager since June 2009, Chairman of Dreyfus Transfer, Inc., an affiliate of the Manager and the transfer agent of the funds, since May 2011 and Chief Executive Officer of MBSC Securities Corporation since August 2016. He is an officer of 63 investment companies (comprised of 130 portfolios) managed by the Manager. He is 58 years old and has been an employee of the Manager since February 1988.
BENNETT A. MACDOUGALL, Chief Legal Officer since October 2015.
Chief Legal Officer of the Manager and Associate General Counsel and Managing Director of BNY Mellon since June 2015; from June 2005 to June 2015, he served in various capacities with Deutsche Bank – Asset & Wealth Management Division, including as Director and Associate General Counsel, and Chief Legal Officer of Deutsche Investment Management Americas Inc. from June 2012 to May 2015. He is an officer of 64 investment companies (comprised of 155 portfolios) managed by the Manager. He is 45 years old and has been an employee of the Manager since June 2015.
JANETTE E. FARRAGHER, Vice President and Secretary since December 2011.
Associate General Counsel of BNY Mellon, and an officer of 64 investment companies (comprised of 155 portfolios) managed by the Manager. She is 54 years old and has been an employee of the Manager since February 1984.
JAMES BITETTO, Vice President and Assistant Secretary since August 2005.
Managing Counsel of BNY Mellon and Secretary of the Manager, and an officer of 64 investment companies (comprised of 155 portfolios) managed by the Manager. He is 51 years old and has been an employee of the Manager since December 1996.
JOSEPH M. CHIOFFI, Vice President and Assistant Secretary since August 2005.
Managing Counsel of BNY Mellon, and an officer of 64 investment companies (comprised of 155 portfolios) managed by the Manager. He is 55 years old and has been an employee of the Manager since June 2000.
MAUREEN E. KANE, Vice President and Assistant Secretary since April 2015.
Managing Counsel of BNY Mellon since July 2014; from October 2004 until July 2014, General Counsel, and from May 2009 until July 2014, Chief Compliance Officer of Century Capital Management. She is an officer of 64 investment companies (comprised of 155 portfolios) managed by the Manager. She is 55 years old and has been an employee of the Manager since July 2014.
SARAH S. KELLEHER, Vice President and Assistant Secretary since April 2014.
Senior Counsel of BNY Mellon since March 2013, from August 2005 to March 2013, Associate General Counsel of Third Avenue Management. She is an officer of 64 investment companies (comprised of 155 portfolios) managed by the Manager. She is 41 years old and has been an employee of the Manager since March 2013.
JEFF PRUSNOFSKY, Vice President and Assistant Secretary since August 2005.
Senior Managing Counsel of BNY Mellon, and an officer of 64 investment companies (comprised of 155 portfolios) managed by the Manager. He is 52 years old and has been an employee of the Manager since October 1990.
NATALYA ZELENSKY, Vice President and Assistant Secretary since March 2017.
Counsel and Vice President of BNY Mellon since May 2016; Attorney at Wildermuth Endowment Strategy Fund/Wildermuth Advisory, LLC from November 2015 until May 2016; Assistant General Counsel at RCS Advisory Services from July 2014 until November 2015; Associate at Sutherland, Asbill & Brennan from January 2013 until January 2014; Associate at K&L Gates from October 2011 until January 2013. She is an officer of 64 investment companies (comprised of 155 portfolios) managed by Dreyfus. She is 32 years old and has been an employee of the Manager since May 2016.
JAMES WINDELS, Treasurer since November 2001.
Director – Mutual Fund Accounting of the Manager, and an officer of 64 investment companies (comprised of 155 portfolios) managed by the Manager. He is 58 years old and has been an employee of the Manager since April 1985.
34
RICHARD CASSARO, Assistant Treasurer since January 2008.
Senior Accounting Manager – Money Market and Municipal Bond Funds of the Manager, and an officer of 64 investment companies (comprised of 155 portfolios) managed by the Manager. He is 58 years old and has been an employee of the Manager since September 1982.
GAVIN C. REILLY, Assistant Treasurer since December 2005.
Tax Manager of the Investment Accounting and Support Department of the Manager, and an officer of 64 investment companies (comprised of 155 portfolios) managed by the Manager. He is 48 years old and has been an employee of the Manager since April 1991.
ROBERT S. ROBOL, Assistant Treasurer since August 2003.
Senior Accounting Manager – Dreyfus Financial Reporting of the Manager, and an officer of 64 investment companies (comprised of 155 portfolios) managed by the Manager. He is 53 years old and has been an employee of the Manager since October 1988.
ROBERT SALVIOLO, Assistant Treasurer since July 2007.
Senior Accounting Manager – Equity Funds of the Manager, and an officer of 64 investment companies (comprised of 155 portfolios) managed by the Manager. He is 50 years old and has been an employee of the Manager since June 1989.
ROBERT SVAGNA, Assistant Treasurer since August 2005.
Senior Accounting Manager – Fixed Income and Equity Funds of the Manager, and an officer of 64 investment companies (comprised of 155 portfolios) managed by the Manager. He is 50 years old and has been an employee of the Manager since November 1990.
JOSEPH W. CONNOLLY, Chief Compliance Officer since October 2004.
Chief Compliance Officer of the Manager and The Dreyfus Family of Funds (64 investment companies, comprised of 155 portfolios). He is 60 years old and has served in various capacities with the Manager since 1980, including manager of the firm’s Fund Accounting Department from 1997 through October 2001.
CARIDAD M. CAROSELLA, Anti-Money Laundering Compliance Officer since January 2016
Anti-Money Laundering Compliance Officer of the Dreyfus Family of Funds and BNY Mellon Funds Trust since January 2016; from May 2015 to December 2015, Interim Anti-Money Laundering Compliance Officer of the Dreyfus Family of Funds and BNY Mellon Funds Trust and the Distributor; from January 2012 to May 2015, AML Surveillance Officer of the Distributor and from 2007 to December 2011, Financial Processing Manager of the Distributor. She is an officer of 59 investment companies (comprised of 150 portfolios) managed by the Manager. She is 49 years old and has been an employee of the Distributor since 1997.
35
NOTES
36
NOTES
37
Dreyfus Inflation Adjusted Securities Fund
200 Park Avenue
New York, NY 10166
Manager
The Dreyfus Corporation
200 Park Avenue
New York, NY 10166
Custodian
The Bank of New York Mellon
225 Liberty Street
New York, NY 10286
Transfer Agent &
Dividend Disbursing Agent
Dreyfus Transfer, Inc.
200 Park Avenue
New York, NY 10166
Distributor
MBSC Securities Corporation
200 Park Avenue
New York, NY 10166
| | |
Ticker Symbols: | Class I: DIASX Investor: DIAVX Class Y: DAIYX |
Telephone Call your financial representative or 1-800-DREYFUS
Mail The Dreyfus Family of Funds, 144 Glenn Curtiss Boulevard, Uniondale, NY 11556-0144
E-mail Send your request to info@dreyfus.com
Internet Information can be viewed online or downloaded at www.dreyfus.com
The fund files its complete schedule of portfolio holdings with the Securities and Exchange Commission (“SEC”) for the first and third quarters of each fiscal year on Form N-Q. The fund’s Forms N-Q are available on the SEC’s website at www.sec.gov and may be reviewed and copied at the SEC’s Public Reference Room in Washington, D.C. (phone 1-800-SEC-0330 for information).
A description of the policies and procedures that the fund uses to determine how to vote proxies relating to portfolio securities and information regarding how the fund voted these proxies for the most recent 12-month period ended June 30 is available at www.dreyfus.com and on the SEC’s website at www.sec.gov and without charge, upon request, by calling 1-800-DREYFUS.
| | |
© 2017 MBSC Securities Corporation
0588AR0717 | 
|