UNITED STATES
SECURITIES AND EXCHANGE COMMISSION
Washington, D.C. 20549
FORM N-CSR
CERTIFIED SHAREHOLDER REPORT OF REGISTERED
MANAGEMENT INVESTMENT COMPANIES
Investment Company Act file number: 811-06722
FORWARD FUNDS
(Exact name of registrant as specified in charter)
433 California Street, 11th Floor
San Francisco, CA 94104
(Address of principal executive offices) (Zip code)
J. Alan Reid, Jr., President
Forward Funds
433 California Street, 11th Floor
San Francisco, CA 94104
(Name and address of agent for service)
Registrant’s Telephone Number, including Area Code: (800) 999-6809
Date of fiscal year end: December 31
Date of reporting period: January 1, 2006 – June 30, 2006
Form N-CSR is to be used by management investment companies to file reports with the Commission not later than 10 days after the transmission to stockholders of any report that is required to be transmitted to stockholders under Rule 30e-1 under the Investment Company Act of 1940 (17 CFR 270.30e-1). The Commission may use the information provided on Form N-CSR in its regulatory, disclosure review, inspection, and policymaking roles.
A registrant is required to disclose the information specified by Form N-CSR, and the Commission will make this information public. A registrant is not required to respond to the collection of information contained in Form N-CSR unless the Form displays a currently valid Office of Management and Budget (“OMB”) control number. Please direct comments concerning the accuracy of the information collection burden estimate and any suggestions for reducing the burden to Secretary, Securities and Exchange Commission, 100 F Street, NE, Washington, DC 20549. The OMB has reviewed this collection of information under the clearance requirements of 44 U.S.C. § 3507.
|
| Item 1 - Reports to Stockholders |
|
| The following is a copy of the report transmitted to shareholders of the Forward Legato Fund, the Forward Emerald Growth Fund, the Forward Emerald Banking and Finance Fund, the Forward Emerald Opportunities Fund, the Forward Uniplan Real Estate Investment Fund, the Forward Hoover Small Cap Equity Fund, the Forward Hoover Mini-Cap Fund, the Forward International Equity Fund, the Forward Global Emerging Markets Fund, the Forward International Small Companies Fund, the Sierra Club Equity Income Fund and the Sierra Club Stock Fund, each a series of the registrant, pursuant to Rule 30e-1 under the Act (17 CFR 270.30e-1). |
| |
FORWARD FUNDS.
Semi-Annual Report
June 30, 2006
Semi-Annual Report | June 30, 2006
FORWARD THINKING: Paying Attention to Correlation
Many have observed a trend that we feel deserves our investors’ attention: high correlation among major global markets. Traditionally, U.S. and overseas markets often moved in separate directions. Adding one or more international funds to a portfolio centered on U.S. equities provided a meaningful measure of diversification. In recent years, however, U.S. and international markets have increasingly moved in lockstep as performance of large-cap stocks around the world has converged.
Markets have become globalized—companies now offer the same goods and services almost everywhere. For example, technology stocks have become major players in markets worldwide as technology is a critical component of economic growth. Investors who believe that their portfolios are reasonably diversified because they hold both domestic and international funds may need to look further to manage risk, especially during periods of volatility.
New Opportunities for Risk Reduction
We have long been committed to meeting investor needs as market conditions change. That’s why we offer a family of products in a range of asset classes, including long/short strategies, like the Forward Emerald Opportunities Fund. The Fund integrates a traditional long portfolio with the ability to short or hedge within the fund, investing in undervalued stocks and selling short over-valued issues. These strategies typically result in a low correlation to major markets, offering investors another risk management tool.
We encourage you to review your portfolio and its level of diversification and to speak with your financial advisor about strategies to manage high correlation and reduce risk. And we will continue to develop innovative products that can help our investors diversify with funds that provide investment exposure via a wide range of asset classes.
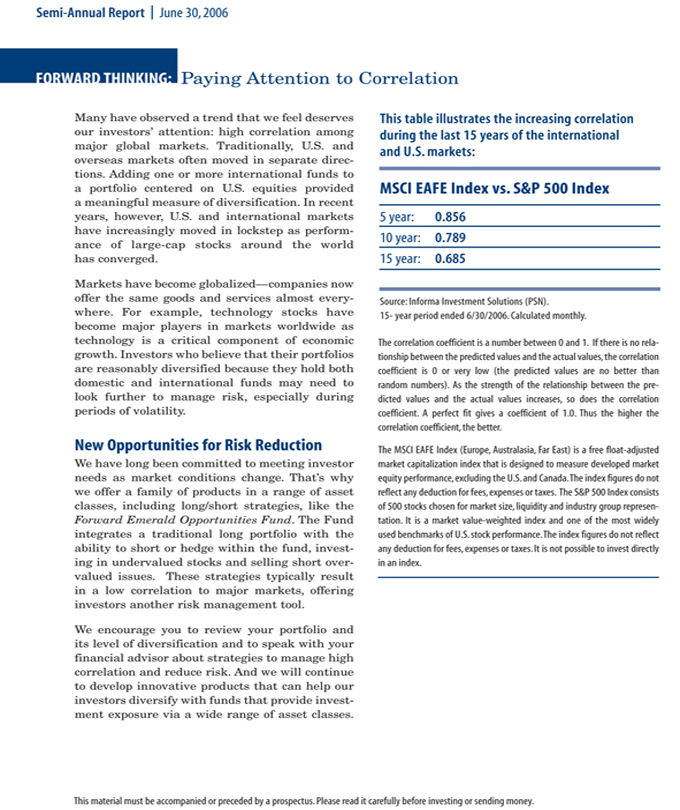
This table illustrates the increasing correlation during the last 15 years of the international and U.S. markets:
MSCI EAFE Index vs. S&P 500 Index
5 year:
0.856
10 year:
0.789
15 year:
0.685
Source: Informa Investment Solutions (PSN).
15- year period ended 6/30/2006. Calculated monthly.
The correlation coefficient is a number between 0 and 1. If there is no relationship between the predicted values and the actual values, the correlation coefficient is 0 or very low (the predicted values are no better than random numbers). As the strength of the relationship between the predicted values and the actual values increases, so does the correlation coefficient. A perfect fit gives a coefficient of 1.0. Thus the higher the correlation coefficient, the better.
The MSCI EAFE Index (Europe, Australasia, Far East) is a free float-adjusted market capitalization index that is designed to measure developed market equity performance, excluding the U.S. and Canada.The index figures do not reflect any deduction for fees, expenses or taxes. The S&P 500 Index consists of 500 stocks chosen for market size, liquidity and industry group representation. It is a market value-weighted index and one of the most widely used benchmarks of U.S. stock performance.The index figures do not reflect any deduction for fees, expenses or taxes. It is not possible to invest directly in an index.
This material must be accompanied or preceded by a prospectus. Please read it carefully before investing or sending money.
A MESSAGE FROM: J. Alan Reid Jr., President
Dear Shareholder:
Following several highly bullish years, the markets experienced considerable volatility during the first half of 2006. I am pleased to report that throughout this extraordinary period, Forward Funds has produced solid results for shareholders.
Our record reflects our agile, forward-thinking investment philosophy. We seek out and offer our investors innovative investment products. We identify portfolio managers who focus on delivering alpha.1 And we maintain our pro-shareholder position, which has created transparent, clear and ethical investment practices. This forward thinking permeates everything we do. Here are some examples:
Strong Results from Small Caps. Forward Funds has five small-cap funds—four domestic and one international. Our small-cap managers have done a great job of uncovering opportunities in this segment of the market. While conventional wisdom has it that large caps may return to favor and outperform small caps, our managers feel otherwise. Irene Hoover of the Forward Hoover Small Cap Equity Fund and the Forward Hoover Mini-Cap Fund states, “From the thousands of small-cap companies, there are always companies to discover for new investment—like emerging companies, smaller companies with accelerated growth, turnarounds or out-of-favor industries with niche-leading companies.”
International Opportunities Continue. Despite the dramatic volatility of international and emerging markets in the first half of the year, Forward’s international funds delivered solid results. Forward Funds works with Pictet Asset Management, a leader in international investing in both emerging and mature markets worldwide. During the spring volatility returned to international markets due to central banks’ more restrictive monetary policies, a halt in the uptrend of bond yields and the stalling of Asian currencies’ reevaluation processes. Pictet continues to identify opportunities thanks to attractive price/earnings ratios and continuing progress in many emerging markets.
Cutting Costs with ReFlow. Forward Funds’ portfolio managers now reduce costs by utilizing ReFlow, a service that purchases and sells shares of mutual funds to counterbalance daily shareholder flow. ReFlow benefits shareholders by reducing fund trading and transaction costs, stabilizing a fund’s cash position and improving tax efficiency and shareholder performance. ReFlow enabled the portfolio management teams at Pictet to keep from selling under pressure or holding cash, resulting in cost savings for the three Forward international funds during the first half of 2006.
New Large-Cap Fund. Forward Funds is adding a new U.S. large-cap equity fund to our family of funds in the fall of 2006. The Forward Large Cap Equity Fund will be sub-advised by Affinity Investment Advisors. A registration statement relating to these securities has been filed with the Securities and Exchange Commission but has not yet become effective. These securities may not be sold nor may offers to buy be accepted prior to the time the registration statement becomes effective.
Forward Funds remains deeply committed to helping our shareholders attain true portfolio diversification and achieve their long-term goals. We also believe that open, transparent practices give our investors access to the information they need to make important investment choices. I invite you to review the information in this report and the performance of the Forward Funds year to date.
Best regards,
J. Alan Reid Jr.
President
Forward Management, LLC
1 Alpha is a coefficient measuring the portion of an investment’s risk arising for specific (non-market) risk.
Small company stocks are generally riskier than large company stocks due to greater volatility and less liquidity. Investing in foreign securities may involve certain additional risks, including exchange rate fluctuation, less liquidity, greater volatility and less regulation. Real estate funds may be subject to a higher degree of market risk due to concentration in a specific industry or in geographic regions. Investments in real estate and REITS have various risks including vacancies and devaluation based upon adverse economic or regulatory changes.
There are risks involved with investing, including loss of principal. Past performance does not guarantee future results.
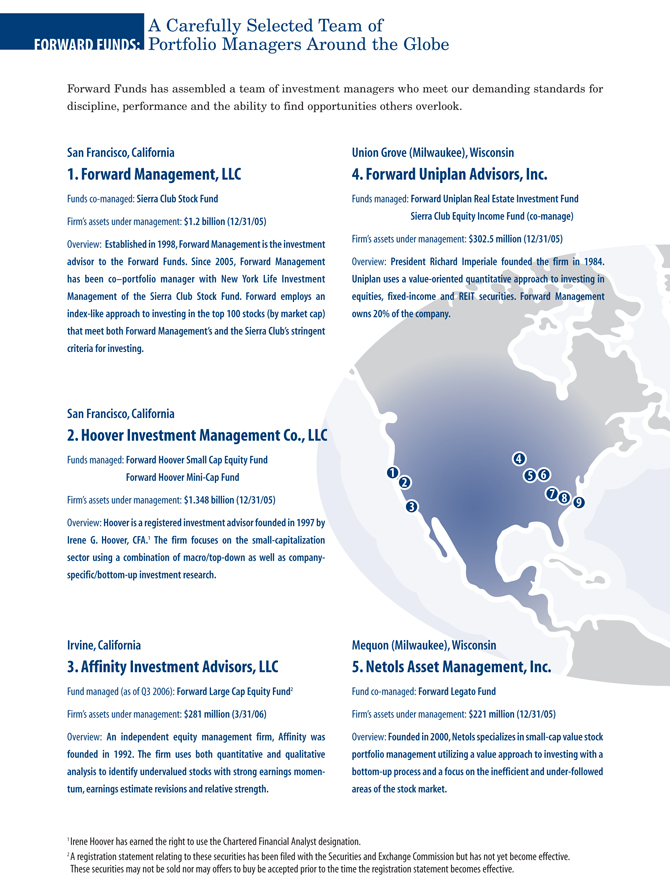
A Carefully Selected Team of
FORWARD FUNDS: Portfolio Managers Around the Globe
Forward Funds has assembled a team of investment managers who meet our demanding standards for discipline, performance and the ability to find opportunities others overlook.
San Francisco, California
1. Forward Management, LLC
Funds co-managed: Sierra Club Stock Fund
Firm’s assets under management: $1.2 billion (12/31/05)
Overview: Established in 1998, Forward Management is the investment advisor to the Forward Funds. Since 2005, Forward Management has been co–portfolio manager with New York Life Investment Management of the Sierra Club Stock Fund. Forward employs an index-like approach to investing in the top 100 stocks (by market cap) that meet both Forward Management’s and the Sierra Club’s stringent criteria for investing.
San Francisco, California
2. Hoover Investment Management Co., LLC
Funds managed: Forward Hoover Small Cap Equity Fund
Forward Hoover Mini-Cap Fund
Firm’s assets under management: $1.348 billion (12/31/05)
Overview: Hoover is a registered investment advisor founded in 1997 by Irene G. Hoover, CFA.1 The firm focuses on the small-capitalization sector using a combination of macro/top-down as well as company-specific/bottom-up investment research.
Irvine, California
3. Affinity Investment Advisors, LLC
Fund managed (as of Q3 2006): Forward Large Cap Equity Fund2
Firm’s assets under management: $281 million (3/31/06)
Overview: An independent equity management firm, Affinity was founded in 1992. The firm uses both quantitative and qualitative analysis to identify undervalued stocks with strong earnings momentum, earnings estimate revisions and relative strength.
Union Grove (Milwaukee), Wisconsin
4. Forward Uniplan Advisors, Inc.
Funds managed: Forward Uniplan Real Estate Investment Fund Sierra Club Equity Income Fund (co-manage)
Firm’s assets under management: $302.5 million (12/31/05)
Overview: President Richard Imperiale founded the firm in 1984. Uniplan uses a value-oriented quantitative approach to investing in equities, fixed-income and REIT securities. Forward Management owns 20% of the company.
Mequon (Milwaukee), Wisconsin
5. Netols Asset Management, Inc.
Fund co-managed: Forward Legato Fund
Firm’s assets under management: $221 million (12/31/05)
Overview: Founded in 2000, Netols specializes in small-cap value stock portfolio management utilizing a value approach to investing with a bottom-up process and a focus on the inefficient and under-followed areas of the stock market.
1 Irene Hoover has earned the right to use the Chartered Financial Analyst designation.
2 A registration statement relating to these securities has been filed with the Securities and Exchange Commission but has not yet become effective. These securities may not be sold nor may offers to buy be accepted prior to the time the registration statement becomes effective.
Minneapolis, Minnesota
6. Riverbridge Partners, LLC
Fund co-managed: Forward Legato Fund
Firm’s assets under management: $823 million (12/31/05)
Overview: Founded in 1987, Riverbridge Partners specializes in small-cap growth stock portfolio management. Riverbridge believes that earnings power determines the value of a franchise. They focus on companies that are building earnings power and the intrinsic value of the company over the long term.
Lancaster, Pennsylvania
7. Emerald Mutual Fund Advisers Trust
Funds managed: Forward Emerald Banking and Finance Fund
Forward Emerald Growth Fund
Forward Emerald Opportunities Fund
Firm’s assets under management: $2.36 billion (12/31/05)
Overview: The four principal officers of the parent company, Emerald Advisers, Inc., combine more than 70 years of experience in the mutual fund, investment advisory, pension funds management and securities brokerage industries. Emerald’s research staff conducts extensive fundamental research to identify companies whose earnings growth exceeds that of their peer group.
Radnor (Philadelphia), Pennsylvania
8. Conestoga Capital Advisors, LLC
Fund co-managed: Forward Legato Fund
Firm’s assets under management: $212 million (12/31/05)
Overview: Founded in 2001, Conestoga specializes in small-cap core stock portfolio management. Conestoga uses a core investment strategy based on investing in well-managed companies that are growing at reasonable valuations and are poised to deliver superior long-term performance.
Parsippany, New Jersey (New York City)
9. New York Life Investment Management LLC (NYLIM)
Funds co-managed: Sierra Club Equity Income Fund
Sierra Club Stock Fund
Firm’s assets under management (including affiliates):
more than $200 billion (12/31/05)
Overview: Founded in 2000, NYLIM is an independently managed, wholly-owned subsidiary of New York Life Insurance Company. NYLIM uses a quantitative approach, typically investing in value stocks.
London, England; Geneva, Switzerland
10. Pictet Asset Management Limited
Funds managed: Forward International Equity Fund
Forward Global Emerging Markets Fund
Forward International Small Companies Fund
Firm’s assets under management: $25.2 billion (12/31/05)
Overview: Pictet Asset Management is the institutional business division of Pictet & Cie, a Swiss private bank that was founded in 1805, which manages a range of products, including a variety of equity portfolios for U.S. and international institutional clients. The firm has offices in Geneva, Zurich, Singapore and Tokyo in addition to London, investing in emerging and developing markets worldwide.
| | |
| |
| FORWARD FUNDS: | | Table of Contents |
Forward Funds are distributed by ALPS Distributors, Inc., P.O. Box 1345, Denver, CO 80201
The report has been prepared for the general information of Forward Funds’ shareholders. It is not authorized for distribution to prospective investors unless accompanied or proceeded by a current Forward Funds Prospectus, which contains more complete information about Forward Funds’ investment policies, management fees and expenses. Investors are reminded to read the prospectus before investing or sending money.
June 30, 2006
Fund Performance
Performance Results for Periods Ended June 30, 2006
The performance quoted represents past performance. Past performance is no guarantee of future results. Investment return and principal value will fluctuate so that an investor’s shares, when redeemed, may be worth more or less than their original cost. Current performance may be lower or higher than the performance data quoted. Performance quoted does not reflect the non-recurring redemption fee of 2% that may be charged if shares are sold or exchanged within 180 days (60 days for the Sierra Club Equity Income Fund and the Sierra Club Stock Fund) of purchase. If these fees were reflected, the performance quoted would be lower. Investment performance reflects fee waivers in effect. In the absence of fee waivers, total return would be lower. Total return is based on NAV, assuming reinvestment of all distributions. Performance does not reflect the deduction of taxes that a shareholder would pay on Fund distributions or the redemption of Fund shares. For performance data current to the most recent month end, please visit our web site at www.forwardfunds.com.
Real Estate Funds may be subject to a higher degree of market risk because of concentration in a specific industry or geographic sector. Risks include declines in value of real estate, general and economic conditions, changes in the value of the underlying property and defaults by borrowers.
Investing in foreign securities may involve certain additional risks, including exchange rate fluctuations, less liquidity, greater volatility and less regulation.
Small company stocks are generally riskier than large company stocks due to greater volatility and less liquidity.
Forward International Equity Fund(a)
| | | | | | | | |
| | | 1 YEAR | | 5 YEAR | | SINCE
INCEPTION | | INCEPTION
DATE |
| Average Annual Total Return | | | | | | | | |
Investor Class | | 31.46% | | 9.65% | | 7.15% | | 10/01/98 |
Forward International Small Companies Fund(b)
| | | | | | | | | | |
| | | 1 YEAR | | 5 YEAR | | 10 YEAR | | SINCE
INCEPTION | | INCEPTION
DATE |
| Average Annual Total Return | | | | | | | | | | |
Investor Class | | 33.46% | | N/A | | N/A | | 23.97% | | 03/05/02 |
| | | | | |
Institutional Class | | 33.91% | | 17.52% | | 13.01% | | 13.19% | | 02/07/96 |
| | | | | |
Class A (load adjusted)(c) | | 26.99% | | N/A | | N/A | | 26.05% | | 05/02/05 |
| | | | | |
Class A (without load)(d) | | 33.28% | | N/A | | N/A | | 31.40% | | 05/02/05 |
Forward Global Emerging Markets Fund(e)
| | | | | | | | | | |
| | | 1 YEAR | | 5 YEAR | | 10 YEAR | | SINCE
INCEPTION | | INCEPTION
DATE |
| Average Annual Total Return | | | | | | | | | | |
Investor Class | | 30.96% | | N/A | | N/A | | 39.12% | | 04/09/03 |
| | | | | |
Institutional Class | | 31.25% | | 24.37% | | 7.10% | | 7.32% | | 10/04/95 |
Fund Performance
Performance Results for Periods Ended June 30, 2006
See page 2 for important performance disclosure information about the Forward Funds.
Sierra Club Equity Income Fund(f)
| | | | | | |
| | | 1 YEAR | | SINCE
INCEPTION | | INCEPTION
DATE |
| Average Annual Total Return | | | | | | |
Investor Class | | 6.44% | | 8.13% | | 01/02/03 |
Sierra Club Stock Fund(g)
| | | | | | | | |
| | | 1 YEAR | | 5 YEAR | | SINCE
INCEPTION | | INCEPTION
DATE |
| Average Annual Total Return | | | | | | | | |
Investor Class | | 5.62% | | 2.18% | | 4.48% | | 10/01/98 |
| | | | |
Class A (load adjusted)(c) | | 0.57% | | N/A | | 5.13% | | 05/02/05 |
| | | | |
Class A (without load)(d) | | 5.62% | | N/A | | 9.65% | | 05/02/05 |
Forward Emerald Banking and Finance Fund(h)
| | | | | | | | |
| | | 1 YEAR | | 5 YEAR | | SINCE
INCEPTION | | INCEPTION
DATE |
| Average Annual Total Return | | | | | | | | |
Class A (load adjusted)(c) | | 4.29% | | 15.32% | | 13.81% | | 02/18/97 |
| | | | |
Class A (without load)(d) | | 9.50% | | 16.46% | | 14.41% | | 02/18/97 |
| | | | |
Class C (with CDSC)(i) | | 7.82% | | 15.70% | | 19.43% | | 07/01/00 |
| | | | |
Class C (without CDSC)(j) | | 8.82% | | 15.70% | | 19.43% | | 07/01/00 |
Forward Emerald Opportunities Fund(k)
| | | | | | | | |
| | | 1 YEAR | | 5 YEAR | | SINCE
INCEPTION | | INCEPTION
DATE |
| Average Annual Total Return | | | | | | | | |
Class A (load adjusted)(c) | | 20.46% | | -6.16% | | 0.70% | | 10/31/97 |
| | | | |
Class A (without load)(d) | | 26.46% | | -5.24% | | 1.27% | | 10/31/97 |
| | | | |
Class C (with CDSC)(i) | | 24.62% | | -5.72% | | -15.74% | | 07/01/00 |
| | | | |
Class C (without CDSC)(j) | | 25.62% | | -5.72% | | -15.74% | | 07/01/00 |
Forward Uniplan Real Estate Investment Fund
| | | | | | | | |
| | | 1 YEAR | | 5 YEAR | | SINCE
INCEPTION | | INCEPTION
DATE |
| Average Annual Total Return | | | | | | | | |
Investor Class | | 17.92% | | 17.07% | | 15.34% | | 05/10/99 |
Fund Performance
Performance Results for Periods Ended June 30, 2006
See page 2 for important performance disclosure information about the Forward Funds.
Forward Emerald Growth Fund(l)
| | | | | | | | | | |
| | | 1 YEAR | | 5 YEAR | | 10 YEAR | | SINCE
INCEPTION | | INCEPTION
DATE |
| Average Annual Total Return | | | | | | | | | | |
Class A (load adjusted)(c) | | 16.78% | | 4.52% | | 8.85% | | 12.83% | | 10/01/92 |
| | | | | |
Class A (without load)(d) | | 22.63% | | 5.53% | | 9.38% | | 13.23% | | 10/01/92 |
| | | | | |
Class C (with CDSC)(i) | | 20.85% | | 4.84% | | N/A | | 2.19% | | 07/01/00 |
| | | | | |
Class C (without CDSC)(j) | | 21.85% | | 4.84% | | N/A | | 2.19% | | 07/01/00 |
Forward Hoover Small Cap Equity Fund
| | | | | | | | |
| | | 1 YEAR | | 5 YEAR | | SINCE
INCEPTION | | INCEPTION
DATE |
| Average Annual Total Return | | | | | | | | |
Investor Class | | 11.97% | | 9.78% | | 11.68% | | 10/01/98 |
| | | | |
Institutional Class | | 12.36% | | N/A | | 13.49% | | 06/06/02 |
| | | | |
Class A (load adjusted)(c) | | 6.72% | | N/A | | 15.22% | | 05/02/05 |
| | | | |
Class A (without load)(d) | | 12.03% | | N/A | | 20.12% | | 05/02/05 |
Forward Hoover Mini-Cap Fund
| | | | | | |
| | | 1 YEAR | | SINCE
INCEPTION | | INCEPTION
DATE |
| Average Annual Total Return | | | | | | |
Investor Class | | 18.78% | | 21.65% | | 01/02/03 |
| | | |
Institutional Class | | 19.44% | | 16.40% | | 08/15/03 |
Forward Legato Fund
| | | | | | |
| | | 1 YEAR | | SINCE
INCEPTION | | INCEPTION
DATE |
| Average Annual Total Return | | | | | | |
Class A (load adjusted)(c) | | 4.80% | | 8.88% | | 04/01/05 |
| | | |
Class A (without load)(d) | | 10.04% | | 13.23% | | 04/01/05 |
(a) Pictet Asset Management Limited has been the Fund’s sub-advisor since September 1, 2005. From March 6, 2000 through August 31, 2005, Hansberger Global Investors, Inc. was the Fund’s sub-advisor and the Fund’s investment strategy was different. Prior to March 6, 2000, the Fund was managed by a different sub-advisor. Accordingly, performance figures for periods before September 1, 2005 do not reflect the current strategy or the current sub-advisor’s performance.
(b) The Retail Class and Institutional Class of the Pictet International Small Companies Fund were reorganized into the Investor and Institutional classes, respectively, of the Forward International Small Companies Fund on December 23, 2003. Performance figures for periods prior to December 23, 2003 represent performance of the respective class of shares of the Pictet International Small Companies Fund.
(c) Includes the effect of the maximum 4.75% sales charge.
(d) Excludes sales charge.
(e) The Retail Class and Institutional Class of the Pictet Global Emerging Markets Fund were reorganized into the Investor and Institutional Class, respectively, of the Forward Global Emerging Markets Fund on September 16, 2004. Performance figures shown for periods prior to September 16, 2004 represent performance of the Retail Class and Institutional Class of the Pictet Global Emerging Markets Fund.
Fund Performance
Performance Results for Periods Ended June 30, 2006
See page 2 for important performance disclosure information about the Forward Funds.
(f) On April 1, 2005, the Fund changed its name, certain investment policies and restrictions, and one of its sub-advisors. Prior to that time, the Fund operated as the Sierra Club Balanced Fund and the portion of the Fund that is currently managed by Forward Uniplan Advisors, Inc. was managed by a different sub-advisor. Performance figures for periods prior to that date do not reflect the current strategy or allocation of the Fund’s assets among different investment advisors.
(g) Forward Management, LLC (Forward Management or the Advisor) and New York Life Investment Management, LLC (NYLIM) have been managing the Fund’s portfolio since January 1, 2006. Between January 1, 2003 and December 31, 2005, NYLIM and MDTA LLC (formerly known as Harris Bretall Sullivan & Smith L.L.C.) were the Fund’s sub-advisors and the strategy for the portion of the Fund that Forward Management manages was different. Prior to January 1, 2003, the Fund was managed by a different sub-advisor and was not subject to the Sierra Club’s environmental and social evaluation process. Accordingly, performance figures for periods prior to January 1, 2006 do not reflect current management or strategy.
(h) As of May 1, 2005, Forward Management became the investment advisor and Emerald Mutual Fund Advisers Trust (Emerald) became the sub-advisor to the Fund. Prior to May 1, 2005, Emerald was the investment advisor. Prior to October 20, 1998, the Fund was named the HomeState Select Opportunities Fund and pursued a different objective.
(i) Includes the 1.00% contingent deferred sales charge.
(j) Excludes the 1.00% contingent deferred sales charge.
(k) As of May 1, 2005, Forward Management became the investment advisor and Emerald became the sub-advisor to the Fund. Prior to May 1, 2005, Emerald was the investment advisor. Prior to September 29, 2005, the Fund was named the Forward Emerald Technology Fund and invested a minimum 80% of its net assets, plus borrowing for investment purposes, if any, in a non-diversified portfolio of equity securities of public companies in the technology sector. Accordingly, performance figures for periods prior to September 29, 2005 do not reflect the current strategy. Prior to February 29, 2000, the Fund was named the HomeState Year 2000 Fund and its investment objective focused on a specific industry within the technology sector. The Fund has invested in a variety of initial public offerings (IPOs). The performance of the IPOs may have greater impact on the performance results of a small fund and may lessen as the Fund’s assets grow.
(l) As of May 1, 2005, Forward Management became the investment advisor and Emerald became the sub-advisor to the Fund. Prior to May 1, 2005, Emerald was the investment advisor. Prior to July 1, 2001, the Fund was named the HomeState Pennsylvania Growth Fund and focused on a specific geographic region within the U.S.
Disclosure of Fund Expenses
For the Six Months Ended June 30, 2006 (Unaudited)
As a shareholder of the Forward Funds, you incur two types of costs: (1) transaction costs, including applicable sales charges (loads) on purchase payments, reinvested dividends or other distributions, and redemption fees; and (2) ongoing costs, including management fees, distribution and service (12b-1) fees, shareholder services fees and other Fund expenses. This example is intended to help you understand your ongoing costs (in dollars) of investing in the Funds and to compare these costs with the ongoing costs of investing in other mutual funds. The example is based on an investment of $1,000 invested at the beginning of the (six-month) period and held for the entire period January 1, 2006 through June 30, 2006.
Actual Expenses
The first line for each share class of each Fund in the table provides information about actual account values and actual expenses. You may use this information, together with the amount you invested, to estimate the expenses that you paid over the period. Simply divide your account value by $1,000 (for example, an $8,600 account value divided by $1,000 = 8.6), then multiply the result by the number in the applicable line under the heading entitled “Expenses Paid During the
Period” to estimate the expenses you paid on your account during this period.
Hypothetical Example For Comparison Purposes
The second line for each share class of each Fund in the table below provides information about hypothetical account values and hypothetical expenses based on the Fund’s actual expense ratio and an assumed rate of return of 5% per year before expenses, which is not the Fund’s actual return. The hypothetical account values and expenses may not be used to estimate the actual ending account balance or expenses you paid for the period. You may use this information to compare the ongoing costs of investing in the Funds and other funds. To do so, compare this 5% hypothetical example with the 5% hypothetical examples that appear in the shareholder reports of other funds.
Please note that the expenses shown in the table below are meant to highlight your ongoing costs only and do not reflect any transactional costs, such as sales charges (loads), redemption fees or exchange fees. Therefore, the second line for each share class of each Fund in the table is useful in comparing ongoing costs only and will not help you determine the relative total costs of owning different funds. If these transactional costs were included, your costs would have been higher.
| | | | | | | | | | | | |
| | | BEGINNING ACCOUNT VALUE 01/01/06 | | ENDING ACCOUNT VALUE 06/30/06 | | EXPENSE RATIO(a) | | | EXPENSES PAID DURING PERIOD(b) 01/01/06–06/30/06 |
| | |
| FORWARD INTERNATIONAL EQUITY FUND | | | | | | |
| Investor Class | | | | | | | | | | | | |
Actual | | $ | 1,000.00 | | $ | 1,117.90 | | 1.54 | % | | $ | 8.07 |
| | | | |
Hypothetical | | $ | 1,000.00 | | $ | 1,017.17 | | 1.54 | % | | $ | 7.69 |
| | |
| FORWARD INTERNATIONAL SMALL COMPANIES FUND | | | | | | |
| Investor Class | | | | | | | | | | | | |
Actual | | $ | 1,000.00 | | $ | 1,108.50 | | 1.53 | % | | $ | 7.98 |
| | | | |
Hypothetical | | $ | 1,000.00 | | $ | 1,017.22 | | 1.53 | % | | $ | 7.64 |
Disclosure of Fund Expenses
For the Six Months Ended June 30, 2006 (Unaudited)
| | | | | | | | | | | | |
| | | BEGINNING ACCOUNT VALUE 01/01/06 | | ENDING ACCOUNT VALUE 06/30/06 | | EXPENSE RATIO(a) | | | EXPENSES PAID DURING PERIOD(b) 01/01/06–06/30/06 |
| | |
| FORWARD INTERNATIONAL SMALL COMPANIES FUND | | | | | | |
| Institutional Class | | | | | | | | | | | | |
Actual | | $ | 1,000.00 | | $ | 1,110.20 | | 1.18 | % | | $ | 6.18 |
| | | | |
Hypothetical | | $ | 1,000.00 | | $ | 1,018.94 | | 1.18 | % | | $ | 5.91 |
| Class A | | | | | | | | | | | | |
Actual | | $ | 1,000.00 | | $ | 1,110.20 | | 1.43 | % | | $ | 7.50 |
| | | | |
Hypothetical | | $ | 1,000.00 | | $ | 1,017.69 | | 1.43 | % | | $ | 7.17 |
| | | |
| FORWARD GLOBAL EMERGING MARKETS FUND | | | | | | | | | |
| Investor Class | | | | | | | | | | | | |
Actual | | $ | 1,000.00 | | $ | 1,035.10 | | 1.83 | % | | $ | 9.25 |
| | | | |
Hypothetical | | $ | 1,000.00 | | $ | 1,015.70 | | 1.83 | % | | $ | 9.17 |
| Institutional Class | | | | | | | | | | | | |
Actual | | $ | 1,000.00 | | $ | 1,036.00 | | 1.54 | % | | $ | 7.76 |
| | | | |
Hypothetical | | $ | 1,000.00 | | $ | 1,017.17 | | 1.54 | % | | $ | 7.69 |
| | | | |
| SIERRA CLUB EQUITY INCOME FUND | | | | | | | | | | | | |
| Investor Class | | | | | | | | | | | | |
Actual | | $ | 1,000.00 | | $ | 1,009.50 | | 1.57 | % | | $ | 7.83 |
| | | | |
Hypothetical | | $ | 1,000.00 | | $ | 1,017.00 | | 1.57 | % | | $ | 7.86 |
| | | | |
| SIERRA CLUB STOCK FUND | | | | | | | | | | | | |
| Investor Class | | | | | | | | | | | | |
Actual | | $ | 1,000.00 | | $ | 981.50 | | 1.48 | % | | $ | 7.29 |
| | | | |
Hypothetical | | $ | 1,000.00 | | $ | 1,017.44 | | 1.48 | % | | $ | 7.42 |
| Class A | | | | | | | | | | | | |
Actual | | $ | 1,000.00 | | $ | 981.50 | | 1.48 | % | | $ | 7.29 |
| | | | |
Hypothetical | | $ | 1,000.00 | | $ | 1,017.44 | | 1.48 | % | | $ | 7.42 |
| | |
| FORWARD EMERALD BANKING AND FINANCE FUND | | | | | | |
| Class A | | | | | | | | | | | | |
Actual | | $ | 1,000.00 | | $ | 1,039.80 | | 1.62 | % | | $ | 8.20 |
| | | | |
Hypothetical | | $ | 1,000.00 | | $ | 1,016.76 | | 1.62 | % | | $ | 8.10 |
| Class C | | | | | | | | | | | | |
Actual | | $ | 1,000.00 | | $ | 1,036.30 | | 2.27 | % | | $ | 11.48 |
| | | | |
Hypothetical | | $ | 1,000.00 | | $ | 1,013.52 | | 2.27 | % | | $ | 11.35 |
| | |
| FORWARD EMERALD OPPORTUNITIES FUND | | | | | | |
| Class A | | | | | | | | | | | | |
Actual | | $ | 1,000.00 | | $ | 1,112.70 | | 2.51 | % | | $ | 13.17 |
| | | | |
Hypothetical | | $ | 1,000.00 | | $ | 1,012.33 | | 2.51 | % | | $ | 12.54 |
Disclosure of Fund Expenses
For the Six Months Ended June 30, 2006 (Unaudited)
| | | | | | | | | | | | |
| | | BEGINNING ACCOUNT VALUE 01/01/06 | | ENDING ACCOUNT VALUE 06/30/06 | | EXPENSE RATIO(a) | | | EXPENSES PAID DURING PERIOD(b) 01/01/06–06/30/06 |
| | |
| FORWARD EMERALD OPPORTUNITIES FUND | | | | | | |
| Class C | | | | | | | | | | | | |
Actual | | $ | 1,000.00 | | $ | 1,109.50 | | 3.18 | % | | $ | 16.64 |
| | | | |
Hypothetical | | $ | 1,000.00 | | $ | 1,009.01 | | 3.18 | % | | $ | 15.85 |
| | |
| FORWARD UNIPLAN REAL ESTATE INVESTMENT FUND | | | | | | |
| Investor Class | | | | | | | | | | | | |
Actual | | $ | 1,000.00 | | $ | 1,116.20 | | 1.46 | % | | $ | 7.64 |
| | | | |
Hypothetical | | $ | 1,000.00 | | $ | 1,017.57 | | 1.46 | % | | $ | 7.29 |
| | |
| FORWARD EMERALD GROWTH FUND | | | | | | |
| Class A | | | | | | | | | | | | |
Actual | | $ | 1,000.00 | | $ | 1,059.60 | | 1.41 | % | | $ | 7.21 |
| | | | |
Hypothetical | | $ | 1,000.00 | | $ | 1,017.79 | | 1.41 | % | | $ | 7.06 |
| Class C | | | | | | | | | | | | |
Actual | | $ | 1,000.00 | | $ | 1,055.00 | | 2.07 | % | | $ | 10.52 |
| | | | |
Hypothetical | | $ | 1,000.00 | | $ | 1,014.55 | | 2.07 | % | | $ | 10.32 |
| | |
| FORWARD HOOVER SMALL CAP EQUITY FUND | | | | | | |
| Investor Class | | | | | | | | | | | | |
Actual | | $ | 1,000.00 | | $ | 1,047.40 | | 1.65 | % | | $ | 8.38 |
| | | | |
Hypothetical | | $ | 1,000.00 | | $ | 1,016.55 | | 1.65 | % | | $ | 8.25 |
| Institutional Class | | | | | | | | | | | | |
Actual | | $ | 1,000.00 | | $ | 1,049.10 | | 1.29 | % | | $ | 6.55 |
| | | | |
Hypothetical | | $ | 1,000.00 | | $ | 1,018.82 | | 1.29 | % | | $ | 6.46 |
| Class A | | | | | | | | | | | | |
Actual | | $ | 1,000.00 | | $ | 1,047.50 | | 1.56 | % | | $ | 7.94 |
| | | | |
Hypothetical | | $ | 1,000.00 | | $ | 1,017.04 | | 1.56 | % | | $ | 7.82 |
| | |
| FORWARD HOOVER MINI-CAP FUND | | | | | | |
| Investor Class | | | | | | | | | | | | |
Actual | | $ | 1,000.00 | | $ | 1,061.80 | | 1.79 | % | | $ | 9.15 |
| | | | |
Hypothetical | | $ | 1,000.00 | | $ | 1,016.57 | | 1.79 | % | | $ | 8.95 |
| Institutional Class | | | | | | | | | | | | |
Actual | | $ | 1,000.00 | | $ | 1,064.80 | | 1.23 | % | | $ | 6.30 |
| | | | |
Hypothetical | | $ | 1,000.00 | | $ | 1,018.46 | | 1.23 | % | | $ | 6.16 |
| | |
| FORWARD LEGATO FUND | | | | | | |
| Class A | | | | | | | | | | | | |
Actual | | $ | 1,000.00 | | $ | 1,030.10 | | 1.63 | % | | $ | 8.22 |
| | | | |
Hypothetical | | $ | 1,000.00 | | $ | 1,016.69 | | 1.63 | % | | $ | 8.17 |
Disclosure of Fund Expenses
For the Six Months Ended June 30, 2006 (Unaudited)
(a) Annualized, based on the Portfolio’s most recent fiscal half-year expenses.
(b) Expenses are equal to the Fund’s annualized expense ratio multiplied by the average account value over the period, multiplied by the number of days in the most recent fiscal half year (181), then divided by 365.
Summary of Portfolio Holdings (Note 10) (Unaudited)
Under SEC rules, all funds are required to include in their annual and semi-annual shareholder reports a presentation of portfolio holdings in a table, chart or graph by reasonably identifiable categories. The following tables, which present portfolio holdings as a percent of total net assets, are provided in compliance with such requirements.
| | | |
|
| FORWARD INTERNATIONAL EQUITY FUND | |
Financials | | 34.64% | (a) |
| |
Industrials | | 13.16% | |
| |
Consumer Discretionary | | 12.63% | |
| |
Energy | | 10.23% | |
| |
Materials | | 7.33% | |
| |
Consumer Staples | | 6.25% | |
| |
Information Technology | | 5.32% | |
| |
Telecommunication Services | | 4.72% | |
| |
Health Care | | 4.14% | |
| |
Utilities | | 1.19% | |
| |
Net Other Assets and Liabilities | | 0.39% | |
| | 100.00% | |
|
| FORWARD INTERNATIONAL SMALL COMPANIES FUND | |
Industrials | | 25.57% | (a) |
| |
Consumer Discretionary | | 16.96% | |
| |
Financials | | 15.14% | |
| |
Information Technology | | 12.68% | |
| |
Health Care | | 6.11% | |
| |
Consumer Staples | | 5.86% | |
| |
Materials | | 5.11% | |
| |
Utilities | | 4.28% | |
| |
Energy | | 3.68% | |
| |
Short-Term Bank Debt Instruments | | 4.33% | |
| |
Net Other Assets and Liabilities | | 0.28% | |
| | 100.00% | |
|
| FORWARD GLOBAL EMERGING MARKETS FUND | |
Financials | | 27.29% | (a) |
| |
Energy | | 14.74% | |
| |
Information Technology | | 14.10% | |
| |
Telecommunication Services | | 11.62% | |
| |
Materials | | 7.38% | |
| |
Consumer Discretionary | | 5.73% | |
| |
Industrials | | 4.39% | |
| | | |
| |
Consumer Staples | | 3.82% | |
| |
Industrials | | 2.32% | |
| |
Health Care | | 2.30% | |
| |
Utilities | | 2.22% | |
| |
Short-Term Bank Debt Instruments | | 2.89% | |
| |
Net Other Assets and Liabilities | | 1.20% | |
| | 100.00% | |
| | | |
|
| SIERRA CLUB EQUITY INCOME FUND | |
Commercial Services & Supplies | | 11.00% | |
| |
Corporate Notes & Bonds | | 8.28% | |
| |
Banks | | 8.21% | |
| |
U.S. Government & Agency Obligations | | 6.91% | |
| |
Software | | 6.65% | |
| |
Hotels, Restaurants & Leisure | | 6.51% | |
| |
Diversified Financials | | 5.89% | |
| |
Real Estate | | 4.77% | |
| |
Media | | 4.32% | |
| |
Biotechnology | | 4.07% | |
| |
Health Care Providers & Services | | 3.83% | |
| |
Health Care Equipment & Supplies | | 2.70% | |
| |
Pharmaceuticals | | 2.66% | |
| |
Computers & Peripherals | | 2.39% | |
| |
Insurance | | 2.39% | |
| |
Semiconductors & Semiconductor Equipment | | 2.37% | |
| |
Food & Drug Retailing | | 1.89% | |
| |
Specialty Retail | | 1.67% | |
| |
Mutual Funds | | 1.64% | |
| |
Diversified Telecommunication Services | | 1.49% | |
| |
Communications Equipment | | 1.33% | |
| |
Cosmetics/Personal Care | | 1.07% | |
| |
Food | | 0.89% | |
| |
Semiconductors | | 0.74% | |
| |
Office Furnishings | | 0.62% | |
| |
Air Freight & Logistics | | 0.56% | |
Summary of Portfolio Holdings (Note 10) (Unaudited)
| | |
|
| SIERRA CLUB EQUITY INCOME FUND |
Internet Software & Services | | 0.40% |
| |
Internet | | 0.26% |
| |
Household Durables | | 0.16% |
| |
Short-Term Bank Debt Instruments | | 4.07% |
| |
Net Other Assets and Liabilities | | 0.26% |
| | 100.00% |
|
| SIERRA CLUB STOCK FUND |
Banks | | 14.08% |
| |
Commercial Services & Supplies | | 10.45% |
| |
Diversified Financials | | 10.16% |
| |
Hotels, Restaurants & Leisure | | 8.15% |
| |
Software | | 8.02% |
| |
Health Care Providers & Services | | 7.08% |
| |
Health Care Equipment & Supplies | | 5.41% |
| |
Computers & Peripherals | | 4.76% |
| |
Media | | 4.45% |
| |
Biotechnology | | 3.51% |
| |
Semiconductors & Semiconductor Equipment | | 2.66% |
| |
Diversified Telecommunication Services | | 2.50% |
| |
Communications Equipment | | 2.27% |
| |
Insurance | | 2.25% |
| |
Food & Drug Retailing | | 1.95% |
| |
Internet Software & Services | | 1.55% |
| |
Property & Casualty Insurance | | 1.42% |
| |
Multi-Line Insurance | | 0.96% |
| |
Specialty Retail | | 0.96% |
| |
Food Products | | 0.94% |
| |
Real Estate | | 0.78% |
| |
Pharmaceuticals | | 0.53% |
| |
Internet & Catalog Retail | | 0.49% |
| |
Leisure Equipment & Products | | 0.48% |
| |
Airlines | | 0.47% |
| |
IT Consulting Services | | 0.47% |
| |
Multi-Line Retail | | 0.47% |
| |
Telecommunications | | 0.47% |
| |
Mutual Funds | | 0.47% |
| |
Household Durables | | 0.19% |
| | |
| |
Short-Term Bank Debt instruments | | 1.30% |
| |
Net Other Assets and Liabilities | | 0.35% |
| | 100.00% |
|
| FORWARD EMERALD BANKING AND FINANCE FUND |
Financial Services | | 96.43% |
| |
Banks Regional | | 68.94% |
| |
Insurance Carriers: Property & Casualty | | 8.27% |
| |
Investment Management Companies | | 4.60% |
| |
Diversified Financial Services | | 3.79% |
| |
Financial Miscellaneous | | 3.13% |
| |
Financial Data Processing Services | | 2.89% |
| |
Savings & Loans | | 1.79% |
| |
Financial Information Services | | 0.98% |
| |
Real Estate Investment Trusts | | 0.73% |
| |
Insurance: Multi-Line | | 0.62% |
| |
Securities Brokerage & Service | | 0.44% |
| |
Property Casualty | | 0.25% |
| |
Short-Term Bank Debt Instruments | | 4.43% |
| |
Net Other Assets and Liabilities | | -0.86% |
| | 100.00% |
|
| FORWARD EMERALD OPPORTUNITIES FUND |
Technology | | 18.67% |
| |
Consumer Discretionary | | 15.03% |
| |
Health Care | | 12.39% |
| |
Biotechnology | | 7.61% |
| |
Medical & Dental Instruments | | 3.01% |
| |
Drugs & Pharmaceuticals | | 1.48% |
| |
Miscellaneous Health Care | | 0.29% |
| |
Consumer Staples | | 6.75% |
| |
Financial Services | | 6.67% |
| |
Energy | | 4.47% |
| |
Producer Durables | | 3.74% |
| |
Materials & Processing | | 3.17% |
| |
Utilities | | 2.10% |
| |
Auto & Transportation | | 0.46% |
| |
Options Purchased | | 2.98% |
| |
Short-Term Bank Debt Instruments | | 38.90% |
| |
Net Other Assets and Liabilities | | -15.33% |
| | 100.00% |
Summary of Portfolio Holdings (Note 10) (Unaudited)
| | | |
|
| FORWARD UNIPLAN REAL ESTATE INVESTMENT FUND | |
Retail | | 34.99% | |
| |
Residential | | 13.98% | |
| |
Office | | 13.52% | |
| |
Industrial | | 12.49% | |
| |
Specialty | | 9.12% | |
| |
Hotels | | 7.03% | |
| |
Health Care | | 6.28% | |
| |
Preferred Stocks | | 1.49% | |
| |
Short-Term Bank Debt Instruments | | 0.00% | (b) |
| |
Net Other Assets and Liabilities | | 1.10% | |
| | 100.00% | |
|
| FORWARD EMERALD GROWTH FUND | |
Technology | | 22.74% | |
| |
Consumer Discretionary | | 20.05% | |
| |
Health Care | | 16.35% | |
| |
Producer Durables | | 15.30% | |
| |
Financial Services | | 6.07% | |
| |
Energy | | 5.92% | |
| |
Materials & Processing | | 4.76% | |
| |
Auto & Transportation | | 4.39% | |
| |
Consumer Staples | | 0.74% | |
| |
Utilities | | 0.18% | |
| |
Warrants | | 0.00% | (a) |
| |
Short-Term Bank Debt Instruments | | 3.86% | |
| |
Net Other Assets and Liabilities | | -0.36% | |
| | 100.00% | |
|
| FORWARD HOOVER SMALL CAP EQUITY FUND | |
Consumer Discretionary | | 27.06% | (a) |
| |
Financial Services | | 23.61% | |
| |
Producer Durables | | 10.10% | |
| |
Health Care | | 7.95% | |
| |
Technology | | 6.85% | |
| |
Energy | | 6.63% | |
| |
Materials & Processing | | 6.22% | |
| |
Consumer Staples | | 4.20% | |
| |
Auto & Transportation | | 3.68% | |
| |
Utilities | | 1.04% | |
| | | |
| |
Short-Term Bank Debt Instruments | | 3.93% | |
| |
Net Other Assets and Liabilities | | -1.27% | |
| | 100.00% | |
|
| FORWARD HOOVER MINI-CAP FUND | |
Consumer Discretionary | | 23.89% | |
| |
Financial Services | | 15.30% | |
| |
Health Care | | 15.15% | |
| |
Materials & Processing | | 11.99% | |
| |
Auto & Transportation | | 10.58% | |
| |
Consumer Staples | | 5.49% | |
| |
Producer Durables | | 4.78% | |
| |
Technology | | 4.18% | |
| |
Energy | | 3.29% | |
| |
Utilities | | 1.09% | |
| |
Short-Term Bank Debt Instruments | | 6.30% | |
| |
Net Other Assets and Liabilities | | -2.04% | |
| | 100.00% | |
|
| FORWARD LEGATO FUND | |
Health Care | | 19.04% | |
| |
Information Technology | | 18.52% | |
| |
Consumer Discretionary | | 14.62% | |
| |
Financial Services | | 10.41% | |
| |
Producer Durables | | 8.01% | |
| |
Materials Processing | | 6.70% | |
| |
Energy | | 6.03% | |
| |
Auto & Transportation | | 4.88% | |
| |
Industrials | | 4.82% | |
| |
Consumer Staples | | 3.58% | |
| |
Other | | 1.05% | |
| |
Utilities | | 0.60% | |
| |
Short-Term Bank Debt Instruments | | 2.08% | |
| |
Net Other Assets and Liabilities | | -0.34% | |
| | 100.00% | |
(a) When sector categorization is broken down by industry, no industry exceeds the 25% maximum specified in the Statement of Additional Information.
(b) Amount represents less than 0.01%.
The Funds file a complete schedule of portfolio holdings with the SEC for the first and third quarters of each fiscal year on Form N-Q. The Funds’ form N-Q was filed for the quarter ended March 31, 2006. The Funds’ Form N-Q is available on the SEC’s website at www.sec.gov and may also be reviewed and copied at the Commission’s Public Reference Room in Washington, DC. Information on the operation of the Public Reference Room may be obtained by calling 1-800-SEC-0330.
A description of the Funds’ proxy voting policies and procedures and how the Funds’ voted proxies relating to portfolio securities during the most recent 12-month period ended June 30, 2006 are available (i) without charge, upon request, by calling 1-800-999-6809 and (ii) on the Securities and Exchange Commission’s website at www.sec.gov.
Portfolio of Investments (Note 10) (Unaudited)
Forward International Equity Fund
| | | | | |
| SHARES | | | | VALUE (NOTE 3) |
| |
| COMMON STOCKS: 99.45% | | | |
| Australia: 3.36% | | | |
| 33,500 | | AMP, Ltd. | | $ | 227,234 |
| | |
| 49,200 | | AWB Ltd. | | | 158,274 |
| | |
| 102,300 | | Pacific Brands, Ltd. | | | 163,408 |
| | |
| 82,100 | | Telestra Corp., Ltd. | | | 224,465 |
| | |
| 7,400 | | Wesfarmers Ltd. | | | 194,238 |
| | |
| | | | | 967,619 |
| | | | | |
| Austria: 1.54% | | | |
| 5,100 | | Raiffeisen International Bank-Holding AG | | | 442,786 |
| | | | | |
| Belgium: 1.89% | | | |
| 11,000 | | Agfa-Gevaert NV | | | 266,396 |
| | |
| 4,000 | | Delhaize Group | | | 277,213 |
| | |
| | | | | 543,609 |
| | | | | |
| Brazil: 1.93% | | | |
| 5,300 | | Banco Nossa Caixa SA | | | 110,934 |
| | |
| 4,627 | | Companhia de Bebidas das Americas, ADR(b) | | | 190,864 |
| | |
| 2,500 | | Petroleo Brasileiro SA, ADR(b) | | | 199,600 |
| | |
| 21,700 | | Vivo Participacoes SA, ADR(b)(d) | | | 53,382 |
| | |
| | | | | 554,780 |
| | | | | |
| Canada: 3.90% | | | |
| 32,100 | | iShares MSCI Canada Index Fund | | | 762,375 |
| | |
| 4,454 | | Suncor Energy, Inc. | | | 360,819 |
| | |
| | | | | 1,123,194 |
| | | | | |
| China: 0.51% | | | |
| 138,000 | | PetroChina Co., Ltd. | | | 147,470 |
| | | | | |
| Czechoslovakia: 1.19% | | | |
| 10,200 | | CEZ AS | | | 343,634 |
| | | | | |
| Egypt: 0.41% | | | |
| 2,900 | | Orascom Telecom Holding SAE, GDR(c) | | | 118,320 |
| | | | | |
| France: 6.40% | | | |
| 10,900 | | Air France-KLM | | | 256,169 |
| | |
| 19,780 | | Bull SA(a) | | | 132,276 |
| | |
| 5,740 | | Gemalto NV(a) | | | 154,350 |
| | |
| 2,160 | | Pernod Recard SA | | | 428,095 |
| | | | | |
| SHARES | | | | VALUE (NOTE 3) |
|
|
| | | |
| 4,500 | | Total SA, ADR(b) | | $ | 294,840 |
| | |
| 8,800 | | Total SA | | | 578,925 |
| | |
| | | | | 1,844,655 |
| | | | | |
| Germany: 8.19% | | | |
| 2,440 | | Allianz AG | | | 385,155 |
| | |
| 8,800 | | Bayer AG | | | 404,854 |
| | |
| 11,300 | | Deutsche Post AG | | | 303,570 |
| | |
| 1,500 | | Fresenius Medical Care AG & Co. KGaA | | | 171,468 |
| | |
| 27,500 | | GEA Group AG | | | 469,076 |
| | |
| 10,300 | | Hypo Real Estate Holding AG | | | 624,266 |
| | |
| | | | | 2,358,389 |
| | | | | |
| Greece: 6.39% | | | |
| 39,600 | | Chipita International SA | | | 181,273 |
| | |
| 34,900 | | Hellenic Exchanges SA | | | 561,384 |
| | |
| 17,700 | | National Bank of Greece SA | | | 698,884 |
| | |
| 11,000 | | Opap SA | | | 398,046 |
| | |
| | | | | 1,839,587 |
| | | | | |
| Hong Kong: 0.98% | | | |
| 26,000 | | Cheung Kong (Holdings), Ltd. | | | 281,692 |
| | | | | |
| Hungary: 1.14% | | | |
| 3,200 | | MOL Magyar Olaj-es Gazipari Rt., GDR(c) | | | 328,000 |
| | | | | |
| Italy: 6.78% | | | |
| 58,400 | | Danieli SpA | | | 415,186 |
| | |
| 19,700 | | Fondiaria-Sai SpA | | | 588,176 |
| | |
| 38,700 | | Mediaset SpA | | | 456,243 |
| | |
| 63,100 | | UniCredito Italiano SpA | | | 493,782 |
| | |
| | | | | 1,953,387 |
| | | | | |
| Japan: 17.30% | | | |
| 6,300 | | Aeon Credit Service Co., Ltd. | | | 153,208 |
| | |
| 4,000 | | Aoyama Trading Co., Ltd. | | | 125,268 |
| | |
| 5,600 | | Arnest One Corp. | | | 158,719 |
| | |
| 16,000 | | Asahi Glass Co., Ltd. | | | 203,088 |
| | |
| 81 | | Astellas Pharma, Inc. | | | 2,976 |
| | |
| 21,000 | | Bank of Fukuoka, Ltd. | | | 159,822 |
| | |
| 8,400 | | Century Leasing System, Inc. | | | 132,560 |
| | | | |
| June 30, 2006 | | 14 | | See Notes to Financial Statements |
Portfolio of Investments (Note 10) (Unaudited)
Forward International Equity Fund
| | | | | |
| SHARES | | | | VALUE (NOTE 3) |
| Japan: 17.30% | | | |
| | |
| 13,000 | | Daiwa Securities Group, Inc. | | $ | 155,115 |
| | |
| 22,000 | | The Eighteenth Bank, Ltd. | | | 124,708 |
| | |
| 24,000 | | Fujitsu, Ltd. | | | 186,222 |
| | |
| 9,100 | | GLORY, Ltd. | | | 175,130 |
| | |
| 7,200 | | Hitachi Chemical Co., Ltd. | | | 188,952 |
| | |
| 21,000 | | ITOCHU Corp. | | | 184,622 |
| | |
| 13,000 | | JGC Corp. | | | 223,916 |
| | |
| 18,000 | | Kyowa Exeo Corp. | | | 232,725 |
| | |
| 26,000 | | Mitsubishi Electric Corp. | | | 208,564 |
| | |
| 22 | | Mitsubishi UFJ Financial Group, Inc. | | | 307,921 |
| | |
| 34,000 | | Mitsui Mining & Smelting Co., Ltd. | | | 200,761 |
| | |
| 2,400 | | Nidec Corp. | | | 172,156 |
| | |
| 8,000 | | Ricoh Co., Ltd. | | | 157,110 |
| | |
| 19,000 | | Sekisui Chemical Co., Ltd. | | | 164,213 |
| | |
| 1,000 | | SMC Corp. | | | 141,626 |
| | |
| 13,000 | | Sompo Japan Insurance, Inc. | | | 181,953 |
| | |
| 19,000 | | Sumitomo Heavy Industries, Ltd. | | | 175,848 |
| | |
| 18 | | Sumitomo Mitsui Financial Group, Inc. | | | 190,526 |
| | |
| 10,000 | | Sumitomo Realty & Development Co., Ltd. | | | 246,687 |
| | |
| 5,600 | | Toyota Motor Corp. | | | 293,435 |
| | |
| 33 | | West Japan Railway Co. | | | 137,121 |
| | |
| | | | | 4,984,952 |
| | | | | |
| Luxembourg: 2.21% | | | |
| 13,200 | | Arcelor | | | 636,986 |
| | | | | |
| Mexico 0.64% | | | |
| 3,100 | | Coca-Cola Femsa, SA de CV, ADR(b) | | | 91,512 |
| | |
| 4,800 | | Grupo Televisa SA, ADR(b) | | | 92,688 |
| | |
| | | | | 184,200 |
| | | | | |
| Netherlands: 2.80% | | | |
| 24,000 | | Royal Dutch Shell Plc, Class A | | | 807,089 |
| | | | | |
| Norway: 4.16% | | | |
| 435,700 | | Pan Fish ASA(a) | | | 471,928 |
| | |
| 29,900 | | Tandberg ASA | | | 247,461 |
| | |
| 39,700 | | Telenor ASA | | | 480,092 |
| | |
| | | | | 1,199,481 |
| | | | | |
| SHARES | | | | VALUE (NOTE 3) |
| Philippines: 0.57% | | | |
| 753,200 | | Ayala Land, Inc. | | $ | 163,038 |
| | | | | |
| Russia: 0.80% | | | |
| 5,500 | | OAO Gazprom, GDR(c) | | | 231,275 |
| | | | | |
| South Korea: 1.89% | | | |
| 2,900 | | Kookmin Bank, ADR(b) | | | 240,874 |
| | |
| 480 | | Samsung Electronics Co., Ltd. | | | 305,091 |
| | |
| | | | | 545,965 |
| | | | | |
| Spain: 6.29% | | | |
| 19,900 | | Banco Bilbao Vizcaya Argentaria SA | | | 409,160 |
| | |
| 20,900 | | Corporacion Dermoestetica(a) | | | 179,852 |
| | |
| 6,100 | | Fadesa Inmobiliaria SA | | | 209,191 |
| | |
| 4,200 | | Fomento de Construcciones y Contratas SA | | | 319,268 |
| | |
| 9,280 | | Tecnicas Reunidas SA(a) | | | 210,621 |
| | |
| 29,000 | | Telefonica SA | | | 482,796 |
| | |
| | | | | 1,810,888 |
| | | | | |
| Sweden: 2.54% | | | |
| 7,400 | | Modern Times Group AB, Class B(a) | | | 388,827 |
| | |
| 13,300 | | Svenska Handelsbanken AB | | | 342,496 |
| | |
| | | | | 731,323 |
| | | | | |
| Switzerland: 4.37% | | | |
| 5,590 | | Julius Baer Holding, Ltd. | | | 484,619 |
| | |
| 9,100 | | Novartis AG | | | 491,771 |
| | |
| 1,300 | | Valora Holding AG | | | 281,225 |
| | |
| | | | | 1,257,615 |
| | | | | |
| Taiwan: 1.85% | | | |
| 84,000 | | Cathay Financial Holding Co., Ltd. | | | 183,686 |
| | |
| 18,200 | | Hon Hai Precision Industry Co., Ltd.(c) | | | 220,220 |
| | |
| 14,214 | | Taiwan Semiconductor Manufacturing Co., Ltd., Sponsored ADR(b) | | | 130,483 |
| | |
| | | | | 534,389 |
| | | | | |
| Thailand: 0.63% | | | |
| 65,400 | | Bangkok Bank Public Co., Ltd. | | | 181,690 |
| | | | | |
| Turkey: 1.12% | | | |
| 117,600 | | Aksigorta AS | | | 324,261 |
| | | | | |
| | | | |
| See Notes to Financial Statements | | 15 | | June 30, 2006 |
Portfolio of Investments (Note 10) (Unaudited)
Forward International Equity Fund
| | | | | |
| SHARES | | | | VALUE (NOTE 3) |
| United Kingdom: 7.67% | | | |
| 7,200 | | Carnival Plc | | $ | 293,369 |
| | |
| 12,400 | | GlaxoSmithKline Plc | | | 346,540 |
| | |
| 83,800 | | IG Group Holdings Plc | | | 329,360 |
| | |
| 139,100 | | Old Mutual Plc | | | 419,999 |
| | |
| 8,500 | | Standard Chartered Plc | | | 207,520 |
| | |
| 28,500 | | William Hill Plc | | | 330,243 |
| | |
| 29,800 | | Yell Group Plc | | | 281,923 |
| | |
| | | | | 2,208,954 |
| | |
| | Total Common Stocks (Cost $25,151,131) | | | 28,649,228 |
| |
| RIGHTS: 0.16% | | | |
| Greece: 0.16% | | | |
| 14,400 | | National Bank of Greece SA, Rights(a) | | | 45,479 |
| | |
| | Total Rights
(Cost $0) | | | 45,479 |
| | |
| | Total Investments: 99.61%
(Cost $25,151,131) | | | 28,694,707 |
| | |
| | Net Other Assets and Liabilities: 0.39% | | | 111,175 |
| | |
| | Net Assets: 100.00% | | $ | 28,805,882 |
(a) Non-income producing security.
(b) ADR — American Depositary Receipt
(c) GDR — Global Depositary Receipt
(d) Security, or portion of security, is currently on loan.
Percentages are stated as a percent of net assets.
| | | | |
| June 30, 2006 | | 16 | | See Notes to Financial Statements |
Portfolio of Investments (Note 10) (Unaudited)
Forward International Small Companies Fund
| | | | | |
| Shares | | | | Value (Note 3) |
| |
| COMMON STOCKS: 95.39% | | | |
| Australia: 4.32% | | | |
| 720,000 | | A.B.C. Learning Centres, Ltd.(c) | | $ | 3,423,502 |
| | |
| 528,000 | | ABB Grain, Ltd., Class B(d) | | | 2,667,479 |
| | |
| 1,300,000 | | Bendigo Mining, Ltd.(a) | | | 1,661,231 |
| | |
| 375,000 | | McGuigan Simeon Wines, Ltd. | | | 696,513 |
| | |
| 2,192,276 | | Sigma Pharmaceuticals, Ltd.(c) | | | 4,234,740 |
| | |
| 1,400,000 | | Timbercorp, Ltd.(c) | | | 4,181,309 |
| | |
| 193,000 | | Toll Holdings, Ltd. | | | 2,014,614 |
| | |
| | | | | 18,879,388 |
| | | | | |
| Austria: 4.22% | | | |
| 24,500 | | Andritz AG | | | 4,048,717 |
| | |
| 29,749 | | austriamicrosystems AG(a) | | | 1,536,020 |
| | |
| 49,480 | | Boehler-Uddeholm AG | | | 2,704,707 |
| | |
| 203,750 | | Century Casinos, Inc., ADC(a)(b)(d) | | | 2,292,634 |
| | |
| 138,460 | | Conwert Immobilien Invest AG(a) | | | 2,637,940 |
| | |
| 35,500 | | EVN AG | | | 3,613,685 |
| | |
| 395,046 | | SkyEurope Holding AG(a)(d) | | | 1,601,258 |
| | |
| | | | | 18,434,961 |
| | | | | |
| Belgium: 2.39% | | | |
| 45,000 | | Bekaert NV | | | 4,321,224 |
| | |
| 70,644 | | ICOS Vision Systems NV(a)(c)(d) | | | 3,233,797 |
| | |
| 120,000 | | Option NV(a)(c) | | | 2,876,980 |
| | |
| | | | | 10,432,001 |
| | | | | |
| Denmark: 0.56% | | | |
| 22,000 | | Bang & Olufsen AS, Class B(c) | | | 2,432,398 |
| | | | | |
| Finland: 0.84% | | | |
| 100,800 | | Metso Corp. | | | 3,656,573 |
| | | | | |
| France: 6.94% | | | |
| 49,070 | | April Group | | | 2,633,355 |
| | |
| 88,170 | | Archos(a)(c)(d) | | | 3,117,241 |
| | |
| 95,772 | | bioMerieux(d) | | | 5,657,635 |
| | |
| 26,160 | | Cegedim SA(a)(d) | | | 2,231,094 |
| | |
| 74,240 | | CS Communication & Systemes(a)(d) | | | 2,671,262 |
| | |
| 55,000 | | Groupe Steria SCA | | | 2,900,955 |
| | |
| 57,280 | | Ipsen, Ltd. | | | 2,314,432 |
| | | | | |
| Shares | | | | Value (Note 3) |
|
|
| | | |
| 29,000 | | Seche Environnement(d) | | $ | 3,986,216 |
| | |
| 120,000 | | SR Teleperformance(a) | | | 4,799,570 |
| | |
| | | | | 30,311,760 |
| | | | | |
| Germany: 5.54% | | | |
| 11,630 | | Bijou Brigitte Modische Accessoires AG(c)(d) | | | 3,109,482 |
| | |
| 135,000 | | Gerry Weber International AG(c)(d) | | | 2,965,591 |
| | |
| 125,000 | | IVG Immobilien AG | | | 3,835,974 |
| | |
| 152,500 | | Pfleiderer AG | | | 4,274,298 |
| | |
| 19,500 | | Rational AG | | | 3,155,875 |
| | |
| 46,000 | | Rheinmetall AG | | | 3,200,890 |
| | |
| 29,000 | | Wincor Nixdorf AG | | | 3,680,297 |
| | |
| | | | | 24,222,407 |
| | | | | |
| Greece: 0.68% | | | |
| 125,000 | | Piraeus Bank SA | | | 2,972,880 |
| | | | | |
| Hong Kong: 3.73% | | | |
| 2,000,000 | | China Shineway Pharmaceuticals Group, Ltd.(e) | | | 1,519,248 |
| | |
| 1,500,000 | | Hysan Development Co., Ltd. | | | 4,229,432 |
| | |
| 2,182,000 | | Kowloon Development Co., Ltd. | | | 3,652,118 |
| | |
| 1,000,000 | | Moulin Global Eyecare Holdings, Ltd.(a) | | | 0 |
| | |
| 6,200,000 | | Pacific Basin Shipping, Ltd. | | | 2,813,828 |
| | |
| 6,500,000 | | Prime Success International Group, Ltd. | | | 4,079,760 |
| | |
| | | | | 16,294,386 |
| | | | | |
| Indonesia: 0.12% | | | |
| 80,000,000 | | PT Bank Century Tbk(a)(d) | | | 518,191 |
| | | | | |
| Ireland: 2.11% | | | |
| 105,000 | | FBD Holdings Plc | | | 4,954,160 |
| | |
| 245,000 | | Kingspan Group Plc | | | 4,276,152 |
| | |
| | | | | 9,230,312 |
| | | | | |
| Italy: 4.98% | | | |
| 380,809 | | Astaldi SpA | | | 2,282,458 |
| | |
| 320,304 | | Biesse SpA | | | 4,595,255 |
| | |
| 350,900 | | Credito Emiliano SpA | | | 4,332,016 |
| | |
| 701,140 | | Hera SpA | | | 2,330,947 |
| | | | |
| See Notes to Financial Statements | | 17 | | June 30, 2006 |
Portfolio of Investments (Note 10) (Unaudited)
Forward International Small Companies Fund
| | | | | |
| Shares | | | | Value (Note 3) |
| Italy: 4.98% | | | |
| 200,900 | | Recordati SpA | | $ | 1,466,798 |
| | |
| 28,000 | | Tod’s SpA | | | 2,098,738 |
| | |
| 160,000 | | Valentino Fashion Group SpA | | | 4,656,361 |
| | |
| | | | | 21,762,573 |
| | | | | |
| Japan: 20.57% | | | |
| 175,000 | | CKD Corp.(c) | | | 2,718,803 |
| | |
| 230,000 | | Daimei Telecom Engineering Corp. | | | 3,199,055 |
| | |
| 679,000 | | DAISO Co., Ltd.(c)(d) | | | 2,179,880 |
| | |
| 196,700 | | Espec Corp. | | | 2,821,922 |
| | |
| 140,100 | | Fujimi, Inc.(c)(d) | | | 3,284,503 |
| | |
| 120,000 | | Hamamatsu Photonics K.K.(c) | | | 4,146,438 |
| | |
| 600,000 | | Haseko Corp.(a)(c) | | | 2,041,727 |
| | |
| 268,100 | | Heiwa Corp.(c) | | | 3,724,295 |
| | |
| 280,000 | | Hitachi Koki Co., Ltd. | | | 4,274,155 |
| | |
| 125,000 | | Izumi Co., Ltd.(c) | | | 4,559,769 |
| | |
| 210,800 | | Japan General Estate Co., Ltd. | | | 4,342,685 |
| | |
| 660,000 | | Keiyo Bank, Ltd. | | | 3,741,241 |
| | |
| 420,000 | | Kitz Corp. | | | 3,189,083 |
| | |
| 390,000 | | Nabtesco Corp. | | | 4,370,293 |
| | |
| 358,000 | | Nippon Koei Co., Ltd. | | | 1,030,328 |
| | |
| 210,600 | | Nippon Seiki Co., Ltd. | | | 4,172,760 |
| | |
| 287,000 | | Nittetsu Mining Corp. Co., Ltd. | | | 2,046,144 |
| | |
| 55,000 | | Okinawa Electric Power Co., Inc. | | | 3,290,907 |
| | |
| 1,140 | | Pasona, Inc.(c) | | | 2,183,965 |
| | |
| 630,000 | | Ryobi, Ltd.(c) | | | 4,138,827 |
| | |
| 166,000 | | Ryowa Life Create Co., Ltd.(c) | | | 842,234 |
| | |
| 104,400 | | Seijo Corp.(d) | | | 2,931,584 |
| | |
| 384,000 | | Shizuoka Gas Co., Ltd. | | | 3,120,640 |
| | |
| 260,000 | | SMBC Friend Securities Co., Ltd. | | | 2,183,441 |
| | |
| 73,000 | | Sysmex Corp. | | | 3,371,736 |
| | |
| 375,000 | | The Tokushima Bank, Ltd.(d) | | | 2,791,628 |
| | |
| 410,000 | | Tokyo Tatemono Co., Ltd.(c) | | | 4,397,148 |
| | |
| 195,000 | | Toyo Suisan Kaisha, Ltd. | | | 3,056,817 |
| | |
| 220 | | Village Vanguard Co., Ltd.(a) | | | 1,693,566 |
| | |
| | | | | 89,845,574 |
| | | | | |
| | | | | |
| Shares | | | | Value (Note 3) |
| Netherlands: 3.10% | | | |
| 45,000 | | Fugro NV | | $ | 1,940,235 |
| | |
| 200,300 | | Koninklijke BAM Groep NV | | | 3,980,030 |
| | |
| 53,000 | | Koninklijke Boskalis Westminster NV | | | 3,595,139 |
| | |
| 62,960 | | Nutreco Holding NV(c) | | | 4,033,266 |
| | |
| | | | | 13,548,670 |
| | | | | |
| Norway: 3.61% | | | |
| 666,740 | | Acta Holding ASA | | | 2,121,533 |
| | |
| 65,000 | | Aker Yards AS | | | 4,575,258 |
| | |
| 508,820 | | Bergesen Worldwide Gas ASA(a) | | | 1,798,933 |
| | |
| 3,179,320 | | Pan Fish ASA(a) | | | 3,443,676 |
| | |
| 240,000 | | Subsea 7, Inc.(a)(c) | | | 3,818,339 |
| | |
| | | | | 15,757,739 |
| | | | | |
| Singapore: 3.75% | | | |
| 6,000,000 | | Gallant Venture Ltd.(a) | | | 2,010,940 |
| | |
| 10,500,000 | | Global Testing Corp., Ltd.(a) | | | 1,892,370 |
| | |
| 2,500,000 | | KS Energy Services, Ltd. | | | 3,225,093 |
| | |
| 2,500,000 | | Parkway Holdings, Ltd.(d) | | | 3,904,891 |
| | |
| 3,400,000 | | Petra Foods, Ltd.(e) | | | 2,988,586 |
| | |
| 4,600,000 | | United Test and Assembly Center, Ltd.(a) | | | 2,341,670 |
| | |
| | | | | 16,363,550 |
| | | | | |
| Spain: 1.48% | | | |
| 160,000 | | Banco Pastor SA | | | 2,096,999 |
| | |
| 272,000 | | Sol Melia SA(a) | | | 4,385,694 |
| | |
| | | | | 6,482,693 |
| | | | | |
| Sweden: 4.05% | | | |
| 200,000 | | Bergman & Beving AB, Class B(d) | | | 4,123,024 |
| | |
| 83,670 | | Brostrom AB, Class B(c) | | | 1,649,368 |
| | |
| 125,000 | | Hexagon AB, Class B | | | 4,546,433 |
| | |
| 230,000 | | Kungsleden AB | | | 2,698,013 |
| | |
| 140,000 | | Oriflame Cosmetics SA | | | 4,654,714 |
| | |
| | | | | 17,671,552 |
| | | | | |
| Switzerland: 4.54% | | | |
| 8,600 | | Advanced Digital Broadcast Holdings SA(a) | | | 308,898 |
| | |
| 2,710 | | Barry Callebaut AG(a) | | | 1,141,518 |
| | | | |
| June 30, 2006 | | 18 | | See Notes to Financial Statements |
Portfolio of Investments (Note 10) (Unaudited)
Forward International Small Companies Fund
| | | | | |
| Shares | | | | Value (Note 3) |
| Switzerland: 4.54% | | | |
| 29,500 | | BKW FMB Energie AG | | $ | 2,571,918 |
| | |
| 40,000 | | Dufry Group(a)(d) | | | 3,213,061 |
| | |
| 4,400 | | Geberit AG | | | 5,078,857 |
| | |
| 64,400 | | Logitech International SA, Registered Shares(a) | | | 2,481,372 |
| | |
| 14,000 | | SIG Holding AG(a) | | | 3,074,286 |
| | |
| 16,330 | | Ypsomed Holding AG(a) | | | 1,972,931 |
| | |
| | | | | 19,842,841 |
| | | | | |
| United Kingdom: 17.86% | | | |
| 470,000 | | Amlin Plc | | | 2,051,529 |
| | |
| 720,890 | | Avocet Mining Plc(a)(d) | | | 2,226,656 |
| | |
| 170,000 | | AWG Plc | | | 3,766,808 |
| | |
| 452,600 | | Balfour Beatty Plc | | | 2,875,471 |
| | |
| 640,000 | | Bodycote International Plc | | | 2,997,762 |
| | |
| 175,000 | | BowLeven Plc(a)(d) | | | 734,736 |
| | |
| 266,180 | | Charter Plc(a) | | | 3,970,521 |
| | |
| 3,613,000 | | European Nickel Plc(a)(d) | | | 2,305,445 |
| | |
| 1,100,000 | | FKI Plc | | | 2,176,929 |
| | |
| 146,000 | | Forth Ports Plc | | | 4,952,448 |
| | |
| 300,000 | | Hunting Plc | | | 2,157,046 |
| | |
| 420,000 | | Inchcape Plc | | | 3,670,446 |
| | |
| 1,281,660 | | Indago Petroleum, Ltd.(a)(d) | | | 1,230,291 |
| | |
| 533,400 | | Informa Plc | | | 4,254,513 |
| | |
| 307,690 | | Inspired Gaming Group Plc(a) | | | 1,072,735 |
| | |
| 520,000 | | Laird Group Plc | | | 3,750,902 |
| | |
| 400,000 | | Lancashire Holdings, Ltd.-W/I(a) | | | 2,258,309 |
| | |
| 14,590 | | Lonmin Plc | | | 759,089 |
| | |
| 210,000 | | Premier Oil Plc(a) | | | 3,738,417 |
| | |
| 2,100,000 | | Regus Group Plc(a) | | | 4,253,056 |
| | |
| 619,980 | | SCI Entertainment Group Plc(a) | | | 5,928,379 |
| | |
| 400,000 | | Shaftesbury Plc | | | 3,802,689 |
| | |
| 670,000 | | St. James's Place Capital Plc | | | 4,067,685 |
| | |
| 323,000 | | Stanley Leisure Plc | | | 3,847,301 |
| | |
| 400,000 | | Tullow Oil Plc | | | 2,826,123 |
| | |
| 283,670 | | Wolfson Microelectronics Plc(a) | | | 2,347,871 |
| | |
| | | | | 78,023,157 |
| | | | | |
| Shares | | | | Value (Note 3) |
| | | |
| | Total Common Stocks (Cost $378,869,275) | | $ | 416,683,606 |
| | |
| Par Value | | | | |
|
| SHORT-TERM BANK DEBT INSTRUMENTS: 4.33% |
| $18,903,000 | | Wells Fargo & Co. — Grand Cayman 4.350%, 07/03/06 | | | 18,903,000 |
| | |
| | Total Short-Term Bank Debt Instruments (Cost $18,903,000) | | | 18,903,000 |
| | |
| | Total Investments: 99.72%
(Cost $397,772,275) | | | 435,586,606 |
| | |
| | Net Other Assets and Liabilities: 0.28% | | | 1,210,762 |
| | |
| | Net Assets: 100.00% | | $ | 436,797,368 |
(a) Non-income producing security.
(b) ADC— Austrian Depositary Certificates
(c) Security, or portion of security, is currently on loan.
(d) Securities determined to be illiquid under procedures approved by the Fund's Board of Trustees.
(e) Fair Valued security.
Percentages are stated as a percent of net assets.
| | | | |
| See Notes to Financial Statements | | 19 | | June 30, 2006 |
Portfolio of Investments (Note 10) (Unaudited)
Forward International Small Companies Fund
Information related to these illiquid securities is as follows:
| | | | | | | | | | |
| Date(s) of Purchase | | Security | | | Cost | | | Market Value | | % of Net Assets |
| 12/14/04 - 06/09/06 | | bioMerieux | | $ | 4,995,940 | | $ | 5,657,635 | | 1.30% |
| 01/11/06 - 02/10/06 | | Bergman & Beving AB, Class B | | $ | 2,889,036 | | $ | 4,123,024 | | 0.94% |
| 06/17/05 - 05/26/06 | | Seche Environnement | | $ | 2,969,764 | | $ | 3,986,216 | | 0.91% |
| 03/23/05 - 06/06/06 | | Parkway Holdings, Ltd. | | $ | 3,190,283 | | $ | 3,904,891 | | 0.89% |
| 11/25/05 - 06/30/06 | | Fujimi, Inc. | | $ | 2,829,671 | | $ | 3,284,503 | | 0.75% |
| 12/10/04 - 04/27/06 | | ICOS Vision Systems NV | | $ | 2,466,027 | | $ | 3,233,797 | | 0.74% |
| 12/06/05 - 03/31/06 | | Dufry Group | | $ | 2,577,041 | | $ | 3,213,061 | | 0.74% |
| 05/24/06 - 06/14/06 | | Archos | | $ | 4,024,226 | | $ | 3,117,241 | | 0.71% |
| 12/20/04 - 03/31/06 | | Bijou Brigitte Modische Accessoires AG | | $ | 2,169,407 | | $ | 3,109,482 | | 0.71% |
| 04/29/05 - 05/22/06 | | Petra Foods, Ltd. | | $ | 2,486,973 | | $ | 2,988,586 | | 0.68% |
| 03/23/06 - 03/28/06 | | Gerry Weber International AG | | $ | 2,693,742 | | $ | 2,965,591 | | 0.68% |
| 01/11/06 - 06/30/06 | | Seijo Corp. | | $ | 2,827,197 | | $ | 2,931,584 | | 0.67% |
| 01/12/06 - 06/30/06 | | The Tokushima Bank, Ltd. | | $ | 3,250,158 | | $ | 2,791,628 | | 0.64% |
| 03/29/06 | | CS Communication & Systemes | | $ | 3,329,362 | | $ | 2,671,262 | | 0.61% |
| 02/23/06 - 05/25/06 | | ABB Grain, Ltd., Class B | | $ | 3,043,523 | | $ | 2,667,479 | | 0.61% |
| 05/12/06 - 06/22/06 | | European Nickel Plc | | $ | 2,324,488 | | $ | 2,305,445 | | 0.53% |
| 10/11/05 - 02/02/06 | | Century Casinos, Inc., ADC | | $ | 1,475,034 | | $ | 2,292,634 | | 0.52% |
| 07/06/04 - 03/28/06 | | Cegedim SA | | $ | 2,252,053 | | $ | 2,231,094 | | 0.51% |
| 05/04/06 - 06/30/06 | | Avocet Mining Plc | | $ | 2,689,174 | | $ | 2,226,656 | | 0.51% |
| 01/30/06 - 06/30/06 | | DAISO Co., Ltd. | | $ | 2,992,392 | | $ | 2,179,880 | | 0.50% |
| 09/22/05 - 04/20/06 | | SkyEurope Holding AG | | $ | 2,690,185 | | $ | 1,601,258 | | 0.37% |
| 03/31/06 - 05/02/06 | | China Shineway Pharmaceuticals Group, Ltd. | | $ | 1,699,420 | | $ | 1,519,248 | | 0.35% |
| 12/12/05 - 02/09/06 | | Indago Petroleum, Ltd. | | $ | 1,609,974 | | $ | 1,230,291 | | 0.28% |
| 09/16/05 - 02/16/06 | | BowLeven Plc | | $ | 1,605,751 | | $ | 734,736 | | 0.17% |
| 02/25/05 | | PT Bank Century Tbk | | $ | 907,358 | | $ | 518,191 | | 0.12% |
| | | | |
| June 30, 2006 | | 20 | | See Notes to Financial Statements |
Portfolio of Investments (Note 10) (Unaudited)
Forward Global Emerging Markets Fund
| | | | | |
| Shares | | | | Value (Note 3) |
| |
| COMMON STOCKS: 93.59% | | | |
| Brazil: 9.20% | | | |
| 15,200 | | Bradespar SA | | $ | 516,756 |
| | |
| 5,800 | | Cia Brasileira de Distribuicao Grupo Pao de Acucar, ADR(c)(f) | | | 180,612 |
| | |
| 19,974 | | Cia Vale do Rio Doce | | | 477,778 |
| | |
| 5,000 | | Lojas Renner SA | | | 265,675 |
| | |
| 22,484 | | Petroleo Brasileiro SA, ADR(c) | | | 1,795,123 |
| | |
| 11,170 | | Tim Participacoes SA, ADR(c) | | | 307,733 |
| | |
| 11,618 | | Unibanco-Uniao de Bancos Brasileiros SA, ADR(c) | | | 771,319 |
| | |
| | | | | 4,314,996 |
| | | | | |
| China: 8.31% | | | |
| 924,000 | | Air China, Ltd. | | | 386,636 |
| | |
| 385,000 | | China Life Insurance Co., Class H | | | 607,216 |
| | |
| 152,000 | | China Mobile (Hong Kong), Ltd. | | | 868,907 |
| | |
| 513,579 | | China Unicom, Ltd. | | | 459,556 |
| | |
| 640,000 | | CNOOC, Ltd. | | | 510,879 |
| | |
| 586,000 | | PetroChina Co., Ltd. | | | 626,214 |
| | |
| 16,900 | | Sohu.com, Inc.(a) | | | 435,851 |
| | |
| | | | | 3,895,259 |
| | | | | |
| Egypt: 0.50% | | | |
| 5,700 | | Orascom Telecom Holding SAE | | | 236,389 |
| | | | | |
| Hong Kong: 4.69% | | | |
| 170,000 | | China Overseas Land & Investment, Ltd. | | | 103,418 |
| | |
| 108,000 | | China Resources Enterprise, Ltd. | | | 220,394 |
| | |
| 45,800 | | Esprit Holdings, Ltd. | | | 373,854 |
| | |
| 48,000 | | Hutchison Whampoa, Ltd. | | | 438,161 |
| | |
| 225,000 | | Kowloon Development Co., Ltd. | | | 376,593 |
| | |
| 184,000 | | Shangri-LA Asia, Ltd. | | | 354,165 |
| | |
| 94,000 | | Wharf (Holdings), Ltd. | | | 334,029 |
| | |
| | | | | 2,200,614 |
| | | | | |
| India: 3.91% | | | |
| 11,400 | | Dr. Reddy’s Laboratories, Ltd., ADR(c)(f) | | | 315,780 |
| | |
| 12,300 | | ICICI Bank, Ltd.(c) | | | 290,895 |
| | |
| 17,000 | | Patni Computer Systems, Ltd.(c) | | | 242,760 |
| | |
| 8,177 | | Satyam Computer Services, Ltd., ADR(c)(f) | | | 270,986 |
| | | | | |
| Shares | | | | Value (Note 3) |
|
|
| | | |
| 11,376 | | State Bank of India, GDR(d) | | $ | 455,040 |
| | |
| 14,953 | | Tata Motors, Ltd., Sponsored ADR(c)(f) | | | 257,939 |
| | |
| | | | | 1,833,400 |
| | | | | |
| Indonesia: 1.70% | | | |
| 1,013,915 | | PT Bank Mandiri | | | 188,269 |
| | |
| 313,313 | | PT Bank Rakyat Indonesia | | | 138,679 |
| | |
| 14,613 | | PT Telekomunikasi Indonsia, Sponsored ADR | | | 469,077 |
| | |
| | | | | 796,025 |
| | | | | |
| Israel: 3.96% | | | |
| 103,531 | | Bank Hapoalim B.M. | | | 440,562 |
| | |
| 130,800 | | Bank Leumi Le-Israel | | | 464,032 |
| | |
| 110,000 | | Israel Discount Bank(a) | | | 187,509 |
| | |
| 24,200 | | Teva Pharmaceutical Industries, Ltd., Sponsored ADR(c)(f) | | | 764,478 |
| | |
| | | | | 1,856,581 |
| | | | | |
| Malaysia: 3.02% | | | |
| 221,400 | | Bumiputra-Commerce Holding Berhad | | | 358,506 |
| | |
| 29,000 | | Genting Berhad | | | 187,046 |
| | |
| 270,100 | | RHB Capital Berhad | | | 202,143 |
| | |
| 159,100 | | Telekom Malaysia Berhad | | | 391,850 |
| | |
| 110,675 | | Tenaga Nasional Berhad | | | 277,102 |
| | |
| | | | | 1,416,647 |
| | | | | |
| Mexico: 5.84% | | | |
| 21,403 | | America Movil SA de CV, ADR, Series L(c) | | | 711,864 |
| | |
| 77,600 | | Empresas ICA SA de CV(a) | | | 219,993 |
| | |
| 6,300 | | Fomento Economico Mexicano SA de CV, Sponsored ADR(c) | | | 527,436 |
| | |
| 166,900 | | Grupo Financiero Banorte SA de CV | | | 388,874 |
| | |
| 166,500 | | Grupo Mexico SA de CV | | | 477,920 |
| | |
| 21,332 | | Grupo Televisa SA, Sponsored ADR(c) | | | 411,921 |
| | |
| | | | | 2,738,008 |
| | | | | |
| Netherlands: 0.46% | | | |
| 6,600 | | Efes Breweries International, GDR(a)(d) | | | 217,800 |
| | | | | |
| | | | |
| See Notes to Financial Statements | | 21 | | June 30, 2006 |
Portfolio of Investments (Note 10) (Unaudited)
Forward Global Emerging Markets Fund
| | | | | |
| Shares | | | | Value (Note 3) |
| Philippines: 2.59% | | | |
| 88,612 | | ABS-CBN Broadcasting Corp., PDR(a)(e) | | $ | 24,602 |
| | |
| 1,785,963 | | Ayala Land, Inc. | | | 386,590 |
| | |
| 262,507 | | Bank of the Philippine Islands | | | 247,054 |
| | |
| 8,019 | | Philippine Long Distance Telephone Co. | | | 276,218 |
| | |
| 821,000 | | Universal Robina Corp. | | | 278,161 |
| | |
| | | | | 1,212,625 |
| | | | | |
| Russia: 8.18% | | | |
| 9,596 | | LUKOIL, Sponsored ADR(c) | | | 798,387 |
| | |
| 11,000 | | Mechel OAO(c)(f) | | | 246,290 |
| | |
| 12,400 | | Mobile TeleSystems(a)(c) | | | 365,056 |
| | |
| 36,803 | | OAO Gazprom, Sponsored ADR, Registered Shares(c) | | | 1,547,545 |
| | |
| 7,430 | | OAO Vimpel-Communications, Sponsored ADR(a)(c) | | | 340,443 |
| | |
| 3,700 | | RAO Unified Energy System, GDR(d) | | | 255,670 |
| | |
| 3,800 | | Surgutneftegaz OJSC(c)(f) | | | 281,200 |
| | |
| | | | | 3,834,591 |
| | | | | |
| Singapore: 0.96% | | | |
| 141,700 | | Singapore Petroleum Co., Ltd. | | | 452,515 |
| | | | | |
| Slovakia: 0.00%(b) | | | |
| 525 | | Chirana Prema AS(a) | | | 0 |
| | | | | |
| South Africa: 6.54% | | | |
| 1,900 | | Anglo Platinum, Ltd. | | | 201,143 |
| | |
| 20,060 | | Barloworld, Ltd. | | | 340,346 |
| | |
| 13,900 | | Gold Fields, Ltd. | | | 315,743 |
| | |
| 20,600 | | Harmony Gold Mining Co., Ltd.(a) | | | 329,577 |
| | |
| 1,805 | | Impala Platinum Holdings, Ltd. | | | 334,038 |
| | |
| 19,196 | | Nedbank Group, Ltd. | | | 304,154 |
| | |
| 65,475 | | Sanlam, Ltd. | | | 133,121 |
| | |
| 23,160 | | Sappi, Ltd. | | | 286,425 |
| | |
| 16,500 | | Sasol, Ltd. | | | 636,239 |
| | |
| 17,324 | | Standard Bank Group, Ltd. | | | 187,043 |
| | |
| | | | | 3,067,829 |
| | | | | |
| South Korea: 14.62% | | | |
| 21,360 | | Daewoo Engineering & Construction, Co., Ltd. | | | 303,953 |
| | | | | |
| Shares | | | | Value (Note 3) |
| | | |
| 6,057 | | Hana Financial Group, Inc. | | $ | 284,726 |
| | |
| 3,300 | | Hyundai Department Store Co., Ltd. | | | 254,970 |
| | |
| 7,000 | | Hyundai Development Co. | | | 302,519 |
| | |
| 3,000 | | Hyundai Motor Co. | | | 254,875 |
| | |
| 4,500 | | Kookmin Bank | | | 369,980 |
| | |
| 7,582 | | LG Corp. | | | 222,577 |
| | |
| 4,480 | | LG Electronics, Inc. | | | 271,529 |
| | |
| 49,900 | | Macquarie Korea Infrastructure Fund, GDR(a)(d) | | | 357,668 |
| | |
| 5,259 | | POSCO, ADR(c)(f) | | | 351,827 |
| | |
| 610 | | POSCO | | | 163,640 |
| | |
| 18,640 | | Samsung Corp. | | | 511,829 |
| | |
| 2,605 | | Samsung Electronics Co., Ltd. | | | 1,655,755 |
| | |
| 1,650 | | Samsung Fire & Marine Insurance Co., Ltd. | | | 221,751 |
| | |
| 8,200 | | Shinhan Financial Group Co., Ltd. | | | 384,632 |
| | |
| 810 | | Shinsegae Co., Ltd. | | | 405,555 |
| | |
| 4,100 | | SK Corp. | | | 263,624 |
| | |
| 11,800 | | SK Telecom Co., Ltd., ADR(c) | | | 276,356 |
| | |
| | | | | 6,857,766 |
| | | | | |
| Taiwan: 14.46% | | | |
| 165,049 | | Acer, Inc. | | | 290,060 |
| | |
| 144,632 | | Asustek Computer, Inc. | | | 355,136 |
| | |
| 270,620 | | AU Optronics Corp. | | | 381,979 |
| | |
| 231,000 | | Cathay Financial Holding, Co., Ltd. | | | 505,136 |
| | |
| 281,000 | | China Steel Corp. | | | 278,596 |
| | |
| 630,000 | | Chinatrust Financial Holding, Co., Ltd. | | | 522,454 |
| | |
| 12,500 | | Chunghwa Telecom Co., Ltd., ADR(c) | | | 230,875 |
| | |
| 198,000 | | Compal Electronics, Inc. | | | 188,968 |
| | |
| 102,900 | | Delta Electronics, Inc. | | | 292,393 |
| | |
| 434,346 | | First Financial Holding Co., Ltd. | | | 328,674 |
| | |
| 26,000 | | Foxconn Technology Co., Ltd. | | | 208,790 |
| | |
| 526,772 | | Fubon Financial Holding Co., Ltd. | | | 455,558 |
| | |
| 47,887 | | Hon Hai Precision Industry Co., Ltd. | | | 295,809 |
| | |
| 20,000 | | MediaTek, Inc. | | | 185,317 |
| | |
| 435,000 | | Mega Financial Holding Co., Ltd. | | | 321,779 |
| | | | |
| June 30, 2006 | | 22 | | See Notes to Financial Statements |
Portfolio of Investments (Note 10) (Unaudited)
Forward Global Emerging Markets Fund
| | | | | |
| Shares | | | | Value (Note 3) |
| Taiwan: 14.46% | | | |
| 19,000 | | Nan Ya Printed Circuit Board Corp. | | $ | 147,003 |
| | |
| 187,992 | | Siliconware Precision Industries Co. | | | 231,093 |
| | |
| 634,038 | | Taiwan Semiconductor Manufacturing Co., Ltd. | | | 1,143,646 |
| | |
| 477,243 | | United Microelectronics Corp. | | | 285,960 |
| | |
| 204,000 | | Yuanta Core Pacific Securities Co. | | | 134,836 |
| | |
| | | | | 6,784,062 |
| | | | | |
| Thailand: 2.17% | | | |
| 157,564 | | Bangkok Bank Public Co., Ltd. | | | 437,735 |
| | |
| 172,254 | | Kasikornbank Public Co., Ltd. | | | 275,390 |
| | |
| 1,287,300 | | True Corporation Public Co., Ltd.(a) | | | 303,648 |
| | |
| | | | | 1,016,773 |
| | | | | |
| Turkey: 2.48% | | | |
| 28,949 | | Akbank TAS | | | 138,501 |
| | |
| 53,000 | | Aksigorta AS | | | 146,138 |
| | |
| 11,923 | | Arcelik AS | | | 67,928 |
| | |
| 43,901 | | Haci Omer Sabanci Holding AS | | | 118,284 |
| | |
| 54,377 | | Koc Holding AS(a) | | | 161,572 |
| | |
| 23,000 | | Migros Turk TAS(a) | | | 183,884 |
| | |
| 46,770 | | Turkcell Iletisim Hizmetleri AS | | | 213,461 |
| | |
| 27,338 | | Turkiye Is Bankasi, Class C | | | 134,240 |
| | |
| | | | | 1,164,008 |
| | |
| | Total Common Stocks (Cost $37,456,811) | | | 43,895,888 |
| |
| PREFERRED STOCKS: 2.32% | | | |
| Brazil: 2.32% | | | |
| 18,508 | | Banco Bradesco SA, Preference No Par | | | 577,482 |
| | |
| 11,955,600 | | Cia Energetica de Minas Gerais, Preference | | | 508,761 |
| | |
| | | | | 1,086,243 |
| | |
| | Total Preferred Stocks (Cost $955,580) | | | 1,086,243 |
| | | | | |
| | | | | |
| Shares | | | | Value (Note 3) |
| |
| RIGHTS: 0.00%(b) | | | |
| Thailand: 0.00%(b) | | | |
| 47,704 | | True Corporation Public Co., Ltd., Rights(a) | | $ | 0 |
| | |
| | Total Rights (Cost $0) | | | 0 |
| | |
| Par Value | | | | |
| |
| SHORT-TERM BANK DEBT INSTRUMENTS: 2.89% | | | |
| $1,355,000 | | CitiBank: Nassau
4.350%, due 07/03/06 | | | 1,355,000 |
| | |
| | Total Short-Term Bank Debt Instruments (Cost $1,355,000) | | | 1,355,000 |
| | |
| | Total Investments: 98.80% (Cost $39,767,391) | | | 46,337,131 |
| | |
| | Net Other Assets and Liabilities: 1.20% | | | 562,413 |
| | |
| | Net Assets: 100.00% | | $ | 46,899,544 |
(a) Non-income producing security.
(b) Amount represents less than 0.01%.
(c) ADR — American Depositary Receipt
(d) GDR — Global Depositary Receipt
(e) PDR — Philippine Depositary Receipt
(f) Security, or portion of security, is currently on loan.
Percentages are stated as a percent of net assets.
| | | | |
| See Notes to Financial Statements | | 23 | | June 30, 2006 |
Portfolio of Investments (Note 10) (Unaudited)
Sierra Club Equity Income Fund
| | | | | |
| Shares | | | | Value (Note 3) |
|
| COMMON STOCKS: 78.84% |
| Air Freight & Logistics: 0.56% | | | |
| 5,000 | | Pacer International, Inc. | | $ | 162,900 |
| | | | | |
| Banks: 8.21% | | | |
| 14,015 | | Astoria Financial Corp. | | | 426,757 |
| | |
| 5,000 | | KeyCorp | | | 178,400 |
| | |
| 7,653 | | Northern Trust Corp. | | | 423,211 |
| | |
| 6,118 | | The PNC Financial Services Group, Inc. | | | 429,300 |
| | |
| 2,100 | | SunTrust Banks, Inc. | | | 160,146 |
| | |
| 13,686 | | U.S. Bancorp | | | 422,623 |
| | |
| 5,000 | | Wells Fargo & Co. | | | 335,400 |
| | |
| | | | | 2,375,837 |
| | | | | |
| Biotechnology: 4.07% | | | |
| 8,000 | | Celgene Corp.(a) | | | 379,440 |
| | |
| 13,487 | | Gilead Sciences, Inc.(a) | | | 797,891 |
| | |
| | | | | 1,177,331 |
| | | | | |
| Commercial Services & Supplies: 11.00% | | | |
| 1,134 | | Ceridian Corp.(a) | | | 27,715 |
| | |
| 7,000 | | Checkfree Corp.(a) | | | 346,920 |
| | |
| 4,000 | | Corporate Executive Board Co. | | | 400,800 |
| | |
| 6,187 | | Dun & Bradstreet Corp.(a) | | | 431,110 |
| | |
| 16,330 | | Equifax, Inc. | | | 560,772 |
| | |
| 473 | | First Data Corp. | | | 21,304 |
| | |
| 5,664 | | Manpower, Inc. | | | 365,894 |
| | |
| 7,542 | | Moody’s Corp. | | | 410,737 |
| | |
| 8,330 | | Paychex, Inc. | | | 324,704 |
| | |
| 7,000 | | Robert Half International, Inc. | | | 294,000 |
| | |
| | | | | 3,183,956 |
| | | | | |
| Communications Equipment: 1.33% | | | |
| 834 | | QLogic Corp.(a) | | | 14,378 |
| | |
| 9,266 | | QUALCOMM, Inc. | | | 371,289 |
| | |
| | | | | 385,667 |
| | | | | |
| Computers & Peripherals: 2.39% | | | |
| 21,840 | | Hewlett-Packard Co. | | | 691,891 |
| | | | | |
| Cosmetics/Personal Care: 1.07% | | | |
| 8,000 | | The Estee Lauder Companies, Inc. | | | 309,360 |
| | | | | |
| Shares | | | | Value (Note 3) |
|
|
| Diversified Financials: 5.89% | | | |
| 762 | | A.G. Edwards, Inc. | | $ | 42,154 |
| | |
| 6,100 | | Bank of America Corp. | | | 293,410 |
| | |
| 3,279 | | Bear Stearns Cos., Inc. | | | 459,322 |
| | |
| 2,613 | | Freddie Mac | | | 148,967 |
| | |
| 12,405 | | Mellon Financial Corp. | | | 427,104 |
| | |
| 5,764 | | State Street Corp. | | | 334,831 |
| | |
| | | | | 1,705,788 |
| | | | | |
| Diversified Telecommunication Services: 1.49% | | | |
| 11,631 | | CenturyTel, Inc. | | | 432,092 |
| | | | | |
| Food: 0.89% | | | |
| 10,000 | | The Hain Celestial Group, Inc.(a) | | | 257,600 |
| | | | | |
| Food & Drug Retailing: 1.89% | | | |
| 12,000 | | Kroger Co. | | | 262,320 |
| | |
| 4,400 | | Whole Foods Market, Inc. | | | 284,416 |
| | |
| | | | | 546,736 |
| | | | | |
| Health Care Equipment & Supplies: 2.70% | | | |
| 3,318 | | Becton Dickinson & Co. | | | 202,829 |
| | |
| 4,800 | | Edwards Lifesciences Corp.(a) | | | 218,064 |
| | |
| 7,635 | | Varian Medical Systems, Inc.(a) | | | 361,517 |
| | |
| | | | | 782,410 |
| | | | | |
| Health Care Providers & Services: 3.83% | | | |
| 1,827 | | Cardinal Health, Inc. | | | 117,531 |
| | |
| 3,689 | | Cigna Corp. | | | 363,403 |
| | |
| 4,000 | | Quest Diagnostics, Inc. | | | 239,680 |
| | |
| 14,000 | | Sunrise Senior Living, Inc.(a) | | | 387,100 |
| | |
| | | | | 1,107,714 |
| | | | | |
| Hotels, Restaurants & Leisure: 6.51% | | | |
| 4,471 | | Choice Hotels International, Inc. | | | 270,943 |
| | |
| 16,725 | | International Game Technology | | | 634,547 |
| | |
| 2,346 | | Las Vegas Sands Corp.(a) | | | 182,660 |
| | |
| 11,476 | | Starbucks Corp.(a) | | | 433,334 |
| | |
| 6,000 | | Starwood Hotels & Resorts Worldwide, Inc. | | | 362,040 |
| | |
| | | | | 1,883,524 |
| | | | | |
| | | | |
| June 30, 2006 | | 24 | | See Notes to Financial Statements |
Portfolio of Investments (Note 10) (Unaudited)
Sierra Club Equity Income Fund
| | | | | |
| Shares | | | | Value (Note 3) |
| Household Durables: 0.16% | | | |
| 97 | | NVR, Inc.(a) | | $ | 47,651 |
| | | | | |
| Insurance: 2.39% | | | |
| 3,500 | | Aflac, Inc. | | | 162,225 |
| | |
| 10,786 | | Progressive Corp. | | | 277,308 |
| | |
| 4,500 | | Safeco Corp. | | | 253,575 |
| | |
| | | | | 693,108 |
| | | | | |
| Internet: 0.26% | | | |
| 6,000 | | Emdeon Corp.(a) | | | 74,460 |
| | | | | |
| Internet Software & Services: 0.40% | | | |
| 279 | | Google, Inc., Class A(a) | | | 116,993 |
| | | | | |
| Media: 4.32% | | | |
| 11,194 | | McGraw-Hill Cos., Inc. | | | 562,275 |
| | |
| 2,000 | | Omnicom Group, Inc. | | | 178,180 |
| | |
| 15,274 | | Univision Communications, Inc.(a) | | | 511,679 |
| | |
| | | | | 1,252,134 |
| | | | | |
| Office Furnishings: 0.62% | | | |
| 7,000 | | Herman Miller, Inc. | | | 180,390 |
| | | | | |
| Pharmaceuticals: 2.66% | | | |
| 2,378 | | Barr Pharmaceuticals, Inc.(a) | | | 113,407 |
| | |
| 12,000 | | Endo Pharmaceuticals Holdings, Inc.(a) | | | 395,760 |
| | |
| 13,000 | | Mylan Laboratories, Inc. | | | 260,000 |
| | |
| | | | | 769,167 |
| | | | | |
| Real Estate: 4.77% | | | |
| 8,000 | | AMB Property Corp. | | | 404,400 |
| | |
| 13,000 | | Kimco Realty Corp. | | | 474,370 |
| | |
| 1,426 | | New Century Financial Corp. | | | 65,239 |
| | |
| 4,000 | | SL Green Realty Corp. | | | 437,880 |
| | |
| | | | | 1,381,889 |
| | | | | |
| Semiconductors: 0.74% | | | |
| 9,000 | | Veeco Instruments, Inc.(a) | | | 214,560 |
| | | | | |
| Semiconductors & Semiconductor Equipment: 2.37% |
| 10,000 | | Applied Materials, Inc. | | | 162,800 |
| | |
| 334 | | KLA-Tencor Corp. | | | 13,884 |
| | | | | |
| Shares | | | | Value (Note 3) |
| | | |
| 5,100 | | Microchip Technology, Inc. | | $ | 171,105 |
| | |
| 11,191 | | Texas Instruments, Inc. | | | 338,976 |
| | |
| | | | | 686,765 |
| | | | | |
| Software: 6.65% | | | |
| 5,600 | | Autodesk, Inc.(a) | | | 192,976 |
| | |
| 5,330 | | BEA Systems, Inc.(a) | | | 69,770 |
| | |
| 2,292 | | Fair Isaac Corp. | | | 83,222 |
| | |
| 5,000 | | Fiserv, Inc.(a) | | | 226,800 |
| | |
| 6,000 | | IMS Health, Inc. | | | 161,100 |
| | |
| 12,722 | | Intuit, Inc.(a) | | | 768,282 |
| | |
| 18,195 | | Microsoft Corp. | | | 423,943 |
| | |
| | | | | 1,926,093 |
| | | | | |
| Specialty Retail: 1.67% | | | |
| 165 | | Claire’s Stores, Inc. | | | 4,209 |
| | |
| 11,900 | | Fastenal Co. | | | 479,451 |
| | |
| | | | | 483,660 |
| | |
| | Total Common Stocks (Cost $20,186,980) | | | 22,829,676 |
|
| MUTUAL FUNDS: 1.64% |
| 25,000 | | PowerShares Wilderhill Clean Energy Portfolio(b) | | | 475,250 |
| | |
| | Total Mutual Funds (Cost $452,520) | | | 475,250 |
| | |
| Par Value | | | | |
|
| U.S. GOVERNMENT AND AGENCY OBLIGATIONS: 6.91% |
| Federal Home Loan Bank: 3.59% | | | |
| $1,040,000 | | 5.200%, 01/05/07 | | | 1,038,121 |
| | | | | |
| Federal Home Loan Mortgage Corp.: 3.32% | | | |
| 960,000 | | 5.500%, 07/15/06 | | | 959,985 |
| | |
| | Total U.S. Government and Agency Obligations (Amortized Cost $1,999,317) | | | 1,998,106 |
| | | | | |
| | | | |
| See Notes to Financial Statements | | 25 | | June 30, 2006 |
Portfolio of Investments (Note 10) (Unaudited)
Sierra Club Equity Income Fund
| | | | | |
| Par Value | | | | Value (Note 3) |
| |
| CORPORATE NOTES AND BONDS: 8.28% | | | |
| Banks: 2.34% | | | |
| | National City Corp. | | | |
| | |
| $150,000 | | 5.750%, 02/01/09 | | $ | 150,728 |
| | |
| | Wachovia Bank NA | | | |
| | |
| 200,000 | | 4.850%, 07/30/07 | | | 198,338 |
| | |
| | Wells Fargo & Co. | | | |
| | |
| 150,000 | | 3.500%, 04/04/08 | | | 144,720 |
| | |
| 125,000 | | 7.550%, 06/21/10 | | | 133,597 |
| | |
| 50,000 | | 6.125%, 04/18/12 | | | 50,756 |
| | |
| | | | | 678,139 |
| | | | | |
| Computers & Peripherals: 0.44% | | | |
| | Dell, Inc. | | | |
| | |
| 125,000 | | 6.550%, 04/15/08 | | | 126,702 |
| | | | | |
| Diversified Telecommunications Services: 1.37% |
| | Alltel Corp. | | | |
| | |
| 375,000 | | 7.000%, 07/01/12 | | | 396,242 |
| | | | | |
| Finance: 3.61% | | | |
| | Bank of America Corp. | | | |
| | |
| 100,000 | | 7.125%, 03/01/09 | | | 103,523 |
| | |
| 175,000 | | 7.125%, 10/15/11 | | | 186,168 |
| | |
| | Bear Stearns Cos., Inc. | | | |
| | |
| 75,000 | | 7.625%, 12/07/09 | | | 79,581 |
| | |
| | Key Bank NA | | | |
| | |
| 150,000 | | 7.000%, 02/01/11 | | | 157,387 |
| | |
| | Mellon Funding Corp. | | | |
| | |
| 150,000 | | 6.375%, 02/15/10 | | | 153,271 |
| | |
| | National City Bank | | | |
| | |
| 50,000 | | 6.250%, 03/15/11 | | | 51,057 |
| | |
| | U.S. Bank NA Minnesota | | | |
| | |
| 150,000 | | 6.375%, 08/01/11 | | | 154,539 |
| | |
| 150,000 | | 7.800%, 08/18/10 | | | 160,680 |
| | |
| | | | | 1,046,206 |
| | | | | |
| | | | | |
| Par Value | | | | Value (Note 3) |
|
|
| Health Care: 0.52% | | | |
| | Becton Dickinson & Co. | | | |
| | |
| $145,000 | | 7.150%, 10/01/09 | | $ | 151,440 |
| | |
| | Total Corporate Notes and Bonds (Amortized Cost $2,484,690) | | | 2,398,729 |
| Par Value | | | | |
|
| SHORT-TERM BANK DEBT INSTRUMENTS: 4.07% |
| $1,177,779 | | Brown Brothers Harriman & Co.— Grand Cayman
4.350%, due 07/03/06 | | | 1,177,779 |
| | |
| | Total Short-Term Bank Debt Instruments
(Cost $1,177,779) | | | 1,177,779 |
| | |
| | Total Investments: 99.74% (Cost $26,301,286) | | | 28,879,540 |
| | |
| | Net Other Assets and Liabilities: 0.26% | | | 76,007 |
| | |
| | Net Assets: 100.00% | | $ | 28,955,547 |
(a) Non-income producing security.
(b) Investments in other funds are calculated at their respective net asset values as determined by those funds, in accordance with the Investment Company Act of 1940.
Percentages are stated as a percent of net assets.
| | | | |
| June 30, 2006 | | 26 | | See Notes to Financial Statements |
Portfolio of Investments (Note 10) (Unaudited)
Sierra Club Stock Fund
| | | | | |
| Shares | | | | Value
(Note 3) |
|
| COMMON STOCKS: 97.88% |
| Airlines: 0.47% | | | |
| 9,145 | | Southwest Airlines Co. | | $ | 149,704 |
| | | | | |
| Banks: 14.08% | | | |
| 5,704 | | AmSouth Bancorp | | | 150,871 |
| | |
| 20,912 | | Astoria Financial Corp. | | | 636,770 |
| | |
| 3,600 | | BB&T Corp. | | | 149,724 |
| | |
| 29 | | Comerica, Inc. | | | 1,508 |
| | |
| 4,131 | | Fifth Third Bancorp | | | 152,640 |
| | |
| 2,060 | | Golden West Financial Corp. | | | 152,852 |
| | |
| 4,262 | | KeyCorp | | | 152,068 |
| | |
| 4,168 | | National City Corp. | | | 150,840 |
| | |
| 5,020 | | North Fork Bancorp | | | 151,453 |
| | |
| 14,165 | | Northern Trust Corp. | | | 783,325 |
| | |
| 11,318 | | The PNC Financial Services Group, Inc. | | | 794,184 |
| | |
| 2,017 | | SunTrust Banks, Inc. | | | 153,816 |
| | |
| 25,267 | | U.S. Bancorp | | | 780,245 |
| | |
| 2,851 | | Wachovia Corp. | | | 154,182 |
| | |
| 2,294 | | Wells Fargo & Co. | | | 153,882 |
| | |
| | | | | 4,518,360 |
| | | | | |
| Biotechnology: 3.51% | | | |
| 3,367 | | Biogen Idec, Inc.(a) | | | 155,993 |
| | |
| 2,452 | | Genzyme Corp.(a) | | | 149,695 |
| | |
| 13,897 | | Gilead Sciences, Inc.(a) | | | 822,146 |
| | |
| | | | | 1,127,834 |
| | | | | |
| Commercial Services & Supplies: 10.45% | | | |
| 2,887 | | Apollo Group, Inc., Class A(a) | | | 149,171 |
| | |
| 3,438 | | Automatic Data Processing, Inc. | | | 155,913 |
| | |
| 1,682 | | Ceridian Corp.(a) | | | 41,108 |
| | |
| 9,231 | | Dun & Bradstreet Corp.(a) | | | 643,216 |
| | |
| 5,049 | | eBay, Inc.(a) | | | 147,885 |
| | |
| 12,430 | | Equifax, Inc. | | | 426,846 |
| | |
| 4,043 | | First Data Corp. | | | 182,097 |
| | |
| 3,229 | | Manpower, Inc. | | | 208,593 |
| | |
| 14,084 | | Moody’s Corp. | | | 767,015 |
| | |
| 16,216 | | Paychex, Inc. | | | 632,100 |
| | |
| | | | | 3,353,944 |
| | | | | |
| | | | | |
| Shares | | | | Value
(Note 3) |
|
|
| Communications Equipment: 2.27% | | | |
| 1,245 | | QLogic Corp.(a) | | $ | 21,464 |
| | |
| 17,635 | | QUALCOMM, Inc. | | | 706,634 |
| | |
| | | | | 728,098 |
| | | | | |
| Computers & Peripherals: 4.76% | | | |
| 2,558 | | Apple Computer, Inc.(a) | | | 146,113 |
| | |
| 6,280 | | Dell, Inc.(a) | | | 153,295 |
| | |
| 13,236 | | EMC Corp.(a) | | | 145,199 |
| | |
| 24,498 | | Hewlett-Packard Co. | | | 776,096 |
| | |
| 4,370 | | Network Appliance, Inc.(a) | | | 154,261 |
| | |
| 36,899 | | Sun Microsystems, Inc.(a) | | | 153,131 |
| | |
| | | | | 1,528,095 |
| | | | | |
| Diversified Financials: 10.16% | | | |
| 1,137 | | A.G. Edwards, Inc. | | | 62,899 |
| | |
| 2,837 | | American Express Co. | | | 150,985 |
| | |
| 3,171 | | Bank of America Corp. | | | 152,525 |
| | |
| 3,007 | | Bear Stearns Cos., Inc. | | | 421,221 |
| | |
| 1,799 | | Capital One Financial Corp. | | | 153,725 |
| | |
| 9,846 | | The Charles Schwab Corp. | | | 157,339 |
| | |
| 4,030 | | Countrywide Financial Corp. | | | 153,462 |
| | |
| 3,214 | | Fannie Mae | | | 154,593 |
| | |
| 1,725 | | Franklin Resources, Inc. | | | 149,747 |
| | |
| 6,566 | | Freddie Mac | | | 374,328 |
| | |
| 22,826 | | Mellon Financial Corp. | | | 785,899 |
| | |
| 2,844 | | SLM Corp. | | | 150,504 |
| | |
| 6,766 | | State Street Corp. | | | 393,037 |
| | |
| | | | | 3,260,264 |
| | | | | |
| Diversified Telecommunication Services: 2.50% | | | |
| 2,484 | | Alltel Corp. | | | 158,554 |
| | |
| 17,355 | | CenturyTel, Inc. | | | 644,738 |
| | |
| | | | | 803,292 |
| | | | | |
| Food & Drug Retailing: 1.95% | | | |
| 5,021 | | CVS Corp. | | | 154,145 |
| | |
| 7,268 | | Kroger Co. | | | 158,878 |
| | | | |
| See Notes to Financial Statements | | 27 | | June 30, 2006 |
Portfolio of Investments (Note 10) (Unaudited)
Sierra Club Stock Fund
| | | | | |
| Shares | | | | Value
(Note 3) |
| Food & Drug Retailing: 1.95% | | | |
| 3,390 | | Walgreen Co. | | $ | 152,007 |
| | |
| 2,462 | | Whole Foods Market, Inc. | | | 159,144 |
| | |
| | | | | 624,174 |
| | | | | |
| Food Products: 0.94% | | | |
| 2,778 | | The Hershey Co. | | | 152,985 |
| | |
| 2,664 | | Wm. Wrigley Jr. Co. | | | 120,839 |
| | |
| 641 | | Wm. Wrigley Jr. Co., Class B | | | 29,037 |
| | |
| | | | | 302,861 |
| | | | | |
| Health Care Equipment & Supplies: 5.41% | | | |
| 4,106 | | Baxter International, Inc. | | | 150,937 |
| | |
| 7,431 | | Becton Dickinson & Co. | | | 454,257 |
| | |
| 4,500 | | Biomet, Inc. | | | 140,805 |
| | |
| 8,805 | | Boston Scientific Corp.(a) | | | 148,276 |
| | |
| 4,652 | | St. Jude Medical, Inc.(a) | | | 150,818 |
| | |
| 3,580 | | Stryker Corp. | | | 150,754 |
| | |
| 11,392 | | Varian Medical Systems, Inc.(a) | | | 539,411 |
| | |
| | | | | 1,735,258 |
| | | | | |
| Health Care Providers & Services: 7.08% | | | |
| 5,117 | | Cardinal Health, Inc. | | | 329,177 |
| | |
| 3,098 | | Caremark Rx, Inc. | | | 154,497 |
| | |
| 7,074 | | Cigna Corp. | | | 696,860 |
| | |
| 2,800 | | Coventry Health Care, Inc.(a) | | | 153,832 |
| | |
| 2,257 | | Express Scripts, Inc.(a) | | | 161,917 |
| | |
| 2,900 | | Humana, Inc.(a) | | | 155,730 |
| | |
| 2,735 | | Medco Health Solutions, Inc.(a) | | | 156,661 |
| | |
| 2,608 | | Quest Diagnostics, Inc. | | | 156,271 |
| | |
| 3,395 | | UnitedHealth Group, Inc. | | | 152,028 |
| | |
| 2,118 | | WellPoint, Inc.(a) | | | 154,127 |
| | |
| | | | | 2,271,100 |
| | | | | |
| Hotels, Restaurants & Leisure: 8.15% | | | |
| 6,671 | | Choice Hotels International, Inc. | | | 404,263 |
| | |
| 2,173 | | Harrah’s Entertainment, Inc. | | | 154,674 |
| | |
| 21,791 | | International Game Technology | | | 826,751 |
| | |
| 3,501 | | Las Vegas Sands Corp.(a) | | | 272,588 |
| | | | | |
| Shares | | | | Value
(Note 3) |
| | | |
| 21,277 | | Starbucks Corp.(a) | | $ | 803,419 |
| | |
| 2,545 | | Starwood Hotels & Resorts Worldwide, Inc. | | | 153,565 |
| | |
| | | | | 2,615,260 |
| | | | | |
| Household Durables: 0.19% | | | |
| 127 | | NVR, Inc.(a) | | | 62,389 |
| | | | | |
| Insurance: 2.25% | | | |
| 3,357 | | Aflac, Inc. | | | 155,597 |
| | |
| 21,970 | | Progressive Corp. | | | 564,849 |
| | |
| | | | | 720,446 |
| | | | | |
| Internet & Catalog Retail: 0.49% | | | |
| 4,061 | | Amazon.com, Inc.(a) | | | 157,079 |
| | | | | |
| Internet Software & Services: 1.55% | | | |
| 811 | | Google, Inc., Class A(a) | | | 340,077 |
| | |
| 4,730 | | Yahoo!, Inc.(a) | | | 156,090 |
| | |
| | | | | 496,167 |
| | | | | |
| IT Consulting & Services: 0.47% | | | |
| 6,233 | | Electronic Data Systems Corp. | | | 149,966 |
| | | | | |
| Leisure Equipment & Products: 0.48% | | | |
| 3,600 | | Electronic Arts, Inc.(a) | | | 154,944 |
| | | | | |
| Media: 4.45% | | | |
| 4,738 | | Comcast Corp., Class A(a) | | | 155,122 |
| | |
| 7,893 | | McGraw-Hill Cos., Inc. | | | 396,466 |
| | |
| 1,764 | | Omnicom Group, Inc. | | | 157,155 |
| | |
| 21,481 | | Univision Communications, Inc.(a) | | | 719,613 |
| | |
| | | | | 1,428,356 |
| | | | | |
| Multi-Line Insurance: 0.96% | | | |
| 1,900 | | Ambac Financial Group, Inc. | | | 154,090 |
| | |
| 1,808 | | The Hartford Financial Services Group, Inc. | | | 152,957 |
| | |
| | | | | 307,047 |
| | | | | |
| Multi-Line Retail: 0.47% | | | |
| 2,635 | | Costco Wholesale Corp. | | | 150,538 |
| | | | | |
| Pharmaceuticals: 0.53% | | | |
| 3,545 | | Barr Pharmaceuticals, Inc.(a) | | | 169,061 |
| | | | | |
| | | | |
| June 30, 2006 | | 28 | | See Notes to Financial Statements |
Portfolio of Investments (Note 10) (Unaudited)
Sierra Club Stock Fund
| | | | | |
| Shares | | | | Value
(Note 3) |
|
|
| Property & Casualty Insurance: 1.42% | | | |
| 3,055 | | ACE Ltd. | | $ | 154,552 |
| | |
| 3,004 | | Chubb Corp. | | | 149,900 |
| | |
| 2,485 | | XL Capital Ltd. | | | 152,330 |
| | |
| | | | | 456,782 |
| | | | | |
| Real Estate: 0.78% | | | |
| 4,199 | | Kimco Realty Corp. | | | 153,222 |
| | |
| 2,128 | | New Century Financial Corp. | | | 97,356 |
| | |
| | | | | 250,578 |
| | | | | |
| Semiconductors & Semiconductor Equipment: 2.66% |
| 4,815 | | Analog Devices, Inc. | | | 154,754 |
| | |
| 9,321 | | Applied Materials, Inc. | | | 151,746 |
| | |
| 538 | | KLA-Tencor Corp. | | | 22,365 |
| | |
| 20 | | NVIDIA Corp.(a) | | | 426 |
| | |
| 17,291 | | Texas Instruments, Inc. | | | 523,744 |
| | |
| | | | | 853,035 |
| | | | | |
| Software: 8.02% | | | |
| 4,914 | | Adobe Systems, Inc.(a) | | | 149,189 |
| | |
| 7,953 | | BEA Systems, Inc.(a) | | | 104,105 |
| | |
| 7,227 | | CA, Inc. | | | 148,515 |
| | |
| 4,000 | | Citrix Systems, Inc.(a) | | | 160,560 |
| | |
| 3,419 | | Fair Isaac Corp. | | | 124,144 |
| | |
| 13,305 | | Intuit, Inc.(a) | | | 803,489 |
| | |
| 33,737 | | Microsoft Corp. | | | 786,072 |
| | |
| 10,268 | | Oracle Corp.(a) | | | 148,783 |
| | |
| 9,564 | | Symantec Corp.(a) | | | 148,624 |
| | |
| | | | | 2,573,481 |
| | | | | |
| Specialty Retail: 0.96% | | | |
| 4,458 | | Bed Bath & Beyond, Inc.(a) | | | 147,872 |
| | |
| 2,778 | | Best Buy Co., Inc. | | | 152,346 |
| | |
| 246 | | Claire’s Stores, Inc. | | | 6,275 |
| | |
| | | | | 306,493 |
| | | | | |
| Telecommunications: 0.47% | | | |
| 9,500 | | Juniper Networks, Inc.(a) | | | 151,906 |
| | |
| | Total Common Stocks (Cost $30,708,146) | | | 31,406,512 |
| | | | | |
| Shares | | | | Value
(Note 3) |
| |
| MUTUAL FUNDS: 0.47% | | | |
| 7,951 | | Powershares Wilderhill Clean Energy Portfolio(b) | | $ | 151,149 |
| | |
| | Total Mutual Funds (Cost $158,147) | | | 151,149 |
| | |
| Par Value | | | | |
| |
| SHORT-TERM BANK DEBT INSTRUMENTS: 1.30% | | | |
| $415,688 | | Brown Brothers Harriman & Co. — Grand Cayman 4.350%, due 07/03/06 | | | 415,688 |
| | |
| | Total Short-Term Bank Debt Instruments (Cost $415,688) | | | 415,688 |
| | |
| | Total Investments: 99.65% (Cost $31,281,981) | | | 31,973,349 |
| | |
| | Net Other Assets and Liabilities: 0.35% | | | 112,503 |
| | |
| | Net Assets: 100.00% | | $ | 32,085,852 |
(a) Non-income producing security.
(b) Investments in other funds are calculated at their respective net asset values as determined by those funds, in accordance with the Investment Company Act of 1940.
Percentages are stated as a percent of net assets.
| | | | |
| See Notes to Financial Statements | | 29 | | June 30, 2006 |
Portfolio of Investments (Note 10) (Unaudited)
Forward Emerald Banking and Finance Fund
| | | | |
| Shares | | | | Value
(Note 3) |
| |
| COMMON STOCKS: 96.43% | | |
| Financial Services: 96.43% | | |
| | | | |
| | | | | |
| Banks Regional: 68.94% | | | |
| 57,905 | | Alabama National Bancorp Delaware | | $ | 3,946,226 |
| | |
| 74,800 | | Appalachian Bancshares, Inc.(a) | | | 1,363,230 |
| | |
| 121,454 | | Bank of The Ozarks, Inc. | | | 4,044,418 |
| | |
| 106,550 | | Boston Private Bancorp, Inc. | | | 2,972,745 |
| | |
| 62,400 | | Camden National Corp. | | | 2,489,760 |
| | |
| 52,840 | | Capital Corp. of The West | | | 1,690,880 |
| | |
| 140,504 | | Capital Crossing Bank(a) | | | 3,456,398 |
| | |
| 125,000 | | Cardinal Financial Corp. | | | 1,452,500 |
| | |
| 146,928 | | Cascade Financial Corp. | | | 2,273,483 |
| | |
| 111,846 | | Central Pacific Financial Corp. | | | 4,328,440 |
| | |
| 55,800 | | CoBiz, Inc. | | | 1,256,616 |
| | |
| 89,917 | | Codorus Valley Bancorp, Inc. | | | 1,723,709 |
| | |
| 218,200 | | Colonial Bancgroup, Inc. | | | 5,603,376 |
| | |
| 195,781 | | Community Banks, Inc. | | | 5,090,306 |
| | |
| 42,890 | | Dearborn Bancorp, Inc.(a) | | | 952,148 |
| | |
| 131,080 | | Desert Community Bank Vicorville CA | | | 2,422,935 |
| | |
| 31,183 | | East Penn Financial Corp. | | | 273,475 |
| | |
| 143,273 | | East West Bancorp, Inc. | | | 5,431,479 |
| | |
| 25,400 | | Enterprise Financial Services Corp. | | | 646,430 |
| | |
| 31,725 | | First Regional Bancorp(a) | | | 2,791,800 |
| | |
| 242,638 | | First Security Group, Inc. | | | 2,814,601 |
| | |
| 32,000 | | First State Bancorp | | | 760,960 |
| | |
| 19,800 | | First State Financial Corp. | | | 358,380 |
| | |
| 47,700 | | FNB Corp. VA. | | | 1,764,900 |
| | |
| 147,620 | | Gateway Financial Holdings, Inc. | | | 2,239,395 |
| | |
| 28,800 | | GB&T Bancshares, Inc. | | | 626,688 |
| | |
| 101,600 | | Great Southern Bancorp, Inc. | | | 3,101,848 |
| | |
| 32,942 | | Harrington West Financial Group, Inc. | | | 523,778 |
| | |
| 101,700 | | Heartland Financial USA, Inc. | | | 2,710,305 |
| | |
| 30,300 | | Heritage Commerce Corp. | | | 751,137 |
| | |
| 72,275 | | International Bancshares Corp. | | | 1,986,117 |
| | |
| 144,461 | | Lakeland Financial Corp. | | | 3,508,958 |
| | |
| 31,824 | | Leesport Financial Corp. | | | 731,952 |
| | |
| 86,099 | | Macatawa Bank Corp. | | | 2,013,844 |
| | | | | |
| | |
| 116,463 | | Mercantile Bank Corp. | | $ | 4,641,051 |
| | |
| 66,528 | | Mercantile Bankshare Corp. | | | 2,373,054 |
| | |
| 38,200 | | New Century Bancorp, Inc.(a) | | | 750,630 |
| | |
| 388,890 | | Nexity Financial Corp.(a) | | | 4,861,125 |
| | |
| 62,980 | | Oak Hill Financial, Inc. | | | 1,604,730 |
| | |
| 107,500 | | Pinnacle Financial Partners, Inc.(a) | | | 3,271,225 |
| | |
| 110,754 | | Preferred Bank of Los Angeles | | | 5,937,522 |
| | |
| 57,500 | | Princeton National Bancorp, Inc. | | | 1,877,375 |
| | |
| 35,300 | | Private Bancorp, Inc. | | | 1,461,773 |
| | |
| 201,722 | | Prosperity Bancshares, Inc. | | | 6,634,637 |
| | |
| 86,300 | | Pulaski Financial Corp. | | | 1,437,758 |
| | |
| 37,500 | | Sandy Springs Bancorp, Inc. | | | 1,352,250 |
| | |
| 90,200 | | Seacoast Banking Corp. of Florida | | | 2,402,026 |
| | |
| 160,042 | | Security Bank Corp. | | | 3,564,135 |
| | |
| 33,500 | | Signature Bank(a) | | | 1,084,730 |
| | |
| 128,836 | | Smithtown Bancorp, Inc. | | | 3,112,666 |
| | |
| 176,638 | | Southwest Bancorp, Inc. Oklahoma | | | 4,504,269 |
| | |
| 278,767 | | Sterling Financial Corp. | | | 6,104,997 |
| | |
| 145,697 | | Summit Bancshares, Inc.
Fort Worth Texas | | | 3,090,233 |
| | |
| 183,674 | | Superior Bancorp(a) | | | 2,020,414 |
| | |
| 36,900 | | SVB Financial Group(a) | | | 1,677,474 |
| | |
| 355,202 | | Texas Capital Bancshares, Inc.(a) | | | 8,276,207 |
| | |
| 331,101 | | Texas United Bancshares, Inc. | | | 9,320,493 |
| | |
| 31,500 | | UCBH Holdings, Inc. | | | 521,010 |
| | |
| 120,026 | | Union Bankshares Corp. | | | 5,177,922 |
| | |
| 190,700 | | United Community Banks, Inc. | | | 5,804,908 |
| | |
| 15,450 | | United Security Bancshares, Inc. | | | 330,475 |
| | |
| 131,671 | | Virginia Commerce Bancorp, Inc.(a) | | | 3,146,937 |
| | |
| 70,300 | | Virginia Financial Group, Inc. | | | 2,968,066 |
| | |
| 20,000 | | West Coast Bancorp | | | 589,400 |
| | |
| 84,500 | | Western Alliance Bancorp(a) | | | 2,938,910 |
| | |
| 361,982 | | Wilshire Bancorp, Inc. | | | 6,522,916 |
| | |
| 104,733 | | Yardville National Bancorp | | | 3,742,110 |
| | |
| | | | | 191,206,645 |
| | | | | |
| | | | |
| June 30, 2006 | | 30 | | See Notes to Financial Statements |
Portfolio of Investments (Note 10) (Unaudited)
Forward Emerald Banking and Finance Fund
| | | | | |
| Diversified Financial Services: 3.79% | | | |
| 203,200 | | E*Trade Financial Corp.(a) | | $ | 4,637,024 |
| | |
| 31,600 | | Legg Mason, Inc. | | | 3,144,832 |
| | |
| 77,233 | | Stifel Financial Corp.(a) | | | 2,727,097 |
| | |
| | | | | 10,508,953 |
| | | | | |
| Financial Data Processing Services: 2.89% |
| 128,179 | | Digital Insight Corp.(a) | | | 4,395,258 |
| | |
| 73,100 | | Penson Worldwide, Inc.(a) | | | 1,258,051 |
| | |
| 185,900 | | TradeStation Group, Inc.(a) | | | 2,355,353 |
| | |
| | | | | 8,008,662 |
| | | | | |
| Financial Information Services: 0.98% | | | |
| 211,800 | | TheStreet.com, Inc. | | | 2,715,276 |
| | | | | |
| Financial Miscellaneous: 3.13% | | | |
| 130,500 | | Advanta Corp. | | | 4,691,475 |
| | |
| 210,442 | | Thomas Weisel Partners Group Llc(a) | | | 4,000,503 |
| | |
| | | | | 8,691,978 |
| | | | | |
| Insurance Carriers: Property & Casualty: 8.27% |
| 27,400 | | Erie Indemnity Co. | | | 1,424,800 |
| | |
| 115,600 | | First Acceptance Corp.(a) | | | 1,361,768 |
| | |
| 169,300 | | HUB International, Ltd. | | | 4,437,353 |
| | |
| 68,700 | | Navigators Group, Inc.(a) | | | 3,010,434 |
| | |
| 70,000 | | North Pointe Holdings Corp.(a) | | | 511,000 |
| | |
| 3,100 | | PartnerRe, Ltd. | | | 198,555 |
| | |
| 106,981 | | Philadelphia Consolidated Holding Corp.(a) | | | 3,247,943 |
| | |
| 56,756 | | Selective Insurance Group, Inc. | | | 3,170,958 |
| | |
| 267,154 | | United America Indemnity, Ltd.(a) | | | 5,567,489 |
| | |
| | | | | 22,930,300 |
| | | | | |
| Insurance: Multi-Line: 0.62% | | | |
| 142,717 | | Brooke Corp. | | | 1,712,604 |
| | | | | |
| Investment Management Companies: 4.60% |
| 69,000 | | Affiliated Managers Group, Inc.(a) | | | 5,995,410 |
| | |
| 74,568 | | Calamos Asset Management, Inc. | | | 2,161,726 |
| | |
| 94,400 | | SEI Investments Co. | | | 4,614,272 |
| | |
| | | | | 12,771,408 |
| | | | | |
| Property Casualty: 0.25% | | | |
| 43,300 | | SeaBright Insurance Holdings, Inc.(a) | | | 697,563 |
| | | | | |
| | | | | |
| Real Estate Investment Trusts: 0.73% | | | |
| 12,500 | | Mid-America Apartment Communities, Inc. | | $ | 696,875 |
| | |
| 82,000 | | Urstadt Biddle Properties, Inc. | | | 1,335,780 |
| | |
| | | | | 2,032,655 |
| | | | | |
| Savings & Loans: 1.79% | | | |
| 27,000 | | Guaranty Federal Bancshares, Inc. | | | 757,350 |
| | |
| 187,600 | | Pacific Premier Bancorp.(a) | | | 2,194,920 |
| | |
| 19,800 | | PFF Bancorp, Inc. | | | 656,568 |
| | |
| 85,181 | | Willow Grove Bancorp, Inc. | | | 1,355,230 |
| | |
| | | | | 4,964,068 |
| | | | | |
| Securities Brokerage & Service: 0.44% | | | |
| 15,200 | | Investment Technology Group, Inc.(a) | | | 773,072 |
| | |
| 15,000 | | Raymond James Financial, Inc. | | | 454,050 |
| | |
| | | | | 1,227,122 |
| | |
| | Total Financial Services | | | 267,467,234 |
| | |
| | Total Common Stocks
(Cost $202,952,595) | | | 267,467,234 |
| | | | | | |
| | |
| Par Value | | | | | |
|
| SHORT-TERM BANK DEBT INSTRUMENTS: 4.43% | |
| $12,278,735 | | Bank of America — London
4.350%, due 07/03/06 | | | | |
| | | | | | |
| | |
| | Total Short-Term Bank Debt Instruments
(Cost $12,278,735) | | | 12,278,735 | |
| | |
| | Total Investments: 100.86%
(Cost $215,231,330) | | | 279,745,969 | |
| | |
| | Net Other Assets and Liabilities: (0.86)% | | | (2,372,935 | ) |
| | |
| | Net Assets: 100.00% | | $ | 277,373,034 | |
(a) Non-income producing security.
Percentages are stated as a percent of net assets.
| | | | |
| See Notes to Financial Statements | | 31 | | June 30, 2006 |
Portfolio of Investments (Note 10) (Unaudited)
Forward Emerald Opportunities Fund
| | | | | |
| Shares | | | | Value (Note 3) |
| |
| COMMON STOCKS: 73.45% | | | |
| Auto & Transportation: 0.46% | | | |
| 1,100 | | Landstar System, Inc. | | $ | 51,953 |
| | | | | |
| Consumer Discretionary: 15.03% | | | |
| 3,600 | | Coach, Inc.(a) | | | 107,640 |
| | |
| 300 | | Google, Inc.(a) | | | 125,799 |
| | |
| 5,000 | | GSI Commerce, Inc.(a)(c) | | | 67,650 |
| | |
| 3,000 | | Hilton Hotels Corp. | | | 84,840 |
| | |
| 4,000 | | Iconix Brand Group, Inc.(a) | | | 65,360 |
| | |
| 45,000 | | Internap Network Services Corp.(a) | | | 47,250 |
| | |
| 2,000 | | Jarden Corp.(a) | | | 60,900 |
| | |
| 3,000 | | Jupitermedia Corp.(a) | | | 39,000 |
| | |
| 200 | | LoopNet, Inc.(a) | | | 3,722 |
| | |
| 4,100 | | NutriSystem, Inc.(a) (c) | | | 254,733 |
| | |
| 2,000 | | Pinnacle Entertainment, Inc.(a) | | | 61,300 |
| | |
| 2,000 | | The Providence Service Corp.(a) | | | 54,460 |
| | |
| 300 | | Sears Holdings Corp.(a) | | | 46,452 |
| | |
| 20,000 | | Smith & Wesson Holding Corp.(a) | | | 164,400 |
| | |
| 2,500 | | THQ, Inc.(a) | | | 54,000 |
| | |
| 37,000 | | Traffic.com, Inc.(a) | | | 206,830 |
| | |
| 4,000 | | Trump Entertainment Resorts, Inc.(a) | | | 80,600 |
| | |
| 2,400 | | WESCO International, Inc.(a) | | | 165,600 |
| | |
| 1,000 | | XM Satellite Radio Holdings, Inc.(a) | | | 14,650 |
| | |
| | | | | 1,705,186 |
| | | | | |
| Consumer Staples: 6.75% | | | |
| 1,000 | | Altria Group, Inc. | | | 73,430 |
| | |
| 1,500 | | The Clorox Co. | | | 91,455 |
| | |
| 2,000 | | H.J. Heinz Co. Ltd. | | | 82,440 |
| | |
| 400 | | Hansen Natural Corp.(a) | | | 76,148 |
| | |
| 3,000 | | The Hershey Co.(c) | | | 165,210 |
| | |
| 6,000 | | Jones Soda Co.(a) | | | 54,000 |
| | |
| 6,000 | | Vical, Inc.(a) | | | 33,300 |
| | |
| 3,700 | | Wild Oats Markets, Inc.(a) | | | 72,520 |
| | |
| 1,000 | | Wm. Wrigley Jr. Co. | | | 45,360 |
| | |
| 15,000 | | Youbet.com, Inc.(a) | | | 72,450 |
| | |
| | | | | 766,313 |
| | | | | |
| | | | | |
| Shares | | | | Value (Note 3) |
|
|
| Energy: 4.47% | | | |
| 2,500 | | Carrizo Oil & Gas, Inc.(a) | | $ | 78,275 |
| | |
| 1,000 | | Halliburton Co. | | | 74,210 |
| | |
| 2,500 | | Helix Energy Solutions, Inc.(a) | | | 100,900 |
| | |
| 1,500 | | Hornbeck Offshore Services, Inc.(a) | | | 53,280 |
| | |
| 3,000 | | KFx, Inc.(a) | | | 45,840 |
| | |
| 3,500 | | Parallel Petroleum Corp.(a) | | | 86,485 |
| | |
| 2,000 | | Superior Energy Services, Inc.(a) | | | 67,800 |
| | |
| | | | | 506,790 |
| | | | | |
| Financial Services: 6.67% | | | |
| 3,000 | | Bankrate, Inc.(a) | | | 113,280 |
| | |
| 1,000 | | CheckFree Corp.(a) | | | 49,560 |
| | |
| 2,200 | | Citigroup, Inc. | | | 106,128 |
| | |
| 2,000 | | Digital Insight Corp.(a) | | | 68,580 |
| | |
| 2,000 | | E*TRADE Financial Corp.(a) | | | 45,640 |
| | |
| 400 | | The Goldman Sachs Group, Inc. | | | 60,172 |
| | |
| 2,000 | | SEI Investments Co.(c) | | | 97,760 |
| | |
| 16,800 | | TheStreet.com, Inc.(c) | | | 215,376 |
| | |
| | | | | 756,496 |
| | | | | |
| Health Care: 12.39% | | | |
| | | | | |
| | | | |
| Biotechnology: 7.61% | | |
| 2,000 | | Alnylam Pharmaceuticals, Inc.(a) | | 30,160 |
| | |
| 1,400 | | Amylin Pharmaceuticals, Inc.(a)(c) | | 69,118 |
| | |
| 3,000 | | BioCryst Pharmaceuticals, Inc.(a) | | 42,990 |
| | |
| 4,000 | | Cardiome Pharmaceutical Corp.(a) | | 35,360 |
| | |
| 4,700 | | Celgene Corp.(a)(c) | | 222,921 |
| | |
| 1,500 | | Crucell NV ADR(a)(b) | | 31,170 |
| | |
| 4,000 | | Cubist Pharmaceuticals, Inc.(a) | | 100,720 |
| | |
| 2,600 | | Digene Corp.(a) | | 100,724 |
| | |
| 1,300 | | Illumina, Inc.(a) | | 38,558 |
| | |
| 2,000 | | Myriad Genetics, Inc.(a) | | 50,500 |
| | |
| 4,200 | | Novavax, Inc.(a) | | 21,168 |
| | |
| 8,000 | | Sirna Therapeutics, Inc.(a) | | 45,600 |
| | |
| 4,500 | | Telik, Inc.(a)(c) | | 74,250 |
| | |
| | | | 863,239 |
| | | | |
| | | | |
| June 30, 2006 | | 32 | | See Notes to Financial Statements |
Portfolio of Investments (Note 10) (Unaudited)
Forward Emerald Opportunities Fund
| | | | | |
| Drugs & Pharmaceuticals: 1.48% | | | |
| 3,000 | | CV Therapeutics, Inc.(a) | | $ | 41,910 |
| | |
| 3,500 | | Dr. Reddy’s Laboratories, Ltd.(b) | | | 96,950 |
| | |
| 3,000 | | Quidel Corp.(a) | | | 28,500 |
| | |
| | | | | 167,360 |
| | | | | |
| Medical & Dental Instruments: 3.01% | | | |
| 1,500 | | dj Orthopedics, Inc.(a) | | | 55,245 |
| | |
| 1,600 | | I-Flow Corp.(a) | | | 17,312 |
| | |
| 15,000 | | Inovio Biomedical Corp.(a) | | | 31,050 |
| | |
| 7,700 | | LifeCell Corp.(a)(c) | | | 238,084 |
| | |
| | | | | 341,691 |
| | | | | |
| Miscellaneous Health Care: 0.29% | | | |
| 8,000 | | Thermogenesis Corp.(a) | | | 32,960 |
| | |
| | Total Health Care | | | 1,405,250 |
| | | | | |
| | | | |
| Materials & Processing: 3.17% | | |
| 1,800 | | McDermott International, Inc.(a) | | 81,846 |
| | |
| 700 | | Mobile Mini, Inc.(a) | | 20,482 |
| | |
| 8,500 | | PW Eagle, Inc.(c) | | 257,040 |
| | |
| | | | 359,368 |
| | | | |
| Producer Durables: 3.74% | | |
| 3,500 | | BEA Systems, Inc.(a) | | 45,815 |
| | |
| 500 | | Caterpillar, Inc. | | 37,240 |
| | |
| 14,000 | | C-COR, Inc.(a) | | 108,080 |
| | |
| 2,000 | | General Electric Co.(c) | | 65,920 |
| | |
| 2,000 | | InterDigital Communications Corp.(a)(c) | | 69,820 |
| | |
| 3,000 | | Varian Semiconductor Equipment Associates, Inc.(a) | | 97,830 |
| | |
| | | | 424,705 |
| | | | |
| Technology: 18.67% | | |
| 500 | | Allegheny Technologies, Inc. | | 34,620 |
| | |
| 1,000 | | Ansoft Corp.(a) | | 20,480 |
| | |
| 1,300 | | Apple Computer, Inc.(a) | | 74,256 |
| | |
| 1,300 | | BE Aerospace, Inc.(a) | | 29,718 |
| | |
| 1,500 | | Blackboard, Inc.(a) | | 43,440 |
| | |
| 15,000 | | Callidus Software, Inc.(a)(c) | | 79,200 |
| | |
| 10,000 | | Ciena Corp.(a) | | 48,100 |
| | | | | |
| Shares | | | | Value (Note 3) |
| | |
| 800 | | Cognizant Technology Solutions Corp.(a) | | $ | 53,896 |
| | |
| 7,000 | | EXFO Electro-Optical Engineering, Inc.(a) | | | 43,120 |
| | |
| 1,000 | | Fiserv, Inc.(a) | | | 45,360 |
| | |
| 2,500 | | Fuel-Tech NV(a) | | | 30,250 |
| | |
| 1,500 | | Gen-Probe, Inc.(a) | | | 80,970 |
| | |
| 4,000 | | Hewlett-Packard Co. | | | 126,720 |
| | |
| 6,000 | | Intel Corp. | | | 113,700 |
| | |
| 10,000 | | Internet Capital Group, Inc.(a) | | | 90,000 |
| | |
| 1,000 | | IntraLase Corp.(a) | | | 16,740 |
| | |
| 3,000 | | j2 Global Communications, Inc.(a) | | | 93,660 |
| | |
| 2,000 | | Kenexa Corp.(a) | | | 63,700 |
| | |
| 5,000 | | Micrus Endovascular Corp.(a) | | | 60,300 |
| | |
| 1,500 | | Motorola, Inc. | | | 30,225 |
| | |
| 2,800 | | MRO Software, Inc.(a) | | | 56,196 |
| | |
| 9,000 | | ON Semiconductor Corp.(a) | | | 52,920 |
| | |
| 4,000 | | OPNET Technologies, Inc.(a) | | | 51,840 |
| | |
| 5,000 | | Radiant Systems, Inc.(a) | | | 52,850 |
| | |
| 3,000 | | Respironics, Inc.(a) | | | 102,660 |
| | |
| 2,000 | | Sify Ltd.(a)(b) | | | 19,960 |
| | |
| 7,000 | | Smith Micro Software(a) | | | 112,140 |
| | |
| 5,400 | | SPSS, Inc.(a) | | | 173,556 |
| | |
| 6,500 | | TASER International, Inc.(a) | | | 51,415 |
| | |
| 4,500 | | Technitrol, Inc. | | | 104,175 |
| | |
| 10,000 | | Tut Systems, Inc.(a) | | | 24,200 |
| | |
| 2,000 | | Vishay Intertechnology, Inc.(a) | | | 31,460 |
| | |
| 3,000 | | WebEx Communications, Inc.(a) | | | 106,621 |
| | |
| | | | | 2,118,448 |
| | | | | |
| Utilities: 2.10% | | | |
| 5,500 | | Comcast Corp.(a) | | | 180,070 |
| | |
| 2,000 | | Duke Energy Corp. | | | 58,740 |
| | |
| | | | | 238,810 |
| | |
| | Total Common Stocks (Cost $7,836,144) | | | 8,333,319 |
| | | | |
| See Notes to Financial Statements | | 33 | | June 30, 2006 |
Portfolio of Investments (Note 10) (Unaudited)
Forward Emerald Opportunities Fund
| | | | | |
| Contracts | | | | Value (Note 3) |
| |
| OPTIONS PURCHASED: 2.98% | | | |
| Calls: 2.87% | | | |
| | |
| | Allegheny Technology | | | |
| | |
| 15 | | Expiration: August 2006 at $65.00 | | $ | 12,900 |
| | |
| | Apple Computer Inc. | | | |
| | |
| 30 | | Expiration: October 2006 at $60.00 | | | 12,600 |
| | |
| | Bankrate, Inc. | | | |
| | |
| 30 | | Expiration: November 2006 at $40.00 | | | 11,250 |
| | |
| | BioCryst Pharmaceuticals, Inc. | | | |
| | |
| 50 | | Expiration: September 2006 at $17.50 | | | 3,500 |
| | |
| | Celgene Corp. | | | |
| | |
| 10 | | Expiration: July 2006 at $42.50 | | | 5,250 |
| | |
| 20 | | Expiration: July 2006 at $40.00 | | | 15,200 |
| | |
| | Cognizant Technology Solutions Corp. | | | |
| | |
| 15 | | Expiration: July 2006 at $60.00 | | | 12,600 |
| | |
| 10 | | Expiration: August 2006 at $65.00 | | | 10,100 |
| | |
| | Cubist Pharmaceuticals, Inc. | | | |
| | |
| 30 | | Expiration: November 2006 at $22.50 | | | 14,100 |
| | |
| | Dr. Reddy’s Laboratories, Ltd. | | | |
| | |
| 20 | | Expiration: September 2006 at $30.00 | | | 3,300 |
| | |
| 60 | | Expiration: September 2006 at $35.00 | | | 3,300 |
| | |
| | Gen-Probe, Inc. | | | |
| | |
| 20 | | Expiration: July 2006 at $50.00 | | | 8,800 |
| | |
| | Google, Inc. | | | |
| | |
| 4 | | Expiration: July 2006 at $390.00 | | | 13,640 |
| | |
| 4 | | Expiration: August 2006 at $420.00 | | | 8,740 |
| | |
| | Hyperion Solutions Corp. | | | |
| | |
| 25 | | Expiration: August 2006 at $25.00 | | | 10,750 |
| | |
| | Illumina, Inc. | | | |
| | |
| 30 | | Expiration: August 2006 at $30.00 | | | 6,750 |
| | |
| | KFX, Inc. | | | |
| | |
| 40 | | Expiration: January 2007 at $17.50 | | | 6,300 |
| | |
| | LifeCell Corp. | | | |
| | |
| 30 | | Expiration: December 2006 at $27.50 | | | 19,200 |
| | |
| | Micron Technology, Inc. | | | |
| | |
| 60 | | Expiration: July 2006 at $17.00 | | | 600 |
| | | | | |
| Contracts | | | | Value (Note 3) |
|
|
| | | |
| | Nektar Therapeutics | | | |
| | |
| 40 | | Expiration: August 2006 at $20.00 | | $ | 9,100 |
| | |
| | Netlogic Microsystems, Inc. | | | |
| | |
| 35 | | Expiration: July 2006 at $35.00 | | | 2,975 |
| | |
| | NutriSystem, Inc. | | | |
| | |
| 20 | | Expiration: July 2006 at $55.00 | | | 9,800 |
| | |
| 10 | | Expiration: September 2006 at $55.00 | | | 5,650 |
| | |
| | Onyx Pharmaceuticals, Inc. | | | |
| | |
| 50 | | Expiration: July 2006 at $17.50 | | | 5,000 |
| | |
| | Penn National Gaming | | | |
| | |
| 40 | | Expiration: July 2006 at $40.00 | | | 3,000 |
| | |
| | PW Eagle, Inc. | | | |
| | |
| 60 | | Expiration: September 2006 at $30.00 | | | 21,600 |
| | |
| | Respironics, Inc. | | | |
| | |
| 40 | | Expiration: October 2006 at $40.00 | | | 2,200 |
| | |
| | RPC, Inc. | | | |
| | |
| 20 | | Expiration: September 2006 at $25.00 | | | 4,750 |
| | |
| | S&P 100 Index | | | |
| | |
| 10 | | Expiration: July 2006 at $570.00 | | | 2,300 |
| | |
| | Sears Holdings Corp. | | | |
| | |
| 15 | | Expiration: September 2006 at $145.00 | | | 25,650 |
| | |
| | Telik, Inc. | | | |
| | |
| 70 | | Expiration: January 2007 at $17.50 | | | 28,000 |
| | |
| 35 | | Expiration: July 2006 at $15.00 | | | 612 |
| | |
| 20 | | Expiration: January 2007 at $15.00 | | | 10,300 |
| | |
| | THQ, Inc. | | | |
| | |
| 20 | | Expiration: September 2006 at $20.00 | | | 5,100 |
| | |
| | WESCO International, Inc. | | | |
| | |
| 20 | | Expiration: August 2006 at $65.00 | | | 10,600 |
| | |
| | | | | 325,517 |
| | | | | |
| Puts: 0.11% | | | |
| | eBAY, Inc. | | | |
| | |
| 30 | | Expiration: July 2006 at $40.00 | | | 75 |
| | |
| | Jarden Corp. | | | |
| | |
| 30 | | Expiration: July 2006 at $35.00 | | | 225 |
| | | | |
| June 30, 2006 | | 34 | | See Notes to Financial Statements |
Portfolio of Investments (Note 10) (Unaudited)
Forward Emerald Opportunities Fund
| | | | | | |
| Contracts | | | | Value (Note 3) | |
|
| |
| | | |
| | Myriad Genetics, Inc. | | | | |
| | |
| 30 | | Expiration: August 2006 at $30.00 | | $ | 825 | |
| | |
| | Telik, Inc. | | | | |
| | |
| 90 | | Expiration: July 2006 at $17.50 | | | 2,250 | |
| | |
| 30 | | Expiration: January 2007 at $20.00 | | | 9,000 | |
| | |
| | | | | 12,375 | |
| | |
| | Total Options Purchased (Cost $431,429) | | | 337,892 | |
| | |
| Par Value | | | | | |
|
| SHORT-TERM BANK DEBT INSTRUMENTS: 38.90% | |
| | |
| $4,412,792 | | Bank of America: London
4.350%, 07/03/06 | | | 4,412,792 | |
| | |
| | Total Short-Term Bank Debt Instruments (Cost $4,412,792) | | | 4,412,792 | |
| | |
| | Total Investments: 115.33% (Cost $12,680,365) | | | 13,084,003 | |
| | |
| | Net Other Assets and Liabilities: (15.33)% | | | (1,739,434 | ) |
| | |
| | Net Assets: 100.00% | | $ | 11,344,569 | |
| | | | | | |
| Contracts | | | | Value (Note 3) | |
| |
| OPTIONS WRITTEN | | | | |
| Puts | | | | |
| | NutriSystem, Inc. | | | | |
| | |
| 10 | | Expiration: September 2006 at $50.00 | | $ | (3,900 | ) |
| | |
| | Total Options Written (Premiums received $5,070) | | | (3,900 | ) |
| | |
| Shares | | | | Value | |
| |
| SCHEDULE OF SECURITIES SOLD SHORT | | | | |
| (9,000) | | Arctic Cat, Inc. | | | (175,590 | ) |
| | |
| (17,000) | | Autobytel, Inc. | | | (60,010 | ) |
| | |
| (1,500) | | Cognos, Inc. | | | (42,675 | ) |
| | |
| (19,000) | | Corillian Corp. | | | (56,810 | ) |
| | |
| (7,000) | | ExpressJet Holdings, Inc. | | | (48,370 | ) |
| | |
| (12,000) | | INVESTools, Inc. | | | (95,280 | ) |
| | |
| (5,000) | | Monaco Coach Corp. | | | (63,500 | ) |
| | |
| (3,000) | | NASDAQ 100 Index Fund(d) | | | (116,280 | ) |
| | |
| (500) | | Nektar Therapeutics | | | (9,170 | ) |
| | |
| (6,800) | | New River Pharmaceuticals, Inc. | | | (193,800 | ) |
| | |
| (8,800) | | Onyx Pharmaceuticals, Inc. | | | (148,104 | ) |
| | |
| (1,200) | | S1 Corp. | | | (57,600 | ) |
| | |
| | Total Securities Sold Short (Proceeds $1,065,271) | | $ | (1,067,189 | ) |
(a) Non-income producing security.
(b) ADR — American Depositary Receipt
(c) Security, or portion of security, is being held as collateral for short sales.
(d) Investments in other funds are calculated at their respective net asset values as determined by those funds, in accordance with the Investment Company Act of 1940.
Percentages are stated as a percent of net assets.
| | | | |
| See Notes to Financial Statements | | 35 | | June 30, 2006 |
Portfolio of Investments (Note 10) (Unaudited)
Forward Uniplan Real Estate Investment Fund
| | | | | |
| Shares | | | | Value (Note 3) |
| |
| COMMON STOCKS: 97.41% | | | |
| Health Care: 6.28% | | | |
| 12,750 | | Alexandria Real Estate Equities, Inc. | | $ | 1,130,670 |
| | |
| 55,200 | | BioMed Realty Trust, Inc. | | | 1,652,688 |
| | |
| | | | | 2,783,358 |
| | | | | |
| Hotels: 7.03% | | | |
| 67,000 | | Great Wolf Resorts, Inc.(a) | | | 804,670 |
| | |
| 67,225 | | Interstate Hotels & Resorts, Inc.(a) | | | 624,520 |
| | |
| 28,000 | | Starwood Hotels & Resorts Worldwide, Inc. | | | 1,689,520 |
| | |
| | | | | 3,118,710 |
| | | | | |
| Industrial: 12.49% | | | |
| 41,350 | | AMB Property Corp. | | | 2,090,242 |
| | |
| 40,300 | | EastGroup Properties, Inc. | | | 1,881,204 |
| | |
| 30,000 | | ProLogis | | | 1,563,600 |
| | |
| | | | | 5,535,046 |
| | | | | |
| Office: 13.52% | | | |
| 16,500 | | Boston Properties, Inc. | | | 1,491,600 |
| | |
| 18,400 | | Kilroy Realty Corp. | | | 1,329,400 |
| | |
| 21,250 | | SL Green Realty Corp. | | | 2,326,238 |
| | |
| 29,500 | | Trizec Properties, Inc. | | | 844,880 |
| | |
| | | | | 5,992,118 |
| | | | | |
| Residential: 13.98% | | | |
| 36,000 | | American Campus Communities, Inc. | | | 894,600 |
| | |
| 20,700 | | Archstone-Smith Trust | | | 1,053,009 |
| | |
| 18,000 | | AvalonBay Communities, Inc. | | | 1,991,160 |
| | |
| 32,200 | | Boardwalk Real Estate Investment Trust | | | 742,676 |
| | |
| 5,000 | | Camden Property Trust | | | 367,750 |
| | |
| 25,700 | | Equity Residential | | | 1,149,561 |
| | |
| | | | | 6,198,756 |
| | | | | |
| Retail: 34.99% | | | |
| 1,000 | | Alexander’s, Inc.(a) | | | 271,760 |
| | |
| 31,550 | | CBL & Associates Properties, Inc. | | | 1,228,241 |
| | |
| 48,100 | | Cedar Shopping Centers, Inc. | | | 708,032 |
| | |
| 26,000 | | Developers Diversified Realty Corp. | | | 1,356,680 |
| | |
| 1,800 | | Feldman Mall Properties, Inc. | | | 19,728 |
| | |
| 31,200 | | General Growth Properties, Inc. | | | 1,405,872 |
| | | | | |
| Shares | | | | Value (Note 3) |
|
|
| | | | |
| 49,100 | | Kimco Realty Corp. | | $ | 1,791,659 |
| | |
| 26,200 | | Realty Income Corp. | | | 573,780 |
| | |
| 21,250 | | Regency Centers Corp. | | | 1,320,688 |
| | |
| 37,108 | | Simon Property Group, Inc. | | | 3,077,738 |
| | |
| 25,100 | | The Mills Corp. | | | 671,425 |
| | |
| 19,000 | | Vornado Realty Trust | | | 1,853,450 |
| | |
| 32,200 | | Weingarten Realty Investors | | | 1,232,616 |
| | |
| | | | | 15,511,669 |
| | | | | |
| Specialty: 9.12% | | | |
| 42,000 | | CB Richard Ellis Group, Inc., Class A(a) | | | 1,045,800 |
| | |
| 19,000 | | Global Signal, Inc. | | | 880,080 |
| | |
| 13,944 | | Patriot Capital Funding, Inc. | | | 154,778 |
| | |
| 20,000 | | Potlatch Corp. | | | 755,000 |
| | |
| 31,800 | | Rayonier, Inc. | | | 1,205,538 |
| | |
| | | | | 4,041,196 |
| | |
| | Total Common Stocks
(Cost $24,712,442) | | | 43,180,853 |
| |
| PREFERRED STOCKS: 1.49% | | | |
| Health Care: 1.49% | | | |
| 15,000 | | LTC Properties, Inc., Series E, 8.500% | | | 660,000 |
| | |
| | Total Preferred Stocks
(Cost $375,000) | | | 660,000 |
| | |
Par
Value | | | | |
|
| SHORT-TERM BANK DEBT INSTRUMENTS: 0.00%(b) |
| $1,407 | | Brown Brothers Harriman & Co.: Grand Cayman 4.350%, 07/03/06 | | | 1,407 |
| | |
| | Total Short-Term Bank Debt Instruments
(Cost $1,407) | | | 1,407 |
| | |
| | Total Investments: 98.90%
(Cost $25,088,849) | | | 43,842,260 |
| | |
| | Net other Assets and Liabilities: 1.10% | | | 488,597 |
| | |
| | Net Assets: 100.00% | | $ | 44,330,857 |
(a) Non-income producing security.
(b) Amount represents less than 0.01%.
Percentages are stated as a percent of net assets.
| | | | |
| June 30, 2006 | | 36 | | See Notes to Financial Statements |
Portfolio of Investments (Note 10) (Unaudited)
Forward Emerald Growth Fund
| | | | | |
| Shares | | | | Value (Note 3) |
| |
| COMMON STOCKS: 96.50% | | | |
| Auto & Transportation: 4.39% | | | |
| 74,250 | | Forward Air Corp. | | $ | 3,024,202 |
| | |
| 83,150 | | Old Dominion Freight Lines, Inc.(a) | | | 3,125,609 |
| | |
| 57,700 | | Wabtec Corp. | | | 2,157,980 |
| | |
| | | | | 8,307,791 |
| | | | | |
| Consumer Discretionary: 20.05% | | | |
| 188,600 | | 24/7 Real Media, Inc.(a) | | | 1,655,908 |
| | |
| 112,800 | | Aaron Rents, Inc. | | | 3,032,064 |
| | |
| 42,200 | | Aéropostale, Inc.(a) | | | 1,219,158 |
| | |
| 69,400 | | Cache, Inc.(a) | | | 1,203,396 |
| | |
| 24,900 | | Christopher & Banks Corp. | | | 722,100 |
| | |
| 136,101 | | DiamondCluster International, Inc.(a) | | | 1,077,920 |
| | |
| 88,000 | | EarthLink, Inc.(a) | | | 762,080 |
| | |
| 37,900 | | Gevity HR, Inc. | | | 1,006,245 |
| | |
| 25,514 | | Hibbett Sporting Goods, Inc.(a) | | | 609,784 |
| | |
| 144,600 | | Iconix Brand Group, Inc.(a) | | | 2,362,764 |
| | |
| 641,800 | | Internap Network Services Corp.(a) | | | 673,890 |
| | |
| 54,900 | | Lifetime Brands, Inc. | | | 1,189,683 |
| | |
| 71,700 | | Lions Gate Entertainment Corp.(a) | | | 613,035 |
| | |
| 3,900 | | LoopNet, Inc.(a) | | | 72,579 |
| | |
| 40,800 | | Marvel Entertainment, Inc.(a) | | | 816,000 |
| | |
| 25,900 | | Morgans Hotel Group Co.(a) | | | 403,004 |
| | |
| 46,200 | | Navigant Consulting, Inc.(a) | | | 1,046,430 |
| | |
| 96,600 | | NutriSystem, Inc.(a) | | | 6,001,758 |
| | |
| 13,400 | | Pinnacle Entertainment, Inc.(a) | | | 410,710 |
| | |
| 64,047 | | Providence Service Corp.(a) | | | 1,744,000 |
| | |
| 169,700 | | Smith & Wesson Holding Corp.(a) | | | 1,394,934 |
| | |
| 51,100 | | Stein Mart, Inc. | | | 756,280 |
| | |
| 28,700 | | THQ, Inc.(a) | | | 619,920 |
| | |
| 64,200 | | WebSideStory, Inc.(a) | | | 783,240 |
| | |
| 91,500 | | WESCO International, Inc.(a) | | | 6,313,500 |
| | |
| 183,500 | | The Wet Seal, Inc.(a) | | | 895,480 |
| | |
| 13,400 | | World Fuel Services Corp. | | | 612,246 |
| | |
| | | | | 37,998,108 |
| | | | | |
| Consumer Staples: 0.74% | | | |
| 7,383 | | Hansen Natural Corp.(a) | | | 1,405,502 |
| | | | | |
| | | | | |
| Shares | | | | Value (Note 3) |
|
|
| Energy: 5.92% | | | |
| 23,200 | | Atwood Oceanics, Inc.(a) | | $ | 1,150,720 |
| | |
| 52,624 | | Helix Energy Solutions, Inc.(a) | | | 2,123,905 |
| | |
| 58,100 | | Hercules Offshore, Inc.(a) | | | 2,033,500 |
| | |
| 21,600 | | Hornbeck Offshore Services, Inc.(a) | | | 767,232 |
| | |
| 89,500 | | KFx, Inc.(a) | | | 1,367,560 |
| | |
| 18,900 | | Parallel Petroleum Corp.(a) | | | 467,019 |
| | |
| 86,300 | | Superior Energy Services, Inc.(a) | | | 2,925,570 |
| | |
| 15,600 | | Warrior Energy Services Corp.(a) | | | 379,548 |
| | |
| | | | | 11,215,054 |
| | | | | |
| Financial Services: 6.07% | | | |
| 71,502 | | Digital Insight Corp.(a) | | | 2,451,803 |
| | |
| 44,900 | | Prosperity Bancshares, Inc. | | | 1,476,761 |
| | |
| 49,538 | | Texas Capital Bancshares, Inc.(a) | | | 1,154,235 |
| | |
| 51,900 | | Thomas Weisel Partners Group, Inc.(a) | | | 986,619 |
| | |
| 92,500 | | TheStreet.com, Inc. | | | 1,185,850 |
| | |
| 69,541 | | UCBH Holdings, Inc. | | | 1,150,208 |
| | |
| 33,915 | | United America Indemnity, Ltd.(a) | | | 706,789 |
| | |
| 75,993 | | Wilshire Bancorp, Inc. | | | 1,369,394 |
| | |
| 28,700 | | Yardville National Bancorp | | | 1,025,451 |
| | |
| | | | | 11,507,110 |
| | | | | |
| Health Care: 16.35% | | | |
| 2,500 | | Adeza Biomedical Corp.(a) | | | 35,050 |
| | |
| 117,775 | | Allscripts Healthcare Solutions, Inc.(a) | | | 2,066,951 |
| | |
| 73,401 | | Cardiome Pharmaceuticals Corp.(a) | | | 648,865 |
| | |
| 98,100 | | Cubist Pharmaceuticals, Inc.(a) | | | 2,470,158 |
| | |
| 69,700 | | CV Therapeutics, Inc.(a) | | | 973,709 |
| | |
| 51,742 | | Digene Corp.(a) | | | 2,004,485 |
| | |
| 22,300 | | dj Orthopedics, Inc.(a) | | | 821,309 |
| | |
| 62,879 | | Gen-Probe, Inc.(a) | | | 3,394,208 |
| | |
| 63,891 | | Horizon Health Corp.(a) | | | 1,334,044 |
| | |
| 54,600 | | I-Flow Corp.(a) | | | 590,772 |
| | |
| 73,827 | | Illumina, Inc.(a) | | | 2,189,709 |
| | |
| 43,700 | | IntraLase Corp.(a) | | | 731,538 |
| | |
| 103,618 | | LifeCell Corp.(a) | | | 3,203,869 |
| | |
| 18,700 | | Micrus Endovascular Corp.(a) | | | 225,522 |
| | | | |
| See Notes to Financial Statements | | 37 | | June 30, 2006 |
Portfolio of Investments (Note 10) (Unaudited)
Forward Emerald Growth Fund
| | | | | |
| Shares | | | | Value (Note 3) |
| | | | |
| | |
| 25,806 | | Neuro Matrix, Llc.(a) | | $ | 786,051 |
| | |
| 81,400 | | NovaMed, Inc.(a) | | | 549,450 |
| | |
| 46,100 | | NUCRYST Pharmaceuticals Corp.(a) | | | 594,229 |
| | |
| 116,644 | | Psychiatric Solutions, Inc. (a) | | | 3,343,017 |
| | |
| 47,300 | | ResMed, Inc.(a) | | | 2,220,735 |
| | |
| 50,800 | | The Spectranetics Corp.(a) | | | 544,576 |
| | |
| 89,627 | | Telik, Inc.(a) | | | 1,478,845 |
| | |
| 189,081 | | Thermogenesis Corp.(a) | | | 779,014 |
| | |
| | | | | 30,986,106 |
| | | | | |
| Materials & Processing: 4.76% | | | |
| 135,800 | | Airgas, Inc. | | | 5,058,550 |
| | |
| 29,100 | | Allegheny Technologies, Inc. | | | 2,014,884 |
| | |
| 26,700 | | Mobile Mini, Inc.(a) | | | 781,242 |
| | |
| 38,600 | | PW Eagle, Inc. | | | 1,167,264 |
| | |
| | | | | 9,021,940 |
| | | | | |
| Producer Durables: 15.30% | | | |
| 13,243 | | American Science & Engineering, Inc.(a) | | | 767,035 |
| | |
| 126,718 | | Arris Groups, Inc.(a) | | | 1,662,540 |
| | |
| 137,518 | | BE Aerospace, Inc.(a) | | | 3,143,661 |
| | |
| 26,400 | | Cohu, Inc. | | | 463,320 |
| | |
| 117,600 | | EMCORE Corp.(a) | | | 1,128,960 |
| | |
| 88,000 | | Entegris, Inc.(a) | | | 838,640 |
| | |
| 167,450 | | Environmental Tectonics Corp.(a) | | | 987,955 |
| | |
| 64,000 | | Esco Technologies, Inc.(a) | | | 3,420,800 |
| | |
| 90,800 | | EXFO Electro-Optical Engineering, Inc.(a) | | | 559,328 |
| | |
| 46,495 | | H&E Equipment Services, Inc.(a) | | | 1,369,278 |
| | |
| 103,904 | | JLG Industries, Inc. | | | 2,337,840 |
| | |
| 34,200 | | Kennametal, Inc. | | | 2,128,950 |
| | |
| 109,353 | | Met-Pro Corp. | | | 1,368,006 |
| | |
| 90,715 | | Paragon Technologies, Inc.(a) | | | 796,478 |
| | |
| 42,900 | | SBA Communications Corp.(a) | | | 1,121,406 |
| | |
| 106,248 | | Semitool, Inc.(a) | | | 958,357 |
| | |
| 158,800 | | Taser International, Inc.(a) | | | 1,256,108 |
| | |
| 98,700 | | Technitrol, Inc. | | | 2,284,905 |
| | | | | |
| Shares | | | | Value (Note 3) |
| | | | |
| | |
| 50,900 | | Varian Semiconductor Equipment Association, Inc. (a) | | $ | 1,659,849 |
| | |
| 30,500 | | Veeco Instruments, Inc.(a) | | | 727,120 |
| | |
| | | | | 28,980,536 |
| | | | | |
| Technology: 22.74% | | | |
| 85,276 | | Ansoft Corp.(a) | | | 1,746,452 |
| | |
| 44,056 | | Ansys, Inc.(a) | | | 2,106,758 |
| | |
| 44,400 | | Atheros Communications, Inc.(a) | | | 841,824 |
| | |
| 94,359 | | Blackboard, Inc.(a) | | | 2,732,637 |
| | |
| 49,100 | | Cognizant Technology Solutions Corp.(a) | | | 3,307,867 |
| | |
| 45,300 | | Fairchild Semiconductor International, Inc.(a) | | | 823,101 |
| | |
| 370,400 | | Finisar Corp.(a) | | | 1,211,208 |
| | |
| 53,501 | | FormFactor, Inc.(a) | | | 2,387,750 |
| | |
| 103,649 | | II-VI, Inc.(a) | | | 1,896,777 |
| | |
| 76,066 | | Ikanos Communications(a) | | | 1,155,443 |
| | |
| 148,996 | | Ixia, Inc.(a) | | | 1,340,964 |
| | |
| 98,000 | | j2 Global Communications, Inc.(a) | | | 3,059,560 |
| | |
| 27,300 | | Kenexa Corp.(a) | | | 869,505 |
| | |
| 135,400 | | Mindspeed Technologies, Inc.(a) | | | 326,314 |
| | |
| 94,089 | | MRO Software, Inc.(a) | | | 1,888,366 |
| | |
| 85,700 | | M-Systems Flash Disk Pioneers, Ltd.(a) | | | 2,539,291 |
| | |
| 26,500 | | Neoware Systems, Inc.(a) | | | 325,685 |
| | |
| 78,500 | | Oplink Communications, Inc.(a) | | | 1,437,335 |
| | |
| 99,097 | | Opnet Technologies, Inc.(a) | | | 1,284,297 |
| | |
| 114,300 | | Opsware, Inc.(a) | | | 941,832 |
| | |
| 20,153 | | Progress Software Corp.(a) | | | 471,782 |
| | |
| 26,800 | | Radiant Systems, Inc.(a) | | | 283,276 |
| | |
| 89,777 | | Redback Networks, Inc.(a) | | | 1,646,510 |
| | |
| 24,200 | | Sirf Technology Holdings, Inc.(a) | | | 779,724 |
| | |
| 119,700 | | Smith Micro Software, Inc.(a) | | | 1,917,594 |
| | |
| 65,200 | | SPSS, Inc.(a) | | | 2,095,528 |
| | |
| 114,179 | | Tut Systems, Inc.(a) | | | 276,313 |
| | |
| 89,200 | | Ultimate Software Group, Inc.(a) | | | 1,709,072 |
| | | | |
| June 30, 2006 | | 38 | | See Notes to Financial Statements |
Portfolio of Investments (Note 10) (Unaudited)
Forward Emerald Growth Fund
| | | | | |
| Shares | | | | Value (Note 3) |
| | | | |
| | |
| 38,136 | | Viasat, Inc.(a) | | $ | 979,332 |
| | |
| 19,900 | | WebEx Communications, Inc.(a) | | | 707,246 |
| | |
| | | | | 43,089,343 |
| | | | | |
| Utilities: 0.18% | | | |
| 31,100 | | First Avenue Networks, Inc.(a) | | | 338,368 |
| | |
| | Total Common Stocks
(Cost $139,171,652) | | | 182,849,858 |
| |
| WARRANTS: 0.00%(b) | | | |
| | |
| | American Banknote Corp., Series 1, | | | |
| | |
| 28 | | Expiration: 10/01/07, Strike: $10.00(a) | | | 0 |
| | |
| | American Banknote Corp., Series 2, | | | |
| | |
| 28 | | Expiration: 10/01/07, Strike: $12.50(a) | | | 0 |
| | |
| | Total Warrants | | | 0 |
| | |
| | (Cost $0) | | | |
| | | | | | |
| Par Value | | | | Value (Note 3) | |
|
| SHORT-TERM BANK DEBT INSTRUMENTS: 3.86% | |
| | |
| $7,311,084 | | Wachovia Bank: Grand Cayman 4.350%, due 07/03/06 | | $ | 7,311,084 | |
| | |
| | Total Short-Term Bank Debt Instruments
(Cost $7,311,084) | | | 7,311,084 | |
| | |
| | Total Investments: 100.36%
(Cost $146,482,736) | | | 190,160,942 | |
| | |
| | Net Other Assets and Liabilities: (0.36)% | | | (682,353 | ) |
| | |
| | Net Assets: 100.00% | | $ | 189,478,589 | |
(a) Non-income producing security.
(b) Amount represents less than 0.01%.
Percentages are stated as a percent of net assets.
| | | | |
| See Notes to Financial Statements | | 39 | | June 30, 2006 |
Portfolio of Investments (Note 10) (Unaudited)
Forward Hoover Small Cap Equity Fund
| | | | | |
| Shares | | | | Value
(Note 3) |
| |
| COMMON STOCKS: 97.34% | | | |
| Auto & Transportation: 3.68% | | | |
| 309,900 | | Aftermarket Technology Corp.(a) | | $ | 7,701,015 |
| 142,500 | | Bristow Group, Inc.(a) | | | 5,130,000 |
| 200,000 | | U.S. Xpress Enterprises, Inc.(a) | | | 5,404,000 |
| | |
| | | | | 18,235,015 |
| | | | | |
| Consumer Discretionary: 27.06%(b) | | | |
| 192,400 | | Aeropostale, Inc.(a) | | | 5,558,436 |
| 189,700 | | American Greetings Corp. | | | 3,985,597 |
| 125,100 | | AnnTaylor Stores Corp.(a) | | | 5,426,838 |
| 224,500 | | Cabela’s, Inc.(a) | | | 4,323,870 |
| 115,900 | | Central Garden & Pet Co.(a) | | | 4,989,495 |
| 417,000 | | Charming Shoppes, Inc.(a) | | | 4,687,080 |
| 153,600 | | The Children’s Place Retail Stores, Inc.(a) | | | 9,223,680 |
| 254,700 | | Christopher & Banks Corp. | | | 7,386,300 |
| 128,900 | | Corrections Corporation of America(a) | | | 6,823,966 |
| 175,200 | | The Dress Barn, Inc.(a) | | | 4,441,320 |
| 156,000 | | The GEO Group, Inc.(a) | | | 5,467,800 |
| 163,950 | | Hibbett Sporting Goods, Inc.(a) | | | 3,918,405 |
| 215,000 | | ICT Group, Inc.(a) | | | 5,273,950 |
| 139,500 | | Intrawest Corp. | | | 4,444,470 |
| 99,900 | | Jack in the Box, Inc.(a) | | | 3,916,080 |
| 141,950 | | The Men’s Wearhouse, Inc. | | | 4,301,085 |
| 212,000 | | Movado Group, Inc. | | | 4,865,400 |
| 161,000 | | Oxford Industries, Inc. | | | 6,345,010 |
| 129,500 | | Phillips-Van Heusen | | | 4,941,720 |
| 289,500 | | Quiksilver, Inc.(a) | | | 3,526,110 |
| 108,300 | | Scientific Games Corp., Class A(a) | | | 3,857,646 |
| 121,700 | | Steiner Leisure Ltd.(a) | | | 4,810,801 |
| 99,800 | | Tractor Supply Co.(a) | | | 5,515,946 |
| 161,800 | | United Natural Foods, Inc.(a) | | | 5,342,636 |
| 77,100 | | WESCO International, Inc.(a) | | | 5,147,196 |
| 118,800 | | World Fuel Services Corp. | | | 5,427,972 |
| | | | | 133,948,809 |
| | | | | |
| Consumer Staples: 4.20% | | | |
| 187,400 | | The Hain Celestial Group, Inc.(a) | | | 4,827,424 |
| 147,100 | | Longs Drug Stores Corp. | | | 6,710,702 |
| | | | | |
| Shares | | | | Value
(Note 3) |
|
|
| | | | |
| | |
| 193,500 | | NBTY, Inc.(a) | | $ | 4,626,585 |
| | |
| 152,400 | | Performance Food Group Co.(a) | | | 4,629,912 |
| | |
| | | | | 20,794,623 |
| | | | | |
| Energy: 6.63% | | | |
| | |
| 139,300 | | Hercules Offshore, Inc.(a) | | | 4,875,500 |
| | |
| 72,600 | | The Houston Exploration Co.(a) | | | 4,442,394 |
| | |
| 182,700 | | Parallel Petroleum Corp.(a) | | | 4,514,517 |
| | |
| 236,100 | | Superior Energy Services, Inc.(a) | | | 8,003,790 |
| | |
| 279,050 | | TETRA Technologies, Inc.(a) | | | 8,452,424 |
| | |
| 62,000 | | TODCO(a) | | | 2,532,700 |
| | |
| | | | | 32,821,325 |
| | | | | |
| Financial Services: 23.61% | | | |
| 289,300 | | Advance America Cash Advance
Centers, Inc. | | | 5,074,322 |
| | |
| 146,700 | | Advent Software, Inc.(a) | | | 5,291,469 |
| | |
| 55,900 | | Affiliated Managers Group, Inc.(a) | | | 4,857,151 |
| | |
| 39,900 | | Alexandria Real Estate Equities, Inc. | | | 3,538,332 |
| | |
| 193,200 | | BioMed Realty Trust, Inc. | | | 5,784,408 |
| | |
| 121,100 | | Corporate Office Properties Trust | | | 5,095,888 |
| | |
| 130,000 | | Crescent Real Estate Equities Co. | | | 2,412,800 |
| | |
| 148,300 | | DiamondRock Hospitality Co. | | | 2,196,323 |
| | |
| 155,900 | | Digital Realty Trust, Inc. | | | 3,849,171 |
| | |
| 134,200 | | East West Bancorp, Inc. | | | 5,087,522 |
| | |
| 272,800 | | Equity Inns, Inc. | | | 4,517,568 |
| | |
| 142,600 | | First Midwest Bancorp, Inc. | | | 5,287,608 |
| | |
| 115,100 | | GATX Corp. | | | 4,891,750 |
| | |
| 166,500 | | Greater Bay Bancorp | | | 4,786,875 |
| | |
| 95,700 | | Hancock Holding Co. | | | 5,359,200 |
| | |
| 107,800 | | Investment Technology Group, Inc.(a) | | | 5,482,708 |
| | |
| 137,200 | | McGrath Rentcorp | | | 3,815,532 |
| | |
| 68,150 | | Raymond James Financial, Inc. | | | 2,062,900 |
| | |
| 311,900 | | Sotheby’s Holdings, Inc.(a) | | | 8,187,375 |
| | |
| 101,300 | | Sovran Self Storage, Inc. | | | 5,145,027 |
| | |
| 302,700 | | Sterling Bancshares, Inc. | | | 5,675,625 |
| | | | |
| June 30, 2006 | | 40 | | See Notes to Financial Statements |
Portfolio of Investments (Note 10) (Unaudited)
Forward Hoover Small Cap Equity Fund
| | | | | |
| Shares | | | | Value
(Note 3) |
| | | | |
| | |
| 77,900 | | Texas Capital Bancshares, Inc.(a) | | $ | 1,815,070 |
| | |
| 199,300 | | Thomas Weisel Partners Group Llc(a) | | | 3,788,693 |
| | |
| 229,900 | | Waddell & Reed Financial, Inc., Class A | | | 4,726,744 |
| | |
| 231,100 | | Whitney Holding Corp. | | | 8,174,007 |
| | |
| | | | | 116,904,068 |
| | | | | |
| Health Care: 7.95% | | | |
| | |
| 147,900 | | Amedisys, Inc.(a) | | | 5,605,410 |
| | |
| 188,000 | | Centene Corp.(a) | | | 4,423,640 |
| | |
| 109,400 | | Healthcare Services Group, Inc. | | | 2,291,930 |
| | |
| 332,520 | | IRIS International, Inc.(a) | | | 4,375,963 |
| | |
| 231,150 | | Meridian Bioscience, Inc. | | | 5,767,193 |
| | |
| 65,800 | | Pediatrix Medical Group, Inc.(a) | | | 2,980,740 |
| | |
| 127,800 | | Psychiatric Solutions, Inc.(a) | | | 3,662,748 |
| | |
| 191,700 | | Viasys Healthcare, Inc.(a) | | | 4,907,520 |
| | |
| 147,800 | | West Pharmaceutical Services, Inc. | | | 5,362,184 |
| | |
| | | | | 39,377,328 |
| | | | | |
| Materials & Processing: 6.22% | | | |
| | |
| 92,200 | | The Andersons, Inc. | | | 3,836,442 |
| | |
| 112,000 | | Barnes Group, Inc. | | | 2,234,400 |
| | |
| 272,500 | | Griffon Corp.(a) | | | 7,112,250 |
| | |
| 43,000 | | Harsco Corp. | | | 3,352,280 |
| | |
| 159,600 | | Mobile Mini, Inc.(a) | | | 4,669,896 |
| | |
| 120,600 | | Oregon Steel Mills, Inc.(a) | | | 6,109,596 |
| | |
| 99,600 | | Trammell Crow Co.(a) | | | 3,502,932 |
| | |
| | | | | 30,817,796 |
| | | | | |
| Producer Durables: 10.10% | | | |
| | |
| 66,700 | | Actuant Corp., Class A | | | 3,331,665 |
| | |
| 204,200 | | AGCO Corp.(a) | | | 5,374,544 |
| | |
| 107,200 | | AMETEK, Inc. | | | 5,079,136 |
| | |
| 341,800 | | Flow International Corp.(a) | | | 4,809,126 |
| | |
| 138,800 | | Gardner Denver, Inc.(a) | | | 5,343,800 |
| | |
| 127,100 | | Gehl Co.(a) | | | 3,244,863 |
| | |
| 82,500 | | Kennametal, Inc. | | | 5,135,625 |
| | |
| 320,500 | | Kimball International, Inc. | | | 6,317,055 |
| | | | | | |
| Shares | | | | Value
(Note 3) | |
| | | | | |
| | |
| 93,600 | | The Manitowoc Co., Inc. | | $ | 4,165,200 | |
| | |
| 146,200 | | Steelcase, Inc., Class A | | | 2,404,990 | |
| | |
| 106,000 | | United Industrial Corp. | | | 4,796,500 | |
| | |
| | | | | 50,002,504 | |
| | | | | | |
| Technology: 6.85% | | | | |
| | |
| 73,000 | | CACI International, Inc.(a) | | | 4,258,090 | |
| | |
| 223,400 | | Cbeyond Communications, Inc.(a) | | | 4,872,354 | |
| | |
| 253,500 | | Cypress Semiconductor Corp.(a) | | | 3,685,890 | |
| | |
| 301,400 | | Foundry Networks, Inc.(a) | | | 3,212,924 | |
| | |
| 235,200 | | RadiSys Corp.(a) | | | 5,164,992 | |
| | |
| 84,500 | | SRA International, Inc.(a) | | | 2,250,235 | |
| | |
| 120,600 | | Varian, Inc.(a) | | | 5,006,106 | |
| | |
| 154,500 | | WebEx Communications, Inc.(a) | | | 5,490,930 | |
| | |
| | | | | 33,941,521 | |
| | | | | | |
| Utilities: 1.04% | | | | |
| | |
| 139,400 | | Northwest Natural Gas Co. | | | 5,161,982 | |
| | |
| | Total Common Stocks
(Cost $434,801,645) | | | 482,004,971 | |
| | |
Par
Value | | | | | |
|
| SHORT-TERM BANK DEBT INSTRUMENTS: 3.93% | |
| $19,482,659 | | CitiBank: Nassau
4.350%, due 07/03/06 | | | 19,482,659 | |
| | |
| | Total Short-Term Bank Debt Instruments
(Cost $19,482,659) | | | 19,482,659 | |
| | |
| | Total Investments: 101.27% (Cost $454,284,304) | | | 501,487,630 | |
| | |
| | Net Other Assets and Liabilities: (1.27)% | | | (6,295,325 | ) |
| | |
| | Net Assets: 100.00% | | $ | 495,192,305 | |
(a) Non-income producing security.
(b) When sector categorization is broken down by industry, no industry exceeds the 25% maximum specified in the Statement of Additional Information.
Percentages are stated as a percent of net assets.
| | | | |
| See Notes to Financial Statements | | 41 | | June 30, 2006 |
`
Portfolio of Investments (Note 10) (Unaudited)
Forward Hoover Mini-Cap Fund
| | | | | |
| Shares | | | | Value
(Note 3) |
| |
| COMMON STOCKS: 95.74% | | | |
| Auto & Transportation: 10.58% | | | |
| 29,700 | | Aftermarket Technology Corp.(a) | | $ | 738,045 |
| | |
| 37,100 | | Air Methods Corp.(a) | | | 971,278 |
| | |
| 13,600 | | Bristow Group, Inc.(a) | | | 489,600 |
| | |
| 38,400 | | Celadon Group, Inc.(a) | | | 846,336 |
| | |
| 102,700 | | Force Protection, Inc.(a) | | | 657,280 |
| | |
| 39,000 | | U.S. Xpress Enterprises, Inc.(a) | | | 1,053,780 |
| | |
| | | | | 4,756,319 |
| | | | | |
| Consumer Discretionary: 23.89% | | | |
| 19,100 | | Central Garden & Pet Co.(a) | | | 822,255 |
| | |
| 32,400 | | Charlotte Russe Holding, Inc.(a) | | | 775,656 |
| | |
| 39,100 | | Charming Shoppes, Inc.(a) | | | 439,484 |
| | |
| 36,900 | | Christopher & Banks Corp. | | | 1,070,100 |
| | |
| 16,700 | | The Dress Barn, Inc.(a) | | | 423,345 |
| | |
| 23,000 | | The GEO Group, Inc.(a) | | | 806,150 |
| | |
| 28,212 | | Hibbett Sporting Goods, Inc.(a) | | | 674,267 |
| | |
| 33,600 | | ICT Group, Inc.(a) | | | 824,208 |
| | |
| 10,800 | | Jack in the Box, Inc.(a) | | | 423,360 |
| | |
| 21,600 | | Movado Group, Inc. | | | 495,720 |
| | |
| 71,000 | | Nathans Famous, Inc.(a) | | | 958,500 |
| | |
| 15,300 | | Oxford Industries, Inc. | | | 602,973 |
| | |
| 95,900 | | Restoration Hardware, Inc.(a) | | | 688,562 |
| | |
| 17,400 | | Steiner Leisure Ltd.(a) | | | 687,822 |
| | |
| 66,000 | | The Topps Company, Inc. | | | 542,520 |
| | |
| 13,500 | | Zumiez, Inc.(a) | | | 507,195 |
| | |
| | | | | 10,742,117 |
| | | | | |
| Consumer Staples: 5.49% | | | |
| 53,700 | | Jones Soda Co.(a) | | | 483,300 |
| | |
| 18,700 | | The Hain Celestial Group, Inc.(a) | | | 481,712 |
| | |
| 31,200 | | Lance, Inc. | | | 718,224 |
| | |
| 7,600 | | Longs Drug Stores Corp. | | | 346,712 |
| | |
| 14,500 | | Performance Food Group Co.(a) | | | 440,510 |
| | |
| | | | | 2,470,458 |
| | | | | |
| Shares | | | | Value
(Note 3) |
|
|
| Energy: 3.29% | | | |
| 13,400 | | Hercules Offshore, Inc.(a) | | $ | 469,000 |
| | |
| 20,500 | | Parallel Petroleum Corp.(a) | | | 506,555 |
| | |
| 16,650 | | TETRA Technologies, Inc.(a) | | | 504,328 |
| | |
| | | | | 1,479,883 |
| | | | | |
| Financial Services: 15.30% | | | |
| | |
| 17,400 | | ACE Cash Express, Inc.(a) | | | 509,298 |
| | |
| 18,900 | | Advent Software, Inc.(a) | | | 681,723 |
| | |
| 800 | | Carolina Bank Holdings, Inc.(a) | | | 10,520 |
| | |
| 17,800 | | CentraCore Properties Trust | | | 440,550 |
| | |
| 14,500 | | DiamondRock Hospitality Co. | | | 214,745 |
| | |
| 18,400 | | Digital Realty Trust, Inc. | | | 454,296 |
| | |
| 26,100 | | Equity Inns, Inc. | | | 432,216 |
| | |
| 15,300 | | First Potomac Realty Trust | | | 455,787 |
| | |
| 49,400 | | Highland Hospitality Corp. | | | 695,552 |
| | |
| 17,000 | | PrivateBancorp, Inc. | | | 703,970 |
| | |
| 14,300 | | Sovran Self Storage, Inc. | | | 726,297 |
| | |
| 28,800 | | Sterling Bancshares, Inc. | | | 540,000 |
| | |
| 36,500 | | TheStreet.com, Inc. | | | 467,930 |
| | |
| 7,900 | | Texas Capital Bancshares, Inc.(a) | | | 184,070 |
| | |
| 19,100 | | Thomas Weisel Partners Group Llc(a) | | | 363,091 |
| | |
| | | | | 6,880,045 |
| | | | | |
| Health Care: 15.15% |
| | |
| 14,200 | | Amedisys, Inc.(a) | | | 538,180 |
| | |
| 18,000 | | Centene Corp.(a) | | | 423,540 |
| | |
| 81,300 | | Cholestech Corp.(a) | | | 1,032,510 |
| | |
| 63,300 | | Five Star Quality Care, Inc.(a) | | | 700,731 |
| | |
| 30,375 | | Healthcare Services Group, Inc. | | | 636,356 |
| | |
| 38,100 | | LHC Group, Inc.(a) | | | 758,952 |
| | |
| 23,500 | | Meridian Bioscience, Inc. | | | 586,325 |
| | |
| 45,300 | | Psychemedics Corp. | | | 795,468 |
| | |
| 13,700 | | Utah Medical Products, Inc. | | | 411,137 |
| | |
| 15,000 | | Viasys Healthcare, Inc.(a) | | | 384,000 |
| | |
| 15,100 | | West Pharmaceutical Services, Inc. | | | 547,828 |
| | |
| | | | | 6,815,027 |
| | | | | |
| | | | |
| June 30, 2006 | | 42 | | See Notes to Financial Statements |
Portfolio of Investments (Note 10) (Unaudited)
Forward Hoover Mini-Cap Fund
| | | | | |
| Shares | | | | Value
(Note 3) |
| Materials & Processing: 11.99% |
| | |
| 15,900 | | AAON, Inc. | | $ | 407,994 |
| | |
| 14,400 | | Alico, Inc. | | | 793,584 |
| | |
| 8,400 | | The Andersons, Inc. | | | 349,524 |
| | |
| 48,100 | | Ennis, Inc. | | | 946,608 |
| | |
| 26,200 | | Griffon Corp.(a) | | | 683,820 |
| | |
| 15,600 | | Mobile Mini, Inc.(a) | | | 456,456 |
| | |
| 5,100 | | Oregon Steel Mills, Inc.(a) | | | 258,366 |
| | |
| 22,600 | | Trammell Crow Co.(a) | | | 794,842 |
| | |
| 23,400 | | Zoltek Companies, Inc.(a) | | | 699,426 |
| | |
| | | | | 5,390,620 |
| | | | | |
| Producer Durables: 4.78% |
| | |
| 34,800 | | Flow International Corp.(a) | | | 489,636 |
| | |
| 12,500 | | Gehl Co.(a) | | | 319,125 |
| | |
| 32,500 | | Kimball International, Inc. | | | 640,575 |
| | |
| 31,050 | | Napco Security Systems, Inc.(a) | | | 301,806 |
| | |
| 8,800 | | United Industrial Corp. | | | 398,200 |
| | |
| | | | | 2,149,342 |
| | | | | | |
| Shares | | | | Value
(Note 3) | |
| Technology: 4.18% | | | | |
| 21,000 | | Cbeyond Communications, Inc.(a) | | $ | 458,010 | |
| | |
| 13,300 | | ManTech International Corp.(a) | | | 410,438 | |
| | |
| 22,300 | | RadiSys Corp.(a) | | | 489,708 | |
| | |
| 14,700 | | WebEx Communications, Inc.(a) | | | 522,438 | |
| | |
| | | | | 1,880,594 | |
| | | | | | |
| Utilities: 1.09% | | | | |
| 13,300 | | Northwest Natural Gas Co. | | | 492,499 | |
| | |
| | Total Common Stocks (Cost $38,354,999) | | | 43,056,904 | |
| | |
| Par Value | | | | | |
| |
| SHORT-TERM BANK DEBT INSTRUMENTS: 6.30% | | | | |
| $2,834,353 | | CitiBank — Nassau
4.350%, due 07/03/06 | | | 2,834,353 | |
| | |
| | Total Short-Term Bank Debt Instruments (Cost $2,834,353) | | | 2,834,353 | |
| | |
| | Total Investments: 102.04% (Cost $41,189,352) | | | 45,891,257 | |
| | |
| | Net Other Assets and Liabilities: (2.04)% | | | (918,316 | ) |
| | |
| | Net Assets: 100.00% | | $ | 44,972,941 | |
(a) Non-income producing security.
Percentages are stated as a percent of net assets.
| | | | |
| See Notes to Financial Statements | | 43 | | June 30, 2006 |
Portfolio of Investments (Note 10) (Unaudited)
Forward Legato Fund
| | | | | |
| Shares | | | | Value (Note 3) |
| |
| COMMON STOCKS: 98.26% | | | |
| Auto & Transportation: 4.88% | | | |
| 2,156 | | AirTran Holdings, Inc.(a) | | $ | 32,038 |
| | |
| 3,170 | | Fleetwood Enterprises, Inc.(a) | | | 23,902 |
| | |
| 1,232 | | General Maritime Corp. | | | 45,534 |
| | |
| 1,408 | | Keystone Automotive Industries, Inc.(a) | | | 59,446 |
| | |
| 3,000 | | Knight Transportation, Inc. | | | 60,600 |
| | |
| 6,932 | | Visteon Corp.(a) | | | 49,980 |
| | |
| 2,141 | | Wabtec Corp. | | | 80,073 |
| | |
| 2,050 | | Winnebago Industries, Inc. | | | 63,632 |
| | |
| | | | | 415,205 |
| | | | | |
| Consumer Discretionary: 14.62% | | | |
| 1,125 | | Advisory Board Co.(a) | | | 54,101 |
| | |
| 1,495 | | ADVO, Inc. | | | 36,792 |
| | |
| 1,449 | | Arbitron, Inc. | | | 55,540 |
| | |
| 1,047 | | California Pizza Kitchen, Inc.(a) | | | 28,772 |
| | |
| 5,209 | | Casual Male Retail Group, Inc.(a) | | | 52,350 |
| | |
| 1,320 | | The Cheesecake Factory, Inc.(a) | | | 35,574 |
| | |
| 1,300 | | Cherokee, Inc. | | | 53,768 |
| | |
| 3,702 | | Corinthian Colleges, Inc.(a) | | | 53,161 |
| | |
| 2,709 | | Cost Plus, Inc.(a) | | | 39,714 |
| | |
| 2,066 | | Cox Radio, Inc.(a) | | | 29,792 |
| | |
| 1,839 | | DeVry, Inc.(a) | | | 40,403 |
| | |
| 5,103 | | DiamondCluster International, Inc.(a) | | | 40,416 |
| | |
| 2,310 | | Fred’s, Inc. | | | 30,839 |
| | |
| 5,740 | | Gentex Corp. | | | 80,360 |
| | |
| 1,900 | | Iconix Brand Group, Inc.(a) | | | 31,046 |
| | |
| 1,592 | | Jarden Corp.(a) | | | 48,476 |
| | |
| 2,225 | | LoJack Corp.(a) | | | 41,964 |
| | |
| 1,500 | | Matthews International Corp., Class A | | | 51,705 |
| | |
| 2,466 | | O’Charleys, Inc.(a) | | | 41,922 |
| | |
| 3,349 | | Reader’s Digest Association, Inc. | | | 46,752 |
| | |
| 1,450 | | Ritchie Bros. Auctioneers, Inc. | | | 77,111 |
| | |
| 4,810 | | Rollins, Inc. | | | 94,468 |
| | |
| 857 | | School Specialty, Inc.(a) | | | 27,295 |
| | |
| 1,075 | | SCP Pool Corp. | | | 46,902 |
| | |
| 2,025 | | Select Comfort Corp.(a) | | | 46,514 |
| | | | | |
| Shares | | | | Value (Note 3) |
|
|
| | | | |
| 4,620 | | Sturm, Ruger, & Co., Inc. | | $ | 28,875 |
| | |
| 1,325 | | Universal Technical Institute, Inc.(a) | | | 29,177 |
| | |
| | | | | 1,243,789 |
| | | | | |
| Consumer Staples: 3.58% | | | |
| 4,689 | | Del Monte Foods Co. | | | 52,657 |
| | |
| 2,344 | | Lance, Inc. | | | 53,959 |
| | |
| 2,130 | | Performance Food Group Co.(a) | | | 64,709 |
| | |
| 2,610 | | United Natural Foods, Inc.(a) | | | 86,182 |
| | |
| 1,240 | | USANA Health Sciences, Inc.(a) | | | 46,996 |
| | |
| | | | | 304,503 |
| | | | | |
| Energy: 6.03% | | | |
| 1,051 | | CARBO Ceramics, Inc. | | | 51,636 |
| | |
| 1,979 | | Encore Acquisition Co.(a) | | | 53,097 |
| | |
| 2,660 | | Global Industries, Ltd.(a) | | | 44,422 |
| | |
| 3,350 | | Hanover Compressor Co.(a) | | | 62,913 |
| | |
| 714 | | James River Coal Co.(a) | | | 18,914 |
| | |
| 4,615 | | Matrix Service Co.(a) | | | 52,796 |
| | |
| 1,250 | | St. Mary Land & Exploration Co. | | | 50,312 |
| | |
| 2,475 | | W-H Energy Services, Inc.(a) | | | 125,804 |
| | |
| 1,259 | | Whiting Petroleum Corp.(a) | | | 52,714 |
| | |
| | | | | 512,608 |
| | | | | |
| Financial Services: 10.41% | | | |
| 6,316 | | The BISYS Group, Inc.(a) | | | 86,529 |
| | |
| 2,500 | | Boston Private Financial Holdings, Inc. | | | 69,750 |
| | |
| 2,805 | | Cedar Shopping Centers, Inc. | | | 41,290 |
| | |
| 1,750 | | FactSet Research Systems, Inc. | | | 82,775 |
| | |
| 2,250 | | Financial Federal Corp. | | | 62,572 |
| | |
| 1,107 | | First Industrial Realty Trust, Inc. | | | 42,000 |
| | |
| 742 | | The First Marblehead Corp. | | | 42,249 |
| | |
| 1,063 | | GATX Corp. | | | 45,178 |
| | |
| 1,234 | | Hanover Insurance Group, Inc. | | | 58,566 |
| | |
| 2,190 | | Kronos, Inc.(a) | | | 79,300 |
| | |
| 1,000 | | Portfolio Recovery Associates, Inc.(a) | | | 45,700 |
| | |
| 1,500 | | PrivateBancorp, Inc. | | | 62,115 |
| | |
| 672 | | Sun Communities, Inc. | | | 21,860 |
| | | | |
| June 30, 2006 | | 44 | | See Notes to Financial Statements |
Portfolio of Investments (Note 10) (Unaudited)
Forward Legato Fund
| | | | | |
| Shares | | | | Value (Note 3) |
| | | | |
| 925 | | TSX Group, Inc. | | $ | 37,259 |
| | |
| 687 | | WestAmerica BanCorp. | | | 33,642 |
| | |
| 2,100 | | World Acceptance Corp.(a) | | | 74,592 |
| | |
| | | | | 885,377 |
| | | | | |
| Health Care: 19.04% | | | |
| 1,980 | | American Medical Systems Holdings, Inc.(a) | | | 32,967 |
| | |
| 1,800 | | Angiodynamics, Inc.(a) | | | 48,690 |
| | |
| 1,240 | | ArthroCare Corp.(a) | | | 52,092 |
| | |
| 850 | | Aspect Medical Systems, Inc.(a) | | | 14,824 |
| | |
| 4,780 | | Cepheid, Inc.(a) | | | 46,414 |
| | |
| 1,510 | | Chemed Corp. | | | 82,340 |
| | |
| 1,900 | | Computer Programs & Systems, Inc. | | | 75,924 |
| | |
| 2,573 | | Gentiva Health Services, Inc.(a) | | | 41,245 |
| | |
| 2,870 | | Greatbatch, Inc.(a) | | | 67,732 |
| | |
| 2,910 | | Integra LifeSciences Holdings(a) | | | 112,937 |
| | |
| 1,500 | | Kensey Nash Corp.(a) | | | 44,250 |
| | |
| 2,568 | | K-V Pharmaceutical Co., Class A(a) | | | 47,919 |
| | |
| 1,435 | | Kyphon, Inc.(a) | | | 55,047 |
| | |
| 1,250 | | Landauer, Inc. | | | 59,875 |
| | |
| 1,644 | | LifePoint Hospitals, Inc.(a) | | | 52,822 |
| | |
| 1,344 | | Matria Healthcare, Inc.(a) | | | 28,788 |
| | |
| 1,300 | | Medicis Pharmaceutical, Class A | | | 31,200 |
| | |
| 1,000 | | Mentor Corp. | | | 43,500 |
| | |
| 740 | | Millipore Corp.(a) | | | 46,613 |
| | |
| 1,910 | | Neogen Corp.(a) | | | 36,519 |
| | |
| 1,799 | | Par Pharmaceutical Cos., Inc.(a) | | | 33,209 |
| | |
| 1,700 | | Pediatrix Medical Group, Inc.(a) | | | 77,010 |
| | |
| 1,626 | | PolyMedica Corp. | | | 58,471 |
| | |
| 2,814 | | PSS World Medical, Inc.(a) | | | 49,667 |
| | |
| 3,100 | | Psychemedics Corp. | | | 54,436 |
| | |
| 1,201 | | Sunrise Senior Living, Inc.(a) | | | 33,208 |
| | |
| 2,975 | | SurModics, Inc.(a) | | | 107,427 |
| | |
| 3,260 | | Synovis Life Technologies, Inc. (a) | | | 32,046 |
| | |
| 2,350 | | Techne Corp.(a) | | | 119,662 |
| | |
| 2,230 | | U.S. Physical Therapy, Inc.(a) | | | 32,647 |
| | |
| | | | | 1,619,481 |
| | | | | |
| Shares | | | | Value (Note 3) |
| Industrials: 4.82% | | | |
| 3,536 | | Federal Signal Corp. | | $ | 53,535 |
| | |
| 8,500 | | First Consulting Group, Inc.(a) | | | 75,140 |
| | |
| 1,590 | | G & K Services, Inc., Class A | | | 54,537 |
| | |
| 1,950 | | Mobile Mini, Inc. (a) | | | 57,057 |
| | |
| 1,775 | | Resources Connection, Inc.(a) | | | 44,411 |
| | |
| 1,930 | | Stericycle, Inc.(a) | | | 125,643 |
| | |
| | | | | 410,323 |
| | | | | |
| Information Technology: 18.52% | | | |
| 3,800 | | Ansoft Corp.(a) | | | 77,824 |
| | |
| 1,425 | | ANSYS, Inc.(a) | | | 68,143 |
| | |
| 1,186 | | Avid Technology Corp.(a) | | | 39,529 |
| | |
| 2,000 | | Avocent Corp.(a) | | | 52,500 |
| | |
| 2,250 | | Blackboard, Inc.(a) | | | 65,160 |
| | |
| 1,990 | | Cree, Inc.(a) | | | 47,282 |
| | |
| 5,970 | | Digi International, Inc.(a) | | | 74,804 |
| | |
| 1,670 | | Digital Insight Corp.(a) | | | 57,264 |
| | |
| 3,320 | | Echelon Corp.(a) | | | 24,867 |
| | |
| 7,230 | | Entegris, Inc.(a) | | | 68,902 |
| | |
| 480 | | F5 Networks, Inc. (a) | | | 25,670 |
| | |
| 1,106 | | FileNET Corp.(a) | | | 29,785 |
| | |
| 1,400 | | Hutchinson Technology, Inc.(a) | | | 30,282 |
| | |
| 2,000 | | II-VI, Inc.(a) | | | 36,600 |
| | |
| 1,446 | | Internet Security Systems, Inc.(a) | | | 27,257 |
| | |
| 2,805 | | iPass, Inc.(a) | | | 15,708 |
| | |
| 1,936 | | IXYS Corp.(a) | | | 18,586 |
| | |
| 4,380 | | Keane, Inc.(a) | | | 54,750 |
| | |
| 1,634 | | ManTech International Corp., Class A(a) | | | 50,425 |
| | |
| 1,330 | | Maximus, Inc. | | | 30,790 |
| | |
| 4,490 | | Microsemi Corp.(a) | | | 109,466 |
| | |
| 2,340 | | National Instruments Corp. | | | 64,116 |
| | |
| 2,250 | | Power Integrations, Inc.(a) | | | 39,330 |
| | |
| 1,225 | | Rimage Corp.(a) | | | 25,015 |
| | |
| 1,642 | | Rudolph Technologies, Inc.(a) | | | 23,809 |
| | |
| 2,610 | | Semtech Corp.(a) | | | 37,715 |
| | |
| 1,280 | | Sybase, Inc.(a) | | | 24,832 |
| | | | |
| See Notes to Financial Statements | | 45 | | June 30, 2006 |
Portfolio of Investments (Note 10) (Unaudited)
Forward Legato Fund
| | | | | |
| Shares | | | | Value (Note 3) |
| | | | |
| 1,100 | | Tech Data Corp.(a) | | $ | 42,141 |
| | |
| 1,850 | | Trimble Navigation, Ltd.(a) | | | 82,584 |
| | |
| 821 | | Varian, Inc.(a) | | | 34,080 |
| | |
| 2,380 | | Verint Systems, Inc.(a) | | | 69,472 |
| | |
| 3,560 | | WebEx Communications, Inc.(a) | | | 126,523 |
| | |
| | | | | 1,575,211 |
| | | | | |
| Materials & Processing: 6.70% | | | |
| 1,457 | | Acuity Brands, Inc. | | | 56,692 |
| | |
| 2,250 | | Amcol International Corp. | | | 59,287 |
| | |
| 2,614 | | Brush Engineered Materials, Inc.(a) | | | 54,502 |
| | |
| 1,966 | | Commercial Metals Co. | | | 50,526 |
| | |
| 3,134 | | Gold Kist, Inc.(a) | | | 41,902 |
| | |
| 4,341 | | Modtech Holdings, Inc.(a) | | | 29,389 |
| | |
| 2,000 | | Simpson Manufacturing Co., Inc. | | | 72,100 |
| | |
| 4,758 | | Spartech Corp. | | | 107,531 |
| | |
| 2,520 | | Symyx Technologies, Inc.(a) | | | 60,858 |
| | |
| 1,762 | | Worthington Industries, Inc. | | | 36,914 |
| | |
| | | | | 569,701 |
| | | | | |
| Other: 1.05% | | | |
| 2,850 | | Raven Industries, Inc. | | | 89,775 |
| | | | | |
| | | | | | |
| Shares | | | | Value (Note 3) | |
| Producer Durables: 8.01% | | | | |
| 1,575 | | A.S.V., Inc.(a) | | $ | 36,288 | |
| | |
| 1,983 | | Applied Signal Technology, Inc. | | | 33,790 | |
| | |
| 2,589 | | BE Aerospace, Inc.(a) | | | 59,185 | |
| | |
| 7,716 | | C&D Technologies, Inc. | | | 58,024 | |
| | |
| 4,097 | | Champion Enterprises, Inc.(a) | | | 45,231 | |
| | |
| 1,275 | | Crane Co. | | | 53,040 | |
| | |
| 1,000 | | Curtiss-Wright Corp. | | | 30,880 | |
| | |
| 1,281 | | Esterline Technologies Corp.(a) | | | 53,277 | |
| | |
| 1,500 | | Franklin Electric Co., Inc. | | | 77,460 | |
| | |
| 1,967 | | General Cable Corp.(a) | | | 68,845 | |
| | |
| 1,051 | | IDEX Corp. | | | 49,607 | |
| | |
| 1,500 | | Plantronics, Inc. | | | 33,315 | |
| | |
| 1,478 | | Robbins & Myers, Inc. | | | 38,635 | |
| | |
| 1,340 | | Varian Semiconductor Equipment Associates, Inc.(a) | | | 43,697 | |
| | |
| | | | | 681,274 | |
| | | | | | |
| Utilities: 0.60% | | | | |
| 4,058 | | Alaska Communications Systems Group, Inc. | | | 51,334 | |
| | |
| | Total Common Stocks
(Cost $7,601,046) | | | 8,358,581 | |
| | |
| Par Value | | | | | |
| |
| SHORT-TERM BANK DEBT INSTRUMENTS: 2.08% | | | | |
| $177,148 | | Brown Brothers Harriman & Co. —
Grand Cayman
4.350%, due 07/03/06 | | | 177,148 | |
| | |
| | Total Short-Term Bank Debt Instruments
(Cost $177,148) | | | 177,148 | |
| | |
| | Total Investments: 100.34%
(Cost $7,778,194) | | | 8,535,729 | |
| | |
| | Net Other Assets and Liabilities: -0.34% | | | (29,655 | ) |
| | |
| | Net Assets: 100.00% | | $ | 8,506,074 | |
(a) Non-income producing security.
Percentages are stated as a percent of net assets.
| | | | |
| June 30, 2006 | | 46 | | See Notes to Financial Statements |
Statement of Assets and Liabilities (Unaudited)
| | | | | | |
| | | FORWARD
INTERNATIONAL
EQUITY FUND | | FORWARD
INTERNATIONAL
SMALL
COMPANIES
FUND |
| ASSETS: | | | | | | |
Investments, at value | | $ | 28,694,707 | | $ | 435,586,606 |
Cash | | | 0 | | | 475 |
Foreign currency, at value (Cost $0 and $34,997, respectively) | | | 0 | | | 35,585 |
Receivable for investments sold | | | 198,775 | | | 7,673,651 |
Receivable from advisor | | | 8,422 | | | 0 |
Receivable for shares sold | | | 310 | | | 920,272 |
Interest and dividends receivable | | | 103,049 | | | 655,173 |
Other assets | | | 3,092 | | | 107,550 |
| | | | | | |
Total Assets | | | 29,008,355 | | | 444,979,312 |
| | | | | | |
| LIABILITIES: | | | | | | |
Payable to custodian (Cost $118,613 and $0, respectively) | | | 119,073 | | | 0 |
Payable for investments purchased | | | 0 | | | 7,484,286 |
Payable for shares redeemed | | | 13,424 | | | 282,491 |
Payable to advisor | | | 19,213 | | | 341,835 |
Payable for distribution and service fees | | | 4,746 | | | 52,360 |
Payable to trustees | | | 361 | | | 855 |
Accrued expenses and other liabilities | | | 45,656 | | | 20,117 |
| | | | | | |
Total Liabilities | | | 202,473 | | | 8,181,944 |
| | | | | | |
| NET ASSETS | | $ | 28,805,882 | | $ | 436,797,368 |
| | | | | | |
| NET ASSETS CONSIST OF: | | | | | | |
Paid-in capital (Note 7) | | $ | 23,428,337 | | $ | 382,631,250 |
Accumulated net investment income | | | 212,677 | | | 2,040,045 |
Accumulated net realized gain on investments and foreign currency transactions | | | 1,615,730 | | | 14,267,179 |
Net unrealized appreciation on investments and translation of assets and liabilities in foreign currencies | | | 3,549,138 | | | 37,858,894 |
| | | | | | |
| TOTAL NET ASSETS | | $ | 28,805,882 | | $ | 436,797,368 |
| | | | | | |
| INVESTMENTS, AT COST | | $ | 25,151,131 | | $ | 397,772,275 |
| | |
| PRICING OF SHARES | | | | | | |
Investor Class: | | | | | | |
Net Asset Value, offering, and redemption price per share | | | $16.78 | | | $16.75 |
Net Assets | | $ | 28,805,882 | | $ | 188,153,151 |
Shares of beneficial interest outstanding | | | 1,716,249 | | | 11,230,268 |
Institutional Class: | | | | | | |
Net Asset Value, offering, and redemption price per share | | | | | | $16.82 |
Net Assets | | | | | $ | 243,333,913 |
Shares of beneficial interest outstanding | | | | | | 14,468,699 |
Class A: | | | | | | |
Net Asset Value, offering, and redemption price per share | | | | | | $16.72 |
Net Assets | | | | | | $5,310,304 |
Shares of beneficial interest outstanding | | | | | | 317,665 |
Maximum offering price per share (NAV/0.9525, based on maximum sales charge of 4.75% of the offering price) | | | | | | $17.55 |
| | | | |
| See Notes to Financial Statements | | 47 | | June 30, 2006 |
Statement of Assets and Liabilities (Unaudited)
| | | | | | | | |
| | | FORWARD
GLOBAL
EMERGING
MARKETS
FUND | | | SIERRA
CLUB
EQUITY
INCOME
FUND | |
| ASSETS: | | | | | | | | |
Investments, at value | | $ | 46,337,131 | | | $ | 28,879,540 | |
Cash | | | 403 | | | | 0 | |
Foreign currency, at value (Cost $300,795 and $0, respectively) | | | 299,905 | | | | 0 | |
Receivable for investments sold | | | 983,919 | | | | 409,275 | |
Receivable from advisor | | | 16,603 | | | | 0 | |
Receivable for shares sold | | | 54,134 | | | | 0 | |
Interest and dividends receivable | | | 143,289 | | | | 99,410 | |
Other assets | | | 20,893 | | | | 452 | |
| | | | | | | | |
Total Assets | | | 47,856,277 | | | | 29,388,677 | |
| | | | | | | | |
| LIABILITIES: | | | | | | | | |
Distributions payable | | | 0 | | | | 30,697 | |
Payable to custodian | | | 0 | | | | 345,626 | |
Payable for investments purchased | | | 845,232 | | | | 0 | |
Payable for shares redeemed | | | 0 | | | | 1,617 | |
Payable to advisor | | | 45,856 | | | | 24,767 | |
Payable for distribution and service fees | | | 3,112 | | | | 3,002 | |
Payable to trustees | | | 437 | | | | 631 | |
Accrued expenses and other liabilities | | | 62,096 | | | | 26,790 | |
| | | | | | | | |
Total Liabilities | | | 956,733 | | | | 433,130 | |
| | | | | | | | |
| NET ASSETS | | $ | 46,899,544 | | | $ | 28,955,547 | |
| | | | | | | | |
| NET ASSETS CONSIST OF: | | | | | | | | |
Paid-in capital (Note 7) | | $ | 42,491,993 | | | $ | 26,301,286 | |
Accumulated net investment income/(loss) | | | 268,084 | | | | (2,423 | ) |
Accumulated net realized gain/(loss) on investments and foreign currency transactions | | | (2,426,622 | ) | | | 849,527 | |
Net unrealized appreciation on investments and translation of assets and liabilities in foreign currencies | | | 6,566,089 | | | | 2,578,254 | |
| | | | | | | | |
| TOTAL NET ASSETS | | $ | 46,899,544 | | | $ | 28,955,547 | |
| | | | | | | | |
| INVESTMENTS, AT COST | | $ | 39,767,391 | | | $ | 26,301,286 | |
| | |
| PRICING OF SHARES | | | | | | | | |
Investor Class: | | | | | | | | |
Net Asset Value, offering, and redemption price per share | | | $19.49 | | | | $11.52 | |
Net Assets | | $ | 13,247,043 | | | $ | 28,955,547 | |
Shares of beneficial interest outstanding | | | 679,858 | | | | 2,512,733 | |
Institutional Class: | | | | | | | | |
Net Asset Value, offering, and redemption price per share | | | $19.56 | | | | | |
Net Assets | | $ | 33,652,501 | | | | | |
Shares of beneficial interest outstanding | | | 1,720,229 | | | | | |
| | | | |
| June 30, 2006 | | 48 | | See Notes to Financial Statements |
Statement of Assets and Liabilities (Unaudited)
| | | | | | | |
| | | SIERRA
CLUB STOCK
FUND | | FORWARD
EMERALD
BANKING AND
FINANCE
FUND | |
| ASSETS: | | | | | | | |
Investments, at value | | $ | 31,973,349 | | $ | 279,745,969 | |
Receivable for investments sold | | | 282,219 | | | 884,060 | |
Receivable from advisor | | | 1,953 | | | 33,310 | |
Receivable for shares sold | | | 4,000 | | | 115,708 | |
Interest and dividends receivable | | | 34,776 | | | 271,316 | |
Other assets | | | 9,660 | | | 34,566 | |
| | | | | | | |
Total Assets | | | 32,305,957 | | | 281,084,929 | |
| | | | | | | |
| LIABILITIES: | | | | | | | |
Payable to custodian | | | 43,180 | | | 11,208 | |
Payable for investments purchased | | | 103,207 | | | 2,882,785 | |
Payable for shares redeemed | | | 16,103 | | | 436,637 | |
Payable to advisor | | | 22,039 | | | 172,818 | |
Payable for distribution and service fees | | | 7,557 | | | 138,212 | |
Payable to trustees | �� | | 2,495 | | | 3,701 | |
Accrued expenses and other liabilities | | | 25,524 | | | 66,534 | |
| | | | | | | |
Total Liabilities | | | 220,105 | | | 3,711,895 | |
| | | | | | | |
| NET ASSETS | | $ | 32,085,852 | | $ | 277,373,034 | |
| | | | | | | |
| NET ASSETS CONSIST OF: | | | | | | | |
Paid-in capital (Note 7) | | $ | 28,716,943 | | $ | 201,304,956 | |
Accumulated net investment income/(loss) | | | 13,396 | | | (301,567 | ) |
Accumulated net realized gain on investments | | | 2,664,145 | | | 11,855,006 | |
Net unrealized appreciation on investments | | | 691,368 | | | 64,514,639 | |
| | | | | | | |
| TOTAL NET ASSETS | | $ | 32,085,852 | | $ | 277,373,034 | |
| | | | | | | |
| INVESTMENTS, AT COST | | $ | 31,281,981 | | $ | 215,231,330 | |
| | |
| PRICING OF SHARES | | | | | | | |
Investor Class: | | | | | | | |
Net Asset Value, offering and redemption price per share | | | $11.70 | | | | |
Net Assets | | $ | 26,653,002 | | | | |
Shares of beneficial interest outstanding | | | 2,277,210 | | | | |
Class A: | | | | | | | |
Net Asset Value, offering and redemption price per share | | | $11.70 | | | $28.71 | |
Net Assets | | $ | 5,432,850 | | $ | 165,902,854 | |
Shares of beneficial interest outstanding | | | 464,186 | | | 5,778,433 | |
Maximum offering price per share (NAV/0.9525, based on maximum sales charge of
4.75% of the offering price) | | | $12.28 | | | $30.14 | |
Class C: | | | | | | | |
Net Asset Value, offering and redemption price per share | | | | | | $27.70 | |
Net Assets | | | | | $ | 111,470,180 | |
Shares of beneficial interest outstanding | | | | | | 4,024,467 | |
| | | | |
| See Notes to Financial Statements | | 49 | | June 30, 2006 |
Statement of Assets and Liabilities (Unaudited)
| | | | | | | |
| | | FORWARD
EMERALD
OPPORTUNITIES
FUND | | | FORWARD
UNIPLAN
REAL ESTATE
INVESTMENT
FUND |
| ASSETS: | | | | | | | |
Investments, at value | | $ | 13,084,003 | | | $ | 43,842,260 |
Deposit with broker for securities sold short and written options | | | 1,158,615 | | | | 0 |
Receivable for investments sold | | | 26,711 | | | | 533,552 |
Receivable from advisor | | | 0 | | | | 0 |
Receivable for shares sold | | | 25,000 | | | | 1,137 |
Interest and dividends receivable | | | 1,860 | | | | 130,573 |
Other assets | | | 28,532 | | | | 7,968 |
| | | | | | | |
Total Assets | | | 14,324,721 | | | | 44,515,490 |
| | | | | | | |
| LIABILITIES: | | | | | | | |
Securities sold short (Proceeds $1,065,271) | | | 1,067,189 | | | | — |
Options written at value (Premiums received $5,070) | | | 3,900 | | | | — |
Distributions payable | | | 0 | | | | 45,035 |
Payable to custodian | | | 2,661 | | | | 0 |
Payable for investments purchased | | | 1,876,039 | | | | 0 |
Payable for shares redeemed | | | 4,728 | | | | 51,235 |
Payable to advisor | | | 10,544 | | | | 31,736 |
Payable for distribution and service fees | | | 5,346 | | | | 6,347 |
Payable to trustees | | | 429 | | | | 4,687 |
Accrued expenses and other liabilities | | | 9,316 | | | | 45,593 |
| | | | | | | |
Total Liabilities | | | 2,980,152 | | | | 184,633 |
| | | | | | | |
| NET ASSETS | | $ | 11,344,569 | | | $ | 44,330,857 |
| | | | | | | |
| NET ASSETS CONSIST OF: | | | | | | | |
Paid-in capital (Note 7) | | $ | 17,992,067 | | | $ | 23,465,523 |
Accumulated net investment income/(loss) | | | (66,627 | ) | | | 97,202 |
Accumulated net realized gain/(loss) on investments, options and securities sold short | | | (6,983,761 | ) | | | 2,014,721 |
Net unrealized appreciation on investments, options and securities sold short | | | 402,890 | | | | 18,753,411 |
| | | | | | | |
| TOTAL NET ASSETS | | $ | 11,344,569 | | | $ | 44,330,857 |
| | | | | | | |
| INVESTMENTS, AT COST | | $ | 12,680,365 | | | $ | 25,088,849 |
| | |
| PRICING OF SHARES | | | | | | | |
Investor Class: | | | | | | | |
Net Asset Value, offering and redemption price per share | | | | | | | $18.53 |
Net Assets | | | | | | $ | 44,330,857 |
Shares of beneficial interest outstanding | | | | | | | 2,392,878 |
Class A: | | | | | | | |
Net Asset Value, offering and redemption price per share | | | $8.89 | | | | |
Net Assets | | $ | 8,694,860 | | | | |
Shares of beneficial interest outstanding | | | 978,191 | | | | |
Maximum offering price per share (NAV/0.9525, based on maximum sales charge of 4.75% of the offering price) | | | $9.33 | | | | |
Class C: | | | | | | | |
Net Asset Value, offering and redemption price per share | | | $8.63 | | | | |
Net Assets | | $ | 2,649,709 | | | | |
Shares of beneficial interest outstanding | | | 307,034 | | | | |
| | | | |
| June 30, 2006 | | 50 | | See Notes to Financial Statements |
Statement of Assets and Liabilities (Unaudited)
| | | | | | | | |
| | | FORWARD
EMERALD
GROWTH
FUND | | | FORWARD
HOOVER
SMALL CAP
EQUITY FUND | |
| ASSETS: | | | | | | | | |
Investments, at value | | $ | 190,160,942 | | | $ | 501,487,630 | |
Receivable for investments sold | | | 1,359,162 | | | | 7,792,173 | |
Receivable for shares sold | | | 152,949 | | | | 1,181,520 | |
Interest and dividends receivable | | | 19,553 | | | | 356,348 | |
Other assets | | | 24,261 | | | | 36,708 | |
| | | | | | | | |
Total Assets | | | 191,716,867 | | | | 510,854,379 | |
| | | | | | | | |
| LIABILITIES: | | | | | | | | |
Payable to custodian | | | 10,842 | | | | 0 | |
Payable for investments purchased | | | 1,842,686 | | | | 14,432,011 | |
Payable for shares redeemed | | | 171,694 | | | | 598,646 | |
Payable to advisor | | | 117,283 | | | | 426,695 | |
Payable for distribution and service fees | | | 58,610 | | | | 122,998 | |
Payable to trustees | | | 2,498 | | | | 4,073 | |
Accrued expenses and other liabilities | | | 34,665 | | | | 77,651 | |
| | | | | | | | |
Total Liabilities | | | 2,238,278 | | | | 15,662,074 | |
| | | | | | | | |
| NET ASSETS | | $ | 189,478,589 | | | $ | 495,192,305 | |
| | | | | | | | |
| NET ASSETS CONSIST OF: | | | | | | | | |
Paid-in capital (Note 7) | | $ | 132,697,128 | | | $ | 419,112,484 | |
Accumulated net investment loss | | | (1,058,639 | ) | | | (1,610,022 | ) |
Accumulated net realized gain on investments | | | 14,161,894 | | | | 30,486,517 | |
Net unrealized appreciation on investments | | | 43,678,206 | | | | 47,203,326 | |
| | | | | | | | |
| TOTAL NET ASSETS | | $ | 189,478,589 | | | $ | 495,192,305 | |
| | | | | | | | |
| INVESTMENTS, AT COST | | $ | 146,482,736 | | | $ | 454,284,304 | |
| | |
| PRICING OF SHARES | | | | | | | | |
Investor Class: | | | | | | | | |
Net Asset Value, offering and redemption price per share | | | | | | | $20.32 | |
Net Assets | | | | | | $ | 421,701,473 | |
Shares of beneficial interest outstanding | | | | | | | 20,755,235 | |
Institutional Class: | | | | | | | | |
Net Asset Value, offering and redemption price per share | | | | | | | $20.74 | |
Net Assets | | | | | | $ | 53,559,325 | |
Shares of beneficial interest outstanding | | | | | | | 2,582,167 | |
Class A: | | | | | | | | |
Net Asset Value, offering and redemption price per share | | | $15.10 | | | | $20.33 | |
Net Assets | | $ | 178,099,627 | | | $ | 19,931,507 | |
Shares of beneficial interest outstanding | | | 11,797,319 | | | | 980,288 | |
Maximum offering price per share (NAV/0.9525, based on maximum sales charge of 4.75% of the offering price) | | | $15.85 | | | | $21.34 | |
Class C: | | | | | | | | |
Net Asset Value, offering and redemption price per share | | | $14.49 | | | | | |
Net Assets | | $ | 11,378,962 | | | | | |
Shares of beneficial interest outstanding | | | 785,418 | | | | | |
| | | | |
| See Notes to Financial Statements | | 51 | | June 30, 2006 |
Statement of Assets and Liabilities (Unaudited)
| | | | | | | | |
| | | FORWARD
HOOVER
MINI-CAP
FUND | | | FORWARD
LEGATO
FUND | |
| ASSETS: | | | | | | | | |
Investments, at value | | $ | 45,891,257 | | | $ | 8,535,729 | |
Receivable for investments sold | | | 653,357 | | | | 4,979 | |
Receivable from advisor | | | 4,440 | | | | 0 | |
Receivable for shares sold | | | 104,240 | | | | 0 | |
Interest and dividends receivable | | | 29,018 | | | | 3,564 | |
Other assets | | | 18,189 | | | | 462 | |
| | | | | | | | |
Total Assets | | | 46,700,501 | | | | 8,544,734 | |
| | | | | | | | |
| LIABILITIES: | | | | | | | | |
Payable for investments purchased | | | 1,665,855 | | | | 9,136 | |
Payable to advisor | | | 41,910 | | | | 6,884 | |
Payable for distribution and service fees | | | 2,182 | | | | 688 | |
Payable to trustees | | | 516 | | | | 734 | |
Accrued expenses and other liabilities | | | 17,097 | | | | 21,218 | |
| | | | | | | | |
Total Liabilities | | | 1,727,560 | | | | 38,660 | |
| | | | | | | | |
| NET ASSETS | | $ | 44,972,941 | | | $ | 8,506,074 | |
| | | | | | | | |
| NET ASSETS CONSIST OF: | | | | | | | | |
Paid-in capital (Note 7) | | $ | 33,957,482 | | | $ | 7,545,191 | |
Accumulated net investment loss | | | (100,087 | ) | | | (37,758 | ) |
Accumulated net realized gain on investments | | | 6,413,641 | | | | 241,106 | |
Net unrealized appreciation on investments | | | 4,701,905 | | | | 757,535 | |
| | | | | | | | |
| TOTAL NET ASSETS | | $ | 44,972,941 | | | $ | 8,506,074 | |
| | | | | | | | |
| INVESTMENTS, AT COST | | $ | 41,189,352 | | | $ | 7,778,194 | |
| | |
| PRICING OF SHARES | | | | | | | | |
Investor Class: | | | | | | | | |
Net Asset Value, offering and redemption price per share | | | $18.91 | | | | | |
Net Assets | | $ | 11,410,826 | | | | | |
Shares of beneficial interest outstanding | | | 603,271 | | | | | |
Institutional Class: | | | | | | | | |
Net Asset Value, offering and redemption price per share | | | $19.22 | | | | | |
Net Assets | | $ | 33,562,115 | | | | | |
Shares of beneficial interest outstanding | | | 1,746,568 | | | | | |
Class A: | | | | | | | | |
Net Asset Value, offering and redemption price per share | | | | | | | $11.64 | |
Net Assets | | | | | | $ | 8,506,074 | |
Shares of beneficial interest outstanding | | | | | | | 730,810 | |
Maximum offering price per share (NAV/0.9525, based on maximum sales charge of
4.75% of the offering price) | | | | | | | $12.22 | |
| | | | |
| June 30, 2006 | | 52 | | See Notes to Financial Statements |
Statement of Operations
For the Six Months Ended June 30, 2006 (Unaudited)
| | | | | | | | |
| | | FORWARD
INTERNATIONAL
EQUITY FUND | | | FORWARD
INTERNATIONAL
SMALL
COMPANIES
FUND | |
| INVESTMENT INCOME: | | | | | | | | |
Interest | | $ | 1,849 | | | $ | 387,375 | |
Dividends | | | 458,601 | | | | 4,118,637 | |
Securities lending income | | | 12,279 | | | | 197,232 | |
Foreign taxes withheld | | | (45,516 | ) | | | (435,827 | ) |
| | | | | | | | |
Total Investment Income | | | 427,213 | | | | 4,267,417 | |
| | | | | | | | |
| EXPENSES: | | | | | | | | |
Investment advisory fee | | | 118,627 | | | | 1,676,808 | |
Administrative fee | | | 19,750 | | | | 125,969 | |
Custodian fee | | | 25,694 | | | | 38,735 | |
Legal and audit fee | | | 17,447 | | | | 50,275 | |
Transfer agent fee | | | 6,238 | | | | 41,150 | |
Trustees' fees and expenses | | | 1,031 | | | | 15,170 | |
Registration/filing fees | | | 4,714 | | | | 17,133 | |
Report to shareholder and printing fees | | | 12,421 | | | | 13,796 | |
Distribution and service fees | | | | | | | | |
Investor Class | | | 29,308 | | | | 224,253 | |
Class A | | | — | | | | 7,323 | |
ReFlow fees (Note 2) | | | 852 | | | | 1,891 | |
Other | | | 11,329 | | | | 14,957 | |
| | | | | | | | |
Total expenses before waiver | | | 247,411 | | | | 2,227,460 | |
Less fees waived/reimbursed by investment advisor | | | (32,875 | ) | | | (18,883 | ) |
| | | | | | | | |
Total net expenses | | | 214,536 | | | | 2,208,577 | |
| | | | | | | | |
| NET INVESTMENT INCOME: | | | 212,677 | | | | 2,058,840 | |
| | | | | | | | |
Net realized gain on investments | | | 1,869,155 | | | | 12,239,929 | |
Net realized gain on foreign currency transactions | | | 94,535 | | | | 869,134 | |
Net change in unrealized appreciation on investments | | | 764,873 | | | | 5,628,415 | |
Net change in unrealized appreciation/(depreciation) on translation of assets and liabilities in foreign currencies | | | (10,115 | ) | | | 36,683 | |
| | | | | | | | |
| NET REALIZED AND UNREALIZED GAIN ON INVESTMENTS AND FOREIGN CURRENCY | | | 2,718,448 | | | | 18,774,161 | |
| | | | | | | | |
| NET INCREASE IN NET ASSETS RESULTING FROM OPERATIONS | | $ | 2,931,125 | | | $ | 20,833,001 | |
| | | | | | | | |
| | | | |
| See Notes to Financial Statements | | 53 | | June 30, 2006 |
Statement of Operations
For the Six Months Ended June 30, 2006 (Unaudited)
| | | | | | | | |
| | | FORWARD GLOBAL
EMERGING
MARKETS FUND | | | SIERRA CLUB
EQUITY INCOME
FUND | |
| INVESTMENT INCOME: | | | | | | | | |
Interest | | $ | 17,947 | | | $ | 143,871 | |
Dividends | | | 639,654 | | | | 271,820 | |
Securities lending income | | | 3,158 | | | | 0 | |
Foreign taxes withheld | | | (67,686 | ) | | | 0 | |
| | | | | | | | |
Total Investment Income | | | 593,073 | | | | 415,691 | |
| | | | | | | | |
| EXPENSES: | | | | | | | | |
Investment advisory fee | | | 283,111 | | | | 144,634 | |
Administrative fee | | | 30,866 | | | | 20,654 | |
Custodian fee | | | 63,134 | | | | 4,894 | |
Legal and audit fee | | | 14,389 | | | | 11,842 | |
Transfer agent fee | | | 7,000 | | | | 10,206 | |
Trustees’ fees and expenses | | | 2,065 | | | | 1,314 | |
Registration/filing fees | | | 2,083 | | | | 9,639 | |
Report to shareholder and printing fees | | | 12,811 | | | | 17,985 | |
Distribution and service fees | | | | | | | | |
Investor Class | | | 18,983 | | | | 18,464 | |
Repayment of reimbursed expenses | | | 0 | | | | 1,249 | |
ReFlow fees (Note 2) | | | 5,777 | | | | 2,057 | |
Other | | | 7,974 | | | | 7,281 | |
| | | | | | | | |
Total expenses before waiver | | | 448,193 | | | | 250,219 | |
Less fees waived/reimbursed by investment advisor | | | (83,844 | ) | | | (8,474 | ) |
| | | | | | | | |
Total net expenses | | | 364,349 | | | | 241,745 | |
| | | | | | | | |
| NET INVESTMENT INCOME: | | | 228,724 | | | | 173,946 | |
| | | | | | | | |
Net realized gain on investments | | | 2,791,072 | | | | 619,450 | |
Net realized gain on foreign currency transactions | | | 180,493 | | | | 0 | |
Net change in unrealized depreciation on investments | | | (2,255,325 | ) | | | (539,184 | ) |
Net change in unrealized depreciation on translation of assets and liabilities in foreign currencies | | | (2,839 | ) | | | 0 | |
| | | | | | | | |
| NET REALIZED AND UNREALIZED GAIN ON INVESTMENTS AND FOREIGN CURRENCY | | | 713,401 | | | | 80,266 | |
| | | | | | | | |
| NET INCREASE IN NET ASSETS RESULTING FROM OPERATIONS | | $ | 942,125 | | | $ | 254,212 | |
| | | | | | | | |
| | | | |
| June 30, 2006 | | 54 | | See Notes to Financial Statements |
Statement of Operations
For the Six Months Ended June 30, 2006 (Unaudited)
| | | | | | | | |
| | | SIERRA
CLUB
STOCK
FUND | | | FORWARD
EMERALD
BANKING AND
FINANCE
FUND | |
| INVESTMENT INCOME: | | | | | | | | |
Interest | | $ | 13,028 | | | $ | 192,487 | |
Dividends | | | 231,867 | | | | 2,216,276 | |
Foreign taxes withheld | | | 0 | | | | (2,930 | ) |
| | | | | | | | |
Total Investment Income | | | 244,895 | | | | 2,405,833 | |
| | | | | | | | |
| EXPENSES: | | | | | | | | |
Investment advisory fee | | | 132,684 | | | | 1,355,183 | |
Administrative fee | | | 25,116 | | | | 87,318 | |
Custodian fee | | | 889 | | | | 16,291 | |
Legal and audit fee | | | 13,090 | | | | 88,449 | |
Transfer agent fee | | | 13,015 | | | | 121,457 | |
Trustees’ fees and expenses | | | 3,090 | | | | 18,116 | |
Registration/filing fees | | | 1,711 | | | | 40,571 | |
Report to shareholder and printing fees | | | 19,069 | | | | 75,561 | |
Distribution and service fees | | | | | | | | |
Investor Class | | | 38,542 | | | | — | |
Class A | | | 6,906 | | | | 308,303 | |
Class C | | | — | | | | 569,489 | |
ReFlow fees (Note 2) | | | 659 | | | | 496 | |
Other | | | 7,930 | | | | 26,166 | |
| | | | | | | | |
Total expenses before waiver | | | 262,701 | | | | 2,707,400 | |
Less fees waived/reimbursed by investment advisor | | | (31,202 | ) | | | 0 | |
| | | | | | | | |
Total net expenses | | | 231,499 | | | | 2,707,400 | |
| | | | | | | | |
| NET INVESTMENT INCOME/(LOSS): | | | 13,396 | | | | (301,567 | ) |
| | | | | | | | |
Net realized gain on investments | | | 2,420,515 | | | | 6,591,986 | |
Net change in unrealized appreciation/(depreciation) on investments | | | (3,062,057 | ) | | | 5,093,952 | |
| | | | | | | | |
| NET REALIZED AND UNREALIZED GAIN/(LOSS) ON INVESTMENTS | | | (641,542 | ) | | | 11,685,938 | |
| | | | | | | | |
| NET INCREASE/(DECREASE) IN NET ASSETS RESULTING FROM OPERATIONS | | $ | (628,146 | ) | | $ | 11,384,371 | |
| | | | | | | | |
| | | | |
| See Notes to Financial Statements | | 55 | | June 30, 2006 |
Statement of Operations
| | | | | | | | | | | | |
| | | FORWARD
EMERALD
OPPORTUNITIES
FUND | | | FORWARD
UNIPLAN
REAL ESTATE
INVESTMENT
FUND | |
| | | SIX MONTHS ENDED
JUNE 30, 2006
(UNAUDITED) | | | SIX MONTHS ENDED
JUNE 30, 2006
(UNAUDITED) | | | YEAR ENDED
DECEMBER 31, 2005
(AUDITED) | |
| INVESTMENT INCOME: | | | | | | | | | | | | |
Interest | | $ | 44,570 | | | $ | 22,833 | | | $ | 20,537 | |
Dividends | | | 12,631 | | | | 657,439 | | | | 1,666,307 | (a) |
Foreign taxes withheld | | | 0 | | | | (2,241 | ) | | | (5,166 | ) |
| | | | | | | | | | | | |
Total Investment Income | | | 57,201 | | | | 678,031 | | | | 1,681,678 | (a) |
| | | | | | | | | | | | |
| EXPENSES: | | | | | | | | | | | | |
Investment advisory fee | | | 47,116 | | | | 193,467 | | | | 379,381 | |
Administrative fee | | | 3,384 | | | | 27,737 | | | | 92,869 | |
Custodian fee | | | 15,243 | | | | 6,182 | | | | 16,964 | |
Legal and audit fee | | | 4,606 | | | | 18,184 | | | | 47,880 | |
Transfer agent fee | | | 9,262 | | | | 10,583 | | | | 13,905 | |
Trustees' fees and expenses | | | 3,078 | | | | 5,432 | | | | 9,755 | |
Registration/filing fees | | | 12,370 | | | | 4,635 | | | | 16,949 | |
Report to shareholder and printing fees | | | 7,081 | | | | 6,952 | | | | 43,153 | |
Distribution and service fees | | | | | | | | | | | | |
Investor Class | | | — | | | | 38,693 | | | | 75,876 | |
Class A | | | 19,420 | | | | — | | | | — | |
Class C | | | 8,071 | | | | — | | | | — | |
Repayment of reimbursed expenses | | | — | | | | — | | | | 80,300 | |
ReFlow fees (Note 2) | | | 0 | | | | 3,731 | | | | 3,283 | |
Other | | | 4,751 | | | | 16,016 | | | | 18,478 | |
| | | | | | | | | | | | |
Total expenses before waiver | | | 134,382 | | | | 331,612 | | | | 798,793 | |
Less fees waived/reimbursed by investment advisor | | | (10,554 | ) | | | 0 | | | | 0 | |
| | | | | | | | | | | | |
Total net expenses | | | 123,828 | | | | 331,612 | | | | 798,793 | |
| | | | | | | | | | | | |
| NET INVESTMENT INCOME/(LOSS): | | | (66,627 | ) | | | 346,419 | | | | 882,885 | (a) |
| | | | | | | | | | | | |
Net realized gain on investments | | | 421,799 | | | | 2,022,323 | | | | 3,193,635 | (a) |
Net realized gain/(loss) on foreign currency transactions | | | 0 | | | | (94 | ) | | | 58 | |
Net realized loss on options | | | (32,075 | ) | | | — | | | | — | |
Net realized loss on securities sold short | | | (23,701 | ) | | | — | | | | — | |
Net change in unrealized appreciation on investments, options and securities sold short | | | 41,086 | | | | 2,470,599 | | | | 357,351 | (a) |
Net change in unrealized appreciation/(depreciation) on translation of assets and liabilities in foreign currencies | | | 0 | | | | 12 | | | | (52 | ) |
| | | | | | | | | | | | |
| NET REALIZED AND UNREALIZED GAIN ON INVESTMENTS, OPTIONS, SECURITIES SOLD SHORT AND FOREIGN CURRENCY | | | 407,109 | | | | 4,492,840 | | | | 3,550,992 | |
| | | | | | | | | | | | |
| NET INCREASE IN NET ASSETS RESULTING FROM OPERATIONS | | $ | 340,482 | | | $ | 4,839,259 | | | $ | 4,433,877 | |
| | | | | | | | | | | | |
(a) Amount has been restated. See Note 2 to December 31, 2005 Financial Statements.
| | | | |
| June 30, 2006 | | 56 | | See Notes to Financial Statements |
Statement of Operations
For the Six Months Ended June 30, 2006 (Unaudited)
| | | | | | | | |
| | | FORWARD
EMERALD
GROWTH
FUND | | | FORWARD
HOOVER
SMALL CAP
EQUITY
FUND | |
| INVESTMENT INCOME: | | | | | | | | |
Interest | | $ | 148,959 | | | $ | 429,415 | |
Dividends | | | 146,104 | | | | 1,710,660 | |
Foreign taxes withheld | | | 0 | | | | (2,937 | ) |
| | | | | | | | |
Total Investment Income | | | 295,063 | | | | 2,137,138 | |
| | | | | | | | |
| EXPENSES: | | | | | | | | |
Investment advisory fee | | | 707,969 | | | | 2,431,642 | |
Administrative fee | | | 58,481 | | | | 148,731 | |
Custodian fee | | | 25,044 | | | | 25,949 | |
Legal and audit fee | | | 51,920 | | | | 98,594 | |
Transfer agent fee | | | 51,061 | | | | 174,892 | |
Trustees’ fees and expenses | | | 11,829 | | | | 25,409 | |
Registration/filing fees | | | 26,259 | | | | 35,222 | |
Report to shareholder and printing fees | | | 38,016 | | | | 57,699 | |
Distribution and service fees | | | | | | | | |
Investor Class | | | — | | | | 692,859 | |
Class A | | | 306,775 | | | | 31,577 | |
Class C | | | 59,153 | | | | — | |
Repayment of reimbursed expenses | | | 0 | | | | 19,743 | |
ReFlow fees (Note 2) | | | 0 | | | | 1,452 | |
Other | | | 17,195 | | | | 43,304 | |
| | | | | | | | |
Total expenses before waiver | | | 1,353,702 | | | | 3,787,073 | |
Less fees waived/reimbursed by investment advisor | | | 0 | | | | (39,913 | ) |
| | | | | | | | |
Total net expenses | | | 1,353,702 | | | | 3,747,160 | �� |
| | | | | | | | |
| NET INVESTMENT LOSS: | | | (1,058,639 | ) | | | (1,610,022 | ) |
| | | | | | | | |
Net realized gain on investments | | | 14,078,311 | | | | 21,994,410 | |
Net change in unrealized appreciation/(depreciation) on investments | | | 5,609,215 | | | | (7,843,538 | ) |
| | | | | | | | |
| NET REALIZED AND UNREALIZED GAIN ON INVESTMENTS | | | 19,687,526 | | | | 14,150,872 | |
| | | | | | | | |
| NET INCREASE IN NET ASSETS RESULTING FROM OPERATIONS | | $ | 18,628,887 | | | $ | 12,540,850 | |
| | | | | | | | |
| | | | |
| See Notes to Financial Statements | | 57 | | June 30, 2006 |
Statement of Operations
For the Six Months Ended June 30, 2006 (Unaudited)
| | | | | | | | |
| | | FORWARD
HOOVER
MINI-CAP
FUND | | | FORWARD
LEGATO
FUND | |
| INVESTMENT INCOME: | | | | | | | | |
Interest | | $ | 66,482 | | | $ | 3,930 | |
Dividends | | | 146,716 | | | | 25,952 | |
Foreign taxes withheld | | | 0 | | | | (142 | ) |
| | | | | | | | |
Total Investment Income | | | 213,198 | | | | 29,740 | |
| | | | | | | | |
| EXPENSES: | | | | | | | | |
Investment advisory fee | | | 239,347 | | | | 41,997 | |
Administrative fee | | | 23,360 | | | | 22,110 | |
Custodian fee | | | 10,586 | | | | 2,340 | |
Legal and audit fee | | | 15,870 | | | | 4,963 | |
Transfer agent fee | | | 5,519 | | | | 1,078 | |
Trustees’ fees and expenses | | | 11,360 | | | | 1,302 | |
Registration/filing fees | | | 7,966 | | | | 2,255 | |
Report to shareholder and printing fees | | | 3,856 | | | | 1,902 | |
Distribution and service fees | | | | | | | | |
Investor Class | | | 9,737 | | | | — | |
Class A | | | — | | | | 4,200 | |
Repayment of reimbursed expenses | | | 11,605 | | | | 0 | |
Other | | | 10,203 | | | | 1,273 | |
| | | | | | | | |
Total expenses before waiver | | | 349,409 | | | | 83,420 | |
Less fees waived/reimbursed by investment advisor | | | (36,124 | ) | | | (14,823 | ) |
| | | | | | | | |
Total net expenses | | | 313,285 | | | | 68,597 | |
| | | | | | | | |
| NET INVESTMENT LOSS: | | | (100,087 | ) | | | (38,857 | ) |
| | | | | | | | |
Net realized gain on investments | | | 3,296,338 | | | | 186,871 | |
Net change in unrealized appreciation/(depreciation) on investments | | | (972,683 | ) | | | 32,130 | |
| | | | | | | | |
| NET REALIZED AND UNREALIZED GAIN ON INVESTMENTS | | | 2,323,655 | | | | 219,001 | |
| | | | | | | | |
| NET INCREASE IN NET ASSETS RESULTING FROM OPERATIONS | | $ | 2,223,568 | | | $ | 180,144 | |
| | | | | | | | |
| | | | |
| June 30, 2006 | | 58 | | See Notes to Financial Statements |
Statement of Changes in Net Assets
| | | | | | | | |
| | | FORWARD INTERNATIONAL EQUITY FUND(a) | |
| | | SIX MONTHS ENDED
JUNE 30, 2006 (UNAUDITED) | | | YEAR ENDED
DECEMBER 31, 2005 | |
| OPERATIONS: | | | | | | | | |
Net investment income | | $ | 212,677 | | | $ | 84,298 | |
Net realized gain on investments | | | 1,869,155 | | | | 6,882,682 | |
Net realized gain/(loss) on foreign currency | | | 94,535 | | | | (172,131 | ) |
Net change in unrealized appreciation/(depreciation) on investments and foreign currency | | | 754,758 | | | | (3,125,506 | ) |
| | | | | | | | |
Net increase in net assets resulting from operations | | | 2,931,125 | | | | 3,669,343 | |
| | | | | | | | |
| DISTRIBUTIONS TO SHAREHOLDERS: | | | | | | | | |
From net investment income | | | 0 | | | | (10,770 | ) |
| | | | | | | | |
Total distributions | | | 0 | | | | (10,770 | ) |
| | | | | | | | |
| SHARE TRANSACTIONS: | | | | | | | | |
| INVESTOR CLASS | | | | | | | | |
Proceeds from sale of shares | | | 1,739,738 | | | | 2,446,975 | |
Issued to shareholders in reinvestment of distributions | | | 0 | | | | 1,894 | |
Cost of shares redeemed, net of redemption fees (Note 7) | | | (744,829 | ) | | | (5,431,797 | ) |
| | | | | | | | |
Net increase/(decrease) from share transactions | | | 994,909 | | | | (2,982,928 | ) |
| | | | | | | | |
Net increase in net assets | | $ | 3,926,034 | | | $ | 675,645 | |
| | | | | | | | |
| NET ASSETS: | | | | | | | | |
Beginning of period | | | 24,879,848 | | | | 24,204,203 | |
| | | | | | | | |
End of period (including accumulated net investment income of $212,677 and $0, respectively) | | $ | 28,805,882 | | | $ | 24,879,848 | |
| | | | | | | | |
| Other Information: | | | | | | | | |
| SHARE TRANSACTIONS: | | | | | | | | |
| INVESTOR CLASS | | | | | | | | |
Sold | | | 106,675 | | | | 189,729 | |
Distributions reinvested | | | 0 | | | | 126 | |
Redeemed | | | (47,551 | ) | | | (425,902 | ) |
| | | | | | | | |
Net increase/(decrease) in shares outstanding | | | 59,124 | | | | (236,047 | ) |
| | | | | | | | |
(a) Prior to September 1, 2005, the Forward International Equity Fund was known as the Forward Hansberger International Growth Fund.
| | | | |
| See Notes to Financial Statements | | 59 | | June 30, 2006 |
Statement of Changes in Net Assets
| | | | | | | | |
| | | FORWARD INTERNATIONAL SMALL COMPANIES FUND | |
| | | SIX MONTHS ENDED
JUNE 30, 2006 (UNAUDITED) | | | YEAR ENDED
DECEMBER 31, 2005 | |
OPERATIONS: | | | | | | | | |
Net investment income | | $ | 2,058,840 | | | $ | 1,357,606 | |
Net realized gain on investments | | | 12,239,929 | | | | 12,254,422 | |
Net realized gain/(loss) on foreign currency | | | 869,134 | | | | (103,213 | ) |
Net change in unrealized appreciation on investments and foreign currency | | | 5,665,098 | | | | 22,185,401 | |
| | | | | | | | |
Net increase in net assets resulting from operations | | | 20,833,001 | | | | 35,694,216 | |
| | | | | | | | |
DISTRIBUTIONS TO SHAREHOLDERS: | | | | | | | | |
From net investment income | | | | | | | | |
Investor Class | | | 0 | | | | (331,158 | ) |
Institutional Class | | | 0 | | | | (994,070 | ) |
Class A | | | 0 | | | | (18,509 | ) |
From net realized gains on investments | | | | | | | | |
Investor Class | | | 0 | | | | (3,679,469 | ) |
Institutional Class | | | 0 | | | | (8,552,479 | ) |
Class A | | | 0 | | | | (201,289 | ) |
| | | | | | | | |
Total distributions | | | 0 | | | | (13,776,974 | ) |
| | | | | | | | |
SHARE TRANSACTIONS: | | | | | | | | |
INVESTOR CLASS | | | | | | | | |
Proceeds from sale of shares | | | 138,085,618 | | | | 62,930,686 | |
Issued to shareholders in reinvestment of distributions | | | 0 | | | | 3,685,830 | |
Cost of shares redeemed, net of redemption fees (Note 7) | | | (19,316,242 | ) | | | (17,178,000 | ) |
| | | | | | | | |
Net increase from share transactions | | | 118,769,376 | | | | 49,438,516 | |
| | | | | | | | |
INSTITUTIONAL CLASS | | | | | | | | |
Proceeds from sale of shares | | | 103,591,902 | | | | 79,363,770 | |
Issued to shareholders in reinvestment of distributions | | | 0 | | | | 9,357,468 | |
Cost of shares redeemed, net of redemption fees (Note 7) | | | (19,944,790 | ) | | | (9,854,783 | ) |
| | | | | | | | |
Net increase from share transactions | | | 83,647,112 | | | | 78,866,455 | |
| | | | | | | | |
CLASS A | | | | | | | | |
Proceeds from sale of shares | | | 777,163 | | | | 4,476,025 | |
Issued to shareholders in reinvestment of distributions | | | 0 | | | | 217,433 | |
Cost of shares redeemed, net of redemption fees (Note 7) | | | (1,031,770 | ) | | | 0 | |
| | | | | | | | |
Net increase/(decrease) from share transactions | | | (254,607 | ) | | | 4,693,458 | |
| | | | | | | | |
Net increase in net assets | | $ | 222,994,882 | | | $ | 154,915,671 | |
| | | | | | | | |
NET ASSETS: | | | | | | | | |
Beginning of period | | | 213,802,486 | | | | 58,886,815 | |
| | | | | | | | |
End of period (including accumulated net investment income of $2,040,045
and $0, respectively) | | $ | 436,797,368 | | | $ | 213,802,486 | |
| | | | | | | | |
| | | | | | |
Other Information: | | | | | | |
SHARE TRANSACTIONS: | | | | | | |
INVESTOR CLASS | | | | | | |
Sold | | 8,132,658 | | | 4,486,491 | |
Distributions reinvested | | 0 | | | 261,485 | |
Redeemed | | (1,168,004 | ) | | (1,245,002 | ) |
| | | | | | |
Net increase in shares outstanding | | 6,964,654 | | | 3,502,974 | |
| | | | | | |
INSTITUTIONAL CLASS | | | | | | |
Sold | | 6,147,823 | | | 5,748,013 | |
Distributions reinvested | | 0 | | | 660,131 | |
Redeemed | | (1,207,136 | ) | | (686,978 | ) |
| | | | | | |
Net increase in shares outstanding | | 4,940,687 | | | 5,721,166 | |
| | | | | | |
CLASS A | | | | | | |
Sold | | 45,898 | | | 320,862 | |
Distributions reinvested | | 0 | | | 15,428 | |
Redeemed | | (64,523 | ) | | 0 | |
| | | | | | |
Net increase/(decrease) in shares outstanding | | (18,625 | ) | | 336,290 | |
| | | | | | |
| | | | |
| June 30, 2006 | | 60 | | See Notes to Financial Statements |
Statement of Changes in Net Assets
| | | | | | | | |
| | | FORWARD GLOBAL EMERGING MARKETS FUND | |
| | | SIX MONTHS ENDED
JUNE 30, 2006 (UNAUDITED) | | | YEAR ENDED
DECEMBER 31, 2005 | |
| OPERATIONS: | | | | | | | | |
Net investment income | | $ | 228,724 | | | $ | 626,905 | |
Net realized gain on investments | | | 2,791,072 | | | | 3,770,099 | |
Net realized gain/(loss) on foreign currency | | | 180,493 | | | | (9,999 | ) |
Net change in unrealized appreciation/(depreciation) on
investments and foreign currency | | | (2,258,164 | ) | | | 3,933,761 | |
| | | | | | | | |
Net increase in net assets resulting from operations | | | 942,125 | | | | 8,320,766 | |
| | | | | | | | |
| DISTRIBUTIONS TO SHAREHOLDERS: | | | | | | | | |
From net investment income | | | | | | | | |
Investor Class | | | 0 | | | | (122,863 | ) |
Institutional Class | | | 0 | | | | (454,683 | ) |
| | | | | | | | |
Total distributions | | | 0 | | | | (577,546 | ) |
| | | | | | | | |
| SHARE TRANSACTIONS: | | | | | | | | |
| INVESTOR CLASS | | | | | | | | |
Proceeds from sale of shares | | | 7,363,527 | | | | 10,737,828 | |
Issued to shareholders in reinvestment of distributions | | | 0 | | | | 23,796 | |
Cost of shares redeemed, net of redemption fees (Note 7) | | | (3,120,608 | ) | | | (4,472,740 | ) |
| | | | | | | | |
Net increase from share transactions | | | 4,242,919 | | | | 6,288,884 | |
| | | | | | | | |
| INSTITUTIONAL CLASS | | | | | | | | |
Proceeds from sale of shares | | | 7,119,872 | | | | 8,038,233 | |
Issued to shareholders in reinvestment of distributions | | | 0 | | | | 170,186 | |
Cost of shares redeemed, net of redemption fees (Note 7) | | | (3,003,112 | ) | | | (4,465,956 | ) |
| | | | | | | | |
Net increase from share transactions | | | 4,116,760 | | | | 3,742,463 | |
| | | | | | | | |
Net increase in net assets | | $ | 9,301,804 | | | $ | 17,774,567 | |
| | | | | | | | |
| NET ASSETS: | | | | | | | | |
Beginning of period | | | 37,597,740 | | | | 19,823,173 | |
| | | | | | | | |
End of period (including accumulated net investment income of $268,084 and $39,360, respectively) | | $ | 46,899,544 | | | $ | 37,597,740 | |
| | | | | | | | |
| Other Information: | | | | | | | | |
| SHARE TRANSACTIONS: | | | | | | | | |
| INVESTOR CLASS | | | | | | | | |
Sold | | | 365,149 | | | | 689,415 | |
Distributions reinvested | | | 0 | | | | 1,264 | |
Redeemed | | | (154,346 | ) | | | (289,852 | ) |
| | | | | | | | |
Net increase in shares outstanding | | | 210,803 | | | | 400,827 | |
| | | | | | | | |
| INSTITUTIONAL CLASS | | | | | | | | |
Sold | | | 348,329 | | | | 465,253 | |
Distributions reinvested | | | 0 | | | | 9,014 | |
Redeemed | | | (151,440 | ) | | | (275,548 | ) |
| | | | | | | | |
Net increase in shares outstanding | | | 196,889 | | | | 198,719 | |
| | | | | | | | |
| | | | |
| See Notes to Financial Statements | | 61 | | June 30, 2006 |
Statement of Changes in Net Assets
| | | | | | | | |
| | | SIERRA CLUB EQUITY INCOME FUND | |
| | | SIX MONTHS ENDED
JUNE 30, 2006 (UNAUDITED) | | | YEAR ENDED
DECEMBER 31, 2005 | |
| OPERATIONS: | | | | | | | | |
Net investment income | | $ | 173,946 | | | $ | 35,131 | |
Net realized gain on investments | | | 619,450 | | | | 1,010,658 | |
Net change in unrealized appreciation/(depreciation) on investments | | | (539,184 | ) | | | (862,223 | ) |
| | | | | | | | |
Net increase in net assets resulting from operations | | | 254,212 | | | | 183,566 | |
| | | | | | | | |
| DISTRIBUTIONS TO SHAREHOLDERS: | | | | | | | | |
| INVESTOR CLASS | | | | | | | | |
From net investment income | | | (176,369 | ) | | | (31,551 | ) |
From net realized gains on investments | | | 0 | | | | (1,589,307 | ) |
| | | | | | | | |
Total distributions | | | (176,369 | ) | | | (1,620,858 | ) |
| | | | | | | | |
| SHARE TRANSACTIONS: | | | | | | | | |
| INVESTOR CLASS | | | | | | | | |
Proceeds from sale of shares | | | 2,406,325 | | | | 4,156,404 | |
Issued to shareholders in reinvestment of distributions | | | 101,518 | | | | 555,674 | |
Cost of shares redeemed, net of redemption fees (Note 7) | | | (3,776,440 | ) | | | (3,550,379 | ) |
| | | | | | | | |
Net increase/(decrease) from share transactions | | | (1,268,597 | ) | | | 1,161,699 | |
| | | | | | | | |
Net decrease in net assets | | $ | (1,190,754 | ) | | $ | (275,593 | ) |
| | | | | | | | |
| NET ASSETS: | | | | | | | | |
Beginning of period | | | 30,146,301 | | | | 30,421,894 | |
| | | | | | | | |
End of period (including accumulated net investment loss of $(2,423) and $0, respectively) | | $ | 28,955,547 | | | $ | 30,146,301 | |
| | | | | | | | |
| Other Information: | | | | | | | | |
| SHARE TRANSACTIONS: | | | | | | | | |
| INVESTOR CLASS | | | | | | | | |
Sold | | | 207,933 | | | | 359,003 | |
Distributions reinvested | | | 8,812 | | | | 48,400 | |
Redeemed | | | (330,841 | ) | | | (304,543 | ) |
| | | | | | | | |
Net increase/(decrease) in shares outstanding | | | (114,096 | ) | | | 102,860 | |
| | | | | | | | |
| | | | |
| June 30, 2006 | | 62 | | See Notes to Financial Statements |
Statement of Changes in Net Assets
| | | | | | | | |
| | | SIERRA CLUB STOCK FUND | |
| | | SIX MONTHS ENDED
JUNE 30, 2006 (UNAUDITED) | | | YEAR ENDED
DECEMBER 31, 2005 | |
| OPERATIONS: | | | | | | | | |
Net investment income/(loss) | | $ | 13,396 | | | $ | (180,683 | ) |
Net realized gain on investments | | | 2,420,515 | | | | 906,248 | |
Net change in unrealized appreciation/(depreciation) on investments | | | (3,062,057 | ) | | | 296,307 | |
| | | | | | | | |
Net increase/(decrease) in net assets resulting from operations | | | (628,146 | ) | | | 1,021,872 | |
| | | | | | | | |
| DISTRIBUTIONS TO SHAREHOLDERS: | | | | | | | | |
From net realized gains on investments | | | | | | | | |
Investor Class | | | 0 | | | | (610,736 | ) |
Class A | | | 0 | | | | (138,034 | ) |
| | | | | | | | |
Total distributions | | | 0 | | | | (748,770 | ) |
| | | | | | | | |
| SHARE TRANSACTIONS: | | | | | | | | |
| INVESTOR CLASS | | | | | | | | |
Proceeds from sale of shares | | | 4,289,606 | | | | 10,482,206 | |
Issued to shareholders in reinvestment of distributions | | | 0 | | | | 349,977 | |
Cost of shares redeemed, net of redemption fees (Note 7) | | | (1,380,488 | ) | | | (6,482,743 | ) |
| | | | | | | | |
Net increase from share transactions | | | 2,909,118 | | | | 4,349,440 | |
| | | | | | | | |
| CLASS A | | | | | | | | |
Proceeds from sale of shares | | | 48,589 | | | | 4,867,522 | |
Issued to shareholders in reinvestment of distributions | | | 0 | | | | 65,470 | |
| | | | | | | | |
Net increase from share transactions | | | 48,589 | | | | 4,932,992 | |
| | | | | | | | |
Net increase in net assets | | $ | 2,329,561 | | | $ | 9,555,534 | |
| | | | | | | | |
| NET ASSETS: | | | | | | | | |
Beginning of period | | | 29,756,291 | | | | 20,200,757 | |
| | | | | | | | |
End of period (including accumulated net investment income of $13,396 and $0, respectively) | | $ | 32,085,852 | | | $ | 29,756,291 | |
| | | | | | | | |
| Other Information: | | | | | | | | |
| SHARE TRANSACTIONS: | | | | | | | | |
| INVESTOR CLASS | | | | | | | | |
Sold | | | 4,289,606 | | | | 918,708 | |
Distributions reinvested | | | 0 | | | | 29,360 | |
Redeemed | | | (1,380,488 | ) | | | (593,034 | ) |
| | | | | | | | |
Net increase in shares outstanding | | | 2,909,118 | | | | 355,034 | |
| | | | | | | | |
| CLASS A | | | | | | | | |
Sold | | | 48,589 | | | | 454,658 | |
Distributions reinvested | | | 0 | | | | 5,492 | |
| | | | | | | | |
Net increase in shares outstanding | | | 48,589 | | | | 460,150 | |
| | | | | | | | |
| | | | |
| See Notes to Financial Statements | | 63 | | June 30, 2006 |
Statement of Changes in Net Assets
| | | | | | | | | | | | |
| | | FORWARD EMERALD BANKING AND FINANCE FUND | |
| | | SIX MONTHS ENDED
JUNE 30, 2006 (UNAUDITED) | | | SIX MONTHS ENDED
DECEMBER 31, 2005 | | | YEAR ENDED JUNE 30, 2005 | |
| OPERATIONS: | | | | | | | | | | | | |
Net investment loss | | $ | (301,567 | ) | | $ | (517,397 | ) | | $ | (1,278,059 | ) |
Net realized gain on investments | | | 6,591,986 | | | | 15,711,697 | | | | 9,230,290 | |
Net change in unrealized appreciation/(depreciation) on investments | | | 5,093,952 | | | | (313,635 | ) | | | 20,528,532 | |
| | | | | | | | | | | | |
Net increase in net assets resulting from operations | | | 11,384,371 | | | | 14,880,665 | | | | 28,480,763 | |
| | | | | | | | | | | | |
| DISTRIBUTIONS TO SHAREHOLDERS: | | | | | | | | | | | | |
From net realized gains on investments | | | | | | | | | | | | |
Class A | | | 0 | | | | (12,042,011 | ) | | | (4,974,573 | ) |
Class C | | | 0 | | | | (7,512,376 | ) | | | (3,519,861 | ) |
| | | | | | | | | | | | |
Total distributions | | | 0 | | | | (19,554,387 | ) | | | (8,494,434 | ) |
| | | | | | | | | | | | |
| SHARE TRANSACTIONS: | | | | | | | | | | | | |
| CLASS A | | | | | | | | | | | | |
Proceeds from sale of shares | | | 22,341,005 | | | | 22,581,054 | | | | 76,906,237 | |
Issued to shareholders in reinvestment of distributions | | | 0 | | | | 10,658,780 | | | | 4,386,921 | |
Cost of shares redeemed, net of redemption fees (Note 7) | | | (48,293,343 | ) | | | (29,771,823 | ) | | | (43,394,497 | ) |
| | | | | | | | | | | | |
Net increase/(decrease) from share transactions | | | (25,952,338 | ) | | | 3,468,011 | | | | 37,898,661 | |
| | | | | | | | | | | | |
| CLASS C | | | | | | | | | | | | |
Proceeds from sale of shares | | | 6,317,661 | | | | 11,975,900 | | | | 29,488,435 | |
Issued to shareholders in reinvestment of distributions | | | 0 | | | | 5,290,512 | | | | 2,520,733 | |
Cost of shares redeemed, net of redemption fees (Note 7) | | | (11,700,210 | ) | | | (10,096,985 | ) | | | (19,919,675 | ) |
| | | | | | | | | | | | |
Net increase/(decrease) from share transactions | | | (5,382,549 | ) | | | 7,169,427 | | | | 12,089,493 | |
| | | | | | | | | | | | |
Net increase/(decrease) in net assets | | $ | (19,950,516 | ) | | $ | 5,963,716 | | | $ | 69,974,483 | |
| | | | | | | | | | | | |
| NET ASSETS: | | | | | | | | | | | | |
Beginning of period | | | 297,323,550 | | | | 291,359,834 | | | | 221,385,351 | |
| | | | | | | | | | | | |
End of period (including accumulated net investment loss of $(301,567), $0 and $0, respectively) | | $ | 277,373,034 | | | $ | 297,323,550 | | | $ | 291,359,834 | |
| | | | | | | | | | | | |
| Other Information: | | | | | | | | | | | | |
| SHARE TRANSACTIONS: | | | | | | | | | | | | |
| CLASS A | | | | | | | | | | | | |
Sold | | | 782,352 | | | | 793,282 | | | | 2,836,726 | |
Distributions reinvested | | | 0 | | | | 380,328 | | | | 177,520 | |
Redeemed | | | (1,687,416 | ) | | | (1,047,668 | ) | | | (1,628,134 | ) |
| | | | | | | | | | | | |
Net increase/(decrease) in shares outstanding | | | (905,064 | ) | | | 125,942 | | | | 1,386,112 | |
| | | | | | | | | | | | |
| CLASS C | | | | | | | | | | | | |
Sold | | | 227,740 | | | | 433,269 | | | | 1,114,582 | |
Distributions reinvested | | | 0 | | | | 194,685 | | | | 104,304 | |
Redeemed | | | (423,021 | ) | | | (366,719 | ) | | | (758,076 | ) |
| | | | | | | | | | | | |
Net increase/(decrease) in shares outstanding | | | (195,281 | ) | | | 261,235 | | | | 460,810 | |
| | | | | | | | | | | | |
| | | | |
| June 30, 2006 | | 64 | | See Notes to Financial Statements |
Statement of Changes in Net Assets
| | | | | | | | | | | | |
| | | FORWARD EMERALD OPPORTUNITIES FUND(a) | |
| | | SIX MONTHS ENDED
JUNE 30, 2006 (UNAUDITED) | | | SIX MONTHS ENDED
DECEMBER 31, 2005 | | | YEAR ENDED
JUNE 30, 2005 | |
| OPERATIONS: | | | | | | | | | | | | |
Net investment loss | | $ | (66,627 | ) | | $ | (46,163 | ) | | $ | (89,381 | ) |
Net realized gain on investments | | | 421,799 | | | | 621,397 | | | | 440,202 | |
Net realized loss on options | | | (32,075 | ) | | | 0 | | | | 0 | |
Net realized loss on securities sold short | | | (23,701 | ) | | | 0 | | | | 0 | |
Net change in unrealized appreciation/(depreciation) on investments, option contracts and securities sold short | | | 41,086 | | | | 69,744 | | | | (433,809 | ) |
| | | | | | | | | | | | |
Net increase/(decrease) in net assets resulting from operations | | | 340,482 | | | | 644,978 | | | | (82,988 | ) |
| | | | | | | | | | | | |
| SHARE TRANSACTIONS: | | | | | | | | | | | | |
| CLASS A | | | | | | | | | | | | |
Proceeds from sale of shares | | | 2,869,774 | | | | 2,965,879 | | | | 635,411 | |
Cost of shares redeemed, net of redemption fees (Note 7) | | | (496,849 | ) | | | (329,007 | ) | | | (974,092 | ) |
| | | | | | | | | | | | |
Net increase/(decrease) from share transactions | | | 2,372,925 | | | | 2,636,872 | | | | (338,681 | ) |
| | | | | | | | | | | | |
| CLASS C | | | | | | | | | | | | |
Proceeds from sale of shares | | | 1,910,161 | | | | 416,562 | | | | 100 | |
Cost of shares redeemed, net of redemption fees (Note 7) | | | (102,694 | ) | | | (55,350 | ) | | | (117,862 | ) |
| | | | | | | | | | | | |
Net increase/(decrease) from share transactions | | | 1,807,467 | | | | 361,212 | | | | (117,762 | ) |
| | | | | | | | | | | | |
Net increase in net assets | | $ | 4,520,874 | | | $ | 3,643,062 | | | $ | (539,431 | ) |
| | | | | | | | | | | | |
| NET ASSETS: | | | | | | | | | | | | |
Beginning of period | | | 6,823,695 | | | | 3,180,633 | | | | 3,720,064 | |
| | | | | | | | | | | | |
End of period (including accumulated net investment loss of $(66,627), $0 and $0, respectively) | | $ | 11,344,569 | | | $ | 6,823,695 | | | $ | 3,180,633 | |
| | | | | | | | | | | | |
| Other Information: | | | | | | | | | | | | |
| SHARE TRANSACTIONS: | | | | | | | | | | | | |
| CLASS A | | | | | | | | | | | | |
Sold | | | 317,981 | | | | 360,643 | | | | 91,573 | |
Redeemed | | | (55,614 | ) | | | (41,996 | ) | | | (143,726 | ) |
| | | | | | | | | | | | |
Net increase/(decrease) in shares outstanding | | | 262,367 | | | | 318,647 | | | | (52,153 | ) |
| | | | | | | | | | | | |
| CLASS C | | | | | | | | | | | | |
Sold | | | 218,603 | | | | 50,829 | | | | 14 | |
Redeemed | | | (11,780 | ) | | | (7,032 | ) | | | (17,637 | ) |
| | | | | | | | | | | | |
Net increase/(decrease) in shares outstanding | | | 206,823 | | | | 43,797 | | | | (17,623 | ) |
| | | | | | | | | | | | |
(a) Prior to September 29, 2005, the Forward Emerald Opportunities Fund was known as the Forward Emerald Technology Fund.
| | | | |
| See Notes to Financial Statements | | 65 | | June 30, 2006 |
Statement of Changes in Net Assets
| | | | | | | | | | | | |
| | | FORWARD UNIPLAN REAL ESTATE INVESTMENT FUND | |
| | | SIX MONTHS ENDED
JUNE 30, 2006 (UNAUDITED) | | | YEAR ENDED
DECEMBER 31, 2005 | | | YEAR ENDED
DECEMBER 31, 2004 | |
| OPERATIONS: | | | | | | | | | | | | |
Net investment income | | $ | 346,419 | | | $ | 882,885 | (a) | | $ | 945,295 | (a) |
Net realized gain on investments | | | 2,022,323 | | | | 3,193,635 | (a) | | | 2,883,186 | (a) |
Net realized gain/(loss) on foreign currency | | | (94 | ) | | | 58 | | | | 2 | |
Net change in unrealized appreciation on investments and foreign currency | | | 2,470,611 | | | | 357,299 | (a) | | | 7,342,381 | (a) |
| | | | | | | | | | | | |
Net increase in net assets resulting from operations | | | 4,839,259 | | | | 4,433,877 | | | | 11,170,864 | |
| | | | | | | | | | | | |
| DISTRIBUTIONS TO SHAREHOLDERS: | | | | | | | | | | | | |
| INVESTOR CLASS | | | | | | | | | | | | |
From net investment income | | | (249,170 | ) | | | (498,174 | ) | | | (1,647,621 | ) |
From net realized gains on investments | | | 0 | | | | (3,748,049 | ) | | | (2,123,003 | ) |
Tax return of capital | | | 0 | | | | (127,254 | ) | | | — | |
| | | | | | | | | | | | |
Total distributions | | | (249,170 | ) | | | (4,373,477 | ) | | | (3,770,624 | ) |
| | | | | | | | | | | | |
| SHARE TRANSACTIONS: | | | | | | | | | | | | |
| INVESTOR CLASS | | | | | | | | | | | | |
Proceeds from sale of shares | | | 3,143,789 | | | | 8,536,177 | | | | 13,529,123 | |
Issued to shareholders in reinvestment of distributions | | | 59,533 | | | | 2,402,766 | | | | 3,738,910 | |
Cost of shares redeemed, net of redemption fees (Note 7) | | | (6,750,194 | ) | | | (16,057,968 | ) | | | (13,057,217 | ) |
| | | | | | | | | | | | |
Net decrease from share transactions | | | (3,546,872 | ) | | | (5,119,025 | ) | | | 4,210,816 | |
| | | | | | | | | | | | |
Net increase/(decrease) in net assets | | $ | 1,043,217 | | | $ | (5,058,625 | ) | | $ | 11,611,056 | |
| | | | | | | | | | | | |
| NET ASSETS: | | | | | | | | | | | | |
Beginning of period | | | 43,287,640 | | | | 48,346,265 | | | | 36,735,209 | |
| | | | | | | | | | | | |
End of period (including accumulated net investment income/(loss) of $97,202, $(47) and $(88), respectively) | | $ | 44,330,857 | | | $ | 43,287,640 | | | $ | 48,346,265 | |
| | | | | | | | | | | | |
| Other Information: | | | | | | | | | | | | |
| SHARE TRANSACTIONS: | | | | | | | | | | | | |
| INVESTOR CLASS | | | | | | | | | | | | |
Sold | | | 175,733 | | | | 525,466 | | | | 910,437 | |
Distributions reinvested | | | 3,256 | | | | 144,930 | | | | 232,060 | |
Redeemed | | | (379,313 | ) | | | (986,315 | ) | | | (856,293 | ) |
| | | | | | | | | | | | |
Net increase/(decrease) in shares outstanding | | | (200,324 | ) | | | (315,919 | ) | | | 286,204 | |
| | | | | | | | | | | | |
(a) Amount has been restated. See Note 2 to December 31, 2005 Financial Statements.
| | | | |
| June 30, 2006 | | 66 | | See Notes to Financial Statements |
Statement of Changes in Net Assets
| | | | | | | | | | | | |
| | | FORWARD EMERALD GROWTH FUND | |
| | | SIX MONTHS ENDED
JUNE 30, 2006 (UNAUDITED) | | | SIX MONTHS ENDED
DECEMBER 31, 2005 | | | YEAR ENDED
JUNE 30, 2005 | |
| OPERATIONS: | | | | | | | | | | | | |
Net investment loss | | $ | (1,058,639 | ) | | $ | (929,230 | ) | | $ | (1,874,331 | ) |
Net realized gain on investments | | | 14,078,311 | | | | 5,254,272 | | | | 3,714,337 | |
Net change in unrealized appreciation on investments | | | 5,609,215 | | | | 11,403,665 | | | | 169,849 | |
| | | | | | | | | | | | |
Net increase in net assets resulting from operations | | | 18,628,887 | | | | 15,728,707 | | | | 2,009,855 | |
| | | | | | | | | | | | |
| DISTRIBUTIONS TO SHAREHOLDERS: | | | | | | | | | | | | |
From net realized gains on investments | | | | | | | | | | | | |
Class A | | | 0 | | | | (8,074,838 | ) | | | (2,630,169 | ) |
Class C | | | 0 | | | | (625,150 | ) | | | (325,503 | ) |
| | | | | | | | | | | | |
Total distributions | | | 0 | | | | (8,699,988 | ) | | | (2,955,672 | ) |
| | | | | | | | | | | | |
| SHARE TRANSACTIONS: | | | | | | | | | | | | |
| CLASS A | | | | | | | | | | | | |
Proceeds from sale of shares | | | 29,694,190 | | | | 17,022,352 | | | | 65,162,367 | |
Issued to shareholders in reinvestment of distributions | | | 0 | | | | 5,255,650 | | | | 2,443,099 | |
Cost of shares redeemed, net of redemption fees (Note 7) | | | (27,062,377 | ) | | | (15,984,977 | ) | | | (33,965,754 | ) |
| | | | | | | | | | | | |
Net increase from share transactions | | | 2,631,813 | | | | 6,293,025 | | | | 33,639,712 | |
| | | | | | | | | | | | |
| CLASS C | | | | | | | | | | | | |
Proceeds from sale of shares | | | 500,247 | | | | 444,804 | | | | 1,419,286 | |
Issued to shareholders in reinvestment of distributions | | | 0 | | | | 553,045 | | | | 287,362 | |
Cost of shares redeemed, net of redemption fees (Note 7) | | | (1,625,433 | ) | | | (1,667,584 | ) | | | (3,374,467 | ) |
| | | | | | | | | | | | |
Net decrease from share transactions | | | (1,125,186 | ) | | | (669,735 | ) | | | (1,667,819 | ) |
| | | | | | | | | | | | |
Net increase in net assets | | $ | 20,135,514 | | | $ | 12,652,009 | | | $ | 31,026,076 | |
| | | | | | | | | | | | |
| NET ASSETS: | | | | | | | | | | | | |
Beginning of period | | | 169,343,075 | | | | 156,691,066 | | | | 125,664,990 | |
| | | | | | | | | | | | |
End of period (including accumulated net investment loss of $(1,058,639), $0 and $0, respectively) | | $ | 189,478,589 | | | $ | 169,343,075 | | | $ | 156,691,066 | |
| | | | | | | | | | | | |
| Other Information: | | | | | | | | | | | | |
| SHARE TRANSACTIONS: | | | | | | | | | | | | |
| CLASS A | | | | | | | | | | | | |
Sold | | | 1,947,766 | | | | 1,261,758 | | | | 5,083,947 | |
Distributions reinvested | | | 0 | | | | 390,288 | | | | 220,696 | |
Redeemed | | | (1,802,060 | ) | | | (1,186,341 | ) | | | (2,746,701 | ) |
| | | | | | | | | | | | |
Net increase in shares outstanding | | | 145,706 | | | | 465,705 | | | | 2,557,942 | |
| | | | | | | | | | | | |
| CLASS C | | | | | | | | | | | | |
Sold | | | 34,157 | | | | 34,248 | | | | 119,823 | |
Distributions reinvested | | | 0 | | | | 42,582 | | | | 26,657 | |
Redeemed | | | (112,964 | ) | | | (127,716 | ) | | | (279,651 | ) |
| | | | | | | | | | | | |
Net decrease in shares outstanding | | | (78,807 | ) | | | (50,886 | ) | | | (133,171 | ) |
| | | | | | | | | | | | |
| | | | |
| See Notes to Financial Statements | | 67 | | June 30, 2006 |
Statement of Changes in Net Assets
| | | | | | | | |
| | | FORWARD HOOVER SMALL CAP EQUITY FUND | |
| | | SIX MONTHS ENDED
JUNE 30, 2006 (UNAUDITED) | | | YEAR ENDED
DECEMBER 31, 2005 | |
| OPERATIONS: | | | | | | | | |
Net investment loss | | $ | (1,610,022 | ) | | $ | (2,528,304 | ) |
Net realized gain on investments | | | 21,994,410 | | | | 17,724,942 | |
Net change in unrealized appreciation/(depreciation) on investments | | | (7,843,538 | ) | | | 14,337,667 | |
| | | | | | | | |
Net increase in net assets resulting from operations | | | 12,540,850 | | | | 29,534,305 | |
| | | | | | | | |
| DISTRIBUTIONS TO SHAREHOLDERS: | | | | | | | | |
From net realized gains on investments | | | | | | | | |
Investor Class | | | 0 | | | | (12,526,784 | ) |
Institutional Class | | | 0 | | | | (1,456,466 | ) |
Class A | | | 0 | | | | (973,071 | ) |
| | | | | | | | |
Total distributions | | | 0 | | | | (14,956,321 | ) |
| | | | | | | | |
| SHARE TRANSACTIONS: | | | | | | | | |
| INVESTOR CLASS | | | | | | | | |
Proceeds from sale of shares | | | 160,951,381 | | | | 240,899,990 | |
Issued to shareholders in reinvestment of distributions | | | 0 | | | | 11,991,950 | |
Cost of shares redeemed, net of redemption fees (Note 7) | | | (72,751,877 | ) | | | (126,598,951 | ) |
| | | | | | | | |
Net increase from share transactions | | | 88,199,504 | | | | 126,292,989 | |
| | | | | | | | |
| INSTITUTIONAL CLASS | | | | | | | | |
Proceeds from sale of shares | | | 20,376,835 | | | | 24,871,831 | |
Issued to shareholders in reinvestment of distributions | | | 0 | | | | 1,453,098 | |
Cost of shares redeemed, net of redemption fees (Note 7) | | | (2,577,192 | ) | | | (4,383,075 | ) |
| | | | | | | | |
Net increase from share transactions | | | 17,799,643 | | | | 21,941,854 | |
| | | | | | | | |
| CLASS A | | | | | | | | |
Proceeds from sale of shares | | | 998,157 | | | | 20,113,667 | |
Issued to shareholders in reinvestment of distributions | | | 0 | | | | 9,956 | |
Cost of shares redeemed, net of redemption fees (Note 7) | | | (5,003,219 | ) | | | 0 | |
| | | | | | | | |
Net increase/(decrease) from share transactions | | | (4,005,062 | ) | | | 20,123,623 | |
| | | | | | | | |
Net increase in net assets | | $ | 114,534,935 | | | $ | 182,936,450 | |
| | | | | | | | |
| NET ASSETS: | | | | | | | | |
Beginning of period | | | 380,657,370 | | | | 197,720,920 | |
| | | | | | | | |
End of period (including accumulated net investment loss of $(1,610,022) and $0, respectively) | | $ | 495,192,305 | | | $ | 380,657,370 | |
| | | | | | | | |
| Other Information: | | | | | | | | |
| SHARE TRANSACTIONS: | | | | | | | | |
| INVESTOR CLASS | | | | | | | | |
Sold | | | 7,588,186 | | | | 12,864,804 | |
Distributions reinvested | | | 0 | | | | 620,911 | |
Redeemed | | | (3,485,065 | ) | | | (6,982,750 | ) |
| | | | | | | | |
Net increase in shares outstanding | | | 4,103,121 | | | | 6,502,965 | |
| | | | | | | | |
| INSTITUTIONAL CLASS | | | | | | | | |
Sold | | | 957,542 | | | | 1,330,628 | |
Distributions reinvested | | | 0 | | | | 73,874 | |
Redeemed | | | (117,233 | ) | | | (223,384 | ) |
| | | | | | | | |
Net increase in shares outstanding | | | 840,309 | | | | 1,181,118 | |
| | | | | | | | |
| CLASS A | | | | | | | | |
Sold | | | 46,521 | | | | 1,189,148 | |
Distributions reinvested | | | 0 | | | | 515 | |
Redeemed | | | (255,896 | ) | | | 0 | |
| | | | | | | | |
Net increase/(decrease) in shares outstanding | | | (209,375 | ) | | | 1,189,663 | |
| | | | | | | | |
| | | | |
| June 30, 2006 | | 68 | | See Notes to Financial Statements |
Statement of Changes in Net Assets
| | | | | | | | |
| | | FORWARD HOOVER MINI-CAP FUND | |
| | | SIX MONTHS ENDED
JUNE 30, 2006 (UNAUDITED) | | | YEAR ENDED
DECEMBER 31, 2005 | |
| OPERATIONS: | | | | | | | | |
Net investment loss | | $ | (100,087 | ) | | $ | (290,216 | ) |
Net realized gain on investments | | | 3,296,338 | | | | 4,019,729 | |
Net change in unrealized appreciation/(depreciation) on investments | | | (972,683 | ) | | | 910,005 | |
| | | | | | | | |
Net increase in net assets resulting from operations | | | 2,223,568 | | | | 4,639,518 | |
| | | | | | | | |
| DISTRIBUTIONS TO SHAREHOLDERS: | | | | | | | | |
From net realized gains on investments | | | | | | | | |
Investor Class | | | 0 | | | | (217,422 | ) |
Institutional Class | | | 0 | | | | (767,721 | ) |
| | | | | | | | |
Total distributions | | | 0 | | | | (985,143 | ) |
| | | | | | | | |
| SHARE TRANSACTIONS: | | | | | | | | |
| INVESTOR CLASS | | | | | | | | |
Proceeds from sale of shares | | | 5,460,329 | | | | 1,583,091 | |
Issued to shareholders in reinvestment of distributions | | | 0 | | | | 70,470 | |
Cost of shares redeemed, net of redemption fees (Note 7) | | | (3,033,156 | ) | | | (1,362,147 | ) |
| | | | | | | | |
Net increase from share transactions | | | 2,427,173 | | | | 291,414 | |
| | | | | | | | |
| INSTITUTIONAL CLASS | | | | | | | | |
Proceeds from sale of shares | | | 952,562 | | | | 8,380,445 | |
Issued to shareholders in reinvestment of distributions | | | 0 | | | | 204,634 | |
Cost of shares redeemed, net of redemption fees (Note 7) | | | (459,492 | ) | | | (5,129,997 | ) |
| | | | | | | | |
Net increase from share transactions | | | 493,070 | | | | 3,455,082 | |
| | | | | | | | |
Net increase in net assets | | $ | 5,143,811 | | | $ | 7,400,871 | |
| | | | | | | | |
| NET ASSETS: | | | | | | | | |
Beginning of period | | | 39,829,130 | | | | 32,428,259 | |
| | | | | | | | |
End of period (including accumulated net investment loss of $(100,087) and $0, respectively) | | $ | 44,972,941 | | | $ | 39,829,130 | |
| | | | | | | | |
| Other Information: | | | | | | | | |
| SHARE TRANSACTIONS: | | | | | | | | |
| INVESTOR CLASS | | | | | | | | |
Sold | | | 276,526 | | | | 94,322 | |
Distributions reinvested | | | 0 | | | | 3,957 | |
Redeemed | | | (163,994 | ) | | | (82,356 | ) |
| | | | | | | | |
Net increase in shares outstanding | | | 112,532 | | | | 15,923 | |
| | | | | | | | |
| INSTITUTIONAL CLASS | | | | | | | | |
Sold | | | 47,727 | | | | 515,622 | |
Distributions reinvested | | | 0 | | | | 11,330 | |
Redeemed | | | (23,825 | ) | | | (312,142 | ) |
| | | | | | | | |
Net increase in shares outstanding | | | 23,902 | | | | 214,810 | |
| | | | | | | | |
| | | | |
| See Notes to Financial Statements | | 69 | | June 30, 2006 |
Statement of Changes in Net Assets
| | | | | | | | |
| | | FORWARD LEGATO FUND(a) | |
| | | SIX MONTHS ENDED
JUNE 30, 2006 (UNAUDITED) | | | PERIOD ENDED
DECEMBER 31, 2005 | |
| OPERATIONS: | | | | | | | | |
Net investment loss | | $ | (38,857 | ) | | $ | (60,712 | ) |
Net realized gain on investments | | | 186,871 | | | | 136,559 | |
Net change in unrealized appreciation on investments | | | 32,130 | | | | 725,405 | |
| | | | | | | | |
Net increase in net assets resulting from operations | | | 180,144 | | | | 801,252 | |
| | | | | | | | |
| DISTRIBUTIONS TO SHAREHOLDERS: | | | | | | | | |
From net realized gains on investments | | | 0 | | | | (20,513 | ) |
| | | | | | | | |
Total distributions | | | 0 | | | | (20,513 | ) |
| | | | | | | | |
| SHARE TRANSACTIONS: | | | | | | | | |
| CLASS A | | | | | | | | |
Proceeds from sale of shares | | | 1,450,090 | | | | 6,094,808 | |
Issued to shareholders in reinvestment of distributions | | | 0 | | | | 293 | |
| | | | | | | | |
Net increase from share transactions | | | 1,450,090 | | | | 6,095,101 | |
| | | | | | | | |
Net increase in net assets | | $ | 1,630,234 | | | $ | 6,875,840 | |
| | | | | | | | |
| NET ASSETS: | | | | | | | | |
Beginning of period | | | 6,875,840 | | | | — | |
| | | | | | | | |
End of period (including accumulated net investment income/(loss) of $(37,758) and $1,099, respectively) | | $ | 8,506,074 | | | $ | 6,875,840 | |
| | | | | | | | |
| Other Information: | | | | | | | | |
| SHARE TRANSACTIONS: | | | | | | | | |
| CLASS A | | | | | | | | |
Sold | | | 122,087 | | | | 608,697 | |
Distributions reinvested | | | 0 | | | | 26 | |
| | | | | | | | |
Net increase in shares outstanding | | | 122,087 | | | | 608,723 | |
| | | | | | | | |
(a) The Forward Legato Fund commenced operations on April 1, 2005
| | | | |
| June 30, 2006 | | 70 | | See Notes to Financial Statements |
Financial Highlights
For a share outstanding throughout the periods presented.
Forward International Equity Fund(a)
| | | | | | | | | | | | | | | | | | | | | | | | |
| | | INVESTOR CLASS | |
| | | SIX MONTHS
ENDED
JUNE 30, 2006
(UNAUDITED) | | | YEAR ENDED
DECEMBER 31,
2005 | | | YEAR ENDED
DECEMBER 31,
2004 | | | YEAR ENDED
DECEMBER 31,
2003 | | | YEAR ENDED
DECEMBER 31,
2002 | | | YEAR ENDED
DECEMBER 31,
2001 | |
NET ASSET VALUE, BEGINNING OF PERIOD | | $ | 15.01 | | | $ | 12.78 | | | $ | 11.31 | | | $ | 8.21 | | | $ | 9.63 | | | $ | 12.18 | |
INCOME/(LOSS) FROM OPERATIONS: | | | | | | | | | | | | | | | | | | | | | | | | |
Net investment income/(loss) | | | 0.12 | | | | 0.05 | | | | (0.02 | ) | | | (0.01 | ) | | | (0.04 | ) | | | (0.04 | ) |
Net realized and unrealized gain/(loss) on investments | | | 1.65 | | | | 2.19 | | | | 1.49 | | | | 3.11 | | | | (1.38 | ) | | | (2.51 | ) |
| | | | | | | | | | | | | | | | | | | | | | | | |
Total from Investment Operations | | | 1.77 | | | | 2.24 | | | | 1.47 | | | | 3.10 | | | | (1.42 | ) | | | (2.55 | ) |
| | | | | | | | | | | | | | | | | | | | | | | | |
LESS DISTRIBUTIONS: | | | | | | | | | | | | | | | | | | | | | | | | |
From net investment income | | | — | | | | (0.01 | ) | | | — | | | | — | | | | — | | | | — | |
| | | | | | | | | | | | | | | | | | | | | | | | |
Total Distributions | | | — | | | | (0.01 | ) | | | — | | | | — | | | | — | | | | — | |
| | | | | | | | | | | | | | | | | | | | | | | | |
REDEMPTION FEES ADDED TO PAID IN CAPITAL (NOTE 7) | | | — | (b) | | | — | (b) | | | — | (b) | | | — | (b) | | | — | (b) | | | — | |
| | | | | | | | | | | | | | | | | | | | | | | | |
NET INCREASE/(DECREASE) IN NET ASSET VALUE | | | 1.77 | | | | 2.23 | | | | 1.47 | | | | 3.10 | | | | (1.42 | ) | | | (2.55 | ) |
| | | | | | | | | | | | | | | | | | | | | | | | |
NET ASSET VALUE, END OF PERIOD | | $ | 16.78 | | | $ | 15.01 | | | $ | 12.78 | | | $ | 11.31 | | | $ | 8.21 | | | $ | 9.63 | |
| | | | | | | | | | | | | | | | | | | | | | | | |
TOTAL RETURN | | | 11.79 | %(c) | | | 17.50 | % | | | 13.00 | % | | | 37.76 | % | | | (14.75 | )% | | | (20.94 | )% |
RATIOS/SUPPLEMENTAL DATA: | | | | | | | | | | | | | | | | | | | | | | | | |
Net Assets, End of Period (000’s) | | $ | 28,806 | | | $ | 24,880 | | | $ | 24,204 | | | $ | 21,189 | | | $ | 15,322 | | | $ | 17,979 | |
RATIOS TO AVERAGE NET ASSETS: | | | | | | | | | | | | | | | | | | | | | | | | |
Net investment income/(loss) including reimbursement/waiver | | | 1.52 | %(d) | | | 0.37 | % | | | (0.20 | )% | | | (0.16 | )% | | | (0.44 | )% | | | (0.33 | )% |
Operating expenses including reimbursement/waiver | | | 1.54 | %(d)(f) | | | 1.69 | % | | | 1.71 | %(f) | | | 1.99 | % | | | 1.95 | % | | | 1.68 | % |
Operating expenses excluding reimbursement/waiver | | | 1.77 | %(d) | | | 2.28 | % | | | 2.09 | % | | | 2.48 | % | | | 2.43 | % | | | 2.47 | % |
PORTFOLIO TURNOVER RATE | | | 42 | %(c) | | | 138 | % | | | 50 | % | | | 25 | % | | | 37 | % | | | 64 | % |
(a) Prior to September 1, 2005, the Forward International Equity Fund was known as the Forward Hansberger International Growth Fund.
(b) Amount represents less than $0.01 per share.
(c) Not Annualized.
(d) Annualized.
(e) Effective May 1, 2006, the net expense limitation changed from 1.69% to 1.29%.
(f) Effective January 26, 2004, the net expense limitation changed from 1.99% to 1.69%.
| | | | |
| See Notes to Financial Statements | | 71 | | June 30, 2006 |
Financial Highlights
For a share outstanding throughout the periods presented.
Forward International Small Companies Fund
| | | | | | | | | | | | | | | | | | | | |
| | | INVESTOR CLASS | |
| | | SIX MONTHS ENDED
JUNE 30, 2006 (UNAUDITED) | | | YEAR ENDED
DECEMBER 31,
2005 | | | YEAR ENDED
DECEMBER 31,
2004 | | | YEAR ENDED
DECEMBER 31,
2003(a) | | | PERIOD ENDED
DECEMBER 31,
2002(b) | |
NET ASSET VALUE, BEGINNING OF PERIOD | | $ | 15.11 | | | $ | 12.87 | | | $ | 10.39 | | | $ | 6.44 | | | $ | 7.34 | |
INCOME/(LOSS) FROM OPERATIONS: | | | | | | | | | | | | | | | | | | | | |
Net investment income | | | 0.08 | | | | 0.11 | (c) | | | 0.05 | (c) | | | 0.02 | (c) | | | 0.02 | (c) |
Net realized and unrealized gain/(loss) on investments | | | 1.55 | | | | 3.23 | | | | 2.59 | | | | 3.94 | | | | (0.90 | ) |
| | | | | | | | | | | | | | | | | | | | |
Total from Investment Operations | | | 1.63 | | | | 3.34 | | | | 2.64 | | | | 3.96 | | | | (0.88 | ) |
| | | | | | | | | | | | | | | | | | | | |
LESS DISTRIBUTIONS: | | | | | | | | | | | | | | | | | | | | |
From net investment income | | | — | | | | (0.08 | ) | | | (0.03 | ) | | | (0.02 | ) | | | (0.03 | ) |
From capital gains | | | — | | | | (1.02 | ) | | | (0.14 | ) | | | — | | | | — | |
| | | | | | | | | | | | | | | | | | | | |
Total Distributions | | | — | | | | (1.10 | ) | | | (0.17 | ) | | | (0.02 | ) | | | (0.03 | ) |
| | | | | | | | | | | | | | | | | | | | |
REDEMPTION FEES ADDED TO PAID IN CAPITAL (NOTE 7) | | | 0.01 | | | | — | (d) | | | 0.01 | | | | 0.01 | | | | 0.01 | |
| | | | | | | | | | | | | | | | | | | | |
NET INCREASE/(DECREASE) IN NET ASSET VALUE | | | 1.64 | | | | 2.24 | | | | 2.48 | | | | 3.95 | | | | (0.90 | ) |
| | | | | | | | | | | | | | | | | | | | |
NET ASSET VALUE, END OF PERIOD | | $ | 16.75 | | | $ | 15.11 | | | $ | 12.87 | | | $ | 10.39 | | | $ | 6.44 | |
| | | | | | | | | | | | | | | | | | | | |
TOTAL RETURN | | | 10.85 | %(e) | | | 26.57 | % | | | 25.55 | % | | | 61.64 | % | | | (11.82 | )%(e) |
RATIOS/SUPPLEMENTAL DATA: | | | | | | | | | | | | | | | | | | | | |
Net Assets, End of Period (000’s) | | $ | 188,153 | | | $ | 64,346 | | | $ | 9,819 | | | $ | 15,981 | | | $ | 312 | |
RATIOS TO AVERAGE NET ASSETS: | | | | | | | | | | | | | | | | | | | | |
Net investment income including reimbursement/waiver | | | 1.02 | %(f) | | | 0.82 | % | | | 0.47 | % | | | 0.24 | % | | | 0.27 | %(f) |
Operating expenses including reimbursement/waiver | | | 1.53 | %(f)(g) | | | 1.45 | % | | | 1.46 | %(h) | | | 1.45 | % | | | 1.45 | %(f) |
Operating expenses excluding reimbursement/waiver | | | 1.54 | %(f) | | | 1.84 | % | | | 2.26 | %(h) | | | 2.45 | % | | | 2.82 | %(f) |
PORTFOLIO TURNOVER RATE | | | 35 | %(e) | | | 91 | % | | | 175 | % | | | 52 | % | | | 133 | % |
(a) On December 23, 2003, the Forward International Small Companies Fund, a newly created fund, acquired all of the assets and assumed all of the liabilities of the Pictet International Small Companies Fund. The financial highlights for the periods presented previous to December 31, 2003 are that of the Pictet International Small Companies Fund. In addition, for the periods presented prior to December 31, 2003, the Investor Class of shares was known as the Retail Class.
(b) The Pictet International Small Companies Fund—Retail Class commenced operations on March 5, 2002.
(c) Per share numbers have been calculated using the average share method.
(d) Amount represents less than $0.01 per share.
(e) Not Annualized.
(f) Annualized.
(g) Effective January 2, 2006, the net expense limitation changed from 1.45% to 1.56%.
(h) The Fund incurred ReFlow fees during the year. If the ReFlow fees had been excluded, the ratios of expenses including reimbursement and excluding reimbursement to average net assets would have been 1.45% and 2.25%, respectively.
| | | | |
| June 30, 2006 | | 72 | | See Notes to Financial Statements |
Financial Highlights
For a share outstanding throughout the periods presented.
Forward International Small Companies Fund
| | | | | | | | | | | | | | | | | | | | | | | | |
| | | INSTITUTIONAL CLASS | |
| | | SIX MONTHS ENDED
JUNE 30, 2006
(UNAUDITED) | | | YEAR ENDED
DECEMBER 31,
2005 | | | YEAR ENDED
DECEMBER 31,
2004 | | | YEAR ENDED
DECEMBER 31,
2003(a) | | | YEAR ENDED
DECEMBER 31,
2002 | | | YEAR ENDED
DECEMBER 31,
2001 | |
NET ASSET VALUE, BEGINNING OF PERIOD | | $ | 15.15 | | | $ | 12.89 | | | $ | 10.40 | | | $ | 6.44 | | | $ | 7.35 | | | $ | 10.21 | |
INCOME/(LOSS) FROM OPERATIONS: | | | | | | | | | | | | | | | | | | | | | | | | |
Net investment income | | | 0.11 | | | | 0.16 | (b) | | | 0.08 | (b) | | | 0.04 | (b) | | | 0.04 | (b) | | | 0.01 | |
Net realized and unrealized gain/(loss) on investments | | | 1.55 | | | | 3.23 | | | | 2.61 | | | | 3.94 | | | | (0.92 | ) | | | (2.87 | ) |
| | | | | | | | | | | | | | | | | | | | | | | | |
Total from Investment Operations | | | 1.66 | | | | 3.39 | | | | 2.69 | | | | 3.98 | | | | (0.88 | ) | | | (2.86 | ) |
| | | | | | | | | | | | | | | | | | | | | | | | |
LESS DISTRIBUTIONS: | | | | | | | | | | | | | | | | | | | | | | | | |
From net investment income | | | — | | | | (0.11 | ) | | | (0.07 | ) | | | (0.03 | ) | | | (0.04 | ) | | | — | |
From capital gains | | | — | | | | (1.02 | ) | | | (0.14 | ) | | | — | | | | — | | | | (0.01 | ) |
| | | | | | | | | | | | | | | | | | | | | | | | |
Total Distributions | | | — | | | | (1.13 | ) | | | (0.21 | ) | | | (0.03 | ) | | | (0.04 | ) | | | (0.01 | ) |
| | | | | | | | | | | | | | | | | | | | | | | | |
REDEMPTION FEES ADDED TO PAID IN CAPITAL
(NOTE 7) | | | 0.01 | | | | — | (c) | | | 0.01 | | | | 0.01 | | | | 0.01 | | | | 0.01 | |
| | | | | | | | | | | | | | | | | | | | | | | | |
NET INCREASE/(DECREASE) IN NET ASSET VALUE | | | 1.67 | | | | 2.26 | | | | 2.49 | | | | 3.96 | | | | (0.91 | ) | | | (2.86 | ) |
| | | | | | | | | | | | | | | | | | | | | | | | |
NET ASSET VALUE, END OF PERIOD | | $ | 16.82 | | | $ | 15.15 | | | $ | 12.89 | | | $ | 10.40 | | | $ | 6.44 | | | $ | 7.35 | |
| | | | | | | | | | | | | | | | | | | | | | | | |
TOTAL RETURN | | | 11.02 | %(d) | | | 26.81 | % | | | 25.99 | % | | | 61.95 | % | | | (11.87 | )% | | | (27.95 | )% |
RATIOS/SUPPLEMENTAL DATA: | | | | | | | | | | | | | | | | | | | | | | | | |
Net Assets, End of Period (000’s) | | $ | 243,334 | | | $ | 144,302 | | | $ | 49,068 | | | $ | 26,221 | | | $ | 22,251 | | | $ | 21,934 | |
RATIOS TO AVERAGE NET ASSETS: | | | | | | | | | | | | | | | | | | | | | | | | |
Net investment income including reimbursement/waiver | | | 1.36 | %(e) | | | 1.12 | % | | | 0.75 | % | | | 0.49 | % | | | 0.52 | % | | | 0.17 | % |
Operating expenses including reimbursement/waiver | | | 1.18 | %(e)(f) | | | 1.20 | % | | | 1.21 | %(g) | | | 1.20 | % | | | 1.20 | % | | | 1.20 | % |
Operating expenses excluding reimbursement/waiver | | | 1.19 | %(e) | | | 1.46 | % | | | 2.12 | %(g) | | | 2.20 | % | | | 2.57 | % | | | 2.28 | % |
PORTFOLIO TURNOVER RATE | | | 35 | %(d) | | | 91 | % | | | 175 | % | | | 52 | % | | | 133 | % | | | 122 | % |
(a) On December 23, 2003, the Forward International Small Companies Fund, a newly created fund, acquired all of the assets and assumed all of the liabilities of the Pictet International Small Companies Fund. The financial highlights for the periods presented previous to December 31, 2003 are that of the Pictet International Small Companies Fund.
(b) Per share numbers have been calculated using the average share method.
(c) Amount represents less than $0.01 per share.
(d) Not Annualized.
(e) Annualized.
(f) Effective January 2, 2006, the net expense limitation changed from 1.20% to 1.26%.
(g) The Fund incurred ReFlow fees during the year. If the ReFlow fees had been excluded, the ratios of expenses including reimbursement and excluding reimbursement to average net assets would have been 1.20% and 2.11%, respectively.
| | | | |
| See Notes to Financial Statements | | 73 | | June 30, 2006 |
Financial Highlights
For a share outstanding throughout the periods presented.
Forward International Small Companies Fund
| | | | | | |
| | | CLASS A | |
| | | SIX MONTHS ENDED
JUNE 30, 2006
(UNAUDITED) | | | PERIOD ENDED
DECEMBER 31, 2005(a) | |
| | | | | | |
| NET ASSET VALUE, BEGINNING OF PERIOD | | $15.06 | | | $13.13 | |
| INCOME FROM OPERATIONS: | | | | | | |
Net investment income | | 0.09 | | | 0.13 | (b) |
Net realized and unrealized gain on investments | | 1.56 | | | 2.90 | |
| | | | | | |
Total from Investment Operations | | 1.65 | | | 3.03 | |
| | | | | | |
| LESS DISTRIBUTIONS: | | | | | | |
From net investment income | | — | | | (0.08 | ) |
From capital gains | | — | | | (1.02 | ) |
| | | | | | |
Total Distributions | | — | | | (1.10 | ) |
| | | | | | |
| REDEMPTION FEES ADDED TO PAID IN CAPITAL (NOTE 7) | | 0.01 | | | — | (c) |
| | | | | | |
| NET INCREASE IN NET ASSET VALUE | | 1.66 | | | 1.93 | |
| | | | | | |
| NET ASSET VALUE, END OF PERIOD | | $16.72 | | | $15.06 | |
| | | | | | |
| TOTAL RETURN(d) | | 11.02 | %(e) | | 23.78 | %(e) |
| RATIOS/SUPPLEMENTAL DATA: | | | | | | |
Net Assets, End of Period (000’s) | | $5,310 | | | $5,065 | |
| RATIOS TO AVERAGE NET ASSETS: | | | | | | |
Net investment income including reimbursement/waiver | | 1.11 | %(f) | | 0.51 | %(f) |
Operating expenses including reimbursement/waiver | | 1.43 | %(f)(g) | | 1.78 | %(f) |
Operating expenses excluding reimbursement/waiver | | 1.44 | %(f) | | 1.82 | %(f) |
| PORTFOLIO TURNOVER RATE | | 35 | %(e) | | 91 | % |
(a) The Fund began offering Class A shares on May 2, 2005.
(b) Per share numbers have been calculated using the average share method.
(c) Amount represents less than $0.01 per share.
(d) Total return assumes dividend reinvestment and does not reflect the effect of sales charges.
(e) Not Annualized.
(f) Annualized.
(g) Effective January 2, 2006, the net expense limitation changed from 1.78% to 1.56%.
| | | | |
| June 30, 2006 | | 74 | | See Notes to Financial Statements |
Financial Highlights
For a share outstanding throughout the periods presented.
Forward Global Emerging Markets Fund
| | | | | | | | | | | | | | | | |
| | | INVESTOR CLASS | |
| | | SIX MONTHS ENDED
JUNE 30, 2006
(UNAUDITED) | | | YEAR ENDED
DECEMBER 31,
2005 | | | YEAR ENDED
DECEMBER 31,
2004(a) | | | PERIOD ENDED
DECEMBER 31,
2003(b) | |
| NET ASSET VALUE, BEGINNING OF PERIOD | | $ | 18.83 | | | $ | 14.21 | | | $ | 11.86 | | | $ | 6.98 | |
| INCOME/(LOSS) FROM OPERATIONS: | | | | | | | | | | | | | | | | |
Net investment income | | | 0.06 | | | | 0.27 | | | | 0.21 | | | | — | (c) |
Net realized and unrealized gain/(loss) on investments | | | 0.59 | | | | 4.61 | | | | 2.35 | | | | 4.94 | |
| | | | | | | | | | | | | | | | |
Total from Investment Operations | | | 0.65 | | | | 4.88 | | | | 2.56 | | | | 4.94 | |
| | | | | | | | | | | | | | | | |
| LESS DISTRIBUTIONS: | | | | | | | | | | | | | | | | |
From net investment income | | | — | | | | (0.26 | ) | | | (0.22 | ) | | | (0.06 | ) |
| | | | | | | | | | | | | | | | |
Total Distributions | | | — | | | | (0.26 | ) | | | (0.22 | ) | | | (0.06 | ) |
| | | | | | | | | | | | | | | | |
| REDEMPTION FEES ADDED TO PAID IN CAPITAL (NOTE 7) | | | 0.01 | | | | — | (c) | | | 0.01 | | | | — | (c) |
| | | | | | | | | | | | | | | | |
| NET INCREASE/(DECREASE) IN NET ASSET VALUE | | | 0.66 | | | | 4.62 | | | | 2.35 | | | | 4.88 | |
| | | | | | | | | | | | | | | | |
| NET ASSET VALUE, END OF PERIOD | | $ | 19.49 | | | $ | 18.83 | | | $ | 14.21 | | | $ | 11.86 | |
| | | | | | | | | | | | | | | | |
| TOTAL RETURN | | | 3.51 | %(d) | | | 34.36 | % | | | 22.06 | % | | | 70.83 | %(d) |
| RATIOS/SUPPLEMENTAL DATA: | | | | | | | | | | | | | | | | |
Net Assets, End of Period (000’s) | | $ | 13,247 | | | $ | 8,833 | | | $ | 969 | | | $ | 227 | |
| RATIOS TO AVERAGE NET ASSETS: | | | | | | | | | | | | | | | | |
Net investment income/(loss) including reimbursement/waiver | | | 0.78 | %(e) | | | 2.57 | % | | | (0.32 | )% | | | 0.66 | %(e) |
Operating expenses including reimbursement/waiver | | | 1.83 | %(e)(f) | | | 1.95 | % | | | 1.98 | %(g) | | | 1.95 | %(e) |
Operating expenses excluding reimbursement/waiver | | | 2.24 | %(e) | | | 3.04 | % | | | 3.29 | %(g) | | | 2.48 | %(e) |
| PORTFOLIO TURNOVER RATE | | | 44 | %(d) | | | 62 | % | | | 45 | % | | | 44 | % |
(a) On September 16, 2004, the Forward Global Emerging Markets Fund, a newly created fund, acquired all of the assets and assumed all of the liabilities of the Pictet Global Emerging Markets Fund. The financial highlights for the periods presented previous to December 31, 2004 are that of the Pictet Global Emerging Markets Fund. In addition, for the periods presented prior to December 31, 2004, the Investor Class of shares was known as the Retail Class.
(b) The Pictet Global Emerging Markets Fund—Retail Class commenced operations on April 9, 2003.
(c) Amount represents less than $0.01 per share.
(d) Not Annualized.
(e) Annualized.
(f) Effective January 2, 2006, the net expense limitation changed from 1.95% to 1.89%. Effective May 1, 2006, the net expense limitation changed from 1.89% to 1.39%.
(g) The Fund incurred ReFlow fees during the year. If the ReFlow fees had been excluded, the ratios of expenses including reimbursement and excluding reimbursement to average net assets would have been 1.95% and 3.25%, respectively.
| | | | |
| See Notes to Financial Statements | | 75 | | June 30, 2006 |
Financial Highlights
For a share outstanding throughout the periods presented.
Forward Global Emerging Markets Fund
| | | | | | | | | | | | | | | | | | | | | | | | |
| | | INSTITUTIONAL CLASS | |
| | | SIX MONTHS ENDED
JUNE 30, 2006
(UNAUDITED) | | | YEAR ENDED
DECEMBER 31,
2005 | | | YEAR ENDED
DECEMBER 31,
2004(a) | | | YEAR ENDED
DECEMBER 31,
2003 | | | YEAR ENDED
DECEMBER 31,
2002 | | | YEAR ENDED
DECEMBER 31,
2001 | |
NET ASSET VALUE, BEGINNING OF PERIOD | | $ | 18.88 | | | $ | 14.23 | | | $ | 11.88 | | | $ | 6.92 | | | $ | 6.89 | | | $ | 7.02 | |
INCOME/(LOSS) FROM OPERATIONS: | | | | | | | | | | | | | | | | | | | | | | | | |
Net investment loss | | | 0.11 | | | | 0.33 | | | | 0.23 | | | | 0.08 | | | | 0.01 | | | | 0.10 | |
Net realized and unrealized gain/(loss) on investments | | | 0.56 | | | | 4.62 | | | | 2.36 | | | | 4.95 | | | | 0.03 | | | | (0.15 | ) |
| | | | | | | | | | | | | | | | | | | | | | | | |
Total from Investment Operations | | | 0.67 | | | | 4.95 | | | | 2.59 | | | | 5.03 | | | | 0.04 | | | | (0.05 | ) |
| | | | | | | | | | | | | | | | | | | | | | | | |
LESS DISTRIBUTIONS: | | | | | | | | | | | | | | | | | | | | | | | | |
From net investment income | | | — | | | | (0.30 | ) | | | (0.25 | ) | | | (0.07 | ) | | | (0.01 | ) | | | (0.08 | ) |
| | | | | | | | | | | | | | | | | | | | | | | | |
Total Distributions | | | — | | | | (0.30 | ) | | | (0.25 | ) | | | (0.07 | ) | | | (0.01 | ) | | | (0.08 | ) |
| | | | | | | | | | | | | | | | | | | | | | | | |
REDEMPTION FEES ADDED TO PAID IN CAPITAL (NOTE 7) | | | 0.01 | | | | — | (b) | | | 0.01 | | | | — | (b) | | | — | (b) | | | — | |
| | | | | | | | | | | | | | | | | | | | | | | | |
NET INCREASE/(DECREASE) IN NET ASSET VALUE | | | 0.68 | | | | 4.65 | | | | 2.35 | | | | 4.96 | | | | 0.03 | | | | (0.13 | ) |
| | | | | | | | | | | | | | | | | | | | | | | | |
NET ASSET VALUE, END OF PERIOD | | $ | 19.56 | | | $ | 18.88 | | | $ | 14.23 | | | $ | 11.88 | | | $ | 6.92 | | | $ | 6.89 | |
| | | | | | | | | | | | | | | | | | | | | | | | |
TOTAL RETURN | | | 3.60 | %(c) | | | 34.79 | % | | | 22.26 | % | | | 72.72 | % | | | 0.60 | % | | | (0.68 | )% |
RATIOS/SUPPLEMENTAL DATA: | | | | | | | | | | | | | | | | | | | | | | | | |
Net Assets, End of Period (000’s) | | $ | 33,653 | | | $ | 28,765 | | | $ | 18,854 | | | $ | 116,774 | | | $ | 67,509 | | | $ | 66,711 | |
RATIOS TO AVERAGE NET ASSETS: | | | | | | | | | | | | | | | | | | | | | | | | |
Net investment income including reimbursement/waiver | | | 1.08 | %(d) | | | 2.34 | % | | | 0.63 | % | | | 0.91 | % | | | 0.16 | % | | | 1.12 | % |
Operating expenses including reimbursement/waiver | | | 1.54 | %(d)(e) | | | 1.70 | % | | | 1.70 | %(f) | | | 1.70 | % | | | 1.70 | % | | | 1.70 | % |
Operating expenses excluding reimbursement/waiver | | | 1.90 | %(d) | | | 2.84 | % | | | 2.38 | %(f) | | | 2.23 | % | | | 2.31 | % | | | 2.22 | % |
PORTFOLIO TURNOVER RATE | | | 44 | %(c) | | | 62 | % | | | 45 | % | | | 44 | % | | | 47 | % | | | 84 | % |
(a) On September 16, 2004, the Forward Global Emerging Markets Fund, a newly created fund, acquired all of the assets and assumed all of the liabilities of the Pictet Global Emerging Markets Fund. The financial highlights for the periods presented previous to December 31, 2004 are that of the Pictet Global Emerging Markets Fund.
(b) Amount represents less than $0.01 per share.
(c) Not Annualized.
(d) Annualized.
(e) Effective January 2, 2006, the net expense limitation changed from 1.70% to 1.59%. Effective May 1, 2006, the net expense limitation changed from 1.59% to 1.39%.
(f) The Fund incurred ReFlow fees during the year. If the ReFlow fees had been excluded, the ratios of expenses including reimbursement and excluding reimbursement to average net assets would have been 1.70% and 2.37%, respectively.
| | | | |
| June 30, 2006 | | 76 | | See Notes to Financial Statements |
Financial Highlights
For a share outstanding throughout the periods presented.
Sierra Club Equity Income Fund(b)
| | | | | | | | | | | | | | | | |
| | | INVESTOR CLASS | |
| | | SIX MONTHS ENDED
JUNE 30, 2006
(UNAUDITED) | | | YEAR ENDED
DECEMBER 31,
2005(b) | | | YEAR ENDED
DECEMBER 31,
2004 | | | YEAR ENDED
DECEMBER 31,
2003(a) | |
| NET ASSET VALUE, BEGINNING OF PERIOD | | $ | 11.48 | | | $ | 12.05 | | | $ | 11.66 | | | $ | 10.00 | |
| INCOME/(LOSS) FROM OPERATIONS: | | | | | | | | | | | | | | | | |
Net investment income/(loss) | | | 0.07 | | | | 0.01 | | | | (0.02 | ) | | | (0.04 | ) |
Net realized and unrealized gain on investments | | | 0.04 | | | | 0.05 | | | | 1.09 | | | | 1.90 | |
| | | | | | | | | | | | | | | | |
Total from Investment Operations | | | 0.11 | | | | 0.06 | | | | 1.07 | | | | 1.86 | |
| | | | | | | | | | | | | | | | |
| LESS DISTRIBUTIONS: | | | | | | | | | | | | | | | | |
From net investment income | | | (0.07 | ) | | | (0.01 | ) | | | — | | | | — | |
From capital gains | | | — | | | | (0.62 | ) | | | (0.68 | ) | | | (0.20 | ) |
| | | | | | | | | | | | | | | | |
Total Distributions | | | (0.07 | ) | | | (0.63 | ) | | | (0.68 | ) | | | (0.20 | ) |
| | | | | | | | | | | | | | | | |
| REDEMPTION FEES ADDED TO PAID IN CAPITAL (NOTE 7) | | | — | (c) | | | — | (c) | | | — | (c) | | | — | (c) |
| | | | | | | | | | | | | | | | |
| NET INCREASE/(DECREASE) IN NET ASSET VALUE | | | 0.04 | | | | (0.57 | ) | | | 0.39 | | | | 1.66 | |
| | | | | | | | | | | | | | | | |
| NET ASSET VALUE, END OF PERIOD | | $ | 11.52 | | | $ | 11.48 | | | $ | 12.05 | | | $ | 11.66 | |
| | | | | | | | | | | | | | | | |
| TOTAL RETURN | | | 0.95 | %(d) | | | 0.49 | % | | | 9.18 | % | | | 18.65 | % |
| RATIOS/SUPPLEMENTAL DATA: | | | | | | | | | | | | | | | | |
Net Assets, End of Period (000’s) | | $ | 28,956 | | | $ | 30,146 | | | $ | 30,422 | | | $ | 26,882 | |
| RATIOS TO AVERAGE NET ASSETS: | | | | | | | | | | | | | | | | |
Net investment income/(loss) including reimbursement/waiver | | | 1.13 | %(e) | | | 0.12 | % | | | (0.18 | )% | | | (0.36 | )% |
Operating expenses including reimbursement/waiver | | | 1.57 | %(e) | | | 1.69 | % | | | 1.72 | %(f)(g) | | | 1.84 | % |
Operating expenses excluding reimbursement/waiver | | | 1.63 | %(e) | | | 1.87 | % | | | 2.01 | %(f) | | | 2.60 | % |
| PORTFOLIO TURNOVER RATE | | | 42 | %(d) | | | 89 | % | | | 79 | % | | | 62 | % |
(a) The Fund commenced operations on January 1, 2003.
(b) Prior to April 1, 2005, the Sierra Club Equity Income Fund was known as the Sierra Club Balanced Fund.
(c) Amount represents less than $0.01 per share.
(d) Not Annualized.
(e) Annualized.
(f) The Fund incurred ReFlow fees during the year. If the ReFlow fees had been excluded, the ratios of expenses including reimbursement and excluding reimbursement to average net assets would have been 1.71% and 2.00%, respectively.
(g) Effective January 26, 2004, the net expense limitation changed from 1.84% to 1.69%.
| | | | |
| See Notes to Financial Statements | | 77 | | June 30, 2006 |
Financial Highlights
For a share outstanding throughout the periods presented.
Sierra Club Stock Fund
| | | | | | | | | | | | | | | | | | | | | | | | |
| | | INVESTOR CLASS | |
| | | SIX MONTHS ENDED
JUNE 30, 2006 (UNAUDITED) | | | YEAR ENDED
DECEMBER 31,
2005 | | | YEAR ENDED
DECEMBER 31,
2004 | | | YEAR ENDED
DECEMBER 31,
2003 | | | YEAR ENDED
DECEMBER 31,
2002 | | | YEAR ENDED
DECEMBER 31,
2001 | |
NET ASSET VALUE, BEGINNING OF PERIOD | | $ | 11.92 | | | $ | 11.99 | | | $ | 10.39 | | | $ | 7.87 | | | $ | 10.32 | | | $ | 11.96 | |
INCOME/(LOSS) FROM OPERATIONS: | | | | | | | | | | | | | | | | | | | | | | | | |
Net investment income/(loss) | | | 0.00 | (a) | | | (0.08 | ) | | | (0.05 | ) | | | (0.05 | ) | | | (1.15 | ) | | | (0.02 | ) |
Net realized and unrealized gain/(loss) on investments | | | (0.22 | ) | | | 0.31 | | | | 1.74 | | | | 2.57 | | | | (1.30 | ) | | | (1.62 | ) |
| | | | | | | | | | | | | | | | | | | | | | | | |
Total from Investment Operations | | | (0.22 | ) | | | 0.23 | | | | 1.69 | | | | 2.52 | | | | (2.45 | ) | | | (1.64 | ) |
| | | | | | | | | | | | | | | | | | | | | | | | |
LESS DISTRIBUTIONS: | | | | | | | | | | | | | | | | | | | | | | | | |
From capital gains | | | — | | | | (0.30 | ) | | | (0.09 | ) | | | — | | | | — | | | | — | |
| | | | | | | | | | | | | | | | | | | | | | | | |
Total Distributions | | | — | | | | (0.30 | ) | | | (0.09 | ) | | | — | | | | — | | | | — | |
| | | | | | | | | | | | | | | | | | | | | | | | |
REDEMPTION FEES ADDED TO PAID IN CAPITAL (NOTE 7) | | | — | (a) | | | — | (a) | | | — | (a) | | | — | (a) | | | — | (a) | | | — | |
| | | | | | | | | | | | | | | | | | | | | | | | |
NET INCREASE/(DECREASE) IN NET ASSET VALUE | | | (0.22 | ) | | | (0.07 | ) | | | 1.60 | | | | 2.52 | | | | (2.45 | ) | | | (1.64 | ) |
| | | | | | | | | | | | | | | | | | | | | | | | |
NET ASSET VALUE, END OF PERIOD | | $ | 11.70 | | | $ | 11.92 | | | $ | 11.99 | | | $ | 10.39 | | | $ | 7.87 | | | $ | 10.32 | |
| | | | | | | | | | | | | | | | | | | | | | | | |
TOTAL RETURN | | | (1.85 | )%(b) | | | 1.95 | % | | | 16.23 | % | | | 32.02 | % | | | (23.74 | )% | | | (13.71 | )% |
RATIOS/SUPPLEMENTAL DATA: | | | | | | | | | | | | | | | | | | | | | | | | |
Net Assets, End of Period (000’s) | | $ | 26,653 | | | $ | 24,272 | | | $ | 20,201 | | | $ | 8,155 | | | $ | 518 | | | $ | 25,903 | |
RATIOS TO AVERAGE NET ASSETS: | | | | | | | | | | | | | | | | | | | | | | | | |
Net investment income/(loss) including reimbursement/waiver | | | 0.09 | %(c) | | | (0.72 | )% | | | (0.70 | )% | | | (0.95 | )% | | | (0.34 | )% | | | (0.15 | )% |
Operating expenses including reimbursement/waiver | | | 1.48 | %(c)(d) | | | 1.69 | % | | | 1.70 | %(e)(f) | | | 1.84 | % | | | 1.86 | % | | | 1.50 | % |
Operating expenses excluding reimbursement/waiver | | | 1.69 | %(c) | | | 2.29 | % | | | 2.70 | %(e) | | | 6.32 | % | | | 1.96 | % | | | 1.91 | % |
PORTFOLIO TURNOVER RATE | | | 74 | %(b) | | | 70 | % | | | 93 | % | | | 56 | % | | | 88 | % | | | 73 | % |
(a) Amount represents less than $0.01 per share.
(b) Not Annualized.
(c) Annualized.
(d) Effective January 2, 2006, the net expense limitation changed from 1.69% to 1.49%.
(e) The Fund incurred ReFlow fees during the year ended December 31, 2004. If the ReFlow fees had been excluded, the ratios of expenses including reimbursement and excluding reimbursement to average net assets would have been 1.70% and 2.70%, respectively.
(f) Effective January 26, 2004, the net expense limitation changed from 1.84% to 1.69%.
| | | | |
| June 30, 2006 | | 78 | | See Notes to Financial Statements |
Financial Highlights
For a share outstanding throughout the periods presented.
Sierra Club Stock Fund
| | | | | | | | |
| | | CLASS A | |
| | | SIX MONTHS ENDED
JUNE 30, 2006
(UNAUDITED) | | | PERIOD ENDED
DECEMBER 31,
2005(a) | |
| NET ASSET VALUE, BEGINNING OF PERIOD | | $ | 11.92 | | | $ | 10.78 | |
| INCOME/(LOSS) FROM OPERATIONS: | | | | | | | | |
Net investment income/(loss) | | | 0.01 | | | | (0.05 | ) |
Net realized and unrealized gain/(loss) on investments | | | (0.23 | ) | | | 1.49 | |
| | | | | | | | |
Total from Investment Operations | | | (0.22 | ) | | | 1.44 | |
| | | | | | | | |
| LESS DISTRIBUTIONS: | | | | | | | | |
From capital gains | | | — | | | | (0.30 | ) |
| | | | | | | | |
Total Distributions | | | — | | | | (0.30 | ) |
| | | | | | | | |
| REDEMPTION FEES ADDED TO PAID IN CAPITAL (NOTE 7) | | | — | (b) | | | — | (b) |
| | | | | | | | |
| NET INCREASE/(DECREASE) IN NET ASSET VALUE | | | (0.22 | ) | | | 1.14 | |
| | | | | | | | |
| NET ASSET VALUE, END OF PERIOD | | $ | 11.70 | | | $ | 11.92 | |
| | | | | | | | |
| TOTAL RETURN(c) | | | (1.85 | )%(d) | | | 13.39 | %(d) |
| RATIOS/SUPPLEMENTAL DATA: | | | | | | | | |
Net Assets, End of Period (000’s) | | $ | 5,433 | | | $ | 5,484 | |
| RATIOS TO AVERAGE NET ASSETS: | | | | | | | | |
Net investment income/(loss) including reimbursement/waiver | | | 0.09 | %(e) | | | (0.68 | )%(e) |
Operating expenses including reimbursement/waiver | | | 1.48 | %(e)(f) | | | 1.69 | %(e) |
Operating expenses excluding reimbursement/waiver | | | 1.64 | %(e) | | | 2.28 | %(e) |
| PORTFOLIO TURNOVER RATE | | | 74 | %(d) | | | 70 | % |
(a) The Fund began offering Class A shares on May 2, 2005.
(b) Amount represents less than $0.01 per share.
(c) Total return assumes dividend reinvestment and does not reflect the effect of sales charges.
(d) Not Annualized.
(e) Annualized.
(f) Effective January 2, 2006, the net expense limitation changed from 1.69% to 1.49%.
| | | | |
| See Notes to Financial Statements | | 79 | | June 30, 2006 |
Financial Highlights
For a share outstanding throughout the periods presented.
Forward Emerald Banking and Finance Fund
| | | | | | | | | | | | | | | | | | | | | | | | | | | | |
| | | CLASS A | |
| | | SIX MONTHS ENDED
JUNE 30, 2006 (UNAUDITED) | | | SIX MONTHS ENDED DECEMBER 31, 2005 | | | YEAR ENDED
JUNE 30, 2005 | | | YEAR ENDED
JUNE 30, 2004 | | | YEAR ENDED
JUNE 30, 2003 | | | YEAR ENDED
JUNE 30, 2002 | | | YEAR ENDED
JUNE 30, 2001 | |
NET ASSET VALUE, BEGINNING OF PERIOD | | $ | 27.61 | | | $ | 27.99 | | | $ | 25.74 | | | $ | 19.89 | | | $ | 18.36 | | | $ | 15.55 | | | $ | 11.20 | |
INCOME/(LOSS) FROM OPERATIONS: | | | | | | | | | | | | | | | | | | | | | | | | | | | | |
Net investment income/(loss) | | | 0.01 | | | | (0.01 | )(a) | | | (0.06 | )(a) | | | (0.03 | )(a) | | | 0.03 | (a) | | | 0.05 | (a) | | | 0.18 | (a) |
Net realized and unrealized gain on investments | | | 1.09 | | | | 1.49 | | | | 3.30 | | | | 6.07 | | | | 1.84 | | | | 3.01 | | | | 4.34 | |
| | | | | | | | | | | | | | | | | | | | | | | | | | | | |
Total from Investment Operations | | | 1.10 | | | | 1.48 | | | | 3.24 | | | | 6.04 | | | | 1.87 | | | | 3.06 | | | | 4.52 | |
| | | | | | | | | | | | | | | | | | | | | | | | | | | | |
LESS DISTRIBUTIONS: | | | | | | | | | | | | | | | | | | | | | | | | | | | | |
From net investment income | | | — | | | | — | | | | — | | | | (0.01 | ) | | | — | | | | (0.08 | ) | | | (0.17 | ) |
From capital gains | | | — | | | | (1.86 | ) | | | (0.99 | ) | | | (0.18 | ) | | | (0.34 | ) | | | (0.17 | ) | | | — | |
| | | | | | | | | | | | | | | | | | | | | | | | | | | | |
Total Distributions | | | — | | | | (1.86 | ) | | | (0.99 | ) | | | (0.19 | ) | | | (0.34 | ) | | | (0.25 | ) | | | (0.17 | ) |
| | | | | | | | | | | | | | | | | | | | | | | | | | | | |
REDEMPTION FEES ADDED TO PAID IN CAPITAL (NOTE 7) | | | — | (b) | | | — | | | | — | | | | — | | | | — | | | | — | | | | — | |
| | | | | | | | | | | | | | | | | | | | | | | | | | | | |
NET INCREASE/(DECREASE) IN NET ASSET VALUE | | | 1.10 | | | | (0.38 | ) | | | 2.25 | | | | 5.85 | | | | 1.53 | | | | 2.81 | | | | 4.35 | |
| | | | | | | | | | | | | | | | | | | | | | | | | | | | |
NET ASSET VALUE, END OF PERIOD | | $ | 28.71 | | | $ | 27.61 | | | $ | 27.99 | | | $ | 25.74 | | | $ | 19.89 | | | $ | 18.36 | | | $ | 15.55 | |
| | | | | | | | | | | | | | | | | | | | | | | | | | | | |
TOTAL RETURN(c) | | | 3.98 | %(d) | | | 5.31 | %(d) | | | 13.12 | % | | | 30.53 | % | | | 10.46 | % | | | 19.96 | % | | | 40.72 | % |
RATIOS/SUPPLEMENTAL DATA | | | | | | | | | | | | | | | | | | | | | | | | | | | | |
Net assets, end of period (in 000s) | | $ | 165,903 | | | $ | 184,550 | | | $ | 183,556 | | | $ | 133,136 | | | $ | 59,565 | | | $ | 34,933 | | | $ | 14,822 | |
RATIOS TO AVERAGE NETS ASSETS: | | | | | | | | | | | | | | | | | | | | | | | | | | | | |
Net investment income including reimbursement/waiver | | | n/a | (e) | | | n/a | (e) | | | n/a | (e) | | | n/a | (e) | | | n/a | (e) | | | n/a | (e) | | | 1.38 | % |
Net investment income/(loss) excluding reimbursement/waiver | | | 0.05 | %(f) | | | (0.10 | )%(f) | | | (0.23 | )% | | | (0.13 | )% | | | 0.20 | % | | | 0.28 | % | | | 0.79 | % |
Operating expenses including reimbursement/waiver | | | n/a | (e) | | | n/a | (e) | | | n/a | (e) | | | n/a | (e) | | | n/a | (e) | | | n/a | (e) | | | 2.35 | % |
Operating expenses excluding reimbursement/waiver | | | 1.62 | %(f) | | | 1.57 | %(f) | | | 1.80 | % | | | 1.74 | % | | | 1.97 | % | | | 2.26 | % | | | 2.94 | % |
PORTFOLIO TURNOVER RATE | | | 17 | %(d) | | | 15 | %(d) | | | 25 | % | | | 29 | % | | | 47 | % | | | 27 | % | | | 55 | % |
(a) Per share amounts calculated based on the average shares outstanding during the period.
(b) Amount represents less than $0.01 per share.
(c) Total return assumes dividend reinvestment and does not reflect the effect of sales charges.
(d) Not annualized.
(e) Not applicable, no reimbursements/waiver were made by the Advisor.
(f) Annualized.
| | | | |
| June 30, 2006 | | 80 | | See Notes to Financial Statements |
Financial Highlights
For a share outstanding throughout the periods presented.
Forward Emerald Banking and Finance Fund
| | | | | | | | | | | | | | | | | | | | | | | | | | | | |
| | | CLASS C | |
| | | SIX MONTHS ENDED
JUNE 30, 2006
(UNAUDITED) | | | SIX MONTHS ENDED
DECEMBER 31,
2005 | | | YEAR ENDED
JUNE 30,
2005 | | | YEAR ENDED
JUNE 30,
2004 | | | YEAR ENDED
JUNE 30,
2003 | | | YEAR ENDED
JUNE 30,
2002 | | | YEAR ENDED
JUNE 30,
2001(a) | |
NET ASSET VALUE, BEGINNING OF PERIOD | | $ | 26.73 | | | $ | 27.23 | | | $ | 25.23 | | | $ | 19.62 | | | $ | 18.24 | | | $ | 15.47 | | | $ | 11.20 | |
INCOME/(LOSS) FROM OPERATIONS: | | | | | | | | | | | | | | | | | | | | | | | | | | | | |
Net investment income/(loss) | | | (0.08 | ) | | | (0.10 | )(b) | | | (0.23 | )(b) | | | (0.18 | )(b) | | | (0.08 | )(b) | | | (0.06 | )(b) | | | 0.10 | (b) |
Net realized and unrealized gain/(loss) on investments | | | 1.05 | | | | 1.46 | | | | 3.22 | | | | 5.97 | | | | 1.80 | | | | 3.00 | | | | 4.34 | |
| | | | | | | | | | | | | | | | | | | | | | | | | | | | |
Total from Investment Operations | | | 0.97 | | | | 1.36 | | | | 2.99 | | | | 5.79 | | | | 1.72 | | | | 2.94 | | | | 4.44 | |
| | | | | | | | | | | | | | | | | | | | | | | | | | | | |
LESS DISTRIBUTIONS: | | | | | | | | | | | | | | | | | | | | | | | | | | | | |
From net investment income | | | — | | | | — | | | | — | | | | — | | | | — | | | | — | | | | (0.17 | ) |
From capital gains | | | — | | | | (1.86 | ) | | | (0.99 | ) | | | (0.18 | ) | | | (0.34 | ) | | | (0.17 | ) | | | — | |
| | | | | | | | | | | | | | | | | | | | | | | | | | | | |
Total Distributions | | | — | | | | (1.86 | ) | | | (0.99 | ) | | | (0.18 | ) | | | (0.34 | ) | | | (0.17 | ) | | | (0.17 | ) |
| | | | | | | | | | | | | | | | | | | | | | | | | | | | |
REDEMPTION FEES ADDED TO PAID IN CAPITAL (NOTE 7) | | | — | (c) | | | — | | | | — | | | | — | | | | — | | | | — | | | | — | |
| | | | | | | | | | | | | | | | | | | | | | | | | | | | |
NET INCREASE/(DECREASE) IN NET ASSET VALUE | | | 0.97 | | | | (0.50 | ) | | | 2.00 | | | | 5.61 | | | | 1.38 | | | | 2.77 | | | | 4.27 | |
| | | | | | | | | | | | | | | | | | | | | | | | | | | | |
NET ASSET VALUE, END OF PERIOD | | $ | 27.70 | | | $ | 26.73 | | | $ | 27.23 | | | $ | 25.23 | | | $ | 19.62 | | | $ | 18.24 | | | $ | 15.47 | |
| | | | | | | | | | | | | | | | | | | | | | | | | | | | |
TOTAL RETURN(d) | | | 3.63 | %(f) | | | 5.01 | %(f) | | | 12.37 | % | | | 29.68 | % | | | 9.69 | % | | | 19.22 | % | | | 40.00 | % |
RATIOS/SUPPLEMENTAL DATA | | | | | | | | | | | | | | | | | | | | | | | | | | | | |
Net assets, end of period (in 000s) | | $ | 111,470 | | | $ | 112,774 | | | $ | 107,804 | | | $ | 88,249 | | | $ | 27,482 | | | $ | 6,210 | | | $ | 513 | |
RATIOS TO AVERAGE NET ASSETS: | | | | | | | | | | | | | | | | | | | | | | | | | | | | |
Net investment income including reimbursement/waiver | | | n/a | (e) | | | n/a | (e) | | | n/a | (e) | | | n/a | (e) | | | n/a | (e) | | | n/a | (e) | | | 0.73 | % |
Net investment income/(loss) excluding reimbursement/waiver | | | (0.61 | )%(g) | | | (0.75 | )%(g) | | | (0.88 | )% | | | (0.77 | )% | | | (0.43 | )% | | | (0.37 | )% | | | 0.14 | % |
Operating expenses including reimbursement/waiver | | | n/a | (e) | | | n/a | (e) | | | n/a | (e) | | | n/a | (e) | | | n/a | (e) | | | n/a | (e) | | | 3.00 | % |
Operating expenses excluding reimbursement/waiver | | | 2.27 | %(g) | | | 2.22 | %(g) | | | 2.45 | % | | | 2.39 | % | | | 2.66 | % | | | 2.91 | % | | | 3.59 | % |
PORTFOLIO TURNOVER RATE | | | 17 | %(f) | | | 15 | %(f) | | | 25 | % | | | 29 | % | | | 47 | % | | | 27 | % | | | 55 | % |
(a) The Fund began offering Class C Shares on July 1, 2000.
(b) Per share amounts calculated based on the average shares outstanding during the period.
(c) Amount represents less than $0.01 per share.
(d) Total return assumes dividend reinvestment and does not reflect the effect of sales charges.
(e) Not applicable, no reimbursements/waiver were made by the Advisor.
(f) Not annualized.
(g) Annualized.
| | | | |
| See Notes to Financial Statements | | 81 | | June 30, 2006 |
Financial Highlights
For a share outstanding throughout the periods presented.
Forward Emerald Opportunities Fund
| | | | | | | | | | | | | | | | | | | | | |
| | | CLASS A | |
| | | SIX MONTHS ENDED
JUNE 30, 2006
(UNAUDITED) | | | SIX MONTHS ENDED
DECEMBER 31,
2005(a) | | | YEAR ENDED
JUNE 30,
2005(a) | | | YEAR ENDED
JUNE 30,
2004(a) | | | YEAR ENDED
JUNE 30,
2003(a) | | | YEAR ENDED
JUNE 30,
2002(a) | | | YEAR ENDED
JUNE 30,
2001(a) | |
NET ASSET VALUE, BEGINNING OF PERIOD | | $8.39 | | | $7.03 | | | $7.13 | | | $5.64 | | | $5.38 | | | $12.15 | | | $29.59 | |
INCOME/(LOSS) FROM OPERATIONS: | | | | | | | | | | | | | | | | | | | | | |
Net investment loss | | (0.05 | ) | | (0.08 | )(b) | | (0.17 | )(b) | | (0.19 | )(b) | | (0.12 | )(b) | | (0.20 | )(b) | | (0.43 | ) |
Net realized and unrealized gain/(loss) on investments | | 0.55 | | | 1.44 | | | 0.07 | | | 1.68 | | | 0.38 | | | (6.15 | ) | | (13.01 | ) |
| | | | | | | | | | | | | | | | | | | | | |
Total from Investment Operations | | 0.50 | | | 1.36 | | | (0.10 | ) | | 1.49 | | | 0.26 | | | (6.35 | ) | | (13.44 | ) |
| | | | | | | | | | | | | | | | | | | | | |
LESS DISTRIBUTIONS | | | | | | | | | | | | | | | | | | | | | |
From capital gains | | — | | | — | | | — | | | — | | | — | | | (0.42 | ) | | (4.00 | ) |
| | | | | | | | | | | | | | | | | | | | | |
Total Distributions | | — | | | — | | | — | | | — | | | — | | | (0.42 | ) | | (4.00 | ) |
| | | | | | | | | | | | | | | | | | | | | |
REDEMPTION FEES ADDED TO PAID IN CAPITAL (NOTE 7) | | — | (c) | | — | | | — | | | — | | | — | | | — | | | — | |
| | | | | | | | | | | | | | | | | | | | | |
NET INCREASE/(DECREASE) IN NET ASSET VALUE | | 0.50 | | | 1.36 | | | (0.10 | ) | | 1.49 | | | 0.26 | | | (6.77 | ) | | (17.44 | ) |
| | | | | | | | | | | | | | | | | | | | | |
NET ASSET VALUE, END OF PERIOD | | $8.89 | | | $8.39 | | | $7.03 | | | $7.13 | | | $5.64 | | | $5.38 | | | $12.15 | |
| | | | | | | | | | | | | | | | | | | | | |
TOTAL RETURN(d) | | 11.27 | %(e) | | 19.35 | %(e) | | (1.40 | )% | | 26.42 | % | | 4.83 | % | | (53.76 | )% | | (51.80 | )% |
RATIOS/SUPPLEMENTAL DATA | | | | | | | | | | | | | | | | | | | | | |
Net assets, end of period (in 000s) | | $8,695 | | | $6,004 | | | $2,793 | | | $3,202 | | | $2,572 | | | $3,132 | | | $8,054 | |
RATIOS TO AVERAGE NET ASSETS: | | | | | | | | | | | | | | | | | | | | | |
Net investment loss including reimbursement/waiver | | (1.30 | )%(f) | | (2.15 | )%(f) | | (2.62 | )% | | (2.65 | )% | | (2.69 | )% | | (2.50 | )% | | (2.25 | )% |
Net investment loss excluding reimbursement/waiver | | (1.55 | )%(f) | | (2.56 | )%(f) | | (2.76 | )% | | (2.67 | )% | | (4.78 | )% | | (4.26 | )% | | (2.76 | )% |
Operating expenses including reimbursement/waiver | | 2.51 | %(f)(g) | | 2.73 | %(f) | | 2.76 | % | | 2.74 | % | | 2.90 | % | | 2.90 | % | | 2.90 | % |
Operating expenses excluding reimbursement/waiver | | 2.77 | %(f) | | 3.14 | %(f) | | 2.90 | % | | 2.75 | % | | 4.99 | % | | 4.66 | % | | 3.41 | % |
PORTFOLIO TURNOVER RATE | | 200 | %(e) | | 156 | %(e) | | 189 | % | | 65 | % | | 151 | % | | 249 | % | | 193 | % |
(a) Prior to September 29, 2005, the Fund was named the Forward Emerald Technology Fund and invested a minimum 80% of its net assets, plus borrowings for investment purposes, if any, in a non-diversified portfolio of equity securities of public companies in the Technology sector. Accordingly, performance figures for periods prior to September 29, 2005, do not reflect the current strategy. Prior to February 29, 2000, the Fund was named the HomeState Year 2000 Fund and its investment objective focused on a specific industry within the Technology sector.
(b) Per share numbers have been calculated using the average shares method.
(c) Amount represents less than $0.01 per share.
(d) Total return assumes dividend reinvestment and does not reflect the effect of sales charges.
(e) Not annualized.
(f) Annualized.
(g) Effective May 1, 2006, the net expense limitation changed from 2.90% to 1.99%.
| | | | |
| June 30, 2006 | | 82 | | See Notes to Financial Statements |
Financial Highlights
For a share outstanding throughout the periods presented.
Forward Emerald Opportunities Fund
| | | | | | | | | | | | | | | | | | | | | | | | | | | | |
| | | CLASS C | |
| | | SIX MONTHS ENDED
JUNE 30, 2006 (UNAUDITED) | | | SIX MONTHS ENDED
DECEMBER 31,
2005(a) | | | YEAR ENDED
JUNE 30,
2005(a) | | | YEAR ENDED
JUNE 30,
2004(a) | | | YEAR ENDED
JUNE 30,
2003(a) | | | YEAR ENDED
JUNE 30,
2002(a) | | | YEAR ENDED
JUNE 30,
2001(b) | |
NET ASSET VALUE, BEGINNING OF PERIOD | | $ | 8.18 | | | $ | 6.87 | | | $ | 7.00 | | | $ | 5.56 | | | $ | 5.33 | | | $ | 12.10 | | | $ | 29.59 | |
INCOME/(LOSS) FROM OPERATIONS: | | | | | | | | | | | | | | | | | | | | | | | | | | | | |
Net investment loss | | | (0.05 | ) | | | (0.10 | )(c) | | | (0.20 | )(c) | | | (0.22 | )(c) | | | (0.15 | )(c) | | | (0.24 | )(c) | | | (0.37 | ) |
Net realized and unrealized gain/(loss) on investments | | | 0.50 | | | | 1.41 | | | | 0.07 | | | | 1.66 | | | | 0.38 | | | | (6.11 | ) | | | (13.12 | ) |
| | | | | | | | | | | | | | | | | | | | | | | | | | | | |
Total from Investment Operations | | | 0.45 | | | | 1.31 | | | | (0.13 | ) | | | 1.44 | | | | 0.23 | | | | (6.35 | ) | | | (13.49 | ) |
| | | | | | | | | | | | | | | | | | | | | | | | | | | | |
LESS DISTRIBUTIONS | | | | | | | | | | | | | | | | | | | | | | | | | | | | |
From capital gains | | | — | | | | — | | | | — | | | | — | | | | — | | | | (0.42 | ) | | | (4.00 | ) |
| | | | | | | | | | | | | | | | | | | | | | | | | | | | |
Total Distributions | | | — | | | | — | | | | — | | | | — | | | | — | | | | (0.42 | ) | | | (4.00 | ) |
| | | | | | | | | | | | | | | | | | | | | | | | | | | | |
REDEMPTION FEES ADDED TO PAID IN CAPITAL (NOTE 7) | | | — | (d) | | | — | | | | — | | | | — | | | | — | | | | — | | | | — | |
| | | | | | | | | | | | | | | | | | | | | | | | | | | | |
NET INCREASE/(DECREASE) IN NET ASSET VALUE | | | 0.45 | | | | 1.31 | | | | (0.13 | ) | | | 1.44 | | | | 0.23 | | | | (6.77 | ) | | | (17.49 | ) |
| | | | | | | | | | | | | | | | | | | | | | | | | | | | |
NET ASSET VALUE, END OF PERIOD | | $ | 8.63 | | | $ | 8.18 | | | $ | 6.87 | | | $ | 7.00 | | | $ | 5.56 | | | $ | 5.33 | | | $ | 12.10 | |
| | | | | | | | | | | | | | | | | | | | | | | | | | | | |
TOTAL RETURN(e) | | | 10.95 | %(f) | | | 19.07 | %(f) | | | (1.86 | )% | | | 25.90 | % | | | 4.32 | % | | | (53.99 | )% | | | (52.00 | )% |
RATIOS/SUPPLEMENTAL DATA | | | | | | | | | | | | | | | | | | | | | | | | | | | | |
Net assets, end of period (in 000’s) | | $ | 2,650 | | | $ | 820 | | | $ | 388 | | | $ | 518 | | | $ | 201 | | | $ | 89 | | | $ | 301 | |
RATIOS TO AVERAGE NET ASSETS: | | | | | | | | | | | | | | | | | | | | | | | | | | | | |
Net investment loss including reimbursement/waiver | | | (1.97 | )%(g) | | | (2.64 | )%(g) | | | (3.11 | )% | | | (3.15 | )% | | | (3.19 | )% | | | (3.00 | )% | | | (2.75 | )% |
Net investment loss excluding reimbursement/waiver | | | (2.06 | )%(g) | | | (3.05 | )%(g) | | | (3.24 | )% | | | (3.17 | )% | | | (5.28 | )% | | | (4.76 | )% | | | (3.26 | )% |
Operating expenses including reimbursement/waiver | | | 3.18 | %(g)(h) | | | 3.22 | %(g) | | | 3.26 | % | | | 3.24 | % | | | 3.40 | % | | | 3.40 | % | | | 3.40 | % |
Operating expenses excluding reimbursement/waiver | | | 3.27 | %(g) | | | 3.63 | %(g) | | | 3.40 | % | | | 3.25 | % | | | 5.49 | % | | | 5.16 | % | | | 3.91 | % |
PORTFOLIO TURNOVER RATE | | | 200 | %(f) | | | 156 | %(f) | | | 189 | % | | | 65 | % | | | 151 | % | | | 249 | % | | | 193 | % |
(a) Prior to September 29, 2005, the Fund was named the Forward Emerald Technology Fund and invested a minimum 80% of its net assets, plus borrowings for investment purposes, if any, in a non-diversified portfolio of equity securities of public companies in the Technology sector. Accordingly, performance figures for periods prior to September 29, 2005, do not reflect the current strategy. Prior to February 29, 2000, the Fund was named the HomeState Year 2000 Fund and its investment objective focused on a specific industry within the Technology sector.
(b) The Fund began offering Class C Shares on July 1, 2000.
(c) Per share amounts calculated based on the average shares outstanding during the period.
(d) Amount represents less than $0.01 per share.
(e) Total return assumes dividend reinvestment and does not reflect the effect of sales charges.
(f) Not annualized.
(g) Annualized.
(h) Effective May 1, 2006, the net expense limitation changed from 3.40% to 2.49%.
| | | | |
| See Notes to Financial Statements | | 83 | | June 30, 2006 |
Financial Highlights
For a share outstanding throughout the periods presented.
Forward Uniplan Real Estate Investment Fund
| | | | | | | | | | | | | | | | | | | | | | | | |
| | | INVESTOR CLASS | |
| | | SIX MONTHS ENDED JUNE 30, 2006 (UNAUDITED) | | | YEAR ENDED DECEMBER 31, 2005 | | | YEAR ENDED DECEMBER 31, 2004 | | | YEAR ENDED DECEMBER 31, 2003 | | | YEAR ENDED DECEMBER 31, 2002 | | | YEAR ENDED DECEMBER 31, 2001 | |
NET ASSET VALUE, BEGINNING OF PERIOD | | $ | 16.69 | | | $ | 16.62 | | | $ | 14.01 | | | $ | 11.24 | | | $ | 11.43 | | | $ | 10.91 | |
INCOME/(LOSS) FROM OPERATIONS: | | | | | | | | | | | | | | | | | | | | | | | | |
Net investment income | | | 0.14 | | | | 0.33 | (a) | | | 0.34 | (a) | | | 0.30 | (a) | | | 0.40 | (a) | | | 0.45 | (a) |
Net realized and unrealized gain on investments | | | 1.80 | | | | 1.47 | (a) | | | 3.62 | (a) | | | 2.85 | (a) | | | 0.02 | (a) | | | 0.77 | (a) |
| | | | | | | | | | | | | | | | | | | | | | | | |
Total from Investment Operations | | | 1.94 | | | | 1.80 | | | | 3.96 | | | | 3.15 | | | | 0.42 | | | | 1.22 | |
| | | | | | | | | | | | | | | | | | | | | | | | |
LESS DISTRIBUTIONS: | | | | | | | | | | | | | | | | | | | | | | | | |
From net investment income | | | (0.10 | ) | | | (0.22 | ) | | | (0.59 | ) | | | (0.31 | ) | | | (0.44 | ) | | | (0.44 | ) |
From capital gains | | | (0.00 | ) | | | (1.50 | ) | | | (0.76 | ) | | | (0.07 | ) | | | (0.17 | ) | | | (0.18 | ) |
Tax return of capital | | | (0.00 | ) | | | (0.01 | ) | | | — | | | | — | | | | — | | | | (0.08 | ) |
| | | | | | | | | | | | | | | | | | | | | | | | |
Total Distributions | | | (0.10 | ) | | | (1.73 | ) | | | (1.35 | ) | | | (0.38 | ) | | | (0.61 | ) | | | (0.70 | ) |
| | | | | | | | | | | | | | | | | | | | | | | | |
REDEMPTION FEES ADDED TO PAID IN CAPITAL (NOTE 7) | | | — | (b) | | | — | (b) | | | — | (b) | | | — | (b) | | | — | (b) | | | — | |
| | | | | | | | | | | | | | | | | | | | | | | | |
NET INCREASE/(DECREASE) IN NET ASSET VALUE | | | 1.84 | | | | 0.07 | | | | 2.61 | | | | 2.77 | | | | (0.19 | ) | | | 0.52 | |
| | | | | | | | | | | | | | | | | | | | | | | | |
NET ASSET VALUE, END OF PERIOD | | $ | 18.53 | | | $ | 16.69 | | | $ | 16.62 | | | $ | 14.01 | | | $ | 11.24 | | | $ | 11.43 | |
| | | | | | | | | | | | | | | | | | | | | | | | |
TOTAL RETURN | | | 11.62 | %(c) | | | 11.01 | % | | | 28.77 | % | | | 28.53 | % | | | 3.56 | % | | | 11.31 | % |
RATIOS/SUPPLEMENTAL DATA: | | | | | | | | | | | | | | | | | | | | | | | | |
Net Assets, End of Period (000’s) | | $ | 44,331 | | | $ | 43,288 | | | $ | 48,346 | | | $ | 36,735 | | | $ | 23,456 | | | $ | 15,085 | |
RATIOS TO AVERAGE NET ASSETS: | | | | | | | | | | | | | | | | | | | | | | | | |
Net investment income including reimbursement/waiver | | | 1.52 | %(d) | | | 1.98 | %(a) | | | 2.23 | %(a) | | | 2.50 | %(a) | | | 3.63 | %(a) | | | 3.98 | %(a) |
Operating expenses including reimbursement/waiver | | | 1.46 | %(d)(e) | | | 1.79 | % | | | 1.85 | % | | | 1.91 | % | | | 1.94 | % | | | 1.80 | % |
Operating expenses excluding reimbursement/waiver | | | n/a | (f) | | | n/a | (f) | | | n/a | (f) | | | 2.16 | % | | | 2.09 | % | | | 2.41 | % |
PORTFOLIO TURNOVER RATE | | | 16 | %(c) | | | 21 | % | | | 32 | % | | | 17 | % | | | 22 | % | | | 7 | % |
(a) Amount has been restated. See Note 2 to December 31, 2005 Financial Statements.
(b) Amount represents less than $0.01 per share.
(c) Not Annualized.
(d) Annualized.
(e) Effective January 2, 2006, the net expense limitation changed from 1.79% to 1.69%.
(f) Not applicable, no reimbursements/waiver were made by the Advisor.
| | | | |
| June 30, 2006 | | 84 | | See Notes to Financial Statements |
Financial Highlights
For a share outstanding throughout the periods presented.
Forward Emerald Growth Fund
| | | | | | | | | | | | | | | | | | | | | |
| | | CLASS A | | | | |
| | | SIX MONTHS ENDED
JUNE 30, 2006
(UNAUDITED) | | | SIX MONTHS ENDED
DECEMBER 31,
2005 | | | YEAR ENDED
JUNE 30,
2005 | | | YEAR ENDED
JUNE 30,
2004 | | | YEAR ENDED
JUNE 30,
2003 | | | YEAR ENDED
JUNE 30,
2002 | | | YEAR ENDED
JUNE 30,
2001(a) | |
NET ASSET VALUE, BEGINNING OF PERIOD | | $13.57 | | | $12.98 | | | $13.02 | | | $10.21 | | | $10.26 | | | $12.50 | | | $18.31 | |
INCOME/(LOSS) FROM OPERATIONS: | | | | | | | | | | | | | | | | | | | | | |
Net investment loss | | (0.08 | ) | | (0.07 | )(b) | | (0.16 | )(b) | | (0.17 | )(b) | | (0.10 | )(b) | | (0.10 | )(b) | | (0.05 | )(b) |
Net realized and unrealized gain/(loss) on investments | | 1.61 | | | 1.38 | | | 0.43 | | | 2.98 | | | 0.05 | | | (2.14 | ) | | (1.58 | ) |
| | | | | | | | | | | | | | | | | | | | | |
Total from Investment Operations | | 1.53 | | | 1.31 | | | 0.27 | | | 2.81 | | | (0.05 | ) | | (2.24 | ) | | (1.63 | ) |
| | | | | | | | | | | | | | | | | | | | | |
LESS DISTRIBUTIONS: | | | | | | | | | | | | | | | | | | | | | |
From capital gains | | — | | | (0.72 | ) | | (0.31 | ) | | — | | | — | | | — | | | (4.18 | ) |
| | | | | | | | | | | | | | | | | | | | | |
Total Distributions | | — | | | (0.72 | ) | | (0.31 | ) | | — | | | — | | | — | | | (4.18 | ) |
| | | | | | | | | | | | | | | | | | | | | |
REDEMPTION FEES ADDED TO PAID IN CAPITAL (NOTE 7) | | — | (c) | | — | | | — | | | — | | | — | | | — | | | — | |
| | | | | | | | | | | | | | | | | | | | | |
NET INCREASE/(DECREASE) IN NET ASSET VALUE | | 1.53 | | | 0.59 | | | (0.04 | ) | | — | | | — | | | — | | | (5.81 | ) |
| | | | | | | | | | | | | | | | | | | | | |
Net Asset Value, End of Period | | $15.10 | | | $13.57 | | | $12.98 | | | $13.02 | | | $10.21 | | | $10.26 | | | $12.50 | |
| | | | | | | | | | | | | | | | | | | | | |
TOTAL RETURN(d) | | 5.96 | %(e) | | 10.21 | %(e) | | 2.48 | % | | 27.52 | % | | (0.49 | )% | | (17.92 | )% | | (9.62 | )% |
RATIOS/SUPPLEMENTAL DATA: | | | | | | | | | | | | | | | | | | | | | |
Net assets, end of period (in 000s) | | $178,100 | | | $158,056 | | | $145,193 | | | $112,354 | | | $78,060 | | | $82,805 | | | $107,325 | |
Ratio to average net assets: | | | | | | | | | | | | | | | | | | | | | |
Net Investment loss | | (1.10 | )%(f) | | (1.08 | )%(f) | | (1.31 | )% | | (1.34 | )% | | (1.14 | )% | | (0.88 | )% | | (0.40 | )% |
Operating expenses | | 1.41 | %(f) | | 1.40 | %(f) | | 1.63 | % | | 1.57 | % | | 1.73 | % | | 1.62 | % | | 1.56 | % |
PORTFOLIO TURNOVER RATE | | 44 | %(e) | | 34 | %(e) | | 73 | % | | 62 | % | | 79 | % | | 61 | % | | 60 | % |
(a) Prior to July 1, 2001, the Fund was named the HomeState Pennsylvania Growth Fund and focused on a specific geographic region within the U.S.
(b) Per share numbers have been calculated using the average shares method.
(c) Amount represents less than $0.01 per share.
(d) Total return assumes dividend reinvestment and does not reflect the effect of sales charges.
(e) Not Annualized.
(f) Annualized.
| | | | |
| See Notes to Financial Statements | | 85 | | June 30, 2006 |
Financial Highlights
For a share outstanding throughout the periods presented.
Forward Emerald Growth Fund
| | | | | | | | | | | | | | | | | | | | | | | | | | | | |
| | | CLASS C | |
| | | SIX MONTHS ENDED
JUNE 30, 2006
(UNAUDITED) | | | SIX MONTHS ENDED
DECEMBER 31,
2005 | | | YEAR ENDED
JUNE 30,
2005 | | | YEAR ENDED
JUNE 30,
2004 | | | YEAR ENDED
JUNE 30,
2003 | | | YEAR ENDED
JUNE 30,
2002 | | | YEAR ENDED
JUNE 30,
2001(a) | |
NET ASSET VALUE, BEGINNING OF PERIOD | | | $13.06 | | | | $12.56 | | | | $12.70 | | | | $10.02 | | | | $10.14 | | | | $12.43 | | | | $18.31 | |
INCOME/(LOSS) FROM OPERATIONS | | | | | | | | | | | | | | | | | | | | | | | | | | | | |
Net investment loss | | | (0.13 | )(b) | | | (0.11 | )(b) | | | (0.23 | )(b) | | | (0.25 | )(b) | | | (0.16 | )(b) | | | (0.17 | )(b) | | | (0.13 | )(b) |
Net realized and unrealized gain/(loss) on investments | | | 1.56 | | | | 1.33 | | | | 0.40 | | | | 2.93 | | | | 0.40 | | | | (2.12 | ) | | | (1.57 | ) |
| | | | | | | | | | | | | | | | | | | | | | | | | | | | |
Total from Investment Operations | | | 1.43 | | | | 1.22 | | | | 0.17 | | | | 2.68 | | | | (0.12 | ) | | | (2.29 | ) | | | (1.70 | ) |
| | | | | | | | | | | | | | | | | | | | | | | | | | | | |
LESS DISTRIBUTIONS | | | | | | | | | | | | | | | | | | | | | | | | | | | | |
From capital gains | | | — | | | | (0.72 | ) | | | (0.31 | ) | | | — | | | | — | | | | — | | | | (4.18 | ) |
| | | | | | | | | | | | | | | | | | | | | | | | | | | | |
Total Distributions | | | — | | | | (0.72 | ) | | | (0.31 | ) | | | — | | | | — | | | | — | | | | (4.18 | ) |
| | | | | | | | | | | | | | | | | | | | | | | | | | | | |
REDEMPTION FEES ADDED TO PAID IN CAPITAL (NOTE 7) | | | — | (c) | | | — | | | | — | | | | — | | | | — | | | | — | | | | — | |
| | | | | | | | | | | | | | | | | | | | | | | | | | | | |
NET INCREASE/(DECREASE) IN NET ASSET VALUE | | | 1.43 | | | | 0.50 | | | | (0.14 | ) | | | 2.68 | | | | (0.12 | ) | | | (2.29 | ) | | | (5.88 | ) |
| | | | | | | | | | | | | | | | | | | | | | | | | | | | |
NET ASSET VALUE, END OF PERIOD | | $ | 14.49 | | | $ | 13.06 | | | $ | 12.56 | | | $ | 12.70 | | | $ | 10.02 | | | $ | 10.14 | | | $ | 12.43 | |
| | | | | | | | | | | | | | | | | | | | | | | | | | | | |
TOTAL RETURN(d) | | | 5.50 | %(e) | | | 9.82 | %(e) | | | 1.74 | % | | | 26.75 | % | | | (1.18 | )% | | | (18.42 | )% | | | (10.08 | )% |
RATIOS/SUPPLEMENTAL DATA: | | | | | | | | | | | | | | | | | | | | | | | | | | | | |
Net assets, end of period (in 000s) | | | $11,379 | | | | $11,287 | | | | $11,498 | | | | $13,311 | | | | $4,905 | | | | $3,505 | | | | $1,434 | |
Ratios to average net assets: | | | | | | | | | | | | | | | | | | | | | | | | | | | | |
Net investment loss | | | (1.75 | )%(f) | | | (1.73 | )%(f) | | | (1.94 | )% | | | (1.99 | )% | | | (1.81 | )% | | | (1.53 | )% | | | (1.05 | )% |
Operating expenses | | | 2.07 | %(f) | | | 2.04 | %(f) | | | 2.28 | % | | | 2.22 | % | | | 2.39 | % | | | 2.27 | % | | | 2.21 | % |
PORTFOLIO TURNOVER RATE | | | 44 | %(e) | | | 34 | %(e) | | | 73 | % | | | 62 | % | | | 79 | % | | | 61 | % | | | 60 | % |
(a) The Fund began offering Class C Shares on July 1, 2000. Prior to July 1, 2001, the Fund was named the HomeState Pennsylvania Growth Fund and focused on a specific geographic region within the U.S.
(b) Per share numbers have been calculated using the average shares method.
(c) Amount represents less than $0.01 per share.
(d) Total return assumes dividend reinvestment and does not reflect the effect of sales charges.
(e) Not Annualized.
(f) Annualized.
| | | | |
| June 30, 2006 | | 86 | | See Notes to Financial Statements |
Financial Highlights
For a share outstanding throughout the periods presented.
Forward Hoover Small Cap Equity Fund
| | | | | | | | | | | | | | | | | | |
| | | INVESTOR CLASS | |
| | | SIX MONTHS ENDED
JUNE 30, 2006
(UNAUDITED) | | | YEAR ENDED
DECEMBER 31,
2005 | | | YEAR ENDED
DECEMBER 31,
2004 | | | YEAR ENDED
DECEMBER 31,
2003 | | | YEAR ENDED
DECEMBER 31,
2002 | | | YEAR ENDED
DECEMBER 31,
2001 | |
NET ASSET VALUE, BEGINNING OF PERIOD | | $19.40 | | | $18.45 | | | $16.17 | | | $12.05 | | | $14.78 | | | $14.26 | |
INCOME/(LOSS) FROM OPERATIONS: | | | | | | | | | | | | | | | | | | |
Net investment income loss | | (0.07 | ) | | (0.14 | ) | | (0.17 | ) | | (0.17 | ) | | (0.18 | ) | | (0.14 | ) |
Net realized and unrealized gain/(loss) on investments | | 0.98 | | | 1.91 | | | 3.86 | | | 4.57 | | | (2.55 | ) | | 0.75 | |
| | | | | | | | | | | | | | | | | | |
Total from Investment Operations | | 0.91 | | | 1.77 | | | 3.69 | | | 4.40 | | | (2.73 | ) | | 0.61 | |
| | | | | | | | | | | | | | | | | | |
LESS DISTRIBUTIONS: | | | | | | | | | | | | | | | | | | |
From capital gains | | — | | | (0.82 | ) | | (1.41 | ) | | (0.28 | ) | | — | | | (0.09 | ) |
Tax return of capital | | — | | | — | | | — | | | — | | | — | | | (— | )(a) |
| | | | | | | | | | | | | | | | | | |
Total Distributions | | — | | | (0.82 | ) | | (1.41 | ) | | (0.28 | ) | | — | | | (0.09 | ) |
| | | | | | | | | | | | | | | | | | |
REDEMPTION FEES ADDED TO PAID IN CAPITAL (NOTE 7) | | 0.01 | | | — | (a) | | — | (a) | | — | (a) | | — | (a) | | — | |
| | | | | | | | | | | | | | | | | | |
NET INCREASE/(DECREASE) IN NET ASSET VALUE | | 0.92 | | | 0.95 | | | 2.28 | | | 4.12 | | | (2.73 | ) | | 0.52 | |
| | | | | | | | | | | | | | | | | | |
NET ASSET VALUE, END OF PERIOD | | $20.32 | | | $19.40 | | | $18.45 | | | $16.17 | | | $12.05 | | | $14.78 | |
| | | | | | | | | | | | | | | | | | |
TOTAL RETURN | | 4.74 | %(b) | | 9.63 | % | | 22.77 | % | | 36.49 | % | | (18.47 | )% | | 4.27 | % |
RATIOS/SUPPLEMENTAL DATA: | | | | | | | | | | | | | | | | | | |
Net Assets, End of Period (000’s) | | $421,701 | | | $323,125 | | | $187,230 | | | $128,317 | | | $91,979 | | | $115,546 | |
RATIOS TO AVERAGE NET ASSETS: | | | | | | | | | | | | | | | | | | |
Net investment loss including reimbursement/waiver | | (0.73 | )%(c) | | (0.96 | )% | | (1.21 | )% | | (1.28 | )% | | (1.30 | )% | | (1.04 | )% |
Operating expenses including reimbursement/waiver | | 1.65 | %(c) | | 1.73 | %(d) | | 1.78 | % | | 1.83 | % | | 1.85 | % | | 1.65 | % |
Operating expenses excluding reimbursement/waiver | | 1.67 | %(c) | | 1.98 | % | | 1.80 | % | | 1.89 | % | | 1.89 | % | | 1.99 | % |
PORTFOLIO TURNOVER RATE | | 100 | %(b) | | 181 | % | | 207 | % | | 190 | % | | 147 | % | | 140 | % |
(a) Amount represents less than $0.01 per share.
(b) Not Annualized.
(c) Annualized.
(d) Effective July 1, 2005, the net expense limitation changed from 1.89% to 1.69%.
| | | | |
| See Notes to Financial Statements | | 87 | | June 30, 2006 |
Financial Highlights
For a share outstanding throughout the periods presented.
Forward Hoover Small Cap Equity Fund
| | | | | | | | | | | | | | | | | | | | |
| | | INSTITUTIONAL CLASS | |
| | | SIX MONTHS ENDED
JUNE 30, 2006
(UNAUDITED) | | | YEAR ENDED
DECEMBER 31,
2005 | | | YEAR ENDED
DECEMBER 31,
2004 | | | YEAR ENDED
DECEMBER 31,
2003 | | | PERIOD ENDED
DECEMBER 31,
2002(a) | |
NET ASSET VALUE, BEGINNING OF PERIOD | | | $19.77 | | | | $18.71 | | | | $16.31 | | | | $12.10 | | | | $14.12 | |
INCOME/(LOSS) FROM OPERATIONS: | | | | | | | | | | | | | | | | | | | | |
Net investment income loss | | | (0.02 | ) | | | (0.08 | ) | | | (0.07 | ) | | | (0.05 | ) | | | (0.08 | ) |
Net realized and unrealized gain/(loss) on investments | | | 0.98 | | | | 1.96 | | | | 3.88 | | | | 4.54 | | | | (1.94 | ) |
| | | | | | | | | | | | | | | | | | | | |
Total from Investment Operations | | | 0.96 | | | | 1.88 | | | | 3.81 | | | | 4.49 | | | | (2.02 | ) |
| | | | | | | | | | | | | | | | | | | | |
LESS DISTRIBUTIONS: | | | | | | | | | | | | | | | | | | | | |
From capital gains | | | — | | | | (0.82 | ) | | | (1.41 | ) | | | (0.28 | ) | | | — | |
Tax return of capital | | | — | | | | — | | | | — | | | | — | | | | — | |
| | | | | | | | | | | | | | | | | | | | |
Total Distributions | | | — | | | | (0.82 | ) | | | (1.41 | ) | | | (0.28 | ) | | | — | |
| | | | | | | | | | | | | | | | | | | | |
REDEMPTION FEES ADDED TO PAID IN CAPITAL (NOTE 7) | | | 0.01 | | | | — | (b) | | | — | (b) | | | — | (b) | | | — | (b) |
| | | | | | | | | | | | | | | | | | | | |
NET INCREASE/(DECREASE) IN NET ASSET VALUE | | | 0.97 | | | | 1.06 | | | | 2.40 | | | | 4.21 | | | | (2.02 | ) |
| | | | | | | | | | | | | | | | | | | | |
NET ASSET VALUE, END OF PERIOD | | $ | 20.74 | | | $ | 19.77 | | | $ | 18.71 | | | $ | 16.31 | | | $ | 12.10 | |
| | | | | | | | | | | | | | | | | | | | |
TOTAL RETURN | | | 4.91 | %(c) | | | 10.08 | % | | | 23.31 | % | | | 37.08 | % | | | (14.31 | )%(c) |
RATIOS/SUPPLEMENTAL DATA: | | | | | | | | | | | | | | | | | | | | |
Net Assets, End of Period (000’s) | | | $53,559 | | | | $34,442 | | | | $10,491 | | | | $3,926 | | | | $214 | |
RATIOS TO AVERAGE NET ASSETS: | | | | | | | | | | | | | | | | | | | | |
Net investment loss including reimbursement/waiver | | | (0.37 | )%(d) | | | (0.53 | )% | | | (0.76 | )% | | | (0.82 | )% | | | (1.13 | )%(d) |
Operating expenses including reimbursement/waiver | | | 1.29 | %(d) | | | 1.34 | % | | | 1.34 | % | | | 1.35 | % | | | 1.85 | %(d) |
Operating expenses excluding reimbursement/waiver | | | 1.31 | %(d) | | | 1.66 | % | | | 1.48 | % | | | 1.74 | % | | | 1.85 | %(d) |
PORTFOLIO TURNOVER RATE | | | 100 | %(c) | | | 181 | % | | | 207 | % | | | 190 | % | | | 147 | %(c)(e) |
(a) The Fund began offering Institutional Class shares on June 6, 2002.
(b) Amount represents less than $0.01 per share.
(c) Not Annualized.
(d) Annualized.
(e) Portfolio turnover rate is calculated at the Fund level and represents the year ended December 31, 2002.
| | | | |
| June 30, 2006 | | 88 | | See Notes to Financial Statements |
Financial Highlights
For a share outstanding throughout the periods presented.
Forward Hoover Small Cap Equity Fund
| | | | | | | | |
| | | CLASS A | |
| | | SIX MONTHS ENDED
JUNE 30, 2006
(UNAUDITED) | | | PERIOD ENDED
DECEMBER 31,
2005(a) | |
| NET ASSET VALUE, BEGINNING OF PERIOD | | $ | 19.41 | | | $ | 17.13 | |
| INCOME/(LOSS) FROM OPERATIONS: | | | | | | | | |
Net investment income loss | | | (0.08 | ) | | | (0.10 | ) |
Net realized and unrealized gain on investments | | | 0.99 | | | | 3.20 | |
| | | | | | | | |
Total from Investment Operations | | | 0.91 | | | | 3.10 | |
| | | | | | | | |
| LESS DISTRIBUTIONS: | | | | | | | | |
From capital gains | | | — | | | | (0.82 | ) |
| | | | | | | | |
Total Distributions | | | — | | | | (0.82 | ) |
| | | | | | | | |
| REDEMPTION FEES ADDED TO PAID IN CAPITAL (NOTE 7) | | | 0.01 | | | | — | (b) |
| | | | | | | | |
| NET INCREASE IN NET ASSET VALUE | | | 0.92 | | | | 2.28 | |
| | | | | | | | |
| NET ASSET VALUE, END OF PERIOD | | $ | 20.33 | | | $ | 19.41 | |
| | | | | | | | |
| TOTAL RETURN(c) | | | 4.75 | %(d) | | | 18.13 | %(d) |
| RATIOS/SUPPLEMENTAL DATA: | | | | | | | | |
Net Assets, End of Period (000’s) | | $ | 19,932 | | | $ | 23,090 | |
| RATIOS TO AVERAGE NET ASSETS: | | | | | | | | |
Net investment loss including reimbursement/waiver | | | (0.63 | )%(e) | | | (0.82 | )%(e) |
Operating expenses including reimbursement/waiver | | | 1.56 | %(e) | | | 1.69 | %(e)(f) |
Operating expenses excluding reimbursement/waiver | | | 1.56 | %(e) | | | 1.92 | %(e) |
| PORTFOLIO TURNOVER RATE | | | 100 | %(d) | | | 181 | % |
(a) The Fund began offering Class A shares on May 2, 2005.
(b) Amount represents less than $0.01 per share.
(c) Total return assumes dividend reinvestment and does not reflect the effect of sales charges.
(d) Not Annualized.
(e) Annualized.
(f) Effective July 1, 2005, the net expense limitation changed from 1.89% to 1.69%.
| | | | |
| See Notes to Financial Statements | | 89 | | June 30, 2006 |
Financial Highlights
For a share outstanding throughout the periods presented.
Forward Hoover Mini-Cap Fund
| | | | | | | | | | | | | | | | |
| | | INVESTOR CLASS | |
| | | SIX MONTHS ENDED
JUNE 30, 2006
(UNAUDITED) | | | YEAR ENDED
DECEMBER 31,
2005 | | | YEAR ENDED
DECEMBER 31,
2004 | | | YEAR ENDED
DECEMBER 31,
2003(a) | |
| NET ASSET VALUE, BEGINNING OF PERIOD | | $ | 17.81 | | | $ | 16.26 | | | $ | 14.21 | | | $ | 10.00 | |
| INCOME/(LOSS) FROM OPERATIONS: | | | | | | | | | | | | | | | | |
Net investment loss | | | (0.07 | ) | | | (0.20 | ) | | | (0.19 | ) | | | (0.13 | ) |
Net realized and unrealized gain on investments | | | 1.17 | | | | 2.20 | | | | 2.41 | | | | 4.52 | |
| | | | | | | | | | | | | | | | |
Total from Investment Operations | | | 1.10 | | | | 2.00 | | | | 2.22 | | | | 4.39 | |
| | | | | | | | | | | | | | | | |
| LESS DISTRIBUTIONS: | | | | | | | | | | | | | | | | |
From capital gains | | | — | | | | (0.45 | ) | | | (0.17 | ) | | | (0.18 | ) |
| | | | | | | | | | | | | | | | |
Total Distributions | | | — | | | | (0.45 | ) | | | (0.17 | ) | | | (0.18 | ) |
| | | | | | | | | | | | | | | | |
| REDEMPTION FEES ADDED TO PAID IN CAPITAL (NOTE 7) | | | — | (b) | | | — | (b) | | | — | (b) | | | — | (b) |
| | | | | | | | | | | | | | | | |
| NET INCREASE IN NET ASSET VALUE | | | 1.10 | | | | 1.55 | | | | 2.05 | | | | 4.21 | |
| | | | | | | | | | | | | | | | |
| NET ASSET VALUE, END OF PERIOD | | $ | 18.91 | | | $ | 17.81 | | | $ | 16.26 | | | $ | 14.21 | |
| | | | | | | | | | | | | | | | |
| TOTAL RETURN | | | 6.18 | %(c) | | | 12.28 | % | | | 15.64 | % | | | 43.91 | % |
| RATIOS/SUPPLEMENTAL DATA: | | | | | | | | | | | | | | | | |
Net Assets, End of Period (000’s) | | $ | 11,411 | | | $ | 8,741 | | | $ | 7,722 | | | $ | 6,027 | |
| RATIOS TO AVERAGE NET ASSETS: | | | | | | | | | | | | | | | | |
Net investment loss including reimbursement/waiver | | | (0.87 | )%(d) | | | (1.25 | )% | | | (1.41 | )% | | | (1.67 | )% |
Operating expenses including reimbursement/waiver | | | 1.79 | %(d)(e) | | | 1.99 | % | | | 1.95 | % | | | 1.99 | % |
Operating expenses excluding reimbursement/waiver | | | n/a | (f) | | | 1.99 | % | | | 2.21 | % | | | 4.84 | % |
| PORTFOLIO TURNOVER RATE | | | 152 | %(c) | | | 277 | % | | | 306 | % | | | 421 | % |
(a) The Fund began offering Investor Class shares on January 1, 2003.
(b) Amount represents less than $0.01 per share.
(c) Not Annualized.
(d) Annualized.
(e) Effective January 2, 2006, the net expense limitation changed from 1.99% to 1.79%.
(f) Not applicable, no reimbursement/waiver made by Advisor.
| | | | |
| June 30, 2006 | | 90 | | See Notes to Financial Statements |
Financial Highlights
For a share outstanding throughout the periods presented.
Forward Hoover Mini-Cap Fund
| | | | | | | | | | | | | | | | |
| | | INSTITUTIONAL CLASS | |
| | | SIX MONTHS ENDED
JUNE 30, 2006
(UNAUDITED) | | | YEAR ENDED
DECEMBER 31,
2005 | | | YEAR ENDED
DECEMBER 31,
2004 | | | PERIOD ENDED
DECEMBER 31, 2003(a) | |
| NET ASSET VALUE, BEGINNING OF PERIOD | | $ | 18.05 | | | $ | 16.38 | | | $ | 14.24 | | | $ | 13.02 | |
| INCOME/(LOSS) FROM OPERATIONS: | | | | | | | | | | | | | | | | |
Net investment loss | | | (0.03 | ) | | | (0.11 | ) | | | (0.09 | ) | | | (0.03 | ) |
Net realized and unrealized gain on investments | | | 1.20 | | | | 2.23 | | | | 2.40 | | | | 1.43 | |
| | | | | | | | | | | | | | | | |
Total from Investment Operations | | | 1.17 | | | | 2.12 | | | | 2.31 | | | | 1.40 | |
| | | | | | | | | | | | | | | | |
| LESS DISTRIBUTIONS: | | | | | | | | | | | | | | | | |
From capital gains | | | — | | | | (0.45 | ) | | | (0.17 | ) | | | (0.18 | ) |
| | | | | | | | | | | | | | | | |
Total Distributions | | | — | | | | (0.45 | ) | | | (0.17 | ) | | | (0.18 | ) |
| | | | | | | | | | | | | | | | |
| REDEMPTION FEES ADDED TO PAID IN CAPITAL (NOTE 7) | | | — | (b) | | | — | (b) | | | — | (b) | | | — | |
| | | | | | | | | | | | | | | | |
| NET INCREASE IN NET ASSET VALUE | | | 1.17 | | | | 1.67 | | | | 2.14 | | | | 1.22 | |
| | | | | | | | | | | | | | | | |
| NET ASSET VALUE, END OF PERIOD | | $ | 19.22 | | | $ | 18.05 | | | $ | 16.38 | | | $ | 14.24 | |
| | | | | | | | | | | | | | | | |
| TOTAL RETURN | | | 6.48 | %(c) | | | 12.92 | % | | | 16.24 | % | | | 10.76 | %(c) |
| RATIOS/SUPPLEMENTAL DATA: | | | | | | | | | | | | | | | | |
Net Assets, End of Period (000’s) | | $ | 33,562 | | | $ | 31,088 | | | $ | 24,706 | | | $ | 9,373 | |
| Ratios to average net assets: | | | | | | | | | | | | | | | | |
Net investment loss including reimbursement/waiver | | | (0.29 | )%(d) | | | (0.69 | )% | | | (0.86 | )% | | | (1.04 | )%(d) |
Operating expenses including reimbursement/waiver | | | 1.23 | %(d)(e) | | | 1.43 | % | | | 1.43 | % | | | 1.43 | %(d) |
Operating expenses excluding reimbursement/waiver | | | 1.44 | %(d) | | | 1.71 | % | | | 1.87 | % | | | 3.44 | %(d) |
| PORTFOLIO TURNOVER RATE | | | 152 | %(c) | | | 277 | % | | | 306 | % | | | 421 | % |
(a) The Fund began offering Institutional Class shares on August 15, 2003.
(b) Amount represents less than $0.01 per share.
(c) Not Annualized.
(d) Annualized.
(e) Effective January 2, 2006, the net expense limitation changed from 1.43% to 1.23%.
| | | | |
| See Notes to Financial Statements | | 91 | | June 30, 2006 |
Financial Highlights
For a share outstanding throughout the periods presented.
Forward Legato Fund
| | | | | | | | |
| | | CLASS A | |
| | | SIX MONTHS ENDED
JUNE 30, 2006
(UNAUDITED) | | | PERIOD ENDED
DECEMBER 31,
2005(a) | |
| NET ASSET VALUE, BEGINNING OF PERIOD | | $ | 11.30 | | | $ | 10.00 | |
| INCOME/(LOSS) FROM OPERATIONS: | | | | | | | | |
Net investment loss | | | (0.05 | ) | | | (0.10 | ) |
Net realized and unrealized gain on investments | | | 0.39 | | | | 1.43 | |
| | | | | | | | |
Total from Investment Operations | | | 0.34 | | | | 1.33 | |
| | | | | | | | |
| LESS DISTRIBUTIONS: | | | | | | | | |
From net investment income | | | — | | | | (0.03 | ) |
| | | | | | | | |
Total Distributions | | | — | | | | (0.03 | ) |
| | | | | | | | |
| REDEMPTION FEES ADDED TO PAID IN CAPITAL (NOTE 7) | | | — | (b) | | | — | (b) |
| | | | | | | | |
| NET INCREASE IN NET ASSET VALUE | | | 0.34 | | | | 1.30 | |
| | | | | | | | |
| NET ASSET VALUE, END OF PERIOD | | $ | 11.64 | | | $ | 11.30 | |
| | | | | | | | |
| TOTAL RETURN(c) | | | 3.01 | %(d) | | | 13.34 | %(d) |
| RATIOS/SUPPLEMENTAL DATA: | | | | | | | | |
Net Assets, End of Period (000’s) | | $ | 8,506 | | | $ | 6,876 | |
| RATIOS TO AVERAGE NET ASSETS: | | | | | | | | |
Net investment loss including reimbursement/waiver | | | (0.93 | )%(e) | | | (1.25 | )%(e) |
Operating expenses including reimbursement/waiver | | | 1.63 | %(e)(f) | | | 1.89 | %(e) |
Operating expenses excluding reimbursement/waiver | | | 1.99 | %(e) | | | 3.53 | %(e) |
| PORTFOLIO TURNOVER RATE | | | 21 | %(d) | | | 28 | %(d) |
(a) The Fund commenced operations on April 1, 2005.
(b) Amount represents less than $0.01 per share.
(c) Total return assumes dividend reinvestment and does not reflect the effect of sales charges.
(d) Not Annualized.
(e) Annualized.
(f) Effective May 1, 2006, the net expense limitation changed from 1.89% to 1.79%.
| | | | |
| June 30, 2006 | | 92 | | See Notes to Financial Statements |
Notes to Financial Statements (Unaudited)
1. Organization
Forward Funds (the “Trust”), a Delaware statutory trust, is an open-end management investment company registered under the Investment Company Act of 1940, as amended (the “1940 Act”). The accompanying financial statements and financial highlights are those of the Forward International Equity Fund (the “International Equity Fund”), the Forward International Small Companies Fund (the “International Small Companies Fund”), the Forward Global Emerging Markets Fund (the “Global Emerging Markets Fund”), the Sierra Club Equity Income Fund (the “Equity Income Fund”), the Sierra Club Stock Fund (the “Stock Fund”), the Forward Emerald Banking and Finance Fund (the “Banking and Finance Fund”), the Forward Emerald Opportunities Fund (the “Opportunities Fund”), the Forward Uniplan Real Estate Investment Fund (the “Real Estate Fund”), the Forward Emerald Growth Fund (the “Growth Fund”), the Forward Hoover Small Cap Equity Fund (the “Small Cap Fund”), the Forward Hoover Mini-Cap Fund (the “Mini-Cap Fund”) and the Forward Legato Fund (the “Legato Fund”) (each a “Fund” and collectively the “Funds”).
The International Equity Fund seeks to achieve high total returns and invests primarily in the equity securities of companies organized or located outside of the United States. The International Small Companies Fund seeks to achieve long-term growth of capital and invests in equity securities of companies with small market capitalizations located outside the United States. The Global Emerging Markets Fund seeks to achieve long-term growth of capital and invests primarily in the equity securities of emerging market countries. The Equity Income Fund seeks to achieve a competitive total return through capital appreciation and current income. The Equity Income Fund’s portfolio managers actively manage a portfolio of stocks and fixed-income securities that satisfy environmental and social criteria of the Sierra Club. The Stock Fund seeks to achieve high total return by investing in stocks that meet environmental and social criteria of the Sierra Club. The Banking and Finance Fund seeks to achieve long-term growth through capital appreciation with income as a secondary objective. The Opportunities Fund seeks to achieve capital appreciation and, under normal conditions will invest at least 25% of its net assets, plus borrowings for investment purposes, if any, in a non-diversified portfolio of equity securities of public companies in the technology sector. The Real Estate Fund seeks income with capital appreciation as a secondary goal and invests in real estate securities, including real estate investment trusts (“REITs”). The Growth Fund seeks to achieve long-term growth of capital through capital appreciation and invests in stocks and securities convertible into stocks. The Small Cap Fund and Mini-Cap Fund seek to achieve high total returns and invest primarily in the equity securities of companies that have small market capitalizations and offer future growth potential. The Legato Fund seeks to achieve high total return and invests primarily in the equity securities of companies that have small market capitalizations and offer future growth potential.
The International Equity Fund, International Small Companies Fund, Global Emerging Markets Fund, Equity Income Fund, Stock Fund, Real Estate Fund, Small Cap Fund and Mini-Cap Fund offer Investor Class shares.
The International Small Companies Fund, Global Emerging Markets Fund, Small Cap Fund, Mini-Cap Fund and Legato Fund offer Institutional Class shares.
The International Small Companies Fund, Stock Fund, Banking and Finance Fund, Opportunities Fund, Growth Fund, Small Cap Fund and Legato Fund offer Class A shares.
Notes to Financial Statements (Unaudited)
The Banking and Finance Fund, Opportunities Fund and Growth Fund offer Class C shares.
All classes of shares have identical rights to earnings, assets and voting privileges, except for class specific expenses and exclusive rights to vote on matters affecting only individual classes.
Class A Shares are subject to an initial sales charge of up to 4.75% imposed at the time of purchase. Class A shares for which no initial sales charge was paid are subject to a contingent deferred sales charge (“CDSC”) of 0.50% if the shares are sold within eighteen months, in accordance with the Fund’s prospectus. Class C shares are subject to a 1% CDSC for redemptions made within one year of purchase, in accordance with the Fund’s prospectus. The amount of the CDSC is determined as a percentage of the lesser of the current market value or the cost of shares being redeemed.
Certain funds invest a high percentage of their assets in specific sectors of the market. As a result, the economic and regulatory developments in a particular sector of the market, positive or negative, can have a greater impact on the relevant Fund’s net asset value and may cause its shares to fluctuate more than if the Fund did not concentrate in investments in a particular sector.
2. Significant Accounting Policies
The preparation of financial statements in conformity with accounting principles generally accepted in the United States of America requires management to make estimates and assumptions that affect the reported amounts and disclosures in the financial statements. Actual results could differ from those estimates. The following is a summary of the significant accounting policies consistently followed by each Fund in the preparation of its financial statements. These policies are in conformity with accounting principles generally accepted in the United States of America.
Prior year information has been changed to reflect current presentation.
Portfolio Valuation: Portfolio securities listed or traded on a nationally recognized securities exchange or traded in the U.S. over-the-counter market for which market quotations are readily available are valued at the last quoted sale price or a market’s official closing price as of the close of business on the day the securities are being valued. If there were no sales that day, the security is valued at the mean of the closing bid and ask price. Portfolio securities that are primarily traded on foreign securities exchanges are valued at the last quoted sale or closing price of such securities on their respective exchanges. Investments in open-ended registered investment companies are valued at their net asset value each business day. An option contract is valued at the last sales price as quoted on the principal exchange on which such option is traded, or in the absence of a sale, the mean between the last bid and ask prices. Investments in short-term obligations that mature in 60 days or less are valued at amortized cost, which approximates fair value. All other securities and other assets are carried at their fair value as determined in good faith by or under the direction of the Board of Trustees. The Funds generally value their holdings, including fixed income securities, through the use of independent pricing agents, except for securities for which a ready market does not exist, which are valued under the direction of the Board of Trustees or by the Sub-Advisors using methodologies approved by the Board of Trustees. The valuation methodologies include, but are not limited to, the analysis of the effect of any restrictions on the sale of the security, product development and trends of the security’s issuer, changes in the industry and other competing companies, significant changes
Notes to Financial Statements (Unaudited)
in the issuer’s financial position and any other event that could have a significant impact on the value of the security.
Securities Transactions and Investment Income: Securities transactions are accounted for on a trade date basis. Net realized gains or losses on sales of securities are determined by the identified cost method. Interest income, adjusted for accretion of discounts and amortization of premiums, is recorded on the accrual basis. Dividend income is recorded on the ex-dividend date, except that certain dividends from foreign securities where the ex-dividend date may have passed are recorded as soon as a Fund is informed of such dividends in the exercise of reasonable diligence.
Foreign Currency Translation: The books and records of the Funds are maintained in U.S. dollars. Investment valuations and other assets and liabilities initially expressed in foreign currencies are converted each business day into U.S. dollars based upon current exchange rates. Purchases and sales of foreign investments and income and expenses are converted into U.S. dollars based upon exchange rates prevailing on the respective dates of such transactions. The portion of unrealized gains or losses on investments due to fluctuations in foreign currency exchange rates is not separately disclosed.
Option Writing/Purchasing: The Funds, excluding the Growth Fund, may write or purchase financial options contracts solely for the purpose of hedging their existing portfolio securities, or securities that the funds intend to purchase, against fluctuations in market value caused by changes in prevailing market interest rates. When the Fund writes or purchases an option, an amount equal to the premium received or paid by the Fund is recorded as a liability or an asset and is subsequently adjusted to the current market value of the option written or purchased. Premiums received or paid from writing or purchasing options, which expire unexercised, are treated by the Fund on the expiration date as realized gains or losses. The difference between the premium and the amount paid or received on effecting a closing purchase or sale transaction, including brokerage commissions, is also treated as a realized gain or loss. If an option is exercised, the premium paid or received is added to the cost of the purchase or proceeds from the sale in determining whether the funds have realized a gain or loss on investment transactions. Risks from entering into option transactions arise from the potential inability of counterparties to meet the terms of the contracts, the potential inability to enter into closing transactions because of an illiquid secondary market and from unexpected movements in security values. At June 30, 2006, the Opportunities Fund held purchased options with a market value of $337,892 and written options with a market value of $3,900, and the other Funds held no purchased or written options.
Written option activity for Opportunities Fund for the six months ended June 30, 2006 was as follows:
| | | | | |
| WRITTEN PUT OPTIONS | | CONTRACTS | | PREMIUMS |
Outstanding at December 31, 2005 | | 0 | | $ | 0 |
Positions opened | | 10 | | | 5,070 |
Exercised or closed | | — | | | — |
Expired | | — | | | — |
| | | | | |
Outstanding at June 30, 2006 | | 10 | | $ | 5,070 |
| | | | | |
Short Sales: The Funds, excluding the Growth Fund, may sell securities short. Short sales are transactions in which a Fund sells a security that it does not own, in anticipation of a decline in the market value of that security. To complete such a transaction, a Fund must borrow the security to deliver to the buyer. The Fund then is obligated to replace the security borrowed by purchasing it in the open market at some later date. The Fund bears the risk of a loss if the market price of the
Notes to Financial Statements (Unaudited)
security increases between the date of the short sale and the date on which the Fund replaces the borrowed security. The Fund will realize a gain if the security declines in value between those dates. There can be no assurance that securities necessary to cover a short position will be available for purchase. All short sales must be fully collateralized. The Fund maintains collateral consisting of cash, U.S. Government securities or other liquid assets in an amount at least equal to the market value of their respective short positions. The Fund is liable for any dividends payable on securities while those securities are in a short position. At June 30, 2006, the Opportunities Fund held securities sold short with a market value of $1,067,189, and the other Funds held no securities sold short.
Cash Management Transactions: The Funds subscribe to the Brown Brothers Harriman & Co. (“BBH”) Cash Management Service (“CMS”). The BBH CMS is an investment product that automatically sweeps the Funds’ cash balances into overnight offshore time deposits with either BBH Grand Cayman branch or branches of pre-approved world class commercial banks. This fully automated program allows the Funds to earn interest on cash balances while remaining diversified. Excess cash invested with deposit institutions domiciled outside of the United States, as with any offshore deposit, may be subject to sovereign actions in the jurisdiction of the deposit institution including, but not limited to, freeze, seizure, or diminution. The Funds bear the risk associated with the repayment of principal and payment of interest on such instruments by the institution with which the deposit is ultimately placed. Balances in the CMS are accounted for on a cost basis.
Lending of Portfolio Securities: The Funds, excluding the Equity Income Fund and the Stock Fund, from time to time may lend portfolio securities to broker-dealers, banks or institutional borrowers of securities. Upon lending its securities to third parties, a Fund receives compensation in the form of fees. The loans are secured by collateral which is at least 102% to the fair value of the securities loaned plus accrued interest in the form of cash or U.S. government securities. Gain or loss in the fair value of the securities loaned that may occur during the term of the loan will be for the account of the Fund. The Fund has the right under the lending agreement to recover the securities from the borrower on demand. Additionally, the Fund does not have the right to sell or repledge collateral received in the form of securities unless the borrower goes into default. The risks to the Fund of securities lending are that the borrower may not provide additional collateral when required or return the securities when due. This collateral must be valued daily and should the market value of the loaned securities increase the borrower must furnish additional collateral to the lending Fund. During the time portfolio securities are on loan, the borrower pays the lending Fund any dividends or interest paid on such securities. Loans are subject to termination by the lending Fund or the borrower at any time. While the lending Fund does not have the right to vote securities on loan, it intends to terminate the loan and regain the right to vote if the matter to be voted upon is considered significant with respect to the investment. In the event the borrower defaults on its obligation to the lending Fund, the lending Fund could experience delays in recovering its securities and possible capital losses. At June 30, 2006, the International Equity Fund, International Small Companies Fund and Global Emerging Markets Fund had securities on loan valued at $55,426, $38,826,995 and $2,345,931, respectively, and received cash with a value of $56,710, $44,355,828 and $2,407,443, respectively, as collateral. At June 30, 2006, there were no securities on loan from the portfolios of the Banking and Finance Fund, Oppor - -
Notes to Financial Statements (Unaudited)
tunities Fund, Real Estate Fund, Growth Fund, Small Cap Fund, Mini-Cap Fund and Legato Fund. Interest income from securities lending transactions are recorded in the Statement of Operations.
Foreign Securities: Each Fund may directly purchase securities of foreign issuers. Investing in securities of foreign issuers involves special risks not typically associated with investing in securities of U.S. issuers. The risks include possible revaluation of currencies, the inability to repatriate funds, less complete financial information about companies and possible future adverse political and economic developments. Moreover, securities of many foreign issuers and their markets may be less liquid and their prices more volatile than those of securities of comparable U.S. issuers.
REITs: The Real Estate Fund invests a substantial portion of its assets in REITs and is subject to certain risks associated with direct investments in REITs. REITs may be affected by changes in the value of their underlying properties and by defaults by borrowers or tenants. REITs depend generally on their ability to generate cash flow to make distributions to shareowners, and certain REITs have self-liquidation provisions by which mortgages held may be paid in full and distributions of capital returns may be made at any time. In addition, the performance of a REIT may be affected by its failure to qualify for tax-free pass-through of income under the Internal Revenue Code of 1986 or its failure to maintain exemption from registration under the 1940 Act.
Distributions to Shareholders: Dividends from net investment income are declared and paid annually for the International Equity Fund, International Small Companies Fund, Global Emerging Markets Fund, Stock Fund, Banking and Finance Fund, Opportunities Fund, Growth Fund, Small Cap Fund, Mini-Cap Fund and Legato Fund, quarterly for the Equity Income Fund and monthly for the Real Estate Fund. Net realized capital gains, if any, are distributed at least annually.
Income and capital gain distributions are determined in accordance with Federal income tax regulations, which may differ from accounting principles generally accepted in the United States of America. Therefore, the source of the Funds’ distributions may be shown in the accompanying financial statements as either from or in excess of net investment income or net realized gain, or from paid-in-capital, depending upon the type of book/tax differences that may exist.
A portion of the dividend income recorded by the Real Estate Fund is from distributions by publicly traded REITs held by the Fund, and such distributions may also consist of capital gains and return of capital for tax purposes. The actual return of capital and capital gains portions of such distributions may be determined by formal notifications from the REITs subsequent to the calendar year-end. Distributions received from the REITs that are determined to be a return of capital are recorded by the Fund as a reduction of the cost basis of the securities held.
Federal Income Taxes: The Trust treats each Fund as a separate entity for Federal income tax purposes. Each Fund intends to continue to qualify each year as a “regulated investment company” under Subchapter M of the Internal Revenue Code of 1986, as amended (the “Code”). By so qualifying, each Fund will not be subject to Federal income taxes to the extent that it distributes substantially all of its taxable or tax-exempt income, if any, for its tax year ending December 31. In addition, by distributing in each calendar year substantially all of its net investment income, capital gains and certain other amounts, if any, each Fund will not be subject to a Federal excise tax. Therefore, no provision is made by the Funds for Federal income or excise
Notes to Financial Statements (Unaudited)
taxes. Withholding taxes on foreign dividends are paid or provided for in accordance with the applicable country’s tax rules and rates.
Expenses: Expenses that are specific to a Fund are charged directly to that Fund. Expenses that are common to all Funds generally are allocated among the Funds in proportion to their average daily net assets. For Funds offering multiple share classes, all of the realized and unrealized gains and losses and net investment income, other than class specific expenses, are allocated daily to each class in proportion to its average daily net assets. Fees provided under the Rule 12b-1 plan for a particular class of the fund are charged to the operations of such class.
When-Issued and Delayed-Delivery Transactions: The Funds may purchase securities on a when-issued or delayed-delivery basis. A Fund will engage in when-issued and delayed-delivery transactions only for the purpose of acquiring portfolio securities consistent with its investment objective and policies and not for investment leverage. When-issued securities are securities purchased for delivery beyond the normal settlement date at a stated price and yield and thereby involve a risk that the yield obtained in the transaction will be less than that available in the market when delivery takes place. A Fund will not pay for such securities or start earning interest on them until they are received. When a Fund agrees to purchase securities on a when-issued basis, the custodian will set aside cash or liquid securities equal to the amount of the commitment in a segregated account. Securities purchased on a when-issued basis are recorded as an asset and are subject to changes in value based upon changes in the general level of interest rates. In when-issued and delayed-delivery transactions, a Fund relies on the seller to complete the transaction; the seller’s failure to do so may cause a Fund to miss an advantageous price or yield.
ReFlow Transactions: The Funds may participate in ReFlow, a program designed to provide an alternative liquidity source for mutual funds experiencing redemptions of their shares. In order to pay cash to shareholders who redeem their shares on a given day, a mutual fund typically must hold cash in its portfolio, liquidate portfolio securities, or borrow money, all of which impose certain costs on the fund. ReFlow provides participating mutual funds with another source of cash by standing ready to purchase shares from a fund equal to the amount of the fund’s net redemptions on a given day. ReFlow then generally redeems those shares when the fund experiences net sales. In return for this service, the Fund will pay a fee to ReFlow at a rate determined by a daily auction with other participating mutual funds. The costs to a Fund for participating in ReFlow are expected to be influenced by and comparable to the cost of other sources of liquidity, such as the Fund’s short-term lending arrangements or the costs of selling portfolio securities to meet redemptions. ReFlow will be prohibited from acquiring more than 3% of the outstanding voting securities of any Fund. The Funds will waive their redemption fee with respect to redemptions by ReFlow.
ReFlow Management Co., LLC, the entity that facilitates the day-to-day operations of ReFlow, is under common control with Forward Management, LLC, the investment advisor to the Funds. In light of this, the Board of Trustees has adopted certain procedures to govern the Funds’ participation in ReFlow. During the six months ended June 30, 2006, ReFlow fees that were incurred by the International Equity Fund, International Small Companies Fund, Global Emerging Markets Fund, Equity Income Fund, Stock Fund, Banking and Finance Fund, Real Estate Fund and Small Cap Fund are recorded in the Statement of Operations. During that same period there were no ReFlow fees incurred by the
Notes to Financial Statements (Unaudited)
Opportunities Fund, Growth Fund, Mini-Cap Fund and Legato Fund.
3. Investment Management Services
The Trust has entered into an investment management agreement with Forward Management, LLC (“Forward Management” or the “Advisor”) pursuant to which Forward Management provides investment management services to the Funds and is entitled to receive a fee calculated daily and payable monthly at the following annual rates, as of June 30, 2006, based on each Fund’s average daily net assets: International Equity Fund, 0.85% up to $250 million, 0.75% over $250 million up to $1 billion, 0.65% over $1 billion; International Small Companies Fund, 1.00% up to $1 billion and 0.95% over $1 billion; Global Emerging Markets Fund, 1.25% up to $500 million, 1.20% over $500 million up to $1 billion, and 1.15% over $1 billion; Equity Income Fund, 0.94% up to $100 million, 0.87% over $100 million up to $250 million, 0.82% over $250 million up to $500 million, 0.78% over $500 million; Stock Fund, 0.85% up to $100 million, 0.81% over $100 million up to $250 million, 0.78% over $250 million up to $500 million, and 0.70% over $500 million; Banking and Finance Fund and Opportunities Fund, 1.00% on assets up to $100 million and 0.90% for assets over $100 million; Real Estate Fund, 0.85% up to $100 million, 0.80% over $100 million up to $500 million and 0.70% on assets over $500 million; Growth Fund, 0.75% on assets up to $250 million, 0.65% for the next $250 million, 0.55% for the next $250 million and 0.45% for assets over $750 million; Small Cap Fund, 1.05% up to $500 million and 1.00% over $500 million; Mini-Cap Fund, 1.05%; and Legato Fund, 1.00% up to $500 million and 0.85% on assets over $500 million.
Forward Management has entered into investment sub-advisory agreements with Pictet Asset Management Ltd. (“PAM”) for International Equity Fund, International Small Companies Fund and Global Emerging Markets Fund; New York Life Investment Management LLC (“NYLIM”) and Forward Uniplan Advisors, Inc. (“Uniplan”) for Equity Income Fund; NYLIM for Stock Fund; Emerald Mutual Fund Advisers Trust for Banking and Finance Fund, Opportunities Fund and Growth Fund; Hoover Investment Management Co., LLC (“Hoover”) for Small Cap Fund and Mini-Cap Fund; Uniplan for the Real Estate Fund; Netols Asset Management Inc. (“Netols”), Conestoga Capital Investment Advisors, LLC (“CCA”) and Riverbridge Partners, LLC (“Riverbridge”) for Legato Fund (each a “Sub-Advisor”). Pursuant to these agreements, the Sub-Advisors provide investment sub-advisory services to the Funds and are entitled to receive a fee from Forward Management calculated daily and payable monthly at the following annual rates, based on each Fund’s average daily net assets (for the Equity Income Fund, Stock Fund and Legato Fund, based on the portion of the Fund that is managed by each Sub-Advisor): International Equity Fund, 0.45% on assets up to $250 million, 0.40% on assets over $250 million up to $1 billion and 0.35% on assets over $1 billion; International Small Companies Fund, 0.65%; Global Emerging Markets Fund, 0.80%; Equity Income Fund, pursuant to the sub-advisory agreement with NYLIM, 0.37% on assets less than $100 million, 0.32% on assets $100 million to less than $250 million, 0.27% on assets $250 million to less than $500 million and 0.22% on assets $500 million and over; Equity Income Fund, pursuant to the sub-advisory agreement with Uniplan, 0.41% on assets less than $100 million, 0.32% on assets $100 million to less than $500 million, 0.27% on assets $250 million to less than $500 million, and 0.24% on assets $500 million and over; Stock Fund, pursuant to the sub-advisory agreement with NYLIM, 0.45% on assets less than $100 million, 0.40% on assets $100 million to less than $250 million, 0.35% on assets $250 million to less than
Notes to Financial Statements (Unaudited)
$500 million and 0.30% on assets $500 million and over; Real Estate Fund, 0.60% on assets through $100 million, 0.55% on assets over $100 million through $500 million and 0.45% on assets over $500 million; Small Cap Fund, 0.70% on assets through $100 million and 0.55% on assets over $100 million; Mini-Cap Fund, 0.70% on assets through $100 million and 0.55% on assets over $100 million; and Legato Fund, 0.60%.
Effective January 1, 2006, Forward Management, the Funds’ investment advisor, took over direct management of a portion of the Stock Fund. Forward Management retains the entire fee for, and does not pay a sub-advisory fee with respect to, the portion of the portfolio of the Stock Fund that it directly manages.
Expense Limitations
The Investment Advisor has agreed to limit the total expenses of the Funds, exclusive of brokerage costs, interest, taxes, dividends and extraordinary expenses through the dates indicated to the annual rates stated below. Pursuant to these agreements, each Fund, except for the Growth Fund, Banking and Finance Fund and Opportunities Fund, will reimburse the Investment Advisor for any fee waivers or expense reimbursements made by the Advisor, provided that any such reimbursements made by a Fund to the Advisor will not cause the Fund’s expense limitation to exceed expense limitations in existence at the time the expense was incurred, or at the time of the reimbursement, whichever is lower, and the reimbursement is made within three years after the expenses were incurred.
Expense Limitations
| | | | | | | | | | | | | | |
| FUND | | INSTITUTIONAL
CLASS | | | INVESTOR
CLASS | | | CLASS A | | | CLASS C | | | END DATE |
International Equity(a) | | N/A | | | 1.29 | % | | N/A | | | N/A | | | January 1, 2007 |
International Small Companies | | 1.26 | % | | 1.56 | % | | 1.56 | % | | N/A | | | January 1, 2007 |
Global Emerging Markets(b) | | 1.39 | % | | 1.69 | % | | N/A | | | N/A | | | January 1, 2007 |
Equity Income | | N/A | | | 1.69 | % | | N/A | | | N/A | | | January 1, 2007 |
Stock | | N/A | | | 1.49 | % | | 1.49 | % | | N/A | | | January 1, 2007 |
Banking and Finance | | N/A | | | N/A | | | 2.35 | % | | 3.00 | % | | June 30, 2007 |
Opportunities(c) | | N/A | | | N/A | | | 1.99 | % | | 2.49 | % | | June 30, 2007 |
Real Estate | | N/A | | | 1.69 | % | | N/A | | | N/A | | | January 1, 2007 |
Growth | | N/A | | | N/A | | | 2.25 | % | | 2.90 | % | | June 30, 2007 |
Small Cap | | 1.34 | % | | 1.69 | % | | 1.69 | % | | N/A | | | January 1, 2007 |
Mini-Cap | | 1.23 | % | | 1.79 | % | | N/A | | | N/A | | | January 1, 2007 |
Legato (d) | | N/A | | | N/A | | | 1.79 | % | | N/A | | | January 1, 2007 |
(a) From January 2, 2006 to April 30, 2006, the Advisor contractually agreed to waive a portion of its fees in amounts necessary to limit the Fund’s Investor Class shares’ operating expenses to an annual rate (as a percentage of the Fund’s average daily net assets) of 1.69%.
(b) From January 2, 2006 to April 30, 2006, the Advisor contractually agreed to waive a portion of its fees in amounts necessary to limit the Fund’s Institutional Class and Investor Class shares’ operating expenses to an annual rate (as a percentage of the Fund’s average daily net assets) of 1.59% and 1.89%, respectively.
(c) From January 2, 2006 to April 30, 2006, the Advisor contractually agreed to waive a portion of its fees in amounts necessary to limit the Fund’s Class A and Class C shares’ operating expenses to an annual rate (as a percentage of the Fund’s average daily net assets) of 2.90% and 3.40%, respectively.
(d) From January 2, 2006 to April 30, 2006, the Advisor contractually agreed to waive a portion of its fees in amounts necessary to limit the Fund’s Class A shares’ operating expenses to an annual rate (as a percentage of the Fund’s average daily net assets) of 1.89%.
Notes to Financial Statements (Unaudited)
For the six months ended June, 2006, the fee waivers and/or reimbursements were as follows:
| | | | | | | | | | |
| FUND | | FEES WAIVED BY
ADVISOR | | RECOUPMENT OF
PAST WAIVED/
REIMBURSED
FEES BY ADVISOR | | | TOTAL |
International Equity | | $ | 32,875 | | $ | 0 | | | $ | 32,875 |
International Small Companies | | | 18,883 | | | 0 | | | | 18,883 |
Global Emerging Markets | | | 83,844 | | | 0 | | | | 83,844 |
Equity Income | | | 8,474 | | | (1,249 | ) | | | 7,225 |
Stock | | | 31,202 | | | 0 | | | | 31,202 |
Opportunities | | | 10,554 | | | N/A | (a) | | | 10,554 |
Small Cap | | | 39,913 | | | (19,743 | ) | | | 20,170 |
Mini-Cap | | | 36,124 | | | (11,605 | ) | | | 24,519 |
Legato | | | 14,823 | | | 0 | | | | 14,823 |
(a) Opportunities Fund does not have a recoupment plan.
At June 30, 2006, the balance of recoupable expenses for each Fund was:
| | | | | | | | | | | | | | | |
| FUND | | 2003 | | 2004 | | 2005 | | 2006 | | TOTAL |
International Equity | | $ | 84,748 | | $ | 82,632 | | $ | 134,862 | | $ | 32,875 | | $ | 335,117 |
International Small Companies | | | 0 | | | 379,991 | | | 379,970 | | | 18,883 | | | 778,844 |
Global Emerging Markets | | | N/A | | | 99,444 | | | 296,908 | | | 83,844 | | | 480,196 |
Equity Income | | | 175,961 | | | 79,228 | | | 52,666 | | | 8,474 | | | 316,329 |
Stock | | | 178,542 | | | 133,688 | | | 151,523 | | | 31,202 | | | 494,955 |
Small Cap | | | 53,297 | | | 43,565 | | | 714,343 | | | 39,913 | | | 851,118 |
Mini-Cap | | | 114,887 | | | 88,725 | | | 78,439 | | | 36,124 | | | 318,174 |
Legato | | | N/A | | | N/A | | | 79,728 | | | 14,823 | | | 94,551 |
4. Distribution Plans and Shareholder Services Plans
The Funds have adopted service and distribution plans pursuant to Rule 12b-1 under the 1940 Act (each a “Distribution Plan” and collectively “Distribution Plans”). Under the Distribution Plan for the Investor Class shares of International Equity Fund, International Small Companies Fund, Global Emerging Markets Fund, Equity Income Fund, Stock Fund, Real Estate Fund, Small Cap Equity Fund and Mini-Cap Fund, the Funds pay distribution fees on a monthly basis at an annual rate up to 0.25% of each Fund’s average daily net assets. Under the Distribution Plan for the Class A shares of the International Small Companies Fund, Stock Fund, Small Cap Fund and Legato Fund, the Funds pay distribution fees on a monthly basis at an annual rate up to 0.35% of each Fund’s average daily net assets.
Under the Distribution Plans for the Class A shares of the Growth Fund, the Banking and Finance Fund and the Opportunities Fund, the Growth Fund and Banking and Finance Fund will each reimburse the Distributor at an annual rate up to 0.35% and the Opportunities Fund will reimburse the distributor at an annual rate up to 0.50% of the average net assets attributable to the Class A shares of each of the Funds. Under the Distribution Plan for the Class C shares of the Growth Fund, the Banking and Finance Fund and the Opportunities Fund, each Fund will pay the Distributor at an annual rate of 1.00%, payable monthly, of which 0.25% is a shareholder servicing fee and 0.75% is for distribution-related expenses, of the average daily net assets attributable to the Class C shares of each of the Funds.
Notes to Financial Statements (Unaudited)
In addition, the Investor Class shares of the International Equity Fund, Global Emerging Markets Fund, Real Estate Fund and Mini-Cap Fund; the Investor Class shares and Class A shares of the International Small Companies Fund, Stock Fund and Small Cap Fund; and the Institutional Class and Class A shares of the Legato Fund have a shareholder services plan (the “Shareholder Services Plan”) that may be used to pay shareholder servicing fees at an annual rate of up to 0.10% of each Fund’s average daily net assets.
The expenses of the Distribution and Shareholder Services Plans are reflected as distribution and service fees in the Statement of Operations. Institutional Class shares of the International Small Companies Fund, Global Emerging Markets Fund, Small Cap Fund and Mini-Cap Fund are not subject to distribution or shareholder service fees.
ALPS Distributors, Inc. (the “Distributor”) serves as the Funds’ distributor. The Distributor acts as an agent for the Funds and the distributor of their shares.
The Trust has entered into an administration agreement with ALPS Mutual Fund Services, Inc. (“AMFS”), pursuant to which AMFS serves as the administrator of the Funds. For International Equity Fund, International Small Companies, Global Emerging Markets Fund, Equity Income Fund, Stock Fund, Real Estate Fund, Small Cap Fund, Mini-Cap Fund and Legato Fund, this agreement became effective March 1, 2006 and prior to that time PFPC Inc. (“PFPC”), an indirect wholly owned subsidiary of PNC Financial Services Group, Inc., was the administrator for those Funds. For the Banking and Finance Fund, Opportunities Fund and Growth Fund, the agreement became effective September 12, 2005 and prior to that time, Citco Mutual Fund Services, Inc. was the administrator for those Funds.
ALPS Mutual Fund Services, Inc. serves as the Trust’s transfer agent and dividend paying agent.
Brown Brothers Harriman & Co. (“BBH”) is the Funds’ custodian.
5. Directors
The overall responsibility for oversight of the Funds rests with the Trustees of the Trust. As of June 30, 2006, there were six Trustees, five of whom are not “interested persons” of the Trust within the meaning of that term under the 1940 Act (each, an “Independent Trustee”). The Funds pay each Independent Trustee a retainer fee in the amount of $12,000 per year, $3,625 each per regular meeting and $1,000 each for attendance in person at each special meeting that is not held in conjunction with a regular meeting, and $750 for attendance at a special telephonic meeting. The Chairman of the Board of Trustees and the Chairman of the Audit Committee each receive a special retainer fee in the amount of $6,000 per year. The interested Trustee receives no compensation from the Funds.
6. Indemnifications
Under the Funds’ organizational documents, its officers and Trustees are indemnified against certain liability arising out of the performance of their duties to the Funds. In addition, in the normal course of business, the Funds enter into contracts with vendors and others that provide general indemnification. The Funds’ maximum exposure under these arrangements is unknown, as this would involve future claims that may be made against the Funds. Based on experience, however, the Funds expect the risk of loss to be remote.
7. Shares of Beneficial Interest
The capitalization of the Trust consists of an unlimited number of shares of beneficial interest with no par value per share. The Board of Trust - -
Notes to Financial Statements (Unaudited)
ees may establish additional Funds and classes of shares at any time in the future without shareholder approval. Holders of shares of the Funds of the Trust have one vote for each share held and a proportionate fraction of a vote for each fractional share. All shares issued and outstanding are fully paid and are non-assessable, transferable and redeemable at the option of the shareholder. Shares have no pre-emptive rights.
Shares exchanged or redeemed within 180 days of purchase (60 days for the Equity Income Fund and Stock Fund) incur a fee of 2.00% of the total redemption amount. Such redemption fees are reflected in the “cost of shares redeemed” in the Statement of Changes in Net Assets. The redemption fees retained by International Equity Fund, International Small Companies Fund, Global Emerging Markets Fund, Equity Income Fund, Stock Fund, Banking and Finance Fund, Opportunities Fund, Real Estate Fund, Growth Fund, Small Cap Fund and Mini-Cap Fund for the six months ended June 30, 2006, were $3,051, $198,607, $20,432, $705, $1,186, $5,108, $524, $1,830, $4,727, $193,820 and $9,759, respectively. During that same period there were no redemption fees retained by Legato Fund.
The following entities owned of record or beneficially, as of June 30, 2006, 5% or greater of any class of the Funds outstanding equity securities:
| | | | | |
| FUND | | NAME | | PERCENTAGE | |
International Equity Investor Class | | Sutton Place Associates, LLC | | 79.45 | % |
| | ReFlow Management Co., LLC | | 9.08 | % |
| | |
International Small Companies Investor Class | | Charles Schwab & Co., Inc. | | 50.00 | % |
| | National Financial Services Corp. | | 13.88 | % |
| | |
International Small Companies
Institutional Class | | Charles Schwab & Co., Inc. | | 56.22 | % |
| | Muir & Co. | | 10.26 | % |
| | National Financial Services Corp. | | 6.28 | % |
| | Brown Brothers Harriman & Co | | 5.91 | % |
| | |
International Small Companies
Class A | | Sutton Place Associates, LLC | | 83.07 | % |
| | |
Global Emerging Markets
Investor Class | | Sutton Place Associates, LLC | | 49.17 | % |
| | ReFlow Management Co., LLC | | 9.80 | % |
| | National Financial Services Corp. | | 9.15 | % |
| | Charles Schwab & Co., Inc. | | 7.95 | % |
| | |
Global Emerging Markets
Institutional Class | | Brown Brothers Harriman & Co. | | 41.52 | % |
| | Charles Schwab & Co., Inc. | | 10.97 | % |
| | Ellard & Co. | | 10.89 | % |
| | National Financial Services Corp. | | 10.48 | % |
| | |
Equity Income Investor Class | | Sutton Place Associates, LLC | | 52.82 | % |
| | Sierra Club | | 10.24 | % |
| | ReFlow Management Co., LLC | | 5.94 | % |
Notes to Financial Statements (Unaudited)
| | | | | |
| FUND | | NAME | | PERCENTAGE | |
Stock Fund Investor Class | | Sierra Club | | 35.44 | % |
| | Charles Schwab & Co., Inc. | | 23.66 | % |
| | National Financial Services Corp. | | 12.36 | % |
| | |
Stock Fund Class A | | Sutton Place Associates, LLC | | 51.48 | % |
| | ReFlow Management Co., LLC | | 31.70 | % |
| | Forward Management, LLC | | 15.75 | % |
| | |
Banking and Finance Class A | | Merrill Lynch Pierce Fenner & Smith | | 7.00 | % |
| | |
Banking and Finance Class C | | Merrill Lynch Pierce Fenner & Smith | | 22.57 | % |
| | |
Opportunities Class A | | Sutton Place Associates, LLC | | 25.69 | % |
| | |
Real Estate Investor Class | | Sutton Place Associates, LLC | | 45.32 | % |
| | Charles Schwab & Co., Inc. | | 31.40 | % |
| | |
Growth Class A | | Merrill Lynch Pierce Fenner & Smith | | 35.35 | % |
| | Salomon Smith Barney, Inc. | | 14.08 | % |
| | |
Growth Class C | | Merrill Lynch Pierce Fenner & Smith | | 6.53 | % |
| | |
Small Cap Investor Class | | Charles Schwab & Co., Inc. | | 36.29 | % |
| | National Financial Services Corp. | | 13.22 | % |
| | Muir & Co. | | 8.83 | % |
| | New York Life Trust Co. | | 5.89 | % |
| | |
Small Cap Institutional Class | | Charles Schwab & Co., Inc. | | 75.61 | % |
| | National Financial Services Corp. | | 9.79 | % |
| | |
Small Cap Class A | | Sutton Place Associates, LLC | | 76.49 | % |
| | ReFlow Management Co., LLC | | 11.30 | % |
| | Forward Management, LLC | | 5.65 | % |
| | |
Mini-Cap Investor Class | | Charles Schwab & Co., Inc. | | 36.59 | % |
| | Sutton Place Associates, LLC | | 34.81 | % |
| | National Financial Services Corp. | | 14.18 | % |
| | |
Mini-Cap Institutional Class | | Lepick & Co. | | 42.11 | % |
| | Charles Schwab & Co., Inc. | | 31.61 | % |
| | |
Legato Class A | | Sutton Place Associates, LLC | | 82.10 | % |
| | Create Foundation | | 9.89 | % |
| | Franklin Development | | 6.72 | % |
Sutton Place Associates, LLC and ReFlow Management Co., LLC are entities under common control with Forward Management.
Notes to Financial Statements (Unaudited)
8. Purchases and Sales of Investments
Investment transactions for the six months ended June 30, 2006, excluding temporary short-term investments, were as follows:
| | | | | | |
| FUND | | COST OF
INVESTMENTS
PURCHASED | | PROCEEDS FROM
INVESTMENTS
SOLD |
International Equity | | $ | 13,030,465 | | $ | 11,614,562 |
International Small Companies | | | 307,640,148 | | | 114,705,908 |
Global Emerging Markets | | | 26,815,149 | | | 19,652,361 |
Equity Income | | | 11,861,509 | | | 13,392,406 |
Stock | | | 26,037,050 | | | 22,865,302 |
Banking and Finance | | | 49,115,723 | | | 80,569,654 |
Opportunities | | | 18,491,606 | | | 14,310,767 |
Real Estate | | | 3,656,716 | | | 7,308,256 |
Growth | �� | | 79,941,642 | | | 82,870,353 |
Small Cap | | | 556,067,243 | | | 455,741,570 |
Mini-Cap | | | 67,777,436 | | | 65,999,815 |
Legato | | | 3,010,304 | | | 1,708,021 |
9. Tax Basis Information
Tax Basis of Investments: At June 30, 2006, the aggregate cost of investments, gross unrealized appreciation/(depreciation) and net unrealized appreciation/(depreciation) for Federal tax purposes was as follows:
| | | | | | | | | | | | | |
| FUND | | COST OF
INVESTMENTS | | GROSS
UNREALIZED
APPRECIATION | | GROSS
UNREALIZED
DEPRECIATION | | | NET UNREALIZED
APPRECIATION/
(DEPRECIATION) |
International Equity | | $ | 25,175,643 | | $ | 4,504,068 | | $ | (985,004 | ) | | $ | 3,519,064 |
International Small Companies | | | 397,772,275 | | | 58,151,155 | | | (20,336,824 | ) | | | 37,814,331 |
Global Emerging Markets | | | 39,780,926 | | | 8,277,286 | | | (1,721,081 | ) | | | 6,556,205 |
Equity Income | | | 26,342,823 | | | 3,208,284 | | | (671,567 | ) | | | 2,536,717 |
Stock | | | 31,321,647 | | | 2,159,111 | | | (1,507,409 | ) | | | 651,702 |
Banking and Finance | | | 215,274,330 | | | 67,727,227 | | | (3,255,588 | ) | | | 64,471,639 |
Opportunities | | | 12,727,619 | | | 798,748 | | | (442,364 | ) | | | 356,384 |
Real Estate | | | 25,088,849 | | | 19,457,446 | | | (704,035 | ) | | | 18,753,411 |
Growth | | | 146,525,735 | | | 50,825,802 | | | (7,190,595 | ) | | | 43,635,207 |
Small Cap | | | 455,263,834 | | | 58,242,785 | | | (12,018,989 | ) | | | 46,223,796 |
Mini-Cap | | | 41,235,047 | | | 5,422,522 | | | (766,312 | ) | | | 4,656,210 |
Legato | | | 7,780,271 | | | 1,170,764 | | | (415,336 | ) | | | 755,428 |
Notes to Financial Statements (Unaudited)
Post October Loss: Under the current tax law, capital and currency losses realized after October 31 may be deferred and treated as occurring on the first day of the following fiscal year. For the fiscal year ended December 31, 2005, the Funds elected to defer capital losses and currency losses occurring between November 1, 2005 and December 31, 2005 as follows:
| | | |
| FUND | | F/X LOSS |
Real Estate | | $ | 47 |
International Small Companies | | $ | 59,592 |
Capital Loss Carryforwards: At December 31, 2005 the following Funds had available for Federal income tax purposes unused capital losses as follows:
| | | | | | | | | | | | | | | | |
FUND | | EXPIRING
IN 2006 | | 2007 | | 2008 | | 2009 | | 2010 | | 2011 |
International Equity | | — | | — | | | — | | | — | | | — | | $ | 323,448 |
Global Emerging Markets | | — | | — | | $ | 3,651,293 | | $ | 2,015,691 | | | — | | | — |
Opportunities | | — | | — | | | — | | $ | 5,473,892 | | $ | 1,848,987 | | | — |
During the six months ended December 31, 2005, the Opportunities Fund utilized capital loss carryovers of $639,096. During the year ended June 30, 2005, the Opportunities Fund utilized capital loss carryovers of $445,067.
10. Portfolio of Investments
The investment categories used in this report may differ from the industry classification categories used for determining compliance with industry concentration restrictions and requirements applicable to each of the Funds.
Notes to Financial Statements for year ended December 31, 2005 (Audited)
These Notes relate to Forward International Equity Fund, Forward Hoover Small Cap Equity Fund, Forward Hoover Mini-Cap Fund, Forward Global Emerging Markets Fund, Forward International Small Companies Fund, Forward Uniplan Real Estate Investment Fund and Forward Legato Fund, which were included in the Trust at December 31, 2005, and have been included because of a restatement to the Forward Uniplan Real Estate Investment Fund.
Because Note 2 is new, references in the Financial Statements for year ended December 31, 2005 to Notes 2 through 12 are changed to 3 through 13.
1. Organization
Forward Funds (the “Trust”), is an open-end management investment company registered under the Investment Company Act of 1940, as amended (the “1940 Act”). The Trust was organized as a Pennsylvania common law trust on August 26, 1992 under the name HomeState Group and was reorganized effective April 7, 2005 as a Delaware statutory trust created on February 1, 2005. At December 31, 2005, the Trust offered twelve investment portfolios. This annual report describes seven portfolios offered by the Trust. The accompanying financial statements and financial highlights are those of the Forward International Equity Fund (prior to September 1, 2005, the Forward International Equity Fund was called the Forward Hansberger International Growth Fund) (the “International Equity Fund”), the Forward Hoover Small Cap Equity Fund (the “Small Cap Fund”), the Forward Hoover Mini-Cap Fund (the “Mini-Cap Fund”), the Forward Global Emerging Markets Fund (the “Global Emerging Markets Fund”), the Forward International Small Companies Fund (the “International Small Companies Fund”), the Forward Uniplan Real Estate Investment Fund (the “Real Estate Fund”) and the Forward Legato Fund (the “Legato Fund”) (each a “Fund” and collectively the “Funds”). The Funds are successor mutual funds to previously operational funds (the “Predecessor Forward Funds,” each a “Predecessor Forward Fund”), which were series of a separate legal entity called Forward Funds, Inc. (the “Predecessor Company”), a Maryland corporation incorporated on October 3, 1997. The Predecessor Forward Funds were reorganized into the Funds effective after the close of business on June 30, 2005. Any reference in this annual report to events that occurred, payments that were made, and the financial data and information in this annual report prior to June 30, 2005 for the Funds relates to the Predecessor Forward Funds or Predecessor Company. The investment objective, policies and restrictions of each Fund and its respective Predecessor Forward Fund are substantially identical. Each Fund described in this annual report, except the Real Estate Fund, is a diversified portfolio as defined under the 1940 Act. The Sierra Club Stock Fund, the Sierra Club Equity Income Fund, the Forward Emerald Growth Fund, the Forward Emerald Opportunities Fund and the Forward Emerald Banking and Finance Fund have disclosed their financial statements and financial highlights in two separate annual reports.
The Small Cap Fund and Mini-Cap Fund seek to achieve high total returns and they invest primarily in the equity securities of companies that have small market capitalizations and offer future growth potential. The Real Estate Fund seeks income with capital appreciation as a secondary goal and invests in real estate securities, including real estate investment trusts (“REITs”); the International Equity Fund seeks to achieve high total returns and invests primarily in the equity securities of companies organized or located outside of the United States. The Global Emerging Markets Fund seeks to
Notes to Financial Statements for year ended December 31, 2005 (Audited) (continued)
achieve long-term growth of capital and invests primarily in the equity securities of emerging market countries. The International Small Companies Fund seeks to achieve long-term growth of capital and invests in equity securities of companies with small market capitalizations located outside the United States. The Legato Fund seeks to achieve high total returns and invests primarily in the equity securities of companies that have small market capitalizations and offer future growth potential.
2. Restatement
In the Real Estate Fund’s previously issued December 31, 2005 Annual Report to Shareholders, the Fund incorrectly classified return of capital distributions from real estate investment trust securities held in the Fund’s portfolio in prior years by presenting them as investment income in the Statements of Operations, of Changes in Net Assets and the Financial Highlights. This misclassification has no impact on the amounts previously reported for net asset value, net asset value per share, distributions paid, amounts of taxable income reported to shareholders, total return, portfolio turnover rate, security valuation, or net change in net assets from operations. The Fund’s financial statements have accordingly been restated to reclassify amounts reported as investment income, net realized gain and change in unrealized appreciation on investments in the Statements of Operations and of Changes in Net Assets for the years ended December 31, 2005 and 2004 and to revise the net investment income per share, net realized and unrealized gain/(loss) on investments per share and the ratio of net investment income to average net assets for each of the five years ended December 31, 2005, as presented in the Financial Highlights. In addition, the cost of investment securities as of December 31, 2005 as previously disclosed in the
Fund’s Portfolio of Investments and Statement of Assets and Liabilities, along with net unrealized appreciation on investments, other components of net assets, and certain other amounts in the Fund’s notes to financial statements have been restated as discussed below.
The Fund’s Schedule of Investments and Statement of Assets and Liabilities as of December 31, 2005 have not been presented in these financial statements because only the amounts discussed herein were restated. To read the Fund’s audited Schedule of Investments and Statement of Assets and Liabilities as of December 31, 2005, after taking into account the matters discussed in this Note, refer to the Trust’s Form N-CSR, which was filed with the Securities and Exchange Commission on March 10, 2006.
The amounts before and after restatement for the Real Estate Fund are shown in the table below.
| | | | | | | |
| | | AS ORIGINALLY
REPORTED | | RESTATED | |
| Portfolio of Investments — Cost | | | | | | | |
| At December 31, 2005 | | | | | | | |
Total Common Stocks | | $ | 27,004,846 | | $ | 26,468,337 | |
Total Investments | | $ | 29,349,955 | | $ | 28,813,446 | |
| | |
| | | AS ORIGINALLY
REPORTED | | RESTATED | |
| Statement of Assets and Liabilities | | | | | | | |
| At December 31, 2005 | | | | | | | |
Accumulated net realized gain/(loss) on investments and foreign currency transactions | | $ | 529,001 | | $ | (7,508 | ) |
Net unrealized appreciation on investments and translation of asset and liabilities in foreign currencies | | $ | 15,746,291 | | $ | 16,282,800 | |
Investments, at cost | | $ | 29,349,955 | | $ | 28,813,446 | |
| | |
| | | AS ORIGINALLY
REPORTED | | RESTATED | |
| Statement of Operations | | | | | | | |
| Year Ended December 31, 2005 | | | | | | | |
| INVESTMENT INCOME: | | | | | | | |
Dividends | | $ | 1,985,809 | | $ | 1,666,307 | |
Total investment income | | $ | 2,001,180 | | $ | 1,681,678 | |
NET INVESTMENT INCOME | | $ | 1,202,387 | | $ | 882,885 | |
Net realized gain on investments | | $ | 2,875,816 | | $ | 3,193,635 | |
Net change in unrealized appreciation on investments | | $ | 355,668 | | $ | 357,351 | |
Notes to Financial Statements for year ended December 31, 2005 (Audited) (continued)
| | | | | | |
| | | AS ORIGINALLY
REPORTED | | RESTATED |
| Statement of Changes in Net Assets | | | | | | |
| Year Ended December 31, 2005 | | | | | | |
Net investment income | | $ | 1,202,387 | | $ | 882,885 |
Net realized gain on investments | | | 2,875,816 | | | 3,193,635 |
Net realized gain on foreign currency | | | 58 | | | 58 |
Net change in unrealized appreciation on investments | | | 355,616 | | | 357,299 |
| | | | | | |
Net increase in net assets from operations | | $ | 4,433,877 | | $ | 4,433,877 |
| | | | | | |
| | |
| | | AS ORIGINALLY
REPORTED | | RESTATED |
| Statement of Changes in Net Assets | | | | | | |
| Year Ended December 31, 2004 | | | | | | |
Net investment income | | $ | 1,344,539 | | $ | 945,295 |
Net realized gain on investments | | | 2,687,104 | | | 2,883,186 |
Net realized gain on foreign currency | | | 2 | | | 2 |
Net change in unrealized appreciation on investments | | | 7,139,219 | | | 7,342,381 |
| | | | | | |
Net increase in net assets from operations | | $ | 11,170,864 | | $ | 11,170,864 |
| | | | | | |
| | | | | | | | |
| | | AS ORIGINALLY
REPORTED | | | RESTATED | |
| Per Share Financial Highlights | | | | | | | | |
| Year Ended December 31, | | | | | | | | |
Net Investment Income: | | | | | | | | |
2005 | | $ | 0.45 | | | $ | 0.33 | |
2004 | | $ | 0.48 | | | $ | 0.34 | |
2003 | | $ | 0.39 | | | $ | 0.30 | |
2002 | | $ | 0.44 | | | $ | 0.40 | |
2001 | | $ | 0.52 | | | $ | 0.45 | |
Net realized and unrealized gain/(loss) on investments: | | | | | | | | |
2005 | | $ | 1.35 | | | $ | 1.47 | |
2004 | | $ | 3.48 | | | $ | 3.62 | |
2003 | | $ | 2.76 | | | $ | 2.85 | |
2002 | | $ | (0.02 | ) | | $ | 0.02 | |
2001 | | $ | 0.70 | | | $ | 0.77 | |
Ratio to average net assets: | | | | | | | | |
Net investment income including reimbursement/waiver | | | | | | | | |
2005 | | | 2.69 | % | | | 1.98 | % |
2004 | | | 3.17 | % | | | 2.23 | % |
2003 | | | 3.30 | % | | | 2.50 | % |
2002 | | | 4.03 | % | | | 3.63 | % |
2001 | | | 4.63 | % | | | 3.98 | % |
| | | | | | | | |
| | | AS ORIGINALLY
REPORTED | | | RESTATED | |
| Notes to Financial Statements | | | | | | | | |
| 9. Tax Basis Information | | | | | | | | |
| Reclassifications: | | | | | | | | |
Increase/(Decrease) Accumulated Net Investment Income/(Loss) | | $ | (442,582 | ) | | $ | (123,080 | ) |
Increase/(Decrease) Accumulated Net Realized Gain/(Loss) | | $ | 569,836 | | | $ | 250,334 | |
3. Significant Accounting Policies
The preparation of financial statements in conformity with accounting principles generally accepted in the United States of America requires management to make estimates and assumptions that affect the reported amounts and disclosures in the financial statements. Actual results could differ from those estimates. The following is a summary of the significant accounting policies consistently followed by each Fund in the preparation of its financial statements. These policies are in conformity with accounting principles generally accepted in the United States of America.
Portfolio Valuation: Portfolio securities listed or traded on a nationally recognized securities exchange or traded in the U.S. over-the-counter market for which market quotations are readily available are valued at the last quoted sale price or a market’s official closing price as of the close of business on the day the securities are being valued. If there were no sales that day, the security is valued at the mean of the closing bid and ask price. Portfolio securities which are primarily traded on foreign securities exchanges are valued at the last quoted sale price of such securities on their respective exchanges. Investments in short-term obligations that mature in 60 days or less are valued at amortized cost, which approximates fair value. All other securities and other assets are carried at their fair value as determined in good faith by or under the direction of the Board of Trustees. The Funds generally value their holdings, including fixed income securities, through the use of independent pricing agents,
Notes to Financial Statements for year ended December 31, 2005 (Audited) (continued)
except for securities for which a ready market does not exist, which are valued under the direction of the Board of Trustees or by the Sub-Advisors using methodologies approved by the Board of Trustees. The valuation methodologies include, but are not limited to, the analysis of the effect of any restrictions on the sale of the security, product development and trends of the security’s issuer, changes in the industry and other competing companies, significant changes in the issuer’s financial position and any other event that could have a significant impact on the value of the security.
Securities Transactions and Investment Income: Securities transactions are accounted for on a trade date basis. Net realized gains or losses on sales of securities are determined by the identified cost method. Interest income, adjusted for accretion of discounts and amortization of premiums, is recorded on the accrual basis. Dividend income is recorded on the ex-dividend date, except that certain dividends from foreign securities where the ex-dividend date may have passed are recorded as soon as a Fund is informed of such dividends in the exercise of reasonable diligence.
Foreign Currency Translation: The books and records of the Funds are maintained in U.S. dollars. Investment valuations and other assets and liabilities initially expressed in foreign currencies are converted each business day into U.S. dollars based upon current exchange rates. Purchases and sales of foreign investments and income and expenses are converted into U.S. dollars based upon exchange rates prevailing on the respective dates of such transactions. The portion of unrealized gains or losses on investments due to fluctuations in foreign currency exchange rates is not separately disclosed.
Distributions to Shareholders: Dividends from net investment income are declared and paid annually for the International Equity Fund, Small Cap Fund, Mini-Cap Fund, Global Emerging Markets Fund, International Small Companies Fund, Legato Fund and monthly for the Real Estate Fund. Net realized capital gains, if any, are distributed at least annually.
Income and capital gain distributions are determined in accordance with Federal income tax regulations, which may differ from accounting principles generally accepted in the United States of America. Therefore, the source of the Funds’ distributions may be shown in the accompanying financial statements as either from or in excess of net investment income or net realized gain, or from paid-in-capital, depending upon the type of book/tax differences that may exist.
A portion of the dividend income recorded by the Real Estate Fund is from distributions by publicly traded REITs, and such distributions may also consist of capital gains and return of capital for tax purposes. The actual return of capital and capital gains portions of such distributions may be determined by formal notifications from the REITs subsequent to the calendar year-end. Distributions received from the REITs that are determined to be a return of capital, are recorded by the Fund as a reduction of the cost basis of the securities held.
Federal Income Taxes: The Trust treats each Fund as a separate entity for Federal income tax purposes. Each Fund intends to continue to qualify each year as a “regulated investment company” under Subchapter M of the Internal Revenue Code of 1986, as amended (the “Code”). By so qualifying, each Fund will not be subject to Federal income taxes to the extent that it distributes substantially all of its taxable or tax-exempt income, if any, for its tax year ending December 31. In addition, by distributing in each calendar year substantially all of its net investment income, capital gains and certain other amounts, if any, each Fund will not be subject to a Federal excise tax. Therefore, no provision is
Notes to Financial Statements for year ended December 31, 2005 (Audited) (continued)
made by the Funds for Federal income or excise taxes. Withholding taxes on foreign dividends have been paid or provided for in accordance with the applicable country’s tax rules and rates.
Expenses: Expenses that are specific to a Fund are charged directly to that Fund. Expenses that are common to all Funds generally are allocated among the Funds in proportion to their average daily net assets. For Funds offering multiple share classes, all of the realized and unrealized gains and losses and net investment income, other than class specific expenses, are allocated daily to each class in proportion to its average daily net assets.
ReFlow Transactions: The Funds may participate in ReFlow, a program designed to provide an alternative liquidity source for mutual funds experiencing redemptions of their shares. In order to pay cash to shareholders who redeem their shares on a given day, a mutual fund typically must hold cash in its portfolio, liquidate portfolio securities, or borrow money, all of which impose certain costs on the fund. ReFlow provides participating mutual funds with another source of cash by standing ready to purchase shares from a fund equal to the amount of the fund’s net redemptions on a given day. ReFlow then generally redeems those shares when the fund experiences net sales. In return for this service, the Fund will pay a fee to ReFlow at a rate determined by a daily auction with other participating mutual funds. The costs to a Fund for participating in ReFlow are expected to be influenced by and comparable to the cost of other sources of liquidity, such as the Fund’s short-term lending arrangements or the costs of selling portfolio securities to meet redemptions. ReFlow will be prohibited from acquiring more than 3% of the outstanding voting securities of any Fund. The Funds will waive their redemption fee with respect to redemptions by ReFlow.
ReFlow Management Co., LLC, the entity which facilitates the day to day operations of ReFlow, is under common control with Forward Management, LLC the investment advisor to the Funds. In light of this, the Board of Trustees has adopted certain procedures to govern the Funds’ participation in ReFlow. During the year ended December 31, 2005, ReFlow fees which were incurred by the Small Cap Fund, Mini-Cap Fund, Real Estate Fund, International Equity Fund, Global Emerging Markets Fund and International Small Companies Fund were $14,073, $1,142, $3,283, $2,946, $5,099, $8,641, respectively.
Cash Management Transactions: The Funds subscribe to the Brown Brothers Harriman & Co. (“BBH&Co.”) Cash Management Service (“CMS”). The BBH&Co. CMS is an investment product that automatically sweeps the Funds’ cash balances into overnight offshore time deposits with either BBH&Co.’s Grand Cayman branch or branches of pre-approved world class commercial banks. This fully automated program allows the Funds to earn interest on cash balances while remaining diversified. Excess cash invested with deposit institutions domiciled outside of the United States, as with any offshore deposit, may be subject to sovereign actions in the jurisdiction of the deposit institution including, but not limited to, freeze, seizure, or diminution. The Funds bear the risk associated with the repayment of principal and payment of interest on such instruments by the institution with which the deposit is ultimately placed. Balances in the CMS are accounted for on a cost basis.
4. Investment Management Services
The Trust has entered into an investment management agreement with Forward Management, LLC (“Forward Management” or the “Advisor”) pursuant to which Forward Management provides investment management services to the Funds and is entitled to receive a fee calculated
Notes to Financial Statements for year ended December 31, 2005 (Audited) (continued)
daily and payable monthly at the following annual rates, as of December 31, 2005, based on each Fund’s average daily net assets: International Equity Fund, 0.85% up to $250 million, 0.75% over $250 million up to $1 billion, 0.65% over $1 billion; Small Cap Fund, 1.05%; Mini-Cap Fund, 1.05%; Global Emerging Markets Fund, 1.25%; International Small Companies Fund, 1.00%; Real Estate Fund, 0.85% up to $100 million, 0.80% over $100 million up to $500 million and 0.70% on assets over $500 million; and Legato Fund, 1.00% up to $500 million, 0.85% on assets over $500 million.
Prior to September 1, 2005, the International Equity Fund was known as the Forward Hansberger International Growth Fund and the fee was 0.85% up to $50 million, 0.75% over $50 million up to $100 million, 0.65% over $100 million up to $250 million, 0.60% over $250 million up to $500 million and 0.55% over $500 million.
As of January 1, 2006, the fee for the Small Cap Fund will be 1.05% up to $500 million and 1.00% over $500 million; the fee for the Global Emerging Markets Fund will be 1.25% up to $500 million, 1.20% over $500 million up to $1 billion, and 1.15% over $1 billion; and the fee for the International Small Companies Fund will be 1.00% up to $1 billion and 0.95% over $1 billion.
Forward Management has entered into investment sub-advisory agreements with Hoover Investment Management Co., LLC (“Hoover”) for the Small Cap Fund and Mini-Cap Fund; Pictet Asset Management Ltd. (formerly known as Pictet International Management Ltd.) (“Pictet”) for the Global Emerging Markets Fund, the International Equity Fund, and the International Small Companies Fund; Forward Uniplan Advisors, Inc. (“Uniplan”) for the Real Estate Fund and Netols Asset Management Inc. (“Netols”), Conestoga Capital Investment Advisors, LLC (“CCA”) and Riverbridge Partners, LLC (“Riverbridge”) for the Legato Fund (each a “Sub- Advisor”). Pursuant to these agreements, the Sub-Advisors provide investment sub-advisory services to the Funds and are entitled to receive a fee from Forward Management calculated daily and payable monthly at the following annual rates, as of December 31, 2005, based on each Fund’s average daily net assets: International Equity Fund, 0.45% on assets up to $250 million, 0.40% on assets over $250 million up to $1 billion, 0.35% on assets over $1 billion; Small Cap Fund, 0.70% on the first $100 million and 0.60% on assets over $100 million; Mini-Cap Fund, 0.70% on the first $100 million and 0.60% on assets over $100 million; Global Emerging Markets Fund, 0.65%; International Small Companies Fund, 0.65%; Real Estate Fund, 0.60% on the first $100 million, 0.55% on the next $400 million and 0.45% on assets over $500 million; and Legato Fund, 0.60%. The fees payable to each Sub-Advisor for the Legato Fund are computed with respect to the portion of the Fund’s portfolio allocated to the respective Sub-Advisor.
Prior to September 1, 2005, the International Equity Fund was known as the Forward Hansberger International Growth Fund and the Sub-Advisor was Hansberger Global Investors, Inc. (“HGI”). The fee payable from Forward to HGI was 0.50%.
As of January 1, 2006, the sub-advisory fee for the Small Cap Fund will be 0.70% on the first $100 million and 0.55% on assets over $100 million.
Waiver of Fees: The Advisor contractually agreed to waive a portion of its fees and/or reimburse certain expenses. These waivers and/or reimbursements continued until January 1, 2006 for all the funds except for the Legato Fund, for which these waivers and/or reimbursements will continue through May 1, 2006. As a result of such waivers, the total annual fund operating expenses (as a percentage of net assets) for the year ended December 31, 2005 were limited to
Notes to Financial Statements for year ended December 31, 2005 (Audited) (continued)
1.69% for the International Equity Fund, 1.69% for the Small Cap Fund Investor Class, 1.34% for the Small Cap Fund Institutional Class, 1.69% for the Small Cap Fund Class A, 1.99% for the Mini-Cap Fund Investor Class, 1.43% for the Mini-Cap Fund Institutional Class, 1.95% for the Global Emerging Markets Fund Investor Class, 1.70% for the Global Emerging Markets Fund Institutional Class, 1.45% for the International Small Companies Fund Investor Class, 1.20% for the International Small Companies Fund Institutional Class, 1.78% for the International Small Companies Fund Class A, 1.79% for the Real Estate Fund and 1.89% for the Legato Fund Class A shares. Any waiver or reimbursement by the Advisor is subject to recoupment from the Fund within the three years following the date on which the expense was incurred, to the extent such recoupment would not cause total expenses to exceed the expense limitations in existence at the time the expense was incurred, or at the time of the reimbursement, whichever is lower.
For the year ended December 31, 2005, the fee waivers and/or reimbursements were as follows:
| | | | | | | | | | | |
| FUND | | FEES WAIVED BY
ADVISOR | | RECOUPMENT OF
PAST WAIVED/
REIMBURSED
FEES BY ADVISOR | | | TOTAL | |
Small Cap | | $ | 714,343 | | | — | | | $ | 714,343 | |
Mini-Cap | | | 78,439 | | $ | (9,349 | ) | | | 69,090 | |
Real Estate | | | — | | | (80,300 | ) | | | (80,300 | ) |
International Equity | | | 134,862 | | | — | | | | 134,862 | |
Global Emerging Markets | | | 296,908 | | | — | | | | 296,908 | |
International Small Companies | | | 379,970 | | | — | | | | 379,970 | |
Legato | | | 79,728 | | | — | | | | 79,728 | |
At December 31, 2005, the balance of recoupable expenses for each Fund was:
| | | | | | | | | | | | |
| FUND | | 2003 | | 2004 | | 2005 | | TOTAL |
Small Cap | | $ | 73,040 | | $ | 43,565 | | $ | 714,343 | | $ | 830,948 |
Mini-Cap | | | 135,841 | | | 81,858 | | | 69,090 | | | 286,789 |
Real Estate | | | 80,300 | | | — | | | — | | | — |
International Equity | | | 84,748 | | | 82,632 | | | 134,862 | | | 302,242 |
Global Emerging Markets | | | — | | | 99,444 | | | 296,908 | | | 396,352 |
International Small Companies | | | — | | | 379,991 | | | 379,970 | | | 759,961 |
Legato | | | — | | | — | | | 79,728 | | | 79,728 |
As of January 2, 2006, the Advisor has contractually agreed to waive a portion of its fees and/or reimburse certain expenses which should have the effect of limiting the total annual fund operating expenses (as a percentage of assets) as follows: 1.69% for the International Equity Fund, 1.69% for the Small Cap Fund Investor Class, 1.34% for the Small Cap Fund Institutional Class, 1.69% for the Small Cap Fund Class A, 1.79% for the Mini-Cap Fund Investor Class, 1.23% for the Mini-Cap Fund Institutional Class, 1.89% for the Global Emerging Markets Fund Investor Class, 1.59% for the Global Emerging Markets Fund Institutional Class, 1.56% for the International Small Companies Fund Investor Class, 1.26% for the International Small Companies Fund Institutional Class, 1.56% for the International Small Companies Fund Class A, and 1.69% for the Real Estate Fund. These waivers and reimbursements will continue through January 1, 2007. Any waiver or reimbursement by the Advisor is subject to recoupment from the Fund within the three years following the date on which the expense was incurred, to the extent
Notes to Financial Statements for year ended December 31, 2005 (Audited) (continued)
such recoupment would not cause total expenses to exceed the expense limitations in existence at the time the expense was incurred, or at the time of the reimbursement, whichever is lower.
5. Distribution Plan and Shareholder Services Plan
The Investor Class shares of the Funds have a Distribution Plan pursuant to Rule 12b-1 for which up to 0.25% of each Fund’s average daily net assets may be used to pay distribution fees. The Class A shares of the Small Cap Fund, International Small Companies Fund and Legato Fund have a Distribution Plan pursuant to Rule 12b-1 for which up to 0.35% of each Fund’s average daily net assets may be used to pay distribution fees. In addition, the Investor Class shares of the International Equity Fund, Mini-Cap Fund, Global Emerging Markets Fund, and Real Estate Fund; the Investor Class shares and Class A shares of the Small Cap Fund and International Small Companies Fund; and the Institutional Class shares and Class A shares of the Legato Fund have a Shareholder Services Plan which may be used to pay shareholder servicing fees at an annual rate of up to 0.10% of each Fund’s average daily net assets. The expenses of the Distribution and Shareholder Services Plans are reflected as distribution and service fees in the Statement of Operations. Institutional Class shares of the Small Cap Fund, Mini-Cap Fund, Global Emerging Markets Fund and International Small Companies Fund are not subject to distribution or service fees.
The Trust has entered into an administration agreement with PFPC Inc. (“PFPC”), an indirect wholly owned subsidiary of PNC Financial Services Group, Inc., which will terminate effective March 1, 2006. Accordingly, the Trust has entered into an administration agreement with ALPS Mutual Fund Services, Inc. (“AMFS”), pursuant to which AMFS will become the administrator of the Funds effective March 1, 2006.
Effective September 9, 2005, ALPS Distributors, Inc. (the “Distributor”) serves as the Funds’ distributor. Prior to that time, PFPC Distributors, Inc. served as the Funds’ distributor. The Distributor acts as an agent for the Funds and the distributor of their shares.
Effective October 17, 2005, ALPS Mutual Fund Services, Inc. serves as the Trust’s transfer agent and dividend paying agent. Prior to that time, PFPC served as the Trust’s transfer agent and dividend paying agent.
6. Trustees and Officers
The overall responsibility for oversight of the Funds rests with the Trustees of the Trust. As of December 31, 2005, there were five Trustees, four of whom are not “interested persons” of the Trust within the meaning of that term under the 1940 Act. As of January 1, 2006, the number of Trustees was increased to six and Mr. DeWitt F. Bowman was appointed as a non-interested Trustee. The Funds pay each non-interested Trustee a retainer fee in the amount of $12,000 per year, $3,625 each per regular meeting and $1,000 each for attendance in person at each special meeting that is not held in conjunction with a regular meeting, and $750.00 for attendance at a special telephonic meeting. The Chairman of the Board of Trustees and the Chairman of the Audit Committee each receive a special retainer fee in the amount of $6,000 per year. The Funds will also reimburse Trustees’ travel expenses incurred attending Board Meetings. The interested Trustee does not receive any compensation by the Funds.
Prior to his appointment as a non-interested Trustee, Mr. Bowman served as a consultant to the Trust from July 21, 2005 through December 31, 2005, and was paid consulting fees by the Trust in the amount of $7,015.57 for his services as an advisory board member during the year ended December 31, 2005.
Notes to Financial Statements for year ended December 31, 2005 (Audited) (continued)
7. Indemnifications
Under the Funds’ organizational documents, its officers and trustees are indemnified against certain liability arising out of the performance of their duties to the Funds. In addition, in the normal course of business, the Funds enter into contracts with their vendors and others that provide general indemnification. The Funds’ maximum exposure under these arrangements is unknown, as this would involve future claims that may be made against the Funds. However, based on experience, the Funds expect the risk of loss to be remote.
8. Shares of Beneficial Interest
The capitalization of the Trust consists of an unlimited number of shares of beneficial interest with no par value per share. Each Fund, other than the Forward Legato Fund, Forward Emerald Growth Fund, Forward Emerald Opportunities Fund and Forward Emerald Banking and Finance Fund, currently offers a class of shares called the Investor Class shares. The Forward Hoover Small Cap Equity Fund, Forward Hoover Mini-Cap Fund, Forward International Small Companies Fund, Forward Global Emerging Markets Fund and Forward Legato Fund offer a class of shares called the Institutional Class shares to institutional investors and investors meeting certain purchase qualifications. The Forward Legato Fund, Forward Hoover Small Cap Equity Fund, Forward International Small Companies Fund, Sierra Club Stock Fund, Forward Emerald Growth Fund, Forward Emerald Opportunities Fund and Forward Emerald Banking and Finance Fund offer a class of shares called Class A shares. In addition, the Forward Emerald Growth Fund, Forward Emerald Opportunities Fund and Forward Emerald Banking and Finance Fund offer a class of shares called Class C shares. The Board of Trustees may establish additional Funds and classes of shares at any time in the future without shareholder approval. Holders of shares of the Funds of the Trust have one vote for each share held, and a proportionate fraction of a vote for each fractional share. All shares issued and outstanding are fully paid and are non-assessable, transferable and redeemable at the option of the shareholder. Shares have no pre-emptive rights.
Shares exchanged or redeemed within 180 days of purchase incur a fee of 2.00% of the total redemption amount. Such redemption fees are reflected in the “cost of shares redeemed” in the Statement of Changes in Net Assets. The redemption fees retained by the Small Cap Fund, the Mini-Cap Fund, the Real Estate Fund, the International Equity Fund, the Global Emerging Markets Fund and the International Small Companies Fund for the year ended December 31, 2005 were $119,959, $8,283, $4,881, $759, $7,319 and $55,281, respectively.
Notes to Financial Statements for year ended December 31, 2005 (Audited) (continued)
The following entities owned of record or beneficially, as of December 31, 2005, 5% or greater of any class of the Funds outstanding equity securities:
| | | | | |
| FUND | | NAME | | PERCENTAGE | |
Small Cap Investor Class | | Charles Schwab & Co., Inc. | | 37.28 | % |
| | Muir & Co. | | 9.88 | % |
| | New York Life Trust Co. | | 6.64 | % |
| | |
Small Cap Institutional Class | | Charles Schwab & Co., Inc. | | 68.81 | % |
| | The Northern Trust Company | | 14.25 | % |
| | |
Small Cap Class A | | Sutton Place Associates LLC | | 84.48 | % |
| | ReFlow Management Co., LLC | | 9.31 | % |
| | |
Mini-Cap Investor Class | | Sutton Place Associates LLC | | 65.18 | % |
| | Charles Schwab & Co., Inc. | | 23.22 | % |
| | National Investor Services | | 5.47 | % |
| | |
Mini-Cap Institutional Class | | Lepick & Co | | 43.19 | % |
| | Charles Schwab & Co., Inc. | | 25.40 | % |
| | Trust Management for Bank of West | | 5.01 | % |
| | Sherjac c/o Amegy Bank of Texas | | 5.00 | % |
| | |
Real Estate | | Sutton Place Associates LLC | | 50.53 | % |
| | Charles Schwab & Co., Inc. | | 28.80 | % |
| | |
International Equity | | Sutton Place Associates LLC | | 82.32 | % |
| | ReFlow Management Co., LLC | | 9.40 | % |
| | |
Global Emerging Markets Investor Class | | Sutton Place Associates LLC | | 70.98 | % |
| | ReFlow Management Co., LLC | | 8.35 | % |
| | |
Global Emerging Markets Institutional Class | | Brown Brothers Harriman & Co. | | 46.61 | % |
| | Ellard & Co | | 12.30 | % |
| | Charles Schwab & Co., Inc. | | 10.92 | % |
| | Jupiter & Co | | 6.96 | % |
| | Wells Fargo Bank N.A. | | 5.33 | % |
| | |
International Small Companies Investor Class | | Charles Schwab & Co., Inc. | | 33.90 | % |
| | Reliance Trust | | 9.24 | % |
| | National Investor Services | | 8.04 | % |
| | |
International Small Companies Institutional Class | | Charles Schwab & Co., Inc. | | 63.93 | % |
| | Brown Brothers Harriman & Co. | | 7.70 | % |
| | |
International Small Companies Class A | | Sutton Place Associates LLC | | 95.24 | % |
| | |
Legato Class A | | Sutton Place Associates LLC | | 98.57 | % |
Sutton Place Associates LLC and ReFlow Management Co., LLC are entities under common control with Forward Management.
Notes to Financial Statements for year ended December 31, 2005 (Audited) (continued)
9. Purchases and Sales of Investments
Investment transactions for the year ended December 31, 2005, excluding temporary short-term investments, were as follows:
| | | | | | |
| FUND | | COST OF
INVESTMENTS
PURCHASED | | PROCEEDS FROM
INVESTMENTS
SOLD |
Small Cap | | $ | 627,462,766 | | $ | 484,409,783 |
Mini-Cap | | | 98,338,384 | | | 94,351,227 |
Real Estate | | | 9,154,465 | | | 17,162,699 |
International Equity | | | 31,475,590 | | | 34,282,109 |
Global Emerging Markets | | | 25,224,113 | | | 15,981,218 |
International Small Companies | | | 228,750,516 | | | 115,348,212 |
Legato | | | 7,590,688 | | | 1,643,818 |
10. Tax Basis Information
Reclassifications: At December 31, 2005, permanent differences in book and tax accounting have been reclassified as follows:
| | | | | | | | | | | | |
| | | INCREASE/
(DECREASE)
PAID-IN
CAPITAL | | | INCREASE/
(DECREASE)
ACCUMULATIVE
NET INVESTMENT
INCOME/(LOSS) | | | INCREASE/
(DECREASE)
ACCUMULATIVE
NET REALIZED
GAIN/(LOSS) | |
Small Cap | | | — | | | $ | 2,528,304 | | | $ | (2,528,304 | ) |
Mini-Cap | | $ | 82 | | | | 290,216 | | | | (290,298 | ) |
Real Estate | | | (127,254 | ) | | | (123,080 | )(a) | | | 250,334 | (a) |
International Equity | | | (10,726 | ) | | | (3,979 | ) | | | 14,705 | |
Global Emerging Markets | | | — | | | | (9,999 | ) | | | 9,999 | |
International Small Companies | | | — | | | | (100,324 | ) | | | 100,324 | |
Legato | | | — | | | | 61,811 | | | | (61,811 | ) |
(a) Amounts have been restated. See Note 2.
Tax Basis of Investments: At December 31, 2005, the aggregate cost of investments, gross unrealized appreciation/(depreciation) and net unrealized appreciation/(depreciation) for Federal tax purposes was as follows:
| | | | | | | | | | | | | |
| FUND | | COST OF
INVESTMENTS | | GROSS
UNREALIZED
APPRECIATION | | GROSS
UNREALIZED
DEPRECIATION | | | NET
UNREALIZED
APPRECIATION/
(DEPRECIATION) |
Small Cap | | $ | 328,359,477 | | $ | 57,733,858 | | $ | (3,058,635 | ) | | $ | 54,675,223 |
Mini-Cap | | | 35,788,750 | | | 5,933,145 | | | (291,796 | ) | | | 5,641,349 |
Real Estate | | | 28,820,957 | | | 16,935,887 | | | (660,586 | ) | | | 16,275,301 |
International Equity | | | 21,965,486 | | | 3,196,570 | | | (442,379 | ) | | | 2,754,191 |
Global Emerging Markets | | | 29,300,387 | | | 9,266,378 | | | (444,629 | ) | | | 8,821,749 |
International Small Companies | | | 181,391,821 | | | 36,624,218 | | | (4,541,114 | ) | | | 32,083,104 |
Legato | | | 6,265,905 | | | 910,639 | | | (185,550 | ) | | | 725,089 |
Notes to Financial Statements for year ended December 31, 2005 (Audited) (continued)
Post October Loss: Under the current tax law, capital and currency losses realized after October 31 may be deferred and treated as occurring on the first day of the following fiscal year. For the fiscal year ended December 31, 2005, the Funds elected to defer capital losses and currency losses occurring between November 1, 2005 and December 31, 2005 as follows:
| | | |
| FUND | | F/X
LOSS |
Real Estate | | $ | 47 |
International Small Companies | | | 59,592 |
Capital Loss Carryforwards: At December 31, 2005 the following Funds had available for Federal income tax purposes unused capital losses as follows:
| | | | | | | | | | | | | | | | | |
| FUND | | EXPIRING
IN 2005 | | 2006 | | 2007 | | 2008 | | 2009 | | 2010 | | 2011 |
International Equity | | — | | — | | — | | | — | | | — | | — | | $ | 323,448 |
Global Emerging Markets | | — | | — | | — | | $ | 3,651,293 | | $ | 2,015,691 | | — | | | — |
Tax Basis of Distributable Earnings: At December 31, 2005, the components of accumulated earnings on a tax basis were as follows:
| | | | | | | | | | |
| | | SMALL CAP | | MINI-CAP | | REAL ESTATE | |
Post-October losses | | | — | | | — | | $ | (47 | ) |
Accumulated capital loss carryforwards | | | — | | | — | | | — | |
Undistributed Ordinary Income | | | — | | | — | | | — | |
Undistributed short-term gain | | $ | 3,022,040 | | $ | 2,369,142 | | | — | |
Undistributed long-term gain | | | 5,841,708 | | | 781,400 | | | — | |
Net unrealized appreciation/(depreciation) of F/X | | | — | | | — | | | — | |
Net unrealized appreciation on Investments | | | 54,675,223 | | | 5,641,349 | | | 16,275,292 | |
| | | | | | | | | | |
Total distributable earnings | | | 63,538,971 | | | 8,791,891 | | | 16,275,245 | |
| | | | | | | | | | | | | | | |
| | | INTERNATIONAL
EQUITY | | | GLOBAL
EMERGING
MARKETS | | | INTERNATIONAL
SMALL
COMPANIES | | | LEGATO |
Post-October losses | | | — | | | | — | | | $ | (59,592 | ) | | | — |
Accumulated capital loss carryforwards | | $ | (323,448 | ) | | $ | (5,666,984 | ) | | | — | | | | — |
Undistributed Ordinary Income | | | | | | | 39,360 | | | | 40,797 | | | | — |
Undistributed short-term gain | | | — | | | | — | | | | 336,450 | | | $ | 55,650 |
Undistributed long-term gain | | | — | | | | 272,114 | | | | 924,478 | | | | — |
Net unrealized appreciation/(depreciation) of F/X | | | 15,677 | | | | (814 | ) | | | 7,881 | | | | — |
Net unrealized appreciation on Investments | | | 2,754,191 | | | | 8,821,749 | | | | 32,083,104 | | | | 725,089 |
| | | | | | | | | | | | | | | |
Total distributable earnings | | | 2,446,420 | | | | 3,465,425 | | | | 33,333,118 | | | | 780,739 |
Notes to Financial Statements for year ended December 31, 2005 (Audited) (continued)
Tax Basis of Distributions to Shareholders: Income and long-term capital gain distributions are determined in accordance with federal income tax regulations, which may differ from accounting principles generally accepted in the United States. The tax character of distributions paid were as follows:
| | | | | | | | | | | | |
| | | 2005
ORDINARY
INCOME
TOTAL | | 2005
SHORT-TERM
CAPITAL GAIN
TOTAL | | 2005
LONG-TERM
CAPITAL GAIN
TOTAL | | 2005
RETURN OF
CAPITAL
TOTAL |
Small Cap | | | — | | $ | 4,663,448 | | $ | 10,292,873 | | | — |
Mini-Cap | | | — | | | 379,852 | | | 605,292 | | | — |
Real Estate | | $ | 498,174 | | | 248,707 | | | 3,499,342 | | $ | 127,254 |
International Equity | | | 10,770 | | | — | | | — | | | — |
Global Emerging Markets | | | 577,546 | | | — | | | — | | | — |
International Small Companies | | | 1,343,737 | | | 7,983,872 | | | 4,449,365 | | | — |
Legato | | | — | | | 20,078 | | | 435 | | | — |
11. Foreign Securities
Each Fund may directly purchase securities of foreign issuers. Investing in securities of foreign issuers involves special risks not typically associated with investing in securities of U.S. issuers. The risks include possible revaluation of currencies, the ability to repatriate funds, less complete financial information about companies and possible future adverse political and economic developments. Moreover, securities of many foreign issuers and their markets may be less liquid and their prices more volatile than those of securities of comparable U.S. issuers.
12. REITs
The Real Estate Fund invests a substantial portion of its assets in REITs and is subject to certain risks associated with direct investments in REITs. REITs may be affected by changes in the value of their underlying properties and by defaults by borrowers or tenants. REITs depend generally on their ability to generate cash flow to make distributions to shareowners, and certain REITs have self-liquidation provisions by which mortgages held may be paid in full and distributions of capital returns may be made at any time. In addition, the performance of a REIT may be affected by its failure to qualify for tax-free pass-through of income under the Code or its failure to maintain exemption from registration under the 1940 Act.
13. Portfolio of Investments
The investment categories used in this report may differ from the industry classification categories used for determining compliance with industry concentration restrictions and requirements applicable to each of the Funds.
Report of Independent Registered Public Accounting Firm
To the Board of Trustees and Shareholders of
Forward Uniplan Real Estate Investment Fund:
In our opinion, the accompanying statement of assets and liabilities at December 31, 2005, including the schedule of investments (as incorporated by reference herein, see Note 2), and the related statements of operations and of changes in net assets and the financial highlights present fairly, in all material respects, the financial position of Forward Uniplan Real Estate Investment Fund (the “Fund”) at December 31, 2005, the results of its operations for the year then ended, the changes in its net assets for each of the two years in the period then ended and the financial highlights for each of the five years in the period then ended, in conformity with accounting principles generally accepted in the United States of America. These financial statements and financial highlights (hereafter referred to as “financial statements”) are the responsibility of the Fund’s management; our responsibility is to express an opinion on these financial statements based on our audits. We conducted our audits of these financial statements in accordance with the standards of the Public Company Accounting Oversight Board (United States). Those standards require that we plan and perform the audits to obtain reasonable assurance about whether the financial statements are free of material misstatement. An audit includes examining, on a test basis, evidence supporting the amounts and disclosures in the financial statements, assessing the accounting principles used and significant estimates made by management, and evaluating the overall financial statement presentation. We believe that our audits, which included confirmation of securities at December 31, 2005 by correspondence with the custodian, provide a reasonable basis for our opinion.
As described in Note 2, the financial statements have been restated.
PricewaterhouseCoopers LLP
San Francisco, California
February 24, 2006, except for the information in Note 2, as to which the date is August 29, 2006
Subsequent Events (Unaudited)
��
The following information applies to the Forward Hoover Small Cap Equity Fund only:
Effective September 1, 2006, the Forward Hoover Small Cap Equity Fund will change its definition of “small market capitalization companies” as follows:
For purposes of the Fund, small capitalization companies generally are companies with market capitalizations of up to $2.5 billion at the time of initial purchase. However, small capitalization companies may include any company with a market capitalization equal to or less than any company in the Russell 2000 Index at time of purchase so long as the purchase of those securities would not cause the average weighted market capitalization of the Fund to exceed $2.5 billion. The sub-advisor is not required to sell a stock when its market capitalization exceeds $2.5 billion although it may do so.
The following information applies to the Forward Uniplan Real Estate Investment Fund only:
Effective October 30, 2006, the Forward Uniplan Real Estate Investment Fund will change its name to the Forward Progressive Real Estate Fund and will change its investment strategy.
The Forward Progressive Real Estate Fund will invest at least 80% of its net assets plus borrowings, if any, in securities of progressive real estate companies. Under normal conditions, the Fund expects to invest principally in common stock and units of beneficial interest of real estate investment trusts, preferred stock, rights to purchase common stock and securities which may convert into common stock of real estate companies. If market conditions warrant, the Fund may invest in debt securities issued or guaranteed by real estate companies. The Fund may invest in securities of real estate companies of any market capitalization.
“Progressive real estate” refers to real estate companies that, in the assessment of the sub-advisor, have policies and exhibit certain specific positive behaviors that demonstrate environmental and/or social awareness on the part of management. These would include policies that take into account the interests of local communities and governments, employees, tenants, vendors, and the environment. The sub-advisor believes that “progressive” policies and corporate behaviors are indicative of quality management teams and consequently may offer superior long-term shareholder value.
The sub-advisor will employ a two-part process to select individual investments for the Fund: fundamental analysis and social and environmental (“progressive”) analysis.
The sub-advisor conducts fundamental analysis to select the universe of investments for the Fund. The sub-advisor generally tracks real estate supply and demand across the United States by separating the country into eight geographic regions and then further into major metropolitan markets within those regions. Within each region, the sub-advisor compiles a profile of supply and demand factors including: (1) vacancy rates by property type; (2) visible supply of new property based on building permit activity; (3) regional population, job and economic growth; and (4) local trends in rental and property capitalization rates. The sub-advisor uses this data to determine which property types in which regions appear to be most favorably poised to outperform similar properties in other regions. The sub-advisor then proceeds to select investments that attempt to take advantage of those factors.
The Fund’s sub-advisor believes that the management quality of a real estate investment is one of the most important determinants of its performance. The sub-advisor believes that many of the common traits among the management of the
Subsequent Events (Unaudited)
best performing real estate investments can be considered indications of a socially and environmentally responsible management culture. Accordingly, the sub-advisor conducts a social and environmental analysis of potential real estate investments, which includes the following factors: (1) management culture—does management work to align the interest of shareholders, management, employees, the local community and environment, and the vendors to the company? (2) real estate policy—including issues regarding community planning, urban development and general construction practices. (3) general social, environmental and business policy—the company’s general social and business practices in relation to the environment. The sub-advisor selects companies that it believes have a positive approach to these factors.
The following information applies to the Sierra Club Stock Fund only:
Effective August 11, 2006, New York Life Investment Management LLC (“NYLIM”) no longer serves as a sub-advisor for a portion of the Sierra Club Stock Fund. Forward Management, LLC, which formerly managed a portion of the Sierra Club Stock Fund, took over management of NYLIM’s portion of the Sierra Club Stock Fund.
Effective September 1, 2006, the net expense limitation for the Investor Class and Class A shares of the Sierra Club Stock Fund will be lowered from 1.49% to 1.29%.
The following information applies to the Sierra Club Equity Income Fund only:
Effective August 11, 2006, New York Life Investment Management LLC (“NYLIM”) no longer serves as a sub-advisor for a portion of the Sierra Club Equity Income Fund. Forward Uniplan Advisors, Inc., which formerly managed a portion of the Sierra Club Equity Income Fund, took over management of NYLIM’s portion of the Sierra Club Equity Income Fund.

Investment Advisor
Forward Management, LLC
Administrator
ALPS Mutual Fund Services, Inc.
Distributor
ALPS Distributors, Inc.
Counsel
Dechert LLP
Independent Registered Public Accounting Firm
PricewaterhouseCoopers, LLP
Custodian
Brown Brothers Harriman & Co.
Transfer Agent
ALPS Mutual Funds Services, Inc.
Forward Funds
Forward Funds
P.O. Box 1345
Denver, CO
80201 (800) 999-6809
www.forwardfunds.com
International
Forward International Equity Fund
Forward International Small Companies Fund
Forward Global Emerging Markets Fund
Forward Sustainable
Sierra Club Equity Income Fund
Sierra Club Stock Fund
Banking and Finance
Forward Emerald Banking and Finance Fund
Long/Short
Forward Emerald Opportunities Fund
Real Estate
Forward Uniplan Real Estate Investment Fund
Small Cap and Mini Cap
Forward Emerald Growth Fund
Forward Hoover Small Cap Equity Fund
Forward Hoover Mini-Cap Fund
Forward Legato Fund
Printed on recycled paper using soy-based inks.
FWD000475 083107
Item 2. Code of Ethics.
Not applicable to semi-annual report.
Item 3. Audit Committee Financial Expert.
Not applicable to semi-annual report.
Item 4. Principal Accountant Fees and Services.
Not applicable to semi-annual report.
| Item 5. | Audit Committee of Listed Registrants. |
Not applicable.
Item 6. Schedule of Investments.
Schedule of Investments in securities of unaffiliated issuers as of the close of the reporting period is included as part of the report to shareholders filed under Item 1 of this form.
Item 7. Disclosure of Proxy Voting Policies and Procedures for Closed-End Management Investment Companies.
Not applicable.
Item 8. Portfolio Managers of Closed-End Management Investment Companies.
Not applicable.
Item 9. Purchases of Equity Securities by Closed-End Management Investment Companies and Affiliated Purchases.
Not applicable.
2
Item 10. Submission of Matters to Vote of Security Holders.
There have been no material change to the procedures by which the shareholders may recommend nominees to the registrant’s Board of Trustees, where those changes were implemented after the registrant’s last provided disclosure in response to the requirements of Item 7(d)(2)(ii)(G) of Schedule 14A (17 CFR 240.14a-101), or this Item.
Item 11. Controls and Procedures.
| | (a) | The registrant’s principal executive and principal financial officers, or persons performing similar functions, have concluded that the registrant’s disclosure controls and procedures (as defined in Rule 30a-3(c) under the Investment Company Act of 1940, as amended (the “1940 Act”) (17 CFR 270.30a-3(c))) are effective, as of a date within 90 days of the filing date of the report that includes the disclosure required by this paragraph, based on their evaluation of these controls and procedures required by Rule 30a-3(b) under the 1940 Act (17 CFR 270.30a-3(b)) and Rules 13a-15(b) or 15d-15(b) under the Securities Exchange Act of 1934, as amended (17 CFR 240.13a-15(b) or 240.15d-15(b)). |
| | (b) | There were no changes in the registrant’s internal control over financial reporting (as defined in Rule 30a-3(d) under the 1940 Act (17 CFR 270.30a-3(d)) that occurred during the registrant’s second fiscal quarter of the period covered by this report that have materially affected, or are reasonably likely to materially affect, the registrant’s internal control over financial reporting. |
Item 12. Exhibits.
| | |
| (a)(1) | | Not applicable to semi-annual report. |
| |
| (a)(2) | | Certifications pursuant to Rule 30a-2(a) under the 1940 Act and Section 302 of the Sarbanes-Oxley Act of 2002 are attached hereto. |
| |
| (a)(3) | | Not applicable. |
| |
| (b) | | Certifications pursuant to Rule 30a-2(b) under the 1940 act and Section 906 of the Sarbanes-Oxley Act of 2002 are attached hereto. |
3
SIGNATURES
Pursuant to the requirements of the Securities Exchange Act of 1934 and the Investment Company Act of 1940, the registrant has duly caused this report to be signed on its behalf by the undersigned, thereunto duly authorized.
| | |
| FORWARD FUNDS |
| |
| By: | | /s/ J. Alan Reid, Jr. |
| | J. Alan Reid, Jr. |
| | President & Trustee |
| |
| Date: | | September 5, 2006 |
Pursuant to the requirements of the Securities Exchange Act of 1934 and the Investment Company Act of 1940, this report has been signed below by the following persons on behalf of the registrant and in the capacities and on the dates indicated.
| | |
| By: | | /s/ J. Alan Reid, Jr. |
| | J. Alan Reid, Jr. |
| | President & Trustee |
| |
| Date: | | September 5, 2006 |
| |
| By: | | /s/ Barbara Tolle |
| | Barbara Tolle |
| | Treasurer |
| |
| Date: | | September 5, 2006 |
4