UNITED STATES
SECURITIES AND EXCHANGE COMMISSION
Washington, D.C. 20549
FORM N-CSR
CERTIFIED SHAREHOLDER REPORT OF REGISTERED
MANAGEMENT INVESTMENT COMPANIES
Investment Company Act file number: 811-06722
FORWARD FUNDS
(Exact name of registrant as specified in charter)
433 California Street, 11th Floor
San Francisco, CA 94104
(Address of principal executive offices) (Zip code)
J. Alan Reid, Jr., President
Forward Funds
433 California Street, 11th Floor
San Francisco, CA 94104
(Name and address of agent for service)
Registrant’s Telephone Number, including Area Code: (800) 999-6809
Date of fiscal year end: December 31
Date of reporting period: June 30, 2009
Form N-CSR is to be used by management investment companies to file reports with the Commission, not later than 10 days after the transmission to stockholders of any report that is required to be transmitted to stockholders under Rule 30e-1 under the Investment Company Act of 1940 (17 CFR 270.30e-1). The Commission may use the information provided on Form N-CSR in its regulatory, disclosure review, inspection, and policymaking roles.
A registrant is required to disclose the information specified by Form N-CSR, and the Commission will make this information public. A registrant is not required to respond to the collection of information contained in Form N-CSR unless the Form displays a currently valid Office of Management and Budget (“OMB”) control number. Please direct comments concerning the accuracy of the information collection burden estimate and any suggestions for reducing the burden to the Secretary, Securities and Exchange Commission, 100 F Street, NE, Washington, DC 20549. The OMB has reviewed this collection of information under the clearance requirements of 44 U.S.C. § 3507.
Item 1 - Reports to Stockholders
The following is a copy of the reports transmitted to shareholders of the Accessor Growth Fund, Accessor Value Fund, Accessor Small to Mid Cap Fund, Accessor International Equity Fund, Accessor Total Return Fund, Accessor Strategic Alternatives Fund, Accessor Frontier Markets Fund, Accessor High Yield Bond Fund, Accessor Investment Grade Fixed-Income Fund, Accessor Mortgage Securities Fund, Accessor Limited Duration U.S. Government Fund, Accessor U.S. Government Money Fund, Accessor Income Allocation Fund, Accessor Income & Growth Allocation Fund, Accessor Balanced Allocation Fund, Accessor Growth & Income Allocation Fund, Accessor Growth Allocation Fund and Accessor Aggressive Growth Allocation Fund, each a series of the registrant, pursuant to Rule 30e-1 under the Act (17 CFR 270.30e-1). The report transmitted to shareholders of the Accessor series, which were reorganized as series of the registrant effective September 1, 2008, has been or will be submitted in a separate Form N-CSR.
Semiannual Report
Equity Funds
Accessor Growth
Accessor Value
Accessor Small to Mid Cap
Accessor International Equity
Accessor Total Return
Accessor Strategic Alternatives
Accessor Frontier Markets
Fixed Income Funds
Accessor High Yield Bond
Accessor Investment Grade Fixed-Income
Accessor Mortgage Securities
Accessor Limited Duration U.S. Government
Accessor U.S. Government Money
Asset Allocation Funds
Accessor Income Allocation
Accessor Income & Growth Allocation
Accessor Balanced Allocation
Accessor Growth & Income Allocation
Accessor Growth Allocation
Accessor Aggressive Growth Allocation
June 30, 2009
| | |
| |
| ACCESSOR FUNDS: | | Table of Contents |
Accessor Funds are distributed by SEI Investments Distribution Co., Oaks, PA 19456
The report has been prepared for the general information of Accessor Funds’ shareholders. It is not authorized for distribution to prospective investors unless accompanied or proceeded by a current Accessor Funds Prospectus, which contains more complete information about Accessor Funds’ investment policies, management fees and expenses. Investors are reminded to read the prospectus carefully before investing or sending money.
| | |
| Shareholder Update | | June 30, 2009 |
| | |
| |
| A MESSAGE FROM: | | J. Alan Reid, Jr.
Chief Executive Officer |

Dear Shareholder:
Over the last few years, investors have faced a crisis of confidence as perceived investment wisdom has been turned on its head. Traditional asset allocation has suffered as investments that typically were not correlated became correlated during the recent market crisis, and traditional safe-haven investments like CD’s, bonds, real estate and large cap stocks also were drawn into question. In response, government officials and global central bankers provided massive capital infusions to help jump start the markets. Starting in early 2009, these support measures began to pay off as credit spreads began narrowing, and the overall outlook started to improve.
In March of this year, a recovery in the global equity markets began to signal that the worst days of this economic crisis might be behind us. During the second quarter, banks, REITs and other leveraged players around the globe began to issue equity in an effort to avoid default and strengthen their balance sheets. In addition, banks began repaying government capital infusions and were in the process of being able to function normally on their own once again.
The markets still have a way to go before we can conclude that there has been a complete recovery. There will be much need for continued strengthening in consumer, government and corporate balance sheets. Legal and regulatory structures will no doubt be overhauled, as one of the biggest lessons learned was that too much leverage is hazardous to the markets.
In reviewing the past six months, I found it interesting to note that companies and countries with less debt—like technology companies and emerging market countries—performed strongly in the rebound as they were able to bounce back more quickly. As the recovery phase unfolded, many high yielding securities enjoyed a significant improvement as the panic mentality surrounding the market began to decline. I also was intrigued to see that diversification internationally and across asset classes began to reassert itself as a powerful driver of investment returns. We have always believed that an asset allocation with non-correlated asset classes is the best way to maintain a strong portfolio.
We remain focused on asset classes that will benefit from the continued recovery, as well as overall global growth. In June 2009, we added four new funds to the Forward Funds and Accessor Funds family. These funds, formerly the Kensington Funds, add additional diversification options for our shareholders seeking exposure to global infrastructure, real estate and income-oriented portfolios. The portfolio management teams for these funds have built deep expertise investing in real estate and infrastructure, and these portfolios offer investors access to companies involved in the ownership, development, management and financing of commercial real estate and infrastructure assets throughout the world. With low valuations in real estate—and the potential for substantial yield opportunities —our newest funds offer our investors solid investment alternatives. To learn more about our newest portfolios, visit www.forwardfunds.com.
As always, we remain committed to helping our shareholders attain true portfolio diversification and achieve their long-term financial goals. We also believe that transparent practices give our investors access to the information they need to make important investment decisions. I invite you to review the information in this report and the performance of the Accessor Funds in the first half of 2009, and thank you for the continued confidence that you place in our Funds.
Best regards,

J. Alan Reid, Jr.
Chief Executive Officer
Forward Management, LLC
The statements and opinions expressed herein are those of the author and should not be considered investment advice.
You should consider the investment objectives, risks, charges and expenses of the Accessor Funds carefully before investing. A prospectus with this and other information may be obtained by calling (800) 882-9612 or by downloading one from www.accessor.com. It should be read carefully before investing.
REIT funds will be subject to a higher degree of market risk because of concentration in a specific industry, sector or geographic sector. Risks also include declines in the value of real estate, general and economic conditions.
Certain of the Funds will invest in lower-rated debt securities and may utilize derivatives for hedging purposes.
There are risks involved with investing, including loss of principal. Past performance does not guarantee future results.
J. Alan Reid, Jr. is a registered representative of ALPS Distributors, Inc.
Forward Funds are distributed by ALPS Distributors, Inc.
Not FDIC Insured | No Bank Guarantee | May Lose Value
Fund Performance (Unaudited)
Performance Results for Periods Ended June 30, 2009
The performance quoted represents past performance, does not guarantee future results and current performance may be lower or higher than the data quoted. The investment return and principal value of an investment will fluctuate so that shares, when redeemed, may be worth more or less than their original cost. Investment performance reflects fee waivers in effect. In the absence of fee waivers, total return would be lower. Total return is based on NAV, assuming reinvestment of all distributions. Performance does not reflect the deduction of taxes that a shareholder would pay on Fund distributions or the redemption of Fund shares. Performance data current to the most recent month end may be obtained at www.accessor.com.
When investing in small cap stocks you may notice greater fluctuations in market value. By investing in international stocks, including emerging markets and frontier markets, you may be subject to currency fluctuations and political and economic instability. By investing in high yield bonds you may be subjected to greater price volatility based on fluctuations in issuer and credit quality. When investing in bonds, you are subject to, but not limited to, the same interest rate, inflation and credit risks associated with the underlying bonds owned by the Fund. Mortgage-backed securities are subject to prepayment and extension risk and therefore react differently to changes in interest rates than other bonds. Small movements in interest rates may quickly and significantly reduce the value of certain mortgage-backed securities. Return of principal is not guaranteed. The Accessor Frontier Markets, Strategic Alternatives and Total Return Funds are non-diversified funds. An investor will indirectly bear the expenses of a fund’s underlying investments. In addition, a fund’s underlying investments (such as structured notes, derivatives, commodities and levered ETFs) will involve heightened risks related to liquidity, increased volatility, and unfavorable fluctuations in currency values. The underlying international and real estate investments of the Accessor Frontier Markets, Strategic Alternatives and Total Return Funds may also be subject to economic or political instability in the US and other countries, credit risk and interest rate fluctuations.
Accessor Growth Fund
| | | | | | | | | | |
| | | 1 YEAR | | 5 YEAR | | 10 YEAR | | SINCE
INCEPTION | | INCEPTION
DATE |
| Average Annual Total Return | | | | | | | | | | |
Institutional Class | | -24.60% | | -2.83% | | -4.52% | | 6.40% | | 08/24/92 |
| | | | | |
Investor Class | | -24.27% | | -3.00% | | -4.82% | | -2.21% | | 07/01/98 |
| | | | | |
C Class (without load)(a) | | -25.32% | | -3.78% | | N/A | | 0.74% | | 12/30/02 |
| | | | | |
C Class (load adjusted)(b) | | -26.07% | | -3.78% | | N/A | | 0.74% | | 12/30/02 |
| | | | | |
A Class (without load)(c) | | -24.88% | | -3.16% | | N/A | | -0.43% | | 09/29/03 |
| | | | | |
A Class (load adjusted)(d) | | -29.21% | | -4.30% | | N/A | | -1.45% | | 09/29/03 |
| | | | | |
Z Class(f) | | N/A | | N/A | | N/A | | 2.35% | | 05/05/09 |
Fund Performance (Unaudited)
Performance Results for Periods Ended June 30, 2009
See page 4 for important performance disclosure information about the Accessor Funds
Accessor Value Fund
| | | | | | | | | | |
| | | 1 YEAR | | 5 YEAR | | 10 YEAR | | SINCE
INCEPTION | | INCEPTION
DATE |
| Average Annual Total Return | | | | | | | | | | |
Institutional Class | | -31.12% | | -3.86% | | -2.93% | | 5.56% | | 08/24/92 |
| | | | | |
Investor Class | | -31.47% | | -4.29% | | -3.36% | | -2.05% | | 07/01/98 |
| | | | | |
C Class (without load)(a) | | -31.78% | | -4.81% | | N/A | | 0.60% | | 12/30/02 |
| | | | | |
C Class (load adjusted)(b) | | -32.45% | | -4.81% | | N/A | | 0.60% | | 12/30/02 |
| | | | | |
A Class (without load)(c) | | -31.35% | | -4.16% | | N/A | | -1.14% | | 09/29/03 |
| | | | | |
A Class (load adjusted)(d) | | -35.28% | | -5.29% | | N/A | | -2.14% | | 09/29/03 |
| | | | | |
Z Class(f) | | N/A | | N/A | | N/A | | 1.11% | | 05/05/09 |
Accessor Small to Mid Cap Fund
| | | | | | | | | | |
| | | 1 YEAR | | 5 YEAR | | 10 YEAR | | SINCE
INCEPTION | | INCEPTION
DATE |
| Average Annual Total Return | | | | | | | | | | |
Institutional Class | | -30.74% | | -2.51% | | -0.61% | | 7.33% | | 08/24/92 |
| | | | | |
Investor Class | | -31.08% | | -2.95% | | -1.07% | | 0.03% | | 06/24/98 |
| | | | | |
C Class (without load)(a) | | -31.41% | | -3.48% | | N/A | | 3.60% | | 12/30/02 |
| | | | | |
C Class (load adjusted)(b) | | -32.09% | | -3.48% | | N/A | | 3.60% | | 12/30/02 |
| | | | | |
A Class (without load)(c) | | -30.96% | | -2.85% | | N/A | | 0.71% | | 09/29/03 |
| | | | | |
A Class (load adjusted)(d) | | -34.94% | | -4.00% | | N/A | | -0.32% | | 09/29/03 |
| | | | | |
Z Class(f) | | N/A | | N/A | | N/A | | -0.15% | | 05/05/09 |
Accessor International Equity Fund
| | | | | | | | | | |
| | | 1 YEAR | | 5 YEAR | | 10 YEAR | | SINCE
INCEPTION | | INCEPTION
DATE |
| Average Annual Total Return | | | | | | | | | | |
Institutional Class | | -39.76% | | 0.58% | | -0.82% | | 3.08% | | 10/03/94 |
| | | | | |
Investor Class | | -40.02% | | 0.16% | | -1.25% | | -0.61% | | 07/06/98 |
| | | | | |
C Class (without load)(a) | | -40.34% | | -0.42% | | N/A | | 4.66% | | 12/30/02 |
| | | | | |
C Class (load adjusted)(b) | | -40.91% | | -0.42% | | N/A | | 4.66% | | 12/30/02 |
| | | | | |
A Class (without load)(c) | | -39.95% | | 0.25% | | N/A | | 3.22% | | 09/29/03 |
| | | | | |
A Class (load adjusted)(d) | | -43.39% | | -0.94% | | N/A | | 2.16% | | 09/29/03 |
| | | | | |
Z Class(f) | | N/A | | N/A | | N/A | | 8.08% | | 05/05/09 |
Accessor Total Return Fund
| | | | | | | | | | |
| | | 1 YEAR | | 5 YEAR | | 10 YEAR | | SINCE
INCEPTION | | INCEPTION
DATE |
| Average Annual Total Return | | | | | | | | | | |
| | -34.65% | | N/A | | N/A | | -29.12% | | 09/10/07 |
Fund Performance (Unaudited)
Performance Results for Periods Ended June 30, 2009
See page 4 for important performance disclosure information about the Accessor Funds
Accessor Strategic Alternatives Fund
| | | | | | | | | | |
| | | 1 YEAR | | 5 YEAR | | 10 YEAR | | SINCE
INCEPTION | | INCEPTION
DATE |
| Average Annual Total Return | | | | | | | | | | |
Institutional Class | | -16.14% | | N/A | | N/A | | -10.48% | | 01/30/08 |
| | | | | |
Investor Class(f) | | N/A | | N/A | | N/A | | -1.38% | | 12/31/08 |
| | | | | |
Z Class(f) | | N/A | | N/A | | N/A | | 3.00% | | 05/05/09 |
Accessor Frontier Markets Fund
| | | | | | | | | | |
| | | 1 YEAR | | 5 YEAR | | 10 YEAR | | SINCE
INCEPTION | | INCEPTION
DATE |
| Average Annual Total Return | | | | | | | | | | |
Institutional Class(f) | | N/A | | N/A | | N/A | | 3.17% | | 12/31/08 |
| | | | | |
Investor Class(f) | | N/A | | N/A | | N/A | | 3.25% | | 12/31/08 |
| | | | | |
Z Class(f) | | N/A | | N/A | | N/A | | 14.10% | | 05/05/09 |
Accessor High Yield Bond Fund
| | | | | | | | | | |
| | | 1 YEAR | | 5 YEAR | | 10 YEAR | | SINCE
INCEPTION | | INCEPTION
DATE |
| Average Annual Total Return | | | | | | | | | | |
Institutional Class | | -5.68% | | 3.03% | | N/A | | 4.76% | | 05/01/00 |
| | | | | |
Investor Class | | -6.22% | | 2.72% | | N/A | | 4.36% | | 05/01/00 |
| | | | | |
C Class (without load)(a) | | -6.72% | | 2.00% | | N/A | | 4.98% | | 12/30/02 |
| | | | | |
C Class (load adjusted)(b) | | -7.57% | | 2.00% | | N/A | | 4.98% | | 12/30/02 |
| | | | | |
A Class (without load)(c) | | -5.95% | | 2.76% | | N/A | | 3.70% | | 09/29/03 |
| | | | | |
A Class (load adjusted)(e) | | -10.45% | | 1.77% | | N/A | | 2.82% | | 09/29/03 |
| | | | | |
Z Class(f) | | N/A | | N/A | | N/A | | 3.38% | | 05/05/09 |
Accessor Investment Grade Fixed-Income Fund
| | | | | | | | | | |
| | | 1 YEAR | | 5 YEAR | | 10 YEAR | | SINCE
INCEPTION | | INCEPTION
DATE |
| Average Annual Total Return | | | | | | | | | | |
Institutional Class | | 6.96% | | 3.16% | �� | 4.98% | | 5.33% | | 06/15/92 |
| | | | | |
Investor Class | | 6.33% | | 2.70% | | 4.49% | | 4.12% | | 07/14/98 |
| | | | | |
C Class (without load)(a) | | 5.90% | | 2.12% | | N/A | | 2.10% | | 12/30/02 |
| | | | | |
C Class (load adjusted)(b) | | 4.90% | | 2.12% | | N/A | | 2.10% | | 12/30/02 |
| | | | | |
Z Class(f) | | N/A | | N/A | | N/A | | 4.06% | | 05/05/09 |
Fund Performance (Unaudited)
Performance Results for Periods Ended June 30, 2009
See page 4 for important performance disclosure information about the Accessor Funds
Accessor Mortgage Securities Fund
| | | | | | | | | | |
| | | 1 YEAR | | 5 YEAR | | 10 YEAR | | SINCE
INCEPTION | | INCEPTION
DATE |
| Average Annual Total Return | | | | | | | | | | |
Institutional Class | | 5.73% | | 4.46% | | 5.24% | | 5.74% | | 05/18/92 |
| | | | | |
Investor Class | | 5.29% | | 4.01% | | 4.78% | | 4.57% | | 07/08/98 |
| | | | | |
C Class (without load)(a) | | 4.67% | | 3.43% | | N/A | | 2.80% | | 12/30/02 |
| | | | | |
C Class (load adjusted)(b) | | 3.67% | | 3.43% | | N/A | | 2.80% | | 12/30/02 |
| | | | | |
Z Class(f) | | N/A | | N/A | | N/A | | 2.03% | | 05/05/09 |
Accessor Limited Duration U.S. Government Fund
| | | | | | | | | | |
| | | 1 YEAR | | 5 YEAR | | 10 YEAR | | SINCE
INCEPTION | | INCEPTION
DATE |
| Average Annual Total Return | | | | | | | | | | |
| | 3.67% | | N/A | | N/A | | 3.71% | | 07/06/04 |
Accessor U.S. Government Money Fund
| | | | | | | | | | |
| | | 1 YEAR | | 5 YEAR | | 10 YEAR | | SINCE
INCEPTION | | INCEPTION
DATE |
| Average Annual Total Return | | | | | | | | | | |
Institutional Class | | 1.16% | | 3.00% | | 2.97% | | 3.54% | | 04/09/92 |
| | | | | |
Investor Class | | 0.82% | | 2.55% | | 2.51% | | 2.65% | | 07/29/98 |
| | | | | |
C Class (without load)(a) | | 0.55% | | 2.17% | | N/A | | 1.75% | | 12/30/02 |
| | | | | |
C Class (load adjusted)(b) | | -0.45% | | 2.17% | | N/A | | 1.75% | | 12/30/02 |
| | | | | |
A Class | | 0.97% | | 2.77% | | N/A | | 2.46% | | 09/29/03 |
| | | | | |
Z Class | | 1.40% | | N/A | | N/A | | 3.12% | | 01/04/07 |
Accessor Income Allocation Fund
| | | | | | | | | | |
| | | 1 YEAR | | 5 YEAR | | 10 YEAR | | SINCE
INCEPTION | | INCEPTION
DATE |
| Average Annual Total Return | | | | | | | | | | |
Institutional Class | | 2.77% | | 2.46% | | N/A | | 3.38% | | 12/27/00 |
| | | | | |
Investor Class | | 2.25% | | 1.96% | | N/A | | 2.86% | | 12/27/00 |
| | | | | |
C Class (without load)(a) | | 1.67% | | 1.43% | | N/A | | 1.59% | | 12/30/02 |
| | | | | |
C Class (load adjusted)(b) | | 0.70% | | 1.43% | | N/A | | 1.59% | | 12/30/02 |
| | | | | |
A Class (without load)(c) | | 2.43% | | 2.20% | | N/A | | 2.07% | | 09/29/03 |
| | | | | |
A Class (load adjusted)(e) | | -2.41% | | 1.21% | | N/A | | 1.22% | | 09/29/03 |
Fund Performance (Unaudited)
Performance Results for Periods Ended June 30, 2009
See page 4 for important performance disclosure information about the Accessor Funds
Accessor Income & Growth Allocation Fund
| | | | | | | | | | |
| | | 1 YEAR | | 5 YEAR | | 10 YEAR | | SINCE
INCEPTION | | INCEPTION
DATE |
| Average Annual Total Return | | | | | | | | | | |
Institutional Class | | -8.39% | | 1.20% | | N/A | | 2.03% | | 12/27/00 |
| | | | | |
Investor Class | | -8.86% | | 0.72% | | N/A | | 1.53% | | 12/27/00 |
| | | | | |
C Class (without load)(a) | | -9.28% | | 0.20% | | N/A | | 2.13% | | 12/30/02 |
| | | | | |
C Class (load adjusted)(b) | | -10.16% | | 0.20% | | N/A | | 2.13% | | 12/30/02 |
| | | | | |
A Class (without load)(c) | | -8.73% | | 0.84% | | N/A | | 1.73% | | 09/29/03 |
| | | | | |
A Class (load adjusted)(d) | | -13.96% | | -0.35% | | N/A | | 0.69% | | 09/29/03 |
Accessor Balanced Allocation Fund
| | | | | | | | | | |
| | | 1 YEAR | | 5 YEAR | | 10 YEAR | | SINCE
INCEPTION | | INCEPTION
DATE |
| Average Annual Total Return | | | | | | | | | | |
Institutional Class | | -14.06% | | 0.66% | | N/A | | 1.25% | | 12/27/00 |
| | | | | |
Investor Class | | -14.50% | | 0.18% | | N/A | | 0.74% | | 12/27/00 |
| | | | | |
C Class (without load)(a) | | -14.91% | | -0.34% | | N/A | | 2.67% | | 12/30/02 |
| | | | | |
C Class (load adjusted)(b) | | -15.73% | | -0.34% | | N/A | | 2.67% | | 12/30/02 |
| | | | | |
A Class (without load)(c) | | -14.32% | | 0.32% | | N/A | | 1.84% | | 09/29/03 |
| | | | | |
A Class (load adjusted)(d) | | -19.25% | | -0.86% | | N/A | | 0.80% | | 09/29/03 |
Accessor Growth & Income Allocation Fund
| | | | | | | | | | |
| | | 1 YEAR | | 5 YEAR | | 10 YEAR | | SINCE
INCEPTION | | INCEPTION
DATE |
| Average Annual Total Return | | | | | | | | | | |
Institutional Class | | -18.13% | | -0.05% | | N/A | | 0.47% | | 12/27/00 |
| | | | | |
Investor Class | | -18.56% | | -0.55% | | N/A | | -0.02% | | 12/27/00 |
| | | | | |
C Class (without load)(a) | | -18.99% | | -1.06% | | N/A | | 2.50% | | 12/30/02 |
| | | | | |
C Class (load adjusted)(b) | | -19.77% | | -1.06% | | N/A | | 2.50% | | 12/30/02 |
| | | | | |
A Class (without load)(c) | | -18.42% | | -0.42% | | N/A | | 1.44% | | 09/29/03 |
| | | | | |
A Class (load adjusted)(d) | | -23.11% | | -1.59% | | N/A | | 0.41% | | 09/29/03 |
Accessor Growth Allocation Fund
| | | | | | | | | | |
| | | 1 YEAR | | 5 YEAR | | 10 YEAR | | SINCE
INCEPTION | | INCEPTION
DATE |
| Average Annual Total Return | | | | | | | | | | |
Institutional Class | | -24.20% | | -0.91% | | N/A | | -0.64% | | 12/27/00 |
| | | | | |
Investor Class | | -24.56% | | -1.38% | | N/A | | -1.12% | | 12/27/00 |
| | | | | |
C Class (without load)(a) | | -24.94% | | -1.89% | | N/A | | 2.77% | | 12/30/02 |
| | | | | |
C Class (load adjusted)(b) | | -25.66% | | -1.89% | | N/A | | 2.77% | | 12/30/02 |
| | | | | |
A Class (without load)(c) | | -24.49% | | -1.26% | | N/A | | 1.26% | | 09/29/03 |
| | | | | |
A Class (load adjusted)(d) | | -28.82% | | -2.43% | | N/A | | 0.23% | | 09/29/03 |
Fund Performance (Unaudited)
Performance Results for Periods Ended June 30, 2009
See page 4 for important performance disclosure information about the Accessor Funds
Accessor Aggressive Growth Allocation Fund
| | | | | | | | | | |
| | | 1 YEAR | | 5 YEAR | | 10 YEAR | | SINCE
INCEPTION | | INCEPTION
DATE |
| Average Annual Total Return | | | | | | | | | | |
Institutional Class | | -29.76% | | -2.01% | | N/A | | -2.16% | | 12/27/00 |
| | | | | |
Investor Class | | -30.13% | | -2.51% | | N/A | | -2.66% | | 12/27/00 |
| | | | | |
C Class (without load)(a) | | -30.47% | | -2.99% | | N/A | | 2.27% | | 12/30/02 |
| | | | | |
C Class (load adjusted)(b) | | -31.14% | | -2.99% | | N/A | | 2.27% | | 12/30/02 |
| | | | | |
A Class (without load)(c) | | -30.05% | | -2.36% | | N/A | | 0.61% | | 09/29/03 |
| | | | | |
A Class (load adjusted)(d) | | -34.06% | | -3.51% | | N/A | | -0.42% | | 09/29/03 |
(a) Excludes the 1.00% contingent deferred sales charge.
(b) Includes the 1.00% contingent deferred sales charge.
(c) Excludes sales charge.
(d) Includes the effect of the maximum 5.75% sales charge.
(e) Includes the effect of the maximum 4.75% sales charge.
(f) “Since inception” performance is not annualized for a “since inception” period that is less than 1 year.
Disclosure of Fund Expenses (Unaudited)
For the Six Months Ended June 30, 2009
As a shareholder of the Accessor Funds, you incur two types of costs: (1) transaction costs, including applicable sales charges (loads); and (2) ongoing costs, including management fees, distribution and service (12b-1) fees, shareholder services fees and other Fund expenses. This example is intended to help you understand your ongoing costs (in dollars) of investing in the Funds and to compare these costs with the ongoing costs of investing in other mutual funds. The example is based on an investment of $1,000 invested at the beginning of the (six-month) period and held for the entire period January 1, 2009 through June 30, 2009.
Actual Expenses
The first line for each share class of each Fund in the table provides information about actual account values and actual expenses. You may use this information, together with the amount you invested, to estimate the expenses that you paid over the period. Simply divide your account value by $1,000 (for example, an $8,600 account value divided by $1,000 = 8.6), then multiply the result by the number in the applicable line under the heading entitled “Expenses Paid During the Period” to estimate the expenses you paid on your account during this period.
Hypothetical Example For Comparison Purposes
The second line for each share class of each Fund in the table below provides information about hypothetical account values and hypothetical expenses based on the Fund’s actual expense ratio and an assumed rate of return of 5% per year before expenses, which is not the Fund’s actual return. The hypothetical account values and expenses may not be used to estimate the actual ending account balance or expenses you paid for the period. You may use this information to compare the ongoing costs of investing in the Funds and other funds. To do so, compare this 5% hypothetical example with the 5% hypothetical examples that appear in the shareholder reports of other funds.
Please note that the expenses shown in the table below are meant to highlight your ongoing costs only and do not reflect any transactional costs, such as sales charges (loads), redemption fees or exchange fees. Therefore, the second line for each share class of each Fund of the table is useful in comparing ongoing costs only, and will not help you determine the relative total costs of owning different funds. If these transactional costs were included, your costs would have been higher.
Disclosure of Fund Expenses (Unaudited)
For the Six Months Ended June 30, 2009
| | | | | | | | | | | |
| | | BEGINNING
ACCOUNT VALUE ON
01/01/09 | | ENDING
ACCOUNT VALUE ON
06/30/09 | | EXPENSE
RATIO(a) | | EXPENSES PAID
DURING THE PERIOD
01/01/09-06/30/09(b) |
| | | | |
| ACCESSOR GROWTH | | | | | | | | | | | |
| Institutional Class | | | | | | | | | | | |
Actual | | $ | 1,000.00 | | $ | 1,045.10 | | 1.07% | | $ | 5.43 |
| | | | |
Hypothetical | | $ | 1,000.00 | | $ | 1,019.49 | | 1.07% | | $ | 5.36 |
| Investor Class | | | | | | | | | | | |
Actual | | $ | 1,000.00 | | $ | 1,042.60 | | 1.52% | | $ | 7.68 |
| | | | |
Hypothetical | | $ | 1,000.00 | | $ | 1,017.21 | | 1.52% | | $ | 7.58 |
| C Class | | | | | | | | | | | |
Actual | | $ | 1,000.00 | | $ | 1,040.40 | | 2.03% | | $ | 10.24 |
| | | | |
Hypothetical | | $ | 1,000.00 | | $ | 1,014.69 | | 2.03% | | $ | 10.11 |
| A Class | | | | | | | | | | | |
Actual | | $ | 1,000.00 | | $ | 1,043.40 | | 1.37% | | $ | 6.92 |
| | | | |
Hypothetical | | $ | 1,000.00 | | $ | 1,017.95 | | 1.37% | | $ | 6.84 |
| Z Class(c) | | | | | | | | | | | |
Actual | | $ | 1,000.00 | | $ | 1,023.50 | | 0.91% | | $ | 1.41 |
| | | | |
Hypothetical | | $ | 1,000.00 | | $ | 1,020.28 | | 0.91% | | $ | 4.56 |
| | | | |
| ACCESSOR VALUE | | | | | | | | | | | |
| Institutional Class | | | | | | | | | | | |
Actual | | $ | 1,000.00 | | $ | 952.40 | | 1.08% | | $ | 5.23 |
| | | | |
Hypothetical | | $ | 1,000.00 | | $ | 1,019.44 | | 1.08% | | $ | 5.41 |
| Investor Class | | | | | | | | | | | |
Actual | | $ | 1,000.00 | | $ | 950.30 | | 1.54% | | $ | 7.43 |
| | | | |
Hypothetical | | $ | 1,000.00 | | $ | 1,017.11 | | 1.54% | | $ | 7.68 |
| C Class | | | | | | | | | | | |
Actual | | $ | 1,000.00 | | $ | 947.90 | | 2.04% | | $ | 9.83 |
| | | | |
Hypothetical | | $ | 1,000.00 | | $ | 1,014.64 | | 2.04% | | $ | 10.16 |
| A Class | | | | | | | | | | | |
Actual | | $ | 1,000.00 | | $ | 951.00 | | 1.38% | | $ | 6.66 |
| | | | |
Hypothetical | | $ | 1,000.00 | | $ | 1,017.90 | | 1.38% | | $ | 6.89 |
| Z Class(c) | | | | | | | | | | | |
Actual | | $ | 1,000.00 | | $ | 1,011.10 | | 0.93% | | $ | 1.43 |
| | | | |
Hypothetical | | $ | 1,000.00 | | $ | 1,020.18 | | 0.93% | | $ | 4.66 |
Disclosure of Fund Expenses (Unaudited)
For the Six Months Ended June 30, 2009
| | | | | | | | | | | |
| | | BEGINNING
ACCOUNT VALUE ON
01/01/09 | | ENDING
ACCOUNT VALUE ON
06/30/09 | | EXPENSE
RATIO(a) | | EXPENSES PAID
DURING THE PERIOD
01/01/09-06/30/09(b) |
| | | |
| ACCESSOR SMALL TO MID CAP | | | | | | | | |
| Institutional Class | | | | | | | | | | | |
Actual | | $ | 1,000.00 | | $ | 1,049.70 | | 1.32% | | $ | 6.71 |
| | | | |
Hypothetical | | $ | 1,000.00 | | $ | 1,018.25 | | 1.32% | | $ | 6.61 |
| Investor Class | | | | | | | | | | | |
Actual | | $ | 1,000.00 | | $ | 1,047.40 | | 1.79% | | $ | 9.06 |
| | | | |
Hypothetical | | $ | 1,000.00 | | $ | 1,015.87 | | 1.79% | | $ | 8.92 |
| C Class | | | | | | | | | | | |
Actual | | $ | 1,000.00 | | $ | 1,044.90 | | 2.29% | | $ | 11.58 |
| | | | |
Hypothetical | | $ | 1,000.00 | | $ | 1,013.40 | | 2.29% | | $ | 11.40 |
| A Class | | | | | | | | | | | |
Actual | | $ | 1,000.00 | | $ | 1,048.50 | | 1.63% | | $ | 8.26 |
| | | | |
Hypothetical | | $ | 1,000.00 | | $ | 1,016.67 | | 1.63% | | $ | 8.13 |
| Z Class(c) | | | | | | | | | | | |
Actual | | $ | 1,000.00 | | $ | 998.50 | | 1.19% | | $ | 1.82 |
| | | | |
Hypothetical | | $ | 1,000.00 | | $ | 1,018.89 | | 1.19% | | $ | 5.96 |
| | | |
| ACCESSOR INTERNATIONAL EQUITY | | | | | | | | |
| Institutional Class | | | | | | | | | | | |
Actual | | $ | 1,000.00 | | $ | 1,092.70 | | 1.51% | | $ | 7.84 |
| | | | |
Hypothetical | | $ | 1,000.00 | | $ | 1,017.31 | | 1.51% | | $ | 7.55 |
| Investor Class | | | | | | | | | | | |
Actual | | $ | 1,000.00 | | $ | 1,091.90 | | 1.96% | | $ | 10.14 |
| | | | |
Hypothetical | | $ | 1,000.00 | | $ | 1,015.03 | | 1.96% | | $ | 9.77 |
| C Class | | | | | | | | | | | |
Actual | | $ | 1,000.00 | | $ | 1,088.50 | | 2.46% | | $ | 12.70 |
| | | | |
Hypothetical | | $ | 1,000.00 | | $ | 1,012.56 | | 2.46% | | $ | 12.24 |
| A Class | | | | | | | | | | | |
Actual | | $ | 1,000.00 | | $ | 1,091.90 | | 1.81% | | $ | 9.36 |
| | | | |
Hypothetical | | $ | 1,000.00 | | $ | 1,015.78 | | 1.81% | | $ | 9.02 |
| Z Class(c) | | | | | | | | | | | |
Actual | | $ | 1,000.00 | | $ | 1,080.80 | | 1.32% | | $ | 2.11 |
| | | | |
Hypothetical | | $ | 1,000.00 | | $ | 1,018.25 | | 1.32% | | $ | 6.61 |
| | | |
| ACCESSOR TOTAL RETURN | | | | | | | | |
Actual | | $ | 1,000.00 | | $ | 970.60 | | 0.88% | | $ | 4.30 |
| | | | |
Hypothetical | | $ | 1,000.00 | | $ | 1,020.43 | | 0.88% | | $ | 4.41 |
Disclosure of Fund Expenses (Unaudited)
For the Six Months Ended June 30, 2009
| | | | | | | | | | | |
| | | BEGINNING
ACCOUNT VALUE ON
01/01/09 | | ENDING
ACCOUNT VALUE ON
06/30/09 | | EXPENSE
RATIO(a) | | EXPENSES PAID
DURING THE PERIOD
01/01/09-06/30/09(b) |
| | | |
| ACCESSOR STRATEGIC ALTERNATIVES | | | | | | | | |
| Institutional Class | | | | | | | | | | | |
Actual | | $ | 1,000.00 | | $ | 985.10 | | 1.02% | | $ | 5.02 |
| | | | |
Hypothetical | | $ | 1,000.00 | | $ | 1,019.74 | | 1.02% | | $ | 5.11 |
| Investor Class | | | | | | | | | | | |
Actual | | $ | 1,000.00 | | $ | 986.20 | | 1.00% | | $ | 4.91 |
| | | | |
Hypothetical | | $ | 1,000.00 | | $ | 1,019.78 | | 1.00% | | $ | 4.99 |
| Z Class(c) | | | | | | | | | | | |
Actual | | $ | 1,000.00 | | $ | 1,030.00 | | 0.94% | | $ | 1.46 |
| | | | |
Hypothetical | | $ | 1,000.00 | | $ | 1,020.13 | | 0.94% | | $ | 4.71 |
| | | |
| ACCESSOR FRONTIER MARKETS | | | | | | | | |
| Institutional Class | | | | | | | | | | | |
Actual | | $ | 1,000.00 | | $ | 1,031.70 | | 1.56% | | $ | 7.86 |
| | | | |
Hypothetical | | $ | 1,000.00 | | $ | 1,017.06 | | 1.56% | | $ | 7.80 |
| Investor Class | | | | | | | | | | | |
Actual | | $ | 1,000.00 | | $ | 1,032.50 | | 1.67% | | $ | 8.39 |
| | | | |
Hypothetical | | $ | 1,000.00 | | $ | 1,016.47 | | 1.67% | | $ | 8.33 |
| Z Class(c) | | | | | | | | | | | |
Actual | | $ | 1,000.00 | | $ | 1,141.00 | | 1.10% | | $ | 1.81 |
| | | | |
Hypothetical | | $ | 1,000.00 | | $ | 1,019.34 | | 1.10% | | $ | 5.51 |
| | | |
| ACCESSOR HIGH YIELD BOND | | | | | | | | |
| Institutional Class | | | | | | | | | | | |
Actual | | $ | 1,000.00 | | $ | 1,196.00 | | 0.96% | | $ | 5.23 |
| | | | |
Hypothetical | | $ | 1,000.00 | | $ | 1,020.03 | | 0.96% | | $ | 4.81 |
| Investor Class | | | | | | | | | | | |
Actual | | $ | 1,000.00 | | $ | 1,192.00 | | 1.40% | | $ | 7.59 |
| | | | |
Hypothetical | | $ | 1,000.00 | | $ | 1,017.80 | | 1.40% | | $ | 6.99 |
| C Class | | | | | | | | | | | |
Actual | | $ | 1,000.00 | | $ | 1,189.40 | | 1.92% | | $ | 10.39 |
| | | | |
Hypothetical | | $ | 1,000.00 | | $ | 1,015.23 | | 1.92% | | $ | 9.57 |
| A Class | | | | | | | | | | | |
Actual | | $ | 1,000.00 | | $ | 1,193.40 | | 1.17% | | $ | 6.35 |
| | | | |
Hypothetical | | $ | 1,000.00 | | $ | 1,018.94 | | 1.17% | | $ | 5.84 |
| Z Class(c) | | | | | | | | | | | |
Actual | | $ | 1,000.00 | | $ | 1,033.80 | | 0.85% | | $ | 1.33 |
| | | | |
Hypothetical | | $ | 1,000.00 | | $ | 1,020.58 | | 0.85% | | $ | 4.26 |
Disclosure of Fund Expenses (Unaudited)
For the Six Months Ended June 30, 2009
| | | | | | | | | | | |
| | | BEGINNING
ACCOUNT VALUE ON
01/01/09 | | ENDING
ACCOUNT VALUE ON
06/30/09 | | EXPENSE
RATIO(a) | | EXPENSES PAID
DURING THE PERIOD
01/01/09-06/30/09(b) |
| |
| ACCESSOR INVESTMENT GRADE FIXED-INCOME | | | |
| Institutional Class | | | | | | | | | | | |
Actual | | $ | 1,000.00 | | $ | 1,032.10 | | 1.06% | | $ | 5.34 |
| | | | |
Hypothetical | | $ | 1,000.00 | | $ | 1,019.54 | | 1.06% | | $ | 5.31 |
| Investor Class | | | | | | | | | | | |
Actual | | $ | 1,000.00 | | $ | 1,028.60 | | 1.50% | | $ | 7.52 |
| | | | |
Hypothetical | | $ | 1,000.00 | | $ | 1,017.31 | | 1.50% | | $ | 7.48 |
| C Class | | | | | | | | | | | |
Actual | | $ | 1,000.00 | | $ | 1,027.10 | | 1.99% | | $ | 9.97 |
| | | | |
Hypothetical | | $ | 1,000.00 | | $ | 1,014.89 | | 1.99% | | $ | 9.91 |
| Z Class(c) | | | | | | | | | | | |
Actual | | $ | 1,000.00 | | $ | 1,040.60 | | 0.85% | | $ | 1.33 |
| | | | |
Hypothetical | | $ | 1,000.00 | | $ | 1,020.58 | | 0.85% | | $ | 4.26 |
| |
| ACCESSOR MORTGAGE SECURITIES | | | |
| Institutional Class | | | | | | | | | | | |
Actual | | $ | 1,000.00 | | $ | 1,055.20 | | 1.07% | | $ | 5.45 |
| | | | |
Hypothetical | | $ | 1,000.00 | | $ | 1,019.49 | | 1.07% | | $ | 5.36 |
| Investor Class | | | | | | | | | | | |
Actual | | $ | 1,000.00 | | $ | 1,052.60 | | 1.54% | | $ | 7.82 |
| | | | |
Hypothetical | | $ | 1,000.00 | | $ | 1,017.11 | | 1.54% | | $ | 7.68 |
| C Class | | | | | | | | | | | |
Actual | | $ | 1,000.00 | | $ | 1,049.90 | | 2.05% | | $ | 10.39 |
| | | | |
Hypothetical | | $ | 1,000.00 | | $ | 1,014.59 | | 2.05% | | $ | 10.21 |
| Z Class(c) | | | | | | | | | | | |
Actual | | $ | 1,000.00 | | $ | 1,020.30 | | 0.96% | | $ | 1.49 |
| | | | |
Hypothetical | | $ | 1,000.00 | | $ | 1,020.03 | | 0.96% | | $ | 4.81 |
| |
| ACCESSOR LIMITED DURATION U.S. GOVERNMENT | | | |
| Institutional Class | | | | | | | | | | | |
Actual | | $ | 1,000.00 | | $ | 1,013.10 | | 0.67% | | $ | 3.34 |
| | | | |
Hypothetical | | $ | 1,000.00 | | $ | 1,021.47 | | 0.67% | | $ | 3.36 |
Disclosure of Fund Expenses (Unaudited)
For the Six Months Ended June 30, 2009
| | | | | | | | | | | |
| | | BEGINNING
ACCOUNT VALUE ON
01/01/09 | | ENDING
ACCOUNT VALUE ON
06/30/09 | | EXPENSE
RATIO(a) | | EXPENSES PAID
DURING THE PERIOD
01/01/09-06/30/09(b) |
| |
| ACCESSOR U.S. GOVERNMENT MONEY | | | |
| Institutional Class | | | | | | | | | | | |
Actual | | $ | 1,000.00 | | $ | 1,002.10 | | 0.48% | | $ | 2.38 |
| | | | |
Hypothetical | | $ | 1,000.00 | | $ | 1,022.41 | | 0.48% | | $ | 2.41 |
| Investor Class | | | | | | | | | | | |
Actual | | $ | 1,000.00 | | $ | 1,001.30 | | 0.65% | | $ | 3.22 |
| | | | |
Hypothetical | | $ | 1,000.00 | | $ | 1,021.51 | | 0.65% | | $ | 3.25 |
| C Class | | | | | | | | | | | |
Actual | | $ | 1,000.00 | | $ | 1,001.10 | | 0.67% | | $ | 3.32 |
| | | | |
Hypothetical | | $ | 1,000.00 | | $ | 1,021.41 | | 0.67% | | $ | 3.35 |
| A Class | | | | | | | | | | | |
Actual | | $ | 1,000.00 | | $ | 1,001.50 | | 0.61% | | $ | 3.02 |
| | | | |
Hypothetical | | $ | 1,000.00 | | $ | 1,021.71 | | 0.61% | | $ | 3.05 |
| Z Class | | | | | | | | | | | |
Actual | | $ | 1,000.00 | | $ | 1,003.30 | | 0.24% | | $ | 1.19 |
| | | | |
Hypothetical | | $ | 1,000.00 | | $ | 1,023.60 | | 0.24% | | $ | 1.20 |
| |
| ACCESSOR INCOME ALLOCATION | | | |
| Institutional Class | | | | | | | | | | | |
Actual | | $ | 1,000.00 | | $ | 1,071.00 | | 0.46% | | $ | 2.36 |
| | | | |
Hypothetical | | $ | 1,000.00 | | $ | 1,022.51 | | 0.46% | | $ | 2.31 |
| Investor Class | | | | | | | | | | | |
Actual | | $ | 1,000.00 | | $ | 1,068.40 | | 0.97% | | $ | 4.96 |
| | | | |
Hypothetical | | $ | 1,000.00 | | $ | 1,019.93 | | 0.97% | | $ | 4.84 |
| C Class | | | | | | | | | | | |
Actual | | $ | 1,000.00 | | $ | 1,065.20 | | 1.46% | | $ | 7.46 |
| | | | |
Hypothetical | | $ | 1,000.00 | | $ | 1,017.51 | | 1.46% | | $ | 7.28 |
| A Class | | | | | | | | | | | |
Actual | | $ | 1,000.00 | | $ | 1,069.80 | | 0.71% | | $ | 3.63 |
| | | | |
Hypothetical | | $ | 1,000.00 | | $ | 1,021.22 | | 0.71% | | $ | 3.55 |
Disclosure of Fund Expenses (Unaudited)
For the Six Months Ended June 30, 2009
| | | | | | | | | | | |
| | | BEGINNING
ACCOUNT VALUE ON
01/01/09 | | ENDING
ACCOUNT VALUE ON
06/30/09 | | EXPENSE
RATIO(a) | | EXPENSES PAID
DURING THE PERIOD
01/01/09-06/30/09(b) |
| | | |
| ACCESSOR INCOME & GROWTH ALLOCATION | | | | | | | | |
| Institutional Class | | | | | | | | | | | |
Actual | | $ | 1,000.00 | | $ | 1,058.10 | | 0.27% | | $ | 1.38 |
| | | | |
Hypothetical | | $ | 1,000.00 | | $ | 1,023.46 | | 0.27% | | $ | 1.35 |
| Investor Class | | | | | | | | | | | |
Actual | | $ | 1,000.00 | | $ | 1,054.80 | | 0.78% | | $ | 3.96 |
| | | | |
Hypothetical | | $ | 1,000.00 | | $ | 1,020.87 | | 0.78% | | $ | 3.90 |
| C Class | | | | | | | | | | | |
Actual | | $ | 1,000.00 | | $ | 1,052.30 | | 1.28% | | $ | 6.50 |
| | | | |
Hypothetical | | $ | 1,000.00 | | $ | 1,018.40 | | 1.28% | | $ | 6.39 |
| A Class | | | | | | | | | | | |
Actual | | $ | 1,000.00 | | $ | 1,055.60 | | 0.63% | | $ | 3.20 |
| | | | |
Hypothetical | | $ | 1,000.00 | | $ | 1,021.61 | | 0.63% | | $ | 3.15 |
| |
| ACCESSOR BALANCED ALLOCATION | | | |
| Institutional Class | | | | | | | | | | | |
Actual | | $ | 1,000.00 | | $ | 1,052.80 | | 0.18% | | $ | 0.92 |
| | | | |
Hypothetical | | $ | 1,000.00 | | $ | 1,023.90 | | 0.18% | | $ | 0.90 |
| Investor Class | | | | | | | | | | | |
Actual | | $ | 1,000.00 | | $ | 1,050.30 | | 0.69% | | $ | 3.50 |
| | | | |
Hypothetical | | $ | 1,000.00 | | $ | 1,021.31 | | 0.69% | | $ | 3.45 |
| C Class | | | | | | | | | | | |
Actual | | $ | 1,000.00 | | $ | 1,047.70 | | 1.19% | | $ | 6.03 |
| | | | |
Hypothetical | | $ | 1,000.00 | | $ | 1,018.84 | | 1.19% | | $ | 5.94 |
| A Class | | | | | | | | | | | |
Actual | | $ | 1,000.00 | | $ | 1,051.90 | | 0.54% | | $ | 2.74 |
| | | | |
Hypothetical | | $ | 1,000.00 | | $ | 1,022.06 | | 0.54% | | $ | 2.70 |
Disclosure of Fund Expenses (Unaudited)
For the Six Months Ended June 30, 2009
| | | | | | | | | | | |
| | | BEGINNING
ACCOUNT VALUE ON
01/01/09 | | ENDING
ACCOUNT VALUE ON
06/30/09 | | EXPENSE
RATIO(a) | | EXPENSES PAID
DURING THE PERIOD
01/01/09-06/30/09(b) |
| | | |
| ACCESSOR GROWTH & INCOME ALLOCATION | | | | | | | | |
| Institutional Class | | | | | | | | | | | |
Actual | | $ | 1,000.00 | | $ | 1,052.30 | | 0.19% | | $ | 0.97 |
| | | | |
Hypothetical | | $ | 1,000.00 | | $ | 1,023.85 | | 0.19% | | $ | 0.95 |
| Investor Class | | | | | | | | | | | |
Actual | | $ | 1,000.00 | | $ | 1,049.80 | | 0.70% | | $ | 3.55 |
| | | | |
Hypothetical | | $ | 1,000.00 | | $ | 1,021.27 | | 0.70% | | $ | 3.50 |
| C Class | | | | | | | | | | | |
Actual | | $ | 1,000.00 | | $ | 1,046.50 | | 1.20% | | $ | 6.07 |
| | | | |
Hypothetical | | $ | 1,000.00 | | $ | 1,018.84 | | 1.20% | | $ | 5.99 |
| A Class | | | | | | | | | | | |
Actual | | $ | 1,000.00 | | $ | 1,050.60 | | 0.55% | | $ | 2.73 |
| | | | |
Hypothetical | | $ | 1,000.00 | | $ | 1,022.01 | | 0.55% | | $ | 2.70 |
| |
| ACCESSOR GROWTH ALLOCATION | | | |
| Institutional Class | | | | | | | | | | | |
Actual | | $ | 1,000.00 | | $ | 1,043.50 | | 0.19% | | $ | 0.96 |
| | | | |
Hypothetical | | $ | 1,000.00 | | $ | 1,023.85 | | 0.19% | | $ | 0.95 |
| Investor Class | | | | | | | | | | | |
Actual | | $ | 1,000.00 | | $ | 1,040.10 | | 0.70% | | $ | 3.53 |
| | | | |
Hypothetical | | $ | 1,000.00 | | $ | 1,021.27 | | 0.70% | | $ | 3.50 |
| C Class | | | | | | | | | | | |
Actual | | $ | 1,000.00 | | $ | 1,037.90 | | 1.19% | | $ | 6.00 |
| | | | |
Hypothetical | | $ | 1,000.00 | | $ | 1,018.84 | | 1.19% | | $ | 5.94 |
| A Class | | | | | | | | | | | |
Actual | | $ | 1,000.00 | | $ | 1,040.90 | | 0.54% | | $ | 2.73 |
| | | | |
Hypothetical | | $ | 1,000.00 | | $ | 1,022.06 | | 0.54% | | $ | 2.70 |
Disclosure of Fund Expenses (Unaudited)
For the Six Months Ended June 30, 2009
| | | | | | | | | | | |
| | | BEGINNING
ACCOUNT VALUE ON
01/01/09 | | ENDING
ACCOUNT VALUE ON
06/30/09 | | EXPENSE
RATIO(a) | | EXPENSES PAID
DURING THE PERIOD
01/01/09-06/30/09(b) |
| |
| ACCESSOR AGGRESSIVE GROWTH ALLOCATION | | | |
| Institutional Class | | | | | | | | | | | |
Actual | | $ | 1,000.00 | | $ | 1,034.00 | | 0.26% | | $ | 1.31 |
| | | | |
Hypothetical | | $ | 1,000.00 | | $ | 1,023.51 | | 0.26% | | $ | 1.30 |
| Investor Class | | | | | | | | | | | |
Actual | | $ | 1,000.00 | | $ | 1,031.60 | | 0.76% | | $ | 3.82 |
| | | | |
Hypothetical | | $ | 1,000.00 | | $ | 1,020.97 | | 0.76% | | $ | 3.80 |
| C Class | | | | | | | | | | | |
Actual | | $ | 1,000.00 | | $ | 1,028.80 | | 1.26% | | $ | 6.32 |
| | | | |
Hypothetical | | $ | 1,000.00 | | $ | 1,018.50 | | 1.26% | | $ | 6.29 |
| A Class | | | | | | | | | | | |
Actual | | $ | 1,000.00 | | $ | 1,031.80 | | 0.61% | | $ | 3.06 |
| | | | |
Hypothetical | | $ | 1,000.00 | | $ | 1,021.71 | | 0.61% | | $ | 3.05 |
(a) Annualized, based on the Portfolio’s most recent fiscal half-year expenses.
(b) Expenses are equal to the Fund’s annualized expense ratio multiplied by the average account value over the period, multiplied by the number of days in the most recent fiscal half year (181), then divided by 365.
(c) The Z Class for Accessor Growth, Accessor Value, Accessor Small to Mid Cap, Accessor International Equity, Accessor Strategic Alternatives, Accessor Frontier Markets, Accessor High Yield, Accessor Investment Grade Fixed-Income and Accessor Mortgage Securities Funds commenced operations on May 5, 2009. The information presented above is calculated for the full six month period. The Funds’ actual expenses have been annualized and are from the period of May 5, 2009 through June 30, 2009. The Z Class for the Accessor Growth, Accessor Value, Accessor Small to Mid Cap, Accessor International Equity, Accessor Strategic Alternatives, Accessor Frontier Markets, Accessor High Yield Bond, Accessor Investment Grade Fixed-Income and Accessor Mortgage Securities Funds non annualized expense ratios are 0.14%, 0.14%, 0.18%, 0.20%, 0.14%, 0.17%, 0.13%, 0.13% and 0.15%, respectively.
Summary of Portfolio Holdings (Unaudited)
| | |
| |
| ACCESSOR GROWTH | | |
| |
| Sector Allocation as of 6/30/09 | | |
Information Technology | | 29.4% |
| |
Energy | | 20.5% |
| |
Health Care | | 15.3% |
| |
Consumer Staples | | 10.8% |
| |
Consumer Discretionary | | 8.7% |
| |
Industrials | | 7.2% |
| |
Financials | | 6.5% |
| |
Materials | | 1.3% |
| |
Exchange Traded Fund | | 0.3% |
| | 100.0% |
| |
| ACCESSOR VALUE | | |
| |
| Sector Allocation as of 6/30/09 | | |
Financials | | 21.9% |
| |
Health Care | | 14.1% |
| |
Industrials | | 13.3% |
| |
Consumer Staples | | 10.4% |
| |
Information Technology | | 9.7% |
| |
Consumer Discretionary | | 7.4% |
| |
Telecommunication Services | | 7.2% |
| |
Materials | | 6.5% |
| |
Utilities | | 5.9% |
| |
Energy | | 3.6% |
| | 100.0% |
| |
| ACCESSOR SMALL TO MID CAP | | |
| |
| Sector Allocation as of 6/30/09 | | |
Financials | | 20.6% |
| |
Information Technology | | 17.6% |
| |
Consumer Discretionary | | 15.2% |
| |
Industrials | | 11.9% |
| |
Health Care | | 10.5% |
| |
Energy | | 9.5% |
| |
Materials | | 5.5% |
| |
Consumer Staples | | 3.6% |
| |
Utilities | | 3.4% |
| |
Telecommunication Services | | 2.2% |
| | 100.0% |
| | |
| |
| ACCESSOR INTERNATIONAL EQUITY | | |
| |
| Sector Allocation as of 6/30/09 | | |
Financials | | 25.0% |
| |
Energy | | 11.0% |
| |
Industrials | | 9.8% |
| |
Materials | | 9.5% |
| |
Consumer Discretionary | | 9.3% |
| |
Consumer Staples | | 8.4% |
| |
Health Care | | 8.1% |
| |
Information Technology | | 7.3% |
| |
Telecommunication Services | | 6.2% |
| |
Utilities | | 5.4% |
| | 100.0% |
| |
| ACCESSOR TOTAL RETURN | | |
| |
| Sector Allocation as of 6/30/09 | | |
Exchange Traded Fund | | 62.2% |
| |
Industrials | | 10.1% |
| |
Information Technology | | 7.6% |
| |
Energy | | 6.4% |
| |
Consumer Discretionary | | 5.4% |
| |
Financials | | 2.2% |
| |
Consumer Staples | | 1.9% |
| |
Investment Company | | 1.9% |
| |
Telecommunication Services | | 1.2% |
| |
Materials | | 1.1% |
| | 100.0% |
| |
| ACCESSOR STRATEGIC ALTERNATIVES | | |
| |
| Sector Allocation as of 6/30/09 | | |
Exchange Traded Fund | | 32.3% |
| |
Structured Notes | | 21.4% |
| |
U.S. Government | | 18.8% |
| |
Exchange Traded Note | | 17.8% |
| |
Others | | 9.7% |
| | 100.0% |
Summary of Portfolio Holdings (Unaudited)
| | |
| |
| ACCESSOR FRONTIER MARKETS | | |
| |
| Sector Allocation as of 6/30/09 | | |
Exchange Traded Fund | | 41.9% |
| |
Financials | | 24.2% |
| |
Warrants | | 17.9% |
| |
U. S. Government and Agency | | 7.3% |
| |
Investment Company | | 6.6% |
| |
Telecommunication Services | | 1.1% |
| |
Energy | | 0.6% |
| |
Consumer Staples | | 0.4% |
| | 100.0% |
| |
| ACCESSOR HIGH YIELD BOND | | |
| |
| Sector Allocation as of 6/30/09 | | |
Consumer Discretionary | | 23.2% |
| |
Energy | | 12.9% |
| |
Consumer Staples | | 12.8% |
| |
Telecommunication Services | | 11.2% |
| |
Health Care | | 9.7% |
| |
Information Technology | | 6.7% |
| |
Industrials | | 6.0% |
| |
Materials | | 6.0% |
| |
Financials | | 5.8% |
| |
Utilities | | 5.7% |
| | 100.0% |
| |
| ACCESSOR INVESTMENT GRADE FIXED-INCOME | | |
| |
| Sector Allocation as of 6/30/09 | | |
Collateralized Mortgage Obligations | | 50.3% |
| |
Corporate Bonds | | 31.5% |
| |
U.S. Government and Agency | | 8.1% |
| |
Asset Backed | | 5.8% |
| |
Municipal Bonds | | 4.3% |
| | 100.0% |
| |
| Credit Quality as of 6/30/09 | | |
U.S. Government and Agency | | 51.2% |
| |
AAA | | 8.5% |
| |
AA | | 9.9% |
| |
A | | 19.4% |
| |
BBB | | 5.5% |
| |
BB | | 3.7% |
| |
B | | 0.9% |
| | |
|
| ACCESSOR INVESTMENT GRADE FIXED-INCOME (continued) |
| |
CCC | | 0.5% |
| |
CC | | 0.1% |
| |
NR | | 0.3% |
| |
Average Credit Quality | | AA- |
| |
| ACCESSOR MORTGAGE SECURITIES | | |
| |
| Sector Allocation as of 6/30/09 | | |
Collateralized Mortgage Obligations | | 99.6% |
| |
Asset Backed | | 0.4% |
| | 100.0% |
| |
| Credit Quality as of 6/30/09 | | |
U.S. Government and Agency | | 90.6% |
| |
AAA | | 5.4% |
| |
BBB | | 1.4% |
| |
BB | | 1.8% |
| |
B | | 0.8% |
| |
Average Credit Quality | | AAA |
|
| ACCESSOR LIMITED DURATION U.S. GOVERNMENT |
| |
| Sector Allocation as of 6/30/09 | | |
U.S. Government and Agency | | 100.0% |
| |
| Credit Quality as of 6/30/09 | | |
U.S. Government and Agency | | 100.00% |
| |
Average Credit Quality | | Govt. Equiv. |
| |
| ACCESSOR U.S. GOVERNMENT MONEY FUND | | |
| |
| Sector Allocation as of 6/30/09 | | |
U.S. Government and Agency | | 87.9% |
| |
Other | | 12.1% |
| | 100.0% |
| |
| Credit Quality as of 6/30/09 | | |
U.S. Government and Agency | | 100.00% |
| |
Average Credit Quality | | Govt. Equiv. |
Accessor Income Allocation Fund (Unaudited)
Fund Allocation as of 6/30/09
| | | | | | | | |
| | | UNDERLYING ACCESSOR FUND AND FUND ADVISOR OR SUB-ADVISOR | | # OF ISSUES | | ALLOCATION | |  |
| | Fixed-Income Funds | | | | | |
 | | Accessor High Yield Bond — First Western | | 101 | | 19.0% | |
 | | Accessor Investment Grade Fixed-Income — PIMCO | | 155 | | 51.0% | |
 | | Accessor Mortgage Securities — BlackRock Financial Mgmt | | 113 | | 24.9% | |
 | | Accessor U.S. Government Money — Forward Mgmt | | 32 | | 5.1% | |
| | Total | | 401 | | 100.0% | |
Accessor Income & Growth Allocation Fund (Unaudited)
Fund Allocation as of 6/30/09
| | | | | | | | |
| | | UNDERLYING ACCESSOR FUND AND FUND ADVISOR OR SUB-ADVISOR | | # OF ISSUES | | ALLOCATION | |  |
| | Equity Funds | | | | | |
| | Accessor Growth — Smith Asset Mgmt | | 100 | | 6.1% | |
| | Accessor Value — Acadian Asset Mgmt | | 198 | | 5.9% | |
| | Accessor Small to Mid Cap — LA Capital Mgmt | | 500 | | 7.5% | |
| | Accessor International Equity — Lazard Asset Mgmt | | 210 | | 6.8% | |
 | | Accessor Strategic Alternatives — Forward Mgmt | | 11 | | 15.0% | |
 | | Accessor Frontier Markets — Forward Mgmt | | 20 | | 3.3% | |
| | Fixed-Income Funds | | | | | |
 | | Accessor High Yield Bond — First Western | | 101 | | 11.6% | |
 | | Accessor Investment Grade Fixed-Income — PIMCO | | 161 | | 28.4% | |
 | | Accessor Mortgage Securities — BlackRock Financial Mgmt | | 113 | | 15.4% | |
| | Accessor U.S. Government Money — Forward Mgmt | | 32 | | 0.0% | |
| | Total | | 1,446 | | 100.0% | |
Accessor Balanced Allocation Fund (Unaudited)
Fund Allocation as of 6/30/09
| | | | | | | | |
| | | UNDERLYING ACCESSOR FUND AND FUND ADVISOR OR SUB-ADVISOR | | # OF ISSUES | | ALLOCATION | |  |
| | Equity Funds | | | | | |
| | Accessor Growth — Smith Asset Mgmt | | 100 | | 9.8% | |
| | Accessor Value — Acadian Asset Mgmt | | 198 | | 9.7% | |
| | Accessor Small to Mid Cap — LA Capital Mgmt | | 500 | | 12.7% | |
| | Accessor International Equity — Lazard Asset Mgmt | | 210 | | 11.2% | |
| | Accessor Strategic Alternatives — Forward Mgmt | | 11 | | 12.6% | |
| | Accessor Frontier Markets — Forward Mgmt | | 20 | | 4.0% | |
| | Fixed-Income Funds | | | | | |
| | Accessor High Yield Bond — First Western | | 101 | | 7.7% | |
| | Accessor Investment Grade Fixed-Income — PIMCO | | 161 | | 19.8% | |
| | Accessor Mortgage Securities — BlackRock Financial Mgmt | | 113 | | 10.8% | |
 | | Accessor U.S. Government Money — Forward Mgmt | | 32 | | 1.7% | |
| | Total | | 1,446 | | 100.0% | |
Accessor Growth & Income Allocation Fund (Unaudited)
Fund Allocation as of 6/30/09
| | | | | | | | |
| | | UNDERLYING ACCESSOR FUND AND FUND ADVISOR OR SUB-ADVISOR | | # OF ISSUES | | ALLOCATION | | 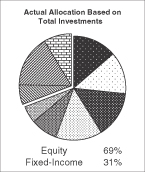 |
| | Equity Funds | | | | | |
| | Accessor Growth — Smith Asset Mgmt | | 100 | | 13.5% | |
| | Accessor Value — Acadian Asset Mgmt | | 198 | | 13.3% | |
| | Accessor Small to Mid Cap — LA Capital Mgmt | | 500 | | 14.3% | |
| | Accessor International Equity — Lazard Asset Mgmt | | 210 | | 14.5% | |
| | Accessor Strategic Alternatives — Forward Mgmt | | 11 | | 8.2% | |
| | Accessor Frontier Markets — Forward Mgmt | | 20 | | 5.3% | |
| | Fixed-Income Funds | | | | | |
| | Accessor High Yield Bond — First Western | | 101 | | 6.1% | |
| | Accessor Investment Grade Fixed-Income — PIMCO | | 161 | | 16.2% | |
 | | Accessor Mortgage Securities — BlackRock Financial Mgmt | | 113 | | 8.6% | |
| | Total | | 1,414 | | 100.0% | |
Accessor Growth Allocation Fund (Unaudited)
Fund Allocation as of 6/30/09
| | | | | | | | |
| | | UNDERLYING ACCESSOR FUND AND FUND ADVISOR OR SUB-ADVISOR | | # OF ISSUES | | ALLOCATION | | 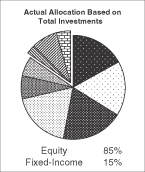 |
| | Equity Funds | | | | | |
| | Accessor Growth — Smith Asset Mgmt | | 100 | | 16.9% | |
| | Accessor Value — Acadian Asset Mgmt | | 198 | | 17.0% | |
| | Accessor Small to Mid Cap — LA Capital Mgmt | | 500 | | 19.1% | |
| | Accessor International Equity — Lazard Asset Mgmt | | 210 | | 18.5% | |
| | Accessor Strategic Alternatives — Forward Mgmt | | 11 | | 7.2% | |
| | Accessor Frontier Markets — Forward Mgmt | | 20 | | 6.0% | |
| | Fixed-Income Funds | | | | | |
| | Accessor High Yield Bond — First Western | | 101 | | 2.8% | |
| | Accessor Investment Grade Fixed-Income — PIMCO | | 161 | | 8.1% | |
| | Accessor Mortgage Securities — BlackRock Financial Mgmt | | 113 | | 4.4% | |
| | Total | | 1,414 | | 100.0% | |
Accessor Aggressive Growth Allocation Fund (Unaudited)
Fund Allocation as of 6/30/09
| | | | | | | | |
| | | UNDERLYING ACCESSOR FUND AND FUND ADVISOR OR SUB-ADVISOR | | # OF ISSUES | | ALLOCATION | | 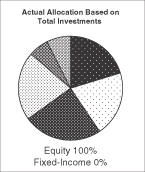 |
| | Equity Funds | | | | | |
| | Accessor Growth — Smith Asset Mgmt | | 100 | | 20.2% | |
| | Accessor Value — Acadian Asset Mgmt | | 198 | | 20.3% | |
| | Accessor Small to Mid Cap — LA Capital Mgmt | | 500 | | 24.4% | |
| | Accessor International Equity — Lazard Asset Mgmt | | 210 | | 21.5% | |
| | Accessor Strategic Alternatives — Forward Mgmt | | 11 | | 6.2% | |
| | Accessor Frontier Markets — Forward Mgmt | | 20 | | 7.4% | |
| | Total | | 1,039 | | 100.0% | |
Schedule of Investments as of June 30, 2009 (Unaudited)
Accessor Growth Fund
| | | | | |
| Shares | | | | Value |
| |
| COMMON STOCKS (99.4%) | | | |
| Aerospace & Defense (3.7%) | | | |
| | |
| 6,470 | | General Dynamics | | $ | 358,373 |
| | |
| 9,200 | | Honeywell International | | | 288,880 |
| | |
| 8,500 | | L-3 Communications Holdings — Class 3 | | | 589,730 |
| | |
| 10,180 | | Lockheed Martin | | | 821,017 |
| | |
| 7,400 | | Raytheon | | | 328,782 |
| | |
| 7,900 | | United Technologies | | | 410,484 |
| | |
| | | | | 2,797,266 |
| | | | | |
| Air Freight & Logistics (1.0%) | | | |
| | |
| 6,800 | | CH Robinson Worldwide | | | 354,620 |
| | |
| 12,500 | | Expeditors International of Washington | | | 416,750 |
| | |
| | | | | 771,370 |
| | | | | |
| Beverages (2.5%) | | | |
| | |
| 4,100 | | Coca-Cola Company | | | 196,759 |
| | |
| 30,600 | | PepsiCo | | | 1,681,776 |
| | |
| | | | | 1,878,535 |
| | | | | |
| Biotechnology (3.0%) | | | |
| | |
| 17,800 | | Amgen* | | | 942,332 |
| | |
| 14,100 | | Biogen Idec* | | | 636,615 |
| | |
| 15,100 | | Gilead Sciences* | | | 707,284 |
| | |
| | | | | 2,286,231 |
| | | | | |
| Capital Markets (4.1%) | | | |
| | |
| 12,200 | | Federated Investors — Class B | | | 293,898 |
| | |
| 7,200 | | Franklin Resources | | | 518,472 |
| | |
| 10,350 | | Goldman Sachs | | | 1,526,004 |
| | |
| 9,900 | | T Rowe Price Group | | | 412,533 |
| | |
| 13,000 | | Waddell & Reed Financial — Class A | | | 342,810 |
| | |
| | | | | 3,093,717 |
| | | | | |
| Chemicals (0.6%) | | | |
| | |
| 5,800 | | Monsanto | | | 431,172 |
| | | | | |
| Commercial Services & Supplies (0.4%) | | | |
| | |
| 13,000 | | Equifax | | | 339,300 |
| | | | | |
| Communications Equipment (5.4%) | | | |
| | |
| 119,380 | | Cisco Systems* | | | 2,225,243 |
| | |
| 80,100 | | Motorola | | | 531,063 |
| | |
| 29,100 | | QUALCOMM | | | 1,315,320 |
| | |
| | | | | 4,071,626 |
| | | | | |
| Shares | | | | Value |
| | |
| | | | | |
| Computers & Peripherals (9.0%) | | | |
| | |
| 18,830 | | Apple Computer* | | $ | 2,681,957 |
| | |
| 45,900 | | EMC* | | | 601,290 |
| | |
| 27,500 | | Hewlett-Packard | | | 1,062,875 |
| | |
| 21,000 | | International Business Machines | | | 2,192,820 |
| | |
| 20,500 | | SanDisk | | | 301,145 |
| | |
| | | | | 6,840,087 |
| | | | | |
| Construction & Engineering (0.3%) | | | |
| | |
| 5,300 | | Jacobs Engineering Group* | | | 223,077 |
| | | | | |
| Consumer Finance (0.7%) | | | |
| | |
| 23,200 | | American Express | | | 539,168 |
| | | | | |
| Diversified Consumer Services (0.3%) | | | |
| | |
| 3,100 | | Apollo Group — Class A* | | | 220,472 |
| | | | | |
| Electrical Equipment (0.7%) | | | |
| | |
| 11,000 | | Emerson Electric | | | 356,400 |
| | |
| 5,200 | | General Cable* | | | 195,416 |
| | |
| | | | | 551,816 |
| | | | | |
| Energy Equipment & Services (1.8%) | | | |
| | |
| 2,600 | | Diamond Offshore Drilling | | | 215,930 |
| | |
| 21,080 | | Schlumberger | | | 1,140,639 |
| | |
| | | | | 1,356,569 |
| | | | | |
| Food & Staples Retailing (2.1%) | | | |
| | |
| 17,600 | | Kroger | | | 388,080 |
| | |
| 24,600 | | Wal-Mart Stores | | | 1,191,624 |
| | |
| | | | | 1,579,704 |
| | | | | |
| Food Products (1.3%) | | | |
| | |
| 17,680 | | General Mills | | | 990,434 |
| | | | | |
| Health Care Equipment & Supplies (3.5%) | | | |
| | |
| 10,590 | | Baxter International | | | 560,846 |
| | |
| 43,700 | | Boston Scientific* | | | 443,118 |
| | |
| 2,600 | | C.R. Bard | | | 193,570 |
| | |
| 26,700 | | Medtronic | | | 931,563 |
| | |
| 13,000 | | Resmed* | | | 529,490 |
| | |
| | | | | 2,658,587 |
| | | | |
| June 30, 2009 | | 24 | | See Notes to Financial Statements |
Schedule of Investments as of June 30, 2009 (Unaudited)
Accessor Growth Fund
| | | | | |
| Shares | | | | Value |
| Health Care Providers & Services (2.4%) | | | |
| | |
| 9,500 | | Express Scripts — Class A* | | $ | 653,125 |
| | |
| 27,920 | | UnitedHealth Group | | | 697,442 |
| | |
| 9,800 | | WellPoint Inc.* | | | 498,722 |
| | |
| | | | | 1,849,289 |
| | | | | |
| Hotels, Restaurants & Leisure (2.3%) | | | |
| | |
| 20,500 | | McDonald’s | | | 1,178,545 |
| | |
| 16,000 | | Yum! Brands | | | 533,440 |
| | |
| | | | | 1,711,985 |
| | | | | |
| Household Products (2.9%) | | | |
| | |
| 42,600 | | Procter & Gamble | | | 2,176,860 |
| | | | | |
| Industrial Conglomerates (1.0%) | | | |
| | |
| 12,300 | | 3M | | | 739,230 |
| | | | | |
| Insurance (1.6%) | | | |
| | |
| 11,340 | | Aflac | | | 352,561 |
| | |
| 44,000 | | Progressive | | | 664,840 |
| | |
| 6,200 | | Torchmark | | | 229,648 |
| | |
| | | | | 1,247,049 |
| | | | | |
| Internet & Catalog Retail (1.0%) | | | |
| | |
| 9,500 | | Amazon.com* | | | 794,770 |
| | | | | |
| Internet Software & Services (3.3%) | | | |
| | |
| 4,810 | | Google — Class A* | | | 2,027,848 |
| | |
| 31,300 | | Yahoo!* | | | 490,158 |
| | |
| | | | | 2,518,006 |
| | | | | |
| IT Services (2.6%) | | | |
| | |
| 41,700 | | Genpact Ltd.* | | | 489,975 |
| | |
| 15,900 | | Lender Processing Services | | | 441,543 |
| | |
| 2,700 | | Mastercard — Class A | | | 451,737 |
| | |
| 10,500 | | SAIC* | | | 194,775 |
| | |
| 21,800 | | Western Union | | | 357,520 |
| | |
| | | | | 1,935,550 |
| | | | | |
| Life Sciences Tools & Services (0.6%) | | | |
| | |
| 10,400 | | Thermo Fisher Scientific* | | | 424,008 |
| | | | | |
| Media (2.2%) | | | |
| | |
| 35,500 | | Comcast — Class A | | | 514,395 |
| | |
| 14,600 | | McGraw Hill | | | 439,606 |
| | | | | |
| Shares | | | | Value |
| | | | |
| | |
| 10,700 | | Time Warner Cable — Class A | | $ | 338,869 |
| | |
| 16,200 | | Viacom — Class B* | | | 367,740 |
| | |
| | | | | 1,660,610 |
| | | | | |
| Metals & Mining (0.8%) | | | |
| | |
| 11,360 | | Freeport-McMoRan Copper & Gold | | | 569,249 |
| | | | | |
| Multi-Line Retail (0.7%) | | | |
| | |
| 12,500 | | Target | | | 493,375 |
| | | | | |
| Oil, Gas & Consumable Fuels (18.7%) | | | |
| | |
| 10,900 | | Anadarko Petroleum | | | 494,751 |
| | |
| 10,000 | | Apache | | | 721,500 |
| | |
| 16,300 | | Chesapeake Energy | | | 323,229 |
| | |
| 36,680 | | ChevronTexaco | | | 2,430,050 |
| | |
| 22,200 | | ConocoPhillips | | | 933,732 |
| | |
| 6,500 | | Consol Energy | | | 220,740 |
| | |
| 12,400 | | Devon Energy | | | 675,800 |
| | |
| 87,870 | | Exxon Mobil | | | 6,142,992 |
| | |
| 6,500 | | Hess | | | 349,375 |
| | |
| 8,900 | | Murphy Oil | | | 483,448 |
| | |
| 13,000 | | Occidental Petroleum | | | 855,530 |
| | |
| 8,400 | | Southwestern Energy* | | | 326,340 |
| | |
| 15,300 | | Tesoro Petroleum | | | 194,769 |
| | |
| | | | | 14,152,256 |
| | | | | |
| Personal Products (1.5%) | | | |
| | |
| 36,900 | | Mead Johnson Nutrition — Class A | | | 1,172,313 |
| | | | | |
| Pharmaceuticals (5.7%) | | | |
| | |
| 7,800 | | Abbott Laboratories | | | 366,912 |
| | |
| 7,300 | | Allergan | | | 347,334 |
| | |
| 46,300 | | Johnson & Johnson | | | 2,629,840 |
| | |
| 23,660 | | Watson Pharmaceuticals* | | | 797,105 |
| | |
| 4,500 | | Wyeth | | | 204,255 |
| | |
| | | | | 4,345,446 |
| | | | | |
| Semiconductors & Semiconductor Equipment (2.5%) |
| | |
| 8,200 | | Broadcom — Class A* | | | 203,278 |
| | |
| 59,780 | | Intel | | | 989,359 |
| | |
| 34,600 | | Texas Instruments | | | 736,980 |
| | |
| | | | | 1,929,617 |
| | | | |
| See Notes to Financial Statements | | 25 | | June 30, 2009 |
Schedule of Investments as of June 30, 2009 (Unaudited)
Accessor Growth Fund
| | | | | |
| Shares | | | | Value |
|
|
| Software (6.5%) | | | |
| | |
| 134,000 | | Microsoft | | $ | 3,185,180 |
| | |
| 24,500 | | Oracle | | | 524,790 |
| | |
| 14,600 | | Red Hat* | | | 293,898 |
| | |
| 11,000 | | Salesforce.com* | | | 419,870 |
| | |
| 30,100 | | Symantec* | | | 468,356 |
| | |
| | | | | 4,892,094 |
| | | | | |
| Specialty Retail (2.3%) | | | |
| | |
| 2,600 | | Autozone* | | | 392,886 |
| | |
| 29,700 | | Home Depot | | | 701,811 |
| | |
| 20,000 | | TJX | | | 629,200 |
| | |
| | | | | 1,723,897 |
| | | | | |
| Tobacco (0.4%) | | | |
| | |
| 4,900 | | Lorillard | | | 332,073 |
| | |
| | Total Common Stocks (Identified Cost $81,402,117) | | | 75,296,808 |
| | |
| | | | | |
| | | | | | | |
| Shares | | | | | | Value |
|
| EXCHANGE TRADED FUND (0.3%) |
| Exchange Traded Fund (0.3%) |
| | | |
| 5,500 | | iShares S&P 500 Growth Index | | | | $ | 262,735 |
| | | |
| | Total Exchange Traded Fund (Identified Cost $363,407) | | | | | 262,735 |
| | | |
| | Total Investments (99.7%) (Identified Cost $81,765,524)1 | | | | | 75,559,543 |
| | | |
| | Total Other Assets Less Liabilities
(0.3%) | | | | | 214,367 |
| | | |
| | Total Net Assets (100.0%) | | | | $ | 75,773,910 |
* Non-income producing security.
1 See Note 6 for important tax information.
| | | | |
| June 30, 2009 | | 26 | | See Notes to Financial Statements |
Schedule of Investments as of June 30, 2009 (Unaudited)
Accessor Value Fund
| | | | | |
| Shares | | | | Value |
| |
| COMMON STOCKS (98.7%) | | | |
| Aerospace & Defense (3.8%) | | | |
| | |
| 2,000 | | Esterline Technologies* | | $ | 54,140 |
| | |
| 4,800 | | General Dynamics | | | 265,872 |
| | |
| 10,000 | | Honeywell International | | | 314,000 |
| | |
| 11,300 | | L-3 Communications Holdings — Class 3 | | | 783,994 |
| | |
| 13,140 | | Northrop Grumman | | | 600,235 |
| | |
| 16,000 | | Raytheon | | | 710,880 |
| | |
| | | | | 2,729,121 |
| | | | | |
| Air Freight & Logistics (0.5%) | | | |
| | |
| 7,400 | | United Parcel Service — Class B | | | 369,926 |
| | | | | |
| Airlines (0.2%) | | | |
| | |
| 20,800 | | Hawaiian Holdings* | | | 125,216 |
| | | | | |
| Auto Components (0.3%) | | | |
| | |
| 14,000 | | Superior Industries International | | | 197,400 |
| | | | | |
| Automobiles (0.6%) | | | |
| | |
| 71,000 | | Ford Motor* | | | 430,970 |
| | | | | |
| Biotechnology (0.1%) | | | |
| | |
| 44,681 | | Insmed* | | | 44,681 |
| | |
| 3,914 | | Maxygen* | | | 26,302 |
| | |
| | | | | 70,983 |
| | | | | |
| Building Products (0.1%) | | | |
| | |
| 2,100 | | Armstrong World Industries* | | | 34,629 |
| | |
| 346 | | Griffon* | | | 2,879 |
| | |
| | | | | 37,508 |
| | | | | |
| Capital Markets (5.9%) | | | |
| | |
| 45,920 | | Bank of New York Mellon | | | 1,345,915 |
| | |
| 500 | | Goldman Sachs | | | 73,720 |
| | |
| 36,100 | | Morgan Stanley | | | 1,029,211 |
| | |
| 18,000 | | Northern Trust | | | 966,240 |
| | |
| 17,871 | | State Street | | | 843,511 |
| | |
| | | | | 4,258,597 |
| | | | | |
| Chemicals (3.3%) | | | |
| | |
| 2,700 | | Ashland | | | 75,735 |
| | |
| 2,200 | | CF Industries Holdings | | | 163,108 |
| | |
| 46,300 | | Dow Chemical | | | 747,282 |
| | |
| 21,700 | | Eastman Chemical | | | 822,430 |
| | | | | |
| Shares | | | | Value |
|
|
| | | | |
| | |
| 21,600 | | Huntsman | | $ | 108,648 |
| | |
| 2,500 | | Innophos Holdings | | | 42,225 |
| | |
| 3,400 | | OM Group* | | | 98,668 |
| | |
| 3,408 | | Schulman A | | | 51,495 |
| | |
| 3,900 | | Scotts Miracle-Gro — Class A | | | 136,695 |
| | |
| 4,500 | | Spartech | | | 41,355 |
| | |
| 2,347 | | Stepan | | | 103,643 |
| | |
| | | | | 2,391,284 |
| | | | | |
| Commercial Banks (3.7%) | | | |
| | |
| 3,900 | | Bank of Hawaii | | | 139,737 |
| | |
| 1,300 | | First Financial Bankshares | | | 65,468 |
| | |
| 100 | | FirstMerit | | | 1,698 |
| | |
| 3,100 | | Home Bancshares | | | 59,024 |
| | |
| 8,720 | | Marshall & Ilsley | | | 41,856 |
| | |
| 16,500 | | National Penn Bancshares | | | 76,065 |
| | |
| 5,199 | | NBT Bancorp | | | 112,870 |
| | |
| 1,700 | | Prosperity Bancshares | | | 50,711 |
| | |
| 27,200 | | Regions Financial | | | 109,888 |
| | |
| 8,800 | | Republic Bancorp — Class A | | | 198,792 |
| | |
| 1,500 | | SunTrust Banks | | | 24,675 |
| | |
| 73,400 | | Wells Fargo | | | 1,780,684 |
| | |
| | | | | 2,661,468 |
| | | | | |
| Commercial Services & Supplies (1.4%) | | | |
| | |
| 35,700 | | APAC Customer Services* | | | 183,141 |
| | |
| 11,141 | | Brink’s | | | 323,423 |
| | |
| 44,767 | | RR Donnelley & Sons | | | 520,193 |
| | |
| 798 | | Standard Register | | | 2,601 |
| | |
| | | | | 1,029,358 |
| | | | | |
| Communications Equipment (0.2%) | | | |
| | |
| 35,623 | | 3Com* | | | 167,784 |
| | | | | |
| Computers & Peripherals (4.0%) | | | |
| | |
| 8,960 | | Hewlett-Packard | | | 346,304 |
| | |
| 21,900 | | International Business Machines | | | 2,286,798 |
| | |
| 14,900 | | Lexmark International — Class A* | | | 236,165 |
| | |
| | | | | 2,869,267 |
| | | | |
| See Notes to Financial Statements | | 27 | | June 30, 2009 |
Schedule of Investments as of June 30, 2009 (Unaudited)
Accessor Value Fund
| | | | | |
| Shares | | | | Value |
| Construction & Engineering (0.5%) | | | |
| | |
| 4,600 | | Fluor | | $ | 235,934 |
| | |
| 3,046 | | Michael Baker* | | | 129,029 |
| | |
| | | | | 364,963 |
| | | | | |
| Consumer Finance (0.8%) | | | |
| | |
| 3,918 | | Advance America Cash Advance Centers | | | 17,357 |
| | |
| 23,500 | | American Express | | | 546,140 |
| | |
| | | | | 563,497 |
| | | | | |
| Containers & Packaging (1.5%) | | | |
| | |
| 8,700 | | Bemis | | | 219,240 |
| | |
| 2,500 | | Bway Holding* | | | 43,825 |
| | |
| 3,000 | | Owens-Illinois* | | | 84,030 |
| | |
| 4,900 | | Packaging Corp of America | | | 79,380 |
| | |
| 20,200 | | Pactiv* | | | 438,340 |
| | |
| 19,300 | | Temple-Inland | | | 253,216 |
| | |
| | | | | 1,118,031 |
| | | | | |
| Distributors (0.0%) | | | |
| | |
| 100 | | Core-Mark Holding* | | | 2,606 |
| | | | | |
| Diversified Consumer Services (0.1%) | | | |
| | |
| 2,800 | | H&R Block | | | 48,244 |
| | | | | |
| Diversified Financial Services (5.5%) | | | |
| | |
| 102,400 | | Bank of America | | | 1,351,680 |
| | |
| 24,900 | | Citigroup | | | 73,953 |
| | |
| 70,710 | | JP Morgan Chase | | | 2,411,918 |
| | |
| 7,876 | | PHH* | | | 143,186 |
| | |
| | | | | 3,980,737 |
| | | | | |
| Diversified Telecommunication Services (6.5%) |
| | |
| 153,200 | | AT&T | | | 3,805,488 |
| | |
| 28,200 | | Verizon Communications | | | 866,586 |
| | |
| | | | | 4,672,074 |
| | | | | |
| Electric Utilities (3.4%) | | | |
| | |
| 5,300 | | American Electric Power | | | 153,117 |
| | |
| 59,700 | | Duke Energy | | | 871,023 |
| | |
| 600 | | Edison International | | | 18,876 |
| | |
| 12,300 | | Exelon | | | 629,883 |
| | |
| 14,640 | | FirstEnergy | | | 567,300 |
| | | | | |
| Shares | | | | Value |
| | | | |
| | |
| 1,900 | | FPL Group | | $ | 108,034 |
| | |
| 2,900 | | Southern | | | 90,364 |
| | |
| | | | | 2,438,597 |
| | | | | |
| Electronic Equipment & Instruments (0.4%) | | | |
| | |
| 3,000 | | Tech Data* | | | 98,130 |
| | |
| 25,500 | | Vishay Intertechnology* | | | 173,145 |
| | |
| | | | | 271,275 |
| | | | | |
| Energy Equipment & Services (0.2%) | | | |
| | |
| 1,300 | | SEACOR Holdings* | | | 97,812 |
| | |
| 3,600 | | Willbros Group* | | | 45,036 |
| | |
| | | | | 142,848 |
| | | | | |
| Food & Staples Retailing (4.2%) | | | |
| | |
| 25,220 | | Kroger | | | 556,101 |
| | |
| 5,300 | | Nash Finch | | | 143,418 |
| | |
| 48,000 | | Wal-Mart Stores | | | 2,325,120 |
| | |
| | | | | 3,024,639 |
| | | | | |
| Food Products (0.9%) | | | |
| | |
| 1,600 | | Archer-Daniels-Midland | | | 42,832 |
| | |
| 7,300 | | Dean Foods* | | | 140,087 |
| | |
| 47,800 | | Del Monte Foods | | | 448,364 |
| | |
| 1,800 | | Kraft Foods — Class A | | | 45,612 |
| | |
| | | | | 676,895 |
| | | | | |
| Health Care Equipment & Supplies (0.1%) | | | |
| | |
| 4,300 | | Cantel Medical* | | | 69,789 |
| | | | | |
| Health Care Providers & Services (3.9%) | | | |
| | |
| 4,900 | | Aetna | | | 122,745 |
| | |
| 13,800 | | AmerisourceBergen — Class A | | | 244,812 |
| | |
| 22,400 | | Cigna | | | 539,616 |
| | |
| 4,900 | | Gentiva Health Services* | | | 80,654 |
| | |
| 13,874 | | Health Management Associates — Class A* | | | 68,538 |
| | |
| 15,300 | | Kindred Healthcare* | | | 189,261 |
| | |
| 13,200 | | McKesson | | | 580,800 |
| | |
| 9,300 | | Universal American* | | | 81,096 |
| | |
| 18,000 | | WellPoint Inc.* | | | 916,020 |
| | |
| | | | | 2,823,542 |
| | | | |
| June 30, 2009 | | 28 | | See Notes to Financial Statements |
Schedule of Investments as of June 30, 2009 (Unaudited)
Accessor Value Fund
| | | | | |
| Shares | | | | Value |
| Hotels, Restaurants & Leisure (1.2%) | | | |
| | |
| 11,630 | | McDonald’s | | $ | 668,609 |
| | |
| 14,900 | | Ruby Tuesday* | | | 99,234 |
| | |
| 7,600 | | Steak N Shake* | | | 66,424 |
| | |
| | | | | 834,267 |
| | | | | |
| Household Durables (0.3%) | | | |
| | |
| 18,500 | | Furniture Brands International | | | 56,055 |
| | |
| 4,400 | | Whirlpool | | | 187,264 |
| | |
| | | | | 243,319 |
| | | | | |
| Household Products (0.9%) | | | |
| | |
| 33,400 | | Central Garden and Pet* | | | 367,066 |
| | |
| 2,639 | | Central Garden and Pet — Class A* | | | 25,994 |
| | |
| 5,500 | | Procter & Gamble | | | 281,050 |
| | |
| | | | | 674,110 |
| | | | | |
| Independent Power Producers & Energy Traders (0.6%) |
| | |
| 15,500 | | AES* | | | 179,955 |
| | |
| 11,800 | | Calpine* | | | 131,570 |
| | |
| 5,856 | | Mirant* | | | 92,174 |
| | |
| | | | | 403,699 |
| | | | | |
| Industrial Conglomerates (3.9%) | | | |
| | |
| 233,900 | | General Electric | | | 2,741,308 |
| | |
| 7,396 | | Tredegar | | | 98,515 |
| | |
| | | | | 2,839,823 |
| | | | | |
| Insurance (2.1%) | | | |
| | |
| 5,500 | | Aflac | | | 170,995 |
| | |
| 35,713 | | American Equity Investment Life Holding | | | 199,279 |
| | |
| 5,595 | | Assured Guaranty Ltd. | | | 69,266 |
| | |
| 42,703 | | Conseco* | | | 101,206 |
| | |
| 7,900 | | Genworth Financial — Class A | | | 55,221 |
| | |
| 11,290 | | Hartford Financial Services Group | | | 134,012 |
| | |
| 9,800 | | Horace Mann Educators | | | 97,706 |
| | |
| 8,500 | | Metlife | | | 255,085 |
| | |
| 6,100 | | Prudential Financial | | | 227,042 |
| | |
| 434 | | Torchmark | | | 16,075 |
| | |
| 10,400 | | Unum Group | | | 164,944 |
| | |
| | | | | 1,490,831 |
| | | | | |
| Shares | | | | Value |
| Internet & Catalog Retail (0.4%) | | | |
| | |
| 24,331 | | HSN* | | $ | 257,179 |
| | | | | |
| Internet Software & Services (0.1%) | | | |
| | |
| 13,036 | | Earthlink* | | | 96,597 |
| | | | | |
| IT Services (3.3%) | | | |
| | |
| 25,681 | | Acxiom | | | 226,763 |
| | |
| 2,400 | | Affiliated Computer Services — Class A* | | | 106,608 |
| | |
| 24,600 | | Automatic Data Processing | | | 871,824 |
| | |
| 2,700 | | Broadridge Financial Solutions | | | 44,766 |
| | |
| 600 | | CACI International — Class A* | | | 25,626 |
| | |
| 22,100 | | Computer Sciences* | | | 979,030 |
| | |
| 1,700 | | Hewitt Associates — Class A* | | | 50,626 |
| | |
| 1,900 | | Lender Processing Services | | | 52,763 |
| | |
| | | | | 2,358,006 |
| | | | | |
| Machinery (0.6%) | | | |
| | |
| 8,000 | | Chart Industries* | | | 145,440 |
| | |
| 18,400 | | Timken | | | 314,272 |
| | |
| | | | | 459,712 |
| | | | | |
| Marine (0.1%) | | | |
| | |
| 19,800 | | Paragon Shipping — Class A | | | 72,270 |
| | | | | |
| Media (2.5%) | | | |
| | |
| 85,300 | | Comcast — Class A | | | 1,235,997 |
| | |
| 14,000 | | Interpublic Group* | | | 70,700 |
| | |
| 4,229 | | Time Warner Cable — Class A | | | 133,933 |
| | |
| 14,049 | | Time Warner | | | 353,894 |
| | |
| | | | | 1,794,524 |
| | | | | |
| Metals & Mining (0.1%) | | | |
| | |
| 8,400 | | Alcoa | | | 86,772 |
| | |
| 591 | | United States Steel | | | 21,122 |
| | |
| | | | | 107,894 |
| | | | | |
| Multi-Line Retail (0.1%) | | | |
| | |
| 6,100 | | Dillard’s — Class A | | | 56,120 |
| | |
| 853 | | Family Dollar Stores | | | 24,140 |
| | |
| | | | | 80,260 |
| | | | | |
| Multi-Utilities (1.9%) | | | |
| | |
| 5,000 | | Consolidated Edison | | | 187,100 |
| | |
| 4,900 | | Dominion Resources | | | 163,758 |
| | | | |
| See Notes to Financial Statements | | 29 | | June 30, 2009 |
Schedule of Investments as of June 30, 2009 (Unaudited)
Accessor Value Fund
| | | | | |
| Shares | | | | Value |
| Multi-Utilities (continued) (1.9%) | | | |
| | |
| 11,600 | | DTE Energy | | $ | 371,200 |
| | |
| 500 | | NorthWestern | | | 11,380 |
| | |
| 6,300 | | NSTAR | | | 202,293 |
| | |
| 23,900 | | Xcel Energy | | | 439,999 |
| | |
| | | | | 1,375,730 |
| | | | | |
| Oil, Gas & Consumable Fuels (3.4%) | | | |
| | |
| 4,900 | | Calumet Specialty Products Partners LP | | | 75,950 |
| | |
| 26,400 | | ConocoPhillips | | | 1,110,384 |
| | |
| 49 | | Delek US Holdings | | | 415 |
| | |
| 10,000 | | Marathon Oil | | | 301,300 |
| | |
| 9,800 | | Sunoco | | | 227,360 |
| | |
| 9,860 | | Tesoro Petroleum | | | 125,518 |
| | |
| 18,200 | | Valero Energy | | | 307,398 |
| | |
| 27,782 | | Western Refining | | | 196,141 |
| | |
| 2,100 | | World Fuel Services | | | 86,583 |
| | |
| | | | | 2,431,049 |
| | | | | |
| Paper & Forest Products (1.4%) | | | |
| | |
| 1,406 | | Clearwater Paper* | | | 35,558 |
| | |
| 38,700 | | Glatfelter | | | 344,430 |
| | |
| 14,838 | | International Paper | | | 224,499 |
| | |
| 25,010 | | Louisiana-Pacific | | | 85,534 |
| | |
| 15,900 | | MeadWestvaco | | | 260,919 |
| | |
| 3,400 | | Schweitzer-Mauduit International | | | 92,514 |
| | |
| | | | | 1,043,454 |
| | | | | |
| Pharmaceuticals (9.8%) | | | |
| | |
| 17,400 | | Abbott Laboratories | | | 818,496 |
| | |
| 59,000 | | Bristol-Myers Squibb | | | 1,198,290 |
| | |
| 15,600 | | Eli Lilly | | | 540,384 |
| | |
| 24,100 | | Merck | | | 673,836 |
| | |
| 19,900 | | Mylan* | | | 259,695 |
| | |
| 212,500 | | Pfizer | | | 3,187,500 |
| | |
| 12,400 | | Watson Pharmaceuticals* | | | 417,756 |
| | |
| 100 | | Wyeth | | | 4,539 |
| | |
| | | | | 7,100,496 |
| | | | | |
| Shares | | | | Value |
| Real Estate (2.7%) | | | |
| | |
| 300 | | Boston Properties | | $ | 14,310 |
| | |
| 14,721 | | PS Business Parks | | | 713,085 |
| | |
| 10,500 | | Rayonier | | | 381,675 |
| | |
| 12,512 | | Simon Property Group | | | 643,492 |
| | |
| 6,200 | | Ventas | | | 185,132 |
| | |
| | | | | 1,937,694 |
| | | | | |
| Road & Rail (1.7%) | | | |
| | |
| 23,308 | | Dollar Thrifty Automotive Group* | | | 325,147 |
| | |
| 2,800 | | Marten Transport Ltd.* | | | 58,128 |
| | |
| 2,000 | | Ryder System | | | 55,840 |
| | |
| 15,100 | | Union Pacific | | | 786,106 |
| | |
| | | | | 1,225,221 |
| | | | | |
| Semiconductors & Semiconductor Equipment (1.2%) |
| | |
| 45,800 | | Intel | | | 757,990 |
| | |
| 6,400 | | Xilinx | | | 130,944 |
| | |
| | | | | 888,934 |
| | | | | |
| Software (0.4%) | | | |
| | |
| 1,600 | | Compuware* | | | 10,976 |
| | |
| 13,895 | | i2 Technologies* | | | 174,382 |
| | |
| 61,784 | | OpenTV — Class A* | | | 81,555 |
| | |
| | | | | 266,913 |
| | | | | |
| Specialty Retail (1.5%) | | | |
| | |
| 6,000 | | Buckle | | | 190,620 |
| | |
| 8,000 | | Kirkland’s* | | | 96,080 |
| | |
| 30,100 | | RadioShack | | | 420,196 |
| | |
| 22,321 | | Rent-A-Center — Class A* | | | 397,983 |
| | |
| | | | | 1,104,879 |
| | | | | |
| Textiles, Apparel & Luxury Goods (0.4%) | | | |
| | |
| 11,500 | | Carter’s* | | | 283,015 |
| | | | | |
| Thrifts & Mortgage Finance (0.9%) | | | |
| | |
| 6,800 | | MGIC Investment | | | 29,920 |
| | |
| 34,206 | | NewAlliance Bancshares | | | 393,369 |
| | |
| 9,644 | | Ocwen Financial* | | | 125,083 |
| | |
| 69,900 | | PMI Group | | | 138,402 |
| | |
| | | | | 686,774 |
| | | | |
| June 30, 2009 | | 30 | | See Notes to Financial Statements |
Schedule of Investments as of June 30, 2009 (Unaudited)
Accessor Value Fund
| | | | | |
| Shares | | | | Value |
| Tobacco (4.2%) | | | |
| | |
| 45,100 | | Alliance One International* | | $ | 171,380 |
| | |
| 135,200 | | Altria Group | | | 2,215,928 |
| | |
| 14,600 | | Philip Morris International | | | 636,852 |
| | |
| | | | | 3,024,160 |
| | | | | |
| Trading Companies & Distributors (0.3%) |
| | |
| 7,900 | | WESCO International* | | | 197,816 |
| | | | | |
| Wireless Telecommunication Services (0.6%) |
| | |
| 97,700 | | Sprint Nextel* | | | 469,937 |
| | |
| | Total Common Stocks
(Identified Cost $83,350,687) | | | 71,285,182 |
| | |
| | Total Investments (98.7%)
(Identified Cost $83,350,687)1 | | | 71,285,182 |
| | |
| | Total Other Assets Less Liabilities (1.3%) | | | 905,502 |
| | |
| | Total Net Assets (100.0%) | | $ | 72,190,684 |
* Non-income producing security.
1 See Note 6 for important tax information.
| | | | |
| See Notes to Financial Statements | | 31 | | June 30, 2009 |
Schedule of Investments as of June 30, 2009 (Unaudited)
Accessor Small to Mid Cap Fund
| | | | | |
| Shares | | | | Value |
| |
| COMMON STOCKS (99.7%) | | | |
| Aerospace & Defense (0.3%) | | | |
| | |
| 5,857 | | Alliant Techsystems* | | $ | 482,382 |
| | | | | |
| Air Freight & Logistics (0.1%) | | | |
| | |
| 78,431 | | Pacer International | | | 174,901 |
| | | | | |
| Airlines (1.1%) | | | |
| | |
| 17,600 | | Alaska Air Group* | | | 321,376 |
| | |
| 48,208 | | AMR* | | | 193,796 |
| | |
| 34,434 | | Continental Airlines — Class B* | | | 305,085 |
| | |
| 71,501 | | Delta Air Lines* | | | 413,991 |
| | |
| 25,480 | | Skywest | | | 259,896 |
| | |
| 48,829 | | UAL* | | | 155,765 |
| | |
| 63,272 | | US Airways Group* | | | 153,751 |
| | |
| | | | | 1,803,660 |
| | | | | |
| Auto Components (0.3%) | | | |
| | |
| 9,115 | | BorgWarner | | | 311,277 |
| | |
| 17,860 | | Cooper Tire & Rubber | | | 177,171 |
| | |
| | | | | 488,448 |
| | | | | |
| Beverages (0.2%) | | | |
| | |
| 12,588 | | Hansen Natural* | | | 387,962 |
| | | | | |
| Biotechnology (1.4%) | | | |
| | |
| 11,705 | | Alexion Pharmaceuticals* | | | 481,310 |
| | |
| 4,153 | | Biogen Idec* | | | 187,508 |
| | |
| 4,988 | | Cephalon* | | | 282,570 |
| | |
| 14,918 | | Martek Biosciences | | | 315,516 |
| | |
| 6,482 | | Myriad Genetics* | | | 231,083 |
| | |
| 1,621 | | Myriad Pharmaceuticals* | | | 7,535 |
| | |
| 13,410 | | OSI Pharmaceuticals* | | | 378,564 |
| | |
| 12,670 | | Vertex Pharmaceuticals* | | | 451,559 |
| | |
| | | | | 2,335,645 |
| | | | | |
| Capital Markets (2.3%) | | | |
| | |
| 8,586 | | Affiliated Managers Group* | | | 499,619 |
| | |
| 3,356 | | BlackRock — Class A | | | 588,709 |
| | |
| 14,888 | | Cohen & Steers | | | 222,575 |
| | |
| 19,123 | | Eaton Vance | | | 511,540 |
| | |
| 7,140 | | Evercore Partners — Class A | | | 140,230 |
| | |
| 24,814 | | FCStone Group* | | | 98,015 |
| | | | | |
| Shares | | | | Value |
| |
| | | |
| | | | |
| | |
| 33,932 | | GFI Group | | $ | 228,702 |
| | |
| 30,463 | | Hercules Technology Growth Capital | | | 254,671 |
| | |
| 14,534 | | Knight Capital Group — Class A* | | | 247,805 |
| | |
| 14,787 | | optionsXpress Holdings | | | 229,642 |
| | |
| 13,841 | | SWS Group | | | 193,359 |
| | |
| 18,168 | | TD Ameritrade Holding* | | | 318,667 |
| | |
| 12,660 | | Waddell & Reed Financial — Class A | | | 333,844 |
| | |
| | | | | 3,867,378 |
| | | | | |
| Chemicals (3.2%) | | | |
| | |
| 5,571 | | Airgas | | | 225,793 |
| | |
| 9,046 | | Arch Chemicals | | | 222,441 |
| | |
| 8,406 | | Ashland | | | 235,788 |
| | |
| 18,534 | | Cabot | | | 233,158 |
| | |
| 11,850 | | Celanese — Class A | | | 281,437 |
| | |
| 12,099 | | Cytec Industries | | | 225,283 |
| | |
| 11,103 | | FMC | | | 525,172 |
| | |
| 14,888 | | HB Fuller | | | 279,448 |
| | |
| 32,004 | | Huntsman | | | 160,980 |
| | |
| 9,862 | | Innophos Holdings | | | 166,569 |
| | |
| 8,887 | | Koppers Holdings | | | 234,350 |
| | |
| 4,760 | | Lubrizol | | | 225,196 |
| | |
| 11,748 | | Mosaic | | | 520,436 |
| | |
| 22,382 | | Nalco Holding | | | 376,913 |
| | |
| 8,184 | | OM Group* | | | 237,500 |
| | |
| 28,463 | | RPM International | | | 399,620 |
| | |
| 14,332 | | Schulman A | | | 216,557 |
| | |
| 9,419 | | Sensient Technologies | | | 212,587 |
| | |
| 7,831 | | Terra Industries | | | 189,667 |
| | |
| 16,305 | | WR Grace* | | | 201,693 |
| | |
| | | | | 5,370,588 |
| | | | | |
| Commercial Banks (2.0%) | | | |
| | |
| 5,945 | | Bank of Hawaii | | | 213,009 |
| | |
| 6,300 | | Chemical Financial | | | 125,433 |
| | |
| 5,267 | | City National | | | 193,984 |
| | |
| 14,843 | | Columbia Banking System | | | 151,844 |
| | | | |
| June 30, 2009 | | 32 | | See Notes to Financial Statements |
Schedule of Investments as of June 30, 2009 (Unaudited)
Accessor Small to Mid Cap Fund
| | | | | |
| Shares | | | | Value |
| Commercial Banks (continued) (2.0%) | | | |
| | |
| 5,668 | | Cullen | | $ | 261,408 |
| | |
| 28,744 | | First Financial Bancorp | | | 216,155 |
| | |
| 7,619 | | Hancock Holding | | | 247,541 |
| | |
| 13,902 | | Independent Bank | | | 273,870 |
| | |
| 10,432 | | Independent Bank | | | 13,770 |
| | |
| 11,850 | | Nara Bancorp | | | 61,383 |
| | |
| 18,927 | | Old National Bancorp | | | 185,863 |
| | |
| 9,233 | | Prosperity Bancshares | | | 275,420 |
| | |
| 19,648 | | Umpqua Holdings | | | 152,469 |
| | |
| 14,609 | | United Community Banks | | | 87,505 |
| | |
| 11,334 | | Westamerica Bancorporation | | | 562,280 |
| | |
| 19,746 | | Wilmington Trust | | | 269,730 |
| | |
| | | | | 3,291,664 |
| | | | | |
| Commercial Services & Supplies (3.0%) | | | |
| | |
| 8,209 | | Advisory Board* | | | 210,971 |
| | |
| 1,830 | | Amrep* | | | 20,185 |
| | |
| 18,390 | | Brink’s | | | 533,862 |
| | |
| 10,938 | | CDI | | | 121,959 |
| | |
| 2,099 | | Compx International | | | 13,035 |
| | |
| 18,404 | | Covanta Holding* | | | 312,132 |
| | |
| 3,161 | | Dun & Bradstreet | | | 256,705 |
| | |
| 11,796 | | FTI Consulting* | | | 598,293 |
| | |
| 18,710 | | Geo Group* | | | 347,632 |
| | |
| 11,142 | | Heidrick & Struggles International | | | 203,341 |
| | |
| 7,034 | | IHS — Class A* | | | 350,785 |
| | |
| 19,345 | | Korn/Ferry International* | | | 205,831 |
| | |
| 7,191 | | Manpower | | | 304,467 |
| | |
| 11,440 | | Mine Safety Appliances | | | 275,704 |
| | |
| 15,701 | | Robert Half International | | | 370,857 |
| | |
| 4,928 | | United Stationers* | | | 171,889 |
| | |
| 9,933 | | Waste Connections* | | | 257,364 |
| | |
| 11,146 | | Watson Wyatt Worldwide — Class A | | | 418,309 |
| | |
| | | | | 4,973,321 |
| | | | | |
| Communications Equipment (0.7%) | | | |
| | |
| 11,391 | | CommScope* | | | 299,128 |
| | |
| 15,815 | | InterDigital* | | | 386,519 |
| | | | | |
| Shares | | | | Value |
| | | | |
| | |
| 8,103 | | Neutral Tandem* | | $ | 239,200 |
| | |
| 12,500 | | Riverbed Technology* | | | 289,875 |
| | |
| | | | | 1,214,722 |
| | | | | |
| Computers & Peripherals (1.6%) | | | |
| | |
| 24,585 | | Lexmark International — Class A* | | | 389,672 |
| | |
| 33,676 | | NCR* | | | 398,387 |
| | |
| 18,564 | | Novatel Wireless* | | | 167,447 |
| | |
| 50,740 | | Seagate Technology | | | 530,740 |
| | |
| 9,355 | | Synaptics* | | | 361,571 |
| | |
| 29,019 | | Western Digital* | | | 769,004 |
| | |
| | | | | 2,616,821 |
| | | | | |
| Construction & Engineering (1.5%) | | | |
| | |
| 13,555 | | Dycom Industries* | | | 150,054 |
| | |
| 18,268 | | EMCOR Group* | | | 367,552 |
| | |
| 20,762 | | KBR | | | 382,851 |
| | |
| 22,420 | | Quanta Services* | | | 518,575 |
| | |
| 12,052 | | Shaw Group* | | | 330,345 |
| | |
| 12,900 | | Tutor Perini* | | | 223,944 |
| | |
| 10,447 | | URS* | | | 517,336 |
| | |
| | | | | 2,490,657 |
| | | | | |
| Construction Materials (0.3%) | | | |
| | |
| 27,810 | | Headwaters* | | | 93,442 |
| | |
| 3,032 | | Martin Marietta Materials | | | 239,164 |
| | |
| 5,358 | | Texas Industries | | | 168,027 |
| | |
| | | | | 500,633 |
| | | | | |
| Consumer Finance (0.2%) | | | |
| | |
| 15,955 | | AmeriCredit* | | | 216,190 |
| | |
| 4,344 | | Credit Acceptance* | | | 94,917 |
| | |
| 2,496 | | Student Loan | | | 92,851 |
| | |
| | | | | 403,958 |
| | | | | |
| Containers & Packaging (0.6%) | | | |
| | |
| 18,911 | | Crown Holdings* | | | 456,512 |
| | |
| 6,051 | | Greif — Class A | | | 267,575 |
| | |
| 8,001 | | Sonoco Products | | | 191,624 |
| | |
| | | | | 915,711 |
| | | | |
| See Notes to Financial Statements | | 33 | | June 30, 2009 |
Schedule of Investments as of June 30, 2009 (Unaudited)
Accessor Small to Mid Cap Fund
| | | | | |
| Shares | | | | Value |
| Diversified Consumer Services (1.7%) | | | |
| | |
| 9,900 | | Brink’s Home Security Holdings* | | $ | 280,269 |
| | |
| 12,950 | | Career Education* | | | 322,326 |
| | |
| 8,109 | | DeVry | | | 405,774 |
| | |
| 12,112 | | Hillenbrand | | | 201,544 |
| | |
| 4,403 | | ITT Educational Services* | | | 443,206 |
| | |
| 11,850 | | Regis | | | 206,309 |
| | |
| 3,767 | | Strayer Education | | | 821,620 |
| | |
| 14,180 | | Universal Technical Institute* | | | 211,707 |
| | |
| | | | | 2,892,755 |
| | | | | |
| Diversified Financial Services (0.8%) | | | |
| | |
| 8,837 | | Asta Funding | | | 48,073 |
| | |
| 637 | | CME Group — Class A | | | 198,177 |
| | |
| 8,001 | | Encore Capital Group* | | | 106,013 |
| | |
| 16,572 | | Financial Federal | | | 340,555 |
| | |
| 9,599 | | MSCI — Class A* | | | 234,599 |
| | |
| 23,898 | | PHH* | | | 434,466 |
| | |
| | | | | 1,361,883 |
| | | | | |
| Diversified Telecommunication Services (0.5%) |
| | |
| 85,887 | | Cincinnati Bell* | | | 243,919 |
| | |
| 12,356 | | General Communication — Class A* | | | 85,627 |
| | |
| 203,768 | | Level 3 Communications* | | | 307,690 |
| | |
| 21,061 | | tw telecom — Class A* | | | 216,296 |
| | |
| | | | | 853,532 |
| | | | | |
| Electric Utilities (0.7%) | | | |
| | |
| 18,718 | | Hawaiian Electric Industries | | | 356,765 |
| | |
| 24,864 | | Portland General Electric | | | 484,351 |
| | |
| 12,061 | | Unisource Energy | | | 320,099 |
| | |
| | | | | 1,161,215 |
| | | | | |
| Electrical Equipment (1.3%) | | | |
| | |
| 9,124 | | AO Smith | | | 297,169 |
| | |
| 10,736 | | Belden | | | 179,291 |
| | |
| 4,234 | | First Solar* | | | 686,416 |
| | |
| 8,913 | | General Cable* | | | 334,951 |
| | |
| 7,900 | | Roper Industries | | | 357,949 |
| | |
| 14,496 | | Sunpower — Class A* | | | 386,173 |
| | |
| | | | | 2,241,949 |
| | | | | |
| Shares | | | | Value |
| Electronic Equipment & Instruments (4.1%) | | | |
| | |
| 11,669 | | Amphenol — Class A | | $ | 369,207 |
| | |
| 10,444 | | Anixter International* | | | 392,590 |
| | |
| 19,142 | | Arrow Electronics* | | | 406,576 |
| | |
| 21,066 | | Avnet* | | | 443,018 |
| | |
| 25,040 | | Benchmark Electronics* | | | 360,576 |
| | |
| 68,695 | | Brightpoint* | | | 430,718 |
| | |
| 16,103 | | Checkpoint Systems* | | | 252,656 |
| | |
| 14,078 | | Cognex | | | 198,922 |
| | |
| 12,755 | | Dolby Laboratories — Class A* | | | 475,506 |
| | |
| 20,906 | | FLIR Systems* | | | 471,639 |
| | |
| 17,926 | | Ingram Micro — Class A* | | | 313,705 |
| | |
| 37,483 | | Jabil Circuit | | | 278,124 |
| | |
| 29,625 | | L-1 Identity Solutions — Class 1* | | | 229,297 |
| | |
| 28,495 | | Methode Electronics | | | 200,035 |
| | |
| 7,495 | | Multi-Fineline Electronix* | | | 160,393 |
| | |
| 8,352 | | Rofin-Sinar Technologies* | | | 167,124 |
| | |
| 10,229 | | Scansource* | | | 250,815 |
| | |
| 9,824 | | SYNNEX* | | | 245,502 |
| | |
| 13,141 | | Tech Data* | | | 429,842 |
| | |
| 21,612 | | Trimble Navigation Ltd.* | | | 424,244 |
| | |
| 39,430 | | Vishay Intertechnology* | | | 267,730 |
| | |
| | | | | 6,768,219 |
| | | | | |
| Energy Equipment & Services (1.8%) | | | |
| | |
| 17,082 | | Dresser-Rand Group* | | | 445,840 |
| | |
| 19,290 | | Exterran Holdings* | | | 309,412 |
| | |
| 7,386 | | FMC Technologies* | | | 277,566 |
| | |
| 8,145 | | Gulf Island Fabrication | | | 128,935 |
| | |
| 17,200 | | Helix Energy Solutions Group* | | | 186,964 |
| | |
| 13,654 | | Helmerich & Payne | | | 421,499 |
| | |
| 4,507 | | Oceaneering International* | | | 203,717 |
| | |
| 21,254 | | Pride International* | | | 532,625 |
| | |
| 13,294 | | Superior Energy Services* | | | 229,587 |
| | |
| 11,417 | | Unit* | | | 314,767 |
| | |
| | | | | 3,050,912 |
| | | | | |
| Food & Staples Retailing (1.0%) | | | |
| | |
| 17,500 | | BJ’s Wholesale Club* | | | 564,025 |
| | | | |
| June 30, 2009 | | 34 | | See Notes to Financial Statements |
Schedule of Investments as of June 30, 2009 (Unaudited)
Accessor Small to Mid Cap Fund
| | | | | |
| Shares | | | | Value |
| Food & Staples Retailing (continued) (1.0%) | | | |
| | |
| 12,861 | | Casey’s General Stores | | $ | 330,399 |
| | |
| 14,776 | | Nash Finch | | | 399,838 |
| | |
| 109,211 | | RITE AID* | | | 164,909 |
| | |
| 6,659 | | United Natural Foods* | | | 174,799 |
| | |
| | | | | 1,633,970 |
| | | | | |
| Food Products (1.6%) | | | |
| | |
| 11,586 | | Bunge Ltd. | | | 698,056 |
| | |
| 35,601 | | Chiquita Brands International* | | | 365,266 |
| | |
| 10,715 | | Corn Products International | | | 287,055 |
| | |
| 10,533 | | Flowers Foods | | | 230,041 |
| | |
| 13,369 | | Fresh Del Monte Produce* | | | 217,380 |
| | |
| 6,483 | | Hormel Foods | | | 223,923 |
| | |
| 7,097 | | Ralcorp Holdings* | | | 432,349 |
| | |
| 17,408 | | Smithfield Foods* | | | 243,190 |
| | |
| | | | | 2,697,260 |
| | | | | |
| Gas Utilities (1.6%) | | | |
| | |
| 15,199 | | Energen | | | 606,440 |
| | |
| 16,584 | | EQT | | | 578,948 |
| | |
| 17,290 | | Laclede Group | | | 572,818 |
| | |
| 12,541 | | National Fuel Gas | | | 452,479 |
| | |
| 10,776 | | Northwest Natural Gas | | | 477,592 |
| | |
| | | | | 2,688,277 |
| | | | | |
| Health Care Equipment & Supplies (3.4%) | | | |
| | |
| 7,264 | | Angiodynamics* | | | 96,393 |
| | |
| 9,484 | | Cooper | | | 234,539 |
| | |
| 12,154 | | CryoLife* | | | 67,333 |
| | |
| 13,424 | | Cutera* | | | 115,715 |
| | |
| 8,772 | | Cynosure — Class A* | | | 67,106 |
| | |
| 10,618 | | Edwards Lifesciences* | | | 722,342 |
| | |
| 13,972 | | Gen-Probe* | | | 600,517 |
| | |
| 19,759 | | Hologic* | | | 281,171 |
| | |
| 7,374 | | ICU Medical* | | | 303,440 |
| | |
| 14,302 | | Idexx Laboratories* | | | 660,752 |
| | |
| 21,037 | | Immucor* | | | 289,469 |
| | |
| 1,168 | | Intuitive Surgical* | | | 191,155 |
| | |
| 8,036 | | Kensey Nash* | | | 210,624 |
| | | | | |
| Shares | | | | Value |
| | | | |
| | |
| 17,817 | | Meridian Bioscience | | $ | 402,308 |
| | |
| 13,301 | | Palomar Medical Technologies* | | | 194,993 |
| | |
| 20,920 | | Quidel* | | | 304,595 |
| | |
| 16,085 | | Resmed* | | | 655,142 |
| | |
| 7,900 | | Somanetics* | | | 130,429 |
| | |
| 7,394 | | STERIS | | | 192,835 |
| | |
| | | | | 5,720,858 |
| | | | | |
| Health Care Providers & Services (2.7%) | | | |
| | |
| 16,220 | | AMERIGROUP* | | | 435,507 |
| | |
| 13,145 | | Amsurg — Class A* | | | 281,829 |
| | |
| 9,514 | | Chemed | | | 375,613 |
| | |
| 10,533 | | Community Health Systems* | | | 265,958 |
| | |
| 12,328 | | Hanger Orthopedic Group* | | | 167,537 |
| | |
| 47,200 | | Health Management Associates — Class A* | | | 233,168 |
| | |
| 19,702 | | Health Net* | | | 306,366 |
| | |
| 23,787 | | Healthspring* | | | 258,327 |
| | |
| 6,989 | | Henry Schein* | | | 335,122 |
| | |
| 17,137 | | inVentiv Health* | | | 231,864 |
| | |
| 5,976 | | Laboratory Corp of America Holdings* | | | 405,113 |
| | |
| 12,351 | | LHC Group* | | | 274,316 |
| | |
| 7,214 | | LifePoint Hospitals* | | | 189,367 |
| | |
| 8,001 | | Magellan Health Services* | | | 262,593 |
| | |
| 7,805 | | Mednax* | | | 328,825 |
| | |
| 40,223 | | Nighthawk Radiology Holdings* | | | 148,825 |
| | |
| | | | | 4,500,330 |
| | | | | |
| Health Care Technology (0.1%) | | | |
| | |
| 13,584 | | Omnicell* | | | 146,028 |
| | | | | |
| Hotels, Restaurants & Leisure (1.9%) | | | |
| | |
| 9,723 | | Bally Technologies* | | | 290,912 |
| | |
| 17,657 | | Brinker International | | | 300,699 |
| | |
| 6,371 | | Chipotle Mexican Grill — Class A* | | | 509,680 |
| | |
| 19,952 | | CKE Restaurants | | | 169,193 |
| | |
| 32,754 | | Domino’s Pizza* | | | 245,327 |
| | |
| 40,078 | | Las Vegas Sands* | | | 315,013 |
| | |
| 9,895 | | Peet’s Coffee & Tea* | | | 249,354 |
| | |
| 15,900 | | Pinnacle Entertainment* | | | 147,711 |
| | | | |
| See Notes to Financial Statements | | 35 | | June 30, 2009 |
Schedule of Investments as of June 30, 2009 (Unaudited)
Accessor Small to Mid Cap Fund
| | | | | |
| Shares | | | | Value |
| Hotels, Restaurants & Leisure (continued) (1.9%) |
| | |
| 18,433 | | Royal Caribbean Cruises | | $ | 249,583 |
| | |
| 96,106 | | Wendy’s/Arby’s Group — Class A | | | 384,424 |
| | |
| 11,486 | | WMS Industries* | | | 361,924 |
| | |
| | | | | 3,223,820 |
| | | | | |
| Household Durables (1.2%) | | | |
| | |
| 20,387 | | Centex | | | 172,474 |
| | |
| 10,634 | | Garmin Ltd. | | | 253,302 |
| | |
| 99,210 | | Hovnanian Enterprises — Class A* | | | 234,136 |
| | |
| 17,420 | | Jarden* | | | 326,625 |
| | |
| 25,490 | | Lennar — Class A | | | 246,998 |
| | |
| 7,900 | | Mohawk Industries* | | | 281,872 |
| | |
| 73,569 | | Standard Pacific* | | | 149,345 |
| | |
| 17,825 | | Toll Brothers* | | | 302,490 |
| | |
| | | | | 1,967,242 |
| | | | | |
| Household Products (0.2%) | | | |
| | |
| 7,347 | | Energizer Holdings* | | | 383,807 |
| | | | | |
| Independent Power Producers & Energy Traders (0.3%) |
| | |
| 19,330 | | Calpine* | | | 215,530 |
| | |
| 65,443 | | RRI Energy* | | | 327,869 |
| | |
| | | | | 543,399 |
| | | | | |
| Industrial Conglomerates (0.4%) | | | |
| | |
| 20,256 | | McDermott International* | | | 411,399 |
| | |
| 13,014 | | Tredegar | | | 173,347 |
| | |
| | | | | 584,746 |
| | | | | |
| Insurance (9.0%) | | | |
| | |
| 10,837 | | AMERISAFE* | | | 168,624 |
| | |
| 9,723 | | Axis Capital Holdings Ltd. | | | 254,548 |
| | |
| 3,134 | | Berkshire Hathaway — Class B* | | | 9,075,218 |
| | |
| 10,331 | | Delphi Financial Group — Class A | | | 200,731 |
| | |
| 18,231 | | eHealth* | | | 321,959 |
| | |
| 15,192 | | Endurance Specialty Holdings Ltd. | | | 445,126 |
| | |
| 14,620 | | Fidelity National Financial — Class A | | | 197,809 |
| | |
| 14,382 | | Hilltop Holdings* | | | 170,714 |
| | |
| 10,100 | | Infinity Property & Casualty | | | 368,246 |
| | |
| 29,455 | | Meadowbrook Insurance Group | | | 192,341 |
| | |
| 7,090 | | Platinum Underwriters Holdings Ltd. | | | 202,703 |
| | | | | |
| Shares | | | | Value |
| | | | |
| | |
| 13,537 | | ProAssurance* | | $ | 625,545 |
| | |
| 20,661 | | Protective Life | | | 236,362 |
| | |
| 19,069 | | Reinsurance Group of America — Class A | | | 665,699 |
| | |
| 5,519 | | RLI | | | 247,251 |
| | |
| 5,758 | | Safety Insurance Group | | | 175,965 |
| | |
| 11,600 | | SeaBright Insurance Holdings* | | | 117,508 |
| | |
| 18,635 | | Selective Insurance Group | | | 237,969 |
| | |
| 12,255 | | StanCorp Financial Group | | | 351,473 |
| | |
| 15,496 | | Tower Group | | | 383,991 |
| | |
| 21,358 | | Unitrin | | | 256,723 |
| | |
| 8,710 | | Zenith National Insurance | | | 189,355 |
| | |
| | | | | 15,085,860 |
| | | | | |
| Internet & Catalog Retail (0.3%) | | | |
| | |
| 72,716 | | Liberty Media-Interactive* | | | 364,307 |
| | |
| 12,113 | | NutriSystem | | | 175,639 |
| | |
| | | | | 539,946 |
| | | | | |
| Internet Software & Services (0.6%) | | | |
| | |
| 22,027 | | LivePerson* | | | 88,108 |
| | |
| 44,336 | | United Online | | | 288,627 |
| | |
| 22,004 | | Valueclick* | | | 231,482 |
| | |
| 9,478 | | VistaPrint Ltd.* | | | 404,237 |
| | |
| | | | | 1,012,454 |
| | | | | |
| IT Services (3.9%) | | | |
| | |
| 4,744 | | Alliance Data Systems* | | | 195,405 |
| | |
| 13,268 | | Broadridge Financial Solutions | | | 219,983 |
| | |
| 12,007 | | CSG Systems International* | | | 158,973 |
| | |
| 12,947 | | DST Systems* | | | 478,392 |
| | |
| 5,469 | | Global Payments | | | 204,869 |
| | |
| 31,172 | | Heartland Payment Systems | | | 298,316 |
| | |
| 20,894 | | Hewitt Associates — Class A* | | | 622,223 |
| | |
| 20,736 | | Integral Systems* | | | 172,524 |
| | |
| 13,600 | | MAXIMUS | | | 561,000 |
| | |
| 11,503 | | NeuStar — Class A* | | | 254,907 |
| | |
| 36,662 | | SAIC* | | | 680,080 |
| | |
| 36,040 | | VeriFone Holdings* | | | 270,660 |
| | |
| 39,389 | | Visa — Class A | | | 2,452,359 |
| | |
| | | | | 6,569,691 |
| | | | |
| June 30, 2009 | | 36 | | See Notes to Financial Statements |
Schedule of Investments as of June 30, 2009 (Unaudited)
Accessor Small to Mid Cap Fund
| | | | | |
| Shares | | | | Value |
| Leisure Equipment & Products (0.2%) | | | |
| | |
| 96,350 | | Eastman Kodak | | $ | 285,196 |
| | | | | |
| Life Sciences Tools & Services (1.6%) | | | |
| | |
| 26,539 | | Bruker* | | | 245,751 |
| | |
| 11,088 | | Charles River Laboratories International* | | | 374,220 |
| | |
| 12,821 | | Covance* | | | 630,793 |
| | |
| 9,547 | | Illumina* | | | 371,760 |
| | |
| 18,243 | | Kendle International* | | | 223,295 |
| | |
| 10,674 | | Luminex* | | | 197,896 |
| | |
| 10,457 | | Techne | | | 667,261 |
| | |
| | | | | 2,710,976 |
| | | | | |
| Machinery (2.4%) | | | |
| | |
| 13,152 | | Actuant — Class A | | | 160,454 |
| | |
| 14,900 | | AGCO* | | | 433,143 |
| | |
| 23,261 | | Briggs & Stratton | | | 310,302 |
| | |
| 3,622 | | Flowserve | | | 252,852 |
| | |
| 24,709 | | Force Protection* | | | 218,428 |
| | |
| 9,163 | | Gencor Industries* | | | 62,308 |
| | |
| 8,152 | | Hardinge | | | 34,646 |
| | |
| 6,737 | | Joy Global | | | 240,646 |
| | |
| 10,446 | | Lydall* | | | 35,516 |
| | |
| 38,357 | | Mueller Water Products — Class A | | | 143,455 |
| | |
| 8,824 | | Navistar International* | | | 384,726 |
| | |
| 19,344 | | Oshkosh | | | 281,262 |
| | |
| 16,068 | | Pentair | | | 411,662 |
| | |
| 10,057 | | PMFG* | | | 88,602 |
| | |
| 15,799 | | Terex* | | | 190,694 |
| | |
| 10,634 | | Timken | | | 181,629 |
| | |
| 13,875 | | Trinity Industries | | | 188,977 |
| | |
| 13,398 | | Wabtec | | | 431,014 |
| | |
| | | | | 4,050,316 |
| | | | | |
| Marine (0.4%) | | | |
| | |
| 7,538 | | Alexander & Baldwin | | | 176,691 |
| | |
| 15,779 | | Kirby* | | | 501,614 |
| | |
| | | | | 678,305 |
| | | | | |
| Media (3.5%) | | | |
| | |
| 26,261 | | Cablevision Systems | | | 509,726 |
| | |
| 32,820 | | Discovery Communications — Class A* | | | 740,091 |
| | | | | |
| Shares | | | | Value |
| | | | |
| | |
| 30,965 | | DISH Network — Class A* | | $ | 501,943 |
| | |
| 17,891 | | DreamWorks Animation SKG — Class A* | | | 493,613 |
| | |
| 49,882 | | Gannett | | | 178,079 |
| | |
| 20,458 | | Harte-Hanks | | | 189,236 |
| | |
| 38,181 | | Liberty Global — Class A* | | | 606,696 |
| | |
| 47,069 | | Liberty Media* | | | 1,259,096 |
| | |
| 57,314 | | Live Nation* | | | 278,546 |
| | |
| 12,557 | | Morningstar* | | | 517,725 |
| | |
| 11,702 | | Time Warner Cable — Class A | | | 370,602 |
| | |
| 27,607 | | Valassis Communications* | | | 168,679 |
| | |
| | | | | 5,814,032 |
| | | | | |
| Metals & Mining (1.5%) | | | |
| | |
| 15,394 | | Cliffs Natural Resources | | | 376,691 |
| | |
| 23,598 | | Commercial Metals | | | 378,276 |
| | |
| 6,685 | | Reliance Steel & Aluminum | | | 256,637 |
| | |
| 3,343 | | Schnitzer Steel Industries — Class A | | | 176,711 |
| | |
| 15,496 | | Southern Copper | | | 316,738 |
| | |
| 23,699 | | Steel Dynamics | | | 349,086 |
| | |
| 23,401 | | Stillwater Mining* | | | 133,620 |
| | |
| 8,790 | | Walter Energy | | | 318,550 |
| | |
| 19,315 | | Worthington Industries | | | 247,039 |
| | |
| | | | | 2,553,348 |
| | | | | |
| Multi-Line Retail (0.5%) | | | |
| | |
| 8,406 | | Big Lots* | | | 176,778 |
| | |
| 9,419 | | Dollar Tree* | | | 396,540 |
| | |
| 15,091 | | Macy’s | | | 177,470 |
| | |
| | | | | 750,788 |
| | | | | |
| Multi-Utilities (0.7%) | | | |
| | |
| 9,743 | | Black Hills | | | 223,992 |
| | |
| 10,229 | | MDU Resources Group | | | 194,044 |
| | |
| 28,921 | | NorthWestern | | | 658,242 |
| | |
| 15,317 | | PNM Resources | | | 164,045 |
| | |
| | | | | 1,240,323 |
| | | | | |
| Oil, Gas & Consumable Fuels (7.6%) | | | |
| | |
| 12,977 | | Arch Coal | | | 199,456 |
| | |
| 35,302 | | Atlas Pipeline Partners1 | | | 281,004 |
| | | | |
| See Notes to Financial Statements | | 37 | | June 30, 2009 |
Schedule of Investments as of June 30, 2009 (Unaudited)
Accessor Small to Mid Cap Fund
| | | | | |
| Shares | | | | Value |
| Oil, Gas & Consumable Fuels (continued) (7.6%) |
| | |
| 14,423 | | Buckeye Partners1 | | $ | 617,737 |
| | |
| 11,424 | | Cimarex Energy | | | 323,756 |
| | |
| 9,664 | | Continental Resources* | | | 268,176 |
| | |
| 18,230 | | CVR Energy* | | | 133,626 |
| | |
| 26,200 | | Denbury Resources* | | | 385,926 |
| | |
| 18,197 | | Enbridge Energy Partners1 | | | 702,040 |
| | |
| 60,121 | | Endeavour International* | | | 81,765 |
| | |
| 15,941 | | Energy Transfer Equity1 | | | 404,423 |
| | |
| 18,903 | | Enterprise Products Partners LP1 | | | 471,441 |
| | |
| 24,003 | | EXCO Resources* | | | 310,119 |
| | |
| 30,847 | | Kinder Morgan Energy Partners1 | | | 1,576,899 |
| | |
| 16,190 | | Kinder Morgan Management LLC* | | | 731,298 |
| | |
| 11,880 | | Magellan Midstream Partners1 | | | 412,949 |
| | |
| 19,800 | | Mariner Energy* | | | 232,650 |
| | |
| 60,640 | | McMoRan Exploration* | | | 361,414 |
| | |
| 13,338 | | Newfield Exploration* | | | 435,752 |
| | |
| 4,052 | | NuStar Energy1 | | | 218,930 |
| | |
| 11,415 | | NuStar GP Holdings LLC1 | | | 263,686 |
| | |
| 27,557 | | PetroHawk Energy* | | | 614,521 |
| | |
| 7,741 | | Pioneer Natural Resources | | | 197,396 |
| | |
| 15,714 | | Plains All American Pipeline1 | | | 668,631 |
| | |
| 13,968 | | Plains Exploration & Production* | | | 382,164 |
| | |
| 24,600 | | Quicksilver Resources* | | | 228,534 |
| | |
| 15,192 | | Southern Union | | | 279,381 |
| | |
| 5,951 | | Sunoco | | | 138,063 |
| | |
| 11,040 | | Targa Resources Partners1 | | | 153,125 |
| | |
| 17,521 | | TEPPCO Partners | | | 523,177 |
| | |
| 19,206 | | Ultra Petroleum* | | | 749,034 |
| | |
| 9,139 | | World Fuel Services | | | 376,801 |
| | |
| | | | | 12,723,874 |
| | | | | |
| Paper & Forest Products (0.1%) | | | |
| | |
| 9,663 | | Domtar* | | | 160,213 |
| | | | | |
| Personal Products (0.3%) | | | |
| | |
| 16,127 | | Herbalife Ltd. | | | 508,646 |
| | | | | |
| Pharmaceuticals (1.3%) | | | |
| | |
| 23,804 | | Endo Pharmaceuticals Holdings* | | | 426,568 |
| | | | | |
| Shares | | | | Value |
| | | | |
| | |
| 20,740 | | King Pharmaceuticals* | | $ | 199,726 |
| | |
| 20,432 | | Medicis Pharmaceutical — Class A | | | 333,450 |
| | |
| 19,892 | | Noven Pharmaceuticals* | | | 284,456 |
| | |
| 11,812 | | Obagi Medical Products* | | | 86,109 |
| | |
| 23,324 | | Pain Therapeutics* | | | 125,250 |
| | |
| 16,719 | | Perrigo | | | 464,454 |
| | |
| 12,488 | | Sepracor* | | | 216,292 |
| | |
| | | | | 2,136,305 |
| | | | | |
| Real Estate (5.3%) | | | |
| | |
| 12,052 | | AMB Property | | | 226,698 |
| | |
| 26,870 | | Annaly Capital Management | | | 406,812 |
| | |
| 89,806 | | Anthracite Capital | | | 55,680 |
| | |
| 39,542 | | Anworth Mortgage Asset | | | 285,098 |
| | |
| 94,525 | | Capital Trust | | | 137,061 |
| | |
| 135,500 | | Chimera Investment | | | 472,895 |
| | |
| 24,813 | | Duke Realty | | | 217,610 |
| | |
| 12,228 | | Entertainment Properties Trust | | | 251,897 |
| | |
| 33,523 | | Equity One | | | 444,515 |
| | |
| 21,167 | | Franklin Street Properties | | | 280,463 |
| | |
| 34,572 | | Hatteras Financial | | | 988,413 |
| | |
| 14,483 | | Hospitality Properties Trust | | | 172,203 |
| | |
| 49,287 | | Inland Real Estate | | | 345,009 |
| | |
| 16,098 | | Investors Real Estate Trust | | | 143,111 |
| | |
| 14,889 | | Kimco Realty | | | 149,634 |
| | |
| 13,068 | | LaSalle Hotel Properties | | | 161,259 |
| | |
| 24,573 | | LTC Properties | | | 502,518 |
| | |
| 12,356 | | Mack-Cali Realty | | | 281,717 |
| | |
| 28,006 | | Medical Properties Trust | | | 169,996 |
| | |
| 47,641 | | MFA Financial | | | 329,676 |
| | |
| 22,026 | | National Retail Properties | | | 382,151 |
| | |
| 10,503 | | Nationwide Health Properties | | | 270,347 |
| | |
| 56,854 | | NorthStar Realty Finance | | | 160,897 |
| | |
| 23,505 | | Omega Healthcare Investors | | | 364,798 |
| | |
| 13,641 | | Potlatch | | | 331,340 |
| | |
| 32,900 | | Redwood Trust | | | 485,604 |
| | |
| 26,514 | | Resource Capital | | | 84,845 |
| | | | |
| June 30, 2009 | | 38 | | See Notes to Financial Statements |
Schedule of Investments as of June 30, 2009 (Unaudited)
Accessor Small to Mid Cap Fund
| | | | | |
| Shares | | | | Value |
| Real Estate (continued) (5.3%) | | | |
| | |
| 10,432 | | SL Green Realty | | $ | 239,310 |
| | |
| 11,850 | | Sovran Self Storage | | | 291,510 |
| | |
| 7,496 | | Ventas | | | 223,830 |
| | |
| | | | | 8,856,897 |
| | | | | |
| Road & Rail (0.7%) | | | |
| | |
| 8,305 | | Arkansas Best | | | 218,837 |
| | |
| 10,356 | | Con-way | | | 365,670 |
| | |
| 16,461 | | Kansas City Southern* | | | 265,187 |
| | |
| 7,495 | | Old Dominion Freight Line* | | | 251,607 |
| | |
| | | | | 1,101,301 |
| | | | | |
| Semiconductors & Semiconductor Equipment (3.8%) |
| | |
| 30,804 | | Applied Micro Circuits* | | | 250,437 |
| | |
| 40,772 | | Integrated Device Technology* | | | 246,263 |
| | |
| 38,066 | | Intersil — Class A | | | 478,490 |
| | |
| 31,669 | | Lam Research* | | | 823,394 |
| | |
| 75,254 | | Marvell Technology Group Ltd.* | | | 875,957 |
| | |
| 36,865 | | Maxim Integrated Products | | | 578,412 |
| | |
| 22,801 | | Microsemi* | | | 314,654 |
| | |
| 12,188 | | Monolithic Power Systems* | | | 273,133 |
| | |
| 30,079 | | National Semiconductor | | | 377,491 |
| | |
| 24,112 | | Nvidia* | | | 272,224 |
| | |
| 71,707 | | ON Semiconductor* | | | 491,910 |
| | |
| 60,102 | | RF Micro Devices* | | | 225,984 |
| | |
| 6,880 | | Silicon Laboratories* | | | 261,027 |
| | |
| 10,765 | | Standard Microsystems* | | | 220,144 |
| | |
| 7,854 | | Varian Semiconductor Equipment Associates* | | | 188,417 |
| | |
| 15,743 | | Veeco Instruments* | | | 182,461 |
| | |
| 20,500 | | Zoran* | | | 223,450 |
| | |
| | | | | 6,283,848 |
| | | | | |
| Software (2.9%) | | | |
| | |
| 114,481 | | Activision Blizzard* | | | 1,445,895 |
| | |
| 17,304 | | ANSYS* | | | 539,193 |
| | |
| 75,680 | | Cadence Design Systems* | | | 446,512 |
| | |
| 33,637 | | Red Hat* | | | 677,113 |
| | |
| 7,519 | | SPSS* | | | 250,909 |
| | | | | |
| Shares | | | | Value |
| | | | |
| | |
| 11,647 | | Sybase* | | $ | 365,017 |
| | |
| 27,699 | | Symyx Technologies* | | | 162,039 |
| | |
| 10,526 | | Synopsys* | | | 205,362 |
| | |
| 27,418 | | Take-Two Interactive Software | | | 259,648 |
| | |
| 16,254 | | Taleo — Class A* | | | 296,961 |
| | |
| 32,611 | | TIBCO Software* | | | 233,821 |
| | |
| | | | | 4,882,470 |
| | | | | |
| Specialty Retail (5.1%) | | | |
| | |
| 15,317 | | Aaron’s | | | 456,753 |
| | |
| 9,115 | | Abercrombie & Fitch — Class A | | | 231,430 |
| | |
| 9,146 | | Aeropostale* | | | 313,433 |
| | |
| 44,147 | | American Eagle Outfitters | | | 625,563 |
| | |
| 24,205 | | AnnTaylor Stores* | | | 193,156 |
| | |
| 17,434 | | Barnes & Noble | | | 359,663 |
| | |
| 8,204 | | Buckle | | | 260,641 |
| | |
| 30,111 | | Carmax* | | | 442,632 |
| | |
| 16,306 | | Cato — Class A | | | 284,377 |
| | |
| 11,873 | | Charlotte Russe Holding* | | | 152,924 |
| | |
| 26,523 | | Christopher & Banks | | | 177,969 |
| | |
| 16,508 | | Collective Brands* | | | 240,522 |
| | |
| 34,442 | | Foot Locker | | | 360,608 |
| | |
| 16,205 | | Gap | | | 265,762 |
| | |
| 8,913 | | Group 1 Automotive | | | 231,916 |
| | |
| 5,874 | | Gymboree* | | | 208,410 |
| | |
| 17,443 | | J Crew Group* | | | 471,310 |
| | |
| 12,062 | | Jo-Ann Stores* | | | 249,322 |
| | |
| 9,217 | | Men’s Wearhouse | | | 176,782 |
| | |
| 23,900 | | OfficeMax | | | 150,092 |
| | |
| 13,977 | | O’Reilly Automotive* | | | 532,244 |
| | |
| 13,396 | | Penske Auto Group | | | 222,909 |
| | |
| 9,419 | | PetSmart | | | 202,132 |
| | |
| 13,877 | | RadioShack | | | 193,723 |
| | |
| 17,456 | | Rent-A-Center — Class A* | | | 311,240 |
| | |
| 10,432 | | Ross Stores | | | 402,675 |
| | |
| 11,125 | | Signet Jewelers Ltd. | | | 231,623 |
| | |
| 15,415 | | Urban Outfitters* | | | 321,711 |
| | | | |
| See Notes to Financial Statements | | 39 | | June 30, 2009 |
Schedule of Investments as of June 30, 2009 (Unaudited)
Accessor Small to Mid Cap Fund
| | | | | |
| Shares | | | | Value |
| Specialty Retail (continued) (5.1%) | | | |
| | |
| 25,220 | | Williams-Sonoma | | $ | 299,361 |
| | |
| | | | | 8,570,883 |
| | | | | |
| Textiles, Apparel & Luxury Goods (0.5%) | | | |
| | |
| 11,679 | | Fossil* | | | 281,230 |
| | |
| 23,478 | | Iconix Brand Group* | | | 361,092 |
| | |
| 19,520 | | Jones Apparel Group | | | 209,450 |
| | |
| | | | | 851,772 |
| | | | | |
| Thrifts & Mortgage Finance (0.9%) | | | |
| | |
| 16,016 | | Bank Mutual | | | 139,659 |
| | |
| 25,623 | | First Niagara Financial Group | | | 292,615 |
| | |
| 10,093 | | Flushing Financial | | | 94,369 |
| | |
| 37,009 | | TFS Financial | | | 393,036 |
| | |
| 62,391 | | Trustco Bank NY | | | 368,731 |
| | |
| 7,257 | | United Financial Bancorp | | | 100,292 |
| | |
| 7,611 | | ViewPoint Financial Group | | | 115,915 |
| | |
| | | | | 1,504,617 |
| | | | | |
| Tobacco (0.2%) | | | |
| | |
| 5,105 | | Lorillard | | | 345,966 |
| | | | | |
| Trading Companies & Distributors (0.6%) | | | |
| | |
| 25,434 | | Aircastle Ltd. | | | 186,940 |
| | |
| 12,104 | | Kaman | | | 202,137 |
| | |
| 9,908 | | Textainer Group Holdings Ltd. | | | 113,843 |
| | |
| 36,818 | | United Rentals* | | | 238,949 |
| | |
| 11,141 | | WESCO International* | | | 278,970 |
| | |
| | | | | 1,020,839 |
| | | | | |
| Wireless Telecommunication Services (1.7%) |
| | |
| 30,122 | | Crown Castle International* | | | 723,531 |
| | |
| 9,385 | | Leap Wireless International* | | | 309,048 |
| | |
| 26,535 | | MetroPCS Communications* | | | 353,181 |
| | |
| 21,572 | | NII Holdings* | | | 411,378 |
| | | | | |
| Shares | | | | Value |
| | | |
| 25,623 | | SBA Communications — Class A* | | $ | 628,788 |
| | |
| 11,900 | | Telephone & Data Systems | | | 336,770 |
| | |
| | | | | 2,762,696 |
| | |
| | Total Common Stocks
(Identified Cost $186,150,663) | | | 166,740,215 |
| | |
| | Total Investments (99.7%)
(Identified Cost $186,150,663)2 | | | 166,740,215 |
| | |
| | Total Other Assets Less Liabilities (0.3%) | | | 539,632 |
| | |
| | Total Net Assets (100.0%) | | $ | 167,279,847 |
* Non-income producing security.
1 Security considered a Master Limited Partnership. At June 30, 2009, these securities amounted to $5,770,865 or 3.4% of net assets.
2 See Note 6 for important tax information.
| | | | |
| June 30, 2009 | | 40 | | See Notes to Financial Statements |
Schedule of Investments as of June 30, 2009 (Unaudited)
Accessor International Equity Fund
| | | | | |
| Shares | | | | Value |
| |
| COMMON STOCKS (98.5%) | | | |
| Australia (3.7%) |
| | |
| 140,447 | | Australian Worldwide Exploration Ltd. | | $ | 290,673 |
| | |
| 12,023 | | Cochlear Ltd. | | | 558,660 |
| | |
| 9,551 | | CSL Ltd. | | | 247,280 |
| | |
| 86,685 | | Downer EDI Ltd. | | | 390,224 |
| | |
| 32,841 | | JB Hi-Fi Ltd. | | | 407,283 |
| | |
| 11,540 | | Macquarie Group Ltd. | | | 363,363 |
| | |
| 18,500 | | National Australia Bank Ltd. | | | 334,313 |
| | |
| 399,207 | | OZ Minerals Ltd. | | | 295,764 |
| | |
| 8,601 | | Rio Tinto Ltd. | | | 361,558 |
| | |
| 20,064 | | Westpac Banking | | | 327,191 |
| | |
| | | | | 3,576,309 |
| | | | | |
| Austria (0.3%) |
| | |
| 7,824 | | OMV AG | | | 292,834 |
| | | | | |
| Belgium (1.0%) |
| | |
| 8,876 | | Anheuser-Busch InBev NV | | | 320,383 |
| | |
| 1,600 | | Bekaert SA | | | 164,261 |
| | |
| 3,164 | | Groupe Bruxelles Lambert SA | | | 231,163 |
| | |
| 25,551 | | Nyrstar | | | 216,415 |
| | |
| | | | | 932,222 |
| | | | | |
| Brazil (3.4%) |
| | |
| 3,800 | | Cia Brasileira de Distribuicao Grupo Pao de Acucar — ADR | | | 146,148 |
| | |
| 18,100 | | Cia de Saneamento Basico do Estado de Sao Paulo — ADR | | | 542,819 |
| | |
| 22,900 | | EDP — Energias do Brasil SA | | | 311,070 |
| | |
| 34,100 | | Natura Cosmeticos SA | | | 446,299 |
| | |
| 33,300 | | Petroleo Brasileiro SA — Class A —ADR | | | 1,110,888 |
| | |
| 42,900 | | Vale SA — Class B — ADR | | | 658,515 |
| | |
| | | | | 3,215,739 |
| | | | | |
| Chile (0.1%) |
| | |
| 14,808 | | Cia Cervecerias Unidas SA | | | 103,350 |
|
| China (4.1%) |
| | |
| 88,000 | | Anta Sports Products Ltd. | | | 110,036 |
| | | | | |
| Shares | | | | Value |
|
|
| |
| | |
| 486,720 | | Chaoda Modern Agriculture Holdings Ltd. | | $ | 285,770 |
| | |
| 712,000 | | China BlueChemical Ltd. | | | 373,939 |
| | |
| 1,176,000 | | China Construction Bank — Class H | | | 912,028 |
| | |
| 208,000 | | China Oilfield Services Ltd. — Class H | | | 225,728 |
| | |
| 684,000 | | Dongfeng Motor Group Ltd. — Class H | | | 577,245 |
| | |
| 316,000 | | Industrial & Commercial Bank of China | | | 220,195 |
| | |
| 186,000 | | PetroChina Co. Ltd. — Class H | | | 206,413 |
| | |
| 76,000 | | Shandong Weigao Group Medical Polymer Ltd. — Class H | | | 195,161 |
| | |
| 29,000 | | Tencent Holdings Ltd. | | | 338,480 |
| | |
| 64,000 | | Weichai Power Ltd. — Class H | | | 212,246 |
| | |
| 228,000 | | Yanzhou Coal Mining Ltd. — Class H | | | 313,631 |
| | |
| | | | | 3,970,872 |
| | | | | |
| Czech Republic (0.3%) |
| | |
| 6,760 | | CEZ | | | 304,763 |
| | | | | |
| Denmark (1.3%) |
| | |
| 36 | | A P Moller — Maersk A | | | 215,605 |
| | |
| 18,810 | | Novo Nordisk A — Class B | | | 1,016,719 |
| | |
| | | | | 1,232,324 |
| | | | | |
| Egypt (0.2%) |
| | |
| 25,170 | | Commercial International Bank | | | 220,513 |
| | | | | |
| France (8.2%) |
| | |
| 60,200 | | AXA SA | | | 1,130,370 |
| | |
| 13,500 | | BNP Paribas | | | 875,566 |
| | |
| 62,100 | | Credit Agricole SA | | | 772,952 |
| | |
| 9,841 | | Sanofi-Aventis | | | 577,811 |
| | |
| 4,819 | | Schneider Electric SA | | | 366,944 |
| | |
| 15,280 | | Societe Generale | | | 833,199 |
| | |
| 30,629 | | STMicroelectronics NV | | | 229,059 |
| | |
| 48,000 | | Total SA | | | 2,590,119 |
| | |
| 3,226 | | Unibail-Rodamco SE | | | 480,252 |
| | |
| | | | | 7,856,272 |
| | | | | |
| Germany (6.8%) |
| | |
| 10,800 | | BASF SE | | | 429,056 |
| | |
| 12,016 | | Daimler AG | | | 434,396 |
| | | | |
| See Notes to Financial Statements | | 41 | | June 30, 2009 |
Schedule of Investments as of June 30, 2009 (Unaudited)
Accessor International Equity Fund
| | | | | |
| Shares | | | | Value |
| Germany (continued) (6.8%) |
| | |
| 10,322 | | Deutsche Bank AG | | $ | 625,231 |
| | |
| 3,400 | | Deutsche Boerse AG | | | 263,567 |
| | |
| 5,574 | | K+S AG | | | 312,893 |
| | |
| 5,578 | | MTU Aero Engines Holding AG | | | 203,374 |
| | |
| 9,744 | | Muenchener Rueckversicherungs AG | | | 1,314,349 |
| | |
| 18,165 | | RWE AG | | | 1,428,777 |
| | |
| 7,743 | | Siemens AG | | | 533,783 |
| | |
| 21,400 | | ThyssenKrupp AG | | | 530,866 |
| | |
| 7,000 | | Wincor Nixdorf AG | | | 391,468 |
| | |
| | | | | 6,467,760 |
| | | | | |
| Great Britian (16.4%) |
| | |
| 12,200 | | Anglo American PLC | | | 353,936 |
| | |
| 80,746 | | Antofagasta PLC | | | 780,402 |
| | |
| 13,239 | | Ashtead Group PLC | | | 12,360 |
| | |
| 34,968 | | AstraZeneca PLC | | | 1,536,217 |
| | |
| 29,172 | | Atkins WS PLC | | | 286,023 |
| | |
| 78,374 | | BAE Systems PLC | | | 436,435 |
| | |
| 79,000 | | Barclays PLC | | | 367,792 |
| | |
| 28,775 | | BG Group PLC | | | 481,895 |
| | |
| 54,706 | | BHP Billiton PLC | | | 1,227,548 |
| | |
| 40,250 | | British American Tobacco PLC | | | 1,107,774 |
| | |
| 264,200 | | BT Group PLC — Class A | | | 441,152 |
| | |
| 76,236 | | Centrica PLC | | | 279,675 |
| | |
| 48,592 | | Compass Group PLC | | | 273,189 |
| | |
| 108,000 | | Game Group PLC | | | 292,266 |
| | |
| 106,644 | | GlaxoSmithKline PLC | | | 1,874,564 |
| | |
| 98,700 | | Hiscox Ltd. | | | 470,062 |
| | |
| 143,225 | | HSBC Holdings PLC | | | 1,183,980 |
| | |
| 43,700 | | Micro Focus International PLC | | | 269,229 |
| | |
| 24,114 | | Next PLC | | | 582,747 |
| | |
| 48,026 | | Pearson PLC | | | 481,548 |
| | |
| 38,500 | | Petrofac Ltd. | | | 424,351 |
| | |
| 6,417 | | Reckitt Benckiser Group PLC | | | 291,994 |
| | |
| 45,595 | | Royal Dutch Shell PLC — Class A | | | 1,138,619 |
| | |
| 75,235 | | Tesco PLC | | | 437,645 |
| | |
| 190,396 | | Vodafone Group PLC | | | 367,092 |
| | | | | |
| Shares | | | | Value |
| |
| | |
| 27,929 | | Wetherspoon (J.D.) PLC | | $ | 178,040 |
| | |
| 16,299 | | WH Smith PLC | | | 112,147 |
| | |
| | | | | 15,688,682 |
| | | | | |
| Hong Kong (3.2%) |
| | |
| 152,000 | | China Unicom Hong Kong Ltd. | | | 201,241 |
| | |
| 87,000 | | Hutchison Whampoa Ltd. | | | 568,624 |
| | |
| 167,000 | | Hysan Development Ltd. | | | 428,841 |
| | |
| 553,000 | | Noble Group Ltd. | | | 695,213 |
| | |
| 65,000 | | Sun Hung Kai Properties Ltd. | | | 811,923 |
| | |
| 58,000 | | VTech Holdings Ltd. | | | 395,922 |
| | |
| | | | | 3,101,764 |
| | | | | |
| India (1.7%) |
| | |
| 1,600 | | HDFC Bank Ltd. | | | 165,008 |
| | |
| 8,000 | | Infosys Technologies Ltd. | | | 294,240 |
| | |
| 11,300 | | State Bank of India Ltd. | | | 802,300 |
| | |
| 40,300 | | Tata Motors Ltd. | | | 343,356 |
| | |
| | | | | 1,604,904 |
| | | | | |
| Indonesia (0.7%) |
| | |
| 164,500 | | Astra International | | | 383,833 |
| | |
| 160,000 | | Tambang Batubara Bukit Asam | | | 181,961 |
| | |
| 155,500 | | Unilever Indonesia | | | 141,017 |
| | |
| | | | | 706,811 |
| | | | | |
| Ireland (0.3%) |
| | |
| 12,857 | | CRH PLC | | | 292,979 |
| | | | | |
| Israel (0.5%) |
| | |
| 25,700 | | Partner Communications | | | 439,213 |
| | | | | |
| Italy (2.7%) |
| | |
| 50,965 | | Banco Popolare Scarl | | | 380,213 |
| | |
| 7,155 | | DiaSorin SpA | | | 177,694 |
| | |
| 75,974 | | Enel SpA | | | 369,690 |
| | |
| 39,301 | | ENI SpA | | | 928,639 |
| | |
| 31,100 | | Fiat SpA | | | 312,260 |
| | |
| 154,092 | | UniCredito Italiano SpA | | | 387,872 |
| | |
| | | | | 2,556,368 |
| | | | |
| June 30, 2009 | | 42 | | See Notes to Financial Statements |
Schedule of Investments as of June 30, 2009 (Unaudited)
Accessor International Equity Fund
| | | | | |
| Shares | | | | Value |
| Japan (18.6%) |
| | |
| 100,000 | | 77 Bank Ltd. | | $ | 583,351 |
| | |
| 11,400 | | Astellas Pharma | | | 404,692 |
| | |
| 29,100 | | Canon | | | 954,495 |
| | |
| 3,200 | | East Japan Railway | | | 192,983 |
| | |
| 42,600 | | FUJIFILM Holdings | | | 1,353,083 |
| | |
| 64,000 | | Godo Steel Ltd. | | | 191,322 |
| | |
| 68,000 | | Gunma Bank Ltd. | | | 379,033 |
| | |
| 25,300 | | Hitachi Chemical Ltd. | | | 408,886 |
| | |
| 10,500 | | Hitachi Information Systems Ltd. | | | 221,793 |
| | |
| 142,000 | | Hokuhoku Financial Group | | | 356,695 |
| | |
| 30,600 | | Honda Motor Ltd. | | | 844,883 |
| | |
| 29 | | INPEX | | | 232,385 |
| | |
| 79,000 | | IWATANI | | | 222,223 |
| | |
| 20,000 | | Japan Steel Works Ltd. | | | 247,457 |
| | |
| 53,000 | | JFE Shoji Holdings | | | 196,398 |
| | |
| 201 | | KDDI | | | 1,068,217 |
| | |
| 69,000 | | KUREHA | | | 365,985 |
| | |
| 7,700 | | Kurita Water Industries Ltd. | | | 249,367 |
| | |
| 84,000 | | Marubeni | | | 373,178 |
| | |
| 58,200 | | Mitsubishi UFJ Financial Group | | | 361,258 |
| | |
| 28,000 | | Mitsui Fudosan Ltd. | | | 489,143 |
| | |
| 8,100 | | Mitsui Sumitomo Insurance Group Holdings | | | 213,136 |
| | |
| 156,000 | | Nippon Express Ltd. | | | 710,857 |
| | |
| 39,000 | | Nippon Meat Packers | | | 493,471 |
| | |
| 63,000 | | Nippon Oil | | | 372,742 |
| | |
| 11,700 | | Nippon Telegraph & Telephone | | | 476,064 |
| | |
| 35,400 | | Nissan Motor Co. Ltd. | | | 215,325 |
| | |
| 217 | | NTT DoCoMo | | | 318,044 |
| | |
| 17,300 | | Omron | | | 250,503 |
| | |
| 8,180 | | ORIX | | | 493,313 |
| | |
| 84,000 | | Osaka Gas Ltd. | | | 268,549 |
| | |
| 19,700 | | Sony | | | 516,322 |
| | |
| 46,000 | | Sumitomo Electric Industries Ltd. | | | 518,539 |
| | |
| 6,600 | | Sumitomo Mitsui Financial Group | | | 269,234 |
| | |
| 14,000 | | Sumitomo Realty & Development Ltd. | | | 257,359 |
| | |
| 76,500 | | Sumitomo | | | 779,770 |
| | | | | |
| Shares | | | | Value |
| |
| | |
| 106,000 | | Tokyo Gas Ltd. | | $ | 379,593 |
| | |
| 22,400 | | Toyota Motor | | | 853,311 |
| | |
| 51,000 | | UNY Ltd. | | | 436,735 |
| | |
| 81 | | West Japan Railway | | | 268,206 |
| | |
| | | | | 17,787,900 |
| | | | | |
| Luxembourg (0.3%) |
| | |
| 6,761 | | Oriflame Cosmetics SA | | | 294,063 |
| | | | | |
| Malaysia (0.5%) |
| | |
| 2,400 | | Public Bank BHD | | | 6,183 |
| | |
| 205,000 | | Tenaga Nasional BHD | | | 446,413 |
| | |
| | | | | 452,596 |
| | | | | |
| Mexico (1.1%) |
| | |
| 21,112 | | Cemex SAB de CV — ADR* | | | 197,186 |
| | |
| 274,900 | | GEO SAB de CV* | | | 530,768 |
| | |
| 277,447 | | Grupo Mexico SAB de CV | | | 303,219 |
| | |
| | | | | 1,031,173 |
| | | | | |
| Netherlands (2.6%) |
| | |
| 8,528 | | ArcelorMittal | | | 279,719 |
| | |
| 84,049 | | ING Groep NV | | | 845,311 |
| | |
| 5,895 | | Koninklijke DSM NV | | | 184,593 |
| | |
| 90,993 | | Reed Elsevier NV | | | 1,000,769 |
| | |
| 7,315 | | Ten Cate NV | | | 176,589 |
| | |
| | | | | 2,486,981 |
| | | | | |
| Norway (2.7%) |
| | |
| 117,200 | | DnB NOR ASA | | | 892,946 |
| | |
| 6,150 | | Fred Olsen Energy ASA | | | 208,943 |
| | |
| 35,000 | | StatoilHydro ASA | | | 688,974 |
| | |
| 18,000 | | Tandberg ASA | | | 302,971 |
| | |
| 36,600 | | Telenor ASA | | | 281,416 |
| | |
| 8,750 | | Yara International ASA | | | 244,896 |
| | |
| | | | | 2,620,146 |
| | | | | |
| Philippines (0.3%) |
| | |
| 5,900 | | Philippine Long Distance Telephone | | | 293,712 |
| | | | | |
| Poland (0.1%) |
| | |
| 4,269 | | KGHM Polska Miedz SA | | | 109,672 |
| | | | |
| See Notes to Financial Statements | | 43 | | June 30, 2009 |
Schedule of Investments as of June 30, 2009 (Unaudited)
Accessor International Equity Fund
| | | | | |
| Shares | | | | Value |
| Russia (1.3%) |
| | |
| 10,683 | | LUKOIL | | $ | 474,005 |
| | |
| 10,100 | | Mobile Telesystems | | | 372,993 |
| | |
| 10,379 | | Pharmstandard* | | | 156,723 |
| | |
| 36,203 | | Rosneft Oil | | | 197,306 |
| | |
| | | | | 1,201,027 |
| | | | | |
| Singapore (0.9%) |
| | |
| 106,000 | | Oversea-Chinese Banking Ltd. | | | 489,107 |
| | |
| 96,000 | | Wilmar International Ltd. | | | 332,887 |
| | |
| | | | | 821,994 |
| | | | | |
| South Africa (1.8%) |
| | |
| 40,725 | | AVI Ltd. | | | 89,866 |
| | |
| 15,400 | | Group Ltd. | | | 236,497 |
| | |
| 13,751 | | Impala Platinum Holdings Ltd. | | | 304,239 |
| | |
| 72,875 | | Shoprite Holdings Ltd. | | | 520,265 |
| | |
| 59,100 | | Truworths International Ltd. | | | 283,840 |
| | |
| 18,703 | | Wilson Bayly Holmes-Ovcon Ltd. | | | 257,822 |
| | |
| | | | | 1,692,529 |
| | | | | |
| South Korea (2.8%) |
| | |
| 2,385 | | Hyundai Heavy Industries | | | 357,047 |
| | |
| 9,610 | | KB Financial Group | | | 323,228 |
| | |
| 16,510 | | Korea Electric Power | | | 384,693 |
| | |
| 1,602 | | Korea Zinc Ltd. | | | 174,363 |
| | |
| 19,700 | | LG Dacom | | | 273,246 |
| | |
| 8,220 | | LG Display Ltd. | | | 205,419 |
| | |
| 46,210 | | LG Telecom Ltd. | | | 291,241 |
| | |
| 2,300 | | POSCO — ADR | | | 190,141 |
| | |
| 551 | | Samsung Electronics Co. Ltd. | | | 256,339 |
| | |
| 9,460 | | STX Engine Ltd. | | | 202,582 |
| | |
| | | | | 2,658,299 |
| | | | | |
| Spain (2.9%) |
| | |
| 140,162 | | Banco Santander SA | | | 1,682,471 |
| | |
| 17,492 | | Enagas | | | 343,776 |
| | |
| 34,729 | | Telefonica SA | | | 785,056 |
| | |
| | | | | 2,811,303 |
| | | | | |
| Sweden (0.2%) |
| | |
| 14,543 | | Assa Abloy AB — Class B | | | 202,675 |
| | | | | |
| Shares | | | | Value |
| Switzerland (4.2%) |
| | |
| 2,542 | | Baloise Holding AG | | $ | 188,690 |
| | |
| 57,156 | | Nestle SA | | | 2,152,622 |
| | |
| 6,400 | | Roche Holding AG | | | 870,023 |
| | |
| 4,600 | | Zurich Financial Services AG | | | 810,345 |
| | |
| | | | | 4,021,680 |
| | | | | |
| Taiwan (2.3%) |
| | |
| 57,050 | | HON HAI Precision Industry Ltd. | | | 176,327 |
| | |
| 13,000 | | HTC | | | 183,678 |
| | |
| 319,000 | | KGI Securities Ltd. | | | 145,706 |
| | |
| 17,000 | | MediaTek | | | 202,923 |
| | |
| 63,000 | | Siliconware Precision Industries — ADR | | | 390,600 |
| | |
| 53,000 | | Taiwan Semiconductor Manufacturing Co. Ltd. | | | 498,730 |
| | |
| 172,000 | | TSRC | | | 209,501 |
| | |
| 259,000 | | Yuanta Financial Holding Ltd. | | | 174,297 |
| | |
| 141,000 | | Zinwell | | | 227,558 |
| | |
| | | | | 2,209,320 |
| | | | | |
| Thailand (0.5%) |
| | |
| 56,300 | | Bangkok Bank PCL | | | 185,241 |
| | |
| 1,141,100 | | Charoen Pokphand Foods PCL | | | 160,237 |
| | |
| 323,200 | | CP ALL PCL | | | 162,359 |
| | |
| | | | | 507,837 |
| | | | | |
| Turkey (0.5%) |
| | |
| 55,898 | | Haci Omer Sabanci Holding AS | | | 150,321 |
| | |
| 78,650 | | Turkiye Is Bankasi — Class C | | | 231,939 |
| | |
| 69,900 | | Turkiye Vakiflar Bankasi Tao — Class D | | | 105,792 |
| | |
| | | | | 488,052 |
| | |
| | Total Common Stocks
(Identified Cost $86,487,786) | | | 94,254,638 |
| | |
| | Total Investments (98.5%)
(Identified Cost $86,487,786)1 | | | 94,254,638 |
| | |
| | Total Other Assets Less Liabilities (1.5%) | | | 1,448,069 |
| | |
| | Total Net Assets (100.0%) | | $ | 95,702,707 |
* Non-income producing security.
1 See Note 6 for important tax information.
ADR — American Depositary Receipt
| | | | |
| June 30, 2009 | | 44 | | See Notes to Financial Statements |
Schedule of Investments as of June 30, 2009 (Unaudited)
Accessor Total Return Fund
| | | | | |
| Shares | | | | Value |
| |
| COMMON STOCKS (29.0%) | | | |
| Aerospace & Defense (0.9%) | | | |
| | |
| 5,100 | | Boeing | | $ | 216,750 |
| | | | | |
| Capital Markets (1.1%) | | | |
| | |
| 10,000 | | Morgan Stanley | | | 285,100 |
| | | | | |
| Computers & Peripherals (4.9%) | | | |
| | |
| 18,200 | | Hewlett-Packard | | | 703,430 |
| | |
| 5,056 | | International Business Machines | | | 527,948 |
| | |
| | | | | 1,231,378 |
| | | | | |
| Containers & Packaging (0.6%) | | | |
| | |
| 11,000 | | Temple-Inland | | | 144,320 |
| | | | | |
| Diversified Telecommunication Services (1.1%) | | | |
| | |
| 9,000 | | Verizon Communications | | | 276,570 |
| | | | | |
| Hotels, Restaurants & Leisure (0.5%) | | | |
| | |
| 2,350 | | McDonald’s | | | 135,101 |
| | | | | |
| Industrial Conglomerates (3.0%) | | | |
| | |
| 8,411 | | 3M | | | 505,501 |
| | |
| 10,000 | | Carlisle | | | 240,400 |
| | |
| | | | | 745,901 |
| | | | | |
| Internet & Catalog Retail (0.3%) | | | |
| | |
| 2,000 | | NetFlix* | | | 82,680 |
| | | | | |
| Internet Software & Services (1.6%) | | | |
| | |
| 15,000 | | Akamai Technologies* | | | 287,700 |
| | |
| 250 | | Google — Class A* | | | 105,397 |
| | |
| | | | | 393,097 |
| | | | | |
| Machinery (2.5%) | | | |
| | |
| 9,000 | | Bucyrus International — Class A | | | 257,040 |
| | |
| 9,800 | | CIRCOR International | | | 231,378 |
| | |
| 4,000 | | Joy Global | | | 142,880 |
| | |
| | | | | 631,298 |
| | | | | |
| Metals & Mining (0.5%) | | | |
| | |
| 6,600 | | Vale SA —Class B | | | 116,358 |
| | | | | |
| Oil, Gas & Consumable Fuels (5.8%) | | | |
| | |
| 4,100 | | Apache | | | 295,815 |
| | |
| 13,000 | | Linn Energy LLC1 | | | 254,410 |
| | |
| 12,683 | | Massey Energy | | | 247,826 |
| | | | | |
| Shares | | | | Value |
|
|
| | | | |
| | |
| 9,486 | | Royal Dutch Shell PLC — Class A — ADR | | $ | 476,102 |
| | |
| 12,500 | | Williams Cos | | | 195,125 |
| | |
| | | | | 1,469,278 |
| | | | | |
| Semiconductors & Semiconductor Equipment (0.4%) |
| | |
| 10,000 | | Nvidia* | | | 112,900 |
| | | | | |
| Specialty Retail (4.1%) |
| | |
| 20,000 | | Home Depot | | | 472,600 |
| | |
| 5,000 | | J Crew Group* | | | 135,100 |
| | |
| 12,500 | | Lowe’s | | | 242,625 |
| | |
| 17,073 | | Sonic Automotive — Class A | | | 173,462 |
| | |
| | | | | 1,023,787 |
| | | | | |
| Tobacco (1.7%) |
| | |
| 27,000 | | Altria Group | | | 442,530 |
| | |
| | Total Common Stocks
(Identified Cost $6,986,706) | | | 7,307,048 |
| |
| EXCHANGE TRADED FUNDS (56.8%) | | | |
| 40,150 | | Consumer Discretionary Select Sector SPDR Fund | | | 926,662 |
| | |
| 32,700 | | Consumer Staples Select Sector SPDR Fund | | | 751,773 |
| | |
| 9,000 | | Energy Select Sector SPDR Fund | | | 432,630 |
| | |
| 138,000 | | Financial Select Sector SPDR Fund | | | 1,651,860 |
| | |
| 77,350 | | Health Care Select Sector SPDR Fund | | | 2,035,079 |
| | |
| | iShares Dow Jones US Basic Materials Sector Index Fund | | | 867,800 |
| | |
| 10,222 | | iShares Dow Jones US Broker Dealers Index Fund | | | 261,683 |
| | |
| 15,900 | | iShares Dow Jones US Energy Sector Index Fund | | | 455,535 |
| | |
| | iShares iBoxx Investment Grade Corporate Bond Fund | | | 300,840 |
| | |
| 77,500 | | iShares MSCI Emerging Markets Index Fund | | | 2,497,825 |
| | |
| 15,750 | | Powershares QQQ | | | 572,985 |
| | |
| 51,734 | | ProShares Ultra S&P500 | | | 1,352,327 |
| | |
| 35,000 | | ProShares UltraShort Gold | | | 535,150 |
| | |
| 20,940 | | Rydex S&P Equal Weight Technology ETF | | | 715,101 |
| | | | |
| See Notes to Financial Statements | | 45 | | June 30, 2009 |
Schedule of Investments as of June 30, 2009 (Unaudited)
Accessor Total Return Fund
| | | | | | | | |
| Shares | | | | Rate | | | Value |
|
|
| 51,000 | | Technology Select Sector SPDR Fund | | | | | $ | 926,670 |
| | | |
| | | | | | | | 14,283,920 |
| | | |
| | Total Exchange Traded Funds
(Identified Cost $15,583,129) | | | | | | 14,283,920 |
| | |
| PREFERRED STOCKS (3.8%) | | | | | | |
| Capital Markets (0.9%) | | | | | | |
| | | |
| 10,000 | | Goldman Sachs Group | | 6.200 | % | | | 227,500 |
| | | | | | | | |
| Industrial-Other (2.9%) | | | | | | |
| | | |
| 21,400 | | CORTS Trust for Walt Disney | | 6.875 | % | | | 538,210 |
| | | |
| 8,000 | | PreferredPlus Trust — CCR1 — Class 1 | | 7.250 | % | | | 178,720 |
| | | |
| | | | | | | | 716,930 |
| | | |
| | Total Preferred Stocks
(Identified Cost $948,891) | | | | | | 944,430 |
| | | | | |
| Shares | | | | Value |
| |
| INVESTMENT COMPANIES (1.7%) | | | |
| Investment Companies (1.7%) | | | |
| | |
| 20,000 | | Evergreen Income Advantage Fund | | $ | 162,200 |
| | |
| 57,384 | | Neuberger Berman Income Opportunity Fund | | | 262,245 |
| | |
| | | | | 424,445 |
| | |
| | Total Investment Companies
(Identified Cost $459,527) | | | 424,445 |
| | |
| | Total Investments (91.3%)
(Identified Cost $23,978,253)2 | | | 22,959,843 |
| | |
| | Total Other Assets Less Liabilities
(8.7%) | | | 2,195,091 |
| | |
| | Total Net Assets (100.0%) | | $ | 25,154,934 |
* Non-income producing security.
1 Security considered a Master Limited Partnership. At June 30, 2009, these securities amounted to $254,410 or 1.0% of net assets.
2 See Note 6 for important tax information.
ADR — American Depositary Receipt
MSCI — Morgan Stanley Capital International
SPDR — Standard & Poor’s Depositary Receipt
| | | | |
| June 30, 2009 | | 46 | | See Notes to Financial Statements |
Schedule of Investments as of June 30, 2009 (Unaudited)
Accessor Strategic Alternatives Fund
| | | | | |
Shares | | | | Value |
| |
| EXCHANGE TRADED FUNDS (40.5%) | | | |
| 359,400 | | iShares Cohen & Steers Realty Majors Index Fund | | $ | 12,916,836 |
| | |
| 104,550 | | Market Vectors — Coal ETF | | | 2,418,242 |
| | |
| 56,000 | | Market Vectors — Steel Index Fund | | | 2,359,280 |
| | |
| 626,300 | | SPDR DJ Wilshire International Real Estate | | | 17,993,599 |
| | |
| 145,818 | | Vanguard REIT ETF | | | 4,521,816 |
| | |
| | Total Exchange Traded Funds
(Identified Cost $59,782,641) | | | 40,209,773 |
| |
| EXCHANGE TRADED NOTE (17.1%) | | | |
| Exchange Traded Note (17.1%) | | | |
| | |
| 384,500 | | iPath Optimized Currency Carry* | | | 17,006,435 |
| | |
| | Total Exchange Traded Note
(Identified Cost $19,105,315) | | | 17,006,435 |
| | |
Principal
Amount | | | | |
| |
| STRUCTURED NOTES (20.6%) | | | |
| $6,500,000 | | Svensk Exportkredit AB CTI Note1,2
0.049%, 08/12/2009 | | | 9,495,200 |
| | |
| 8,000,000 | | Svensk Exportkredit AB MTN — Linked to DB Balanced Currency Harvest Index1*
0.000%, 04/28/2011 | | | 7,174,400 |
| | |
| 4,500,000 | | Svensk Exportkredit AB MTN — Linked to DB Balanced Currency Harvest Index1*
0.000%, 03/16/2012 | | | 3,825,000 |
| | |
| | | | | 20,494,600 |
| | |
| | Total Structured Notes
(Identified Cost $19,000,000) | | | 20,494,600 |
| | | | | |
Principal
Amount | | | | Value |
|
| U.S. GOVERNMENT AND AGENCY SECURITIES (18.1%) |
| Federal Farm Credit Bank (FFCB) (10.1%) | | | |
| | |
| $10,000,000 | | FFCB2
0.235%, 06/22/2010 | | $ | 9,992,340 |
| | | | | |
| Federal Home Loan Bank (FHLB) (8.0%) | | | |
| | |
| 8,000,000 | | FHLB2
0.244%, 08/13/2009 | | | 7,999,512 |
| | |
| | Total U.S. Government And Agency Securities
(Identified Cost $18,004,541) | | | 17,991,852 |
| | |
| | Total Investments (96.3%)
(Identified Cost $115,892,497)3 | | | 95,702,660 |
| | |
| | Total Other Assets Less Liabilities
(3.7%) | | | 3,716,587 |
| | |
| | Total Net Assets (100.0%) | | $ | 99,419,247 |
* Non-income producing security.
1 Fair Valued security under procedures established by the Fund’s Board of Trustees.
2 Represents a variable or increasing rate security. Rate disclosed is as of June 30, 2009.
3 See Note 6 for important tax information.
CTI — Comparative Tracking Index
ETF — Exchange Traded Fund
MTN — Medium Term Note
REIT — Real Estate Investment Trust
SPDR — Standard & Poor’s Depositary Receipt
| | | | |
| See Notes to Financial Statements | | 47 | | June 30, 2009 |
Schedule of Investments as of June 30, 2009 (Unaudited)
Accessor Frontier Markets Fund
| | | | | |
Shares | | | | Value |
| |
| COMMON STOCKS (5.3%) | | | |
| Commercial Banks (1.6%) | | | |
| | |
| 13,000 | | Banco Macro SA — ADR * | | $ | 210,470 |
| | |
| 1,800 | | Banque Audi sal- Audi Saradar Group | | | 117,000 |
| | |
| 11,000 | | BBVA Banco Frances SA — ADR * | | | 51,590 |
| | |
| 1,700 | | BLOM Bank SAL | | | 124,100 |
| | |
| | | | | 503,160 |
| | | | | |
| Diversified Telecommunication Services (0.9%) | | | |
| | |
| 22,500 | | Telecom Argentina SA — ADR * | | | 288,675 |
| | | | | |
| Food Products (0.4%) | | | |
| | |
| 11,000 | | Cresud SACIF y A — ADR | | | 103,730 |
| | | | | |
| Oil, Gas & Consumable Fuels (0.5%) | | | |
| | |
| 25,500 | | Petrobras Energia Participaciones SA — ADR | | | 151,470 |
| | | | | |
| Real Estate (1.9%) | | | |
| | |
| 24,500 | | Solidere* | | | 586,775 |
| | |
| | Total Common Stocks (Identified Cost $1,551,521) | | | 1,633,810 |
| |
| EXCHANGE TRADED PRODUCTS (36.8%) | | | |
| 219,124 | | Barclays Middle East Equities Non ETN*1 | | | 5,336,984 |
| | |
| 10,150 | | DB X-Trackers FTSE Vietnam ETF* | | | 440,098 |
| | |
| 30,206 | | Market Vectors — Gulf States ETF1 | | | 620,126 |
| | |
| 147,500 | | Market Vectors Africa Index ETF1 | | | 3,954,490 |
| | |
| 40,899 | | PowerShares MENA Frontier Countries Portfolio* | | | 533,323 |
| | |
| 39,590 | | WisdomTree Middle East Dividend Fund | | | 557,427 |
| | |
| | Total Exchange Traded Products (Identified Cost $9,640,785) | | | 11,442,448 |
| |
| INVESTMENT COMPANY (5.8%) | | | |
| 1,800,000 | | Accessor U.S. Government Money | | | 1,800,000 |
| | |
| | Total Investment Company
(Identified Cost $1,800,000) | | | 1,800,000 |
| | | | | |
Principal
Amount | | | | Value |
|
| U.S. GOVERNMENT AND AGENCY SECURITIES (24.2%) |
| Federal National Mortgage Corp (FNMA) (17.8%) |
| | |
| $5,500,000 | | FNMA
1.875%, 04/08/2011 | | $ | 5,525,982 |
| | | | | |
| U.S. Treasury Bonds & Notes (6.4%) |
| | |
| 2,000,000 | | United States Treasury Bill2,3
0.371%, 9/24/2009 | | | 1,999,174 |
| | |
| | Total U.S. Government and Agency Securities
(Identified Cost $7,498,253) | | | 7,525,156 |
| | |
| Shares | | | | |
| |
| WARRANTS (15.7%) | | | |
| 9,500 | | MSCI GCC Countries Ex-Saudi Arabia, Expires 02/24/10, Strike Price: $0.000001*1 | | | 4,877,300 |
| | |
| | Total Warrants (Identified Cost $4,401,614) | | | 4,877,300 |
| | |
| | Total Investments (87.8%)
(Identified Cost $24,892,173)4 | | | 27,278,714 |
| | |
| | Total Other Assets Less Liabilities (12.2%) | | | 3,778,310 |
| | |
| | Total Net Assets (100.0%) | | $ | 31,057,024 |
* Non-income producing security.
1 Fair Valued security under procedures established by the Fund’s Board of Trustees.
2 Rate shown represents the bond equivalent yield to maturity at date of purchase.
3 Security, or a portion of, has been pledged as collateral for swap contracts.
4 See Note 6 for important tax information.
ADR — American Depositary Receipt
ETF — Exchange Traded Fund
ETN — Exchange Traded Note
GCC — Gulf Cooperation Council
LIBOR — London Interbank Offered Rate
MSCI — Morgan Stanley Capital International
| | | | |
| June 30, 2009 | | 48 | | See Notes to Financial Statements |
Schedule of Investments as of June 30, 2009 (Unaudited)
Accessor Frontier Markets Fund
OUTSTANDING TOTAL RETURN SWAP CONTRACTS
| | | | | | | | | | | | | |
| Counterparty | | Reference Entry/Obligation | | Fund Pays | | Fund
Receives | | Termination
Date | | Notional
Amount | | Net Unrealized
Gain (Loss) |
| Barclays Capital | | Eastern Europe Basket of Securities | | 1-month LIBOR plus 85 Bps | | Total Return | | 04/29/2010 | | 4,089,299 | | $ | 42,959 |
| Barclays Capital | | MSCI GCC Countries Ex-Saudi Arabia | | 1-month LIBOR plus 50 Bps | | Price Return | | 04/26/2010 | | 6,823,487 | | | (179,337) |
| | | | | | | | | | | | $ | (136,378) |
| | | | |
| See Notes to Financial Statements | | 49 | | June 30, 2009 |
Schedule of Investments as of June 30, 2009 (Unaudited)
Accessor High Yield Bond Fund
| | | | | |
Principal
Amount | | | | Value |
| |
| CORPORATE BONDS (98.0%) | | | |
| Automobiles (1.9%) | | | |
| | |
| $1,000,000 | | Ford Motor
6.500%, 08/01/2018 | | $ | 590,000 |
| | |
| 1,500,000 | | Penske Auto Group
7.750%, 12/15/2016 | | | 1,211,250 |
| | |
| | | | | 1,801,250 |
| | | | | |
| Computers & Peripherals (2.0%) | | | |
| | |
| 1,000,000 | | GameStop
8.000%, 10/01/2012 | | | 1,012,500 |
| | |
| 1,000,000 | | Maxtor
2.375%, 08/15/2012 | | | 856,250 |
| | |
| | | | | 1,868,750 |
| | | | | |
| Consumer Finance (2.1%) | | | |
| | |
| 1,500,000 | | Ford Motor Credit LLC
8.000%, 06/01/2014 | | | 1,213,677 |
| | |
| 1,000,000 | | GMAC LLC1
6.750%, 12/01/2014 | | | 785,000 |
| | |
| | | | | 1,998,677 |
| | | | | |
| Electric Utilities (2.5%) | | | |
| | |
| 1,000,000 | | Mirant Americas Generation LLC1
8.500%, 10/01/2021 | | | 790,000 |
| | |
| 1,000,000 | | PSEG Energy Holdings LLC
8.500%, 06/15/2011 | | | 1,009,616 |
| | |
| 1,000,000 | | Texas Competitive Electric Holdings LLC
10.250%, 11/01/2015 | | | 622,500 |
| | |
| | | | | 2,422,116 |
| | | | | |
| Electrical Equipment (1.9%) | | | |
| | |
| 1,000,000 | | L-3 Communications
5.875%, 01/15/2015 | | | 887,500 |
| | |
| 1,000,000 | | Sanmina-SCI1,2
3.379%, 06/15/2010 | | | 960,000 |
| | |
| | | | | 1,847,500 |
| | | | | |
| Finance-Other (0.9%) | | | |
| | |
| 1,000,000 | | Pinnacle Foods Finance LLC
10.625%, 04/01/2017 | | | 845,000 |
| | | | | |
| Food & Staples Retailing (3.2%) | | | |
| | |
| 1,500,000 | | Chiquita Brands International
4.250%, 08/15/2016 | | | 1,053,750 |
| | |
| 1,000,000 | | Ingles Markets1
8.875%, 05/15/2017 | | | 985,000 |
| | | | | |
Principal
Amount | | | | Value |
|
|
| | | | |
| | |
| $1,000,000 | | SUPERVALU
7.500%, 05/15/2012 | | $ | 990,000 |
| | |
| | | | | 3,028,750 |
| | | | | |
| Health Care Providers & Services (3.7%) | | | |
| | |
| 1,000,000 | | Community Health Systems
8.875%, 07/15/2015 | | | 980,000 |
| | |
| 1,000,000 | | HCA
9.000%, 12/15/2014 | | | 828,847 |
| | |
| 1,000,000 | | LifePoint Hospitals
3.500%, 05/15/2014 | | | 802,500 |
| | |
| 1,000,000 | | Tenet Healthcare
9.250%, 02/01/2015 | | | 915,000 |
| | |
| | | | | 3,526,347 |
| | | | | |
| Industrial Energy (2.0%) | | | |
| | |
| 1,000,000 | | Arch Western Finance LLC
6.750%, 07/01/2013 | | | 912,500 |
| | |
| 1,500,000 | | Massey Energy
3.250%, 08/01/2015 | | | 990,000 |
| | |
| | | | | 1,902,500 |
| | | | | |
| Industrial-Automotive (1.6%) | | | |
| | |
| 1,500,000 | | Goodyear Tire & Rubber
10.500%, 05/15/2016 | | | 1,515,000 |
| | | | | |
| Industrial-Basic (1.0%) | | | |
| | |
| 1,000,000 | | Nalco Finance Holdings3
9.000%, 02/01/2014 | | | 980,000 |
| | | | | |
| Industrial-Capital Goods (2.0%) | | | |
| | |
| 1,000,000 | | Case New Holland
7.125%, 03/01/2014 | | | 912,500 |
| | |
| 1,000,000 | | Columbus McKinnon
8.875%, 11/01/2013 | | | 1,001,250 |
| | |
| | | | | 1,913,750 |
| | | | | |
| Industrial-Energy (11.8%) | | | |
| | |
| 1,000,000 | | Berry Petroleum
8.250%, 11/01/2016 | | | 857,500 |
| | |
| 1,000,000 | | Chesapeake Energy
2.250%, 12/15/2038 | | | 613,750 |
| | |
| 1,000,000 | | KCS Energy
7.125%, 04/01/2012 | | | 942,500 |
| | | | |
| June 30, 2009 | | 50 | | See Notes to Financial Statements |
Schedule of Investments as of June 30, 2009 (Unaudited)
Accessor High Yield Bond Fund
| | | | | |
Principal
Amount | | | | Value |
| Industrial-Energy (continued) (11.8%) | | | |
| | |
| $1,500,000 | | MarkWest Energy Partners1
6.875%, 11/01/2014 | | $ | 1,237,500 |
| | |
| 950,000 | | NRG Energy
8.500%, 06/15/2019 | | | 920,313 |
| | |
| 1,500,000 | | Parker Drilling
2.125%, 07/15/2012 | | | 1,140,000 |
| | |
| 1,000,000 | | Plains Exploration & Production
7.000%, 03/15/2017 | | | 875,000 |
| | |
| 1,000,000 | | Quicksilver Resources
7.125%, 04/01/2016 | | | 780,000 |
| | |
| 1,000,000 | | Regency Energy Partners
8.375%, 12/15/2013 | | | 965,000 |
| | |
| 1,000,000 | | SunPower
1.250%, 02/15/2027 | | | 766,250 |
| | |
| 1,500,000 | | Targa Resources Partners
8.250%, 07/01/2016 | | | 1,271,250 |
| | |
| 1,000,000 | | Western Refining1
11.250%, 06/15/2017 | | | 887,500 |
| | |
| | | | | 11,256,563 |
| | | | | |
| Industrial-Gaming (1.9%) | | | |
| | |
| 1,000,000 | | MGM Mirage1
11.125%, 11/15/2017 | | | 1,060,000 |
| | |
| 1,000,000 | | River Rock Entertainment
9.750%, 11/01/2011 | | | 750,000 |
| | |
| | | | �� | 1,810,000 |
| | | | | |
| Industrial-Health Care (5.8%) | | | |
| | |
| 1,000,000 | | Alliance HealthCare Services
7.250%, 12/15/2012 | | | 970,000 |
| | |
| 1,000,000 | | AMR HoldCo
10.000%, 02/15/2015 | | | 1,015,000 |
| | |
| 1,000,000 | | DaVita
6.625%, 03/15/2013 | | | 942,500 |
| | |
| 1,000,000 | | Healthsouth
10.750%, 06/15/2016 | | | 1,005,000 |
| | |
| 1,000,000 | | Omnicare
3.250%, 12/15/2035 | | | 692,500 |
| | |
| 1,000,000 | | Universal Hospital Services
8.500%, 06/01/2015 | | | 942,500 |
| | |
| | | | | 5,567,500 |
| | | | | |
Principal
Amount | | | | Value |
| Industrial-Media Cable (3.4%) | | | |
| | |
| $1,000,000 | | CSC Holdings
7.625%, 07/15/2018 | | $ | 926,250 |
| | |
| 1,000,000 | | DirecTV Holdings LLC
6.375%, 06/15/2015 | | | 925,000 |
| | |
| 1,500,000 | | Mediacom LLC
9.500%, 01/15/2013 | | | 1,428,750 |
| | |
| | | | | 3,280,000 |
| | | | | |
| Industrial-Media-Non-Cable (1.2%) | | | |
| | |
| 1,500,000 | | Marquee Holdings3
9.505%, 08/15/2014 | | | 1,155,000 |
| | | | | |
| Industrial-Other (14.8%) | | | |
| | |
| 1,000,000 | | Corrections Corp of America
6.250%, 03/15/2013 | | | 947,500 |
| | |
| 1,000,000 | | Domtar
10.750%, 06/01/2017 | | | 960,000 |
| | |
| 1,000,000 | | Exopack Holding
11.250%, 02/01/2014 | | | 820,000 |
| | |
| 1,000,000 | | Georgia-Pacific LLC
9.500%, 12/01/2011 | | | 1,030,000 |
| | |
| 1,000,000 | | Graham Packaging
9.875%, 10/15/2014 | | | 930,000 |
| | |
| 1,000,000 | | Graphic Packaging International
9.500%, 08/15/2013 | | | 955,000 |
| | |
| 1,500,000 | | Hertz
7.625%, 06/01/2012 | | | 1,230,000 |
| | |
| 1,000,000 | | Interface1
11.375%, 11/01/2013 | | | 1,035,000 |
| | |
| 1,250,000 | | Lennar
5.600%, 05/31/2015 | | | 984,375 |
| | |
| 1,000,000 | | Rock-Tenn
5.625%, 03/15/2013 | | | 898,750 |
| | |
| 1,000,000 | | Rockwood Specialties
7.500%, 11/15/2014 | | | 940,000 |
| | |
| 1,000,000 | | RSC Equipment Rental
9.500%, 12/01/2014 | | | 802,500 |
| | |
| 1,000,000 | | Service International
7.500%, 04/01/2027 | | | 785,000 |
| | |
| 1,000,000 | | Solo Cup
8.500%, 02/15/2014 | | | 820,000 |
| | | | |
| See Notes to Financial Statements | | 51 | | June 30, 2009 |
Schedule of Investments as of June 30, 2009 (Unaudited)
Accessor High Yield Bond Fund
| | | | | |
Principal
Amount | | | | Value |
| Industrial-Other (continued) (14.8%) | | | |
| | |
| $1,000,000 | | WMG Acquisition1
9.500%, 06/15/2016 | | $ | 995,000 |
| | |
| | | | | 14,133,125 |
| | | | | |
| Industrial-Other Consumer Cyclicals (3.5%) |
| | |
| 1,000,000 | | Carrols
9.000%, 01/15/2013 | | | 937,500 |
| | |
| 1,500,000 | | Denny’s Holdings
10.000%, 10/01/2012 | | | 1,455,000 |
| | |
| 1,000,000 | | Land O’ Lakes
8.750%, 11/15/2011 | | | 1,005,000 |
| | |
| | | | | 3,397,500 |
| | | | | |
| Industrial-Other Consumer Non-Cyclicals (1.0%) |
| | |
| 1,000,000 | | Visant Holding3
10.250%, 12/01/2013 | | | 992,500 |
| | | | | |
| Industrial-Retailers (7.3%) | | | |
| | |
| 1,000,000 | | AmeriGas Partners
7.125%, 05/20/2016 | | | 915,000 |
| | |
| 1,000,000 | | Ferrellgas Partners
8.750%, 06/15/2012 | | | 930,000 |
| | |
| 1,000,000 | | Jo-Ann Stores
7.500%, 03/01/2012 | | | 940,000 |
| | |
| 1,000,000 | | Pantry
3.000%, 11/15/2012 | | | 767,500 |
| | |
| 907,000 | | Phillips-Van Heusen
8.125%, 05/01/2013 | | | 891,127 |
| | |
| 1,000,000 | | Rite Aid
7.500%, 03/01/2017 | | | 782,500 |
| | |
| 1,000,000 | | Toys R US
7.875%, 04/15/2013 | | | 835,000 |
| | |
| 1,000,000 | | Vitamin Shoppe Industries2
8.383%, 08/15/2009 | | | 945,000 |
| | |
| | | | | 7,006,127 |
| | | | | |
| Industrial-Technology (3.1%) | | | |
| | |
| 1,000,000 | | First Data1
9.875%, 09/24/2015 | | | 710,000 |
| | |
| 1,500,000 | | Sungard Data Systems
10.250%, 08/15/2015 | | | 1,385,625 |
| | |
| 1,000,000 | | Viasystems
10.500%, 01/15/2011 | | | 890,000 |
| | |
| | | | | 2,985,625 |
| | | | | |
Principal
Amount | | | | Value |
| Industrial-Telecommunications-Wired (5.1%) |
| | |
| $1,000,000 | | Frontier Communications
9.000%, 08/15/2031 | | $ | 825,000 |
| | |
| 1,000,000 | | PAETEC Holding1
8.875%, 06/30/2017 | | | 940,000 |
| | |
| 1,000,000 | | Qwest Communications International
7.500%, 02/15/2014 | | | 912,500 |
| | |
| 1,000,000 | | Sprint Nextel
6.000%, 12/01/2016 | | | 817,500 |
| | |
| 500,000 | | Syniverse Technologies
7.750%, 08/15/2013 | | | 470,000 |
| | |
| 1,000,000 | | Windstream
7.000%, 03/15/2019 | | | 870,000 |
| | |
| | | | | 4,835,000 |
| | | | | |
| Industrial-Telecommunication-Wireless (3.0%) |
| | |
| 500,000 | | Intelsat Jackson Holdings Ltd.
9.250%, 06/15/2016 | | | 442,500 |
| | |
| 500,000 | | Intelsat Subsidiary Holding Ltd.
8.875%, 01/15/2015 | | | 482,500 |
| | |
| 1,000,000 | | MetroPCS Wireless
9.250%, 11/01/2014 | | | 993,750 |
| | |
| 1,000,000 | | Telesat Canada1
12.500%, 11/01/2017 | | | 985,000 |
| | |
| | | | | 2,903,750 |
| | | | | |
| Industrial-Transportation (1.0%) |
| | |
| 1,000,000 | | RailAmerica1
9.250%, 07/01/2017 | | | 965,000 |
| | | | | |
| Insurance (0.9%) |
| | |
| 1,000,000 | | Fairfax Financial Holdings Ltd.
7.750%, 06/15/2017 | | | 895,000 |
| | | | | |
| Media (1.4%) |
| | |
| 1,500,000 | | Liberty Media LLC
5.700%, 05/15/2013 | | | 1,297,500 |
| | | | | |
| Real Estate (1.8%) |
| | |
| 1,000,000 | | Felcor Lodging
9.000%, 06/01/2011 | | | 880,000 |
| | |
| 1,000,000 | | Host Hotels & Resorts1
2.625%, 04/15/2027 | | | 848,750 |
| | |
| | | | | 1,728,750 |
| | | | |
| June 30, 2009 | | 52 | | See Notes to Financial Statements |
Schedule of Investments as of June 30, 2009 (Unaudited)
Accessor High Yield Bond Fund
| | | | | |
Principal
Amount | | | | Value |
| Semiconductors & Semiconductor Equipment (0.5%) |
| | |
| $1,125,000 | | Conexant Systems
4.000%, 03/01/2026 | | $ | 485,156 |
| | | | | |
| Specialty Retail (1.0%) |
| | |
| 1,000,000 | | Sally Holdings LLC
9.250%, 11/15/2014 | | | 995,000 |
| | | | | |
| Textiles, Apparel & Luxury Goods (1.0%) |
| | |
| 1,000,000 | | Levi Strauss
9.750%, 01/15/2015 | | | 982,500 |
| | | | | |
| Transportation (1.0%) |
| | |
| 1,000,000 | | Kansas City Southern Railway
8.000%, 06/01/2015 | | | 930,000 |
| | | | | |
| Utilities (2.7%) |
| | |
| 1,000,000 | | AES
7.750%, 03/01/2014 | | | 947,500 |
| | |
| 1,000,000 | | Edison Mission Energy
7.200%, 05/15/2019 | | | 745,000 |
| | |
| 1,000,000 | | Suburban Propane Partners
6.875%, 12/15/2013 | | | 920,000 |
| | |
| | | | | 2,612,500 |
| | |
| | Total Corporate Bonds
(Identified Cost $91,568,838) | | | 93,863,736 |
| | |
| | Total Investments (98.0%)
(Identified Cost $91,568,838)4 | | | 93,863,736 |
| | |
| | Total Other Assets Less Liabilities
(2.0%) | | | 1,956,013 |
| | |
| | Total Net Assets (100.0%) | | $ | 95,819,749 |
1 Securities exempt from registration under Rule 144A of the Securities Act of 1933. These securities may be resold in transactions exempt from registration, normally to qualified institutional buyers. These securities have been determined to be liquid in accordance with procedures adopted by the Fund’s Board.
2 Represents an adjustable rate security. Rate disclosed is as of June 30, 2009.
3 Represents a step bond. Rate disclosed is the effective yield as of June 30, 2009.
4 See Note 6 for important tax information.
| | | | |
| See Notes to Financial Statements | | 53 | | June 30, 2009 |
Schedule of Investments as of June 30, 2009 (Unaudited)
Accessor Investment Grade Fixed-Income Fund
| | | | | |
Principal
Amount | | | | Value |
| |
| ASSET BACKED SECURITIES (6.4%) | | | |
| $85,925,761 | | Bear Stearns Commercial Mortgage Securities1,2,4
0.270%, 11/11/2041 | | $ | 1,040,105 |
| | |
| 20,153,044 | | Captec Franchise Trust1,2,4,7
0.926%, 10/25/2018 | | | 280,542 |
| | |
| 1,060,000 | | CBC Insurance Revenue Securitization LLC2,7
8.880%, 02/15/2023 | | | 921,882 |
| | |
| 385,000 | | CDO Repack SPC Ltd.2,7
7.110%, 05/20/2030 | | | 155,039 |
| | |
| 715,324 | | CDO Repackaging Trust Series1,2,7
2.931%, 01/17/2036 | | | 346,036 |
| | |
| 350,929 | | Centex Home Equity Company, LLC1,2,7
3.814%, 07/25/2034 | | | 44,708 |
| | |
| 12,320,689 | | CNL Funding1,2,4,7
1.477%, 09/18/2012 | | | 284,608 |
| | |
| 910,000 | | Commercial Industrial Finance1,2,7
4.668%, 03/01/2021 | | | 53,781 |
| | |
| 98,496 | | Countrywide Home Loan Mortgage Pass Through Trust
5.250%, 12/25/2009 | | | 98,762 |
| | |
| 9,153,692 | | Falcon Franchise Loan1,2,4,7
3.604%, 06/05/2020 | | | 856,786 |
| | |
| 236,282 | | Falcon Franchise Loan2,7
6.067%, 01/05/2023 | | | 253,531 |
| | |
| 548,523 | | Falcon Franchise Loan2
4.856%, 01/05/2025 | | | 461,869 |
| | |
| 250,000 | | Falcon Franchise Loan2,7
7.074%, 01/05/2025 | | | 85,625 |
| | |
| 3,325,560 | | Falcon Franchise1,2,4,7
3.317%, 01/05/2023 | | | 232,457 |
| | |
| 236,853 | | Home Equity Mortgage Trust3
5.367%, 07/25/2036 | | | 46,388 |
| | |
| 1,711,957 | | Luxembourg Fund Holdings of KODIAK Currency1,2,7
2.486%, 08/07/2037 | | | 34,024 |
| | |
| 947,994 | | Orion Ltd. CDO1,2,7
3.823%, 09/10/2046 | | | 18,836 |
| | |
| 2,150,000 | | Restructured Asset Securities1,2,7
2.278%, 01/29/2022 | | | 549,245 |
| | |
| | | | | 5,764,224 |
| | |
| | Total Asset Backed Securities
(Identified Cost $15,503,725) | | | 5,764,224 |
| | | | | |
Principal
Amount | | | | Value |
|
| COLLATERALIZED MORTGAGE OBLIGATIONS (46.5%) |
| $ 230,533 | | Attentus CDO Ltd.2,7
9.532%, 10/11/2042 | | $ | 2,490 |
| | |
| 1,000,000 | | Banc of America Large Loan1,2
3.319%, 03/15/2022 | | | 268,659 |
| | |
| 1,000,000 | | Banc of America SST2
6.274%, 10/11/2033 | | | 812,836 |
| | |
| 1,717,887 | | Capco America Securitization Corp.1
2.499%, 10/15/2030 | | | 1,154 |
| | |
| 12,782 | | Collateralized Mortgage Securities
9.450%, 02/01/2017 | | | 13,988 |
| | |
| 870,000 | | Commercial Mortgage1,2
7.197%, 02/14/2034 | | | 717,246 |
| | |
| 1,040,480 | | Countrywide Alternative Loan Trust
6.000%, 05/25/2036 | | | 546,090 |
| | |
| 611,000 | | Entertainment Properties Trust2
6.223%, 02/15/2018 | | | 380,194 |
| | |
| 34,183 | | FHLMC — Gold
5.500%, 06/01/2038 | | | 35,334 |
| | |
| 805,378 | | FHLMC — Gold
5.500%, 07/01/2038 | | | 832,507 |
| | |
| 546,626 | | FHLMC
4.500%, 03/15/2019 | | | 565,851 |
| | |
| 691,728 | | FHLMC
6.000%, 02/15/2034 | | | 719,857 |
| | |
| 1,720,000 | | FHLMC
5.500%, 10/15/2034 | | | 1,730,086 |
| | |
| 1,955,469 | | FNMA
5.580%, 06/01/2011 | | | 2,052,897 |
| | |
| 121,965 | | FNMA
6.000%, 09/01/2022 | | | 128,928 |
| | |
| 239,086 | | FNMA
5.500%, 02/01/2023 | | | 250,727 |
| | |
| 489,922 | | FNMA
5.500%, 10/01/2023 | | | 513,365 |
| | |
| 270,992 | | FNMA
5.500%, 11/01/2023 | | | 283,959 |
| | |
| 2,271,000 | | FNMA
5.500%, 11/25/2032 | | | 2,378,488 |
| | |
| 584,498 | | FNMA
6.000%, 03/01/2033 | | | 611,055 |
| | | | |
| June 30, 2009 | | 54 | | See Notes to Financial Statements |
Schedule of Investments as of June 30, 2009 (Unaudited)
Accessor Investment Grade Fixed-Income Fund
| | | | | |
Principal
Amount | | | | Value |
| $ 305,331 | | FNMA1
3.950%, 05/01/2034 | | $ | 314,196 |
| | |
| 1,373,296 | | FNMA1
0.962%, 02/25/2035 | | | 6,940 |
| | |
| 15,901 | | FNMA
5.500%, 06/01/2036 | | | 16,448 |
| | |
| 38,392 | | FNMA
6.000%, 04/01/2037 | | | 40,180 |
| | |
| 941,645 | | FNMA
6.000%, 06/01/2037 | | | 985,509 |
| | |
| 755,124 | | FNMA
5.500%, 08/01/2037 | | | 780,602 |
| | |
| 940,279 | | FNMA
6.000%, 09/01/2037 | | | 984,960 |
| | |
| 817,474 | | FNMA
6.000%, 10/01/2037 | | | 855,554 |
| | |
| 933,088 | | FNMA
6.000%, 10/01/2037 | | | 976,553 |
| | |
| 939,412 | | FNMA
6.000%, 11/01/2037 | | | 983,172 |
| | |
| 83,834 | | FNMA
6.000%, 02/01/2038 | | | 87,721 |
| | |
| 925,203 | | FNMA
5.500%, 03/01/2038 | | | 956,367 |
| | |
| 2,375,111 | | FNMA
5.500%, 05/01/2038 | | | 2,455,114 |
| | |
| 947,404 | | FNMA
6.000%, 09/01/2038 | | | 991,334 |
| | |
| 897,830 | | FNMA
6.000%, 09/01/2038 | | | 939,462 |
| | |
| 439,533 | | FNMA
6.000%, 11/01/2038 | | | 459,914 |
| | |
| 369,219 | | FNMA
6.000%, 11/01/2038 | | | 386,340 |
| | |
| 642,705 | | FNMA
5.500%, 02/01/2039 | | | 664,354 |
| | |
| 1,831,585 | | FNMA
4.000%, 06/01/2039 | | | 1,775,345 |
| | |
| 668,415 | | FNMA
4.000%, 06/01/2039 | | | 647,891 |
| | |
| 42,481,953 | | FNMA1,4
0.000%, 06/17/2040 | | | 5,854 |
| | | | | |
Principal
Amount | | | | Value |
| $ 1,530,000 | | GMAC Mortgage Corp. Loan Trust1
4.291%, 12/19/2033 | | $ | 1,455,492 |
| | |
| 13,751,250 | | GNMA TRUST IO1,4
0.640%, 01/16/2042 | | | 259,479 |
| | |
| 136,995 | | GNMA
3.360%, 08/16/2022 | | | 137,678 |
| | |
| 1,635,422 | | GNMA
6.000%, 12/15/2037 | | | 1,705,886 |
| | |
| 1,809,204 | | GNMA
6.000%, 08/15/2038 | | | 1,886,873 |
| | |
| 742,699 | | GNMA
6.000%, 11/15/2038 | | | 773,263 |
| | |
| 12,607,846 | | GNMA1
0.417%, 08/16/2043 | | | 186,751 |
| | |
| 877,041 | | Government Lease Trust2
4.000%, 05/18/2011 | | | 906,031 |
| | |
| 10,590 | | Harborview Mortgage Loan Trust1
1.070%, 06/19/2034 | | | 4,810 |
| | |
| 551,219 | | JP Morgan Commercial Mortgage Securities
4.475%, 07/15/2041 | | | 549,051 |
| | |
| 2,839,176 | | LB Commercial Conduit Mortgage Trust1,4
0.900%, 10/25/2026 | | | 1,400 |
| | |
| 1,014,000 | | LB-UBS Commercial Mortgage Trust1
4.333%, 02/15/2037 | | | 586,060 |
| | |
| 282,835,992 | | LB-UBS Commercial Mortgage Trust1,2
0.043%, 06/15/2038 | | | 280,602 |
| | |
| 250,000 | | LNR CDO Ltd.7
6.000%, 02/28/2043 | | | 4,992 |
| | |
| 1,298,453 | | Marathon Structured Finance CDO Ltd.1,2,7
4.492%, 07/26/2046 | | | 798,938 |
| | |
| 19,265,711 | | Merrill Lynch Mortgage Investments1,4
0.756%, 11/15/2026 | | | 518,932 |
| | |
| 1,000,000 | | Morgan Stanley Capital I1,2
7.151%, 06/03/2030 | | | 560,000 |
| | |
| 650,000 | | Preferred Term Securities XIII Ltd.1,2
2.184%, 03/24/2034 | | | 78,000 |
| | |
| 128,721,363 | | Salomon Brothers Mortgage Securities VII1,2
1.133%, 11/13/2011 | | | 2,059,323 |
| | | | |
| See Notes to Financial Statements | | 55 | | June 30, 2009 |
Schedule of Investments as of June 30, 2009 (Unaudited)
Accessor Investment Grade Fixed-Income Fund
| | | | | |
Principal
Amount | | | | Value |
| $1,907,680 | | Washington Mutual1
5.613%, 01/25/2036 | | $ | 705,536 |
| | |
| | | | | 41,618,618 |
| | |
| | Total Collateralized Mortgage Obligations
(Identified Cost $50,153,186) | | | 41,618,618 |
| |
| CORPORATE BONDS (35.0%) | | | |
| Diversified Financial Services (2.4%) | | | |
| | |
| 500,000 | | General Electric Capital
5.720%, 08/22/2011 | | | 504,754 |
| | |
| 725,000 | | General Electric Capital
6.900%, 09/15/2015 | | | 726,737 |
| | |
| 400,000 | | General Electric Capital
5.400%, 02/15/2017 | | | 387,286 |
| | |
| 600,000 | | General Electric Capital
6.150%, 08/07/2037 | | | 494,226 |
| | |
| | | | | 2,113,003 |
| | | | | |
| Electric Utilities (3.5%) | | | |
| | |
| 1,200,000 | | Dominion Resources1
1.664%, 06/17/2010 | | | 1,194,154 |
| | |
| 1,000,000 | | FPL Group Capital1
1.494%, 06/17/2011 | | | 1,010,291 |
| | |
| 766,722 | | MP Environmental Funding LLC7
4.982%, 07/15/2014 | | | 916,079 |
| | |
| | | | | 3,120,524 |
| | | | | |
| Finance-Banking (16.1%) | | | |
| | |
| 1,700,000 | | American General Finance
5.375%, 09/01/2009 | | | 1,648,568 |
| | |
| 600,000 | | Bank of America
5.750%, 12/01/2017 | | | 534,257 |
| | |
| 800,000 | | Bank of America
5.650%, 05/01/2018 | | | 706,905 |
| | |
| 1,800,000 | | Bank of America5
8.846%, 07/17/2028 | | | 235,283 |
| | |
| 810,000 | | Centura Capital Trust2
8.845%, 06/01/2027 | | | 631,912 |
| | |
| 3,000,000 | | Citigroup
6.125%, 11/21/2017 | | | 2,630,283 |
| | |
| 240,000 | | Colonial Bank NA Montgomery
9.375%, 06/01/2011 | | | 170,618 |
| | | | | |
Principal
Amount | | | | Value |
| $ 500,000 | | Goldman Sachs Group
6.250%, 09/01/2017 | | $ | 495,493 |
| | |
| 1,000,000 | | Goldman Sachs Group
5.950%, 01/18/2018 | | | 969,959 |
| | |
| 1,300,000 | | HSBC Holdings PLC
6.800%, 06/01/2038 | | | 1,306,452 |
| | |
| 200,000 | | HSBC1
2.013%, 09/29/2049 | | | 93,000 |
| | |
| 500,000 | | JPMorgan Chase Bank1
0.959%, 06/13/2016 | | | 407,612 |
| | |
| 1,000,000 | | M&T Trust1,2
2.097%, 04/01/2013 | | | 785,987 |
| | |
| 800,000 | | Morgan Stanley1
0.848%, 01/09/2014 | | | 718,226 |
| | |
| 200,000 | | Royal Bank of Scotland Group PLC
5.000%, 10/01/2014 | | | 159,882 |
| | |
| 100,000 | | Royal Bank of Scotland Group PLC1,9
7.648%, 08/31/2049 | | | 49,500 |
| | |
| 300,000 | | SLM1
1.322%, 10/25/2011 | | | 243,070 |
| | |
| 700,000 | | Wachovia Bank1
1.806%, 05/14/2010 | | | 700,041 |
| | |
| 1,500,000 | | Wachovia Bank
4.800%, 11/01/2014 | | | 1,453,819 |
| | |
| 400,000 | | Wachovia Bank1
0.959%, 03/15/2016 | | | 315,780 |
| | |
| 100,000 | | Wachovia
5.300%, 10/15/2011 | | | 104,210 |
| | |
| | | | | 14,360,857 |
| | | | | |
| Finance-Broker Related (Brokerage) (3.4%) |
| | |
| 300,000 | | Goldman Sachs Group
6.150%, 04/01/2018 | | | 292,073 |
| | |
| 270,000 | | Jefferies Group
6.250%, 01/15/2036 | | | 186,266 |
| | |
| 900,000 | | JPMorgan Chase
5.375%, 10/01/2012 | | | 942,547 |
| | |
| 695,000 | | Lehman Brothers Holdings6
5.750%, 04/25/2011 | | | 102,512 |
| | |
| 1,300,000 | | Lehman Brothers Holdings6
6.875%, 05/02/2018 | | | 208,000 |
| | | | |
| June 30, 2009 | | 56 | | See Notes to Financial Statements |
Schedule of Investments as of June 30, 2009 (Unaudited)
Accessor Investment Grade Fixed-Income Fund
| | | | | |
Principal
Amount | | | | Value |
| Finance-Broker Related (Brokerage) (continued) (3.4%) |
| | |
| $ 200,000 | | Morgan Stanley
6.750%, 04/15/2011 | | $ | 209,514 |
| | |
| 1,100,000 | | Morgan Stanley
6.625%, 04/01/2018 | | | 1,096,597 |
| | |
| | | | | 3,037,509 |
| | | | | |
| Finance-Other (2.0%) | | | |
| | |
| 1,400,000 | | American Express Credit
5.875%, 05/02/2013 | | | 1,390,156 |
| | |
| 250,000 | | NLV Financial2
7.500%, 08/15/2033 | | | 188,012 |
| | |
| 1,000,000 | | Regional Diversified Funding 1,2,7
2.412%, 01/25/2036 | | | 241,300 |
| | |
| | | | | 1,819,468 |
| | | | | |
| Financial (1.0%) | | | |
| | |
| 200,000 | | Citigroup
8.500%, 05/22/2019 | | | 203,448 |
| | |
| 800,000 | | Morgan Stanley1
1.611%, 07/15/2009 | | | 685,553 |
| | |
| | | | | 889,001 |
| | | | | |
| Industrial-Capital Goods (1.0%) | | | |
| | |
| 1,000,000 | | Eaton
6.500%, 06/01/2025 | | | 928,750 |
| | | | | |
| Industrial-Energy (1.6%) | | | |
| | |
| 700,000 | | Suncor Energy
6.850%, 06/01/2039 | | | 688,316 |
| | |
| 750,000 | | Sunoco
9.000%, 11/01/2024 | | | 769,798 |
| | |
| | | | | 1,458,114 |
| | | | | |
| Industrial-Other (1.4%) | | | |
| | |
| 1,300,000 | | Barnett Capital III1
1.653%, 02/01/2027 | | | 689,688 |
| | |
| 1,625,000 | | Canal Pointe LLC1,2,7
4.048%, 06/25/2014 | | | 544,375 |
| | |
| | | | | 1,234,063 |
| | | | | |
| Industrial-Telecommunications-Wired (1.3%) |
| | |
| 1,000,000 | | AT&T
8.000%, 11/15/2031 | | | 1,154,181 |
| | | | | |
Principal
Amount | | | | Value |
| Insurance (0.5%) | | | |
| | |
| $ 200,000 | | International Lease Finance
5.750%, 06/15/2011 | | $ | 165,852 |
| | |
| 400,000 | | International Lease Finance1
1.489%, 07/13/2012 | | | 288,382 |
| | |
| | | | | 454,234 |
| | | | | |
| Utilities (0.8%) | | | |
| | |
| 700,000 | | Entergy Arkansas
4.500%, 06/01/2010 | | | 709,090 |
| | |
| | Total Corporate Bonds
(Identified Cost $34,898,196) | | | 31,278,794 |
| |
| MUNICIPAL BONDS (4.8%) | | | |
| 1,000,000 | | Chicago Transit Authority
6.899%, 12/01/2040 | | | 1,069,570 |
| | |
| 1,100,000 | | Chicago Transit Authority
6.899%, 12/01/2040 | | | 1,176,527 |
| | |
| 900,000 | | Florida State Turnpike Authority
6.800%, 07/01/2039 | | | 907,767 |
| | |
| 250,000 | | Fort Walton Defense Housing5
5.208%, 10/15/2009 | | | 247,658 |
| | |
| 900,000 | | Port Authority of New York & New Jersey
5.859%, 12/01/2024 | | | 921,465 |
| | |
| | | | | 4,322,987 |
| | |
| | Total Municipal Bonds
(Identified Cost $4,143,441) | | | 4,322,987 |
|
| U.S. GOVERNMENT AND AGENCY SECURITIES (9.0%) |
| Department of Housing & Urban Development (HUD) (0.3%) |
| | |
| 295,000 | | HUD
6.330%, 08/01/2013 | | | 295,676 |
| | | | | |
| Federal Home Loan Mortgage Corp (FHLMC) (1.7%) |
| | |
| 1,825,000 | | FHLMC5
6.750%, 09/15/2014 | | | 1,499,936 |
| | |
| 7,747 | | FHLMC1
7.000%, 01/15/2037 | | | 6,625 |
| | |
| | | | | 1,506,561 |
| | | | | |
| Federal Home Loan Mortgage Corp (FHLMC) — Discount Note (0.2%) |
| | |
| 137,000 | | FHLMC5
0.280%, 11/23/2009 | | | 136,873 |
| | | | |
| See Notes to Financial Statements | | 57 | | June 30, 2009 |
Schedule of Investments as of June 30, 2009 (Unaudited)
Accessor Investment Grade Fixed-Income Fund
| | | | | |
Principal
Amount | | | | Value |
|
|
| Federal National Mortgage Association (FNMA) (1.1%) |
| | |
| $ 450,000 | | FNMA
5.500%, 07/30/2025 | | $ | 445,531 |
| | |
| 500,000 | | FNMA
6.000%, 07/25/2033 | | | 525,288 |
| | |
| | | | | 970,819 |
| | | | | |
| Federal National Mortgage Association (FNMA) — Discount Note (0.6%) |
| | |
| 400,000 | | FNMA 5
0.025%, 07/21/2009 | | | 399,980 |
| | |
| 181,000 | | FNMA5
0.081%, 11/18/2009 | | | 180,839 |
| | |
| | | | | 580,819 |
| | | | | |
| Small Business Administration-Pass-Through-Agency (SBA) (1.0%) |
| | |
| 900,200 | | SBA
4.640%, 05/01/2023 | | | 927,501 |
| | | | | |
| U.S. Treasury Bonds & Notes (4.1%) | | | |
| | |
| 59,000 | | U.S. Treasury Note11
0.875%, 04/30/2011 | | | 58,827 |
| | |
| 36 | | U.S. Treasury STRIP5,8
0.000%, 11/15/2017 | | | 26 |
| | |
| 226,254 | | United States Treasury Inflation Indexed Bonds
2.000%, 07/15/2014 | | | 231,557 |
| | |
| 422,960 | | United States Treasury Inflation Indexed Bonds
2.375%, 01/15/2017 | | | 441,333 |
| | |
| 1,887,080 | | United States Treasury Inflation Indexed Bonds
2.125%, 01/15/2019 | | | 1,948,999 |
| | |
| 429,752 | | United States Treasury Inflation Indexed Bonds
2.000%, 01/15/2026 | | | 420,754 |
| | |
| 496,600 | | United States Treasury Inflation Indexed Bonds
2.500%, 01/15/2029 | | | 527,637 |
| | |
| | | | | 3,629,133 |
| | |
| | Total U.S. Government and Agency Securities
(Identified Cost $8,292,151) | | | 8,047,382 |
| | |
| | Total Investments (101.7%) (Identified Cost $112,990,699)10 | | $ | 91,032,005 |
| | | | | | |
Contracts | | | | Value | |
| |
| WRITTEN OPTIONS (-0.0%) | | | | |
| 8 | | CME APUT Euro
Expires September 2009,
Strike Price $98.50 Put | | $ | (350 | ) |
| | |
| | Total Written Options
(Identified Proceeds $1,815) | | | (350 | ) |
| | |
| | Total Liabilities Less Other Assets
(-1.7%) | | | (1,538,721 | ) |
| | |
| | Total Net Assets (100.0%) | | $ | 89,492,934 | |
Principal
Amount | | | | | |
| |
| FORWARD COMMITMENT | | | | |
TBA Purchase Commitments at June 30, 2009
(Cost Payable $13,388,281) (15.1%) | |
| | |
| $ 2,000,000 | | FNMA
5.500%, 07/01/2022 | | | 2,092,500 | |
| | |
| 2,000,000 | | FNMA
5.500%, 07/01/2022 | | | 2,092,500 | |
| | |
| 500,000 | | FNMA
4.000%, 08/13/2039 | | | 482,969 | |
| | |
| 8,500,000 | | GNMA
6.000%, 07/21/2038 | | | 8,853,277 | |
| | |
| | | | $ | 13,521,246 | |
| | | | | | |
TBA Sale Commitments at June 30, 2009
(Proceeds Receivable $5,127,746) (-5.8%) | |
| | |
| (1,000,000) | | FNMA
6.000%, 07/01/2037 | | | (1,045,000 | ) |
| | |
| (1,000,000) | | FNMA
6.000%, 07/01/2037 | | | (1,045,000 | ) |
| | |
| (3,000,000) | | FNMA
5.500%, 07/14/2038 | | | (2,064,376 | ) |
| | |
| (1,000,000) | | FNMA
5.500%, 07/14/2038 | | | (1,032,188 | ) |
| | |
| | | | $ | (5,186,564 | ) |
1 Represents a variable or increasing rate security. Rate disclosed is as of June 30, 2009.
2 Securities exempt from registration under Rule 144A of the Securities Act of 1933. These securities may be resold in transactions exempt from registration, normally to qualified institutional buyers. These securities have been determined to be liquid in accordance with procedures adopted by the Fund’s Board.
| | | | |
| June 30, 2009 | | 58 | | See Notes to Financial Statements |
Schedule of Investments as of June 30, 2009 (Unaudited)
Accessor Investment Grade Fixed-Income Fund
3 Represents a step bond. Rate disclosed is the effective yield as of June 30, 2009.
4 Interest only security.
5 Represents a zero coupon bond. Rate disclosed is the effective yield as of June 30, 2009.
6 Security in default on interest payments.
7 Fair Valued security under procedures established by the Fund’s Board of Trustees.
8 Principal only security.
9 Perpetual Maturity date.
10 See Note 6 for important tax information.
11 Security, or a portion of, has been pledged as collateral for futures contracts.
CDO — Collateralized Debt Obligation
STRIP — Separate Trading of Registered Interest and Principal of Securities
OUTSTANDING FUTURES CONTRACTS
| | | | | | | | | |
| Type | | Expiration | | Contracts | | Units Per
Contract | | Unrealized
Appreciation/
(Depreciation) |
| 90 Day Euro Future (Buy) | | 03/15/10 | | 132 | | 2,500 | | $ | 439,726 |
| 90 Day Euro Future (Buy) | | 12/17/09 | | 150 | | 2,500 | | | 134,225 |
| 90 Day Euro Future (Buy) | | 06/14/10 | | 20 | | 2,500 | | | (7,217) |
| U.S. 10 Year Treasury Note Future (Buy) | | 09/22/09 | | 48 | | 1,000 | | | (23,734) |
| U.S. 2 Year Treasury Note Future (Buy) | | 10/01/09 | | 3 | | 2,000 | | | (1,828) |
| U.S. 5 Year Treasury Note Future (Buy) | | 09/22/09 | | 18 | | 1,000 | | | (35,155) |
| | | | |
| | | | | | | | $ | 506,017 |
| | | | |
| See Notes to Financial Statements | | 59 | | June 30, 2009 |
Schedule of Investments as of June 30, 2009 (Unaudited)
Accessor Mortgage Securities Fund
| | | | | |
Principal Amount | | | | Value |
| |
| ASSET BACKED SECURITIES (0.4%) | | | |
| $171,609 | | JP Morgan Mortgage Acquisition1
0.374%, 03/25/2047 | | $ | 123,227 |
| | |
| 126,937 | | Merrill Lynch First Franklin Mortgage Loan Trust1
0.434%, 04/25/2037 | | | 104,805 |
| | |
| | | | | 228,032 |
| | |
| | Total Asset Backed Securities
(Identified Cost $283,972) | | | 228,032 |
| |
| PROJECT LOANS (0.0%) | | | |
| 2,342 | | Merrill Lynch 422
7.430%, 09/01/2022 | | | 2,356 |
| | |
| | Total Project Loans
(Identified Cost $2,411) | | | 2,356 |
|
| COLLATERALIZED MORTGAGE OBLIGATIONS (90.0%) |
| Collateralized Mortgage Obligation — Other (11.8%) |
| | |
| 152,878 | | Banc of America Alternative Loan Trust (2003-10 6A2)
5.500%, 12/25/2018 | | | 144,709 |
| | |
| 213,182 | | Banc of America Alternative Loan Trust (2004-3 4A1)
5.000%, 04/25/2019 | | | 188,600 |
| | |
| 398,582 | | Bear Stearns Adjustable Rate Mortgage Trust1
4.767%, 12/25/2035 | | | 308,103 |
| | |
| 153,921 | | Countrywide Alternative Loan Trust
6.000%, 02/25/2017 | | | 150,602 |
| | |
| 78,579 | | Countrywide Alternative Loan Trust
5.000%, 07/25/2018 | | | 75,019 |
| | |
| 88,573 | | Countrywide Alternative Loan Trust
5.000%, 01/25/2020 | | | 78,359 |
| | |
| 399,226 | | Countrywide Alternative Loan Trust
5.500%, 01/25/2035 | | | 303,772 |
| | |
| 133,308 | | Countrywide Alternative Loan Trust
5.250%, 03/25/2035 | | | 99,902 |
| | |
| 581,020 | | Countrywide Alternative Loan Trust
5.500%, 07/25/2035 | | | 373,123 |
| | |
| 397,002 | | Countrywide Alternative Loan Trust
5.500%, 02/25/2036 | | | 298,620 |
| | |
| 347,275 | | Countrywide Alternative Loan Trust
5.750%, 03/25/2037 | | | 234,956 |
| | | | | |
Principal Amount | | | | Value |
|
|
| $ 256,498 | | Countrywide Home Loan Mortgage Pass Through Trust1
5.018%, 05/20/2034 | | $ | 176,110 |
| | |
| 567,013 | | Deutsche ALT-A Securities Alternate Loan Trust1
0.814%, 02/25/2035 | | | 286,500 |
| | |
| 151,177 | | First Horizon Alternative Mortgage Securities
5.500%, 03/25/2035 | | | 124,653 |
| | |
| 418,288 | | GSR Mortgage Loan Trust1
5.171%, 10/25/2035 | | | 297,983 |
| | |
| 872,043 | | GSR Mortgage Loan Trust1
5.176%, 01/25/2036 | | | 584,730 |
| | |
| 187,122 | | GSR Mortgage Loan Trust
5.750%, 02/25/2036 | | | 170,147 |
| | |
| 279,375 | | GSR Mortgage Loan Trust1
0.504%, 08/25/2046 | | | 171,813 |
| | |
| 331,927 | | Indymac INDA Mortgage Loan Trust1
5.947%, 03/25/2037 | | | 198,075 |
| | |
| 214,138 | | JP Morgan Mortgage Trust
5.500%, 12/25/2019 | | | 202,695 |
| | |
| 182,440 | | Lehman Mortgage Trust
5.500%, 12/25/2035 | | | 137,855 |
| | |
| 281,999 | | Residential Accredit Loans
5.500%, 12/25/2017 | | | 264,110 |
| | |
| 184,461 | | Residential Accredit Loans
5.000%, 03/25/2019 | | | 168,724 |
| | |
| 401,346 | | Residential Accredit Loans
5.500%, 04/25/2035 | | | 296,766 |
| | |
| 460,000 | | Residential Funding Mortgage Securities I
5.250%, 07/25/2035 | | | 279,490 |
| | |
| 167,218 | | Residential Funding Mortgage Securities I
6.000%, 02/25/2037 | | | 142,207 |
| | |
| 1,742,907 | | Wells Fargo Alternative Loan Trust
6.000%, 06/25/2037 | | | 1,089,045 |
| | |
| | | | | 6,846,668 |
| | | | | |
| Federal Home Loan Mortgage Corp (FHLMC) (1.9%) |
| | |
| 252,591 | | FHLMC1
4.673%, 03/01/2038 | | | 257,157 |
| | |
| 456,029 | | FHLMC1
5.145%, 03/01/2038 | | | 472,921 |
| | | | |
| June 30, 2009 | | 60 | | See Notes to Financial Statements |
Schedule of Investments as of June 30, 2009 (Unaudited)
Accessor Mortgage Securities Fund
| | | | | |
Principal Amount | | | | Value |
| Federal Home Loan Mortgage Corp (FHLMC) (continued) (1.9%) |
| | |
| $ 349,398 | | FHLMC1
5.177%, 07/01/2038 | | $ | 363,530 |
| | |
| | | | | 1,093,608 |
| | | | | |
| Federal Home Loan Mortgage Corp (FHLMC)-Pass-Through- Agency (9.8%) |
| | |
| 9,714 | | FHLMC - Gold
7.500%, 09/01/2014 | | | 10,336 |
| | |
| 227 | | FHLMC - Gold
7.000%, 06/01/2015 | | | 242 |
| | |
| 2,826 | | FHLMC - Gold
8.000%, 07/01/2024 | | | 3,124 |
| | |
| 33,523 | | FHLMC - Gold
8.000%, 07/01/2024 | | | 37,049 |
| | |
| 413 | | FHLMC - Gold
8.000%, 07/01/2024 | | | 456 |
| | |
| 2,073 | | FHLMC - Gold
8.000%, 08/01/2024 | | | 2,291 |
| | |
| 26,789 | | FHLMC - Gold
8.000%, 07/01/2025 | | | 29,589 |
| | |
| 264 | | FHLMC - Gold
8.000%, 09/01/2025 | | | 293 |
| | |
| 890 | | FHLMC - Gold
8.000%, 11/01/2025 | | | 985 |
| | |
| 3,660 | | FHLMC - Gold
8.000%, 12/01/2025 | | | 4,042 |
| | |
| 339 | | FHLMC - Gold
8.000%, 01/01/2026 | | | 376 |
| | |
| 6,734 | | FHLMC - Gold
8.000%, 06/01/2026 | | | 7,458 |
| | |
| 18,159 | | FHLMC - Gold
5.500%, 01/01/2029 | | | 18,868 |
| | |
| 1,857,759 | | FHLMC - Gold
4.500%, 03/01/2029 | | | 1,871,375 |
| | |
| 1,354,053 | | FHLMC - Gold
5.000%, 09/01/2033 | | | 1,384,678 |
| | |
| 1,856,731 | | FHLMC - Gold
5.500%, 08/01/2038 | | | 1,919,273 |
| | |
| 395,000 | | FHLMC - Gold
4.500%, 07/01/2039 | | | 393,700 |
| | |
| | | | | 5,684,135 |
| | | | | |
Principal Amount | | | | Value |
| Federal National Mortgage Association (FNMA)- Pass-Through-Agency (65.3%) |
| | |
| $ 55,197 | | FNMA
7.500%, 09/01/2029 | | $ | 60,132 |
| | |
| 6,406 | | FNMA
7.500%, 12/01/2031 | | | 6,993 |
| | |
| 14,962,545 | | FNMA
5.500%, 02/01/2033 | | | 15,539,859 |
| | |
| 3,467,402 | | FNMA
5.000%, 11/01/2033 | | | 3,547,464 |
| | |
| 859,676 | | FNMA
5.000%, 03/01/2034 | | | 879,522 |
| | |
| 235,332 | | FNMA
5.000%, 08/01/2034 | | | 240,335 |
| | |
| 77,202 | | FNMA
5.000%, 08/01/2034 | | | 78,984 |
| | |
| 604,134 | | FNMA
5.000%, 10/01/2034 | | | 618,081 |
| | |
| 343,689 | | FNMA
5.000%, 12/01/2034 | | | 351,623 |
| | |
| 3,512,748 | | FNMA
5.500%, 03/01/2035 | | | 3,642,795 |
| | |
| 1,129,777 | | FNMA
5.000%, 12/01/2035 | | | 1,154,977 |
| | |
| 2,733,062 | | FNMA
5.000%, 02/01/2036 | | | 2,792,313 |
| | |
| 280,525 | | FNMA
6.000%, 03/01/2036 | | | 293,855 |
| | |
| 951,314 | | FNMA
6.000%, 01/01/2037 | | | 996,520 |
| | |
| 167,474 | | FNMA
6.000%, 01/01/2037 | | | 175,433 |
| | |
| 1,450,000 | | FNMA
6.000%, 10/01/2037 | | | 1,517,544 |
| | |
| 1,040,895 | | FNMA
6.000%, 12/01/2037 | | | 1,089,382 |
| | |
| 335,478 | | FNMA1
4.467%, 06/01/2038 | | | 340,668 |
| | |
| 402,351 | | FNMA1
5.160%, 07/01/2038 | | | 418,726 |
| | |
| 338,595 | | FNMA1
4.837%, 08/01/2038 | | | 350,688 |
| | | | |
| See Notes to Financial Statements | | 61 | | June 30, 2009 |
Schedule of Investments as of June 30, 2009 (Unaudited)
Accessor Mortgage Securities Fund
| | | | | |
Principal Amount | | | | Value |
| Federal National Mortgage Association (FNMA)- Pass-Through-Agency (continued) (65.3%) |
| | |
| $ 435,550 | | FNMA1
5.319%, 08/01/2038 | | $ | 454,718 |
| | |
| 20,722 | | FNMA
5.500%, 12/01/2038 | | | 21,420 |
| | |
| 24,648 | | FNMA
4.500%, 02/01/2039 | | | 24,631 |
| | |
| 1,830,026 | | FNMA
6.000%, 04/01/2039 | | | 1,914,701 |
| | |
| 164,697 | | FNMA
4.500%, 05/01/2039 | | | 164,567 |
| | |
| 240,000 | | FNMA
4.500%, 06/01/2039 | | | 239,810 |
| | |
| 65,000 | | FNMA
4.500%, 06/01/2039 | | | 64,949 |
| | |
| 385,000 | | FNMA
4.500%, 06/01/2039 | | | 384,695 |
| | |
| 50,000 | | FNMA
4.500%, 06/01/2039 | | | 49,960 |
| | |
| 195,000 | | FNMA
4.500%, 06/01/2039 | | | 194,846 |
| | |
| 80,000 | | FNMA
4.500%, 07/01/2039 | | | 79,937 |
| | |
| | | | | 37,690,128 |
| | | | | |
| Federal National Mortgage Corp (FNMA) (0.8%) |
| | |
| 827,460 | | FNMA1,3
5.000%, 10/01/2036 | | | 133,049 |
| | |
| 299,154 | | FNMA4
0.000%, 06/25/2039 | | | 244,893 |
| | |
| 593,476 | | FNMA1,3
5.500%, 05/01/2037 | | | 86,809 |
| | |
| | | | | 464,751 |
| | | | | |
| Government National Mortgage Association (GNMA) (0.2%) |
| | |
| 909,155 | | GNMA1,3
6.082%, 01/16/2038 | | | 100,337 |
| | | | | |
| Government National Mortgage Association (GNMA)-Pass- Through-Agency (0.2%) |
| | |
| 35,232 | | GNMA
5.500%, 04/15/2014 | | | 36,881 |
| | |
| 3,171 | | GNMA
6.500%, 08/15/2014 | | | 3,387 |
| | | | | |
Principal Amount | | | | Value |
| | | | |
| | |
| $ 1,151 | | GNMA
8.000%, 03/15/2017 | | $ | 1,234 |
| | |
| 19,273 | | GNMA
6.500%, 12/15/2023 | | | 20,482 |
| | |
| 35,420 | | GNMA
8.000%, 09/20/2026 | | | 38,929 |
| | |
| 3,742 | | GNMA
7.500%, 10/15/2029 | | | 4,107 |
| | |
| | | | | 105,020 |
| | |
| | Total Collateralized Mortgage Obligations
(Identified Cost $53,014,910) | | | 51,984,647 |
| | |
| | Total Investments (90.4%)
(Identified Cost $53,301,293)5 | | | 52,215,035 |
| | |
| | Total Liabilities Less Other Assets
(9.6%) | | | 5,529,023 |
| | |
| | Total Net Assets (100.0%) | | $ | 57,744,058 |
|
| FORWARD COMMITMENTS |
TBA Purchase Commitments at June 30, 2009
(Cost Payable $32,169,570) (56.1%) |
| | |
| 100,000 | | FHLMC - Gold
6.000%, 07/15/2032 | | | 104,344 |
| | |
| 3,900,000 | | FHLMC - Gold
5.500%, 07/01/2037 | | | 4,025,533 |
| | |
| 100,000 | | FHLMC
6.000%, 08/15/2018 | | | 105,406 |
| | |
| 200,000 | | FHLMC
4.500%, 08/01/2019 | | | 203,188 |
| | |
| 2,900,000 | | FHLMC
5.000%, 07/01/2036 | | | 2,948,937 |
| | |
| 1,600,000 | | FNMA 30YR TBA
6.500%, 08/15/2037 | | | 1,697,000 |
| | |
| 900,000 | | FNMA
4.000%, 07/17/2018 | | | 900,000 |
| | |
| 100,000 | | FNMA
6.000%, 08/18/2021 | | | 105,531 |
| | |
| 1,700,000 | | FNMA
5.000%, 07/01/2022 | | | 1,758,970 |
| | |
| 1,000,000 | | FNMA
4.500%, 07/01/2037 | | | 997,812 |
| | | | |
| June 30, 2009 | | 62 | | See Notes to Financial Statements |
Schedule of Investments as of June 30, 2009 (Unaudited)
Accessor Mortgage Securities Fund
| | | | | | |
Principal Amount | | | | Value | |
| TBA Purchase Commitments at June 30, 2009 (continued) (Cost Payable $32,169,570) (56.1%) | |
| | |
| $ 600,000 | | FNMA
6.000%, 07/01/2037 | | $ | 627,000 | |
| | |
| 2,100,000 | | FNMA
4.000%, 07/13/2039 | | | 2,034,375 | |
| | |
| 2,200,000 | | GNMA
5.500%, 07/01/2033 | | | 2,271,500 | |
| | |
| 11,600,000 | | GNMA
6.000%, 07/21/2038 | | | 12,082,119 | |
| | |
| 1,500,000 | | GNMA
5.000%, 08/20/2038 | | | 1,522,968 | |
| | |
| 1,000,000 | | GNMA
4.500%, 07/15/2039 | | | 998,125 | |
| | |
| | | | $ | 32,382,808 | |
| | | | | | |
TBA Sale Commitments at June 30, 2009
(Proceeds Receivable $22,648,677) (-39.4%) | |
| | |
| (2,100,000) | | FHLMC
4.500%, 07/13/2036 | | | (2,090,155 | ) |
| | |
| (100,000) | | FNMA
5.000%, 07/12/2033 | | | (101,813 | ) |
| | |
| (115,000) | | FNMA
4.500%, 08/01/2033 | | | (114,317 | ) |
| | |
| (4,200,000) | | FNMA
6.000%, 08/01/2033 | | | (4,374,560 | ) |
| | |
| (11,800,000) | | FNMA
5.500%, 08/01/2037 | | | (12,135,568 | ) |
| | |
| (3,800,000) | | GNMA
6.000%, 08/01/2033 | | | (3,948,436 | ) |
| | |
| | | | $ | (22,764,849 | ) |
1 Represents a variable or increasing rate security. Rate disclosed is as of June 30, 2009.
2 Fair Valued security under procedures established by the Fund’s Board of Trustees.
3 Interest only security.
4 Principal only security.
5 See Note 6 for important tax information.
TBA — To be announced.
| | | | |
| See Notes to Financial Statements | | 63 | | June 30, 2009 |
Schedule of Investments as of June 30, 2009 (Unaudited)
Accessor Limited Duration U.S. Government Fund
| | | | | |
Principal
Amount | | | | Value |
|
| AGENCY COLLATERALIZED MORTGAGE OBLIGATIONS (19.6%) |
| Federal Home Loan Mortgage Corp (FHLMC) (7.4%) |
| | |
| $ 135,868 | | FHLMC Stated Final
3.255%, 12/15/2010 | | $ | 135,979 |
| | |
| 1,451,171 | | FHLMC
4.000%, 06/15/2013 | | | 1,486,957 |
| | |
| 1,239,635 | | FHLMC
5.250%, 05/15/2017 | | | 1,301,556 |
| | |
| | | | | 2,924,492 |
| | | | | |
| Federal National Mortgage Association (FNMA) — Pass-Through-Agency��(4.2%) |
| | |
| 250,000 | | FNMA
4.500%, 09/25/2020 | | | 260,030 |
| | |
| 1,474,721 | | FNMA1
2.701%, 03/25/2027 | | | 1,397,842 |
| | |
| | | | | 1,657,872 |
| | | | | |
| Federal National Mortgage Corp (FNMA) (8.0%) |
| | |
| 1,134,439 | | FNMA
5.500%, 12/25/2014 | | | 1,204,909 |
| | |
| 1,883,615 | | FNMA
5.500%, 02/25/2017 | | | 1,970,568 |
| | |
| | | | | 3,175,477 |
| | |
| | Total Agency Collateralized Mortgage Obligations
(Identified Cost $7,516,569) | | | 7,757,841 |
|
| U.S. AGENCY BONDS (74.0%) |
| Federal Farm Credit Bank (FFCB) (4.8%) |
| | |
| 1,000,000 | | FFCB
3.950%, 07/15/2011 | | | 1,018,188 |
| | |
| 890,000 | | FFCB
3.750%, 09/29/2011 | | | 896,425 |
| | |
| | | | | 1,914,613 |
| | | | | |
| Federal Home Loan Bank (FHLB) (7.6%) |
| | |
| 1,000,000 | | FHLB
3.250%, 09/25/2009 | | | 1,007,015 |
| | |
| 1,000,000 | | FHLB
4.200%, 07/21/2011 | | | 1,002,050 |
| | |
| 1,000,000 | | FHLB
4.875%, 10/19/2011 | | | 1,012,760 |
| | |
| | | | | 3,021,825 |
| | | | | |
| | | | | |
Principal
Amount | | | | Value |
|
|
| Federal Home Loan Mortgage Corp (FHLMC) — Pass-Through-Agency (12.4%) |
| | |
| $ 734,505 | | FHLMC — Gold
4.500%, 09/01/2013 | | $ | 753,765 |
| | |
| 160,844 | | FHLMC — Gold
4.000%, 04/01/2014 | | | 163,681 |
| | |
| 1,540,023 | | FHLMC — Gold
4.000%, 05/01/2014 | | | 1,567,151 |
| | |
| 1,517,173 | | FHLMC — Gold
4.500%, 06/01/2014 | | | 1,558,656 |
| | |
| 816,200 | | FHLMC — Gold
5.000%, 10/01/2014 | | | 844,275 |
| | |
| | | | | 4,887,528 |
| | | | | |
| Federal National Mortgage Association (FNMA) — Pass-Through-Agency (8.6%) |
| | |
| 760,679 | | FNMA
4.500%, 05/01/2014 | | | 780,624 |
| | |
| 1,547,225 | | FNMA
4.500%, 07/01/2014 | | | 1,587,900 |
| | |
| 996,259 | | FNMA
5.000%, 02/01/2015 | | | 1,031,297 |
| | |
| | | | | 3,399,821 |
| | | | | |
| Federal National Mortgage Corp (FNMA) (2.5%) |
| | |
| 1,000,000 | | FNMA
3.460%, 02/21/2012 | | | 1,003,875 |
| | | | | |
| Small Business Administration — Pass-Through-Agency (SBA) (33.1%) |
| | |
| 97,571 | | SBA1
1.250%, 09/25/2010 | | | 97,270 |
| | |
| 11,496 | | SBA1
3.125%, 03/25/2011 | | | 11,432 |
| | |
| 50,011 | | SBA1
1.125%, 03/25/2013 | | | 49,735 |
| | |
| 71,123 | | SBA1
0.875%, 07/25/2013 | | | 70,511 |
| | |
| 1,064,718 | | SBA1
1.250%, 10/25/2013 | | | 1,059,655 |
| | |
| 2,406 | | SBA1
1.250%, 01/25/2014 | | | 2,394 |
| | |
| 169,368 | | SBA1
4.265%, 05/25/2014 | | | 173,879 |
| | | | |
| June 30, 2009 | | 64 | | See Notes to Financial Statements |
Schedule of Investments as of June 30, 2009 (Unaudited)
Accessor Limited Duration U.S. Government Fund
| | | | | |
Principal
Amount | | | | Value |
| Small Business Administration — Pass-Through-Agency (SBA) (continued) (33.1%) |
| | |
| $ 3,413 | | SBA1
5.250%, 06/25/2014 | | $ | 3,542 |
| | |
| 798,227 | | SBA1
2.575%, 11/25/2014 | | | 808,304 |
| | |
| 12,855 | | SBA1
1.625%, 04/25/2016 | | | 12,538 |
| | |
| 31,152 | | SBA1
3.625%, 07/25/2016 | | | 31,348 |
| | |
| 23,744 | | SBA
7.100%, 02/01/2017 | | | 25,776 |
| | |
| 11,538 | | SBA1
1.250%, 03/25/2017 | | | 11,476 |
| | |
| 37,454 | | SBA1
1.375%, 07/25/2017 | | | 37,347 |
| | |
| 5,665 | | SBA1
1.375%, 09/25/2017 | | | 5,649 |
| | |
| 221,520 | | SBA1
1.250%, 11/25/2017 | | | 220,286 |
| | |
| 231,511 | | SBA1
1.250%, 12/25/2017 | | | 230,220 |
| | |
| 21,268 | | SBA1
1.250%, 02/25/2018 | | | 21,149 |
| | |
| 508,106 | | SBA1
1.250%, 02/25/2018 | | | 505,266 |
| | |
| 126,998 | | SBA1
1.250%, 02/25/2018 | | | 126,288 |
| | |
| 138,246 | | SBA1
1.250%, 04/25/2018 | | | 137,472 |
| | |
| 1,631,647 | | SBA1
0.800%, 05/25/2018 | | | 1,607,384 |
| | |
| 143,916 | | SBA1
1.250%, 05/25/2018 | | | 143,110 |
| | |
| 368,078 | | SBA1
1.000%, 08/25/2018 | | | 364,472 |
| | |
| 114,855 | | SBA1
1.625%, 10/25/2018 | | | 113,472 |
| | |
| 34,598 | | SBA1
0.950%, 01/25/2019 | | | 34,207 |
| | |
| 80,920 | | SBA1
1.250%, 06/25/2019 | | | 80,464 |
| | | | | |
Principal
Amount | | | | Value |
| | | | |
| | |
| $1,557,346 | | SBA1
0.750%, 06/25/2020 | | $ | 1,530,293 |
| | |
| 56,328 | | SBA1
0.750%, 04/25/2021 | | | 55,436 |
| | |
| 6,158 | | SBA1
3.625%, 04/25/2021 | | | 6,111 |
| | |
| 9,705 | | SBA1
3.125%, 07/25/2021 | | | 9,701 |
| | |
| 539,149 | | SBA1
1.000%, 09/25/2021 | | | 534,205 |
| | |
| 173,827 | | SBA1
0.875%, 10/25/2021 | | | 171,683 |
| | |
| 57,280 | | SBA
7.125%, 06/25/2024 | | | 60,889 |
| | |
| 23,556 | | SBA1
3.625%, 10/25/2024 | | | 24,800 |
| | |
| 368,041 | | SBA1
1.000%, 11/25/2024 | | | 364,533 |
| | |
| 413,773 | | SBA1
0.875%, 01/25/2025 | | | 408,387 |
| | |
| 34,940 | | SBA1
3.875%, 02/25/2025 | | | 36,680 |
| | |
| 14,516 | | SBA1
3.125%, 06/25/2025 | | | 14,743 |
| | |
| 28,930 | | SBA1
3.375%, 09/25/2025 | | | 29,208 |
| | |
| 28,581 | | SBA1
3.625%, 10/25/2025 | | | 29,959 |
| | |
| 442,164 | | SBA1
0.700%, 02/25/2030 | | | 432,935 |
| | |
| 384,300 | | SBA1
0.625%, 03/25/2030 | | | 375,168 |
| | |
| 791,574 | | SBA1
0.600%, 09/25/2030 | | | 774,738 |
| | |
| 656,383 | | SBA1
0.570%, 09/25/2031 | | | 641,622 |
| | |
| 687,545 | | SBA1
0.570%, 11/25/2031 | | | 672,057 |
| | |
| 940,620 | | SBA1
1.400%, 09/25/2032 | | | 941,537 |
| | |
| | | | | 13,099,331 |
| | | | |
| See Notes to Financial Statements | | 65 | | June 30, 2009 |
Schedule of Investments as of June 30, 2009 (Unaudited)
Accessor Limited Duration U.S. Government Fund
| | | | | |
Principal
Amount | | | | Value |
| U.S. Treasury Bonds & Notes (5.0%) |
| | |
| $1,000,000 | | U.S. Treasury Note
1.875%, 06/15/2012 | | $ | 1,007,270 |
| | |
| 1,000,000 | | U.S. Treasury Note
1.750%, 03/31/2014 | | | 967,188 |
| | |
| | | | | 1,974,458 |
| | |
| | Total U.S. Agency Bonds
(Identified Cost $29,102,237) | | | 29,301,451 |
| | |
| | Total Investments (93.6%)
(Identified Cost $36,618,806)2 | | | 37,059,292 |
| | |
| | Total Other Assets Less Liabilities
(6.4%) | | | 2,542,903 |
| | |
| | Total Net Assets (100.0%) | | $ | 39,602,195 |
1 Represents an adjustable rate security. Rate disclosed is as of June 30, 2009.
2 See Note 6 for important tax information.
| | | | |
| June 30, 2009 | | 66 | | See Notes to Financial Statements |
Schedule of Investments as of June 30, 2009 (Unaudited)
Accessor U.S. Government Money Fund
| | | | | |
Principal
Amount | | | | Value |
| |
| U.S. AGENCY BONDS (89.5%) | | | |
| Federal Farm Credit Bank (FFCB) (8.4%) |
| | |
| $20,000,000 | | FFCB2
1.008%, 07/01/2009 | | $ | 20,000,000 |
| | |
| 50,000,000 | | FFCB2
0.215%, 07/20/2009 | | | 50,000,000 |
| | |
| | | | | 70,000,000 |
| | | | | |
| Federal Home Loan Bank (FHLB) (52.4%) |
| | |
| 30,000,000 | | FHLB2
0.311%, 07/07/2009 | | | 30,000,000 |
| | |
| 14,700,000 | | FHLB
5.375%, 07/17/2009 | | | 14,731,498 |
| | |
| 20,000,000 | | FHLB
3.875%, 07/24/2009 | | | 20,042,517 |
| | |
| 25,000,000 | | FHLB
2.560%, 08/04/2009 | | | 25,038,232 |
| | |
| 20,000,000 | | FHLB
2.000%, 08/18/2009 | | | 20,039,061 |
| | |
| 11,000,000 | | FHLB2
0.245%, 08/21/2009 | | | 10,998,302 |
| | |
| 25,000,000 | | FHLB
5.250%, 09/11/2009 | | | 25,225,326 |
| | |
| 25,000,000 | | FHLB
5.000%, 09/18/2009 | | | 25,134,907 |
| | |
| 11,800,000 | | FHLB2
0.920%, 10/23/2009 | | | 11,812,791 |
| | |
| 12,000,000 | | FHLB
4.250%, 11/20/2009 | | | 12,164,216 |
| | |
| 20,000,000 | | FHLB
0.580%, 12/09/2009 | | | 20,000,000 |
| | |
| 75,000,000 | | FHLB2
0.750%, 02/02/2010 | | | 75,000,000 |
| | |
| 50,000,000 | | FHLB2
0.718%, 02/18/2010 | | | 50,000,000 |
| | |
| 20,000,000 | | FHLB
5.000%, 03/12/2010 | | | 20,619,051 |
| | |
| 22,000,000 | | FHLB3
1.500%, 05/05/2010 | | | 22,000,000 |
| | |
| 8,575,000 | | FHLB
4.875%, 05/14/2010 | | | 8,898,030 |
| | |
| 20,000,000 | | FHLB
0.650%, 06/10/2010 | | | 20,000,000 |
| | | | | |
Principal
Amount | | | | Value |
|
|
| |
| | |
| $25,000,000 | | FHLB
0.650%, 07/06/2010 | | $ | 25,000,000 |
| | |
| | | | | 436,703,931 |
| | | | | |
| Federal Home Loan Bank (FHLB) — Discount Note (4.5%) |
| | |
| 7,788,000 | | FHLB1
0.551%, 07/31/2009 | | | 7,784,431 |
| | |
| 30,000,000 | | FHLB1
0.461%, 11/02/2009 | | | 29,952,467 |
| | |
| | | | | 37,736,898 |
| | | | | |
| Federal Home Loan Mortgage Corp (FHLMC) (13.8%) |
| | |
| 10,000,000 | | FHLMC
4.125%, 09/01/2009 | | | 10,055,013 |
| | |
| 30,000,000 | | FHLMC2
0.246%, 10/19/2009 | | | 29,975,944 |
| | |
| 15,000,000 | | FHLMC
2.680%, 11/16/2009 | | | 15,096,600 |
| | |
| 10,000,000 | | FHLMC
4.125%, 11/30/2009 | | | 10,141,395 |
| | |
| 50,000,000 | | FHLMC2
0.650%, 01/08/2010 | | | 50,000,000 |
| | |
| | | | | 115,268,952 |
| | | | | |
| Federal Home Loan Mortgage Corp (FHLMC) — Discount Note (4.4%) |
| | |
| 12,015,000 | | FHLMC1
0.500%, 09/15/2009 | | | 12,002,342 |
| | |
| 25,000,000 | | FHLMC1
0.240%, 10/05/2009 | | | 24,984,000 |
| | |
| | | | | 36,986,342 |
| | | | | |
| Federal National Mortgage Association (FNMA) — Discount Note (6.0%) |
| | |
| 25,000,000 | | FNMA1
0.471%, 08/10/2009 | | | 24,986,944 |
| | |
| 25,000,000 | | FNMA1
0.492%, 08/17/2009 | | | 24,984,007 |
| | |
| | | | | 49,970,951 |
| | |
| | Total U.S. Agency Bonds
(Identified Cost $746,667,074) | | | 746,667,074 |
| | | | |
| See Notes to Financial Statements | | 67 | | June 30, 2009 |
Schedule of Investments as of June 30, 2009 (Unaudited)
Accessor U.S. Government Money Fund
| | | | | | |
Principal
Amount | | | | Value | |
| |
| SHORT-TERM INVESTMENTS (12.3%) | | | | |
| $103,000,000 | | SOUTH STREET REPURCHASE AGREEMENT DATED 06/30/2009 (Repurchase value $103,000,372 by U.S. Government Agency securities)4
0.130%, 07/01/2009 | | $ | 103,000,000 | |
| | |
| | Total Short-Term Investments
(Identified Cost $103,000,000) | | | 103,000,000 | |
| | |
| | Total Investments (101.8%)
(Identified Cost $849,667,074)5 | | | 849,667,074 | |
| | |
| | Total Liabilities Less Other Assets
(-1.8%) | | | (15,463,826 | ) |
| | |
| | Total Net Assets (100.0%) | | $ | 834,203,248 | |
1 Represents a zero coupon bond. Rate disclosed is the effective yield as of June 30, 2009.
2 Represents an adjustable rate security. Rate disclosed as of June 30, 2009.
3 Represents a step bond. Rate disclosed is the effective yield as of June 30, 2009.
4 See Note 2 for collateral information.
5 See Note 6 for important tax information.
| | | | |
| June 30, 2009 | | 68 | | See Notes to Financial Statements |
Schedule of Investments as of June 30, 2009 (Unaudited)
Accessor Income Allocation Fund
| | | | | | | |
| Shares | | | | Allocation | | Value |
|
| AFFILIATED INVESTMENT COMPANIES (98.3%) |
| Accessor Funds — Z Class Shares (98.3%) |
| | | |
| 423,621 | | Accessor High Yield Bond | | 18.7% | | $ | 3,600,780 |
| | | |
| 971,839 | | Accessor Investment Grade Fixed-Income | | 50.2% | | | 9,669,795 |
| | | |
| 378,316 | | Accessor Mortgage Securities | | 24.4% | | | 4,713,813 |
| | | |
| 965,619 | | Accessor U.S. Government Money | | 5.0% | | | 965,619 |
| | | |
| | | | | | | 18,950,007 |
| | | |
| | Total Affiliated Investment Companies
(Identified Cost $20,955,756) | | | | | 18,950,007 |
| | | |
| | Total Investments (98.3%)
(Identified Cost $20,955,756)1 | | | | | 18,950,007 |
| | | |
| | Total Other Assets Less Liabilities (1.7%) | | | | | 328,497 |
| | | |
| | Total Net Assets (100.0%) | | | | $ | 19,278,504 |
1 See Note 6 for important tax information.
| | | | |
| See Notes to Financial Statements | | 69 | | June 30, 2009 |
Schedule of Investments as of June 30, 2009 (Unaudited)
Accessor Income & Growth Allocation Fund
| | | | | | | |
| Shares | | | | Allocation | | Value |
|
| AFFILIATED INVESTMENT COMPANIES (94.6%) |
| Accessor Funds — Z Class Shares (94.6%) |
| | | |
| 109,136 | | Accessor Frontier Markets | | 3.1% | | $ | 1,351,108 |
| | | |
| 135,947 | | Accessor Growth | | 5.8% | | | 2,547,648 |
| | | |
| 569,524 | | Accessor High Yield Bond | | 11.0% | | | 4,840,955 |
| | | |
| 238,121 | | Accessor International Equity | | 6.4% | | | 2,833,636 |
| | | |
| 1,188,379 | | Accessor Investment Grade Fixed-Income | | 26.9% | | | 11,824,372 |
| | | |
| 512,142 | | Accessor Mortgage Securities | | 14.5% | | | 6,381,289 |
| | | |
| 162,168 | | Accessor Small to Mid Cap | | 7.1% | | | 3,121,733 |
| | | |
| 620,328 | | Accessor Strategic Alternatives | | 14.2% | | | 6,246,705 |
| | | |
| 265 | | Accessor U.S. Government Money | | 0.0% | | | 265 |
| | | |
| 184,280 | | Accessor Value | | 5.6% | | | 2,461,975 |
| | | |
| | | | | | | 41,609,686 |
| | | |
| | Total Affiliated Investment Companies
(Identified Cost $47,587,262) | | | | | 41,609,686 |
| | | |
| | Total Investments (94.6%)
(Identified Cost $47,587,262)1 | | | | | 41,609,686 |
| | | |
| | Total Other Assets Less Liabilities (5.4%) | | | | | 2,362,189 |
| | | |
| | Total Net Assets (100.0%) | | | | $ | 43,971,875 |
1 See Note 6 for important tax information.
| | | | |
| June 30, 2009 | | 70 | | See Notes to Financial Statements |
Schedule of Investments as of June 30, 2009 (Unaudited)
Accessor Balanced Allocation Fund
| | | | | | | | |
| Shares | | | | Allocation | | | Value |
|
| AFFILIATED INVESTMENT COMPANIES (99.3%) |
| Accessor Funds — Z Class Shares (99.3%) |
| | | |
| 346,730 | | Accessor Frontier Markets | | 4.0 | % | | $ | 4,292,523 |
| | | |
| 560,674 | | Accessor Growth | | 9.7 | % | | | 10,507,022 |
| | | |
| 977,854 | | Accessor High Yield Bond | | 7.7 | % | | | 8,311,763 |
| | | |
| 1,015,166 | | Accessor International Equity | | 11.1 | % | | | 12,080,471 |
| | | |
| 2,143,666 | | Accessor Investment Grade Fixed-Income | | 19.7 | % | | | 21,329,474 |
| | | |
| 931,947 | | Accessor Mortgage Securities | | 10.7 | % | | | 11,612,060 |
| | | |
| 712,617 | | Accessor Small to Mid Cap | | 12.6 | % | | | 13,717,884 |
| | | |
| 1,345,844 | | Accessor Strategic Alternatives | | 12.5 | % | | | 13,552,649 |
| | | |
| 1,855,937 | | Accessor U.S. Government Money | | 1.7 | % | | | 1,855,937 |
| | | |
| 778,514 | | Accessor Value | | 9.6 | % | | | 10,400,941 |
| | | |
| | | | | | | | 107,660,724 |
| | | |
| | Total Affiliated Investment Companies
(Identified Cost $127,536,573) | | | | | | 107,660,724 |
| | | |
| | Total Investments (99.3%)
(Identified Cost $127,536,573)1 | | | | | | 107,660,724 |
| | | |
| | Total Other Assets Less Liabilities (0.7%) | | | | | | 800,937 |
| | | |
| | Total Net Assets (100.0%) | | | | | $ | 108,461,661 |
1 See Note 6 for important tax information.
| | | | |
| See Notes to Financial Statements | | 71 | | June 30, 2009 |
Schedule of Investments as of June 30, 2009 (Unaudited)
Accessor Growth & Income Allocation Fund
| | | | | | | | |
| Shares | | | | Allocation | | | Value |
|
| AFFILIATED INVESTMENT COMPANIES (97.9%) |
| Accessor Funds — Z Class Shares (97.9%) |
| | | |
| 433,380 | | Accessor Frontier Markets | | 5.2 | % | | $ | 5,365,244 |
| | | |
| 725,103 | | Accessor Growth | | 13.2 | % | | | 13,588,427 |
| | | |
| 724,767 | | Accessor High Yield Bond | | 6.0 | % | | | 6,160,518 |
| | | |
| 1,228,421 | | Accessor International Equity | | 14.2 | % | | | 14,618,204 |
| | | |
| 1,641,659 | | Accessor Investment Grade Fixed-Income | | 15.8 | % | | | 16,334,509 |
| | | |
| 699,063 | | Accessor Mortgage Securities | | 8.5 | % | | | 8,710,325 |
| | | |
| 748,874 | | Accessor Small to Mid Cap | | 14.0 | % | | | 14,415,816 |
| | | |
| 823,122 | | Accessor Strategic Alternatives | | 8.0 | % | | | 8,288,835 |
| | | |
| 1,003,691 | | Accessor Value | | 13.0 | % | | | 13,409,306 |
| | | |
| | | | | | | | 100,891,184 |
| | | |
| | Total Affiliated Investment Companies
(Identified Cost $124,234,093) | | | | | | 100,891,184 |
| | | |
| | Total Investments (97.9%)
(Identified Cost $124,234,093)1 | | | | | | 100,891,184 |
| | | |
| | Total Other Assets Less Liabilities (2.1%) | | | | | | 2,210,727 |
| | | |
| | Total Net Assets (100.0%) | | | | | $ | 103,101,911 |
1 See Note 6 for important tax information.
| | | | |
| June 30, 2009 | | 72 | | See Notes to Financial Statements |
Schedule of Investments as of June 30, 2009 (Unaudited)
Accessor Growth Allocation Fund
| | | | | | | | |
| Shares | | | | Allocation | | | Value |
|
| AFFILIATED INVESTMENT COMPANIES (99.3%) |
| Accessor Funds — Z Class Shares (99.3%) |
| | | |
| 476,211 | | Accessor Frontier Markets | | 5.9 | % | | $ | 5,895,487 |
| | | |
| 887,024 | | Accessor Growth | | 16.7 | % | | | 16,622,828 |
| | | |
| 330,445 | | Accessor High Yield Bond | | 2.8 | % | | | 2,808,786 |
| | | |
| 1,532,287 | | Accessor International Equity | | 18.4 | % | | | 18,234,221 |
| | | |
| 799,490 | | Accessor Investment Grade Fixed-Income | | 8.0 | % | | | 7,954,927 |
| | | |
| 352,662 | | Accessor Mortgage Securities | | 4.4 | % | | | 4,394,168 |
| | | |
| 977,394 | | Accessor Small to Mid Cap | | 19.0 | % | | | 18,814,830 |
| | | |
| 706,720 | | Accessor Strategic Alternatives | | 7.2 | % | | | 7,116,673 |
| | | |
| 1,252,056 | | Accessor Value | | 16.9 | % | | | 16,727,467 |
| | | |
| | | | | | | | 98,569,387 |
| | | |
| | Total Affiliated Investment Companies
(Identified Cost $124,155,231) | | | | | | 98,569,387 |
| | | |
| | Total Investments (99.3%)
(Identified Cost $124,155,231)1 | | | | | | 98,569,387 |
| | | |
| | Total Other Assets Less Liabilities (0.7%) | | | | | | 722,480 |
| | | |
| | Total Net Assets (100.0%) | | | | | $ | 99,291,867 |
1 See Note 6 for important tax information.
| | | | |
| See Notes to Financial Statements | | 73 | | June 30, 2009 |
Schedule of Investments as of June 30, 2009 (Unaudited)
Accessor Aggressive Growth Allocation Fund
| | | | | | | | |
| Shares | | | | Allocation | | | Value |
|
| AFFILIATED INVESTMENT COMPANIES (99.0%) |
| Accessor Funds — Z Class Shares (99.0%) |
| | | |
| 294,781 | | Accessor Frontier Markets | | 7.4 | % | | $ | 3,649,394 |
| | | |
| 531,113 | | Accessor Growth | | 20.0 | % | | | 9,953,055 |
| | | |
| 890,102 | | Accessor International Equity | | 21.3 | % | | | 10,592,214 |
| | | |
| 622,702 | | Accessor Small to Mid Cap | | 24.1 | % | | | 11,987,017 |
| | | |
| 300,856 | | Accessor Strategic Alternatives | | 6.1 | % | | | 3,029,617 |
| | | |
| 749,384 | | Accessor Value | | 20.1 | % | | | 10,011,766 |
| | | |
| | | | | | | | 49,223,063 |
| | | |
| | Total Affiliated Investment Companies
(Identified Cost $64,286,699) | | | | | | 49,223,063 |
| | | |
| | Total Investments (99.0%)
(Identified Cost $64,286,699)1 | | | | | | 49,223,063 |
| | | |
| | Total Other Assets Less Liabilities (1.0%) | | | | | | 506,737 |
| | | |
| | Total Net Assets (100.0%) | | | | | $ | 49,729,800 |
1 See Note 6 for important tax information.
| | | | |
| June 30, 2009 | | 74 | | See Notes to Financial Statements |
Statements of Assets & Liabilities (Unaudited)
| | | | | | | | | | | | |
| | | ACCESSOR
GROWTH | | | ACCESSOR
VALUE | | | ACCESSOR
SMALL TO MID
CAP | |
| ASSETS: | | | | | | | | | | | | |
Investments, at value (Note 2) | | $ | 75,559,543 | | | $ | 71,285,182 | | | $ | 166,740,215 | |
Cash | | | 78,196 | | | | 391,536 | | | | 2,131,297 | |
Receivable for investments sold | | | — | | | | — | | | | 712,575 | |
Receivable for capital shares sold | | | 321,540 | | | | 556,137 | | | | 279,601 | |
Dividends and interest receivable | | | 27,861 | | | | 152,182 | | | | 120,568 | |
Prepaid expenses and other assets | | | 16,681 | | | | 15,911 | | | | 21,973 | |
| | | | | | | | | | | | |
Total Assets | | | 76,003,821 | | | | 72,400,948 | | | | 170,006,229 | |
| | | | | | | | | | | | |
| LIABILITIES: | | | | | | | | | | | | |
Payable for investments securities purchased | | | — | | | | — | | | | 2,296,631 | |
Payable for capital shares redeemed | | | 153,567 | | | | 137,430 | | | | 232,122 | |
Payable to investment advisor (Note 3) | | | 29,422 | | | | 27,553 | | | | 80,560 | |
Payable to money managers (Note 3) | | | 16,346 | | | | 15,307 | | | | 53,706 | |
Payable to administrator (Note 3) | | | 5,468 | | | | 5,186 | | | | 9,638 | |
Payable for 12b-1 & administrative services fees (Note 3) | | | 4,110 | | | | 3,680 | | | | 10,958 | |
Payable for shareholder services (Note 3) | | | 1,741 | | | | 1,486 | | | | 8,367 | |
Payable for chief compliance officer fee (Note 3) | | | — | | | | — | | | | 290 | |
Accrued expenses and other liabilities | | | 19,257 | | | | 19,622 | | | | 34,110 | |
| | | | | | | | | | | | |
Total Liabilities | | | 229,911 | | | | 210,264 | | | | 2,726,382 | |
| | | | | | | | | | | | |
| NET ASSETS | | $ | 75,773,910 | | | $ | 72,190,684 | | | $ | 167,279,847 | |
| | | | | | | | | | | | |
| NET ASSETS CONSIST OF: | | | | | | | | | | | | |
Paid-in capital | | $ | 121,842,123 | | | $ | 125,673,804 | | | $ | 241,272,247 | |
Net unrealized appreciation (depreciation) of investments | | | (6,205,981 | ) | | | (12,065,505 | ) | | | (19,410,448 | ) |
Undistributed (distributions in excess) net investment income (loss) | | | (218 | ) | | | 1,626 | | | | 115,191 | |
Accumulated net realized gain (loss) on investments | | | (39,862,014 | ) | | | (41,419,241 | ) | | | (54,697,143 | ) |
| | | | | | | | | | | | |
| TOTAL NET ASSETS | | $ | 75,773,910 | | | $ | 72,190,684 | | | $ | 167,279,847 | |
| | | | | | | | | | | | |
| INVESTMENTS, AT COST | | $ | 81,765,524 | | | $ | 83,350,687 | | | $ | 186,150,663 | |
| | | | |
| See Notes to Financial Statements | | 75 | | June 30, 2009 |
Statements of Assets & Liabilities (Unaudited)
| | | | | | | | | |
| | | ACCESSOR
GROWTH | | ACCESSOR
VALUE | | ACCESSOR
SMALL TO MID
CAP |
| | | |
| PRICING OF SHARES | | | | | | | | | |
Institutional Class: | | | | | | | | | |
Net Asset Value, offering & redemption price per share | | | $18.75 | | | $13.37 | | | $19.25 |
Net Assets | | $ | 21,036,381 | | $ | 18,259,215 | | $ | 100,180,444 |
Shares of beneficial interest outstanding | | | 1,121,970 | | | 1,365,942 | | | 5,203,577 |
Investor Class: | | | | | | | | | |
Net Asset Value, offering & redemption price per share | | | $18.30 | | | $13.39 | | | $18.37 |
Net Assets | | $ | 551,294 | | $ | 582,365 | | $ | 1,283,430 |
Shares of beneficial interest outstanding | | | 30,120 | | | 43,497 | | | 69,858 |
C Class: | | | | | | | | | |
Net Asset Value & offering price per share1 | | | $18.02 | | | $13.37 | | | $18.19 |
Net Assets | | $ | 494,116 | | $ | 238,942 | | $ | 531,857 |
Shares of beneficial interest outstanding | | | 27,423 | | | 17,874 | | | 29,238 |
A Class: | | | | | | | | | |
Net Asset Value & redemption price per share | | | $18.59 | | | $13.37 | | | $18.92 |
Public offering price per share2 | | | $19.72 | | | $14.19 | | | $20.07 |
Net Assets | | $ | 459,298 | | $ | 84,202 | | $ | 3,227,629 |
Shares of beneficial interest outstanding | | | 24,702 | | | 6,300 | | | 170,566 |
Z Class: | | | | | | | | | |
Net Asset Value, offering and redemption price per share | | | $18.74 | | | $13.36 | | | $19.25 |
Net Assets | | $ | 53,232,821 | | $ | 53,025,960 | | $ | 62,056,487 |
Shares of beneficial interest outstanding | | | 2,839,860 | | | 3,967,923 | | | 3,223,755 |
1 The redemption price per shares excludes the applicable contingent deferred sales charges.
2 NAV/0.9425, based on maximum sales charge of 5.75% of the offering price.
| | | | |
| June 30, 2009 | | 76 | | See Notes to Financial Statements |
Statements of Assets & Liabilities (Unaudited)
| | | | | | | | | | | | |
| | | ACCESSOR
INTERNATIONAL
EQUITY | | | ACCESSOR
TOTAL
RETURN | | | ACCESSOR
STRATEGIC
ALTERNATIVES | |
| ASSETS: | | | | | | | | | | | | |
Investments, at value (Note 2) | | $ | 94,254,638 | | | $ | 22,959,843 | | | $ | 95,702,660 | |
Cash | | | 517,669 | | | | 1,780,471 | | | | 4,640,050 | |
Receivable for capital shares sold | | | 159,444 | | | | — | | | | 279,225 | |
Dividend tax reclaim | | | 197,237 | | | | — | | | | — | |
Dividends and interest receivable | | | 303,926 | | | | 26,067 | | | | 275,669 | |
Receivable for investments sold | | | 662,715 | | | | 2,194,375 | | | | — | |
Unrealized gain on foreign currency spot contracts | | | 2,745 | | | | — | | | | — | |
Prepaid expenses and other assets | | | 25,446 | | | | 376 | | | | 10,274 | |
| | | | | | | | | | | | |
Total Assets | | | 96,123,820 | | | | 26,961,132 | | | | 100,907,878 | |
| | | | | | | | | | | | |
| LIABILITIES: | | | | | | | | | | | | |
Cash overdraft of foreign currency | | | 76,110 | | | | — | | | | — | |
Payable for capital shares redeemed | | | 201,860 | | | | — | | | | 1,303 | |
Payable for investments securities purchased | | | — | | | | 1,776,502 | | | | 1,409,154 | |
Payable to investment advisor (Note 3) | | | 43,986 | | | | 2,536 | | | | 58,167 | |
Payable to money managers (Note 3) | | | 35,988 | | | | 10,568 | | | | — | |
Payable for 12b-1 & administrative services fees (Note 3) | | | 6,459 | | | | — | | | | — | |
Payable to administrator (Note 3) | | | 6,330 | | | | 1,388 | | | | 8,583 | |
Payable for shareholder services (Note 3) | | | 2,535 | | | | — | | | | 5,000 | |
Payable for chief compliance officer fee (Note 3) | | | 14 | | | | 32 | | | | 41 | |
Unrealized loss on foreign currency spot contracts | | | 851 | | | | — | | | | — | |
Accrued expenses and other liabilities | | | 46,980 | | | | 15,172 | | | | 6,383 | |
| | | | | | | | | | | | |
Total Liabilities | | | 421,113 | | | | 1,806,198 | | | | 1,488,631 | |
| | | | | | | | | | | | |
| NET ASSETS | | $ | 95,702,707 | | | $ | 25,154,934 | | | $ | 99,419,247 | |
| | | | | | | | | | | | |
| NET ASSETS CONSIST OF: | | | | | | | | | | | | |
Paid-in capital | | $ | 183,601,897 | | | $ | 54,302,628 | | | $ | 120,370,725 | |
Net unrealized appreciation (depreciation) of investments | | | 7,766,852 | | | | (1,018,410 | ) | | | (20,189,837 | ) |
Net unrealized appreciation (depreciation) on foreign currencies | | | 8,607 | | | | — | | | | — | |
Undistributed net investment income (loss) | | | 5,633,954 | | | | 34,608 | | | | 17,944 | |
Accumulated net realized gain (loss) on investments, futures contracts, options and foreign currencies | | | (101,308,603 | ) | | | (28,163,892 | ) | | | (779,585 | ) |
| | | | | | | | | | | | |
| TOTAL NET ASSETS | | $ | 95,702,707 | | | $ | 25,154,934 | | | $ | 99,419,247 | |
| | | | | | | | | | | | |
| INVESTMENTS, AT COST | | $ | 86,487,786 | | | $ | 23,978,253 | | | $ | 115,892,497 | |
| | | | |
| See Notes to Financial Statements | | 77 | | June 30, 2009 |
Statements of Assets & Liabilities (Unaudited)
| | | | | | | | | |
| | | ACCESSOR
INTERNATIONAL
EQUITY | | ACCESSOR
TOTAL
RETURN | | ACCESSOR
STRATEGIC
ALTERNATIVES |
| | | |
| PRICING OF SHARES | | | | | | | | | |
Total Return: | | | | | | | | | |
Net Asset Value, offering & redemption price per share | | | N/A | | | $5.19 | | | N/A |
Net Assets | | | N/A | | $ | 25,154,934 | | | N/A |
Shares of beneficial interest outstanding | | | N/A | | | 4,847,991 | | | N/A |
Institutional Class: | | | | | | | | | |
Net Asset Value, offering & redemption price per share | | | $11.90 | | | N/A | | | $10.06 |
Net Assets | | $ | 30,165,496 | | | N/A | | $ | 61,181,963 |
Outstanding shares | | | 2,534,560 | | | N/A | | | 6,081,717 |
Investor Class: | | | | | | | | | |
Net Asset Value, offering & redemption price per share | | | $11.41 | | | N/A | | | $10.07 |
Net Assets | | $ | 1,650,276 | | | N/A | | $ | 19,805 |
Shares of beneficial interest outstanding | | | 144,677 | | | N/A | | | 1,967 |
C Class: | | | | | | | | | |
Net Asset Value & offering price per share1 | | | $11.32 | | | N/A | | | N/A |
Net Assets | | $ | 844,383 | | | N/A | | | N/A |
Shares of beneficial interest outstanding | | | 74,600 | | | N/A | | | N/A |
A Class: | | | | | | | | | |
Net Asset Value & redemption price per share | | | $11.76 | | | N/A | | | N/A |
Public offering price per share2 | | | $12.48 | | | N/A | | | N/A |
Net Assets | | $ | 4,663,900 | | | N/A | | | N/A |
Shares of beneficial interest outstanding | | | 396,717 | | | N/A | | | N/A |
Z Class: | | | | | | | | | |
Net Asset Value, offering and redemption price per share | | | $11.90 | | | N/A | | | $10.07 |
Net Assets | | $ | 58,378,652 | | | N/A | | $ | 38,217,479 |
Shares of beneficial interest outstanding | | | 4,904,096 | | | N/A | | | 3,796,870 |
1 The redemption price per shares excludes the applicable contingent deferred sales charges.
2 NAV/0.9425, based on maximum sales charge of 5.75% of the offering price.
| | | | |
| June 30, 2009 | | 78 | | See Notes to Financial Statements |
Statements of Assets & Liabilities (Unaudited)
| | | | | | | | | | | | |
| | | ACCESSOR
FRONTIER MARKETS | | | ACCESSOR HIGH YIELD BOND | | | ACCESSOR
INVESTMENT GRADE
FIXED-INCOME | |
| ASSETS: | | | | | | | | | | | | |
Investments, at value (Note 2) | | $ | 27,278,714 | | | $ | 93,863,736 | | | $ | 91,032,005 | |
Cash | | | 4,292,688 | | | | — | | | | 1,041,309 | |
TBA purchase commitments, at value (Cost payable $0, $0 and $13,388,281, respectively) | | | — | | | | — | | | | 13,521,246 | |
Dividends and interest receivable | | | 83,156 | | | | 1,781,121 | | | | 982,301 | |
Receivable for investments sold | | | — | | | | 5,861,500 | | | | 5,774,165 | |
Receivable for capital shares sold | | | 66,490 | | | | 152,947 | | | | 38,867 | |
Unrealized gain on swap contracts | | | 42,959 | | | | — | | | | — | |
Prepaid expenses and other assets | | | 5,815 | | | | 22,607 | | | | 15,639 | |
| | | | | | | | | | | | |
Total Assets | | | 31,769,822 | | | | 101,681,911 | | | | 112,405,532 | |
| | | | | | | | | | | | |
| LIABILITIES: | | | | | | | | | | | | |
Payable to custodian | | | — | | | | 390,582 | | | | — | |
Payable for investments securities purchased and
TBA purchase commitments | | | 499,978 | | | | 5,190,830 | | | | 15,659,053 | |
TBA sale commitments, at value (proceeds receivable $0, $0 and $5,127,746, respectively) | | | — | | | | — | | | | 5,186,564 | |
Unrealized loss on swap contracts | | | 179,337 | | | | — | | | | — | |
Written Options (proceeds $0, $0, $1,815) | | | — | | | | — | | | | 350 | |
Payable for capital shares redeemed | | | — | | | | 191,133 | | | | 1,893,420 | |
Payable to investment advisor (Note 3) | | | 21,242 | | | | 28,555 | | | | 24,429 | |
Payable to money managers (Note 3) | | | — | | | | 19,830 | | | | 18,506 | |
Payable to administrator (Note 3) | | | 1,477 | | | | 6,252 | | | | 5,877 | |
Payable for 12b-1 & administrative services fees (Note 3) | | | — | | | | 2,608 | | | | 3,166 | |
Payable for shareholder services (Note 3) | | | 639 | | | | 5,454 | | | | 1,882 | |
Payable for chief compliance officer fee (Note 3) | | | 41 | | | | 90 | | | | — | |
Variation margin | | | — | | | | — | | | | 24,556 | |
Accrued expenses and other liabilities | | | 10,084 | | | | 26,828 | | | | 94,795 | |
| | | | | | | | | | | | |
Total Liabilities | | | 712,798 | | | | 5,862,162 | | | | 22,912,598 | |
| | | | | | | | | | | | |
| NET ASSETS | | $ | 31,057,024 | | | $ | 95,819,749 | | | $ | 89,492,934 | |
| | | | | | | | | | | | |
| NET ASSETS CONSIST OF: | | | | | | | | | | | | |
Paid-in capital | | $ | 26,607,573 | | | $ | 112,030,271 | | | $ | 100,463,049 | |
Net unrealized appreciation (depreciation) of investments and options | | | 2,386,541 | | | | 2,294,898 | | | | (10,086,276 | ) |
Net unrealized appreciation (depreciation) on swap contracts | | | (136,378 | ) | | | — | | | | — | |
Net unrealized appreciation (depreciation) on futures contracts | | | — | | | | — | | | | 506,017 | |
Undistributed net investment income | | | 8,667 | | | | 132,809 | | | | 315,319 | |
Accumulated net realized gain (loss) on investments, options and foreign currencies | | | 2,190,621 | | | | (18,638,229 | ) | | | (1,705,175 | ) |
| | | | | | | | | | | | |
| TOTAL NET ASSETS | | $ | 31,057,024 | | | $ | 95,819,749 | | | $ | 89,492,934 | |
| | | | | | | | | | | | |
| INVESTMENTS, AT COST | | $ | 24,892,173 | | | $ | 91,568,838 | | | $ | 112,990,699 | |
| | | | |
| See Notes to Financial Statements | | 79 | | June 30, 2009 |
Statements of Assets & Liabilities (Unaudited)
| | | | | | | | | |
| | | ACCESSOR
FRONTIER MARKETS | | ACCESSOR HIGH YIELD BOND | | ACCESSOR
INVESTMENT GRADE
FIXED-INCOME |
| | | |
| PRICING OF SHARES | | | | | | | | | |
Institutional Class: | | | | | | | | | |
Net Asset Value, offering & redemption price per share | | | $12.38 | | | $8.51 | | | $9.95 |
Net Assets | | $ | 9,427,752 | | $ | 65,966,246 | | $ | 21,125,245 |
Shares of beneficial interest outstanding | | | 761,537 | | | 7,752,892 | | | 2,122,981 |
Investor Class: | | | | | | | | | |
Net Asset Value, offering & redemption price per share | | | $12.39 | | | $8.51 | | | $9.94 |
Net Assets | | $ | 1,068,540 | | $ | 2,913,409 | | $ | 692,890 |
Shares of beneficial interest outstanding | | | 86,255 | | | 342,337 | | | 69,682 |
C Class: | | | | | | | | | |
Net Asset Value & offering price per share1 | | | N/A | | | $8.49 | | | $9.95 |
Net Assets | | | N/A | | $ | 781,963 | | $ | 591,198 |
Shares of beneficial interest outstanding | | | N/A | | | 92,069 | | | 59,419 |
A Class: | | | | | | | | | |
Net Asset Value & redemption price per share | | | N/A | | | $8.50 | | | N/A |
Public offering price per share2 | | | N/A | | | $8.92 | | | N/A |
Net Assets | | | N/A | | $ | 423,671 | | | N/A |
Shares of beneficial interest outstanding | | | N/A | | | 49,825 | | | N/A |
Z Class: | | | | | | | | | |
Net Asset Value, offering and redemption price per share | | | $12.38 | | | $8.50 | | | $9.95 |
Net Assets | | $ | 20,560,732 | | $ | 25,734,460 | | $ | 67,083,601 |
Shares of beneficial interest outstanding | | | 1,660,239 | | | 3,026,212 | | | 6,745,033 |
1 The redemption price per shares excludes the applicable contingent deferred sales charges.
2 NAV/0.9525, based on maximum sales charge of 4.75% of the offering price.
| | | | |
| June 30, 2009 | | 80 | | See Notes to Financial Statements |
Statements of Assets & Liabilities (Unaudited)
| | | | | | | | | | | |
| | | ACCESSOR
MORTGAGE
SECURITIES | | | ACCESSOR LIMITED
DURATION U.S.
GOVERNMENT | | | ACCESSOR U.S.
GOVERNMENT
MONEY |
| ASSETS: | | | | | | | | | | | |
Investments, at value (Note 2) | | $ | 52,215,035 | | | $ | 37,059,292 | | | $ | 746,667,074 |
Repurchase agreements, at value | | | — | | | | — | | | | 103,000,000 |
| | | | | | | | | | | |
Total Investments | | | 52,215,035 | | | | 37,059,292 | | | | 849,667,074 |
Cash | | | 7,553,531 | | | | 5,129,215 | | | | 6,919,797 |
Receivable for investments sold and TBA sale commitments | | | 88,677,766 | | | | — | | | | — |
TBA purchase commitments, at value (Cost payable $32,169,570, $0 and $0, respectively) | | | 32,382,808 | | | | — | | | | — |
Dividends and interest receivable | | | 229,376 | | | | 167,095 | | | | 2,957,922 |
Receivable for investments sold | | | — | | | | 532,752 | | | | — |
Receivable for capital shares sold | | | 327,473 | | | | 1,255 | | | | 151,147 |
Prepaid expenses and other assets | | | 19,255 | | | | 1,684 | | | | 44,772 |
| | | | | | | | | | | |
Total Assets | | | 181,405,244 | | | | 42,891,293 | | | | 859,740,712 |
| | | | | | | | | | | |
| LIABILITIES: | | | | | | | | | | | |
Distribution payable | | | — | | | | — | | | | 174,667 |
Payable for investments securities purchased and TBA purchase commitments | | | 100,777,722 | | | | 1,005,938 | | | | 25,000,000 |
TBA sale commitments, at value (proceeds receivable $22,648,677, $0 and $0, respectively) | | | 22,764,849 | | | | — | | | | — |
Payable for capital shares redeemed | | | 55,103 | | | | 2,244,624 | | | | 134,109 |
Payable to investment advisor (Note 3) | | | 16,622 | | | | 4,604 | | | | 55,440 |
Payable to money managers (Note 3) | | | 11,543 | | | | 11,646 | | | | — |
Payable to administrator (Note 3) | | | 4,288 | | | | 2,584 | | | | 45,418 |
Payable for 12b-1 & administrative services fees (Note 3) | | | 1,173 | | | | — | | | | 1,976 |
Payable for chief compliance officer fee (Note 3) | | | — | | | | — | | | | 1,119 |
Payable for shareholder services (Note 3) | | | 1,681 | | | | — | | | | 61,296 |
Accrued expenses and other liabilities | | | 28,205 | | | | 19,702 | | | | 63,439 |
| | | | | | | | | | | |
Total Liabilities | | | 123,661,186 | | | | 3,289,098 | | | | 25,537,464 |
| | | | | | | | | | | |
| NET ASSETS | | $ | 57,744,058 | | | $ | 39,602,195 | | | $ | 834,203,248 |
| | | | | | | | | | | |
| NET ASSETS CONSIST OF: | | | | | | | | | | | |
Paid-in capital | | $ | 62,691,967 | | | $ | 38,905,878 | | | $ | 834,099,921 |
Net unrealized appreciation (depreciation) of investments | | | (989,192 | ) | | | 440,486 | | | | — |
Undistributed net investment income (loss) | | | 218,175 | | | | (4,600 | ) | | | 3 |
Accumulated net realized gain (loss) on investments, futures contracts, options, and foreign currencies | | | (4,176,892 | ) | | | 260,431 | | | | 103,324 |
| | | | | | | | | | | |
| TOTAL NET ASSETS | | $ | 57,744,058 | | | $ | 39,602,195 | | | $ | 834,203,248 |
| | | | | | | | | | | |
| INVESTMENTS, AT COST | | $ | 53,301,293 | | | $ | 36,618,806 | | | $ | 849,667,074 |
| | | | |
| See Notes to Financial Statements | | 81 | | June 30, 2009 |
Statements of Assets & Liabilities (Unaudited)
| | | | | | | | | | |
| | | ACCESSOR
MORTGAGE
SECURITIES | | | ACCESSOR LIMITED
DURATION U.S.
GOVERNMENT | | ACCESSOR U.S.
GOVERNMENT
MONEY |
| | | |
| PRICING OF SHARES | | | | | | | | | | |
Limited Duration U.S. Government: | | | | | | | | | | |
Net Asset Value, offering & redemption price per share | | | N/A | | | | $12.16 | | | N/A |
Net Assets | | | N/A | | | $ | 39,602,195 | | | N/A |
Shares of beneficial interest outstanding | | | N/A | | | | 3,256,245 | | | N/A |
Institutional Class: | | | | | | | | | | |
Net Asset Value, offering & redemption price per share | | | $12.46 | | | | N/A | | | $1.00 |
Net Assets | | $ | 20,847,965 | | | | N/A | | $ | 348,800,331 |
Shares of beneficial interest outstanding | | | 1,673,340 | | | | N/A | | | 348,751,490 |
Investor Class: | | | | | | | | | | |
Net Asset Value, offering & redemption price per share | | | $12.46 | | | | N/A | | | $1.00 |
Net Assets | | $ | 681,508 | | | | N/A | | $ | 7,987,771 |
Shares of beneficial interest outstanding | | | 54,713 | | | | N/A | | | 7,986,187 |
C Class: | | | | | | | | | | |
Net Asset Value & offering price per share | | | $12.48 | 1 | | | N/A | | | $1.00 |
Net Assets | | $ | 400,456 | | | | N/A | | $ | 1,946,679 |
Shares of beneficial interest outstanding | | | 32,089 | | | | N/A | | | 1,946,589 |
A Class: | | | | | | | | | | |
Net Asset Value, offering and redemption price per share | | | N/A | | | | N/A | | | $1.00 |
Net Assets | | | N/A | | | | N/A | | $ | 508,041 |
Shares of beneficial interest outstanding | | | N/A | | | | N/A | | | 507,966 |
Z Class: | | | | | | | | | | |
Net Asset Value, offering and redemption price per share1 | | | $12.46 | | | | N/A | | | $1.00 |
Net Assets | | $ | 35,814,129 | | | | N/A | | $ | 474,960,426 |
Shares of beneficial interest outstanding | | | 2,874,130 | | | | N/A | | | 474,908,712 |
1 The redemption price per shares excludes the applicable contingent deferred sales charges.
| | | | |
| June 30, 2009 | | 82 | | See Notes to Financial Statements |
Statements of Assets & Liabilities (Unaudited)
| | | | | | | | | | | | |
| | | ACCESSOR INCOME
ALLOCATION | | | ACCESSOR INCOME
& GROWTH
ALLOCATION | | | ACCESSOR
BALANCED
ALLOCATION | |
| ASSETS: | | | | | | | | | | | | |
Investments in affiliates, at value (Note 2) | | $ | 18,950,007 | | | $ | 41,609,686 | | | $ | 107,660,724 | |
Cash | | | 339,272 | | | | 1,692,562 | | | | 949,217 | |
Receivable for capital shares sold | | | 4,809 | | | | 698,227 | | | | 95,091 | |
Due from advisor | | | 300 | | | | 500 | | | | 1,300 | |
Dividends and interest receivable | | | 276 | | | | — | | | | 531 | |
Prepaid expenses and other assets | | | 19,663 | | | | 18,892 | | | | 21,257 | |
| | | | | | | | | | | | |
Total Assets | | | 19,314,327 | | | | 44,019,867 | | | | 108,728,120 | |
| | | | | | | | | | | | |
| LIABILITIES: | | | | | | | | | | | | |
Payable for capital shares redeemed | | | 23,373 | | | | 29,257 | | | | 230,935 | |
Payable for 12b-1 & administrative services fees (Note 3) | | | 3,468 | | | | 8,846 | | | | 23,068 | |
Payable for chief compliance officer fee (Note 3) | | | — | | | | — | | | | 2 | |
Payable to administrator (Note 3) | | | 382 | | | | 827 | | | | 2,121 | |
Accrued expenses and other liabilities | | | 8,600 | | | | 9,062 | | | | 10,333 | |
| | | | | | | | | | | | |
Total Liabilities | | | 35,823 | | | | 47,992 | | | | 266,459 | |
| | | | | | | | | | | | |
| NET ASSETS | | $ | 19,278,504 | | | $ | 43,971,875 | | | $ | 108,461,661 | |
| | | | | | | | | | | | |
| NET ASSETS CONSIST OF: | | | | | | | | | | | | |
Paid-in capital | | $ | 21,690,726 | | | $ | 50,193,579 | | | $ | 129,250,658 | |
Net unrealized appreciation (depreciation) of investments | | | (2,005,749 | ) | | | (5,977,576 | ) | | | (19,875,849 | ) |
Undistributed (distribution in excess) net investment income (loss) | | | (1,151 | ) | | | (1,857 | ) | | | (3,889 | ) |
Accumulated net realized gain (loss) on investments | | | (405,322 | ) | | | (242,271 | ) | | | (909,259 | ) |
| | | | | | | | | | | | |
| TOTAL NET ASSETS | | $ | 19,278,504 | | | $ | 43,971,875 | | | $ | 108,461,661 | |
| | | | | | | | | | | | |
| INVESTMENTS, AT COST | | $ | 20,955,756 | | | $ | 47,587,262 | | | $ | 127,536,573 | |
| | | |
| PRICING OF SHARES | | | | | | | | | | | | |
Institutional Class: | | | | | | | | | | | | |
Net Asset Value, offering & redemption price per share | | | $13.32 | | | | $13.09 | | | | $12.94 | |
Net Assets | | $ | 13,865,200 | | | $ | 31,541,550 | | | $ | 67,537,807 | |
Shares of beneficial interest outstanding | | | 1,041,053 | | | | 2,410,224 | | | | 5,218,460 | |
Investor Class: | | | | | | | | | | | | |
Net Asset Value, offering & redemption price per share | | | $13.31 | | | | $13.08 | | | | $12.93 | |
Net Assets | | $ | 1,444,282 | | | $ | 3,621,417 | | | $ | 9,449,433 | |
Shares of beneficial interest outstanding | | | 108,514 | | | | 276,935 | | | | 730,641 | |
C Class: | | | | | | | | | | | | |
Net Asset Value & offering price per share1 | | | $13.28 | | | | $13.04 | | | | $12.91 | |
Net Assets | | $ | 2,806,246 | | | $ | 5,731,499 | | | $ | 11,700,466 | |
Shares of beneficial interest outstanding | | | 211,238 | | | | 439,667 | | | | 906,324 | |
A Class: | | | | | | | | | | | | |
Net Asset Value & redemption price per share | | | $13.31 | | | | $13.07 | | | | $12.93 | |
Public offering price per share | | | $13.97 | 2 | | | $13.87 | 3 | | | $13.72 | 3 |
Net Assets | | $ | 1,162,776 | | | $ | 3,077,409 | | | $ | 19,773,955 | |
Shares of beneficial interest outstanding | | | 87,336 | | | | 235,475 | | | | 1,529,752 | |
1 The redemption price per shares excludes the applicable contingent deferred sales charges.
2 NAV/0.9525, based on maximum sales charge of 4.75% of the offering price.
3 NAV/0.9425, based on maximum sales charge of 5.75% of the offering price.
| | | | |
| See Notes to Financial Statements | | 83 | | June 30, 2009 |
Statements of Assets & Liabilities (Unaudited)
| | | | | | | | | | | | |
| | | ACCESSOR
GROWTH & INCOME
ALLOCATION | | | ACCESSOR
GROWTH
ALLOCATION | | | ACCESSOR
AGGRESSIVE
GROWTH
ALLOCATION | |
| ASSETS: | | | | | | | | | | | | |
Investments in affiliates, at value (Note 2) | | $ | 100,891,184 | | | $ | 98,569,387 | | | $ | 49,223,063 | |
Cash | | | 2,297,697 | | | | 705,889 | | | | 482,932 | |
Due from advisor | | | 3,200 | | | | 3,800 | | | | 1,900 | |
Receivable for capital shares sold | | | 67,000 | | | | 72,319 | | | | 29,553 | |
Prepaid expenses and other assets | | | 25,772 | | | | 22,387 | | | | 19,458 | |
| | | | | | | | | | | | |
Total Assets | | | 103,284,853 | | | | 99,373,782 | | | | 49,756,906 | |
| | | | | | | | | | | | |
| LIABILITIES: | | | | | | | | | | | | |
Payable for capital shares redeemed | | | 119,895 | | | | 28,263 | | | | 3,526 | |
Payable for 12b-1 & administrative services fees (Note 3) | | | 49,134 | | | | 40,696 | | | | 13,391 | |
Payable for chief compliance officer fee (Note 3) | | | 57 | | | | 5 | | | | — | |
Payable to administrator (Note 3) | | | 2,062 | | | | 1,994 | | | | 962 | |
Payable to ReFlow (Note 2) | | | 451 | | | | — | | | | — | |
Accrued expenses and other liabilities | | | 11,343 | | | | 10,957 | | | | 9,227 | |
| | | | | | | | | | | | |
Total Liabilities | | | 182,942 | | | | 81,915 | | | | 27,106 | |
| | | | | | | | | | | | |
| NET ASSETS | | $ | 103,101,911 | | | $ | 99,291,867 | | | $ | 49,729,800 | |
| | | | | | | | | | | | |
| NET ASSETS CONSIST OF: | | | | | | | | | | | | |
Paid-in capital | | $ | 129,170,576 | | | $ | 126,184,661 | | | $ | 65,374,175 | |
Net unrealized appreciation (depreciation) of investments | | | (23,342,909 | ) | | | (25,585,844 | ) | | | (15,063,636 | ) |
Undistributed (distributions in excess) net investment income (loss) | | | (6,152 | ) | | | (5,706 | ) | | | (2,385 | ) |
Accumulated net realized gain (loss) on investments | | | (2,719,604 | ) | | | (1,301,244 | ) | | | (578,354 | ) |
| | | | | | | | | | | | |
| TOTAL NET ASSETS | | $ | 103,101,911 | | | $ | 99,291,867 | | | $ | 49,729,800 | |
| | | | | | | | | | | | |
| INVESTMENTS, AT COST | | $ | 124,234,093 | | | $ | 124,155,231 | | | $ | 64,286,699 | |
| | | |
| PRICING OF SHARES | | | | | | | | | | | | |
Institutional Class: | | | | | | | | | | | | |
Net Asset Value, offering & redemption price per share | | | $12.43 | | | | $12.01 | | | | $11.54 | |
Net Assets | | $ | 43,200,062 | | | $ | 42,689,559 | | | $ | 28,412,640 | |
Shares of beneficial interest outstanding | | | 3,475,378 | | | | 3,554,610 | | | | 2,462,513 | |
Investor Class: | | | | | | | | | | | | |
Net Asset Value, offering & redemption price per share | | | $12.41 | | | | $12.00 | | | | $11.26 | |
Net Assets | | $ | 11,476,611 | | | $ | 11,825,311 | | | $ | 7,511,516 | |
Shares of beneficial interest outstanding | | | 924,597 | | | | 985,396 | | | | 667,077 | |
C Class: | | | | | | | | | | | | |
Net Asset Value & offering price per share1 | | | $12.37 | | | | $11.94 | | | | $11.09 | |
Net Assets | | $ | 30,611,588 | | | $ | 27,148,193 | | | $ | 5,990,467 | |
Shares of beneficial interest outstanding | | | 2,473,781 | | | | 2,273,477 | | | | 540,148 | |
A Class: | | | | | | | | | | | | |
Net Asset Value & redemption price per share | | | $12.39 | | | | $12.00 | | | | $11.42 | |
Public offering price per share2 | | | $13.15 | | | | $12.73 | | | | $12.12 | |
Net Assets | | $ | 17,813,650 | | | $ | 17,628,804 | | | $ | 7,815,177 | |
Shares of beneficial interest outstanding | | | 1,437,238 | | | | 1,468,706 | | | | 684,221 | |
1 The redemption price per shares excludes the applicable contingent deferred sales charges.
2 NAV/0.9425, based on maximum sales charge of 5.75% of the offering price.
| | | | |
| June 30, 2009 | | 84 | | See Notes to Financial Statements |
Statements of Operations
For the Six Months Ended June 30, 2009 (Unaudited)
| | | | | | | | | | | | | | | | |
| | | ACCESSOR
GROWTH | | | ACCESSOR
VALUE | | | ACCESSOR
SMALL TO
MID CAP | | | ACCESSOR
INTERNATIONAL
EQUITY | |
| INVESTMENT INCOME: | | | | | | | | | | | | | | | | |
Dividends | | $ | 692,837 | | | $ | 1,211,509 | | | $ | 1,245,214 | | | $ | 2,276,876 | |
Foreign taxes withheld | | | — | | | | — | | | | — | | | | (282,701 | ) |
| | | | | | | | | | | | | | | | |
Total Investment Income | | | 692,837 | | | | 1,211,509 | | | | 1,245,214 | | | | 1,994,175 | |
| | | | | | | | | | | | | | | | |
| EXPENSES: | | | | | | | | | | | | | | | | |
Management fees (Note 3) | | | 169,580 | | | | 156,456 | | | | 410,266 | | | | 241,127 | |
Money managers fees (Note 3) | | | 101,461 | | | | 91,315 | | | | 273,510 | | | | 197,285 | |
Distribution and service fees (Note 3) | | | | | | | | | | | | | | | | |
Investor Class | | | 862 | | | | 834 | | | | 1,803 | | | | 1,887 | |
C Class | | | 3,568 | | | | 2,060 | | | | 2,901 | | | | 4,860 | |
A Class | | | 764 | | | | 138 | | | | 5,282 | | | | 7,335 | |
Administrative services fees — Investor Class (Note 3) | | | 862 | | | | 834 | | | | 1,803 | | | | 1,887 | |
Shareholder servicing fees — Institutional Class | | | 4,389 | | | | 3,870 | | | | 17,479 | | | | 5,999 | |
Chief compliance officer fees (Note 3) | | | 612 | | | | 598 | | | | 758 | | | | 624 | |
Transfer agent & administration fees (Note 3) | | | 46,823 | | | | 42,225 | | | | 80,856 | | | | 53,813 | |
Fund accounting fees | | | 22,315 | | | | 20,782 | | | | 38,387 | | | | 25,526 | |
Registration fees | | | 17,162 | | | | 16,938 | | | | 19,789 | | | | 22,871 | |
Audit fees | | | 10,875 | | | | 10,651 | | | | 11,103 | | | | 9,580 | |
Legal fees | | | 3,223 | | | | 2,952 | | | | 5,558 | | | | 12,575 | |
Printing/postage expense | | | 4,545 | | | | 4,109 | | | | 9,942 | | | | 6,194 | |
Custodian fees | | | 3,454 | | | | 5,980 | | | | 13,536 | | | | 54,374 | |
Trustees fees | | | 3,420 | | | | 3,156 | | | | 5,919 | | | | 4,004 | |
ReFlow fees (Note 3) | | | — | | | | — | | | | 251 | | | | 642 | |
Other expenses | | | 3,728 | | | | 4,048 | | | | 7,268 | | | | 9,834 | |
| | | | | | | | | | | | | | | | |
Total net expenses | | | 397,643 | | | | 366,946 | | | | 906,411 | | | | 660,417 | |
| | | | | | | | | | | | | | | | |
| NET INVESTMENT INCOME: | | | 295,194 | | | | 844,563 | | | | 338,803 | | | | 1,333,758 | |
| | | | | | | | | | | | | | | | |
Net realized loss on investments: | | | (6,851,824 | ) | | | (13,883,944 | ) | | | (23,970,194 | ) | | | (3,457,856 | ) |
Net realized loss on foreign currency transactions | | | — | | | | — | | | | — | | | | (56,353 | ) |
Net change in unrealized appreciation on investments | | | 10,204,142 | | | | 9,609,736 | | | | 30,248,202 | | | | 9,724,633 | |
Net change in unrealized appreciation on translations of assets and liabilities in foreign currencies | | | — | | | | — | | | | — | | | | 19,932 | |
| | | | | | | | | | | | | | | | |
| NET REALIZED AND UNREALIZED GAIN (LOSS) ON INVESTMENTS AND FOREIGN CURRENCY | | | 3,352,318 | | | | (4,274,208 | ) | | | 6,278,008 | | | | 6,230,356 | |
| | | | | | | | | | | | | | | | |
| NET INCREASE (DECREASE) IN NET ASSETS RESULTING FROM OPERATIONS | | $ | 3,647,512 | | | $ | (3,429,645 | ) | | $ | 6,616,811 | | | $ | 7,564,114 | |
| | | | | | | | | | | | | | | | |
| | | | |
| See Notes to Financial Statements | | 85 | | June 30, 2009 |
Statements of Operations
For the Six Months Ended June 30, 2009 (Unaudited)
| | | | | | | | | | | | | | | | |
| | | ACCESSOR
TOTAL RETURN | | | ACCESSOR
STRATEGIC
ALTERNATIVES | | | ACCESSOR
FRONTIER
MARKETS | | | ACCESSOR HIGH
YIELD BOND | |
| INVESTMENT INCOME: | | | | | | | | | | | | | | | | |
Interest | | $ | — | | | $ | 35,942 | | | $ | 25,614 | | | $ | 4,390,484 | |
Dividends | | | 338,524 | | | | 985,253 | | | | 26,971 | | | | 4,152 | |
Swap income | | | — | | | | — | | | | 79,358 | | | | — | |
Foreign taxes withheld | | | (3,410 | ) | | | — | | | | — | | | | — | |
| | | | | | | | | | | | | | | | |
Total Investments Income | | | 335,114 | | | | 1,021,195 | | | | 131,943 | | | | 4,394,636 | |
| | | | | | | | | | | | | | | | |
| EXPENSES: | | | | | | | | | | | | | | | | |
Management fees (Note 3) | | | 15,732 | | | | 325,614 | | | | 74,507 | | | | 142,291 | |
Money managers fees (Note 3) | | | 65,550 | | | | — | | | | — | | | | 98,813 | |
Distribution and service fees (Note 3) | | | | | | | | | | | | | | | | |
Investor Class | | | N/A | | | | — | | | �� | — | | | | 2,106 | |
C Class | | | N/A | | | | N/A | | | | N/A | | | | 3,666 | |
A Class | | | N/A | | | | N/A | | | | N/A | | | | 466 | |
Administrative services fees — Investor Class (Note 3) | | | — | | | | — | | | | — | | | | 2,106 | |
Shareholder servicing fees — Institutional Class | | | — | | | | 10,461 | | | | 1,350 | | | | 11,109 | |
Chief compliance officer fees (Note 3) | | | 984 | | | | 643 | | | | 117 | | | | 1,072 | |
Transfer agent & administration fees (Note 3) | | | 9,727 | | | | 52,486 | | | | 3,720 | | | | 42,180 | |
Audit fees | | | 11,404 | | | | 14,030 | | | | 11,664 | | | | 12,213 | |
Custodian fees | | | — | | | | — | | | | 2,316 | | | | 1,517 | |
Fund accounting fees | | | 6,886 | | | | 30,428 | | | | 17,367 | | | | 23,323 | |
Legal fees | | | 1,230 | | | | 17,957 | | | | 2,344 | | | | 3,746 | |
Registration fees | | | 634 | | | | 10,300 | | | | 4,196 | | | | 14,644 | |
Printing/postage expense | | | 1,475 | | | | 6,824 | | | | 3,903 | | | | 9,036 | |
Trustees fees | | | 1,230 | | | | 4,190 | | | | 540 | | | | 3,125 | |
ReFlow fees (Note 3) | | | — | | | | — | | | | — | | | | 707 | |
Other expenses | | | — | | | | — | | | | 1,252 | | | | 11,360 | |
| | | | | | | | | | | | | | | | |
Total net expenses | | | 114,852 | | | | 472,933 | | | | 123,276 | | | | 383,480 | |
| | | | | | | | | | | | | | | | |
| NET INVESTMENT INCOME: | | | 220,262 | | | | 548,262 | | | | 8,667 | | | | 4,011,156 | |
| | | | | | | | | | | | | | | | |
Net realized gain (loss) on investments | | | (3,817,466 | ) | | | 87,272 | | | | (177,926 | ) | | | (2,247,644 | ) |
Net realized loss on foreign currency transactions | | | — | | | | — | | | | (1,302 | ) | | | — | |
Net realized gain on swap contracts | | | — | | | | — | | | | 2,369,849 | | | | — | |
Net change in unrealized appreciation (depreciation) on investments | | | 2,242,885 | | | | (2,075,955 | ) | | | 2,386,541 | | | | 11,771,383 | |
Net change in unrealized depreciation on swap contracts | | | — | | | | — | | | | (136,378 | ) | | | | |
| | | | | | | | | | | | | | | | |
| NET REALIZED AND UNREALIZED GAIN (LOSS) ON INVESTMENTS, SWAP CONTRACTS AND FOREIGN CURRENCY | | | (1,574,581 | ) | | | (1,988,683 | ) | | | 4,440,784 | | | | 9,523,739 | |
| | | | | | | | | | | | | | | | |
| NET INCREASE (DECREASE) IN NET ASSETS RESULTING FROM OPERATIONS | | $ | (1,354,319 | ) | | $ | (1,440,421 | ) | | $ | 4,449,451 | | | $ | 13,534,895 | |
| | | | | | | | | | | | | | | | |
| | | | |
| June 30, 2009 | | 86 | | See Notes to Financial Statements |
Statements of Operations
For the Six Months Ended June 30, 2009 (Unaudited)
| | | | | | | | | | | | | |
| | | ACCESSOR
INVESTMENT
GRADE
FIXED-INCOME | | ACCESSOR
MORTGAGE
SECURITIES | | ACCESSOR
LIMITED
DURATION U.S.
GOVERNMENT | | ACCESSOR U.S.
GOVERNMENT
MONEY | |
| INVESTMENT INCOME: | | | | | | | | | | | | | |
Interest | | $ | 2,779,624 | | $ | 1,649,570 | | $ | 821,560 | | $ | 4,572,714 | |
| | | | | | | | | | | | | |
Total Investments Income | | | 2,779,624 | | | 1,649,570 | | | 821,560 | | | 4,572,714 | |
| | | | | | | | | | | | | |
| EXPENSES: | | | | | | | | | | | | | |
Management fees (Note 3) | | | 111,296 | | | 104,145 | | | 30,388 | | | 395,794 | |
Money managers fees (Note 3) | | | 84,315 | | | 72,323 | | | 75,705 | | | — | |
Distribution and service fees (Note 3) | | | | | | | | | | | | | |
Investor Class | | | 1,123 | | | 1,003 | | | N/A | | | 13,576 | |
C Class | | | 3,138 | | | 2,773 | | | N/A | | | 10,595 | |
A Class | | | 1,123 | | | — | | | N/A | | | 920 | |
Administrative services fees — Investor Class (Note 3) | | | — | | | 1,003 | | | N/A | | | 13,576 | |
Shareholder services fees — Institutional Class | | | 4,856 | | | 3,964 | | | N/A | | | 496,839 | |
Investor Class | | | — | | | — | | | N/A | | | 13,576 | |
C Class | | | — | | | — | | | N/A | | | 2,649 | |
A Class | | | — | | | — | | | N/A | | | 919 | |
Chief compliance officer fees (Note 3) | | | 641 | | | 571 | | | 563 | | | — | |
Transfer agent & administration fees (Note 3) | | | 35,057 | | | 32,711 | | | 18,926 | | | 273,895 | |
Registration fees | | | 15,086 | | | 14,503 | | | 1,647 | | | 42,040 | |
Audit fees | | | 12,314 | | | 14,348 | | | 11,842 | | | 13,219 | |
Fund accounting fees | | | 20,312 | | | 17,718 | | | 13,327 | | | 258,139 | |
Custodian fees | | | 9,314 | | | 20,273 | | | 1,938 | | | 20,109 | |
Legal fees | | | 16,747 | | | 2,743 | | | 2,492 | | | 68,507 | |
Printing/postage expense | | | 4,379 | | | 3,458 | | | 2,969 | | | 60,980 | |
ReFlow fees (Note 3) | | | 3,849 | | | — | | | — | | | — | |
Trustees fees | | | 3,101 | | | 2,719 | | | 2,337 | | | 45,471 | |
Other expenses | | | 13,953 | | | 15,094 | | | 8,341 | | | 25,677 | |
| | | | | | | | | | | | | |
Total expenses before waiver | | | 340,604 | | | 309,349 | | | 170,475 | | | 1,756,481 | |
Less fees waived: | | | | | | | | | | | | | |
Distribution and service fees | | | | | | | | | | | | | |
Investor Class | | | N/A | | | N/A | | | N/A | | | (11,311 | ) |
C Class | | | N/A | | | N/A | | | N/A | | | (8,587 | ) |
A Class | | | N/A | | | N/A | | | N/A | | | (440 | ) |
Administrative services fees — Investor Class
(Note 2 and 3): | | | N/A | | | N/A | | | N/A | | | (6,526 | ) |
Shareholder services fees | | | | | | | | | | | | | |
Institutional Class | | | N/A | | | N/A | | | N/A | | | (27,390 | ) |
Investor Class | | | N/A | | | N/A | | | N/A | | | (725 | ) |
C Class | | | N/A | | | N/A | | | N/A | | | (156 | ) |
A Class | | | N/A | | | N/A | | | N/A | | | (48 | ) |
| | | | | | | | | | | | | |
Total net expenses | | | 340,604 | | | 309,349 | | | 170,475 | | | 1,701,298 | |
| | | | | | | | | | | | | |
| NET INVESTMENT INCOME: | | | 2,439,020 | | | 1,340,221 | | | 651,085 | | | 2,871,416 | |
| | | | | | | | | | | | | |
| | | | |
| See Notes to Financial Statements | | 87 | | June 30, 2009 |
Statements of Operations
For the Six Months Ended June 30, 2009 (Unaudited)
| | | | | | | | | | | | | | | | |
| | | ACCESSOR
INVESTMENT
GRADE
FIXED-INCOME | | | ACCESSOR
MORTGAGE
SECURITIES | | | ACCESSOR
LIMITED
DURATION U.S.
GOVERNMENT | | | ACCESSOR U.S.
GOVERNMENT
MONEY | |
Net realized gain (loss) on investments and options contracts | | $ | (1,286,705 | ) | | $ | 1,272,914 | | | $ | 234,091 | | | $ | (14,853 | ) |
Net realized gain on futures contracts | | | 205,481 | | | | — | | | | — | | | | — | |
Net change in unrealized appreciation (depreciation) on investments and options contracts | | | 1,793,756 | | | | 459,532 | | | | (189,485 | ) | | | | |
Net change in unrealized depreciation on futures contracts | | | (68,427 | ) | | | (38,203 | ) | | | — | | | | — | |
| | | | | | | | | | | | | | | | |
| NET REALIZED AND UNREALIZED GAIN (LOSS) ON INVESTMENTS, FUTURES CONTRACTS, OPTIONS CONTRACTS AND FOREIGN CURRENCY | | | 644,105 | | | | 1,694,243 | | | | 44,606 | | | | (14,853 | ) |
| | | | | | | | | | | | | | | | |
| NET INCREASE IN NET ASSETS RESULTING FROM OPERATIONS | | $ | 3,083,125 | | | $ | 3,034,464 | | | $ | 695,691 | | | $ | 2,856,563 | |
| | | | | | | | | | | | | | | | |
| | | | |
| June 30, 2009 | | 88 | | See Notes to Financial Statements |
Statements of Operations
For the Six Months Ended June 30, 2009 (Unaudited)
| | | | | | | | | | | | |
| | | ACCESSOR
INCOME
ALLOCATION | | | ACCESSOR
INCOME &
GROWTH
ALLOCATION | | | ACCESSOR
BALANCED
ALLOCATION | |
| INVESTMENT INCOME: | | | | | | | | | | | | |
Dividends from affiliated investment company shares | | $ | 516,834 | | | $ | 760,351 | | | $ | 1,561,313 | |
| | | | | | | | | | | | |
Total Investment Income | | | 516,834 | | | | 760,351 | | | | 1,561,313 | |
| | | | | | | | | | | | |
| EXPENSES: | | | | | | | | | | | | |
Management fees (Note 3) | | | 8,622 | | | | 18,509 | | | | 47,863 | |
Distribution and service fees (Note 3) | | | | | | | | | | | | |
Investor Class | | | 2,159 | | | | 4,231 | | | | 11,858 | |
C Class | | | 13,569 | | | | 28,592 | | | | 57,409 | |
A Class | | | 1,349 | | | | 4,855 | | | | 32,680 | |
Administrative services fees — Investor Class (Note 3) | | | 2,159 | | | | 4,231 | | | | 11,858 | |
Chief compliance officer fees (Note 3) | | | 494 | | | | 538 | | | | 680 | |
Registration fees | | | 17,314 | | | | 16,890 | | | | 20,393 | |
Audit fees | | | 7,288 | | | | 7,310 | | | | 7,373 | |
Printing/postage expense | | | 1,049 | | | | 2,175 | | | | 5,796 | |
Custodian fees | | | 2,989 | | | | 3,001 | | | | 3,000 | |
Fund accounting fees | | | 1,088 | | | | 2,325 | | | | 6,018 | |
Legal fees | | | 783 | | | | 1,652 | | | | 4,255 | |
Transfer agent & administration fees (Note 3) | | | 1,266 | | | | 2,323 | | | | 6,186 | |
Trustees fees | | | 741 | | | | 1,598 | | | | 4,176 | |
ReFlow fees (Note 3) | | | — | | | | 77 | | | | — | |
Other expense | | | 1,701 | | | | 2,166 | | | | 3,663 | |
| | | | | | | | | | | | |
Total expenses before waiver | | | 62,571 | | | | 100,473 | | | | 223,208 | |
Less fees waived of management fees and transfer agent fees | | | (3,693 | ) | | | (7,762 | ) | | | (20,119 | ) |
| | | | | | | | | | | | |
Total net expenses | | | 58,878 | | | | 92,711 | | | | 203,089 | |
| | | | | | | | | | | | |
| NET INVESTMENT INCOME: | | | 457,956 | | | | 667,640 | | | | 1,358,224 | |
| | | | | | | | | | | | |
Net realized gain (loss) on affiliated investments | | | 27,045 | | | | (132,361 | ) | | | (381,474 | ) |
Net change in unrealized appreciation on investments | | | 725,364 | | | | 1,472,390 | | | | 4,034,572 | |
| | | | | | | | | | | | |
| NET REALIZED AND UNREALIZED GAIN ON INVESTMENTS | | | 752,409 | | | | 1,340,029 | | | | 3,653,098 | |
| | | | | | | | | | | | |
| NET INCREASE IN NET ASSETS RESULTING FROM OPERATIONS | | $ | 1,210,365 | | | $ | 2,007,669 | | | $ | 5,011,322 | |
| | | | | | | | | | | | |
| | | | |
| See Notes to Financial Statements | | 89 | | June 30, 2009 |
Statements of Operations
For the Six Months Ended June 30, 2009 (Unaudited)
| | | | | | | | | | | | |
| | | ACCESSOR
GROWTH &
INCOME
ALLOCATION | | | ACCESSOR
GROWTH
ALLOCATION | | | ACCESSOR
AGGRESSIVE
GROWTH
ALLOCATION | |
| INVESTMENT INCOME: | | | | | | | | | | | | |
Dividends from affiliated investment company shares | | $ | 1,355,378 | | | $ | 898,038 | | | $ | 219,160 | |
| | | | | | | | | | | | |
Total Investment Income | | | 1,355,378 | | | | 898,038 | | | | 219,160 | |
| | | | | | | | | | | | |
| EXPENSES: | | | | | | | | | | | | |
Management fees (Note 3) | | | 47,634 | | | | 45,756 | | | | 21,719 | |
Distribution and service fees (Note 3) | | | | | | | | | | | | |
Investor Class | | | 13,288 | | | | 14,525 | | | | 8,312 | |
C Class | | | 145,375 | | | | 126,019 | | | | 27,472 | |
A Class | | | 30,732 | | | | 28,719 | | | | 12,378 | |
Administrative services fees — Investor Class (Note 3) | | | 13,288 | | | | 14,525 | | | | 8,312 | |
Chief compliance officer fees (Note 3) | | | 655 | | | | 656 | | | | 547 | |
Registration fees | | | 23,432 | | | | 20,850 | | | | 19,082 | |
Printing/postage expense | | | 5,907 | | | | 5,890 | | | | 2,873 | |
Audit fees | | | 7,350 | | | | 7,342 | | | | 7,288 | |
Fund accounting fees | | | 5,976 | | | | 5,742 | | | | 2,720 | |
Legal fees | | | 4,192 | | | | 4,008 | | | | 1,851 | |
Transfer agent & administration fees (Note 3) | | | 9,941 | | | | 10,955 | | | | 5,609 | |
Trustees fees | | | 4,301 | | | | 4,077 | | | | 1,914 | |
Custodian fees | | | 3,014 | | | | 3,020 | | | | 2,990 | |
ReFlow fees (Note 3) | | | 450 | | | | 629 | | | | — | |
Other expense | | | 3,887 | | | | 3,731 | | | | 2,441 | |
| | | | | | | | | | | | |
Total expenses before waiver | | | 319,422 | | | | 296,444 | | | | 125,508 | |
Less fees waived of management fees | | | (23,268 | ) | | | (24,038 | ) | | | (12,108 | ) |
| | | | | | | | | | | | |
Total net expenses | | | 296,154 | | | | 272,406 | | | | 113,400 | |
| | | | | | | | | | | | |
| NET INVESTMENT INCOME: | | | 1,059,224 | | | | 625,632 | | | | 105,760 | |
| | | | | | | | | | | | |
Net realized loss on affiliated investments | | | (1,549,373 | ) | | | (729,906 | ) | | | (386,611 | ) |
Net change in unrealized appreciation on investments | | | 4,733,803 | | | | 3,972,003 | | | | 1,774,319 | |
| | | | | | | | | | | | |
| NET REALIZED AND UNREALIZED GAIN ON INVESTMENTS | | | 3,184,430 | | | | 3,242,097 | | | | 1,387,708 | |
| | | | | | | | | | | | |
| NET INCREASE IN NET ASSETS RESULTING FROM OPERATIONS | | $ | 4,243,654 | | | $ | 3,867,729 | | | $ | 1,493,468 | |
| | | | | | | | | | | | |
| | | | |
| June 30, 2009 | | 90 | | See Notes to Financial Statements |
Statements of Changes in Net Assets
| | | | | | | | | | | | | | | | |
| | | ACCESSOR GROWTH | | | ACCESSOR VALUE | |
| | | PERIOD ENDED
JUNE 30, 2009
(UNAUDITED) | | | YEAR ENDED
DEC. 31, 2008 | | | PERIOD ENDED
JUNE 30, 2009
(UNAUDITED) | | | YEAR ENDED
DEC. 31, 2008 | |
| OPERATIONS: | | | | | | | | | | | | | | | | |
Net investment income | | $ | 295,194 | | | $ | 289,271 | | | $ | 844,563 | | | $ | 2,031,361 | |
Net realized loss on investments transactions | | | (6,851,824 | ) | | | (23,708,308 | ) | | | (13,883,944 | ) | | | (25,617,477 | ) |
Change in unrealized net appreciation (depreciation) of investments | | | 10,204,142 | | | | (25,075,007 | ) | | | 9,609,736 | | | | (28,460,785 | ) |
| | | | | | | | | | | | | | | | |
Net increase/(decrease) in net assets resulting from operations | | | 3,647,512 | | | | (48,494,044 | ) | | | (3,429,645 | ) | | | (52,046,901 | ) |
| | | | | | | | | | | | | | | | |
| DISTRIBUTIONS TO SHAREHOLDERS: | | | | | | | | | | | | | | | | |
From net investment income | | | | | | | | | | | | | | | | |
Institutional Class | | | (176,202 | ) | | | (317,608 | ) | | | (574,664 | ) | | | (1,993,893 | ) |
Investor Class | | | (1,073 | ) | | | (7,267 | ) | | | (6,335 | ) | | | (17,696 | ) |
C Class | | | — | | | | — | | | | (2,220 | ) | | | (12,780 | ) |
A Class | | | (1,084 | ) | | | (695 | ) | | | (845 | ) | | | (2,217 | ) |
Z Class | | | (117,053 | ) | | | — | | | | (264,823 | ) | | | — | |
| | | | | | | | | | | | | | | | |
Total distributions | | | (295,412 | ) | | | (325,570 | ) | | | (848,887 | ) | | | (2,026,586 | ) |
| | | | | | | | | | | | | | | | |
| SHARE TRANSACTIONS: | | | | | | | | | | | | | | | | |
| Institutional Class | | | | | | | | | | | | | | | | |
Proceeds from sales of shares | | | 3,154,808 | | | | 20,439,421 | | | | 5,055,724 | | | | 17,608,490 | |
Issued to shareholders in reinvestment of distributions | | | 52,079 | | | | 60,746 | | | | 127,185 | | | | 328,686 | |
Cost of shares redeemed | | | (64,603,407 | ) | | | (54,462,088 | ) | | | (60,415,964 | ) | | | (28,588,494 | ) |
| | | | | | | | | | | | | | | | |
Net decrease from share transactions | | | (61,396,520 | ) | | | (33,961,921 | ) | | | (55,233,055 | ) | | | (10,651,318 | ) |
| | | | | | | | | | | | | | | | |
| Investor Class | | | | | | | | | | | | | | | | |
Proceeds from sales of shares | | | 47,539 | | | | 175,921 | | | | 57,255 | | | | 192,690 | |
Issued to shareholders in reinvestment of distributions | | | 745 | | | | 5,411 | | | | 4,738 | | | | 12,709 | |
Cost of shares redeemed | | | (328,309 | ) | | | (869,709 | ) | | | (222,997 | ) | | | (783,104 | ) |
| | | | | | | | | | | | | | | | |
Net decrease from share transactions | | | (280,025 | ) | | | (688,377 | ) | | | (161,004 | ) | | | (577,705 | ) |
| | | | | | | | | | | | | | | | |
| C Class | | | | | | | | | | | | | | | | |
Proceeds from sales of shares | | | 115,107 | | | | 427,569 | | | | 17,353 | | | | 343,902 | |
Issued to shareholders in reinvestment of distributions | | | — | | | | — | | | | 392 | | | | 6,492 | |
Cost of shares redeemed | | | (500,787 | ) | | | (4,122,446 | ) | | | (310,364 | ) | | | (3,213,618 | ) |
| | | | | | | | | | | | | | | | |
Net decrease from share transactions | | | (385,680 | ) | | | (3,694,877 | ) | | | (292,619 | ) | | | (2,863,224 | ) |
| | | | | | | | | | | | | | | | |
| A Class | | | | | | | | | | | | | | | | |
Proceeds from sales of shares | | | 6,820 | | | | 98,342 | | | | 353 | | | | 660 | |
Issued to shareholders in reinvestment of distributions | | | 1,030 | | | | 668 | | | | 845 | | | | 2,217 | |
Cost of shares redeemed | | | (92,643 | ) | | | (116,019 | ) | | | (2,761 | ) | | | (91,617 | ) |
| | | | | | | | | | | | | | | | |
Net decrease from share transactions | | | (84,793 | ) | | | (17,009 | ) | | | (1,563 | ) | | | (88,740 | ) |
| | | | | | | | | | | | | | | | |
| Z Class | | | | | | | | | | | | | | | | |
Proceeds from sales of shares | | | 58,843,034 | | | | — | | | | 59,007,641 | | | | — | |
Cost of shares redeemed | | | (7,092,491 | ) | | | — | | | | (6,488,588 | ) | | | — | |
| | | | | | | | | | | | | | | | |
Net increase from share transactions | | | 51,750,543 | | | | — | | | | 52,519,053 | | | | — | |
| | | | | | | | | | | | | | | | |
Total decrease from share transactions | | | (10,396,475 | ) | | | (38,362,184 | ) | | | (3,169,188 | ) | | | (14,180,987 | ) |
| | | | | | | | | | | | | | | | |
Net decrease in net assets | | | (7,044,375 | ) | | | (87,181,798 | ) | | | (7,447,720 | ) | | | (68,254,474 | ) |
| | | | | | | | | | | | | | | | |
| | | | |
| See Notes to Financial Statements | | 91 | | June 30, 2009 |
Statements of Changes in Net Assets
| | | | | | | | | | | | | | | | |
| | | ACCESSOR GROWTH | | | ACCESSOR VALUE | |
| | | PERIOD ENDED
JUNE 30, 2009
(UNAUDITED) | | | YEAR ENDED
DEC. 31, 2008 | | | PERIOD ENDED
JUNE 30, 2009
(UNAUDITED) | | | YEAR ENDED
DEC. 31, 2008 | |
| | | | |
| NET ASSETS: | | | | | | | | | | | | | | | | |
Beginning of period | | $ | 82,818,285 | | | $ | 170,000,083 | | | $ | 79,638,404 | | | $ | 147,892,878 | |
| | | | | | | | | | | | | | | | |
End of period (including undistributed (distributions in excess) net investment income (loss) of $(218), $0, $1,626 and $5,950 respectively) | | $ | 75,773,910 | | | $ | 82,818,285 | | | $ | 72,190,684 | | | $ | 79,638,404 | |
| | | | | | | | | | | | | | | | |
| Other Informations: | | | | | | | | | | | | | | | | |
| SHARE TRANSACTIONS: | | | | | | | | | | | | | | | | |
| Institutional Class | | | | | | | | | | | | | | | | |
Sold | | | 179,910 | | | | 885,590 | | | | 389,828 | | | | 970,385 | |
Distributions reinvested | | | 2,887 | | | | 2,994 | | | | 10,052 | | | | 18,487 | |
Redeemed | | | (3,538,162 | ) | | | (2,295,917 | ) | | | (4,536,461 | ) | | | (1,417,173 | ) |
| | | | | | | | | | | | | | | | |
Net decrease in shares outstanding | | | (3,355,365 | ) | | | (1,407,333 | ) | | | (4,136,581 | ) | | | (428,301 | ) |
| | | | | | | | | | | | | | | | |
| Investor Class | | | | | | | | | | | | | | | | |
Sold | | | 2,920 | | | | 7,764 | | | | 4,814 | | | | 9,141 | |
Distributions reinvested | | | 42 | | | | 317 | | | | 374 | | | | 719 | |
Redeemed | | | (19,008 | ) | | | (37,731 | ) | | | (17,578 | ) | | | (39,991 | ) |
| | | | | | | | | | | | | | | | |
Net decrease in shares outstanding | | | (16,046 | ) | | | (29,650 | ) | | | (12,390 | ) | | | (30,131 | ) |
| | | | | | | | | | | | | | | | |
| C Class | | | | | | | | | | | | | | | | |
Sold | | | 6,911 | | | | 17,996 | | | | 1,370 | | | | 16,149 | |
Distributions reinvested | | | — | | | | — | | | | 32 | | | | 322 | |
Redeemed | | | (29,505 | ) | | | (173,520 | ) | | | (24,504 | ) | | | (150,435 | ) |
| | | | | | | | | | | | | | | | |
Net decrease in shares outstanding | | | (22,594 | ) | | | (155,524 | ) | | | (23,102 | ) | | | (133,964 | ) |
| | | | | | | | | | | | | | | | |
| A Class | | | | | | | | | | | | | | | | |
Sold | | | 381 | | | | 5,487 | | | | 29 | | | | 36 | |
Distributions reinvested | | | 57 | | | | 39 | | | | 67 | | | | 124 | |
Redeemed | | | (5,066 | ) | | | (4,796 | ) | | | (205 | ) | | | (4,504 | ) |
| | | | | | | | | | | | | | | | |
Net increase (decrease) in shares outstanding | | | (4,628 | ) | | | 730 | | | | (109 | ) | | | (4,344 | ) |
| | | | | | | | | | | | | | | | |
| Z Class | | | | | | | | | | | | | | | | |
Sold | | | 3,207,926 | | | | — | | | | 4,441,339 | | | | — | |
Redeemed | | | (368,066 | ) | | | — | | | | (473,416 | ) | | | — | |
| | | | | | | | | | | | | | | | |
Net increase in shares outstanding | | | 2,839,860 | | | | — | | | | 3,967,923 | | | | — | |
| | | | | | | | | | | | | | | | |
| | | | |
| June 30, 2009 | | 92 | | See Notes to Financial Statements |
Statements of Changes in Net Assets
| | | | | | | | | | | | | | | | |
| | | ACCESSOR SMALL TO MID CAP | | | ACCESSOR INTERNATIONAL
EQUITY | |
| | | PERIOD ENDED
JUNE 30, 2009
(UNAUDITED) | | | YEAR ENDED
DEC. 31, 2008 | | | PERIOD ENDED
JUNE 30, 2009
(UNAUDITED) | | | YEAR ENDED
DEC. 31, 2008 | |
| OPERATIONS: | | | | | | | | | | | | | | | | |
Net investment income | | $ | 338,803 | | | $ | 162,655 | | | $ | 1,333,758 | | | $ | 4,448,882 | |
Net realized loss on investments | | | (23,970,194 | ) | | | (30,368,797 | ) | | | (3,457,856 | ) | | | (97,714,944 | ) |
Net realized gain (loss) on foreign currency transactions | | | — | | | | — | | | | (56,353 | ) | | | 73,194 | |
Change in unrealized appreciation (depreciation) on investments | | | 30,248,202 | | | | (69,855,089 | ) | | | 9,724,633 | | | | (26,209,806 | ) |
Change in unrealized appreciation on translations of assets and liabilities in foreign currencies | | | — | | | | — | | | | 19,932 | | | | 42,875 | |
| | | | | | | | | | | | | | | | |
Net increase (decrease) from operations | | | 6,616,811 | | | | (100,061,231 | ) | | | 7,564,114 | | | | (119,359,799 | ) |
| | | | | | | | | | | | | | | | |
| DISTRIBUTIONS TO SHAREHOLDERS: | | | | | | | | | | | | | | | | |
From net investment income | | | | | | | | | | | | | | | | |
Institutional Class | | | (528,432 | ) | | | — | | | | — | | | | (114,367 | ) |
Investor Class | | | (3,502 | ) | | | — | | | | — | | | | (2,508 | ) |
C Class | | | (346 | ) | | | — | | | | — | | | | — | |
A Class | | | (9,043 | ) | | | — | | | | — | | | | (6,014 | ) |
Z Class | | | (97,686 | ) | | | — | | | | — | | | | — | |
From net realized gains on investments | | | | | | | | | | | | | | | | |
Advisor Class | | | — | | | | (975,244 | ) | | | — | | | | (7,588,239 | ) |
Investor Class | | | — | | | | (15,268 | ) | | | — | | | | (166,429 | ) |
C Class | | | — | | | | (5,615 | ) | | | — | | | | (105,285 | ) |
A Class | | | — | | | | (23,620 | ) | | | — | | | | (399,020 | ) |
Z Class | | | — | | | | — | | | | — | | | | — | |
| | | | | | | | | | | | | | | | |
Total distributions | | | (639,009 | ) | | | (1,019,747 | ) | | | — | | | | (8,381,862 | ) |
| | | | | | | | | | | | | | | | |
| SHARE TRANSACTIONS: | | | | | | | | | | | | | | | | |
| Institutional Class | | | | | | | | | | | | | | | | |
Proceeds from sales of shares | | | 11,571,641 | | | | 45,620,395 | | | | 2,858,975 | | | | 29,392,704 | |
Issued to shareholders in reinvestment of distributions | | | 124,814 | | | | 270,692 | | | | — | | | | 2,139,881 | |
Cost of shares redeemed | | | (56,113,621 | ) | | | (102,828,344 | ) | | | (70,304,013 | ) | | | (61,029,776 | ) |
| | | | | | | | | | | | | | | | |
Net decrease from share transactions | | | (44,417,166 | ) | | | (56,937,257 | ) | | | (67,445,038 | ) | | | (29,497,191 | ) |
| | | | | | | | | | | | | | | | |
| Investor Class | | | | | | | | | | | | | | | | |
Proceeds from sales of shares | | | 82,767 | | | | 352,528 | | | | 316,165 | | | | 1,034,076 | |
Issued to shareholders in reinvestment of distributions | | | 3,141 | | | | 13,544 | | | | — | | | | 149,340 | |
Cost of shares redeemed | | | (566,124 | ) | | | (1,918,175 | ) | | | (615,077 | ) | | | (3,303,489 | ) |
| | | | | | | | | | | | | | | | |
Net decrease from share transactions | | | (480,216 | ) | | | (1,552,103 | ) | | | (298,912 | ) | | | (2,120,073 | ) |
| | | | | | | | | | | | | | | | |
| C Class | | | | | | | | | | | | | | | | |
Proceeds from sales of shares | | | 11,649 | | | | 261,593 | | | | 17,701 | | | | 887,540 | |
Issued to shareholders in reinvestment of distributions | | | 246 | | | | 5,615 | | | | — | | | | 93,469 | |
Cost of shares redeemed | | | (185,917 | ) | | | (2,170,745 | ) | | | (358,171 | ) | | | (5,508,725 | ) |
| | | | | | | | | | | | | | | | |
Net decrease from share transactions | | | (174,022 | ) | | | (1,903,537 | ) | | | (340,470 | ) | | | (4,527,716 | ) |
| | | | | | | | | | | | | | | | |
| A Class | | | | | | | | | | | | | | | | |
Proceeds from sales of shares | | | 296,331 | | | | 1,157,447 | | | | 211,215 | | | | 3,143,435 | |
Issued to shareholders in reinvestment of distributions | | | 9,021 | | | | 23,558 | | | | — | | | | 401,381 | |
Cost of shares redeemed | | | (447,239 | ) | | | (1,492,307 | ) | | | (665,372 | ) | | | (4,421,462 | ) |
| | | | | | | | | | | | | | | | |
Net decrease from share transactions | | | (141,887 | ) | | | (311,302 | ) | | | (454,157 | ) | | | (876,646 | ) |
| | | | | | | | | | | | | | | | |
| | | | |
| See Notes to Financial Statements | | 93 | | June 30, 2009 |
Statements of Changes in Net Assets
| | | | | | | | | | | | | | | | |
| | | ACCESSOR SMALL TO MID CAP | | | ACCESSOR INTERNATIONAL
EQUITY | |
| | | PERIOD ENDED
JUNE 30, 2009
(UNAUDITED) | | | YEAR ENDED
DEC. 31, 2008 | | | PERIOD ENDED
JUNE 30, 2009
(UNAUDITED) | | | YEAR ENDED
DEC. 31, 2008 | |
| Z Class | | | | | | | | | | | | | | | | |
Proceeds from sales of shares | | $ | 62,546,785 | | | $ | — | | | $ | 54,163,345 | | | $ | — | |
Cost of shares redeemed | | | — | | | | — | | | | (200,000 | ) | | | — | |
| | | | | | | | | | | | | | | | |
Net increase from share transactions | | | 62,546,785 | | | | — | | | | 53,963,345 | | | | — | |
| | | | | | | | | | | | | | | | |
Total increase (decrease) from share transactions | | | 17,333,494 | | | | (60,704,199 | ) | | | (14,575,232 | ) | | | (37,021,626 | ) |
| | | | | | | | | | | | | | | | |
Net increase/(decrease) in net assets | | | 23,311,296 | | | | (161,785,177 | ) | | | (7,011,118 | ) | | | (164,763,287 | ) |
| | | | | | | | | | | | | | | | |
| NET ASSETS: | | | | | | | | | | | | | | | | |
Beginning of period | | | 143,968,551 | | | | 305,753,728 | | | | 102,713,825 | | | | 267,477,112 | |
| | | | | | | | | | | | | | | | |
End of period (including undistributed (distributions in excess) net investment income (loss) of $115,191, $415,397, $5,633,954 and $4,300,196 respectively) | | $ | 167,279,847 | | | $ | 143,968,551 | | | $ | 95,702,707 | | | $ | 102,713,825 | |
| | | | | | | | | | | | | | | | |
| Other Informations: | | | | | | | | | | | | | | | | |
| SHARE TRANSACTIONS: | | | | | | | | | | | | | | | | |
| Institutional Class | | | | | | | | | | | | | | | | |
Sold | | | 670,896 | | | | 1,893,129 | | | | 272,633 | | | | 1,779,746 | |
Distributions reinvested | | | 7,050 | | | | 9,822 | | | | — | | | | 118,831 | |
Redeemed | | | (2,981,763 | ) | | | (3,806,911 | ) | | | (6,456,124 | ) | | | (3,268,184 | ) |
| | | | | | | | | | | | | | | | |
Net decrease in shares outstanding | | | (2,303,817 | ) | | | (1,903,960 | ) | | | (6,183,491 | ) | | | (1,369,607 | ) |
| | | | | | | | | | | | | | | | |
| Investor Class | | | | | | | | | | | | | | | | |
Sold | | | 5,204 | | | | 13,570 | | | | 31,651 | | | | 57,045 | |
Distributions reinvested | | | 189 | | | | 514 | | | | — | | | | 8,618 | |
Redeemed | | | (34,747 | ) | | | (73,447 | ) | | | (63,291 | ) | | | (171,180 | ) |
| | | | | | | | | | | | | | | | |
Net decrease in shares outstanding | | | (29,354 | ) | | | (59,363 | ) | | | (31,640 | ) | | | (105,517 | ) |
| | | | | | | | | | | | | | | | |
| C Class | | | | | | | | | | | | | | | | |
Sold | | | 700 | | | | 10,020 | | | | 1,785 | | | | 44,257 | |
Distributions reinvested | | | 15 | | | | 215 | | | | — | | | | 5,412 | |
Redeemed | | | (11,594 | ) | | | (79,726 | ) | | | (33,956 | ) | | | (272,680 | ) |
| | | | | | | | | | | | | | | | |
Net decrease in shares outstanding | | | (10,879 | ) | | | (69,491 | ) | | | (32,171 | ) | | | (223,011 | ) |
| | | | | | | | | | | | | | | | |
| A Class | | | | | | | | | | | | | | | | |
Sold | | | 17,249 | | | | 47,093 | | | | 20,636 | | | | 158,618 | |
Distributions reinvested | | | 520 | | | | 869 | | | | — | | | | 22,499 | |
Redeemed | | | (27,460 | ) | | | (58,917 | ) | | | (68,911 | ) | | | (237,907 | ) |
| | | | | | | | | | | | | | | | |
Net decrease in shares outstanding | | | (9,691 | ) | | | (10,955 | ) | | | (48,275 | ) | | | (56,790 | ) |
| | | | | | | | | | | | | | | | |
| Z Class | | | | | | | | | | | | | | | | |
Sold | | | 3,223,755 | | | | — | | | | 4,920,903 | | | | — | |
Redeemed | | | — | | | | — | | | | (16,807 | ) | | | — | |
| | | | | | | | | | | | | | | | |
Net increase in shares outstanding | | | 3,223,755 | | | | — | | | | 4,904,096 | | | | — | |
| | | | | | | | | | | | | | | | |
| | | | |
| June 30, 2009 | | 94 | | See Notes to Financial Statements |
Statements of Changes in Net Assets
| | | | | | | | | | | | | | | | |
| | | ACCESSOR TOTAL RETURN | | | ACCESSOR STRATEGIC
ALTERNATIVES | |
| | | PERIOD ENDED
JUNE 30, 2009
(UNAUDITED) | | | YEAR ENDED
DEC. 31, 2008 | | | PERIOD ENDED
JUNE 30, 2009
(UNAUDITED) | | | PERIOD ENDED
DECEMBER 31, 2008* | |
| OPERATIONS: | | | | | | | | | | | | | | | | |
Net investment income | | $ | 220,262 | | | $ | 829,085 | | | $ | 548,262 | | | $ | 1,396,722 | |
Net realized gain (loss) on investments | | | (3,817,466 | ) | | | (23,412,690 | ) | | | 87,272 | | | | (922,670 | ) |
Change in unrealized appreciation (depreciation) of investments and other assets and liabilities | | | 2,242,885 | | | | (2,876,328 | ) | | | (2,075,955 | ) | | | (18,113,882 | ) |
| | | | | | | | | | | | | | | | |
Net decrease from operations | | | (1,354,319 | ) | | | (25,459,933 | ) | | | (1,440,421 | ) | | | (17,639,830 | ) |
| | | | | | | | | | | | | | | | |
| DISTRIBUTIONS TO SHAREHOLDERS: | | | | | | | | | | | | | | | | |
From net investment income | | | | | | | | | | | | | | | | |
Total Return | | | (206,048 | ) | | | (837,875 | ) | | | N/A | | | | N/A | |
Institutional Class | | | N/A | | | | N/A | | | | (436,553 | ) | | | (1,391,852 | ) |
Investor Class | | | N/A | | | | N/A | | | | (109 | ) | | | — | |
C Class | | | N/A | | | | N/A | | | | N/A | | | | N/A | |
A Class | | | N/A | | | | N/A | | | | N/A | | | | N/A | |
Z Class | | | N/A | | | | N/A | | | | (93,656 | ) | | | — | |
From net realized gains on investments | | | | | | | | | | | | | | | | |
Institutional Class | | | N/A | | | | N/A | | | | N/A | | | | N/A | |
Investor Class | | | N/A | | | | N/A | | | | — | | | | — | |
C Class | | | N/A | | | | N/A | | | | N/A | | | | N/A | |
A Class | | | N/A | | | | N/A | | | | N/A | | | | N/A | |
Z Class | | | N/A | | | | N/A | | | | — | | | | — | |
| | | | | | | | | | | | | | | | |
Total distributions | | | (206,048 | ) | | | (837,875 | ) | | | (530,318 | ) | | | (1,391,852 | ) |
| | | | | | | | | | | | | | | | |
| SHARE TRANSACTIONS: | | | | | | | | | | | | | | | | |
| Total Return | | | | | | | | | | | | | | | | |
Proceeds from sales of shares | | | 706,451 | | | | 23,772,119 | | | | N/A | | | | N/A | |
Issued to shareholders in reinvestment of distributions | | | 22,463 | | | | 88,714 | | | | N/A | | | | N/A | |
Cost of shares redeemed | | | (5,195,598 | ) | | | (23,447,977 | ) | | | N/A | | | | N/A | |
| | | | | | | | | | | | | | | | |
Net increase (decrease) from share transactions | | | (4,466,684 | ) | | | 412,856 | | | | N/A | | | | N/A | |
| | | | | | | | | | | | | | | | |
| Institutional Class | | | | | | | | | | | | | | | | |
Proceeds from sales of shares | | | N/A | | | | N/A | | | | 14,247,002 | | | | 139,308,853 | |
Issued to shareholders in reinvestment of distributions | | | N/A | | | | N/A | | | | 59,100 | | | | 115,143 | |
Cost of shares redeemed | | | N/A | | | | N/A | | | | (52,376,409 | ) | | | (18,065,231 | ) |
| | | | | | | | | | | | | | | | |
Net increase (decrease) from share transactions | | | N/A | | | | N/A | | | | (38,070,307 | ) | | | 121,358,765 | |
| | | | | | | | | | | | | | | | |
| Investor Class | | | | | | | | | | | | | | | | |
Proceeds from sales of shares | | | N/A | | | | N/A | | | | 19,900 | | | | — | |
Issued to shareholders in reinvestment of distributions | | | N/A | | | | N/A | | | | 109 | | | | — | |
Cost of shares redeemed | | | N/A | | | | N/A | | | | — | | | | — | |
| | | | | | | | | | | | | | | | |
Net increase from share transactions | | | N/A | | | | N/A | | | | 20,009 | | | | — | |
| | | | | | | | | | | | | | | | |
| Z Class | | | | | | | | | | | | | | | | |
Proceeds from sales of shares | | | N/A | | | | N/A | | | | 41,713,201 | | | | — | |
Cost of shares redeemed | | | N/A | | | | N/A | | | | (4,600,000 | ) | | | — | |
| | | | | | | | | | | | | | | | |
Net increase from share transactions | | | N/A | | | | N/A | | | | 37,113,201 | | | | — | |
| | | | | | | | | | | | | | | | |
Total increase (decrease) from share transactions | | | (4,466,684 | ) | | | 412,856 | | | | (937,097 | ) | | | 121,358,765 | |
| | | | | | | | | | | | | | | | |
Net increase/(decrease) in net assets | | | (6,027,051 | ) | | | (25,884,952 | ) | | | (2,907,836 | ) | | | 102,327,083 | |
| | | | | | | | | | | | | | | | |
| | | | |
| See Notes to Financial Statements | | 95 | | June 30, 2009 |
Statements of Changes in Net Assets
| | | | | | | | | | | | | | | | |
| | | ACCESSOR TOTAL RETURN | | | ACCESSOR STRATEGIC
ALTERNATIVES | |
| | | PERIOD ENDED
JUNE 30, 2009
(UNAUDITED) | | | YEAR ENDED
DEC. 31, 2008 | | | PERIOD ENDED
JUNE 30, 2009
(UNAUDITED) | | | PERIOD ENDED
DECEMBER 31, 2008* | |
| NET ASSETS: | | | | | | | | | | | | | | | | |
Beginning of period | | $ | 31,181,985 | | | $ | 57,066,937 | | | $ | 102,327,083 | | | $ | — | |
| | | | | | | | | | | | | | | | |
End of period (including undistributed (distributions in excess) net investment income (loss) of $34,608, $20,394, $17,944 and $0 respectively) | | $ | 25,154,934 | | | $ | 31,181,985 | | | $ | 99,419,247 | | | $ | 102,327,083 | |
| | | | | | | | | | | | | | | | |
| Other Informations: | | | | | | | | | | | | | | | | |
| SHARE TRANSACTIONS: | | | | | | | | | | | | | | | | |
| Total Return | | | | | | | | | | | | | | | | |
Sold | | | 159,399 | | | | 3,176,023 | | | | N/A | | | | N/A | |
Distributions reinvested | | | 4,675 | | | | 13,537 | | | | N/A | | | | N/A | |
Redeemed | | | (1,098,128 | ) | | | (3,203,735 | ) | | | N/A | | | | N/A | |
| | | | | | | | | | | | | | | | |
Net decrease in shares outstanding | | | (934,054 | ) | | | (14,175 | ) | | | N/A | | | | N/A | |
| | | | | | | | | | | | | | | | |
| Institutional Class | | | | | | | | | | | | | | | | |
Sold | | | N/A | | | | N/A | | | | 1,464,602 | | | | 11,643,738 | |
Distributions reinvested | | | N/A | | | | N/A | | | | 6,128 | | | | 10,377 | |
Redeemed | | | N/A | | | | N/A | | | | (5,356,283 | ) | | | (1,686,845 | ) |
| | | | | | | | | | | | | | | | |
Net increase (decrease) in shares outstanding | | | N/A | | | | N/A | | | | (3,885,553 | ) | | | 9,967,270 | |
| | | | | | | | | | | | | | | | |
| Investor Class | | | | | | | | | | | | | | | | |
Sold | | | N/A | | | | N/A | | | | 1,956 | | | | N/A | |
Distributions reinvested | | | N/A | | | | N/A | | | | 11 | | | | N/A | |
Redeemed | | | N/A | | | | N/A | | | | — | | | | N/A | |
| | | | | | | | | | | | | | | | |
Net increase in shares outstanding | | | N/A | | | | N/A | | | | 1,967 | | | | N/A | |
| | | | | | | | | | | | | | | | |
| Z Class | | | | | | | | | | | | | | | | |
Sold | | | N/A | | | | N/A | | | | 4,243,434 | | | | N/A | |
Redeemed | | | N/A | | | | N/A | | | | (446,564 | ) | | | N/A | |
| | | | | | | | | | | | | | | | |
Net increase in shares outstanding | | | N/A | | | | N/A | | | | 3,796,870 | | | | N/A | |
| | | | | | | | | | | | | | | | |
* Commenced operations on January 29, 2008.
| | | | |
| June 30, 2009 | | 96 | | See Notes to Financial Statements |
Statements of Changes in Net Assets
| | | | | | | | | | | | |
| | | ACCESSOR FRONTIER MARKETS | | | ACCESSOR HIGH YIELD BOND | |
| | | PERIOD ENDED
JUNE 30, 2009
(UNAUDITED)(a) | | | PERIOD ENDED
JUNE 30, 2009
(UNAUDITED) | | | YEAR ENDED
DEC. 31, 2008 | |
| OPERATIONS: | | | | | | | | | | | | |
Net investment income | | $ | 8,667 | | | $ | 4,011,156 | | | $ | 5,422,676 | |
Net realized loss on investments | | | (177,926 | ) | | | (2,247,644 | ) | | | (12,953,473 | ) |
Net realized loss on foreign currency transactions | | | (1,302 | ) | | | — | | | | — | |
Net realized gain on swap contracts | | | 2,369,849 | | | | — | | | | — | |
Change in unrealized appreciation (depreciation) of investments and other assets and liabilities | | | 2,386,541 | | | | 11,771,383 | | | | (7,908,646 | ) |
Change in unrealized depreciation on swap contracts | | | (136,378 | ) | | | — | | | | — | |
| | | | | | | | | | | | |
Net increase (decrease) from operations | | | 4,449,451 | | | | 13,534,895 | | | | (15,439,443 | ) |
| | | | | | | | | | | | |
| DISTRIBUTIONS TO SHAREHOLDERS: | | | | | | | | | | | | |
From net investment income | | | | | | | | | | | | |
Institutional Class | | | — | | | | (3,354,026 | ) | | | (5,231,439 | ) |
Investor Class | | | — | | | | (82,660 | ) | | | (71,005 | ) |
C Class | | | — | | | | (32,922 | ) | | | (69,204 | ) |
A Class | | | — | | | | (17,577 | ) | | | (74,635 | ) |
Z Class | | | — | | | | (391,162 | ) | | | — | |
From net realized gains on investments | | | | | | | | | | | | |
Advisor Class | | | — | | | | — | | | | — | |
Investor Class | | | — | | | | — | | | | — | |
C Class | | | — | | | | — | | | | — | |
A Class | | | — | | | | — | | | | — | |
Z Class | | | — | | | | — | | | | — | |
| | | | | | | | | | | | |
Total distributions | | | — | | | | (3,878,347 | ) | | | (5,446,283 | ) |
| | | | | | | | | | | | |
| SHARE TRANSACTIONS: | | | | | | | | | | | | |
| Institutional Class | | | | | | | | | | | | |
Proceeds from sales of shares | | | 27,240,407 | | | | 41,609,361 | | | | 21,486,546 | |
Issued to shareholders in reinvestment of distributions | | | — | | | | 1,038,268 | | | | 1,507,563 | |
Cost of shares redeemed | | | (19,414,567 | ) | | | (36,385,746 | ) | | | (24,577,935 | ) |
| | | | | | | | | | | | |
Net increase (decrease) from share transactions | | | 7,825,840 | | | | 6,261,883 | | | | (1,583,826 | ) |
| | | | | | | | | | | | |
| Investor Class | | | | | | | | | | | | |
Proceeds from sales of shares | | | 1,037,770 | | | | 2,886,934 | | | | 278,565 | |
Issued to shareholders in reinvestment of distributions | | | — | | | | 68,433 | | | | 48,638 | |
Cost of shares redeemed | | | — | | | | (774,397 | ) | | | (1,429,834 | ) |
| | | | | | | | | | | | |
Net increase (decrease) from share transactions | | | 1,037,770 | | | | 2,180,970 | | | | (1,102,631 | ) |
| | | | | | | | | | | | |
| C Class | | | | | | | | | | | | |
Proceeds from sales of shares | | | N/A | | | | 296,304 | | | | 122,297 | |
Issued to shareholders in reinvestment of distributions | | | N/A | | | | 15,288 | | | | 29,957 | |
Cost of shares redeemed | | | N/A | | | | (252,399 | ) | | | (656,924 | ) |
| | | | | | | | | | | | |
Net increase (decrease) from share transactions | | | N/A | | | | 59,193 | | | | (504,670 | ) |
| | | | | | | | | | | | |
| A Class | | | | | | | | | | | | |
Proceeds from sales of shares | | | N/A | | | | 39,555 | | | | 101,323 | |
Issued to shareholders in reinvestment of distributions | | | N/A | | | | 4,771 | | | | 8,176 | |
Cost of shares redeemed | | | N/A | | | | (2,123 | ) | | | (970,901 | ) |
| | | | | | | | | | | | |
Net increase (decrease) from share transactions | | | N/A | | | | 42,203 | | | | (861,402 | ) |
| | | | | | | | | | | | |
(a) Commenced operations on December 31, 2008.
| | | | |
| See Notes to Financial Statements | | 97 | | June 30, 2009 |
Statements of Changes in Net Assets
| | | | | | | | | | | | |
| | | ACCESSOR FRONTIER MARKETS | | | ACCESSOR HIGH YIELD BOND | |
| | | PERIOD ENDED
JUNE 30, 2009
(UNAUDITED)(a) | | | PERIOD ENDED
JUNE 30, 2009
(UNAUDITED) | | | YEAR ENDED
DEC. 31, 2008 | |
| Z Class | | | | | | | | | | | | |
Proceeds from sales of shares | | $ | 19,393,963 | | | $ | 25,276,692 | | | $ | — | |
Cost of shares redeemed | | | (1,650,000 | ) | | | — | | | | — | |
| | | | | | | | | | | | |
Net increase from share transactions | | | 17,743,963 | | | | 25,276,692 | | | | — | |
| | | | | | | | | | | | |
Total increase (decrease) from share transactions | | | 26,607,573 | | | | 33,820,941 | | | | (4,052,529 | ) |
| | | | | | | | | | | | |
Net increase/(decrease) in net assets | | | 31,057,024 | | | | 43,477,489 | | | | (24,938,255 | ) |
| | | | | | | | | | | | |
| NET ASSETS: | | | | | | | | | | | | |
Beginning of period | | | — | | | | 52,342,260 | | | | 77,280,515 | |
| | | | | | | | | | | | |
End of period (including undistributed (distributions in excess) net investment income (loss) of $8,667, $132,809 and $0 respectively) | | $ | 31,057,024 | | | $ | 95,819,749 | | | $ | 52,342,260 | |
| | | | | | | | | | | | |
| Other Informations: | | | | | | | | | | | | |
| SHARE TRANSACTIONS: | | | | | | | | | | | | |
| Institutional Class | | | | | | | | | | | | |
Sold | | | 2,550,878 | | | | 5,229,645 | | | | 2,513,284 | |
Distributions reinvested | | | — | | | | 128,424 | | | | 172,700 | |
Redeemed | | | (1,789,341 | ) | | | (4,441,162 | ) | | | (2,801,317 | ) |
| | | | | | | | | | | | |
Net increase (decrease) in shares outstanding | | | 761,537 | | | | 916,907 | | | | (115,333 | ) |
| | | | | | | | | | | | |
| Investor Class | | | | | | | | | | | | |
Sold | | | 86,255 | | | | 361,549 | | | | 27,682 | |
Distributions reinvested | | | — | | | | 8,352 | | | | 5,150 | |
Redeemed | | | — | | | | (92,701 | ) | | | (144,804 | ) |
| | | | | | | | | | | | |
Net increase (decrease) in shares outstanding | | | 86,255 | | | | 277,200 | | | | (111,972 | ) |
| | | | | | | | | | | | |
| C Class | | | | | | | | | | | | |
Sold | | | — | | | | 36,926 | | | | 13,895 | |
Distributions reinvested | | | — | | | | 1,902 | | | | 3,270 | |
Redeemed | | | — | | | | (30,500 | ) | | | (69,181 | ) |
| | | | | | | | | | | | |
Net increase (decrease) in shares outstanding | | | — | | | | 8,328 | | | | (52,016 | ) |
| | | | | | | | | | | | |
| A Class | | | | | | | | | | | | |
Sold | | | — | | | | 4,843 | | | | 10,004 | |
Distributions reinvested | | | — | | | | 592 | | | | 896 | |
Redeemed | | | — | | | | (272 | ) | | | (101,351 | ) |
| | | | | | | | | | | | |
Net increase (decrease) in shares outstanding | | | — | | | | 5,163 | | | | (90,451 | ) |
| | | | | | | | | | | | |
| Z Class | | | | | | | | | | | | |
Sold | | | 1,787,462 | | | | 3,026,212 | | | | — | |
Redeemed | | | (127,223 | ) | | | — | | | | — | |
| | | | | | | | | | | | |
Net increase in shares outstanding | | | 1,660,239 | | | | 3,026,212 | | | | — | |
| | | | | | | | | | | | |
(a) Commenced operations on December 31, 2008.
| | | | |
| June 30, 2009 | | 98 | | See Notes to Financial Statements |
Statements of Changes in Net Assets
| | | | | | | | | | | | | | | | |
| | | ACCESSOR INVESTMENT
GRADE FIXED-INCOME | | | ACCESSOR MORTGAGE
SECURITIES | |
| | | PERIOD ENDED
JUNE 30, 2009
(UNAUDITED) | | | YEAR ENDED
DEC. 31, 2008 | | | PERIOD ENDED
JUNE 30, 2009
(UNAUDITED) | | | YEAR ENDED
DEC. 31, 2008 | |
| OPERATIONS: | | | | | | | | | | | | | | | | |
Net investment income | | $ | 2,439,020 | | | $ | 4,107,592 | | | $ | 1,340,221 | | | $ | 3,270,562 | |
Net realized gain (loss) on investments and options contracts | | | (1,286,705 | ) | | | 297,616 | | | | 1,272,914 | | | | (925,961 | ) |
Net realized gain on future contracts | | | 205,481 | | | | — | | | | — | | | | — | |
Change in unrealized net appreciation (depreciation) of investments and options contracts | | | 1,793,756 | | | | (6,989,480 | ) | | | 459,532 | | | | (1,986,476 | ) |
Change in unrealized appreciation (depreciation) on futures contracts | | | (68,427 | ) | | | — | | | | (38,203 | ) | | | — | |
| | | | | | | | | | | | | | | | |
Net increase/(decrease) in net assets resulting from operations | | | 3,083,125 | | | | (2,584,272 | ) | | | 3,034,464 | | | | 358,125 | |
| | | | | | | | | | | | | | | | |
| DISTRIBUTIONS TO SHAREHOLDERS: | | | | | | | | | | | | | | | | |
From net investment income | | | | | | | | | | | | | | | | |
Institutional Class | | | (1,447,329 | ) | | | (4,162,656 | ) | | | (908,848 | ) | | | (3,108,781 | ) |
Investor Class | | | (26,172 | ) | | | (148,319 | ) | | | (13,355 | ) | | | (45,426 | ) |
C Class | | | (16,513 | ) | | | (34,459 | ) | | | (8,085 | ) | | | (25,490 | ) |
Z Class | | | (594,687 | ) | | | — | | | | (191,758 | ) | | | — | |
From net realized gains on investments | | | | | | | | | | | | | | | | |
Institutional Class | | | (198,391 | ) | | | — | | | | — | | | | — | |
Investor Class | | | (2,332 | ) | | | — | | | | — | | | | — | |
C Class | | | (1,978 | ) | | | — | | | | — | | | | — | |
Z Class | | | — | | | | — | | | | — | | | | — | |
| | | | | | | | | | | | | | | | |
Total distributions | | | (2,287,402 | ) | | | (4,345,434 | ) | | | (1,122,046 | ) | | | (3,179,697 | ) |
| | | | | | | | | | | | | | | | |
| SHARE TRANSACTIONS: | | | | | | | | | | | | | | | | |
| Institutional Class | | | | | | | | | | | | | | | | |
Proceeds from sales of shares | | | 6,197,398 | | | | 21,382,866 | | | | 1,904,249 | | | | 28,775,383 | |
Issued to shareholders in reinvestment of distributions | | | 484,419 | | | | 1,585,253 | | | | 316,478 | | | | 1,159,290 | |
Shares issued in connection with merger (Note 11) | | | 36,540,066 | | | | — | | | | — | | | | — | |
Cost of shares redeemed | | | (84,807,880 | ) | | | (24,002,191 | ) | | | (48,173,273 | ) | | | (24,266,601 | ) |
| | | | | | | | | | | | | | | | |
Net increase (decrease) from share transactions | | | (41,585,997 | ) | | | (1,034,072 | ) | | | (45,952,546 | ) | | | 5,668,072 | |
| | | | | | | | | | | | | | | | |
| Investor Class | | | | | | | | | | | | | | | | |
Proceeds from sales of shares | | | 86,224 | | | | 1,011,246 | | | | 194,974 | | | | 213,048 | |
Issued to shareholders in reinvestment of distributions | | | 20,528 | | | | 125,112 | | | | 11,552 | | | | 29,362 | |
Shares issued in connection with merger (Note 11) | | | 147,495 | | | | — | | | | — | | | | — | |
Cost of shares redeemed | | | (807,184 | ) | | | (6,571,460 | ) | | | (503,302 | ) | | | (503,938 | ) |
| | | | | | | | | | | | | | | | |
Net decrease from share transactions | | | (552,937 | ) | | | (5,435,102 | ) | | | (296,776 | ) | | | (261,528 | ) |
| | | | | | | | | | | | | | | | |
| C Class | | | | | | | | | | | | | | | | |
Proceeds from sales of shares | | | 70,474 | | | | 136,833 | | | | 33,022 | | | | 142,477 | |
Issued to shareholders in reinvestment of distributions | | | 5,250 | | | | 3,631 | | | | 2,695 | | | | 7,216 | |
Shares issued in connection with merger (Note 11) | | | 452,976 | | | | — | | | | — | | | | — | |
Cost of shares redeemed | | | (543,835 | ) | | | (329,208 | ) | | | (278,186 | ) | | | (353,045 | ) |
| | | | | | | | | | | | | | | | |
Net decrease from share transactions | | | (15,135 | ) | | | (188,744 | ) | | | (242,469 | ) | | | (203,352 | ) |
| | | | | | | | | | | | | | | | |
| | | | |
| See Notes to Financial Statements | | 99 | | June 30, 2009 |
Statements of Changes in Net Assets
| | | | | | | | | | | | | | | | |
| | | ACCESSOR INVESTMENT
GRADE FIXED-INCOME | | | ACCESSOR MORTGAGE
SECURITIES | |
| | | PERIOD ENDED
JUNE 30, 2009
(UNAUDITED) | | | YEAR ENDED
DEC. 31, 2008 | | | PERIOD ENDED
JUNE 30, 2009
(UNAUDITED) | | | YEAR ENDED
DEC. 31, 2008 | |
| Z Class | | | | | | | | | | | | | | | | |
Proceeds from sales of shares | | $ | 69,424,566 | | | $ | — | | | $ | 35,326,619 | | | $ | — | |
Cost of shares redeemed | | | (4,333,411 | ) | | | — | | | | — | | | | — | |
| | | | | | | | | | | | | | | | |
Net increase from share transactions | | | 65,091,155 | | | | — | | | | 35,326,619 | | | | — | |
| | | | | | | | | | | | | | | | |
Total increase (decrease) from share transactions | | | 22,937,086 | | | | (6,657,918 | ) | | | (11,165,172 | ) | | | 5,203,192 | |
| | | | | | | | | | | | | | | | |
Net increase/(decrease) in net assets | | | 23,732,809 | | | | (13,587,624 | ) | | | (9,252,754 | ) | | | 2,381,620 | |
| | | | | | | | | | | | | | | | |
| NET ASSETS: | | | | | | | | | | | | | | | | |
Beginning of period | | | 65,760,125 | | | | 79,347,749 | | | | 66,996,812 | | | | 64,615,192 | |
| | | | | | | | | | | | | | | | |
End of period (including undistributed (distributions in excess) net investment income (loss) of $315,319, ($39,000), $218,175 and $0, respectively) | | $ | 89,492,934 | | | $ | 65,760,125 | | | $ | 57,744,058 | | | $ | 66,996,812 | |
| | | | | | | | | | | | | | | | |
| Other Informations: | | | | | | | | | | | | | | | | |
| SHARE TRANSACTIONS: | | | | | | | | | | | | | | | | |
| Institutional Class | | | | | | | | | | | | | | | | |
Sold | | | 637,935 | | | | 2,070,213 | | | | 155,949 | | | | 2,293,338 | |
Distributions reinvested | | | 49,525 | | | | 159,310 | | | | 25,964 | | | | 95,523 | |
Shares issued in connection with merger (Note 11) | | | 3,790,485 | | | | — | | | | — | | | | — | |
Redeemed | | | (8,752,850 | ) | | | (2,407,716 | ) | | | (3,941,540 | ) | | | (1,986,500 | ) |
| | | | | | | | | | | | | | | | |
Net increase (decrease) in shares outstanding | | | (4,274,905 | ) | | | (178,193 | ) | | | (3,759,627 | ) | | | 402,361 | |
| | | | | | | | | | | | | | | | |
| Investor Class | | | | | | | | | | | | | | | | |
Sold | | | 8,952 | | | | 94,916 | | | | 15,976 | | | | 17,263 | |
Distributions reinvested | | | 2,102 | | | | 12,134 | | | | 948 | | | | 2,412 | |
Shares issued in connection with merger (Note 11) | | | 15,309 | | | | — | | | | — | | | | — | |
Redeemed | | | (82,883 | ) | | | (633,457 | ) | | | (41,471 | ) | | | (41,801 | ) |
| | | | | | | | | | | | | | | | |
Net decrease in shares outstanding | | | (56,520 | ) | | | (526,407 | ) | | | (24,547 | ) | | | (22,126 | ) |
| | | | | | | | | | | | | | | | |
| C Class | | | | | | | | | | | | | | | | |
Sold | | | 7,115 | | | | 13,962 | | | | 2,657 | | | | 11,523 | |
Distributions reinvested | | | 541 | | | | 362 | | | | 221 | | | | 591 | |
Shares issued in connection with merger (Note 11) | | | 46,984 | | | | — | | | | — | | | | — | |
Redeemed | | | (55,244 | ) | | | (33,150 | ) | | | (22,530 | ) | | | (29,229 | ) |
| | | | | | | | | | | | | | | | |
Net decrease in shares outstanding | | | (604 | ) | | | (18,826 | ) | | | (19,652 | ) | | | (17,115 | ) |
| | | | | | | | | | | | | | | | |
| Z Class | | | | | | | | | | | | | | | | |
Sold | | | 7,189,417 | | | | — | | | | 2,874,130 | | | | — | |
Redeemed | | | (444,384 | ) | | | — | | | | — | | | | — | |
| | | | | | | | | | | | | | | | |
Net increase in shares outstanding | | | 6,745,033 | | | | — | | | | 2,874,130 | | | | — | |
| | | | | | | | | | | | | | | | |
| | | | |
| June 30, 2009 | | 100 | | See Notes to Financial Statements |
Statements of Changes in Net Assets
| | | | | | | | | | | | | | | | |
| | | ACCESSOR LIMITED
DURATION U.S. GOVT. | | | ACCESSOR U.S. GOVERNMENT MONEY | |
| | | PERIOD ENDED
JUNE 30, 2009
(UNAUDITED) | | | YEAR ENDED
DEC. 31, 2008 | | | PERIOD ENDED
JUNE 30, 2009
(UNAUDITED) | | | YEAR ENDED
DEC. 31, 2008 | |
| OPERATIONS: | | | | | | | | | | | | | | | | |
Net investment income | | $ | 651,085 | | | $ | 2,127,058 | | | $ | 2,871,416 | | | $ | 29,149,191 | |
Net realized gain (loss) on investments | | | 234,091 | | | | 462,896 | | | | (14,853 | ) | | | 118,177 | |
Change in unrealized net depreciation of investments | | | (189,485 | ) | | | (94,986 | ) | | | — | | | | — | |
| | | | | | | | | | | | | | | | |
Net increase/(decrease) in net assets resulting from operations | | | 695,691 | | | | 2,494,968 | | | | 2,856,563 | | | | 29,267,368 | |
| | | | | | | | | | | | | | | | |
| DISTRIBUTIONS TO SHAREHOLDERS: | | | | | | | | | | | | | | | | |
From net investment income | | | | | | | | | | | | | | | | |
Limited Duration U.S. Government Fund | | | (655,685 | ) | | | (2,106,718 | ) | | | N/A | | | | N/A | |
U.S. Government Money Fund | | | | | | | | | | | | | | | | |
Institutional Class | | | N/A | | | | N/A | | | | (837,118 | ) | | | (15,638,986 | ) |
Investor Class | | | N/A | | | | N/A | | | | (14,291 | ) | | | (184,820 | ) |
C Class | | | N/A | | | | N/A | | | | (2,412 | ) | | | (21,517 | ) |
A Class | | | N/A | | | | N/A | | | | (1,115 | ) | | | (18,172 | ) |
Z Class | | | N/A | | | | N/A | | | | (2,016,477 | ) | | | (13,285,691 | ) |
From net realized gains on investments | | | | | | | | | | | | | | | | |
Limited Duration U.S. Government Fund | | | — | | | | (202,154 | ) | | | N/A | | | | N/A | |
| | | | | | | | | | | | | | | | |
Total distributions | | | (655,685 | ) | | | (2,308,872 | ) | | | (2,871,413 | ) | | | (29,149,186 | ) |
| | | | | | | | | | | | | | | | |
| SHARE TRANSACTIONS: | | | | | | | | | | | | | | | | |
| Limited Duration | | | | | | | | | | | | | | | | |
Proceeds from sales of shares | | | 4,840,498 | | | | 20,011,045 | | | | N/A | | | | N/A | |
Issued to shareholders in reinvestment of distributions | | | 63,240 | | | | 161,092 | | | | N/A | | | | N/A | |
Cost of shares redeemed | | | (20,452,032 | ) | | | (28,412,140 | ) | | | N/A | | | | N/A | |
| | | | | | | | | | | | | | | | |
Net decrease from share transactions | | | (15,548,294 | ) | | | (8,240,003 | ) | | | N/A | | | | N/A | |
| | | | | | | | | | | | | | | | |
| Institutional Class | | | | | | | | | | | | | | | | |
Proceeds from sales of shares | | | N/A | | | | N/A | | | | 579,598,012 | | | | 939,586,306 | |
Issued to shareholders in reinvestment of distributions | | | N/A | | | | N/A | | | | 43,346 | | | | 708,171 | |
Cost of shares redeemed | | | N/A | | | | N/A | | | | (623,433,914 | ) | | | (1,892,044,845 | ) |
| | | | | | | | | | | | | | | | |
Net decrease from share transactions | | | N/A | | | | N/A | | | | (43,792,556 | ) | | | (951,750,368 | ) |
| | | | | | | | | | | | | | | | |
| Investor Class | | | | | | | | | | | | | | | | |
Proceeds from sales of shares | | | N/A | | | | N/A | | | | 3,983,811 | | | | 10,456,049 | |
Issued to shareholders in reinvestment of distributions | | | N/A | | | | N/A | | | | 13,630 | | | | 175,804 | |
Cost of shares redeemed | | | N/A | | | | N/A | | | | (6,706,792 | ) | | | (11,138,524 | ) |
| | | | | | | | | | | | | | | | |
Net decrease from share transactions | | | N/A | | | | N/A | | | | (2,709,351 | ) | | | (506,671 | ) |
| | | | | | | | | | | | | | | | |
| C Class | | | | | | | | | | | | | | | | |
Proceeds from sales of shares | | | N/A | | | | N/A | | | | 957,772 | | | | 3,684,586 | |
Issued to shareholders in reinvestment of distributions | | | N/A | | | | N/A | | | | 2,317 | | | | 20,434 | |
Cost of shares redeemed | | | N/A | | | | N/A | | | | (950,121 | ) | | | (3,275,310 | ) |
| | | | | | | | | | | | | | | | |
Net increase from share transactions | | | N/A | | | | N/A | | | | 9,968 | | | | 429,710 | |
| | | | | | | | | | | | | | | | |
| A Class | | | | | | | | | | | | | | | | |
Proceeds from sales of shares | | | N/A | | | | N/A | | | | 663,601 | | | | 1,583,430 | |
Issued to shareholders in reinvestment of distributions | | | N/A | | | | N/A | | | | 1,080 | | | | 17,983 | |
Cost of shares redeemed | | | N/A | | | | N/A | | | | (864,628 | ) | | | (2,263,596 | ) |
| | | | | | | | | | | | | | | | |
Net decrease from share transactions | | | N/A | | | | N/A | | | | (199,947 | ) | | | (662,183 | ) |
| | | | | | | | | | | | | | | | |
| | | | |
| See Notes to Financial Statements | | 101 | | June 30, 2009 |
Statements of Changes in Net Assets
| | | | | | | | | | | | | | | | |
| | | ACCESSOR LIMITED
DURATION U.S. GOVT. | | | ACCESSOR U.S. GOVERNMENT MONEY | |
| | | PERIOD ENDED
JUNE 30, 2009
(UNAUDITED) | | | YEAR ENDED
DEC. 31, 2008 | | | PERIOD ENDED
JUNE 30, 2009
(UNAUDITED) | | | YEAR ENDED
DEC. 31, 2008 | |
| Z Class | | | | | | | | | | | | | | | | |
Proceeds from sales of shares | | $ | N/A | | | $ | N/A | | | $ | 734,669,811 | | | $ | 2,300,347,644 | |
Issued to shareholders in reinvestment of distributions | | | N/A | | | | N/A | | | | 14,806 | | | | 82,947 | |
Cost of shares redeemed | | | N/A | | | | N/A | | | | (1,006,007,866 | ) | | | (1,621,457,478 | ) |
| | | | | | | | | | | | | | | | |
Net increase (decrease) from share transactions | | | N/A | | | | N/A | | | | (271,323,249 | ) | | | 678,973,113 | |
| | | | | | | | | | | | | | | | |
Total decrease from share transactions | | | (15,548,294 | ) | | | (8,240,003 | ) | | | (318,015,135 | ) | | | (273,516,399 | ) |
| | | | | | | | | | | | | | | | |
Net decrease in net assets | | | (15,508,288 | ) | | | (8,053,907 | ) | | | (318,029,985 | ) | | | (273,398,217 | ) |
| | | | | | | | | | | | | | | | |
| NET ASSETS: | | | | | | | | | | | | | | | | |
Beginning of period | | | 55,110,483 | | | | 63,164,390 | | | | 1,152,233,233 | | | | 1,425,631,450 | |
| | | | | | | | | | | | | | | | |
End of period (including undistributed (distributions in excess) net investment income (loss) of $(4,600), $0, $3 and $0 respectively) | | $ | 39,602,195 | | | $ | 55,110,483 | | | $ | 834,203,248 | | | $ | 1,152,233,233 | |
| | | | | | | | | | | | | | | | |
| Other Informations: | | | | | | | | | | | | | | | | |
| SHARE TRANSACTIONS: | | | | | | | | | | | | | | | | |
| Limited Duration | | | | | | | | | | | | | | | | |
Sold | | | 398,009 | | | | 1,642,121 | | | | N/A | | | | N/A | |
Distributions reinvested | | | 5,199 | | | | 13,253 | | | | N/A | | | | N/A | |
Redeemed | | | (1,680,855 | ) | | | (2,334,057 | ) | | | N/A | | | | N/A | |
| | | | | | | | | | | | | | | | |
Net decrease in shares outstanding | | | (1,277,647 | ) | | | (678,683 | ) | | | N/A | | | | N/A | |
| | | | | | | | | | | | | | | | |
| Institutional Class | | | | | | | | | | | | | | | | |
Sold | | | N/A | | | | N/A | | | | 579,598,011 | | | | 939,586,306 | |
Distributions reinvested | | | N/A | | | | N/A | | | | 43,348 | | | | 708,171 | |
Redeemed | | | N/A | | | | N/A | | | | (623,433,913 | ) | | | (1,892,044,845 | ) |
| | | | | | | | | | | | | | | | |
Net decrease in shares outstanding | | | N/A | | | | N/A | | | | (43,792,554 | ) | | | (951,750,368 | ) |
| | | | | | | | | | | | | | | | |
| Investor Class | | | | | | | | | | | | | | | | |
Sold | | | N/A | | | | N/A | | | | 3,983,811 | | | | 10,456,049 | |
Distributions reinvested | | | N/A | | | | N/A | | | | 13,630 | | | | 175,804 | |
Redeemed | | | N/A | | | | N/A | | | | (6,706,792 | ) | | | (11,138,524 | ) |
| | | | | | | | | | | | | | | | |
Net decrease in shares outstanding | | | N/A | | | | N/A | | | | (2,709,351 | ) | | | (506,671 | ) |
| | | | | | | | | | | | | | | | |
| C Class | | | | | | | | | | | | | | | | |
Sold | | | N/A | | | | N/A | | | | 957,772 | | | | 3,684,586 | |
Distributions reinvested | | | N/A | | | | N/A | | | | 2,317 | | | | 20,434 | |
Redeemed | | | N/A | | | | N/A | | | | (950,121 | ) | | | (3,275,310 | ) |
| | | | | | | | | | | | | | | | |
Net increase in shares outstanding | | | N/A | | | | N/A | | | | 9,968 | | | | 429,710 | |
| | | | | | | | | | | | | | | | |
| A Class | | | | | | | | | | | | | | | | |
Sold | | | N/A | | | | N/A | | | | 663,601 | | | | 1,583,430 | |
Distributions reinvested | | | N/A | | | | N/A | | | | 1,080 | | | | 17,983 | |
Redeemed | | | N/A | | | | N/A | | | | (864,628 | ) | | | (2,263,596 | ) |
| | | | | | | | | | | | | | | | |
Net decrease in shares outstanding | | | N/A | | | | N/A | | | | (199,947 | ) | | | (662,183 | ) |
| | | | | | | | | | | | | | | | |
| Z Class | | | | | | | | | | | | | | | | |
Sold | | | N/A | | | | N/A | | | | 734,669,811 | | | | 2,300,347,644 | |
Distributions reinvested | | | N/A | | | | N/A | | | | 14,806 | | | | 82,947 | |
Redeemed | | | N/A | | | | N/A | | | | (1,006,007,866 | ) | | | (1,621,457,478 | ) |
| | | | | | | | | | | | | | | | |
Net increase (decrease) in shares outstanding | | | N/A | | | | N/A | | | | (271,323,249 | ) | | | 678,973,113 | |
| | | | | | | | | | | | | | | | |
| | | | |
| June 30, 2009 | | 102 | | See Notes to Financial Statements |
Statements of Changes in Net Assets
| | | | | | | | | | | | | | | | |
| | | ACCESSOR INCOME
ALLOCATION | | | ACCESSOR INCOME &
GROWTH ALLOCATION | |
| | | PERIOD ENDED
JUNE 30, 2009
(UNAUDITED) | | | YEAR ENDED
DEC. 31, 2008 | | | PERIOD ENDED
JUNE 30, 2009
(UNAUDITED) | | | YEAR ENDED
DEC. 31, 2008 | |
| OPERATIONS: | | | | | | | | | | | | | | | | |
Net investment income | | $ | 457,956 | | | $ | 906,575 | | | $ | 667,640 | | | $ | 1,369,827 | |
Net realized gain (loss) on affiliated investments | | | 27,045 | | | | (179,328 | ) | | | (132,361 | ) | | | 162,528 | |
Change in unrealized appreciation (depreciation) of investments and other assets and liabilities | | | 725,364 | | | | (2,117,508 | ) | | | 1,472,390 | | | | (10,194,986 | ) |
| | | | | | | | | | | | | | | | |
Net increase/(decrease) in net assets resulting from operations | | | 1,210,365 | | | | (1,390,261 | ) | | | 2,007,669 | | | | (8,662,631 | ) |
| | | | | | | | | | | | | | | | |
| DISTRIBUTIONS TO SHAREHOLDERS: | | | | | | | | | | | | | | | | |
From net investment income | | | | | | | | | | | | | | | | |
Institutional Class | | | (325,698 | ) | | | (607,865 | ) | | | (487,798 | ) | | | (991,740 | ) |
Investor Class | | | (43,082 | ) | | | (124,319 | ) | | | (56,904 | ) | | | (142,888 | ) |
C Class | | | (62,179 | ) | | | (116,503 | ) | | | (81,582 | ) | | | (236,502 | ) |
A Class | | | (28,795 | ) | | | (58,483 | ) | | | (49,022 | ) | | | (113,968 | ) |
From net realized gains on investments | | | | | | | | | | | | | | | | |
Advisor Class | | | — | | | | — | | | | — | | | | (163,526 | ) |
Investor Class | | | — | | | | — | | | | — | | | | (25,450 | ) |
C Class | | | — | | | | — | | | | — | | | | (48,758 | ) |
A Class | | | — | | | | — | | | | — | | | | (20,150 | ) |
| | | | | | | | | | | | | | | | |
Total distributions | | | (459,754 | ) | | | (907,170 | ) | | | (675,306 | ) | | | (1,742,982 | ) |
| | | | | | | | | | | | | | | | |
| SHARE TRANSACTIONS: | | | | | | | | | | | | | | | | |
| Institutional Class | | | | | | | | | | | | | | | | |
Proceeds from sales of shares | | | 4,699,916 | | | | 11,502,129 | | | | 10,749,730 | | | | 17,020,892 | |
Issued to shareholders in reinvestment of distributions | | | 210,953 | | | | 422,781 | | | | 392,559 | | | | 919,954 | |
Cost of shares redeemed | | | (2,026,055 | ) | | | (11,672,186 | ) | | | (5,416,490 | ) | | | (11,456,011 | ) |
| | | | | | | | | | | | | | | | |
Net increase from share transactions | | | 2,884,814 | | | | 252,724 | | | | 5,725,799 | | | | 6,484,835 | |
| | | | | | | | | | | | | | | | |
| Investor Class | | | | | | | | | | | | | | | | |
Proceeds from sales of shares | | | 218,065 | | | | 910,491 | | | | 374,973 | | | | 1,208,215 | |
Issued to shareholders in reinvestment of distributions | | | 42,433 | | | | 123,024 | | | | 56,904 | | | | 168,058 | |
Cost of shares redeemed | | | (921,284 | ) | | | (1,735,823 | ) | | | (379,270 | ) | | | (1,839,267 | ) |
| | | | | | | | | | | | | | | | |
Net increase (decrease) from share transactions | | | (660,786 | ) | | | (702,308 | ) | | | 52,607 | | | | (462,994 | ) |
| | | | | | | | | | | | | | | | |
| C Class | | | | | | | | | | | | | | | | |
Proceeds from sales of shares | | | 868,096 | | | | 1,421,956 | | | | 378,115 | | | | 1,853,991 | |
Issued to shareholders in reinvestment of distributions | | | 56,606 | | | | 99,258 | | | | 79,691 | | | | 276,624 | |
Cost of shares redeemed | | | (710,364 | ) | | | (1,585,618 | ) | | | (1,145,579 | ) | | | (4,309,294 | ) |
| | | | | | | | | | | | | | | | |
Net increase (decrease) from share transactions | | | 214,338 | | | | (64,404 | ) | | | (687,773 | ) | | | (2,178,679 | ) |
| | | | | | | | | | | | | | | | |
| A Class | | | | | | | | | | | | | | | | |
Proceeds from sales of shares | | | 270,988 | | | | 1,415,713 | | | | 771,325 | | | | 1,568,475 | |
Issued to shareholders in reinvestment of distributions | | | 20,791 | | | | 44,604 | | | | 46,898 | | | | 123,290 | |
Cost of shares redeemed | | | (172,295 | ) | | | (1,003,229 | ) | | | (431,812 | ) | | | (1,533,085 | ) |
| | | | | | | | | | | | | | | | |
Net increase (decrease) from share transactions | | | 119,484 | | | | 457,088 | | | | 386,411 | | | | 158,680 | |
| | | | | | | | | | | | | | | | |
Total increase (decrease) from share transactions | | | 2,557,850 | | | | (56,900 | ) | | | 5,477,044 | | | | 4,001,842 | |
| | | | | | | | | | | | | | | | |
Net increase/(decrease) in net assets | | | 3,308,461 | | | | (2,354,331 | ) | | | 6,809,407 | | | | (6,403,771 | ) |
| | | | | | | | | | | | | | | | |
| | | | |
| See Notes to Financial Statements | | 103 | | June 30, 2009 |
Statements of Changes in Net Assets
| | | | | | | | | | | | | | | | |
| | | ACCESSOR INCOME
ALLOCATION | | | ACCESSOR INCOME &
GROWTH ALLOCATION | |
| | | PERIOD ENDED
JUNE 30, 2009
(UNAUDITED) | | | YEAR ENDED
DEC. 31, 2008 | | | PERIOD ENDED
JUNE 30, 2009
(UNAUDITED) | | | YEAR ENDED
DEC. 31, 2008 | |
| NET ASSETS: | | | | | | | | | | | | | | | | |
Beginning of period | | $ | 15,970,043 | | | $ | 18,324,374 | | | $ | 37,162,468 | | | $ | 43,566,239 | |
| | | | | | | | | | | | | | | | |
End of period (including undistributed (distributions in excess) net investment income (loss) of $(1,151), $647, $(1,857) and $5,809 respectively) | | $ | 19,278,504 | | | $ | 15,970,043 | | | $ | 43,971,875 | | | $ | 37,162,468 | |
| | | | | | | | | | | | | | | | |
| Other Informations: | | | | | | | | | | | | | | | | |
| SHARE TRANSACTIONS: | | | | | | | | | | | | | | | | |
| Institutional Class | | | | | | | | | | | | | | | | |
Sold | | | 363,448 | | | | 825,813 | | | | 848,982 | | | | 1,162,207 | |
Distributions reinvested | | | 16,292 | | | | 31,324 | | | | 31,468 | | | | 64,784 | |
Redeemed | | | (157,907 | ) | | | (847,549 | ) | | | (441,975 | ) | | | (791,580 | ) |
| | | | | | | | | | | | | | | | |
Net increase in shares outstanding | | | 221,833 | | | | 9,588 | | | | 438,475 | | | | 435,411 | |
| | | | | | | | | | | | | | | | |
| Investor Class | | | | | | | | | | | | | | | | |
Sold | | | 16,849 | | | | 65,321 | | | | 30,288 | | | | 81,358 | |
Distributions reinvested | | | 3,287 | | | | 9,093 | | | | 4,572 | | | | 11,775 | |
Redeemed | | | (71,025 | ) | | | (127,521 | ) | | | (31,265 | ) | | | (125,499 | ) |
| | | | | | | | | | | | | | | | |
Net increase (decrease) in shares outstanding | | | (50,889 | ) | | | (53,107 | ) | | | 3,595 | | | | (32,366 | ) |
| | | | | | | | | | | | | | | | |
| C Class | | | | | | | | | | | | | | | | |
Sold | | | 67,985 | | | | 104,206 | | | | 30,997 | | | | 129,373 | |
Distributions reinvested | | | 4,387 | | | | 7,383 | | | | 6,432 | | | | 19,407 | |
Redeemed | | | (55,304 | ) | | | (116,722 | ) | | | (95,809 | ) | | | (298,354 | ) |
| | | | | | | | | | | | | | | | |
Net increase (decrease) in shares outstanding | | | 17,068 | | | | (5,133 | ) | | | (58,380 | ) | | | (149,574 | ) |
| | | | | | | | | | | | | | | | |
| A Class | | | | | | | | | | | | | | | | |
Sold | | | 20,996 | | | | 99,957 | | | | 62,264 | | | | 106,546 | |
Distributions reinvested | | | 1,607 | | | | 3,304 | | | | 3,768 | | | | 8,643 | |
Redeemed | | | (13,363 | ) | | | (72,894 | ) | | | (36,131 | ) | | | (109,205 | ) |
| | | | | | | | | | | | | | | | |
Net increase in shares outstanding | | | 9,240 | | | | 30,367 | | | | 29,901 | | | | 5,984 | |
| | | | | | | | | | | | | | | | |
| | | | |
| June 30, 2009 | | 104 | | See Notes to Financial Statements |
Statements of Changes in Net Assets
| | | | | | | | | | | | | | | | |
| | | ACCESSOR BALANCED
ALLOCATION | | | ACCESSOR GROWTH &
INCOME ALLOCATION | |
| | | PERIOD ENDED
JUNE 30, 2009
(UNAUDITED) | | | YEAR ENDED
DEC. 31, 2008 | | | PERIOD ENDED
JUNE 30, 2009
(UNAUDITED) | | | YEAR ENDED
DEC. 31, 2008 | |
| OPERATIONS: | | | | | | | | | | | | | | | | |
Net investment income | | $ | 1,358,224 | | | $ | 2,897,470 | | | $ | 1,059,224 | | | $ | 2,612,805 | |
Net realized gain (loss) on investments | | | (381,474 | ) | | | 215,375 | | | | (1,549,373 | ) | | | 67,343 | |
Change in unrealized appreciation (depreciation) of investments and other assets and liabilities | | | 4,034,572 | | | | (36,542,158 | ) | | | 4,733,803 | | | | (50,151,599 | ) |
| | | | | | | | | | | | | | | | |
Net increase/(decrease) in net assets resulting from operations | | | 5,011,322 | | | | (33,429,313 | ) | | | 4,243,654 | | | | (47,471,451 | ) |
| | | | | | | | | | | | | | | | |
| DISTRIBUTIONS TO SHAREHOLDERS: | | | | | | | | | | | | | | | | |
From net investment income | | | | | | | | | | | | | | | | |
Institutional Class | | | (868,784 | ) | | | (1,956,961 | ) | | | (507,479 | ) | | | (1,531,848 | ) |
Investor Class | | | (122,115 | ) | | | (328,262 | ) | | | (116,163 | ) | | | (323,841 | ) |
C Class | | | (117,862 | ) | | | (376,736 | ) | | | (241,407 | ) | | | (776,785 | ) |
A Class | | | (253,352 | ) | | | (687,198 | ) | | | (200,329 | ) | | | (639,527 | ) |
From net realized gains on investments | | | | | | | | | | | | | | | | |
Advisor Class | | | — | | | | (593,212 | ) | | | — | | | | (879,131 | ) |
Investor Class | | | — | | | | (110,694 | ) | | | — | | | | (235,171 | ) |
C Class | | | — | | | | (159,020 | ) | | | — | | | | (721,388 | ) |
A Class | | | — | | | | (221,543 | ) | | | — | | | | (436,783 | ) |
| | | | | | | | | | | | | | | | |
Total distributions | | | (1,362,113 | ) | | | (4,433,626 | ) | | | (1,065,378 | ) | | | (5,544,474 | ) |
| | | | | | | | | | | | | | | | |
| SHARE TRANSACTIONS: | | | | | | | | | | | | | | | | |
| Institutional Class | | | | | | | | | | | | | | | | |
Proceeds from sales of shares | | | 20,912,705 | | | | 25,145,480 | | | | 7,904,998 | | | | 17,855,906 | |
Issued to shareholders in reinvestment of distributions | | | 657,130 | | | | 2,089,256 | | | | 426,541 | | | | 2,118,731 | |
Cost of shares redeemed | | | (9,240,780 | ) | | | (17,608,499 | ) | | | (6,741,080 | ) | | | (26,000,460 | ) |
| | | | | | | | | | | | | | | | |
Net increase (decrease) from share transactions | | | 12,329,055 | | | | 9,626,237 | | | | 1,590,459 | | | | (6,025,823 | ) |
| | | | | | | | | | | | | | | | |
| Investor Class | | | | | | | | | | | | | | | | |
Proceeds from sales of shares | | | 905,906 | | | | 3,669,629 | | | | 766,174 | | | | 3,514,790 | |
Issued to shareholders in reinvestment of distributions | | | 121,934 | | | | 438,192 | | | | 116,163 | | | | 559,029 | |
Cost of shares redeemed | | | (2,142,124 | ) | | | (5,039,210 | ) | | | (866,167 | ) | | | (3,835,236 | ) |
| | | | | | | | | | | | | | | | |
Net increase (decrease) from share transactions | | | (1,114,284 | ) | | | (931,389 | ) | | | 16,170 | | | | 238,583 | |
| | | | | | | | | | | | | | | | |
| C Class | | | | | | | | | | | | | | | | |
Proceeds from sales of shares | | | 383,766 | | | | 3,582,243 | | | | 1,394,789 | | | | 7,544,249 | |
Issued to shareholders in reinvestment of distributions | | | 113,276 | | | | 516,384 | | | | 231,579 | | | | 1,430,978 | |
Cost of shares redeemed | | | (1,890,239 | ) | | | (6,583,756 | ) | | | (3,919,130 | ) | | | (16,140,217 | ) |
| | | | | | | | | | | | | | | | |
Net decrease from share transactions | | | (1,393,197 | ) | | | (2,485,129 | ) | | | (2,292,762 | ) | | | (7,164,990 | ) |
| | | | | | | | | | | | | | | | |
| A Class | | | | | | | | | | | | | | | | |
Proceeds from sales of shares | | | 1,694,940 | | | | 4,566,540 | | | | 828,650 | | | | 4,947,755 | |
Issued to shareholders in reinvestment of distributions | | | 242,194 | | | | 873,430 | | | | 191,262 | | | | 1,027,547 | |
Cost of shares redeemed | | | (2,345,954 | ) | | | (7,752,377 | ) | | | (3,983,692 | ) | | | (5,885,890 | ) |
| | | | | | | | | | | | | | | | |
Net increase (decrease) from share transactions | | | (408,820 | ) | | | (2,312,407 | ) | | | (2,963,780 | ) | | | 89,412 | |
| | | | | | | | | | | | | | | | |
Total increase (decrease) from share transactions | | | 9,412,754 | | | | 3,897,312 | | | | (3,649,913 | ) | | | (12,862,818 | ) |
| | | | | | | | | | | | | | | | |
Net increase/(decrease) in net assets | | | 13,061,963 | | | | (33,965,627 | ) | | | (471,637 | ) | | | (65,878,743 | ) |
| | | | | | | | | | | | | | | | |
| | | | |
| See Notes to Financial Statements | | 105 | | June 30, 2009 |
Statements of Changes in Net Assets
| | | | | | | | | | | | | | | | |
| | | ACCESSOR BALANCED
ALLOCATION | | | ACCESSOR GROWTH & INCOME
ALLOCATION | |
| | | PERIOD ENDED
JUNE 30, 2009
(UNAUDITED) | | | YEAR ENDED
DEC. 31, 2008 | | | PERIOD ENDED
JUNE 30, 2009
(UNAUDITED) | | | YEAR ENDED
DEC. 31, 2008 | |
| NET ASSETS: | | | | | | | | | | | | | | | | |
Beginning of period | | $ | 95,399,698 | | | $ | 129,365,325 | | | $ | 103,573,548 | | | $ | 169,452,291 | |
| | | | | | | | | | | | | | | | |
End of period (including undistributed (distributions in excess) net investment income (loss) of $(3,889), $0, $(6,152) and $2 respectively) | | $ | 108,461,661 | | | $ | 95,399,698 | | | $ | 103,101,911 | | | $ | 103,573,548 | |
| | | | | | | | | | | | | | | | |
| Other Informations: | | | | | | | | | | | | | | | | |
| SHARE TRANSACTIONS: | | | | | | | | | | | | | | | | |
| Institutional Class | | | | | | | | | | | | | | | | |
Sold | | | 1,694,752 | | | | 1,623,393 | | | | 669,424 | | | | 1,124,123 | |
Distributions reinvested | | | 53,877 | | | | 143,874 | | | | 36,446 | | | | 147,927 | |
Redeemed | | | (768,765 | ) | | | (1,193,637 | ) | | | (605,178 | ) | | | (1,700,702 | ) |
| | | | | | | | | | | | | | | | |
Net increase (decrease) in shares outstanding | | | 979,864 | | | | 573,630 | | | | 100,692 | | | | (428,652 | ) |
| | | | | | | | | | | | | | | | |
| Investor Class | | | | | | | | | | | | | | | | |
Sold | | | 74,547 | | | | 244,623 | | | | 65,716 | | | | 230,473 | |
Distributions reinvested | | | 10,033 | | | | 30,220 | | | | 9,961 | | | | 39,333 | |
Redeemed | | | (175,502 | ) | | | (334,057 | ) | | | (75,612 | ) | | | (256,949 | ) |
| | | | | | | | | | | | | | | | |
Net increase (decrease) in shares outstanding | | | (90,922 | ) | | | (59,214 | ) | | | 65 | | | | 12,857 | |
| | | | | | | | | | | | | | | | |
| C Class | | | | | | | | | | | | | | | | |
Sold | | | 31,771 | | | | 226,328 | | | | 122,115 | | | | 503,027 | |
Distributions reinvested | | | 9,333 | | | | 35,576 | | | | 19,968 | | | | 100,802 | |
Redeemed | | | (160,788 | ) | | | (455,595 | ) | | | (350,159 | ) | | | (1,089,427 | ) |
| | | | | | | | | | | | | | | | |
Net decrease in shares outstanding | | | (119,684 | ) | | | (193,691 | ) | | | (208,076 | ) | | | (485,598 | ) |
| | | | | | | | | | | | | | | | |
| A Class | | | | | | | | | | | | | | | | |
Sold | | | 141,112 | | | | 298,017 | | | | 72,214 | | | | 322,504 | |
Distributions reinvested | | | 19,905 | | | | 59,999 | | | | 16,445 | | | | 72,200 | |
Redeemed | | | (196,678 | ) | | | (514,430 | ) | | | (343,407 | ) | | | (402,414 | ) |
| | | | | | | | | | | | | | | | |
Net decrease in shares outstanding | | | (35,661 | ) | | | (156,414 | ) | | | (254,748 | ) | | | (7,710 | ) |
| | | | | | | | | | | | | | | | |
| | | | |
| June 30, 2009 | | 106 | | See Notes to Financial Statements |
Statements of Changes in Net Assets
| | | | | | | | | | | | | | | | |
| | | ACCESSOR GROWTH
ALLOCATION | | | ACCESSOR AGGRESSIVE
GROWTH ALLOCATION | |
| | | PERIOD ENDED
JUNE 30, 2009
(UNAUDITED) | | | YEAR ENDED
DEC. 31, 2008 | | | PERIOD ENDED
JUNE 30, 2009
(UNAUDITED) | | | YEAR ENDED
DEC. 31, 2008 | |
| OPERATIONS: | | | | | | | | | | | | | | | | |
Net investment income | | $ | 625,632 | | | $ | 1,239,747 | | | $ | 105,760 | | | $ | 112,207 | |
Net realized gain (loss) on investments | | | (729,906 | ) | | | 803,477 | | | | (386,611 | ) | | | 517,308 | |
Change in unrealized appreciation (depreciation) of investments and other assets and liabilities | | | 3,972,003 | | | | (57,329,670 | ) | | | 1,774,319 | | | | (32,914,014 | ) |
| | | | | | | | | | | | | | | | |
Net increase/(decrease) in net assets resulting from operations | | | 3,867,729 | | | | (55,286,446 | ) | | | 1,493,468 | | | | (32,284,499 | ) |
| | | | | | | | | | | | | | | | |
| DISTRIBUTIONS TO SHAREHOLDERS: | | | | | | | | | | | | | | | | |
From net investment income | | | | | | | | | | | | | | | | |
Institutional Class | | | (342,593 | ) | | | (1,056,535 | ) | | | (87,203 | ) | | | (362,213 | ) |
Investor Class | | | (73,112 | ) | | | (248,820 | ) | | | (9,254 | ) | | | (69,595 | ) |
C Class | | | (99,925 | ) | | | (351,589 | ) | | | — | | | | (46,236 | ) |
A Class | | | (115,710 | ) | | | (394,213 | ) | | | (14,131 | ) | | | (83,421 | ) |
From net realized gains on investments | | | | | | | | | | | | | | | | |
Advisor Class | | | — | | | | (1,187,230 | ) | | | — | | | | (847,654 | ) |
Investor Class | | | — | | | | (369,156 | ) | | | — | | | | (224,946 | ) |
C Class | | | — | | | | (803,344 | ) | | | — | | | | (203,766 | ) |
A Class | | | — | | | | (536,548 | ) | | | — | | | | (259,266 | ) |
| | | | | | | | | | | | | | | | |
Total distributions | | | (631,340 | ) | | | (4,947,435 | ) | | | (110,588 | ) | | | (2,097,097 | ) |
| | | | | | | | | | | | | | | | |
| SHARE TRANSACTIONS: | | | | | | | | | | | | | | | | |
| Institutional Class | | | | | | | | | | | | | | | | |
Proceeds from sales of shares | | | 6,696,015 | | | | 12,099,617 | | | | 5,014,408 | | | | 8,332,013 | |
Issued to shareholders in reinvestment of distributions | | | 289,806 | | | | 2,019,337 | | | | 76,384 | | | | 1,100,051 | |
Cost of shares redeemed | | | (4,970,733 | ) | | | (14,635,659 | ) | | | (2,848,676 | ) | | | (9,089,184 | ) |
| | | | | | | | | | | | | | | | |
Net increase (decrease) from share transactions | | | 2,015,088 | | | | (516,705 | ) | | | 2,242,116 | | | | 342,880 | |
| | | | | | | | | | | | | | | | |
| Investor Class | | | | | | | | | | | | | | | | |
Proceeds from sales of shares | | | 918,610 | | | | 5,426,611 | | | | 816,735 | | | | 2,619,890 | |
Issued to shareholders in reinvestment of distributions | | | 72,330 | | | | 611,999 | | | | 9,215 | | | | 293,446 | |
Cost of shares redeemed | | | (2,150,800 | ) | | | (4,635,190 | ) | | | (460,645 | ) | | | (3,685,000 | ) |
| | | | | | | | | | | | | | | | |
Net increase (decrease) from share transactions | | | (1,159,860 | ) | | | 1,403,420 | | | | 365,305 | | | | (771,664 | ) |
| | | | | | | | | | | | | | | | |
| C Class | | | | | | | | | | | | | | | | |
Proceeds from sales of shares | | | 1,804,760 | | | | 5,886,276 | | | | 449,039 | | | | 1,758,195 | |
Issued to shareholders in reinvestment of distributions | | | 97,622 | | | | 1,123,236 | | | | — | | | | 248,084 | |
Cost of shares redeemed | | | (2,420,090 | ) | | | (9,059,099 | ) | | | (557,804 | ) | | | (1,739,378 | ) |
| | | | | | | | | | | | | | | | |
Net increase (decrease) from share transactions | | | (517,708 | ) | | | (2,049,587 | ) | | | (108,765 | ) | | | 266,901 | |
| | | | | | | | | | | | | | | | |
| A Class | | | | | | | | | | | | | | | | |
Proceeds from sales of shares | | | 989,868 | | | | 4,294,091 | | | | 485,131 | | | | 2,063,788 | |
Issued to shareholders in reinvestment of distributions | | | 108,074 | | | | 869,366 | | | | 12,537 | | | | 302,759 | |
Cost of shares redeemed | | | (1,809,100 | ) | | | (5,692,197 | ) | | | (512,939 | ) | | | (1,986,423 | ) |
| | | | | | | | | | | | | | | | |
Net increase (decrease) from share transactions | | | (711,158 | ) | | | (528,740 | ) | | | (15,271 | ) | | | 380,124 | |
| | | | | | | | | | | | | | | | |
Total increase (decrease) from share transactions | | | (373,638 | ) | | | (1,691,612 | ) | | | 2,483,385 | | | | 218,241 | |
| | | | | | | | | | | | | | | | |
Net increase/(decrease) in net assets | | | 2,862,751 | | | | (61,925,493 | ) | | | 3,866,265 | | | | (34,163,355 | ) |
| | | | | | | | | | | | | | | | |
| | | | |
| See Notes to Financial Statements | | 107 | | June 30, 2009 |
Statements of Changes in Net Assets
| | | | | | | | | | | | | | | | |
| | | ACCESSOR GROWTH
ALLOCATION | | | ACCESSOR AGGRESSIVE
GROWTH ALLOCATION | |
| | | PERIOD ENDED
JUNE 30, 2009
(UNAUDITED) | | | YEAR ENDED
DEC. 31, 2008 | | | PERIOD ENDED
JUNE 30, 2009
(UNAUDITED) | | | YEAR ENDED
DEC. 31, 2008 | |
| NET ASSETS: | | | | | | | | | | | | | | | | |
Beginning of period | | $ | 96,429,116 | | | $ | 158,354,609 | | | $ | 45,863,535 | | | $ | 80,026,890 | |
| | | | | | | | | | | | | | | | |
End of period (including undistributed (distributions in excess) net investment income (loss) of $(5,706), $2, $(2,385) and $2,443 respectively) | | $ | 99,291,867 | | | $ | 96,429,116 | | | $ | 49,729,800 | | | $ | 45,863,535 | |
| | | | | | | | | | | | | | | | |
| Other Informations: | | | | | | | | | | | | | | | | |
| SHARE TRANSACTIONS: | | | | | | | | | | | | | | | | |
| Institutional Class | | | | | | | | | | | | | | | | |
Sold | | | 604,123 | | | | 781,609 | | | | 468,280 | | | | 519,563 | |
Distributions reinvested | | | 25,825 | | | | 138,103 | | | | 7,203 | | | | 72,991 | |
Redeemed | | | (451,495 | ) | | | (988,660 | ) | | | (282,004 | ) | | | (587,772 | ) |
| | | | | | | | | | | | | | | | |
Net increase (decrease) in shares outstanding | | | 178,453 | | | | (68,948 | ) | | | 193,479 | | | | 4,782 | |
| | | | | | | | | | | | | | | | |
| Investor Class | | | | | | | | | | | | | | | | |
Sold | | | 83,436 | | | | 342,734 | | | | 80,099 | | | | 172,607 | |
Distributions reinvested | | | 6,504 | | | | 42,073 | | | | 908 | | | | 19,844 | |
Redeemed | | | (189,982 | ) | | | (302,794 | ) | | | (46,871 | ) | | | (236,937 | ) |
| | | | | | | | | | | | | | | | |
Net increase (decrease) in shares outstanding | | | (100,042 | ) | | | 82,013 | | | | 34,136 | | | | (44,486 | ) |
| | | | | | | | | | | | | | | | |
| C Class | | | | | | | | | | | | | | | | |
Sold | | | 164,118 | | | | 381,050 | | | | 45,114 | | | | 113,944 | |
Distributions reinvested | | | 8,861 | | | | 77,801 | | | | — | | | | 16,884 | |
Redeemed | | | (221,093 | ) | | | (597,610 | ) | | | (56,503 | ) | | | (117,198 | ) |
| | | | | | | | | | | | | | | | |
Net increase (decrease) in shares outstanding | | | (48,114 | ) | | | (138,759 | ) | | | (11,389 | ) | | | 13,630 | |
| | | | | | | | | | | | | | | | |
| A Class | | | | | | | | | | | | | | | | |
Sold | | | 89,794 | | | | 265,739 | | | | 47,204 | | | | 126,978 | |
Distributions reinvested | | | 9,674 | | | | 59,650 | | | | 1,206 | | | | 20,185 | |
Redeemed | | | (164,877 | ) | | | (375,972 | ) | | | (48,372 | ) | | | (129,074 | ) |
| | | | | | | | | | | | | | | | |
Net increase (decrease) in shares outstanding | | | (65,409 | ) | | | (50,583 | ) | | | 38 | | | | 18,089 | |
| | | | | | | | | | | | | | | | |
| | | | |
| June 30, 2009 | | 108 | | See Notes to Financial Statements |
Financial Highlights
For a share outstanding throughout the periods presented
Accessor Growth Fund
| | | | | | | | | | | | | | | | | | | | | | | | |
| | | INSTITUTIONAL CLASS SHARES | |
| | | PERIOD ENDED
JUNE 30,
2009 (UNAUDITED) | | | FOR THE YEARS
ENDED DECEMBER 31, | |
| | | | 2008 | | | 2007 | | | 2006 | | | 2005 | | | 2004 | |
| NET ASSET VALUE, BEGINNING OF PERIOD | | $ | 18.01 | | | $ | 27.48 | | | $ | 26.03 | | | $ | 24.49 | | | $ | 23.08 | | | $ | 20.77 | |
Net investment income (loss)1 | | | 0.05 | | | | 0.06 | | | | 0.08 | | | | 0.07 | | | | 0.05 | | | | 0.13 | |
Net realized and unrealized gain (loss) on investments1 | | | 0.76 | | | | (9.46 | ) | | | 1.44 | | | | 1.54 | | | | 1.43 | | | | 2.26 | |
| | | | | | | | | | | | | | | | | | | | | | | | |
Total from investment operations | | | 0.81 | | | | (9.40 | ) | | | 1.52 | | | | 1.61 | | | | 1.48 | | | | 2.39 | |
| | | | | | | | | | | | | | | | | | | | | | | | |
Distributions from net investment income | | | (0.07 | ) | | | (0.07 | ) | | | (0.07 | ) | | | (0.07 | ) | | | (0.07 | ) | | | (0.08 | ) |
| | | | | | | | | | | | | | | | | | | | | | | | |
Total Distributions | | | (0.07 | ) | | | (0.07 | ) | | | (0.07 | ) | | | (0.07 | ) | | | (0.07 | ) | | | (0.08 | ) |
| | | | | | | | | | | | | | | | | | | | | | | | |
| REDEMPTION FEES | | | — | | | | 0.00 | 3 | | | 0.00 | 3 | | | 0.00 | 3 | | | 0.00 | 3 | | | 0.00 | 3 |
| | | | | | | | | | | | | | | | | | | | | | | | |
| NET ASSET VALUE, END OF PERIOD | | $ | 18.75 | | | $ | 18.01 | | | $ | 27.48 | | | $ | 26.03 | | | $ | 24.49 | | | $ | 23.08 | |
| | | | | | | | | | | | | | | | | | | | | | | | |
| TOTAL RETURN2 | | | 4.51 | % | | | (34.24 | )% | | | 5.86 | % | | | 6.56 | % | | | 6.44 | % | | | 11.52 | % |
| | | | | | |
| NET ASSETS, END OF PERIOD (IN THOUSANDS) | | $ | 21,036 | | | $ | 80,617 | | | $ | 161,713 | | | $ | 178,084 | | | $ | 133,132 | | | $ | 113,110 | |
| | | | | | |
| RATIO OF EXPENSES TO AVERAGE NET ASSETS4 | | | 1.07 | %* | | | 1.02 | % | | | 1.12 | % | | | 1.20 | % | | | 1.22 | % | | | 0.91 | % |
| RATIO OF NET INVESTMENT INCOME (LOSS) TO AVERAGE NET ASSETS | | | 0.60 | %* | | | 0.26 | % | | | 0.30 | % | | | 0.29 | % | | | 0.21 | % | | | 0.60 | % |
| PORTFOLIO TURNOVER RATE | | | 43.57 | % | | | 166.14 | % | | | 190.94 | % | | | 130.94 | % | | | 97.70 | % | | | 141.00 | % |
1 Per share amounts are based upon average shares outstanding.
2 Total return is for the period indicated and has not been annualized. Total return is calculated assuming a purchase of shares at net asset value per share on the first day and a sale at net asset value per share on the last day of each period reported. Distributions are assumed, for purposes of this calculation, to be reinvested at the net asset value per share on the respective payment dates of each Fund.
3 Less than $0.005 per share.
4 The effect of any custody credits on this ratio is less than 0.01%.
* Annualized
| | | | |
| See Notes to Financial Statements | | 109 | | June 30, 2009 |
Financial Highlights
For a share outstanding throughout the periods presented
Accessor Growth Fund
| | | | | | | | | | | | | | | | | | | | | | | | |
| | | INVESTOR CLASS SHARES | |
| | | PERIOD ENDED
JUNE 30,
2009 (UNAUDITED) | | | FOR THE YEARS
ENDED DECEMBER 31, | |
| | | | 2008 | | | 2007 | | | 2006 | | | 2005 | | | 2004 | |
| NET ASSET VALUE, BEGINNING OF PERIOD | | $ | 17.58 | | | $ | 26.87 | | | $ | 25.49 | | | $ | 24.00 | | | $ | 22.65 | | | $ | 20.42 | |
Net investment income (loss)1 | | | 0.02 | | | | 0.06 | | | | (0.01 | ) | | | 0.02 | | | | (0.03 | ) | | | 0.01 | |
Net realized and unrealized gain (loss) on investments1 | | | 0.73 | | | | (9.19 | ) | | | 1.41 | | | | 1.51 | | | | 1.41 | | | | 2.23 | |
| | | | | | | | | | | | | | | | | | | | | | | | |
Total from investment operations | | | 0.75 | | | | (9.13 | ) | | | 1.40 | | | | 1.53 | | | | 1.38 | | | | 2.24 | |
| | | | | | | | | | | | | | | | | | | | | | | | |
Distributions from net investment income | | | (0.03 | ) | | | (0.16 | ) | | | (0.02 | ) | | | (0.04 | ) | | | (0.03 | ) | | | (0.01 | ) |
| | | | | | | | | | | | | | | | | | | | | | | | |
Total Distributions | | | (0.03 | ) | | | (0.16 | ) | | | (0.02 | ) | | | (0.04 | ) | | | (0.03 | ) | | | (0.01 | ) |
| | | | | | | | | | | | | | | | | | | | | | | | |
| REDEMPTION FEES | | | — | | | | — | | | | — | | | | 0.00 | 3 | | | 0.00 | 3 | | | 0.00 | 3 |
| | | | | | | | | | | | | | | | | | | | | | | | |
| NET ASSET VALUE, END OF PERIOD | | $ | 18.30 | | | $ | 17.58 | | | $ | 26.87 | | | $ | 25.49 | | | $ | 24.00 | | | $ | 22.65 | |
| | | | | | | | | | | | | | | | | | | | | | | | |
| TOTAL RETURN2 | | | 4.26 | % | | | (33.96 | )% | | | 5.49 | % | | | 6.36 | % | | | 6.11 | % | | | 10.96 | % |
| | | | | | |
| NET ASSETS, END OF PERIOD (IN THOUSANDS) | | $ | 551 | | | $ | 812 | | | $ | 2,037 | | | $ | 2,293 | | | $ | 2,682 | | | $ | 2,687 | |
| | | | | | |
| RATIO OF EXPENSES TO AVERAGE NET ASSETS4 | | | 1.52 | %* | | | 1.00 | % | | | 1.47 | % | | | 1.39 | % | | | 1.54 | % | | | 1.37 | % |
| RATIO OF NET INVESTMENT INCOME (LOSS) TO AVERAGE NET ASSETS | | | 0.29 | %* | | | 0.26 | % | | | (0.05 | )% | | | 0.06 | % | | | (0.13 | )% | | | 0.05 | % |
| PORTFOLIO TURNOVER RATE | | | 43.57 | % | | | 166.14 | % | | | 190.94 | % | | | 130.94 | % | | | 97.70 | % | | | 141.00 | % |
1 Per share amounts are based upon average shares outstanding.
2 Total return is for the period indicated and has not been annualized. Total return is calculated assuming a purchase of shares at net asset value per share on the first day and a sale at net asset value per share on the last day of each period reported. Distributions are assumed, for purposes of this calculation, to be reinvested at the net asset value per share on the respective payment dates of each Fund.
3 Less than $0.005 per share.
4 The effect of any custody credits on this ratio is less than 0.01%.
* Annualized
| | | | |
| June 30, 2009 | | 110 | | See Notes to Financial Statements |
Financial Highlights
For a share outstanding throughout the periods presented
Accessor Growth Fund
| | | | | | | | | | | | | | | | | | | | | | | | |
| | | C CLASS SHARES | |
| | | PERIOD ENDED
JUNE 30,
2009 (UNAUDITED) | | | FOR THE YEARS
ENDED DECEMBER 31, | |
| | �� | | 2008 | | | 2007 | | | 2006 | | | 2005 | | | 2004 | |
| NET ASSET VALUE, BEGINNING OF PERIOD | | $ | 17.32 | | | $ | 26.61 | | | $ | 25.39 | | | $ | 24.07 | | | $ | 22.83 | | | $ | 20.68 | |
Net investment income (loss)1 | | | (0.01 | ) | | | (0.19 | ) | | | (0.18 | ) | | | (0.17 | ) | | | (0.18 | ) | | | (0.07 | ) |
Net realized and unrealized gain (loss) on investments1 | | | 0.71 | | | | (9.10 | ) | | | 1.40 | | | | 1.49 | | | | 1.42 | | | | 2.22 | |
| | | | | | | | | | | | | | | | | | | | | | | | |
Total from investment operations | | | 0.70 | | | | (9.29 | ) | | | 1.22 | | | | 1.32 | | | | 1.24 | | | | 2.15 | |
| | | | | | | | | | | | | | | | | | | | | | | | |
Distributions from net investment income | | | — | | | | — | | | | — | | | | — | | | | — | | | | — | |
| | | | | | | | | | | | | | | | | | | | | | | | |
Total Distributions | | | — | | | | — | | | | — | | | | — | | | | — | | | | — | |
| | | | | | | | | | | | | | | | | | | | | | | | |
| REDEMPTION FEES | | | — | | | | — | | | | — | | | | 0.00 | 3 | | | 0.00 | 3 | | | 0.00 | 3 |
| | | | | | | | | | | | | | | | | | | | | | | | |
| NET ASSET VALUE, END OF PERIOD | | $ | 18.02 | | | $ | 17.32 | | | $ | 26.61 | | | $ | 25.39 | | | $ | 24.07 | | | $ | 22.83 | |
| | | | | | | | | | | | | | | | | | | | | | | | |
| TOTAL RETURN2 | | | 4.04 | % | | | (34.91 | )% | | | 4.81 | % | | | 5.48 | % | | | 5.43 | % | | | 10.40 | % |
| | | | | | |
| NET ASSETS, END OF PERIOD (IN THOUSANDS) | | $ | 494 | | | $ | 866 | | | $ | 5,470 | | | $ | 5,269 | | | $ | 4,095 | | | $ | 3,327 | |
| | | | | | |
| RATIO OF EXPENSES TO AVERAGE NET ASSETS4 | | | 2.03 | %* | | | 2.00 | % | | | 2.10 | % | | | 2.20 | % | | | 2.22 | % | | | 1.92 | % |
| RATIO OF NET INVESTMENT INCOME (LOSS) TO AVERAGE NET ASSETS | | | (0.16 | )%* | | | (0.81 | )% | | | (0.70 | )% | | | (0.71 | )% | | | (0.80 | )% | | | (0.35 | )% |
| PORTFOLIO TURNOVER RATE | | | 43.57 | % | | | 166.14 | % | | | 190.94 | % | | | 130.94 | % | | | 97.70 | % | | | 141.00 | % |
1 Per share amounts are based upon average shares outstanding.
2 Total return is for the period indicated and has not been annualized. Total return is calculated assuming a purchase of shares at net asset value per share on the first day and a sale at net asset value per share on the last day of each period reported. Distributions are assumed, for purposes of this calculation, to be reinvested at the net asset value per share on the respective payment dates of each Fund.
3 Less than $0.005 per share.
4 The effect of any custody credits on this ratio is less than 0.01%.
* Annualized
| | | | |
| See Notes to Financial Statements | | 111 | | June 30, 2009 |
Financial Highlights
For a share outstanding throughout the periods presented
Accessor Growth Fund
| | | | | | | | | | | | | | | | | | | | | | | | |
| | | A CLASS SHARES | |
| | | PERIOD ENDED
JUNE 30,
2009 (UNAUDITED) | | | FOR THE YEARS
ENDED DECEMBER 31, | |
| | | | 2008 | | | 2007 | | | 2006 | | | 2005 | | | 2004 | |
| NET ASSET VALUE, BEGINNING OF PERIOD | | $ | 17.86 | | | $ | 27.30 | | | $ | 25.89 | | | $ | 24.40 | | | $ | 23.02 | | | $ | 20.75 | |
Net investment income (loss)1 | | | 0.04 | | | | (0.02 | ) | | | (0.01 | ) | | | (0.01 | ) | | | (0.03 | ) | | | 0.17 | |
Net realized and unrealized gain (loss) on investments1 | | | 0.73 | | | | (9.40 | ) | | | 1.43 | | | | 1.52 | | | | 1.44 | | | | 2.13 | |
| | | | | | | | | | | | | | | | | | | | | | | | |
Total from investment operations | | | 0.77 | | | | (9.42 | ) | | | 1.42 | | | | 1.51 | | | | 1.41 | | | | 2.30 | |
| | | | | | | | | | | | | | | | | | | | | | | | |
Distributions from net investment income | | | (0.04 | ) | | | (0.02 | ) | | | (0.01 | ) | | | (0.02 | ) | | | (0.03 | ) | | | (0.03 | ) |
| | | | | | | | | | | | | | | | | | | | | | | | |
Total Distributions | | | (0.04 | ) | | | (0.02 | ) | | | (0.01 | ) | | | (0.02 | ) | | | (0.03 | ) | | | (0.03 | ) |
| | | | | | | | | | | | | | | | | | | | | | | | |
| REDEMPTION FEES | | | — | | | | — | | | | — | | | | 0.00 | 3 | | | 0.00 | 3 | | | 0.00 | 3 |
| | | | | | | | | | | | | | | | | | | | | | | | |
| NET ASSET VALUE, END OF PERIOD | | $ | 18.59 | | | $ | 17.86 | | | $ | 27.30 | | | $ | 25.89 | | | $ | 24.40 | | | $ | 23.02 | |
| | | | | | | | | | | | | | | | | | | | | | | | |
| TOTAL RETURN2,4 | | | 4.34 | % | | | (34.49 | )% | | | 5.50 | % | | | 6.20 | % | | | 6.13 | % | | | 11.10 | % |
| | | | | | |
| NET ASSETS, END OF PERIOD (IN THOUSANDS) | | $ | 459 | | | $ | 524 | | | $ | 780 | | | $ | 779 | | | $ | 746 | | | $ | 175 | |
| | | | | | |
| RATIO OF EXPENSES TO AVERAGE NET ASSETS5 | | | 1.37 | %* | | | 1.38 | % | | | 1.46 | % | | | 1.55 | % | | | 1.62 | % | | | 1.30 | % |
| RATIO OF NET INVESTMENT INCOME (LOSS) TO AVERAGE NET ASSETS | | | 0.44 | %* | | | (0.09 | )% | | | (0.04 | )% | | | (0.05 | )% | | | (0.11 | )% | | | (0.77 | )% |
| PORTFOLIO TURNOVER RATE | | | 43.57 | % | | | 166.14 | % | | | 190.94 | % | | | 130.94 | % | | | 97.70 | % | | | 141.00 | % |
1 Per share amounts are based upon average shares outstanding.
2 Total return is for the period indicated and has not been annualized. Total return is calculated assuming a purchase of shares at net asset value per share on the first day and a sale at net asset value per share on the last day of each period reported. Distributions are assumed, for purposes of this calculation, to be reinvested at the net asset value per share on the respective payment dates of each Fund.
3 Less than $0.005 per share.
4 A Class total return does not include the one-time front-end sales charge.
5 The effect of any custody credits on this ratio is less than 0.01%.
* Annualized
| | | | |
| June 30, 2009 | | 112 | | See Notes to Financial Statements |
Financial Highlights
For a share outstanding throughout the period presented
Accessor Growth Fund
| | | | |
| | | Z CLASS SHARES | |
| | | PERIOD ENDED
JUNE 30,
20094 (UNAUDITED) | |
| NET ASSET VALUE, BEGINNING OF PERIOD | | $ | 18.35 | |
Net investment income (loss)1 | | | 0.04 | |
Net realized and unrealized gain (loss) on investments1 | | | 0.39 | |
| | | | |
Total from investment operations | | | 0.43 | |
| | | | |
Distributions from net investment income | | | (0.04 | ) |
| | | | |
Total Distributions | | | (0.04 | ) |
| | | | |
| REDEMPTION FEES | | | — | |
| | | | |
| NET ASSET VALUE, END OF PERIOD | | $ | 18.74 | |
| | | | |
| TOTAL RETURN2 | | | 2.35 | % |
| |
| NET ASSETS, END OF PERIOD (IN THOUSANDS) | | $ | 53,233 | |
| |
| RATIO OF EXPENSES TO AVERAGE NET ASSETS3 | | | 0.91 | %* |
| RATIO OF NET INVESTMENT INCOME (LOSS) TO AVERAGE NET ASSETS | | | 1.41 | %* |
| PORTFOLIO TURNOVER RATE | | | 43.57 | % |
1 Per share amounts are based upon average shares outstanding.
2 Total return is for the period indicated and has not been annualized. Total return is calculated assuming a purchase of shares at net asset value per share on the first day and a sale at net asset value per share on the last day of each period reported. Distributions are assumed, for purposes of this calculation, to be reinvested at the net asset value per share on the respective payment dates of each Fund.
3 The effect of any custody credits on this ratio is less than 0.01%.
4 Commenced operations on May 5, 2009.
* Annualized
| | | | |
| See Notes to Financial Statements | | 113 | | June 30, 2009 |
Financial Highlights
For a share outstanding throughout the periods presented
Accessor Value Fund
| | | | | | | | | | | | | | | | | | | | | | | | |
| | | INSTITUTIONAL CLASS SHARES | |
| | | PERIOD ENDED
JUNE 30,
2009 (UNAUDITED) | | | FOR THE YEARS
ENDED DECEMBER 31, | |
| | | | 2008 | | | 2007 | | | 2006 | | | 2005 | | | 2004 | |
| NET ASSET VALUE, BEGINNING OF PERIOD | | $ | 14.21 | | | $ | 23.85 | | | $ | 23.94 | | | $ | 20.86 | | | $ | 19.93 | | | $ | 17.58 | |
Net investment income (loss)1 | | | 0.16 | | | | 0.36 | | | | 0.26 | | | | 0.31 | | | | 0.27 | | | | 0.23 | |
Net realized and unrealized gain (loss) on investments1 | | | (0.85 | ) | | | (9.64 | ) | | | 0.55 | | | | 3.09 | | | | 0.93 | | | | 2.33 | |
| | | | | | | | | | | | | | | | | | | | | | | | |
Total from investment operations | | | (0.69 | ) | | | (9.28 | ) | | | 0.81 | | | | 3.40 | | | | 1.20 | | | | 2.56 | |
| | | | | | | | | | | | | | | | | | | | | | | | |
Distributions from net investment income | | | (0.15 | ) | | | (0.36 | ) | | | (0.24 | ) | | | (0.32 | ) | | | (0.27 | ) | | | (0.21 | ) |
Distributions from capital gains | | | — | | | | — | | | | (0.66 | ) | | | — | | | | — | | | | — | |
| | | | | | | | | | | | | | | | | | | | | | | | |
Total Distributions | | | (0.15 | ) | | | (0.36 | ) | | | (0.90 | ) | | | (0.32 | ) | | | (0.27 | ) | | | (0.21 | ) |
| | | | | | | | | | | | | | | | | | | | | | | | |
| REDEMPTION FEES | | | — | | | | 0.00 | 3 | | | 0.00 | 3 | | | 0.00 | 3 | | | — | | | | 0.00 | 3 |
| | | | | | | | | | | | | | | | | | | | | | | | |
| NET ASSET VALUE, END OF PERIOD | | $ | 13.37 | | | $ | 14.21 | | | $ | 23.85 | | | $ | 23.94 | | | $ | 20.86 | | | $ | 19.93 | |
| | | | | | | | | | | | | | | | | | | | | | | | |
| TOTAL RETURN2 | | | (4.76 | )% | | | (39.18 | )% | | | 3.32 | % | | | 16.42 | % | | | 6.09 | % | | | 14.67 | % |
| | | | | | |
| NET ASSETS, END OF PERIOD (IN THOUSANDS) | | $ | 18,259 | | | $ | 78,171 | | | $ | 141,422 | | | $ | 127,895 | | | $ | 109,228 | | | $ | 94,222 | |
| | | | | | |
| RATIO OF EXPENSES TO AVERAGE NET ASSETS4 | | | 1.08 | %* | | | 1.01 | % | | | 0.97 | % | | | 0.99 | % | | | 1.00 | % | | | 0.84 | % |
| RATIO OF NET EXPENSES TO AVERAGE NET ASSETS4 | | | 1.08 | %* | | | 1.01 | % | | | 0.97 | % | | | 0.99 | % | | | 0.85 | % | | | 0.84 | % |
| RATIO OF NET INVESTMENT INCOME (LOSS) TO AVERAGE NET ASSETS | | | 2.55 | %* | | | 1.87 | % | | | 1.04 | % | | | 1.40 | % | | | 1.36 | % | | | 1.27 | % |
| PORTFOLIO TURNOVER RATE | | | 67.40 | % | | | 144.57 | % | | | 158.41 | % | | | 64.20 | % | | | 70.01 | % | | | 88.83 | % |
1 Per share amounts are based upon average shares outstanding.
2 Total return is for the period indicated and has not been annualized. Total return is calculated assuming a purchase of shares at net asset value per share on the first day and a sale at net asset value per share on the last day of each period reported. Distributions are assumed, for purposes of this calculation, to be reinvested at the net asset value per share on the respective payment dates of each Fund.
3 Less than 0.005 per share
4 The effect of any custody credits on this ratio is less than 0.01%.
* Annualized
| | | | |
| June 30, 2009 | | 114 | | See Notes to Financial Statements |
Financial Highlights
For a share outstanding throughout the periods presented
Accessor Value Fund
| | | | | | | | | | | | | | | | | | | | | | | | |
| | | INVESTOR CLASS SHARES | |
| | | PERIOD ENDED
JUNE 30,
2009 (UNAUDITED) | | | FOR THE YEARS
ENDED DECEMBER 31, | |
| | | | 2008 | | | 2007 | | | 2006 | | | 2005 | | | 2004 | |
| NET ASSET VALUE, BEGINNING OF PERIOD | | $ | 14.23 | | | $ | 23.87 | | | $ | 23.97 | | | $ | 20.88 | | | $ | 19.95 | | | $ | 17.57 | |
Net investment income (loss)1 | | | 0.13 | | | | 0.26 | | | | 0.13 | | | | 0.20 | | | | 0.21 | | | | 0.14 | |
Net realized and unrealized gain (loss) on investments1 | | | (0.85 | ) | | | (9.64 | ) | | | 0.55 | | | | 3.10 | | | | 0.93 | | | | 2.34 | |
| | | | | | | | | | | | | | | | | | | | | | | | |
Total from investment operations | | | (0.72 | ) | | | (9.38 | ) | | | 0.68 | | | | 3.30 | | | | 1.14 | | | | 2.48 | |
| | | | | | | | | | | | | | | | | | | | | | | | |
Distributions from net investment income | | | (0.12 | ) | | | (0.26 | ) | | | (0.12 | ) | | | (0.21 | ) | | | (0.21 | ) | | | (0.10 | ) |
Distributions from capital gains | | | — | | | | — | | | | (0.66 | ) | | | — | | | | — | | | | — | |
| | | | | | | | | | | | | | | | | | | | | | | | |
Total Distributions | | | (0.12 | ) | | | (0.26 | ) | | | (0.78 | ) | | | (0.21 | ) | | | (0.21 | ) | | | (0.10 | ) |
| | | | | | | | | | | | | | | | | | | | | | | | |
| REDEMPTION FEES | | | — | | | | — | | | | — | | | | 0.00 | 3 | | | — | | | | 0.00 | |
| | | | | | | | | | | | | | | | | | | | | | | | |
| NET ASSET VALUE, END OF PERIOD | | $ | 13.39 | | | $ | 14.23 | | | $ | 23.87 | | | $ | 23.97 | | | $ | 20.88 | | | $ | 19.95 | |
| | | | | | | | | | | | | | | | | | | | | | | | |
| TOTAL RETURN2 | | | (4.97 | )% | | | (39.49 | )% | | | 2.76 | % | | | 15.88 | % | | | 5.78 | % | | | 14.13 | % |
| | | | | | |
| NET ASSETS, END OF PERIOD (IN THOUSANDS) | | $ | 582 | | | $ | 795 | | | $ | 2,053 | | | $ | 2,207 | | | $ | 2,448 | | | $ | 2,372 | |
| | | | | | |
| RATIO OF EXPENSES TO AVERAGE NET ASSETS4 | | | 1.54 | %* | | | 1.50 | % | | | 1.47 | % | | | 1.47 | % | | | 1.29 | % | | | 1.30 | % |
| RATIO OF NET EXPENSES TO AVERAGE NET ASSETS4 | | | 1.54 | %* | | | 1.50 | % | | | 1.47 | % | | | 1.47 | % | | | 1.14 | % | | | 1.30 | % |
| RATIO OF NET INVESTMENT INCOME (LOSS) TO AVERAGE NET ASSETS | | | 2.00 | %* | | | 1.32 | % | | | 0.53 | % | | | 0.91 | % | | | 1.06 | % | | | 0.78 | % |
| PORTFOLIO TURNOVER RATE | | | 67.40 | % | | | 144.57 | % | | | 158.41 | % | | | 64.20 | % | | | 70.01 | % | | | 88.83 | % |
1 Per share amounts are based upon average shares outstanding.
2 Total return is for the period indicated and has not been annualized. Total return is calculated assuming a purchase of shares at net asset value per share on the first day and a sale at net asset value per share on the last day of each period reported. Distributions are assumed, for purposes of this calculation, to be reinvested at the net asset value per share on the respective payment dates of each Fund.
3 Less than 0.005 per share
4 The effect of any custody credits on this ratio is less than 0.01%.
* Annualized
| | | | |
| See Notes to Financial Statements | | 115 | | June 30, 2009 |
Financial Highlights
For a share outstanding throughout the periods presented
Accessor Value Fund
| | | | | | | | | | | | | | | | | | | | | | | | |
| | | C CLASS SHARES | |
| | | PERIOD ENDED
JUNE 30,
2009 (UNAUDITED) | | | FOR THE YEARS
ENDED DECEMBER 31, | |
| | | | 2008 | | | 2007 | | | 2006 | | | 2005 | | | 2004 | |
| NET ASSET VALUE, BEGINNING OF PERIOD | | $ | 14.19 | | | $ | 23.79 | | | $ | 23.92 | | | $ | 20.84 | | | $ | 19.92 | | | $ | 17.57 | |
Net investment income (loss)1 | | | 0.10 | | | | 0.15 | | | | 0.01 | | | | 0.09 | | | | 0.07 | | | | 0.05 | |
Net realized and unrealized gain (loss) on investments1 | | | (0.84 | ) | | | (9.59 | ) | | | 0.54 | | | | 3.09 | | | | 0.93 | | | | 2.33 | |
| | | | | | | | | | | | | | | | | | | | | | | | |
Total from investment operations | | | (0.74 | ) | | | (9.44 | ) | | | 0.55 | | | | 3.18 | | | | 1.00 | | | | 2.38 | |
| | | | | | | | | | | | | | | | | | | | | | | | |
Distributions from net investment income | | | (0.08 | ) | | | (0.16 | ) | | | (0.02 | ) | | | (0.10 | ) | | | (0.08 | ) | | | (0.03 | ) |
Distributions from capital gains | | | — | | | | — | | | | (0.66 | ) | | | — | | | | — | | | | — | |
| | | | | | | | | | | | | | | | | | | | | | | | |
Total Distributions | | | (0.08 | ) | | | (0.16 | ) | | | (0.68 | ) | | | (0.10 | ) | | | (0.08 | ) | | | (0.03 | ) |
| | | | | | | | | | | | | | | | | | | | | | | | |
| REDEMPTION FEES | | | — | | | | — | | | | — | | | | — | | | | — | | | | — | |
| | | | | | | | | | | | | | | | | | | | | | | | |
| NET ASSET VALUE, END OF PERIOD | | $ | 13.37 | | | $ | 14.19 | | | $ | 23.79 | | | $ | 23.92 | | | $ | 20.84 | | | $ | 19.92 | |
| | | | | | | | | | | | | | | | | | | | | | | | |
| TOTAL RETURN2 | | | (5.21 | )% | | | (39.79 | )% | | | 2.23 | % | | | 15.31 | % | | | 5.02 | % | | | 13.56 | % |
| | | | | | |
| NET ASSETS, END OF PERIOD (IN THOUSANDS) | | $ | 239 | | | $ | 581 | | | $ | 4,162 | | | $ | 3,831 | | | $ | 3,314 | | | $ | 3,020 | |
| | | | | | |
| RATIO OF EXPENSES TO AVERAGE NET ASSETS3 | | | 2.04 | %* | | | 1.99 | % | | | 1.97 | % | | | 1.99 | % | | | 2.00 | % | | | 1.84 | % |
| RATIO OF NET EXPENSES TO AVERAGE NET ASSETS3 | | | 2.04 | %* | | | 1.99 | % | | | 1.97 | % | | | 1.99 | % | | | 1.85 | % | | | 1.84 | % |
| RATIO OF NET INVESTMENT INCOME (LOSS) TO AVERAGE NET ASSETS | | | 1.58 | %* | | | 0.75 | % | | | 0.03 | % | | | 0.40 | % | | | 0.36 | % | | | 0.26 | % |
| PORTFOLIO TURNOVER RATE | | | 67.40 | % | | | 144.57 | % | | | 158.41 | % | | | 64.20 | % | | | 70.01 | % | | | 88.83 | % |
1 Per share amounts are based upon average shares outstanding.
2 Total return is for the period indicated and has not been annualized. Total return is calculated assuming a purchase of shares at net asset value per share on the first day and a sale at net asset value per share on the last day of each period reported. Distributions are assumed, for purposes of this calculation, to be reinvested at the net asset value per share on the respective payment dates of each Fund.
3 The effect of any custody credits on this ratio is less than 0.01%.
* Annualized
| | | | |
| June 30, 2009 | | 116 | | See Notes to Financial Statements |
Financial Highlights
For a share outstanding throughout the periods presented
Accessor Value Fund
| | | | | | | | | | | | | | | | | | | | | | | | |
| | | A CLASS SHARES | |
| | | PERIOD ENDED
JUNE 30,
2009 (UNAUDITED) | | | FOR THE YEARS
ENDED DECEMBER 31, | |
| | | | 2008 | | | 2007 | | | 2006 | | | 2005 | | | 2004 | |
| NET ASSET VALUE, BEGINNING OF PERIOD | | $ | 14.21 | | | $ | 23.84 | | | $ | 23.95 | | | $ | 20.84 | | | $ | 19.91 | | | $ | 17.57 | |
Net investment income (loss)1 | | | 0.13 | | | | 0.29 | | | | 0.18 | | | | 0.25 | | | | 0.20 | | | | 0.20 | |
Net realized and unrealized gain (loss) on investments1 | | | (0.83 | ) | | | (9.63 | ) | | | 0.53 | | | | 3.10 | | | | 0.93 | | | | 2.29 | |
| | | | | | | | | | | | | | | | | | | | | | | | |
Total from investment operations | | | (0.70 | ) | | | (9.34 | ) | | | 0.71 | | | | 3.35 | | | | 1.13 | | | | 2.49 | |
| | | | | | | | | | | | | | | | | | | | | | | | |
Distributions from net investment income | | | (0.14 | ) | | | (0.29 | ) | | | (0.16 | ) | | | (0.24 | ) | | | (0.20 | ) | | | (0.15 | ) |
Distributions from capital gains | | | — | | | | — | | | | (0.66 | ) | | | — | | | | — | | | | — | |
| | | | | | | | | | | | | | | | | | | | | | | | |
Total Distributions | | | (0.14 | ) | | | (0.29 | ) | | | (0.82 | ) | | | (0.24 | ) | | | (0.20 | ) | | | (0.15 | ) |
| | | | | | | | | | | | | | | | | | | | | | | | |
| REDEMPTION FEES | | | — | | | | — | | | | — | | | | 0.00 | 3 | | | — | | | | 0.00 | 3 |
| | | | | | | | | | | | | | | | | | | | | | | | |
| NET ASSET VALUE, END OF PERIOD | | $ | 13.37 | | | $ | 14.21 | | | $ | 23.84 | | | $ | 23.95 | | | $ | 20.84 | | | $ | 19.91 | |
| | | | | | | | | | | | | | | | | | | | | | | | |
| TOTAL RETURN2,4 | | | (4.90 | )% | | | (39.38 | )% | | | 3.07 | % | | | 16.00 | % | | | 5.72 | % | | | 14.24 | % |
| | | | | | |
| NET ASSETS, END OF PERIOD (IN THOUSANDS) | | $ | 84 | | | $ | 91 | | | $ | 256 | | | $ | 160 | | | $ | 1,096 | | | $ | 1,075 | |
| | | | | | |
| RATIO OF EXPENSES TO AVERAGE NET ASSETS5 | | | 1.38 | %* | | | 1.35 | % | | | 1.25 | % | | | 1.35 | % | | | 1.34 | % | | | 1.18 | % |
| RATIO OF NET EXPENSES TO AVERAGE NET ASSETS5 | | | 1.38 | %* | | | 1.35 | % | | | 1.25 | % | | | 1.35 | % | | | 1.19 | % | | | 1.18 | % |
| RATIO OF NET INVESTMENT INCOME (LOSS) TO AVERAGE NET ASSETS | | | 2.12 | %* | | | 1.48 | % | | | 0.70 | % | | | 1.05 | % | | | 1.00 | % | | | 1.00 | % |
| PORTFOLIO TURNOVER RATE | | | 67.40 | % | | | 144.57 | % | | | 158.41 | % | | | 64.20 | % | | | 70.01 | % | | | 88.83 | % |
1 Per share amounts are based upon average shares outstanding.
2 Total return is for the period indicated and has not been annualized. Total return is calculated assuming a purchase of shares at net asset value per share on the first day and a sale at net asset value per share on the last day of each period reported. Distributions are assumed, for purposes of this calculation, to be reinvested at the net asset value per share on the respective payment dates of each Fund.
3 Less than 0.005 per share
4 A Class total return does not include the one-time front-end sales charge.
5 The effect of any custody credits on this ratio is less than 0.01%.
* Annualized
| | | | |
| See Notes to Financial Statements | | 117 | | June 30, 2009 |
Financial Highlights
For a share outstanding throughout the period presented
Accessor Value Fund
| | | | |
| | | Z CLASS SHARES | |
| | | PERIOD ENDED
JUNE 30,
20094 (UNAUDITED) | |
| NET ASSET VALUE, BEGINNING OF PERIOD | | $ | 13.28 | |
Net investment income (loss)1 | | | 0.04 | |
Net realized and unrealized gain (loss) on investments1 | | | 0.11 | |
| | | | |
Total from investment operations | | | 0.15 | |
| | | | |
Distributions from net investment income | | | (0.07 | ) |
| | | | |
Total Distributions | | | (0.07 | ) |
| | | | |
| REDEMPTION FEES | | | — | |
| | | | |
| NET ASSET VALUE, END OF PERIOD | | $ | 13.36 | |
| | | | |
| TOTAL RETURN2 | | | 1.11 | % |
| |
| NET ASSETS, END OF PERIOD (IN THOUSANDS) | | $ | 53,026 | |
| |
| RATIO OF EXPENSES TO AVERAGE NET ASSETS3 | | | 0.93 | %* |
| RATIO OF NET EXPENSES TO AVERAGE NET ASSETS3 | | | 0.93 | %* |
| RATIO OF NET INVESTMENT INCOME (LOSS) TO AVERAGE NET ASSETS | | | 2.06 | %* |
| PORTFOLIO TURNOVER RATE | | | 67.40 | % |
1 Per share amounts are based upon average shares outstanding.
2 Total return is for the period indicated and has not been annualized. Total return is calculated assuming a purchase of shares at net asset value per share on the first day and a sale at net asset value per share on the last day of each period reported. Distributions are assumed, for purposes of this calculation, to be reinvested at the net asset value per share on the respective payment dates of each Fund.
3 The effect of any custody credits on this ratio is less than 0.01%.
4 Commenced operations on May 5, 2009.
* Annualized
| | | | |
| June 30, 2009 | | 118 | | See Notes to Financial Statements |
Financial Highlights
For a share outstanding throughout the periods presented
Accessor Small to Mid Cap Fund
| | | | | | | | | | | | | | | | | | | | | | | | |
| | | INSTITUTIONAL CLASS SHARES | |
| | | PERIOD ENDED
JUNE 30,
2009 (UNAUDITED) | | | FOR THE YEARS
ENDED DECEMBER 31, | |
| | | | 2008 | | | 2007 | | | 2006 | | | 2005 | | | 2004 | |
| NET ASSET VALUE, BEGINNING OF PERIOD | | $ | 18.42 | | | $ | 31.02 | | | $ | 32.06 | | | $ | 28.20 | | | $ | 24.96 | | | $ | 21.00 | |
Net investment income (loss)1 | | | 0.05 | | | | 0.03 | | | | 0.05 | | | | 0.05 | | | | 0.03 | | | | (0.02 | ) |
Net realized and unrealized gain (loss) on investments1 | | | 0.86 | | | | (12.50 | ) | | | (0.97 | ) | | | 3.83 | | | | 3.21 | | | | 3.98 | |
| | | | | | | | | | | | | | | | | | | | | | | | |
Total from investment operations | | | 0.91 | | | | (12.47 | ) | | | (0.92 | ) | | | 3.88 | | | | 3.24 | | | | 3.96 | |
| | | | | | | | | | | | | | | | | | | | | | | | |
Distributions from net investment income | | | (0.08 | ) | | | — | | | | (0.07 | ) | | | (0.02 | ) | | | — | | | | 0.00 | 3 |
Distributions from capital gains | | | — | | | | (0.13 | ) | | | (0.05 | ) | | | — | | | | — | | | | — | |
| | | | | | | | | | | | | | | | | | | | | | | | |
Total Distributions | | | (0.08 | ) | | | (0.13 | ) | | | (0.12 | ) | | | (0.02 | ) | | | — | | | | 0.00 | 3 |
| | | | | | | | | | | | | | | | | | | | | | | | |
| REDEMPTION FEES | | | — | | | | 0.00 | 3 | | | 0.00 | 3 | | | 0.00 | 3 | | | 0.00 | 3 | | | 0.00 | 3 |
| | | | | | | | | | | | | | | | | | | | | | | | |
| NET ASSET VALUE, END OF PERIOD | | $ | 19.25 | | | $ | 18.42 | | | $ | 31.02 | | | $ | 32.06 | | | $ | 28.20 | | | $ | 24.96 | |
| | | | | | | | | | | | | | | | | | | | | | | | |
| TOTAL RETURN2 | | | 4.97 | % | | | (40.33 | )% | | | (2.89 | )% | | | 13.75 | % | | | 12.98 | % | | | 18.86 | % |
| | | | | | |
| NET ASSETS, END OF PERIOD (IN THOUSANDS) | | $ | 100,180 | | | $ | 138,263 | | | $ | 291,934 | | | $ | 288,277 | | | $ | 155,235 | | | $ | 163,878 | |
| | | | | | |
| RATIO OF EXPENSES (INCLUDING DIVIDEND EXPENSE) TO AVERAGE NET ASSETS4,5 | | | 1.32 | %* | | | 1.52 | % | | | 1.26 | % | | | 1.22 | % | | | 1.26 | % | | | 1.20 | % |
| RATIO OF EXPENSES (EXCLUDING DIVIDEND EXPENSE) TO AVERAGE NET ASSETS4,5 | | | 1.32 | %* | | | 1.34 | % | | | 1.20 | % | | | 1.22 | % | | | 1.26 | % | | | 1.20 | % |
| RATIO OF NET INVESTMENT INCOME (LOSS) (INCLUDING DIVIDEND EXPENSE) TO AVERAGE NET ASSETS4,5 | | | 0.57 | %* | | | 0.10 | % | | | 0.15 | % | | | 0.18 | % | | | 0.13 | % | | | (0.09 | )% |
| RATIO OF NET INVESTMENT INCOME (LOSS) (EXCLUDING DIVIDEND EXPENSE) TO AVERAGE NET ASSETS4,5 | | | 0.57 | %* | | | 0.28 | % | | | 0.21 | % | | | 0.18 | % | | | 0.13 | % | | | (0.09 | )% |
| PORTFOLIO TURNOVER RATE | | | 43.55 | % | | | 139.69 | % | | | 57.25 | % | | | 37.24 | % | | | 41.64 | % | | | 46.31 | % |
1 Per share amounts are based upon average shares outstanding.
2 Total return is for the period indicated and has not been annualized. Total return is calculated assuming a purchase of shares at net asset value per share on the first day and a sale at net asset value per share on the last day of each period reported. Distributions are assumed, for purposes of this calculation, to be reinvested at the net asset value per share on the respective payment dates of each Fund.
3 Less than $0.005 per share.
4 The effect of any custody credits on this ratio is less than 0.01%.
5 Dividend expense totaled 0.00%, 0.18%, 0.06%, 0.00%, 0.00% and 0.00%, respectively, of average net assets for the six month period ended June 30, 2009 and the years ended December 31, 2008, 2007, 2006, 2005 and 2004, respectively.
* Annualized
| | | | |
| See Notes to Financial Statements | | 119 | | June 30, 2009 |
Financial Highlights
For a share outstanding throughout the periods presented
Accessor Small to Mid Cap Fund
| | | | | | | | | | | | | | | | | | | | | | | | |
| | | INVESTOR CLASS SHARES | |
| | | PERIOD ENDED
JUNE 30,
2009 (UNAUDITED) | | | FOR THE YEARS
ENDED DECEMBER 31, | |
| | | | 2008 | | | 2007 | | | 2006 | | | 2005 | | | 2004 | |
| NET ASSET VALUE, BEGINNING OF PERIOD | | $ | 17.58 | | | $ | 29.76 | | | $ | 30.84 | | | $ | 27.24 | | | $ | 24.20 | | | $ | 20.46 | |
Net investment income (loss)1 | | | 0.01 | | | | (0.11 | ) | | | (0.10 | ) | | | (0.08 | ) | | | (0.06 | ) | | | (0.12 | ) |
Net realized and unrealized gain (loss) on investments1 | | | 0.82 | | | | (11.94 | ) | | | (0.93 | ) | | | 3.68 | | | | 3.10 | | | | 3.86 | |
| | | | | | | | | | | | | | | | | | | | | | | | |
Total from investment operations | | | 0.83 | | | | (12.05 | ) | | | (1.03 | ) | | | 3.60 | | | | 3.04 | | | | 3.74 | |
| | | | | | | | | | | | | | | | | | | | | | | | |
Distributions from net investment income | | | (0.04 | ) | | | — | | | | — | | | | — | | | | — | | | | — | |
Distributions from capital gains | | | — | | | | (0.13 | ) | | | (0.05 | ) | | | — | | | | — | | | | — | |
| | | | | | | | | | | | | | | | | | | | | | | | |
Total Distributions | | | (0.04 | ) | | | (0.13 | ) | | | (0.05 | ) | | | — | | | | — | | | | — | |
| | | | | | | | | | | | | | | | | | | | | | | | |
| REDEMPTION FEES | | | — | | | | — | | | | (0.00 | )3 | | | 0.00 | 3 | | | 0.00 | 3 | | | 0.00 | 3 |
| | | | | | | | | | | | | | | | | | | | | | | | |
| NET ASSET VALUE, END OF PERIOD | | $ | 18.37 | | | $ | 17.58 | | | $ | 29.76 | | | $ | 30.84 | | | $ | 27.24 | | | $ | 24.20 | |
| | | | | | | | | | | | | | | | | | | | | | | | |
| TOTAL RETURN2 | | | 4.74 | % | | | (40.63 | )% | | | (3.35 | )% | | | 13.22 | % | | | 12.56 | % | | | 18.28 | % |
| | | | | | |
| NET ASSETS, END OF PERIOD (IN THOUSANDS) | | $ | 1,283 | | | $ | 1,744 | | | $ | 4,719 | | | $ | 4,396 | | | $ | 4,028 | | | $ | 3,414 | |
| | | | | | |
| RATIO OF EXPENSES (INCLUDING DIVIDEND EXPENSE) TO AVERAGE NET ASSETS4,5 | | | 1.79 | %* | | | 2.02 | % | | | 1.74 | % | | | 1.68 | % | | | 1.64 | % | | | 1.67 | % |
| RATIO OF EXPENSES (EXCLUDING DIVIDEND EXPENSE) TO AVERAGE NET ASSETS4,5 | | | 1.79 | %* | | | 1.84 | % | | | 1.68 | % | | | 1.68 | % | | | 1.64 | % | | | 1.67 | % |
| RATIO OF NET INVESTMENT INCOME (LOSS) (INCLUDING DIVIDEND EXPENSE) TO AVERAGE NET ASSETS4,5 | | | 0.09 | %* | | | (0.44 | )% | | | (0.33 | )% | | | (0.29 | )% | | | (0.24 | )% | | | (0.56 | )% |
| RATIO OF NET INVESTMENT INCOME (LOSS) (EXCLUDING DIVIDEND EXPENSE) TO AVERAGE NET ASSETS4,5 | | | 0.09 | %* | | | (0.26 | )% | | | (0.27 | )% | | | (0.29 | )% | | | (0.24 | )% | | | (0.56 | )% |
| PORTFOLIO TURNOVER RATE | | | 43.55 | % | | | 139.69 | % | | | 57.25 | % | | | 37.24 | % | | | 41.64 | % | | | 46.31 | % |
1 Per share amounts are based upon average shares outstanding.
2 Total return is for the period indicated and has not been annualized. Total return is calculated assuming a purchase of shares at net asset value per share on the first day and a sale at net asset value per share on the last day of each period reported. Distributions are assumed, for purposes of this calculation, to be reinvested at the net asset value per share on the respective payment dates of each Fund.
3 Less than $0.005 per share.
4 The effect of any custody credits on this ratio is less than 0.01%.
5 Dividend expense totaled 0.00%, 0.18%, 0.06%, 0.00%, 0.00% and 0.00%, respectively, of average net assets for the six month period ended June 30, 2009 and the years ended December 31, 2008, 2007, 2006, 2005 and 2004, respectively.
* Annualized
| | | | |
| June 30, 2009 | | 120 | | See Notes to Financial Statements |
Financial Highlights
For a share outstanding throughout the periods presented
Accessor Small to Mid Cap Fund
| | | | | | | | | | | | | | | | | | | | | | | | |
| | | C CLASS SHARES | |
| | | PERIOD ENDED
JUNE 30,
2009 (UNAUDITED) | | | FOR THE YEARS
ENDED DECEMBER 31, | |
| | | | 2008 | | | 2007 | | | 2006 | | | 2005 | | | 2004 | |
| NET ASSET VALUE, BEGINNING OF PERIOD | | $ | 17.42 | | | $ | 29.65 | | | $ | 30.88 | | | $ | 27.43 | | | $ | 24.52 | | | $ | 20.84 | |
Net investment income (loss)1 | | | (0.03 | ) | | | (0.25 | ) | | | (0.27 | ) | | | (0.24 | ) | | | (0.21 | ) | | | (0.23 | ) |
Net realized and unrealized gain (loss) on investments1 | | | 0.81 | | | | (11.85 | ) | | | (0.91 | ) | | | 3.69 | | | | 3.12 | | | | 3.91 | |
| | | | | | | | | | | | | | | | | | | | | | | | |
Total from investment operations | | | 0.78 | | | | (12.10 | ) | | | (1.18 | ) | | | 3.45 | | | | 2.91 | | | | 3.68 | |
| | | | | | | | | | | | | | | | | | | | | | | | |
Distributions from net investment income | | | (0.01 | ) | | | — | | | | — | | | | — | | | | — | | | | — | |
Distributions from capital gains | | | — | | | | (0.13 | ) | | | (0.05 | ) | | | — | | | | — | | | | — | |
| | | | | | | | | | | | | | | | | | | | | | | | |
Total Distributions | | | (0.01 | ) | | | (0.13 | ) | | | (0.05 | ) | | | — | | | | — | | | | — | |
| | | | | | | | | | | | | | | | | | | | | | | | |
| REDEMPTION FEES | | | — | | | | — | | | | — | | | | (0.00 | )3 | | | (0.00 | )3 | | | (0.00 | )3 |
| | | | | | | | | | | | | | | | | | | | | | | | |
| NET ASSET VALUE, END OF PERIOD | | $ | 18.19 | | | $ | 17.42 | | | $ | 29.65 | | | $ | 30.88 | | | $ | 27.43 | | | $ | 24.52 | |
| | | | | | | | | | | | | | | | | | | | | | | | |
| TOTAL RETURN2 | | | 4.49 | % | | | (40.95 | )% | | | (3.83 | )% | | | 12.58 | % | | | 11.87 | % | | | 17.66 | % |
| | | | | | |
| NET ASSETS, END OF PERIOD (IN THOUSANDS) | | $ | 532 | | | $ | 699 | | | $ | 3,250 | | | $ | 3,272 | | | $ | 2,617 | | | $ | 2,439 | |
| | | | | | |
| RATIO OF EXPENSES (INCLUDING DIVIDEND EXPENSE) TO AVERAGE NET ASSETS4,5 | | | 2.29 | %* | | | 2.53 | % | | | 2.26 | % | | | 2.22 | % | | | 2.27 | % | | | 2.20 | % |
| RATIO OF EXPENSES (EXCLUDING DIVIDEND EXPENSE) TO AVERAGE NET ASSETS4,5 | | | 2.29 | %* | | | 2.53 | % | | | 2.20 | % | | | 2.22 | % | | | 2.27 | % | | | 2.20 | % |
| RATIO OF NET INVESTMENT INCOME (LOSS) (INCLUDING DIVIDEND EXPENSE) TO AVERAGE NET ASSETS4,5 | | | (0.41 | )%* | | | (0.97 | )% | | | (0.85 | )% | | | (0.82 | )% | | | (0.84 | )% | | | (1.09 | )% |
| RATIO OF NET INVESTMENT INCOME (LOSS) (EXCLUDING DIVIDEND EXPENSE) TO AVERAGE NET ASSETS4,5 | | | (0.41 | )%* | | | (0.79 | )% | | | (0.79 | )% | | | (0.82 | )% | | | (0.84 | )% | | | (1.09 | )% |
| PORTFOLIO TURNOVER RATE | | | 43.55 | % | | | 139.69 | % | | | 57.25 | % | | | 37.24 | % | | | 41.64 | % | | | 46.31 | % |
1 Per share amounts are based upon average shares outstanding.
2 Total return is for the period indicated and has not been annualized. Total return is calculated assuming a purchase of shares at net asset value per share on the first day and a sale at net asset value per share on the last day of each period reported. Distributions are assumed, for purposes of this calculation, to be reinvested at the net asset value per share on the respective payment dates of each Fund.
3 Less than $0.005 per share.
4 The effect of any custody credits on this ratio is less than 0.01%.
5 Dividend expense totaled 0.00%, 0.18%, 0.06%, 0.00%, 0.00% and 0.00%, respectively, of average net assets for the six-month period ended June 30, 2009 and the years ended December 31, 2008, 2007, 2006, 2005 and 2004, respectively.
* Annualized
| | | | |
| See Notes to Financial Statements | | 121 | | June 30, 2009 |
Financial Highlights
For a share outstanding throughout the periods presented
Accessor Small to Mid Cap Fund
| | | | | | | | | | | | | | | | | | | | | | | | |
| | | A CLASS SHARES | |
| | | PERIOD ENDED
JUNE 30,
2009 (UNAUDITED) | | | FOR THE YEARS
ENDED DECEMBER 31, | |
| | | | 2008 | | | 2007 | | | 2006 | | | 2005 | | | 2004 | |
| NET ASSET VALUE, BEGINNING OF PERIOD | | $ | 18.10 | | | $ | 30.60 | | | $ | 31.67 | | | $ | 27.94 | | | $ | 24.83 | | | $ | 20.98 | |
Net investment income (loss)1 | | | 0.02 | | | | (0.06 | ) | | | (0.03 | ) | | | (0.05 | ) | | | (0.05 | ) | | | (0.10 | ) |
Net realized and unrealized gain (loss) on investments1 | | | 0.85 | | | | (12.31 | ) | | | (0.98 | ) | | | 3.78 | | | | 3.16 | | | | 3.95 | |
| | | | | | | | | | | | | | | | | | | | | | | | |
Total from investment operations | | | 0.87 | | | | (12.37 | ) | | | (1.01 | ) | | | 3.73 | | | | 3.11 | | | | 3.85 | |
| | | | | | | | | | | | | | | | | | | | | | | | |
Distributions from net investment income | | | (0.05 | ) | | | — | | | | (0.01 | ) | | | — | | | | — | | | | — | |
Distributions from capital gains | | | — | | | | (0.13 | ) | | | (0.05 | ) | | | — | | | | — | | | | — | |
| | | | | | | | | | | | | | | | | | | | | | | | |
Total Distributions | | | (0.05 | ) | | | (0.13 | ) | | | (0.06 | ) | | | — | | | | — | | | | — | |
| | | | | | | | | | | | | | | | | | | | | | | | |
| REDEMPTION FEES | | | — | | | | — | | | | — | | | | (0.00 | )4 | | | (0.00 | )4 | | | (0.00 | )4 |
| | | | | | | | | | | | | | | | | | | | | | | | |
| NET ASSET VALUE, END OF PERIOD | | $ | 18.92 | | | $ | 18.10 | | | $ | 30.60 | | | $ | 31.67 | | | $ | 27.94 | | | $ | 24.83 | |
| | | | | | | | | | | | | | | | | | | | | | | | |
| TOTAL RETURN2,3 | | | 4.85 | % | | | (40.56 | )% | | | (3.24 | )% | | | 13.39 | % | | | 12.53 | % | | | 18.35 | % |
| | | | | | |
| NET ASSETS, END OF PERIOD (IN THOUSANDS) | | $ | 3,228 | | | $ | 3,263 | | | $ | 5,851 | | | $ | 354 | | | $ | 704 | | | $ | 622 | |
| | | | | | |
| RATIO OF EXPENSES (INCLUDING DIVIDEND EXPENSE) TO AVERAGE NET ASSETS5,6 | | | 1.63 | %* | | | 1.87 | % | | | 1.58 | % | | | 1.57 | % | | | 1.62 | % | | | 1.55 | % |
| RATIO OF EXPENSES (EXCLUDING DIVIDEND EXPENSE) TO AVERAGE NET ASSETS5,6 | | | 1.63 | %* | | | 1.69 | % | | | 1.52 | % | | | 1.57 | % | | | 1.62 | % | | | 1.55 | % |
| RATIO OF NET INVESTMENT INCOME (LOSS) (INCLUDING DIVIDEND EXPENSE) TO AVERAGE NET ASSETS5,6 | | | 0.23 | %* | | | (0.23 | )% | | | (0.08 | )% | | | (0.17 | )% | | | (0.21 | )% | | | (0.42 | )% |
| RATIO OF NET INVESTMENT INCOME (LOSS) (EXCLUDING DIVIDEND EXPENSE) TO AVERAGE NET ASSETS5,6 | | | 0.23 | %* | | | (0.50 | )% | | | (0.02 | )% | | | (0.17 | )% | | | (0.21 | )% | | | (0.42 | )% |
| PORTFOLIO TURNOVER RATE | | | 43.55 | % | | | 139.69 | % | | | 57.25 | % | | | 37.24 | % | | | 41.64 | % | | | 46.31 | % |
1 Per share amounts are based upon average shares outstanding.
2 Total return is for the period indicated and has not been annualized. Total return is calculated assuming a purchase of shares at net asset value per share on the first day and a sale at net asset value per share on the last day of each period reported. Distributions are assumed, for purposes of this calculation, to be reinvested at the net asset value per share on the respective payment dates of each Fund.
3 A Class total return does not include the one-time front-end sales charge.
4 Less than $0.005 per share.
5 The effect of any custody credits on this ratio is less than 0.01%.
6 Dividend expense totaled 0.00%, 0.18%, 0.06%, 0.00%, 0.00% and 0.00%, respectively, of average net assets for the six-month period ended June 30, 2009 and the years ended December 31, 2008, 2007, 2006, 2005 and 2004, respectively.
* Annualized
| | | | |
| June 30, 2009 | | 122 | | See Notes to Financial Statements |
Financial Highlights
For a share outstanding throughout the period presented
Accessor Small to Mid Cap Fund
| | | | |
| | | Z CLASS SHARES | |
| | | PERIOD ENDED
JUNE 30,
20094 (UNAUDITED) | |
| NET ASSET VALUE, BEGINNING OF PERIOD | | $ | 19.31 | |
Net investment income (loss)1 | | | 0.00 | 5 |
Net realized and unrealized gain (loss) on investments1 | | | (0.03 | ) |
| | | | |
Total from investment operations | | | (0.03 | ) |
| | | | |
Distributions from net investment income | | | (0.03 | ) |
| | | | |
Total Distributions | | | (0.03 | ) |
| | | | |
| REDEMPTION FEES | | | — | |
| | | | |
| NET ASSET VALUE, END OF PERIOD | | $ | 19.25 | |
| | | | |
| TOTAL RETURN2 | | | (0.15 | )% |
| |
| NET ASSETS, END OF PERIOD (IN THOUSANDS) | | $ | 62,056 | |
| |
| RATIO OF EXPENSES TO AVERAGE NET ASSETS3 | | | 1.19 | %* |
| RATIO OF NET INVESTMENT INCOME (LOSS) TO AVERAGE NET ASSETS | | | 0.07 | %* |
| PORTFOLIO TURNOVER RATE | | | 43.55 | % |
1 Per share amounts are based upon average shares outstanding.
2 Total return is for the period indicated and has not been annualized. Total return is calculated assuming a purchase of shares at net asset value per share on the first day and a sale at net asset value per share on the last day of each period reported. Distributions are assumed, for purposes of this calculation, to be reinvested at the net asset value per share on the respective payment dates of each Fund.
3 The effect of any custody credits on this ratio is less than 0.01%.
4 Commenced operations on May 5, 2009.
5 Less than $0.005 per share.
* Annualized
| | | | |
| See Notes to Financial Statements | | 123 | | June 30, 2009 |
Financial Highlights
For a share outstanding throughout the periods presented
Accessor International Equity Fund
| | | | | | | | | | | | | | | | | | | | | | | | |
| | | INSTITUTIONAL CLASS SHARES | |
| | | PERIOD ENDED
JUNE 30,
2009 (UNAUDITED) | | | FOR THE YEARS
ENDED DECEMBER 31, | |
| | | | 2008 | | | 2007 | | | 2006 | | | 2005 | | | 2004 | |
| NET ASSET VALUE, BEGINNING OF PERIOD | | $ | 10.89 | | | $ | 23.93 | | | $ | 22.99 | | | $ | 17.35 | | | $ | 15.21 | | | $ | 12.96 | |
Net investment income (loss)1 | | | 0.15 | | | | 0.46 | | | | 0.24 | | | | 0.10 | | | | 0.14 | | | | 0.15 | |
Net realized and unrealized gain (loss) on investments1 | | | 0.86 | | | | (12.63 | ) | | | 2.71 | | | | 5.65 | | | | 2.04 | | | | 2.15 | |
| | | | | | | | | | | | | | | | | | | | | | | | |
Total from investment operations | | | 1.01 | | | | (12.17 | ) | | | 2.95 | | | | 5.75 | | | | 2.18 | | | | 2.30 | |
| | | | | | | | | | | | | | | | | | | | | | | | |
Distributions from net investment income | | | — | | | | (0.01 | ) | | | (0.20 | ) | | | (0.11 | ) | | | (0.04 | ) | | | (0.05 | ) |
Distributions from capital gains | | | — | | | | (0.86 | ) | | | (1.81 | ) | | | — | | | | — | | | | — | |
| | | | | | | | | | | | | | | | | | | | | | | | |
Total Distributions | | | — | | | | (0.87 | ) | | | (2.01 | ) | | | (0.11 | ) | | | (0.04 | ) | | | (0.05 | ) |
| | | | | | | | | | | | | | | | | | | | | | | | |
| REDEMPTION FEES | | | — | | | | 0.00 | 4 | | | 0.00 | 4 | | | (0.00 | )4 | | | (0.00 | )4 | | | (0.00 | )4 |
| | | | | | | | | | | | | | | | | | | | | | | | |
| NET ASSET VALUE, END OF PERIOD | | $ | 11.90 | | | $ | 10.89 | | | $ | 23.93 | | | $ | 22.99 | | | $ | 17.35 | | | $ | 15.21 | |
| | | | | | | | | | | | | | | | | | | | | | | | |
| TOTAL RETURN2 | | | 9.27 | % | | | (52.29 | )% | | | 12.97 | % | | | 33.13 | % | | | 14.33 | % | | | 17.76 | % |
| | | | | | |
| NET ASSETS, END OF PERIOD (IN THOUSANDS) | | $ | 30,165 | | | $ | 94,963 | | | $ | 241,397 | | | $ | 152,545 | | | $ | 100,146 | | | $ | 87,790 | |
| | | | | | |
| RATIO OF EXPENSES TO AVERAGE NET ASSETS3 | | | 1.51 | %* | | | 1.25 | % | | | 1.33 | % | | | 1.44 | % | | | 1.41 | % | | | 1.24 | % |
| RATIO OF NET INVESTMENT INCOME (LOSS) TO AVERAGE NET ASSETS | | | 2.94 | %* | | | 2.49 | % | | | 0.96 | % | | | 0.53 | % | | | 0.89 | % | | | 1.09 | % |
| PORTFOLIO TURNOVER RATE | | | 46.61 | % | | | 102.02 | % | | | 73.71 | % | | | 93.54 | % | | | 127.58 | % | | | 15.91 | % |
1 Per share amounts are based upon average shares outstanding.
2 Total return is for the period indicated and has not been annualized. Total return is calculated assuming a purchase of shares at net asset value per share on the first day and a sale at net asset value per share on the last day of each period reported. Distributions are assumed, for purposes of this calculation, to be reinvested at the net asset value per share on the respective payment dates of each Fund.
3 The effect of any custody credits on this ratio is less than 0.01%.
4 Less than $0.005 per share.
* Annualized
| | | | |
| June 30, 2009 | | 124 | | See Notes to Financial Statements |
Financial Highlights
For a share outstanding throughout the periods presented
Accessor International Equity Fund
| | | | | | | | | | | | | | | | | | | | | | | | |
| | | INVESTOR CLASS SHARES | |
| | | PERIOD ENDED
JUNE 30,
2009
(UNAUDITED) | | | FOR THE YEARS
ENDED DECEMBER 31, | |
| | | | 2008 | | | 2007 | | | 2006 | | | 2005 | | | 2004 | |
| NET ASSET VALUE, BEGINNING OF PERIOD | | $ | 10.46 | | | $ | 23.14 | | | $ | 22.32 | | | $ | 16.85 | | | $ | 14.79 | | | $ | 12.61 | |
Net investment income (loss)1 | | | 0.12 | | | | 0.37 | | | | 0.07 | | | | 0.03 | | | | 0.10 | | | | 0.09 | |
Net realized and unrealized gain (loss) on investments1 | | | 0.83 | | | | (12.20 | ) | | | 2.66 | | | | 5.46 | | | | 1.96 | | | | 2.09 | |
| | | | | | | | | | | | | | | | | | | | | | | | |
Total from investment operations | | | 0.95 | | | | (11.83 | ) | | | 2.73 | | | | 5.49 | | | | 2.06 | | | | 2.18 | |
| | | | | | | | | | | | | | | | | | | | | | | | |
Distributions from net investment income | | | — | | | | (0.01 | ) | | | (0.10 | ) | | | (0.02 | ) | | | — | | | | — | |
Distributions from capital gains | | | — | | | | (0.86 | ) | | | (1.81 | ) | | | — | | | | — | | | | — | |
| | | | | | | | | | | | | | | | | | | | | | | | |
Total Distributions | | | — | | | | (0.87 | ) | | | (1.91 | ) | | | (0.02 | ) | | | — | | | | — | |
| | | | | | | | | | | | | | | | | | | | | | | | |
| REDEMPTION FEES | | | — | | | | 0.02 | | | | 0.00 | 4 | | | (0.00 | )4 | | | (0.00 | )4 | | | (0.00 | )4 |
| | | | | | | | | | | | | | | | | | | | | | | | |
| NET ASSET VALUE, END OF PERIOD | | $ | 11.41 | | | $ | 10.46 | | | $ | 23.14 | | | $ | 22.32 | | | $ | 16.85 | | | $ | 14.79 | |
| | | | | | | | | | | | | | | | | | | | | | | | |
| TOTAL RETURN2 | | | 9.19 | % | | | (52.57 | )% | | | 12.37 | % | | | 32.59 | % | | | 13.93 | % | | | 17.29 | % |
| | | | | | |
| NET ASSETS, END OF PERIOD (IN THOUSANDS) | | $ | 1,650 | | | $ | 1,845 | | | $ | 6,523 | | | $ | 1,746 | | | $ | 1,200 | | | $ | 1,159 | |
| | | | | | |
| RATIO OF EXPENSES TO AVERAGE NET ASSETS3 | | | 1.96 | %* | | | 1.76 | % | | | 1.79 | % | | | 1.92 | % | | | 1.68 | % | | | 1.69 | % |
| RATIO OF NET INVESTMENT INCOME (LOSS) TO AVERAGE NET ASSETS | | | 2.47 | %* | | | 2.05 | % | | | 0.27 | % | | | 0.18 | % | | | 0.65 | % | | | 0.67 | % |
| PORTFOLIO TURNOVER RATE | | | 46.61 | % | | | 102.02 | % | | | 73.71 | % | | | 93.54 | % | | | 127.58 | % | | | 15.91 | % |
1 Per share amounts are based upon average shares outstanding.
2 Total return is for the period indicated and has not been annualized. Total return is calculated assuming a purchase of shares at net asset value per share on the first day and a sale at net asset value per share on the last day of each period reported. Distributions are assumed, for purposes of this calculation, to be reinvested at the net asset value per share on the respective payment dates of each Fund.
3 The effect of any custody credits on this ratio is less than 0.01%.
4 Less than $0.005 per share.
* Annualized
| | | | |
| See Notes to Financial Statements | | 125 | | June 30, 2009 |
Financial Highlights
For a share outstanding throughout the periods presented
Accessor International Equity Fund
| | | | | | | | | | | | | | | | | | | | | | | | |
| | | C CLASS SHARES | |
| | | PERIOD ENDED
JUNE 30,
2009
(UNAUDITED) | | | FOR THE YEARS
ENDED DECEMBER 31, | |
| | | | 2008 | | | 2007 | | | 2006 | | | 2005 | | | 2004 | |
| NET ASSET VALUE, BEGINNING OF PERIOD | | $ | 10.41 | | | $ | 23.14 | | | $ | 22.33 | | | $ | 16.94 | | | $ | 14.97 | | | $ | 12.83 | |
Net investment income (loss)1 | | | 0.11 | | | | 0.14 | | | | (0.01 | ) | | | (0.09 | ) | | | (0.02 | ) | | | 0.01 | |
Net realized and unrealized gain (loss) on investments1 | | | 0.80 | | | | (12.01 | ) | | | 2.63 | | | | 5.48 | | | | 1.99 | | | | 2.13 | |
| | | | | | | | | | | | | | | | | | | | | | | | |
Total from investment operations | | | 0.91 | | | | (11.87 | ) | | | 2.62 | | | | 5.39 | | | | 1.97 | | | | 2.14 | |
| | | | | | | | | | | | | | | | | | | | | | | | |
Distributions from net investment income | | | — | | | | — | | | | — | | | | — | | | | — | | | | — | |
Distributions from capital gains | | | — | | | | (0.86 | ) | | | (1.81 | ) | | | — | | | | — | | | | — | |
| | | | | | | | | | | | | | | | | | | | | | | | |
Total Distributions | | | — | | | | (0.86 | ) | | | (1.81 | ) | | | — | | | | — | | | | — | |
| | | | | | | | | | | | | | | | | | | | | | | | |
| REDEMPTION FEES | | | — | | | | — | | | | 0.00 | 4 | | | 0.00 | 4 | | | 0.00 | 4 | | | 0.00 | 4 |
| | | | | | | | | | | | | | | | | | | | | | | | |
| NET ASSET VALUE, END OF PERIOD | | $ | 11.32 | | | $ | 10.41 | | | $ | 23.14 | | | $ | 22.33 | | | $ | 16.94 | | | $ | 14.97 | |
| | | | | | | | | | | | | | | | | | | | | | | | |
| TOTAL RETURN2 | | | 8.85 | % | | | (52.82 | )% | | | 11.85 | % | | | 31.82 | % | | | 13.16 | % | | | 16.68 | % |
| | | | | | |
| NET ASSETS, END OF PERIOD (IN THOUSANDS) | | $ | 844 | | | $ | 1,111 | | | $ | 7,631 | | | $ | 5,095 | | | $ | 2,392 | | | $ | 1,748 | |
| | | | | | |
| RATIO OF EXPENSES TO AVERAGE NET ASSETS3 | | | 2.46 | %* | | | 2.27 | % | | | 2.33 | % | | | 2.41 | % | | | 2.41 | % | | | 2.24 | % |
| RATIO OF NET INVESTMENT INCOME (LOSS) TO AVERAGE NET ASSETS | | | 2.17 | %* | | | 0.75 | % | | | (0.03 | )% | | | (0.48 | )% | | | (0.12 | )% | | | 0.10 | % |
| PORTFOLIO TURNOVER RATE | | | 46.61 | % | | | 102.02 | % | | | 73.71 | % | | | 93.54 | % | | | 127.58 | % | | | 15.91 | % |
1 Per share amounts are based upon average shares outstanding.
2 Total return is for the period indicated and has not been annualized. Total return is calculated assuming a purchase of shares at net asset value per share on the first day and a sale at net asset value per share on the last day of each period reported. Distributions are assumed, for purposes of this calculation, to be reinvested at the net asset value per share on the respective payment dates of each Fund.
3 The effect of any custody credits on this ratio is less than 0.01%.
4 Less than $0.005 per share.
* Annualized
| | | | |
| June 30, 2009 | | 126 | | See Notes to Financial Statements |
Financial Highlights
For a share outstanding throughout the periods presented
Accessor International Equity Fund
| | | | | | | | | | | | | | | | | | | | | | | | |
| | | A CLASS SHARES | |
| | | PERIOD ENDED
JUNE 30,
2009
(UNAUDITED) | | | FOR THE YEARS
ENDED DECEMBER 31, | |
| | | | 2008 | | | 2007 | | | 2006 | | | 2005 | | | 2004 | |
| NET ASSET VALUE, BEGINNING OF PERIOD | | $ | 10.78 | | | $ | 23.77 | | | $ | 22.87 | | | $ | 17.27 | | | $ | 15.17 | | | $ | 12.94 | |
Net investment income (loss)1 | | | 0.14 | | | | 0.40 | | | | (0.02 | ) | | | 0.05 | | | | 0.08 | | | | 0.15 | |
Net realized and unrealized gain (loss) on investments1 | | | 0.84 | | | | (12.52 | ) | | | 2.86 | | | | 5.60 | | | | 2.02 | | | | 2.11 | |
| | | | | | | | | | | | | | | | | | | | | | | | |
Total from investment operations | | | 0.98 | | | | (12.12 | ) | | | 2.84 | | | | 5.65 | | | | 2.10 | | | | 2.26 | |
| | | | | | | | | | | | | | | | | | | | | | | | |
Distributions from net investment income | | | — | | | | (0.01 | ) | | | (0.13 | ) | | | (0.05 | ) | | | — | | | | (0.03 | ) |
Distributions from capital gains | | | — | | | | (0.86 | ) | | | (1.81 | ) | | | — | | | | — | | | | — | |
| | | | | | | | | | | | | | | | | | | | | | | | |
Total Distributions | | | — | | | | (0.87 | ) | | | (1.94 | ) | | | (0.05 | ) | | | — | | | | (0.03 | ) |
| | | | | | | | | | | | | | | | | | | | | | | | |
| REDEMPTION FEES | | | — | | | | — | | | | 0.00 | 5 | | | 0.00 | 5 | | | 0.00 | 5 | | | 0.00 | 5 |
| | | | | | | | | | | | | | | | | | | | | | | | |
| NET ASSET VALUE, END OF PERIOD | | $ | 11.76 | | | $ | 10.78 | | | $ | 23.77 | | | $ | 22.87 | | | $ | 17.27 | | | $ | 15.17 | |
| | | | | | | | | | | | | | | | | | | | | | | | |
| TOTAL RETURN2,3 | | | 9.19 | % | | | (52.47 | )% | | | 12.56 | % | | | 32.73 | % | | | 13.84 | % | | | 17.45 | % |
| | | | | | |
| NET ASSETS, END OF PERIOD (IN THOUSANDS) | | $ | 4,664 | | | $ | 4,795 | | | $ | 11,927 | | | $ | 709 | | | $ | 521 | | | $ | 360 | |
| | | | | | |
| RATIO OF EXPENSES TO AVERAGE NET ASSETS4 | | | 1.81 | %* | | | 1.59 | % | | | 1.57 | % | | | 1.90 | % | | | 1.77 | % | | | 1.56 | % |
| RATIO OF NET INVESTMENT INCOME (LOSS) TO AVERAGE NET ASSETS | | | 2.72 | %* | | | 2.21 | % | | | (0.09 | )% | | | 0.22 | % | | | 0.50 | % | | | 1.01 | % |
| PORTFOLIO TURNOVER RATE | | | 46.61 | % | | | 102.02 | % | | | 73.71 | % | | | 93.54 | % | | | 127.58 | % | | | 15.91 | % |
1 Per share amounts are based upon average shares outstanding.
2 Total return is for the period indicated and has not been annualized. Total return is calculated assuming a purchase of shares at net asset value per share on the first day and a sale at net asset value per share on the last day of each period reported. Distributions are assumed, for purposes of this calculation, to be reinvested at the net asset value per share on the respective payment dates of each Fund.
3 A Class total return does not include the one-time front-end sales charge.
4 The effect of any custody credits on this ratio is less than 0.01%.
5 Less than $0.005 per share.
* Annualized
| | | | |
| See Notes to Financial Statements | | 127 | | June 30, 2009 |
Financial Highlights
For a share outstanding throughout the period presented
Accessor International Equity Fund
| | | | |
| | | Z CLASS SHARES | |
| | | PERIOD ENDED
JUNE 30,
20093
(UNAUDITED) | |
| NET ASSET VALUE, BEGINNING OF PERIOD | | $ | 11.01 | |
Net investment income1 | | | 0.06 | |
Net realized and unrealized gain on investments1 | | | 0.83 | |
| | | | |
Total from investment operations | | | 0.89 | |
| | | | |
Distributions from net investment income | | | — | |
| | | | |
Total Distributions | | | — | |
| | | | |
| REDEMPTION FEES | | | — | |
| | | | |
| NET ASSET VALUE, END OF PERIOD | | $ | 11.90 | |
| | | | |
| TOTAL RETURN2 | | | 8.08 | % |
| |
| NET ASSETS, END OF PERIOD (IN THOUSANDS) | | $ | 58,379 | |
| |
| RATIO OF EXPENSES TO AVERAGE NET ASSETS3 | | | 1.32 | %* |
| RATIO OF NET INVESTMENT INCOME TO AVERAGE NET ASSETS | | | 3.52 | %* |
| PORTFOLIO TURNOVER RATE | | | 46.61 | % |
1 Per share amounts are based upon average shares outstanding.
2 Total return is for the period indicated and has not been annualized. Total return is calculated assuming a purchase of shares at net asset value per share on the first day and a sale at net asset value per share on the last day of each period reported. Distributions are assumed, for purposes of this calculation, to be reinvested at the net asset value per share on the respective payment dates of each Fund.
3 Commenced operations on May 5, 2009.
* Annualized
| | | | |
| June 30, 2009 | | 128 | | See Notes to Financial Statements |
Financial Highlights
For a share outstanding throughout the periods presented
Accessor Total Return Fund
| | | | | | | | | | | | |
| | | PERIOD ENDED
JUNE 30,
2009
(UNAUDITED) | | | FOR THE YEARS
ENDED DECEMBER 31, | |
| | | | 2008 | | | 20073 | |
| NET ASSET VALUE, BEGINNING OF PERIOD | | $ | 5.39 | | | $ | 9.85 | | | $ | 10.00 | |
Net investment income (loss)1 | | | 0.04 | | | | 0.14 | | | | 0.07 | |
Net realized and unrealized gain (loss) on investments1 | | | (0.20 | ) | | | (4.46 | ) | | | (0.16 | ) |
| | | | | | | | | | | | |
Total from investment operations | | | (0.16 | ) | | | (4.32 | ) | | | (0.09 | ) |
| | | | | | | | | | | | |
Distributions from net investment income | | | (0.04 | ) | | | (0.14 | ) | | | (0.06 | ) |
| | | | | | | | | | | | |
Total Distributions | | | (0.04 | ) | | | (0.14 | ) | | | (0.06 | ) |
| | | | | | | | | | | | |
| NET ASSET VALUE, END OF PERIOD | | $ | 5.19 | | | $ | 5.39 | | | $ | 9.85 | |
| | | | | | | | | | | | |
| TOTAL RETURN2 | | | (2.94 | )% | | | (44.13 | )% | | | (0.96 | )% |
| | | |
| NET ASSETS, END OF PERIOD (IN THOUSANDS) | | $ | 25,155 | | | $ | 31,182 | | | $ | 57,067 | |
| | | |
| RATIO OF EXPENSES TO AVERAGE NET ASSETS | | | 0.88 | %* | | | 0.89 | % | | | 0.87 | %* |
| RATIO OF NET INVESTMENT INCOME (LOSS) TO AVERAGE NET ASSETS | | | 1.68 | %* | | | 1.76 | % | | | 2.37 | %* |
| PORTFOLIO TURNOVER RATE | | | 759.32 | %4 | | | 1219.95 | %4 | | | 512.93 | % |
1 Per share amounts are based upon average shares outstanding.
2 Total return is for the period indicated and has not been annualized. Total return is calculated assuming a purchase of shares at net asset value per share on the first day and a sale at net asset value per share on the last day of each period reported. Distributions are assumed, for purposes of this calculation, to be reinvested at the net asset value per share on the respective payment dates of each Fund.
3 Commenced operations on September 10, 2007.
4 The Fund from time to time utilizes short term trading strategies, it will dispose of securities without regard to the time they have been held is such action seems advisable. The portfolio turnover rate of the Fund may exceed 100%.
* Annualized
| | | | |
| See Notes to Financial Statements | | 129 | | June 30, 2009 |
Financial Highlights
For a share outstanding throughout the periods presented
Accessor Strategic Alternatives Fund
| | | | | | | | |
| | | INSTITUTIONAL CLASS SHARES | |
| | | PERIOD ENDED
JUNE 30,
2009 (UNAUDITED) | | | FOR THE YEAR
ENDED
DECEMBER 31, 20083 | |
| | | |
| NET ASSET VALUE, BEGINNING OF PERIOD | | $ | 10.27 | | | $ | 12.00 | |
Net investment income (loss)1 | | | 0.05 | | | | 0.16 | |
Net realized and unrealized gain (loss) on investments1 | | | (0.21 | ) | | | (1.74 | ) |
| | | | | | | | |
Total from investment operations | | | (0.16 | ) | | | (1.58 | ) |
| | | | | | | | |
Distributions from net investment income | | | (0.05 | ) | | | (0.15 | ) |
| | | | | | | | |
Total Distributions | | | (0.05 | ) | | | (0.15 | ) |
| | | | | | | | |
| REDEMPTION FEES | | | — | | | | 0.00 | 4 |
| | | | | | | | |
| NET ASSET VALUE, END OF PERIOD | | $ | 10.06 | | | $ | 10.27 | |
| | | | | | | | |
| TOTAL RETURN2 | | | (1.49 | )% | | | (13.25 | )% |
| | |
| NET ASSETS, END OF PERIOD (IN THOUSANDS) | | $ | 61,182 | | | $ | 102,327 | |
| | |
| RATIO OF EXPENSES TO AVERAGE NET ASSETS4 | | | 1.02 | %* | | | 1.04 | %* |
| RATIO OF NET INVESTMENT INCOME (LOSS) TO AVERAGE NET ASSETS | | | 1.04 | %* | | | 1.54 | %* |
| PORTFOLIO TURNOVER RATE | | | 27.21 | % | | | 158.92 | % |
1 Per share amounts are based upon average shares outstanding.
2 Total return is for the period indicated and has not been annualized. Total return is calculated assuming a purchase of shares at net asset value per share on the first day and a sale at net asset value per share on the last day of each period reported. Distributions are assumed, for purposes of this calculation, to be reinvested at the net asset value per share on the respective payment dates of each Fund.
3 Commenced operations on January 29, 2008.
4 The effect of any custody credits on this ratio is less than 0.01%.
* Annualized
| | | | |
| June 30, 2009 | | 130 | | See Notes to Financial Statements |
Financial Highlights
For a share outstanding throughout the period presented
Accessor Strategic Alternatives Fund
| | | | |
| | | INVESTOR CLASS SHARES | |
| | | PERIOD ENDED
JUNE 30,
20093
(UNAUDITED) | |
| NET ASSET VALUE, BEGINNING OF PERIOD | | $ | 10.27 | |
Net investment income (loss)1 | | | 0.06 | |
Net realized and unrealized gain (loss) on investments1 | | | (0.20 | ) |
| | | | |
Total from investment operations | | | (0.14 | ) |
| | | | |
Distributions from net investment income | | | (0.06 | ) |
Distributions from capital gains | | | — | |
| | | | |
Total Distributions | | | (0.06 | ) |
| | | | |
| REDEMPTION FEES | | | — | |
| | | | |
| NET ASSET VALUE, END OF PERIOD | | $ | 10.07 | |
| | | | |
| TOTAL RETURN2 | | | (1.38 | )% |
| |
| NET ASSETS, END OF PERIOD (IN THOUSANDS) | | $ | 20 | |
| |
| RATIO OF EXPENSES TO AVERAGE NET ASSETS4 | | | 1.00 | %* |
| RATIO OF NET INVESTMENT INCOME (LOSS) TO AVERAGE NET ASSETS | | | 1.27 | %* |
| PORTFOLIO TURNOVER RATE | | | 27.21 | % |
1 Per share amounts are based upon average shares outstanding.
2 Total return is for the period indicated and has not been annualized. Total return is calculated assuming a purchase of shares at net asset value per share on the first day and a sale at net asset value per share on the last day of each period reported. Distributions are assumed, for purposes of this calculation, to be reinvested at the net asset value per share on the respective payment dates of each Fund.
3 Commenced operations on December 31, 2008.
4 The effect of any custody credits on this ratio is less than 0.01%.
* Annualized
| | | | |
| See Notes to Financial Statements | | 131 | | June 30, 2009 |
Financial Highlights
For a share outstanding throughout the period presented
Accessor Strategic Alternatives Fund
| | | | |
| | | Z CLASS SHARES | |
| | | PERIOD ENDED
JUNE 30,
20093 (UNAUDITED) | |
| NET ASSET VALUE, BEGINNING OF PERIOD | | $ | 9.80 | |
Net investment income (loss)1 | | | 0.03 | |
Net realized and unrealized gain (loss) on investments1 | | | 0.26 | |
| | | | |
Total from investment operations | | | 0.29 | |
| | | | |
Distributions from net investment income | | | (0.02 | ) |
| | | | |
Total Distributions | | | (0.02 | ) |
| | | | |
| REDEMPTION FEES | | | — | |
| | | | |
| NET ASSET VALUE, END OF PERIOD | | $ | 10.07 | |
| | | | |
| TOTAL RETURN2 | | | 3.00 | % |
| |
| NET ASSETS, END OF PERIOD (IN THOUSANDS) | | $ | 38,217 | |
| |
| RATIO OF EXPENSES TO AVERAGE NET ASSETS4 | | | 0.94 | %* |
| RATIO OF NET INVESTMENT INCOME (LOSS) TO AVERAGE NET ASSETS | | | 2.11 | %* |
| PORTFOLIO TURNOVER RATE | | | 27.21 | % |
1 Per share amounts are based upon average shares outstanding.
2 Total return is for the period indicated and has not been annualized. Total return is calculated assuming a purchase of shares at net asset value per share on the first day and a sale at net asset value per share on the last day of each period reported. Distributions are assumed, for purposes of this calculation, to be reinvested at the net asset value per share on the respective payment dates of each Fund.
3 Commenced operations on May 5, 2009.
4 The effect of any custody credits on this ratio is less than 0.01%.
* Annualized
| | | | |
| June 30, 2009 | | 132 | | See Notes to Financial Statements |
Financial Highlights
For a share outstanding throughout the period presented
Accessor Frontier Markets Fund
| | | | |
| | | INSTITUTIONAL CLASS SHARES | |
| | | PERIOD ENDED
JUNE 30,
20093 (UNAUDITED) | |
| NET ASSET VALUE, BEGINNING OF PERIOD | | $ | 12.00 | |
Net investment income (loss)1 | | | (0.02 | ) |
Net realized and unrealized gain (loss) on investments1 | | | 0.40 | |
| | | | |
Total from investment operations | | | 0.38 | |
| | | | |
Distributions from net investment income | | | — | |
| | | | |
Total Distributions | | | — | |
| | | | |
| REDEMPTION FEES | | | — | |
| | | | |
| NET ASSET VALUE, END OF PERIOD | | $ | 12.38 | |
| | | | |
| TOTAL RETURN2 | | | 3.17 | % |
| |
| NET ASSETS, END OF PERIOD (IN THOUSANDS) | | $ | 9,428 | |
| |
| RATIO OF EXPENSES TO AVERAGE NET ASSETS | | | 1.56 | %* |
| RATIO OF NET INVESTMENT INCOME (LOSS) TO AVERAGE NET ASSETS | | | (0.42 | )%* |
| PORTFOLIO TURNOVER RATE | | | 54.53 | % |
1 Per share amounts are based upon average shares outstanding.
2 Total return is for the period indicated and has not been annualized. Total return is calculated assuming a purchase of shares at net asset value per share on the first day and a sale at net asset value per share on the last day of each period reported. Distributions are assumed, for purposes of this calculation, to be reinvested at the net asset value per share on the respective payment dates of each Fund.
3 Commenced operations on December 31, 2008.
* Annualized
| | | | |
| See Notes to Financial Statements | | 133 | | June 30, 2009 |
Financial Highlights
For a share outstanding throughout the period presented
Accessor Frontier Markets Fund
| | | | |
| | | INVESTOR CLASS SHARES | |
| | | PERIOD ENDED
JUNE 30,
20093 (UNAUDITED) | |
| NET ASSET VALUE, BEGINNING OF PERIOD | | $ | 12.00 | |
Net investment income (loss)1 | | | (0.03 | ) |
Net realized and unrealized gain (loss) on investments1 | | | 0.42 | |
| | | | |
Total from investment operations | | | 0.39 | |
| | | | |
Distributions from net investment income | | | — | |
| | | | |
Total Distributions | | | — | |
| | | | |
| REDEMPTION FEES | | | — | |
| | | | |
| NET ASSET VALUE, END OF PERIOD | | $ | 12.39 | |
| | | | |
| TOTAL RETURN2 | | | 3.25 | % |
| |
| NET ASSETS, END OF PERIOD (IN THOUSANDS) | | $ | 1,069 | |
| |
| RATIO OF EXPENSES TO AVERAGE NET ASSETS | | | 1.67 | %* |
| RATIO OF NET INVESTMENT INCOME (LOSS) TO AVERAGE NET ASSETS | | | (0.52 | )%* |
| PORTFOLIO TURNOVER RATE | | | 54.53 | % |
1 Per share amounts are based upon average shares outstanding.
2 Total return is for the period indicated and has not been annualized. Total return is calculated assuming a purchase of shares at net asset value per share on the first day and a sale at net asset value per share on the last day of each period reported. Distributions are assumed, for purposes of this calculation, to be reinvested at the net asset value per share on the respective payment dates of each Fund.
3 Commenced operations on December 31, 2008.
* Annualized
| | | | |
| June 30, 2009 | | 134 | | See Notes to Financial Statements |
Financial Highlights
For a share outstanding throughout the period presented
Accessor Frontier Markets Fund
| | | | |
| | | Z CLASS SHARES | |
| | | PERIOD ENDED
JUNE 30,
20093 (UNAUDITED) | |
| NET ASSET VALUE, BEGINNING OF PERIOD | | $ | 10.85 | |
Net investment income (loss)1 | | | 0.02 | |
Net realized and unrealized gain (loss) on investments1 | | | 1.51 | |
| | | | |
Total from investment operations | | | 1.53 | |
| | | | |
Distributions from net investment income | | | — | |
| | | | |
Total Distributions | | | — | |
| | | | |
| REDEMPTION FEES | | | — | |
| | | | |
| NET ASSET VALUE, END OF PERIOD | | $ | 12.38 | |
| | | | |
| TOTAL RETURN2 | | | 14.10 | % |
| |
| NET ASSETS, END OF PERIOD (IN THOUSANDS) | | $ | 20,561 | |
| |
| RATIO OF EXPENSES TO AVERAGE NET ASSETS | | | 1.10 | %* |
| RATIO OF NET INVESTMENT INCOME (LOSS) TO AVERAGE NET ASSETS | | | 1.00 | %* |
| PORTFOLIO TURNOVER RATE | | | 54.53 | % |
1 Per share amounts are based upon average shares outstanding.
2 Total return is for the period indicated and has not been annualized. Total return is calculated assuming a purchase of shares at net asset value per share on the first day and a sale at net asset value per share on the last day of each period reported. Distributions are assumed, for purposes of this calculation, to be reinvested at the net asset value per share on the respective payment dates of each Fund.
3 Commenced operations on May 5, 2009.
* Annualized
| | | | |
| See Notes to Financial Statements | | 135 | | June 30, 2009 |
Financial Highlights
For a share outstanding throughout the periods presented
Accessor High Yield Bond Fund
| | | | | | | | | | | | | | | | | | | | | | | | |
| | | INSTITUTIONAL CLASS SHARES | |
| | | PERIOD ENDED
JUNE 30,
2009 (UNAUDITED) | | | FOR THE YEARS
ENDED DECEMBER 31, | |
| | | | 2008 | | | 2007 | | | 2006 | | | 2005 | | | 2004 | |
| NET ASSET VALUE, BEGINNING OF PERIOD | | $ | 7.45 | | | $ | 10.44 | | | $ | 11.01 | | | $ | 10.72 | | | $ | 11.31 | | | $ | 11.18 | |
Net investment income (loss)1 | | | 0.41 | | | | 0.77 | | | | 0.80 | | | | 0.80 | | | | 0.82 | | | | 0.89 | |
Net realized and unrealized gain (loss) on investments1 | | | 1.03 | | | | (2.98 | ) | | | (0.57 | ) | | | 0.31 | | | | (0.58 | ) | | | 0.12 | |
| | | | | | | | | | | | | | | | | | | | | | | | |
Total from investment operations | | | 1.44 | | | | (2.21 | ) | | | 0.23 | | | | 1.11 | | | | 0.24 | | | | 1.01 | |
| | | | | | | | | | | | | | | | | | | | | | | | |
Distributions from net investment income | | | (0.38 | ) | | | (0.78 | ) | | | (0.80 | ) | | | (0.82 | ) | | | (0.83 | ) | | | (0.88 | ) |
| | | | | | | | | | | | | | | | | | | | | | | | |
Total Distributions | | | (0.38 | ) | | | (0.78 | ) | | | (0.80 | ) | | | (0.82 | ) | | | (0.83 | ) | | | (0.88 | ) |
| | | | | | | | | | | | | | | | | | | | | | | | |
| REDEMPTION FEES | | | — | | | | 0.00 | 4 | | | 0.00 | 4 | | | 0.00 | 4 | | | 0.00 | 4 | | | 0.00 | 4 |
| | | | | | | | | | | | | | | | | | | | | | | | |
| NET ASSET VALUE, END OF PERIOD | | $ | 8.51 | | | $ | 7.45 | | | $ | 10.44 | | | $ | 11.01 | | | $ | 10.72 | | | $ | 11.31 | |
| | | | | | | | | | | | | | | | | | | | | | | | |
| TOTAL RETURN2 | | | 19.60 | % | | | (22.16 | )% | | | 2.10 | % | | | 10.82 | % | | | 2.20 | % | | | 9.49 | % |
| | | | | | |
| NET ASSETS, END OF PERIOD (IN THOUSANDS) | | $ | 65,966 | | | $ | 50,902 | | | $ | 72,604 | | | $ | 59,931 | | | $ | 50,311 | | | $ | 50,920 | |
| | | | | | |
| RATIO OF EXPENSES TO AVERAGE NET ASSETS3 | | | 0.96 | %* | | | 0.96 | % | | | 0.91 | % | | | 0.90 | % | | | 0.93 | % | | | 0.83 | % |
| RATIO OF NET INVESTMENT INCOME (LOSS) TO AVERAGE NET ASSETS | | | 10.20 | %* | | | 8.16 | % | | | 7.38 | % | | | 7.52 | % | | | 7.51 | % | | | 8.00 | % |
| PORTFOLIO TURNOVER RATE | | | 97.93 | % | | | 109.77 | % | | | 86.29 | % | | | 87.80 | % | | | 62.75 | % | | | 75.03 | % |
1 Per share amounts are based upon average shares outstanding.
2 Total return is for the period indicated and has not been annualized. Total return is calculated assuming a purchase of shares at net asset value per share on the first day and a sale at net asset value per share on the last day of each period reported. Distributions are assumed, for purposes of this calculation, to be reinvested at the net asset value per share on the respective payment dates of each Fund.
3 The effect of any custody credits on this ratio is less than 0.01%.
4 Less than $0.005 per share
* Annualized
| | | | |
| June 30, 2009 | | 136 | | See Notes to Financial Statements |
Financial Highlights
For a share outstanding throughout the periods presented
Accessor High Yield Bond Fund
| | | | | | | | | | | | | | | | | | | | | | | | |
| | | INVESTOR CLASS SHARES | |
| | | PERIOD ENDED
JUNE 30,
2009 (UNAUDITED) | | | FOR THE YEARS
ENDED DECEMBER 31, | |
| | | | 2008 | | | 2007 | | | 2006 | | | 2005 | | | 2004 | |
| NET ASSET VALUE, BEGINNING OF PERIOD | | $ | 7.45 | | | $ | 10.45 | | | $ | 11.01 | | | $ | 10.73 | | | $ | 11.30 | | | $ | 11.18 | |
Net investment income (loss)1 | | | 0.39 | | | | 0.71 | | | | 0.76 | | | | 0.82 | | | | 0.78 | | | | 0.84 | |
Net realized and unrealized gain (loss) on investments1 | | | 1.04 | | | | (2.98 | ) | | | (0.56 | ) | | | 0.28 | | | | (0.55 | ) | | | 0.11 | |
| | | | | | | | | | | | | | | | | | | | | | | | |
Total from investment operations | | | 1.43 | | | | (2.27 | ) | | | 0.20 | | | | 1.10 | | | | 0.23 | | | | 0.95 | |
| | | | | | | | | | | | | | | | | | | | | | | | |
Distributions from net investment income | | | (0.37 | ) | | | (0.73 | ) | | | (0.76 | ) | | | (0.82 | ) | | | (0.80 | ) | | | (0.83 | ) |
| | | | | | | | | | | | | | | | | | | | | | | | |
Total Distributions | | | (0.37 | ) | | | (0.73 | ) | | | (0.76 | ) | | | (0.82 | ) | | | (0.80 | ) | | | (0.83 | ) |
| | | | | | | | | | | | | | | | | | | | | | | | |
| REDEMPTION FEES | | | — | | | | — | | | | — | | | | 0.00 | 4 | | | 0.00 | 4 | | | 0.00 | 4 |
| | | | | | | | | | | | | | | | | | | | | | | | |
| NET ASSET VALUE, END OF PERIOD | | $ | 8.51 | | | $ | 7.45 | | | $ | 10.45 | | | $ | 11.01 | | | $ | 10.73 | | | $ | 11.30 | |
| | | | | | | | | | | | | | | | | | | | | | | | |
| TOTAL RETURN2 | | | 19.20 | % | | | (22.54 | )% | | | 1.85 | % | | | 10.71 | % | | | 2.11 | % | | | 8.95 | % |
| | | | | | |
| NET ASSETS, END OF PERIOD (IN THOUSANDS) | | $ | 2,913 | | | $ | 486 | | | $ | 1,850 | | | $ | 498 | | | $ | 471 | | | $ | 1,277 | |
| | | | | | |
| RATIO OF EXPENSES TO AVERAGE NET ASSETS3 | | | 1.40 | %* | | | 1.45 | % | | | 1.29 | % | | | 0.91 | % | | | 1.22 | % | | | 1.28 | % |
| RATIO OF NET INVESTMENT INCOME (LOSS) TO AVERAGE NET ASSETS | | | 9.56 | %* | | | 7.32 | % | | | 7.02 | % | | | 7.54 | % | | | 7.29 | % | | | 7.47 | % |
| PORTFOLIO TURNOVER RATE | | | 97.93 | % | | | 109.77 | % | | | 86.29 | % | | | 87.80 | % | | | 62.75 | % | | | 75.03 | % |
1 Per share amounts are based upon average shares outstanding.
2 Total return is for the period indicated and has not been annualized. Total return is calculated assuming a purchase of shares at net asset value per share on the first day and a sale at net asset value per share on the last day of each period reported. Distributions are assumed, for purposes of this calculation, to be reinvested at the net asset value per share on the respective payment dates of each Fund.
3 The effect of any custody credits on this ratio is less than 0.01%.
4 Less than $0.005 per share
* Annualized
| | | | |
| See Notes to Financial Statements | | 137 | | June 30, 2009 |
Financial Highlights
For a share outstanding throughout the periods presented
Accessor High Yield Bond Fund
| | | | | | | | | | | | | | | | | | | | | | | | |
| | | C CLASS SHARES | |
| | | PERIOD ENDED
JUNE 30,
2009
(UNAUDITED) | | | FOR THE YEARS
ENDED DECEMBER 31, | |
| | | | 2008 | | | 2007 | | | 2006 | | | 2005 | | | 2004 | |
| NET ASSET VALUE, BEGINNING OF PERIOD | | $ | 7.44 | | | $ | 10.43 | | | $ | 10.99 | | | $ | 10.71 | | | $ | 11.29 | | | $ | 11.17 | |
Net investment income (loss)1 | | | 0.37 | | | | 0.67 | | | | 0.69 | | | | 0.70 | | | | 0.71 | | | | 0.77 | |
Net realized and unrealized gain (loss) on investments1 | | | 1.02 | | | | (2.98 | ) | | | (0.56 | ) | | | 0.29 | | | | (0.57 | ) | | | 0.13 | |
| | | | | | | | | | | | | | | | | | | | | | | | |
Total from investment operations | | | 1.39 | | | | (2.31 | ) | | | 0.13 | | | | 0.99 | | | | 0.14 | | | | 0.90 | |
| | | | | | | | | | | | | | | | | | | | | | | | |
Distributions from net investment income | | | (0.34 | ) | | | (0.68 | ) | | | (0.69 | ) | | | (0.71 | ) | | | (0.72 | ) | | | (0.78 | ) |
| | | | | | | | | | | | | | | | | | | | | | | | |
Total Distributions | | | (0.34 | ) | | | (0.68 | ) | | | (0.69 | ) | | | (0.71 | ) | | | (0.72 | ) | | | (0.78 | ) |
| | | | | | | | | | | | | | | | | | | | | | | | |
| REDEMPTION FEES | | | — | | | | — | | | | — | | | | 0.00 | 4 | | | 0.00 | 4 | | | 0.00 | 4 |
| | | | | | | | | | | | | | | | | | | | | | | | |
| NET ASSET VALUE, END OF PERIOD | | $ | 8.49 | | | $ | 7.44 | | | $ | 10.43 | | | $ | 10.99 | | | $ | 10.71 | | | $ | 11.29 | |
| | | | | | | | | | | | | | | | | | | | | | | | |
| TOTAL RETURN2 | | | 18.94 | % | | | (22.97 | )% | | | 1.17 | % | | | 9.65 | % | | | 1.29 | % | | | 8.39 | % |
| | | | | | |
| NET ASSETS, END OF PERIOD (IN THOUSANDS) | | $ | 782 | | | $ | 623 | | | $ | 1,416 | | | $ | 1,804 | | | $ | 1,565 | | | $ | 1,935 | |
| | | | | | |
| RATIO OF EXPENSES TO AVERAGE NET ASSETS3 | | | 1.92 | %* | | | 1.96 | % | | | 1.89 | % | | | 1.90 | % | | | 1.93 | % | | | 1.83 | % |
| RATIO OF NET INVESTMENT INCOME (LOSS) TO AVERAGE NET ASSETS | | | 9.19 | %* | | | 7.03 | % | | | 6.37 | % | | | 6.53 | % | | | 6.51 | % | | | 6.99 | % |
| PORTFOLIO TURNOVER RATE | | | 97.93 | % | | | 109.77 | % | | | 86.29 | % | | | 87.80 | % | | | 62.75 | % | | | 75.03 | % |
1 Per share amounts are based upon average shares outstanding.
2 Total return is for the period indicated and has not been annualized. Total return is calculated assuming a purchase of shares at net asset value per share on the first day and a sale at net asset value per share on the last day of each period reported. Distributions are assumed, for purposes of this calculation, to be reinvested at the net asset value per share on the respective payment dates of each Fund.
3 The effect of any custody credits on this ratio is less than 0.01%.
4 Less than $0.005 per share
* Annualized
| | | | |
| June 30, 2009 | | 138 | | See Notes to Financial Statements |
Financial Highlights
For a share outstanding throughout the periods presented
Accessor High Yield Bond Fund
| | | | | | | | | | | | | | | | | | | | | | | | |
| | | A CLASS SHARES | |
| | | PERIOD ENDED
JUNE 30,
2009 (UNAUDITED) | | | FOR THE YEARS
ENDED DECEMBER 31, | |
| | | | 2008 | | | 2007 | | | 2006 | | | 2005 | | | 2004 | |
| NET ASSET VALUE, BEGINNING OF PERIOD | | $ | 7.44 | | | $ | 10.44 | | | $ | 11.00 | | | $ | 10.72 | | | $ | 11.30 | | | $ | 11.17 | |
Net investment income (loss)1 | | | 0.40 | | | | 0.74 | | | | 0.77 | | | | 0.77 | | | | 0.79 | | | | 0.86 | |
Net realized and unrealized gain (loss) on investments1 | | | 1.03 | | | | (2.99 | ) | | | (0.55 | ) | | | 0.30 | | | | (0.57 | ) | | | 0.13 | |
| | | | | | | | | | | | | | | | | | | | | | | | |
Total from investment operations | | | 1.43 | | | | (2.25 | ) | | | 0.22 | | | | 1.07 | | | | 0.22 | | | | 0.99 | |
| | | | | | | | | | | | | | | | | | | | | | | | |
Distributions from net investment income | | | (0.37 | ) | | | (0.75 | ) | | | (0.78 | ) | | | (0.79 | ) | | | (0.80 | ) | | | (0.86 | ) |
| | | | | | | | | | | | | | | | | | | | | | | | |
Total Distributions | | | (0.37 | ) | | | (0.75 | ) | | | (0.78 | ) | | | (0.79 | ) | | | (0.80 | ) | | | (0.86 | ) |
| | | | | | | | | | | | | | | | | | | | | | | | |
| REDEMPTION FEES | | | — | | | | — | | | | — | | | | 0.00 | 5 | | | 0.00 | 5 | | | 0.00 | 5 |
| | | | | | | | | | | | | | | | | | | | | | | | |
| NET ASSET VALUE, END OF PERIOD | | $ | 8.50 | | | $ | 7.44 | | | $ | 10.44 | | | $ | 11.00 | | | $ | 10.72 | | | $ | 11.30 | |
| | | | | | | | | | | | | | | | | | | | | | | | |
| TOTAL RETURN2,3 | | | 19.34 | % | | | (22.38 | )% | | | 1.96 | % | | | 10.44 | % | | | 2.05 | % | | | 9.25 | % |
| | | | | | |
| NET ASSETS, END OF PERIOD (IN THOUSANDS) | | $ | 424 | | | $ | 332 | | | $ | 1,410 | | | $ | 158 | | | $ | 144 | | | $ | 136 | |
| | | | | | |
| RATIO OF EXPENSES TO AVERAGE NET ASSETS4 | | | 1.17 | %* | | | 1.20 | % | | | 1.17 | % | | | 1.16 | % | | | 1.18 | % | | | 1.07 | % |
| RATIO OF NET INVESTMENT INCOME (LOSS) TO AVERAGE NET ASSETS | | | 9.94 | %* | | | 7.54 | % | | | 7.18 | % | | | 7.27 | % | | | 7.28 | % | | | 7.70 | % |
| PORTFOLIO TURNOVER RATE | | | 97.93 | % | | | 109.77 | % | | | 86.29 | % | | | 87.80 | % | | | 62.75 | % | | | 75.03 | % |
1 Per share amounts are based upon average shares outstanding.
2 Total return is for the period indicated and has not been annualized. Total return is calculated assuming a purchase of shares at net asset value per share on the first day and a sale at net asset value per share on the last day of each period reported. Distributions are assumed, for purposes of this calculation, to be reinvested at the net asset value per share on the respective payment dates of each Fund.
3 A Class total return does not include the one-time front-end sales charge.
4 The effect of any custody credits on this ratio is less than 0.01%.
5 Less than $0.005 per share
* Annualized
| | | | |
| See Notes to Financial Statements | | 139 | | June 30, 2009 |
Financial Highlights
For a share outstanding throughout the period presented
Accessor High Yield Bond Fund
| | | | |
| | | Z CLASS SHARES | |
| | | PERIOD ENDED
JUNE 30,
20094 (UNAUDITED) | |
| NET ASSET VALUE, BEGINNING OF PERIOD | | $ | 8.35 | |
Net investment income (loss)1 | | | 0.13 | |
Net realized and unrealized gain (loss) on investments1 | | | 0.15 | |
| | | | |
Total from investment operations | | | 0.28 | |
| | | | |
Distributions from net investment income | | | (0.13 | ) |
| | | | |
Total Distributions | | | (0.13 | ) |
| | | | |
| REDEMPTION FEES | | | — | |
| | | | |
| NET ASSET VALUE, END OF PERIOD | | $ | 8.50 | |
| | | | |
| TOTAL RETURN2 | | | 3.80 | % |
| |
| NET ASSETS, END OF PERIOD (IN THOUSANDS) | | $ | 25,734 | |
| |
| RATIO OF EXPENSES TO AVERAGE NET ASSETS3 | | | 0.85 | %* |
| RATIO OF NET INVESTMENT INCOME (LOSS) TO AVERAGE NET ASSETS | | | 9.73 | %* |
| PORTFOLIO TURNOVER RATE | | | 97.93 | % |
1 Per share amounts are based upon average shares outstanding.
2 Total return is for the period indicated and has not been annualized. Total return is calculated assuming a purchase of shares at net asset value per share on the first day and a sale at net asset value per share on the last day of each period reported. Distributions are assumed, for purposes of this calculation, to be reinvested at the net asset value per share on the respective payment dates of each Fund.
3 Less than $0.005 per share
4 Commenced operations on May 5, 2009.
* Annualized
| | | | |
| June 30, 2009 | | 140 | | See Notes to Financial Statements |
Financial Highlights
For a share outstanding throughout the periods presented
Accessor Investment Grade Fixed-Income Fund
| | | | | | | | | | | | | | | | | | | | | | | | |
| | | INSTITUTIONAL CLASS SHARES | |
| | | PERIOD ENDED
JUNE 30,
2009 (UNAUDITED) | | | FOR THE YEARS
ENDED DECEMBER 31, | |
| | | | 2008 | | | 2007 | | | 2006 | | | 2005 | | | 2004 | |
| NET ASSET VALUE, BEGINNING OF PERIOD | | $ | 9.99 | | | $ | 10.86 | | | $ | 11.24 | | | $ | 11.64 | | | $ | 11.91 | | | $ | 12.13 | |
Net investment income (loss)1 | | | 0.35 | | | | 0.56 | | | | 0.75 | | | | 0.79 | | | | 0.63 | | | | 0.60 | |
Net realized and unrealized gain (loss) on investments1 | | | (0.04 | ) | | | (0.84 | ) | | | (0.36 | ) | | | (0.38 | ) | | | (0.20 | ) | | | (0.14 | ) |
| | | | | | | | | | | | | | | | | | | | | | | | |
Total from investment operations | | | 0.31 | | | | (0.28 | ) | | | 0.39 | | | | 0.41 | | | | 0.43 | | | | 0.46 | |
| | | | | | | | | | | | | | | | | | | | | | | | |
Distributions from net investment income | | | (0.31 | ) | | | (0.59 | ) | | | (0.77 | ) | | | (0.81 | ) | | | (0.66 | ) | | | (0.59 | ) |
Distributions from capital gains | | | (0.04 | ) | | | — | | | | — | | | | — | | | | (0.04 | ) | | | (0.09 | ) |
| | | | | | | | | | | | | | | | | | | | | | | | |
Total Distributions | | | (0.35 | ) | | | (0.59 | ) | | | (0.77 | ) | | | (0.81 | ) | | | (0.70 | ) | | | (0.68 | ) |
| | | | | | | | | | | | | | | | | | | | | | | | |
| NET ASSET VALUE, END OF PERIOD | | $ | 9.95 | | | $ | 9.99 | | | $ | 10.86 | | | $ | 11.24 | | | $ | 11.64 | | | $ | 11.91 | |
| | | | | | | | | | | | | | | | | | | | | | | | |
| TOTAL RETURN2 | | | 3.21 | % | | | (2.43 | )% | | | 3.64 | % | | | 3.73 | % | | | 3.69 | % | | | 3.88 | % |
| | | | | | |
| NET ASSETS, END OF PERIOD (IN THOUSANDS) | | $ | 21,125 | | | $ | 63,900 | | | $ | 71,409 | | | $ | 36,331 | | | $ | 56,312 | | | $ | 51,548 | |
| | | | | | |
| RATIO OF EXPENSES TO AVERAGE NET ASSETS3 | | | 1.06 | %* | | | 0.88 | % | | | 0.79 | % | | | 0.73 | % | | | 0.73 | % | | | 0.87 | % |
| RATIO OF NET INVESTMENT INCOME (LOSS) TO AVERAGE NET ASSETS | | | 7.27 | %* | | | 5.49 | % | | | 6.87 | % | | | 6.90 | % | | | 5.36 | % | | | 5.04 | % |
| PORTFOLIO TURNOVER RATE | | | 180.88 | % | | | 259.79 | % | | | 71.66 | % | | | 102.65 | % | | | 93.26 | % | | | 125.84 | % |
1 Per share amounts are based upon average shares outstanding.
2 Total return is for the period indicated and has not been annualized. Total return is calculated assuming a purchase of shares at net asset value per share on the first day and a sale at net asset value per share on the last day of each period reported. Distributions are assumed, for purposes of this calculation, to be reinvested at the net asset value per share on the respective payment dates of each Fund.
3 The effect of any custody credits on this ratio is less than 0.01%.
* Annualized
| | | | |
| See Notes to Financial Statements | | 141 | | June 30, 2009 |
Financial Highlights
For a share outstanding throughout the periods presented
Accessor Investment Grade Fixed-Income Fund
| | | | | | | | | | | | | | | | | | | | | | | | |
| | | INVESTOR CLASS SHARES | |
| | | PERIOD ENDED
JUNE 30,
2009 (UNAUDITED) | | | FOR THE YEARS
ENDED DECEMBER 31, | |
| | | | 2008 | | | 2007 | | | 2006 | | | 2005 | | | 2004 | |
| NET ASSET VALUE, BEGINNING OF PERIOD | | $ | 9.99 | | | $ | 10.85 | | | $ | 11.23 | | | $ | 11.63 | | | $ | 11.91 | | | $ | 12.13 | |
Net investment income (loss)1 | | | 0.37 | | | | 0.51 | | | | 0.70 | | | | 0.75 | | | | 0.61 | | | | 0.53 | |
Net realized and unrealized gain (loss) on investments1 | | | (0.09 | ) | | | (0.83 | ) | | | (0.36 | ) | | | (0.39 | ) | | | (0.22 | ) | | | (0.13 | ) |
| | | | | | | | | | | | | | | | | | | | | | | | |
Total from investment operations | | | 0.28 | | | | (0.32 | ) | | | 0.34 | | | | 0.36 | | | | 0.39 | | | | 0.40 | |
| | | | | | | | | | | | | | | | | | | | | | | | |
Distributions from net investment income | | | (0.29 | ) | | | (0.54 | ) | | | (0.72 | ) | | | (0.76 | ) | | | (0.63 | ) | | | (0.53 | ) |
Distributions from capital gains | | | (0.04 | ) | | | — | | | | — | | | | — | | | | (0.04 | ) | | | (0.09 | ) |
| | | | | | | | | | | | | | | | | | | | | | | | |
Total Distributions | | | (0.33 | ) | | | (0.54 | ) | | | (0.72 | ) | | | (0.76 | ) | | | (0.67 | ) | | | (0.62 | ) |
| | | | | | | | | | | | | | | | | | | | | | | | |
| NET ASSET VALUE, END OF PERIOD | | $ | 9.94 | | | $ | 9.99 | | | $ | 10.85 | | | $ | 11.23 | | | $ | 11.63 | | | $ | 11.91 | |
| | | | | | | | | | | | | | | | | | | | | | | | |
| TOTAL RETURN2 | | | 2.86 | % | | | (2.85 | )% | | | 3.15 | % | | | 3.30 | % | | | 3.36 | % | | | 3.37 | % |
| | | | | | |
| NET ASSETS, END OF PERIOD (IN THOUSANDS) | | $ | 693 | | | $ | 1,260 | | | $ | 7,083 | | | $ | 1,646 | | | $ | 1,552 | | | $ | 982 | |
| | | | | | |
| RATIO OF EXPENSES TO AVERAGE NET ASSETS3 | | | 1.50 | %* | | | 1.33 | % | | | 1.29 | % | | | 1.15 | % | | | 0.97 | % | | | 1.38 | % |
| RATIO OF NET INVESTMENT INCOME (LOSS) TO AVERAGE NET ASSETS | | | 7.65 | %* | | | 4.91 | % | | | 6.45 | % | | | 6.64 | % | | | 5.12 | % | | | 4.23 | % |
| PORTFOLIO TURNOVER RATE | | | 180.88 | % | | | 259.79 | % | | | 71.66 | % | | | 102.65 | % | | | 93.26 | % | | | 125.84 | % |
1 Per share amounts are based upon average shares outstanding.
2 Total return is for the period indicated and has not been annualized. Total return is calculated assuming a purchase of shares at net asset value per share on the first day and a sale at net asset value per share on the last day of each period reported. Distributions are assumed, for purposes of this calculation, to be reinvested at the net asset value per share on the respective payment dates of each Fund.
3 The effect of any custody credits on this ratio is less than 0.01%.
* Annualized
| | | | |
| June 30, 2009 | | 142 | | See Notes to Financial Statements |
Financial Highlights
For a share outstanding throughout the periods presented
Accessor Investment Grade Fixed-Income Fund
| | | | | | | | | | | | | | | | | | | | | | | | |
| | | C CLASS SHARES | |
| | | PERIOD ENDED
JUNE 30,
2009 (UNAUDITED) | | | FOR THE YEARS
ENDED DECEMBER 31, | |
| | | | 2008 | | | 2007 | | | 2006 | | | 2005 | | | 2004 | |
| NET ASSET VALUE, BEGINNING OF PERIOD | | $ | 9.99 | | | $ | 10.86 | | | $ | 11.23 | | | $ | 11.63 | | | $ | 11.91 | | | $ | 12.12 | |
Net investment income (loss)1 | | | 0.27 | | | | 0.45 | | | | 0.71 | | | | 0.70 | | | | 0.52 | | | | 0.47 | |
Net realized and unrealized gain (loss) on investments1 | | | (0.01 | ) | | | (0.83 | ) | | | (0.44 | ) | | | (0.40 | ) | | | (0.22 | ) | | | (0.12 | ) |
| | | | | | | | | | | | | | | | | | | | | | | | |
Total from investment operations | | | 0.26 | | | | (0.38 | ) | | | 0.27 | | | | 0.30 | | | | 0.30 | | | | 0.35 | |
| | | | | | | | | | | | | | | | | | | | | | | | |
Distributions from net investment income | | | (0.26 | ) | | | (0.49 | ) | | | (0.64 | ) | | | (0.70 | ) | | | (0.54 | ) | | | (0.47 | ) |
Distributions from capital gains | | | (0.04 | ) | | | — | | | | — | | | | — | | | | (0.04 | ) | | | (0.09 | ) |
| | | | | | | | | | | | | | | | | | | | | | | | |
Total Distributions | | | (0.30 | ) | | | (0.49 | ) | | | (0.64 | ) | | | (0.70 | ) | | | (0.58 | ) | | | (0.56 | ) |
| | | | | | | | | | | | | | | | | | | | | | | | |
| NET ASSET VALUE, END OF PERIOD | | $ | 9.95 | | | $ | 9.99 | | | $ | 10.86 | | | $ | 11.23 | | | $ | 11.63 | | | $ | 11.91 | |
| | | | | | | | | | | | | | | | | | | | | | | | |
| TOTAL RETURN2 | | | 2.71 | % | | | (3.40 | )% | | | 2.51 | % | | | 2.76 | % | | | 2.59 | % | | | 2.95 | % |
| | | | | | |
| NET ASSETS, END OF PERIOD (IN THOUSANDS) | | $ | 591 | | | $ | 600 | | | $ | 856 | | | $ | 5,119 | | | $ | 846 | | | $ | 865 | |
| | | | | | |
| RATIO OF EXPENSES TO AVERAGE NET ASSETS3 | | | 1.99 | %* | | | 1.87 | % | | | 1.72 | % | | | 1.74 | % | | | 1.73 | % | | | 1.87 | % |
| RATIO OF NET INVESTMENT INCOME (LOSS) TO AVERAGE NET ASSETS | | | 5.65 | %* | | | 4.47 | % | | | 6.26 | % | | | 6.08 | % | | | 4.37 | % | | | 3.96 | % |
| PORTFOLIO TURNOVER RATE | | | 180.88 | % | | | 259.79 | % | | | 71.66 | % | | | 102.65 | % | | | 93.26 | % | | | 125.84 | % |
1 Per share amounts are based upon average shares outstanding.
2 Total return is for the period indicated and has not been annualized. Total return is calculated assuming a purchase of shares at net asset value per share on the first day and a sale at net asset value per share on the last day of each period reported. Distributions are assumed, for purposes of this calculation, to be reinvested at the net asset value per share on the respective payment dates of each Fund.
3 The effect of any custody credits on this ratio is less than 0.01%.
* Annualized
| | | | |
| See Notes to Financial Statements | | 143 | | June 30, 2009 |
Financial Highlights
For a share outstanding throughout the period presented
Accessor Investment Grade Fixed-Income Fund
| | | | |
| | | Z CLASS SHARES | |
| | | PERIOD ENDED
JUNE 30,
20094 (UNAUDITED) | |
| NET ASSET VALUE, BEGINNING OF PERIOD | | $ | 9.65 | |
Net investment income (loss)1 | | | 0.11 | |
Net realized and unrealized gain (loss) on investments1 | | | 0.28 | |
| | | | |
Total from investment operations | | | 0.39 | |
| | | | |
Distributions from net investment income | | | (0.09 | ) |
| | | | |
Total Distributions | | | (0.09 | ) |
| | | | |
| NET ASSET VALUE, END OF PERIOD | | $ | 9.95 | |
| | | | |
| TOTAL RETURN2 | | | 4.06 | % |
| |
| NET ASSETS, END OF PERIOD (IN THOUSANDS) | | $ | 67,084 | |
| |
| RATIO OF EXPENSES TO AVERAGE NET ASSETS3 | | | 0.85 | %* |
| RATIO OF NET INVESTMENT INCOME (LOSS) TO AVERAGE NET ASSETS | | | 7.18 | %* |
| PORTFOLIO TURNOVER RATE | | | 180.88 | % |
1 Per share amounts are based upon average shares outstanding.
2 Total return is for the period indicated and has not been annualized. Total return is calculated assuming a purchase of shares at net asset value per share on the first day and a sale at net asset value per share on the last day of each period reported. Distributions are assumed, for purposes of this calculation, to be reinvested at the net asset value per share on the respective payment dates of each Fund.
3 The effect of any custody credits on this ratio is less than 0.01%.
4 Commenced operations on May 5, 2009.
* Annualized
| | | | |
| June 30, 2009 | | 144 | | See Notes to Financial Statements |
Financial Highlights
For a share outstanding throughout the periods presented
Accessor Mortgage Securities Fund
| | | | | | | | | | | | | | | | | | | | | | | | |
| | | INSTITUTIONAL CLASS SHARES | |
| | | PERIOD ENDED
JUNE 30,
2009 (UNAUDITED) | | | FOR THE YEARS
ENDED DECEMBER 31, | |
| | | | 2008 | | | 2007 | | | 2006 | | | 2005 | | | 2004 | |
| NET ASSET VALUE, BEGINNING OF PERIOD | | $ | 12.04 | | | $ | 12.42 | | | $ | 12.21 | | | $ | 12.39 | | | $ | 12.65 | | | $ | 12.69 | |
Net investment income (loss)1 | | | 0.27 | | | | 0.53 | | | | 0.56 | | | | 0.52 | | | | 0.45 | | | | 0.46 | |
Net realized and unrealized gain (loss) on investments1 | | | 0.39 | | | | (0.39 | ) | | | 0.19 | | | | (0.05 | ) | | | (0.20 | ) | | | 0.02 | |
| | | | | | | | | | | | | | | | | | | | | | | | |
Total from investment operations | | | 0.66 | | | | 0.14 | | | | 0.75 | | | | 0.47 | | | | 0.25 | | | | 0.48 | |
| | | | | | | | | | | | | | | | | | | | | | | | |
Distributions from net investment income | | | (0.24 | ) | | | (0.52 | ) | | | (0.54 | ) | | | (0.58 | ) | | | (0.49 | ) | | | (0.45 | ) |
Distributions from capital gains | | | — | | | | — | | | | — | | | | (0.07 | ) | | | (0.02 | ) | | | (0.07 | ) |
| | | | | | | | | | | | | | | | | | | | | | | | |
Total Distributions | | | (0.24 | ) | | | (0.52 | ) | | | (0.54 | ) | | | (0.65 | ) | | | (0.51 | ) | | | (0.52 | ) |
| | | | | | | | | | | | | | | | | | | | | | | | |
| NET ASSET VALUE, END OF PERIOD | | $ | 12.46 | | | $ | 12.04 | | | $ | 12.42 | | | $ | 12.21 | | | $ | 12.39 | | | $ | 12.65 | |
| | | | | | | | | | | | | | | | | | | | | | | | |
| TOTAL RETURN2 | | | 5.52 | % | | | 1.17 | % | | | 6.28 | % | | | 3.92 | % | | | 1.96 | % | | | 3.87 | % |
| | | | | | |
| NET ASSETS, END OF PERIOD (IN THOUSANDS) | | $ | 20,848 | | | $ | 65,419 | | | $ | 62,498 | | | $ | 48,202 | | | $ | 158,056 | | | $ | 163,913 | |
| | | | | | |
| RATIO OF EXPENSES TO AVERAGE NET ASSETS3 | | | 1.07 | %* | | | 0.98 | % | | | 0.95 | % | | | 1.00 | % | | | 0.92 | % | | | 0.81 | % |
| RATIO OF NET INVESTMENT INCOME (LOSS) TO AVERAGE NET ASSETS | | | 4.54 | %* | | | 4.34 | % | | | 4.54 | % | | | 4.24 | % | | | 3.56 | % | | | 3.65 | % |
| PORTFOLIO TURNOVER RATE | | | 237.83 | % | | | 654.15 | % | | | 496.94 | % | | | 578.95 | % | | | 474.16 | % | | | 324.40 | % |
1 Per share amounts are based upon average shares outstanding.
2 Total return is for the period indicated and has not been annualized. Total return is calculated assuming a purchase of shares at net asset value per share on the first day and a sale at net asset value per share on the last day of each period reported. Distributions are assumed, for purposes of this calculation, to be reinvested at the net asset value per share on the respective payment dates of each Fund.
3 The effect of any custody credits on this ratio is less than 0.01%.
* Annualized
| | | | |
| See Notes to Financial Statements | | 145 | | June 30, 2009 |
Financial Highlights
For a share outstanding throughout the periods presented
Accessor Mortgage Securities Fund
| | | | | | | | | | | | | | | | | | | | | | | | |
| | | INVESTOR CLASS SHARES | |
| | | PERIOD ENDED
JUNE 30,
2009 (UNAUDITED) | | | FOR THE YEARS
ENDED DECEMBER 31, | |
| | | | 2008 | | | 2007 | | | 2006 | | | 2005 | | | 2004 | |
| NET ASSET VALUE, BEGINNING OF PERIOD | | $ | 12.04 | | | $ | 12.42 | | | $ | 12.21 | | | $ | 12.38 | | | $ | 12.64 | | | $ | 12.69 | |
Net investment income (loss)1 | | | 0.24 | | | | 0.72 | | | | 0.50 | | | | 0.45 | | | | 0.41 | | | | 0.40 | |
Net realized and unrealized gain (loss) on investments1 | | | 0.39 | | | | (0.64 | ) | | | 0.19 | | | | (0.03 | ) | | | (0.20 | ) | | | 0.02 | |
| | | | | | | | | | | | | | | | | | | | | | | | |
Total from investment operations | | | 0.63 | | | | 0.08 | | | | 0.69 | | | | 0.42 | | | | 0.21 | | | | 0.42 | |
| | | | | | | | | | | | | | | | | | | | | | | | |
Distributions from net investment income | | | (0.21 | ) | | | (0.46 | ) | | | (0.48 | ) | | | (0.52 | ) | | | (0.45 | ) | | | (0.40 | ) |
Distributions from capital gains | | | — | | | | — | | | | — | | | | (0.07 | ) | | | (0.02 | ) | | | (0.07 | ) |
| | | | | | | | | | | | | | | | | | | | | | | | |
Total Distributions | | | (0.21 | ) | | | (0.46 | ) | | | (0.48 | ) | | | (0.59 | ) | | | (0.47 | ) | | | (0.47 | ) |
| | | | | | | | | | | | | | | | | | | | | | | | |
| NET ASSET VALUE, END OF PERIOD | | $ | 12.46 | | | $ | 12.04 | | | $ | 12.42 | | | $ | 12.21 | | | $ | 12.38 | | | $ | 12.64 | |
| | | | | | | | | | | | | | | | | | | | | | | | |
| TOTAL RETURN2 | | | 5.26 | % | | | 0.67 | % | | | 5.76 | % | | | 3.55 | % | | | 1.59 | % | | | 3.40 | % |
| | | | | | |
| NET ASSETS, END OF PERIOD (IN THOUSANDS) | | $ | 682 | | | $ | 954 | | | $ | 1,259 | | | $ | 894 | | | $ | 1,111 | | | $ | 1,226 | |
| | | | | | |
| RATIO OF EXPENSES TO AVERAGE NET ASSETS3 | | | 1.54 | %* | | | 1.48 | % | | | 1.45 | % | | | 1.56 | % | | | 1.22 | % | | | 1.29 | % |
| RATIO OF NET INVESTMENT INCOME (LOSS) TO AVERAGE NET ASSETS | | | 3.99 | %* | | | 3.78 | % | | | 4.12 | % | | | 3.72 | % | | | 3.25 | % | | | 3.16 | % |
| PORTFOLIO TURNOVER RATE | | | 237.83 | % | | | 654.15 | % | | | 496.94 | % | | | 578.95 | % | | | 474.16 | % | | | 324.40 | % |
1 Per share amounts are based upon average shares outstanding.
2 Total return is for the period indicated and has not been annualized. Total return is calculated assuming a purchase of shares at net asset value per share on the first day and a sale at net asset value per share on the last day of each period reported. Distributions are assumed, for purposes of this calculation, to be reinvested at the net asset value per share on the respective payment dates of each Fund.
3 The effect of any custody credits on this ratio is less than 0.01%.
* Annualized
| | | | |
| June 30, 2009 | | 146 | | See Notes to Financial Statements |
Financial Highlights
For a share outstanding throughout the periods presented
Accessor Mortgage Securities Fund
| | | | | | | | | | | | | | | | | | | | | | | | |
| | | C CLASS SHARES | |
| | | PERIOD ENDED
JUNE 30,
2009 (UNAUDITED) | | | FOR THE YEARS
ENDED DECEMBER 31, | |
| | | | 2008 | | | 2007 | | | 2006 | | | 2005 | | | 2004 | |
| NET ASSET VALUE, BEGINNING OF PERIOD | | $ | 12.06 | | | $ | 12.44 | | | $ | 12.23 | | | $ | 12.40 | | | $ | 12.67 | | | $ | 12.71 | |
Net investment income (loss)1 | | | 0.21 | | | | 0.27 | | | | 0.44 | | | | 0.38 | | | | 0.33 | | | | 0.33 | |
Net realized and unrealized gain (loss) on investments1 | | | 0.39 | | | | (0.25 | ) | | | 0.18 | | | | (0.03 | ) | | | (0.21 | ) | | | 0.03 | |
| | | | | | | | | | | | | | | | | | | | | | | | |
Total from investment operations | | | 0.60 | | | | 0.02 | | | | 0.62 | | | | 0.35 | | | | 0.12 | | | | 0.36 | |
| | | | | | | | | | | | | | | | | | | | | | | | |
Distributions from net investment income | | | (0.18 | ) | | | (0.40 | ) | | | (0.41 | ) | | | (0.45 | ) | | | (0.37 | ) | | | (0.33 | ) |
Distributions from capital gains | | | — | | | | — | | | | — | | | | (0.07 | ) | | | (0.02 | ) | | | (0.07 | ) |
| | | | | | | | | | | | | | | | | | | | | | | | |
Total Distributions | | | (0.18 | ) | | | (0.40 | ) | | | (0.41 | ) | | | (0.52 | ) | | | (0.39 | ) | | | (0.40 | ) |
| | | | | | | | | | | | | | | | | | | | | | | | |
| NET ASSET VALUE, END OF PERIOD | | $ | 12.48 | | | $ | 12.06 | | | $ | 12.44 | | | $ | 12.23 | | | $ | 12.40 | | | $ | 12.67 | |
| | | | | | | | | | | | | | | | | | | | | | | | |
| TOTAL RETURN2 | | | 4.99 | % | | | 0.17 | % | | | 5.22 | % | | | 2.94 | % | | | 0.90 | % | | | 2.85 | % |
| | | | | | |
| NET ASSETS, END OF PERIOD (IN THOUSANDS) | | $ | 400 | | | $ | 624 | | | $ | 857 | | | $ | 778 | | | $ | 1,522 | | | $ | 1,015 | |
| | | | | | |
| RATIO OF EXPENSES TO AVERAGE NET ASSETS3 | | | 2.05 | %* | | | 1.97 | % | | | 1.92 | % | | | 2.10 | % | | | 1.92 | % | | | 1.81 | % |
| RATIO OF NET INVESTMENT INCOME (LOSS) TO AVERAGE NET ASSETS | | | 3.45 | %* | | | 3.42 | % | | | 3.57 | % | | | 3.13 | % | | | 2.58 | % | | | 2.63 | % |
| PORTFOLIO TURNOVER RATE | | | 237.83 | % | | | 654.15 | % | | | 496.94 | % | | | 578.95 | % | | | 474.16 | % | | | 324.40 | % |
1 Per share amounts are based upon average shares outstanding.
2 Total return is for the period indicated and has not been annualized. Total return is calculated assuming a purchase of shares at net asset value per share on the first day and a sale at net asset value per share on the last day of each period reported. Distributions are assumed, for purposes of this calculation, to be reinvested at the net asset value per share on the respective payment dates of each Fund.
3 The effect of any custody credits on this ratio is less than 0.01%.
* Annualized
| | | | |
| See Notes to Financial Statements | | 147 | | June 30, 2009 |
Financial Highlights
For a share outstanding throughout the period presented
Accessor Mortgage Securities Fund
| | | | |
| | | Z CLASS SHARES | |
| | | PERIOD ENDED
JUNE 30,
20094 (UNAUDITED) | |
| NET ASSET VALUE, BEGINNING OF PERIOD | | $ | 12.28 | |
Net investment income (loss)1 | | | 0.10 | |
Net realized and unrealized gain (loss) on investments1 | | | 0.15 | |
| | | | |
Total from investment operations | | | 0.25 | |
| | | | |
Distributions from net investment income | | | (0.07 | ) |
| | | | |
Total Distributions | | | (0.07 | ) |
| | | | |
| REDEMPTION FEES | | | — | |
| | | | |
| NET ASSET VALUE, END OF PERIOD | | $ | 12.46 | |
| | | | |
| TOTAL RETURN2 | | | 2.03 | % |
| |
| NET ASSETS, END OF PERIOD (IN THOUSANDS) | | $ | 35,814 | |
| |
| RATIO OF EXPENSES TO AVERAGE NET ASSETS3 | | | 0.96 | %* |
| RATIO OF NET INVESTMENT INCOME (LOSS) TO AVERAGE NET ASSETS | | | 5.06 | %* |
| PORTFOLIO TURNOVER RATE | | | 237.83 | % |
1 Per share amounts are based upon average shares outstanding.
2 Total return is for the period indicated and has not been annualized. Total return is calculated assuming a purchase of shares at net asset value per share on the first day and a sale at net asset value per share on the last day of each period reported. Distributions are assumed, for purposes of this calculation, to be reinvested at the net asset value per share on the respective payment dates of each Fund.
3 The effect of any custody credits on this ratio is less than 0.01%.
4 Commenced operations on May 5, 2009.
* Annualized
| | | | |
| June 30, 2009 | | 148 | | See Notes to Financial Statements |
Financial Highlights
For a share outstanding throughout the periods presented
Accessor Limited Duration U.S. Government Fund
| | | | | | | | | | | | | | | | | | | | | | | | |
| | | PERIOD ENDED
JUNE 30,
2009 (UNAUDITED) | | | FOR THE YEARS
ENDED DECEMBER 31, | |
| | | | 2008 | | | 2007 | | | 2006 | | | 2005 | | | 20043 | |
| NET ASSET VALUE, BEGINNING OF PERIOD | | $ | 12.16 | | | $ | 12.12 | | | $ | 11.92 | | | $ | 11.87 | | | $ | 11.96 | | | $ | 12.00 | |
Net investment income (loss)1 | | | 0.16 | | | | 0.42 | | | | 0.53 | | | | 0.43 | | | | 0.31 | | | | 0.09 | |
Net realized and unrealized gain (loss) on investments1 | | | — | | | | 0.08 | | | | 0.19 | | | | 0.08 | | | | (0.07 | ) | | | (0.04 | ) |
| | | | | | | | | | | | | | | | | | | | | | | | |
Total from investment operations | | | 0.16 | | | | 0.50 | | | | 0.72 | | | | 0.51 | | | | 0.24 | | | | 0.05 | |
| | | | | | | | | | | | | | | | | | | | | | | | |
Distributions from net investment income | | | (0.16 | ) | | | (0.42 | ) | | | (0.52 | ) | | | (0.46 | ) | | | (0.33 | ) | | | (0.09 | ) |
Distributions from capital gains | | | — | | | | (0.04 | ) | | | — | | | | — | | | | — | | | | — | |
| | | | | | | | | | | | | | | | | | | | | | | | |
Total distributions | | | (0.16 | ) | | | (0.46 | ) | | | (0.52 | ) | | | (0.46 | ) | | | (0.33 | ) | | | (0.09 | ) |
| | | | | | | | | | | | | | | | | | | | | | | | |
| NET ASSET VALUE, END OF PERIOD | | $ | 12.16 | | | $ | 12.16 | | | $ | 12.12 | | | $ | 11.92 | | | $ | 11.87 | | | $ | 11.96 | |
| | | | | | | | | | | | | | | | | | | | | | | | |
| TOTAL RETURN2 | | | 1.31 | % | | | 4.22 | % | | | 6.22 | % | | | 4.36 | % | | | 2.00 | % | | | 0.44 | % |
| | | | | | |
| NET ASSETS, END OF PERIOD (IN THOUSANDS) | | $ | 39,602 | | | $ | 55,110 | | | $ | 63,172 | | | $ | 54,721 | | | $ | 58,140 | | | $ | 58,963 | |
| | | | | | |
| RATIO OF EXPENSES TO AVERAGE NET ASSETS4 | | | 0.67 | %* | | | 0.65 | % | | | 0.53 | % | | | 0.65 | % | | | 0.58 | % | | | 0.57 | %* |
| RATIO OF NET INVESTMENT INCOME (LOSS) TO AVERAGE NET ASSETS | | | 2.57 | %* | | | 3.46 | % | | | 4.40 | % | | | 3.60 | % | | | 2.61 | % | | | 1.66 | %* |
| PORTFOLIO TURNOVER RATE | | | 29.62 | % | | | 54.13 | % | | | 103.74 | % | | | 40.85 | % | | | 65.48 | % | | | 29.46 | % |
1 Per share amounts are based upon average shares outstanding.
2 Total return is for the period indicated and has not been annualized. Total return is calculated assuming a purchase of shares at net asset value per share on the first day and a sale at net asset value per share on the last day of each period reported. Distributions are assumed, for purposes of this calculation, to be reinvested at the net asset value per share on the respective payment dates of each Fund.
3 Fund commenced operations on July 6, 2004.
4 The effect of any custody credits on this ratio is less than 0.01%.
* Annualized
| | | | |
| See Notes to Financial Statements | | 149 | | June 30, 2009 |
Financial Highlights
For a share outstanding throughout the periods presented
Accessor U.S. Government Money Fund
| | | | | | | | | | | | | | | | | | | | | | | | |
| | | INSTITUTIONAL CLASS SHARES | |
| | | PERIOD ENDED
JUNE 30,
2009 (UNAUDITED) | | | FOR THE YEARS
ENDED DECEMBER 31, | |
| | | | 2008 | | | 2007 | | | 2006 | | | 2005 | | | 2004 | |
| NET ASSET VALUE, BEGINNING OF PERIOD | | $ | 1.00 | | | $ | 1.00 | | | $ | 1.00 | | | $ | 1.00 | | | $ | 1.00 | | | $ | 1.00 | |
Net investment income (loss)1 | | | 0.00 | 4 | | | 0.03 | | | | 0.05 | | | | 0.04 | | | | 0.03 | | | | 0.01 | |
Net realized and unrealized gain (loss) on investments1 | | | 0.00 | 4 | | | (0.01 | ) | | | — | | | | — | | | | — | | | | — | |
| | | | | | | | | | | | | | | | | | | | | | | | |
Total from investment operations | | | 0.00 | | | | 0.02 | | | | 0.05 | | | | 0.04 | | | | 0.03 | | | | 0.01 | |
| | | | | | | | | | | | | | | | | | | | | | | | |
Distributions from net investment income | | | (0.00 | )4 | | | (0.02 | ) | | | (0.05 | ) | | | (0.04 | ) | | | (0.03 | ) | | | (0.01 | ) |
| | | | | | | | | | | | | | | | | | | | | | | | |
| NET ASSET VALUE, END OF PERIOD | | $ | 1.00 | | | $ | 1.00 | | | $ | 1.00 | | | $ | 1.00 | | | $ | 1.00 | | | $ | 1.00 | |
| | | | | | | | | | | | | | | | | | | | | | | | |
| TOTAL RETURN2 | | | 0.21 | % | | | 2.30 | % | | | 4.72 | % | | | 4.49 | % | | | 2.75 | % | | | 0.93 | % |
| | | | | | |
| NET ASSETS, END OF PERIOD (IN THOUSANDS) | | $ | 348,800 | | | $ | 392,599 | | | $ | 1,344,292 | �� | | $ | 1,433,080 | | | $ | 1,266,322 | | | $ | 1,260,063 | |
| | | | | | |
| RATIO OF EXPENSES TO AVERAGE NET ASSETS3 | | | 0.49 | %* | | | 0.49 | % | | | 0.46 | % | | | 0.47 | % | | | 0.45 | % | | | 0.46 | % |
| RATIO OF NET EXPENSES TO AVERAGE NET ASSETS3 | | | 0.48 | %* | | | 0.49 | % | | | 0.46 | % | | | 0.47 | % | | | 0.45 | % | | | 0.46 | % |
| RATIO OF NET INVESTMENT INCOME (LOSS) TO (EXCLUDING WAIVER) AVERAGE NET ASSETS | | | 0.41 | %* | | | 2.53 | % | | | 4.60 | % | | | 4.37 | % | | | 2.68 | % | | | 0.94 | % |
| RATIO OF NET INVESTMENT INCOME (LOSS) TO AVERAGE NET ASSETS | | | 0.42 | %* | | | 2.53 | % | | | 4.60 | % | | | 4.37 | % | | | 2.68 | % | | | 0.94 | % |
1 Per share amounts are based upon average shares outstanding.
2 Total return is for the period indicated and has not been annualized. Total return is calculated assuming a purchase of shares at net asset value per share on the first day and a sale at net asset value per share on the last day of each period reported. Distributions are assumed, for purposes of this calculation, to be reinvested at the net asset value per share on the respective payment dates of each Fund.
3 The effect of any custody credits on this ratio is less than 0.01%.
4 Less than $0.005 per share.
* Annualized
| | | | |
| June 30, 2009 | | 150 | | See Notes to Financial Statements |
Financial Highlights
For a share outstanding throughout the periods presented
Accessor U.S. Government Money Fund
| | | | | | | | | | | | | | | | | | | | | | | | |
| | | INVESTOR CLASS SHARES | |
| | | PERIOD ENDED
JUNE 30,
2009 (UNAUDITED) | | | FOR THE YEARS
ENDED DECEMBER 31, | |
| | | | 2008 | | | 2007 | | | 2006 | | | 2005 | | | 2004 | |
| NET ASSET VALUE, BEGINNING OF PERIOD | | $ | 1.00 | | | $ | 1.00 | | | $ | 1.00 | | | $ | 1.00 | | | $ | 1.00 | | | $ | 1.00 | |
Net investment income (loss)1 | | | 0.00 | 4 | | | 0.02 | | | | 0.04 | | | | 0.04 | | | | 0.02 | | | | 0.01 | |
Net realized and unrealized gain (loss) on investments1 | | | 0.00 | 4 | | | — | | | | — | | | | — | | | | — | | | | — | |
| | | | | | | | | | | | | | | | | | | | | | | | |
Total from investment operations | | | 0.00 | | | | 0.02 | | | | 0.04 | | | | 0.04 | | | | 0.02 | | | | 0.01 | |
| | | | | | | | | | | | | | | | | | | | | | | | |
Distributions from net investment income | | | (0.00 | )4 | | | (0.02 | ) | | | (0.04 | ) | | | (0.04 | ) | | | (0.02 | ) | | | (0.01 | ) |
| | | | | | | | | | | | | | | | | | | | | | | | |
| NET ASSET VALUE, END OF PERIOD | | $ | 1.00 | | | $ | 1.00 | | | $ | 1.00 | | | $ | 1.00 | | | $ | 1.00 | | | $ | 1.00 | |
| | | | | | | | | | | | | | | | | | | | | | | | |
| TOTAL RETURN2 | | | 0.13 | % | | | 1.79 | % | | | 4.20 | % | | | 3.97 | % | | | 2.27 | % | | | 0.68 | % |
| | | | | | |
| NET ASSETS, END OF PERIOD (IN THOUSANDS) | | $ | 7,988 | | | $ | 10,697 | | | $ | 11,203 | | | $ | 9,286 | | | $ | 6,355 | | | $ | 12,689 | |
| | | | | | |
| RATIO OF EXPENSES TO AVERAGE NET ASSETS3 | | | 0.99 | %* | | | 0.99 | % | | | 0.96 | % | | | 0.98 | % | | | 0.91 | % | | | 0.71 | % |
| RATIO OF NET EXPENSES TO AVERAGE NET ASSETS3 | | | 0.65 | %* | | | 0.99 | % | | | 0.96 | % | | | 0.98 | % | | | 0.91 | % | | | 0.71 | % |
| RATIO OF NET INVESTMENT INCOME (LOSS) TO (EXCLUDING WAIVER) AVERAGE NET ASSETS | | | (0.08 | )%* | | | 1.84 | % | | | 4.09 | % | | | 3.89 | % | | | 2.19 | % | | | 0.63 | % |
| RATIO OF NET INVESTMENT INCOME (LOSS) TO AVERAGE NET ASSETS | | | 0.26 | %* | | | 1.84 | % | | | 4.09 | % | | | 3.89 | % | | | 2.19 | % | | | 0.63 | % |
1 Per share amounts are based upon average shares outstanding.
2 Total return is for the period indicated and has not been annualized. Total return is calculated assuming a purchase of shares at net asset value per share on the first day and a sale at net asset value per share on the last day of each period reported. Distributions are assumed, for purposes of this calculation, to be reinvested at the net asset value per share on the respective payment dates of each Fund.
3 The effect of any custody credits on this ratio is less than 0.01%.
4 Less than $0.005 per share.
* Annualized
| | | | |
| See Notes to Financial Statements | | 151 | | June 30, 2009 |
Financial Highlights
For a share outstanding throughout the periods presented
Accessor U.S. Government Money Fund
| | | | | | | | | | | | | | | | | | | | | | | | |
| | | C CLASS SHARES | |
| | | PERIOD ENDED
JUNE 30,
2009 (UNAUDITED) | | | FOR THE YEARS
ENDED DECEMBER 31, | |
| | | | 2008 | | | 2007 | | | 2006 | | | 2005 | | | 2004 | |
| NET ASSET VALUE, BEGINNING OF PERIOD | | $ | 1.00 | | | $ | 1.00 | | | $ | 1.00 | | | $ | 1.00 | | | $ | 1.00 | | | $ | 1.00 | |
Net investment income (loss)1 | | | 0.00 | 4 | | | 0.01 | | | | 0.04 | | | | 0.03 | | | | 0.02 | | | | 0.01 | |
Net realized and unrealized gain (loss) on investments1 | | | — | | | | — | | | | — | | | | — | | | | — | | | | — | |
| | | | | | | | | | | | | | | | | | | | | | | | |
Total from investment operations | | | — | | | | 0.01 | | | | 0.04 | | | | 0.03 | | | | 0.02 | | | | 0.01 | |
| | | | | | | | | | | | | | | | | | | | | | | | |
Distributions from net investment income | | | (0.00 | )4 | | | (0.01 | ) | | | (0.04 | ) | | | (0.03 | ) | | | (0.02 | ) | | | (0.01 | ) |
| | | | | | | | | | | | | | | | | | | | | | | | |
| NET ASSET VALUE, END OF PERIOD | | $ | 1.00 | | | $ | 1.00 | | | $ | 1.00 | | | $ | 1.00 | | | $ | 1.00 | | | $ | 1.00 | |
| | | | | | | | | | | | | | | | | | | | | | | | |
| TOTAL RETURN2 | | | 0.11 | % | | | 1.29 | % | | | 3.70 | % | | | 3.45 | % | | | 1.91 | % | | | 0.68 | % |
| | | | | | |
| NET ASSETS, END OF PERIOD (IN THOUSANDS) | | $ | 1,947 | | | $ | 1,937 | | | $ | 1,507 | | | $ | 2,808 | | | $ | 2,014 | | | $ | 1,989 | |
| | | | | | |
| RATIO OF EXPENSES TO AVERAGE NET ASSETS3 | | | 1.49 | %* | | | 1.50 | % | | | 1.46 | % | | | 1.47 | % | | | 1.29 | % | | | 0.71 | % |
| RATIO OF NET EXPENSES TO AVERAGE NET ASSETS3 | | | 0.67 | %* | | | 1.50 | % | | | 1.46 | % | | | 1.47 | % | | | 1.29 | % | | | 0.71 | % |
| RATIO OF NET INVESTMENT INCOME (LOSS) TO (EXCLUDING WAIVER) AVERAGE NET ASSETS | | | (0.60 | )%* | | | 1.24 | % | | | 3.59 | % | | | 3.42 | % | | | 1.88 | % | | | 0.79 | % |
| RATIO OF NET INVESTMENT INCOME (LOSS) TO AVERAGE NET ASSETS | | | 0.23 | %* | | | 1.24 | % | | | 3.59 | % | | | 3.42 | % | | | 1.88 | % | | | 0.79 | % |
1 Per share amounts are based upon average shares outstanding.
2 Total return is for the period indicated and has not been annualized. Total return is calculated assuming a purchase of shares at net asset value per share on the first day and a sale at net asset value per share on the last day of each period reported. Distributions are assumed, for purposes of this calculation, to be reinvested at the net asset value per share on the respective payment dates of each Fund.
3 The effect of any custody credits on this ratio is less than 0.01%.
4 Less than $0.005 per share.
* Annualized
| | | | |
| June 30, 2009 | | 152 | | See Notes to Financial Statements |
Financial Highlights
For a share outstanding throughout the periods presented
Accessor U.S. Government Money Fund
| | | | | | | | | | | | | | | | | | | | | | | | |
| | | A CLASS SHARES | |
| | | PERIOD ENDED
JUNE 30,
2009 (UNAUDITED) | | | FOR THE YEARS
ENDED DECEMBER 31, | |
| | | | 2008 | | | 2007 | | | 2006 | | | 2005 | | | 2004 | |
| NET ASSET VALUE, BEGINNING OF PERIOD | | $ | 1.00 | | | $ | 1.00 | | | $ | 1.00 | | | $ | 1.00 | | | $ | 1.00 | | | $ | 1.00 | |
Net investment income (loss)1 | | | 0.00 | 5 | | | 0.02 | | | | 0.04 | | | | 0.04 | | | | 0.03 | | | | 0.01 | |
Net realized and unrealized gain (loss) on investments1 | | | — | | | | — | | | | — | | | | — | | | | — | | | | — | |
| | | | | | | | | | | | | | | | | | | | | | | | |
Total from investment operations | | | — | | | | 0.02 | | | | 0.04 | | | | 0.04 | | | | 0.03 | | | | 0.01 | |
| | | | | | | | | | | | | | | | | | | | | | | | |
Distributions from net investment income | | | 0.00 | 5 | | | (0.02 | ) | | | (0.04 | ) | | | (0.04 | ) | | | (0.03 | ) | | | (0.01 | ) |
| | | | | | | | | | | | | | | | | | | | | | | | |
| NET ASSET VALUE, END OF PERIOD | | $ | 1.00 | | | $ | 1.00 | | | $ | 1.00 | | | $ | 1.00 | | | $ | 1.00 | | | $ | 1.00 | |
| | | | | | | | | | | | | | | | | | | | | | | | |
| TOTAL RETURN2,3 | | | 0.15 | % | | | 2.05 | % | | | 4.46 | % | | | 4.27 | % | | | 2.54 | % | | | 0.68 | % |
| | | | | | |
| NET ASSETS, END OF PERIOD (IN THOUSANDS) | | $ | 508 | | | $ | 708 | | | $ | 1,370 | | | $ | 290 | | | $ | 109 | | | $ | 49 | |
| | | | | | |
| RATIO OF EXPENSES TO AVERAGE NET ASSETS4 | | | 0.74 | %* | | | 0.74 | % | | | 0.72 | % | | | 0.70 | % | | | 0.65 | % | | | 0.72 | % |
| RATIO OF NET EXPENSES TO AVERAGE NET ASSETS4 | | | 0.61 | %* | | | 0.74 | % | | | 0.72 | % | | | 0.70 | % | | | 0.65 | % | | | 0.72 | % |
| RATIO OF NET INVESTMENT INCOME (LOSS) TO (EXCLUDING WAIVER) AVERAGE NET ASSETS | | | 0.17 | %* | | | 2.22 | % | | | 4.28 | % | | | 4.30 | % | | | 2.63 | % | | | 0.94 | % |
| RATIO OF NET INVESTMENT INCOME (LOSS) TO AVERAGE NET ASSETS | | | 0.30 | %* | | | 2.22 | % | | | 4.28 | % | | | 4.30 | % | | | 2.63 | % | | | 0.94 | % |
1 Per share amounts are based upon average shares outstanding.
2 Total return is for the period indicated and has not been annualized. Total return is calculated assuming a purchase of shares at net asset value per share on the first day and a sale at net asset value per share on the last day of each period reported. Distributions are assumed, for purposes of this calculation, to be reinvested at the net asset value per share on the respective payment dates of each Fund.
3 A Class total return does not include the one-time front-end sales charge.
4 The effect of any custody credits on this ratio is less than 0.01%.
5 Less than $0.005 per share.
* Annualized
| | | | |
| See Notes to Financial Statements | | 153 | | June 30, 2009 |
Financial Highlights
For a share outstanding throughout the periods presented
Accessor U.S. Government Money Fund
| | | | | | | | | | | | |
| | | Z CLASS SHARES | |
| | | PERIOD ENDED
JUNE 30,
2009 (UNAUDITED) | | | FOR THE YEARS
ENDED DECEMBER 31, | |
| | | | 2008 | | | 20075 | |
| NET ASSET VALUE, BEGINNING OF PERIOD | | $ | 1.00 | | | $ | 1.00 | | | $ | 1.00 | |
Net investment income (loss)1 | | | 0.00 | 4 | | | 0.02 | | | | 0.05 | |
Net realized and unrealized gain (loss) on investments1 | | | 0.00 | 4 | | | 0.01 | | | | — | |
| | | | | | | | | | | | |
Total from investment operations | | | 0.00 | | | | 0.03 | | | | 0.05 | |
| | | | | | | | | | | | |
Distributions from net investment income | | | (0.00 | )4 | | | (0.03 | ) | | | (0.05 | ) |
| | | | | | | | | | | | |
| NET ASSET VALUE, END OF PERIOD | | $ | 1.00 | | | $ | 1.00 | | | $ | 1.00 | |
| | | | | | | | | | | | |
| TOTAL RETURN2 | | | 0.33 | % | | | 2.55 | % | | | 4.97 | % |
| | | |
| NET ASSETS, END OF PERIOD (IN THOUSANDS) | | $ | 474,960 | | | $ | 746,292 | | | $ | 67,259 | |
| | | |
| RATIO OF EXPENSES TO AVERAGE NET ASSETS3 | | | 0.24 | %* | | | 0.24 | % | | | 0.21 | %* |
| RATIO OF NET EXPENSES TO AVERAGE NET ASSETS3 | | | 0.24 | %* | | | 0.24 | % | | | 0.21 | %* |
| RATIO OF NET INVESTMENT INCOME (LOSS) TO (EXCLUDING WAIVER) AVERAGE NET ASSETS | | | 0.70 | %* | | | 2.31 | % | | | 4.78 | %* |
| RATIO OF NET INVESTMENT INCOME (LOSS) TO AVERAGE NET ASSETS | | | 0.70 | %* | | | 2.31 | % | | | 4.78 | %* |
1 Per share amounts are based upon average shares outstanding.
2 Total return is for the period indicated and has not been annualized. Total return is calculated assuming a purchase of shares at net asset value per share on the first day and a sale at net asset value per share on the last day of each period reported. Distributions are assumed, for purposes of this calculation, to be reinvested at the net asset value per share on the respective payment dates of each Fund.
3 The effect of any custody credits on this ratio is less than 0.01%.
4 Less than $0.005 per share.
5 Class commenced operations on January 4, 2007.
* Annualized
| | | | |
| June 30, 2009 | | 154 | | See Notes to Financial Statements |
Financial Highlights
For a share outstanding throughout the periods presented
Accessor Income Allocation Fund
| | | | | | | | | | | | | | | | | | | | | | | | |
| | | INSTITUTIONAL CLASS SHARES | |
| | | PERIOD ENDED
JUNE 30,
2009 (UNAUDITED) | | | FOR THE YEARS
ENDED DECEMBER 31, | |
| | | | 2008 | | | 2007 | | | 2006 | | | 2005 | | | 2004 | |
| NET ASSET VALUE, BEGINNING OF PERIOD | | $ | 12.77 | | | $ | 14.45 | | | $ | 14.84 | | | $ | 14.94 | | | $ | 15.17 | | | $ | 15.29 | |
Net investment income (loss)1 | | | 0.36 | | | | 0.69 | | | | 0.84 | | | | 0.73 | | | | 0.60 | | | | 0.50 | |
Net realized and unrealized gain (loss) on investments1 | | | 0.54 | | | | (1.66 | ) | | | (0.38 | ) | | | (0.10 | ) | | | (0.23 | ) | | | (0.09 | ) |
| | | | | | | | | | | | | | | | | | | | | | | | |
Total from investment operations | | | 0.90 | | | | (0.97 | ) | | | 0.46 | | | | 0.63 | | | | 0.37 | | | | 0.41 | |
| | | | | | | | | | | | | | | | | | | | | | | | |
Distributions from net investment income | | | (0.35 | ) | | | (0.71 | ) | | | (0.85 | ) | | | (0.73 | ) | | | (0.59 | ) | | | (0.49 | ) |
Distributions from capital gains | | | — | | | | — | | | | — | | | | — | | | | (0.01 | ) | | | (0.04 | ) |
| | | | | | | | | | | | | | | | | | | | | | | | |
Total distributions | | | (0.35 | ) | | | (0.71 | ) | | | (0.85 | ) | | | (0.73 | ) | | | (0.60 | ) | | | (0.53 | ) |
| | | | | | | | | | | | | | | | | | | | | | | | |
| NET ASSET VALUE, END OF PERIOD | | $ | 13.32 | | | $ | 12.77 | | | $ | 14.45 | | | $ | 14.84 | | | $ | 14.94 | | | $ | 15.17 | |
| | | | | | | | | | | | | | | | | | | | | | | | |
| TOTAL RETURN2 | | | 7.10 | % | | | (6.79 | )% | | | 3.16 | % | | | 4.32 | % | | | 2.38 | % | | | 2.83 | % |
| | | | | | |
| NET ASSETS, END OF PERIOD (IN THOUSANDS) | | $ | 13,865 | | | $ | 10,464 | | | $ | 11,696 | | | $ | 10,440 | | | $ | 8,415 | | | $ | 7,410 | |
| | | | | | |
| RATIO OF EXPENSES TO AVERAGE NET ASSETS | | | 0.50 | %* | | | 0.46 | % | | | 0.29 | % | | | 0.35 | % | | | 0.36 | % | | | 0.42 | % |
| RATIO OF NET EXPENSES TO AVERAGE NET ASSETS | | | 0.46 | %* | | | 0.46 | % | | | 0.29 | % | | | 0.20 | % | | | 0.20 | % | | | 0.20 | % |
| RATIO OF NET INVESTMENT INCOME (LOSS) TO AVERAGE NET ASSETS (EXCLUDING EXPENSES PAID DIRECTLY BY THE ADVISOR) | | | 5.49 | %* | | | 5.09 | % | | | 5.75 | % | | | 4.76 | % | | | 3.79 | % | | | 3.06 | % |
| RATIO OF NET INVESTMENT INCOME (LOSS) TO AVERAGE NET ASSETS (INCLUDING EXPENSES PAID DIRECTLY BY THE ADVISOR) | | | 5.54 | %* | | | 5.09 | % | | | 5.75 | % | | | 4.91 | % | | | 3.94 | % | | | 3.28 | % |
| PORTFOLIO TURNOVER RATE | | | 7.00 | % | | | 45.58 | % | | | 60.59 | % | | | 14.19 | % | | | 19.91 | % | | | 33.21 | % |
1 Per share amounts are based upon average shares outstanding.
2 Total return is for the period indicated and has not been annualized. Total return is calculated assuming a purchase of shares at net asset value per share on the first day and a sale at net asset value per share on the last day of each period reported. Distributions are assumed, for purposes of this calculation, to be reinvested at the net asset value per share on the respective payment dates of each Fund.
* Annualized
| | | | |
| See Notes to Financial Statements | | 155 | | June 30, 2009 |
Financial Highlights
For a share outstanding throughout the periods presented
Accessor Income Allocation Fund
| | | | | | | | | | | | | | | | | | | | | | | | |
| | | INVESTOR CLASS SHARES | |
| | | PERIOD ENDED
JUNE 30,
2009 (UNAUDITED) | | | FOR THE YEARS
ENDED DECEMBER 31, | |
| | | | 2008 | | | 2007 | | | 2006 | | | 2005 | | | 2004 | |
| NET ASSET VALUE, BEGINNING OF PERIOD | | $ | 12.76 | | | $ | 14.43 | | | $ | 14.83 | | | $ | 14.93 | | | $ | 15.17 | | | $ | 15.29 | |
Net investment income (loss)1 | | | 0.32 | | | | 0.63 | | | | 0.77 | | | | 0.65 | | | | 0.52 | | | | 0.42 | |
Net realized and unrealized gain (loss) on investments1 | | | 0.55 | | | | (1.66 | ) | | | (0.40 | ) | | | (0.10 | ) | | | (0.23 | ) | | | (0.08 | ) |
| | | | | | | | | | | | | | | | | | | | | | | | |
Total from investment operations | | | 0.87 | | | | (1.03 | ) | | | 0.37 | | | | 0.55 | | | | 0.29 | | | | 0.34 | |
| | | | | | | | | | | | | | | | | | | | | | | | |
Distributions from net investment income | | | (0.32 | ) | | | (0.64 | ) | | | (0.77 | ) | | | (0.65 | ) | | | (0.52 | ) | | | (0.42 | ) |
Distributions from capital gains | | | — | | | | — | | | | — | | | | — | | | | (0.01 | ) | | | (0.04 | ) |
| | | | | | | | | | | | | | | | | | | | | | | | |
Total distributions | | | (0.32 | ) | | | (0.64 | ) | | | (0.77 | ) | | | (0.65 | ) | | | (0.53 | ) | | | (0.46 | ) |
| | | | | | | | | | | | | | | | | | | | | | | | |
| NET ASSET VALUE, END OF PERIOD | | $ | 13.31 | | | $ | 12.76 | | | $ | 14.43 | | | $ | 14.83 | | | $ | 14.93 | | | $ | 15.17 | |
| | | | | | | | | | | | | | | | | | | | | | | | |
| TOTAL RETURN2 | | | 6.84 | % | | | (7.20 | )% | | | 2.58 | % | | | 3.81 | % | | | 1.92 | % | | | 2.28 | % |
| | | | | | |
| NET ASSETS, END OF PERIOD (IN THOUSANDS) | | $ | 1,444 | | | $ | 2,035 | | | $ | 3,067 | | | $ | 3,037 | | | $ | 3,399 | | | $ | 3,266 | |
| | | | | | |
| RATIO OF EXPENSES TO AVERAGE NET ASSETS | | | 1.01 | %* | | | 0.95 | % | | | 0.79 | % | | | 0.83 | % | | | 0.82 | % | | | 0.92 | % |
| RATIO OF NET EXPENSES TO AVERAGE NET ASSETS | | | 0.97 | %* | | | 0.95 | % | | | 0.79 | % | | | 0.69 | % | | | 0.66 | % | | | 0.70 | % |
| RATIO OF NET INVESTMENT INCOME (LOSS) TO AVERAGE NET ASSETS (EXCLUDING EXPENSES PAID DIRECTLY BY THE ADVISOR) | | | 4.92 | %* | | | 4.62 | % | | | 5.24 | % | | | 4.23 | % | | | 3.32 | % | | | 2.54 | % |
| RATIO OF NET INVESTMENT INCOME (LOSS) TO AVERAGE NET ASSETS (INCLUDING EXPENSES PAID DIRECTLY BY THE ADVISOR) | | | 4.97 | %* | | | 4.62 | % | | | 5.24 | % | | | 4.37 | % | | | 3.48 | % | | | 2.77 | % |
| PORTFOLIO TURNOVER RATE | | | 7.00 | % | | | 45.58 | % | | | 60.59 | % | | | 14.19 | % | | | 19.91 | % | | | 33.21 | % |
1 Per share amounts are based upon average shares outstanding.
2 Total return is for the period indicated and has not been annualized. Total return is calculated assuming a purchase of shares at net asset value per share on the first day and a sale at net asset value per share on the last day of each period reported. Distributions are assumed, for purposes of this calculation, to be reinvested at the net asset value per share on the respective payment dates of each Fund.
* Annualized
| | | | |
| June 30, 2009 | | 156 | | See Notes to Financial Statements |
Financial Highlights
For a share outstanding throughout the periods presented
Accessor Income Allocation Fund
| | | | | | | | | | | | | | | | | | | | | | | | |
| | | C CLASS SHARES | |
| | | PERIOD ENDED
JUNE 30,
2009 (UNAUDITED) | | | FOR THE YEARS
ENDED DECEMBER 31, | |
| | | | 2008 | | | 2007 | | | 2006 | | | 2005 | | | 2004 | |
| NET ASSET VALUE, BEGINNING OF PERIOD | | $ | 12.74 | | | $ | 14.41 | | | $ | 14.81 | | | $ | 14.91 | | | $ | 15.15 | | | $ | 15.28 | |
Net investment income (loss)1 | | | 0.29 | | | | 0.57 | | | | 0.69 | | | | 0.60 | | | | 0.44 | | | | 0.37 | |
Net realized and unrealized gain (loss) on investments1 | | | 0.54 | | | | (1.67 | ) | | | (0.39 | ) | | | (0.12 | ) | | | (0.23 | ) | | | (0.11 | ) |
| | | | | | | | | | | | | | | | | | | | | | | | |
Total from investment operations | | | 0.83 | | | | (1.10 | ) | | | 0.30 | | | | 0.48 | | | | 0.21 | | | | 0.26 | |
| | | | | | | | | | | | | | | | | | | | | | | | |
Distributions from net investment income | | | (0.29 | ) | | | (0.57 | ) | | | (0.70 | ) | | | (0.58 | ) | | | (0.44 | ) | | | (0.35 | ) |
Distributions from capital gains | | | — | | | | — | | | | — | | | | — | | | | (0.01 | ) | | | (0.04 | ) |
| | | | | | | | | | | | | | | | | | | | | | | | |
Total distributions | | | (0.29 | ) | | | (0.57 | ) | | | (0.70 | ) | | | (0.58 | ) | | | (0.45 | ) | | | (0.39 | ) |
| | | | | | | | | | | | | | | | | | | | | | | | |
| NET ASSET VALUE, END OF PERIOD | | $ | 13.28 | | | $ | 12.74 | | | $ | 14.41 | | | $ | 14.81 | | | $ | 14.91 | | | $ | 15.15 | |
| | | | | | | | | | | | | | | | | | | | | | | | |
| TOTAL RETURN2 | | | 6.52 | % | | | (7.68 | )% | | | 2.07 | % | | | 3.31 | % | | | 1.38 | % | | | 1.77 | % |
| | | | | | |
| NET ASSETS, END OF PERIOD (IN THOUSANDS) | | $ | 2,806 | | | $ | 2,474 | | | $ | 2,872 | | | $ | 3,033 | | | $ | 1,546 | | | $ | 1,529 | |
| | | | | | |
| RATIO OF EXPENSES TO AVERAGE NET ASSETS | | | 1.51 | %* | | | 1.46 | % | | | 1.29 | % | | | 1.40 | % | | | 1.36 | % | | | 1.43 | % |
| RATIO OF NET EXPENSES TO AVERAGE NET ASSETS | | | 1.46 | %* | | | 1.46 | % | | | 1.29 | % | | | 1.20 | % | | | 1.20 | % | | | 1.20 | % |
| RATIO OF NET INVESTMENT INCOME (LOSS) TO AVERAGE NET ASSETS (EXCLUDING EXPENSES PAID DIRECTLY BY THE ADVISOR) | | | 4.52 | %* | | | 4.18 | % | | | 4.74 | % | | | 3.79 | % | | | 2.79 | % | | | 2.20 | % |
| RATIO OF NET INVESTMENT INCOME (LOSS) TO AVERAGE NET ASSETS (INCLUDING EXPENSES PAID DIRECTLY BY THE ADVISOR) | | | 4.56 | %* | | | 4.18 | % | | | 4.74 | % | | | 3.99 | % | | | 2.95 | % | | | 2.43 | % |
| PORTFOLIO TURNOVER RATE | | | 7.00 | % | | | 45.58 | % | | | 60.59 | % | | | 14.19 | % | | | 19.91 | % | | | 33.21 | % |
1 Per share amounts are based upon average shares outstanding.
2 Total return is for the period indicated and has not been annualized. Total return is calculated assuming a purchase of shares at net asset value per share on the first day and a sale at net asset value per share on the last day of each period reported. Distributions are assumed, for purposes of this calculation, to be reinvested at the net asset value per share on the respective payment dates of each Fund.
* Annualized
| | | | |
| See Notes to Financial Statements | | 157 | | June 30, 2009 |
Financial Highlights
For a share outstanding throughout the periods presented
Accessor Income Allocation Fund
| | | | | | | | | | | | | | | | | | | | | | | | |
| | | A CLASS SHARES | |
| | | PERIOD ENDED
JUNE 30,
2009 (UNAUDITED) | | | FOR THE YEARS
ENDED DECEMBER 31, | |
| | | | 2008 | | | 2007 | | | 2006 | | | 2005 | | | 2004 | |
| NET ASSET VALUE, BEGINNING OF PERIOD | | $ | 12.77 | | | $ | 14.44 | | | $ | 14.84 | | | $ | 14.92 | | | $ | 15.17 | | | $ | 15.29 | |
Net investment income (loss)1 | | | 0.34 | | | | 0.69 | | | | 0.80 | | | | 0.73 | | | | 0.56 | | | | 0.50 | |
Net realized and unrealized gain (loss) on investments1 | | | 0.54 | | | | (1.68 | ) | | | (0.39 | ) | | | (0.12 | ) | | | (0.25 | ) | | | (0.12 | ) |
| | | | | | | | | | | | | | | | | | | | | | | | |
Total from investment operations | | | 0.88 | | | | (0.99 | ) | | | 0.41 | | | | 0.61 | | | | 0.31 | | | | 0.38 | |
| | | | | | | | | | | | | | | | | | | | | | | | |
Distributions from net investment income | | | (0.34 | ) | | | (0.68 | ) | | | (0.81 | ) | | | (0.69 | ) | | | (0.55 | ) | | | (0.46 | ) |
Distributions from capital gains | | | — | | | | — | | | | — | | | | — | | | | (0.01 | ) | | | (0.04 | ) |
| | | | | | | | | | | | | | | | | | | | | | | | |
Total distributions | | | (0.34 | ) | | | (0.68 | ) | | | (0.81 | ) | | | (0.69 | ) | | | (0.56 | ) | | | (0.50 | ) |
| | | | | | | | | | | | | | | | | | | | | | | | |
| NET ASSET VALUE, END OF PERIOD | | $ | 13.31 | | | $ | 12.77 | | | $ | 14.44 | | | $ | 14.84 | | | $ | 14.92 | | | $ | 15.17 | |
| | | | | | | | | | | | | | | | | | | | | | | | |
| TOTAL RETURN2,3 | | | 6.98 | % | | | (7.03 | )% | | | 2.88 | % | | | 4.13 | % | | | 2.06 | % | | | 2.53 | % |
| | | | | | |
| NET ASSETS, END OF PERIOD (IN THOUSANDS) | | $ | 1,163 | | | $ | 997 | | | $ | 689 | | | $ | 617 | | | $ | 720 | | | $ | 581 | |
| | | | | | |
| RATIO OF EXPENSES TO AVERAGE NET ASSETS | | | 0.75 | %* | | | 0.71 | % | | | 0.57 | % | | | 0.54 | % | | | 0.61 | % | | | 0.68 | % |
| RATIO OF NET EXPENSES TO AVERAGE NET ASSETS | | | 0.71 | %* | | | 0.71 | % | | | 0.57 | % | | | 0.45 | % | | | 0.45 | % | | | 0.45 | % |
| RATIO OF NET INVESTMENT INCOME (LOSS) TO AVERAGE NET ASSETS (EXCLUDING EXPENSES PAID DIRECTLY BY THE ADVISOR) | | | 5.25 | %* | | | 5.03 | % | | | 5.45 | % | | | 4.62 | % | | | 3.57 | % | | | 2.93 | % |
| RATIO OF NET INVESTMENT INCOME (LOSS) TO AVERAGE NET ASSETS (INCLUDING EXPENSES PAID DIRECTLY BY THE ADVISOR) | | | 5.29 | %* | | | 5.03 | % | | | 5.45 | % | | | 4.71 | % | | | 3.73 | % | | | 3.16 | % |
| PORTFOLIO TURNOVER RATE | | | 7.00 | % | | | 45.58 | % | | | 60.59 | % | | | 14.19 | % | | | 19.91 | % | | | 33.21 | % |
1 Per share amounts are based upon average shares outstanding.
2 Total return is for the period indicated and has not been annualized. Total return is calculated assuming a purchase of shares at net asset value per share on the first day and a sale at net asset value per share on the last day of each period reported. Distributions are assumed, for purposes of this calculation, to be reinvested at the net asset value per share on the respective payment dates of each Fund.
3 A Class total return does not include the one-time front-end sales charge.
* Annualized
| | | | |
| June 30, 2009 | | 158 | | See Notes to Financial Statements |
Financial Highlights
For a share outstanding throughout the periods presented
Accessor Income & Growth Allocation Fund
| | | | | | | | | | | | | | | | | | | | | | | | |
| | | INSTITUTIONAL CLASS SHARES | |
| | | PERIOD ENDED
JUNE 30,
2009 (UNAUDITED) | | | FOR THE YEARS
ENDED DECEMBER 31, | |
| | | | 2008 | | | 2007 | | | 2006 | | | 2005 | | | 2004 | |
| NET ASSET VALUE, BEGINNING OF PERIOD | | $ | 12.61 | | | $ | 16.22 | | | $ | 16.27 | | | $ | 15.57 | | | $ | 15.38 | | | $ | 14.83 | |
Net investment income (loss)1 | | | 0.24 | | | | 0.52 | | | | 0.62 | | | | 0.56 | | | | 0.45 | | | | 0.39 | |
Net realized and unrealized gain (loss) on investments1 | | | 0.48 | | | | (3.47 | ) | | | 0.03 | | | | 0.71 | | | | 0.20 | | | | 0.55 | |
| | | | | | | | | | | | | | | | | | | | | | | | |
Total from investment operations | | | 0.72 | | | | (2.95 | ) | | | 0.65 | | | | 1.27 | | | | 0.65 | | | | 0.94 | |
| | | | | | | | | | | | | | | | | | | | | | | | |
Distributions from net investment income | | | (0.24 | ) | | | (0.57 | ) | | | (0.69 | ) | | | (0.56 | ) | | | (0.45 | ) | | | (0.37 | ) |
Distributions from capital gains | | | — | | | | (0.09 | ) | | | (0.01 | ) | | | (0.01 | ) | | | (0.01 | ) | | | (0.02 | ) |
| | | | | | | | | | | | | | | | | | | | | | | | |
Total distributions | | | (0.24 | ) | | | (0.66 | ) | | | (0.70 | ) | | | (0.57 | ) | | | (0.46 | ) | | | (0.39 | ) |
| | | | | | | | | | | | | | | | | | | | | | | | |
| NET ASSET VALUE, END OF PERIOD | | $ | 13.09 | | | $ | 12.61 | | | $ | 16.22 | | | $ | 16.27 | | | $ | 15.57 | | | $ | 15.38 | |
| | | | | | | | | | | | | | | | | | | | | | | | |
| TOTAL RETURN2 | | | 5.81 | % | | | (18.61 | )% | | | 4.03 | % | | | 8.33 | % | | | 4.29 | % | | | 6.45 | % |
| | | | | | |
| NET ASSETS, END OF PERIOD (IN THOUSANDS) | | $ | 31,542 | | | $ | 24,869 | | | $ | 24,914 | | | $ | 15,923 | | | $ | 14,277 | | | $ | 12,381 | |
| | | | | | |
| RATIO OF EXPENSES TO AVERAGE NET ASSETS | | | 0.31 | %* | | | 0.29 | % | | | 0.24 | % | | | 0.28 | % | | | 0.28 | % | | | 0.33 | % |
| RATIO OF NET EXPENSES TO AVERAGE NET ASSETS | | | 0.27 | %* | | | 0.29 | % | | | 0.24 | % | | | 0.20 | % | | | 0.20 | % | | | 0.20 | % |
| RATIO OF NET INVESTMENT INCOME (LOSS) TO AVERAGE NET ASSETS (EXCLUDING EXPENSES PAID DIRECTLY BY THE ADVISOR) | | | 3.80 | %* | | | 3.63 | % | | | 3.78 | % | | | 3.44 | % | | | 2.87 | % | | | 2.45 | % |
| RATIO OF NET INVESTMENT INCOME (LOSS) TO AVERAGE NET ASSETS (INCLUDING EXPENSES PAID DIRECTLY BY THE ADVISOR) | | | 3.85 | %* | | | 3.63 | % | | | 3.78 | % | | | 3.52 | % | | | 2.95 | % | | | 2.58 | % |
| PORTFOLIO TURNOVER RATE | | | 14.23 | % | | | 20.29 | % | | | 48.68 | % | | | 19.31 | % | | | 11.49 | % | | | 19.76 | % |
1 Per share amounts are based upon average shares outstanding.
2 Total return is for the period indicated and has not been annualized. Total return is calculated assuming a purchase of shares at net asset value per share on the first day and a sale at net asset value per share on the last day of each period reported. Distributions are assumed, for purposes of this calculation, to be reinvested at the net asset value per share on the respective payment dates of each Fund.
* Annualized
| | | | |
| See Notes to Financial Statements | | 159 | | June 30, 2009 |
Financial Highlights
For a share outstanding throughout the periods presented
Accessor Income & Growth Allocation Fund
| | | | | | | | | | | | | | | | | | | | | | | | |
| | | INVESTOR CLASS SHARES | |
| | | PERIOD ENDED
JUNE 30,
2009 (UNAUDITED) | | | FOR THE YEARS
ENDED DECEMBER 31, | |
| | | | 2008 | | | 2007 | | | 2006 | | | 2005 | | | 2004 | |
| NET ASSET VALUE, BEGINNING OF PERIOD | | $ | 12.60 | | | $ | 16.21 | | | $ | 16.26 | | | $ | 15.57 | | | $ | 15.37 | | | $ | 14.83 | |
Net investment income (loss)1 | | | 0.21 | | | | 0.44 | | | | 0.53 | | | | 0.49 | | | | 0.37 | | | | 0.31 | |
Net realized and unrealized gain (loss) on investments1 | | | 0.48 | | | | (3.47 | ) | | | 0.04 | | | | 0.69 | | | | 0.22 | | | | 0.55 | |
| | | | | | | | | | | | | | | | | | | | | | | | |
Total from investment operations | | | 0.69 | | | | (3.03 | ) | | | 0.57 | | | | 1.18 | | | | 0.59 | | | | 0.86 | |
| | | | | | | | | | | | | | | | | | | | | | | | |
Distributions from net investment income | | | (0.21 | ) | | | (0.49 | ) | | | (0.61 | ) | | | (0.48 | ) | | | (0.38 | ) | | | (0.30 | ) |
Distributions from capital gains | | | — | | | | (0.09 | ) | | | (0.01 | ) | | | (0.01 | ) | | | (0.01 | ) | | | (0.02 | ) |
| | | | | | | | | | | | | | | | | | | | | | | | |
Total distributions | | | (0.21 | ) | | | (0.58 | ) | | | (0.62 | ) | | | (0.49 | ) | | | (0.39 | ) | | | (0.32 | ) |
| | | | | | | | | | | | | | | | | | | | | | | | |
| NET ASSET VALUE, END OF PERIOD | | $ | 13.08 | | | $ | 12.60 | | | $ | 16.21 | | | $ | 16.26 | | | $ | 15.57 | | | $ | 15.37 | |
| | | | | | | | | | | | | | | | | | | | | | | | |
| TOTAL RETURN2 | | | 5.48 | % | | | (18.97 | )% | | | 3.51 | % | | | 7.76 | % | | | 3.89 | % | | | 5.88 | % |
| | | | | | |
| NET ASSETS, END OF PERIOD (IN THOUSANDS) | | $ | 3,621 | | | $ | 3,445 | | | $ | 4,955 | | | $ | 5,263 | | | $ | 2,740 | | | $ | 4,602 | |
| | | | | | |
| RATIO OF EXPENSES TO AVERAGE NET ASSETS | | | 0.82 | %* | | | 0.78 | % | | | 0.74 | % | | | 0.78 | % | | | 0.72 | % | | | 0.83 | % |
| RATIO OF NET EXPENSES TO AVERAGE NET ASSETS | | | 0.78 | %* | | | 0.78 | % | | | 0.74 | % | | | 0.69 | % | | | 0.64 | % | | | 0.70 | % |
| RATIO OF NET INVESTMENT INCOME (LOSS) TO AVERAGE NET ASSETS (EXCLUDING EXPENSES PAID DIRECTLY BY THE ADVISOR) | | | 3.27 | %* | | | 3.00 | % | | | 3.19 | % | | | 3.01 | % | | | 2.31 | % | | | 1.93 | % |
| RATIO OF NET INVESTMENT INCOME (LOSS) TO AVERAGE NET ASSETS (INCLUDING EXPENSES PAID DIRECTLY BY THE ADVISOR) | | | 3.31 | %* | | | 3.00 | % | | | 3.19 | % | | | 3.10 | % | | | 2.39 | % | | | 2.06 | % |
| PORTFOLIO TURNOVER RATE | | | 14.23 | % | | | 20.29 | % | | | 48.68 | % | | | 19.31 | % | | | 11.49 | % | | | 19.76 | % |
1 Per share amounts are based upon average shares outstanding.
2 Total return is for the period indicated and has not been annualized. Total return is calculated assuming a purchase of shares at net asset value per share on the first day and a sale at net asset value per share on the last day of each period reported. Distributions are assumed, for purposes of this calculation, to be reinvested at the net asset value per share on the respective payment dates of each Fund.
* Annualized
| | | | |
| June 30, 2009 | | 160 | | See Notes to Financial Statements |
Financial Highlights
For a share outstanding throughout the periods presented
Accessor Income & Growth Allocation Fund
| | | | | | | | | | | | | | | | | | | | | | | | |
| | | C CLASS SHARES | |
| | | PERIOD ENDED
JUNE 30,
2009 (UNAUDITED) | | | FOR THE YEARS
ENDED DECEMBER 31, | |
| | | | 2008 | | | 2007 | | | 2006 | | | 2005 | | | 2004 | |
| NET ASSET VALUE, BEGINNING OF PERIOD | | $ | 12.57 | | | $ | 16.16 | | | $ | 16.21 | | | $ | 15.52 | | | $ | 15.33 | | | $ | 14.81 | |
Net investment income (loss)1 | | | 0.17 | | | | 0.38 | | | | 0.44 | | | | 0.40 | | | | 0.30 | | | | 0.27 | |
Net realized and unrealized gain (loss) on investments1 | | | 0.48 | | | | (3.46 | ) | | | 0.05 | | | | 0.70 | | | | 0.20 | | | | 0.51 | |
| | | | | | | | | | | | | | | | | | | | | | | | |
Total from investment operations | | | 0.65 | | | | (3.08 | ) | | | 0.49 | | | | 1.10 | | | | 0.50 | | | | 0.78 | |
| | | | | | | | | | | | | | | | | | | | | | | | |
Distributions from net investment income | | | (0.18 | ) | | | (0.42 | ) | | | (0.53 | ) | | | (0.40 | ) | | | (0.30 | ) | | | (0.24 | ) |
Distributions from capital gains | | | — | | | | (0.09 | ) | | | (0.01 | ) | | | (0.01 | ) | | | (0.01 | ) | | | (0.02 | ) |
| | | | | | | | | | | | | | | | | | | | | | | | |
Total distributions | | | (0.18 | ) | | | (0.51 | ) | | | (0.54 | ) | | | (0.41 | ) | | | (0.31 | ) | | | (0.26 | ) |
| | | | | | | | | | | | | | | | | | | | | | | | |
| NET ASSET VALUE, END OF PERIOD | | $ | 13.04 | | | $ | 12.57 | | | $ | 16.16 | | | $ | 16.21 | | | $ | 15.52 | | | $ | 15.33 | |
| | | | | | | | | | | | | | | | | | | | | | | | |
| TOTAL RETURN2 | | | 5.23 | % | | | (19.38 | )% | | | 3.02 | % | | | 7.22 | % | | | 3.29 | % | | | 5.32 | % |
| | | | | | |
| NET ASSETS, END OF PERIOD (IN THOUSANDS) | | $ | 5,731 | | | $ | 6,258 | | | $ | 10,464 | | | $ | 10,376 | | | $ | 8,856 | | | $ | 6,755 | |
| | | | | | |
| RATIO OF EXPENSES TO AVERAGE NET ASSETS | | | 1.32 | %* | | | 1.28 | % | | | 1.24 | % | | | 1.27 | % | | | 1.28 | % | | | 1.33 | % |
| RATIO OF NET EXPENSES TO AVERAGE NET ASSETS | | | 1.28 | %* | | | 1.28 | % | | | 1.24 | % | | | 1.20 | % | | | 1.20 | % | | | 1.20 | % |
| RATIO OF NET INVESTMENT INCOME (LOSS) TO AVERAGE NET ASSETS (EXCLUDING EXPENSES PAID DIRECTLY BY THE ADVISOR) | | | 2.75 | %* | | | 2.60 | % | | | 2.70 | % | | | 2.44 | % | | �� | 1.86 | % | | | 1.66 | % |
| RATIO OF NET INVESTMENT INCOME (LOSS) TO AVERAGE NET ASSETS (INCLUDING EXPENSES PAID DIRECTLY BY THE ADVISOR) | | | 2.79 | %* | | | 2.60 | % | | | 2.70 | % | | | 2.51 | % | | | 1.94 | % | | | 1.79 | % |
| PORTFOLIO TURNOVER RATE | | | 14.23 | % | | | 20.29 | % | | | 48.68 | % | | | 19.31 | % | | | 11.49 | % | | | 19.76 | % |
1 Per share amounts are based upon average shares outstanding.
2 Total return is for the period indicated and has not been annualized. Total return is calculated assuming a purchase of shares at net asset value per share on the first day and a sale at net asset value per share on the last day of each period reported. Distributions are assumed, for purposes of this calculation, to be reinvested at the net asset value per share on the respective payment dates of each Fund.
* Annualized
| | | | |
| See Notes to Financial Statements | | 161 | | June 30, 2009 |
Financial Highlights
For a share outstanding throughout the periods presented
Accessor Income & Growth Allocation Fund
| | | | | | | | | | | | | | | | | | | | | | | | |
| | | A CLASS SHARES | |
| | | PERIOD ENDED
JUNE 30,
2009 (UNAUDITED) | | | FOR THE YEARS
ENDED DECEMBER 31, | |
| | | | 2008 | | | 2007 | | | 2006 | | | 2005 | | | 2004 | |
| NET ASSET VALUE, BEGINNING OF PERIOD | | $ | 12.60 | | | $ | 16.20 | | | $ | 16.25 | | | $ | 15.56 | | | $ | 15.37 | | | $ | 14.83 | |
Net investment income (loss)1 | | | 0.22 | | | | 0.48 | | | | 0.57 | | | | 0.52 | | | | 0.40 | | | | 0.37 | |
Net realized and unrealized gain (loss) on investments1 | | | 0.47 | | | | (3.48 | ) | | | 0.02 | | | | 0.68 | | | | 0.20 | | | | 0.52 | |
| | | | | | | | | | | | | | | | | | | | | | | | |
Total from investment operations | | | 0.69 | | | | (3.00 | ) | | | 0.59 | | | | 1.20 | | | | 0.60 | | | | 0.89 | |
| | | | | | | | | | | | | | | | | | | | | | | | |
Distributions from net investment income | | | (0.22 | ) | | | (0.51 | ) | | | (0.63 | ) | | | (0.50 | ) | | | (0.40 | ) | | | (0.33 | ) |
Distributions from capital gains | | | — | | | | (0.09 | ) | | | (0.01 | ) | | | (0.01 | ) | | | (0.01 | ) | | | (0.02 | ) |
| | | | | | | | | | | | | | | | | | | | | | | | |
Total distributions | | | (0.22 | ) | | | (0.60 | ) | | | (0.64 | ) | | | (0.51 | ) | | | (0.41 | ) | | | (0.35 | ) |
| | | | | | | | | | | | | | | | | | | | | | | | |
| NET ASSET VALUE, END OF PERIOD | | $ | 13.07 | | | $ | 12.60 | | | $ | 16.20 | | | $ | 16.25 | | | $ | 15.56 | | | $ | 15.37 | |
| | | | | | | | | | | | | | | | | | | | | | | | |
| TOTAL RETURN2,3 | | | 5.56 | % | | | (18.86 | )% | | | 3.61 | % | | | 7.96 | % | | | 3.94 | % | | | 6.05 | % |
| | | | | | |
| NET ASSETS, END OF PERIOD (IN THOUSANDS) | | $ | 3,077 | | | $ | 2,590 | | | $ | 3,233 | | | $ | 1,787 | | | $ | 3,437 | | | $ | 2,332 | |
| | | | | | |
| RATIO OF EXPENSES TO AVERAGE NET ASSETS | | | 0.67 | %* | | | 0.63 | % | | | 0.59 | % | | | 0.59 | % | | | 0.63 | % | | | 0.68 | % |
| RATIO OF NET EXPENSES TO AVERAGE NET ASSETS | | | 0.63 | %* | | | 0.63 | % | | | 0.59 | % | | | 0.55 | % | | | 0.55 | % | | | 0.55 | % |
| RATIO OF NET INVESTMENT INCOME (LOSS) TO AVERAGE NET ASSETS (EXCLUDING EXPENSES PAID DIRECTLY BY THE ADVISOR) | | | 3.44 | %* | | | 3.28 | % | | | 3.42 | % | | | 3.14 | % | | | 2.54 | % | | | 2.23 | % |
| RATIO OF NET INVESTMENT INCOME (LOSS) TO AVERAGE NET ASSETS (INCLUDING EXPENSES PAID DIRECTLY BY THE ADVISOR) | | | 3.48 | %* | | | 3.28 | % | | | 3.42 | % | | | 3.18 | % | | | 2.62 | % | | | 2.36 | % |
| PORTFOLIO TURNOVER RATE | | | 14.23 | % | | | 20.29 | % | | | 48.68 | % | | | 19.31 | % | | | 11.49 | % | | | 19.76 | % |
1 Per share amounts are based upon average shares outstanding.
2 Total return is for the period indicated and has not been annualized. Total return is calculated assuming a purchase of shares at net asset value per share on the first day and a sale at net asset value per share on the last day of each period reported. Distributions are assumed, for purposes of this calculation, to be reinvested at the net asset value per share on the respective payment dates of each Fund.
3 A Class total return does not include the one-time front-end sales charge.
* Annualized
| | | | |
| June 30, 2009 | | 162 | | See Notes to Financial Statements |
Financial Highlights
For a share outstanding throughout the periods presented
Accessor Balanced Allocation Fund
| | | | | | | | | | | | | | | | | | | | | | | | |
| | | INSTITUTIONAL CLASS SHARES | |
| | | PERIOD ENDED
JUNE 30,
2009 (UNAUDITED) | | | FOR THE YEARS
ENDED DECEMBER 31, | |
| | | | 2008 | | | 2007 | | | 2006 | | | 2005 | | | 2004 | |
| NET ASSET VALUE, BEGINNING OF PERIOD | | $ | 12.48 | | | $ | 17.29 | | | $ | 17.14 | | | $ | 15.89 | | | $ | 15.38 | | | $ | 14.40 | |
Net investment income (loss)1 | | | 0.19 | | | | 0.42 | | | | 0.49 | | | | 0.45 | | | | 0.36 | | | | 0.31 | |
Net realized and unrealized gain (loss) on investments1 | | | 0.46 | | | | (4.62 | ) | | | 0.29 | | | | 1.24 | | | | 0.51 | | | | 0.96 | |
| | | | | | | | | | | | | | | | | | | | | | | | |
Total from investment operations | | | 0.65 | | | | (4.20 | ) | | | 0.78 | | | | 1.69 | | | | 0.87 | | | | 1.27 | |
| | | | | | | | | | | | | | | | | | | | | | | | |
Distributions from net investment income | | | (0.19 | ) | | | (0.47 | ) | | | (0.63 | ) | | | (0.44 | ) | | | (0.36 | ) | | | (0.29 | ) |
Distributions from capital gains | | | — | | | | (0.14 | ) | | | — | | | | (0.00 | )3 | | | — | | | | 0.00 | 4 |
| | | | | | | | | | | | | | | | | | | | | | | | |
Total distributions | | | (0.19 | ) | | | (0.61 | ) | | | (0.63 | ) | | | (0.44 | ) | | | (0.36 | ) | | | (0.29 | ) |
| | | | | | | | | | | | | | | | | | | | | | | | |
| NET ASSET VALUE, END OF PERIOD | | $ | 12.94 | | | $ | 12.48 | | | $ | 17.29 | | | $ | 17.14 | | | $ | 15.89 | | | $ | 15.38 | |
| | | | | | | | | | | | | | | | | | | | | | | | |
| TOTAL RETURN2 | | | 5.28 | % | | | (24.73 | )% | | | 4.57 | % | | | 10.81 | % | | | 5.72 | % | | | 9.00 | % |
| | | | | | |
| NET ASSETS, END OF PERIOD (IN THOUSANDS) | | $ | 67,538 | | | $ | 52,881 | | | $ | 63,372 | | | $ | 53,958 | | | $ | 35,693 | | | $ | 27,584 | |
| | | | | | |
| RATIO OF EXPENSES TO AVERAGE NET ASSETS | | | 0.23 | %* | | | 0.20 | % | | | 0.18 | % | | | 0.23 | % | | | 0.22 | % | | | 0.26 | % |
| RATIO OF NET EXPENSES TO AVERAGE NET ASSETS | | | 0.18 | %* | | | 0.20 | % | | | 0.18 | % | | | 0.20 | % | | | 0.20 | % | | | 0.20 | % |
| RATIO OF NET INVESTMENT INCOME (LOSS) TO AVERAGE NET ASSETS (EXCLUDING EXPENSES PAID DIRECTLY BY THE ADVISOR) | | | 3.05 | %* | | | 2.79 | % | | | 2.79 | % | | | 2.70 | % | | | 2.29 | % | | | 2.04 | % |
| RATIO OF NET INVESTMENT INCOME (LOSS) TO AVERAGE NET ASSETS (INCLUDING EXPENSES PAID DIRECTLY BY THE ADVISOR) | | | 3.09 | %* | | | 2.79 | % | | | 2.79 | % | | | 2.73 | % | | | 2.31 | % | | | 2.11 | % |
| PORTFOLIO TURNOVER RATE | | | 13.79 | % | | | 26.31 | % | | | 23.56 | % | | | 13.27 | % | | | 3.20 | % | | | 20.59 | % |
1 Per share amounts are based upon average shares outstanding.
2 Total return is for the period indicated and has not been annualized. Total return is calculated assuming a purchase of shares at net asset value per share on the first day and a sale at net asset value per share on the last day of each period reported. Distributions are assumed, for purposes of this calculation, to be reinvested at the net asset value per share on the respective payment dates of each Fund.
3 Less than ($0.005) per share
* Annualized
| | | | |
| See Notes to Financial Statements | | 163 | | June 30, 2009 |
Financial Highlights
For a share outstanding throughout the periods presented
Accessor Balanced Allocation Fund
| | | | | | | | | | | | | | | | | | | | | | | | |
| | | INVESTOR CLASS SHARES | |
| | | PERIOD ENDED
JUNE 30,
2009 (UNAUDITED) | | | FOR THE YEARS
ENDED DECEMBER 31, | |
| | | | 2008 | | | 2007 | | | 2006 | | | 2005 | | | 2004 | |
| NET ASSET VALUE, BEGINNING OF PERIOD | | $ | 12.47 | | | $ | 17.28 | | | $ | 17.13 | | | $ | 15.88 | | | $ | 15.38 | | | $ | 14.39 | |
Net investment income (loss)1 | | | 0.15 | | | | 0.34 | | | | 0.40 | | | | 0.36 | | | | 0.29 | | | | 0.23 | |
Net realized and unrealized gain (loss) on investments1 | | | 0.47 | | | | (4.61 | ) | | | 0.29 | | | | 1.25 | | | | 0.49 | | | | 0.98 | |
| | | | | | | | | | | | | | | | | | | | | | | | |
Total from investment operations | | | 0.62 | | | | (4.27 | ) | | | 0.69 | | | | 1.61 | | | | 0.78 | | | | 1.21 | |
| | | | | | | | | | | | | | | | | | | | | | | | |
Distributions from net investment income | | | (0.16 | ) | | | (0.40 | ) | | | (0.54 | ) | | | (0.36 | ) | | | (0.28 | ) | | | (0.22 | ) |
Distributions from capital gains | | | — | | | | (0.14 | ) | | | — | | | | (0.00 | )3 | | | — | | | | 0.00 | 3 |
| | | | | | | | | | | | | | | | | | | | | | | | |
Total distributions | | | (0.16 | ) | | | (0.54 | ) | | | (0.54 | ) | | | (0.36 | ) | | | (0.28 | ) | | | (0.22 | ) |
| | | | | | | | | | | | | | | | | | | | | | | | |
| NET ASSET VALUE, END OF PERIOD | | $ | 12.93 | | | $ | 12.47 | | | $ | 17.28 | | | $ | 17.13 | | | $ | 15.88 | | | $ | 15.38 | |
| | | | | | | | | | | | | | | | | | | | | | | | |
| TOTAL RETURN2 | �� | | 5.03 | % | | | (25.12 | )% | | | 4.06 | % | | | 10.29 | % | | | 5.24 | % | | | 8.49 | % |
| | | | | | |
| NET ASSETS, END OF PERIOD (IN THOUSANDS) | | $ | 9,449 | | | $ | 10,243 | | | $ | 15,219 | | | $ | 12,970 | | | $ | 12,161 | | | $ | 7,219 | |
| | | | | | |
| RATIO OF EXPENSES TO AVERAGE NET ASSETS | | | 0.73 | %* | | | 0.70 | % | | | 0.68 | % | | | 0.71 | % | | | 0.69 | % | | | 0.75 | % |
| RATIO OF NET EXPENSES TO AVERAGE NET ASSETS | | | 0.69 | %* | | | 0.70 | % | | | 0.68 | % | | | 0.69 | % | | | 0.67 | % | | | 0.69 | % |
| RATIO OF NET INVESTMENT INCOME (LOSS) TO AVERAGE NET ASSETS (EXCLUDING EXPENSES PAID DIRECTLY BY THE ADVISOR) | | | 2.53 | %* | | | 2.24 | % | | | 2.29 | % | | | 2.18 | % | | | 1.82 | % | | | 1.53 | % |
| RATIO OF NET INVESTMENT INCOME (LOSS) TO AVERAGE NET ASSETS (INCLUDING EXPENSES PAID DIRECTLY BY THE ADVISOR) | | | 2.56 | %* | | | 2.24 | % | | | 2.29 | % | | | 2.20 | % | | | 1.84 | % | | | 1.59 | % |
| PORTFOLIO TURNOVER RATE | | | 13.79 | % | | | 26.31 | % | | | 23.56 | % | | | 13.27 | % | | | 3.20 | % | | | 20.59 | % |
1 Per share amounts are based upon average shares outstanding.
2 Total return is for the period indicated and has not been annualized. Total return is calculated assuming a purchase of shares at net asset value per share on the first day and a sale at net asset value per share on the last day of each period reported. Distributions are assumed, for purposes of this calculation, to be reinvested at the net asset value per share on the respective payment dates of each Fund.
3 Less than ($0.005) per share
* Annualized
| | | | |
| June 30, 2009 | | 164 | | See Notes to Financial Statements |
Financial Highlights
For a share outstanding throughout the periods presented
Accessor Balanced Allocation Fund
| | | | | | | | | | | | | | | | | | | | | | | | |
| | | C CLASS SHARES | |
| | | PERIOD ENDED
JUNE 30,
2009 (UNAUDITED) | | | FOR THE YEARS
ENDED DECEMBER 31, | |
| | | | 2008 | | | 2007 | | | 2006 | | | 2005 | | | 2004 | |
| NET ASSET VALUE, BEGINNING OF PERIOD | | $ | 12.45 | | | $ | 17.25 | | | $ | 17.11 | | | $ | 15.86 | | | $ | 15.36 | | | $ | 14.38 | |
Net investment income (loss)1 | | | 0.12 | | | | 0.26 | | | | 0.31 | | | | 0.28 | | | | 0.20 | | | | 0.17 | |
Net realized and unrealized gain (loss) on investments1 | | | 0.47 | | | | (4.60 | ) | | | 0.29 | | | | 1.25 | | | | 0.51 | | | | 0.97 | |
| | | | | | | | | | | | | | | | | | | | | | | | |
Total from investment operations | | | 0.59 | | | | (4.34 | ) | | | 0.60 | | | | 1.53 | | | | 0.71 | | | | 1.14 | |
| | | | | | | | | | | | | | | | | | | | | | | | |
Distributions from net investment income | | | (0.13 | ) | | | (0.32 | ) | | | (0.46 | ) | | | (0.28 | ) | | | (0.21 | ) | | | (0.16 | ) |
Distributions from capital gains | | | — | | | | (0.14 | ) | | | — | | | | (0.00 | )3 | | | — | | | | (0.00 | )3 |
| | | | | | | | | | | | | | | | | | | | | | | | |
Total distributions | | | (0.13 | ) | | | (0.46 | ) | | | (0.46 | ) | | | (0.28 | ) | | | (0.21 | ) | | | (0.16 | ) |
| | | | | | | | | | | | | | | | | | | | | | | | |
| NET ASSET VALUE, END OF PERIOD | | $ | 12.91 | | | $ | 12.45 | | | $ | 17.25 | | | $ | 17.11 | | | $ | 15.86 | | | $ | 15.36 | |
| | | | | | | | | | | | | | | | | | | | | | | | |
| TOTAL RETURN2 | | | 4.77 | % | | | (25.49 | )% | | | 3.49 | % | | | 9.75 | % | | | 4.64 | % | | | 8.01 | % |
| | | | | | |
| NET ASSETS, END OF PERIOD (IN THOUSANDS) | | $ | 11,700 | | | $ | 12,770 | | | $ | 21,040 | | | $ | 21,272 | | | $ | 16,448 | | | $ | 11,900 | |
| | | | | | |
| RATIO OF EXPENSES TO AVERAGE NET ASSETS | | | 1.23 | %* | | | 1.20 | % | | | 1.18 | % | | | 1.22 | % | | | 1.22 | % | | | 1.26 | % |
| RATIO OF NET EXPENSES TO AVERAGE NET ASSETS | | | 1.19 | %* | | | 1.20 | % | | | 1.18 | % | | | 1.20 | % | | | 1.20 | % | | | 1.20 | % |
| RATIO OF NET INVESTMENT INCOME (LOSS) TO AVERAGE NET ASSETS (EXCLUDING EXPENSES PAID DIRECTLY BY THE ADVISOR) | | | 1.99 | %* | | | 1.72 | % | | | 1.77 | % | | | 1.69 | % | | | 1.28 | % | | | 1.14 | % |
| RATIO OF NET INVESTMENT INCOME (LOSS) TO AVERAGE NET ASSETS (INCLUDING EXPENSES PAID DIRECTLY BY THE ADVISOR) | | | 2.03 | %* | | | 1.72 | % | | | 1.77 | % | | | 1.71 | % | | | 1.30 | % | | | 1.20 | % |
| PORTFOLIO TURNOVER RATE | | | 13.79 | % | | | 26.31 | % | | | 23.56 | % | | | 13.27 | % | | | 3.20 | % | | | 20.59 | % |
1 Per share amounts are based upon average shares outstanding.
2 Total return is for the period indicated and has not been annualized. Total return is calculated assuming a purchase of shares at net asset value per share on the first day and a sale at net asset value per share on the last day of each period reported. Distributions are assumed, for purposes of this calculation, to be reinvested at the net asset value per share on the respective payment dates of each Fund.
3 Less than ($0.005) per share
* Annualized
| | | | |
| See Notes to Financial Statements | | 165 | | June 30, 2009 |
Financial Highlights
For a share outstanding throughout the periods presented
Accessor Balanced Allocation Fund
| | | | | | | | | | | | | | | | | | | | | | | | |
| | | A CLASS SHARES | |
| | | PERIOD ENDED
JUNE 30,
2009 (UNAUDITED) | | | FOR THE YEARS
ENDED DECEMBER 31, | |
| | | | 2008 | | | 2007 | | | 2006 | | | 2005 | | | 2004 | |
| NET ASSET VALUE, BEGINNING OF PERIOD | | $ | 12.46 | | | $ | 17.27 | | | $ | 17.13 | | | $ | 15.88 | | | $ | 15.37 | | | $ | 14.39 | |
Net investment income (loss)1 | | | 0.16 | | | | 0.36 | | | | 0.45 | | | | 0.39 | | | | 0.30 | | | | 0.29 | |
Net realized and unrealized gain (loss) on investments1 | | | 0.48 | | | | (4.61 | ) | | | 0.26 | | | | 1.25 | | | | 0.51 | | | | 0.94 | |
| | | | | | | | | | | | | | | | | | | | | | | | |
Total from investment operations | | | 0.64 | | | | (4.25 | ) | | | 0.71 | | | | 1.64 | | | | 0.81 | | | | 1.23 | |
| | | | | | | | | | | | | | | | | | | | | | | | |
Distributions from net investment income | | | (0.17 | ) | | | (0.42 | ) | | | (0.57 | ) | | | (0.39 | ) | | | (0.30 | ) | | | (0.25 | ) |
Distributions from capital gains | | | — | | | | (0.14 | ) | | | — | | | | (0.00 | )4 | | | — | | | | (0.00 | )4 |
| | | | | | | | | | | | | | | | | | | | | | | | |
Total distributions | | | (0.17 | ) | | | (0.56 | ) | | | (0.57 | ) | | | (0.39 | ) | | | (0.30 | ) | | | (0.25 | ) |
| | | | | | | | | | | | | | | | | | | | | | | | |
| NET ASSET VALUE, END OF PERIOD | | $ | 12.93 | | | $ | 12.46 | | | $ | 17.27 | | | $ | 17.13 | | | $ | 15.88 | | | $ | 15.37 | |
| | | | | | | | | | | | | | | | | | | | | | | | |
| TOTAL RETURN2,3 | | | 5.19 | % | | | (25.02 | )% | | | 4.16 | % | | | 10.45 | % | | | 5.37 | % | | | 8.69 | % |
| | | | | | |
| NET ASSETS, END OF PERIOD (IN THOUSANDS) | | $ | 19,774 | | | $ | 19,506 | | | $ | 29,735 | | | $ | 10,820 | | | $ | 6,450 | | | $ | 4,416 | |
| | | | | | |
| RATIO OF EXPENSES TO AVERAGE NET ASSETS | | | 0.58 | %* | | | 0.55 | % | | | 0.54 | % | | | 0.58 | % | | | 0.57 | % | | | 0.61 | % |
| RATIO OF NET EXPENSES TO AVERAGE NET ASSETS | | | 0.54 | %* | | | 0.55 | % | | | 0.54 | % | | | 0.55 | % | | | 0.55 | % | | | 0.55 | % |
| RATIO OF NET INVESTMENT INCOME (LOSS) TO AVERAGE NET ASSETS (EXCLUDING EXPENSES PAID DIRECTLY BY THE ADVISOR) | | | 2.66 | %* | | | 2.40 | % | | | 2.57 | % | | | 2.38 | % | | | 1.95 | % | | | 1.95 | % |
| RATIO OF NET INVESTMENT INCOME (LOSS) TO AVERAGE NET ASSETS (INCLUDING EXPENSES PAID DIRECTLY BY THE ADVISOR) | | | 2.70 | %* | | | 2.40 | % | | | 2.57 | % | | | 2.41 | % | | | 1.97 | % | | | 2.01 | % |
| PORTFOLIO TURNOVER RATE | | | 13.79 | % | | | 26.31 | % | | | 23.56 | % | | | 13.27 | % | | | 3.20 | % | | | 20.59 | % |
1 Per share amounts are based upon average shares outstanding.
2 Total return is for the period indicated and has not been annualized. Total return is calculated assuming a purchase of shares at net asset value per share on the first day and a sale at net asset value per share on the last day of each period reported. Distributions are assumed, for purposes of this calculation, to be reinvested at the net asset value per share on the respective payment dates of each Fund.
3 A Class total return does not include the one-time front-end sales charge.
4 Less than ($0.005) per share
* Annualized
| | | | |
| June 30, 2009 | | 166 | | See Notes to Financial Statements |
Financial Highlights
For a share outstanding throughout the periods presented
Accessor Growth & Income Allocation Fund
| | | | | | | | | | | | | | | | | | | | | | | | |
| | | INSTITUTIONAL CLASS SHARES | |
| | | PERIOD ENDED
JUNE 30,
2009 (UNAUDITED) | | | FOR THE YEARS
ENDED DECEMBER 31, | |
| | | | 2008 | | | 2007 | | | 2006 | | | 2005 | | | 2004 | |
| NET ASSET VALUE, BEGINNING OF PERIOD | | $ | 11.97 | | | $ | 17.72 | | | $ | 17.49 | | | $ | 15.97 | | | $ | 15.32 | | | $ | 14.15 | |
Net investment income (loss)1 | | | 0.15 | | | | 0.35 | | | | 0.42 | | | | 0.38 | | | | 0.31 | | | | 0.27 | |
Net realized and unrealized gain (loss) on investments1 | | | 0.47 | | | | (5.41 | ) | | | 0.39 | | | | 1.51 | | | | 0.65 | | | | 1.17 | |
| | | | | | | | | | | | | | | | | | | | | | | | |
Total from investment operations | | | 0.62 | | | | (5.06 | ) | | | 0.81 | | | | 1.89 | | | | 0.96 | | | | 1.44 | |
| | | | | | | | | | | | | | | | | | | | | | | | |
Distributions from net investment income | | | (0.16 | ) | | | (0.43 | ) | | | (0.58 | ) | | | (0.37 | ) | | �� | (0.30 | ) | | | (0.25 | ) |
Distributions from capital gains | | | — | | | | (0.26 | ) | | | — | | | | (0.00 | )3 | | | (0.01 | ) | | | (0.02 | ) |
| | | | | | | | | | | | | | | | | | | | | | | | |
Total distributions | | | (0.16 | ) | | | (0.69 | ) | | | (0.58 | ) | | | (0.37 | ) | | | (0.31 | ) | | | (0.27 | ) |
| | | | | | | | | | | | | | | | | | | | | | | | |
| NET ASSET VALUE, END OF PERIOD | | $ | 12.43 | | | $ | 11.97 | | | $ | 17.72 | | | $ | 17.49 | | | $ | 15.97 | | | $ | 15.32 | |
| | | | | | | | | | | | | | | | | | | | | | | | |
| TOTAL RETURN2 | | | 5.23 | % | | | (29.16 | )% | | | 4.66 | % | | | 11.96 | % | | | 6.43 | % | | | 10.21 | % |
| | | | | | |
| NET ASSETS, END OF PERIOD (IN THOUSANDS) | | $ | 43,200 | | | $ | 40,382 | | | $ | 67,402 | | | $ | 54,430 | | | $ | 45,890 | | | $ | 34,118 | |
| | | | | | |
| RATIO OF EXPENSES TO AVERAGE NET ASSETS | | | 0.25 | %* | | | 0.20 | % | | | 0.18 | % | | | 0.22 | % | | | 0.20 | % | | | 0.25 | % |
| RATIO OF NET EXPENSES TO AVERAGE NET ASSETS | | | 0.19 | %* | | | 0.20 | % | | | 0.18 | % | | | 0.20 | % | | | 0.20 | % | | | 0.20 | % |
| RATIO OF NET INVESTMENT INCOME (LOSS) TO AVERAGE NET ASSETS (EXCLUDING EXPENSES PAID DIRECTLY BY THE ADVISOR) | | | 2.61 | %* | | | 2.28 | % | | | 2.31 | % | | | 2.23 | % | | | 2.03 | % | | | 1.82 | % |
| RATIO OF NET INVESTMENT INCOME (LOSS) TO AVERAGE NET ASSETS (INCLUDING EXPENSES PAID DIRECTLY BY THE ADVISOR) | | | 2.66 | %* | | | 2.28 | % | | | 2.31 | % | | | 2.25 | % | | | 2.03 | % | | | 1.88 | % |
| PORTFOLIO TURNOVER RATE | | | 13.61 | % | | | 35.22 | % | | | 18.45 | % | | | 14.32 | % | | | 1.95 | % | | | 12.74 | % |
1 Per share amounts are based upon average shares outstanding.
2 Total return is for the period indicated and has not been annualized. Total return is calculated assuming a purchase of shares at net asset value per share on the first day and a sale at net asset value per share on the last day of each period reported. Distributions are assumed, for purposes of this calculation, to be reinvested at the net asset value per share on the respective payment dates of each Fund.
3 Less than ($0.005) per share
* Annualized
| | | | |
| See Notes to Financial Statements | | 167 | | June 30, 2009 |
Financial Highlights
For a share outstanding throughout the periods presented
Accessor Growth & Income Allocation Fund
| | | | | | | | | | | | | | | | | | | | | | | | |
| | | INVESTOR CLASS SHARES | |
| | | PERIOD ENDED
JUNE 30,
2009 (UNAUDITED) | | | FOR THE YEARS
ENDED DECEMBER 31, | |
| | | | 2008 | | | 2007 | | | 2006 | | | 2005 | | | 2004 | |
| NET ASSET VALUE, BEGINNING OF PERIOD | | $ | 11.95 | | | $ | 17.70 | | | $ | 17.47 | | | $ | 15.96 | | | $ | 15.31 | | | $ | 14.14 | |
Net investment income (loss)1 | | | 0.12 | | | | 0.27 | | | | 0.33 | | | | 0.27 | | | | 0.24 | | | | 0.19 | |
Net realized and unrealized gain (loss) on investments1 | | | 0.47 | | | | (5.41 | ) | | | 0.40 | | | | 1.53 | | | | 0.66 | | | | 1.19 | |
| | | | | | | | | | | | | | | | | | | | | | | | |
Total from investment operations | | | 0.59 | | | | (5.14 | ) | | | 0.73 | | | | 1.80 | | | | 0.90 | | | | 1.38 | |
| | | | | | | | | | | | | | | | | | | | | | | | |
Distributions from net investment income | | | (0.13 | ) | | | (0.35 | ) | | | (0.50 | ) | | | (0.29 | ) | | | (0.24 | ) | | | (0.19 | ) |
Distributions from capital gains | | | — | | | | (0.26 | ) | | | — | | | | (0.00 | )3 | | | (0.01 | ) | | | (0.02 | ) |
| | | | | | | | | | | | | | | | | | | | | | | | |
Total distributions | | | (0.13 | ) | | | (0.61 | ) | | | (0.50 | ) | | | (0.29 | ) | | | (0.25 | ) | | | (0.21 | ) |
| | | | | | | | | | | | | | | | | | | | | | | | |
| NET ASSET VALUE, END OF PERIOD | | $ | 12.41 | | | $ | 11.95 | | | $ | 17.70 | | | $ | 17.47 | | | $ | 15.96 | | | $ | 15.31 | |
| | | | | | | | | | | | | | | | | | | | | | | | |
| TOTAL RETURN2 | | | 4.98 | % | | | (29.56 | )% | | | 4.16 | % | | | 11.40 | % | | | 5.91 | % | | | 9.79 | % |
| | | | | | |
| NET ASSETS, END OF PERIOD (IN THOUSANDS) | | $ | 11,477 | | | $ | 11,049 | | | $ | 16,134 | | | $ | 11,166 | | | $ | 7,546 | | | $ | 6,361 | |
| | | | | | |
| RATIO OF EXPENSES TO AVERAGE NET ASSETS | | | 0.75 | %* | | | 0.70 | % | | | 0.68 | % | | | 0.69 | % | | | 0.63 | % | | | 0.74 | % |
| RATIO OF NET EXPENSES TO AVERAGE NET ASSETS | | | 0.70 | %* | | | 0.70 | % | | | 0.68 | % | | | 0.67 | % | | | 0.63 | % | | | 0.68 | % |
| RATIO OF NET INVESTMENT INCOME (LOSS) TO AVERAGE NET ASSETS (EXCLUDING EXPENSES PAID DIRECTLY BY THE ADVISOR) | | | 2.11 | %* | | | 1.81 | % | | | 1.83 | % | | | 1.78 | % | | | 1.57 | % | | | 1.38 | % |
| RATIO OF NET INVESTMENT INCOME (LOSS) TO AVERAGE NET ASSETS (INCLUDING EXPENSES PAID DIRECTLY BY THE ADVISOR) | | | 2.16 | %* | | | 1.81 | % | | | 1.83 | % | | | 1.80 | % | | | 1.57 | % | | | 1.43 | % |
| PORTFOLIO TURNOVER RATE | | | 13.61 | % | | | 35.22 | % | | | 18.45 | % | | | 14.32 | % | | | 1.95 | % | | | 12.74 | % |
1 Per share amounts are based upon average shares outstanding.
2 Total return is for the period indicated and has not been annualized. Total return is calculated assuming a purchase of shares at net asset value per share on the first day and a sale at net asset value per share on the last day of each period reported. Distributions are assumed, for purposes of this calculation, to be reinvested at the net asset value per share on the respective payment dates of each Fund.
3 Less than ($0.005) per share
* Annualized
| | | | |
| June 30, 2009 | | 168 | | See Notes to Financial Statements |
Financial Highlights
For a share outstanding throughout the periods presented
Accessor Growth & Income Allocation Fund
| | | | | | | | | | | | | | | | | | | | | | | | |
| | | C CLASS SHARES | |
| | | PERIOD ENDED
JUNE 30,
2009 (UNAUDITED) | | | FOR THE YEARS
ENDED DECEMBER 31, | |
| | | | 2008 | | | 2007 | | | 2006 | | | 2005 | | | 2004 | |
| NET ASSET VALUE, BEGINNING OF PERIOD | | $ | 11.91 | | | $ | 17.64 | | | $ | 17.42 | | | $ | 15.91 | | | $ | 15.27 | | | $ | 14.13 | |
Net investment income (loss)1 | | | 0.09 | | | | 0.20 | | | | 0.23 | | | | 0.22 | | | | 0.16 | | | | 0.14 | |
Net realized and unrealized gain (loss) on investments1 | | | 0.47 | | | | (5.40 | ) | | | 0.40 | | | | 1.50 | | | | 0.65 | | | | 1.15 | |
| | | | | | | | | | | | | | | | | | | | | | | | |
Total from investment operations | | | 0.56 | | | | (5.20 | ) | | | 0.63 | | | | 1.72 | | | | 0.81 | | | | 1.29 | |
| | | | | | | | | | | | | | | | | | | | | | | | |
Distributions from net investment income | | | (0.10 | ) | | | (0.27 | ) | | | (0.41 | ) | | | (0.21 | ) | | | (0.16 | ) | | | (0.13 | ) |
Distributions from capital gains | | | — | | | | (0.26 | ) | | | — | | | | (0.00 | )4 | | | (0.01 | ) | | | (0.02 | ) |
| | | | | | | | | | | | | | | | | | | | | | | | |
Total distributions | | | (0.10 | ) | | | (0.53 | ) | | | (0.41 | ) | | | (0.21 | ) | | | (0.17 | ) | | | (0.15 | ) |
| | | | | | | | | | | | | | | | | | | | | | | | |
| NET ASSET VALUE, END OF PERIOD | | $ | 12.37 | | | $ | 11.91 | | | $ | 17.64 | | | $ | 17.42 | | | $ | 15.91 | | | $ | 15.27 | |
| | | | | | | | | | | | | | | | | | | | | | | | |
| TOTAL RETURN2 | | | 4.65 | % | | | (29.86 | )% | | | 3.60 | % | | | 10.88 | % | | | 5.32 | % | | | 9.12 | % |
| | | | | | |
| NET ASSETS, END OF PERIOD (IN THOUSANDS) | | $ | 30,612 | | | $ | 31,953 | | | $ | 55,880 | | | $ | 48,233 | | | $ | 37,020 | | | $ | 23,072 | |
| | | | | | |
| RATIO OF EXPENSES TO AVERAGE NET ASSETS | | | 1.24 | %* | | | 1.20 | % | | | 1.18 | % | | | 1.22 | % | | | 1.20 | % | | | 1.25 | % |
| RATIO OF NET EXPENSES TO AVERAGE NET ASSETS | | | 1.20 | %* | | | 1.20 | % | | | 1.18 | % | | | 1.20 | % | | | 1.20 | % | | | 1.20 | % |
| RATIO OF NET INVESTMENT INCOME (LOSS) TO AVERAGE NET ASSETS (EXCLUDING EXPENSES PAID DIRECTLY BY THE ADVISOR) | | | 1.59 | %* | | | 1.29 | % | | | 1.30 | % | | | 1.24 | % | | | 1.03 | % | | | 0.92 | % |
| RATIO OF NET INVESTMENT INCOME (LOSS) TO AVERAGE NET ASSETS (INCLUDING EXPENSES PAID DIRECTLY BY THE ADVISOR) | | | 1.64 | %* | | | 1.29 | % | | | 1.30 | % | | | 1.26 | % | | | 1.03 | % | | | 0.97 | % |
| PORTFOLIO TURNOVER RATE | | | 13.61 | % | | | 35.22 | % | | | 18.45 | % | | | 14.32 | % | | | 1.95 | % | | | 12.74 | % |
1 Per share amounts are based upon average shares outstanding.
2 Total return is for the period indicated and has not been annualized. Total return is calculated assuming a purchase of shares at net asset value per share on the first day and a sale at net asset value per share on the last day of each period reported. Distributions are assumed, for purposes of this calculation, to be reinvested at the net asset value per share on the respective payment dates of each Fund.
3 Less than ($0.005) per share
* Annualized
| | | | |
| See Notes to Financial Statements | | 169 | | June 30, 2009 |
Financial Highlights
For a share outstanding throughout the periods presented
Accessor Growth & Income Allocation Fund
| | | | | | | | | | | | | | | | | | | | | | | | |
| | | A CLASS SHARES | |
| | | PERIOD ENDED
JUNE 30,
2009 (UNAUDITED) | | | FOR THE YEARS
ENDED DECEMBER 31, | |
| | | | 2008 | | | 2007 | | | 2006 | | | 2005 | | | 2004 | |
| NET ASSET VALUE, BEGINNING OF PERIOD | | $ | 11.93 | | | $ | 17.67 | | | $ | 17.44 | | | $ | 15.93 | | | $ | 15.29 | | | $ | 14.13 | |
Net investment income (loss)1 | | | 0.13 | | | | 0.30 | | | | 0.36 | | | | 0.34 | | | | 0.26 | | | | 0.25 | |
Net realized and unrealized gain (loss) on investments1 | | | 0.47 | | | | (5.41 | ) | | | 0.39 | | | | 1.48 | | | | 0.65 | | | | 1.14 | |
| | | | | | | | | | | | | | | | | | | | | | | | |
Total from investment operations | | | 0.60 | | | | (5.11 | ) | | | 0.75 | | | | 1.82 | | | | 0.91 | | | | 1.39 | |
| | | | | | | | | | | | | | | | | | | | | | | | |
Distributions from net investment income | | | (0.14 | ) | | | (0.37 | ) | | | (0.52 | ) | | | (0.31 | ) | | | (0.26 | ) | | | (0.21 | ) |
Distributions from capital gains | | | — | | | | (0.26 | ) | | | — | | | | (0.00 | )4 | | | (0.01 | ) | | | (0.02 | ) |
| | | | | | | | | | | | | | | | | | | | | | | | |
Total distributions | | | (0.14 | ) | | | (0.63 | ) | | | (0.52 | ) | | | (0.31 | ) | | | (0.27 | ) | | | (0.23 | ) |
| | | | | | | | | | | | | | | | | | | | | | | | |
| NET ASSET VALUE, END OF PERIOD | | $ | 12.39 | | | $ | 11.93 | | | $ | 17.67 | | | $ | 17.44 | | | $ | 15.93 | | | $ | 15.29 | |
| | | | | | | | | | | | | | | | | | | | | | | | |
| TOTAL RETURN2,3 | | | 5.06 | % | | | (29.44 | )% | | | 4.32 | % | | | 11.56 | % | | | 5.97 | % | | | 9.93 | % |
| | | | | | |
| NET ASSETS, END OF PERIOD (IN THOUSANDS) | | $ | 17,814 | | | $ | 20,190 | | | $ | 30,036 | | | $ | 20,836 | | | $ | 20,121 | | | $ | 10,961 | |
| | | | | | |
| RATIO OF EXPENSES TO AVERAGE NET ASSETS | | | 0.59 | %* | | | 0.55 | % | | | 0.53 | % | | | 0.56 | % | | | 0.55 | % | | | 0.60 | % |
| RATIO OF NET EXPENSES TO AVERAGE NET ASSETS | | | 0.55 | %* | | | 0.55 | % | | | 0.53 | % | | | 0.55 | % | | | 0.55 | % | | | 0.55 | % |
| RATIO OF NET INVESTMENT INCOME (LOSS) TO AVERAGE NET ASSETS (EXCLUDING EXPENSES PAID DIRECTLY BY THE ADVISOR) | | | 2.24 | %* | | | 1.96 | % | | | 1.98 | % | | | 1.92 | % | | | 1.70 | % | | | 1.61 | % |
| RATIO OF NET INVESTMENT INCOME (LOSS) TO AVERAGE NET ASSETS (INCLUDING EXPENSES PAID DIRECTLY BY THE ADVISOR) | | | 2.28 | %* | | | 1.96 | % | | | 1.98 | % | | | 1.93 | % | | | 1.70 | % | | | 1.67 | % |
| PORTFOLIO TURNOVER RATE | | | 13.61 | % | | | 35.22 | % | | | 18.45 | % | | | 14.32 | % | | | 1.95 | % | | | 12.74 | % |
1 Per share amounts are based upon average shares outstanding.
2 Total return is for the period indicated and has not been annualized. Total return is calculated assuming a purchase of shares at net asset value per share on the first day and a sale at net asset value per share on the last day of each period reported. Distributions are assumed, for purposes of this calculation, to be reinvested at the net asset value per share on the respective payment dates of each Fund.
3 A Class total return does not include the one-time front-end sales charge.
4 Less than ($0.005) per share
* Annualized
| | | | |
| June 30, 2009 | | 170 | | See Notes to Financial Statements |
Financial Highlights
For a share outstanding throughout the periods presented
Accessor Growth Allocation Fund
| | | | | | | | | | | | | | | | | | | | | | | | |
| | | INSTITUTIONAL CLASS SHARES | |
| | | PERIOD ENDED
JUNE 30,
2009 (UNAUDITED) | | | FOR THE YEARS
ENDED DECEMBER 31, | |
| | | | 2008 | | | 2007 | | | 2006 | | | 2005 | | | 2004 | |
| NET ASSET VALUE, BEGINNING OF PERIOD | | $ | 11.61 | | | $ | 18.68 | | | $ | 18.21 | | | $ | 16.14 | | | $ | 15.17 | | | $ | 13.62 | |
Net investment income (loss)1 | | | 0.10 | | | | 0.21 | | | | 0.24 | | | | 0.23 | | | | 0.20 | | | | 0.18 | |
Net realized and unrealized gain (loss) on investments1 | | | 0.40 | | | | (6.64 | ) | | | 0.71 | | | | 2.06 | | | | 0.96 | | | | 1.55 | |
| | | | | | | | | | | | | | | | | | | | | | | | |
Total from investment operations | | | 0.50 | | | | (6.43 | ) | | | 0.95 | | | | 2.29 | | | | 1.16 | | | | 1.73 | |
| | | | | | | | | | | | | | | | | | | | | | | | |
Distributions from net investment income | | | (0.10 | ) | | | (0.30 | ) | | | (0.47 | ) | | | (0.22 | ) | | | (0.19 | ) | | | (0.18 | ) |
Distributions from capital gains | | | — | | | | (0.34 | ) | | | (0.01 | ) | | | — | | | | — | | | | — | |
| | | | | | | | | | | | | | | | | | | | | | | | |
Total distributions | | | (0.10 | ) | | | (0.64 | ) | | | (0.48 | ) | | | (0.22 | ) | | | (0.19 | ) | | | (0.18 | ) |
| | | | | | | | | | | | | | | | | | | | | | | | |
| NET ASSET VALUE, END OF PERIOD | | $ | 12.01 | | | $ | 11.61 | | | $ | 18.68 | | | $ | 18.21 | | | $ | 16.14 | | | $ | 15.17 | |
| | | | | | | | | | | | | | | | | | | | | | | | |
| TOTAL RETURN2 | | | 4.35 | % | | | (35.05 | )% | | | 5.19 | % | | | 14.30 | % | | | 7.73 | % | | | 12.75 | % |
| | | | | | |
| NET ASSETS, END OF PERIOD (IN THOUSANDS) | | $ | 42,690 | | | $ | 39,210 | | | $ | 64,364 | | | $ | 51,586 | | | $ | 39,186 | | | $ | 30,623 | |
| | | | | | |
| RATIO OF EXPENSES TO AVERAGE NET ASSETS | | | 0.25 | %* | | | 0.20 | % | | | 0.18 | % | | | 0.22 | % | | | 0.20 | % | | | 0.25 | % |
| RATIO OF NET EXPENSES TO AVERAGE NET ASSETS | | | 0.19 | %* | | | 0.20 | % | | | 0.18 | % | | | 0.20 | % | | | 0.20 | % | | | 0.20 | % |
| RATIO OF NET INVESTMENT INCOME (LOSS) TO AVERAGE NET ASSETS (EXCLUDING EXPENSES PAID DIRECTLY BY THE ADVISOR) | | | 1.72 | %* | | | 1.35 | % | | | 1.24 | % | | | 1.33 | % | | | 1.30 | % | | | 1.24 | % |
| RATIO OF NET INVESTMENT INCOME (LOSS) TO AVERAGE NET ASSETS (INCLUDING EXPENSES PAID DIRECTLY BY THE ADVISOR) | | | 1.78 | %* | | | 1.35 | % | | | 1.24 | % | | | 1.35 | % | | | 1.30 | % | | | 1.30 | % |
| PORTFOLIO TURNOVER RATE | | | 17.40 | % | | | 31.17 | % | | | 7.43 | % | | | 18.90 | % | | | 1.76 | % | | | 15.63 | % |
1 Per share amounts are based upon average shares outstanding.
2 Total return is for the period indicated and has not been annualized. Total return is calculated assuming a purchase of shares at net asset value per share on the first day and a sale at net asset value per share on the last day of each period reported. Distributions are assumed, for purposes of this calculation, to be reinvested at the net asset value per share on the respective payment dates of each Fund.
* Annualized
| | | | |
| See Notes to Financial Statements | | 171 | | June 30, 2009 |
Financial Highlights
For a share outstanding throughout the periods presented
Accessor Growth Allocation Fund
| | | | | | | | | | | | | | | | | | | | | | | | |
| | | INVESTOR CLASS SHARES | |
| | | PERIOD ENDED
JUNE 30,
2009 (UNAUDITED) | | | FOR THE YEARS
ENDED DECEMBER 31, | |
| | | | 2008 | | | 2007 | | | 2006 | | | 2005 | | | 2004 | |
| NET ASSET VALUE, BEGINNING OF PERIOD | | $ | 11.61 | | | $ | 18.66 | | | $ | 18.19 | | | $ | 16.12 | | | $ | 15.17 | | | $ | 13.62 | |
Net investment income (loss)1 | | | 0.07 | | | | 0.13 | | | | 0.14 | | | | 0.15 | | | | 0.13 | | | | 0.11 | |
Net realized and unrealized gain (loss) on investments1 | | | 0.39 | | | | (6.61 | ) | | | 0.72 | | | | 2.06 | | | | 0.94 | | | | 1.55 | |
| | | | | | | | | | | | | | | | | | | | | | | | |
Total from investment operations | | | 0.46 | | | | (6.48 | ) | | | 0.86 | | | | 2.21 | | | | 1.07 | | | | 1.66 | |
| | | | | | | | | | | | | | | | | | | | | | | | |
Distributions from net investment income | | | (0.07 | ) | | | (0.23 | ) | | | (0.38 | ) | | | (0.14 | ) | | | (0.12 | ) | | | (0.11 | ) |
Distributions from capital gains | | | — | | | | (0.34 | ) | | | (0.01 | ) | | | — | | | | — | | | | — | |
| | | | | | | | | | | | | | | | | | | | | | | | |
Total distributions | | | (0.07 | ) | | | (0.57 | ) | | | (0.39 | ) | | | (0.14 | ) | | | (0.12 | ) | | | (0.11 | ) |
| | | | | | | | | | | | | | | | | | | | | | | | |
| NET ASSET VALUE, END OF PERIOD | | $ | 12.00 | | | $ | 11.61 | | | $ | 18.66 | | | $ | 18.19 | | | $ | 16.12 | | | $ | 15.17 | |
| | | | | | | | | | | | | | | | | | | | | | | | |
| TOTAL RETURN2 | | | 4.01 | % | | | (35.60 | )% | | | 4.70 | % | | | 13.77 | % | | | 7.12 | % | | | 12.22 | % |
| | | | | | |
| NET ASSETS, END OF PERIOD (IN THOUSANDS) | | $ | 11,825 | | | $ | 12,597 | | | $ | 18,724 | | | $ | 15,282 | | | $ | 14,422 | | | $ | 9,746 | |
| | | | | | |
| RATIO OF EXPENSES TO AVERAGE NET ASSETS | | | 0.75 | %* | | | 0.70 | % | | | 0.68 | % | | | 0.69 | % | | | 0.67 | % | | | 0.75 | % |
| RATIO OF NET EXPENSES TO AVERAGE NET ASSETS | | | 0.70 | %* | | | 0.70 | % | | | 0.68 | % | | | 0.68 | % | | | 0.67 | % | | | 0.69 | % |
| RATIO OF NET INVESTMENT INCOME (LOSS) TO AVERAGE NET ASSETS (EXCLUDING EXPENSES PAID DIRECTLY BY THE ADVISOR) | | | 1.21 | %* | | | 0.86 | % | | | 0.76 | % | | | 0.83 | % | | | 0.82 | % | | | 0.81 | % |
| RATIO OF NET INVESTMENT INCOME (LOSS) TO AVERAGE NET ASSETS (INCLUDING EXPENSES PAID DIRECTLY BY THE ADVISOR) | | | 1.26 | %* | | | 0.86 | % | | | 0.76 | % | | | 0.82 | % | | | 0.82 | % | | | 0.75 | % |
| PORTFOLIO TURNOVER RATE | | | 17.40 | % | | | 31.17 | % | | | 7.43 | % | | | 18.90 | % | | | 1.76 | % | | | 15.63 | % |
1 Per share amounts are based upon average shares outstanding.
2 Total return is for the period indicated and has not been annualized. Total return is calculated assuming a purchase of shares at net asset value per share on the first day and a sale at net asset value per share on the last day of each period reported. Distributions are assumed, for purposes of this calculation, to be reinvested at the net asset value per share on the respective payment dates of each Fund.
* Annualized
| | | | |
| June 30, 2009 | | 172 | | See Notes to Financial Statements |
Financial Highlights
For a share outstanding throughout the periods presented
Accessor Growth Allocation Fund
| | | | | | | | | | | | | | | | | | | | | | | | |
| | | C CLASS SHARES | |
| | | PERIOD ENDED
JUNE 30,
2009 (UNAUDITED) | | | FOR THE YEARS
ENDED DECEMBER 31, | |
| | | | 2008 | | | 2007 | | | 2006 | | | 2005 | | | 2004 | |
| NET ASSET VALUE, BEGINNING OF PERIOD | | $ | 11.55 | | | $ | 18.57 | | | $ | 18.12 | | | $ | 16.07 | | | $ | 15.12 | | | $ | 13.59 | |
Net investment income (loss)1 | | | 0.04 | | | | 0.05 | | | | 0.05 | | | | 0.06 | | | | 0.05 | | | | 0.06 | |
Net realized and unrealized gain (loss) on investments1 | | | 0.39 | | | | (6.58 | ) | | | 0.71 | | | | 2.05 | | | | 0.95 | | | | 1.52 | |
| | | | | | | | | | | | | | | | | | | | | | | | |
Total from investment operations | | | 0.43 | | | | (6.53 | ) | | | 0.76 | | | | 2.11 | | | | 1.00 | | | | 1.58 | |
| | | | | | | | | | | | | | | | | | | | | | | | |
Distributions from net investment income | | | (0.04 | ) | | | (0.15 | ) | | | (0.30 | ) | | | (0.06 | ) | | | (0.05 | ) | | | (0.05 | ) |
Distributions from capital gains | | | — | | | | (0.34 | ) | | | (0.01 | ) | | | — | | | | — | | | | — | |
| | | | | | | | | | | | | | | | | | | | | | | | |
Total distributions | | | (0.04 | ) | | | (0.49 | ) | | | (0.31 | ) | | | (0.06 | ) | | | (0.05 | ) | | | (0.05 | ) |
| | | | | | | | | | | | | | | | | | | | | | | | |
| NET ASSET VALUE, END OF PERIOD | | $ | 11.94 | | | $ | 11.55 | | | $ | 18.57 | | | $ | 18.12 | | | $ | 16.07 | | | $ | 15.12 | |
| | | | | | | | | | | | | | | | | | | | | | | | |
| TOTAL RETURN2 | | | 3.79 | % | | | (35.66 | )% | | | 4.18 | % | | | 13.15 | % | | | 6.64 | % | | | 11.67 | % |
| | | | | | |
| NET ASSETS, END OF PERIOD (IN THOUSANDS) | | $ | 27,148 | | | $ | 26,814 | | | $ | 45,687 | | | $ | 38,013 | | | $ | 26,399 | | | $ | 15,330 | |
| | | | | | |
| RATIO OF EXPENSES TO AVERAGE NET ASSETS | | | 1.25 | %* | | | 1.20 | % | | | 1.18 | % | | | 1.22 | % | | | 1.19 | % | | | 1.25 | % |
| RATIO OF NET EXPENSES TO AVERAGE NET ASSETS | | | 1.19 | %* | | | 1.20 | % | | | 1.18 | % | | | 1.20 | % | | | 1.19 | % | | | 1.20 | % |
| RATIO OF NET INVESTMENT INCOME (LOSS) TO AVERAGE NET ASSETS (EXCLUDING EXPENSES PAID DIRECTLY BY THE ADVISOR) | | | 0.71 | %* | | | 0.34 | % | | | 0.25 | % | | | 0.34 | % | | | 0.31 | % | | | 0.34 | % |
| RATIO OF NET INVESTMENT INCOME (LOSS) TO AVERAGE NET ASSETS (INCLUDING EXPENSES PAID DIRECTLY BY THE ADVISOR) | | | 0.76 | %* | | | 0.34 | % | | | 0.25 | % | | | 0.36 | % | | | 0.31 | % | | | 0.39 | % |
| PORTFOLIO TURNOVER RATE | | | 17.40 | % | | | 31.17 | % | | | 7.43 | % | | | 18.90 | % | | | 1.76 | % | | | 15.63 | % |
1 Per share amounts are based upon average shares outstanding.
2 Total return is for the period indicated and has not been annualized. Total return is calculated assuming a purchase of shares at net asset value per share on the first day and a sale at net asset value per share on the last day of each period reported. Distributions are assumed, for purposes of this calculation, to be reinvested at the net asset value per share on the respective payment dates of each Fund.
* Annualized
| | | | |
| See Notes to Financial Statements | | 173 | | June 30, 2009 |
Financial Highlights
For a share outstanding throughout the periods presented
Accessor Growth Allocation Fund
| | | | | | | | | | | | | | | | | | | | | | | | |
| | | A CLASS SHARES | |
| | | PERIOD ENDED
JUNE 30,
2009 (UNAUDITED) | | | FOR THE YEARS
ENDED DECEMBER 31, | |
| | | | 2008 | | | 2007 | | | 2006 | | | 2005 | | | 2004 | |
| NET ASSET VALUE, BEGINNING OF PERIOD | | $ | 11.61 | | | $ | 18.67 | | | $ | 18.19 | | | $ | 16.13 | | | $ | 15.17 | | | $ | 13.62 | |
Net investment income (loss)1 | | | 0.08 | | | | 0.15 | | | | 0.18 | | | | 0.16 | | | | 0.15 | | | | 0.15 | |
Net realized and unrealized gain (loss) on investments1 | | | 0.39 | | | | (6.62 | ) | | | 0.72 | | | | 2.06 | | | | 0.95 | | | | 1.53 | |
| | | | | | | | | | | | | | | | | | | | | | | | |
Total from investment operations | | | 0.47 | | | | (6.47 | ) | | | 0.90 | | | | 2.22 | | | | 1.10 | | | | 1.68 | |
| | | | | | | | | | | | | | | | | | | | | | | | |
Distributions from net investment income | | | (0.08 | ) | | | (0.25 | ) | | | (0.41 | ) | | | (0.16 | ) | | | (0.14 | ) | | | (0.13 | ) |
Distributions from capital gains | | | — | | | | (0.34 | ) | | | (0.01 | ) | | | — | | | | — | | | | — | |
| | | | | | | | | | | | | | | | | | | | | | | | |
Total distributions | | | (0.08 | ) | | | (0.59 | ) | | | (0.42 | ) | | | (0.16 | ) | | | (0.14 | ) | | | (0.13 | ) |
| | | | | | | | | | | | | | | | | | | | | | | | |
| NET ASSET VALUE, END OF PERIOD | | $ | 12.00 | | | $ | 11.61 | | | $ | 18.67 | | | $ | 18.19 | | | $ | 16.13 | | | $ | 15.17 | |
| | | | | | | | | | | | | | | | | | | | | | | | |
| TOTAL RETURN2,3 | | | 4.09 | % | | | (35.25 | )% | | | 4.91 | % | | | 13.85 | % | | | 7.32 | % | | | 12.43 | % |
| | | | | | |
| NET ASSETS, END OF PERIOD (IN THOUSANDS) | | $ | 17,629 | | | $ | 17,808 | | | $ | 29,580 | | | $ | 21,064 | | | $ | 20,159 | | | $ | 11,388 | |
| | | | | | |
| RATIO OF EXPENSES TO AVERAGE NET ASSETS | | | 0.60 | %* | | | 0.55 | % | | | 0.53 | % | | | 0.57 | % | | | 0.55 | % | | | 0.60 | % |
| RATIO OF NET EXPENSES TO AVERAGE NET ASSETS | | | 0.54 | %* | | | 0.55 | % | | | 0.53 | % | | | 0.55 | % | | | 0.55 | % | | | 0.55 | % |
| RATIO OF NET INVESTMENT INCOME (LOSS) TO AVERAGE NET ASSETS (EXCLUDING EXPENSES PAID DIRECTLY BY THE ADVISOR) | | | 1.41 | %* | | | 0.99 | % | | | 0.92 | % | | | 0.99 | % | | | 0.96 | % | | | 1.04 | % |
| RATIO OF NET INVESTMENT INCOME (LOSS) TO AVERAGE NET ASSETS (INCLUDING EXPENSES PAID DIRECTLY BY THE ADVISOR) | | | 1.36 | %* | | | 0.99 | % | | | 0.92 | % | | | 0.97 | % | | | 0.96 | % | | | 0.98 | % |
| PORTFOLIO TURNOVER RATE | | | 17.40 | % | | | 31.17 | % | | | 7.43 | % | | | 18.90 | % | | | 1.76 | % | | | 15.63 | % |
1 Per share amounts are based upon average shares outstanding.
2 Total return is for the period indicated and has not been annualized. Total return is calculated assuming a purchase of shares at net asset value per share on the first day and a sale at net asset value per share on the last day of each period reported. Distributions are assumed, for purposes of this calculation, to be reinvested at the net asset value per share on the respective payment dates of each Fund.
3 A Class total return does not include the one-time front-end sales charge.
* Annualized
| | | | |
| June 30, 2009 | | 174 | | See Notes to Financial Statements |
Financial Highlights
For a share outstanding throughout the periods presented
Accessor Aggressive Growth Allocation Fund
| | | | | | | | | | | | | | | | | | | | | | | | |
| | | INSTITUTIONAL CLASS SHARES | |
| | | PERIOD ENDED
JUNE 30,
2009 (UNAUDITED) | | | FOR THE YEARS
ENDED DECEMBER 31, | |
| | | | 2008 | | | 2007 | | | 2006 | | | 2005 | | | 2004 | |
| NET ASSET VALUE, BEGINNING OF PERIOD | | $ | 11.20 | | | $ | 19.48 | | | $ | 18.81 | | | $ | 16.27 | | | $ | 14.97 | | | $ | 13.08 | |
Net investment income (loss)1 | | | 0.04 | | | | 0.07 | | | | 0.10 | | | | 0.09 | | | | 0.06 | | | | 0.05 | |
Net realized and unrealized gain (loss) on investments1 | | | 0.34 | | | | (7.82 | ) | | | 0.98 | | | | 2.50 | | | | 1.26 | | | | 1.86 | |
| | | | | | | | | | | | | | | | | | | | | | | | |
Total from investment operations | | | 0.38 | | | | (7.75 | ) | | | 1.08 | | | | 2.59 | | | | 1.32 | | | | 1.91 | |
| | | | | | | | | | | | | | | | | | | | | | | | |
Distributions from net investment income | | | (0.04 | ) | | | (0.16 | ) | | | (0.38 | ) | | | (0.05 | ) | | | (0.02 | ) | | | (0.02 | ) |
Distributions from capital gains | | | — | | | | (0.37 | ) | | | (0.03 | ) | | | — | | | | — | | | | — | |
| | | | | | | | | | | | | | | | | | | | | | | | |
Total distributions | | | (0.04 | ) | | | (0.53 | ) | | | (0.41 | ) | | | (0.05 | ) | | | (0.02 | ) | | | (0.02 | ) |
| | | | | | | | | | | | | | | | | | | | | | | | |
| NET ASSET VALUE, END OF PERIOD | | $ | 11.54 | | | $ | 11.20 | | | $ | 19.48 | | | $ | 18.81 | | | $ | 16.27 | | | $ | 14.97 | |
| | | | | | | | | | | | | | | | | | | | | | | | |
| TOTAL RETURN2 | | | 3.40 | % | | | (40.46 | )% | | | 5.71 | % | | | 15.95 | % | | | 8.86 | % | | | 14.60 | % |
| | | | | | |
| NET ASSETS, END OF PERIOD (IN THOUSANDS) | | $ | 28,413 | | | $ | 25,412 | | | $ | 44,106 | | | $ | 37,716 | | | $ | 21,970 | | | $ | 15,590 | |
| | | | | | |
| RATIO OF EXPENSES TO AVERAGE NET ASSETS | | | 0.32 | %* | | | 0.25 | % | | | 0.20 | % | | | 0.26 | % | | | 0.24 | % | | | 0.30 | % |
| RATIO OF NET EXPENSES TO AVERAGE NET ASSETS | | | 0.26 | %* | | | 0.25 | % | | | 0.20 | % | | | 0.20 | % | | | 0.20 | % | | | 0.20 | % |
| RATIO OF NET INVESTMENT INCOME (LOSS) TO AVERAGE NET ASSETS (EXCLUDING EXPENSES PAID DIRECTLY BY THE ADVISOR) | | | 0.70 | %* | | | 0.44 | % | | | 0.49 | % | | | 0.48 | % | | | 0.35 | % | | | 0.27 | % |
| RATIO OF NET INVESTMENT INCOME (LOSS) TO AVERAGE NET ASSETS (INCLUDING EXPENSES PAID DIRECTLY BY THE ADVISOR) | | | 0.75 | %* | | | 0.44 | % | | | 0.49 | % | | | 0.54 | % | | | 0.39 | % | | | 0.37 | % |
| PORTFOLIO TURNOVER RATE | | | 18.68 | % | | | 30.06 | % | | | 10.36 | % | | | 10.73 | % | | | 2.01 | % | | | 3.61 | % |
1 Per share amounts are based upon average shares outstanding.
2 Total return is for the period indicated and has not been annualized. Total return is calculated assuming a purchase of shares at net asset value per share on the first day and a sale at net asset value per share on the last day of each period reported. Distributions are assumed, for purposes of this calculation, to be reinvested at the net asset value per share on the respective payment dates of each Fund.
* Annualized
| | | | |
| See Notes to Financial Statements | | 175 | | June 30, 2009 |
Financial Highlights
For a share outstanding throughout the periods presented
Accessor Aggressive Growth Allocation Fund
| | | | | | | | | | | | | | | | | | | | | | | | |
| | | INVESTOR CLASS SHARES | |
| | | PERIOD ENDED
JUNE 30,
2009 (UNAUDITED) | | | FOR THE YEARS
ENDED DECEMBER 31, | |
| | | | 2008 | | | 2007 | | | 2006 | | | 2005 | | | 2004 | |
| NET ASSET VALUE, BEGINNING OF PERIOD | | $ | 10.93 | | | $ | 19.06 | | | $ | 18.42 | | | $ | 15.98 | | | $ | 14.76 | | | $ | 12.94 | |
Net investment income (loss)1 | | | 0.01 | | | | (0.01 | ) | | | 0.00 | | | | (0.01 | ) | | | (0.02 | ) | | | (0.02 | ) |
Net realized and unrealized gain (loss) on investments1 | | | 0.33 | | | | (7.64 | ) | | | 0.95 | | | | 2.47 | | | | 1.25 | | | | 1.84 | |
| | | | | | | | | | | | | | | | | | | | | | | | |
Total from investment operations | | | 0.34 | | | | (7.65 | ) | | | 0.95 | | | | 2.46 | | | | 1.23 | | | | 1.82 | |
| | | | | | | | | | | | | | | | | | | | | | | | |
Distributions from net investment income | | | (0.01 | ) | | | (0.11 | ) | | | (0.28 | ) | | | (0.02 | ) | | | (0.01 | ) | | | 0.00 | 3 |
Distributions from capital gains | | | — | | | | (0.37 | ) | | | (0.03 | ) | | | — | | | | — | | | | — | |
| | | | | | | | | | | | | | | | | | | | | | | | |
Total distributions | | | (0.01 | ) | | | (0.48 | ) | | | (0.31 | ) | | | (0.02 | ) | | | (0.01 | ) | | | 0.00 | 3 |
| | | | | | | | | | | | | | | | | | | | | | | | |
| NET ASSET VALUE, END OF PERIOD | | $ | 11.26 | | | $ | 10.93 | | | $ | 19.06 | | | $ | 18.42 | | | $ | 15.98 | | | $ | 14.76 | |
| | | | | | | | | | | | | | | | | | | | | | | | |
| TOTAL RETURN2 | | | 3.16 | % | | | (40.77 | )% | | | 5.15 | % | | | 15.39 | % | | | 8.31 | % | | | 14.01 | % |
| | | | | | |
| NET ASSETS, END OF PERIOD (IN THOUSANDS) | | $ | 7,512 | | | $ | 6,920 | | | $ | 12,913 | | | $ | 11,518 | | | $ | 12,353 | | | $ | 9,782 | |
| | | | | | |
| RATIO OF EXPENSES TO AVERAGE NET ASSETS | | | 0.82 | %* | | | 0.75 | % | | | 0.70 | % | | | 0.73 | % | | | 0.74 | % | | | 0.80 | % |
| RATIO OF NET EXPENSES TO AVERAGE NET ASSETS | | | 0.76 | %* | | | 0.75 | % | | | 0.70 | % | | | 0.69 | % | | | 0.70 | % | | | 0.70 | % |
| RATIO OF NET INVESTMENT INCOME (LOSS) TO AVERAGE NET ASSETS (EXCLUDING EXPENSES PAID DIRECTLY BY THE ADVISOR) | | | 0.19 | %* | | | (0.09 | )% | | | (0.02 | )% | | | (0.09 | )% | | | (0.14 | )% | | | (0.24 | )% |
| RATIO OF NET INVESTMENT INCOME (LOSS) TO AVERAGE NET ASSETS (INCLUDING EXPENSES PAID DIRECTLY BY THE ADVISOR) | | | 0.25 | %* | | | (0.09 | )% | | | (0.02 | )% | | | (0.05 | )% | | | (0.11 | )% | | | (0.14 | )% |
| PORTFOLIO TURNOVER RATE | | | 18.68 | % | | | 30.06 | % | | | 10.36 | % | | | 10.73 | % | | | 2.01 | % | | | 3.61 | % |
1 Per share amounts are based upon average shares outstanding.
2 Total return is for the period indicated and has not been annualized. Total return is calculated assuming a purchase of shares at net asset value per share on the first day and a sale at net asset value per share on the last day of each period reported. Distributions are assumed, for purposes of this calculation, to be reinvested at the net asset value per share on the respective payment dates of each Fund.
3 Less than ($0.005) per share
* Annualized
| | | | |
| June 30, 2009 | | 176 | | See Notes to Financial Statements |
Financial Highlights
For a share outstanding throughout the periods presented
Accessor Aggressive Growth Allocation Fund
| | | | | | | | | | | | | | | | | | | | | | | | |
| | | C CLASS SHARES | |
| | | PERIOD ENDED
JUNE 30,
2009 (UNAUDITED) | | | FOR THE YEARS
ENDED DECEMBER 31, | |
| | | | 2008 | | | 2007 | | | 2006 | | | 2005 | | | 2004 | |
| NET ASSET VALUE, BEGINNING OF PERIOD | | $ | 10.78 | | | $ | 18.86 | | | $ | 18.24 | | | $ | 15.89 | | | $ | 14.74 | | | $ | 13.00 | |
Net investment income (loss)1 | | | (0.01 | ) | | | (0.08 | ) | | | (0.09 | ) | | | (0.08 | ) | | | (0.09 | ) | | | (0.07 | ) |
Net realized and unrealized gain (loss) on investments1 | | | 0.32 | | | | (7.55 | ) | | | 0.95 | | | | 2.43 | | | | 1.24 | | | | 1.81 | |
| | | | | | | | | | | | | | | | | | | | | | | | |
Total from investment operations | | | 0.31 | | | | (7.63 | ) | | | 0.86 | | | | 2.35 | | | | 1.15 | | | | 1.74 | |
| | | | | | | | | | | | | | | | | | | | | | | | |
Distributions from net investment income | | | — | | | | (0.08 | ) | | | (0.21 | ) | | | — | | | | — | | | | — | |
Distributions from capital gains | | | — | | | | (0.37 | ) | | | (0.03 | ) | | | — | | | | — | | | | — | |
| | | | | | | | | | | | | | | | | | | | | | | | |
Total distributions | | | — | | | | (0.45 | ) | | | (0.24 | ) | | | — | | | | — | | | | — | |
| | | | | | | | | | | | | | | | | | | | | | | | |
| NET ASSET VALUE, END OF PERIOD | | $ | 11.09 | | | $ | 10.78 | | | $ | 18.86 | | | $ | 18.24 | | | $ | 15.89 | | | $ | 14.74 | |
| | | | | | | | | | | | | | | | | | | | | | | | |
| TOTAL RETURN2 | | | 2.88 | % | | | (41.05 | )% | | | 4.69 | % | | | 14.79 | % | | | 7.80 | % | | | 13.38 | % |
| | | | | | |
| NET ASSETS, END OF PERIOD (IN THOUSANDS) | | $ | 5,990 | | | $ | 5,944 | | | $ | 10,144 | | | $ | 7,966 | | | $ | 5,399 | | | $ | 3,474 | |
| | | | | | |
| RATIO OF EXPENSES TO AVERAGE NET ASSETS | | | 1.32 | %* | | | 1.25 | % | | | 1.20 | % | | | 1.25 | % | | | 1.24 | % | | | 1.30 | % |
| RATIO OF NET EXPENSES TO AVERAGE NET ASSETS | | | 1.26 | %* | | | 1.25 | % | | | 1.20 | % | | | 1.20 | % | | | 1.20 | % | | | 1.20 | % |
| RATIO OF NET INVESTMENT INCOME (LOSS) TO AVERAGE NET ASSETS (EXCLUDING EXPENSES PAID DIRECTLY BY THE ADVISOR) | | | (0.32 | )%* | | | (0.56 | )% | | | (0.49 | )% | | | (0.55 | )% | | | (0.64 | )% | | | (0.61 | )% |
| RATIO OF NET INVESTMENT INCOME (LOSS) TO AVERAGE NET ASSETS (INCLUDING EXPENSES PAID DIRECTLY BY THE ADVISOR) | | | (0.27 | )%* | | | (0.56 | )% | | | (0.49 | )% | | | (0.50 | )% | | | (0.61 | )% | | | (0.50 | )% |
| PORTFOLIO TURNOVER RATE | | | 18.68 | % | | | 30.06 | % | | | 10.36 | % | | | 10.73 | % | | | 2.01 | % | | | 3.61 | % |
1 Per share amounts are based upon average shares outstanding.
2 Total return is for the period indicated and has not been annualized. Total return is calculated assuming a purchase of shares at net asset value per share on the first day and a sale at net asset value per share on the last day of each period reported. Distributions are assumed, for purposes of this calculation, to be reinvested at the net asset value per share on the respective payment dates of each Fund.
* Annualized
| | | | |
| See Notes to Financial Statements | | 177 | | June 30, 2009 |
Financial Highlights
For a share outstanding throughout the periods presented
Accessor Aggressive Growth Allocation Fund
| | | | | | | | | | | | | | | | | | | | | | | | |
| | | A CLASS SHARES | |
| | | PERIOD ENDED
JUNE 30,
2009 (UNAUDITED) | | | FOR THE YEARS
ENDED DECEMBER 31, | |
| | | | 2008 | | | 2007 | | | 2006 | | | 2005 | | | 2004 | |
| NET ASSET VALUE, BEGINNING OF PERIOD | | $ | 11.09 | | | $ | 19.31 | | | $ | 18.66 | | | $ | 16.17 | | | $ | 14.92 | | | $ | 13.07 | |
Net investment income (loss)1 | | | 0.02 | | | | 0.02 | | | | 0.03 | | | | 0.03 | | | | 0.01 | | | | 0.03 | |
Net realized and unrealized gain (loss) on investments1 | | | 0.33 | | | | (7.75 | ) | | | 0.96 | | | | 2.49 | | | | 1.25 | | | | 1.83 | |
| | | | | | | | | | | | | | | | | | | | | | | | |
Total from investment operations | | | 0.35 | | | | (7.73 | ) | | | 0.99 | | | | 2.52 | | | | 1.26 | | | | 1.86 | |
| | | | | | | | | | | | | | | | | | | | | | | | |
Distributions from net investment income | | | (0.02 | ) | | | (0.12 | ) | | | (0.31 | ) | | | (0.03 | ) | | | (0.01 | ) | | | (0.01 | ) |
Distributions from capital gains | | | — | | | | (0.37 | ) | | | (0.03 | ) | | | — | | | | — | | | | — | |
| | | | | | | | | | | | | | | | | | | | | | | | |
Total distributions | | | (0.02 | ) | | | (0.49 | ) | | | (0.34 | ) | | | (0.03 | ) | | | (0.01 | ) | | | (0.01 | ) |
| | | | | | | | | | | | | | | | | | | | | | | | |
| NET ASSET VALUE, END OF PERIOD | | $ | 11.42 | | | $ | 11.09 | | | $ | 19.31 | | | $ | 18.66 | | | $ | 16.17 | | | $ | 14.92 | |
| | | | | | | | | | | | | | | | | | | | | | | | |
| TOTAL RETURN2,3 | | | 3.18 | % | | | (40.66 | )% | | | 5.30 | % | | | 15.56 | % | | | 8.46 | % | | | 14.23 | % |
| | | | | | |
| NET ASSETS, END OF PERIOD (IN THOUSANDS) | | $ | 7,815 | | | $ | 7,587 | | | $ | 12,864 | | | $ | 9,032 | | | $ | 5,589 | | | $ | 2,375 | |
| | | | | | |
| RATIO OF EXPENSES TO AVERAGE NET ASSETS | | | 0.67 | %* | | | 0.60 | % | | | 0.55 | % | | | 0.61 | % | | | 0.59 | % | | | 0.65 | % |
| RATIO OF NET EXPENSES TO AVERAGE NET ASSETS | | | 0.61 | %* | | | 0.60 | % | | | 0.55 | % | | | 0.55 | % | | | 0.55 | % | | | 0.55 | % |
| RATIO OF NET INVESTMENT INCOME (LOSS) TO AVERAGE NET ASSETS (EXCLUDING EXPENSES PAID DIRECTLY BY THE ADVISOR) | | | 0.34 | %* | | | 0.11 | % | | | 0.16 | % | | | 0.12 | % | | | 0.03 | % | | | 0.13 | % |
| RATIO OF NET INVESTMENT INCOME (LOSS) TO AVERAGE NET ASSETS (INCLUDING EXPENSES PAID DIRECTLY BY THE ADVISOR) | | | 0.39 | %* | | | 0.11 | % | | | 0.16 | % | | | 0.18 | % | | | 0.06 | % | | | 0.23 | % |
| PORTFOLIO TURNOVER RATE | | | 18.68 | % | | | 30.06 | % | | | 10.36 | % | | | 10.73 | % | | | 2.01 | % | | | 3.61 | % |
1 Per share amounts are based upon average shares outstanding.
2 Total return is for the period indicated and has not been annualized. Total return is calculated assuming a purchase of shares at net asset value per share on the first day and a sale at net asset value per share on the last day of each period reported. Distributions are assumed, for purposes of this calculation, to be reinvested at the net asset value per share on the respective payment dates of each Fund.
3 A Class total return does not include the one-time front-end sales charge.
* Annualized
| | | | |
| June 30, 2009 | | 178 | | See Notes to Financial Statements |
Notes to Financial Statements (Unaudited)
1. Organization
Forward Funds (the “Trust”) is organized as a Delaware statutory trust and is registered under the Investment Company Act of 1940, as amended (the “1940 Act”), as an open-end management investment company. The Trust offers multiple separate series each with its own investment objective and policies, eighteen of which are known as the Accessor Funds (each a “Fund” or “Accessor Fund” and collectively, the “Funds” or “Accessor Funds”). Each of the Accessor Funds (with the exception of the Accessor Frontier Markets Fund and the Investment Grade Fixed-Income Fund) are successors to previously operational funds which were series of Accessor Funds, Inc., a Maryland corporation, and were reorganized into the corresponding Accessor Fund effective September 1, 2008. This semi-annual report covers the eighteen Accessor Funds, which consist of eight diversified and two non-diversified investment portfolios (the “Underlying Funds”); six diversified funds of funds investment portfolios (the “Allocation Funds”); one additional diversified investment portfolio; and one additional non-diversified investment portfolio. The Underlying Funds in this report are the Accessor Growth Fund, Accessor Value Fund, Accessor Small to Mid Cap Fund, and Accessor International Equity Fund (the “Equity Funds”); the Accessor High Yield Bond Fund, Accessor Investment Grade Fixed-Income Fund (formerly the “Accessor Intermediate Fixed-Income Fund”), Accessor Mortgage Securities Fund (the “Bond Funds”) and Accessor U.S. Government Money Fund (the “Money Fund”) (collectively with the Bond Funds, the “Fixed-Income Funds”); and the Accessor Frontier Markets Fund and Accessor Strategic Alternatives Fund (collectively, the “Alternative Funds”). The six Allocation Funds are the Accessor Income Allocation Fund, Accessor Income & Growth Allocation Fund, Accessor Balanced Allocation Fund, Accessor Growth & Income Allocation Fund, Accessor Growth Allocation Fund and Accessor Aggressive Growth Allocation Fund. The report also covers the Accessor Total Return Fund and Accessor Limited Duration U.S. Government Fund.
The Accessor Growth Fund, Accessor Value Fund, Accessor Small to Mid Cap Fund, Accessor International Equity Fund and Accessor High Yield Bond Fund each offer five classes of shares: Institutional Class Shares (formerly Advisor Class Shares), Investor Class Shares, A Class Shares, C Class Shares and Z Class Shares. The Accessor U.S. Government Money Fund also offers five classes of shares: Institutional Class Shares (formerly Advisor Class Shares), Investor Class Shares, A Class Shares, C Class Shares and Z Class Shares (formerly Institutional Class Shares). The Accessor Frontier Markets and Strategic Alternatives Funds currently offer three classes of shares: Institutional Class Shares (formerly Advisor Class Shares), Investor Class Shares and Z Class Shares. The Accessor Investment Grade Fixed-Income Fund and Accessor Mortgage Securities Fund each offer four classes of shares: Institutional Class Shares (formerly Advisor Class Shares), Investor Class Shares, C Class Shares and Z Class Shares. The Allocation Funds each offer four classes of shares: Institutional Class Shares (formerly Advisor Class Shares), Investor Class Shares, A Class Shares and C Class Shares. The Accessor Strategic Alternatives Fund offers three classes of shares: Institutional Class Shares (formerly Advisor Class Shares), Investor Class Shares and Z Class Shares. The Accessor Total Return Fund and Accessor Limited Duration U.S. Government Fund each offer one undesignated class of shares. Each class of shares of each Accessor Fund has identical rights and privileges as the other classes of shares of such Accessor Fund, except that (i) each class of shares bears class-specific expenses allocated to it, (ii) each class of shares has exclusive voting rights on any matter submitted to shareholders that relates solely to the
Notes to Financial Statements (Unaudited)
distribution or service arrangements of such classes, and (iii) each class has separate voting rights on any matter submitted to the shareholders in which interests of one class differ from the interests of the shareholders of the other classes of shares.
2. Significant Accounting Policies
The following is a summary of significant accounting policies followed by the Funds. The policies are in conformity with accounting principles generally accepted in the United States of America (“generally accepted accounting principles”). The preparation of financial statements in accordance with generally accepted accounting principles requires management to make estimates and assumptions that affect the reported amounts and disclosures in the financial statements during the reporting period. Management believes the estimates and security valuations are appropriate; however, actual results may differ from those estimates, and the security valuations reflected in the financial statements may differ from the value the Funds ultimately realize upon sale of the securities. To the extent that the Allocation Funds are invested in each of the Underlying Funds, the Allocation Funds will also be exposed to certain estimates, assumptions, and security transactions indirectly. The financial statements have been prepared as of the close of the New York Stock Exchange on June 30, 2009.
Security Valuation: Net Asset Value (“NAV”) per share of each Fund is calculated as of the close of regular trading of the New York Stock Exchange (“NYSE”) (normally 4:00 p.m. Eastern Time), except that the NAV per share of the Money Fund is calculated at 5:00 p.m. Eastern Time. If the NYSE closes early, the Funds may close early and may value their shares at an earlier time.
The Funds generally value their securities using prices obtained from a pricing service. Equity securities (both domestic and international) and fixed-income securities listed and traded principally on a national securities exchange are typically valued on the basis of last reported sale price or a market’s official closing price on such exchange on the day of valuation or, if no sale occurred on such day, at the closing bid price on the primary exchange on which the security is traded. Because foreign securities markets are open on different days from U.S. markets, there may be instances when prices of foreign securities in which a Fund invests change on days when shareholders are not able to buy or sell Fund shares. Over-the-counter equity securities, options, and futures contracts are generally valued on the basis of the last reported sale price or a market’s official closing price or, if believed to more accurately reflect the fair market value, the mean between the bid and asked prices. Many fixed income securities do not trade each day and thus the last sale or bid price are frequently not available. Fixed-income securities may be valued using prices provided by a pricing service, including a qualified broker quote, when such prices are believed by Forward Management, LLC (“Forward Management”) and the appropriate sub-advisor, an unaffiliated investment management organization (referred to herein each as a “Money Manager” and collectively, as the “Money Managers”) to reflect the fair market value of such securities. To the extent that such fixed-income securities do not trade each day and last sale or bid prices are not available, the Board of Trustees has authorized the use of matrix pricing or similar valuation methods used by such pricing sources. Investments held by the Money Fund are valued at amortized cost and short-term debt securities maturing in 60 days or less may be valued at amortized cost, which approximates market value. Investments by the Allocation Funds in shares of the Underlying Funds are valued at the NAV per share of the applicable Underlying Fund.
Investments by any Fund in exchange-traded open-end investment companies or closed-end
Notes to Financial Statements (Unaudited)
investment companies are priced as equity securities as stated above.
An investment for which a price is not readily available as described above is valued at its fair value as determined in good faith in accordance with procedures adopted by the Board of Trustees. The fair value of a security may be determined in circumstances, including, but not limited to, when (i) the exchange or market on or in which a security is traded does not open for trading for an entire trading day and no other market prices are available, (ii) a security does not trade regularly or has had its trading halted, (iii) a security does not have a price source due to its lack of liquidity, (iv) Forward Management or the appropriate Money Manager believes a market quotation from a broker-dealer is unreliable (e.g., where it varies significantly from a recent trade), (v) the security is thinly traded, or (vi) there has been a significant subsequent event. A significant event is one where it is believed with a reasonably high degree of certainty that a particular event has caused the price of the security to no longer reflect its current value as of the time of the Fund’s NAV calculation. The Funds anticipate using fair value pricing for securities primarily traded on U.S. exchanges only under very limited circumstances. The Funds (specifically the Accessor Frontier Markets Fund, Accessor Strategic Alternatives Fund and Accessor International Equity Fund) may, however, use fair value pricing more frequently for securities primarily traded in non-U.S. markets because, among other things, most foreign markets close well before a Fund normally values its securities at 4:00 p.m. Eastern Time. The earlier close of these foreign markets gives rise to the possibility that significant events, including broad market moves, may occur before a Fund values its securities. To account for this, the Funds (particularly the Accessor Frontier Markets Fund, Accessor Strategic Alternatives Fund and Accessor International Equity Fund) may frequently value many foreign equity securities using the fair value procedures adopted by the Board of Trustees. On days when a change has occurred in the closing level of a benchmark index by an amount approved by the Board of Trustees from the previous trading day’s closing level and other criteria have been met, the Board of Trustees has authorized the use of an independent fair valuation service to provide the fair value for foreign equity securities. Forward Management and the Money Managers review the fair values provided, review periodically the methodology and procedures used in providing values to the Funds, and evaluate the accuracy of the prices provided.
Financial Accounting Standards Board (“FASB”) Statement of Financial Accounting Standards (“SFAS”) No. 157 is effective for the Funds’ financial statements issued after December 31, 2007. SFAS No. 157 defines fair value, establishes a fair value hierarchy and specifies that a valuation technique used to measure fair value shall maximize the use of observable inputs and minimize the use of unobservable inputs. The objective of a fair value measurement is to determine the price that would be received to sell an asset or paid to transfer a liability in an orderly transaction between market participants at the measurement date (an exit price). Accordingly, the fair value hierarchy gives the highest priority to quoted prices (unadjusted) in active markets for identical assets or liabilities (Level 1) and the lowest priority to unobservable inputs (Level 3). The three levels of the fair value hierarchy under SFAS No. 157 are described below:
Level 1—Unadjusted quoted prices in active markets for identical, unrestricted assets or liabilities that a Fund has the ability to access at the measurement date;
Level 2—Quoted prices which are not active, quoted prices for similar assets or liabilities in active markets or inputs other than quoted prices that are observable (either directly or indirectly) for substantially the full term of the asset or liability; and
Notes to Financial Statements (Unaudited)
Level 3—Significant unobservable prices or inputs (including a Fund’s own assumptions in determining the fair value of investments) where there is little or no market activity for the asset or liability at the measurement date.
As required by SFAS No.157, investments are classified within the level of the lowest significant input considered in determining fair value. Investments classified within Level 3 whose fair value measurement considers several inputs and may include Level 1 or Level 2 inputs as components of the overall fair value measurement. The designated inputs levels are not necessarily an indication of the risks or liquidity associated with these investments.
The following is a summary of the inputs used as of June 30, 2009 in valuing the Funds’ investments carried at value:
| | | | | | | | | | | | |
| Accessor Growth Fund | | | | | | | | | | | | |
| | | LEVEL 1 | | LEVEL 2 | | LEVEL 3 | | TOTAL |
Investments in Securities | | | | | | | | | | | | |
Common Stocks | | $ | 75,296,808 | | $ | — | | $ | — | | $ | 75,296,808 |
Exchange Traded Funds | | | 262,735 | | | — | | | — | | | 262,735 |
| | | | | | | | | | | | |
Total Investments in Securities | | $ | 75,559,543 | | $ | — | | $ | — | | $ | 75,559,543 |
| | | | | | | | | | | | |
| | | | |
| Accessor Value Fund | | | | | | | | | | | | |
| | | LEVEL 1 | | LEVEL 2 | | LEVEL 3 | | TOTAL |
Investments in Securities | | | | | | | | | | | | |
Common Stocks | | $ | 71,285,182 | | $ | — | | $ | — | | $ | 71,285,182 |
| | | | | | | | | | | | |
Total Investments in Securities | | $ | 71,285,182 | | $ | — | | $ | — | | $ | 71,285,182 |
| | | | | | | | | | | | |
| | | | |
| Accessor Small to Mid Cap Fund | | | | | | | | | | | | |
| | | LEVEL 1 | | LEVEL 2 | | LEVEL 3 | | TOTAL |
Investments in Securities | | | | | | | | | | | | |
Common Stocks | | $ | 166,740,215 | | $ | — | | $ | — | | $ | 166,740,215 |
| | | | | | | | | | | | |
Total Investments in Securities | | $ | 166,740,215 | | $ | — | | $ | — | | $ | 166,740,215 |
| | | | | | | | | | | | |
| | | | |
| Accessor International Equity Fund | | | | | | | | | | | | |
| | | LEVEL 1 | | LEVEL 2 | | LEVEL 3 | | TOTAL |
Investments in Securities | | | | | | | | | | | | |
Common Stocks | | $ | 94,254,638 | | $ | — | | $ | — | | $ | 94,254,638 |
| | | | | | | | | | | | |
Total Investments in Securities | | $ | 94,254,638 | | $ | — | | $ | — | | $ | 94,254,638 |
| | | | | | | | | | | | |
| | | | |
| Accessor Total Return Fund | | | | | | | | | | | | |
| | | LEVEL 1 | | LEVEL 2 | | LEVEL 3 | | TOTAL |
Investments in Securities | | | | | | | | | | | | |
Common Stocks | | $ | 7,307,048 | | $ | — | | $ | — | | $ | 7,307,048 |
Exchange Traded Funds | | | 14,283,920 | | | — | | | — | | | 14,283,920 |
Preferred Stocks | | | 944,430 | | | — | | | — | | | 944,430 |
Investment Companies | | | 424,445 | | | — | | | — | | | 424,445 |
| | | | | | | | | | | | |
Total Investments in Securities | | $ | 22,959,843 | | $ | — | | $ | — | | $ | 22,959,843 |
| | | | | | | | | | | | |
Notes to Financial Statements (Unaudited)
| | | | | | | | | | | | | | | |
| Accessor Strategic Alternatives Fund | | | | | | | | | | | | | | | |
| | | LEVEL 1 | | | LEVEL 2 | | | LEVEL 3 | | TOTAL | |
Investments in Securities | | | | | | | | | | | | | | | |
Exchange Traded Funds | | $ | 40,209,773 | | | $ | — | | | $ | — | | $ | 40,209,773 | |
Exchange Traded Note | | | 17,006,435 | | | | — | | | | — | | | 17,006,435 | |
Structured Notes | | | — | | | | 20,494,600 | | | | — | | | 20,494,600 | |
U.S. Government and Agency Securities | | | — | | | | 17,991,852 | | | | — | | | 17,991,852 | |
| | | | | | | | | | | | | | | |
Total Investments in Securities | | $ | 57,216,208 | | | $ | 38,486,452 | | | $ | — | | $ | 95,702,660 | |
| | | | | | | | | | | | | | | |
| | | | |
| Accessor Frontier Markets Fund | | | | | | | | | | | | | | | |
| | | LEVEL 1 | | | LEVEL 2 | | | LEVEL 3 | | TOTAL | |
Investments in Securities | | | | | | | | | | | | | | | |
Exchange Traded Funds | | $ | 6,105,464 | | | $ | 5,336,984 | | | $ | — | | $ | 11,442,448 | |
U.S. Government and Agency Security | | | — | | | | 7,525,156 | | | | — | | | 7,525,156 | |
Warrant | | | — | | | | 4,877,300 | | | | — | | | 4,877,300 | |
Investment Company | | | 1,800,000 | | | | — | | | | — | | | 1,800,000 | |
Common Stock | | | 1,633,810 | | | | — | | | | — | | | 1,633,810 | |
| | | | | | | | | | | | | | | |
Total Investments in Securities | | $ | 9,539,274 | | | $ | 17,739,440 | | | $ | — | | $ | 27,278,714 | |
| | | | | | | | | | | | | | | |
| | | | |
| | | LEVEL 1 | | | LEVEL 2 | | | LEVEL 3 | | TOTAL | |
| | | | |
Other Financial Instruments | | | | | | | | | | | | | | | |
Total Return Swap Contracts | | $ | — | | | $ | (136,378 | ) | | $ | — | | $ | (136,378 | ) |
| | | | | | | | | | | | | | | |
Total Investments in Securities | | $ | — | | | $ | (136,378 | ) | | $ | — | | $ | (136,378 | ) |
| | | | | | | | | | | | | | | |
| | | | |
| Accessor High Yield Bond Fund | | | | | | | | | | | | | | | |
| | | LEVEL 1 | | | LEVEL 2 | | | LEVEL 3 | | TOTAL | |
Investments in Securities | | | | | | | | | | | | | | | |
Corporate Bonds | | $ | — | | | $ | 93,863,736 | | | $ | — | | $ | 93,863,736 | |
| | | | | | | | | | | | | | | |
Total Investments in Securities | | $ | — | | | $ | 93,863,736 | | | $ | — | | $ | 93,863,736 | |
| | | | | | | | | | | | | | | |
| | | | |
| Accessor Investment Grade Fixed-Income Fund | | | | | | | | | | | | | | | |
| | | LEVEL 1 | | | LEVEL 2 | | | LEVEL 3 | | TOTAL | |
Investments in Securities | | | | | | | | | | | | | | | |
Asset Backed Securities | | $ | — | | | $ | 1,647,124 | | | $ | 4,117,100 | | $ | 5,764,224 | |
Collateralized Mortgage Obligations | | | — | | | | 40,812,198 | | | | 806,420 | | | 41,618,618 | |
Corporate Bonds | | | — | | | | 29,577,040 | | | | 1,701,754 | | | 31,278,794 | |
Municipal Bonds | | | — | | | | 4,322,987 | | | | — | | | 4,322,987 | |
U.S. Government and Agency Securities | | | — | | | | 8,047,382 | | | | — | | | 8,047,382 | |
| | | | | | | | | | | | | | | |
Total Investments in Securities | | $ | — | | | $ | 84,406,731 | | | $ | 6,625,274 | | $ | 91,032,005 | |
| | | | | | | | | | | | | | | |
| | | | |
| | | LEVEL 1 | | | LEVEL 2 | | | LEVEL 3 | | TOTAL | |
Other Financial Instruments | | | | | | | | | | | | | | | |
Futures — Unrealized appreciation | | $ | 573,951 | | | $ | — | | | $ | — | | $ | 573,951 | |
Futures — Unrealized depreciation | | | (67,934 | ) | | | — | | | | — | | | (67,934 | ) |
Written Options | | | (350 | ) | | | — | | | | — | | | (350 | ) |
TBA Purchase Commitments | | | — | | | | 13,521,246 | | | | — | | | 13,521,246 | |
TBA Sale Commitments | | | — | | | | (5,186,564 | ) | | | — | | | (5,186,564 | ) |
| | | | | | | | | | | | | | | |
Total Investments in Securities | | $ | 505,667 | | | $ | 8,334,682 | | | $ | — | | $ | 8,840,349 | |
| | | | | | | | | | | | | | | |
Notes to Financial Statements (Unaudited)
| | | | | | | | | | | | | | |
| Accessor Mortgage Securities Fund | | | | | | | | | | | | | | |
| | | LEVEL 1 | | LEVEL 2 | | | LEVEL 3 | | TOTAL | |
Investments in Securities | | | | | | | | | | | | | | |
Project Loans | | $ | — | | $ | — | | | $ | 2,356 | | $ | 2,356 | |
Collateralized Mortgage Obligations | | | — | | | 51,984,647 | | | | — | | | 51,984,647 | |
Asset Backed Securities | | | — | | | 228,032 | | | | — | | | 228,032 | |
| | | | | | | | | | | | | | |
Total Investments in Securities | | $ | — | | $ | 52,212,679 | | | $ | 2,356 | | $ | 52,215,035 | |
| | | | | | | | | | | | | | |
| | | | |
| | | LEVEL 1 | | LEVEL 2 | | | LEVEL 3 | | TOTAL | |
Other Financial Instruments | | | | | | | | | | | | | | |
TBA Purchase Commitments | | $ | — | | $ | 32,382,808 | | | $ | — | | $ | 32,382,808 | |
TBA Sale Commitments | | | — | | | (22,764,849 | ) | | | — | | | (22,764,849 | ) |
| | | | | | | | | | | | | | |
Total Investments in Securities | | $ | — | | $ | 9,617,959 | | | $ | — | | $ | 9,617,959 | |
| | | | | | | | | | | | | | |
| | | | |
| Accessor Limited Duration U.S. Government Fund | | | | | | | | | | | | | | |
| | | LEVEL 1 | | LEVEL 2 | | | LEVEL 3 | | TOTAL | |
Investments in Securities | | | | | | | | | | | | | | |
Agency Collateralized Mortgage Obligations | | $ | — | | $ | 7,757,841 | | | $ | — | | $ | 7,757,841 | |
U.S. Agency Bonds | | | — | | | 29,301,451 | | | | — | | | 29,301,451 | |
| | | | | | | | | | | | | | |
Total Investments in Securities | | $ | — | | $ | 37,059,292 | | | $ | — | | $ | 37,059,292 | |
| | | | | | | | | | | | | | |
| | | | |
| Accessor U.S. Government Money Fund | | | | | | | | | | | | | | |
| | | LEVEL 1 | | LEVEL 2 | | | LEVEL 3 | | TOTAL | |
Investments in Securities | | | | | | | | | | | | | | |
U.S. Agency Bonds | | $ | — | | $ | 746,667,074 | | | $ | | | $ | 746,667,074 | |
Short-Term Investment | | | — | | | 103,000,000 | | | | | | | 103,000,000 | |
| | | | | | | | | | | | | | |
Total Investments in Securities | | $ | — | | $ | 849,667,074 | | | $ | — | | $ | 849,667,074 | |
| | | | | | | | | | | | | | |
| | | | |
| Accessor Income Allocation Fund | | | | | | | | | | | | | | |
| | | LEVEL 1 | | LEVEL 2 | | | LEVEL 3 | | TOTAL | |
Investments in Securities | | | | | | | | | | | | | | |
Affiliated Investment Companies | | $ | 18,950,007 | | $ | — | | | $ | — | | $ | 18,950,007 | |
| | | | | | | | | | | | | | |
Total Investments in Securities | | $ | 18,950,007 | | $ | — | | | $ | — | | $ | 18,950,007 | |
| | | | | | | | | | | | | | |
| | | | |
| Accessor Income & Growth Allocation Fund | | | | | | | | | | | | | | |
| | | LEVEL 1 | | LEVEL 2 | | | LEVEL 3 | | TOTAL | |
Investments in Securities | | | | | | | | | | | | | | |
Affiliated Investment Companies | | $ | 41,609,686 | | $ | — | | | $ | — | | $ | 41,609,686 | |
| | | | | | | | | | | | | | |
Total Investments in Securities | | $ | 41,609,686 | | $ | — | | | $ | — | | $ | 41,609,686 | |
| | | | | | | | | | | | | | |
| | | | |
| Accessor Balanced Allocation Fund | | | | | | | | | | | | | | |
| | | LEVEL 1 | | LEVEL 2 | | | LEVEL 3 | | TOTAL | |
Investments in Securities | | | | | | | | | | | | | | |
Affiliated Investment Companies | | $ | 107,660,724 | | $ | — | | | $ | — | | $ | 107,660,724 | |
| | | | | | | | | | | | | | |
Total Investments in Securities | | $ | 107,660,724 | | $ | — | | | $ | — | | $ | 107,660,724 | |
| | | | | | | | | | | | | | |
| | | | |
| Accessor Growth & Income Allocation Fund | | | | | | | | | | | | | | |
| | | LEVEL 1 | | LEVEL 2 | | | LEVEL 3 | | TOTAL | |
Investments in Securities | | | | | | | | | | | | | | |
Affiliated Investment Companies | | $ | 100,891,184 | | $ | — | | | $ | — | | $ | 100,891,184 | |
| | | | | | | | | | | | | | |
Total Investments in Securities | | $ | 100,891,184 | | $ | — | | | $ | — | | $ | 100,891,184 | |
| | | | | | | | | | | | | | |
Notes to Financial Statements (Unaudited)
| | | | | | | | | | | | |
| Accessor Growth Allocation Fund | | | | | | | | | | | | |
| | | LEVEL 1 | | LEVEL 2 | | LEVEL 3 | | TOTAL |
Investments in Securities | | | | | | | | | | | | |
Affiliated Investment Companies | | $ | 98,569,387 | | $ | — | | $ | — | | $ | 98,569,387 |
| | | | | | | | | | | | |
Total Investments in Securities | | $ | 98,569,387 | | $ | — | | $ | — | | $ | 98,569,387 |
| | | | | | | | | | | | |
| | | | |
| Accessor Aggressive Growth Allocation Fund | | | | | | | | | | | | |
| | | LEVEL 1 | | LEVEL 2 | | LEVEL 3 | | TOTAL |
Investments in Securities | | | | | | | | | | | | |
Affiliated Investment Companies | | $ | 49,223,063 | | $ | — | | $ | — | | $ | 49,223,063 |
| | | | | | | | | | | | |
Total Investments in Securities | | $ | 49,223,063 | | $ | — | | $ | — | | $ | 49,223,063 |
| | | | | | | | | | | | |
The following is a reconciliation of the investments in which significant unobservable inputs (Level 3) were used in determining value:
| | | | |
| Accessor International Equity Fund(a) | | | | |
| | | COMMON STOCKS | |
Beginning balance as of January 1, 2009 | | $ | 2,397,670 | |
Accrued discounts/premiums | | | — | |
Realized gain/(loss) | | | — | |
Change in unrealized appreciation/(depreciation) | | | — | |
Net purchases/sales | | | — | |
Net transfer in and/or out of Level 3 | | | (2,397,670 | ) |
| | | | |
Ending balance as of June 30, 2009 | | | — | |
| | | | |
Net change in unrealized appreciation/depreciation included in earnings related to investments still held at June 30, 2009 | | $ | 7,766,852 | |
| | | | |
|
| Accessor Investment Grade Fixed-Income Fund(a) | |
| | | ASSET BACKED
SECURITIES | |
Beginning balance as of January 1, 2009 | | $ | 1,171,885 | |
Accrued discounts/premiums | | | (45,339 | ) |
Realized gain/(loss) | | | 4,793,048 | |
Change in unrealized appreciation/(depreciation) | | | (3,284,087 | ) |
Net purchase/sales | | | (22,591 | ) |
Net transfers in/and or out of Level 3 | | | 1,504,184 | |
| | | | |
Ending balance as of June 30, 2009 | | $ | 4,117,100 | |
| | | | |
| | | COLLATERALIZED
MORTGAGE
OBLIGATIONS | |
Beginning balance as of January 1, 2009 | | $ | 149,078 | |
Accrued discounts/premiums | | | 688 | |
Realized gain/(loss) | | | 1,015,118 | |
Change in unrealized appreciation/(depreciation) | | | (385,183 | ) |
Net purchase/sales | | | 26,718 | |
Net transfers in/and or out of Level 3 | | | — | |
| | | | |
Ending balance as of June 30, 2009 | | $ | 806,419 | |
| | | | |
| | | | |
| | | CORPORATE
BONDS | |
Beginning balance as of January 1, 2009 | | $ | 981,402 | |
Accrued discounts/premiums | | | 34,832 | |
Realized gain/(loss) | | | 1,106,722 | |
Change in unrealized appreciation/(depreciation) | | | (421,201 | ) |
Net purchase/sales | | | — | |
Net transfers in/and or out of Level 3 | | | — | |
| | | | |
Ending balance as of June 30, 2009 | | $ | 1,701,755 | |
| | | | |
Net change in unrealized appreciation/depreciation included in earnings related to investments still held at June 30, 2009 | | $ | (10,086,276 | ) |
| | | | |
| |
| Accessor Mortgage Securities Fund(a) | | | | |
| | | PROJECT LOANS | |
Beginning balance as of January 1, 2009 | | $ | — | |
Accrued discounts/premiums | | | — | |
Realized gain/(loss) | | | — | |
Change in unrealized appreciation/(depreciation) | | | — | |
Net purchases/sales | | | — | |
Net transfer in and/or out of Level 3 | | | 2,356 | |
| | | | |
Ending balance as of June 30, 2009 | | $ | 2,356 | |
| | | | |
Net change in unrealized appreciation/depreciation included in earnings related to investments still held at June 30, 2009 | | $ | (989,192 | ) |
| | | | |
(a) Net realized gain/(loss) and net unrealized appreciation/(depreciation) are included in the related amounts on investments in the Statement of Operations.
Security Transactions and Investment Income: Securities transactions are accounted for on the date the securities are purchased or sold (trade date). Interest income is recorded on the accrual basis. All premiums and discounts are amortized or accreted for financial statement
Notes to Financial Statements (Unaudited)
reporting purposes using the effective interest method. Dividend income, less foreign tax withheld, is recorded on the ex-dividend date or upon receipt of ex-dividend notification in the case of certain foreign securities. Realized gains and losses on the sale of investments are determined on the identified cost basis.
Foreign Currency Transactions: The books and records of the Funds are maintained in U.S. dollars. The Bond Funds may purchase debt obligations that are denominated in a foreign currency; and the Equity Funds and the Alternative Funds may purchase equity securities that are denominated in a foreign currency. Investment securities and other assets and liabilities that are denominated in a foreign currency are translated into U.S. dollars at the exchange rate in effect on the day of valuation. Purchases and sales of securities, income receipts and expense payments are translated into U.S. dollars at the exchange rates in effect on the dates of the transactions.
The Funds do not isolate that portion of the results of operations resulting from changes in foreign exchange rates on investments from the fluctuation arising from changes in market prices of securities. Reported net realized foreign exchange gains or losses arise from purchases and sales of foreign currencies, currency gains or losses realized between the trade and settlement dates of securities transactions, and the difference between the translated amount of income or expenses initially recorded in each of the Fund’s accounting records and the amounts actually received or paid. Net unrealized foreign exchange gains or losses arise from changes in the value of assets and liabilities, excluding investments in securities, resulting from changes in the exchange rates.
The Funds report certain foreign currency related security transactions as components of realized gains and losses in the statements of operations for financial reporting purposes, whereas such components are treated as ordinary income or federal income tax purposes. Foreign security and currency transactions may involve certain considerations and risks not typically associated with those of U.S. dollar denominated transactions. These risks include political or economic instability in the country of the issuer, the difficulty of predicting international trade patterns, the possibility of imposition of exchange controls and the risk of currency fluctuations.
Off-Balance Sheet Risk: The Funds (other than the Accessor Limited Duration U.S. Government Fund, the U.S. Government Money Fund and the Allocation Funds) may trade financial instruments with off-balance sheet risk in the normal course of investing activities and to assist in managing exposure to market risks such as interest rates and foreign currency exchange rates. These financial instruments include forward foreign currency exchange contracts, futures contracts and options transactions.
The notional or contractual amounts of these instruments represent the investment the Funds have in particular classes of financial instruments and do not necessarily represent the amounts potentially subject to risk. The measurement of the risks associated with these instruments is meaningful only when all related and offsetting transactions are considered.
Futures Contracts: The Funds (other than the Accessor Limited Duration U.S. Government Fund, the U.S. Government Money Fund and the Allocation Funds) are permitted to enter into financial futures contracts and stock index futures contracts in accordance with their investment objectives. A Fund may do so for a variety of reasons including for cash management purposes. The Accessor International Equity Fund may also purchase and write futures contracts on foreign currencies. A Fund is required to deposit either in cash or securities an amount equal to a certain percentage of the contract amount. Subsequent payments are made or
Notes to Financial Statements (Unaudited)
received by a Fund each day, dependent on daily fluctuations in the value of the contract. Such payments or receipts are known as variation margin and are recorded for financial statement purposes as unrealized gains or losses by a Fund. Should interest rates move unexpectedly, a Fund may not achieve the anticipated benefits of the financial futures contracts and may realize a loss.
When the contract is closed, a Fund records a realized gain or loss equal to the difference between the value of the contract at the time it was opened and the value at the time it was closed. The potential risk to the Funds is that the change in the value of the underlying securities may not correlate to the change in value of the contracts. In addition, the Funds could be exposed to risks if the counterparties to the contracts are unable to meet the terms of their contracts.
Forward Foreign Currency Exchange Contracts: The Accessor International Equity Fund will generally enter into forward foreign currency exchange contracts as a way of managing foreign exchange rate risk. It may enter into these contracts to fix the U.S. dollar value of a security that it has agreed to buy or sell for the period between the date the trade was entered into and the date the security is delivered and paid for. The Fund may also use these contracts to hedge the U.S. dollar value of securities it already owns denominated in foreign currencies. Forward foreign currency contracts are valued at the forward rate and are marked-to-market daily. The change in market value is recorded as an unrealized gain or loss until the contract settlement date, at which time the Fund records a realized gain or loss equal to the difference between the value of the contract at the time it was opened and the value at the time it was closed.
The use of forward foreign currency contracts does not eliminate fluctuations in the underlying prices of the Accessor International Equity Fund’s securities, but it does establish a rate of exchange that can be achieved in the future. Although forward foreign currency contracts limit the risk of loss due to a decline in the value of the hedged currency, they also limit any potential gain that might result should the value of the currency increase. In addition, the Fund could be exposed to risks if the counterparties to the contracts are unable to meet the terms of their contracts.
Options Transactions: Certain Funds may purchase and write call and put options on securities and securities indices, provided such options are traded on a national securities exchange or an over-the-counter market. The Accessor International Equity Fund may also purchase and sell call and put options on foreign currencies.
When any of the Funds writes or purchases a covered call or put option, an amount equal to the premium received is included in that Fund’s statement of assets and liabilities as a liability. The amount of the liability is subsequently marked-to-market to reflect the current market value of the option. If an option expires on its stipulated expiration date or if the Fund enters into a closing purchase transaction, a gain or loss is realized. If a written call option is exercised, a gain or loss is realized for the sale of the underlying security and the proceeds from the sale are increased by the premium originally received. If a written put option is exercised, the cost of the security acquired is decreased by the premium originally received. As writer of an option, the Fund has no control over whether the underlying securities are subsequently sold (call) or purchased (put) and, as a result, bears the market risk of an unfavorable change in the price of the security or index underlying the written option.
When any of the Funds purchases a call or put option, an amount equal to the premium paid is included in that Fund’s statement of assets and liabilities as an investment, and is subsequently marked-to-market to reflect the current market value of the option. If an option expires on the
Notes to Financial Statements (Unaudited)
stipulated expiration date or if a Fund enters into a closing sale transaction, a gain or loss is realized. If a Fund exercises a call, the cost of the security acquired is increased by the premium paid for the call. If a Fund exercises a put option, a gain or loss is realized from the sale of the underlying security, and the proceeds from such sale are decreased by the premium originally paid. Written and purchased options are non-income producing securities.
The option techniques utilized are to hedge against changes in interest rates, foreign currency exchange rates or securities prices in order to establish more definitely the effective return on securities or currencies held or intended to be acquired by a Fund, to reduce the volatility of the currency exposure associated with an investment in non-U.S. securities, or as an efficient means of adjusting exposure to the bond, equity and currency markets and not for speculation.
Swap Agreements: Certain Funds may enter into interest rate, index, equity, currency exchange rate, total return and credit default swap agreements as well as purchase and sell options to enter into such swap agreements, for hedging and non-hedging purposes. These transactions would be entered into in an attempt to obtain a particular return when it is considered desirable to do so, possibly at a lower cost to a Fund than if the Fund had invested directly in the asset that yielded the desired return. Swap agreements are two-party contracts entered into primarily by institutional investors for periods ranging from a few weeks to more than one year. In a standard swap transaction, two parties agree to exchange the returns (or differentials in rates of return) earned or realized on particular predetermined investments or instruments, which may be adjusted for an interest factor. The gross returns to be exchanged or “swapped” between the parties are generally calculated with respect to a “notional amount” (i.e., the return on or increase in value of a particular dollar amount invested at a particular interest rate, in a particular foreign currency, or in a “basket” of securities representing a particular index).
Forms of swap agreements include interest rate caps, under which, in return for a premium, one party agrees to make payments to the other to the extent that interest rates exceed a specified rate, or “cap”; interest rate floors, under which, in return for a premium, one party agrees to make payments to the other to the extent that interest rates fall below a specified level, or “floor”; and interest rate collars, under which a party sells a cap and purchases a floor or vice versa, in an attempt to protect itself against interest rate movements exceeding given minimum or maximum levels. Credit default swaps are a type of swap agreement in which the protection “buyer” is generally obligated to pay the protection “seller” an upfront and/or a periodic stream of payments over the term of the contract provided that no credit event, such as a default, on a reference obligation has occurred. The credit default swap agreement may have as reference obligations one or more securities that are not currently held by a Fund. If a credit event occurs, the seller generally must pay the buyer the “par value” (full notional value) of the swap in exchange for an equal face amount of deliverable obligations of the reference entity described in the swap, or the seller may be required to deliver the related net cash amount, if the swap is cash settled. A Fund may be either the buyer or seller in the transaction. If a Fund is a buyer and no credit event occurs, the Fund may recover nothing if the swap is held through its termination date. However, if a credit event occurs, the buyer generally may elect to receive the full notional value of the swap in exchange for an equal face amount of deliverable obligations of the reference entity whose value may have significantly decreased. As a seller, a Fund generally receives an upfront payment and/or a fixed rate of income throughout the term of the swap provided that there is no credit event. As the seller, a Fund
Notes to Financial Statements (Unaudited)
would effectively add leverage to its portfolio because, in addition to its total net assets, the Fund would be subject to investment exposure on the notional amount of the swap. Credit default swap agreements involve greater risks than if a Fund had invested in the reference obligation directly since, in addition to general market risks, credit default swaps are subject to illiquidity risk, counterparty risk and credit risk. A Fund will enter into credit default swap agreements only with counterparties that meet certain standards of creditworthiness.
Total return swap agreements are contracts in which one party agrees to make periodic payments based on the change in market value of underlying assets, which may include a specified security, basket of securities, defined portfolios of bonds, loans and mortgages, or securities indexes during the specified period, in return for periodic payments based on a fixed or variable interest rate or the total return from other underlying assets. Total return swap agreements may be used to obtain exposure to a security or market without owning or taking physical custody of such security or market. Total return swap agreements may effectively add leverage to a Fund’s portfolio because, in addition to its total net assets, the Fund would be subject to investment exposure on the notional amount of the swap. Total return swaps are a mechanism for the user to accept the economic benefits of asset ownership without utilizing the balance sheet. The other leg of the swap, usually LIBOR, is spread to reflect the non-balance sheet nature of the product. Total return swaps can be designed with any underlying asset agreed between two parties. Typically no notional amounts are exchanged with total return swaps. Total return swap agreements entail the risk that a party will default on its payment obligations to a Fund thereunder. Swap agreements also entail the risk that a Fund will not be able to meet its obligation to the counterparty. Generally, a Fund will enter into total return swaps on a net basis (i.e., the two payment streams are netted out with the Fund receiving or paying, as the case may be, only the net amount of the two payments).
Most swap agreements entered into by a Fund calculate the obligations of the parties to the agreement on a “net basis.” Consequently, a Fund’s current obligations (or rights) under a swap agreement will generally be equal only to the net present value of amounts to be paid or received under the agreement based on the relative values of the positions held by each party to the agreement (the “net amount”). A Fund’s current obligations under a swap agreement will be accrued daily (offset against amounts owed to the Fund), and any accrued but unpaid net amounts owed to a swap counterparty will be covered by the maintenance of a segregated account consisting of assets determined to be liquid by Forward Management or the appropriate Money Manager, in accordance with procedures established by the Board of Trustees to limit any potential leveraging of a Fund’s portfolio.
Obligations under swap agreements so covered will not be construed to be “senior securities” for purposes of the Funds’ investment restriction concerning senior securities. A Fund will not enter into a swap agreement with any single party if the net amount owed or to be received under existing contracts with that party would exceed 5% of the Fund’s assets.
Whether a Fund’s use of swap agreements will be successful in furthering its investment objective will depend on Forward Management’s or the appropriate Money Manager’s ability to correctly predict whether certain types of investments are likely to produce greater returns than other investments. Because they are two-party contracts and because they may have terms of greater than seven days, swap agreements may be considered to be illiquid investments. Moreover, a Fund bears the risk of loss of the amount expected to be received under a swap agreement in the event of the default or
Notes to Financial Statements (Unaudited)
bankruptcy of a swap agreement counterparty. A Fund will enter into swap agreements only with counterparties that meet certain standards for creditworthiness (generally, such counterparties would have to be eligible counterparties under the terms of the Fund’s repurchase agreement guidelines). Certain restrictions imposed on the Funds by the Internal Revenue Code of 1986, as amended (the “Code”), may limit a Fund’s ability to use swap agreements. The swap market is a relatively new market and is largely unregulated. It is possible that developments in the swap market, including potential government regulation, could adversely affect a Fund’s ability to terminate existing swap agreements or to realize amounts to be received under such agreements.
Structured Notes: The Accessor Strategic Alternatives Fund, as part of its investment objective, may invest in structured notes, which are debt obligations that also contain an embedded derivative component with characteristics that adjust the obligation’s risk/return profile. Generally, the performance of a structured note will track that of the underlying debt obligation and the derivative embedded within it. The Fund has the right to receive periodic interest payments from the issuer of the structured notes at an agreed-upon interest rate and a return of the principal at the maturity date.
Structured notes are typically privately negotiated transactions between two or more parties. The Fund bears the risk that the issuer of the structured note will default or become bankrupt. The Fund bears the risk of the loss of its principal investment and periodic interest payments expected to be received for the duration of its investment in the structures notes.
In the case of structured notes on credit default swaps, the Fund is also subject to the credit risk of the corporate credits underlying the credit default swaps. If one of the underlying corporate credit defaults, the Fund may receive the security that has defaulted, or alternatively a cash settlement may occur, and the Funds’ principal investment in the structured note would be reduced by the corresponding face value of the defaulted security.
The Fund intends to invest in equity-linked structured notes (which would be linked to an equity index) to a significant extent. A highly liquid secondary market may not exist for the structured notes the Fund invests in, and there can be no assurance that a highly liquid secondary market will develop. The lack of a highly liquid secondary market may make it difficult for the Fund to sell the structured notes they hold at an acceptable price or accurately value such notes.
The market for structured notes may be, or suddenly can become, illiquid. The other parties to the transaction may be the only investors with sufficient understanding of the derivative to be interested in bidding for it. Changes in liquidity may result in significant, rapid, and unpredictable changes in the prices for structured notes. In certain cases, a market price for a credit-linked security may not be available. The collateral for a structured not may be one or more credit default swaps, which are subject to additional risks.
Forward Commitments: The Funds (other than the Allocation Funds) may contract to purchase securities for a fixed price at a transaction date beyond the customary settlement period (i.e., “when issued,” “delayed delivery,” “forward commitment,” or “TBA transactions”) consistent with a Fund’s ability to manage its investment portfolio and meet redemption requests. These transactions involve a commitment by a Fund to purchase securities for a predetermined price or yield with payment and delivery taking place more than three days in the future, or after a period longer than the customary settlement period for that type of security. No interest will be earned by a Fund on such purchases until the securities are delivered; however the market value may change prior to delivery.
Notes to Financial Statements (Unaudited)
Each Fund may enter into TBA sale commitments to hedge its positions or to sell mortgage-backed securities it owns under delayed delivery arrangements. Proceeds of TBA sale commitments are not received until the contractual settlement date. During the time a TBA sale commitment is outstanding, equivalent deliverable securities, or an offsetting TBA purchase commitment deliverable on or before the sale commitment date, are held as “cover” for the transaction.
Unsettled TBA sale (purchase) commitments are valued at the current market value of the underlying securities, according to the procedures described under “Security Valuation” above. The contract is adjusted to market value daily and the change in market value is recorded by the Fund as an unrealized gain or loss. If the TBA sale (purchase) commitment is closed through the acquisition of an offsetting purchase (sale) commitment, the Fund realizes a gain or loss from the sale of the securities based upon the unit price established at the date the commitment was entered into.
Dollar Rolls: The Funds may enter into mortgage dollar rolls (principally using TBAs) in which each Fund sells mortgage securities for delivery in the current month and simultaneously contracts to repurchase substantially similar securities at an agreed upon price on a fixed date. Each Fund accounts for such dollar rolls under the purchases and sales method and receives compensation as consideration for entering into the commitment to repurchase. Each Fund must maintain liquid securities having a value not less than the repurchase price (including accrued interest) for such dollar rolls. The market value of the securities that each Fund is required to purchase may decline below the agreed upon repurchase price of those securities.
Collateralized Debt Obligations: The Funds may invest in collateralized debt obligations (“CDOs”), which include collateralized loan obligations (“CLOs”) and other similarly structured securities. CLOs are a type of asset-backed securities. A CLO is a trust typically collateralized by a pool of loans, which may include, among others, domestic and foreign senior secured loans, senior unsecured loans, and subordinate corporate loans, including loans that may be rated below investment grade or equivalent unrated loans. CDOs may charge management fees and administrative expenses. For CDOs, the cash flows from the trust are split into two or more portions, called tranches, varying in risk and yield. The riskiest portion is the “equity” tranche which bears the bulk of defaults from the bonds or loans in the trust and serves to protect the other, more senior tranches from default in all but the most severe circumstances. Since it is partially protected from defaults, a senior tranche from a CDO trust typically has a higher rating and lower yield than their underlying securities, and can be rated investment grade. Despite the protection from the equity tranche, CDO senior tranches can experience substantial losses due to actual defaults, increased sensitivity to defaults due to collateral default and disappearance of protecting tranches, market anticipation of defaults, as well as aversion to CDO securities as a class. The risks of an investment in a CDO depend largely on the type of the collateral securities and the class of the CDO in which a Fund invests. Normally, CLOs and other CDOs are privately offered and sold, and thus, are not registered under the securities laws. As a result, investments in CDOs may be characterized by the Funds as illiquid securities; however, an active dealer market may exist for CDOs allowing a CDO to qualify for Rule 144A transactions. In addition to the normal risks associated with fixed income securities (e.g., interest rate risk and default risk), CDOs carry additional risks including, but not limited to: (i) the possibility that distributions from collateral securities will not be adequate to make interest or other payments; (ii) the quality of the
Notes to Financial Statements (Unaudited)
collateral may decline in value or default; (iii) the Funds may invest in CDOs that are subordinate to other classes; and (iv) the complex structure of the security may not be fully understood at the time of investment and may produce disputes with the issuer or unexpected investment results.
Stripped Mortgage-Backed Securities: Stripped mortgage-backed securities are derivative multiple-class mortgage-backed securities. Stripped mortgage-backed securities usually have two classes that receive different proportions of interest and principal distributions on a pool of mortgage assets. Typically, one class will receive some of the interest and most of the principal, while the other class will receive most of the interest and the remaining principal. In extreme cases, one class will receive all of the interest (“interest only” or “IO” class) while the other class will receive the entire principal (“principal only” or “PO” class). The cash flow and yields on IOs and POs are extremely sensitive to the rate of principal payments (including prepayments) on the underlying mortgage loans or mortgage-backed securities. A rapid rate of principal payments may adversely affect the yield to maturity of IOs. Slower than anticipated prepayments of principal may adversely affect the yield to maturity of a PO. The yields and market risk of interest only and principal only stripped mortgage-backed securities, respectively, may be more volatile than those of other fixed income securities, including traditional mortgage-backed securities.
Repurchase Agreements: The Funds may enter into repurchase agreements (agreements to purchase securities—generally securities of the U.S. Government, its agencies or instrumentalities—subject to the seller’s agreement to repurchase them at a specified time and price) with well established dealers or institutions that Forward Management or the appropriate Money Manager has determined to be creditworthy. It is the Funds’ policy to take possession of the underlying securities as collateral and, on a daily basis, mark-to-market such securities to ensure that the market value including accrued interest is at least equal to the amount owed to the Funds under each repurchase agreement.
Set forth below is the collateral for the Money Fund’s Repurchase Agreement on June 30, 2009. As of June 30, 2009, this is the only Accessor Fund with a Repurchase Agreement.
| | | | | | | | | | |
ISSUER OF
REPURCHASE
AGREEMENT | | ISSUER(S) | | PAR | | INTEREST RATE | | MATURITY DATE | | MARKET VALUE |
South Street | | Various U.S.
Government Agencies | | $15,688,200-$37,500,000 | | 0.140%-1.750% | | 8/6/09-4/20/11 | | $105,060,075 |
Distributions to Shareholders: Distributions from net investment income, if any, are declared daily and paid monthly for the Money Fund; declared and paid monthly for the Bond Funds, the Accessor Limited Duration U.S. Government Fund, Accessor Income Allocation Fund, Accessor Income & Growth Allocation Fund and Accessor Balanced Allocation Fund; declared and paid quarterly for the other Equity Funds, the Accessor Total Return Fund, Accessor Strategic Alternatives Fund, and the other Allocation Funds; and declared and paid annually for the Accessor International Equity Fund and Accessor Frontier Markets Fund. Distributions of net realized gains, if any, will be declared and paid at least annually for all Funds. Distributions to shareholders are recorded on the ex-dividend date.
Income distributions and capital gain distributions are determined in accordance with income tax regulations which may differ from generally accepted accounting principles.
Notes to Financial Statements (Unaudited)
Federal Income Taxes: It is each Fund’s intention to continue to comply with the requirements of Subchapter M of the Code to qualify as a regulated investment company. Subchapter M requires a regulated investment company to distribute substantially all of its taxable income and net realized gains, if any, to shareholders. By distributing all of its taxable income and realized gains to shareholders, a Fund will not be subject to Federal income or excise tax. Accordingly, no provision for Federal income taxes is required in the financial statements.
Each Fund files a tax return annually using tax accounting methods required under provisions of the Code which may differ from generally accepted accounting principles, the basis on which these financial statements are prepared. The differences arise primarily from the treatment of foreign currency transactions and futures contracts and the deferral of certain losses under Federal income tax regulations. Accordingly, the amount of net investment income and net realized gains or losses reported in the annual financial statements may differ from that reported in each Fund’s tax return and, consequently, the character of distributions to shareholders reported in the statements of changes in net assets and financial highlights may differ from that reported to shareholders for Federal income tax purposes.
Other Expenses: Shared expenses incurred by the Trust are allocated among the Funds based on each Fund’s ratio of relative net assets to the combined net assets. Specifically identified direct expenses are charged to each Fund as incurred to the extent practicable. Investment income, realized and unrealized gains and losses and Fund expenses not specific to any class of shares are prorated among the classes based upon the relative net assets of each class. Certain specifically identified direct expenses of each class are charged to that class as incurred.
Illiquid or Restricted Securities: The Funds (other than the Accessor Limited Duration U.S. Government Fund, the U.S. Government Money Fund and the Allocation Funds) are permitted to invest in securities that are subject to legal or contractual restrictions on resale. These securities generally may be resold in transactions exempt from registration or to the public once the securities are registered. Disposal of these securities may involve time-consuming negotiations and expense, and prompt sale at an acceptable price may be difficult. Information relating to restricted securities held as of June 30, 2009 is detailed in the Schedules of Investments, as applicable.
Each Fund (except the Allocation Funds) may invest a portion of its net assets not to exceed 15% in securities that are illiquid (except the Money Fund, which may not exceed 10%). Illiquid securities are securities that cannot be sold within seven days in the ordinary course of business at the approximate amount at which the Funds have valued the securities. Certain restricted securities are not subject to the 15% limitation if Forward Management determines that such security is liquid pursuant to procedures approved by the Board of Trustees.
Redemption Fees: Shares exchanged or redeemed from the Equity Funds, the Accessor High Yield Bond Fund and Accessor Strategic Alternatives Fund within 90 days from the date of purchase were previously subject to a redemption fee equal to 2% of the proceeds of the redeemed or exchanged shares. These fees, which are retained by these Funds, are accounted for as an addition to paid-in-capital. Cost of redemptions reported in the Statements of Changes in Net Assets is reported net of such fees. Effective September 1, 2008, the 2% redemption fee on these Funds was eliminated.
ReFlow Transactions: Effective September 1, 2008, the Funds may participate in ReFlow, a
Notes to Financial Statements (Unaudited)
program designed to provide an alternative liquidity source for mutual funds experiencing redemptions of their shares. In order to pay cash to shareholders who redeem their shares on a given day, a mutual fund typically must hold cash in its portfolio, liquidate portfolio securities, or borrow money, all of which impose certain costs on the Fund. ReFlow provides participating mutual funds with another source of cash by standing ready to purchase shares from a Fund equal to the amount of the Fund’s net redemptions on a given day. ReFlow then generally redeems those shares when the Fund experiences net subscriptions. In return for this service, the Funds will pay a fee to ReFlow at a rate determined by a daily auction with other participating mutual funds. The costs to a Fund for participating in ReFlow are expected to be influenced by and comparable to the cost of other sources of liquidity, such as the Fund’s short-term lending arrangements or the costs of selling portfolio securities to meet redemptions. ReFlow is prohibited from acquiring more than 3% of the outstanding voting securities of any Fund.
ReFlow Management Co., LLC, the entity that facilitates the day-to-day operations of ReFlow, is under common control with Forward Management, the investment advisor to the Funds. In light of this, the Board of Trustees has adopted certain procedures to govern the Funds’ participation in ReFlow. ReFlow fees that were incurred by the Accessor Small to Mid Cap Fund, Accessor International Equity Fund, Accessor High Yield Bond Fund, Accessor Investment Grade Fixed-Income, Accessor Income & Growth Allocation Fund, Accessor Growth & Income Allocation Fund and Accessor Growth Allocation Fund during the six months ended June 30, 2009 are recorded in the Statement of Operations. During that same period, there were no ReFlow fees incurred by the other Accessor Funds.
Lending of Portfolio Securities: Each Fund from time to time may lend portfolio securities to broker-dealers, banks or institutional borrowers of securities. The loans are secured by collateral in the form of cash that is equal to at least 102% of the fair value of the securities loaned plus accrued interest, if any. Upon lending its securities to third parties, a Fund receives compensation in the form of income on the investment of the cash collateral. Gain or loss in the fair value of the securities loaned that may occur during the term of the loan will be for the account of the Fund. The Fund has the right under the lending agreement to recover the securities from the borrower on demand, and loans are subject to termination by the lending Fund or the borrower at any time. While the lending Fund does not have the right to vote securities on loan, it intends, to the extent practicable, to terminate the loan and regain the right to vote if the matter to be voted upon is considered significant with respect to the investment. Additionally, the Fund does not have the right to sell or repledge collateral received in the form of securities unless the borrower goes into default. The risks to a Fund of securities lending are that the borrower may not provide additional collateral when required or return the securities when due. The Fund receives cash collateral which may be invested in the Brown Brothers Investment Trust Securities Lending Investment Fund. The Fund bears the risk of any income or gains and losses from investing and reinvesting cash pledged as collateral. This collateral must be valued daily and should the market value of the loaned securities increase the borrower must furnish additional collateral to the lending Fund. During the time portfolio securities are on loan, the borrower pays the lending Fund the economic equivalent of any dividends or interest paid on such securities. In the event the borrower defaults on its obligation to the lending Fund, the lending Fund could experience delays in recovering its securities and possible capital
Notes to Financial Statements (Unaudited)
losses. As of June 30, 2009, there were no Funds with securities on loan and during the six-month period June 30, 2009 there was no securities lending activity in the Funds.
3. Related Party Transactions
Manager: The Trust has entered into an investment management agreement with Forward Management pursuant to which Forward Management provides investment management services to the Funds and is entitled to receive a fee calculated daily and payable monthly at the following annual rates (prior to September 1, 2008, Accessor Capital Management LP was the Accessor Funds’ investment manager and the fees were identical):
| | | |
FUND | | ANNUAL
MANAGEMENT
FEE | |
Accessor Growth | | 0.45 | % |
Accessor Value | | 0.45 | % |
Accessor Small to Mid Cap | | 0.60 | % |
Accessor International Equity | | 0.55 | % |
Accessor Total Return | | 0.12 | % |
Accessor Strategic Alternatives | | 0.70 | % |
Accessor Frontier Markets | | 0.85 | % |
Accessor High Yield Bond | | 0.36 | % |
Accessor Investment Grade Fixed-Income | | 0.33 | % |
Accessor Mortgage Securities | | 0.36 | % |
Accessor Limited Duration U.S. Government | | 0.12 | % |
Accessor U.S. Government Money | | 0.08 | % |
Accessor Income Allocation | | 0.10 | %1 |
Accessor Income & Growth Allocation | | 0.10 | %1 |
Accessor Balanced Allocation | | 0.10 | %1 |
Accessor Growth & Income Allocation | | 0.10 | %1 |
Accessor Growth Allocation | | 0.10 | %1 |
Accessor Aggressive Growth Allocation | | 0.10 | %1 |
1 Forward Management has contractually agreed to waive its investment management fee and reimburse the Allocation Fund’s transfer agent fees until April 30, 2010.
The Trust has obtained an exemptive order from the Securities and Exchange Commission (“SEC”) that allows the Allocation Funds to enter into a special servicing agreement with the Underlying Funds under which the Underlying Funds will pay the expenses of the Allocation Funds (other than the Allocation Funds’ direct management fees, distribution and service fees, and administrative services fees) to the extent that the Underlying Funds derive additional financial and other benefits as a result of investments from the Allocation Funds. None of the expenses incurred by the Allocation Funds for the period ended June 30, 2009 were paid by the Underlying Funds.
Money Managers: Each Fund (other than the Money Fund, the Alternative Funds and the Allocation Funds) is sub-advised by a Money Manager, researched and recommended by Forward Management. During the period ended June 30, 2009, the Money Managers received a fee based on the average daily net assets aggregated across all the classes of each Fund as set forth below. This fee is accrued daily and paid monthly.
| | |
| FUND | | ANNUAL FEE |
Accessor Growth | | 0.25% |
Accessor Value | | 0.25% |
Accessor Small to Mid Cap | | 0.40% |
Accessor International Equity | | 0.45% on assets up to $500 million |
| | 0.425% on assets over $500 million and up to $1 billion |
| | 0.40% on assets over $1 billion |
Accessor Total Return | | 0.50% |
Accessor High Yield Bond | | 0.25% |
Accessor Investment Grade Fixed-Income | | 0.25% |
Accessor Mortgage Securities | | 0.25% on assets up to $100 million |
| | 0.20% on assets over $100 million up to $200 million |
| | 0.15% over $200 million |
Accessor Limited Duration U.S. Government | | 0.35% on assets up to $25 million |
| | 0.25% on assets over $25 million up to $100 million |
| | 0.20% on all assets above $100 million |
Notes to Financial Statements (Unaudited)
For the Money Managers of the Accessor Growth Fund and Accessor Value Fund (Smith Asset Management Group and Acadian Asset Management, respectively) each Money Manager is paid a base fee (“Base Rate”) of 0.25% plus a performance component (“Performance Adjustment”). The Performance Adjustment rate will increase or decrease proportionately to the difference in performance (the “Performance Difference”) between the Fund and its benchmark index.
With regard to the Accessor Growth Fund, to the extent that the Performance Difference between the Fund and the S&P 500/Citigroup Growth Index falls within a “null zone” that is equal to plus 100 basis points (1.00%) or minus 100 basis points (-1.00%), the Performance Adjustment rate shall be zero and there shall be no Performance Adjustment. The Performance Adjustment rate shall not exceed an absolute value of 15 basis points (0.15%) and the maximum Performance Adjustment rate shall be made when the Performance Difference reaches plus or minus 350 basis points (3.50%). Therefore, the minimum possible annual fee payable to the Money Manager will be 10 basis points (0.10%) and the maximum possible annual fee will be 40 basis points (0.40%).
With regard to the Accessor Value Fund, to the extent that the Performance Difference between the Fund and the S&P 500/Citigroup Value Index falls within a “null zone” that is equal to plus 75 basis points (0.75%) or minus 75 basis points (-0.75%), the Performance Adjustment rate shall be zero and there shall be no Performance Adjustment. The Performance Adjustment rate shall not exceed an absolute value of 5 basis points (0.05%) and the maximum Performance Adjustment rate shall be made when the Performance Difference reaches plus or minus 325 basis points (3.25%). Therefore, the minimum possible annual fee payable to the Money Manager will be 20 basis points (0.20%) and the maximum possible annual fee will be 30 basis points (0.30%).
| | | | | | | | | |
| FUND | | BASE
ADVISORY FEE | | | PERFORMANCE FEE
ADJUSTMENT RATE | | | PERFORMANCE
DIFFERENCE | |
Growth | | 0.25 | % | | +/-0.15 | % | | 1.00 | % |
Value | | 0.25 | % | | +/-0.05
| %
| | 0.75 | % |
During the period ended June 30, 2009, the Funds’ Money Manager fees were adjusted in accordance with the policy described above as follows:
| | | | | | | | | |
| FUND | | BASE
ADVISORY FEE | | PERFORMANCE FEE
ADJUSTMENT RATE | | MONEY
MANAGER FEE |
Growth | | $ | 94,211 | | $ | 23,259 | | $ | 117,470 |
Value | | | 86,920 | | | 4,395 | | | 91,315 |
Distribution and Service Plans: The Trust has adopted Distribution and Service Plans (the “Plans”) under Rule 12b-1 of the 1940 Act with respect to the Investor Class Shares, A Class Shares and C Class Shares of each Fund to compensate the distributor of the Accessor Funds, SEI Investments Distribution Co. (the “Distributor”), and/or third party intermediaries or other service organizations for providing distribution and non-distribution-related services to certain shareholders of the Trust. Under the terms of these Plans, the Trust will pay the Distributor and/or third party selling and distribution agents for sales and promotional efforts including printing of prospectuses and reports used for sales purposes. The Trust will also pay third party service organizations for providing non-distribution related services such as account maintenance services.
The maximum amount payable to the Distributor and/or third party selling and distribution agents under the Plans, in aggregate, may not exceed on an annual basis 0.25% of the average daily net assets of each Fund attributable to Investor Class Shares; 0.35% of the average daily net assets of each Fund attributable to A Class Shares of the Equity Funds, the Accessor Frontier Markets Fund and the Allocation Funds (except the Accessor Income Allocation Fund);
Notes to Financial Statements (Unaudited)
0.25% of the average daily assets of each Fund attributable to A Class Shares of the Accessor High Yield Bond Fund, the Money Fund and the Accessor Income Allocation Fund; and 1.00% of the average daily net assets of each Fund attributable to C Class Shares (0.75% for distribution and 0.25% for shareholder service fees). As of June 30, 2009, the Accessor Limited Duration U.S. Government Fund and Accessor Total Return Fund do not have a class of shares that pays a Rule 12b-1 fee.
The Board may temporarily reduce and/or eliminate the payment of Rule 12b-1 fees with respect to the Money Fund to assist the Money Fund’s efforts to maintain a $1.00 NAV per share. Any reduction and/or elimination of the Money Fund’s Rule 12b-1 fees may be reinstated by the Board at any time. Effective January 13, 2009, the Board of Trustees temporarily reduced the payment of Rule 12b-1 fees for C Class Shares of the Money Fund to 50 basis points (0.50%). Effective February 1, 2009, the Board of Trustees temporarily reduced the payment of Rule 12b-1 fees for C Class Shares of the Money Fund to 25 basis points (0.25%) and temporarily eliminated Rule 12b-1 fees for Investor Class Shares of the Money Fund. Effective April 1, 2009, the Board of Trustees eliminated Rule 12b-1 fees for A Class and C Class Shares of the Money Fund.
Distributor: The Funds’ distribution and service plans for the Investor Class Shares, A Class Shares and the C Class Shares allow each class to pay distribution and service fees to the Distributor, which may pay some or all of these fees to financial intermediaries for sales and distribution-related activities and for providing non-distribution related shareholder services. The distribution and service fee is paid to each financial intermediary that enters into a selling agreement with the Distributor or a services agreement with the Accessor Funds based on the average daily net assets of accounts attributable to such intermediary.
Further, under the A Class Shares and C Class Shares distribution and service plan, the Distributor will generally retain the first year of the distribution and service fees attributable to purchases of A Class Shares and will retain the distribution and service fees attributable to purchases of C Class Shares for which a broker-dealer has received an up-front commission payment from the Distributor. The Distributor may retain the distribution and service fee for accounts not attributable to a broker-dealer. Certain A Class Shares and C Class Shares are subject to a 0.50% and 1.00% contingent deferred sales charge (“CDSC”) for shares sold within 18 months and twelve months, respectively, after the date of purchase. Any CDSC is paid to the Distributor. The Distributor may remit portions of the CDSC payments and certain 12b-1 payments to Forward Management to compensate Forward Management for financing the 0.50% and 1.00% up-front payment of the distribution and service fees to broker-dealers pursuant to certain A Class Shares and C Class Shares financing and servicing arrangements between the Distributor and Forward Management.
Other Compensation to Dealers: The Distributor may pay or sponsor informational meetings for dealers as described in the Statement of Additional Information. The Distributor may, for specified periods, allow dealers to retain the full sales charge for sales of shares or may pay additional concession to a dealer who sells a minimum dollar amount of the Funds’ shares. In some instances, such additional concessions will be offered only to certain dealers expected to sell significant amounts of shares. In addition, the Distributor or Forward Management may pay additional compensation, out of their own assets, to certain intermediaries or their affiliates, based on sales or assets attributable to the intermediary, or such other criteria agreed to by the Distributor. The intermediaries to which payments may be made are determined by the
Notes to Financial Statements (Unaudited)
Distributor. These payments may provide an incentive, in addition to any deferred sales charge, to these firms to actively promote the Funds, cooperate with the Distributor or provide marketing or service support to the Funds. For more information, please see the Statement of Additional Information.
Forward Management may make payments, out of its own assets, to certain intermediaries based on sales or assets attributable to the intermediary, or such other criteria agreed to by Forward Management. The intermediaries to which payments may be made are determined by Forward Management. These payments are in addition to other payments such as sales charges, Rule 12b-1 fees or deferred sales charges, and may provide an incentive, in addition to any sales charge, to these firms to actively promote the Accessor Funds or to provide marketing or service support to the Accessor Funds. Please see the Statement of Additional Information for more information.
Administrative Services Plan: The Funds have adopted an Administrative Services Plan with respect to the Investor Class Shares of each Fund (with the exception of the Alternative Funds). Pursuant to the Investor Class Shares Administrative Services Plan, the Trust will pay third party service organizations who provide administrative and support services. The amount payable to service organizations under the Administrative Services Plan for these expenses on an annual basis is up to 0.25% of the average daily net assets of each Fund attributable to Investor Class Shares, provided, however, that no Fund shall directly or indirectly pay any distribution-related amounts that will be allocated under the Funds’ Distribution and Service Plan. For the period ended June 30, 2009, the Board of Trustees temporarily eliminated the Administrative Services Fees of the Investor Class Shares of the Money Fund.
Shareholder Services Plans: The Alternative Funds have adopted a Shareholder Services Plan with respect to Investor Class Shares of each Alternative Fund. Effective December 31, 2008, up to 0.15% of each Fund’s average daily net assets attributable to Investor Class Shares may be used to pay shareholder servicing fees. On May 1, 2009, each of the Funds (except the Accessor U.S. Government Money Fund and the Allocation Funds) has adopted a Shareholder Services Plan pursuant to which up to 0.10% of each Fund’s average daily net assets attributable to Institutional Class Shares may be used to pay shareholder servicing fees.
Money Fund Administrative Plan: The Money Fund has adopted an Administrative Plan with respect to Institutional Class Shares, Investor Class Shares, A Class Shares and C Class Shares of the Money Fund. Pursuant to the Administrative Plan, the Money Fund will pay Forward Management for certain administrative, informational and support services to investors who may from time to time beneficially own Money Fund shares either directly or through omnibus accounts. The amount payable to Forward Management is up to 0.25% of the average daily net assets of the Institutional Class Shares, Investor Class Shares, A Class Shares and C Class Shares of the Money Fund, respectively; provided, however, that the Money Fund shall not directly or indirectly pay any distribution or non-distribution related amounts for the Investor Class Shares, A Class Shares or C Class Shares that will be allocated under the Funds’ Distribution and Service Plans or any non-distribution related amounts for the Investor Class Shares that will be allocated under the Funds’ Administrative Services Plan.
Transfer Agent: Prior to May 1, 2009, Forward Management served as the Accessor Funds’ transfer agent pursuant to a Transfer Agency and Services Agreement between the Trust and
Notes to Financial Statements (Unaudited)
Forward Management. Pursuant to this agreement, Forward Management acted as transfer agent, performing transfer agency and certain compliance services. Effective May 1, 2009, the Trust, on behalf of the Accessor Funds, entered into a Transfer Agency Agreement with ALPS Fund Services, Inc. (“ALPS”) pursuant to which ALPS provides transfer agency, registrar, dividend disbursing and certain other services to the Accessor Funds.
Forward Management has contractually agreed to reimburse the Allocation Funds’ transfer agency fees from May 1, 2009 through April 30, 2010.
Administration Agreement: Pursuant to an Administration Agreement, SEI Investments Global Funds Services (the “Administrator”), a wholly owned subsidiary of SEI Investments Company, acts as the Funds’ Administrator with regard to the Accessor Funds. Under the terms of the Administration Agreement dated December 31, 2006, as amended February 21, 2008, and which was assigned to Forward Funds effective September 1, 2008, the Administrator is entitled to receive an annual fee of 0.05% of the first $3 billion in aggregate net assets and 0.04% of aggregate net assets in excess of $3 billion of the Equity Funds, the Bond Funds, the Accessor Limited Duration U.S. Government Fund, Accessor Total Return Fund, the Alternative Funds and the Money Fund. The Administrator is entitled to receive an annual fee of 0.01% of average net assets of each of the Allocation Funds. The Funds are subject to a minimum annual fee of $960,000. The Administrator may be compensated for performing supplemental administrative services to the Accessor Funds, as requested, pursuant to a separate agreement.
Trustee and Officer Fees and Expenses: The Funds do not pay any compensation directly to the officers or trustees who are also trustees, officers or employees of Forward Management or its affiliates, except as noted below. As of June 30, 2009, there were four Trustees, three of whom are not “interested persons” of the Trust within the meaning of that term under the 1940 Act (each, an “Independent Trustee”). Effective September 1, 2008, the Trust, on behalf of the Funds, pays each Independent Trustee a retainer fee in the amount of $25,000 per year, $10,000 each per regular meeting for attendance in person, $5,000 each per regular meeting for attendance by telephone, $3,000 each for attendance in person at each special meeting that is not held in conjunction with a regular meeting, and $2,250 for attendance at a special telephonic meeting. The Chairman of the Board of Trustees and the Chairman of the Audit Committee each receive a special retainer fee in the amount of $10,000 per year. In addition, reasonable expenses of the Board of Trustees are reimbursed by the Funds. The Trust receives no compensation from the Funds.
As mentioned above, each of the Accessor Funds (with the exception of the Accessor Frontier Markets Fund) are successors to previously operational funds which were series of Accessor Funds, Inc., a Maryland corporation, and were reorganized into the corresponding Accessor Fund effective September 1, 2008. Prior to September 1, 2008, each Director of the Board of Directors of Accessor Funds, Inc. received a fee of $5,000 for each meeting attended.
The Accessor Funds’ Chief Compliance Officer is employed by Forward Management. The Accessor Funds pay an allocated portion of the Chief Compliance Officer’s compensation and other related expenses, subject to approval by the Board of Trustees.
4. Derivative Instruments and Hedging Activities
The Funds have adopted the provisions of FASB SFAS No. 161 “Disclosures about Derivative Instruments and Hedging Activities”. SFAS No. 161 has established improved financial
Notes to Financial Statements (Unaudited)
reporting about derivative instruments and hedging activities as it relates to disclosure associated with these types of investments. The following discloses the amounts related to the Funds use of derivative instruments and hedging activities.
The following table summarizes the written options for the period ended June 30, 2009:
| | | | | | | |
| Accessor Investment Grade Fixed-income | | NUMBER OF
CONTRACTS | | | IDENTIFIED PROCEEDS | |
Options outstanding, December 31, 2008 | | — | | | $ | — | |
Options written | | 73 | | | | (26,703 | ) |
Options expired | | (55 | ) | | | 19,234 | |
Options exercised | | (10 | ) | | | 5,654 | |
Options closed | | — | | | | — | |
| | | | | | | |
Options outstanding, June 30, 2009 | | 8 | | | $ | (1,815 | ) |
| | | | | | | |
Fair Value of Derivative Instruments—The fair value of derivative Instruments as of June 30, 2009, was as follows:
| | | | | | | | | | | |
| | | ASSET DERIVATIVES | | LIABILITY DERIVATIVES | |
DERIVATIVES NOT ACCOUNTED
FOR AS HEDGING INSTRUMENTS
UNDER STATEMENT 133: | | BALANCE SHEET
LOCATION | | FAIR VALUE | | BALANCE SHEET
LOCATION | | FAIR VALUE | |
| Investment Grade Fixed-Income Fund | | | | | | | | | |
Futures Contracts | | | | | | | | | | | |
Eurodollars | | Net Assets — Net unrealized appreciation/(depreciation) on futures* | | $ | 573,951 | | Net Assets — Net unrealized appreciation/(depreciation) on futures* | | $ | (7,216 | ) |
Treasuries | | Net Assets — Net unrealized appreciation/(depreciation) on futures* | | | — | | Net Assets — Net unrealized appreciation/(depreciation) on futures* | | | (60,718 | ) |
| | | | | | | | | | | |
| | | | | 573,951 | | | | | (67,934 | ) |
Options on Euro Futures | | Investments, at value | | | — | | Written Options, at value | | | (350 | ) |
| | | | | | | | | | | |
| Total Derivatives not accounted for as hedging instruments under Statement 133 | | $ | 573,951 | | | | $ | (68,284 | ) |
| | | | | | | | | | | |
* Includes cumulative appreciation/depreciation of futures contracts as reported in the Schedule of Investments. Only current day’s variation margin is reported within the Statements of Assets & Liabilities.
There were no other Funds that held more than one type of Derivative Instrument as of June 30, 2009.
The effect of derivative instruments on the Statement of Operations for the six months ended June 30, 2009 was as follows:
| | | | | | | | | |
| | | AMOUNT OF REALIZED GAIN
OR (LOSS) ON DERIVATIVES
RECOGNIZED IN INCOME |
DERIVATIVES NOT ACCOUNTED
FOR AS HEDGING INSTRUMENTS
UNDER STATEMENT 133 | | OPTIONS | | FUTURES | | TOTAL |
Foreign Exchange | | $ | 7,920 | | $ | 90,477 | | $ | 98,397 |
Interest Rate | | | 15,646 | | | 115,004 | | | 130,650 |
| | | | | | | | | |
Total | | $ | 23,566 | | $ | 205,481 | | $ | 229,047 |
| | | | | | | | | |
Notes to Financial Statements (Unaudited)
| | | | | | | | | | | |
| | | CHANGE IN UNREALIZED APPRECIATION OR
(DEPRECIATION) ON DERIVATIVES
RECOGNIZED IN
INCOME | |
DERIVATIVES NOT ACCOUNTED
FOR AS HEDGING INSTRUMENTS
UNDER STATEMENT 133 | | OPTIONS | | FUTURES | | | TOTAL | |
Foreign Exchange | | $ | 1,465 | | $ | 137,699 | | | $ | 139,164 | |
Interest Rate | | | — | | | (206,127 | ) | | | (206,127 | ) |
| | | | | | | | | | | |
Total | | $ | 1,465 | | $ | (68,428 | ) | | $ | (66,963 | ) |
| | | | | | | | | | | |
There were no other Funds that had more than one type of Derivative Instrument on the Statement of Operations for the six months ended June 30, 2009.
5. Securities Transactions
During the period ended June 30, 2009, purchases, sales and maturities of investments, other than short-term investments and U.S. government securities, were as follows:
| | | | | | |
| | | COST OF
INVESTMENTS
PURCHASED | | PROCEEDS FROM
INVESTMENTS
SOLD AND
MATURED |
| Accessor Fund | | | | | | |
Growth | | $ | 32,834,663 | | $ | 40,124,991 |
Value | | | 47,894,965 | | | 46,652,387 |
Small to Mid Cap | | | 78,800,763 | | | 60,423,657 |
International Equity | | | 41,175,819 | | | 53,574,544 |
Total Return | | | 177,982,761 | | | 179,013,560 |
Strategic Alternatives | | | 18,795,735 | | | 16,928,960 |
Frontier Markets | | | 25,499,544 | | | 7,927,695 |
High Yield Bond | | | 106,208,779 | | | 70,805,104 |
Investment Grade Fixed-Income | | | 49,881,268 | | | 6,625,151 |
Mortgage Securities | | | — | | | 3,454,082 |
Limited Duration U.S. Government | | | 768,322 | | | 8,762 |
| | |
| Accessor Allocation Fund | | | | | | |
Income Allocation | | | 3,475,000 | | | 1,175,000 |
Income & Growth Allocation | | | 9,700,000 | | | 5,125,000 |
Balanced Allocation | | | 22,650,027 | | | 13,050,000 |
Growth & Income Allocation | | | 12,975,000 | | | 17,970,000 |
Growth Allocation | | | 15,900,000 | | | 17,175,000 |
Aggressive Growth Allocation | | | 10,350,000 | | | 8,100,034 |
During the period ended June 30, 2009, purchases and sales of long-term U.S. government securities were as follows:
| | | | | | |
| | | COST OF
INVESTMENTS
PURCHASED | | PROCEEDS FROM
INVESTMENTS
SOLD AND
MATURED |
| Accessor Fund | | | | | | |
Investment Grade Fixed-Income | | $ | 117,891,479 | | $ | 121,946,384 |
Mortgage Securities | | | 146,041,907 | | | 148,199,300 |
Limited Duration U.S. Government | | | 11,137,858 | | | 19,281,534 |
Notes to Financial Statements (Unaudited)
6. Identified Cost
The identified cost for federal income tax purposes of investments (excludes unrealized on TBA commitments, foreign currency, swap and futures contracts) owned by each Fund, their respective gross unrealized appreciation/(depreciation), and resulting net unrealized appreciation/(depreciation) at June 30, 2009.
| | | | | | | | | | | | | | |
| | | COST OF
INVESTMENTS | | GROSS
UNREALIZED
APPRECIATION | | GROSS
UNREALIZED
(DEPRECIATION) | | | NET UNREALIZED
APPRECIATION
(DEPRECIATION) | |
| Accessor Funds | | | | | | | | | | | | | | |
Growth | | $ | 82,071,618 | | $ | 6,289,973 | | $ | (12,802,048 | ) | | $ | (6,512,075 | ) |
Value | | | 84,147,870 | | | 4,730,277 | | | (17,592,965 | ) | | | (12,862,688 | ) |
Small to Mid Cap | | | 187,236,118 | | | 16,044,343 | | | (36,540,246 | ) | | | (20,495,903 | ) |
International Equity | | | 86,487,786 | | | 13,526,964 | | | (5,760,112 | ) | | | 7,766,852 | |
Total Return | | | 24,170,550 | | | 1,002,281 | | | (2,212,988 | ) | | | (1,210,707 | ) |
Strategic Alternatives | | | 115,892,497 | | | 4,163,732 | | | (24,353,569 | ) | | | (20,189,837 | ) |
Frontier Markets | | | 24,892,173 | | | 2,577,330 | | | (190,789 | ) | | | 2,386,541 | |
High Yield Bond | | | 91,568,838 | | | 4,358,309 | | | (2,063,411 | ) | | | 2,294,898 | |
Investment Grade Fixed-Income | | | 113,008,860 | | | 2,583,663 | | | (24,560,518 | ) | | | (21,976,855 | ) |
Mortgage Securities | | | 53,301,293 | | | 1,449,600 | | | (2,535,858 | ) | | | (1,086,258 | ) |
Limited Duration U.S. Government | | | 36,618,806 | | | 621,942 | | | (181,456 | ) | | | 440,486 | |
| | | | |
| Accessor Allocation Funds | | | | | | | | | | | | | | |
Income Allocation | | | 20,955,756 | | | 169,466 | | | (2,175,215 | ) | | | (2,005,749 | ) |
Income & Growth Allocation | | | 47,595,721 | | | 649,862 | | | (6,635,897 | ) | | | (5,986,035 | ) |
Balanced Allocation | | | 127,562,420 | | | 2,384,383 | | | (22,286,079 | ) | | | (19,901,696 | ) |
Growth & Income Allocation | | | 124,239,325 | | | 1,808,509 | | | (25,156,650 | ) | | | (23,348,141 | ) |
Growth Allocation | | | 124,155,231 | | | 2,097,248 | | | (27,683,092 | ) | | | (25,585,844 | ) |
Aggressive Growth Allocation | | | 64,286,699 | | | 1,103,653 | | | (16,167,289 | ) | | | (15,063,636 | ) |
7. Capital Loss Carryforwards
At December 31, 2008, for federal income tax purposes, the following Funds had capital loss carryovers which may be applied against future net taxable realized gains for each succeeding year until the earlier of their utilization or expiration:
| | | | | | | | | | | | | | | | | | | | | | | | |
| | | EXPIRES
IN 2009 | | EXPIRES
IN 2010 | | EXPIRES
IN 2011 | | EXPIRES
IN 2012 | | EXPIRES
IN 2013 | | EXPIRES
IN 2014 | | EXPIRES
IN 2015 | | EXPIRES
IN 2016 |
| Accessor Funds | | | | | | | | | | | | | | | | | | | | | | | | |
Growth | | $ | — | | $ | 4,327,104 | | $ | 3,845,553 | | $ | — | | $ | — | | $ | — | | $ | — | | $ | 14,879,476 |
Value | | | — | | | — | | | — | | | — | | | — | | | — | | | — | | | 20,195,047 |
Small to Mid Cap | | | — | | | — | | | — | | | — | | | — | | | — | | | — | | | 16,657,935 |
International Equity | | | — | | | — | | | — | | | — | | | — | | | — | | | — | | | 23,256,838 |
Total Return | | | — | | | — | | | — | | | — | | | — | | | — | | | 225,716 | | | 18,427,568 |
Strategic Alternatives | | | — | | | — | | | — | | | — | | | — | | | — | | | — | | | 865,978 |
High Yield Bond | | | — | | | 947,550 | | | — | | | — | | | 1,017,103 | | | 81,754 | | | 256,992 | | | 9,772,131 |
Mortgage Securities | | | — | | | — | | | — | | | — | | | — | | | 4,648,320 | | | — | | | 732,857 |
| Accessor Allocation Funds | | | | | | | | | | | | | | | | | | | | | | | | |
Income Allocation | | | — | | | — | | | — | | | — | | | — | | | 69,163 | | | 90,492 | | | 207,103 |
Notes to Financial Statements (Unaudited)
During the year ended December 31, 2008, Accessor Investment Grade Fixed-Income Fund utilized capital loss carryovers of $520,023, and Accessor Limited Duration U.S. Government Fund utilized capital loss carryovers of $263,598.
FIN 48: In July 2006, FASB Interpretation No. 48, Accounting for Uncertainty in Income Taxes—an interpretation of FASB Statement 109 (FIN 48), was issued and is effective for fiscal years beginning after December 15, 2006. FIN 48 has a threshold for financial statement recognition, measurement and disclosure of a tax position taken or expected to be taken on a tax return. Management has completed evaluating the impact of the adoption of FIN 48; which result in having no effect on the Funds’ net assets, results of operations and financial statement disclosures. However, Management’s conclusions regarding FIN 48 may be subject to review and adjustment at a later date based on factors including, but not limited to, further implementation guidance expected from the FASB, and on-going analyses of and changes to tax laws, regulations and interpretations thereof. The Funds file income tax returns in the U.S. federal jurisdiction. No federal income tax returns are currently under examination. The statute of limitations on the Funds’ federal and state tax return filings remains open for the prior three fiscal years.
8. Tax Basis of Distributions to Shareholders
The amount and characteristics of tax-basis distributions and composition of distributable earnings/(accumulated losses) are finalized at fiscal year-end; accordingly, tax basis balances have not been determined as of June 30, 2009. The tax character of distributions declared during 2008 were as follows:
| | | | | | | | | | | | |
| | | GROWTH | | | VALUE | | | SMALL TO
MID CAP | |
| For the year ended December 31, 2008, distributions declared from: | | | | | | | | | | | | |
Ordinary income | | $ | 310,496 | | | $ | 2,021,697 | | | | — | |
Long-term capital gains | | | — | | | | — | | | $ | 1,019,747 | |
Distributions in excess | | | 15,074 | | | | 4,889 | | | | — | |
| | | | | | | | | | | | |
| | | 325,570 | | | | 2,026,586 | | | | 1,019,747 | |
Return of capital | | | — | | | | — | | | | — | |
| | | | | | | | | | | | |
| | $ | 325,570 | | | $ | 2,026,586 | | | $ | 1,019,747 | |
| | | |
| As of December 31, 2008, the components of accumulated losses on a tax basis were as follows: | | | | | | | | | | | | |
Undistributed ordinary income | | | — | | | | — | | | $ | 415,397 | |
Accumulated capital gain (loss) | | | — | | | | — | | | | — | |
Unrealized appreciation (depreciation) | | $ | (17,642,928 | ) | | $ | (22,149,564 | ) | | | (50,161,471 | ) |
Capital loss carryforward | | | (23,052,133 | ) | | | (20,195,047 | ) | | | (16,657,935 | ) |
Post October losses | | | (8,725,252 | ) | | | (6,865,929 | ) | | | (13,566,193 | ) |
Other cumulative effect of timing differences | | | — | | | | 5,952 | | | | — | |
| | | | | | | | | | | | |
| | $ | (49,420,313 | ) | | $ | (49,204,588 | ) | | $ | (79,970,202 | ) |
Notes to Financial Statements (Unaudited)
| | | | | | | | | | | | | | | |
| | | INTERNATIONAL
EQUITY | | | TOTAL
RETURN | | | STRATEGIC
ALTERNATIVES | | | FRONTIER
MARKETS |
| For the year ended December 31, 2008, distributions declared from: | | | | | | | | | | | | | | | |
Ordinary income | | $ | 4,666,352 | | | $ | 811,639 | | | $ | 1,340,908 | | | | N/A |
Long-term capital gains | | | 3,715,510 | | | | — | | | | — | | | | N/A |
Distributions in excess | | | — | | | | 26,236 | | | | 50,944 | | | | N/A |
| | | | | | | | | | | | | | | |
| | | 8,381,862 | | | | 837,875 | | | | 1,391,852 | | | | N/A |
Return of capital | | | — | | | | — | | | | — | | | | N/A |
| | | | | | | | | | | | | | | |
| | $ | 8,381,862 | | | $ | 837,875 | | | $ | 1,391,852 | | | | N/A |
| As of December 31, 2008, the components of accumulated losses on a tax basis were as follows: | | | | | | | | | | | | | | | |
Undistributed ordinary income | | $ | 4,451,466 | | | | — | | | | — | | | | N/A |
Undistributed long-term capital gain | | | — | | | | — | | | | — | | | | N/A |
Accumulated capital gain (loss) | | | — | | | | — | | | | — | | | | N/A |
Unrealized appreciation (depreciation) | | | (2,283,045 | ) | | $ | (4,103,532 | ) | | $ | (18,114,761 | ) | | | N/A |
Capital loss carryforward | | | (23,256,838 | ) | | | (18,653,284 | ) | | | (865,978 | ) | | | N/A |
Post October losses | | | (74,374,885 | ) | | | (4,850,905 | ) | | | — | | | | N/A |
Other cumulative effect of timing differences | | | (2 | ) | | | 20,394 | | | | — | | | | N/A |
| | | | | | | | | | | | | | | |
| | $ | (95,463,304 | ) | | $ | (27,587,327 | ) | | $ | (18,980,739 | ) | | | N/A |
| | | | |
| | | HIGH YIELD
BOND | | | INVESTMENT
GRADE
FIXED-INCOME | | | MORTGAGE
SECURITIES | | | LIMITED
DURATION U.S.
GOVERNMENT |
| For the year ended December 31, 2008, distributions declared from: | | | | | | | | | | | | | | | |
Ordinary income | | $ | 5,429,122 | | | $ | 4,345,434 | | | $ | 3,153,473 | | | $ | 2,099,852 |
Long-term capital gains | | | — | | | | — | | | | — | | | | 209,020 |
Distributions in excess | | | 17,161 | | | | — | | | | 26,224 | | | | — |
| | | | | | | | | | | | | | | |
| | | 5,446,283 | | | | 4,345,434 | | | | 3,179,697 | | | | 2,308,872 |
Return of capital | | | — | | | | — | | | | — | | | | — |
| | | | | | | | | | | | | | | |
| | $ | 5,446,283 | | | $ | 4,345,434 | | | $ | 3,179,697 | | | $ | 2,308,872 |
| | | | |
| As of December 31, 2008, the components of accumulated losses on a tax basis were as follows: | | | | | | | | | | | | | | | |
Undistributed ordinary income | | | — | | | $ | 95,641 | | | | — | | | | — |
Undistributed long-term capital gain | | | — | | | | 107,060 | | | | — | | | $ | 26,340 |
Accumulated capital gain (loss) | | | — | | | | — | | | | — | | | | — |
Unrealized appreciation (depreciation) | | $ | (9,478,222 | ) | | | (11,880,032 | ) | | $ | (1,479,150 | ) | | | 629,971 |
Capital loss carryforward | | | (12,075,530 | ) | | | — | | | | (5,381,177 | ) | | | — |
Post October losses | | | (4,313,318 | ) | | | (49,507 | ) | | | — | | | | — |
Other cumulative effect of timing differences | | | — | | | | (39,000 | ) | | | — | | | | — |
| | | | | | | | | | | | | | | |
| | $ | (25,867,070 | ) | | $ | (11,765,838 | ) | | $ | (6,860,327 | ) | | $ | 656,311 |
The Accessor Growth Fund, Accessor Value Fund, Accessor Small to Mid Cap Fund, Accessor International Equity Fund, Accessor Total Return Fund, Accessor High Yield Bond Fund, Accessor Investment Grade Fixed-Income Fund, Accessor Income Allocation Fund, Accessor Balanced Allocation Fund, Accessor Growth & Income Allocation Fund, Accessor Growth Allocation Fund and Accessor Aggressive Growth Allocation Fund elected to defer to the year ended December 31, 2008, approximately $8,725,253, $6,865,929, $13,566,193, $74,374,885, $4,850,905, $4,313,318, $49,507, $65,266, $444,271,
Notes to Financial Statements (Unaudited)
$1,149,805, $517,625 and $103,566, respectively, of capital losses incurred during the period November 1, 2008 to December 31, 2008.
| | | | | | | | | | | | |
| | | U.S.
GOVERNMENT
MONEY | | | INCOME
ALLOCATION | | | INCOME &
GROWTH
ALLOCATION | |
| For the year ended December 31, 2008, distributions declared from: | | | | | | | | | | | | |
Ordinary income | | $ | 28,821,359 | | | $ | 907,170 | | | $ | 1,485,098 | |
Long-term capital gains | | | — | | | | — | | | | 257,884 | |
| | | | | | | | | | | | |
| | | 28,821,359 | | | | 907,170 | | | | 1,742,982 | |
Return of capital | | | — | | | | — | | | | — | |
| | | | | | | | | | | | |
| | $ | 28,821,359 | | | $ | 907,170 | | | $ | 1,742,982 | |
| | | |
| As of December 31, 2008, the components of accumulated losses on a tax basis were as follows: | | | | | | | | | | | | |
Undistributed ordinary income | | $ | 1,653,786 | | | $ | 648 | | | $ | 5,811 | |
Accumulated capital gain (loss) | | | — | | | | — | | | | — | |
Unrealized appreciation (depreciation) | | | — | | | | (2,731,455 | ) | | | (7,559,878 | ) |
Capital loss carryforward | | | — | | | | (366,758 | ) | | | — | |
Post October losses | | | — | | | | (65,268 | ) | | | — | |
Other cumulative effect of timing differences | | | (1,535,609 | ) | | | — | | | | — | |
| | | | | | | | | | | | |
| | $ | 118,177 | | | $ | (3,162,833 | ) | | $ | (7,554,067 | ) |
| | | | | | | | | | | | | | | | |
| | | BALANCED
ALLOCATION | | | GROWTH &
INCOME
ALLOCATION | | | GROWTH
ALLOCATION | | | AGGRESSIVE
GROWTH
ALLOCATION | |
| For the year ended December 31, 2008, distributions declared from: | | | | | | | | | | | | | | | | |
Ordinary income | | $ | 3,346,545 | | | $ | 3,271,412 | | | $ | 2,049,788 | | | $ | 561,465 | |
Long-term capital gains | | | 1,084,467 | | | | 2,272,470 | | | | 2,896,275 | | | | 1,535,632 | |
Distributions in Excess | | | 2,614 | | | | 592 | | | | 1,372 | | | | — | |
| | | | | | | | | | | | | | | | |
| | | 4,433,626 | | | | 5,544,474 | | | | 4,947,435 | | | | 2,097,097 | |
Return of capital | | | — | | | | — | | | | — | | | | — | |
| | | | | | | | | | | | | | | | |
| | $ | 4,433,626 | | | $ | 5,544,474 | | | $ | 4,947,435 | | | $ | 2,097,097 | |
| | | | |
| As of December 31, 2008, the components of accumulated losses on a tax basis were as follows: | | | | | | | | | | | | | | | | |
Undistributed ordinary income | | | — | | | | — | | | | — | | | $ | 2,444 | |
Accumulated capital gain (loss) | | | — | | | | — | | | | — | | | | — | |
Unrealized appreciation (depreciation) | | $ | (23,993,936 | ) | | $ | (28,097,138 | ) | | $ | (29,611,561 | ) | | | (16,926,133 | ) |
Post October losses | | | (444,270 | ) | | | (1,149,803 | ) | | | (517,622 | ) | | | (103,566 | ) |
Other cumulative effect of timing differences | | | — | | | | — | | | | — | | | | — | |
| | | | | | | | | | | | | | | | |
| | $ | (24,438,206 | ) | | $ | (29,246,941 | ) | | $ | (30,129,183 | ) | | $ | (17,027,255 | ) |
In accordance with accounting pronouncements, the Funds have recorded several reclassifications in the capital accounts. These classifications have no impact on the net asset value of the Funds. These differences, which may result in distribution reclassifications, are primarily due to distributions in excess of tax earnings and profits and operating loss.
Notes to Financial Statements (Unaudited)
9. Affiliated Companies
Each Allocation Fund may invest in certain securities that are considered affiliated companies. As defined by the 1940 Act, an affiliated company is one in which a Fund owns 5% or more of the outstanding voting securities, or a company which is under common ownership or control:
| | | | | | | | | | | | | | | | |
| Accessor Income Allocation Fund | | | | | | | | | | |
| | | | | |
| INVESTMENT COMPANIES | | PURCHASE
COST | | SALES
COST | | DIVIDEND
INCOME | | VALUE
6/30/2009 | | VALUE
12/31/2008 | |
| Accessors Funds — Z Class Shares | | | | | | | | | | | | | | | | |
High Yield Bond | | $ | 250,000 | | $ | 200,000 | | $ | 158,461 | | $ | 3,600,780 | | $ | 3,095,113 | |
Investment Grade Fixed-Income | | | 2,150,000 | | | 450,000 | | | 270,608 | | | 9,669,795 | | | 7,838,602 | (a) |
Mortgage Securities | | | 775,000 | | | 525,000 | | | 86,042 | | | 4,713,813 | | | 4,307,889 | |
U.S. Government Money | | | 300,000 | | | — | | | 1,723 | | | 965,619 | | | 665,619 | |
| | | | | | | | | | | | | | | | |
Total | | $ | 3,475,000 | | $ | 1,175,000 | | $ | 516,834 | | $ | 18,950,007 | | $ | 15,907,223 | |
| | | | | | | | | | | | | | | | |
| Accessor Income & Growth Allocation Fund | | | | | | | | | | |
| | | | | |
| INVESTMENT COMPANIES | | PURCHASE
COST | | SALES
COST | | DIVIDEND
INCOME | | VALUE
6/30/2009 | | VALUE
12/31/2008 | |
| Accessors Funds — Z Class Shares | | | | | | | | | | | | | | | | |
Frontier Markets | | $ | 1,150,000 | | | — | | | — | | $ | 1,351,108 | | | — | |
Growth | | | 550,000 | | $ | 700,000 | | $ | 9,683 | | | 2,547,648 | | $ | 2,568,739 | |
High Yield Bond | | | 500,000 | | | 375,000 | | | 206,782 | | | 4,840,955 | | | 4,166,421 | |
Investment Grade Fixed-Income | | | 1,100,000 | | | 850,000 | | | 363,838 | | | 11,824,372 | | | 11,457,356 | (a) |
International Equity | | | 100,000 | | | — | | | — | | | 2,833,636 | | | 2,496,334 | |
Mortgage Securities | | | 1,325,000 | | | 1,475,000 | | | 115,673 | | | 6,381,289 | | | 6,331,124 | |
Small to Mid Cap | | | 1,500,000 | | | — | | | 10,009 | | | 3,121,733 | | | 1,546,571 | |
Strategic Alternatives | | | 2,525,000 | | | — | | | 27,968 | | | 6,246,705 | | | 3,806,784 | |
U.S. Government Money | | | — | | | 825,000 | | | 1,261 | | | 265 | | | 825,265 | |
Value | | | 950,000 | | | 900,000 | | | 25,137 | | | 2,461,975 | | | 2,509,339 | |
| | | | | | | | | | | | | | | | |
Total | | $ | 9,700,000 | | $ | 5,125,000 | | $ | 760,351 | | $ | 41,609,686 | | $ | 35,707,933 | |
| | | | | | | | | | | | | | | | |
| Accessor Balanced Allocation Fund | | | | | | | |
| | | | | |
| INVESTMENT COMPANIES | | PURCHASE
COST | | SALES
COST | | DIVIDEND
INCOME | | VALUE
6/30/2009 | | VALUE
12/31/2008 | |
| Accessors Funds — Z Class Shares | | | | | | | | | | | | | |
Frontier Markets | | $ | 3,925,000 | | $ | 350,000 | | | — | | $ | 4,292,523 | | | — | |
Growth | | | 1,900,000 | | | 2,800,000 | | $ | 41,689 | | | 10,507,022 | | $ | 10,856,242 | |
High Yield Bond | | | 400,000 | | | 925,000 | | | 376,822 | | | 8,311,763 | | | 7,833,468 | |
Investment Grade Fixed-Income | | | 900,000 | | | 1,950,000 | | | 706,001 | | | 21,329,474 | | | 22,148,590 | (a) |
International Equity | | | — | | | 1,000,000 | | | — | | | 12,080,471 | | | 12,023,153 | |
Mortgage Securities | | | 2,000,000 | | | 2,525,000 | | | 207,475 | | | 11,612,060 | | | 11,786,567 | |
Small to Mid Cap | | | 6,250,000 | | | 250,000 | | | 41,510 | | | 13,717,884 | | | 7,404,152 | |
Strategic Alternatives | | | 4,225,000 | | | — | | | 66,768 | | | 13,552,649 | | | 9,383,156 | |
U.S. Government Money | | | 27 | | | — | | | 4,539 | | | 1,855,937 | | | 1,855,910 | |
Value | | | 3,050,000 | | | 3,250,000 | | | 116,509 | | | 10,400,941 | | | 11,141,474 | |
| | | | | | | | | | | | | | | | |
Total | | $ | 22,650,027 | | $ | 13,050,000 | | $ | 1,561,313 | | $ | 107,660,724 | | $ | 94,432,712 | |
(a) Includes the market value of both the Intermediate Fixed-Income and Short Intermediate Fixed-Income Funds (see Note 11).
Notes to Financial Statements (Unaudited)
| | | | | | | | | | | | | | | | |
| Accessor Growth & Income Allocation Fund | | | | | | | |
| INVESTMENT COMPANIES | | PURCHASE
COST | | SALES
COST | | DIVIDEND
INCOME | | VALUE
6/30/2009 | | VALUE
12/31/2008 | |
| Accessors Funds — Z Class Shares | | | | | | | | | | | | | |
Frontier Markets | | $ | 4,875,000 | | $ | 400,000 | | | — | | $ | 5,365,244 | | | — | |
Growth | | | 350,000 | | | 2,050,000 | | $ | 53,996 | | | 13,588,427 | | $ | 14,751,764 | |
High Yield Bond | | | �� | | | 1,400,000 | | | 299,378 | | | 6,160,518 | | | 6,783,766 | |
Investment Grade Fixed-Income | | | 250,000 | | | 3,750,000 | | | 576,990 | | | 16,334,509 | | | 19,697,011 | (a) |
International Equity | | | — | | | 2,150,000 | | | — | | | 14,618,204 | | | 15,618,177 | |
Mortgage Securities | | | 1,050,000 | | | 2,995,000 | | | 164,063 | | | 8,710,325 | | | 10,379,842 | |
Small to Mid Cap | | | 4,750,000 | | | 875,000 | | | 48,337 | | | 14,415,816 | | | 10,157,787 | |
Strategic Alternatives | | | 900,000 | | | 2,550,000 | | | 49,927 | | | 8,288,835 | | | 10,139,870 | |
Value | | | 800,000 | | | 1,800,000 | | | 162,687 | | | 13,409,306 | | | 15,194,593 | |
| | | | | | | | | | | | | | | | |
Total | | $ | 12,975,000 | | $ | 17,970,000 | | $ | 1,355,378 | | $ | 100,891,184 | | $ | 102,722,810 | |
| | | | | | | | | | | | | | | | |
| Accessor Growth Allocation Fund | | | | | | | | | | | | | |
| INVESTMENT COMPANIES | | PURCHASE
COST | | SALES
COST | | DIVIDEND
INCOME | | VALUE
6/30/2009 | | VALUE
12/31/2008 | |
| Accessors Funds — Z Class Shares | | | | | | | | | | | | | |
Frontier Markets | | $ | 5,650,000 | | $ | 900,000 | | | — | | $ | 5,895,487 | | | — | |
Growth | | | 950,000 | | | 3,750,000 | | $ | 67,272 | | | 16,622,828 | | $ | 18,667,115 | |
High Yield Bond | | | — | | | 650,000 | | | 135,040 | | | 2,808,786 | | | 3,099,014 | |
Investment Grade Fixed-Income | | | — | | | 2,450,000 | | | 304,029 | | | 7,954,927 | | | 10,339,491 | (a) |
International Equity | | | — | | | 2,800,000 | | | — | | | 18,234,221 | | | 19,532,772 | |
Mortgage Securities | | | 700,000 | | | 1,350,000 | | | 78,018 | | | 4,394,168 | | | 4,908,154 | |
Small to Mid Cap | | | 6,700,000 | | | 375,000 | | | 62,698 | | | 18,814,830 | | | 12,139,229 | |
Strategic Alternatives | | | 400,000 | | | 2,650,000 | | | 44,756 | | | 7,116,673 | | | 9,486,700 | |
Value | | | 1,500,000 | | | 2,250,000 | | | 206,225 | | | 16,727,467 | | | 18,441,540 | |
| | | | | | | | | | | | | | | | |
Total | | $ | 15,900,000 | | $ | 17,175,000 | | $ | 898,038 | | $ | 98,569,387 | | $ | 96,614,015 | |
| | | | | | | | | | | | | | | |
| Accessor Aggressive Growth Allocation Fund | | | | | | |
| INVESTMENT COMPANIES | | PURCHASE
COST | | SALES
COST | | DIVIDEND
INCOME | | VALUE
6/30/2009 | | VALUE
12/31/2008 |
| Accessors Funds — Z Class Shares | | | | | | | | | | | | |
Frontier Markets | | $ | 3,200,000 | | | — | | | — | | $ | 3,649,394 | | | — |
Growth | | | 825,000 | | $ | 2,050,000 | | $ | 39,820 | | | 9,953,055 | | $ | 10,724,244 |
International Equity | | | — | | | 1,800,000 | | | — | | | 10,592,214 | | | 11,521,372 |
Small to Mid Cap | | | 4,650,000 | | | 500,000 | | | 38,400 | | | 11,987,017 | | | 7,622,267 |
Strategic Alternatives | | | 300,000 | | | 1,950,000 | | | 19,506 | | | 3,029,617 | | | 4,730,433 |
U.S. Government Money | | | — | | | 34 | | | — | | | — | | | 34 |
Value | | | 1,375,000 | | | 1,800,000 | | | 121,434 | | | 10,011,766 | | | 10,987,047 |
| | | | | | | | | | | | | | | |
Total | | $ | 10,350,000 | | $ | 8,100,034 | | $ | 219,160 | | $ | 49,223,063 | | $ | 45,585,397 |
* Effective May 1, 2009: (i) Advisor Class Shares of the Accessor Funds were redesignated as Institutional Class Shares; and (ii) all holdings of the Allocation Funds in the Underlying Funds were transferred from Institutional Class Shares (formerly Advisor Class Shares) to Z Class Shares.
(a) Includes the market value of both the Intermediate Fixed-Income and Short Intermediate Fixed-Income Funds (See Note 11).
Notes to Financial Statements (Unaudited)
10. Indemnifications
Under the Trust’s organizational documents, its officers and Trustees are indemnified against certain liability arising out of the performance of their duties with respect to the Funds. In addition, in the normal course of business, the Trust, on behalf of the Funds, enters into contracts with vendors and others that provide general indemnification. Each Fund’s maximum exposure under these arrangements is unknown, as this would involve future claims that may be made against the Trust and/or the Funds. Based on experience, however, the Funds expect the risk of loss to be remote.
11. Reorganization of Accessor Short-Intermediate Fixed-Income Fund into Accessor Intermediate Fixed-Income Fund (Renamed the “Accessor Investment Grade Fixed-Income Fund”)
On March 5, 2009, the Board of Trustees, including all of the Independent Trustees, approved a reorganization of the Accessor Short-Intermediate Fixed-Income Fund (the “Acquired Fund”) into the Accessor Intermediate Fixed-Income Fund (the “Acquiring Fund”). The reorganization did not require approval by the shareholders of the Acquired Fund.
As of the close of business on April 30, 2009, the assets of the Acquired Fund were acquired by the Acquiring Fund in exchange for shares of the Acquiring Fund and the assumption by the Acquiring Fund of the liabilities of the Acquired Fund. Upon the closing of the reorganization, the Acquiring Fund issued 3,790,485, 15,309 and 46,984 shares of Institutional Class (formerly Advisor Class), Investor Class and C Class, respectively, in exchange for net assets of the Acquired Fund valued at $36,540,066, $147,495 and $452,976, respectively. On May 1, 2009, the combined value of the Acquired Fund (which included accumulated realized losses of $5,514,293 and unrealized depreciation of
$11,798,271) and the Acquiring Fund was $87,430,597. The exchange of shares qualified as a tax-free reorganization for federal income tax purposes.
12. Change of Independent Registered Public Accounting Firm
The Accessor Funds have selected PricewaterhouseCoopers, LLP (“PwC”) to serve as the Funds’ independent registered public accounting firm for the Funds’ fiscal year ended December 31, 2009. The decision to select PwC was recommended by the Funds’ Audit Committee and was approved by the Funds’ Board of Trustees on March 4, 2009. During the Accessor Funds’ fiscal years ended December 31, 2007 and December 31, 2008, neither the Funds, their portfolios, nor anyone on their behalf, consulted with PwC on items which: (i) concerned the application of accounting principles to a specified transaction, either completed or proposed, or the type of audit opinion that might be rendered on the Accessor Funds’ financial statements; or (ii) concerned the subject of a disagreement (as defined in paragraph (a)(1)(iv) of Item 304 of Regulation S-K) or reportable events (as described in paragraph (a)(1)(iv) of said Item 304).
The selection of PwC does not reflect any disagreements with or dissatisfaction by the Accessor Funds or the Funds’ Board of Trustees with the performance of the Accessor Funds’ prior independent registered public accounting firm, Deloitte & Touche LLP (“Deloitte”). The decision not to renew the engagement of Deloitte, effective upon its completion of its audit for the fiscal year ended December 31, 2008, and to select PwC was recommended by the Funds’ Audit Committee and approved by the Funds’ Board of Trustees. Deloitte’s report on the Accessor Funds’ financial statements for the fiscal years ended December 31, 2007 and December 31, 2008 contained no adverse opinion or disclaimer of opinion, nor were they qualified or modified as to uncertainty, audit scope, or
Notes to Financial Statements (Unaudited)
accounting principles. During the Accessor Funds’ fiscal years ended December 31, 2007 and December 31, 2008: (i) there were no disagreements with Deloitte on any matter of accounting principles or practices, financial statement disclosure, or auditing scope or procedure, which disagreements, if not resolved to the satisfaction of Deloitte, would have caused them to make reference to the subject matter of the disagreements in connection with their reports on the Accessor Funds’ financial statements for such years; and (ii) there were no “reportable events” of the kind described in Item 304(a)(1)(v) of Regulation S-K.
13. Unanimous Shareholder Consent to Change the Fundamental Investment Restriction of the Accessor Frontier Markets Fund Regarding Concentration
On or about March 27, 2009, the Trust mailed an Information Statement to shareholders of the Accessor Frontier Markets Fund (the “Fund”), a series of the Trust, in connection with the solicitation of an action to be taken by written consent of shareholders in lieu of a meeting of shareholders. The Information Statement requested shareholders of the Fund to consent to a proposed modification of a fundamental investment restriction of the Fund, specifically, to remove the Fund’s restriction with respect to concentration of investments in the bank industry. On or about April 2, 2009, the Trust received unanimous written consent of the holders of shares of the Fund (992,927.9 total outstanding Fund shares) as of March 10, 2009 (the record date set by the Board of Trustees for determining shareholders entitled to execute the consent) to change the Fund’s fundamental investment restriction with respect to concentration of investments to read as follows:
Unless otherwise indicated the Fund may not:
1. Invest more than 25% of the value of its total assets in securities in any single industry, provided that there is no limitation on the purchase of securities issued, guaranteed or sponsored by the U.S. Government, its agencies or instrumentalities.
14. Subsequent Event Evaluation
The Trust, on behalf of the Funds, has evaluated the need for disclosures and/or adjustments resulting from subsequent events through August 25, 2009 (i.e., the date the financial statements were available to be issued). Based on this evaluation, no adjustments were required to the financial statements as of June 30, 2009. However, the following are details relating to subsequent events that have occurred since June 30, 2009 through August 25, 2009.
Effective September 14, 2009, the principal investment strategies of the U.S. Government Money Fund are revised as follows:
The U.S. Government Money Fund seeks to achieve its objective by investing at least 80% of its assets in obligations issued or guaranteed by the U.S. Government, its agencies, instrumentalities or sponsored enterprises (“U.S. Government securities”), or in repurchase agreements secured by such instruments. This investment policy and the name of the Fund may not be changed unless the Fund shareholders are notified at least 60 days in advance of the proposed change. The Fund may also invest up to 20% of it assets in domestic U.S. dollar denominated commercial paper that is rated in the highest short-term rating category (i.e., rated A1 by S&P or P1 by Moody’s, or, if unrated, determined by Forward Management to be of comparable quality) at the time of purchase, or in repurchase agreements secured by such instruments.
The Fund follows applicable regulatory requirements concerning the quality, maturity, and diversifications of its investments. The Fund seeks to maintain an average dollar weighted
Notes to Financial Statements (Unaudited)
portfolio maturity of 90 days or less, while maintaining liquidity and maximizing current yield. Because the U.S. Government Money Fund will have a considerable portion of its assets invested in U.S. Government securities, its return may be less than a fund which can invest without limitation in all types of securities.
Forward Management directly invests the assets of the Fund. Forward Management uses quantitative analysis to attempt to maximize the Fund’s yield. The U.S. Government Money Fund seeks to maintain a stable share value of $1.00 per share, although there is no assurance that it will be able to do so. It is possible to lose money by investing in the U.S. Government Money Fund.
Effective July 23, 2009, Z Class shares of each of the Underlying Funds (except for the U.S. Government Money Fund) are currently available for investment by the Allocation Funds only, and are not currently available to any other investors.
Z Class shares of the U.S. Government Money Fund are currently available to investors other than the Allocation Funds, subject to applicable minimum investment restrictions.
Effective July 16, 2009, the exchange privilege with respect to A Class and C Class shares within the same Accessor Fund has been revised to permit exchanges of A Class or C Class shares for Investor Class or Institutional Class shares within the same Accessor Fund. A Class and C Class shares subject to a CDSC will be charged the applicable CDSC upon exchange for Institutional Class or Investor Class shares.
A Class and C Class shares of the U.S. Government Money Fund may be exchanged for Z Class shares of U.S. Government Money Fund. A Class and C Class shares subject to a CDSC will be charged the applicable CDSC upon exchange for Z Class shares of the U.S. Government Money Fund.
Sales charges paid upon the original purchase of A Class shares will not be reimbursed upon exchange of the shares to another Class in the same Fund.
Effective July 23, 2009, the exchange privilege within the same Accessor Fund has been revised to permit exchanges between Institutional and Investor Class shares and to permit exchanges of Z Class shares only for Institutional or Investor Class shares of the same Accessor Fund. However, Institutional or Investor Class shares of the U.S. Government Money Fund may be exchanged for Z Class shares of that Fund.
Approval of the Investment Sub-Advisory Agreements (Unaudited)
At an in-person meeting of the Board of Trustees of the Accessor Funds held on March 5, 2009, the Board of Trustees, including the Independent Trustees, considered the pending change in control of Pennant Management, Inc. (“Pennant”), the sub-adviser to the Accessor Limited Duration U.S. Government Fund and Accessor Total Return Fund, and approved new sub-advisory agreements among Forward Management, Pennant and the Trust, on behalf of the Accessor Limited Duration U.S. Government Fund and Accessor Total Return Fund, upon completion of the change of control transaction.
In connection with the meeting, the Board of Trustees, through counsel to the Trust and the Independent Trustees, requested information from Pennant and Forward Management regarding the proposed change in control of Pennant’s parent corporation which would: (i) result in the automatic termination of the current sub-advisory agreements among Forward Management, Pennant and the Trust, on behalf of the Accessor Limited Duration U.S. Government Fund and Accessor Total Return Fund; and (ii) require the approval of new sub-advisory agreements to enable Pennant to continue to serve as sub-advisor to the Accessor Limited Duration U.S. Government Fund and Accessor Total Return Fund.
In response, Forward Management and Pennant provided materials to the Board of Trustees for its evaluation. Counsel and Forward Management explained that the pending change in control of Pennant would be precipitated by the change in ownership of Pennant’s parent corporation through the acquisition of the parent corporation by Pennant’s Employee Stock Ownership Plan (“ESOP”), and that Pennant represented that the ownership change would not result in a change of management, personnel or governance of either Pennant or its parent corporation. In addition, the Board of Trustees was informed that the terms of the new sub-advisory agreements among Forward Management, Pennant and the Trust, on behalf of the Accessor Limited Duration U.S. Government Fund and Accessor Total Return Fund, would be identical to the current sub-advisory agreements, except for the date of the agreements.
In considering whether to approve the new sub-advisory agreements, the Board of Trustees reviewed the materials provided by Pennant and the factors it had considered in approving the continuation of the current sub-advisory agreements at a meeting held on March 6, 2008, including financial and profitability information, information about the personnel providing investment management services to the Accessor Limited Duration U.S. Government Fund and Accessor Total Return Fund, comparative industry data with regard to investment performance, sub-advisory fees and expenses of the Accessor Limited Duration U.S. Government Fund and Accessor Total Return Fund, and the services provided by Pennant on behalf of the Accessor Limited Duration U.S. Government Fund and Accessor Total Return Fund (the “15(c) materials”). In addition, the Board of Trustees considered the investment performance of the Accessor Limited Duration U.S. Government Fund and Accessor Total Return Fund and other information relating to the nature, extent and quality of services provided by Pennant on an on-going basis at each of the Board of Trustees and committee quarterly meetings.
In evaluating the new sub-advisory agreements, the Board of Trustees, including a majority of the Independent Trustees, principally considered, among other factors, (i) the nature, extent and quality of the services provided by Pennant; (ii) the investment performance of the Accessor Limited Duration U.S. Government Fund, Accessor Total Return Fund and Pennant; (iii) the reasonableness of investment advisory
Approval of the Investment Sub-Advisory Agreements (Unaudited)
compensation to be paid and a comparative analysis of expense ratios of, and advisory fees paid by, funds with similar investment objectives and strategies; (iv) the profits to be realized by Pennant form its relationship with the Accessor Limited Duration U.S. Government Fund and Accessor Total Return Fund; (v) the extent to which the fees to be paid by Forward Management to Pennant reflect economies of scale; and (vi) any benefits derived or to be derived by Pennant from its relationship to the Accessor Limited Duration U.S. Government Fund and Accessor Total Return Fund, such as soft dollar arrangements. The Board of Trustees placed particular emphasis on the revised ownership structure of Pennant, the representations received regarding the lack of any actual change in the management and personnel and governance of Pennant. The Board of Trustees also considered the ability of Pennant to continue to provide an appropriate level of support and resources to the Funds, whether Pennant had sufficiently qualified personnel and the overall financial soundness of Pennant as it relates to its ability to provide services to the Accessor Limited Duration U.S. Government Fund and Accessor Total Return Fund.
Based on the Trustees’ deliberations and their evaluation of the information provided to them at the meeting on March 5, 2009 and previously at the March 6, 2008 meeting, the Board of Trustees, including all of the Independent Trustees, found that: (i) the compensation payable under the new sub-advisory agreements is fair and bears a reasonable relationship to the services to be rendered; and (ii) the approval of the new sub-advisory agreements is in the best interests of the Accessor Limited Duration U.S. Government Fund and Accessor Total Return Fund and their respective shareholders. Based on the Trustees’ deliberations and their evaluation of the information described above, the Trustees, including all of the Independent Trustees, approved the new sub-advisory agreements with Pennant on behalf of the Accessor Limited Duration U.S. Government Fund and Accessor Total Return Fund on the same terms and conditions as the current sub-advisory agreements.
At its meeting held on June 4, 2009, the Board of Trustees reviewed supplementary 15(c) materials provided by Pennant and Pennant’s confirmation, following the closing of the transaction which resulted in its parent corporation’s ESOP plan becoming the sole shareholder of the parent corporation, that the transaction did not result in a change in the management or governance of Pennant or any significant change to Pennant’s 15(c) materials that the Trustees had previously reviewed in connection with the 15(c) contract renewal process.
Additional Fund Information (Unaudited)
How to Obtain a Copy of the Fund’s Proxy Voting Policies
A description of the policies and procedures that the Accessor Funds use to determine how to vote proxies relating to portfolio securities is available without charge, upon request, by calling (800) 759-3504 or on the SEC’s website at http://www.sec.gov.
How to Obtain a Copy of Proxy Voting Records for the 12-Month Period Ended June 30, 2009
Information regarding how the Accessor Funds voted proxies relating to portfolio securities during the 12-month period ended June 30, 2009 is available without charge, upon request, by calling (800) 759-3504. You can obtain the Accessor Funds’ proxy voting records on the SEC’s website at http://www.sec.gov.
Quarterly Filings on Form N-Q
The Accessor Funds files each Fund’s complete schedule of portfolio holdings with the SEC for the first and third quarters of each fiscal year on Form N-Q. The Forms N-Q are available on the SEC’s website at http://www.sec.gov. The Forms N-Q may also be reviewed and copied at the SEC’s Public Reference Room in Washington, DC and information on the operation of the Public Reference Room may be obtained by calling (800) SEC-0330. Information included in the Accessor Funds’ Forms N-Q is also available by calling (800) 759-3504.

Investment Advisor
Forward Management, LLC
Administrator
SEI Investments Global Funds Services
Distributor
SEI Investments Distribution Co.
Counsel
Dechert LLP
Independent Registered Public Accounting Firm
PricewaterhouseCoopers, LLP
Custodian
Brown Brothers Harriman & Co.
Transfer Agent
ALPS Fund Services, Inc.

Accessor Funds
P.O. Box 1345
Denver, CO 80201
(800) 882-9612
www.accessor.com
Equity Funds
Accessor Growth
Accessor Value
Accessor Small to Mid Cap
Accessor International Equity
Accessor Total Return
Accessor Strategic Alternatives
Accessor Frontier Markets
Fixed Income Funds
Accessor High Yield Bond
Accessor Investment Grade Fixed-Income
Accessor Mortgage Securities
Accessor Limited Duration U.S. Government
Accessor U.S. Government Money
Asset Allocation Funds
Accessor Income Allocation
Accessor Income & Growth Allocation
Accessor Balanced Allocation
Accessor Growth & Income Allocation
Accessor Growth Allocation
Accessor Aggressive Growth Allocation
Printed on recycled paper using soy-based inks.
AFSAR063009
Item 2. Code of Ethics.
Not applicable to semi-annual report.
Item 3. Audit Committee Financial Expert.
Not applicable to semi-annual report.
Item 4. Principal Accountant Fees and Services.
Not applicable to semi-annual report.
Item 5. Audit Committee of Listed Registrants.
Not applicable.
Item 6. Investments.
Schedule of Investments in securities of unaffiliated issuers as of the close of the reporting period is included as part of the report to shareholders filed under Item 1 of this form.
Item 7. Disclosure of Proxy Voting Policies and Procedures for Closed-End Management Investment
Companies.
Not applicable.
Item 8. Portfolio Managers of Closed-End Management Investment Companies.
Not applicable.
Item 9. Purchases of Equity Securities by Closed-End Management Investment Companies and
Affiliated Purchases.
Not applicable.
Item 10. Submission of Matters to Vote of Security Holders.
No material changes to the procedures by which the shareholders may recommend nominees to the registrant’s Board of Trustees have been implemented after the registrant’s last provided disclosure in response to the requirements of Item 407(c)(2)(iv) of Regulation S-K (17 CFR 229.407) (as required by Item 22(b)(15) of Schedule 14A (17 CFR 240.14a-101)), or this Item.
Item 11. Controls and Procedures.
| | (a) | The registrant’s principal executive and principal financial officers, or persons performing similar functions, have concluded that the registrant’s disclosure controls and procedures (as defined in Rule 30a-3(c) under the Investment Company Act of 1940, as amended (the “1940 Act”) (17 CFR 270.30a-3(c))) are effective, as of a date within 90 days of the filing date of the report that includes the disclosure required by this paragraph, based on their evaluation of these controls and procedures required by Rule 30a-3(b) under the 1940 Act (17 CFR 270.30a-3(b)) and Rules 13a-15(b) or 15d-15(b) under the Securities Exchange Act of 1934, as amended (17 CFR 240.13a-15(b) or 240.15d-15(b)). |
| | (b) | No changes in the registrant’s internal control over financial reporting (as defined in Rule 30a-3(d) under the 1940 Act (17 CFR 270.30a-3(d)) occurred during the registrant’s second fiscal quarter of the period covered by this report that have materially affected, or are reasonably likely to materially affect, the registrant’s internal control over financial reporting. |
Item 12. Exhibits.
| | |
(a)(1) | | Not applicable to semi-annual report. |
| |
(a)(2) | | Certifications pursuant to Rule 30a-2(a) under the 1940 Act and Section 302 of the Sarbanes-Oxley Act of 2002 are attached hereto. |
| |
(a)(3) | | Not applicable. |
| |
(b) | | Certifications pursuant to Rule 30a-2(b) under the 1940 Act and Section 906 of the Sarbanes-Oxley Act of 2002 are attached hereto. |
SIGNATURES
Pursuant to the requirements of the Securities Exchange Act of 1934 and the Investment Company Act of 1940, the registrant has duly caused this report to be signed on its behalf by the undersigned, thereunto duly authorized.
| | |
| FORWARD FUNDS |
| |
By: | | /s/ J. Alan Reid, Jr. |
| | J. Alan Reid, Jr. |
| | President & Trustee |
| |
Date: | | September 1, 2009 |
Pursuant to the requirements of the Securities Exchange Act of 1934 and the Investment Company Act of 1940, this report has been signed below by the following persons on behalf of the registrant and in the capacities and on the dates indicated.
| | |
| |
By: | | /s/ J. Alan Reid, Jr. |
| | J. Alan Reid, Jr. |
| | President & Trustee |
| |
Date: | | September 1, 2009 |
| |
By: | | /s/ Eric Kleinschmidt |
| | Eric Kleinschmidt |
| | Treasurer |
| |
Date: | | September 1, 2009 |