UNITED STATES
SECURITIES AND EXCHANGE COMMISSION
Washington, D.C. 20549
FORM N-CSR
CERTIFIED SHAREHOLDER REPORT OF REGISTERED
MANAGEMENT INVESTMENT COMPANIES
Investment Company Act file number: 811-06722
Forward Funds
(Exact name of registrant as specified in charter)
345 California Street, Suite 1600
San Francisco, CA 94104
(Address of principal executive offices) (Zip code)
| | |
John A. Blaisdell, Principal Executive Officer Forward Funds 345 California Street, Suite 1600 San Francisco, CA 94104 (Name and address of agent for service) | | With a Copy To: George J. Zornada K&L Gates LLP State Street Financial Center One Lincoln St. |
| | Boston, MA 02111-2950 |
| | (617) 261-3231 |
Registrant’s telephone number, including area code: (800) 999-6809
Date of fiscal year end: December 31
Date of reporting period: December 31, 2017
Form N-CSR is to be used by management investment companies to file reports with the Commission, not later than 10 days after the transmission to stockholders of any report that is required to be transmitted to stockholders under Rule 30e-1 under the Investment Company Act of 1940 (17 CFR 270.30e-1). The Commission may use the information provided on Form N-CSR in its regulatory, disclosure review, inspection, and policymaking roles.
A registrant is required to disclose the information specified by Form N-CSR, and the Commission will make this information public. A registrant is not required to respond to the collection of information contained in Form N-CSR unless the Form displays a currently valid Office of Management and Budget (“OMB”) control number. Please direct comments concerning the accuracy of the information collection burden estimate and any suggestions for reducing the burden to the Secretary, Securities and Exchange Commission, 100 F Street, NE, Washington, DC 20549. The OMB has reviewed this collection of information under the clearance requirements of 44 U.S.C. § 3507.
Item 1 Reports to Stockholders.
The following are copies of the reports transmitted to shareholders of the Salient Adaptive Balanced Fund, Salient Adaptive Income Fund, Salient Adaptive US Equity Fund, Salient EM Infrastructure Fund, Salient International Dividend Signal Fund, Salient International Real Estate Fund, Salient International Small Cap Fund, Salient Real Estate Fund, Salient Select Income Fund, Salient Select Opportunity Fund, Salient Tactical Growth Fund, Salient Tactical Muni & Credit Fund, Salient Tactical Real Estate Fund and Salient US Dividend Signal Fund (collectively, the “Funds”), each a series of the registrant, pursuant to Rule 30e-1 under the Investment Company Act of 1940, as amended (the “Act”) (17 CFR 270.30e-1).

Table of Contents
The series of funds under the Forward Funds Trust (“Salient Funds”) are distributed by:
Forward Securities, LLC
San Francisco, California
The report has been prepared for the general information of the Funds’ shareholders. It is not authorized for distribution to prospective investors unless accompanied or proceeded by a current Funds’ Prospectus, which contains more complete information about Funds’ investment policies, management fees and expenses, experience of the management teams and other information. Investors are reminded to read the Prospectus before investing or sending money.
Shareholder Update | December 31, 2017
| | |
| A MESSAGE FROM: | | Rusty Guinn |
| | Executive Vice President of Asset Management |
Dear Shareholder:
We enter 2018 with gratitude for the trust that you, the shareholders of the Salient Funds, have placed in us. It is our aim to build strategies that enable you to act as good stewards of wealth, and it is our hope that you have found value in your partnership with us over the past year. Thank you.
The past year has been profitable for most investors, including those in most financial markets in which the Salient Funds invest. It has also been a year of widening disconnects between those markets and the economies, businesses and political systems that underlie them. We have observed continued political upheaval in the Middle East and North Asia but precious little volatility in most financial markets as a result. We have observed divergences in central banking policies but near-universal appetite for ownership of risky assets across the globe. We have observed investors unwilling to sell, despite high valuations, lower going-forward return expectations, challenging demographics, historically low yields and spreads, and early signs of inflation. We have observed speculative behaviors around cryptocurrencies, venture capital and growing segments of the technology sector.
It has been an unusual year, to say the least.
Still, there is reason to be optimistic about the world and the markets and companies in which we invest. While we enter the year eagerly and optimistically, we also do so with a redoubled commitment to the integrity and consistency of our investment processes. Risk has not disappeared from investments in financial markets, and we see it as our charge to ensure that those risks are still taken prudently and with the expectation of appropriate compensation—the returns to our investors.
We hope that 2018 proves a prosperous one for you, our shareholders. Thank you for your trust.
Sincerely,

Rusty Guinn
Executive Vice President of Asset Management
Salient
RISKS
There are risks involved with investing, including loss of principal. Past performance does not guarantee future results, share prices will fluctuate and you may have a gain or loss when you redeem shares.
Inflation is the rate at which the general level of prices for goods and services is rising, and, subsequently, purchasing power is falling.
Spread is the difference between the bid and the ask price of a security or asset.
Valuation is the process of determining the value of an asset or company based on earnings and the market value of assets.
1
Salient is the trade name for Salient Partners, L.P., which together with its subsidiaries provides asset management and advisory services. This information is being provided solely for educational purposes and is not an offer to sell or solicitation of an offer to buy an interest in any investment fund. Any such offer or solicitation may only be made by means of a confidential private offering memorandum or prospectus relating to a particular fund and only in a manner consistent with federal and applicable state securities laws.
The Salient Funds offered under the Forward Funds Trust are distributed by Forward Securities, LLC.
Not FDIC Insured | No Bank Guarantee | May Lose Value
©2018 Salient. All rights reserved.
The discussions concerning the Funds included in this shareholder report may contain certain forward-looking statements about the factors that may affect performance of the Funds in the future, including the portfolio managers’ outlook regarding economic, financial, market, petroleum, political and other factors relevant to investment performance in the U.S. and abroad. These statements are based on the portfolio managers’ expectations concerning certain future events and their expected impact on the Funds and are current only through the date on the cover of this report. Forward-looking statements are inherently uncertain and are not intended to predict the future performance of the Funds. Actual events may cause adjustments in the portfolio managers’ strategies from those currently expected to be employed, and the outlook of the portfolio managers is subject to change.
2
Fund Commentary and Performance (Unaudited)
Salient International Real Estate Fund
As of December 31, 2017
For the year ended December 31, 2017, Salient International Real Estate Fund’s Class A shares (without sales load) returned 21.30%, outperforming the Fund’s benchmark, the FTSE EPRA/NAREIT Developed ex-U.S. Index, which returned 20.82%.
2017 proved to be a beneficial year for international real estate investment trust (REIT) equities. The asset class, as represented by the FTSE EPRA/NAREIT Developed ex-U.S. Index, generated strong returns in U.S. dollar terms and outperformed its domestic counterpart, as represented by the FTSE NAREIT Equity REITs Index, which returned 5.23% for the year. While most markets performed strongly, Europe and Asia Pacific (together comprising approximately 93% of the index) generated most of the return for the benchmark, with each region up over 15% at year-end. From a country perspective, Hong Kong and Singapore were up 38% and 42% for the year, respectively, while every European country was up over 14% for 2017. Notably, the United Kingdom, which made up 10% of the index on average throughout the year, was up 24% as fears surrounding Brexit—the United Kingdom’s planned exit from the European Union—subsided throughout the year.
During 2017, the Fund benefited from its investments in the United Kingdom, Hong Kong and Italy. In the U.K., the office and industrial real estate sectors benefited from resurging business sentiment and supportive monetary policy, as fears surrounding the eventual impact of Brexit receded from pre-2017 levels. The Fund’s investments in Hong Kong provided a strong total return of over 35% at year-end, as growth in gross domestic product and a stable rise in inflation supported real estate prices. In Italy, both the office and retail sectors, the primary constituents of the country’s real estate universe, contributed to the Fund’s return during the reporting period. In addition to stable growth and inflation within Italy, the Fund benefited from a strengthening in the euro, which began the year at an exchange rate of 1.05 EUR per USD and ended the year at a rate of 1.20 EUR per USD—a change of 14%.
The only detractor to the Fund’s performance in 2017 was an investment in the SPDR Dow Jones International Real Estate ETF. In order to maintain exposure to the market while managing the Fund’s cash position, the Fund’s investment team invested a small portion of its assets in the international real estate ETF for a brief part of the year. During that period of time, the market slumped slightly and the position detracted from the Fund’s performance.
Finally, from an allocation perspective, the Fund experienced meaningful positive attribution from its overweight positions in the United Kingdom and Italy. It also benefited from individual security selection within Japan, a country which was down -1.58% for the year in the benchmark index while the Fund’s investments were up 9.14%. On the downside, an underweight exposure to Hong Kong hurt the Fund in a year of strong performance, as did security selection within Germany, where the Fund’s individual investments were up less than the country at large.
3
Salient International Real Estate Fund
Weightings by Country as a Percentage of Net Assets
as of December 31, 2017

These allocations may not reflect the current or future position of the portfolio.
Hypothetical Growth of $10,000 Investment in the Fund

The chart above shows how a hypothetical investment of $10,000 in the Fund at its inception would have performed versus an investment in the Fund’s benchmark index. The values indicate what $10,000 would have grown to over the time period indicated. The hypothetical example does not represent the returns of any particular investment.
4
Salient International Real Estate Fund(d)
| | | | | | | | | | | | | | | | | | | | |
| | | 1 Year | | | 5 Year | | | 10 Year | | | Since
Inception | | | Inception
Date | |
| Average Annual Total Return for the period ended December 31, 2017 | | | | | | | | | | | | | | | | | | | | |
Investor Class | | | 21.44% | | | | 2.78% | | | | N/A | | | | 4.87% | | | | 05/02/11 | |
| | | | | |
Institutional Class(e) | | | 21.88% | | | | 3.11% | | | | 1.92% | | | | 3.18% | | | | 04/28/06 | |
| | | | | |
Class A (with sales load)(b) | | | 14.35% | | | | 1.48% | | | | 0.98% | | | | 2.33% | | | | 04/28/06 | |
| | | | | |
Class A (without sales load)(a) | | | 21.30% | | | | 2.69% | | | | 1.58% | | | | 2.85% | | | | 04/28/06 | |
| | | | | |
Class C (with CDSC)(f) | | | 19.73% | | | | 2.13% | | | | 0.93% | | | | 2.18% | | | | 04/28/06 | |
| | | | | |
Class C (without CDSC)(g) | | | 20.73% | | | | 2.13% | | | | 0.93% | | | | 2.18% | | | | 04/28/06 | |
(a) Excludes sales charge.
(b) Includes the effect of the maximum 5.75% sales charge.
(c) The index figures do not reflect any deduction for fees, expenses or taxes. It is not possible to invest directly in an index.
(d) Prior to May 1, 2016, Salient International Real Estate Fund was known as Forward International Real Estate Fund. Prior to June 12, 2009, Forward International
Real Estate Fund was known as Kensington International Real Estate Fund.
(e) Prior to June 13, 2009, Institutional Class was known as Class Y.
(f) Includes the 1.00% contingent deferred sales charge.
(g) Excludes the 1.00% contingent deferred sales charge.
The performance quoted represents past performance, does not guarantee future results and current performance may be lower or higher than the data quoted. The investment return and principal value of an investment will fluctuate so that shares, when redeemed, may be worth more or less than their original cost. Performance data current to the most recent month-end may be obtained at www.salientfunds.com. Investment performance may reflect fee waivers in effect. In the absence of fee waivers, total return would be lower. Total return is based on NAV, assuming reinvestment of all distributions. Performance does not reflect the deduction of taxes that a shareholder would pay on fund distributions or the redemption of fund shares.
5
Fund Commentary and Performance (Unaudited)
Salient Real Estate Fund
As of December 31, 2017
For the year ended December 31, 2017, Salient Real Estate Fund’s Investor Class shares returned -3.92%, underperforming the Fund’s primary benchmark, the FTSE NAREIT Equity REITs Index, which returned 5.23%. The Fund’s secondary benchmark, the S&P 500 Index, returned 21.83%.
The market environment for Salient Real Estate Fund was generally supportive in 2017. The real estate investment trust (REIT) common equity market, as measured by the FTSE NAREIT Equity REITs Index, returned more than 5.2% for the year. This return was generated in approximately equal parts throughout both halves of the year (2.7% in the first and 2.5% in the second), and every property type had at least one half of solid positive performance. Examining these market returns uncovers wide dispersion between property types. Top-performing sectors included infrastructure, data center and industrial REITs, which were aided by growing demand for fiber optic transmission and data storage capacity along with the buildout required to provide “last mile,” or final delivery of products, to retail stores. In particular, much of the strong performance for industrial REITs can be attributed to expectations that e-commerce will continue to win market share from traditional bricks-and-mortar retail stores. On the flip side of this debate, retail REITs, notably shopping centers and regional malls, were the worst-performing sectors for the year, as worries regarding tenant strength and occupancy levels mounted, mainly during the first half of the year.
During the reporting period, the Fund benefited from its investments in the data centers, industrials and timber sectors. Global demand for outsourced IT solutions and growth in cloud computing drove demand toward data center properties in 2017. As investors’ expectations for data center operators rose, they purchased REITs that own them, driving down capitalization rates—the ratio of a property’s net operating income to its market value. This compression of rates, coupled with market-leading cash flow growth, created positive results for the data center sector.
The industrials sector also benefited Fund returns during the reporting period. The global demand for “last mile” delivery and the required buildout to meet such a demand was very positive for industrial real estate operating fundamentals. The strong operating fundamentals led to further compression in both market capitalization rates and vacancy levels.
The timber sector also experienced strong performance in 2017. Increased lumber demand both domestically and abroad led to a steady rise in the price of the resource. The Fund’s investments in the sector also benefited from realized merger and acquisitions synergies as well as strong operating performance.
Not all REIT sectors performed well in 2017. The shopping centers, regional malls and healthcare sectors detracted from the Fund’s performance results. 2017 presented a highly volatile market environment for most shopping center REITs, as headwinds posed by e-commerce and changing consumer preferences increased. Amazon and other web-based retailers continued to take market share from bricks-and-mortar stores.
Similar to the headwinds faced by owners of shopping centers, regional mall landlords also weathered a highly volatile market environment in 2017. Slack in department store profitability and store closures, coupled with the acceleration in e-commerce growth, caused investors to question the viability of much of America’s retail property.
Alongside the retail sector, healthcare facility owners and operators, in particular, faced mounting headwinds in 2017 amidst potential shifts in government policy. Investors feared that government reimbursements might be at risk, calling into question operators’ future profitability. Additionally, reductions in occupancy rates and skilled mix (the proportion of people not dependent on Medicaid coverage) combined for a slowdown in operating performance in the healthcare sector.
Lastly, other factors that impacted performance in 2017 included an overweight position to retail REITs, along with some volatility surrounding the Fund’s largest healthcare holding, both of which detracted from the Fund’s performance for the year. However, the Fund benefited from individual security selection within the data center and self-storage sectors, as well as from its overweight position to timber REITs.
6
Salient Real Estate Fund
Weightings by Sector as a Percentage of Net Assets
as of December 31, 2017
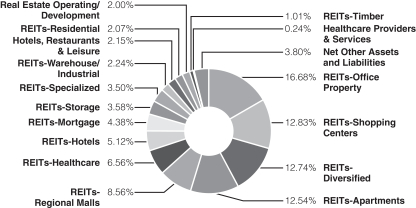
These allocations may not reflect the current or future position of the portfolio.
Hypothetical Growth of $10,000 Investment in the Fund

The chart above shows how a hypothetical investment of $10,000 in the Fund at its inception would have performed versus an investment in the Fund’s benchmark index. The values indicate what $10,000 would have grown to over the time period indicated. The hypothetical example does not represent the returns of any particular investment.
7
Salient Real Estate Fund(b)
| | | | | | | | | | | | | | | | | | | | |
| | | 1 Year | | | 5 Year | | | 10 Year | | | Since
Inception | | | Inception
Date | |
| Average Annual Total Return for the period ended December 31, 2017 | | | | | | | | | | | | | | | | | | | | |
Investor Class | | | -3.92% | | | | 7.39% | | | | 4.97% | | | | 8.39% | | | | 05/10/99 | |
| | | | | |
Institutional Class | | | -3.63% | | | | 7.78% | | | | N/A | | | | 4.58% | | | | 05/01/08 | |
| | | | | |
Class A (with sales load)(c) | | | -9.55% | | | | 6.07% | | | | N/A | | | | 12.93% | | | | 06/12/09 | |
| | | | | |
Class A (without sales load)(d) | | | -4.02% | | | | 7.34% | | | | N/A | | | | 13.72% | | | | 06/12/09 | |
| | | | | |
Class C (with CDSC)(e) | | | -5.36% | | | | 6.75% | | | | N/A | | | | 13.01% | | | | 06/12/09 | |
| | | | | |
Class C (without CDSC)(f) | | | -4.46% | | | | 6.75% | | | | N/A | | | | 13.01% | | | | 06/12/09 | |
(a) The index figures do not reflect any deduction for fees, expenses or taxes. It is not possible to invest directly in an index.
(b) Prior to May 1, 2016, Salient Real Estate Fund was known as Forward Real Estate Fund. Prior to January 20, 2009, Forward Real Estate Fund was known as Forward Progressive Real Estate Fund. Prior to October 30, 2006, Forward Progressive Real Estate Fund was known as Forward Uniplan Real Estate Investment Fund.
(c) Includes the effect of the maximum 5.75% sales charge.
(d) Excludes sales charge.
(e) Includes the 1.00% contingent deferred sales charge.
(f) Excludes the 1.00% contingent deferred sales charge.
The performance quoted represents past performance, does not guarantee future results and current performance may be lower or higher than the data quoted. The investment return and principal value of an investment will fluctuate so that shares, when redeemed, may be worth more or less than their original cost. Performance data current to the most recent month-end may be obtained at www.salientfunds.com. Investment performance may reflect fee waivers in effect. In the absence of fee waivers, total return would be lower. Total return is based on NAV, assuming reinvestment of all distributions. Performance does not reflect the deduction of taxes that a shareholder would pay on fund distributions or the redemption of fund shares.
8
Fund Commentary and Performance (Unaudited)
Salient Select Income Fund
As of December 31, 2017
For the year ended December 31, 2017, Salient Select Income Fund’s Class A shares (without sales load) returned 1.46%, underperforming the Fund’s benchmark, the ICE BofAML Fixed Rate Preferred Securities Index, which returned 10.58%.
The market environment for Salient Select Income Fund was generally supportive in 2017, as both the real estate investment trust (REIT) common and preferred equity markets rose consistently throughout the year. The REIT preferred market, as measured by the Wells Fargo Hybrid and Preferred Securities REIT Index, rose 11.53% for the year, while the REIT common equity market, as measured by the FTSE NAREIT Equity REITs Index, provided a total return of 5.23% for the year. Notably, almost half of the REIT preferred market’s return came in the first quarter of the year, and both markets made positive gains in every quarter. High-level returns show that wide dispersion persisted in 2017 as investor capital moved across and between property sectors. The top-performing sectors for the year included infrastructure, data centers and industrial REITs, aided by growing demand for fiber optic transmission and data storage capacity along with the buildout needed to provide “last mile,” or final delivery of products, to retail stores. On the bottom end of the return spectrum were the shopping center and regional mall REIT sectors, both of which lagged due to concerns regarding the long-term viability of retailers and their need for bricks-and-mortar spaces amidst the rise in e-commerce demand.
During 2017, the lodging/resorts, commercial financing and industrials sectors all contributed to the Fund’s performance. The Fund had several investments, both preferred and common equity, across the lodging sector, which benefited from healthy business and leisure travel environments. Merger and acquisition activity within the space was also positive for the Fund’s investments.
2017 was also a supportive year for mortgage REITs in the commercial financing sector, as volatility in interest rates remained relatively subdued. Additionally, the Fund’s holdings in the sector, which were predominately focused on the preferred equity portion of the capital stack, benefited from improvement in issuer credit quality.
The global demand for “last mile” delivery and the required buildout to meet such a demand was also very positive for real estate operating fundamentals in the industrial sector. Strong operating fundamentals led to further compression in both market capitalization rates and vacancy levels, making a positive contribution to the Fund’s performance during the reporting period.
The sectors that detracted from the Fund’s performance in 2017 included department stores, shopping centers and regional malls. The Fund’s investments in department store companies were the largest detractors in 2017, as many of the country’s largest retailers faced headwinds brought on by e-commerce and changes in consumer buying patterns. 2017 also presented a highly volatile market environment for most shopping center REITs, as those same headwinds posed by e-commerce and changing consumer preferences impacted the sector. Amazon and other web-based retailers continued to take market share from bricks-and-mortar stores. Similar to the struggles that shopping center REITs encountered, regional malls also faced opposition from e-commerce businesses as well as pronounced volatility within the sector.
Lastly, the Fund maintained a short position on the broad real estate market throughout much of 2017, typically rotating between the iShares U.S. Real Estate ETF and the Vanguard REIT ETF but occasionally holding both. These short positions detracted slightly from the Fund’s performance. Additionally, in order to maintain market exposure in a tax efficient manner, the Fund owned call options on particular REITs for part of the year. These securities provided a slight positive contribution to the Fund’s performance in 2017.
9
Salient Select Income Fund
Weightings by Sector as a Percentage of Net Assets
as of December 31, 2017*

*Weightings by Sector reflects long positions and excludes securities sold short.
These allocations may not reflect the current or future position of the portfolio.
Hypothetical Growth of $10,000 Investment in the Fund
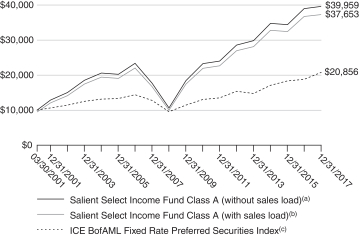
The chart above shows how a hypothetical investment of $10,000 in the Fund at its inception would have performed versus an investment in the Fund’s benchmark index. The values indicate what $10,000 would have grown to over the time period indicated. The hypothetical example does not represent the returns of any particular investment.
10
Salient Select Income Fund(d)
| | | | | | | | | | | | | | | | | | | | |
| | | 1 Year | | | 5 Year | | | 10 Year | | | Since
Inception | | | Inception
Date | |
| Average Annual Total Return for the period ended December 31, 2017 | | | | | | | | | | | | | | | | | | | | |
Investor Class | | | 1.44% | | | | 6.80% | | | | N/A | | | | 9.08% | | | | 10/26/11 | |
| | | | | |
Institutional Class | | | 1.84% | | | | 7.19% | | | | 8.80% | | | | 6.03% | | | | 04/28/06 | |
| | | | | |
Class A (with sales load)(b) | | | -4.39% | | | | 5.49% | | | | 7.77% | | | | 8.23% | | | | 03/30/01 | |
| | | | | |
Class A (without sales load)(a) | | | 1.46% | | | | 6.75% | | | | 8.41% | | | | 8.62% | | | | 03/30/01 | |
| | | | | |
Class C (with CDSC)(e)(f) | | | -0.06% | | | | 6.16% | | | | 7.70% | | | | 7.86% | | | | 03/30/01 | |
| | | | | |
Class C (without CDSC)(e)(g) | | | 0.87% | | | | 6.16% | | | | 7.70% | | | | 7.86% | | | | 03/30/01 | |
(a) Excludes sales charge.
(b) Includes the effect of the maximum 5.75% sales charge.
(c) The index figures do not reflect any deduction for fees, expenses or taxes. It is not possible to invest directly in an index.
(d) Prior to May 1, 2016, Salient Select Income Fund was known as Forward Select Income Fund. Prior to June 12, 2009, Forward Select Income Fund was known as Kensington Select Income Fund.
(e) While Class C shares were initially offered for purchase effective March 30, 2001, no shareholder activity occurred until April 13, 2001.
(f) Includes the 1.00% contingent deferred sales charge.
(g) Excludes the 1.00% contingent deferred sales charge.
The performance quoted represents past performance, does not guarantee future results and current performance may be lower or higher than the data quoted. The investment return and principal value of an investment will fluctuate so that shares, when redeemed, may be worth more or less than their original cost. Performance data current to the most recent month-end may be obtained at www.salientfunds.com. Investment performance may reflect fee waivers in effect. In the absence of fee waivers, total return would be lower. Total return is based on NAV, assuming reinvestment of all distributions. Performance does not reflect the deduction of taxes that a shareholder would pay on fund distributions or the redemption of fund shares.
11
Fund Commentary and Performance (Unaudited)
Salient Select Opportunity Fund
As of December 31, 2017
For the year ended December 31, 2017, Salient Select Opportunity Fund’s Institutional Class shares returned 6.04%, underperforming the Fund’s benchmarks, the ICE BofAML Fixed Rate Preferred Securities Index, which returned 10.58%, and the MSCI World Index, which returned 23.07%.
Domestic and international equity markets generated strong positive total returns for 2017, with the S&P 500 Index rising 21.83% alongside the MSCI World Index, which rose more than 23%. Similarly, preferred securities, as measured by the ICE BofAML Fixed Rate Preferred Securities Index, saw a meaningful rise of more than 10% for the year. Global growth expectations generally rose through much of year while concerns regarding potential destabilization in Europe driven by the United Kingdom’s plans to exit the European Union largely subsided from beginning-of-year levels. This environment was supportive for many eurozone stocks. Financials stocks, in particular, rose as a result of rising expectations for global growth, with the MSCI World Financials Index gaining 23.48% and the MSCI Europe Financials Index gaining 28.16% for the year. Domestically, preferred equities also benefited from the uptick in investor confidence, which, coupled with improving capitalization ratios and credit quality in the financials sector, led to solid performance for many financial institutions in the U.S. This landscape was a positive for the Fund, as financial institutions comprise a large portion of the Fund’s issuer base.
From a sector perspective, the diversified, regional banks, office and data centers sectors all made positive contributions to the Fund’s return in 2017. The Fund’s investments in Europeans financials, as well as its positions in domestic regional banks, performed well over 2017, as the domestic interest rate landscape witnessed a gradual and predicted rise and concerns regarding the solvency of Europe’s largest banks continued to lessen.
The Fund’s singular office holding performed well given that 2017 represented a rather lackluster year for office REITs, as the company’s primary cities of investment (San Francisco, Los Angeles and Washington, D.C.) witnessed moderate supply growth amidst a healthy business operating environment.
Additionally, global demand for outsourced IT solutions and growth in cloud computing continued to drive demand toward properties in the data center sector. As investors’ expectations for data center operators rose, they bought up REITs that own them, driving down capitalization rates—the ratio of a property’s net operating income to its market value. This compression of rates, coupled with market-leading cash flow growth, created positive results for the data center sector.
Detractors to the Fund’s performance in 2017 included the healthcare, restaurants and department stores sectors. Alongside the retail sector, healthcare facility owners and operators, in particular, faced mounting headwinds in 2017 amidst shifts in policy surrounding government reimbursement that caused concerns over future profit growth for operators. Additionally, reductions in occupancy rates and skilled mix (the proportion of guests not dependent on Medicaid coverage) combined for a slowdown in operating performance in the healthcare sector.
Investments in the restaurant industry also detracted from the Fund’s performance during the reporting period. Specifically, the Fund’s investment in Chipotle Mexican Grill, Inc. detracted from returns, as growth expectations faded, profits softened and the company failed to deliver on a major product rollout.
2017 also presented a highly volatile market environment for department store operators, as headwinds posed by e-commerce and changing consumer preferences increased. Amazon and other web-based retailers continued to take market share from bricks-and-mortar stores.
Other factors that impacted the Fund’s performance during the year included security selection. The Fund benefited from its individual holdings within the financials sector as well as from being invested in the common equity portion of those companies’ capital stack. Additionally, the Fund’s exposure to foreign markets was beneficial during a year of broad depreciation of the U.S. dollar. Lastly, the Fund’s investments in the lodging industry detracted from overall performance results.
12
Salient Select Opportunity Fund
Weightings by Sector as a Percentage of Net Assets
as of December 31, 2017
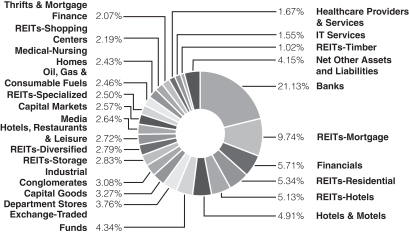
These allocations may not reflect the current or future position of the portfolio.
Hypothetical Growth of $100,000 Investment in the Fund

The chart above shows how a hypothetical investment of $100,000 in the Fund at its inception would have performed versus an investment in the Fund’s benchmark index. The values indicate what $100,000 would have grown to over the time period indicated. The hypothetical example does not represent the returns of any particular investment.
13
Salient Select Opportunity Fund(b)
| | | | | | | | | | | | |
| | | 1 Year | | | Since
Inception | | | Inception
Date | |
| Average Annual Total Return for the period ended December 31, 2017 | | | | | | | | | | | | |
Investor Class | | | 5.66% | | | | 1.38% | | | | 06/02/14 | |
| | | |
Institutional Class | | | 6.04% | | | | 5.07% | | | | 07/31/13 | |
| | | |
Class A (with sales load)(c) | | | -0.58% | | | | 3.15% | | | | 07/31/13 | |
| | | |
Class A (without sales load)(d) | | | 5.51% | | | | 4.54% | | | | 07/31/13 | |
| | | |
Class C (with CDSC)(e) | | | 4.02% | | | | 2.36% | | | | 02/18/14 | |
| | | |
Class C (without CDSC)(f) | | | 5.02% | | | | 2.36% | | | | 02/18/14 | |
(a) The index figures do not reflect any deduction for fees, expenses or taxes. It is not possible to invest directly in an index.
(b) Prior to May 1, 2016, Salient Select Opportunity Fund was known as Forward Select Opportunity Fund. Prior to December 23, 2013, Forward Select Opportunity Fund was known as Forward Select Income Opportunity Fund.
(c) Includes the effect of the maximum 5.75% sales charge.
(d) Excludes sales charge.
(e) Includes the 1.00% contingent deferred sales charge.
(f) Excludes the 1.00% contingent deferred sales charge.
The performance quoted represents past performance, does not guarantee future results and current performance may be lower or higher than the data quoted. The investment return and principal value of an investment will fluctuate so that shares, when redeemed, may be worth more or less than their original cost. Performance data current to the most recent month-end may be obtained at www.salientfunds.com. Investment performance may reflect fee waivers in effect. In the absence of fee waivers, total return would be lower. Total return is based on NAV, assuming reinvestment of all distributions. Performance does not reflect the deduction of taxes that a shareholder would pay on fund distributions or the redemption of fund shares.
14
Fund Commentary and Performance (Unaudited)
Salient Tactical Real Estate Fund
As of December 31, 2017
For the year ended December 31, 2017, Salient Tactical Real Estate Fund’s Class A shares (without sales load) returned -5.24%, underperforming the Fund’s primary benchmark, the FTSE NAREIT Composite Index, which returned 9.29%. The Fund’s secondary benchmark, the FTSE NAREIT Equity REITs Index, returned 5.23%.
The market environment for Salient Tactical Real Estate Fund was generally supportive in 2017. The real estate trust (REIT) common equity market, as measured by the FTSE NAREIT Equity REITs Index, returned more than 5.2% for the year. This return was generated in approximately equal parts throughout both halves of the year (2.7% in the first and 2.5% in the second), and every property type had at least one half of solid positive performance. Examining these market returns uncovers wide dispersion between property types. Top-performing sectors included infrastructure, data center and industrial REITs, which were aided by growing demand for fiber optic transmission and data storage capacity along with the buildout needed to provide “last mile,” or final delivery of products, to retail stores. In particular, much of the strong performance for industrial REITs can be attributed to expectations that e-commerce will continue to win market share from traditional bricks-and-mortar retail. On the flip side of this debate, retail REITs, notably shopping centers and regional malls, were the worst-performing sectors for the year, as worries regarding tenant strength and occupancy levels mounted, mainly during the first half of the year.
During the reporting period, the Fund benefited from its investments in the data centers, industrials and timber sectors. Global demand for outsourced IT solutions and growth in cloud computing drove demand toward data center properties in 2017. As investors’ expectations for data center operators rose, they purchased REITs that own them, driving down capitalization rates—the ratio of a property’s net operating income to its market value. This compression of rates, coupled with market-leading cash flow growth, created positive results for the data center sector.
The industrials sector also benefited Fund returns during the reporting period. The global demand for “last mile” delivery and the required buildout to meet such a demand was very positive for industrial real estate operating fundamentals. Strong operating fundamentals led to further compression in both market capitalization rates and vacancy levels.
The timber sector also experienced strong performance in 2017. Increased lumber demand both domestically and abroad led to a steady rise in the price of the resource. The Fund’s investments in the sector benefited from realized merger and acquisitions synergies as well as strong operating performance.
Not all REIT sectors performed well in 2017. The shopping center, healthcare and lodging/resorts sectors detracted from the Fund’s performance results. 2017 presented a highly volatile market environment for most shopping center REITs, as headwinds posed by e-commerce and changing consumer preferences increased. Amazon and other web-based retailers continued to take market share from bricks-and-mortar stores.
Alongside the shopping center sector, healthcare facility owners and operators, in particular, faced mounting headwinds in 2017 amidst potential shifts in government policy. Investors feared that government reimbursements might be at risk, calling into question operators’ future profitability. Additionally, reductions in occupancy rates and skilled mix (the proportion of guests not dependent on Medicaid coverage) combined for a slowdown in operating performance in the healthcare sector.
Within the lodging sector, the Fund benefited from strong performance in select service hotel company investments, but investments in luxury resorts detracted from 2017 performance results. Much of the poor performance was a result of a dilutive transaction in the first quarter, taken on by a company in the portfolio to further expand and upgrade its portfolio asset base.
Other factors that contributed to the Fund’s performance in 2017 included individual security selection and sector weightings. For example, the Fund benefited from careful security selection within the self-storage sector and an overweight exposure to data centers, which outperformed most other sectors by a wide margin in 2017. However, the Fund’s overweight position in shopping center REITs, along with its underweight exposure to infrastructure REITs, both detracted from the Fund’s return for the year.
Lastly, the Fund maintained a short position on the broad real estate market throughout much of 2017, typically rotating between the iShares U.S. Real Estate ETF and the Vanguard REIT ETF but occasionally holding both. These short positions detracted slightly from the Fund’s performance, as the market experienced an uplift during the year.
15
Salient Tactical Real Estate Fund
Weightings by Sector as a Percentage of Net Assets
as of December 31, 2017*
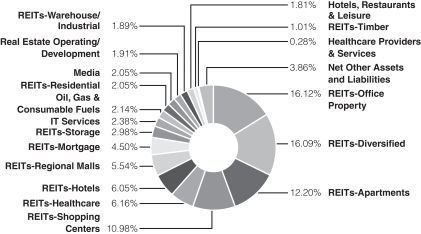
*Weightings by Sector reflects long positions and excludes securities sold short.
These allocations may not reflect the current or future position of the portfolio.
Hypothetical Growth of $10,000 Investment in the Fund
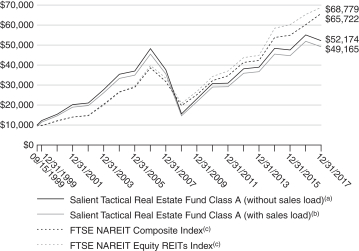
The chart above shows how a hypothetical investment of $10,000 in the Fund at its inception would have performed versus an investment in the Fund’s benchmark index. The values indicate what $10,000 would have grown to over the time period indicated. The hypothetical example does not represent the returns of any particular investment.
16
Salient Tactical Real Estate Fund(d)
| | | | | | | | | | | | | | | | | | | | |
| | | 1 Year | | | 5 Year | | | 10 Year | | | Since
Inception | | | Inception
Date | |
| Average Annual Total Return for the period ended December 31, 2017 | | | | | | | | | | | | | | | | | |
Investor Class | | | -5.23% | | | | 6.53% | | | | N/A | | | | 6.98% | | | | 05/02/11 | |
| | | | | |
Institutional Class | | | -4.88% | | | | 6.90% | | | | 3.89% | | | | 2.80% | | | | 04/28/06 | |
| | | | | |
Class A (with sales load)(b) | | | -10.69% | | | | 5.22% | | | | 2.68% | | | | 9.10% | | | | 09/15/99 | |
| | | | | |
Class A (without sales load)(a) | | | -5.24% | | | | 6.47% | | | | 3.29% | | | | 9.45% | | | | 09/15/99 | |
| | | | | |
Class C (with CDSC)(e) | | | -6.68% | | | | 5.88% | | | | 2.63% | | | | 8.70% | | | | 09/15/99 | |
| | | | | |
Class C (without CDSC)(f) | | | -5.76% | | | | 5.88% | | | | 2.63% | | | | 8.70% | | | | 09/15/99 | |
(a) Excludes sales charge.
(b) Includes the effect of the maximum 5.75% sales charge.
(c) The index figures do not reflect any deduction for fees, expenses or taxes. It is not possible to invest directly in an index.
(d) Prior to May 1, 2016, Salient Tactical Real Estate Fund was known as Forward Real Estate Long/Short Fund. Prior to May 1, 2011, Forward Real Estate Long/ Short Fund was known as Forward Strategic Realty Fund. Prior to to June 12, 2009, Forward Strategic Realty Fund was known as Kensington Strategic Realty Fund.
(e) Includes the 1.00% contingent deferred sales charge.
(f) Excludes the 1.00% contingent deferred sales charge.
The performance quoted represents past performance, does not guarantee future results and current performance may be lower or higher than the data quoted. The investment return and principal value of an investment will fluctuate so that shares, when redeemed, may be worth more or less than their original cost. Performance data current to the most recent month-end may be obtained at www.salientfunds.com. Investment performance may reflect fee waivers in effect. In the absence of fee waivers, total return would be lower. Total return is based on NAV, assuming reinvestment of all distributions. Performance does not reflect the deduction of taxes that a shareholder would pay on fund distributions or the redemption of fund shares.
17
Investment Disclosures (Unaudited)
Fund Risk Disclosures
There are risks involved with investing, including loss of principal. Past performance does not guarantee future results, share prices will fluctuate and you may have a gain or loss when you redeem shares.
Asset allocation does not assure profit or protect against risk.
Diversification does not assure profit or protect against risk.
Salient International Real Estate Fund
Concentration in a particular industry will involve a greater degree of risk than a more diversified portfolio.
Debt securities are subject to interest rate risk. If interest rates increase, the value of debt securities generally declines. Debt securities with longer durations tend to be more sensitive to changes in interest rates and more volatile than securities with shorter durations.
Derivative instruments involve risks different from those associated with investing directly in securities and may cause, among other things, increased volatility and transaction costs or a fund to lose more than the amount invested.
Foreign securities, especially emerging or frontier markets, will involve additional risks including exchange rate fluctuations, social and political instability, less liquidity, greater volatility and less regulation.
Mortgage and asset-backed securities are debt instruments that are secured by interests in pools of mortgage loans or other financial instruments. Mortgage-backed securities are subject to, among other things, prepayment and extension risks.
Investing in a non-diversified fund involves the risk of greater price fluctuation than a more diversified portfolio.
Investing in the real estate industry or in real estate-related securities involves the risks associated with direct ownership of real estate which include, among other things, changes in economic conditions (e.g., interest rates), the macro real estate development market, government intervention (e.g., property taxes) or environmental disasters. These risks may also affect the value of equities that service the real estate sector.
Salient Real Estate Fund
Concentration in a particular industry will involve a greater degree of risk than a more diversified portfolio.
Debt securities are subject to interest rate risk. If interest rates increase, the value of debt securities generally declines. Debt securities with longer durations tend to be more sensitive to changes in interest rates and more volatile than securities with shorter durations.
Investing in lower-rated (“high yield”) debt securities involves special risks in addition to those associated with investments in higher-rated debt securities, including a high degree of credit risk.
Mortgage and asset-backed securities are debt instruments that are secured by interests in pools of mortgage loans or other financial instruments. Mortgage-backed securities are subject to, among other things, prepayment and extension risks.
Investing in the real estate industry or in real estate-related securities involves the risks associated with direct ownership of real estate which include, among other things, changes in economic conditions (e.g., interest rates), the macro real estate development market, government intervention (e.g., property taxes) or environmental disasters. These risks may also affect the value of equities that service the real estate sector.
Investing in smaller companies generally will present greater investment risks, including greater price volatility, greater sensitivity to changing economic conditions and less liquidity than investing in larger, more mature companies.
18
Investment Disclosures (Unaudited)
Salient Select Income Fund
Borrowing for investment purposes creates leverage, which can increase the risk and volatility of a fund.
Concentration in a particular industry will involve a greater degree of risk than a more diversified portfolio.
Debt securities are subject to interest rate risk. If interest rates increase, the value of debt securities generally declines. Debt securities with longer durations tend to be more sensitive to changes in interest rates and more volatile than securities with shorter durations.
Derivative instruments involve risks different from those associated with investing directly in securities and may cause, among other things, increased volatility and transaction costs or a fund to lose more than the amount invested.
Investing in lower-rated (“high yield”) debt securities involves special risks in addition to those associated with investments in higher-rated debt securities, including a high degree of credit risk.
Mortgage and asset-backed securities are debt instruments that are secured by interests in pools of mortgage loans or other financial instruments. Mortgage-backed securities are subject to, among other things, prepayment and extension risks.
Short selling involves additional investment risks and transaction costs, and creates leverage, which can increase the risk and volatility of a fund.
Investing in the real estate industry or in real estate-related securities involves the risks associated with direct ownership of real estate which include, among other things, changes in economic conditions (e.g., interest rates), the macro real estate development market, government intervention (e.g., property taxes) or environmental disasters. These risks may also affect the value of equities that service the real estate sector.
Investing in smaller companies generally will present greater investment risks, including greater price volatility, greater sensitivity to changing economic conditions and less liquidity than investing in larger, more mature companies.
Salient Select Opportunity Fund
Borrowing for investment purposes creates leverage, which can increase the risk and volatility of a fund.
Debt securities are subject to interest rate risk. If interest rates increase, the value of debt securities generally declines. Debt securities with longer durations tend to be more sensitive to changes in interest rates and more volatile than securities with shorter durations.
Derivative instruments involve risks different from those associated with investing directly in securities and may cause, among other things, increased volatility and transaction costs or a fund to lose more than the amount invested.
Foreign securities, especially emerging or frontier markets, will involve additional risks including exchange rate fluctuations, social and political instability, less liquidity, greater volatility and less regulation.
Investing in lower-rated (“high yield”) debt securities involves special risks in addition to those associated with investments in higher-rated debt securities, including a high degree of credit risk.
Mortgage and asset-backed securities are debt instruments that are secured by interests in pools of mortgage loans or other financial instruments. Mortgage-backed securities are subject to, among other things, prepayment and extension risks.
Investing in a non-diversified fund involves the risk of greater price fluctuation than a more diversified portfolio.
Investing in the real estate industry or in real estate-related securities involves the risks associated with direct ownership of real estate which include, among other things, changes in economic conditions (e.g., interest rates), the macro real estate development market, government intervention (e.g., property taxes) or environmental disasters. These risks may also affect the value of equities that service the real estate sector.
Investing in smaller companies generally will present greater investment risks, including greater price volatility, greater sensitivity to changing economic conditions and less liquidity than investing in larger, more mature companies.
19
Investment Disclosures (Unaudited)
Salient Tactical Real Estate Fund
Borrowing for investment purposes creates leverage, which can increase the risk and volatility of a fund.
Concentration in a particular industry will involve a greater degree of risk than a more diversified portfolio.
Debt securities are subject to interest rate risk. If interest rates increase, the value of debt securities generally declines. Debt securities with longer durations tend to be more sensitive to changes in interest rates and more volatile than securities with shorter durations.
Derivative instruments involve risks different from those associated with investing directly in securities and may cause, among other things, increased volatility and transaction costs or a fund to lose more than the amount invested.
Foreign securities, especially emerging or frontier markets, will involve additional risks including exchange rate fluctuations, social and political instability, less liquidity, greater volatility and less regulation.
Investing in lower-rated (“high yield”) debt securities involves special risks in addition to those associated with investments in higher-rated debt securities, including a high degree of credit risk.
Mortgage and asset-backed securities are debt instruments that are secured by interests in pools of mortgage loans or other financial instruments. Mortgage-backed securities are subject to, among other things, prepayment and extension risks.
Investing in the real estate industry or in real estate-related securities involves the risks associated with direct ownership of real estate which include, among other things, changes in economic conditions (e.g., interest rates), the macro real estate development market, government intervention (e.g., property taxes) or environmental disasters. These risks may also affect the value of equities that service the real estate sector.
Short selling involves additional investment risks and transaction costs, and creates leverage, which can increase the risk and volatility of a fund.
Investing in smaller companies generally will present greater investment risks, including greater price volatility, greater sensitivity to changing economic conditions and less liquidity than investing in larger, more mature companies.
Alternative strategies typically are subject to increased risk and loss of principal. Consequently, investments such as mutual funds that focus on alternative strategies are not suitable for all investors.
Fund Benchmark Definitions
FTSE EPRA/NAREIT Developed ex-U.S. Index is designed to track the performance of listed real estate companies and REITs worldwide, excluding U.S. companies.
FTSE NAREIT Composite Index is an unmanaged index consisting of approximately 200 real estate investment trust stocks.
FTSE NAREIT Equity REITs Index is representative of the tax-qualified REITs listed on the New York Stock Exchange, the American Stock Exchange and the NASDAQ National Market.
ICE BofAML Fixed Rate Preferred Securities Index is a capitalization-weighted index of preferred stock issues that is generally representative of the market for preferred securities. Prior to October 2017, the ICE BofAML Fixed Rate Preferred Securities Index was known as the BofA Merrill Lynch Preferred Index.
MSCI World Index is a free float-adjusted market capitalization index that is designed to measure equity market performance in the global developed markets.
S&P 500 Index is an unmanaged index of 500 common stocks chosen to reflect the industries in the U.S. economy.
One cannot invest directly in an index.
20
Investment Disclosures (Unaudited)
Definition of Terms
Call option is an agreement that gives an investor the right (but not the obligation) to buy a stock, bond, commodity or other instrument at a specified price within a specific time period.
Capitalization (cap) rate is the rate of return on a real estate investment property based on the income that the property is expected to generate. The cap rate is used to estimate the investor’s potential return on his or her investment.
Cash flow is a revenue or expense stream that changes a cash account over a given period.
Credit quality informs investors of a bond or bond portfolio’s credit worthiness, or risk of default.
Inflation is the rate at which the general level of prices for goods and services is rising, and, subsequently, purchasing power is falling.
MSCI Europe Financials Index represents large- and mid-cap companies within the financials sector across 15 developed market countries in Europe.
MSCI World Financials Index represents large- and mid-cap companies within the financials sector across 23 developed market countries.
Real estate investment trust (REIT) is a security that sells like a stock on the major exchanges and invests in real estate directly, either through properties or mortgages.
Short is a borrowed security, commodity or currency that is sold on the open market with the expectation that the asset will fall in value.
Volatility is a statistical measure of the dispersion of returns for a given security or market index.
Wells Fargo Hybrid and Preferred Securities REIT Index is a modified market capitalization-weighted index that tracks the performance of preferred securities issued in the U.S. market by real estate investment trusts.
21
Disclosure of Fund Expenses (Unaudited)
For the Six Months Ended December 31, 2017
As a shareholder of the Salient Funds, you incur two types of costs: (1) transaction costs, including applicable sales charges (loads); and (2) ongoing costs, including management fees, distribution and service (12b-1) fees, shareholder services fees and other Fund expenses. This example is intended to help you understand your ongoing costs (in dollars) of investing in the Funds and to compare these costs with the ongoing costs of investing in other mutual funds. The example is based on an investment of $1,000 invested at the beginning of the (six-month) period and held for the entire period July 1, 2017 through December 31, 2017.
Actual Expenses
The first line for each share class of each Fund in the table provides information about actual account values and actual expenses. You may use this information, together with the amount you invested, to estimate the expenses that you paid over the period. Simply divide your account value by $1,000 (for example, an $8,600 account value divided by $1,000 = 8.6), then multiply the result by the number in the applicable line under the heading entitled “Expenses Paid During Period” to estimate the expenses you paid on your account during this period.
Hypothetical Example For Comparison Purposes
The second line for each share class of each Fund in the table below provides information about hypothetical account values and hypothetical expenses based on the Fund’s actual expense ratio and an assumed rate of return of 5% per year before expenses, which is not the Fund’s actual return. The hypothetical account values and expenses may not be used to estimate the actual ending account balance or expenses you paid for the period. You may use this information to compare the ongoing costs of investing in the Funds and other funds. To do so, compare this 5% hypothetical example with the 5% hypothetical examples that appear in the shareholder reports of other funds.
Please note that the expenses shown in the table below are meant to highlight your ongoing costs only and do not reflect any transactional costs, such as sales charges (loads), redemption fees or exchange fees. Therefore, the second line for each share class of each Fund within the table is useful in comparing ongoing costs only, and will not help you determine the relative total costs of owning different funds. If these transactional costs were included, your costs would have been higher.
| | | | | | | | | | | | | | | | |
| Salient International Real Estate Fund | | Beginning
Account Value
07/01/17 | | | Ending
Account Value
12/31/17 | | | Expense
Ratios(a) | | | Expenses Paid
During Period(b)
07/01/17-12/31/17 | |
| Investor Class | | | | | | | | | | | | | | | | |
Actual | | $ | 1,000.00 | | | $ | 1,100.90 | | | | 2.33% | | | $ | 12.34 | |
| | | | |
Hypothetical | | $ | 1,000.00 | | | $ | 1,013.46 | | | | 2.33% | | | $ | 11.82 | |
| Institutional Class | | | | | | | | | | | | | | | | |
Actual | | $ | 1,000.00 | | | $ | 1,102.00 | | | | 1.98% | | | $ | 10.49 | |
| | | | |
Hypothetical | | $ | 1,000.00 | | | $ | 1,015.22 | | | | 1.98% | | | $ | 10.06 | |
| Class A | | | | | | | | | | | | | | | | |
Actual | | $ | 1,000.00 | | | $ | 1,099.50 | | | | 2.38% | | | $ | 12.59 | |
| | | | |
Hypothetical | | $ | 1,000.00 | | | $ | 1,013.21 | | | | 2.38% | | | $ | 12.08 | |
| Class C | | | | | | | | | | | | | | | | |
Actual | | $ | 1,000.00 | | | $ | 1,096.50 | | | | 2.93% | | | $ | 15.48 | |
| | | | |
Hypothetical | | $ | 1,000.00 | | | $ | 1,010.44 | | | | 2.93% | | | $ | 14.85 | |
| Salient Real Estate Fund | | | | | | | | | | | | |
| Investor Class | | | | | | | | | | | | | | | | |
Actual | | $ | 1,000.00 | | | $ | 974.60 | | | | 1.98% | | | $ | 9.85 | |
| | | | |
Hypothetical | | $ | 1,000.00 | | | $ | 1,015.22 | | | | 1.98% | | | $ | 10.06 | |
22
Disclosure of Fund Expenses (Unaudited)
For the Six Months Ended December 31, 2017
| | | | | | | | | | | | | | | | |
| Salient Real Estate Fund (continued) | | Beginning
Account Value
07/01/17 | | | Ending
Account Value
12/31/17 | | | Expense
Ratios(a) | | | Expenses Paid
During Period(b)
07/01/17-12/31/17 | |
| Institutional Class | | | | | | | | | | | | | | | | |
Actual | | $ | 1,000.00 | | | $ | 976.70 | | | | 1.63% | | | $ | 8.12 | |
| | | | |
Hypothetical | | $ | 1,000.00 | | | $ | 1,016.99 | | | | 1.63% | | | $ | 8.29 | |
| Class A | | | | | | | | | | | | | | | | |
Actual | | $ | 1,000.00 | | | $ | 974.00 | | | | 2.03% | | | $ | 10.10 | |
| | | | |
Hypothetical | | $ | 1,000.00 | | | $ | 1,014.97 | | | | 2.03% | | | $ | 10.31 | |
| Class C | | | | | | | | | | | | | | | | |
Actual | | $ | 1,000.00 | | | $ | 972.20 | | | | 2.58% | | | $ | 12.83 | |
| | | | |
Hypothetical | | $ | 1,000.00 | | | $ | 1,012.20 | | | | 2.58% | | | $ | 13.09 | |
| Salient Select Income Fund | | | | | | | | | | | | |
| Investor Class | | | | | | | | | | | | | | | | |
Actual | | $ | 1,000.00 | | | $ | 995.80 | | | | 2.06% | | | $ | 10.36 | |
| | | | |
Hypothetical | | $ | 1,000.00 | | | $ | 1,014.82 | | | | 2.06% | | | $ | 10.46 | |
| Institutional Class | | | | | | | | | | | | | | | | |
Actual | | $ | 1,000.00 | | | $ | 997.70 | | | | 1.75% | | | $ | 8.81 | |
| | | | |
Hypothetical | | $ | 1,000.00 | | | $ | 1,016.38 | | | | 1.75% | | | $ | 8.89 | |
| Class A | | | | | | | | | | | | | | | | |
Actual | | $ | 1,000.00 | | | $ | 995.60 | | | | 2.12% | | | $ | 10.66 | |
| | | | |
Hypothetical | | $ | 1,000.00 | | | $ | 1,014.52 | | | | 2.12% | | | $ | 10.76 | |
| Class C | | | | | | | | | | | | | | | | |
Actual | | $ | 1,000.00 | | | $ | 992.80 | | | | 2.69% | | | $ | 13.51 | |
| | | | |
Hypothetical | | $ | 1,000.00 | | | $ | 1,011.64 | | | | 2.69% | | | $ | 13.64 | |
| Salient Select Opportunity Fund | | | | | | | | | | | | |
| Investor Class | | | | | | | | | | | | | | | | |
Actual | | $ | 1,000.00 | | | $ | 994.90 | | | | 1.74% | | | $ | 8.75 | |
| | | | |
Hypothetical | | $ | 1,000.00 | | | $ | 1,016.43 | | | | 1.74% | | | $ | 8.84 | |
| Institutional Class | | | | | | | | | | | | | | | | |
Actual | | $ | 1,000.00 | | | $ | 997.00 | | | | 1.38% | | | $ | 6.95 | |
| | | | |
Hypothetical | | $ | 1,000.00 | | | $ | 1,018.25 | | | | 1.38% | | | $ | 7.02 | |
| Class A | | | | | | | | | | | | | | | | |
Actual | | $ | 1,000.00 | | | $ | 994.30 | | | | 1.89% | | | $ | 9.50 | |
| | | | |
Hypothetical | | $ | 1,000.00 | | | $ | 1,015.68 | | | | 1.89% | | | $ | 9.60 | |
| Class C | | | | | | | | | | | | | | | | |
Actual | | $ | 1,000.00 | | | $ | 991.80 | | | | 2.33% | | | $ | 11.70 | |
| | | | |
Hypothetical | | $ | 1,000.00 | | | $ | 1,013.46 | | | | 2.33% | | | $ | 11.82 | |
23
Disclosure of Fund Expenses (Unaudited)
For the Six Months Ended December 31, 2017
| | | | | | | | | | | | | | | | |
| Salient Tactical Real Estate Fund | | Beginning
Account Value
07/01/17 | | | Ending
Account Value
12/31/17 | | | Expense
Ratios(a) | | | Expenses Paid
During Period(b)
07/01/17-12/31/17 | |
| Investor Class | | | | | | | | | | | | | | | | |
Actual | | $ | 1,000.00 | | | $ | 967.70 | | | | 2.44% | | | $ | 12.10 | |
| | | | |
Hypothetical | | $ | 1,000.00 | | | $ | 1,012.91 | | | | 2.44% | | | $ | 12.38 | |
| Institutional Class | | | | | | | | | | | | | | | | |
Actual | | $ | 1,000.00 | | | $ | 969.40 | | | | 2.11% | | | $ | 10.47 | |
| | | | |
Hypothetical | | $ | 1,000.00 | | | $ | 1,014.57 | | | | 2.11% | | | $ | 10.71 | |
| Class A | | | | | | | | | | | | | | | | |
Actual | | $ | 1,000.00 | | | $ | 967.50 | | | | 2.50% | | | $ | 12.40 | |
| | | | |
Hypothetical | | $ | 1,000.00 | | | $ | 1,012.60 | | | | 2.50% | | | $ | 12.68 | |
| Class C | | | | | | | | | | | | | | | | |
Actual | | $ | 1,000.00 | | | $ | 965.10 | | | | 3.06% | | | $ | 15.16 | |
| | | | |
Hypothetical | | $ | 1,000.00 | | | $ | 1,009.78 | | | | 3.06% | | | $ | 15.50 | |
(a) Annualized, based on the Fund’s most recent fiscal half year expenses.
(b) Expenses are equal to the Fund’s annualized expense ratio multiplied by the average account values over the period, multiplied by the number of days in the most recent fiscal half year (184), then divided by 365.
24
Schedule of Investments (See Note 11)
Salient International Real Estate Fund
December 31, 2017
| | | | | | | | |
| | | Shares | | | Value
(See Note 2) | |
| | |
| Common Stocks: 98.39% | | | | | | | | |
| Australia: 7.30% | | | | | | | | |
| | |
Garda Diversified Property Fund | | | 535,600 | | | $ | 493,124 | |
| | |
Mirvac Group | | | 259,600 | | | | 475,999 | |
| | |
Scentre Group | | | 139,000 | | | | 454,426 | |
| | |
Westfield Corp. | | | 22,554 | | | | 167,003 | |
| | |
| | | | | | | 1,590,552 | |
| | | | | | | | |
| Austria: 2.16% | | | | | | | | |
| | |
BUWOG AG | | | 13,625 | | | | 470,004 | |
| | | | | | | | |
| France: 5.75% | | | | | | | | |
| | |
Gecina SA | | | 4,571 | | | | 844,067 | |
| | |
Klepierre | | | 9,300 | | | | 409,131 | |
| | |
| | | | | | | 1,253,198 | |
| | | | | | | | |
| Germany: 4.98% | | | | | | | | |
| | |
ADO Properties SA(a) | | | 7,200 | | | | 365,254 | |
| | |
alstria office REIT AG | | | 19,000 | | | | 294,083 | |
| | |
Vonovia SE | | | 8,600 | | | | 427,092 | |
| | |
| | | | | | | 1,086,429 | |
| | | | | | | | |
| Hong Kong: 11.26% | | | | | | | | |
| | |
Henderson Land Development Co., Ltd. | | | 121,660 | | | | 801,947 | |
| | |
Hongkong Land Holdings, Ltd. | | | 43,000 | | | | 302,720 | |
| | |
Link REIT | | | 74,000 | | | | 686,216 | |
| | |
Swire Properties, Ltd. | | | 205,400 | | | | 662,508 | |
| | |
| | | | | | | 2,453,391 | |
| | | | | | | | |
| Italy: 6.29% | | | | | | | | |
| | |
Beni Stabili SpA | | | 900,000 | | | | 832,576 | |
| | |
COIMA RES SpA(a) | | | 50,000 | | | | 539,033 | |
| | |
| | | | | | | 1,371,609 | |
| | | | | | | | |
| Japan: 21.49% | | | | | | | | |
| | |
Mitsubishi Estate Co., Ltd. | | | 51,000 | | | | 887,153 | |
| | |
Mitsui Fudosan Co., Ltd. | | | 43,000 | | | | 963,612 | |
| | |
NIPPON REIT Investment Corp. | | | 160 | | | | 459,374 | |
| | |
Nomura Real Estate Holdings, Inc. | | | 10,700 | | | | 239,878 | |
| | |
NTT Urban Development Corp. | | | 51,100 | | | | 591,386 | |
| | |
Sumitomo Realty & Development Co., Ltd. | | | 29,000 | | | | 953,069 | |
| | | | | | | | |
| | | Shares | | | Value
(See Note 2) | |
| | |
| | | | | | | | |
| | | | | | | | | |
| | |
Tokyo Tatemono Co., Ltd. | | | 43,600 | | | $ | 588,943 | |
| | |
| | | | | | | 4,683,415 | |
| | | | | | | | |
| Netherlands: 1.65% | | | | | | | | |
| | |
InterXion Holding NV(b) | | | 6,100 | | | | 359,473 | |
| | | | | | | | |
| Singapore: 6.72% | | | | | | | | |
| | |
CapitaLand, Ltd. | | | 172,600 | | | | 455,552 | |
| | |
Keppel REIT | | | 514,700 | | | | 484,894 | |
| | |
UOL Group, Ltd. | | | 78,900 | | | | 523,267 | |
| | |
| | | | | | | 1,463,713 | |
| | | | | | | | |
| Spain: 6.48% | | | | | | | | |
| | |
Inmobiliaria Colonial SA | | | 59,300 | | | | 589,345 | |
| | |
Lar Espana Real Estate Socimi SA | | | 30,200 | | | | 322,133 | |
| | |
Merlin Properties Socimi SA | | | 36,900 | | | | 500,302 | |
| | |
| | | | | | | 1,411,780 | |
| | | | | | | | |
| Sweden: 3.26% | | | | | | | | |
| | |
Fabege AB | | | 18,400 | | | | 391,637 | |
| | |
Hufvudstaden AB, Class A | | | 19,900 | | | | 318,765 | |
| | |
| | | | | | | 710,402 | |
| | | | | | | | |
| United Kingdom: 21.05% | | | | | | | | |
| | |
Belmond, Ltd., Class A(b) | | | 25,300 | | | | 309,925 | |
| | |
Capital & Counties Properties Plc | | | 159,500 | | | | 688,471 | |
| | |
Derwent London Plc | | | 15,100 | | | | 635,675 | |
| | |
Great Portland Estates Plc | | | 67,250 | | | | 625,142 | |
| | |
Hammerson Plc | | | 46,900 | | | | 346,372 | |
| | |
Helical Plc | | | 121,200 | | | | 556,370 | |
| | |
Land Securities Group Plc | | | 17,675 | | | | 240,548 | |
| | |
Segro Plc | | | 74,140 | | | | 587,588 | |
| | |
Workspace Group Plc | | | 44,100 | | | | 596,608 | |
| | |
| | | | | | | 4,586,699 | |
| | |
Total Common Stocks
(Cost $17,874,913) | | | | | | | 21,440,665 | |
| | |
Total Investments: 98.39%
(Cost $17,874,913) | | | | | | | 21,440,665 | |
| | |
| Net Other Assets and Liabilities: 1.61% | | | | | | | 350,642 | |
| | |
| Net Assets: 100.00% | | | | | | $ | 21,791,307 | |
| | | | |
| See accompanying Notes to Financial Statements. | | 25 | | |
Schedule of Investments (See Note 11)
Salient International Real Estate Fund
December 31, 2017
Percentages are stated as a percent of net assets.
(a) Securities exempt from registration under Rule 144A of the Securities Act of 1933. These securities may be sold in the ordinary course of business in transactions exempt from registration, normally to qualified institutional buyers. These securities have been deemed liquid under guidelines approved by the Fund’s Board of Trustees, unless otherwise noted below. At period end, the aggregate value of those securities was $904,287, representing 4.15% of net assets.
(b) Non-income producing security.
Investment Abbreviations:
REIT — Real Estate Investment Trust
| | | | |
| See accompanying Notes to Financial Statements. | | 26 | | |
Schedule of Investments (See Note 11)
Salient Real Estate Fund
December 31, 2017
| | | | | | | | |
| | | Shares | | | Value
(See Note 2) | |
| |
| Common Stocks: 96.20% | | | | | |
| Healthcare Providers & Services: 0.24% | | | | | | | | |
| | |
Genesis Healthcare, Inc.(a) | | | 91,700 | | | $ | 69,958 | |
| | | | | | | | |
| Hotels, Restaurants & Leisure: 2.15% | | | | | | | | |
| | |
Belmond, Ltd., Class A(a) | | | 51,800 | | | | 634,550 | |
| | | | | | | | |
| Real Estate Operating/Development: 2.00% | | | | | | | | |
| | |
Forest City Realty Trust, Inc., Class A | | | 24,500 | | | | 590,450 | |
| | | | | | | | |
| REITs-Apartments: 12.54% | | | | | | | | |
| | |
American Campus Communities, Inc. | | | 5,000 | | | | 205,150 | |
| | |
Apartment Investment & Management Co., Class A | | | 16,000 | | | | 699,360 | |
| | |
AvalonBay Communities, Inc. | | | 5,100 | | | | 909,891 | |
| | |
Clipper Realty, Inc. | | | 31,400 | | | | 313,686 | |
| | |
Equity Residential | | | 12,700 | | | | 809,879 | |
| | |
Essex Property Trust, Inc. | | | 3,200 | | | | 772,384 | |
| | |
| | | | | | | 3,710,350 | |
| | | | | | | | |
| REITs-Diversified: 12.74% | | | | | | | | |
| | |
Alexander & Baldwin, Inc. | | | 12,200 | | | | 338,428 | |
| | |
American Assets Trust, Inc. | | | 24,300 | | | | 929,232 | |
| | |
Farmland Partners, Inc. | | | 28,900 | | | | 250,852 | |
| | |
Howard Hughes Corp.(a) | | | 3,500 | | | | 459,445 | |
| | |
Resource Capital Corp. | | | 38,038 | | | | 356,416 | |
| | |
Urstadt Biddle Properties, Inc., Class A | | | 31,500 | | | | 684,810 | |
| | |
Vornado Realty Trust | | | 9,600 | | | | 750,528 | |
| | |
| | | | | | | 3,769,711 | |
| | | | | | | | |
| REITs-Healthcare: 6.56% | | | | | | | | |
| | |
Brookdale Senior Living, Inc.(a) | | | 63,700 | | | | 617,890 | |
| | |
MedEquities Realty Trust, Inc. | | | 1,800 | | | | 20,196 | |
| | |
Sabra Health Care REIT, Inc. | | | 45,000 | | | | 844,650 | |
| | |
Welltower, Inc. | | | 7,200 | | | | 459,144 | |
| | |
| | | | | | | 1,941,880 | |
| | | | | | | | |
| REITs-Hotels: 5.12% | | | | | | | | |
| | |
Ashford Hospitality Prime, Inc. | | | 85,423 | | | | 831,166 | |
| | |
Chatham Lodging Trust | | | 30,100 | | | | 685,076 | |
| | |
| | | | | | | 1,516,242 | |
| | | | | | | | |
| | | Shares | | | Value
(See Note 2) | |
| | |
| | | | | | | | |
| REITs-Mortgage: 4.38% | | | | | | | | |
| | |
Colony NorthStar, Inc., Class A | | | 113,500 | | | $ | 1,295,035 | |
| | | | | | | | |
| REITs-Office Property: 16.68% | | | | | | | | |
| | |
Alexandria Real Estate Equities, Inc. | | | 5,700 | | | | 744,363 | |
| | |
Digital Realty Trust, Inc. | | | 7,200 | | | | 820,080 | |
| | |
Government Properties Income Trust | | | 36,300 | | | | 673,002 | |
| | |
HCP, Inc. | | | 17,800 | | | | 464,224 | |
| | |
Mack-Cali Realty Corp. | | | 27,900 | | | | 601,524 | |
| | |
Paramount Group, Inc. | | | 59,700 | | | | 946,245 | |
| | |
SL Green Realty Corp. | | | 6,800 | | | | 686,324 | |
| | |
| | | | | | | 4,935,762 | |
| | | | | | | | |
| REITs-Regional Malls: 8.56% | | | | | | | | |
| | |
GGP, Inc. | | | 24,600 | | | | 575,394 | |
| | |
Macerich Co. | | | 7,600 | | | | 499,168 | |
| | |
Simon Property Group, Inc. | | | 4,000 | | | | 686,960 | |
| | |
Taubman Centers, Inc. | | | 11,800 | | | | 772,074 | |
| | |
| | | | | | | 2,533,596 | |
| | | | | | | | |
| REITs-Residential: 2.07% | | | | | | | | |
| | |
American Homes 4 Rent, Class A | | | 28,041 | | | | 612,415 | |
| | | | | | | | |
| REITs-Shopping Centers: 12.83% | | | | | | | | |
| | |
Acadia Realty Trust | | | 19,100 | | | | 522,576 | |
| | |
Brixmor Property Group, Inc. | | | 22,700 | | | | 423,582 | |
| | |
DDR Corp. | | | 66,400 | | | | 594,944 | |
| | |
Kimco Realty Corp. | | | 14,800 | | | | 268,620 | |
| | |
Kite Realty Group Trust | | | 30,900 | | | | 605,640 | |
| | |
Retail Opportunity Investments Corp. | | | 32,700 | | | | 652,365 | |
| | |
Tanger Factory Outlet Centers, Inc. | | | 27,500 | | | | 729,025 | |
| | |
| | | | | | | 3,796,752 | |
| | | | | | | | |
| REITs-Specialized: 3.50% | | | | | | | | |
| | |
CoreSite Realty Corp. | | | 9,100 | | | | 1,036,490 | |
| | | | | | | | |
| REITs-Storage: 3.58% | | | | | | | | |
| | |
Jernigan Capital, Inc. | | | 44,900 | | | | 853,549 | |
| | |
National Storage Affiliates Trust | | | 7,503 | | | | 204,532 | |
| | |
| | | | | | | 1,058,081 | |
| | | | |
| See accompanying Notes to Financial Statements. | | 27 | | |
Schedule of Investments (See Note 11)
Salient Real Estate Fund
December 31, 2017
| | | | | | | | |
| | | Shares | | | Value
(See Note 2) | |
| | |
| | | | | | | | |
| REITs-Timber: 1.01% | | | | | | | | |
| | |
Weyerhaeuser Co. | | | 8,500 | | | $ | 299,710 | |
| | | | | | | | |
| REITs-Warehouse/Industrial: 2.24% | | | | | | | | |
| | |
STAG Industrial, Inc. | | | 24,200 | | | | 661,386 | |
| | |
Total Common Stocks
(Cost $25,966,132) | | | | | | | 28,462,368 | |
| | |
Total Investments: 96.20%
(Cost $25,966,132) | | | | | | | 28,462,368 | |
| | |
| Net Other Assets and Liabilities: 3.80% | | | | | | | 1,124,633 | |
| | |
| Net Assets: 100.00% | | | | | | $ | 29,587,001 | |
Percentages are stated as a percent of net assets.
(a) Non-income producing security.
Investment Abbreviations:
REIT — Real Estate Investment Trust
| | | | |
| See accompanying Notes to Financial Statements. | | 28 | | |
Schedule of Investments (See Note 11)
Salient Select Income Fund
December 31, 2017
| | | | | | | | |
| | | Shares | | | Value
(See Note 2) | |
| |
| Common Stocks: 23.95% | | | | | |
| REITs-Apartments: 3.60% | | | | | | | | |
| | |
Apartment Investment & Management Co., Class A(a) | | | 458,800 | | | $ | 20,054,148 | |
| | |
Clipper Realty, Inc.(a)(b) | | | 940,796 | | | | 9,398,552 | |
| | |
| | | | | | | 29,452,700 | |
| | | | | | | | |
| REITs-Diversified: 1.39% | | | | | | | | |
| | |
Resource Capital Corp.(a) | | | 1,215,715 | | | | 11,391,250 | |
| | | | | | | | |
| REITs-Healthcare: 3.16% | | | | | | | | |
| | |
MedEquities Realty Trust, Inc. | | | 52,584 | | | | 589,993 | |
| | |
Sabra Health Care REIT, Inc.(a) | | | 1,349,425 | | | | 25,328,707 | |
| | |
| | | | | | | 25,918,700 | |
| | | | | | | | |
| REITs-Hotels: 2.35% | | | | | | | | |
| | |
Chatham Lodging Trust(a) | | | 845,000 | | | | 19,232,200 | |
| | | | | | | | |
| REITs-Mortgage: 3.69% | | | | | | | | |
| | |
Colony NorthStar, Inc., Class A(a) | | | 2,646,412 | | | | 30,195,561 | |
| | | | | | | | |
| REITs-Regional Malls: 1.04% | | | | | | | | |
| | |
Taubman Centers, Inc.(a) | | | 130,500 | | | | 8,538,615 | |
| | | | | | | | |
| REITs-Residential: 0.23% | | | | | | | | |
| | |
American Homes 4 Rent, Class A | | | 84,801 | | | | 1,852,055 | |
| | | | | | | | |
| REITs-Specialized: 2.46% | | | | | | | | |
| | |
Government Properties Income Trust(a) | | | 1,089,000 | | | | 20,190,060 | |
| | | | | | | | |
| REITs-Storage: 3.67% | | | | | | | | |
| | |
Jernigan Capital, Inc.(a)(b) | | | 1,296,700 | | | | 24,650,267 | |
| | |
National Storage Affiliates Trust(a) | | | 198,892 | | | | 5,421,796 | |
| | |
| | | | | | | 30,072,063 | |
| | | | | | | | |
| REITs-Warehouse/Industrial: 2.36% | | | | | | | | |
| | |
STAG Industrial, Inc.(a) | | | 706,118 | | | | 19,298,205 | |
| | |
Total Common Stocks
(Cost $180,349,939) | | | | | | | 196,141,409 | |
| |
| Convertible Preferred Stocks: 10.81% | | | | | |
| REITs-Diversified: 1.99% | | | | | | | | |
| | |
Lexington Realty Trust
Series C, 6.500%(a) | | | 316,455 | | | | 16,242,053 | |
| | | | | | | | |
| REITs-Office Property: 0.47% | | | | | | | | |
| | |
Alexandria Real Estate Equities, Inc.
Series D, 7.000%(a) | | | 102,798 | | | | 3,868,803 | |
| | | | | | | | |
| | | Shares | | | Value
(See Note 2) | |
| | |
| | | | | | | | |
| REITs-Residential: 2.92% | | | | | | | | |
| | |
American Homes 4 Rent
Series C, 5.500%(a) | | | 841,000 | | | $ | 23,926,450 | |
| | | | | | | | |
| REITs-Shopping Centers: 1.74% | | | | | | | | |
| | |
Ramco-Gershenson Properties Trust
Series D, 7.250%(a) | | | 245,700 | | | | 14,230,944 | |
| | | | | | | | |
| REITs-Specialized: 3.69% | | | | | | | | |
| | |
EPR Properties
Series C, 5.750% | | | 248,700 | | | | 6,695,004 | |
| | |
Series E, 9.000%(a) | | | 644,101 | | | | 23,541,891 | |
| | |
| | | | | | | 30,236,895 | |
| | |
Total Convertible Preferred Stocks
(Cost $66,939,942) | | | | | | | 88,505,145 | |
| |
| Preferred Stocks: 54.39% | | | | | |
| Capital Markets: 0.37% | | | | | | | | |
| | |
B. Riley Financial, Inc.
7.250%, 12/31/2027(c) | | | 120,000 | | | | 3,055,200 | |
| | | | | | | | |
| Oil, Gas & Consumable Fuels: 0.83% | | | | | | | | |
| | |
TravelCenters of America LLC
8.250%, 1/15/2028(a) | | | 270,170 | | | | 6,821,792 | |
| | | | | | | | |
| REITs-Diversified: 4.95% | | | | | | | | |
| | |
CorEnergy Infrastructure Trust, Inc.
Series A, 7.375%(a) | | | 500,000 | | | | 12,870,000 | |
| | |
Global Net Lease, Inc.
Series A, 7.250% | | | 499,600 | | | | 12,839,720 | |
| | |
Investors Real Estate Trust
Series C, 6.625% | | | 80,000 | | | | 2,082,000 | |
| | |
Landmark Infrastructure Partners LP
Series B, 7.900% | | | 100,000 | | | | 2,546,000 | |
| | |
Spirit Realty Capital, Inc.
Series A, 6.000%(a) | | | 200,000 | | | | 4,968,000 | |
| | |
Vornado Realty Trust
Series M, 5.250%(c) | | | 200,000 | | | | 5,232,000 | |
| | |
| | | | | | | 40,537,720 | |
| | | | | | | | |
| REITs-Healthcare: 3.34% | | | | | | | | |
| | |
Global Medical REIT, Inc.
Series A, 7.500% | | | 400,000 | | | | 10,128,000 | |
| | | | |
| See accompanying Notes to Financial Statements. | | 29 | | |
Schedule of Investments (See Note 11)
Salient Select Income Fund
December 31, 2017
| | | | | | | | |
| | | Shares | | | Value
(See Note 2) | |
| | |
| | | | | | | | |
| REITs-Healthcare (continued): 3.34% | | | | | | | | |
| | |
Sabra Health Care REIT, Inc.
Series A, 7.125%(a) | | | 676,943 | | | $ | 17,241,738 | |
| | |
| | | | | | | 27,369,738 | |
| | | | | | | | |
| REITs-Hotels: 13.17% | | | | | | | | |
| | |
Ashford Hospitality Prime, Inc.
Series B, 5.500%(a) | | | 2,756,175 | | | | 55,095,938 | |
| | |
Hersha Hospitality Trust
Series C, 6.875%(a) | | | 275,000 | | | | 6,912,125 | |
| | |
Series E, 6.500% | | | 200,000 | | | | 4,948,000 | |
| | |
Pebblebrook Hotel Trust
Series D, 6.375% | | | 177,725 | | | | 4,571,087 | |
| | |
RLJ Lodging Trust
Series A, 1.950%(a) | | | 1,025,000 | | | | 27,685,250 | |
| | |
Summit Hotel Properties, Inc.
Series C, 7.125%(a) | | | 137,500 | | | | 3,491,125 | |
| | |
Series E, 6.250%(a) | | | 200,000 | | | | 5,134,000 | |
| | |
| | | | | | | 107,837,525 | |
| | | | | | | | |
| REITs-Industrial: 0.93% | | | | | | | | |
| | |
Plymouth Industrial REIT, Inc.
Series A, 7.500% | | | 200,000 | | | | 5,030,000 | |
| | |
Rexford Indus Realty, Inc.
Series B, 5.875%(c) | | | 100,000 | | | | 2,544,000 | |
| | |
| | | | | | | 7,574,000 | |
| | | | | | | | |
| REITs-Mortgage: 8.80% | | | | | | | | |
| | |
Colony NorthStar, Inc.
Series G, 7.500%(a) | | | 367,984 | | | | 9,254,798 | |
| | |
Series H, 7.125%(a) | | | 400,000 | | | | 10,004,000 | |
| | |
Series I, 7.150% | | | 200,000 | | | | 5,036,000 | |
| | |
iStar Financial, Inc.
Series D, 8.000%(a) | | | 266,011 | | | | 6,748,699 | |
| | |
Series G, 7.650%(a) | | | 848,247 | | | | 21,647,263 | |
| | |
Series I, 7.500%(a) | | | 275,200 | | | | 6,981,549 | |
| | |
Resource Capital Corp.
8.625% | | | 30,657 | | | | 782,367 | |
| | |
8.250% | | | 96,978 | | | | 2,423,480 | |
| | |
Sutherland Asset Management Corp. 7.000%, 8/15/2023 | | | 360,000 | | | | 9,162,000 | |
| | |
| | | | | | | 72,040,156 | |
| | | | | | | | |
| | | Shares | | | Value
(See Note 2) | |
| | |
| | | | | | | | |
| REITs-Office Property: 1.26% | | | | | | | | |
| | |
Gramercy Property Trust
Series A, 7.125%(a) | | | 263,479 | | | $ | 7,053,333 | |
| | |
Highwoods Properties, Inc.
Series A, 8.625%(a) | | | 2,624 | | | | 3,272,110 | |
| | |
| | | | | | | 10,325,443 | |
| | | | | | | | |
| REITs-Regional Malls: 1.03% | | | | | | | | |
| | |
Washington Prime Group, Inc.
Series I, 6.875%(a) | | | 340,669 | | | | 8,438,371 | |
| | | | | | | | |
| REITs-Residential: 5.28% | | | | | | | | |
| | |
Bluerock Residential Growth REIT, Inc.
Series A, 8.250% | | | 200,000 | | | | 5,275,500 | |
| | |
Series C, 7.625% | | | 224,000 | | | | 5,700,800 | |
| | |
Series D, 7.125% | | | 275,000 | | | | 6,930,000 | |
| | |
UMH Properties, Inc.
Series B, 8.000%(a) | | | 329,000 | | | | 8,975,120 | |
| | |
Series C, 6.750%(a) | | | 600,000 | | | | 16,320,000 | |
| | |
| | | | | | | 43,201,420 | |
| | | | | | | | |
| REITs-Shopping Centers: 9.12% | | | | | | | | |
| | |
Cedar Realty Trust, Inc.
Series B, 7.250%(a) | | | 151,879 | | | | 3,836,464 | |
| | |
Series C, 6.500%(a) | | | 200,000 | | | | 5,008,000 | |
| | |
Kimco Realty Corp.
Series L, 5.125% | | | 200,000 | | | | 4,948,000 | |
| | |
Pennsylvania Real Estate Investment Trust
Series D, 6.875% | | | 200,000 | | | | 5,022,000 | |
| | |
Saul Centers, Inc.
Series C, 6.875%(a) | | | 775,000 | | | | 19,568,750 | |
| | |
Seritage Growth Properties
Series A, 7.000%(c) | | | 120,000 | | | | 2,916,000 | |
| | |
Urstadt Biddle Properties, Inc.
Series G, 6.750% | | | 450,000 | | | | 11,862,000 | |
| | |
Series H, 6.250% | | | 350,000 | | | | 9,152,500 | |
| | |
Wheeler Real Estate Investment Trust, Inc.
Series B, 9.000% | | | 390,000 | | | | 8,346,000 | |
| | |
Series D, 8.750% | | | 200,000 | | | | 4,020,000 | |
| | |
| | | | | | | 74,679,714 | |
| | | | |
| See accompanying Notes to Financial Statements. | | 30 | | |
Schedule of Investments (See Note 11)
Salient Select Income Fund
December 31, 2017
| | | | | | | | |
| | | Shares | | | Value
(See Note 2) | |
| | |
| | | | | | | | |
| REITs-Specialized: 2.52% | | | | | | | | |
| | |
Farmland Partners, Inc.
Series B, 6.000%(a) | | | 800,000 | | | $ | 20,616,000 | |
| | | | | | | | |
| REITs-Storage: 0.95% | | | | | | | | |
| | |
National Storage Affiliates Trust
Series A, 6.000% | | | 300,000 | | | | 7,812,000 | |
| | | | | | | | |
| REITs-Warehouse/Industrial: 1.84% | | | | | | | | |
| | |
Monmouth Real Estate Investment Corp.
Series C, 6.125%(a) | | | 400,000 | | | | 10,016,000 | |
| | |
STAG Industrial, Inc.
Series B, 6.625%(a) | | | 200,000 | | | | 5,050,000 | |
| | |
| | | | | | | 15,066,000 | |
| | |
Total Preferred Stocks
(Cost $423,255,917) | | | | | | | 445,375,079 | |
| | |
| | | Contracts | | | | |
|
| Options Purchased: 0.01% | |
| | | | | | | | | |
| | |
Brookdale Senior Living Inc. | | | 306 | | | | 4,590 | |
| | |
Brookdale Senior Living Inc. | | | 500 | | | | 20,000 | |
| | |
DDR Corp. | | | 4,638 | | | | 23,190 | |
| | |
| | | | | | | 47,780 | |
| | |
Total Options Purchased
(Cost $226,716) | | | | | | | 47,780 | |
| | | | | | | | |
| | |
| | | Principal
Amount | | | | |
|
| Corporate Bonds: 1.33% | |
| Department Stores: 1.33% | | | | | |
| | |
JC Penney Corp., Inc., Sr. Unsec. Notes 6.375%, 10/15/36(a) | | | $5,000,000 | | | | 3,000,000 | |
| | |
7.400%, 04/01/37 | | | 12,135,000 | | | | 7,887,750 | |
| | |
| | | | | | | 10,887,750 | |
| | |
Total Corporate Bonds
(Cost $12,131,866) | | | | | | | 10,887,750 | |
| |
| Convertible Corporate Bonds: 7.23% | | | | | |
| REITs-Diversified: 5.54% | | | | | |
| | |
Consolidated-Tomoka Land Co., Sr. Unsec. Notes 4.500%, 03/15/20 | | | 20,250,000 | | | | 22,604,062 | |
| | | | | | | | |
| | | Principal
Amount | | | Value
(See Note 2) | |
| | |
| | | | | | | | |
| | | | | | | | | |
| | |
CorEnergy Infrastructure Trust, Inc., Sr. Unsec. Notes 7.000%, 06/15/20 | | | $19,000,000 | | | $ | 22,752,500 | |
| | |
| | | | | | | 45,356,562 | |
| | | | | | | | |
| REITs-Mortgage: 1.69% | | | | | | | | |
| | |
iStar Financial, Inc., Sr. Unsec. Notes 3.125%, 09/15/22(d) | | | 13,885,000 | | | | 13,850,288 | |
| | |
Total Convertible Corporate Bonds
(Cost $51,962,333) | | | | | | | 59,206,850 | |
| | |
Total Investments: 97.72%
(Cost $734,866,713) | | | | | | | 800,164,013 | |
| |
| Net Other Assets and Liabilities: 2.28% | | | | 18,691,439 | |
| | |
| Net Assets: 100.00% | | | | | | $ | 818,855,452 | |
| | |
| | | Shares | | | | |
|
| Schedule of Securities Sold Short: (7.42%) | |
| Exchange-Traded Funds: (7.42%) | | | | | |
| | |
iShares® Dow Jones U.S. Real Estate ETF | | | (750,000) | | | $ | (60,757,500 | ) |
| | |
Total Securities Sold Short
(Proceeds $60,129,111) | | | | | | $ | (60,757,500 | ) |
Percentages are stated as a percent of net assets.
(a) Security, or portion of security, is being held as collateral for securities sold short or the line(s) of credit. At period end, the aggregate market value of those securities was $472,190,484, representing 57.66% of net assets.
(b) Affiliated company. See Note 12 for more information.
(c) Non-income producing security.
(d) Securities exempt from registration under Rule 144A of the Securities Act of 1933. These securities may be sold in the ordinary course of business in transactions exempt from registration, normally to qualified institutional buyers. These securities have been deemed liquid under guidelines approved by the Fund’s Board of Trustees, unless otherwise noted below. At period end, the aggregate value of those securities was $13,850,288, representing 1.69% of net assets.
| | | | |
| See accompanying Notes to Financial Statements. | | 31 | | |
Schedule of Investments (See Note 11)
Salient Select Income Fund
December 31, 2017
Call Options Purchased:
| | | | | | | | | | | | | | | | | | | | | | | | | | | | |
| Description | | Counterparty | | | Exercise
Price | | | Expiration
Date | | | Number of
Contracts | | | Notional Value | | | Value | | | Unrealized
Appreciation
(Depreciation) | |
Brookdale Senior Living Inc. | | | BNP Paribas | | | $ | 10 | | | | January 2018 | | | | 500 | | | $ | 485,000 | | | $ | 20,000 | | | $ | (67,771) | |
Brookdale Senior Living Inc. | | | BNP Paribas | | | $ | 11 | | | | January 2018 | | | | 306 | | | | 296,820 | | | | 4,590 | | | | (10,876) | |
DDR Corp. | | | BNP Paribas | | | $ | 10 | | | | January 2018 | | | | 4,638 | | | | 4,155,648 | | | | 23,190 | | | | (100,289) | |
| | | | | | | | | | | | | | | | | | $ | 4,937,468 | | | $ | 47,780 | | | $ | (178,936) | |
Investment Abbreviations:
ETF — Exchange-Traded Fund
REIT — Real Estate Investment Trust
Sr. — Senior
Unsec. — Unsecured
| | | | |
| See accompanying Notes to Financial Statements. | | 32 | | |
Schedule of Investments (See Note 11)
Salient Select Opportunity Fund
December 31, 2017
| | | | | | | | |
| | | Shares | | | Value
(See Note 2) | |
| | |
| Common Stocks: 69.63% | | | | | | | | |
| Banks: 13.71% | | | | | | | | |
| | |
BankUnited, Inc. | | | 5,400 | | | $ | 219,888 | |
| | |
Commerzbank AG(a) | | | 26,000 | | | | 390,108 | |
| | |
Unione di Banche Italiane SpA | | | 110,822 | | | | 484,808 | |
| | |
| | | | | | | 1,094,804 | |
| | | | | | | | |
| Capital Goods: 3.27% | | | | | | | | |
| | |
Ferrovial SA | | | 11,500 | | | | 261,133 | |
| | | | | | | | |
| Financials: 5.71% | | | | | | | | |
| | |
Berkshire Hathaway, Inc., Class B(a)(b) | | | 2,300 | | | | 455,906 | |
| | | | | | | | |
| Healthcare Providers & Services: 1.67% | | | | | | | | |
| | |
Genesis Healthcare, Inc.(a)(b) | | | 175,000 | | | | 133,507 | |
| | | | | | | | |
| Hotels & Motels: 4.91% | | | | | | | | |
| | |
Belmond, Ltd., Class A(a)(b) | | | 32,000 | | | | 392,000 | |
| | | | | | | | |
| Hotels, Restaurants & Leisure: 2.72% | | | | | | | | |
| | |
Chipotle Mexican Grill, Inc.(a)(b) | | | 750 | | | | 216,772 | |
| | | | | | | | |
| Industrial Conglomerates: 3.08% | | | | | | | | |
| | |
General Electric Co. | | | 14,100 | | | | 246,045 | |
| | | | | | | | |
| IT Services: 1.55% | | | | | | | | |
| | |
InterXion Holding NV(a)(b) | | | 2,100 | | | | 123,753 | |
| | | | | | | | |
| Media: 2.64% | | | | | | | | |
| | |
Madison Square Garden Co., Class A(a) | | | 1,000 | | | | 210,850 | |
| | | | | | | | |
| Medical-Nursing Homes: 2.43% | | | | | | | | |
| | |
Brookdale Senior Living, Inc.(a) | | | 20,000 | | | | 194,000 | |
| | | | | | | | |
| Oil, Gas & Consumable Fuels: 2.46% | | | | | | | | |
| | |
TravelCenters of America LLC(a) | | | 48,000 | | | | 196,800 | |
| | | | | | | | |
| REITs-Hotels: 5.13% | | | | | | | | |
| | |
Ashford Hospitality Prime, Inc.(b) | | | 42,133 | | | | 409,954 | |
| | | | | | | | |
| REITs-Mortgage: 9.74% | | | | | | | | |
| | |
CIM Commercial Trust Corp.(b) | | | 19,545 | | | | 373,310 | |
| | |
Colony NorthStar, Inc., Class A(b) | | | 35,491 | | | | 404,952 | |
| | |
| | | | | | | 778,262 | |
| | | | | | | | |
| REITs-Shopping Centers: 2.19% | | | | | | | | |
| | |
DDR Corp.(b) | | | 19,500 | | | | 174,720 | |
| | | | | | | | |
| | | Shares | | | Value
(See Note 2) | |
| | |
| | | | | | | | |
| REITs-Specialized: 2.50% | | | | | | | | |
| | |
Resource Capital Corp. | | | 21,332 | | | $ | 199,881 | |
| | | | | | | | |
| REITs-Storage: 2.83% | | | | | | | | |
| | |
Jernigan Capital, Inc. | | | 11,900 | | | | 226,219 | |
| | | | | | | | |
| REITs-Timber: 1.02% | | | | | | | | |
| | |
Weyerhaeuser Co.(b) | | | 2,300 | | | | 81,098 | |
| | | | | | | | |
| Thrifts & Mortgage Finance: 2.07% | | | | | | | | |
| | |
New York Community Bancorp, Inc. | | | 12,700 | | | | 165,354 | |
| | |
Total Common Stocks
(Cost $6,248,472) | | | | | | | 5,561,058 | |
| | | | | | | | |
| Exchange-Traded Funds: 4.34% | | | | | |
| | |
SPDR® S&P 500® ETF Trust | | | 1,300 | | | | 346,918 | |
| | |
Total Exchange-Traded Funds
(Cost $342,279) | | | | | | | 346,918 | |
| | |
| Limited Partnerships: 2.57% | | | | | | | | |
| Capital Markets: 2.57% | | | | | | | | |
| | |
Blackstone Group LP(b) | | | 6,400 | | | | 204,928 | |
| | |
Total Limited Partnerships
(Cost $139,426) | | | | | | | 204,928 | |
| |
| Convertible Preferred Stocks: 5.34% | | | | | |
| REITs-Residential: 5.34% | | | | | | | | |
| | |
American Homes 4 Rent
Series C, 5.500%(b) | | | 15,000 | | | | 426,750 | |
| | |
Total Convertible Preferred Stocks
(Cost $367,425) | | | | | | | 426,750 | |
| | |
| | | Principal
Amount | | | | |
|
| Contingent Convertible Securities: 7.42% | |
| Banks: 7.42% | | | | | | | | |
| | |
Deutsche Bank AG, Jr. Sub. Notes
7.500%, Perpetual Maturity(b)(c) | | | $300,000 | | | | 318,075 | |
| | |
UniCredit SpA, Jr. Sub. Notes
8.000%, Perpetual Maturity(c) | | | 250,000 | | | | 274,330 | |
| | |
| | | | | | | 592,405 | |
| | |
Total Contingent Convertible Securities
(Cost $536,445) | | | | | | | 592,405 | |
| | | | |
| See accompanying Notes to Financial Statements. | | 33 | | |
Schedule of Investments (See Note 11)
Salient Select Opportunity Fund
December 31, 2017
| | | | | | | | |
| | | Principal
Amount | | | Value
(See Note 2) | |
| |
| Corporate Bonds: 3.76% | | | | | |
| Department Stores: 3.76% | | | | | | | | |
| | |
JC Penney Corp., Inc., Sr. Unsec. Notes 6.375%, 10/15/36 | | | $500,000 | | | $ | 300,000 | |
| | |
Total Corporate Bonds
(Cost $386,923) | | | | | | | 300,000 | |
| |
| Convertible Corporate Bonds: 2.79% | | | | | |
| REITs-Diversified: 2.79% | | | | | |
| | |
Consolidated-Tomoka Land Co., Sr. Unsec. Notes
4.500%, 03/15/20(b) | | | 200,000 | | | | 223,250 | |
| | |
Total Convertible Corporate Bonds
(Cost $200,000) | | | | | | | 223,250 | |
| | |
Total Investments: 95.85%
(Cost $8,220,970) | | | | | | | 7,655,309 | |
| |
| Net Other Assets and Liabilities: 4.15% | | | | 331,771 | |
| | |
| Net Assets: 100.00% | | | | | | $ | 7,987,080 | |
Percentages are stated as a percent of net assets.
(a) Non-income producing security.
(b) Security, or portion of security, is being held as collateral for the line(s) of credit. At period end, the aggregate market value of those securities was $3,508,486, representing 43.93% of net assets.
(c) This security has no contractual maturity date, is not redeemable and contractually pays an indefinite stream of interest. Interest rate shown reflects the current fixed rate in effect at December 31, 2017. Interest rate will change at a future date.
Investment Abbreviations:
ETF — Exchange-Traded Fund
Jr. — Junior
REIT — Real Estate Investment Trust
S&P — Standard & Poor’s
SPDR — Standard & Poor’s Depository Receipt
Sr. — Senior
Sub. — Subordinated
Unsec. — Unsecured
| | | | |
| See accompanying Notes to Financial Statements. | | 34 | | |
Schedule of Investments (See Note 11)
Salient Tactical Real Estate Fund
December 31, 2017
| | | | | | | | |
| | | Shares | | | Value
(See Note 2) | |
| |
| Common Stocks: 94.86% | | | | | |
| Healthcare Providers & Services: 0.28% | | | | | |
| | |
Genesis Healthcare, Inc.(a)(b) | | | 141,500 | | | $ | 107,950 | |
| | | | | | | | |
| Hotels, Restaurants & Leisure: 1.81% | | | | | |
| | |
Belmond, Ltd., Class A(a)(b) | | | 57,800 | | | | 708,050 | |
| | | | | | | | |
| IT Services: 2.38% | | | | | |
| | |
Equinix, Inc.(a) | | | 900 | | | | 407,898 | |
| | |
InterXion Holding NV(a)(b) | | | 8,900 | | | | 524,477 | |
| | |
| | | | | | | 932,375 | |
| | | | | | | | |
| Media: 2.05% | | | | | |
| | |
Madison Square Garden Co., Class A(a)(b) | | | 3,800 | | | | 801,230 | |
| | | | | | | | |
| Oil, Gas & Consumable Fuels: 2.14% | | | | | |
| | |
TravelCenters of America LLC(a)(b) | | | 203,800 | | | | 835,580 | |
| | | | | | | | |
| Real Estate Operating/Development: 1.91% | | | | | |
| | |
Forest City Realty Trust, Inc., Class A(a) | | | 31,000 | | | | 747,100 | |
| | | | | | | | |
| REITs-Apartments: 12.20% | | | | | |
| | |
American Campus Communities, Inc. | | | 4,100 | | | | 168,223 | |
| | |
Apartment Investment & Management Co., Class A | | | 20,900 | | | | 913,539 | |
| | |
AvalonBay Communities, Inc.(a) | | | 6,700 | | | | 1,195,347 | |
| | |
Clipper Realty, Inc.(a) | | | 37,300 | | | | 372,627 | |
| | |
Equity Residential(a) | | | 17,800 | | | | 1,135,106 | |
| | |
Essex Property Trust, Inc.(a) | | | 4,100 | | | | 989,617 | |
| | |
| | | | | | | 4,774,459 | |
| | | | | | | | |
| REITs-Diversified: 16.09% | | | | | |
| | |
Alexander & Baldwin, Inc.(a) | | | 15,700 | | | | 435,518 | |
| | |
American Assets Trust, Inc.(a) | | | 31,900 | | | | 1,219,856 | |
| | |
CoreSite Realty Corp.(a) | | | 10,800 | | | | 1,230,120 | |
| | |
Farmland Partners, Inc.(a) | | | 36,700 | | | | 318,556 | |
| | |
Howard Hughes Corp.(a)(b) | | | 4,100 | | | | 538,207 | |
| | |
Resource Capital Corp.(a) | | | 93,015 | | | | 871,551 | |
| | |
Urstadt Biddle Properties, Inc., Class A(a) | | | 34,900 | | | | 758,726 | |
| | |
Vornado Realty Trust(a) | | | 11,800 | | | | 922,524 | |
| | |
| | | | | | | 6,295,058 | |
| | | | | | | | |
| | | | | | | | |
| | | Shares | | | Value
(See Note 2) | |
| | |
| | | | | | | | |
| REITs-Healthcare: 6.16% | | | | | |
| | |
Brookdale Senior Living, Inc.(a)(b) | | | 84,000 | | | $ | 814,800 | |
| | |
MedEquities Realty Trust, Inc. | | | 3,300 | | | | 37,026 | |
| | |
Sabra Health Care REIT, Inc.(a) | | | 51,000 | | | | 957,270 | |
| | |
Welltower, Inc.(a) | | | 9,400 | | | | 599,438 | |
| | |
| | | | | | | 2,408,534 | |
| | | | | | | | |
| REITs-Hotels: 4.77% | | | | | |
| | |
Ashford Hospitality Prime, Inc.(a) | | | 109,144 | | | | 1,061,971 | |
| | |
Chatham Lodging Trust(a) | | | 35,400 | | | | 805,704 | |
| | |
| | | | | | | 1,867,675 | |
| | | | | | | | |
| REITs-Mortgage: 4.50% | | | | | |
| | |
Colony NorthStar, Inc., Class A(a) | | | 131,951 | | | | 1,505,561 | |
iStar, Inc.(a)(b) | | | 22,700 | | | | 256,510 | |
| | |
| | | | | | | 1,762,071 | |
| | | | | | | | |
| REITs-Office Property: 16.12% | | | | | |
| | |
Alexandria Real Estate Equities, Inc.(a) | | | 7,100 | | | | 927,189 | |
| | |
Digital Realty Trust, Inc.(a) | | | 10,000 | | | | 1,139,000 | |
| | |
Government Properties Income Trust(a) | | | 41,300 | | | | 765,702 | |
| | |
HCP, Inc.(a) | | | 23,300 | | | | 607,664 | |
| | |
Mack-Cali Realty Corp. | | | 36,500 | | | | 786,940 | |
| | |
Paramount Group, Inc.(a) | | | 74,600 | | | | 1,182,410 | |
| | |
SL Green Realty Corp.(a) | | | 8,900 | | | | 898,277 | |
| | |
| | | | | | | 6,307,182 | |
| | | | | | | | |
| REITs-Regional Malls: 5.54% | | | | | |
| | |
GGP, Inc.(a) | | | 26,100 | | | | 610,479 | |
| | |
Macerich Co.(a) | | | 8,400 | | | | 551,712 | |
| | |
Taubman Centers, Inc.(a) | | | 15,350 | | | | 1,004,351 | |
| | |
| | | | | | | 2,166,542 | |
| | | | | | | | |
| REITs-Residential: 2.05% | | | | | |
| | |
American Homes 4 Rent, Class A(a) | | | 36,656 | | | | 800,567 | |
| | | | | | | | |
| REITs-Shopping Centers: 10.98% | | | | | | | | |
| | |
Acadia Realty Trust(a) | | | 41,100 | | | | 1,124,496 | |
| | |
Brixmor Property Group, Inc.(a) | | | 27,400 | | | | 511,284 | |
| | |
Kimco Realty Corp.(a) | | | 15,100 | | | | 274,065 | |
| | |
Kite Realty Group Trust(a) | | | 40,869 | | | | 801,032 | |
| | | | |
| See accompanying Notes to Financial Statements. | | 35 | | |
Schedule of Investments (See Note 11)
Salient Tactical Real Estate Fund
December 31, 2017
| | | | | | | | |
| | | Shares | | | Value
(See Note 2) | |
| | |
| | | | | | | | |
| REITs-Shopping Centers (continued): 10.98% | | | | | |
| | |
Retail Opportunity Investments Corp.(a) | | | 39,800 | | | $ | 794,010 | |
| | |
Tanger Factory Outlet Centers, Inc.(a) | | | 29,900 | | | | 792,649 | |
| | |
| | | | | | | 4,297,536 | |
| | | | | | | | |
| REITs-Storage: 2.98% | | | | | |
| | |
Jernigan Capital, Inc.(a) | | | 49,800 | | | | 946,698 | |
| | |
National Storage Affiliates Trust(a) | | | 8,041 | | | | 219,198 | |
| | |
| | | | | | | 1,165,896 | |
| | | | | | | | |
| REITs-Timber: 1.01% | | | | | |
| | |
Weyerhaeuser Co. | | | 11,200 | | | | 394,912 | |
| | | | | | | | |
| REITs-Warehouse/Industrial: 1.89% | | | | | |
| | |
STAG Industrial, Inc.(a) | | | 26,988 | | | | 737,582 | |
| | |
Total Common Stocks
(Cost $33,883,430) | | | | | | | 37,110,299 | |
| |
| Convertible Preferred Stocks: 1.28% | | | | | |
| REITs-Hotels: 1.28% | | | | | |
| | |
Ashford Hospitality Prime, Inc.,
Series B 5.500%(a) | | | 25,100 | | | | 501,749 | |
| | |
Total Convertible Preferred Stocks
(Cost $612,589) | | | | | | | 501,749 | |
| | |
Total Investments: 96.14%
(Cost $34,496,019) | | | | | | | 37,612,048 | |
| |
| Net Other Assets and Liabilities: 3.86% | | | | 1,509,488 | |
| | |
| Net Assets: 100.00% | | | | | | $ | 39,121,536 | |
|
| Schedule of Securities Sold Short: (22.78%) | |
| Exchange-Traded Funds: (22.78%) | | | | | |
| | |
iShares® U.S. Real Estate ETF | | | (110,000) | | | $ | (8,911,100 | ) |
| | |
Total Securities Sold Short
(Proceeds $8,818,966) | | | | | | $ | (8,911,100 | ) |
Percentages are stated as a percent of net assets.
(a) Security, or portion of security, is being held as collateral for securities sold short or the line(s) of credit. At period end, the aggregate market value of those securities was $32,042,074, representing 81.90% of net assets.
(b) Non-income producing security.
Investment Abbreviations:
ETF — Exchange-Traded Fund
REIT — Real Estate Investment Trust
| | | | |
| See accompanying Notes to Financial Statements. | | 36 | | |
Statements of Assets and Liabilities
December 31, 2017
| | | | | | | | | | | | |
| | | Salient
International
Real Estate
Fund | | | Salient
Real Estate
Fund | | | Salient
Select Income
Fund | |
Assets: | | | | | | | | | | | | |
Investments in affiliates, at value | | $ | — | | | $ | — | | | $ | 34,048,819 | |
Investments, at value | | | 21,440,665 | | | | 28,462,368 | | | | 766,115,194 | |
Cash | | | 368,703 | | | | 798,527 | | | | 103,570,300 | |
Foreign currency, at value (Cost $2,240, $— and $—, respectively) | | | 2,248 | | | | — | | | | — | |
Deposit with broker for securities sold short | | | — | | | | — | | | | 63,272,582 | |
Receivable for investments sold | | | — | | | | 40,581 | | | | 1,834,284 | |
Receivable for shares sold | | | 2,133 | | | | 4,214 | | | | 125,460 | |
Interest and dividends receivable | | | 48,033 | | | | 346,988 | | | | 7,134,933 | |
Other assets | | | 9,865 | | | | 11,711 | | | | 43,853 | |
| | | | | | | | | | | | |
Total Assets | | | 21,871,647 | | | | 29,664,389 | | | | 976,145,425 | |
| | | | | | | | | | | | |
Liabilities: | | | | | | | | | | | | |
Securities sold short (Proceeds $—, $— and $60,129,111, respectively) | | | — | | | | — | | | | 60,757,500 | |
Payable on loan (See Note 2(i)) | | | — | | | | — | | | | 92,058,708 | |
Payable for interest and commitment fees due on loan (See Note 2(i)) | | | — | | | | — | | | | 107,694 | |
Payable for shares redeemed | | | 13,676 | | | | 7,554 | | | | 3,047,892 | |
Payable to advisor | | | 18,530 | | | | 21,869 | | | | 719,113 | |
Payable for distribution and service fees | | | 8,945 | | | | 10,119 | | | | 274,342 | |
Payable to trustees | | | 106 | | | | 151 | | | | 4,326 | |
Payable for compliance fees | | | 450 | | | | 641 | | | | 18,313 | |
Payable to ReFlow (See Note 2(m)) | | | 733 | | | | — | | | | — | |
Payable for legal and audit fees | | | 22,442 | | | | 21,536 | | | | 67,992 | |
Accrued expenses and other liabilities | | | 15,458 | | | | 15,518 | | | | 234,093 | |
| | | | | | | | | | | | |
Total Liabilities | | | 80,340 | | | | 77,388 | | | | 157,289,973 | |
| | | | | | | | | | | | |
Net Assets | | $ | 21,791,307 | | | $ | 29,587,001 | | | $ | 818,855,452 | |
| | | | | | | | | | | | |
Net Assets Consist of: | | | | | | | | | | | | |
Paid-in capital | | $ | 46,074,816 | | | $ | 27,125,076 | | | $ | 749,210,675 | |
Accumulated net investment loss | | | (1,186,073 | ) | | | — | | | | (236,124 | ) |
Accumulated net realized gain/(loss) | | | (26,663,950 | ) | | | (34,311 | ) | | | 5,211,990 | |
Net unrealized appreciation | | | 3,566,514 | | | | 2,496,236 | | | | 64,668,911 | |
| | | | | | | | | | | | |
Total Net Assets | | $ | 21,791,307 | | | $ | 29,587,001 | | | $ | 818,855,452 | |
| | | | | | | | | | | | |
| | | |
Investments in Affiliates, At Cost | | $ | — | | | $ | — | | | $ | 38,874,209 | |
Investments, At Cost | | $ | 17,874,913 | | | $ | 25,966,132 | | | $ | 695,992,504 | |
| Pricing of Shares | | | | | | | | | | | | |
Investor Class: | | | | | | | | | | | | |
Net Assets | | $ | 554,609 | | | $ | 20,900,991 | | | $ | 28,030,280 | |
Shares of beneficial interest outstanding | | | 37,457 | | | | 1,886,035 | | | | 1,268,144 | |
Net Asset Value, offering and redemption price per share | | | $14.81 | | | | $11.08 | | | | $22.10 | |
Institutional Class: | | | | | | | | | | | | |
Net Assets | | $ | 6,654,847 | | | $ | 3,429,242 | | | $ | 358,845,851 | |
Shares of beneficial interest outstanding | | | 453,217 | | | | 392,698 | | | | 16,218,069 | |
Net Asset Value, offering and redemption price per share | | | $14.68 | | | | $8.73 | | | | $22.13 | |
| | | | |
| See accompanying Notes to Financial Statements. | | 37 | | |
Statements of Assets and Liabilities
December 31, 2017
| | | | | | | | | | | | |
| | | Salient
International
Real Estate
Fund
(continued) | | | Salient
Real Estate
Fund
(continued) | | | Salient
Select Income
Fund
(continued) | |
Class A: | | | | | | | | | | | | |
Net Assets | | $ | 8,426,376 | | | $ | 3,816,746 | | | $ | 265,122,309 | |
Shares of beneficial interest outstanding | | | 571,463 | | | | 349,705 | | | | 11,954,226 | |
Net Asset Value, offering and redemption price per share | | | $14.75 | | | | $10.91 | | | | $22.18 | |
Maximum offering price per share (NAV/0.9425, based on maximum sales charge of 5.75% of the offering price) | | | $15.65 | | | | $11.58 | | | | $23.53 | |
Class C: | | | | | | | | | | | | |
Net Assets | | $ | 6,155,475 | | | $ | 1,440,022 | | | $ | 166,857,012 | |
Shares of beneficial interest outstanding | | | 417,808 | | | | 130,113 | | | | 7,742,353 | |
Net Asset Value, offering and redemption price per share | | | $14.73 | | | | $11.07 | | | | $21.55 | |
| | | | |
| See accompanying Notes to Financial Statements. | | 38 | | |
Statements of Assets and Liabilities
December 31, 2017
| | | | | | | | |
| | | Salient
Select
Opportunity
Fund | | | Salient
Tactical
Real Estate
Fund | |
Assets: | | | | | | | | |
Investments, at value | | $ | 7,655,309 | | | $ | 37,612,048 | |
Cash | | | 785,039 | | | | 198,549 | |
Foreign currency, at value (Cost $868 and $—, respectively) | | | 879 | | | | — | |
Deposit with broker for securities sold short | | | — | | | | 9,696,980 | |
Receivable for investments sold | | | — | | | | 44,556 | |
Receivable for shares sold | | | — | | | | 6,062 | |
Receivable due from advisor | | | 5,503 | | | | — | |
Interest and dividends receivable | | | 91,595 | | | | 616,203 | |
Other assets | | | 14,087 | | | | 19,226 | |
| | | | | | | | |
Total Assets | | | 8,552,412 | | | | 48,193,624 | |
| | | | | | | | |
Liabilities: | | | | | | | | |
Securities sold short (Proceeds $— and $8,818,966, respectively) | | | — | | | | 8,911,100 | |
Payable on loan (See Note 2(i)) | | | 536,786 | | | | — | |
Payable for interest and commitment fees due on loan (See Note 2(i)) | | | 82 | | | | 14,083 | |
Payable for shares redeemed | | | — | | | | 45,973 | |
Payable to advisor | | | — | | | | 38,930 | |
Payable for distribution and service fees | | | 2,122 | | | | 17,637 | |
Payable to trustees | | | 42 | | | | 275 | |
Payable for compliance fees | | | 180 | | | | 1,169 | |
Payable for legal and audit fees | | | 20,435 | | | | 24,897 | |
Accrued expenses and other liabilities | | | 5,685 | | | | 18,024 | |
| | | | | | | | |
Total Liabilities | | | 565,332 | | | | 9,072,088 | |
| | | | | | | | |
Net Assets | | $ | 7,987,080 | | | $ | 39,121,536 | |
| | | | | | | | |
| Net Assets Consist of: | |
Paid-in capital | | $ | 11,029,694 | | | $ | 38,116,282 | |
Accumulated net investment income | | | — | | | | — | |
Accumulated net realized loss | | | (2,477,353 | ) | | | (2,018,639 | ) |
Net unrealized appreciation/(depreciation) | | | (565,261 | ) | | | 3,023,893 | |
| | | | | | | | |
Total Net Assets | | $ | 7,987,080 | | | $ | 39,121,536 | |
| | | | | | | | |
| | |
Investments, At Cost | | $ | 8,220,970 | | | $ | 34,496,019 | |
Pricing of Shares | | | | | | | | |
Investor Class: | |
Net Assets | | $ | 624,743 | | | $ | 1,231,923 | |
Shares of beneficial interest outstanding | | | 25,191 | | | | 36,270 | |
Net Asset Value, offering and redemption price per share | | | $24.80 | | | | $33.97 | |
Institutional Class: | |
Net Assets | | $ | 4,060,955 | | | $ | 7,294,653 | |
Shares of beneficial interest outstanding | | | 163,829 | | | | 207,847 | |
Net Asset Value, offering and redemption price per share | | | $24.79 | | | | $35.10 | |
Class A: | |
Net Assets | | $ | 2,992,658 | | | $ | 20,602,859 | |
Shares of beneficial interest outstanding | | | 120,813 | | | | 605,613 | |
Net Asset Value, offering and redemption price per share | | | $24.77 | | | | $34.02 | |
Maximum offering price per share (NAV/0.9425, based on maximum sales charge of 5.75% of the offering price) | | | $26.28 | | | | $36.10 | |
| | | | |
| See accompanying Notes to Financial Statements. | | 39 | | |
Statements of Assets and Liabilities
December 31, 2017
| | | | | | | | |
| | | Salient
Select
Opportunity
Fund
(continued) | | | Salient
Tactical
Real Estate
Fund
(continued) | |
Class C: | |
Net Assets | | $ | 308,724 | | | $ | 9,992,101 | |
Shares of beneficial interest outstanding | | | 12,472 | | | | 296,521 | |
Net Asset Value, offering and redemption price per share | | | $24.75 | | | | $33.70 | |
| | | | |
| See accompanying Notes to Financial Statements. | | 40 | | |
Statements of Operations
For the Year Ended December 31, 2017
| | | | | | | | | | | | |
| | | Salient
International
Real Estate
Fund | | | Salient
Real Estate
Fund | | | Salient
Select Income
Fund | |
Investment Income: | |
Interest | | $ | 11,097 | | | $ | 17,429 | | | $ | 5,315,424 | |
Dividends | | | 684,246 | | | | 1,025,782 | | | | 39,192,561 | |
Dividends from affiliated investments | | | — | | | | — | | | | 2,038,855 | |
Foreign taxes withheld | | | (51,390 | ) | | | — | | | | — | |
| | | | | | | | | | | | |
Total Investment Income | | | 643,953 | | | | 1,043,211 | | | | 46,546,840 | |
| | | | | | | | | | | | |
Expenses: | |
Dividend expense on short sales | | | — | | | | — | | | | 397,653 | |
Investment advisory fee | | | 220,508 | | | | 296,160 | | | | 9,880,899 | |
Administration fees and expenses | | | 39,644 | | | | 40,655 | | | | 783,150 | |
Custodian fee | | | 7,094 | | | | 4,947 | | | | 28,589 | |
Legal and audit fees | | | 45,973 | | | | 47,826 | | | | 351,273 | |
Transfer agent fees and expenses | | | 31,852 | | | | 43,863 | | | | 916,460 | |
Trustees’ fees and expenses | | | 5,691 | | | | 8,924 | | | | 258,825 | |
Registration/filing fees | | | 58,162 | | | | 53,971 | | | | 165,807 | |
Reports to shareholders and printing fees | | | 9,130 | | | | 21,300 | | | | 223,911 | |
Distribution and service fees | | | | | | | | | | | | |
Investor Class | | | 2,280 | | | | 94,350 | | | | 158,864 | |
Institutional Class | | | 2,869 | | | | 2,549 | | | | 202,377 | |
Class A | | | 41,739 | | | | 19,322 | | | | 1,523,530 | |
Class B | | | — | | | | — | | | | 4,160 | |
Class C | | | 63,219 | | | | 18,639 | | | | 1,924,992 | |
Advisor Class | | | 144 | | | | — | | | | 12,051 | |
Compliance fees | | | 6,219 | | | | 9,663 | | | | 278,449 | |
ReFlow fees (See Note 2(m)) | | | 1,146 | | | | 1,491 | | | | — | |
Interest and commitment fees on loan | | | — | | | | — | | | | 3,467,944 | |
Other | | | 12,409 | | | | 15,855 | | | | 193,003 | |
| | | | | | | | | | | | |
Total Expenses | | | 548,079 | | | | 679,515 | | | | 20,771,937 | |
| | | | | | | | | | | | |
Net Investment Income: | | | 95,874 | | | | 363,696 | | | | 25,774,903 | |
| | | | | | | | | | | | |
Net realized loss on affiliated investments | | | — | | | | — | | | | (9,843,285 | ) |
Net realized gain on investments and foreign currency translations | | | 626,831 | | | | 1,097,366 | | | | 78,999,882 | |
Net realized loss on securities sold short | | | — | | | | — | | | | (11,960,304 | ) |
Net realized loss on foreign currency | | | (1,911 | ) | | | — | | | | — | |
Net change in unrealized appreciation/depreciation on affiliated investments | | | — | | | | — | | | | 4,533,391 | |
Net change in unrealized appreciation/depreciation on investments | | | 3,464,767 | | | | (2,860,666 | ) | | | (77,235,553 | ) |
Net change in unrealized appreciation/depreciation on securities sold short | | | — | | | | — | | | | 5,527,972 | |
Net change in unrealized appreciation/depreciation on foreign currency transactions | | | 737 | | | | — | | | | — | |
| | | | | | | | | | | | |
Net Realized and Unrealized Gain/(Loss) on Investments, Securities Sold Short and Foreign Currency Translations | | | 4,090,424 | | | | (1,763,300 | ) | | | (9,977,897 | ) |
| | | | | | | | | | | | |
Net Increase/(Decrease) in Net Assets Resulting From Operations | | $ | 4,186,298 | | | $ | (1,399,604 | ) | | $ | 15,797,006 | |
| | | | | | | | | | | | |
| | | | |
| See accompanying Notes to Financial Statements. | | 41 | | |
Statements of Operations
For the Year Ended December 31, 2017
| | | | | | | | |
| | | Salient
Select
Opportunity
Fund | | | Salient
Tactical
Real Estate
Fund | |
Investment Income: | |
Interest | | $ | 118,490 | | | $ | 88,738 | |
Dividends | | | 72,041 | | | | 1,920,080 | |
Foreign taxes withheld | | | (2,482 | ) | | | (1,829 | ) |
| | | | | | | | |
Total Investment Income | | | 188,049 | | | | 2,006,989 | |
| | | | | | | | |
Expenses: | |
Dividend expense on short sales | | | — | | | | 130,363 | |
Investment advisory fee | | | 89,452 | | | | 643,459 | |
Administration fees and expenses | | | 16,709 | | | | 63,092 | |
Custodian fee | | | 2,810 | | | | 6,339 | |
Legal and audit fees | | | 44,758 | | | | 63,646 | |
Transfer agent fees and expenses | | | 5,529 | | | | 50,596 | |
Trustees’ fees and expenses | | | 2,279 | | | | 17,026 | |
Registration/filing fees | | | 48,828 | | | | 73,433 | |
Reports to shareholders and printing fees | | | 3,538 | | | | 15,966 | |
Distribution and service fees | | | | | | | | |
Investor Class | | | 2,686 | | | | 6,771 | |
Institutional Class | | | 2,166 | | | | 12,034 | |
Class A | | | 19,655 | | | | 111,947 | |
Class B | | | — | | | | 484 | |
Class C | | | 3,672 | | | | 133,090 | |
Advisor Class | | | — | | | | 349 | |
Compliance fees | | | 2,529 | | | | 18,301 | |
Interest and commitment fees on loan | | | 20,684 | | | | 314,707 | |
Other | | | 6,354 | | | | 27,788 | |
| | | | | | | | |
Total expenses before waivers | | | 271,649 | | | | 1,689,391 | |
Less fees waived/reimbursed by investment advisor (See Note 4) | | | (117,327 | ) | | | — | |
| | | | | | | | |
Total Expenses | | | 154,322 | | | | 1,689,391 | |
| | | | | | | | |
Net Investment Income: | | | 33,727 | | | | 317,598 | |
| | | | | | | | |
Net realized gain on investments and foreign currency translations | | | 46,827 | | | | 232,116 | |
Net realized loss on securities sold short | | | — | | | | (1,102,530 | ) |
Net realized loss on foreign currency | | | (234 | ) | | | (1,079 | ) |
Net change in unrealized appreciation/depreciation on investments | | | 432,508 | | | | (3,016,507 | ) |
Net change in unrealized appreciation/depreciation on securities sold short | | | — | | | | 203,508 | |
Net change in unrealized appreciation/depreciation on foreign currency transactions | | | 1,975 | | | | (64 | ) |
| | | | | | | | |
Net Realized and Unrealized Gain/(Loss) on Investments, Securities Sold Short and Foreign Currency Translations | | | 481,076 | | | | (3,684,556 | ) |
| | | | | | | | |
Net Increase/(Decrease) in Net Assets Resulting From Operations | | $ | 514,803 | | | $ | (3,366,958 | ) |
| | | | | | | | |
| | | | |
| See accompanying Notes to Financial Statements. | | 42 | | |
Statements of Changes in Net Assets
| | | | | | | | | | | | | | | | |
| | | Salient International Real Estate Fund | | | Salient Real Estate Fund | |
| | | Year Ended
December 31, 2017(a) | | | Year Ended
December 31, 2016(b) | | | Year Ended
December 31, 2017 | | | Year Ended
December 31, 2016(c) | |
Operations: | |
Net investment income/(loss) | | $ | 95,874 | | | $ | 108,079 | | | $ | 363,696 | | | $ | (109,988 | ) |
Net realized gain/(loss) | | | 624,920 | | | | (1,881,062 | ) | | | 1,097,366 | | | | 11,025,637 | |
Net change in unrealized appreciation/depreciation | | | 3,465,504 | | | | 2,031,716 | | | | (2,860,666 | ) | | | (5,870,442 | ) |
| | | | | | | | | | | | | | | | |
Net increase/(decrease) in net assets resulting from operations | | | 4,186,298 | | | | 258,733 | | | | (1,399,604 | ) | | | 5,045,207 | |
| | | | | | | | | | | | | | | | |
Distributions to Shareholders: | | | | | | | | | | | | | | | | |
From net investment income | | | | | | | | | | | | | | | | |
Investor Class | | | (36,505 | ) | | | (61,072 | ) | | | (244,363 | ) | | | (30,023 | ) |
Institutional Class | | | (424,959 | ) | | | (306,665 | ) | | | (60,305 | ) | | | (7,658 | ) |
Class A | | | (564,076 | ) | | | (498,483 | ) | | | (43,811 | ) | | | (5,743 | ) |
Class C | | | (380,217 | ) | | | (316,354 | ) | | | (15,217 | ) | | | — | |
Advisor Class | | | (7,975 | ) | | | (72,606 | ) | | | — | | | | — | |
From net realized gains on investments | | | | | | | | | | | | | | | | |
Investor Class | | | — | | | | — | | | | (1,100,910 | ) | | | (6,500,688 | ) |
Institutional Class | | | — | | | | — | | | | (271,685 | ) | | | (1,619,171 | ) |
Class A | | | — | | | | — | | | | (197,380 | ) | | | (1,202,621 | ) |
Class C | | | — | | | | — | | | | (68,558 | ) | | | (625,661 | ) |
| | | | | | | | | | | | | | | | |
Total distributions | | | (1,413,732 | ) | | | (1,255,180 | ) | | | (2,002,229 | ) | | | (9,991,565 | ) |
| | | | | | | | | | | | | | | | |
Share Transactions: | |
Investor Class | |
Proceeds from sale of shares | | | 28,363 | | | | 3,318,066 | | | | 7,814,071 | | | | 25,355,530 | |
Issued to shareholders in reinvestment of distributions | | | 35,022 | | | | 59,841 | | | | 1,338,421 | | | | 6,473,803 | |
Cost of shares redeemed | | | (188,294 | ) | | | (11,274,977 | ) | | | (12,683,114 | ) | | | (40,589,839 | ) |
| | | | | | | | | | | | | | | | |
Net decrease from share transactions | | | (124,909 | ) | | | (7,897,070 | ) | | | (3,530,622 | ) | | | (8,760,506 | ) |
| | | | | | | | | | | | | | | | |
Institutional Class | |
Proceeds from sale of shares | | | 4,649,090 | | | | 4,929,778 | | | | 4,876,874 | | | | 17,116,814 | |
Issued to shareholders in reinvestment of distributions | | | 256,889 | | | | 159,212 | | | | 315,615 | | | | 825,718 | |
Cost of shares redeemed | | | (3,423,822 | ) | | | (14,126,668 | ) | | | (7,030,128 | ) | | | (17,994,657 | ) |
| | | | | | | | | | | | | | | | |
Net increase/(decrease) from share transactions | | | 1,482,157 | | | | (9,037,678 | ) | | | (1,837,639 | ) | | | (52,125 | ) |
| | | | | | | | | | | | | | | | |
Class A | |
Proceeds from sale of shares | | | 2,013,242 | | | | 657,315 | | | | 653,927 | | | | 336,975 | |
Issued to shareholders in reinvestment of distributions | | | 536,830 | | | | 475,021 | | | | 221,515 | | | | 1,084,730 | |
Cost of shares redeemed | | | (4,704,779 | ) | | | (4,380,616 | ) | | | (1,507,026 | ) | | | (1,605,170 | ) |
| | | | | | | | | | | | | | | | |
Net decrease from share transactions | | | (2,154,707 | ) | | | (3,248,280 | ) | | | (631,584 | ) | | | (183,465 | ) |
| | | | | | | | | | | | | | | | |
Class C | |
Proceeds from sale of shares | | | 388,434 | | | | 314,017 | | | | 108,845 | | | | 80,876 | |
Issued to shareholders in reinvestment of distributions | | | 364,509 | | | | 297,086 | | | | 81,144 | | | | 600,067 | |
Cost of shares redeemed | | | (1,866,549 | ) | | | (2,610,212 | ) | | | (1,205,051 | ) | | | (897,388 | ) |
| | | | | | | | | | | | | | | | |
Net decrease from share transactions | | | (1,113,606 | ) | | | (1,999,109 | ) | | | (1,015,062 | ) | | | (216,445 | ) |
| | | | | | | | | | | | | | | | |
| | | | |
| See accompanying Notes to Financial Statements. | | 43 | | |
Statements of Changes in Net Assets
| | | | | | | | | | | | | | | | |
| | | Salient International Real Estate Fund (continued) | | | Salient Real Estate Fund (continued) | |
| | | Year Ended
December 31, 2017(a) | | | Year Ended
December 31, 2016(b) | | | Year Ended
December 31, 2017 | | | Year Ended
December 31, 2016(c) | |
Advisor Class | |
Proceeds from sale of shares | | | 55,717 | | | | 230,838 | | | | — | | | | — | |
Issued to shareholders in reinvestment of distributions | | | 3,748 | | | | 58,548 | | | | — | | | | — | |
Cost of shares redeemed | | | (759,632 | ) | | | (4,177,542 | ) | | | — | | | | — | |
| | | | | | | | | | | | | | | | |
Net decrease from share transactions | | | (700,167 | ) | | | (3,888,156 | ) | | | — | | | | — | |
| | | | | | | | | | | | | | | | |
Net increase/(decrease) in net assets | | $ | 161,334 | | | $ | (27,066,740 | ) | | $ | (10,416,740 | ) | | $ | (14,158,899 | ) |
| | | | | | | | | | | | | | | | |
Net Assets: | |
Beginning of period | | | 21,629,973 | | | | 48,696,713 | | | | 40,003,741 | | | | 54,162,640 | |
| | | | | | | | | | | | | | | | |
End of period (including accumulated net investment loss of $(1,186,073), $(337,668), $— and $—, respectively) | | $ | 21,791,307 | | | $ | 21,629,973 | | | $ | 29,587,001 | | | $ | 40,003,741 | |
| | | | | | | | | | | | | | | | |
Changes in Shares Outstanding: | | | | | | | | | | | | | | | | |
Investor Class | | | | | | | | | | | | | | | | |
Sold | | | 2,061 | | | | 265,065 | | | | 647,464 | | | | 1,819,666 | |
Distributions reinvested | | | 2,470 | | | | 4,505 | | | | 118,569 | | | | 515,781 | |
Redeemed | | | (13,600 | ) | | | (846,475 | ) | | | (1,057,916 | ) | | | (2,858,855 | ) |
| | | | | | | | | | | | | | | | |
Net decrease in shares outstanding | | | (9,069 | ) | | | (576,905 | ) | | | (291,883 | ) | | | (523,408 | ) |
| | | | | | | | | | | | | | | | |
Institutional Class | | | | | | | | | | | | | | | | |
Sold | | | 332,026 | | | | 377,005 | | | | 500,667 | | | | 1,448,182 | |
Distributions reinvested | | | 18,223 | | | | 12,303 | | | | 35,095 | | | | 81,424 | |
Redeemed | | | (243,666 | ) | | | (1,060,231 | ) | | | (731,389 | ) | | | (1,518,121 | ) |
| | | | | | | | | | | | | | | | |
Net increase/(decrease) in shares outstanding | | | 106,583 | | | | (670,923 | ) | | | (195,627 | ) | | | 11,485 | |
| | | | | | | | | | | | | | | | |
Class A | | | | | | | | | | | | | | | | |
Sold | | | 141,460 | | | | 49,214 | | | | 55,951 | | | | 26,253 | |
Distributions reinvested | | | 38,110 | | | | 36,572 | | | | 19,918 | | | | 87,630 | |
Redeemed | | | (330,599 | ) | | | (325,400 | ) | | | (127,681 | ) | | | (114,086 | ) |
| | | | | | | | | | | | | | | | |
Net decrease in shares outstanding | | | (151,029 | ) | | | (239,614 | ) | | | (51,812 | ) | | | (203 | ) |
| | | | | | | | | | | | | | | | |
Class C | | | | | | | | | | | | | | | | |
Sold | | | 28,362 | | | | 23,399 | | | | 9,182 | | | | 5,448 | |
Distributions reinvested | | | 25,805 | | | | 22,868 | | | | 7,218 | | | | 48,085 | |
Redeemed | | | (133,780 | ) | | | (193,493 | ) | | | (100,009 | ) | | | (60,449 | ) |
| | | | | | | | | | | | | | | | |
Net decrease in shares outstanding | | | (79,613 | ) | | | (147,226 | ) | | | (83,609 | ) | | | (6,916 | ) |
| | | | | | | | | | | | | | | | |
Advisor Class | | | | | | | | | | | | | | | | |
Sold | | | 4,230 | | | | 17,760 | | | | — | | | | — | |
Distributions reinvested | | | 289 | | | | 4,447 | | | | — | | | | — | |
Redeemed | | | (58,203 | ) | | | (311,040 | ) | | | — | | | | — | |
| | | | | | | | | | | | | | | | |
Net decrease in shares outstanding | | | (53,684 | ) | | | (288,833 | ) | | | — | | | | — | |
| | | | | | | | | | | | | | | | |
(a) Effective March 29, 2017, Advisor Class shares of Salient International Real Estate Fund were terminated and exchanged into Institutional Class shares.
(b) Prior to May 1, 2016, Salient International Real Estate Fund was known as Forward International Real Estate Fund.
(c) Prior to May 1, 2016, Salient Real Estate Fund was known as Forward Real Estate Fund.
| | | | |
| See accompanying Notes to Financial Statements. | | 44 | | |
Statements of Changes in Net Assets
| | | | | | | | | | | | | | | | |
| | | Salient Select Income Fund | | | Salient Select Opportunity Fund | |
| | | Year Ended
December 31, 2017(a) | | | Year Ended
December 31, 2016(b) | | | Year Ended
December 31, 2017 | | | Year Ended
December 31, 2016(c) | |
Operations: | |
Net investment income | | $ | 25,774,903 | | | $ | 24,896,102 | | | $ | 33,727 | | | $ | 255,825 | |
Net realized gain/(loss) | | | 57,196,293 | | | | 49,543,678 | | | | 46,593 | | | | (1,777,448 | ) |
Net change in unrealized appreciation/depreciation | | | (67,174,190 | ) | | | 59,315,459 | | | | 434,483 | | | | 2,479,926 | |
| | | | | | | | | | | | | | | | |
Net increase in net assets resulting from operations | | | 15,797,006 | | | | 133,755,239 | | | | 514,803 | | | | 958,303 | |
| | | | | | | | | | | | | | | | |
Distributions to Shareholders: | | | | | | | | | | | | | | | | |
From net investment income | | | | | | | | | | | | | | | | |
Investor Class | | | (934,699 | ) | | | (1,665,584 | ) | | | (2,503 | ) | | | (15,387 | ) |
Institutional Class | | | (11,592,803 | ) | | | (8,134,848 | ) | | | (19,032 | ) | | | (86,965 | ) |
Class A | | | (8,477,869 | ) | | | (9,470,107 | ) | | | (12,340 | ) | | | (118,411 | ) |
Class B | | | (3,107 | ) | | | (57,288 | ) | | | — | | | | — | |
Class C | | | (4,908,589 | ) | | | (4,445,627 | ) | | | (996 | ) | | | (36,237 | ) |
Advisor Class | | | (122,410 | ) | | | (1,122,648 | ) | | | — | | | | — | |
From net realized gains on investments | | | | | | | | | | | | | | | | |
Investor Class | | | (1,936,137 | ) | | | (3,113,481 | ) | | | — | | | | — | |
Institutional Class | | | (24,013,349 | ) | | | (15,206,500 | ) | | | — | | | | — | |
Class A | | | (17,561,069 | ) | | | (17,702,503 | ) | | | — | | | | — | |
Class B | | | (6,435 | ) | | | (107,089 | ) | | | — | | | | — | |
Class C | | | (10,167,660 | ) | | | (8,310,226 | ) | | | — | | | | — | |
Advisor Class | | | (253,561 | ) | | | (2,098,570 | ) | | | — | | | | — | |
From return of capital | | | | | | | | | | | | | | | | |
Investor Class | | | — | | | | — | | | | (13,473 | ) | | | (6,416 | ) |
Institutional Class | | | — | | | | — | | | | (102,446 | ) | | | (36,262 | ) |
Class A | | | — | | | | — | | | | (66,421 | ) | | | (49,373 | ) |
Class C | | | — | | | | — | | | | (5,360 | ) | | | (15,110 | ) |
| | | | | | | | | | | | | | | | |
Total distributions | | | (79,977,688 | ) | | | (71,434,471 | ) | | | (222,571 | ) | | | (364,161 | ) |
| | | | | | | | | | | | | | | | |
Share Transactions: | |
Investor Class | |
Proceeds from sale of shares | | | 19,445,870 | | | | 90,384,615 | | | | 7,150 | | | | 75,638 | |
Issued to shareholders in reinvestment of distributions | | | 2,831,192 | | | | 4,751,234 | | | | 15,949 | | | | 21,803 | |
Cost of shares redeemed | | | (74,758,820 | ) | | | (92,659,270 | ) | | | (190,914 | ) | | | (166,497 | ) |
| | | | | | | | | | | | | | | | |
Net increase/(decrease) from share transactions | | | (52,481,758 | ) | | | 2,476,579 | | | | (167,815 | ) | | | (69,056 | ) |
| | | | | | | | | | | | | | | | |
Institutional Class | |
Proceeds from sale of shares | | | 200,701,244 | | | | 200,689,427 | | | | 764,689 | | | | 768,671 | |
Issued to shareholders in reinvestment of distributions | | | 31,238,319 | | | | 20,378,974 | | | | 55,986 | | | | 59,168 | |
Cost of shares redeemed | | | (202,553,366 | ) | | | (217,015,412 | ) | | | (874,026 | ) | | | (2,944,533 | ) |
| | | | | | | | | | | | | | | | |
Net increase/(decrease) from share transactions | | | 29,386,197 | | | | 4,052,989 | | | | (53,351 | ) | | | (2,116,694 | ) |
| | | | | | | | | | | | | | | | |
Class A | |
Proceeds from sale of shares | | | 44,442,393 | | | | 84,013,702 | | | | 255,090 | | | | 2,029,674 | |
Issued to shareholders in reinvestment of distributions | | | 22,339,418 | | | | 22,619,169 | | | | 78,716 | | | | 149,770 | |
Cost of shares redeemed | | | (195,770,459 | ) | | | (148,195,374 | ) | | | (1,494,612 | ) | | | (5,278,453 | ) |
| | | | | | | | | | | | | | | | |
Net decrease from share transactions | | | (128,988,648 | ) | | | (41,562,503 | ) | | | (1,160,806 | ) | | | (3,099,009 | ) |
| | | | | | | | | | | | | | | | |
| | | | |
| See accompanying Notes to Financial Statements. | | 45 | | |
Statements of Changes in Net Assets
| | | | | | | | | | | | | | | | |
| | | Salient Select Income Fund (continued) | | | Salient Select Opportunity Fund (continued) | |
| | | Year Ended
December 31, 2017(a) | | | Year Ended
December 31, 2016(b) | | | Year Ended
December 31, 2017 | | | Year Ended
December 31, 2016(c) | |
Class B | |
Proceeds from sale of shares | | | — | | | | 897 | | | | — | | | | — | |
Issued to shareholders in reinvestment of distributions | | | 3,964 | | | | 104,519 | | | | — | | | | — | |
Cost of shares redeemed | | | (2,134,584 | ) | | | (2,318,968 | ) | | | — | | | | — | |
| | | | | | | | | | | | | | | | |
Net decrease from share transactions | | | (2,130,620 | ) | | | (2,213,552 | ) | | | — | | | | — | |
| | | | | | | | | | | | | | | | |
Class C | |
Proceeds from sale of shares | | | 9,950,635 | | | | 13,855,203 | | | | 11,800 | | | | 35,965 | |
Issued to shareholders in reinvestment of distributions | | | 13,389,924 | | | | 11,183,857 | | | | 6,117 | | | | 48,002 | |
Cost of shares redeemed | | | (51,058,503 | ) | | | (56,913,464 | ) | | | (660,024 | ) | | | (2,033,321 | ) |
| | | | | | | | | | | | | | | | |
Net decrease from share transactions | | | (27,717,944 | ) | | | (31,874,404 | ) | | | (642,107 | ) | | | (1,949,354 | ) |
| | | | | | | | | | | | | | | | |
Advisor Class | |
Proceeds from sale of shares | | | 8,516,838 | | | | 27,876,107 | | | | — | | | | — | |
Issued to shareholders in reinvestment of distributions | | | 310,776 | | | | 2,987,180 | | | | — | | | | — | |
Cost of shares redeemed | | | (63,098,471 | ) | | | (20,360,578 | ) | | | — | | | | — | |
| | | | | | | | | | | | | | | | |
Net increase/(decrease) from share transactions | | | (54,270,857 | ) | | | 10,502,709 | | | | — | | | | — | |
| | | | | | | | | | | | | | | | |
Net increase/(decrease) in net assets | | $ | (300,384,312 | ) | | $ | 3,702,586 | | | $ | (1,731,847 | ) | | $ | (6,639,971 | ) |
| | | | | | | | | | | | | | | | |
Net Assets: | |
Beginning of period | | | 1,119,239,764 | | | | 1,115,537,178 | | | | 9,718,927 | | | | 16,358,898 | |
| | | | | | | | | | | | | | | | |
End of period (including accumulated net investment loss of $(236,124), $—, $— and $(24), respectively) | | $ | 818,855,452 | | | $ | 1,119,239,764 | | | $ | 7,987,080 | | | $ | 9,718,927 | |
| | | | | | | | | | | | | | | | |
Changes in Shares Outstanding: | | | | | | | | | | | | | | | | |
Investor Class | | | | | | | | | | | | | | | | |
Sold | | | 817,708 | | | | 3,865,706 | | | | 286 | | | | 3,548 | |
Distributions reinvested | | | 123,911 | | | | 202,129 | | | | 646 | | | | 1,058 | |
Redeemed | | | (3,128,990 | ) | | | (4,024,098 | ) | | | (7,816 | ) | | | (8,527 | ) |
| | | | | | | | | | | | | | | | |
Net increase/(decrease) in shares outstanding | | | (2,187,371 | ) | | | 43,737 | | | | (6,884 | ) | | | (3,921 | ) |
| | | | | | | | | | | | | | | | |
Institutional Class | | | | | | | | | | | | | | | | |
Sold | | | 8,445,758 | | | | 8,615,671 | | | | 30,990 | | | | 35,290 | |
Distributions reinvested | | | 1,367,289 | | | | 867,365 | | | | 2,267 | | | | 2,868 | |
Redeemed | | | (8,627,741 | ) | | | (9,418,036 | ) | | | (35,527 | ) | | | (150,857 | ) |
| | | | | | | | | | | | | | | | |
Net increase/(decrease) in shares outstanding | | | 1,185,306 | | | | 65,000 | | | | (2,270 | ) | | | (112,699 | ) |
| | | | | | | | | | | | | | | | |
Class A | | | | | | | | | | | | | | | | |
Sold | | | 1,861,341 | | | | 3,603,614 | | | | 10,187 | | | | 100,205 | |
Distributions reinvested | | | 975,224 | | | | 960,846 | | | | 3,191 | | | | 7,418 | |
Redeemed | | | (8,260,681 | ) | | | (6,429,488 | ) | | | (60,166 | ) | | | (259,131 | ) |
| | | | | | | | | | | | | | | | |
Net decrease in shares outstanding | | | (5,424,116 | ) | | | (1,865,028 | ) | | | (46,788 | ) | | | (151,508 | ) |
| | | | | | | | | | | | | | | | |
| | | | |
| See accompanying Notes to Financial Statements. | | 46 | | |
Statements of Changes in Net Assets
| | | | | | | | | | | | | | | | |
| | | Salient Select Income Fund (continued) | | | Salient Select Opportunity Fund (continued) | |
| | | Year Ended
December 31, 2017(a) | | | Year Ended
December 31, 2016(b) | | | Year Ended
December 31, 2017 | | | Year Ended
December 31, 2016(c) | |
Class B | | | | | | | | | | | | | | | | |
Sold | | | — | | | | 33 | | | | — | | | | — | |
Distributions reinvested | | | 170 | | | | 4,546 | | | | — | | | | — | |
Redeemed | | | (90,203 | ) | | | (100,628 | ) | | | — | | | | — | |
| | | | | | | | | | | | | | | | |
Net decrease in shares outstanding | | | (90,033 | ) | | | (96,049 | ) | | | — | | | | — | |
| | | | | | | | | | | | | | | | |
Class C | | | | | | | | | | | | | | | | |
Sold | | | 429,414 | | | | 600,156 | | | | 477 | | | | 1,635 | |
Distributions reinvested | | | 602,611 | | | | 487,409 | | | | 248 | | | | 2,416 | |
Redeemed | | | (2,225,535 | ) | | | (2,546,576 | ) | | | (26,852 | ) | | | (96,851 | ) |
| | | | | | | | | | | | | | | | |
Net decrease in shares outstanding | | | (1,193,510 | ) | | | (1,459,011 | ) | | | (26,127 | ) | | | (92,800 | ) |
| | | | | | | | | | | | | | | | |
Advisor Class | | | | | | | | | | | | | | | | |
Sold | | | 353,839 | | | | 1,176,224 | | | | — | | | | — | |
Distributions reinvested | | | 13,202 | | | | 126,748 | | | | — | | | | — | |
Redeemed | | | (2,650,083 | ) | | | (900,377 | ) | | | — | | | | — | |
| | | | | | | | | | | | | | | | |
Net increase/(decrease) in shares outstanding | | | (2,283,042 | ) | | | 402,595 | | | | — | | | | — | |
| | | | | | | | | | | | | | | | |
(a) Effective March 29, 2017, Advisor Class shares of Salient Select Income Fund were terminated and exchanged into Institutional Class shares. Effective April 28, 2017, Class B shares of Salient Select Income Fund were terminated and exchanged into Class A shares.
(b) Prior to May 1, 2016, Salient Select Income Fund was known as Forward Select Income Fund.
(c) Prior to May 1, 2016, Salient Select Opportunity Fund was known as Forward Select Opportunity Fund.
| | | | |
| See accompanying Notes to Financial Statements. | | 47 | | |
Statements of Changes in Net Assets
| | | | | | | | |
| | | Salient Tactical Real Estate Fund | |
| | | Year Ended
December 31, 2017(a) | | | Year Ended
December 31, 2016(b) | |
Operations: | |
Net investment income/(loss) | | $ | 317,598 | | | $ | (597,642 | ) |
Net realized gain/(loss) | | | (871,493 | ) | | | 11,544,217 | |
Net change in unrealized appreciation/depreciation | | | (2,813,063 | ) | | | (623,398 | ) |
| | | | | | | | |
Net increase/(decrease) in net assets resulting from operations | | | (3,366,958 | ) | | | 10,323,177 | |
| | | | | | | | |
Distributions to Shareholders: | | | | | | | | |
From net investment income | | | | | | | | |
Investor Class | | | (9,144 | ) | | | (23,085 | ) |
Institutional Class | | | (108,224 | ) | | | (537,648 | ) |
Class A | | | (137,272 | ) | | | (598,126 | ) |
Class B | | | (43 | ) | | | (4,040 | ) |
Class C | | | (56,020 | ) | | | (245,807 | ) |
Advisor Class | | | (328 | ) | | | (16,758 | ) |
From return of capital | | | | | | | | |
Investor Class | | | (36,171 | ) | | | — | |
Institutional Class | | | (428,132 | ) | | | — | |
Class A | | | (543,050 | ) | | | — | |
Class B | | | (168 | ) | | | — | |
Class C | | | (221,611 | ) | | | — | |
Advisor Class | | | (1,296 | ) | | | — | |
| | | | | | | | |
Total distributions | | | (1,541,459 | ) | | | (1,425,464 | ) |
| | | | | | | | |
Share Transactions: | |
Investor Class | |
Proceeds from sale of shares | | | 1,146,694 | | | | 742,783 | |
Issued to shareholders in reinvestment of distributions | | | 44,262 | | | | 23,026 | |
Cost of shares redeemed | | | (1,451,660 | ) | | | (398,586 | ) |
| | | | | | | | |
Net increase/(decrease) from share transactions | | | (260,704 | ) | | | 367,223 | |
| | | | | | | | |
Institutional Class | |
Proceeds from sale of shares | | | 6,600,496 | | | | 4,415,204 | |
Issued to shareholders in reinvestment of distributions | | | 534,913 | | | | 536,556 | |
Cost of shares redeemed | | | (23,776,533 | ) | | | (5,075,961 | ) |
| | | | | | | | |
Net decrease from share transactions | | | (16,641,124 | ) | | | (124,201 | ) |
| | | | | | | | |
Class A | |
Proceeds from sale of shares | | | 2,892,787 | | | | 1,178,111 | |
Issued to shareholders in reinvestment of distributions | | | 597,800 | | | | 524,887 | |
Cost of shares redeemed | | | (9,730,607 | ) | | | (7,611,566 | ) |
| | | | | | | | |
Net decrease from share transactions | | | (6,240,020 | ) | | | (5,908,568 | ) |
| | | | | | | | |
Class B | |
Issued to shareholders in reinvestment of distributions | | | 204 | | | | 3,807 | |
Cost of shares redeemed | | | (196,975 | ) | | | (230,544 | ) |
| | | | | | | | |
Net decrease from share transactions | | | (196,771 | ) | | | (226,737 | ) |
| | | | | | | | |
Class C | |
Proceeds from sale of shares | | | 297,579 | | | | 831,994 | |
Issued to shareholders in reinvestment of distributions | | | 262,188 | | | | 233,023 | |
Cost of shares redeemed | | | (5,592,154 | ) | | | (3,332,673 | ) |
| | | | | | | | |
Net decrease from share transactions | | | (5,032,387 | ) | | | (2,267,656 | ) |
| | | | | | | | |
| | | | |
| See accompanying Notes to Financial Statements. | | 48 | | |
Statements of Changes in Net Assets
| | | | | | | | |
| | | Salient Tactical Real Estate Fund | |
| | | Year Ended
December 31, 2017(a) | | | Year Ended
December 31, 2016(b) | |
Advisor Class | |
Proceeds from sale of shares | | | 724,909 | | | | 957,997 | |
Issued to shareholders in reinvestment of distributions | | | 1,624 | | | | 16,758 | |
Cost of shares redeemed | | | (2,151,650 | ) | | | (468,237 | ) |
| | | | | | | | |
Net increase/(decrease) from share transactions | | | (1,425,117 | ) | | | 506,518 | |
| | | | | | | | |
Net increase/(decrease) in net assets | | $ | (34,704,540 | ) | | $ | 1,244,292 | |
| | | | | | | | |
Net Assets: | |
Beginning of period | | | 73,826,076 | | | | 72,581,784 | |
| | | | | | | | |
End of period (including accumulated net investment loss of $— and $(5,488), respectively) | | $ | 39,121,536 | | | $ | 73,826,076 | |
| | | | | | | | |
Changes in Shares Outstanding: | |
Investor Class | |
Sold | | | 30,977 | | | | 20,769 | |
Distributions reinvested | | | 1,273 | | | | 671 | |
Redeemed | | | (40,491 | ) | | | (11,915 | ) |
| | | | | | | | |
Net increase/(decrease) in shares outstanding | | | (8,241 | ) | | | 9,525 | |
| | | | | | | | |
Institutional Class | |
Sold | | | 175,635 | | | | 121,870 | |
Distributions reinvested | | | 14,750 | | | | 15,180 | |
Redeemed | | | (653,650 | ) | | | (142,920 | ) |
| | | | | | | | |
Net decrease in shares outstanding | | | (463,265 | ) | | | (5,870 | ) |
| | | | | | | | |
Class A | |
Sold | | | 78,410 | | | | 33,747 | |
Distributions reinvested | | | 17,203 | | | | 15,342 | |
Redeemed | | | (269,565 | ) | | | (226,305 | ) |
| | | | | | | | |
Net decrease in shares outstanding | | | (173,952 | ) | | | (177,216 | ) |
| | | | | | | | |
Class B | |
Distributions reinvested | | | 6 | | | | 114 | |
Redeemed | | | (5,433 | ) | | | (6,824 | ) |
| | | | | | | | |
Net decrease in shares outstanding | | | (5,427 | ) | | | (6,710 | ) |
| | | | | | | | |
Class C | |
Sold | | | 8,277 | | | | 23,618 | |
Distributions reinvested | | | 7,630 | | | | 6,921 | |
Redeemed | | | (157,686 | ) | | | (97,330 | ) |
| | | | | | | | |
Net decrease in shares outstanding | | | (141,779 | ) | | | (66,791 | ) |
| | | | | | | | |
Advisor Class | |
Sold | | | 18,873 | | | | 25,726 | |
Distributions reinvested | | | 44 | | | | 471 | |
Redeemed | | | (56,887 | ) | | | (13,434 | ) |
| | | | | | | | |
Net increase/(decrease) in shares outstanding | | | (37,970 | ) | | | 12,763 | |
| | | | | | | | |
(a) Effective March 29, 2017, Advisor Class shares of Salient Tactical Real Estate Fund were terminated and exchanged into Institutional Class shares. Effective April 28, 2017, Class B shares of Salient Tactical Real Estate Fund were terminated and exchanged into Class A shares.
(b) Prior to May 1, 2016, Salient Tactical Real Estate Fund was known as Forward Real Estate Long/Short Fund.
| | | | |
| See accompanying Notes to Financial Statements. | | 49 | | |
Statements of Cash Flows
For the Year Ended December 31, 2017
| | | | | | | | | | | | |
| | | Salient Select
Income
Fund | | | Salient Select
Opportunity
Fund | | | Salient Tactical
Real Estate
Fund | |
Cash Flow from Operating Activities: | | | | | | | | | | | | |
Net increase/(decrease) in net assets resulting from operations | | $ | 15,797,006 | | | $ | 514,803 | | | $ | (3,366,958 | ) |
Adjustments to reconcile net increase/(decrease) in net assets resulting from operations to net cash provided by operating activities: | | | | | | | | | | | | |
Purchase of investment securities | | | (451,698,651 | ) | | | (4,772,103 | ) | | | (41,264,511 | ) |
Proceeds from sale of investment securities | | | 733,229,635 | | | | 6,925,606 | | | | 68,235,160 | |
Proceeds from securities sold short transactions | | | 387,172,137 | | | | — | | | | 65,256,223 | |
Purchases to cover securities sold short transactions | | | (409,786,969 | ) | | | — | | | | (72,578,344 | ) |
Purchase of option contracts | | | (262,470 | ) | | | — | | | | — | |
Proceeds from sale of option contracts | | | 402,454 | | | | — | | | | — | |
Amortization of premium and accretion of discount on investments | | | (317,344 | ) | | | (2,290 | ) | | | — | |
Net realized (gain)/loss on investments | | | (69,156,597 | ) | | | (46,827 | ) | | | (232,116 | ) |
Net realized gain on securities sold short | | | 11,960,304 | | | | — | | | | 1,102,530 | |
Net change in unrealized appreciation/depreciation on investments | | | 72,702,162 | | | | (432,508 | ) | | | 3,016,507 | |
Net change in unrealized appreciation/depreciation on securities sold short | | | (5,527,972 | ) | | | — | | | | (203,508 | ) |
Change in assets and liabilities: | | | | | | | | | | | | |
Decrease in deposit with broker for securities sold short | | | 22,719,367 | | | | — | | | | 7,419,010 | |
Increase in receivable due from advisor | | | — | | | | (910 | ) | | | — | |
Increase in interest and dividends receivable | | | (49,154 | ) | | | (16,017 | ) | | | (290,945 | ) |
(Increase)/Decrease in other assets | | | 29,484 | | | | (926 | ) | | | 5,311 | |
Increase/(Decrease) in payable for interest due on loan | | | 63,199 | | | | (84 | ) | | | 10,245 | |
Decrease in payable for dividend expense on short sales | | | — | | | | — | | | | (4,050 | ) |
Decrease in payable to advisor | | | (217,540 | ) | | | — | | | | (22,759 | ) |
Decrease in payable for distribution and service fees | | | (108,676 | ) | | | (977 | ) | | | (8,741 | ) |
Increase in payable to trustees | | | 2,513 | | | | 27 | | | | 157 | |
Increase/(Decrease) in payable for compliance fees | | | (1,685 | ) | | | 11 | | | | (129 | ) |
Increase in payable for legal and audit fees | | | 7,410 | | | | 504 | | | | 753 | |
Increase/(Decrease) in accrued expenses and other liabilities | | | (2,887 | ) | | | 1,194 | | | | 426 | |
| | | | | | | | | | | | |
Net cash provided by operating activities | | | 306,955,726 | | | | 2,169,503 | | | | 27,074,261 | |
| | | | | | | | | | | | |
Cash Flows from Financing Activities: | | | | | | | | | | | | |
Cash repayment of loan | | | (32,662,696 | ) | | | (979,276 | ) | | | (13,043,930 | ) |
Proceeds from sale of shares | | | 288,024,286 | | | | 1,052,010 | | | | 11,703,138 | |
Cost of shares redeemed | | | (594,247,607 | ) | | | (3,232,857 | ) | | | (43,045,574 | ) |
Cash distributions paid | | | (9,864,095 | ) | | | (65,803 | ) | | | (100,468 | ) |
| | | | | | | | | | | | |
Net cash used in financing activities | | | (348,750,112 | ) | | | (3,225,926 | ) | | | (44,486,834 | ) |
| | | | | | | | | | | | |
Effect of exchange rates on cash | | | — | | | | 11 | | | | — | |
| | | | | | | | | | | | |
Net Change in Cash for the Year | | | (41,794,386 | ) | | | (1,056,412 | ) | | | (17,412,573 | ) |
| | | | | | | | | | | | |
Cash and Foreign Currency at Beginning of Period | | | 145,364,686 | | | | 1,842,330 | | | | 17,611,122 | |
| | | | | | | | | | | | |
Cash and Foreign Currency at End of Period | | $ | 103,570,300 | | | $ | 785,918 | | | $ | 198,549 | |
| | | | | | | | | | | | |
Non-cash financing activities not included herein consist of reinvestment of distributions of: | | $ | 70,113,593 | | | $ | 156,768 | | | $ | 1,440,991 | |
Cash paid for interest and commitment fees on loan during the year was: | | $ | 3,404,745 | | | $ | 20,768 | | | $ | 304,462 | |
| | | | |
| See accompanying Notes to Financial Statements. | | 50 | | |
Financial Highlights
For a share outstanding throughout the periods presented.
Salient International Real Estate Fund(a)
| | | | | | | | | | | | | | | | | | | | |
| | | Investor Class | |
| | | Year Ended
December 31,
2017 | | | Year Ended
December 31,
2016 | | | Year Ended
December 31,
2015(b) | | | Year Ended
December 31,
2014 | | | Year Ended
December 31,
2013 | |
Net Asset Value, Beginning of Period | | $ | 13.04 | | | $ | 13.60 | | | $ | 14.74 | | | $ | 15.65 | | | $ | 17.26 | |
Income/(Loss) from Operations: | |
Net investment income(c) | | | 0.07 | | | | 0.02 | | | | 0.21 | | | | 0.18 | | | | 0.38 | |
Net realized and unrealized gain/(loss) on investments | | | 2.67 | | | | 0.07 | | | | (0.79 | ) | | | 0.02 | | | | (1.01 | ) |
| | | | | | | | | | | | | | | | | | | | |
Total from Investment Operations | | | 2.74 | | | | 0.09 | | | | (0.58 | ) | | | 0.20 | | | | (0.63 | ) |
| | | | | | | | | | | | | | | | | | | | |
Less Distributions: | | | | | | | | | | | | | | | | | | | | |
From investment income | | | (0.97 | ) | | | (0.65 | ) | | | (0.56 | ) | | | (1.11 | ) | | | (0.98 | ) |
| | | | | | | | | | | | | | | | | | | | |
Total Distributions | | | (0.97 | ) | | | (0.65 | ) | | | (0.56 | ) | | | (1.11 | ) | | | (0.98 | ) |
| | | | | | | | | | | | | | | | | | | | |
Net Increase/(Decrease) in Net Asset Value | | | 1.77 | | | | (0.56 | ) | | | (1.14 | ) | | | (0.91 | ) | | | (1.61 | ) |
| | | | | | | | | | | | | | | | | | | | |
Net Asset Value, End of Period | | $ | 14.81 | | | $ | 13.04 | | | $ | 13.60 | | | $ | 14.74 | | | $ | 15.65 | |
| | | | | | | | | | | | | | | | | | | | |
Total Return | | | 21.44 | % | | | 0.74 | % | | | (4.08 | )% | | | 1.33 | % | | | (3.51 | )% |
Ratios/Supplemental Data: | |
Net assets, End of Period (in 000s) | | $ | 555 | | | $ | 607 | | | $ | 8,479 | | | $ | 15,385 | | | $ | 51,393 | |
Ratios to Average Net Assets: | | | | | | | | | | | | | | | | | | | | |
Net investment income including reimbursement/waiver | | | 0.52 | % | | | 0.17 | % | | | 1.41 | % | | | 1.17 | % | | | 2.30 | % |
Operating expenses including reimbursement/waiver | | | n/a | | | | n/a | | | | n/a | | | | 1.79 | %(d) | | | 1.75 | % |
Operating expenses excluding reimbursement/waiver | | | 2.39 | % | | | 2.12 | % | | | 1.86 | % | | | 1.79 | % | | | 1.75 | % |
Portfolio Turnover Rate | | | 41 | % | | | 80 | % | | | 281 | % | | | 242 | % | | | 202 | % |
(a) Prior to May 1, 2016, Salient International Real Estate Fund was known as Forward International Real Estate Fund.
(b) The information for the fiscal year ended December 31, 2015 has been audited by KPMG LLP, independent registered public accounting firm. The information for prior periods has been audited by the predecessor independent registered public accounting firm.
(c) Per share amounts are based upon average shares outstanding.
(d) Effective May 1, 2014, the expense limitation agreement expired.
| | | | |
| See accompanying Notes to Financial Statements. | | 51 | | |
Financial Highlights
For a share outstanding throughout the periods presented.
Salient International Real Estate Fund(a)
| | | | | | | | | | | | | | | | | | | | |
| | | Institutional Class | |
| | | Year Ended
December 31,
2017 | | | Year Ended
December 31,
2016 | | | Year Ended
December 31,
2015(b) | | | Year Ended
December 31,
2014 | | | Year Ended
December 31,
2013 | |
Net Asset Value, Beginning of Period | | $ | 12.93 | | | $ | 13.51 | | | $ | 14.65 | | | $ | 15.61 | | | $ | 17.24 | |
Income/(Loss) from Operations: | |
Net investment income(c) | | | 0.12 | | | | 0.10 | | | | 0.25 | | | | 0.38 | | | | 0.43 | |
Net realized and unrealized gain/(loss) on investments | | | 2.64 | | | | 0.04 | | | | (0.78 | ) | | | (0.12 | ) | | | (1.02 | ) |
| | | | | | | | | | | | | | | | | | | | |
Total from Investment Operations | | | 2.76 | | | | 0.14 | | | | (0.53 | ) | | | 0.26 | | | | (0.59 | ) |
| | | | | | | | | | | | | | | | | | | | |
Less Distributions: | | | | | | | | | | | | | | | | | | | | |
From investment income | | | (1.01 | ) | | | (0.72 | ) | | | (0.61 | ) | | | (1.22 | ) | | | (1.04 | ) |
| | | | | | | | | | | | | | | | | | | | |
Total Distributions | | | (1.01 | ) | | | (0.72 | ) | | | (0.61 | ) | | | (1.22 | ) | | | (1.04 | ) |
| | | | | | | | | | | | | | | | | | | | |
Net Increase/(Decrease) in Net Asset Value | | | 1.75 | | | | (0.58 | ) | | | (1.14 | ) | | | (0.96 | ) | | | (1.63 | ) |
| | | | | | | | | | | | | | | | | | | | |
Net Asset Value, End of Period | | $ | 14.68 | | | $ | 12.93 | | | $ | 13.51 | | | $ | 14.65 | | | $ | 15.61 | |
| | | | | | | | | | | | | | | | | | | | |
Total Return | | | 21.88 | % | | | 0.98 | % | | | (3.76 | )% | | | 1.75 | % | | | (3.31 | )% |
Ratios/Supplemental Data: | |
Net assets, End of Period (in 000s) | | $ | 6,655 | | | $ | 4,481 | | | $ | 13,746 | | | $ | 24,886 | | | $ | 64,484 | |
Ratios to Average Net Assets: | | | | | | | | | | | | | | | | | | | | |
Net investment income including reimbursement/waiver | | | 0.89 | % | | | 0.74 | % | | | 1.68 | % | | | 2.47 | % | | | 2.52 | % |
Operating expenses including reimbursement/waiver | | | n/a | | | | n/a | | | | n/a | | | | 1.45 | %(d) | | | 1.40 | %(e) |
Operating expenses excluding reimbursement/waiver | | | 2.03 | % | | | 1.90 | % | | | 1.52 | % | | | 1.47 | % | | | 1.40 | % |
Portfolio Turnover Rate | | | 41 | % | | | 80 | % | | | 281 | % | | | 242 | % | | | 202 | % |
(a) Prior to May 1, 2016, Salient International Real Estate Fund was known as Forward International Real Estate Fund.
(b) The information for the fiscal year ended December 31, 2015 has been audited by KPMG LLP, independent registered public accounting firm. The information for prior periods has been audited by the predecessor independent registered public accounting firm.
(c) Per share amounts are based upon average shares outstanding.
(d) Effective May 1, 2014, the expense limitation agreement expired.
(e) Effective May 1, 2013, the annual expense limitation rate changed from 1.40% to 1.45%.
| | | | |
| See accompanying Notes to Financial Statements. | | 52 | | |
Financial Highlights
For a share outstanding throughout the periods presented.
Salient International Real Estate Fund(a)
| | | | | | | | | | | | | | | | | | | | |
| | | Class A | |
| | | Year Ended
December 31,
2017 | | | Year Ended
December 31,
2016 | | | Year Ended
December 31,
2015(b) | | | Year Ended
December 31,
2014 | | | Year Ended
December 31,
2013 | |
Net Asset Value, Beginning of Period | | $ | 12.99 | | | $ | 13.59 | | | $ | 14.72 | | | $ | 15.68 | | | $ | 17.28 | |
Income/(Loss) from Operations: | |
Net investment income(c) | | | 0.07 | | | | 0.04 | | | | 0.19 | | | | 0.35 | | | | 0.31 | |
Net realized and unrealized gain/(loss) on investments | | | 2.65 | | | | 0.03 | | | | (0.77 | ) | | | (0.15 | ) | | | (0.97 | ) |
| | | | | | | | | | | | | | | | | | | | |
Total from Investment Operations | | | 2.72 | | | | 0.07 | | | | (0.58 | ) | | | 0.20 | | | | (0.66 | ) |
| | | | | | | | | | | | | | | | | | | | |
Less Distributions: | | | | | | | | | | | | | | | | | | | | |
From investment income | | | (0.96 | ) | | | (0.67 | ) | | | (0.55 | ) | | | (1.16 | ) | | | (0.94 | ) |
| | | | | | | | | | | | | | | | | | | | |
Total Distributions | | | (0.96 | ) | | | (0.67 | ) | | | (0.55 | ) | | | (1.16 | ) | | | (0.94 | ) |
| | | | | | | | | | | | | | | | | | | | |
Net Increase/(Decrease) in Net Asset Value | | | 1.76 | | | | (0.60 | ) | | | (1.13 | ) | | | (0.96 | ) | | | (1.60 | ) |
| | | | | | | | | | | | | | | | | | | | |
Net Asset Value, End of Period | | $ | 14.75 | | | $ | 12.99 | | | $ | 13.59 | | | $ | 14.72 | | | $ | 15.68 | |
| | | | | | | | | | | | | | | | | | | | |
Total Return(d) | | | 21.30 | % | | | 0.60 | % | | | (4.09 | )% | | | 1.32 | % | | | (3.71 | )% |
Ratios/Supplemental Data: | |
Net assets, End of Period (in 000s) | | $ | 8,426 | | | $ | 9,384 | | | $ | 13,070 | | | $ | 25,369 | | | $ | 33,913 | |
Ratios to Average Net Assets: | | | | | | | | | | | | | | | | | | | | |
Net investment income including reimbursement/waiver | | | 0.49 | % | | | 0.33 | % | | | 1.27 | % | | | 2.22 | % | | | 1.80 | % |
Operating expenses including reimbursement/waiver | | | n/a | | | | n/a | | | | n/a | | | | 1.85 | %(e) | | | 1.80 | %(f) |
Operating expenses excluding reimbursement/waiver | | | 2.44 | % | | | 2.35 | % | | | 1.91 | % | | | 1.87 | % | | | 1.80 | % |
Portfolio Turnover Rate | | | 41 | % | | | 80 | % | | | 281 | % | | | 242 | % | | | 202 | % |
(a) Prior to May 1, 2016, Salient International Real Estate Fund was known as Forward International Real Estate Fund.
(b) The information for the fiscal year ended December 31, 2015 has been audited by KPMG LLP, independent registered public accounting firm. The information for prior periods has been audited by the predecessor independent registered public accounting firm.
(c) Per share amounts are based upon average shares outstanding.
(d) Total return does not reflect the effect of sales charges.
(e) Effective May 1, 2014, the expense limitation agreement expired.
(f) Effective May 1, 2013, the annual expense limitation rate changed from 1.80% to 1.85%.
| | | | |
| See accompanying Notes to Financial Statements. | | 53 | | |
Financial Highlights
For a share outstanding throughout the periods presented.
Salient International Real Estate Fund(a)
| | | | | | | | | | | | | | | | | | | | |
| | | Class C | |
| | | Year Ended
December 31,
2017 | | | Year Ended
December 31,
2016 | | | Year Ended
December 31,
2015(b) | | | Year Ended
December 31,
2014 | | | Year Ended
December 31,
2013 | |
Net Asset Value, Beginning of Period | | $ | 13.00 | | | $ | 13.62 | | | $ | 14.75 | | | $ | 15.71 | | | $ | 17.33 | |
Income/(Loss) from Operations: | |
Net investment income/(loss)(c) | | | (0.01 | )(d) | | | (0.03 | )(d) | | | 0.12 | | | | 0.26 | | | | 0.27 | |
Net realized and unrealized gain/(loss) on investments | | | 2.64 | | | | 0.03 | | | | (0.78 | ) | | | (0.15 | ) | | | (1.02 | ) |
| | | | | | | | | | | | | | | | | | | | |
Total from Investment Operations | | | 2.63 | | | | 0.00 | | | | (0.66 | ) | | | 0.11 | | | | (0.75 | ) |
| | | | | | | | | | | | | | | | | | | | |
Less Distributions: | | | | | | | | | | | | | | | | | | | | |
From investment income | | | (0.90 | ) | | | (0.62 | ) | | | (0.47 | ) | | | (1.07 | ) | | | (0.87 | ) |
| | | | | | | | | | | | | | | | | | | | |
Total Distributions | | | (0.90 | ) | | | (0.62 | ) | | | (0.47 | ) | | | (1.07 | ) | | | (0.87 | ) |
| | | | | | | | | | | | | | | | | | | | |
Net Increase/(Decrease) in Net Asset Value | | | 1.73 | | | | (0.62 | ) | | | (1.13 | ) | | | (0.96 | ) | | | (1.62 | ) |
| | | | | | | | | | | | | | | | | | | | |
Net Asset Value, End of Period | | $ | 14.73 | | | $ | 13.00 | | | $ | 13.62 | | | $ | 14.75 | | | $ | 15.71 | |
| | | | | | | | | | | | | | | | | | | | |
Total Return(e) | | | 20.73 | % | | | (0.02 | )% | | | (4.62 | )% | | | 0.75 | % | | | (4.23 | )% |
Ratios/Supplemental Data: | |
Net assets, End of Period (in 000s) | | $ | 6,155 | | | $ | 6,465 | | | $ | 8,777 | | | $ | 11,896 | | | $ | 14,421 | |
Ratios to Average Net Assets: | | | | | | | | | | | | | | | | | | | | |
Net investment income/(loss) including reimbursement/waiver | | | (0.05 | )% | | | (0.22 | )% | | | 0.79 | % | | | 1.66 | % | | | 1.60 | % |
Operating expenses including reimbursement/waiver | | | n/a | | | | n/a | | | | n/a | | | | 2.40 | %(f) | | | 2.39 | % |
Operating expenses excluding reimbursement/waiver | | | 2.99 | % | | | 2.90 | % | | | 2.47 | % | | | 2.42 | % | | | 2.39 | % |
Portfolio Turnover Rate | | | 41 | % | | | 80 | % | | | 281 | % | | | 242 | % | | | 202 | % |
(a) Prior to May 1, 2016, Salient International Real Estate Fund was known as Forward International Real Estate Fund.
(b) The information for the fiscal year ended December 31, 2015 has been audited by KPMG LLP, independent registered public accounting firm. The information for prior periods has been audited by the predecessor independent registered public accounting firm.
(c) Per share amounts are based upon average shares outstanding.
(d) The amount shown for a share outstanding throughout the period may not correlate with the Statement of Operations for the period due to the timing of sales and redemptions of Fund shares in relation to income earned and/or fluctuating market value of the investments of the Fund.
(e) Total return does not reflect the effect of sales charges.
(f) Effective May 1, 2014, the expense limitation agreement expired.
| | | | |
| See accompanying Notes to Financial Statements. | | 54 | | |
Financial Highlights
For a share outstanding throughout the periods presented.
Salient Real Estate Fund(a)
| | | | | | | | | | | | | | | | | | | | |
| | | Investor Class | |
| | | Year Ended
December 31,
2017 | | | Year Ended
December 31,
2016 | | | Year Ended
December 31,
2015(b) | | | Year Ended
December 31,
2014 | | | Year Ended
December 31,
2013 | |
Net Asset Value, Beginning of Period | | $ | 12.28 | | | $ | 14.22 | | | $ | 17.45 | | | $ | 14.73 | | | $ | 14.97 | |
Income/(Loss) from Operations: | |
Net investment income/(loss)(c) | | | 0.13 | | | | (0.03 | ) | | | 0.16 | | | | 0.18 | | | | 0.15 | |
Net realized and unrealized gain/(loss) on investments | | | (0.62 | ) | | | 1.74 | | | | (0.06 | ) | | | 3.96 | | | | 0.22 | |
| | | | | | | | | | | | | | | | | | | | |
Total from Investment Operations | | | (0.49 | ) | | | 1.71 | | | | 0.10 | | | | 4.14 | | | | 0.37 | |
| | | | | | | | | | | | | | | | | | | | |
Less Distributions: | | | | | | | | | | | | | | | | | | | | |
From investment income | | | (0.12 | ) | | | (0.01 | ) | | | (0.15 | ) | | | (0.18 | ) | | | (0.11 | ) |
From capital gains | | | (0.59 | ) | | | (3.64 | ) | | | (3.18 | ) | | | (1.24 | ) | | | (0.50 | ) |
| | | | | | | | | | | | | | | | | | | | |
Total Distributions | | | (0.71 | ) | | | (3.65 | ) | | | (3.33 | ) | | | (1.42 | ) | | | (0.61 | ) |
| | | | | | | | | | | | | | | | | | | | |
Net Increase/(Decrease) in Net Asset Value | | | (1.20 | ) | | | (1.94 | ) | | | (3.23 | ) | | | 2.72 | | | | (0.24 | ) |
| | | | | | | | | | | | | | | | | | | | |
Net Asset Value, End of Period | | $ | 11.08 | | | $ | 12.28 | | | $ | 14.22 | | | $ | 17.45 | | | $ | 14.73 | |
| | | | | | | | | | | | | | | | | | | | |
Total Return | | | (3.92 | )% | | | 12.03 | % | | | 0.91 | % | | | 28.30 | % | | | 2.47 | % |
Ratios/Supplemental Data: | |
Net assets, End of Period (in 000s) | | $ | 20,901 | | | $ | 26,735 | | | $ | 38,420 | | | $ | 73,060 | | | $ | 59,219 | |
Ratios to Average Net Assets: | | | | | | | | | | | | | | | | | | | | |
Net investment income/(loss) | | | 1.06 | % | | | (0.23 | )% | | | 0.93 | % | | | 1.10 | % | | | 0.99 | % |
Operating expenses | | | 1.96 | % | | | 1.87 | % | | | 1.70 | % | | | 1.58 | % | | | 1.63 | % |
Portfolio Turnover Rate | | | 60 | % | | | 81 | % | | | 88 | % | | | 85 | % | | | 58 | % |
(a) Prior to May 1, 2016, Salient Real Estate Fund was known as Forward Real Estate Fund.
(b) The information for the fiscal year ended December 31, 2015 has been audited by KPMG LLP, independent registered public accounting firm. The information for prior periods has been audited by the predecessor independent registered public accounting firm.
(c) Per share amounts are based upon average shares outstanding.
| | | | |
| See accompanying Notes to Financial Statements. | | 55 | | |
Financial Highlights
For a share outstanding throughout the periods presented.
Salient Real Estate Fund(a)
| | | | | | | | | | | | | | | | | | | | |
| | | Institutional Class | |
| | | Year Ended
December 31,
2017 | | | Year Ended
December 31,
2016 | | | Year Ended
December 31,
2015(b) | | | Year Ended
December 31,
2014 | | | Year Ended
December 31,
2013 | |
Net Asset Value, Beginning of Period | | $ | 9.84 | | | $ | 12.06 | | | $ | 15.30 | | | $ | 13.06 | | | $ | 13.35 | |
Income/(Loss) from Operations: | |
Net investment income/(loss)(c) | | | 0.12 | | | | (0.00 | )(d) | | | 0.19 | | | | 0.21 | | | | 0.18 | |
Net realized and unrealized gain/(loss) on investments | | | (0.48 | ) | | | 1.48 | | | | (0.04 | ) | | | 3.51 | | | | 0.20 | |
| | | | | | | | | | | | | | | | | | | | |
Total from Investment Operations | | | (0.36 | ) | | | 1.48 | | | | 0.15 | | | | 3.72 | | | | 0.38 | |
| | | | | | | | | | | | | | | | | | | | |
Less Distributions: | | | | | | | | | | | | | | | | | | | | |
From investment income | | | (0.15 | ) | | | (0.02 | ) | | | (0.21 | ) | | | (0.24 | ) | | | (0.17 | ) |
From capital gains | | | (0.60 | ) | | | (3.68 | ) | | | (3.18 | ) | | | (1.24 | ) | | | (0.50 | ) |
| | | | | | | | | | | | | | | | | | | | |
Total Distributions | | | (0.75 | ) | | | (3.70 | ) | | | (3.39 | ) | | | (1.48 | ) | | | (0.67 | ) |
| | | | | | | | | | | | | | | | | | | | |
Net Increase/(Decrease) in Net Asset Value | | | (1.11 | ) | | | (2.22 | ) | | | (3.24 | ) | | | 2.24 | | | | (0.29 | ) |
| | | | | | | | | | | | | | | | | | | | |
Net Asset Value, End of Period | | $ | 8.73 | | | $ | 9.84 | | | $ | 12.06 | | | $ | 15.30 | | | $ | 13.06 | |
| | | | | | | | | | | | | | | | | | | | |
Total Return | | | (3.63 | )% | | | 12.44 | % | | | 1.39 | % | | | 28.77 | % | | | 2.81 | % |
Ratios/Supplemental Data: | |
Net assets, End of Period (in 000s) | | $ | 3,429 | | | $ | 5,790 | | | $ | 6,954 | | | $ | 9,065 | | | $ | 9,625 | |
Ratios to Average Net Assets: | | | | | | | | | | | | | | | | | | | | |
Net investment income/(loss) | | | 1.28 | % | | | (0.03 | )% | | | 1.27 | % | | | 1.42 | % | | | 1.30 | % |
Operating expenses | | | 1.61 | % | | | 1.53 | % | | | 1.35 | % | | | 1.22 | % | | | 1.28 | % |
Portfolio Turnover Rate | | | 60 | % | | | 81 | % | | | 88 | % | | | 85 | % | | | 58 | % |
(a) Prior to May 1, 2016, Salient Real Estate Fund was known as Forward Real Estate Fund.
(b) The information for the fiscal year ended December 31, 2015 has been audited by KPMG LLP, independent registered public accounting firm. The information for prior periods has been audited by the predecessor independent registered public accounting firm.
(c) Per share amounts are based upon average shares outstanding.
(d) Amount represents less than $0.01 per share.
| | | | |
| See accompanying Notes to Financial Statements. | | 56 | | |
Financial Highlights
For a share outstanding throughout the periods presented.
Salient Real Estate Fund(a)
| | | | | | | | | | | | | | | | | | | | |
| | | Class A | |
| | | Year Ended
December 31,
2017 | | | Year Ended
December 31,
2016 | | | Year Ended
December 31,
2015(b) | | | Year Ended
December 31,
2014 | | | Year Ended
December 31,
2013 | |
Net Asset Value, Beginning of Period | | $ | 12.10 | | | $ | 14.07 | | | $ | 17.29 | | | $ | 14.61 | | | $ | 14.85 | |
Income/(Loss) from Operations: | |
Net investment income/(loss)(c) | | | 0.12 | | | | (0.04 | ) | | | 0.14 | | | | 0.17 | | | | 0.11 | |
Net realized and unrealized gain/(loss) on investments | | | (0.61 | ) | | | 1.71 | | | | (0.04 | ) | | | 3.92 | | | | 0.26 | |
| | | | | | | | | | | | | | | | | | | | |
Total from Investment Operations | | | (0.49 | ) | | | 1.67 | | | | 0.10 | | | | 4.09 | | | | 0.37 | |
| | | | | | | | | | | | | | | | | | | | |
Less Distributions: | | | | | | | | | | | | | | | | | | | | |
From investment income | | | (0.12 | ) | | | (0.01 | ) | | | (0.14 | ) | | | (0.17 | ) | | | (0.11 | ) |
From capital gains | | | (0.58 | ) | | | (3.63 | ) | | | (3.18 | ) | | | (1.24 | ) | | | (0.50 | ) |
| | | | | | | | | | | | | | | | | | | | |
Total Distributions | | | (0.70 | ) | | | (3.64 | ) | | | (3.32 | ) | | | (1.41 | ) | | | (0.61 | ) |
| | | | | | | | | | | | | | | | | | | | |
Net Increase/(Decrease) in Net Asset Value | | | (1.19 | ) | | | (1.97 | ) | | | (3.22 | ) | | | 2.68 | | | | (0.24 | ) |
| | | | | | | | | | | | | | | | | | | | |
Net Asset Value, End of Period | | $ | 10.91 | | | $ | 12.10 | | | $ | 14.07 | | | $ | 17.29 | | | $ | 14.61 | |
| | | | | | | | | | | | | | | | | | | | |
Total Return(d) | | | (4.02 | )% | | | 12.00 | % | | | 0.87 | % | | | 28.29 | % | | | 2.44 | % |
Ratios/Supplemental Data: | |
Net assets, End of Period (in 000s) | | $ | 3,817 | | | $ | 4,859 | | | $ | 5,653 | | | $ | 6,846 | | | $ | 6,351 | |
Ratios to Average Net Assets: | | | | | | | | | | | | | | | | | | | | |
Net investment income/(loss) | | | 0.99 | % | | | (0.25 | )% | | | 0.82 | % | | | 1.00 | % | | | 0.69 | % |
Operating expenses | | | 2.02 | % | | | 1.92 | % | | | 1.76 | % | | | 1.63 | % | | | 1.66 | % |
Portfolio Turnover Rate | | | 60 | % | | | 81 | % | | | 88 | % | | | 85 | % | | | 58 | % |
(a) Prior to May 1, 2016, Salient Real Estate Fund was known as Forward Real Estate Fund.
(b) The information for the fiscal year ended December 31, 2015 has been audited by KPMG LLP, independent registered public accounting firm. The information for prior periods has been audited by the predecessor independent registered public accounting firm.
(c) Per share amounts are based upon average shares outstanding.
(d) Total return does not reflect the effect of sales charges.
| | | | |
| See accompanying Notes to Financial Statements. | | 57 | | |
Financial Highlights
For a share outstanding throughout the periods presented.
Salient Real Estate Fund(a)
| | | | | | | | | | | | | | | | | | | | |
| | | Class C | |
| | | Year Ended
December 31,
2017 | | | Year Ended
December 31,
2016 | | | Year Ended
December 31,
2015(b) | | | Year Ended
December 31,
2014 | | | Year Ended
December 31,
2013 | |
Net Asset Value, Beginning of Period | | $ | 12.25 | | | $ | 14.21 | | | $ | 17.44 | | | $ | 14.73 | | | $ | 14.99 | |
Income/(Loss) from Operations: | |
Net investment income/(loss)(c) | | | 0.04 | | | | (0.12 | ) | | | 0.05 | | | | 0.12 | | | | 0.02 | |
Net realized and unrealized gain/(loss) on investments | | | (0.59 | ) | | | 1.72 | | | | (0.04 | ) | | | 3.92 | | | | 0.25 | |
| | | | | | | | | | | | | | | | | | | | |
Total from Investment Operations | | | (0.55 | ) | | | 1.60 | | | | 0.01 | | | | 4.04 | | | | 0.27 | |
| | | | | | | | | | | | | | | | | | | | |
Less Distributions: | | | | | | | | | | | | | | | | | | | | |
From investment income | | | (0.08 | ) | | | — | | | | (0.06 | ) | | | (0.09 | ) | | | (0.03 | ) |
From capital gains | | | (0.55 | ) | | | (3.56 | ) | | | (3.18 | ) | | | (1.24 | ) | | | (0.50 | ) |
| | | | | | | | | | | | | | | | | | | | |
Total Distributions | | | (0.63 | ) | | | (3.56 | ) | | | (3.24 | ) | | | (1.33 | ) | | | (0.53 | ) |
| | | | | | | | | | | | | | | | | | | | |
Net Increase/(Decrease) in Net Asset Value | | | (1.18 | ) | | | (1.96 | ) | | | (3.23 | ) | | | 2.71 | | | | (0.26 | ) |
| | | | | | | | | | | | | | | | | | | | |
Net Asset Value, End of Period | | $ | 11.07 | | | $ | 12.25 | | | $ | 14.21 | | | $ | 17.44 | | | $ | 14.73 | |
| | | | | | | | | | | | | | | | | | | | |
Total Return(d) | | | (4.46 | )% | | | 11.34 | % | | | 0.36 | % | | | 27.57 | % | | | 1.79 | % |
Ratios/Supplemental Data: | |
Net assets, End of Period (in 000s) | | $ | 1,440 | | | $ | 2,619 | | | $ | 3,135 | | | $ | 3,644 | | | $ | 2,117 | |
Ratios to Average Net Assets: | | | | | | | | | | | | | | | | | | | | |
Net investment income/(loss) | | | 0.34 | % | | | (0.81 | )% | | | 0.27 | % | | | 0.71 | % | | | 0.13 | % |
Operating expenses | | | 2.56 | % | | | 2.47 | % | | | 2.31 | % | | | 2.19 | % | | | 2.23 | % |
Portfolio Turnover Rate | | | 60 | % | | | 81 | % | | | 88 | % | | | 85 | % | | | 58 | % |
(a) Prior to May 1, 2016, Salient Real Estate Fund was known as Forward Real Estate Fund.
(b) The information for the fiscal year ended December 31, 2015 has been audited by KPMG LLP, independent registered public accounting firm. The information for prior periods has been audited by the predecessor independent registered public accounting firm.
(c) Per share amounts are based upon average shares outstanding.
(d) Total return does not reflect the effect of sales charges.
| | | | |
| See accompanying Notes to Financial Statements. | | 58 | | |
Financial Highlights
For a share outstanding throughout the periods presented.
Salient Select Income Fund(a)
| | | | | | | | | | | | | | | | | | | | |
| | | Investor Class | |
| | | Year Ended
December 31,
2017 | | | Year Ended
December 31,
2016 | | | Year Ended
December 31,
2015(b) | | | Year Ended
December 31,
2014 | | | Year Ended
December 31,
2013 | |
Net Asset Value, Beginning of Period | | $ | 23.79 | | | $ | 22.34 | | | $ | 25.40 | | | $ | 23.50 | | | $ | 24.38 | |
Income/(Loss) from Operations: | |
Net investment income(c) | | | 0.55 | | | | 0.52 | | | | 0.72 | | | | 0.75 | | | | 1.01 | |
Net realized and unrealized gain/(loss) on investments | | | (0.21 | ) | | | 2.47 | | | | (1.01 | ) | | | 3.12 | | | | 0.05 | |
| | | | | | | | | | | | | | | | | | | | |
Total from Investment Operations | | | 0.34 | | | | 2.99 | | | | (0.29 | ) | | | 3.87 | | | | 1.06 | |
| | | | | | | | | | | | | | | | | | | | |
Less Distributions: | | | | | | | | | | | | | | | | | | | | |
From investment income | | | (0.63 | ) | | | (0.53 | ) | | | (0.75 | ) | | | (0.75 | ) | | | (1.11 | ) |
From capital gains | | | (1.40 | ) | | | (1.01 | ) | | | (1.98 | ) | | | (1.22 | ) | | | (0.83 | ) |
From return of capital | | | — | | | | — | | | | (0.04 | ) | | | — | | | | — | |
| | | | | | | | | | | | | | | | | | | | |
Total Distributions | | | (2.03 | ) | | | (1.54 | ) | | | (2.77 | ) | | | (1.97 | ) | | | (1.94 | ) |
| | | | | | | | | | | | | | | | | | | | |
Net Increase/(Decrease) in Net Asset Value | | | (1.69 | ) | | | 1.45 | | | | (3.06 | ) | | | 1.90 | | | | (0.88 | ) |
| | | | | | | | | | | | | | | | | | | | |
Net Asset Value, End of Period | | $ | 22.10 | | | $ | 23.79 | | | $ | 22.34 | | | $ | 25.40 | | | $ | 23.50 | |
| | | | | | | | | | | | | | | | | | | | |
Total Return | | | 1.44 | % | | | 13.66 | % | | | (1.09 | )% | | | 16.75 | % | | | 4.33 | % |
Ratios/Supplemental Data: | |
Net assets, End of Period (in 000s) | | $ | 28,030 | | | $ | 82,206 | | | $ | 76,217 | | | $ | 115,091 | | | $ | 98,756 | |
Ratios to Average Net Assets (excluding interest and dividends on short sales expense): | | | | | | | | | | | | | | | | | | | | |
Net investment income | | | 2.73 | % | | | 2.84 | % | | | 3.26 | % | | | 3.21 | % | | | 4.20 | % |
Operating expenses | | | 1.73 | % | | | 1.70 | % | | | 1.62 | % | | | 1.61 | % | | | 1.60 | % |
Ratios to Average Net Assets (including interest and dividends on short sales expense): | | | | | | | | | | | | | | | | | | | | |
Net investment income | | | 2.34 | % | | | 2.24 | % | | | 2.83 | % | | | 2.99 | % | | | 4.04 | % |
Operating expenses | | | 2.12 | % | | | 2.30 | % | | | 2.05 | % | | | 1.83 | % | | | 1.75 | % |
Portfolio Turnover Rate | | | 45 | % | | | 46 | % | | | 39 | % | | | 32 | % | | | 50 | % |
(a) Prior to May 1, 2016, Salient Select Income Fund was known as Forward Select Income Fund.
(b) The information for the fiscal year ended December 31, 2015 has been audited by KPMG LLP, independent registered public accounting firm. The information for prior periods has been audited by the predecessor independent registered public accounting firm.
(c) Per share amounts are based upon average shares outstanding.
| | | | |
| See accompanying Notes to Financial Statements. | | 59 | | |
Financial Highlights
For a share outstanding throughout the periods presented.
Salient Select Income Fund(a)
| | | | | | | | | | | | | | | | | | | | |
| | | Institutional Class | |
| | | Year Ended
December 31,
2017 | | | Year Ended
December 31,
2016 | | | Year Ended
December 31,
2015(b) | | | Year Ended
December 31,
2014 | | | Year Ended
December 31,
2013 | |
Net Asset Value, Beginning of Period | | $ | 23.82 | | | $ | 22.36 | | | $ | 25.43 | | | $ | 23.53 | | | $ | 24.40 | |
Income/(Loss) from Operations: | |
Net investment income(c) | | | 0.71 | | | | 0.62 | | | | 0.81 | | | | 0.85 | | | | 1.01 | |
Net realized and unrealized gain/(loss) on investments | | | (0.27 | ) | | | 2.46 | | | | (1.01 | ) | | | 3.11 | | | | 0.14 | |
| | | | | | | | | | | | | | | | | | | | |
Total from Investment Operations | | | 0.44 | | | | 3.08 | | | | (0.20 | ) | | | 3.96 | | | | 1.15 | |
| | | | | | | | | | | | | | | | | | | | |
Less Distributions: | | | | | | | | | | | | | | | | | | | | |
From investment income | | | (0.70 | ) | | | (0.59 | ) | | | (0.82 | ) | | | (0.84 | ) | | | (1.17 | ) |
From capital gains | | | (1.43 | ) | | | (1.03 | ) | | | (2.01 | ) | | | (1.22 | ) | | | (0.85 | ) |
From return of capital | | | — | | | | — | | | | (0.04 | ) | | | — | | | | — | |
| | | | | | | | | | | | | | | | | | | | |
Total Distributions | | | (2.13 | ) | | | (1.62 | ) | | | (2.87 | ) | | | (2.06 | ) | | | (2.02 | ) |
| | | | | | | | | | | | | | | | | | | | |
Net Increase/(Decrease) in Net Asset Value | | | (1.69 | ) | | | 1.46 | | | | (3.07 | ) | | | 1.90 | | | | (0.87 | ) |
| | | | | | | | | | | | | | | | | | | | |
Net Asset Value, End of Period | | $ | 22.13 | | | $ | 23.82 | | | $ | 22.36 | | | $ | 25.43 | | | $ | 23.53 | |
| | | | | | | | | | | | | | | | | | | | |
Total Return | | | 1.84 | % | | | 14.09 | % | | | (0.75 | )% | | | 17.16 | % | | | 4.71 | % |
| Ratios/Supplemental Data: | |
Net assets, End of Period (in 000s) | | $ | 358,846 | | | $ | 358,059 | | | $ | 334,705 | | | $ | 637,666 | | | $ | 494,495 | |
Ratios to Average Net Assets (excluding interest and dividends on short sales expense): | | | | | | | | | | | | | | | | | | | | |
Net investment income | | | 3.41 | % | | | 3.24 | % | | | 3.62 | % | | | 3.59 | % | | | 4.18 | % |
Operating expenses | | | 1.37 | % | | | 1.35 | % | | | 1.27 | % | | | 1.26 | % | | | 1.22 | % |
Ratios to Average Net Assets (including interest and dividends on short sales expense): | | | | | | | | | | | | | | | | | | | | |
Net investment income | | | 3.02 | % | | | 2.64 | % | | | 3.19 | % | | | 3.37 | % | | | 4.02 | % |
Operating expenses | | | 1.76 | % | | | 1.95 | % | | | 1.70 | % | | | 1.48 | % | | | 1.37 | % |
Portfolio Turnover Rate | | | 45 | % | | | 46 | % | | | 39 | % | | | 32 | % | | | 50 | % |
(a) Prior to May 1, 2016, Salient Select Income Fund was known as Forward Select Income Fund.
(b) The information for the fiscal year ended December 31, 2015 has been audited by KPMG LLP, independent registered public accounting firm. The information for prior periods has been audited by the predecessor independent registered public accounting firm.
(c) Per share amounts are based upon average shares outstanding.
| | | | |
| See accompanying Notes to Financial Statements. | | 60 | | |
Financial Highlights
For a share outstanding throughout the periods presented.
Salient Select Income Fund(a)
| | | | | | | | | | | | | | | | | | | | |
| | | Class A | |
| | | Year Ended
December 31,
2017 | | | Year Ended
December 31,
2016 | | | Year Ended
December 31,
2015(b) | | | Year Ended
December 31,
2014 | | | Year Ended
December 31,
2013 | |
Net Asset Value, Beginning of Period | | $ | 23.87 | | | $ | 22.41 | | | $ | 25.47 | | | $ | 23.56 | | | $ | 24.43 | |
Income/(Loss) from Operations: | |
Net investment income(c) | | | 0.60 | | | | 0.52 | | | | 0.73 | | | | 0.75 | | | | 0.92 | |
Net realized and unrealized gain/(loss) on investments | | | (0.26 | ) | | | 2.47 | | | | (1.03 | ) | | | 3.12 | | | | 0.12 | |
| | | | | | | | | | | | | | | | | | | | |
Total from Investment Operations | | | 0.34 | | | | 2.99 | | | | (0.30 | ) | | | 3.87 | | | | 1.04 | |
| | | | | | | | | | | | | | | | | | | | |
| Less Distributions: | | | | | | | | | | | | | | | | | | | | |
From investment income | | | (0.63 | ) | | | (0.52 | ) | | | (0.74 | ) | | | (0.74 | ) | | | (1.08 | ) |
From capital gains | | | (1.40 | ) | | | (1.01 | ) | | | (1.98 | ) | | | (1.22 | ) | | | (0.83 | ) |
From return of capital | | | — | | | | — | | | | (0.04 | ) | | | — | | | | — | |
| | | | | | | | | | | | | | | | | | | | |
Total Distributions | | | (2.03 | ) | | | (1.53 | ) | | | (2.76 | ) | | | (1.96 | ) | | | (1.91 | ) |
| | | | | | | | | | | | | | | | | | | | |
Net Increase/(Decrease) in Net Asset Value | | | (1.69 | ) | | | 1.46 | | | | (3.06 | ) | | | 1.91 | | | | (0.87 | ) |
| | | | | | | | | | | | | | | | | | | | |
Net Asset Value, End of Period | | $ | 22.18 | | | $ | 23.87 | | | $ | 22.41 | | | $ | 25.47 | | | $ | 23.56 | |
| | | | | | | | | | | | | | | | | | | | |
Total Return(d) | | | 1.46 | % | | | 13.56 | % | | | (1.12 | )% | | | 16.72 | % | | | 4.26 | % |
Ratios/Supplemental Data: | |
Net assets, End of Period (in 000s) | | $ | 265,122 | | | $ | 414,748 | | | $ | 431,167 | | | $ | 676,775 | | | $ | 540,264 | |
Ratios to Average Net Assets (excluding interest and dividends on short sales expense): | | | | | | | | | | | | | | | | | | | | |
Net investment income | | | 2.90 | % | | | 2.83 | % | | | 3.31 | % | | | 3.17 | % | | | 3.79 | % |
Operating expenses | | | 1.78 | % | | | 1.75 | % | | | 1.68 | % | | | 1.66 | % | | | 1.62 | % |
Ratios to Average Net Assets (including interest and dividends on short sales expense): | | | | | | | | | | | | | | | | | | | | |
Net investment income | | | 2.51 | % | | | 2.23 | % | | | 2.88 | % | | | 2.95 | % | | | 3.63 | % |
Operating expenses | | | 2.17 | % | | | 2.35 | % | | | 2.11 | % | | | 1.88 | % | | | 1.77 | % |
Portfolio Turnover Rate | | | 45 | % | | | 46 | % | | | 39 | % | | | 32 | % | | | 50 | % |
(a) Prior to May 1, 2016, Salient Select Income Fund was known as Forward Select Income Fund.
(b) The information for the fiscal year ended December 31, 2015 has been audited by KPMG LLP, independent registered public accounting firm. The information for prior periods has been audited by the predecessor independent registered public accounting firm.
(c) Per share amounts are based upon average shares outstanding.
(d) Total return does not reflect the effect of sales charges.
| | | | |
| See accompanying Notes to Financial Statements. | | 61 | | |
Financial Highlights
For a share outstanding throughout the periods presented.
Salient Select Income Fund(a)
| | | | | | | | | | | | | | | | | | | | |
| | | Class C | |
| | | Year Ended
December 31,
2017 | | | Year Ended
December 31,
2016 | | | Year Ended
December 31,
2015(b) | | | Year Ended
December 31,
2014 | | | Year Ended
December 31,
2013 | |
Net Asset Value, Beginning of Period | | $ | 23.25 | | | $ | 21.87 | | | $ | 24.93 | | | $ | 23.10 | | | $ | 23.99 | |
Income/(Loss) from Operations: | | | | | | | | | | | | | | | | | | | | |
Net investment income(c) | | | 0.47 | | | | 0.38 | | | | 0.62 | | | | 0.59 | | | | 0.78 | |
Net realized and unrealized gain/(loss) on investments | | | (0.27 | ) | | | 2.40 | | | | (1.05 | ) | | | 3.06 | | | | 0.11 | |
| | | | | | | | | | | | | | | | | | | | |
Total from Investment Operations | | | 0.20 | | | | 2.78 | | | | (0.43 | ) | | | 3.65 | | | | 0.89 | |
| | | | | | | | | | | | | | | | | | | | |
Less Distributions: | | | | | | | | | | | | | | | | | | | | |
From investment income | | | (0.54 | ) | | | (0.43 | ) | | | (0.65 | ) | | | (0.60 | ) | | | (0.98 | ) |
From capital gains | | | (1.36 | ) | | | (0.97 | ) | | | (1.95 | ) | | | (1.22 | ) | | | (0.80 | ) |
From return of capital | | | — | | | | — | | | | (0.03 | ) | | | — | | | | — | |
| | | | | | | | | | | | | | | | | | | | |
Total Distributions | | | (1.90 | ) | | | (1.40 | ) | | | (2.63 | ) | | | (1.82 | ) | | | (1.78 | ) |
| | | | | | | | | | | | | | | | | | | | |
Net Increase/(Decrease) in Net Asset Value | | | (1.70 | ) | | | 1.38 | | | | (3.06 | ) | | | 1.83 | | | | (0.89 | ) |
| | | | | | | | | | | | | | | | | | | | |
Net Asset Value, End of Period | | $ | 21.55 | | | $ | 23.25 | | | $ | 21.87 | | | $ | 24.93 | | | $ | 23.10 | |
| | | | | | | | | | | | | | | | | | | | |
Total Return(d) | | | 0.87 | % | | | 12.96 | % | | | (1.67 | )% | | | 16.07 | % | | | 3.68 | % |
Ratios/Supplemental Data: | | | | | | | | | | | | | | | | | | | | |
Net assets, End of Period (in 000s) | | $ | 166,857 | | | $ | 207,758 | | | $ | 227,301 | | | $ | 271,510 | | | $ | 264,263 | |
Ratios to Average Net Assets (excluding interest and dividends on short sales expense): | | | | | | | | | | | | | | | | | | | | |
Net investment income | | | 2.42 | % | | | 2.28 | % | | | 2.94 | % | | | 2.61 | % | | | 3.31 | % |
Operating expenses | | | 2.33 | % | | | 2.30 | % | | | 2.23 | % | | | 2.20 | % | | | 2.19 | % |
Ratios to Average Net Assets (including interest and dividends on short sales expense): | | | | | | | | | | | | | | | | | | | | |
Net investment income | | | 2.03 | % | | | 1.68 | % | | | 2.51 | % | | | 2.39 | % | | | 3.16 | % |
Operating expenses | | | 2.72 | % | | | 2.90 | % | | | 2.66 | % | | | 2.42 | % | | | 2.34 | % |
Portfolio Turnover Rate | | | 45 | % | | | 46 | % | | | 39 | % | | | 32 | % | | | 50 | % |
(a) Prior to May 1, 2016, Salient Select Income Fund was known as Forward Select Income Fund.
(b) The information for the fiscal year ended December 31, 2015 has been audited by KPMG LLP, independent registered public accounting firm. The information for prior periods has been audited by the predecessor independent registered public accounting firm.
(c) Per share amounts are based upon average shares outstanding.
(d) Total return does not reflect the effect of sales charges.
| | | | |
| See accompanying Notes to Financial Statements. | | 62 | | |
Financial Highlights
For a share outstanding throughout the periods presented.
Salient Select Opportunity Fund(a)
| | | | | | | | | | | | | | | | |
| | | Investor Class(b) | |
| | | Year Ended
December 31,
2017 | | | Year Ended
December 31,
2016 | | | Year Ended
December 31,
2015(c) | | | Period Ended
December 31,
2014 | |
Net Asset Value, Beginning of Period | | $ | 24.06 | | | $ | 21.39 | | | $ | 24.84 | | | $ | 28.86 | |
Income/(Loss) from Operations: | | | | | | | | | | | | | | | | |
Net investment income(d) | | | 0.07 | | | | 0.46 | | | | 0.58 | | | | 0.46 | |
Net realized and unrealized gain/(loss) on investments | | | 1.28 | | | | 2.90 | | | | (3.33 | ) | | | (1.52 | )(e) |
| | | | | | | | | | | | | | | | |
Total from Investment Operations | | | 1.35 | | | | 3.36 | | | | (2.75 | ) | | | (1.06 | ) |
| | | | | | | | | | | | | | | | |
Less Distributions: | | | | | | | | | | | | | | | | |
From investment income | | | (0.10 | ) | | | (0.49 | ) | | | (0.62 | ) | | | (0.54 | ) |
From capital gains | | | — | | | | — | | | | — | | | | (2.42 | ) |
From return of capital | | | (0.51 | ) | | | (0.20 | ) | | | (0.08 | ) | | | – | |
| | | | | | | | | | | | | | | | |
Total Distributions | | | (0.61 | ) | | | (0.69 | ) | | | (0.70 | ) | | | (2.96 | ) |
| | | | | | | | | | | | | | | | |
Net Increase/(Decrease) in Net Asset Value | | | 0.74 | | | | 2.67 | | | | (3.45 | ) | | | (4.02 | ) |
| | | | | | | | | | | | | | | | |
Net Asset Value, End of Period | | $ | 24.80 | | | $ | 24.06 | | | $ | 21.39 | | | $ | 24.84 | |
| | | | | | | | | | | | | | | | |
Total Return | | | 5.66 | % | | | 16.30 | % | | | (11.30 | )% | | | (3.65 | )%(f) |
Ratios/Supplemental Data: | | | | | | | | | | | | | | | | |
Net assets, End of Period (in 000s) | | $ | 625 | | | $ | 772 | | | $ | 770 | | | $ | 1,013 | |
Ratios to Average Net Assets (excluding interest expense): | | | | | | | | | | | | | | | | |
Net investment income | | | 0.52 | % | | | 2.39 | % | | | 2.49 | % | | | 2.06 | %(g) |
Operating expenses including reimbursement/waiver | | | 1.58 | % | | | 1.58 | % | | | 1.58 | % | | | 1.58 | %(g) |
Operating expenses excluding reimbursement/waiver | | | 2.89 | % | | | 2.64 | % | | | 2.06 | % | | | 2.02 | %(g) |
Ratios to Average Net Assets (including interest expense): | | | | | | | | | | | | | | | | |
Net investment income including reimbursement/waiver | | | 0.29 | % | | | 2.22 | % | | | 2.36 | % | | | 2.00 | %(g) |
Operating expenses including reimbursement/waiver | | | 1.81 | % | | | 1.75 | % | | | 1.71 | % | | | 1.64 | %(g) |
Operating expenses excluding reimbursement/waiver | | | 3.12 | % | | | 2.81 | % | | | 2.19 | % | | | 2.08 | %(g) |
Portfolio Turnover Rate | | | 57 | % | | | 30 | % | | | 104 | % | | | 181 | %(h) |
(a) Prior to May 1, 2016, Salient Select Opportunity Fund was known as Forward Select Opportunity Fund.
(b) The Fund began offering Investor Class shares on June 2, 2014.
(c) The information for the fiscal year ended December 31, 2015 has been audited by KPMG LLP, independent registered public accounting firm. The information for prior periods has been audited by the predecessor independent registered public accounting firm.
(d) Per share amounts are based upon average shares outstanding.
(e) The amount shown for a share outstanding throughout the period may not correlate with the Statement of Operations for the period due to the timing of sales and redemptions of Fund shares in relation to income earned and/or fluctuating market value of the investments of the Fund.
(f) Not Annualized.
(g) Annualized.
(h) Portfolio turnover rate is calculated at the Fund level and represents the year ended December 31, 2014.
| | | | |
| See accompanying Notes to Financial Statements. | | 63 | | |
Financial Highlights
For a share outstanding throughout the periods presented.
Salient Select Opportunity Fund(a)
| | | | | | | | | | | | | | | | | | | | |
| | | Institutional Class | |
| | | Year Ended
December 31,
2017 | | | Year Ended
December 31,
2016 | | | Year Ended
December 31,
2015(b) | | | Year Ended
December 31,
2014 | | | Period Ended
December 31,
2013 | |
Net Asset Value, Beginning of Period | | $ | 24.04 | | | $ | 21.38 | | | $ | 24.83 | | | $ | 26.06 | | | $ | 25.00 | |
Income/(Loss) from Operations: | | | | | | | | | | | | | | | | | | | | |
Net investment income(c) | | | 0.17 | | | | 0.52 | | | | 0.66 | | | | 0.53 | | | | 0.13 | |
Net realized and unrealized gain/(loss) on investments | | | 1.27 | | | | 2.91 | | | | (3.33 | ) | | | 1.40 | | | | 1.16 | |
| | | | | | | | | | | | | | | | | | | | |
Total from Investment Operations | | | 1.44 | | | | 3.43 | | | | (2.67 | ) | | | 1.93 | | | | 1.29 | |
| | | | | | | | | | | | | | | | | | | | |
Less Distributions: | | | | | | | | | | | | | | | | | | | | |
From investment income | | | (0.11 | ) | | | (0.54 | ) | | | (0.70 | ) | | | (0.74 | ) | | | (0.11 | ) |
From capital gains | | | — | | | | — | | | | — | | | | (2.42 | ) | | | (0.12 | ) |
From return of capital | | | (0.58 | ) | | | (0.23 | ) | | | (0.08 | ) | | | — | | | | — | |
| | | | | | | | | | | | | | | | | | | | |
Total Distributions | | | (0.69 | ) | | | (0.77 | ) | | | (0.78 | ) | | | (3.16 | ) | | | (0.23 | ) |
| | | | | | | | | | | | | | | | | | | | |
Net Increase/(Decrease) in Net Asset Value | | | 0.75 | | | | 2.66 | | | | (3.45 | ) | | | (1.23 | ) | | | 1.06 | |
| | | | | | | | | | | | | | | | | | | | |
Net Asset Value, End of Period | | $ | 24.79 | | | $ | 24.04 | | | $ | 21.38 | | | $ | 24.83 | | | $ | 26.06 | |
| | | | | | | | | | | | | | | | | | | | |
Total Return | | | 6.04 | % | | | 16.68 | % | | | (11.01 | )% | | | 7.43 | % | | | 5.19 | %(d) |
Ratios/Supplemental Data: | | | | | | | | | | | | | | | | | | | | |
Net assets, End of Period (in 000s) | | $ | 4,061 | | | $ | 3,993 | | | $ | 5,960 | | | $ | 6,046 | | | $ | 9,749 | |
Ratios to Average Net Assets (excluding interest expense): | | | | | | | | | | | | | | | | | | | | |
Net investment income | | | 0.93 | % | | | 2.69 | % | | | 2.83 | % | | | 1.96 | % | | | 1.26 | %(e) |
Operating expenses including reimbursement/waiver | | | 1.23 | % | | | 1.23 | % | | | 1.23 | % | | | 1.23 | % | | | 1.23 | %(e) |
Operating expenses excluding reimbursement/waiver | | | 2.54 | % | | | 2.28 | % | | | 1.71 | % | | | 1.59 | % | | | 2.29 | %(e) |
Ratios to Average Net Assets (including interest expense): | | | | | | | | | | | | | | | | | | | | |
Net investment income including reimbursement/waiver | | | 0.70 | % | | | 2.52 | % | | | 2.70 | % | | | 1.90 | % | | | n/a | |
Operating expenses including reimbursement/waiver | | | 1.46 | % | | | 1.40 | % | | | 1.36 | % | | | 1.29 | % | | | n/a | |
Operating expenses excluding reimbursement/waiver | | | 2.77 | % | | | 2.45 | % | | | 1.84 | % | | | 1.65 | % | | | n/a | |
Portfolio Turnover Rate | | | 57 | % | | | 30 | % | | | 104 | % | | | 181 | % | | | 46 | %(d) |
(a) Salient Select Opportunity Fund commenced operations on August 1, 2013. Prior to May 1, 2016, Salient Select Opportunity Fund was known as Forward Select Opportunity Fund. Prior to December 23, 2013, Forward Select Opportunity Fund was known as Forward Select Income Opportunity Fund.
(b) The information for the fiscal year ended December 31, 2015 has been audited by KPMG LLP, independent registered public accounting firm. The information for prior periods has been audited by the predecessor independent registered public accounting firm.
(c) Per share amounts are based upon average shares outstanding.
(d) Not Annualized.
(e) Annualized.
| | | | |
| See accompanying Notes to Financial Statements. | | 64 | | |
Financial Highlights
For a share outstanding throughout the periods presented.
Salient Select Opportunity Fund(a)
| | | | | | | | | | | | | | | | | | | | |
| | | Class A | |
| | | Year Ended
December 31,
2017 | | | Year Ended
December 31,
2016 | | | Year Ended
December 31,
2015(b) | | | Year Ended
December 31,
2014 | | | Period Ended
December 31,
2013 | |
Net Asset Value, Beginning of Period | | $ | 24.03 | | | $ | 21.38 | | | $ | 24.83 | | | $ | 26.05 | | | $ | 25.00 | |
Income/(Loss) from Operations: | | | | | | | | | | | | | | | | | | | | |
Net investment income(c) | | | 0.02 | | | | 0.46 | | | | 0.53 | | | | 0.41 | | | | 0.13 | |
Net realized and unrealized gain/(loss) on investments | | | 1.30 | | | | 2.86 | | | | (3.32 | ) | | | 1.38 | | | | 1.11 | |
| | | | | | | | | | | | | | | | | | | | |
Total from Investment Operations | | | 1.32 | | | | 3.32 | | | | (2.79 | ) | | | 1.79 | | | | 1.24 | |
| | | | | | | | | | | | | | | | | | | | |
Less Distributions: | | | | | | | | | | | | | | | | | | | | |
From investment income | | | (0.09 | ) | | | (0.47 | ) | | | (0.59 | ) | | | (0.59 | ) | | | (0.08 | ) |
From capital gains | | | — | | | | — | | | | — | | | | (2.42 | ) | | | (0.11 | ) |
From return of capital | | | (0.49 | ) | | | (0.20 | ) | | | (0.07 | ) | | | — | | | | — | |
| | | | | | | | | | | | | | | | | | | | |
Total Distributions | | | (0.58 | ) | | | (0.67 | ) | | | (0.66 | ) | | | (3.01 | ) | | | (0.19 | ) |
| | | | | | | | | | | | | | | | | | | | |
Net Increase/(Decrease) in Net Asset Value | | | 0.74 | | | | 2.65 | | | | (3.45 | ) | | | (1.22 | ) | | | 1.05 | |
| | | | | | | | | | | | | | | | | | | | |
Net Asset Value, End of Period | | $ | 24.77 | | | $ | 24.03 | | | $ | 21.38 | | | $ | 24.83 | | | $ | 26.05 | |
| | | | | | | | | | | | | | | | | | | | |
Total Return(d) | | | 5.51 | % | | | 16.08 | % | | | (11.45 | )% | | | 6.89 | % | | | 4.98 | %(e) |
Ratios/Supplemental Data: | | | | | | | | | | | | | | | | | | | | |
Net assets, End of Period (in 000s) | | $ | 2,993 | | | $ | 4,028 | | | $ | 6,822 | | | $ | 13,510 | | | $ | 14,521 | |
Ratios to Average Net Assets (excluding interest expense): | | | | | | | | | | | | | | | | | | | | |
Net investment income | | | 0.33 | % | | | 2.41 | % | | | 2.26 | % | | | 1.54 | % | | | 1.22 | %(f) |
Operating expenses including reimbursement/waiver | | | 1.73 | % | | | 1.73 | % | | | 1.73 | % | | | 1.73 | % | | | 1.73 | %(f) |
Operating expenses excluding reimbursement/waiver | | | 3.04 | % | | | 2.75 | % | | | 2.19 | % | | | 2.09 | % | | | 2.59 | %(f) |
Ratios to Average Net Assets (including interest expense): | | | | | | | | | | | | | | | | | | | | |
Net investment income including reimbursement/waiver | | | 0.10 | % | | | 2.24 | % | | | 2.13 | % | | | 1.48 | % | | | n/a | |
Operating expenses including reimbursement/waiver | | | 1.96 | % | | | 1.90 | % | | | 1.86 | % | | | 1.79 | % | | | n/a | |
Operating expenses excluding reimbursement/waiver | | | 3.27 | % | | | 2.92 | % | | | 2.32 | % | | | 2.15 | % | | | n/a | |
Portfolio Turnover Rate | | | 57 | % | | | 30 | % | | | 104 | % | | | 181 | % | | | 46 | %(e) |
(a) Salient Select Opportunity Fund commenced operations on August 1, 2013. Prior to May 1, 2016, Salient Select Opportunity Fund was known as Forward Select Opportunity Fund. Prior to December 23, 2013, Forward Select Opportunity Fund was known as Forward Select Income Opportunity Fund.
(b) The information for the fiscal year ended December 31, 2015 has been audited by KPMG LLP, independent registered public accounting firm. The information for prior periods has been audited by the predecessor independent registered public accounting firm.
(c) Per share amounts are based upon average shares outstanding.
(d) Total return does not reflect the effect of sales charges.
(e) Not Annualized.
(f) Annualized.
| | | | |
| See accompanying Notes to Financial Statements. | | 65 | | |
Financial Highlights
For a share outstanding throughout the periods presented.
Salient Select Opportunity Fund(a)
| | | | | | | | | | | | | | | | |
| | | Class C(b) | |
| | | Year Ended
December 31,
2017 | | | Year Ended
December 31,
2016 | | | Year Ended
December 31,
2015(c) | | | Period Ended
December 31, 2014 | |
Net Asset Value, Beginning of Period | | $ | 24.01 | | | $ | 21.36 | | | $ | 24.80 | | | $ | 27.11 | |
Income/(Loss) from Operations: | | | | | | | | | | | | | | | | |
Net investment income(d) | | | (0.12 | )(e) | | | 0.34 | | | | 0.47 | | | | 0.32 | |
Net realized and unrealized gain/(loss) on investments | | | 1.32 | | | | 2.87 | | | | (3.36 | ) | | | 0.30 | |
| | | | | | | | | | | | | | | | |
Total from Investment Operations | | | 1.20 | | | | 3.21 | | | | (2.89 | ) | | | 0.62 | |
| | | | | | | | | | | | | | | | |
Less Distributions: | | | | | | | | | | | | | | | | |
From investment income | | | (0.07 | ) | | | (0.39 | ) | | | (0.49 | ) | | | (0.51 | ) |
From capital gains | | | — | | | | — | | | | — | | | | (2.42 | ) |
From return of capital | | | (0.39 | ) | | | (0.17 | ) | | | (0.06 | ) | | | — | |
| | | | | | | | �� | | | | | | | | |
Total Distributions | | | (0.46 | ) | | | (0.56 | ) | | | (0.55 | ) | | | (2.93 | ) |
| | | | | | | | | | | | | | | | |
Net Increase/(Decrease) in Net Asset Value | | | 0.74 | | | | 2.65 | | | | (3.44 | ) | | | (2.31 | ) |
| | | | | | | | | | | | | | | | |
Net Asset Value, End of Period | | $ | 24.75 | | | $ | 24.01 | | | $ | 21.36 | | | $ | 24.80 | |
| | | | | | | | | | | | | | | | |
Total Return(f) | | | 5.02 | % | | | 15.53 | % | | | (11.84 | )% | | | 2.30 | %(g) |
Ratios/Supplemental Data: | | | | | | | | | | | | | | | | |
Net assets, End of Period (in 000s) | | $ | 309 | | | $ | 927 | | | $ | 2,807 | | | $ | 1,266 | |
Ratios to Average Net Assets (excluding interest expense): | | | | | | | | | | | | | | | | |
Net investment income | | | (0.24 | )% | | | 1.82 | % | | | 2.06 | % | | | 1.28 | %(h) |
Operating expenses including reimbursement/waiver | | | 2.18 | % | | | 2.18 | % | | | 2.18 | % | | | 2.18 | %(h) |
Operating expenses excluding reimbursement/waiver | | | 3.49 | % | | | 3.19 | % | | | 2.66 | % | | | 2.57 | %(h) |
Ratios to Average Net Assets (including interest expense): | | | | | | | | | | | | | | | | |
Net investment income including reimbursement/waiver | | | (0.47 | )% | | | 1.65 | % | | | 1.93 | % | | | 1.22 | %(h) |
Operating expenses including reimbursement/waiver | | | 2.41 | % | | | 2.35 | % | | | 2.31 | % | | | 2.24 | %(h) |
Operating expenses excluding reimbursement/waiver | | | 3.72 | % | | | 3.36 | % | | | 2.79 | % | | | 2.63 | %(h) |
Portfolio Turnover Rate | | | 57 | % | | | 30 | % | | | 104 | % | | | 181 | %(i) |
(a) Prior to May 1, 2016, Salient Select Opportunity Fund was known as Forward Select Opportunity Fund.
(b) The Fund began offering Class C shares on February 18, 2014.
(c) The information for the fiscal year ended December 31, 2015 has been audited by KPMG LLP, independent registered public accounting firm. The information for prior periods has been audited by the predecessor independent registered public accounting firm.
(d) Per share amounts are based upon average shares outstanding.
(e) The amount shown for a share outstanding throughout the period may not correlate with the Statement of Operations for the period due to the timing of sales and redemptions of Fund shares in relation to income earned and/or fluctuating market value of the investments of the Fund.
(f) Total return does not reflect the effect of sales charges.
(g) Not Annualized.
(h) Annualized.
(i) Portfolio turnover rate is calculated at the Fund level and represents the year ended December 31, 2014.
| | | | |
| See accompanying Notes to Financial Statements. | | 66 | | |
Financial Highlights
For a share outstanding throughout the periods presented.
Salient Tactical Real Estate Fund(a)
| | | | | | | | | | | | | | | | | | | | |
| | | Investor Class | |
| | | Year Ended
December 31,
2017 | | | Year Ended
December 31,
2016 | | | Year Ended
December 31,
2015(b) | | | Year Ended
December 31,
2014 | | | Year Ended
December 31,
2013 | |
Net Asset Value, Beginning of Period | | $ | 36.96 | | | $ | 32.55 | | | $ | 33.53 | | | $ | 27.29 | | | $ | 27.05 | |
Income/(Loss) from Operations: | | | | | | | | | | | | | | | | | | | | |
Net investment income/(loss)(c) | | | 0.17 | | | | (0.30 | ) | | | 0.38 | | | | 0.36 | | | | 0.24 | |
Net realized and unrealized gain/(loss) on investments | | | (2.08 | ) | | | 5.45 | | | | (0.97 | ) | | | 6.19 | | | | 0.40 | |
| | | | | | | | | | | | | | | | | | | | |
Total from Investment Operations | | | (1.91 | ) | | | 5.15 | | | | (0.59 | ) | | | 6.55 | | | | 0.64 | |
| | | | | | | | | | | | | | | | | | | | |
Less Distributions: | | | | | | | | | | | | | | | | | | | | |
From investment income | | | (0.22 | ) | | | (0.74 | ) | | | (0.39 | ) | | | (0.31 | ) | | | (0.40 | ) |
From return of capital | | | (0.86 | ) | | | — | | | | — | | | | — | | | | — | |
| | | | | | | | | | | | | | | | | | | | |
Total Distributions | | | (1.08 | ) | | | (0.74 | ) | | | (0.39 | ) | | | (0.31 | ) | | | (0.40 | ) |
| | | | | | | | | | | | | | | | | | | | |
Net Increase/(Decrease) in Net Asset Value | | | (2.99 | ) | | | 4.41 | | | | (0.98 | ) | | | 6.24 | | | | 0.24 | |
| | | | | | | | | | | | | | | | | | | | |
Net Asset Value, End of Period | | $ | 33.97 | | | $ | 36.96 | | | $ | 32.55 | | | $ | 33.53 | | | $ | 27.29 | |
| | | | | | | | | | | | | | | | | | | | |
Total Return | | | (5.23 | )% | | | 16.03 | % | | | (1.71 | )% | | | 24.01 | % | | | 2.37 | % |
Ratios/Supplemental Data: | | | | | | | | | | | | | | | | | | | | |
Net assets, End of Period (in 000s) | | $ | 1,232 | | | $ | 1,645 | | | $ | 1,139 | | | $ | 2,172 | | | $ | 736 | |
Ratios to Average Net Assets (excluding interest and dividends on short sales expense): | | | | | | | | | | | | | | | | | | | | |
Net investment income | | | 1.17 | % | | | 0.40 | % | | | 1.66 | % | | | 1.83 | % | | | 1.47 | % |
Operating expenses | | | 1.93 | % | | | 1.89 | % | | | 1.80 | % | | | 1.82 | % | | | 1.79 | % |
Ratios to Average Net Assets (including interest and dividends on short sales expense): | | | | | | | | | | | | | | | | | | | | |
Net investment income/(loss) | | | 0.47 | % | | | (0.87 | )% | | | 1.14 | % | | | 1.15 | % | | | 0.83 | % |
Operating expenses | | | 2.63 | % | | | 3.16 | % | | | 2.32 | % | | | 2.50 | % | | | 2.44 | % |
Portfolio Turnover Rate | | | 59 | % | | | 82 | % | | | 77 | % | | | 45 | % | | | 63 | % |
(a) Prior to May 1, 2016, Salient Tactical Real Estate Fund was known as Forward Real Estate Long/Short Fund.
(b) The information for the fiscal year ended December 31, 2015 has been audited by KPMG LLP, independent registered public accounting firm. The information for prior periods has been audited by the predecessor independent registered public accounting firm.
(c) Per share amounts are based upon average shares outstanding.
| | | | |
| See accompanying Notes to Financial Statements. | | 67 | | |
Financial Highlights
For a share outstanding throughout the periods presented.
Salient Tactical Real Estate Fund(a)
| | | | | | | | | | | | | | | | | | | | |
| | | Institutional Class | |
| | | Year Ended
December 31,
2017 | | | Year Ended
December 31,
2016 | | | Year Ended
December 31,
2015(b) | | | Year Ended
December 31,
2014 | | | Year Ended
December 31,
2013 | |
Net Asset Value, Beginning of Period | | $ | 38.15 | | | $ | 33.56 | | | $ | 34.55 | | | $ | 28.12 | | | $ | 27.87 | |
Income/(Loss) from Operations: | |
Net investment income/(loss)(c) | | | 0.31 | | | | (0.17 | ) | | | 0.66 | | | | 0.40 | | | | 0.38 | |
Net realized and unrealized gain/(loss) on investments | | | (2.16 | ) | | | 5.62 | | | | (1.15 | ) | | | 6.45 | | | | 0.39 | |
| | | | | | | | | | | | | | | | | | | | |
Total from Investment Operations | | | (1.85 | ) | | | 5.45 | | | | (0.49 | ) | | | 6.85 | | | | 0.77 | |
| | | | | | | | | | | | | | | | | | | | |
Less Distributions: | | | | | | | | | | | | | | | | | | | | |
From investment income | | | (0.24 | ) | | | (0.86 | ) | | | (0.50 | ) | | | (0.42 | ) | | | (0.52 | ) |
From return of capital | | | (0.96 | ) | | | — | | | | — | | | | — | | | | — | |
| | | | | | | | | | | | | | | | | | | | |
Total Distributions | | | (1.20 | ) | | | (0.86 | ) | | | (0.50 | ) | | | (0.42 | ) | | | (0.52 | ) |
| | | | | | | | | | | | | | | | | | | | |
Net Increase/(Decrease) in Net Asset Value | | | (3.05 | ) | | | 4.59 | | | | (0.99 | ) | | | 6.43 | | | | 0.25 | |
| | | | | | | | | | | | | | | | | | | | |
Net Asset Value, End of Period | | $ | 35.10 | | | $ | 38.15 | | | $ | 33.56 | | | $ | 34.55 | | | $ | 28.12 | |
| | | | | | | | | | | | | | | | | | | | |
Total Return | | | (4.88 | )% | | | 16.42 | % | | | (1.39 | )% | | | 24.44 | % | | | 2.73 | % |
Ratios/Supplemental Data: | |
Net assets, End of Period (in 000s) | | $ | 7,295 | | | $ | 25,601 | | | $ | 22,717 | | | $ | 14,217 | | | $ | 14,926 | |
Ratios to Average Net Assets (excluding interest and dividends on short sales expense): | | | | | | | | | | | | | | | | | | | | |
Net investment income | | | 1.53 | % | | | 0.79 | % | | | 2.44 | % | | | 1.95 | % | | | 1.93 | % |
Operating expenses | | | 1.57 | % | | | 1.54 | % | | | 1.45 | % | | | 1.46 | % | | | 1.42 | % |
Ratios to Average Net Assets (including interest and dividends on short sales expense): | | | | | | | | | | | | | | | | | | | | |
Net investment income/(loss) | | | 0.83 | % | | | (0.48 | )% | | | 1.92 | % | | | 1.27 | % | | | 1.29 | % |
Operating expenses | | | 2.27 | % | | | 2.81 | % | | | 1.97 | % | | | 2.14 | % | | | 2.07 | % |
Portfolio Turnover Rate | | | 59 | % | | | 82 | % | | | 77 | % | | | 45 | % | | | 63 | % |
(a) Prior to May 1, 2016, Salient Tactical Real Estate Fund was known as Forward Real Estate Long/Short Fund.
(b) The information for the fiscal year ended December 31, 2015 has been audited by KPMG LLP, independent registered public accounting firm. The information for prior periods has been audited by the predecessor independent registered public accounting firm.
(c) Per share amounts are based upon average shares outstanding.
| | | | |
| See accompanying Notes to Financial Statements. | | 68 | | |
Financial Highlights
For a share outstanding throughout the periods presented.
Salient Tactical Real Estate Fund(a)
| | | | | | | | | | | | | | | | | | | | |
| | | Class A | |
| | | Year Ended
December 31,
2017 | | | Year Ended
December 31,
2016 | | | Year Ended
December 31,
2015(b) | | | Year Ended
December 31,
2014 | | | Year Ended
December 31,
2013 | |
Net Asset Value, Beginning of Period | | $ | 37.02 | | | $ | 32.59 | | | $ | 33.59 | | | $ | 27.35 | | | $ | 27.12 | |
Income/(Loss) from Operations: | |
Net investment income/(loss)(c) | | | 0.19 | | | | (0.29 | ) | | | 0.42 | | | | 0.28 | | | | 0.23 | |
Net realized and unrealized gain/(loss) on investments | | | (2.13 | ) | | | 5.44 | | | | (1.02 | ) | | | 6.25 | | | | 0.40 | |
| | | | | | | | | | | | | | | | | | | | |
Total from Investment Operations | | | (1.94 | ) | | | 5.15 | | | | (0.60 | ) | | | 6.53 | | | | 0.63 | |
| | | | | | | | | | | | | | | | | | | | |
Less Distributions: | | | | | | | | | | | | | | | | | | | | |
From investment income | | | (0.21 | ) | | | (0.72 | ) | | | (0.40 | ) | | | (0.29 | ) | | | (0.40 | ) |
From return of capital | | | (0.85 | ) | | | — | | | | — | | | | — | | | | — | |
| | | | | | | | | | | | | | | | | | | | |
Total Distributions | | | (1.06 | ) | | | (0.72 | ) | | | (0.40 | ) | | | (0.29 | ) | | | (0.40 | ) |
| | | | | | | | | | | | | | | | | | | | |
Net Increase/(Decrease) in Net Asset Value | | | (3.00 | ) | | | 4.43 | | | | (1.00 | ) | | | 6.24 | | | | 0.23 | |
| | | | | | | | | | | | | | | | | | | | |
Net Asset Value, End of Period | | $ | 34.02 | | | $ | 37.02 | | | $ | 32.59 | | | $ | 33.59 | | | $ | 27.35 | |
| | | | | | | | | | | | | | | | | | | | |
Total Return(d) | | | (5.24 | )% | | | 15.95 | % | | | (1.78 | )% | | | 23.94 | % | | | 2.30 | % |
Ratios/Supplemental Data: | |
Net assets, End of Period (in 000s) | | $ | 20,603 | | | $ | 28,859 | | | $ | 31,179 | | | $ | 35,410 | | | $ | 30,582 | |
Ratios to Average Net Assets (excluding interest and dividends on short sales expense): | | | | | | | | | | | | | | | | | | | | |
Net investment income | | | 1.24 | % | | | 0.41 | % | | | 1.76 | % | | | 1.58 | % | | | 1.47 | % |
Operating expenses | | | 1.98 | % | | | 1.94 | % | | | 1.85 | % | | | 1.87 | % | | | 1.82 | % |
Ratios to Average Net Assets (including interest and dividends on short sales expense): | | | | | | | | | | | | | | | | | | | | |
Net investment income/(loss) | | | 0.54 | % | | | (0.86 | )% | | | 1.24 | % | | | 0.90 | % | | | 0.82 | % |
Operating expenses | | | 2.68 | % | | | 3.21 | % | | | 2.37 | % | | | 2.55 | % | | | 2.46 | % |
Portfolio Turnover Rate | | | 59 | % | | | 82 | % | | | 77 | % | | | 45 | % | | | 63 | % |
(a) Prior to May 1, 2016, Salient Tactical Real Estate Fund was known as Forward Real Estate Long/Short Fund.
(b) The information for the fiscal year ended December 31, 2015 has been audited by KPMG LLP, independent registered public accounting firm. The information for prior periods has been audited by the predecessor independent registered public accounting firm.
(c) Per share amounts are based upon average shares outstanding.
(d) Total return does not reflect the effect of sales charges.
| | | | |
| See accompanying Notes to Financial Statements. | | 69 | | |
Financial Highlights
For a share outstanding throughout the periods presented.
Salient Tactical Real Estate Fund(a)
| | | | | | | | | | | | | | | | | | | | |
| | | Class C | |
| | | Year Ended
December 31,
2017 | | | Year Ended
December 31,
2016 | | | Year Ended
December 31,
2015(b) | | | Year Ended
December 31,
2014 | | | Year Ended
December 31,
2013 | |
Net Asset Value, Beginning of Period | | $ | 36.67 | | | $ | 32.28 | | | $ | 33.32 | | | $ | 27.14 | | | $ | 26.93 | |
Income/(Loss) from Operations: | |
Net investment income/(loss)(c) | | | (0.04 | )(d) | | | (0.48 | ) | | | 0.23 | | | | 0.11 | | | | 0.08 | |
Net realized and unrealized gain/(loss) on investments | | | (2.08 | ) | | | 5.40 | | | | (1.01 | ) | | | 6.19 | | | | 0.39 | |
| | | | | | | | | | | | | | | | | | | | |
Total from Investment Operations | | | (2.12 | ) | | | 4.92 | | | | (0.78 | ) | | | 6.30 | | | | 0.47 | |
| | | | | | | | | | | | | | | | | | | | |
Less Distributions: | | | | | | | | | | | | | | | | | | | | |
From investment income | | | (0.17 | ) | | | (0.53 | ) | | | (0.26 | ) | | | (0.12 | ) | | | (0.26 | ) |
From return of capital | | | (0.68 | ) | | | — | | | | — | | | | — | | | | — | |
| | | | | | | | | | | | | | | | | | | | |
Total Distributions | | | (0.85 | ) | | | (0.53 | ) | | | (0.26 | ) | | | (0.12 | ) | | | (0.26 | ) |
| | | | | | | | | | | | | | | | | | | | |
Net Increase/(Decrease) in Net Asset Value | | | (2.97 | ) | | | 4.39 | | | | (1.04 | ) | | | 6.18 | | | | 0.21 | |
| | | | | | | | | | | | | | | | | | | | |
Net Asset Value, End of Period | | $ | 33.70 | | | $ | 36.67 | | | $ | 32.28 | | | $ | 33.32 | | | $ | 27.14 | |
| | | | | | | | | | | | | | | | | | | | |
Total Return(e) | | | (5.76 | )% | | | 15.32 | % | | | (2.31 | )% | | | 23.22 | % | | | 1.73 | % |
Ratios/Supplemental Data: | |
Net assets, End of Period (in 000s) | | $ | 9,992 | | | $ | 16,071 | | | $ | 16,307 | | | $ | 17,936 | | | $ | 17,095 | |
Ratios to Average Net Assets (excluding interest and dividends on short sales expense): | | | | | | | | | | | | | | | | | | | | |
Net investment income/(loss) | | | 0.58 | % | | | (0.14 | )% | | | 1.21 | % | | | 1.03 | % | | | 0.92 | % |
Operating expenses | | | 2.53 | % | | | 2.49 | % | | | 2.40 | % | | | 2.42 | % | | | 2.38 | % |
Ratios to Average Net Assets (including interest and dividends on short sales expense): | | | | | | | | | | | | | | | | | | | | |
Net investment income/(loss) | | | (0.12 | )% | | | (1.41 | )% | | | 0.69 | % | | | 0.35 | % | | | 0.27 | % |
Operating expenses | | | 3.23 | % | | | 3.76 | % | | | 2.92 | % | | | 3.10 | % | | | 3.03 | % |
Portfolio Turnover Rate | | | 59 | % | | | 82 | % | | | 77 | % | | | 45 | % | | | 63 | % |
(a) Prior to May 1, 2016, Salient Tactical Real Estate Fund was known as Forward Real Estate Long/Short Fund.
(b) The information for the fiscal year ended December 31, 2015 has been audited by KPMG LLP, independent registered public accounting firm. The information for prior periods has been audited by the predecessor independent registered public accounting firm.
(c) Per share amounts are based upon average shares outstanding.
(d) The amount shown for a share outstanding throughout the period may not correlate with the Statement of Operations for the period due to the timing of sales and redemptions of Fund shares in relation to income earned and/or fluctuating market value of the investments of the Fund.
(e) Total return does not reflect the effect of sales charges.
| | | | |
| See accompanying Notes to Financial Statements. | | 70 | | |
Notes to Financial Statements
December 31, 2017
1. ORGANIZATION
Forward Funds (the “Trust”), a Delaware statutory trust, is an open-end management investment company registered under the Investment Company Act of 1940, as amended (the “1940 Act”). As of December 31, 2017, the Trust has 14 registered funds. This annual report describes 5 series of the Trust (each a “Fund” and collectively, the “Funds”) under the brand name Salient. The accompanying financial statements and financial highlights relate to Salient International Real Estate Fund (“International Real Estate Fund”), Salient Real Estate Fund (“Real Estate Fund”), Salient Select Income Fund (“Select Income Fund”), Salient Select Opportunity Fund (“Select Opportunity Fund”), and Salient Tactical Real Estate Fund (“Tactical Real Estate Fund”).
The Funds are distributed by Forward Securities, LLC. The Investment Advisor of the Funds is Forward Management, LLC d/b/a Salient, (the “Advisor” or “Salient Management”).
International Real Estate Fund seeks total return from both capital appreciation and current income through investing primarily in non-U.S. securities of real estate and real estate-related companies, including real estate investment trusts (“REITs”). Real Estate Fund seeks income with capital appreciation as a secondary goal through investing primarily in securities of real estate companies, including REITs. Select Income Fund seeks high current income and potential for modest long-term growth of capital through investing primarily in income-producing securities of companies in the real estate industry, such as REITs, master limited partnerships and other real estate firms. Select Opportunity Fund seeks total return through current income and long-term capital appreciation through investing in equity, fixed income and hybrid securities. Tactical Real Estate Fund seeks total return through a combination of high current income relative to equity investment alternatives plus long-term growth of capital through investing primarily in securities of issuers engaged primarily in the real estate industry, such as REITs, master limited partnerships and other real estate firms.
Information presented in the accompanying Funds’ financial statements pertains to the Investor Class, Institutional Class, Class A, and Class C shares offered by the Funds.
At a meeting held on January 17, 2017, the Board of Trustees of the Trust (the “Board of Trustees”) approved, on behalf of International Real Estate Fund, Select Income Fund, and Tactical Real Estate Fund the termination of Advisor Class shares as share classes of the Funds. On March 29, 2017, outstanding Advisor Class shares of each Fund were
exchanged at relative net asset value for Institutional Class shares of the same Fund having the same value.
At a meeting held on January 17, 2017, the Board of Trustees approved, on behalf of Select Income Fund and Tactical Real Estate Fund the termination of Class B shares as share classes of the Funds. On April 28, 2017, outstanding Class B shares of each Fund were exchanged at relative net asset value for Class A shares of the same Fund having the same value.
All classes of shares have identical rights to earnings, assets and voting privileges, except for class specific expenses and exclusive rights to vote on matters affecting only individual classes.
International Real Estate Fund, Real Estate Fund, Select Income Fund, Select Opportunity Fund, and Tactical Real Estate Fund may invest a substantial portion of assets in the securities of issuers engaged in the real estate industry, including REITs. As a result, the Funds may be more affected by economic and regulatory developments in this industry than would a fund not concentrating its investments in a particular sector or industry. Real Estate Fund, Select Income Fund and Tactical Real Estate Fund are each classified as a diversified fund under the 1940 Act. International Real Estate Fund and Select Opportunity Fund are each classified as a non-diversified fund under the 1940 Act.
2. SIGNIFICANT ACCOUNTING POLICIES
(a) BASIS OF ACCOUNTING
The accounting and reporting policies of the Funds conform with U.S. generally accepted accounting principles (“U.S. GAAP”). The financial statements have been prepared in conformity with U.S. GAAP, which requires management to make estimates and assumptions relating to the reported amounts of assets and liabilities, and the disclosure of contingent assets and liabilities at the date of the financial statements and the reported amounts of income and expenses during the reporting period. Actual results may differ from those estimates and such differences may be significant. Each Fund is an investment company and follows the investment company accounting and reporting guidance under Financial Accounting Standards Board (“FASB”) Accounting Standards Codification (“ASC”) Topic 946, “Financial Services-Investment Companies”.
Notes to Financial Statements
December 31, 2017
(b) PORTFOLIO VALUATION
Portfolio securities or contracts that are listed or traded on a national securities exchange, contract market or over-the-counter market and that are freely transferable are valued at the last sale price or market’s official closing price on the valuation day. If there have been no sales that day, such securities or contracts are valued at the mean of the closing bid and ask prices. If no bid or ask prices are quoted before closing, such securities or contracts are valued either at the last available sale price or at fair value in accordance with procedures established by, and under the general supervision of, the Board of Trustees.
Debt securities that have an original maturity of more than 365 days or that are credit impaired are valued on the basis of the average of the latest bid and ask prices. Debt securities that have an original maturity of less than 365 days and that are not credit impaired are valued as follows: (a) maturity of 61 to 365 days, on the basis of the average of the latest bid and ask prices; and (b) maturity of 60 days or less, at amortized cost.
The Funds’ independent pricing vendors (approved by the Board of Trustees) use multiple valuation techniques to determine fair value. In instances where sufficient market activity exists, the pricing vendors may utilize a market-based approach through which quotes from market makers are used to determine value. In instances where sufficient market activity may not exist or is limited, the pricing vendors may also utilize proprietary valuation models which may consider market characteristics such as benchmark yield curves, option-adjusted spreads, credit spreads, estimated default rates, coupon rates, anticipated timing of principal repayments, underlying collateral, and other unique security features in order to estimate the relevant cash flows, which are then discounted to calculate the value.
In the event valuation information is not available from the Funds’ independent pricing vendors for a security held by a Fund, such security may be valued by alternate pricing methods, including the use of quotations obtained from dealers that make markets in such securities, or otherwise determined based on the fair value of such securities. To the extent that such securities do not trade on a valuation day and the last bid and ask prices are not available, the securities may be valued using matrix pricing or similar valuation methods from the Funds’ independent pricing vendors. Bonds that do not trade regularly and lower-rated bonds tend to be less liquid, and their values may be determined based on alternate or fair valuation methods (approved by the Board of Trustees) more frequently than portfolio holdings that are more frequently traded or that have relatively higher credit ratings.
Futures, options on futures, and swap contracts that are listed or traded on a national securities exchange, commodities exchange, contract market or over-the-counter market and that are freely transferable are valued at their closing settlement price on the exchange on which they are primarily traded or based upon the current settlement price for a like instrument on the day on which the instrument is being valued. Over-the-counter futures, options on futures, and swap contracts for which market quotations are readily available are valued based on quotes received from independent pricing vendors or one or more dealers that make markets in such securities. If quotes are not available from an independent pricing vendor or dealers, over-the-counter futures, options on futures and swap contracts are valued using fair valuation methodologies.
Options on securities and options on indices are valued using the mean of the closing bid and ask prices of the securities or commodities exchange on which they are traded. If a mean price is not available, value shall be determined based on fair valuation methodologies. Certain investments including options may trade in the over-the-counter market and generally are valued based on the mean of the closing bid and ask prices obtained from an approved pricing service or Salient Management may determine value based on quotes from dealers that make markets in such securities.
Bank loans are primarily valued by using a composite loan price from an independent pricing vendor (approved by the Board of Trustees). The methodology used by the Funds’ independent pricing vendor for composite loan prices is to value loans at the mean of the bid and ask prices from one or more brokers or dealers.
Portfolio securities that are traded on foreign securities exchanges are generally valued at the last reported sale or closing price of such securities on their respective exchanges, except when an occurrence subsequent to the time a value was so established is likely to have changed such value. In such an event, the fair value of those securities is determined in good faith through consideration of other factors in accordance with procedures established by, and under the general supervision of, the Board of Trustees. Certain Funds will use a fair valuation model provided by independent pricing vendors, which is intended to reflect fair value when a security’s value is believed to have been materially affected by a valuation event that has occurred between the close of the exchange or market on which the security is traded and the close of the normal trading day of the NYSE, normally 4:00 p.m. Eastern Time. The Funds’ procedures set forth certain triggers that instruct when to use the fair valuation model. The value assigned to a
Notes to Financial Statements
December 31, 2017
security by the fair valuation model is a determination of fair value made under the Funds’ valuation procedures and under the supervision of the Board of Trustees. In such a case, a Fund’s value for a security may be different from the last sales price (or the latest closing price) and there is no guarantee that a fair valued security will be sold at the price at which a Fund is valuing the security.
Forward currency contracts have a market value determined by the prevailing daily foreign currency exchange rates and current foreign currency exchange forward rates. The foreign currency exchange forward rates are calculated using an automated system that estimates rates on the basis of the current day foreign currency exchange rates and forward foreign currency exchange rates supplied by a pricing vendor. Foreign currency exchange rates and foreign currency exchange forward rates may generally be obtained at the close of the NYSE, normally 4:00 p.m. Eastern Time.
Redeemable securities issued by open-end registered investment companies are valued at the investment company’s net asset value, with the exception of exchange-traded products which are priced as equity securities.
All other securities and other assets are carried at their fair value as determined in good faith using methodologies approved by the Board of Trustees. The valuation methodologies include: analysis of recent public transactions in securities or assets of the same class or that are highly similar; analysis of recent private transactions in securities or assets of the same class or that are highly similar; analysis of information that provides a reasonable basis for valuation, such as appraisals, analysts’ reports, and valuation models; and cost, if other valuation methods are not available.
(c) SECURITIES TRANSACTIONS AND INVESTMENT INCOME
For financial statement purposes, securities transactions are accounted for on a trade date basis. Accordingly, differences between the net asset values for financial statement purposes and for executing shareholder transactions may arise. Realized gains or losses on sales of securities are determined by the identified cost method. Interest income, adjusted for accretion of discounts and amortization of premiums, is recorded on the accrual basis. Dividend income is recorded on the ex-dividend date, except that certain dividends from foreign securities where the ex-dividend date may have passed are recorded as soon as a Fund is informed of such dividends in the exercise of reasonable diligence. If applicable, any foreign capital gains taxes are accrued, net of unrealized gains, and are payable upon the sale of such investments.
(d) FOREIGN CURRENCY TRANSLATION
The books and records of the Funds are maintained in U.S. dollars. Investment valuations and other assets and liabilities initially expressed in foreign currencies are converted each business day into U.S. dollars based upon current exchange rates. Prevailing foreign exchange rates may generally be obtained at the close of the NYSE, normally 4:00 p.m. Eastern Time. The portion of realized and unrealized gains or losses on investments due to fluctuations in foreign currency exchange rates is not separately disclosed.
(e) MASTER LIMITED PARTNERSHIPS (“MLPs”)
Entities commonly referred to as MLPs are generally organized under state law as limited partnerships or limited liability companies. Certain Funds may invest in MLPs receiving partnership taxation treatment under the Internal Revenue Code of 1986, as amended (the “Code”), and whose interests or “units” are traded on securities exchanges like shares of corporate stock. To be treated as a partnership for U.S. federal income tax purposes, an MLP whose units are traded on a securities exchange must receive at least 90% of its income from qualifying sources such as interest, dividends, real property rents, gains on dispositions of real property, income and gains from mineral or natural resources activities, income and gains from the transportation or storage of certain fuels, and, in certain circumstances, income and gains from commodities or futures, forwards and options on commodities. Mineral or natural resources activities include exploration, development, production, processing, mining, refining, marketing and transportation (including pipelines) of oil and gas, minerals, geothermal energy, fertilizer, timber or industrial source carbon dioxide. An MLP consists of a general partner and limited partners (or in the case of MLPs organized as limited liability companies, a managing member and members).
The general partner or managing member typically controls the operations and management of the MLP and has an ownership stake in the partnership or limited liability company. The limited partners or members, through their ownership of limited partner or member interests, provide capital to the entity, are intended to have no role in the operation and management of the entity and receive cash distributions. Investments in MLPs consist only of limited partner or member interest ownership. The MLPs themselves generally do not pay U.S. federal income taxes. Thus, unlike investors in corporate securities, direct MLP investors are generally not subject to double taxation (i.e., corporate level tax and tax on corporate dividends). Currently, most MLPs operate in the energy and/or natural resources sector.
Notes to Financial Statements
December 31, 2017
(f) SHORT SALES
Certain Funds may sell securities short. Short sales are transactions in which a Fund sells a security that it does not own in anticipation of a decline in the value of that security. To complete such a transaction, a Fund must borrow the security to deliver to the buyer. The Fund is then obligated to replace the security borrowed by purchasing it in the open market at some later date. The Fund bears the risk of a loss if the market price of the security increases between the date of the short sale and the date on which the Fund replaces the borrowed security. The Fund will realize a gain if the security declines in value between those dates. There can be no assurance that securities necessary to cover a short position will be available for purchase. All short sales must be fully collateralized. The Fund maintains collateral consisting of cash, U.S. government securities or other liquid assets in an amount at least equal to the value of their respective short positions. The Fund is liable for any dividends or interest payable on securities while those securities are in a short position. The Fund typically intends to hold securities sold short for the short term; therefore, they are excluded from the purchases and sales of investments in Note 9 and the Fund’s Portfolio Turnover Calculation in the Financial Highlights. As of December 31, 2017, Select Income Fund and Tactical Real Estate Fund held securities sold short with a value of $60,757,500 and $8,911,100, respectively. No other Funds held securities sold short as of December 31, 2017.
(g) DERIVATIVE INSTRUMENTS AND HEDGING ACTIVITIES
The following discloses the Funds’ use of derivative instruments and hedging activities.
The Funds’ investment objectives not only permit the Funds to purchase investment securities but also allow certain Funds to enter into various types of derivative contracts, including, but not limited to, futures contracts, forward currency contracts, and purchased and written option contracts. In doing so, the Funds will employ strategies in differing combinations to permit them to increase, decrease, or change the level or types of exposure to market factors. Central to those strategies are features inherent to derivatives that make them more attractive for this purpose than equity or debt securities: they require little or no initial cash investment, they can focus exposure on only certain selected risk factors, and they may not require the ultimate receipt or delivery of the underlying security (or securities) to the contract. This may allow the Funds to pursue their objectives more quickly and efficiently than if they were to make direct purchases or sales of securities capable of affecting a similar response to market factors.
Market Risk Factors: In pursuit of their investment objectives, certain Funds may use derivatives that increase or decrease a Fund’s exposure to the following market risk factors:
Credit Risk: Credit risk is the risk an issuer will be unable to make principal and interest payments when due, or will default on its obligations.
Equity Risk: Equity risk relates to the change in value of equity securities as they relate to increases or decreases in the general market.
Foreign Exchange Rate Risk: Foreign exchange rate risk relates to the change in the U.S. dollar value of a security held that is denominated in a foreign currency. The value of a foreign currency denominated security will decrease as the dollar appreciates against the currency, while the value of the foreign currency denominated security will increase as the dollar depreciates against the currency.
Interest Rate Risk: Interest rate risk refers to the fluctuations in value of fixed-income securities resulting from the inverse relationship between price and yield. For example, an increase in general interest rates will tend to reduce the market value of already issued fixed income investments, and a decline in general interest rates will tend to increase the value of such investments. In addition, debt securities with longer maturities, which tend to have higher yields, are subject to potentially greater fluctuations in value from changes in interest rates than obligations with shorter maturities.
Risk of Investing in Derivatives: The Funds’ use of derivatives can result in losses due to unanticipated changes in the market risk factors and the overall market. In instances where the Funds are using derivatives to decrease or hedge exposures to market risk factors for securities held by the Funds, there are also risks that those derivatives may not perform as expected, resulting in losses for the combined or hedged positions.
Derivatives may have little or no initial cash investment relative to their market value exposure and therefore can produce significant gains or losses in excess of their cost. This use of embedded leverage allows the Funds to increase their market value exposure relative to their net assets and can substantially increase the volatility of the Funds’ performance.
Notes to Financial Statements
December 31, 2017
Additional associated risks from investing in derivatives also exist and potentially could have significant effects on the valuation of the derivative and the Funds. Typically, the associated risks are not the risks that the Funds are attempting to increase or decrease exposure to, per their investment objectives, but are the additional risks from investing in derivatives.
Examples of these associated risks are liquidity risk, which is the risk that the Funds will not be able to settle the derivative in the open market in a timely manner, and counterparty credit risk, which is the risk that the counterparty will not fulfill its obligation to the Funds. Associated risks can be different for each type of derivative and are discussed by each derivative type in the notes that follow.
Futures: Certain Funds may invest in futures contracts in accordance with their investment objectives. Each Fund does so for a variety of reasons, including for cash management, hedging or non-hedging purposes in an attempt to achieve investment returns consistent with the Fund’s investment objective. A futures contract provides for the future sale by one party and purchase by another party of a specified quantity of the security or other financial instrument at a specified price and time. A futures contract on an index is an agreement pursuant to which two parties agree to take or make delivery of an amount of cash equal to the difference between the value of the index at the close of the last trading day of the contract and the price at which the index contract was originally written. Futures transactions may result in losses in excess of the amount invested in the futures contract. There can be no guarantee that there will be a correlation between price movements in the hedging vehicle and in the portfolio securities being hedged. An incorrect correlation could result in a loss on both the hedged securities in a Fund and the hedging vehicle so that the portfolio return might have been greater had hedging not been attempted. There can be no assurance that a liquid market will exist at a time when a Fund seeks to close out a futures contract or a futures option position. Lack of a liquid market for any reason may prevent a Fund from liquidating an unfavorable position, and the Fund would remain obligated to meet margin requirements until the position is closed. In addition, a Fund could be exposed to risk if the counterparties to the contracts are unable to meet the terms of their contracts. With exchange-traded futures, there is minimal counterparty credit risk to the Funds since futures are exchange-traded and the exchange’s clearinghouse, as counterparty to all exchange-traded futures, guarantees the futures against default.
When a purchase or sale of a futures contract is made by a Fund, the Fund is required to deposit with its custodian (or broker, if legally permitted) a specified amount of liquid assets (“initial margin”). The margin required for a futures contract is set by the exchange on which the contract is traded and may be modified during the term of the contract. The initial margin is in the nature of a performance bond or good faith deposit on the futures contract that is returned to a Fund upon termination of the contract, assuming all contractual obligations have been satisfied. Each day a Fund may pay or receive cash, called “variation margin,” equal to the daily change in value of the futures contract. Such payments or receipts are recorded for financial statement purposes as unrealized gains or losses by a Fund. Variation margin does not represent a borrowing or loan by a Fund but is instead a settlement between a Fund and the broker of the amount one would owe the other if the futures contract expired. When the contract is closed, a Fund records a realized gain or loss equal to the difference between the value of the contract at the time it was opened and the value at the time it was closed. The Funds held no futures contracts as of December 31, 2017.
Option Writing/Purchasing: Certain Funds may write or purchase option contracts to adjust the risk and return of their overall investment positions. When a Fund writes or purchases an option, an amount equal to the premium received or paid by the Fund is recorded as a liability or an asset and is subsequently adjusted to the current market value of the option written or purchased. Premiums received or paid from writing or purchasing options that expire unexercised are treated by the Fund on the expiration date as realized gains or losses. The difference between the premium and the amount paid or received on affecting a closing purchase or sale transaction, including brokerage commissions, is also treated as a realized gain or loss. If an option is exercised, the premium paid or received is added to the cost of the purchase, or proceeds from the sale, in determining whether the Fund has realized a gain or loss on investment transactions. Risks from entering into option transactions arise from the potential inability of counterparties to meet the terms of the contracts, the potential inability to enter into closing transactions because of an illiquid secondary market and unexpected movements in security values. Select Income Fund held purchased options during the year ended December 31, 2017.
Notes to Financial Statements
December 31, 2017
The values in the following tables exclude the effects of cash collateral received or posted pursuant to these derivative contracts, and therefore are not necessarily representative of the Funds’ net exposure. Cash held as collateral is in a segregated account with the Funds’ custodian and is reflected in the Statement of Assets and Liabilities.
Balance Sheet – Fair Value of Derivative Instruments as of December 31, 2017:
| | | | | | | | | | | | |
Derivatives not Accounted
for as Hedging Instruments | | Asset Derivatives
Balance Sheet Location | | Fair
Value | | | Liabilities Derivatives
Balance Sheet Location | | Fair
Value | |
| Select Income Fund | |
Equity Contracts (Options Purchased) | | Investments, at value | | $ | 47,780 | | | | | $ | — | |
| | | | | | | | | | | | |
Total | | | | $ | 47,780 | | | | | $ | — | |
| | | | | | | | | | | | |
The gains/(losses) in the following table are included in “Net realized gain/(loss)” or “Net change in unrealized gain/(loss)” on the Statement of Operations.
The Effect of Derivative Instruments on the Statement of Operations for the year ended December 31, 2017:
| | | | | | | | | | |
Derivatives not Accounted
for as Hedging Instruments | | Location of Gain/(Loss) on
Derivatives Recognized in Income | | Realized
Gain/(Loss)
on Derivatives
Recognized
in Income | | | Change in
Unrealized
Gain/(Loss)
on Derivatives
Recognized
in Income | |
| Select Income Fund | |
Equity Contracts (Options Purchased) | | Net realized gain on investments and foreign currency translations/Net change in unrealized appreciation/depreciation on investments | | $ | 366,700 | | | $ | (178,936 | ) |
| | | | | | | | | | |
Total | | | | $ | 366,700 | | | $ | (178,936 | ) |
| | | | | | | | | | |
The following is a summary of the average month-end notional value of purchased option contracts held by the Funds for the year ended December 31, 2017, as well as the notional amount of purchased option contracts held as of December 31, 2017:
| | | | | | | | |
| | | Average
Month-end
Notional
Value | | | Notional Value
Outstanding at
December 31, 2017 | |
| Select Income Fund | | | | | | | | |
Options Purchased | | $ | 1,429,656 | | | $ | 4,937,468 | |
Certain derivative contracts are executed under either standardized netting agreements or, for exchange-traded derivatives, the relevant contracts for a particular exchange that contain enforceable netting provisions. A derivative netting arrangement creates an enforceable right of set-off that becomes effective and affects the realization of settlement on individual assets, liabilities and collateral amounts, only following a specified event of default or early termination. Default events may include the failure to make payments or deliver securities timely, material adverse changes in financial condition or insolvency, the
breach of minimum regulatory capital requirements, or loss of license, charter or other legal authorization necessary to perform under the contract. There were no derivative financial instruments that are subject to enforceable netting arrangements or other similar agreements as of December 31, 2017.
Warrants: Certain Funds may invest in warrants. A Fund may purchase warrants issued by domestic and foreign companies to purchase newly created equity securities consisting of common and preferred stock. Warrants are securities that give the holder the right, but not the obligation, to purchase equity issues of the company issuing the warrants, or a related company, at a fixed price either on a certain date or during a set period. The equity security underlying a warrant is authorized at the time the warrant is issued or is issued together with the warrant. Investing in warrants can provide a greater potential for profit or loss than an equivalent investment in the underlying security and, thus, can be a speculative investment. At the time of issue, the cost of a warrant is substantially less than the cost of the underlying security itself, and price movements in the underlying security are
Notes to Financial Statements
December 31, 2017
generally magnified in the price movements of the warrant. The leveraging effect enables the investor to gain exposure to the underlying security with a relatively low capital investment.
This leveraging increases an investor’s risk, as a complete loss of the amount invested in the warrant may result in the event of a decline in the value of the underlying security. In addition, the price of a warrant tends to be more volatile than, and may not correlate exactly to, the price of the underlying security. If the market price of the underlying security is below the exercise price of the warrant on its expiration date, the warrant will generally expire without value. The value of a warrant may decline because of a decline in the value of the underlying security, the passage of time, changes in interest rates or in the dividend or other policies of the company whose equity underlies the warrant, a change in the perception as to the future price of the underlying security, or any combination thereof. Warrants generally pay no dividends and confer no voting or other rights other than to purchase the underlying security. As of December 31, 2017, the Funds held no warrants.
(h) CASH MANAGEMENT TRANSACTIONS
The Funds may hold cash balances in bank demand deposit accounts with the Funds’ custodian, Citibank, N.A. (“Citibank”). Such amounts are readily accessible to purchase investments or pay Fund expenses. The Funds consider liquid assets deposited in a bank demand deposit account to be cash equivalents. Cash and cash equivalents are valued at cost plus any accrued interest. The Funds may maintain demand deposit accounts that have an aggregate value in excess of Federal Deposit Insurance Corporation (“FDIC”) insurance limits. As a result, the Funds may be exposed to credit risk in the event of insolvency or other failure of Citibank to meet its obligations.
(i) LEVERAGE
Select Income Fund, Select Opportunity Fund and Tactical Real Estate Fund may purchase securities with borrowed money, including bank overdrafts (a form of leverage). The Funds may borrow amounts up to one-third of the value of their assets after giving effect to such borrowing. Leverage exaggerates the effect on the net asset value of any increase or decrease in the market value of the Fund’s portfolio securities. These borrowings will be subject to interest costs, which may or may not be recovered by appreciation of the securities purchased. In certain cases, interest costs may exceed the return received on the securities purchased.
Select Income Fund, Select Opportunity Fund and Tactical Real Estate Fund maintain separate lines of credit with BNP Paribas (acting through its New York Branch). The Funds are charged interest of 1.20% above the one-month London Interbank Offered Rate (“LIBOR”) for borrowing under these agreements.
Select Income Fund and Tactical Real Estate Fund also maintain separate lines of credit with Société Générale. For borrowings under these agreements, the Funds are charged interest of 0.95% above the one-month LIBOR. Additionally, if the borrowed amount by a Fund is below 80% of the Fund’s facility limit, the Fund is charged a commitment fee of 0.35% per annum on the amount between the facility limit and borrowed amount.
Select Income Fund, Select Opportunity, and Tactical Real Estate Fund have each pledged a portion of their investment securities as the collateral for their lines of credit. As of December 31, 2017, the value of the investment securities pledged as collateral and the borrowed amounts on the lines of credit were as follows:
| | | | | | | | |
| Fund | | Collateral
Pledged | | | Borrowed
Amounts | |
Select Income Fund | | $ | 471,370,889 | | | $ | 92,058,708 | |
Select Opportunity Fund | | | 3,508,486 | | | | 536,786 | |
Tactical Real Estate Fund | | | 14,877,063 | | | | — | |
The average interest rate charged and the average outstanding loan payable for the year ended December 31, 2017 were as follows:
| | | | | | | | |
| Fund | | Average
Interest Rate | | | Average Outstanding
Loan Payable | |
Select Income Fund | | | 2.258 | % | | $ | 124,662,918 | |
Select Opportunity Fund | | | 2.315 | % | | | 916,921 | |
Tactical Real Estate Fund | | | 2.252 | % | | | 12,444,233 | |
(j) DISTRIBUTIONS TO SHAREHOLDERS
Dividends from net investment income, if any, are declared and paid quarterly for the Funds. For all Funds, net realized capital gains, if any, are normally distributed annually in December, and a spillover capital gain distribution, if any, is distributed in the year after which a Fund elects to treat the distribution as paid for Federal income tax purposes. There is no guarantee that the Funds will continue paying dividends.
Notes to Financial Statements
December 31, 2017
Income and capital gain distributions are determined in accordance with Federal income tax regulations, which may differ from GAAP. Therefore, the source of the Funds’ distributions may be shown in the accompanying financial statements as either from or in excess of net investment income or net realized gain or from paid-in-capital depending upon the type of book/ tax differences that may exist.
Based on information provided by the REITs, the Funds recharacterize distributions received from REIT investments into the following categories: ordinary income, long-term capital gains, and return of capital. If information is not available on a timely basis from the REITs, the recharacterization will be estimated based on available information that may include the previous year’s allocation. If new or additional information becomes available from the REITs at a later date, a recharacterization will be made in the following annual financial reporting period. There is no guarantee that the REITs held by the Funds will continue to pay dividends. The Funds record as dividend income the amount recharacterized as ordinary income and as realized gain the amount recharacterized as long-term capital gain in the Statement of Operations, and the amount recharacterized as a return of capital as a reduction to the cost of investments in the Statement of Assets and Liabilities and in the Schedule of Investments. These recharacterizations are reflected in the accompanying financial statements.
Distributions received from a Funds’ investments in MLPs generally are comprised of income, capital gains and return of capital. A Fund records investment income and return of capital based on estimates made at the time such distributions are received. Such estimates are based on historical information available from each MLP and other industry sources. These estimates may subsequently be revised based on information received from MLPs after their tax reporting periods are concluded.
(k) FEDERAL INCOME TAXES
The Trust treats each Fund as a separate entity for Federal income tax purposes. Each Fund intends to continue to qualify each year as a “regulated investment company” under Subchapter M of the Code. By so qualifying, each Fund will not be subject to Federal income taxes to the extent that it distributes substantially all of its taxable or tax-exempt income, if any, for its tax year ending December 31. In addition, by distributing in each calendar year substantially all of its net investment income, capital gains and certain other amounts, if any, each Fund will not be subject to a Federal excise tax. Therefore, no provision is made
by the Funds for Federal income or excise taxes. Withholding taxes on foreign dividends are paid (a portion of which may be reclaimable) or provided for in accordance with the applicable country’s tax rules and rates and are disclosed in the Statement of Operations. Distributions paid to shareholders are based on net investment income and net realized gains determined on a tax basis, which may differ from net investment income and net realized gains for financial reporting purposes. These differences are due primarily to differing treatment for items such as non- U.S. currency gains and losses, short-term capital gains and losses, capital losses related to wash sales, unrealized appreciation of certain investments in non-U.S. securities, and income on certain investments. The fiscal year in which amounts are distributed may differ from the year in which the net investment income and net realized gains are recorded by the Funds for financial reporting purposes. The Funds may also designate a portion of the amount paid to redeeming shareholders as a distribution for tax purposes.
As of and during the year ended December 31, 2017, and for all open tax years, the Funds did not have a liability for any unrecognized tax benefits in the accompanying financial statements. The Funds recognize the interest and penalties, if any, related to the unrecognized tax benefits as income tax expense in the Statement of Operations. During the period, the Funds did not incur any interest or penalties. The Funds file U.S. federal, state, and local tax returns as required. The Fund’s tax returns are subject to examination by the relevant tax authorities until expiration of the applicable statute of limitations, which is generally three years after the filing of the tax return for federal purposes and four years for most state returns. Salient Management does not believe there are any uncertain tax positions that require recognition of a tax liability.
(l) ALLOCATIONS
Expenses that are specific to a Fund or class of shares of a Fund are charged directly to that Fund or share class. Expenses that are common to all Funds generally are allocated among the Funds in proportion to their average daily net assets. For Funds offering multiple share classes, all of the realized and unrealized gains and losses and net investment income, other than class specific expenses, are allocated daily to each class in proportion to its average daily net assets. Fees provided under the distribution (Rule 12b-1 of the 1940 Act) and/or shareholder services plans for a particular class of a Fund are charged to the operations of such class.
Notes to Financial Statements
December 31, 2017
(m) REFLOW TRANSACTIONS
Certain Funds may participate in ReFlow, a program designed to provide an alternative liquidity source for mutual funds experiencing redemptions of their shares. In order to pay cash to shareholders who redeem their shares on a given day, a mutual fund typically must hold cash in its portfolio, liquidate portfolio securities, or borrow money, all of which impose certain costs on the fund. ReFlow provides participating mutual funds with another source of cash by standing ready to purchase shares from a fund equal to the amount of the fund’s net redemptions on a given day. ReFlow then generally redeems those shares when the fund experiences net sales. In return for this service, the fund will pay a fee to ReFlow at a rate determined by a daily auction with other participating mutual funds. The costs to a Fund for participating in ReFlow are generally expected to be influenced by and comparable to the cost of other sources of liquidity, such as the Fund’s short-term lending arrangements or the costs of selling portfolio securities to meet redemptions. ReFlow is prohibited from acquiring more than 3% of the outstanding voting securities of any Fund. The Board of Trustees has adopted certain procedures to govern the Funds’ participation in ReFlow. ReFlow fees that were incurred by the Funds during the year ended December 31, 2017 are recorded in the Statement of Operations, if applicable.
3. FAIR VALUE MEASUREMENTS
A three-tier hierarchy has been established to classify fair value measurements for disclosure purposes. Inputs refer broadly to the assumptions that market participants would use in pricing the asset or liability, including assumptions about risk. Inputs may be observable or unobservable. Observable inputs are inputs that reflect the assumptions
market participants would use in pricing the asset or liability that are developed based on market data obtained from sources independent of the reporting entity. Unobservable inputs are inputs that reflect the reporting entity’s own assumptions about the assumptions market participants would use in pricing the asset or liability that are developed based on the best information available.
Various inputs are used in determining the value of each Fund’s investments as of the reporting period end. The designated input levels are not necessarily an indication of the risk or liquidity associated with these investments. These inputs are categorized in the following hierarchy under applicable financial accounting standards:
Level 1—Unadjusted quoted prices in active markets for identical, unrestricted assets or liabilities that a Fund has the ability to access at the measurement date. Investments in any underlying open-ended investment companies are valued at their net asset value daily and classified as Level 1.
Level 2—Quoted prices in markets which are not active, quoted prices for similar assets or liabilities in active markets or inputs other than quoted prices that are observable (either directly or indirectly) for substantially the full term of the asset or liability. The Board of Trustees has approved independent pricing vendors that calculate fair valuations of international equity securities based on a number of factors that appear to correlate to the movements in the U.S. markets.
Level 3—Significant unobservable prices or inputs (including the Fund’s own assumptions in determining the fair value of investments) where there is little or no market activity for the asset or liability at the measurement date.
The following tables summarize the Fund’s investments and derivative financial instruments categorized in the disclosure hierarchy as of December 31, 2017:
| | | | | | | | | | | | | | | | |
| Investments in Securities | | Level 1 | | | Level 2 | | | Level 3 | | | Total | |
| International Real Estate Fund | |
Common Stocks(a) | | $ | 21,440,665 | | | $ | — | | | $ | — | | | $ | 21,440,665 | |
| | | | | | | | | | | | | | | | |
Total | | $ | 21,440,665 | | | $ | — | | | $ | — | | | $ | 21,440,665 | |
| | | | | | | | | | | | | | | | |
| | | | | | | | | | | | | | | | |
| Real Estate Fund | |
Common Stocks(a) | | $ | 28,462,368 | | | $ | — | | | $ | — | | | $ | 28,462,368 | |
| | | | | | | | | | | | | | | | |
Total | | $ | 28,462,368 | | | $ | — | | | $ | — | | | $ | 28,462,368 | |
| | | | | | | | | | | | | | | | |
| | | | | | | | | | | | | | | | |
Notes to Financial Statements
December 31, 2017
| | | | | | | | | | | | | | | | |
| Investments in Securities | | Level 1 | | | Level 2 | | | Level 3 | | | Total | |
| Select Income Fund | |
Common Stocks(a) | | $ | 196,141,409 | | | $ | — | | | $ | — | | | $ | 196,141,409 | |
Convertible Preferred Stocks(a) | | | 88,505,145 | | | | — | | | | — | | | | 88,505,145 | |
Preferred Stocks(a) | | | 445,375,079 | | | | — | | | | — | | | | 445,375,079 | |
Purchased Options | | | 47,780 | | | | — | | | | — | | | | 47,780 | |
Corporate Bonds(a) | | | — | | | | 10,887,750 | | | | — | | | | 10,887,750 | |
Convertible Corporate Bonds(a) | | | — | | | | 59,206,850 | | | | — | | | | 59,206,850 | |
| | | | | | | | | | | | | | | | |
Total | | $ | 730,069,413 | | | $ | 70,094,600 | | | $ | — | | | $ | 800,164,013 | |
| | | | | | | | | | | | | | | | |
| | | | | | | | | | | | | | | | |
| Select Opportunity Fund | |
Common Stocks(a) | | $ | 5,561,058 | | | $ | — | | | $ | — | | | $ | 5,561,058 | |
Exchange-Traded Funds | | | 346,918 | | | | — | | | | — | | | | 346,918 | |
Limited Partnerships(a) | | | 204,928 | | | | — | | | | — | | | | 204,928 | |
Convertible Preferred Stocks(a) | | | 426,750 | | | | — | | | | — | | | | 426,750 | |
Contingent Convertible Securities(a) | | | — | | | | 592,405 | | | | — | | | | 592,405 | |
Corporate Bonds(a) | | | — | | | | 300,000 | | | | — | | | | 300,000 | |
Convertible Corporate Bonds(a) | | | — | | | | 223,250 | | | | — | | | | 223,250 | |
| | | | | | | | | | | | | | | | |
Total | | $ | 6,539,654 | | | $ | 1,115,655 | | | $ | — | | | $ | 7,655,309 | |
| | | | | | | | | | | | | | | | |
| | | | | | | | | | | | | | | | |
| Tactical Real Estate Fund | |
Common Stocks(a) | | $ | 37,110,299 | | | $ | — | | | $ | — | | | $ | 37,110,299 | |
Convertible Preferred Stocks(a) | | | 501,749 | | | | — | | | | — | | | | 501,749 | |
| | | | | | | | | | | | | | | | |
Total | | $ | 37,612,048 | | | $ | — | | | $ | — | | | $ | 37,612,048 | |
| | | | | | | | | | | | | | | | |
(a) For detailed descriptions of industry or country see the accompanying Schedule of Investments.
| | | | | | | | | | | | | | | | |
| Other Financial Instruments(a) | | Level 1 | | | Level 2 | | | Level 3 | | | Total | |
| Select Income Fund | | | | | | | | | | | | | | | | |
| Liabilities | |
Securities Sold Short | |
Exchange-Traded Funds | | $ | (60,757,500 | ) | | $ | — | | | $ | — | | | $ | (60,757,500 | ) |
| | | | | | | | | | | | | | | | |
Total | | $ | (60,757,500 | ) | | $ | — | | | $ | — | | | $ | (60,757,500 | ) |
| | | | | | | | | | | | | | | | |
| | | | | | | | | | | | | | | | |
| Tactical Real Estate Fund | | | | | | | | | | | | | | | | |
| Liabilities | |
Securities Sold Short | |
Exchange-Traded Funds | | $ | (8,911,100 | ) | | $ | — | | | $ | — | | | $ | (8,911,100 | ) |
| | | | | | | | | | | | | | | | |
Total | | $ | (8,911,100 | ) | | $ | — | | | $ | — | | | $ | (8,911,100 | ) |
| | | | | | | | | | | | | | | | |
(a) Other financial instruments are derivative instruments reflected in the schedules to the Schedule of Investments, such as short sales.
The Funds recognize transfers between levels as of the beginning of the annual period in which the transfer occurred. For the year ended December 31, 2017 there were no transfers between Level 1 and Level 2 securities.
For the year ended December 31, 2017, no Funds had transfers between the fair value levels designated in the preceding table and unobservable inputs (Level 3) used in determining fair value. Therefore, a reconciliation of assets in which significant unobservable inputs (Level 3) were used in determining fair value is not applicable.
Notes to Financial Statements
December 31, 2017
4. INVESTMENT MANAGEMENT SERVICES
The Trust has entered into an investment management agreement with Salient Management, pursuant to which Salient Management provides investment management services to the Funds and is entitled to receive a fee calculated daily and payable monthly at the following annual rates, as of December 31, 2017, based on each Fund’s average daily net assets:
| | |
| Fund | | Investment Advisory Fees |
International Real Estate Fund | | 1.00% |
| |
Real Estate Fund | | 0.85% up to and including $100 million |
| | 0.80% over $100 million up to and including $500 million |
| | 0.70% over $500 million |
| |
Select Income Fund | | 1.00% |
| |
Select Opportunity Fund | | 1.00% |
| |
Tactical Real Estate Fund | | 1.00% |
Expense Limitations: Salient Management has entered into an Expense Limitation Agreement with Select Opportunity Fund, which limits the total expenses (exclusive of brokerage costs, interest, taxes, dividends, acquired fund fees and expenses, and extraordinary expenses) of certain classes of the Fund, through a specified date. In addition, Salient Management may voluntarily reimburse additional expenses of certain classes of the Fund. Following are the annual expense limitation rates and expiration dates for the Fund:
| | | | | | | | | | | | | | | | | | | | |
| Fund | | Investor
Class | | | Institutional
Class | | | Class A | | | Class C | | | End Date | |
Select Opportunity Fund | | | 1.58 | % | | | 1.23 | % | | | 1.73 | % | | | 2.18 | % | | | April 30, 2018 | |
Pursuant to the Expense Limitation Agreement, the Fund will reimburse Salient Management for any fee waivers and expense reimbursements made by Salient Management, provided that any such reimbursements made by the Fund to Salient Management will not cause the Fund’s expense limitation to exceed the expense limitation in existence at the time the expenses were incurred or at the time of the reimbursement, whichever is lower, and the reimbursement is made within three years following the year in which the expenses were incurred.
For the year ended December 31, 2017, the fee waivers and/or reimbursements were as follows:
| | | | | | | | | | | | |
| Fund | | Fees Waived/
Reimbursed
by Advisor | | | Recoupment of
Past Waived
Fees by Advisor | | | Total | |
| Select Opportunity Fund | | | | | | | | | | | | |
Investor Class | | $ | 8,811 | | | $ | — | | | $ | 8,811 | |
Institutional Class | | | 56,966 | | | | — | | | | 56,966 | |
Class A | | | 46,742 | | | | — | | | | 46,742 | |
Class C | | | 4,808 | | | | — | | | | 4,808 | |
As of December 31, 2017, the balances of recoupable expenses for each Fund were waived in the following years:
| | | | | | | | | | | | | | | | |
| Fund | | 2015 | | | 2016 | | | 2017 | | | Total | |
| Select Opportunity Fund | | | | | | | | | | | | | | | | |
Investor Class | | $ | 4,563 | | | $ | 7,180 | | | $ | 8,811 | | | $ | 20,554 | |
Institutional Class | | | 26,280 | | | | 36,733 | | | | 56,966 | | | | 119,979 | |
Class A | | | 60,893 | | | | 55,083 | | | | 46,742 | | | | 162,718 | |
Class C | | | 17,798 | | | | 19,583 | | | | 4,808 | | | | 42,189 | |
Notes to Financial Statements
December 31, 2017
5. DISTRIBUTION AND SHAREHOLDER SERVICES PLANS
The Funds have adopted Distribution Plans (the “Distribution Plans”) pursuant to Rule 12b-1 of the 1940 Act that allow each of the Funds to pay for the sale and distribution of its shares at an annual rate of up to the following amounts based on each Fund’s daily average net assets:
| | | | | | | | | | | | |
| Fund | | Investor
Class | | | Class A | | | Class C | |
International Real Estate Fund | | | 0.25 | % | | | 0.35 | %(a) | | | 0.75 | % |
Real Estate Fund | | | 0.25 | % | | | 0.35 | %(a) | | | 0.75 | % |
Select Income Fund | | | 0.25 | % | | | 0.35 | %(a) | | | 0.75 | % |
Select Opportunity Fund | | | 0.25 | % | | | 0.35 | % | | | 0.75 | % |
Tactical Real Estate Fund | | | 0.25 | % | | | 0.35 | %(a) | | | 0.75 | % |
(a) The Fund is currently authorized to pay 0.25% with respect to Class A shares.
The Funds have adopted a Shareholder Services Plan (the “Shareholder Services Plan”) with respect to certain Funds. Under the Shareholder Services Plan, a Fund is authorized to pay third party service providers for non-distribution related services to shareholders. Payments under the Shareholder Services Plan are calculated daily and paid monthly and are not to exceed the following annual rates:
| | | | | | | | | | | | | | | | |
| Fund | | Investor
Class | | | Institutional
Class | | | Class A | | | Class C | |
International Real Estate Fund | | | 0.15 | % | | | 0.05 | % | | | 0.20 | % | | | 0.25 | % |
Real Estate Fund | | | 0.15 | % | | | 0.05 | % | | | 0.20 | % | | | 0.25 | % |
Select Income Fund | | | 0.15 | % | | | 0.05 | % | | | 0.20 | % | | | 0.25 | % |
Select Opportunity Fund | | | 0.15 | % | | | 0.05 | % | | | 0.20 | % | | | 0.25 | % |
Tactical Real Estate Fund | | | 0.15 | % | | | 0.05 | % | | | 0.20 | % | | | 0.25 | % |
The expenses of the Distribution Plans and the Shareholder Services Plan are reflected as distribution and service fees in the Statement of Operations.
6. SERVICE PROVIDERS
ALPS Fund Services, Inc. (“AFS”) serves as the Funds’ administrator, transfer agent and dividend paying agent.
Citibank, N.A. serves as the Funds’ custodian.
Forward Securities, LLC, a wholly owned subsidiary of Salient Management, (the “Distributor”) serves as the Funds’ distributor. The Distributor acts as an agent for the Funds and the distributor of their shares.
7. TRUSTEE AND OFFICER FEES
Each Fund’s operations are managed under the direction and oversight of the Board of Trustees. The Board of Trustees appoints officers of the Trust who are responsible for the Funds’ day-to-day business decisions based on policies set by the Board of Trustees. The officers serve at the pleasure of the Board of Trustees.
The Funds do not pay any compensation directly to the officers or trustees who are also trustees, officers or employees of Salient Management or its affiliates, except as noted below. As of December 31, 2017, there were ten Trustees, eight of whom are not “interested persons” of the Trust within the meaning of that term under the 1940 Act (each, an “Independent Trustee”). The Trustees of the Trust may also serve as trustees of other registered investment companies managed by the Advisor and its affiliates, including Salient MF Trust (together with the Trust, the “Trusts”). Each Fund within the Trusts pays Independent Trustees an allocated portion of the retainer of $60,000 per year. Each Fund within the Trusts pays Independent Trustees an allocated portion of the amounts of: $6,250 for attendance in person at a regular meeting and $2,500 for attendance by telephone at a regular meeting; $3,750 for attendance in person or by video conference at a special meeting that is not held in conjunction with a regular meeting
Notes to Financial Statements
December 31, 2017
and $1,500 for attendance by telephone at a special meeting that is not held in conjunction with a regular meeting; and $1,500 per day for participation in Trust-related meetings not held in conjunction with a meeting. The Chairman of the Board of Trustees, the Chairman of the Audit Committee, the Chairman of the Nominating Committee and the Chairman of the Compliance Committee receive a special retainer fee in the amount of $25,000, $12,500, $7,500 and $7,500, respectively per year. In addition, each member of the Audit Committee, Nominating Committee and Compliance Committee receive $1,000, respectively per year. In the interest of retaining Independent Trustees of the highest quality, the Board intends to periodically review such compensation and may modify it as the Board deems appropriate. The interested Trustees receive no compensation from the Funds. In addition, Independent Trustees receive reimbursements for reasonable out-of-pocket expenses incurred for their services as a Trustee, including for the transportation and other expenses that they incur in attending meetings.
The Chief Compliance Officer of the Funds (“CCO”) is an employee of, and is compensated by, Salient Management. The Funds have agreed to pay the Advisor approximately $443,000 per year as (i) an allocated portion of the compensation of an officer or employee of the Advisor to serve as CCO for the Funds (plus the cost of reasonable expenses related to the performance of the CCO’s duties, including travel expenses), and (ii) an allocation of the expenses of other officers or employees of the Advisor who serve in other compliance capacities for the Funds. The Board approves annually an allocation of such costs among such personnel, and each Fund bears its pro rata share of such expense. Other affiliated funds and registered investment companies managed by the Advisor pay additional compensation for the same purposes.
8. INDEMNIFICATIONS
Under the Trust’s organizational documents, its officers and Trustees are indemnified against certain liability arising out of the performance of their duties with respect to the Funds. In addition, in the normal course of business, the Trust, on behalf of the Funds, enters into contracts with vendors and others that provide general indemnification. Each Fund’s maximum exposure under these arrangements is unknown, as this would involve future claims that may be made against the Trust and/or the Funds. Based on experience, however, the Funds expect the risk of loss to be remote.
9. PURCHASES AND SALES OF INVESTMENTS
Investment transactions for the year ended December 31, 2017, excluding U.S. Government Obligations, short-term investments and short sales, were as follows:
| | | | | | | | |
| Fund | | Cost of
Investments
Purchased | | | Proceeds From
Investments
Sold | |
International Real Estate Fund | | $ | 8,517,491 | | | $ | 11,967,397 | |
Real Estate Fund | | | 19,488,324 | | | | 21,816,237 | |
Select Income Fund | | | 451,683,837 | | | | 704,462,235 | |
Select Opportunity Fund | | | 4,772,103 | | | | 6,720,531 | |
Tactical Real Estate Fund | | | 41,262,865 | | | | 66,746,173 | |
Notes to Financial Statements
December 31, 2017
10. TAX BASIS INFORMATION
Reclassifications: At December 31, 2017, permanent differences in book and tax accounting were reclassified. These differences had no effect on net assets and were primarily attributed to differences in the treatment of foreign currency, expiration of capital loss carryforwards, treatment of passive foreign investment companies and differences in the book to tax treatment of certain investments. These reclassifications were as follows:
| | | | | | | | | | | | |
| Fund | | Increase/
(Decrease)
Paid-in Capital | | | Increase/(Decrease)
Accumulated Net
Investment Income/(Loss) | | | Increase/(Decrease)
Accumulated Net
Realized Gain/(Loss) | |
International Real Estate Fund | | $ | (60,639,641 | ) | | $ | 469,453 | | | $ | 60,170,188 | |
Real Estate Fund | | | — | | | | — | | | | — | |
Select Income Fund | | | (1 | ) | | | 28,450 | | | | (28,449 | ) |
Select Opportunity Fund | | | (386 | ) | | | 1,168 | | | | (782 | ) |
Tactical Real Estate Fund | | | (107,182,629 | ) | | | (1,079 | ) | | | 107,183,708 | |
Tax Basis of Investments: Differences in book and tax accounting for cost basis of investments are primarily attributable to realization of unrealized gain/ (losses) for tax purposes, treatment of passive foreign investment companies and the deferral of losses on wash sales. The following information is provided on a tax basis as of December 31, 2017 and includes investments and securities sold short, and excludes foreign currency:
| | | | | | | | | | | | | | | | |
| Fund | | Cost of
Investments | | | Gross
Unrealized
Appreciation | | | Gross
Unrealized
Depreciation | | | Net Unrealized
Appreciation/
(Depreciation) | |
International Real Estate Fund | | $ | 20,302,965 | | | $ | 1,353,445 | | | $ | (215,745 | ) | | $ | 1,137,700 | |
Real Estate Fund | | | 26,184,016 | | | | 4,163,679 | | | | (1,885,327 | ) | | | 2,278,352 | |
Select Income Fund | | | 735,154,222 | | | | 98,121,936 | | | | (33,740,534 | ) | | | 64,381,402 | |
Select Opportunity Fund | | | 8,305,667 | | | | 794,920 | | | | (1,445,278 | ) | | | (650,358 | ) |
Tactical Real Estate Fund | | | 35,326,947 | | | | 4,702,025 | | | | (2,509,058 | ) | | | 2,192,967 | |
Capital Losses: Under the Regulated Investment Company Modernization Act of 2010 (the “Act”), capital losses incurred after December 31, 2010 may now be carried forward indefinitely, but must retain the character of the original loss. However, such losses must be utilized prior to the pre-enactment capital loss, which increases the likelihood that the pre-enactment capital losses will expire unused. Under the pre-enactment law, capital losses could be carried forward for eight years and carried forward as short-term capital losses irrespective of the character of the original loss. As of December 31, 2017, the following Funds had available for Federal income tax purposes unused capital losses that may be used to offset future realized capital gains as follows:
| | | | | | | | | | | | | | | | |
| Fund | | Expiring in
2018(a) | | | Short-Term(b) | | | Long-Term(b) | | | Total | |
International Real Estate Fund | | $ | 3,986,802 | | | $ | 13,460,119 | | | $ | 8,867,278 | | | $ | 26,314,199 | |
Select Opportunity Fund | | | — | | | | 349,128 | | | | 2,042,769 | | | | 2,391,897 | |
Tactical Real Estate Fund | | | — | | | | 162,626 | | | | 177,209 | | | | 339,835 | |
(a) Capital losses incurred prior to December 31, 2010 under pre-enactment law.
(b) Capital losses incurred after December 31, 2010 under the Act and not subject to expiration.
Notes to Financial Statements
December 31, 2017
Capital loss carryovers used during the year ended December 31, 2017 were:
| | | | |
| Fund | | Amount | |
International Real Estate Fund | | $ | (48,958 | ) |
Select Opportunity Fund | | | (173,072 | ) |
The Funds elect to defer to the period ending December 31, 2018 capital losses and late-year ordinary losses recognized during the period November 1, 2017 to December 31, 2017 in the amount of:
| | | | | | | | |
| Fund | | Capital
Losses
Total | | | Ordinary
Losses
Total | |
International Real Estate Fund | | $ | 106,970 | | | $ | — | |
Select Opportunity Fund | | | 759 | | | | — | |
Tactical Real Estate Fund | | | 847,876 | | | | — | |
Tax Basis of Distributable Earning: At December 31, 2017 the following components of accumulated earnings on a tax basis were as follows:
| | | | | | | | | | | | | | | | |
| | | Accumulated
Capital Gains/(Losses) | | | Undistributed
Ordinary
Income | | | Net Unrealized
Appreciation/
(Depreciation) | | | Total | |
International Real Estate Fund | | $ | (26,421,169 | ) | | $ | 999,198 | | | $ | 1,138,462 | | | $ | (24,283,509 | ) |
Real Estate Fund | | | 183,573 | | | | — | | | | 2,278,352 | | | | 2,461,925 | |
Select Income Fund | | | 5,263,375 | | | | — | | | | 64,381,402 | | | | 69,644,777 | |
Select Opportunity Fund | | | (2,392,656 | ) | | | — | | | | (649,958 | ) | | | (3,042,614 | ) |
Tactical Real Estate Fund | | | (1,187,711 | ) | | | — | | | | 2,192,965 | | | | 1,005,254 | |
Tax Character of Distributions to Shareholders: Income and long-term capital gain distributions are determined in accordance with Federal income tax regulations, which may differ from GAAP.
The tax character of distributions paid for the year ended December 31, 2017 were as follows:
| | | | | | | | | | | | |
| Fund | | Ordinary
Income Total | | | Long-Term
Capital Gain
Total | | | Return of
Capital Total | |
International Real Estate Fund | | $ | 1,413,732 | | | $ | — | | | $ | — | |
Real Estate Fund | | | 632,637 | | | | 1,369,592 | | | | — | |
Select Income Fund | | | 29,533,893 | | | | 50,443,795 | | | | — | |
Select Opportunity Fund | | | 34,871 | | | | — | | | | 187,700 | |
Tactical Real Estate Fund | | | 311,031 | | | | — | | | | 1,230,428 | |
The tax character of distributions paid for the year ended December 31, 2016 were as follows:
| | | | | | | | | | | | |
| Fund | | Ordinary
Income Total | | | Long-Term
Capital Gain
Total | | | Return of
Capital Total | |
International Real Estate Fund | | $ | 1,255,180 | | | $ | — | | | $ | — | |
Real Estate Fund | | | 638,862 | | | | 9,352,703 | | | | — | |
Select Income Fund | | | 37,555,681 | | | | 33,878,790 | | | | — | |
Select Opportunity Fund | | | 257,000 | | | | — | | | | 107,161 | |
Tactical Real Estate Fund | | | 1,425,464 | | | | — | | | | — | |
The Funds may own shares in certain foreign investment entities referred to under U.S. tax law, as “passive foreign investment companies” (PFICs). The Funds may elect to mark-to-market annually the shares of each PFIC and may be required to include in distributable income to shareholders any such mark-to market gains.
Notes to Financial Statements
December 31, 2017
11. SCHEDULE OF INVESTMENTS
The investment categories used in this report may differ from the industry classification categories used for determining compliance with industry concentration restrictions and requirements applicable to each of the Funds.
12. AFFILIATED COMPANIES
As defined by the 1940 Act, an affiliated company is one in which a Fund owns 5% or more of the outstanding voting securities or a company that is under common ownership or control.
During the year ended December 31, 2017, Select Income Fund owned 5% or more of the outstanding voting securities of the securities identified in the table below. The purchases, sales, dividend income, realized capital gains, change in unrealized appreciation/depreciation, shares and value of investment by each fund in affiliated companies for the year ended December 31, 2017 were as follows:
| | | | | | | | | | | | | | | | | | | | | | | | | | | | | | | | |
| Security Name | | Beginning
Shares | | | Gross
Purchases | | | Gross
Sales | | | Ending
Shares | | | Value
12/31/17 | | | Dividend
Income | | | Change in
Unrealized
Appreciation/
Depreciation | | | Realized
Gain/
(Loss) | |
| Investments in affiliates held as of December 31, 2017 | | | | | | | | | | | | | | | | | | | | | |
Common Stocks | | | | | | | | | | | | | | | | | | | | | | | | | | | | | | | | |
Clipper Realty, Inc. | | | 296,296 | | | | 644,500 | | | | — | | | | 940,796 | | | $ | 9,398,552 | | | $ | 348,095 | | | $ | (3,387,529 | ) | | $ | — | |
Jernigan Capital, Inc. | | | 472,200 | | | | 824,500 | | | | — | | | | 1,296,700 | | | | 24,650,267 | | | | 453,845 | | | | (2,489,441 | ) | | | — | |
| | | | | | | | | | | | | | | | | | | | | | | | | | | | | | | | |
| | | | | | | | | | | | | | | | | | $ | 34,048,819 | | | $ | 801,940 | | | $ | (5,876,970 | ) | | $ | — | |
| | | | | | | | | | | | | | | | | | | | | | | | | | | | | | | | |
| Investments in affiliates no longer held or affiliated as of December 31, 2017 | | | | | | | | | | | | | | | | | |
Common Stocks | | | | | | | | | | | | | | | | | | | | | | | | | | | | | | | | |
MedEquities Realty Trust, Inc. | | | 1,947,200 | | | | — | | | | (1,894,616 | ) | | | 52,584 | | | $ | 589,993 | | | $ | 1,104,529 | | | $ | 6,470,960 | | | $ | (5,748,069 | ) |
Peak Resorts, Inc. | | | 1,182,000 | | | | — | | | | (1,182,000 | ) | | | — | | | | — | | | | 132,386 | | | | 3,939,401 | | | | (4,095,216 | ) |
| | | | | | | | | | | | | | | | | | | | | | | | | | | | | | | | |
| | | | | | | | | | | | | | | | | | $ | 589,993 | | | $ | 1,236,915 | | | $ | 10,410,361 | | | $ | (9,843,285 | ) |
| | | | | | | | | | | | | | | | | | | | | | | | | | | | | | | | |
| | | | | | | | | | | | | | | Total | | | | | | | $ | 2,038,855 | | | $ | 4,533,391 | | | $ | (9,843,285 | ) |
| | | | | | | | | | | | | | | | | | | | | | | | | | | | | | | | |
13. SEC REGULATIONS
On October 13, 2016, the SEC amended Regulation S-X to require standardized, enhanced disclosure about derivatives in investment company financial statements, as well as other amendments. Effective August 1, 2017, the Fund adopted disclosure requirement changes for Regulation S-X and these changes are reflected throughout this report. The Funds’ adoption of those amendments, effective with the financial statements prepared as of December 31, 2017, had no effect on the Funds’ net assets or results of operations.
14. NEW ACCOUNTING PRONOUNCEMENTS
In March 2017, the Financial Accounting Standards Board (“FASB”) issued Accounting Standards Update “Premium Amortization on Purchased Callable Debt Securities” which amends the amortization
period for a callable debt security held at a premium from the maturity date to the earliest call date. The guidance is effective for annual periods beginning after December 15, 2018, and interim periods within those annual periods. At this time, management is evaluating the implications of these changes on the funds.
In November 2016, the FASB issued Accounting Standards Update “Restricted Cash” which will require entities to include the total of cash, cash equivalents, restricted cash, and restricted cash equivalents in the beginning and ending cash balances in the Statement of Cash Flows. The guidance is effective for fiscal years beginning after December 15, 2017, and interim periods within those years. At this time, management is evaluating the impact, if any, of this guidance on the Funds’ presentation in the Statement of Cash Flows.
Notes to Financial Statements
December 31, 2017
15. SUBSEQUENT EVENTS
The Funds have evaluated the need for disclosures and/or adjustments resulting from subsequent events through the date the financial statements were issued. Based on this evaluation, no adjustments were required to the financial statements as of December 31, 2017.
The Funds file a complete schedule of portfolio holdings with the U.S. Securities and Exchange Commission (“SEC”) for the first and third quarters of each fiscal year on Form N-Q. The Funds’ Form N-Q was filed for the quarter ended September 30, 2017. The Funds’ Form N-Q is available on the SEC’s website at www.sec.gov and may also be reviewed and copied at the SEC’s Public Reference Room in Washington, DC. Information on the operation of the Public Reference Room may be obtained by calling 1-800-SEC-0330. A description of the Funds’ proxy voting policies and procedures and how the Funds voted proxies relating to portfolio securities during the most recent 12-month period ended June 30, 2017 are available (i) without charge, upon request, by calling 1-800-999-6809 and (ii) on the SEC’s website at www.sec.gov.
Report of Independent Registered Public Accounting Firm
To the Shareholders and Board of Trustees of Forward Funds:
Opinion on the Financial Statements
We have audited the accompanying statements of assets and liabilities of Salient International Real Estate Fund, Salient Real Estate Fund, Salient Select Income Fund, Salient Select Opportunity Fund, and Salient Tactical Real Estate Fund (collectively, the “Funds”), including the schedules of investments, as of December 31, 2017, the related statements of operations and cash flows (for the Salient Select Income Fund, Salient Select Opportunity Fund, and Salient Tactical Real Estate Fund) for the year then ended, the statements of changes in net assets for each of the years in the two-year period then ended, and the related notes (collectively, the “financial statements”) and the financial highlights for each of the years in the three-year period then ended. In our opinion, the financial statements and financial highlights present fairly, in all material respects, the financial position of the Funds as of December 31, 2017, the results of their operations and cash flows for the year then ended, the changes in their net assets for each of the years in the two-year period then ended, and the financial highlights for each of the years in the three-year period then ended, in conformity with U.S. generally accepted accounting principles. The accompanying financial highlights for each of the years or periods in the two year period ended December 31, 2014 were audited by other auditors, whose report thereon dated February 24, 2015, expressed an unqualified opinion on those financial highlights.
Basis for Opinion
These financial statements and financial highlights are the responsibility of the Funds’ management. Our responsibility is to express an opinion on these financial statements and financial highlights based on our audits. We are a public accounting firm registered with the Public Company Accounting Oversight Board (United States) (“PCAOB”) and are required to be independent with respect to the Funds in accordance with the U.S. federal securities laws and the applicable rules and regulations of the Securities and Exchange Commission and the PCAOB.
We conducted our audits in accordance with the standards of the PCAOB. Those standards require that we plan and perform the audit to obtain reasonable assurance about whether the financial statements and financial highlights are free of material misstatement, whether due to error or fraud. Our audits included performing procedures to assess the risks of material misstatement of the financial statements and financial highlights, whether due to error or fraud, and performing procedures that respond to those risks. Such procedures included examining, on a test basis, evidence regarding the amounts and disclosures in the financial statements and financial highlights. Such procedures also included confirmation of securities owned as of December 31, 2017, by correspondence with the custodian and brokers or by other appropriate auditing procedures. Our audits also included evaluating the accounting principles used and significant estimates made by management, as well as evaluating the overall presentation of the financial statements and financial highlights. We believe that our audits provide a reasonable basis for our opinion.
/s/ KPMG LLP
We have served as the auditor of one or more Salient investment companies since 2003.
Columbus, Ohio
February 26, 2018
88
Tax Information (Unaudited)
December 31, 2017
Pursuant to Section 852(b)(3) of the Internal Revenue Code the following Funds designate the amounts listed below as long-term capital gain dividends:
| | | | |
Real Estate Fund | | $ | 1,369,592 | |
Select Income Fund | | | 50,443,795 | |
The following Funds designate the percentages listed below of the income dividends distributed between January 1, 2017 and December 31, 2017, as qualified dividend income (QDI) as defined in Section 1(h)(11) of the Internal Revenue Code:
| | | | |
International Real Estate Fund | | | 13.96 | % |
Real Estate Fund | | | 1.77 | % |
Select Income Fund | | | 3.58 | % |
Select Opportunity Fund | | | 68.73 | % |
Tactical Real Estate Fund | | | 7.25 | % |
The following Funds designate the percentages listed below of the income dividends distributed between January 1, 2017 and December 31, 2017, as qualifying for the corporate dividends received deduction (DRD) as defined in Section 854(b)(2) of the Internal Revenue Code:
| | | | |
Select Income Fund | | | 0.50 | % |
Select Opportunity Fund | | | 3.25 | % |
Pursuant to Section 853(c) of the Internal Revenue Code, the following Funds designate the amounts listed below as foreign taxes paid and foreign source income earned between January 1, 2017 and December 31, 2017, respectively.
| | | | | | | | |
| | | Foreign Taxes
Paid | | | Foreign
Source
Income | |
International Real Estate Fund | | $ | 35,933 | | | $ | 674,308 | |
Section 19 Notices
The amounts and sources of distributions reported are only estimates and are not being provided for tax reporting purposes. The actual amounts and sources for tax reporting purposes will depend upon the Fund’s investment experience during the year and may be subject to changes based on the tax regulations. The Fund will send you a Form 1099-DIV each calendar year that will tell you how to report these distributions for Federal income tax purposes.
| | | | | | | | | | | | | | | | | | | | | | | | | | | | | | | | |
| | | Per Share | | | Percentage | |
| | | Net
Investment
Income | | | Net
Realized
Capital
Gains | | | Return of
Capital | | | Total Per Share | | | Net Investment
Income | | | Net
Realized
Capital
Gains | | | Return of
Capital | | | Total Per Share | |
| Real Estate Fund | | | | | | | | | | | | | | | | | | | | | | | | | | | | | | | | |
Institutional Class | | $ | 0.148622 | | | $ | 0.603498 | | | | — | | | $ | 0.752120 | | | | 19.76 | % | | | 80.24 | % | | | — | | | | 100.00 | % |
Investor Class | | $ | 0.121969 | | | $ | 0.586481 | | | | — | | | $ | 0.708450 | | | | 17.22 | % | | | 82.78 | % | | | — | | | | 100.00 | % |
Class A | | $ | 0.118803 | | | $ | 0.584407 | | | | — | | | $ | 0.703210 | | | | 16.89 | % | | | 83.11 | % | | | — | | | | 100.00 | % |
Class C | | $ | 0.075490 | | | $ | 0.557060 | | | | — | | | $ | 0.632550 | | | | 11.93 | % | | | 88.07 | % | | | — | | | | 100.00 | % |
89
Tax Information (Unaudited)
December 31, 2017
| | | | | | | | | | | | | | | | | | | | | | | | | | | | | | | | |
| | |
| | | Per Share | | | Percentage | |
| | | Net
Investment
Income | | | Net
Realized
Capital
Gains | | | Return of
Capital | | | Total Per Share | | | Net Investment
Income | | | Net
Realized
Capital
Gains | | | Return of
Capital | | | Total Per Share | |
| Select Income Fund | | | | | | | | | | | | | | | | | | | | | | | | | | | | | | | | |
Institutional Class | | $ | 0.704712 | | | $ | 1.469218 | | | | — | | | $ | 2.173930 | | | | 32.42 | % | | | 67.58 | % | | | — | | | | 100.00 | % |
Investor Class | | $ | 0.632892 | | | $ | 1.397928 | | | | — | | | $ | 2.030820 | | | | 31.16 | % | | | 68.84 | % | | | — | | | | 100.00 | % |
Class A | | $ | 0.631092 | | | $ | 1.394088 | | | | — | | | $ | 2.025180 | | | | 31.16 | % | | | 68.84 | % | | | — | | | | 100.00 | % |
Class B | | $ | 0.176554 | | | $ | 0.026006 | | | | — | | | $ | 0.202560 | | | | 87.16 | % | | | 12.84 | % | | | — | | | | 100.00 | % |
Class C | | $ | 0.538122 | | | $ | 1.363098 | | | | — | | | $ | 1.901220 | | | | 28.30 | % | | | 71.70 | % | | | — | | | | 100.00 | % |
Advisor Class | | $ | 0.240284 | | | $ | 0.026006 | | | | — | | | $ | 0.266290 | | | | 90.23 | % | | | 9.77 | % | | | — | | | | 100.00 | % |
| | | | | | | | |
| | | Net
Investment
Income | | | Net
Realized
Capital
Gains | | | Return of
Capital | | | Total Per Share | | | Net Investment
Income | | | Net
Realized
Capital
Gains | | | Return of
Capital | | | Total Per Share | |
| Select Opportunity Fund | | | | | | | | | | | | | | | | | | | | | | | | | | | | | | | | |
Institutional Class | | $ | 0.108589 | | | | — | | | $ | 0.584501 | | | $ | 0.693090 | | | | 15.67 | % | | | — | | | | 84.33 | % | | | 100.00 | % |
Investor Class | | $ | 0.096213 | | | | — | | | $ | 0.517887 | | | $ | 0.614100 | | | | 15.67 | % | | | — | | | | 84.33 | % | | | 100.00 | % |
Class A | | $ | 0.090449 | | | | — | | | $ | 0.486861 | | | $ | 0.577310 | | | | 15.67 | % | | | — | | | | 84.33 | % | | | 100.00 | % |
Class C | | $ | 0.072375 | | | | — | | | $ | 0.389575 | | | $ | 0.461950 | | | | 15.67 | % | | | — | | | | 84.33 | % | | | 100.00 | % |
| | |
| | | Per Share | | | Percentage | |
| | | Net
Investment
Income | | | Net
Realized
Capital
Gains | | | Return of
Capital | | | Total Per Share | | | Net Investment
Income | | | Net
Realized
Capital
Gains | | | Return of
Capital | | | Total Per Share | |
| Tactical Real Estate Fund | | | | | | | | | | | | | | | | | | | | | | | | | | | | | | | | |
Institutional Class | | $ | 0.242163 | | | | — | | | $ | 0.957987 | | | $ | 1.200150 | | | | 20.18 | % | | | — | | | | 79.82 | % | | | 100.00 | % |
Investor Class | | $ | 0.217798 | | | | — | | | $ | 0.861602 | | | $ | 1.079400 | | | | 20.18 | % | | | — | | | | 79.82 | % | | | 100.00 | % |
Class A | | $ | 0.214049 | | | | — | | | $ | 0.846771 | | | $ | 1.060820 | | | | 20.18 | % | | | — | | | | 79.82 | % | | | 100.00 | % |
Class B | | $ | 0.010908 | | | | — | | | $ | 0.043152 | | | $ | 0.054060 | | | | 20.18 | % | | | — | | | | 79.82 | % | | | 100.00 | % |
Class C | | $ | 0.172459 | | | | — | | | $ | 0.682241 | | | $ | 0.854700 | | | | 20.18 | % | | | — | | | | 79.82 | % | | | 100.00 | % |
Advisor Class | | $ | 0.025900 | | | | — | | | $ | 0.102460 | | | $ | 0.128360 | | | | 20.18 | % | | | — | | | | 79.82 | % | | | 100.00 | % |
90
Additional Company Information (Unaudited)
MANAGEMENT OF THE FUNDS
Board of Trustees and Officers
Each Fund’s operations are managed under the direction and oversight of the Board of Trustees (the “Board”). The Board appoints officers of the Trust (“Salient FF Trust”) who are responsible for the Funds’ day-to-day business decisions based on policies set by the Board. The officers serve at the pleasure of the Board.
As of December 31, 2017, there were ten Trustees, eight of whom are not “interested persons” of the Trust within the meaning of that term under the 1940 Act (each, an “Independent Trustee”). The Trustees and officers of the Trust also may be directors or officers of some or all of the other registered investment companies, including the Salient MF Trust (together, with the Salient FF Trust, the “Trusts”), managed by Salient and its affiliates (hereafter, Salient and Forward Management, both jointly and individually, are referred to as the “Advisor”). Each Trustee holds office for an indefinite term until his/her successor is duly elected and qualified or until he/she dies, retires, resigns, is removed or becomes disqualified. The table below shows, for each Trustee and executive officer, his/her full name, and year of birth, the position held with the Trusts, the length of time served in that position, his/her principal occupation during the last five years, and other directorships held by such Trustee. The address of each Trustee and officer is c/o Salient MF Trust, 4265 San Felipe, Suite 800, Houston, Texas 77027 or c/o Forward Funds, 345 California Street, Suite 1600, San Francisco, California 94104. The Trust’s Statement of Additional Information includes additional information about the Trustees and is available at www.salientpartners.com or upon request, without charge, by calling 800-999-6809.
Interested Trustees*
| | | | | | | | | | |
Name and
Year of Birth | | Position(s)
with the Trusts | | | | Principal Occupation(s) During the Past 5 Years | | Number of
Portfolios in Fund
Complex
Overseen by
Trustee(1) | | Other
Directorships
During
Past 5 Years** |
John A. Blaisdell* Year of Birth: 1960 | | Salient MF Trust Trustee, President and Principal Executive Officer (since 2012); Chairman of the Board (2012 to 2015) Salient FF Trust Trustee, President and Principal Executive Officer (since 2015) | | | | Managing Director of Salient (since 2002). | | 19 | | The Salient Private Access Funds (investment companies) (four funds) (since 2004); The Endowment PMF Funds (investment companies) (three funds) (since 2014); Salient Midstream & MLP Fund (investment company) (since 2012). |
| | | | | |
Jeremy L. Radcliffe*
Year of Birth: 1974 | | Salient MF Trust Trustee, Secretary (since 2012) Salient FF Trust Trustee, Secretary (since 2015) | | | | President, Forward Securities, LLC (since 2015); Managing Director of Salient (since 2002); Secretary, Salient Midstream & MLP Fund (since 2012). | | 19 | | None. |
91
Additional Company Information (Unaudited)
Independent Trustees***
| | | | | | | | | | |
Name and
Year of Birth | | Position(s)
with the
Trusts | | | | Principal Occupation(s) During the Past 5 Years | | Number of
Portfolios in Fund
Complex
Overseen by
Trustee(1) | | Other
Directorships
During
Past 5 Years** |
Julie Allecta Year of Birth: 1946 | | Salient MF Trust Trustee (since 2015); Audit Committee Chairperson (since 2016) Salient FF Trust Trustee, Audit Committee Chairperson (since 2012) | | | | Retired Partner, Paul Hastings, Janofsky & Walker LLP (1999 to 2009); Member of Executive Committee and Governing Council, Independent Directors Council (since 2014); Director, WildCare Bay Area (2007-2017); Parliamentarian and Director, American Society of Botanical Artists, Northern California Chapter (2014 to 2015). | | 18 | | Trustee, Litman Gregory Funds Trust (since 2013). |
| | | | | |
Karin B. Bonding, CFA Year of Birth: 1939 | | Salient MF Trust Trustee (since 2012) Salient FF Trust Trustee (since 2015) | | | | Lecturer, University of Virginia (1996 to 2015); President of Capital Markets Institute, Inc. (retired) (fee-only financial planner and investment advisor) (1996 to 2016). | | 19 | | The Salient Private Access Funds (investment companies) (four funds) (since 2010); The Endowment PMF Funds (investment companies) (three funds) (since 2010); Brandes Investment Trust (investment companies) (four funds) (2006 to 2012); Credit Suisse Alternative Capital Funds (investment companies) (six funds) (2005 to 2010); Salient Midstream & MLP Fund (investment company) (since 2012). |
92
Additional Company Information (Unaudited)
| | | | | | | | | | |
Name and
Year of Birth | | Position(s)
with the
Trusts | | | | Principal Occupation(s) During the Past 5 Years | | Number of
Portfolios in Fund
Complex
Overseen by
Trustee(1) | | Other
Directorships
During
Past 5 Years** |
Jonathan P. Carroll Year of Birth: 1961 | | Salient MF Trust Trustee (since 2012) Salient FF Trust Trustee (since 2015) | | | | President, Lazarus Capital LLC (Investment company) (since 2006); President, Lazarus Energy Holdings, LLC (Investment holding company) (since 2006); President and CEO of Blue Dolphin Energy Company (since 2012); private investor (since 1988). | | 19 | | The Salient Private Access Funds (investment companies) (four funds) (since 2004); The Endowment PMF Funds (investment companies) (three funds) (since 2014); LRR Energy, L.P. (LRE) (energy company) (2014 to 2015); Blue Dolphin Energy Company (BDCO) (energy company) (since 2014); Salient Midstream & MLP Fund (investment company) (since 2012). |
| | | | | |
A. John Gambs Year of Birth: 1945 | | Salient MF Trust Trustee (since 2015) Salient FF Trust Trustee (since 2012) | | | | Director and Compensation Committee Chair, NMI Holdings, Inc. (2011 to 2012); Trustee and Audit Committee Chair, Barclays Global Investors Funds (2006 to 2010); Trustee and Audit Committee Chair, Master Investment Portfolio (2006 to 2010); Advisory Board Member, Fairview Capital Management (since 2009); Director, San Francisco Classical Voice (2011 to 2016); Member, Board of Governors San Francisco Symphony (since 2001); Director, The New Century Chamber Orchestra (since 2010); Executive Vice President and Chief Financial Officer, The Charles Schwab Corporation (1988 to 1996); President and Director, Gambs Family Foundation (1997 to 2010). | | 18 | | None. |
93
Additional Company Information (Unaudited)
| | | | | | | | | | |
Name and
Year of Birth | | Position(s)
with the
Trusts | | | | Principal Occupation(s) During the Past 5 Years | | Number of
Portfolios in Fund
Complex
Overseen by
Trustee(1) | | Other
Directorships
During
Past 5 Years** |
Dr. Bernard A. Harris, Jr. Year of Birth: 1956 | | Salient MF Trust Trustee (since 2012) Salient FF Trust Trustee (since 2015) | | | | Chief Executive Officer and Managing Partner, Vesalius Ventures, Inc. (venture investing) (since 2002); President of The Harris Foundation (non-profit) (since 1998); clinical scientist, flight surgeon and astronaut for NASA (1986 to 1996). | | 19 | | The Salient Private Access Funds (investment companies) (four funds) (since 2009); Barings Funds (previously Babson Funds) (eleven funds) (since 2011); Monebo Technologies Inc. (since 2009); The National Math and Science Initiative (since 2008); Communities in Schools (since 2007); American Telemedicine Association (2007 to 2014); U.S. Physical Therapy, Inc. (since 2005); Houston Technology Center (2004 to 2016); The Harris Foundation, Inc. (since 1998); Salient Midstream & MLP Fund (investment company) (since 2012). |
| | | | | |
Cecilia H. Herbert Year of Birth: 1949 | | Salient MF Trust Trustee (since 2015), Nominating Committee Chairperson (since 2016) Salient FF Trust Trustee (since 2009), Nominating Committee Chairperson (since 2010) | | | | Trustee, Stanford HealthCare (since 2016); Trustee, WNET, the public media company of New York (since 2011); Member, Archdiocese Finance Committee, the advisory council to the San Francisco Catholic Archdiocese (since 1994); Director (2000 to 2013) and President (2007 to 2010) of the Board, Catholic Charities CYO; Trustee, The Thacher School (2002 to 2011); Managing Director and head of San Francisco Office, J.P. Morgan/Morgan Guaranty Trust Company, a commercial and investment banking institution (1973 to 1976 and 1978 to 1991). | | 18 | | Director (since 2005) and Chair (since 2016), iShares Inc.; Trustee (since 2005) and Chair (since 2016), iShares Trust; Trustee, Pacific Select Funds (2004 to 2005); Trustee, The Montgomery Funds (1992 to 2003). |
| | | | |
| See accompanying Notes to Financial Statements. | | 94 | | |
Additional Company Information (Unaudited)
| | | | | | | | | | |
Name and
Year of Birth | | Position(s)
with the
Trusts | | | | Principal Occupation(s) During the Past 5 Years | | Number of
Portfolios in Fund
Complex
Overseen by
Trustee(1) | | Other
Directorships
During
Past 5 Years** |
Haig G. Mardikian Year of Birth: 1947 | | Salient MF Trust Trustee and Chairman of the Board (since 2015) Salient FF Trust Trustee (since 1998), Chairman of the Board (since 2005) | | | | Owner of Haig G. Mardikian Enterprises, a real estate investment business (since 1971); General Partner of M&B Development, a real estate investment business (since 1983); General Partner of George M. Mardikian Enterprises, a real estate investment business (1983 to 2002); President and Director of Adiuvana-Invest, Inc., a real estate investment business (since 1989); President of the William Saroyan Foundation (since 1992); Managing Director of the United Broadcasting Company, radio broadcasting (1983 to 2001); Trustee of the International House of UC Berkeley (2001 to 2007); Director of the Downtown Association of San Francisco (1982 to 2006); Director of the Market Street Association (1982 to 2006); Trustee of Trinity College (1998 to 2007); Trustee of the Herbert Hoover Presidential Library (since 1997); Trustee of the Herbert Hoover Foundation (since 2002); Trustee of the Advisor California Civil Liberties Public Education Fund (1997 to 2006); Director of The Walnut Management Co., a privately held family investment company (since 2008); President of the Foundation of City College (2006 to 2010); Director of Near East Foundation (since 2007). | | 18 | | Chairman and Director of SIFE Trust Fund (1978 to 2001). |
| | | | | |
Scott E. Schwinger Year of Birth: 1965 | | Salient MF Trust Trustee (since 2012) Salient FF Trust Trustee (since 2015) | | | | President, The McNair Group (management), (since 2006); Senior Vice President and Chief Financial Officer, the Houston Texans (professional football team) (1999). | | 19 | | The Salient Private Access Funds (investment companies) (four funds) (since 2004); The Endowment PMF Funds (investment companies) (three funds) (since 2014); Houston Technology Center (2013-2017); The Make-A-Wish Foundation (since 2008); Nine Energy Services (since 2017); Salient Midstream & MLP Fund (investment company) (since 2012). |
| * | This person’s status as an “interested” Trustee arises from his affiliation with the Advisor. |
| ** | This column includes only directorships of companies required to report to the SEC under the Securities Exchange Act of 1934 (i.e., public companies) or other investment companies registered under the 1940 Act. |
| *** | Richard C. Johnson served as an Independent Trustee of both the Salient MF Trust and the Salient FF Trust during the fiscal year ended December 31, 2017. Mr. Johnson served as an Independent Trustee of the Salient MF Trust since 2012, and of the Salient FF Trust since 2015, through his retirement effective December 31, 2017. |
95
Additional Company Information (Unaudited)
| (1) | The Fund Complex for the purposes of this table consists of 18 open-end funds in the Salient MF Trust and the Salient FF Trust (each, a “Trust”), with the series of each Trust being advised by either the Advisor or an affiliate of the Advisor; and 1 public closed-end fund advised by either the Advisor or an affiliate of the Advisor. |
Officers of the Funds Who Are Not Trustees
| | | | |
| Name and Year of Birth | | Position(s) with the Trusts | | Principal Occupation(s) During Past 5 Years |
Paul A. Bachtold Year of Birth: 1973 | | Salient MF Trust Chief Compliance Officer (since 2012) Salient FF Trust Chief Compliance Officer (since 2016) | | Chief Compliance Officer and Secretary, Forward Securities (since 2016); Chief Compliance Officer, Forward Management, LLC (since 2015); Chief Compliance Officer, The Salient Private Access Funds (four funds) (since 2010); Chief Compliance Officer, The Endowment PMF Funds (three funds) (since 2014); Chief Compliance Officer, Salient (since 2010); Chief Compliance Officer, Salient Midstream & MLP Fund (since 2012); Consultant, Chicago Investment Group (compliance consulting) (2009 to 2010); US Compliance Manager, Barclays Global Investors (2005 to 2008). |
| | |
Barbara H. Tolle Year of Birth: 1949 | | Salient MF Trust Treasurer and Principal Financial Officer (since 2017) Salient FF Trust Treasurer and Principal Financial Officer (since 2006) | | Treasurer and Principal Financial Officer, Salient MF Trust (since 2017); Treasurer and Principal Financial Officer, Salient Midstream & MLP Fund (since 2017); Treasurer and Principal Financial Officer, Forward Funds (since 2006); Treasurer, The Salient Private Access Funds (four funds) (since 2017); Treasurer, The Endowment PMF Funds (three funds) (since 2017); Vice President, Director of Fund Accounting and Operations, Forward Management, LLC (since 2006); Vice President and Director, Fund Accounting and Administration, PFPC Inc. (1998 to 2006). |
| | |
John E. Price Year of Birth: 1967 | | Salient MF Trust Vice President (since 2017) Salient FF Trust Vice President (since 2017) | | Managing Director, Chief Financial Officer and Treasurer, Salient Capital Advisors, LLC (since 2011); Partner, Salient Partners, L.P. (since 2003); Chief Financial Officer and Treasurer, Salient Partners, L.P. (since 2005); Chief Financial Officer and Treasurer, Salient Trust Co., LTA (since 2005); Chief Financial Officer and Treasurer, Forward Management, LLC (since 2015); Chief Financial Officer and Treasurer, Salient Advisors, L.P. (since 2006); Chief Financial Officer and Treasurer, Endowment Advisers, L.P. (since 2004); Interim Principal Financial Officer, The Salient Private Access Funds (four funds) (since 2017); Interim Principal Financial Officer, The Endowment PMF Funds (three funds) (since 2017); Vice President, Salient Midstream & MLP Fund (since 2017). |
| | |
Kristen Bayazitoglu Year of Birth: 1981 | | Salient MF Trust Vice President (since 2017) Salient FF Trust Vice President (since 2017) | | Chief Operating Officer of Asset Management, Salient Partners, L.P. (since 2017); Vice President, The Salient Private Access Funds (four funds) (since 2017); Vice President, The Endowment PMF Funds (three funds) (since 2017); Vice President of Operations, Salient Partners, L.P. (March 2012 – June 2017); Vice President, Salient Midstream & MLP Fund (since 2017). |
| | |
Steve Leonhardt Year of Birth: 1959 | | Salient MF Trust Vice President (since 2017) Salient FF Trust Vice President (since 2017) | | Vice President of Salient (since 2017); Vice President, The Salient Private Access Funds (four funds) (since 2017); Vice President, The Endowment PMF Funds (three funds) (since 2017); Vice President, Salient Midstream & MLP Fund (since 2017); Controller of Stifel Financial Corp. (2015-2017), self-employed (2013-2015), Vice President of Charles Schwab Investment Management (2009-2013). |
96
Additional Company Information (Unaudited)
| | | | |
| Name and Year of Birth | | Position(s) with the Trusts | | Principal Occupation(s) During Past 5 Years |
Kathryn A. Burns Year of Birth: 1976 | | Salient FF Trust Assistant Treasurer (since 2014) | | Vice President and Fund Controller, ALPS Fund Services, Inc. (since 2013); Vice President and Chief Compliance Officer, Old Mutual Capital (2010 to 2012); Vice President and Regulatory Reporting Manager, Old Mutual Capital (2006 to 2012); Manager, PricewaterhouseCoopers LLP (2004 to 2006). |
97
Board Consideration of the Investment Management Agreement (Unaudited)
At an in-person meeting of the Board held on October 17, 2017, the Board, including the Trustees who are not “interested persons” as that term is defined in the Investment Company Act of 1940, as amended (the “Independent Trustees”), considered and approved the continuation of the Investment Management Agreement between Forward Funds (the “Trust”), on behalf of its series Salient International Real Estate Fund, Salient Real Estate Fund, Salient Select Income Fund, Salient Select Opportunity Fund, and Salient Tactical Real Estate Fund (each a “Fund,” and together, the “Funds”), and Forward Management, LLC d/b/a Salient (“Salient Management” or the “Advisor”) (the “Advisory Agreement”).
In preparation for review of the Advisory Agreement, the Board requested that the Advisor provide detailed information that the Board determined to be reasonably necessary to evaluate the Advisory Agreement. The Independent Trustees held a telephonic meeting of the Board on October 6, 2017 (the “Pre-15(c) Meeting”) to review and discuss the response materials of the Advisor in support of the consideration of the Advisory Agreement. The Independent Trustees also met in-person in executive session, without the presence of Advisor personnel, prior to the October 17, 2017 meeting to review and discuss aspects of the response materials. At the request of the Independent Trustees, the Advisor made a presentation and responded to questions from the Independent Trustees at both the Pre-15(c) Meeting and the October 17, 2017 meeting. The Board, including the Independent Trustees, also took into consideration information furnished for the Board’s review and consideration throughout the year at regular Board meetings. The Independent Trustees were assisted at all times by independent counsel.
The Independent Trustees reported that the Advisor’s presentations at the Pre-15(c) Meeting and the October 17, 2017 meeting, as well as the extensive discussions among themselves and with counsel regarding their review of the response materials, left them satisfied that the Advisor had provided responses to the requests for information adequate to allow for an informed decision regarding renewal of the Advisory Agreement. The Independent Trustees reported their conclusion that the continuation of the Advisory Agreement should enable the Funds to obtain high quality services at a cost that is appropriate, reasonable, and in the interests of investors. They stated that prudent exercise of judgment warranted the approval of the Advisory Agreement. It also was noted that the Board’s decision to approve the continuation of the Advisory Agreement was not based on any single factor, but rather was
based on a comprehensive consideration of all the information provided to the Board. Upon consideration of these and other factors, the Board also determined:
The nature, extent and quality of the advisory services to be provided. With respect to the Advisory Agreement, the Board considered: the background and experience of key investment personnel and the Advisor’s ability to retain them; the Advisor’s focus on analysis of complex asset categories; the Advisor’s disciplined investment approach and commitment to investment principles; the Advisor’s significant investment in and commitment to personnel; the Advisor’s significant compliance efforts and risk and general oversight; and the Advisor’s oversight of and interaction with service providers. The Board determined that the Advisor had, when necessary, taken steps to address any underperformance. The Board concluded that the nature, extent and quality of the management and advisory service to be provided are appropriate and thus support a decision to approve the Advisory Agreement.
The investment performance of the Funds. The Board evaluated the historical performance of the Funds, and comparative information provided regarding the Funds’ investment performance and information on the performance of other investment funds and various indices. The Board also considered the various performance reports received throughout the year, showing variability of returns over the course of the year. The Board noted that, as a general matter, the Funds had periods of both underperformance and outperformance. On the basis of the Board’s assessment, the Board concluded that the Advisor was capable of generating a level of long-term investment performance that is consistent with shareholder expectations in light of the various Funds’ investment objectives, policies and strategies. Specifically, the Board noted that:
| | • | | the International Real Estate Fund outperformed its index as of the calendar year-to-date through June 30, 2017, but underperformed its index for the period since the Fund’s inception through June 30, 2017; and outperformed the median and average performance of its peer group as of the calendar year-to-date through June 30, 2017, but underperformed the median and average performance of its peer group for the period since the Fund’s inception through June 30, 2017; |
| | • | | the Real Estate Fund underperformed its index as of the calendar year-to-date through June 30, 2017 and for the |
Board Consideration of the Investment Management Agreement (Unaudited)
| | | period since the Fund’s inception through June 30, 2017; and underperformed the median and average performance of its peer group as of the calendar year-to-date through June 30, 2017 and for the period since the Fund’s inception through June 30, 2017; |
| | • | | the Select Income Fund underperformed its index as of the calendar year-to-date through June 30, 2017, but underperformed its index for the period since the Fund’s inception through June 30, 2017; and underperformed the median and average performance of its peer group as of the calendar year-to-date through June 30, 2017 and for the period since the Fund’s inception through June 30, 2017; |
| | • | | the Select Opportunity Fund underperformed its index as of the calendar year-to-date through June 30, 2017 and for the period since the Fund’s inception through June 30, 2017; and outperformed the median and average performance of its peer group as of the calendar year-to-date through June 30, 2017, but underperformed the median and average performance of its peer group for the period since the Fund’s inception through June 30, 2017; and |
| | • | | the Tactical Real Estate Fund underperformed its index as of the calendar year-to-date through June 30, 2017 and for the period since the Fund’s inception through June 30, 2017; and underperformed the median and average performance of its peer group as of the calendar year-to-date through June 30, 2017 and for the period since the Fund’s inception through June 30, 2017. |
The cost of advisory service to be provided and profits to be realized by the Advisor. In analyzing the cost of services and profitability of the Advisor, the Board considered the revenues and expenses of the Advisor and each Fund’s size. The Board took into account the significant investment by and cost to the Advisor regarding investment management infrastructure to support the Funds and other support for investors. In addition, the Board recognized the subjective nature of determining profitability. Further, the Independent Trustees recognized the difficulties in making comparisons as the profitability of other advisers generally is not publicly available and the profitability information that is available for certain advisers or management firms may not be representative of the industry and may be affected by, among other things, the adviser’s particular business mix, capital costs, types of funds managed and expense allocations. On the basis of the
Board’s review of the fees charged by the Advisor for investment advisory and related services (including to its other clients, if applicable), the specialized nature of the Funds’ investment programs, the Advisor’s financial information, and the costs associated with managing the Funds, the Board concluded that the level of investment management fees and the Advisor’s profitability are reasonable in light of the services provided and the management fees and overall expense ratios of comparable funds and other clients of the Advisor.
The extent to which economies of scale would be realized as the Funds grow and whether fee levels reflect these economies of scale. While noting that the management fees will not decrease as the level of the Funds’ assets increase, the Board noted the Advisor’s expense limitation agreements in place and concluded that each Fund’s management fee is reasonable under the current circumstances. The Board noted that it will have the opportunity to periodically re-examine whether the Funds have achieved economies of scale, as well as the appropriateness of management fees payable to the Advisor.
Benefits (such as soft dollars) to the Advisor from its relationships with the Funds. The Board concluded that other benefits derived by the Advisor from its relationship with the Funds, to the extent such benefits are identifiable or determinable, are reasonable and fair, result from the provision of appropriate services to the Funds and investors therein, and are consistent with industry practice and the best interests of the Funds and their shareholders. In this regard, the Board noted that it has received regular reports from Salient Management regarding its soft dollar policies and usage. The Board discussed the potential for other fall-out benefits to the Advisor, including reputational benefits and the potential for growth of the Advisor’s separate account business or other business lines through association with the Funds, and concluded that such benefits are reasonable and typical of those potentially enjoyed by managers of publicly offered mutual funds.
Other considerations. The Board determined that the Advisor has made a substantial commitment both to the recruitment and retention of high quality personnel, monitoring and investment decision-making and provision of service, as well as the financial, compliance and operational resources reasonably necessary to manage the Funds in a professional manner that is consistent with the best interests of the Funds and their shareholders, and noted the significant financial, reputational, enterprise and litigation and regulatory risk undertaken by the Advisor as a manager of publicly offered mutual funds.
Privacy Policy (Unaudited)
Salient Funds appreciates the privacy concerns and expectations of our customers. We are committed to maintaining a high level of privacy and confidentiality when it comes to your personal information and we use that information only where permitted by law. We recognize that, as our customer, you not only entrust us with your money but with your personal information. Your trust is important to us and you can be sure we will continue our tradition of protecting your personal information. We provide this privacy notice to you so that you may understand our policy with regard to the collection and disclosure of nonpublic personal information (“Information”) pertaining to you.
We collect the following categories of information about you:
| | • | | Information we receive from you on applications or other forms; and |
| | • | | Information about your transactions with us, our affiliates, or others. |
We do not disclose any Information about you or any current or former customer to anyone, except as permitted by law. We may disclose Information about you and any former customer to our affiliates and to nonaffiliated third parties, as permitted by law. We do not disclose personal information that we collect about you to non-affiliated companies except to enable them to provide marketing services on our behalf, to perform joint marketing agreements with other financial institutions, or in other limited circumstances permitted by law. For example, some instances where we may disclose Information about you to third parties include: for servicing and processing transactions, to protect against fraud, for institutional risk control, to respond to judicial process or to perform services on our behalf. When we share personal information about you with these companies, we require them to limit their use of the personal information to the particular purpose for which it was shared and we do not allow them to share your personal information with others except to fulfill that limited purpose. In addition, these companies are required to adhere to our privacy standards with respect to any personal information that we provide them.
Protecting the Security and Confidentiality of Your Information
We restrict access to Information about you to those employees who need to know that Information to provide products or services to you. We maintain physical, electronic, and procedural safeguards to ensure the confidentiality of your Information. Our privacy policies apply only to those individual investors who have a direct customer relationship with us. If you are an individual shareholder of record of any of the Funds, we consider you to be a customer of Salient Funds. Shareholders purchasing or owning shares of any of the Funds through their bank, broker, or other financial institution should consult that financial institution’s privacy policies. If you own shares or receive investment services through a relationship with a third-party broker, bank, investment advisor or other financial service provider, that third- party’s privacy policies will apply to you and ours will not.
100
Investment Advisor
Forward Management, LLC
Investment Sub-Advisors
Broadmark Asset Management, LLC
Pacific Investment Management Company LLC
Pictet Asset Management Limited
Administrator
ALPS Fund Services, Inc.
Custodian
Citibank, N.A.
Distributor
Forward Securities, LLC
Independent Registered Public Accounting Firm
KPMG LLP
Legal Counsel
K&L Gates LLP
Transfer Agent
ALPS Fund Services, Inc.

P.O. Box 1345
Denver, CO 80201
800-999-6809
www.salientfunds.com
Salient Adaptive Balanced Fund
Salient Adaptive Income Fund
Salient Adaptive US Equity Fund
Salient EM Infrastructure Fund
Salient International Dividend Signal Fund
Salient International Real Estate Fund
Salient International Small Cap Fund
Salient Real Estate Fund
Salient Select Income Fund
Salient Select Opportunity Fund
Salient Tactical Growth Fund
Salient Tactical Muni & Credit Fund
Salient Tactical Real Estate Fund
Salient US Dividend Signal Fund


| | | | |
| Printed on paper containing recycled content using soy-based inks. | | | FSD002848 030119 | |

Table of Contents
The series of funds under the Forward Funds Trust (“Salient Funds”) are distributed by:
Forward Securities, LLC
San Francisco, California
The report has been prepared for the general information of the Funds’ shareholders. It is not authorized for distribution to prospective investors unless accompanied or proceeded by a current Funds’ Prospectus, which contains more complete information about Funds’ investment policies, management fees and expenses, experience of the management teams and other information. Investors are reminded to read the Prospectus before investing or sending money.
Shareholder Update | December 31, 2017
| | |
| A MESSAGE FROM: | | Rusty Guinn |
| | Executive Vice President of Asset Management |
Dear Shareholder:
We enter 2018 with gratitude for the trust that you, the shareholders of the Salient Funds, have placed in us. It is our aim to build strategies that enable you to act as good stewards of wealth, and it is our hope that you have found value in your partnership with us over the past year. Thank you.
The past year has been profitable for most investors, including those in most financial markets in which the Salient Funds invest. It has also been a year of widening disconnects between those markets and the economies, businesses and political systems that underlie them. We have observed continued political upheaval in the Middle East and North Asia but precious little volatility in most financial markets as a result. We have observed divergences in central banking policies but near-universal appetite for ownership of risky assets across the globe. We have observed investors unwilling to sell, despite high valuations, lower going-forward return expectations, challenging demographics, historically low yields and spreads, and early signs of inflation. We have observed speculative behaviors around cryptocurrencies, venture capital and growing segments of the technology sector.
It has been an unusual year, to say the least.
Still, there is reason to be optimistic about the world and the markets and companies in which we invest. While we enter the year eagerly and optimistically, we also do so with a redoubled commitment to the integrity and consistency of our investment processes. Risk has not disappeared from investments in financial markets, and we see it as our charge to ensure that those risks are still taken prudently and with the expectation of appropriate compensation—the returns to our investors.
We hope that 2018 proves a prosperous one for you, our shareholders. Thank you for your trust.
Sincerely,

Rusty Guinn
Executive Vice President of Asset Management
Salient
RISKS
There are risks involved with investing, including loss of principal. Past performance does not guarantee future results, share prices will fluctuate and you may have a gain or loss when you redeem shares.
Inflation is the rate at which the general level of prices for goods and services is rising, and, subsequently, purchasing power is falling.
Spread is the difference between the bid and the ask price of a security or asset.
Valuation is the process of determining the value of an asset or company based on earnings and the market value of assets.
1
Salient is the trade name for Salient Partners, L.P., which together with its subsidiaries provides asset management and advisory services. This information is being provided solely for educational purposes and is not an offer to sell or solicitation of an offer to buy an interest in any investment fund. Any such offer or solicitation may only be made by means of a confidential private offering memorandum or prospectus relating to a particular fund and only in a manner consistent with federal and applicable state securities laws.
The Salient Funds offered under the Forward Funds Trust are distributed by Forward Securities, LLC.
Not FDIC Insured | No Bank Guarantee | May Lose Value
©2018 Salient. All rights reserved.
The discussions concerning the Funds included in this shareholder report may contain certain forward-looking statements about the factors that may affect performance of the Funds in the future, including the portfolio managers’ outlook regarding economic, financial, market, petroleum, political and other factors relevant to investment performance in the U.S. and abroad. These statements are based on the portfolio managers’ expectations concerning certain future events and their expected impact on the Funds and are current only through the date on the cover of this report. Forward-looking statements are inherently uncertain and are not intended to predict the future performance of the Funds. Actual events may cause adjustments in the portfolio managers’ strategies from those currently expected to be employed, and the outlook of the portfolio managers is subject to change.
2
Fund Commentary and Performance (Unaudited)
Salient Adaptive Balanced Fund
As of December 31, 2017
For the year ended December 31, 2017, Salient Adaptive Balanced Fund’s Institutional Class shares returned 14.61%, underperforming the Fund’s benchmark, a blend of 60% MSCI World Index and 40% Bloomberg Barclays Global Aggregate Index, which returned 16.58%.
In 2017, equities around the globe produced strong returns. The MSCI ACWI finished the year with a gain of 24.62%, with foreign markets leading the way due, in part, to a weak U.S. dollar. The MSCI Emerging Markets Index represented the biggest winner globally, gaining 37.75% in U.S. dollar terms and 30.55% in local currency terms for the year. Japan and Europe also posted strong gains, with the MSCI Japan Index gaining 23.76% and the MSCI Europe Index gaining 26.62% for the year. In this case, the weaker dollar played an even more significant role as the MSCI Europe Index gained 13.06% in local currency terms and the MSCI Japan Index gained 19.75% in yen for the year. The S&P 500 Index was not left behind, finishing the year with a gain of 21.83% while the Russell 2000 Index finished the year with a gain of 14.14%.
The gains were certainly impressive, but looking behind the curtain reveals some very interesting facts, most notably that as of December 29, 2017, the S&P 500 had gone 289 trading days without a 3% correction—the longest period in history. Additionally, 42 of the 44 international stock markets followed by MSCI posted gains as well as nine of the 11 domestic sectors. The most unusual performance in a sector was the S&P 500 energy sector, which posted a decline for the year despite the rise in oil prices, marking the first time in 15 years energy declined while oil increased in price. Energy also posted the biggest sector swing in year-over-year earnings since the financials sector during the 2008-2009 financial crisis, which may be a positive sign for energy stocks going into 2018.
Not to be outdone, bonds also had a very interesting year. The Bloomberg Barclays Global Aggregate Index increased by 7.40% for the year, yet much of the gain can be attributed to currency effect as the local currency version of the index only increased by 3.04%. This number placed the global index in a very similar position as the Bloomberg Barclays U.S. Aggregate Bond Index, which increased by 3.54% for the year. Once again, emerging market bonds were the winner, with the Credit Suisse EM Corporate Bond Index rising 9.50% and the JPMorgan EMBI Global Core Index rising 10.46% for the year. Domestic credit investors were also rewarded for the year with the Bloomberg Barclays U.S. Corporate High Yield Bond Index rising 7.50% and Bloomberg Barclays High Yield Municipal Bond Index rising 9.95%. It is notable, however, that the volatility of most bond asset classes was unusually high in 2017. The elevated volatility is in direct contrast to stocks, which spent most of the year hugging all-time lows in terms of volatility.
Salient Adaptive Balanced Fund aims to provide access to a blend of traditional and nontraditional equity and bond strategies while maintaining the appropriate target level of risk. The strategy is a blend of 55% equity exposure (measured by the MSCI World Index), which is split between the Salient Adaptive Growth Fund and a capitalization-weighted mix of Salient Adaptive US Equity Fund and Salient International Dividend Signal Fund. Additionally, the strategy is a blend of 35% fixed-income exposure (measured by the Bloomberg Barclays Global Aggregate Index), which is comprised of 10% treasuries and 25% of funds that mimic the exposure of Salient Adaptive Income Fund. Finally, the strategy includes a 10% exposure to Salient Trend Fund.
In 2017, the Fund’s allocation strategy was the primary driver of return in the portfolio, specifically overweight positions to emerging market stocks, foreign developed stocks, high yield corporate bonds and emerging market corporate bonds. Allocations to risk parity, preferred stocks and U.S. real estate detracted from the excess return generated by allocation.
Manager performance also contributed to the overall return of the portfolio, specifically the performance of Salient Adaptive U.S. Equity Fund, Salient Adaptive Growth Fund and Salient Trend Fund. Certain managers underperformed their stated benchmarks in 2017, which detracted from overall performance. The largest detractors were Salient Select Income Fund and Salient Real Estate Fund.
3
Salient Adaptive Balanced Fund
Asset Allocation as a Percentage of Net Assets
as of December 31, 2017

These allocations may not reflect the current or future position of the portfolio.
Hypothetical Growth of $100,000 Investment in the Fund

The chart above shows how a hypothetical investment of $100,000 in the Fund at its inception would have performed versus an investment in the Fund’s benchmark index. The values indicate what $100,000 would have grown to over the time period indicated. The hypothetical example does not represent the returns of any particular investment.
4
Salient Adaptive Balanced Fund(b)
| | | | | | | | | | | | | | | | | | | | |
| | | 1 Year | | | 5 Year | | | 10 Year | | | Since
Inception | | | Inception
Date | |
| Average Annual Total Return for the period ended December 31, 2017 | | | | | | | | | | | | | | | | | | | | |
Investor Class | | | 14.07% | | | | 2.55% | | | | 0.52% | | | | 2.09% | | | | 12/27/00 | |
| | | | | |
Institutional Class | | | 14.61% | | | | 3.07% | | | | 1.03% | | | | 2.60% | | | | 12/27/00 | |
| | | | | |
Class A (with sales load)(c) | | | 7.67% | | | | 1.50% | | | | 0.08% | | | | 3.38% | | | | 09/29/03 | |
| | | | | |
Class A (without sales load)(d) | | | 14.26% | | | | 2.71% | | | | 0.67% | | | | 3.81% | | | | 09/29/03 | |
| | | | | |
Class C (with CDSC)(e) | | | 12.46% | | | | 2.03% | | | | 0.02% | | | | 3.96% | | | | 12/30/02 | |
| | | | | |
Class C (without CDSC)(f) | | | 13.46% | | | | 2.03% | | | | 0.02% | | | | 3.96% | | | | 12/30/02 | |
(a) The index figures do not reflect any deduction for fees, expenses or taxes. It is not possible to invest directly in an index.
(b) Prior to May 1, 2016, Salient Adaptive Balanced Fund was known as Forward Growth Allocation Fund. Prior to May 1, 2010, Forward Growth Allocation Fund was known as Accessor Growth Allocation Fund.
(c) Includes the effect of the maximum 5.75% sales charge.
(d) Excludes sales charge.
(e) Includes the 1.00% contingent deferred sales charge.
(f) Excludes the 1.00% contingent deferred sales charge.
The performance quoted represents past performance, does not guarantee future results and current performance may be lower or higher than the data quoted. The investment return and principal value of an investment will fluctuate so that shares, when redeemed, may be worth more or less than their original cost. Performance data current to the most recent month-end may be obtained at www.salientfunds.com. Investment performance may reflect fee waivers in effect. In the absence of fee waivers, total return would be lower. Total return is based on NAV, assuming reinvestment of all distributions. Performance does not reflect the deduction of taxes that a shareholder would pay on fund distributions or the redemption of fund shares.
5
Fund Commentary and Performance (Unaudited)
Salient Adaptive Income Fund
As of December 31, 2017
For the year ended December 31, 2017, Salient Adaptive Income Fund’s Institutional Class shares returned 9.70%, slightly underperforming the Fund’s benchmark, a blend of 85% Bloomberg Barclays Global Aggregate Index and 15% MSCI ACWI, which returned 9.84%.
In 2017, equities around the globe produced strong returns. The MSCI ACWI finished the year with a gain of 24.62%, with foreign markets leading the way due, in part, to a weak U.S. dollar. The MSCI Emerging Markets Index represented the biggest winner globally, gaining 37.75% in U.S. dollar terms and 30.55% in local currency terms for the year. Japan and Europe also posted strong gains, with the MSCI Japan Index gaining 23.76% and the MSCI Europe Index gaining 26.62% for the year. In this case, the weaker dollar played an even more significant role as the MSCI Europe Index gained 13.06% in local currency terms and the MSCI Japan Index gained 19.75% in yen for the year. The S&P 500 Index was not left behind, finishing the year with a gain of 21.83% while the Russell 2000 Index finished the year with a gain of 14.14%.
The gains were certainly impressive, but looking behind the curtain reveals some very interesting facts, most notably that as of December 29, 2017, the S&P 500 had gone 289 trading days without a 3% correction—the longest period in history. Additionally, 42 of the 44 international stock markets followed by MSCI posted gains as well as nine of the 11 domestic sectors. The most unusual performance in a sector was the S&P 500 energy sector, which posted a decline for the year despite the rise in oil prices, marking the first time in 15 years energy declined while oil increased in price. Energy also posted the biggest sector swing in year-over-year earnings since the financials sector during the 2008-2009 financial crisis, which may be a positive sign for energy stocks going into 2018.
Not to be outdone, bonds also had a very interesting year. The Bloomberg Barclays Global Aggregate Index increased by 7.40% for the year, yet much of the gain can be attributed to currency effect as the local currency version of the index only increased by 3.04%. This number placed the global index in a very similar position as the Bloomberg Barclays U.S. Aggregate Bond Index, which increased by 3.54% for the year. Once again, emerging market bonds were the winner, with Credit Suisse EM Corporate Bond Index rising 9.50% and JPMorgan EMBI Global Core Index rising 10.46% for the year. Domestic credit investors were also rewarded for the year with the Bloomberg Barclays U.S. Corporate High Yield Bond Index rising 7.50% and Bloomberg Barclays High Yield Municipal Bond Index rising 9.95%. It is notable, however, that the volatility of most bond asset classes was unusually high in 2017. The elevated volatility is in direct contrast to stocks, which spent most of the year hugging all-time lows in terms of volatility.
Salient Adaptive Income Fund’s strategy aims to deliver a high level of income while targeting a 6.5% annualized standard deviation. Allocation decisions were the primary source of return, adding 2.12% to the strategy for the year. This return came from overweight positions, as compared to the benchmark, in U.S. high-yield corporate bonds, emerging market corporate bonds and foreign market stocks. Some allocation decisions detracted from overall performance, specifically exposure to preferred stocks and real estate.
Manager performance also impacted the Fund’s return during the reporting period. Salient Select Income Fund and Salient Real Estate Fund were the primary detractors to manager performance while Salient International Real Estate Fund and Salient Tactical Muni & Credit Fund were the primary contributors to manager performance for the year.
6
Salient Adaptive Income Fund
Asset Allocation as a Percentage of Net Assets
as of December 31, 2017
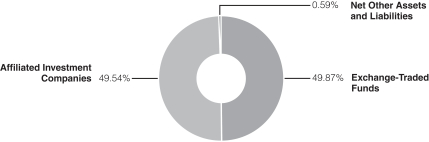
These allocations may not reflect the current or future position of the portfolio.
Hypothetical Growth of $100,000 Investment in the Fund
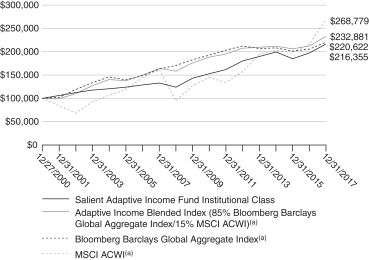
The chart above shows how a hypothetical investment of $100,000 in the Fund at its inception would have performed versus an investment in the Fund’s benchmark index. The values indicate what $100,000 would have grown to over the time period indicated. The hypothetical example does not represent the returns of any particular investment.
7
Salient Adaptive Income Fund(b)
| | | | | | | | | | | | | | | | | | | | |
| | | 1 Year | | | 5 Year | | | 10 Year | | | Since
Inception | | | Inception
Date | |
| Average Annual Total Return for the period ended December 31, 2017 | | | | | | | | | | | | | | | | | | | | |
Investor Class | | | 9.13% | | | | 3.21% | | | | 4.48% | | | | 4.12% | | | | 12/27/00 | |
| | | | | |
Institutional Class | | | 9.70% | | | | 3.73% | | | | 5.00% | | | | 4.64% | | | | 12/27/00 | |
| | | | | |
Class A (with sales load)(c) | | | 5.25% | | | | 2.69% | | | | 4.34% | | | | 3.92% | | | | 09/29/03 | |
| | | | | |
Class A (without sales load)(d) | | | 9.38% | | | | 3.48% | | | | 4.74% | | | | 4.20% | | | | 09/29/03 | |
| | | | | |
Class C (with CDSC)(e) | | | 7.52% | | | | 2.70% | | | | 3.96% | | | | 3.44% | | | | 12/30/02 | |
| | | | | |
Class C (without CDSC)(f) | | | 8.52% | | | | 2.70% | | | | 3.96% | | | | 3.44% | | | | 12/30/02 | |
(a) The index figures do not reflect any deduction for fees, expenses or taxes. It is not possible to invest directly in an index.
(b) Prior to May 1, 2016, Salient Adaptive Income Fund was known as Forward Income Builder Fund. Prior to May 1, 2012, Forward Income Builder Fund was known as Forward Income Allocation Fund. Prior to May 1, 2010, Forward Income Allocation Fund was known as Accessor Income Allocation Fund.
(c) Includes the effect of the maximum 3.75% sales charge.
(d) Excludes sales charge.
(e) Includes the 1.00% contingent deferred sales charge.
(f) Excludes the 1.00% contingent deferred sales charge.
The performance quoted represents past performance, does not guarantee future results and current performance may be lower or higher than the data quoted. The investment return and principal value of an investment will fluctuate so that shares, when redeemed, may be worth more or less than their original cost. Performance data current to the most recent month-end may be obtained at www.salientfunds.com. Investment performance may reflect fee waivers in effect. In the absence of fee waivers, total return would be lower. Total return is based on NAV, assuming reinvestment of all distributions. Performance does not reflect the deduction of taxes that a shareholder would pay on fund distributions or the redemption of fund shares.
8
Fund Commentary and Performance (Unaudited)
Salient Adaptive US Equity Fund
As of December 31, 2017
For the year ended December 31, 2017, Salient Adaptive US Equity Fund’s Institutional Class shares returned 24.50%, outperforming the Fund’s benchmark, the S&P 500 Index, which returned 21.83%.
2017 was a remarkable year for U.S. stocks, as evidenced by the S&P 500 Index’s increase in value every month of the year for the first time in history. Also, as of December 29, 2017, the index had gone 289 trading days without a 3% correction—the longest period in the index’s history. Simultaneously, volatility in U.S. equities hit an all-time low.
Sector performance within the benchmark varied during 2017, but nine of the 11 sectors increased in value during the year. The information technology, materials, consumer discretionary and financials sectors were among the best performers. The technology and consumer discretionary sectors tend to represent the highest growth stocks, which investors preferred as high overall stock valuations typically must be justified by higher earnings growth. The materials sector benefited from increased inflation pressures while the financials sector benefited from increases in interest rates over the course of the year.
On the downside, the utilities, real estate, energy and telecom sectors were among the worst performers in 2017. Rising interest rates weighed down debt-heavy sectors like utilities, real estate and telecom. The most unusual performance was in the energy sector, which posted a decline for the year despite the rise in oil prices. It marked the first time in 15 years that energy declined while oil increased in price. Additionally, the energy sector suffered the worst decline in year-over-year earnings of any sector since the decline of financials during the 2008-2009 financial crisis. If history is any guide, this plunge may be a positive sign for the energy sector in 2018.
Salient Adaptive US Equity Fund uses a strategy that allocates among sectors exhibiting strong price momentum and value. The strategy also maintains a constant risk target of 15%, as measured by annualized standard deviation, by increasing exposure to the S&P 500 using exchange-traded futures contracts.
The strategy began the year favoring financials and industrials with some exposure to energy, materials, technology, telecom and utilities. By the end of the first quarter, the strategy was allocated equally among financials, industrials, technology and materials. By the end of the second quarter, the strategy rotated out of materials and into consumer discretionary, although by July the Fund had rotated back into materials. The Fund maintained an average 44.03% of additional exposure to the S&P 500 during the year. Overall, exposure to S&P 500 futures contributed 1.63% of the excess return of the strategy while the remaining 1.04% of excess return was attributable to the sector allocations.
9
Salient Adaptive US Equity Fund
Asset Allocation as a Percentage of Net Assets
as of December 31, 2017
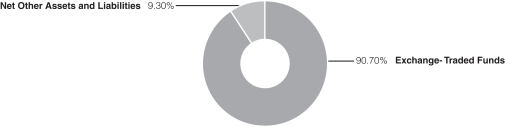
These allocations may not reflect the current or future position of the portfolio.
Hypothetical Growth of $100,000 Investment in the Fund

The chart above shows how a hypothetical investment of $100,000 in the Fund at its inception would have performed versus an investment in the Fund’s benchmark index. The values indicate what $100,000 would have grown to over the time period indicated. The hypothetical example does not represent the returns of any particular investment.
10
Salient Adaptive US Equity Fund(b)
| | | | | | | | | | | | | | | | | | | | |
| | | 1 Year | | | 5 Year | | | 10 Year | | | Since
Inception | | | Inception
Date | |
| Average Annual Total Return for the period ended December 31, 2017 | | | | | | | | | | | | | | | | | | | | |
Investor Class | | | 23.97% | | | | 14.27% | | | | 7.64% | | | | 6.42% | | | | 06/24/98 | |
| | | | | |
Institutional Class | | | 24.50% | | | | 14.71% | | | | 8.09% | | | | 10.09% | | | | 08/24/92 | |
(a) The index figures do not reflect any deduction for fees, expenses or taxes. It is not possible to invest directly in an index.
(b) Prior to May 1, 2016, Salient Adaptive US Equity Fund was known as Forward Total MarketPlus Fund. Prior to May 1, 2013, Forward Total MarketPlus Fund was known as Forward Extended MarketPlus Fund. Prior to May 1, 2011, Forward Extended MarketPlus Fund was known as Forward SMIDPlus Fund. Prior to September 20, 2010, Forward SMIDPlus Fund was known as Forward Small to Mid Cap Fund. Prior to May 1, 2010, Forward Small to Mid Cap Fund was known as Accessor Small to Mid Cap Fund.
The performance quoted represents past performance, does not guarantee future results and current performance may be lower or higher than the data quoted. The investment return and principal value of an investment will fluctuate so that shares, when redeemed, may be worth more or less than their original cost. Performance data current to the most recent month-end may be obtained at www.salientfunds.com. Investment performance may reflect fee waivers in effect. In the absence of fee waivers, total return would be lower. Total return is based on NAV, assuming reinvestment of all distributions. Performance does not reflect the deduction of taxes that a shareholder would pay on fund distributions or the redemption of fund shares.
11
Fund Commentary and Performance (Unaudited)
Salient EM Infrastructure Fund
As of December 31, 2017
For the year ended December 31, 2017, Salient EM Infrastructure Fund’s Class A shares (without sales load) returned 16.92%, trailing the Fund’s benchmark, the MSCI Emerging Markets Index, which returned 37.75%. Returns for the benchmark were primarily driven by three noninfrastructure sectors that the Fund does not have exposure to: information technology, financials and consumer discretionary.
The global economy strengthened notably throughout 2017, becoming increasingly coordinated and less reliant on growth from any one country. Showing widespread growth, the JPMorgan Global Manufacturing Purchasing Managers’ Index printed at 52.8 in January and steadily increased throughout the year, ending the year at a high of 54.5. A reading higher than 50 represents expansion of the manufacturing sector when compared to the previous month. As such, 2017 marked the largest global economic acceleration since 2010; global growth is now the most robust and synchronized it has been in years.
While the Federal Reserve took its first steps to (very gradually) remove monetary policy accommodation, the ongoing quantitative easing programs of the European Central Bank and the Bank of Japan ensured that global monetary policy would remain accommodative. With this backdrop, the outperformance of higher beta stocks and sectors (such as information technology) was notable. Growth stocks, as represented by the MSCI Emerging Markets Growth Index, led the charge with a return of 47.12% for the year, significantly outperforming value stocks, as represented by the MSCI Emerging Markets Value Index, which returned 28.79% for the year.
Despite trailing the benchmark, the Fund delivered solid absolute returns in 2017. The Fund’s exposure to the industrials, utilities and the telecom sectors contributed the most to the Fund’s performance during the reporting period. The Fund benefited from strong performance from several transportation holdings within the industrials sector. One such strong performer was SITC International Holdings Co., Ltd., a marine shipping company focused on intra-Asian trade, which showed increasing business volumes throughout the year. The Fund also benefited from several airport holdings, which delivered very robust performance in an environment of low oil prices.
A number of the Fund’s utilities holdings also contributed to positive performance throughout the year. Among the most notable performers was ENN Energy Holdings, Ltd., a China-based natural gas distributor that benefited from significant volume growth as well as a more certain regulatory environment that continues to favor the adoption of more natural gas usage in China.
Additionally, the Fund benefited from its holdings in the telecom sector, several of which saw strong performance over the course of the year. These included telecom operators in Russia, Thailand, China and the Philippines, all of which experienced improving trends in economic activity.
On the downside, the information technology, financials and energy sectors all detracted from the Fund’s performance during the year. The Fund’s relative performance was hurt by its lack of holdings in the information technology sector, which drove the biggest returns in the benchmark index, and financials, which posted strong returns over the course of the year. Because the Fund is focused on infrastructure, the Fund will continue to hold a massive underweight position to these sectors relative to the benchmark.
Lastly, the Fund’s relative performance was hurt by poor stock selection within the energy sector. Hoegh LNG Holdings, Ltd., an owner and operator of floating storage and regasification units (FSRUs), struggled throughout the year to fill its backlog in a timely manner. However, the Fund’s investment team believes the longer-term environment will prove favorable for operators of FSRUs. Additionally, Cosan, a fully integrated ethanol distributor in Brazil, produced weak performance as a result of generally lackluster sugar prices.
12
Salient EM Infrastructure Fund
Weightings by Country as a Percentage of Net Assets
as of December 31, 2017
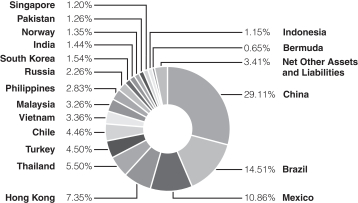
These allocations may not reflect the current or future position of the portfolio.
Hypothetical Growth of $10,000 Investment in the Fund
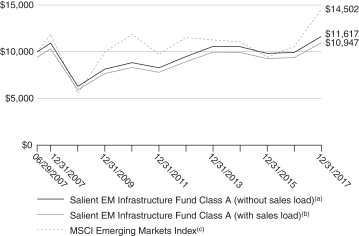
The chart above shows how a hypothetical investment of $10,000 in the Fund at its inception would have performed versus an investment in the Fund’s benchmark index. The values indicate what $10,000 would have grown to over the time period indicated. The hypothetical example does not represent the returns of any particular investment.
13
Salient EM Infrastructure Fund(d)
| | | | | | | | | | | | | | | | | | | | |
| | | 1 Year | | | 5 Year | | | 10 Year | | | Since
Inception | | | Inception
Date | |
| Average Annual Total Return for the period ended December 31, 2017 | | | | | | | | | | | | | | | | | | | | |
Investor Class | | | 16.92% | | | | 4.19% | | | | N/A | | | | 2.57% | | | | 05/02/11 | |
| | | | | |
Institutional Class(e) | | | 17.38% | | | | 4.57% | | | | 0.99% | | | | 1.80% | | | | 06/29/07 | |
| | | | | |
Class A (with sales load)(b) | | | 10.18% | | | | 2.90% | | | | 0.03% | | | | 0.86% | | | | 06/29/07 | |
| | | | | |
Class A (without sales load)(a) | | | 16.92% | | | | 4.13% | | | | 0.63% | | | | 1.44% | | | | 06/29/07 | |
| | | | | |
Class C (with CDSC)(f) | | | 15.26% | | | | 3.55% | | | | -0.02% | | | | 0.78% | | | | 06/29/07 | |
| | | | | |
Class C (without CDSC)(g) | | | 16.26% | | | | 3.55% | | | | -0.02% | | | | 0.78% | | | | 06/29/07 | |
(a) Excludes sales charge.
(b) Includes the effect of the maximum 5.75% sales charge.
(c) The index figures do not reflect any deduction for fees, expenses or taxes. It is not possible to invest directly in an index.
(d) Prior to May 1, 2016, Salient EM Infrastructure Fund was known as Forward Global Infrastructure Fund. Prior to June 12, 2009, Forward Global Infrastructure Fund was known as Kensington Global Infrastructure Fund.
(e) Prior to June 13, 2009, Institutional Class was known as Class Y.
(f) Includes the 1.00% contingent deferred sales charge.
(g) Excludes the 1.00% contingent deferred sales charge.
The performance quoted represents past performance, does not guarantee future results and current performance may be lower or higher than the data quoted. The investment return and principal value of an investment will fluctuate so that shares, when redeemed, may be worth more or less than their original cost. Performance data current to the most recent month-end may be obtained at www.salientfunds.com. Investment performance may reflect fee waivers in effect. In the absence of fee waivers, total return would be lower. Total return is based on NAV, assuming reinvestment of all distributions. Performance does not reflect the deduction of taxes that a shareholder would pay on fund distributions or the redemption of fund shares.
14
Fund Commentary and Performance (Unaudited)
Salient International Dividend Signal Fund
As of December 31, 2017
For the year ended December 31, 2017, Salient International Dividend Signal Fund’s Investor Class shares returned 24.48%, trailing the Fund’s benchmark, the MSCI ACWI ex-USA, which returned 27.77%. The Fund invests in higher dividend-paying stocks than the index average and higher dividend-yielding stocks lagged lower dividend-yielding stocks for the 12-month period.
The global economy accelerated in 2017, continuing the momentum that began in late 2016 and ending two years of slowing growth. Economists expect the global economy’s final measure of 2017 real gross domestic product (GDP) growth to be 3.2% versus the 2.5% reading for 2016. Major economies like the U.S., Europe and Japan as well as most emerging markets contributed to the largest global economic acceleration since 2010. Predictably, investor confidence around the globe increased, and the positive business climate pushed equities higher in 2017.
Many equity indices, including the MSCI ACWI ex-USA, advanced every month of the calendar year. Such an advance had not previously occurred since the index’s inception. Somewhat surprisingly, given the improving economic backdrop, higher priced growth equities outperformed lower multiple value and yield equities by 9.35% and 11.58%, respectively for the year, as measured by MSCI ACWI ex-USA subindices. This growth style advantage over yield and value created the greatest margin since 1999. Unsurprisingly, however, at least according to an early year-end outlook, emerging markets outshined developed markets in 2017 and the overvalued U.S. dollar experienced a partial correction. The U.S. Dollar Index declined the most in a calendar year since 2003.
Optimism early in the reporting period reflected positive expectations for the year, with “soft” economic data like surveys and sentiment statistics making more of an impact than “hard” data like industrial production. This investor optimism pushed the Fund’s benchmark to record the best quarterly performance of 2017 in the first quarter—with returns of more than 7%. The cyclically leveraged materials sector led in early 2017, but after January, the rally broadened to other sectors, including technology, consumer discretionary and industrials. Equities advanced at a slower rate the remaining three quarters of the year. In the second quarter, markets breathed a sigh of relief with relatively business-friendly European election results despite continued intrigue surrounding the U.K.’s planned exit from the European Union. In the third quarter, for the first time since 2007, the economies of all member countries in the Organisation for Economic Co-operation and Development showed expansion. Global investors also cheered data showing a resurgence in China benefiting from pro-business policies leading up to its 19th National Congress of the Communist Party, which is held every five years. Other emerging markets enjoyed the strengthening economic backdrop with mild inflationary pressures and a weakening U.S. dollar relieving stress on their currencies and central banks. Finally, in the fourth quarter, equity returns rose on the largely ubiquitous view of sustained economic expansion in 2018 combined with central bank restraint in Europe and Japan. The European Central Bank and the Bank of Japan may be slow to remove quantitative easing given the muted inflation response to date. Lastly, business confidence remained high at year-end, as reflected by December mergers and acquisitions activity setting a 12-year record.
The Fund posted solid returns in 2017. In terms of contribution by sector, the Fund’s utilities, industrials and information technology companies contributed positively to the Fund’s return, outperforming the benchmark due to security selection. This outperformance was mostly generated by lower dividend-yielding stocks like DISCO Corporation, a Japanese precision tools maker, RIB Software, a multinational company providing construction modeling software, and China Gas Holdings, a natural gas distributor. But the relatively higher-yielding engine maker China Yuchai International also made a significant positive contribution.
The energy sector was the sole negative-performing sector for the period, with oilfield services company Schlumberger and fuel storage company Vopak accounting for most of the weakness. While all other sectors provided a positive return for the year, the telecommunications and healthcare sectors lagged amid the strengthening economic climate.
From a regional perspective, leading regions for the Fund generally matched the benchmark, with the greatest contributions from Asia Pacific and Western Europe. All regions in the Fund contributed positively to performance, but Central Asia and Africa/Middle East made the smallest contributions to the Fund’s return. For the MSCI ACWI ex-USA, the Africa/Middle East and Eastern Europe regions lagged the most.
Finally, to reduce transaction costs, the Fund used index futures during 2017. These instruments are used to manage cash holdings by gaining exposure to the types of securities and instruments in which the fund invests. The limited use of these index futures had a small positive impact on performance, adding approximately three basis points to the Fund’s 2017 annual return.
15
Salient International Dividend Signal Fund
Weightings by Sector as a Percentage of Net Assets
as of December 31, 2017
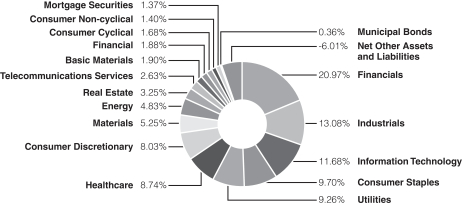
These allocations may not reflect the current or future position of the portfolio.
Weightings by Region as a Percentage of Net Assets
as of December 31, 2017

These allocations may not reflect the current or future position of the portfolio.
Hypothetical Growth of $10,000 Investment in the Fund

The chart above shows how a hypothetical investment of $10,000 in the Fund at its inception would have performed versus an investment in the Fund’s benchmark index. The values indicate what $10,000 would have grown to over the time period indicated. The hypothetical example does not represent the returns of any particular investment.
16
Salient International Dividend Signal Fund(b)
| | | | | | | | | | | | | | | | | | | | |
| | | 1 Year | | | 5 Year | | | 10 Year | | | Since
Inception | | | Inception
Date | |
| Average Annual Total Return for the period ended December 31, 2017 | | | | | | | | | | | | | | | | | | | | |
Investor Class | | | 24.48% | | | | 4.34% | | | | -0.13% | | | | 4.42% | | | | 10/01/98 | |
| | | | | |
Institutional Class | | | 24.90% | | | | 4.73% | | | | 0.18% | | | | 0.50% | | | | 05/01/07 | |
| | | | | |
Class A (with sales load)(c) | | | 17.13% | | | | N/A | | | | N/A | | | | 1.03% | | | | 05/01/13 | |
| | | | | |
Class A (without sales load)(d) | | | 24.32% | | | | N/A | | | | N/A | | | | 2.32% | | | | 05/01/13 | |
| | | | | |
Class C (with CDSC)(e) | | | 22.68% | | | | 3.74% | | | | N/A | | | | 5.72% | | | | 07/31/12 | |
| | | | | |
Class C (without CDSC)(f) | | | 23.68% | | | | 3.74% | | | | N/A | | | | 5.72% | | | | 07/31/12 | |
(a) The index figures do not reflect any deduction for fees, expenses or taxes. It is not possible to invest directly in an index.
(b) Prior to May 1, 2016, Salient International Dividend Signal Fund was known as Forward International Dividend Fund. Prior to May 1, 2010, Forward International Dividend Fund was known as Forward International Equity Fund. As of December 1, 2008, the Fund is directly managed by Salient Management, the advisor to the Salient Funds. Performance figures and other portfolio data shown for periods prior to December 1, 2008, do not reflect the Advisor’s performance or strategy. From September 1, 2005, through November 30, 2008, Pictet Asset Management Limited was the Fund’s sub-advisor and the Fund’s investment strategy was different. Prior to September 1, 2005, Forward International Equity Fund was known as Forward Hansberger International Growth Fund. From March 6, 2000, through August 31, 2005, Hansberger Global Investors, Inc. was the Fund’s sub-advisor and the Fund’s investment strategy was different. Prior to March 6, 2000, the Fund was managed by a different sub-advisor.
(c) Includes the effect of the maximum 5.75% sales charge.
(d) Excludes sales charge.
(e) Includes the 1.00% contingent deferred sales charge.
(f) Excludes the 1.00% contingent deferred sales charge.
The performance quoted represents past performance, does not guarantee future results and current performance may be lower or higher than the data quoted. The investment return and principal value of an investment will fluctuate so that shares, when redeemed, may be worth more or less than their original cost. Performance data current to the most recent month-end may be obtained at www.salientfunds.com. Investment performance may reflect fee waivers in effect. In the absence of fee waivers, total return would be lower. Total return is based on NAV, assuming reinvestment of all distributions. Performance does not reflect the deduction of taxes that a shareholder would pay on fund distributions or the redemption of fund shares.
17
Fund Commentary and Performance (Unaudited)
Salient International Small Cap Fund
As of December 31, 2017
For the year ended December 31, 2017, Salient International Small Cap Fund’s Institutional Class shares returned 34.80%, outperforming the Fund’s benchmark, the MSCI EAFE Small Cap Index, which returned 33.50%.
Global equities returned strong performance in 2017, with the MSCI EAFE Index returning 25.03% for the year. In a strong global equity market, small capitalization stocks, as represented by the MSCI EAFE Small Cap Index, had another year of solid relative performance, returning more than 30%. Small caps re-rated to a modest extent, meaning they experienced a modest increase in their trading multiple as a result of either a particular event or overall improvement in the company’s business, but the key to the outperformance, as in many previous years, was superior earnings growth. Earnings estimates hit an inflexion point in January, moving sharply higher, and continued to do so throughout the year. Thus, the benchmark’s price-earnings ratio began the year at approximately 16x and advanced steadily to 17x by the end of the year.
U.S. dollar weakness also contributed to the performance of global equities during the year. But, of more significance (and contributing to currency moves), was a steady improvement in the economic environment in Europe and Asia. The eurozone’s gross domestic product (GDP) had stagnated since 2014, but started to reaccelerate in the first quarter of 2017, as investor confidence improved and industrial production picked up sharply. Meanwhile, Japan, after a period of economic weakness in early 2016, experienced six successive quarters of improving GDP growth. This environment has been fruitful for stock picking, especially in Continental Europe and Japan, where performance was strong both in established growth stocks and those stocks in which restructuring in previous years led to improved profit margins.
The Fund’s holdings in Japan as well as its holdings in the consumer discretionary and industrials sectors contributed positively to performance in 2017. Stock selection was strong in Japan, delivering a 41% return versus 32% for the benchmark for the year. Technology-related companies were among the leading contributors, including Minebea Mitsumi, Inc., the world’s leading miniature bearing manufacturer, SUMCO Corp., a leading silicon wafer producer, and Otsuka Corp., an IT system integrator. Staffing company Persol Holdings Co., Ltd. (formerly Temp holdings) also performed well, helped by Japan’s tight job market. Additionally, the Fund’s long-term holding Pola Orbis, a cosmetics manufacturer, had a good year, helped by an innovative new anti-wrinkle cream.
The Fund also benefited from strong stock selection in the consumer discretionary sector, led by Start Today, which operates Japan’s top fashion e-commerce site. Other solid performers in the sector included Trigano, a French manufacturer of recreational vehicles, and Coats, a U.K. industrial thread and consumer textile crafts company. Don Quijote Holdings Co., Ltd., the Japanese discount retailer, performed well on the back of a deal to buy into the struggling supermarket chain Uny, while Dalata Hotel Group Plc, an Irish hotel operator, delivered strong earnings growth.
The industrials sector also had strong performance in 2017. More than 40% of the positive contribution in industrials came from an overweight allocation to the sector while the rest of the contribution was derived from stock selection. Dutch conglomerate TKH Group NV performed well due to its leading position in tire manufacturing equipment. Swiss vacuum technology company VAT Group had an excellent year as a result of firm demand from semiconductor and display-related customers. Japanese machine toolmaker Toshiba Machine performed solidly after buying back 22% of its stock from its former parent company.
On the downside, the materials sector underperformed in 2017. Some of the negative impact came from allocation due to an underweight position, but the main detractor was stock selection. The weakest performer was diamond mining company Petra Diamonds, which was impacted by production delays and concerns over the political tension in Tanzania, where some of its mines are located. Belgian wiremaker Bekaert SA had disappointing results due to higher-than-expected cost inflation and a slowdown in Chinese demand for tire cord.
From a country perspective, Austria detracted from the Fund’s performance due to a combination of the Fund’s underweight position relative the benchmark and weakness in Porr AG, a construction company. The company delivered disappointing returns as a result of delays in integrating recent acquisitions.
The United Kingdom also detracted from the Fund’s performance mainly due to the poor performance of Petra Diamonds. Other weak performers included packaging maker RPC Group, which was sold on concerns that the company was overreaching with its mergers and acquisitions strategy, and Secure Trust Bank Plc, which lagged amid concerns over the outlook for U.K. consumer credit.
Lastly, several style factors impacted the Fund’s performance in 2017. Style factors are drivers of return within an asset class and include attributes like value, momentum, volatility and quality. Overweight allocations to growth and medium-term momentum contributed to the Fund’s return while an underweight allocation to value detracted from the Fund’s return during the year.
18
Salient International Small Cap Fund
Weightings by Sector as a Percentage of Net Assets
as of December 31, 2017

These allocations may not reflect the current or future position of the portfolio.
Weightings by Region as a Percentage of Net Assets
as of December 31, 2017
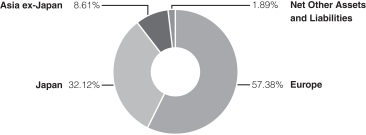
These allocations may not reflect the current or future position of the portfolio.
Hypothetical Growth of $100,000 Investment in the Fund
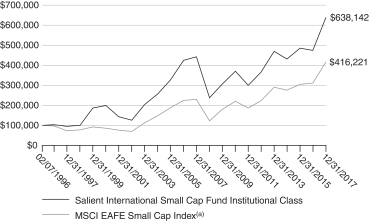
The chart above shows how a hypothetical investment of $100,000 in the Fund at its inception would have performed versus an investment in the Fund’s benchmark index. The values indicate what $100,000 would have grown to over the time period indicated. The hypothetical example does not represent the returns of any particular investment.
19
Salient International Small Cap Fund(b)
| | | | | | | | | | | | | | | | | | | | |
| | | 1 Year | | | 5 Year | | | 10 Year | | | Since
Inception | | | Inception
Date | |
| Average Annual Total Return for the period ended December 31, 2017 | | | | | | | | | | | | | | | | | | | | |
Investor Class | | | 34.28% | | | | 11.38% | | | | 3.38% | | | | 9.63% | | | | 03/05/02 | |
| | | | | |
Institutional Class | | | 34.80% | | | | 11.77% | | | | 3.74% | | | | 8.83% | | | | 02/07/96 | |
(a) The index figures do not reflect any deduction for fees, expenses or taxes. It is not possible to invest directly in an index.
(b) Prior to May 1, 2016, Salient International Small Cap Fund was known as Forward International Small Companies Fund. The Retail Class and Institutional Class of Pictet International Small Companies Fund were reorganized into the Investor Class and Institutional Class, respectively, of Forward International Small Companies Fund on December 23, 2003. Performance figures for periods prior to December 23, 2003, represent performance of the respective class of shares of Pictet International Small Companies Fund.
The performance quoted represents past performance, does not guarantee future results and current performance may be lower or higher than the data quoted. The investment return and principal value of an investment will fluctuate so that shares, when redeemed, may be worth more or less than their original cost. Performance data current to the most recent month-end may be obtained at www.salientfunds.com. Investment performance may reflect fee waivers in effect. In the absence of fee waivers, total return would be lower. Total return is based on NAV, assuming reinvestment of all distributions. Performance does not reflect the deduction of taxes that a shareholder would pay on fund distributions or the redemption of fund shares.
20
Fund Commentary and Performance (Unaudited)
Salient Tactical Growth Fund
As of December 31, 2017
For the year ended December 31, 2017, Salient Tactical Growth Fund’s Institutional Class shares returned 10.91%, underperforming the Fund’s benchmark, the S&P 500 Index, which returned 21.83%.
The U.S. stock market recorded steady gains throughout 2017, continuing the rally that began following the November 2016 election. Most major market indices climbed steadily during the year and ended the year at or near their all-time highs. Investors were encouraged by the Trump administration’s efforts to stimulate economic growth through deregulation as well as the successful passage of tax reform. The stock market ended the year strongly on expectations that corporate and individual tax cuts would boost gross domestic product and consumer spending in 2018 and 2019.
While the Salient Tactical Growth Fund’s models of investor sentiment showed increased optimism (which is negative from a contrary point of view), and valuations remained high by historical standards, these potential negatives were offset by stable interest rates and strong market momentum in terms of both volume and breadth. During 2017, the Fund adhered to the market maxims “Don’t fight the Fed” and “Don’t fight the tape.” Accordingly, the market environment was favorable to the Fund in 2017 and the Fund’s investors were able to participate in and benefit from the stock market’s rise. While the Fund recorded positive returns in 2017, it fell short when compared to its benchmark.
During 2017, the Fund maintained a net positive market exposure. Relatively consistent exposure to the S&P 500 throughout the year contributed to the steady gains in the Fund and was additive to performance. Due to the rotational nature of the advance, with various sectors showing solid relative strength at various times during the year, the Fund allocated capital to the technology sector, small cap stocks and international markets (both developed and emerging markets). These allocations contributed to the Fund’s positive return.
The Fund maintained a defensive cash position throughout the year, recognizing that investor sentiment had reached optimistic levels (negative from a contrary point of view) and valuations remained high by any measure. The cash position held during the year detracted from the Fund’s performance in comparison to the S&P 500. However, it should be remembered that the Fund’s long-term strategy is to participate in the market’s gains while at the same time maintaining a defensive posture in an attempt to safeguard the Fund from market volatility and more significant declines.
As previously mentioned, 2017 was a positive year for the general stock market. The Fund participated in about half of this rise, which is normal for the Fund’s strategy. The Fund’s long-term strategy is to make up lost ground during the bull phases by outperforming the market during intermediate corrections and larger stock market declines.
As the Fund’s investment team looks ahead to 2018, there are a number of factors within its “Four Pillar Process” that the team will be watching to indicate potential periods of market vulnerability:
Valuation—By any measure, current stock market valuations are historically high.
Monetary policy and credit spreads—Interest rates are currently stable and credit spreads remain narrow, providing a favorable environment for the market. Also, while the yield curve has narrowed, it does not present a problem until the yield curve inverts, at least this has been the case historically. But, if interest rates begin to rise and credit spreads widen, monetary policy could quickly turn negative. These factors are potential negatives and should be watched, but do not suggest a more meaningful stock market decline is likely at this point in time.
Investor sentiment—The stock market’s steady climb in 2017 had a meaningful impact on investor sentiment. The continuous rise created high levels of optimism, which, as previously mentioned, is negative from a contrary viewpoint. In addition, individual investor bullishness climbed to its highest level in several years by the end of 2017. Investor sentiment is therefore reaching levels that are often associated with corrective phases in the general market.
Momentum—Stock market momentum remained strong throughout 2017 and the rotational nature of the advance was positive. The investment team’s measures of stock market volume and breadth did not diverge from the market’s price movements. One potential negative is that the number of stocks moving above their 10- and 30-week moving averages has been declining at the same time that the major averages are making new highs. This divergence suggests that the market may be vulnerable to a correction in coming months.
21
Salient Tactical Growth Fund
Asset Allocation as a Percentage of Net Assets
as of December 31, 2017

These allocations may not reflect the current or future position of the portfolio.
Hypothetical Growth of $100,000 Investment in the Fund
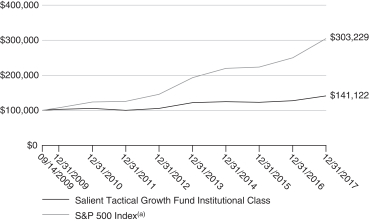
The chart above shows how a hypothetical investment of $100,000 in the Fund at its inception would have performed versus an investment in the Fund’s benchmark index. The values indicate what $100,000 would have grown to over the time period indicated. The hypothetical example does not represent the returns of any particular investment.
22
Salient Tactical Growth Fund(b)
| | | | | | | | | | | | | | | | |
| | | 1 Year | | | 5 Year | | | Since
Inception | | | Inception
Date | |
| Average Annual Total Return for the period ended December 31, 2017 | | | | | | | | | | | | | | | | |
Investor Class | | | 10.57% | | | | 5.66% | | | | 3.88% | | | | 09/14/09 | |
| | | | |
Institutional Class | | | 10.91% | | | | 6.03% | | | | 4.24% | | | | 09/14/09 | |
| | | | |
Class A (with sales load)(c) | | | 4.03% | | | | 4.25% | | | | 2.56% | | | | 03/12/10 | |
| | | | |
Class A (without sales load)(d) | | | 10.39% | | | | 5.49% | | | | 2.56% | | | | 03/12/10 | |
| | | | |
Class C (with CDSC)(e) | | | 8.92% | | | | 5.03% | | | | 3.26% | | | | 09/14/09 | |
| | | | |
Class C (without CDSC)(f) | | | 9.92% | | | | 5.03% | | | | 3.26% | | | | 09/14/09 | |
(a) The index figures do not reflect any deduction for fees, expenses or taxes. It is not possible to invest directly in an index.
(b) Prior to May 1, 2016, Salient Tactical Growth Fund was known as Forward Tactical Growth Fund.
(c) Includes the effect of the maximum 5.75% sales charge.
(d) Excludes sales charge.
(e) Includes the 1.00% contingent deferred sales charge.
(f) Excludes the 1.00% contingent deferred sales charge.
The performance quoted represents past performance, does not guarantee future results and current performance may be lower or higher than the data quoted. The investment return and principal value of an investment will fluctuate so that shares, when redeemed, may be worth more or less than their original cost. Performance data current to the most recent month-end may be obtained at www.salientfunds.com. Investment performance may reflect fee waivers in effect. In the absence of fee waivers, total return would be lower. Total return is based on NAV, assuming reinvestment of all distributions. Performance does not reflect the deduction of taxes that a shareholder would pay on fund distributions or the redemption of fund shares.
23
Fund Commentary and Performance (Unaudited)
Salient Tactical Muni & Credit Fund
As of December 31, 2017
For the year ended December 31, 2017, Salient Tactical Muni & Credit Fund’s Institutional Class shares returned 8.87%, outperforming both of the Fund’s benchmarks, the Bloomberg Barclays U.S. Municipal Bond Index and the Bloomberg Barclays U.S. Corporate High Yield Bond Index, which returned 5.45% and 7.50%, respectively.
Geopolitics continued to capture headlines in 2017—from elections in the U.S., Europe and Japan to China’s 19th National Congress of the Communist Party to turmoil in the Middle East—but markets were broadly resilient and risk assets remained well supported by synchronized global growth. Anticipation for, and passage of, fiscal stimulus in the U.S. as well as an uptick in growth momentum contributed to tighter credit spreads and allowed U.S. equities to finish the year with strong performance. The S&P 500 Index delivered positive returns every month of 2017, a first since the inception of the total return index. Volatility remained low and emerging market assets broadly strengthened, finishing a strong year of performance as a result of healthier fundamentals, a weaker U.S. dollar and rising oil prices.
Yield curves in developed markets flattened as central banks shifted toward diminished monetary policy support. During the fourth quarter, the U.S. Federal Reserve raised interest rates for the third time in 2017, the European Central Bank announced a reduction in monthly asset purchases for 2018 and the Bank of England raised interest rates for the first time since 2007. The fundamental backdrop remained largely intact, however, with data showing acceleration in growth trends in the U.S., Europe and Japan. Despite strong growth, inflation remained subdued, underpinned by improving business investment, consumer confidence and labor market strength. European growth indicators were solid but political risks remained elevated, highlighted by the Catalonian independence referendum in Spain and a lack of progress in forming a new coalition government in Germany.
Within this market environment, Salient Tactical Muni & Credit Fund outperformed its benchmarks in 2017. The Fund’s outperformance was largely driven by security selection in the tobacco sector, with high-yield tobacco bonds outperforming the broader municipal bond market. Overweight allocations to the industrial revenue and hospitals sectors also added to the Fund’s returns as both sectors outperformed the broader municipal bond market. On the downside, underweight allocations to lease-backed revenue and transportation bonds detracted from the Fund’s performance during the reporting period, as both sectors outperformed the broader municipal bond market. Additionally, an underweight allocation to duration detracted from returns as municipal yields generally fell across the yield curve during the year.
Other factors that contributed to the Fund’s performance during the year include the Fund’s focus on longer-term interest rates, as yields on the long-end of the yield curve fell during the period. Additionally, positive security selection within taxable Illinois municipal debt added to performance.
In 2017, government futures were used to tactically manage the Fund’s overall duration and yield curve positioning. The use of these futures did not impact the performance of the Fund. Additionally, the Fund used interest rate swaps in the early part of the year but the position was closed in January. Therefore, the swaps did not have a material impact on the Fund’s performance in 2017.
24
Salient Tactical Muni & Credit Fund
Asset Allocation as a Percentage of Net Assets
as of December 31, 2017

These allocations may not reflect the current or future position of the portfolio.
Hypothetical Growth of $100,000 Investment in the Fund
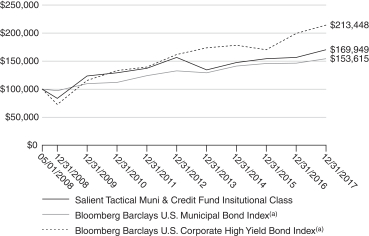
The chart above shows how a hypothetical investment of $100,000 in the Fund at its inception would have performed versus an investment in the Fund’s benchmark index. The values indicate what $100,000 would have grown to over the time period indicated. The hypothetical example does not represent the returns of any particular investment.
25
Salient Tactical Muni & Credit Fund(b)
| | | | | | | | | | | | | | | | | | | | |
| | | 1 Year | | | 5 Year | | | 10 Year | | | Since
Inception | | | Inception
Date | |
| Average Annual Total Return for the period ended December 31, 2017 | | | | | | | | | | | | | | | | | | | | |
Investor Class | | | 8.66% | | | | 1.35% | | | | N/A | | | | 5.26% | | | | 05/01/08 | |
| | | | | |
Institutional Class | | | 8.87% | | | | 1.69% | | | | N/A | | | | 5.64% | | | | 05/01/08 | |
| | | | | |
Class A (with sales load)(c)(d) | | | 2.04% | | | | -0.01% | | | | 3.83% | | | | 1.71% | | | | 12/29/06 | |
| | | | | |
Class A (without sales load)(d)(e) | | | 8.31% | | | | 1.18% | | | | 4.44% | | | | 2.26% | | | | 12/29/06 | |
| | | | | |
Class C (with CDSC)(f) | | | 6.90% | | | | 0.74% | | | | N/A | | | | 4.74% | | | | 06/03/09 | |
| | | | | |
Class C (without CDSC)(g) | | | 7.90% | | | | 0.74% | | | | N/A | | | | 4.74% | | | | 06/03/09 | |
(a) The index figures do not reflect any deduction for fees, expenses or taxes. It is not possible to invest directly in an index.
(b) Prior to June 1, 2016, Salient Tactical Muni & Credit Fund was known as Salient Tactical Muni Strategy Fund. Prior to May 1, 2016, Salient Tactical Muni Strategy Fund was known as Forward Credit Analysis Long/Short Fund. Effective November 1, 2013, Cedar Ridge Partners, LLC (“Cedar Ridge”) resigned as sub-advisor of Forward Credit Analysis Long/Short Fund and terminated its sub-advisory agreement with the Advisor. From November 1, 2013, to November 12, 2013, Forward Management, LLC was the sole advisor of the fund. Effective November 13, 2013, the fund is sub-advised solely by Pacific Investment Management Company LLC (“PIMCO”). Performance figures shown for periods before November 1, 2013, represent performance of Cedar Ridge under the previous investment strategy for the fund. Prior to May 1, 2011, Forward Credit Analysis Long/Short Fund was known as Forward Long/Short Credit Analysis Fund.
(c) Includes the effect of the maximum 5.75% sales charge.
(d) Class A shares of the fund originally commenced operations on December 29, 2006, were liquidated on November 21, 2008, and were launched again on September 1, 2010. The performance shown for any period beginning on or after November 24, 2008, and lasting through August 31, 2010, is that of the fund’s Investor Class shares adjusted to reflect the specific operating expenses applicable to Class A shares. The performance shown for any period beginning on or after September 1, 2010 is that of the fund’s Class A shares.
(e) Excludes sales charge.
(f) Includes the 1.00% contingent deferred sales charge.
(g) Excludes the 1.00% contingent deferred sales charge.
The performance quoted represents past performance, does not guarantee future results and current performance may be lower or higher than the data quoted. The investment return and principal value of an investment will fluctuate so that shares, when redeemed, may be worth more or less than their original cost. Performance data current to the most recent month-end may be obtained at www.salientfunds.com. Investment performance may reflect fee waivers in effect. In the absence of fee waivers, total return would be lower. Total return is based on NAV, assuming reinvestment of all distributions. Performance does not reflect the deduction of taxes that a shareholder would pay on fund distributions or the redemption of fund shares.
26
Fund Commentary and Performance (Unaudited)
Salient US Dividend Signal Fund
As of December 31, 2017
For the year ended December 31, 2017, Salient US Dividend Signal Fund’s Institutional Class shares returned 21.75%, outperforming the Fund’s benchmark, the Russell 3000 Index, which returned 21.13%.
U.S. equity markets were strong in 2017, though not as strong as global equity markets. In fact, 2017 proved to be an interesting year for U.S. equity markets, with three significant and noteworthy takeaways. The first is that 2017 was the first year in the history of the S&P 500 Index in which every month had a positive total return. This steady upward lift in the broad market led to the second important observation: the VIX (Chicago Board Options Exchange Volatility Index), which measures the expected level of price fluctuation in the S&P 500 Index, marked the fewest days above 12—the bottom quartile of the index’s readings—in its recorded history (which dates back to 1990). Third, growth stocks outperformed value stocks in 2017, with the Russell 1000 Growth Index outperforming the Russell 1000 Value Index by 16.55% (30.21% vs. 13.66%).
For the year ended December 31, 2017, the broad market, as measured by the S&P 500 Index, was up 21.83%, slightly outperforming the Fund’s benchmark index. The rising equity markets responded favorably to improving synchronized global growth seen in the major economies and emerging markets. The European Central Bank (ECB) and Bank of Japan (BoJ) continued their quantitative easing programs throughout 2017 and into 2018, which is in contrast to the U.S. Federal Reserve (Fed) gradually removing its accommodative policy. However, the combined amounts of money being put into the global markets by the ECB and BoJ is still greater than what the Fed is removing.
The Fund’s outperformance versus its benchmark occurred despite the previously mentioned strong performance of growth over value that took place throughout 2017, especially because the Fund tends to be a core portfolio that is fairly evenly split between growth and value. At year end, the Fund carried less leverage than the benchmark, as measured by the debt-to-equity ratio, and had a more reasonably priced portfolio than the benchmark, with a lower price-earnings ratio than that of the benchmark. Additionally, the fund’s dividend yield exceeded that of the benchmark at year-end.
The financials, industrials and real estate sectors all contributed positively to Fund performance throughout the year. The Fund had a slight overweight allocation to financials for the reporting period due to the Fed’s decision to continue to raise short-term interest rates as a result of an improving economy. The top two performers in the sector were Blackrock and First American Financial. Blackrock continued to gather inflows in its passively managed funds and exchange-traded funds. First American Financial, a title insurer for the real estate and mortgage industries, benefited from the continued demand for single-family homes in 2017.
The industrials sector also contributed positively to fund performance during the reporting period. The Fund had a slight overweight allocation to the sector due to the widespread belief that the U.S. and global economies were steadily improving. In this sector, the Fund’s top-performing stock was Owens Corning, a maker of insulation, roofing shingles and supplies, and fiber composites for the residential and commercial building industries.
The real estate sector was another key contributor to the Fund’s performance during 2017. The Fund had a slight underweight allocation to the sector due to the rising interest rate environment. However, the sector was still the Fund’s third-best performer overall. HFF, Inc., a provider of commercial real estate and capital markets services primarily to the U.S. commercial real estate industry, was the top-performing stock in the sector.
Investments in the information technology and energy sectors detracted from the Fund’s returns in 2017. An underweight allocation to the information technology sector, based on the belief that the sector was overpriced, contributed most to the underperformance. However, as mentioned previously, growth stocks outperformed value stocks by a wide margin in 2017. As such, not holding Amazon in the portfolio was the largest detractor to the Fund’s performance.
An underweight allocation to the energy sector throughout the year also detracted from the Fund’s performance, as global oil inventories remained elevated. The weakest performer in the sector was oilfield services company Schlumberger. The company lagged due to sluggish demand for its diversified oil drilling services.
Lastly, the utilities sector detracted from performance, as the Fund did not hold any utilities companies during the reporting period. The portfolio is typically well diversified across all sectors, but utilities are heavily regulated, tend to be similar rather than differentiated and may not offer a true competitive advantage. There are no plans to include utilities companies in the Fund’s portfolio in the foreseeable future.
27
Salient US Dividend Signal Fund
Weightings by Sector as a Percentage of Net Assets
as of December 31, 2017

These allocations may not reflect the current or future position of the portfolio.
Hypothetical Growth of $100,000 Investment in the Fund
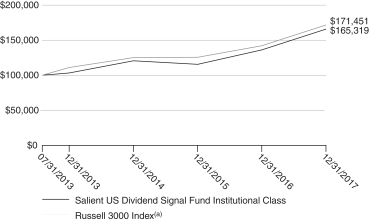
The chart above shows how a hypothetical investment of $100,000 in the Fund at its inception would have performed versus an investment in the Fund’s benchmark index. The values indicate what $100,000 would have grown to over the time period indicated. The hypothetical example does not represent the returns of any particular investment.
28
Salient US Dividend Signal Fund(b)
| | | | | | | | | | | | |
| | | 1 Year | | | Since
Inception | | | Inception
Date | |
| Average Annual Total Return for the period ended December 31, 2017 | | | | | | | | | | | | |
Investor Class | | | 21.36% | | | | 10.70% | | | | 12/31/14 | |
| | | |
Institutional Class | | | 21.75% | | | | 12.05% | | | | 07/31/13 | |
| | | |
Class A (with sales load)(c) | | | 14.16% | | | | 10.01% | | | | 07/31/13 | |
| | | |
Class A (without sales load)(d) | | | 21.13% | | | | 11.50% | | | | 07/31/13 | |
(a) The index figures do not reflect any deduction for fees, expenses or taxes. It is not possible to invest directly in an index.
(b) Prior to May 1, 2016, Salient US Dividend Signal Fund was known as Forward Dynamic Income Fund.
(c) Includes the effect of the maximum 5.75% sales charge.
(d) Excludes sales charge.
The performance quoted represents past performance, does not guarantee future results and current performance may be lower or higher than the data quoted. The investment return and principal value of an investment will fluctuate so that shares, when redeemed, may be worth more or less than their original cost. Performance data current to the most recent month-end may be obtained at www.salientfunds.com. Investment performance may reflect fee waivers in effect. In the absence of fee waivers, total return would be lower. Total return is based on NAV, assuming reinvestment of all distributions. Performance does not reflect the deduction of taxes that a shareholder would pay on fund distributions or the redemption of fund shares.
29
Investment Disclosures (Unaudited)
Fund Risk Disclosures
There are risks involved with investing, including loss of principal. Past performance does not guarantee future results, share prices will fluctuate and you may have a gain or loss when you redeem shares.
Asset allocation does not assure profit or protect against risk.
Diversification does not assure profit or protect against risk.
Salient Adaptive Balanced Fund
Each allocation fund is a fund of funds, which invest in a mix of underlying Salient Funds and related mutual funds. Shareholders of an allocation fund indirectly bear the expenses of the underlying funds. An allocation fund’s allocations may be changed at any time. Asset allocation does not assure profit or protect against risk.
Borrowing for investment purposes creates leverage, which can increase the risk and volatility of a fund.
Exposure to the commodities markets may subject a fund to greater volatility than investing in traditional securities. The value of commodity-linked derivative instruments may be affected by changes in overall market movements, commodity index volatility, changes in interest rates, or factors affecting a particular industry or commodity, such as natural disasters and international economic, political and regulatory developments.
Debt securities are subject to interest rate risk. If interest rates increase, the value of debt securities generally declines. Debt securities with longer durations tend to be more sensitive to changes in interest rates and more volatile than securities with shorter durations.
Derivative instruments involve risks different from those associated with investing directly in securities and may cause, among other things, increased volatility and transaction costs or a fund to lose more than the amount invested.
Investing in exchange-traded funds (ETFs) will subject a fund to substantially the same risks as those associated with the direct ownership of the securities or other property held by the ETFs.
Foreign securities, especially emerging or frontier markets, will involve additional risks including exchange rate fluctuations, social and political instability, less liquidity, greater volatility and less regulation.
Investing in lower-rated (“high yield”) debt securities involves special risks in addition to those associated with investments in higher-rated debt securities, including a high degree of credit risk.
Mortgage and asset-backed securities are debt instruments that are secured by interests in pools of mortgage loans or other financial instruments. Mortgage-backed securities are subject to, among other things, prepayment and extension risks.
Investing in the real estate industry or in real estate-related securities involves the risks associated with direct ownership of real estate which include, among other things, changes in economic conditions (e.g., interest rates), the macro real estate development market, government intervention (e.g., property taxes) or environmental disasters. These risks may also affect the value of equities that service the real estate sector.
Short selling involves additional investment risks and transaction costs, and creates leverage, which can increase the risk and volatility of a fund.
Investing in smaller companies generally will present greater investment risks, including greater price volatility, greater sensitivity to changing economic conditions and less liquidity than investing in larger, more mature companies.
Alternative strategies typically are subject to increased risk and loss of principal. Consequently, investments such as mutual funds that focus on alternative strategies are not suitable for all investors.
See the Investment Disclosures for underlying fund risk disclosures.
30
Investment Disclosures (Unaudited)
Salient Adaptive Income Fund
Each allocation fund is a fund of funds, which invest in a mix of underlying Salient Funds and related mutual funds. Shareholders of an allocation fund indirectly bear the expenses of the underlying funds. An allocation fund’s allocations may be changed at any time. Asset allocation does not assure profit or protect against risk.
Borrowing for investment purposes creates leverage, which can increase the risk and volatility of a fund.
Debt securities are subject to interest rate risk. If interest rates increase, the value of debt securities generally declines. Debt securities with longer durations tend to be more sensitive to changes in interest rates and more volatile than securities with shorter durations.
Derivative instruments involve risks different from those associated with investing directly in securities and may cause, among other things, increased volatility and transaction costs or a fund to lose more than the amount invested.
Investing in exchange-traded funds (ETFs) will subject a fund to substantially the same risks as those associated with the direct ownership of the securities or other property held by the ETFs.
Foreign securities, especially emerging or frontier markets, will involve additional risks including exchange rate fluctuations, social and political instability, less liquidity, greater volatility and less regulation.
Investing in lower-rated (“high yield”) debt securities involves special risks in addition to those associated with investments in higher-rated debt securities, including a high degree of credit risk.
Mortgage and asset-backed securities are debt instruments that are secured by interests in pools of mortgage loans or other financial instruments. Mortgage-backed securities are subject to, among other things, prepayment and extension risks.
Investing in the real estate industry or in real estate-related securities involves the risks associated with direct ownership of real estate which include, among other things, changes in economic conditions (e.g., interest rates), the macro real estate development market, government intervention (e.g., property taxes) or environmental disasters. These risks may also affect the value of equities that service the real estate sector.
Short selling involves additional investment risks and transaction costs, and creates leverage, which can increase the risk and volatility of a fund.
Investing in smaller companies generally will present greater investment risks, including greater price volatility, greater sensitivity to changing economic conditions and less liquidity than investing in larger, more mature companies.
Alternative strategies typically are subject to increased risk and loss of principal. Consequently, investments such as mutual funds that focus on alternative strategies are not suitable for all investors.
See the Investment Disclosures for underlying fund risk disclosures.
Salient Adaptive US Equity Fund
Derivative instruments involve risks different from those associated with investing directly in securities and may cause, among other things, increased volatility and transaction costs or a fund to lose more than the amount invested.
Investing in exchange-traded funds (ETFs) will subject a fund to substantially the same risks as those associated with the direct ownership of the securities or other property held by the ETFs.
Investing in smaller companies generally will present greater investment risks, including greater price volatility, greater sensitivity to changing economic conditions and less liquidity than investing in larger, more mature companies.
31
Investment Disclosures (Unaudited)
Salient EM Infrastructure Fund
Concentration in a particular industry will involve a greater degree of risk than a more diversified portfolio.
Debt securities are subject to interest rate risk. If interest rates increase, the value of debt securities generally declines. Debt securities with longer durations tend to be more sensitive to changes in interest rates and more volatile than securities with shorter durations.
Derivative instruments involve risks different from those associated with investing directly in securities and may cause, among other things, increased volatility and transaction costs or a fund to lose more than the amount invested.
Investing in exchange-traded funds (ETFs) will subject a fund to substantially the same risks as those associated with the direct ownership of the securities or other property held by the ETFs.
Foreign securities, especially emerging or frontier markets, will involve additional risks including exchange rate fluctuations, social and political instability, less liquidity, greater volatility and less regulation.
Investing in lower-rated (“high yield”) debt securities involves special risks in addition to those associated with investments in higher-rated debt securities, including a high degree of credit risk.
Investing in the real estate industry or in real estate-related securities involves the risks associated with direct ownership of real estate which include, among other things, changes in economic conditions (e.g., interest rates), the macro real estate development market, government intervention (e.g., property taxes) or environmental disasters. These risks may also affect the value of equities that service the real estate sector.
Investing in smaller companies generally will present greater investment risks, including greater price volatility, greater sensitivity to changing economic conditions and less liquidity than investing in larger, more mature companies.
Salient International Dividend Signal Fund
Borrowing for investment purposes creates leverage, which can increase the risk and volatility of a fund.
Derivative instruments involve risks different from those associated with investing directly in securities and may cause, among other things, increased volatility and transaction costs or a fund to lose more than the amount invested.
Foreign securities, especially emerging or frontier markets, will involve additional risks including exchange rate fluctuations, social and political instability, less liquidity, greater volatility and less regulation.
Investing in smaller companies generally will present greater investment risks, including greater price volatility, greater sensitivity to changing economic conditions and less liquidity than investing in larger, more mature companies.
There is no guarantee the companies in our portfolio will continue to pay dividends.
Salient International Small Cap Fund
Derivative instruments involve risks different from those associated with investing directly in securities and may cause, among other things, increased volatility and transaction costs or a fund to lose more than the amount invested.
Investing in exchange-traded funds (ETFs) will subject a fund to substantially the same risks as those associated with the direct ownership of the securities or other property held by the ETFs.
Foreign securities, especially emerging or frontier markets, will involve additional risks including, exchange rate fluctuations, social and political instability, less liquidity, greater volatility and less regulation.
32
Investment Disclosures (Unaudited)
Investing in smaller companies generally will present greater investment risks, including greater price volatility, greater sensitivity to changing economic conditions and less liquidity than investing in larger, more mature companies.
Salient Tactical Growth Fund
Debt securities are subject to interest rate risk. If interest rates increase, the value of debt securities generally declines. Debt securities with longer durations tend to be more sensitive to changes in interest rates and more volatile than securities with shorter durations.
Derivative instruments involve risks different from those associated with investing directly in securities and may cause, among other things, increased volatility and transaction costs or a fund to lose more than the amount invested.
Investing in exchange-traded funds (ETFs) will subject a fund to substantially the same risks as those associated with the direct ownership of the securities or other property held by the ETFs.
Foreign securities, especially emerging or frontier markets, will involve additional risks including exchange rate fluctuations, social and political instability, less liquidity, greater volatility and less regulation.
Short selling involves additional investment risks and transaction costs, and creates leverage, which can increase the risk and volatility of a fund.
Investing in smaller companies generally will present greater investment risks, including greater price volatility, greater sensitivity to changing economic conditions and less liquidity than investing in larger, more mature companies.
Alternative strategies typically are subject to increased risk and loss of principal. Consequently, investments such as mutual funds that focus on alternative strategies are not suitable for all investors.
Salient Tactical Muni & Credit Fund
Debt securities are subject to interest rate risk. If interest rates increase, the value of debt securities generally declines. Debt securities with longer durations tend to be more sensitive to changes in interest rates and more volatile than securities with shorter durations.
Derivative instruments involve risks different from those associated with investing directly in securities and may cause, among other things, increased volatility and transaction costs or a fund to lose more than the amount invested.
Foreign securities, especially emerging or frontier markets, will involve additional risks including exchange rate fluctuations, social and political instability, less liquidity, greater volatility and less regulation.
Investing in lower-rated (“high yield”) debt securities involves special risks in addition to those associated with investments in higher-rated debt securities, including a high degree of credit risk.
Investing in a non-diversified fund involves the risk of greater price fluctuation than a more diversified portfolio.
Short selling involves additional investment risks and transaction costs, and creates leverage, which can increase the risk and volatility of a fund.
Alternative strategies typically are subject to increased risk and loss of principal. Consequently, investments such as mutual funds that focus on alternative strategies are not suitable for all investors.
Salient US Dividend Signal Fund
Derivative instruments involve risks different from those associated with investing directly in securities and may cause, among other things, increased volatility and transaction costs or a fund to lose more than the amount invested.
33
Investment Disclosures (Unaudited)
Investing in smaller companies generally will present greater investment risks, including greater price volatility, greater sensitivity to changing economic conditions and less liquidity than investing in larger, more mature companies.
There is no guarantee the companies in our portfolio will continue to pay dividends.
Fund Benchmark Definitions
Bloomberg Barclays Global Aggregate Index provides a broad-base measure of the global investment grade fixed-rate debt markets.
Bloomberg Barclays U.S. Corporate High Yield Bond Index covers the USD-denominated, noninvestment grade, fixed-rate, taxable corporate bond market. Securities are classified as high yield if the middle rating of Moody’s, Fitch and S&P is Ba1/BB+/BB+ or below.
Bloomberg Barclays U.S. Municipal Bond Index covers the USD-denominated, long-term tax-exempt bond market. The index has four main sectors: state and local general obligation bonds, revenue bonds, insured bonds and pre-refunded bonds.
MSCI ACWI (All Country World Index) is a free float-adjusted market capitalization index that is designed to measure equity market performance in the global developed and emerging markets.
MSCI ACWI (All Country World Index) ex-USA is a free float-adjusted market capitalization index that is designed to measure equity market performance in the global developed and emerging markets, excluding the United States.
MSCI EAFE Small Cap Index is an unmanaged, market-weighted index of small companies in developed markets, excluding the U.S. and Canada.
MSCI Emerging Markets Index is a free float-adjusted market capitalization index that is designed to measure equity market performance in the global emerging markets.
MSCI World Index is a free float-adjusted market capitalization index that is designed to measure equity market performance in the global developed markets.
Russell 3000 Index is a market capitalization-weighted equity index maintained by the Russell Investment Group that seeks to be a benchmark of the entire U.S. stock market. The index is composed of the 3,000 largest U.S. companies and represents approximately 98% of the investable U.S. equity market.
S&P 500 Index is an unmanaged index of 500 common stocks chosen to reflect the industries in the U.S. economy.
One cannot invest directly in an index.
Definition of Terms
Basis point (bps) is a unit of measure that is equal to 1/100th of 1% and used to denote a change in the value or rate of a financial instrument.
Beta is a measure of the volatility, or systematic risk, of a security or a portfolio in comparison to the market as a whole.
Bloomberg Barclays High Yield Municipal Bond Index tracks the performance of noninvestment-grade U.S. municipal bonds with a remaining maturity of one year or more.
Bloomberg Barclays U.S. Aggregate Bond Index represents securities that are U.S. domestic, taxable and dollar denominated. The index covers the U.S. investment-grade, fixed-rate bond market, with index components for government and corporate securities, mortgage pass-through securities and asset-backed securities.
34
Investment Disclosures (Unaudited)
Credit Suisse Emerging Market Corporate Bond Index consists of U.S. dollar-denominated fixed-income issues from Latin America, Eastern Europe and Asia.
Credit spread is the spread between Treasury securities and non-Treasury securities that are identical in all respects except for quality rating.
Debt-to-equity ratio is a measurement of a company’s financial leverage, calculated by dividing its total liabilities by stockholders’ equity. It indicates what proportion of equity and debt the company is using to finance its assets.
Derivative is a security whose price is dependent upon or derived from one or more underlying assets.
Dividend yield is a financial ratio that shows how much a company pays out in dividends each year relative to its share price.
Duration is a measure of the sensitivity of the price of a fixed-income investment to a change in interest rates and is expressed as a number of years.
ETF futures are contracts that represent an agreement to buy (or sell) underlying ETF shares at an agreed-upon price on or before a specified date in the future.
Futures are financial contracts that obligate the buyer to purchase an asset (or the seller to sell an asset), such as a physical commodity or a financial instrument, at a predetermined future date and price.
Index future is a futures contract on a stock or financial index.
Inflation is the rate at which the general level of prices for goods and services is rising, and, subsequently, purchasing power is falling.
Interest rate swap is an agreement between two counterparties in which one stream of future interest payments is exchanged for another based on a specified principal amount.
J.P. Morgan Emerging Markets Bond Index (EMBI) Global Core Index is a broad, diverse U.S. dollar-denominated emerging markets debt benchmark that tracks the total return of actively traded debt instruments in emerging market countries.
JPMorgan Global Manufacturing Purchasing Managers’ Index is a composite index that serves as a global economic indicator by measuring different business conditions in 24 countries, including global manufacturing output, new orders and employment across the global manufacturing sector.
Market breadth is a ratio that compares the total number of rising stocks to the total number of falling stocks.
Momentum is the rate of acceleration of a security’s price or volume.
Monetary policy refers to the actions of a central bank, currency board or other regulatory committee that determine the size and rate of growth of the money supply, including an increase in interest rates or changing the amount of money banks need to keep in bank reserves.
MSCI EAFE Index is a stock market index that is designed to measure the equity market performance of developed markets outside of the U.S. and Canada.
MSCI Emerging Markets Growth Index tracks large- and mid-cap securities exhibiting overall growth style characteristics across 24 emerging market countries.
MSCI Emerging Markets Value Index tracks large- and mid-cap securities exhibiting overall value style characteristics across 24 emerging market countries.
MSCI Europe Index is a free float-adjusted market capitalization index designed to measure developed market equity performance in Europe.
35
Investment Disclosures (Unaudited)
MSCI Japan Index is a free float-adjusted market capitalization index that is designed to measure the equity performance of 85% of Japan’s large- and mid-cap segments.
Price-earnings (P/E) ratio is a measure of the price paid for a share of stock relative to the annual income or profit earned by the company per share. A higher P/E ratio means that investors are paying more for each unit of income.
Quantitative easing refers to a form of monetary policy used to stimulate an economy where interest rates are either at, or close to, zero.
Russell 1000 Growth Index is a large cap growth index measuring the performance of the largest 1,000 U.S. companies with higher price-book ratios and higher forecasted growth values.
Russell 1000 Value Index is a large cap value index measuring the performance of the largest 1,000 U.S. companies with lower price-book ratios and lower forecasted growth values.
Russell 2000 Index measures the performance of the 2,000 smallest companies in the Russell 3000 Index. The Russell 3000 Index represents approximately 98% of the investable U.S. equity market.
Standard deviation measures the degree to which a fund’s return varies from its previous returns or from the average of all similar funds.
U.S. Dollar Index is a measure of the value of the U.S. dollar relative to six major world currencies: the euro, Japanese yen, Canadian dollar, British pound, Swedish krona and Swiss franc.
Valuation is the process of determining the value of an asset or company based on earnings and the market value of assets.
VIX (the ticker symbol for the Chicago Board Options Exchange Volatility Index) is a popular measure of market risk and is constructed using the implied volatility of S&P 500 index options.
Volatility is a statistical measure of the dispersion of returns for a given security or market index.
Volume is the number of shares or contracts traded in a security or an entire market during a given period of time.
Yield curve is a line that plots the interest rates, at a set point in time, of bonds having equal credit quality, but differing maturity dates.
36
Disclosure of Fund Expenses (Unaudited)
For the Six Months Ended December 31, 2017
As a shareholder of the Salient Funds, you incur two types of costs: (1) transaction costs, including applicable sales charges (loads); and (2) ongoing costs, including management fees, distribution and service (12b-1) fees, shareholder services fees and other Fund expenses. This example is intended to help you understand your ongoing costs (in dollars) of investing in the Funds and to compare these costs with the ongoing costs of investing in other mutual funds. The example is based on an investment of $1,000 invested at the beginning of the (six-month) period and held for the entire period July 1, 2017 through December 31, 2017.
Actual Expenses
The first line for each share class of each Fund in the table provides information about actual account values and actual expenses. You may use this information, together with the amount you invested, to estimate the expenses that you paid over the period. Simply divide your account value by $1,000 (for example, an $8,600 account value divided by $1,000 = 8.6), then multiply the result by the number in the applicable line under the heading entitled “Expenses Paid During Period” to estimate the expenses you paid on your account during this period.
Hypothetical Example For Comparison Purposes
The second line for each share class of each Fund in the table below provides information about hypothetical account values and hypothetical expenses based on the Fund’s actual expense ratio and an assumed rate of return of 5% per year before expenses, which is not the Fund’s actual return. The hypothetical account values and expenses may not be used to estimate the actual ending account balance or expenses you paid for the period. You may use this information to compare the ongoing costs of investing in the Funds and other funds. To do so, compare this 5% hypothetical example with the 5% hypothetical examples that appear in the shareholder reports of other funds.
Please note that the expenses shown in the table below are meant to highlight your ongoing costs only and do not reflect any transactional costs, such as sales charges (loads), redemption fees or exchange fees. Therefore, the second line for each share class of each Fund within the table is useful in comparing ongoing costs only, and will not help you determine the relative total costs of owning different funds. If these transactional costs were included, your costs would have been higher.
| | | | | | | | | | | | | | | | |
Salient Adaptive Balanced Fund | | Beginning
Account Value
07/01/17 | | | Ending
Account Value
12/31/17 | | | Expense
Ratios(a) | | | Expenses Paid
During Period(b)
07/01/17-12/31/17 | |
| Investor Class | | | | | | | | | | | | | | | | |
Actual | | $ | 1,000.00 | | | $ | 1,082.70 | | | | 0.82% | | | $ | 4.30 | |
| | | | |
Hypothetical | | $ | 1,000.00 | | | $ | 1,021.07 | | | | 0.82% | | | $ | 4.18 | |
| Institutional Class | | | | | | | | | | | | | | | | |
Actual | | $ | 1,000.00 | | | $ | 1,085.20 | | | | 0.32% | | | $ | 1.68 | |
| | | | |
Hypothetical | | $ | 1,000.00 | | | $ | 1,023.59 | | | | 0.32% | | | $ | 1.63 | |
| Class A | | | | | | | | | | | | | | | | |
Actual | | $ | 1,000.00 | | | $ | 1,083.70 | | | | 0.67% | | | $ | 3.52 | |
| | | | |
Hypothetical | | $ | 1,000.00 | | | $ | 1,021.83 | | | | 0.67% | | | $ | 3.41 | |
| Class C | | | | | | | | | | | | | | | | |
Actual | | $ | 1,000.00 | | | $ | 1,080.00 | | | | 1.32% | | | $ | 6.92 | |
| | | | |
Hypothetical | | $ | 1,000.00 | | | $ | 1,018.55 | | | | 1.32% | | | $ | 6.72 | |
| Salient Adaptive Income Fund | | | | | | | | | | | | |
| Investor Class | | | | | | | | | | | | | | | | |
Actual | | $ | 1,000.00 | | | $ | 1,050.10 | | | | 0.51% | | | $ | 2.64 | |
| | | | |
Hypothetical | | $ | 1,000.00 | | | $ | 1,022.63 | | | | 0.51% | | | $ | 2.60 | |
| Institutional Class | | | | | | | | | | | | | | | | |
Actual | | $ | 1,000.00 | | | $ | 1,053.30 | | | | 0.01% | | | $ | 0.05 | |
| | | | |
Hypothetical | | $ | 1,000.00 | | | $ | 1,025.16 | | | | 0.01% | | | $ | 0.05 | |
37
Disclosure of Fund Expenses (Unaudited)
For the Six Months Ended December 31, 2017
| | | | | | | | | | | | | | | | |
Salient Adaptive Income Fund (continued) | | Beginning
Account Value
07/01/17 | | | Ending
Account Value
12/31/17 | | | Expense
Ratios(a) | | | Expenses Paid
During Period(b)
07/01/17-12/31/17 | |
| Class A | | | | | | | | | | | | | | | | |
Actual | | $ | 1,000.00 | | | $ | 1,052.10 | | | | 0.26% | | | $ | 1.34 | |
| | | | |
Hypothetical | | $ | 1,000.00 | | | $ | 1,023.89 | | | | 0.26% | | | $ | 1.33 | |
| Class C | | | | | | | | | | | | | | | | |
Actual | | $ | 1,000.00 | | | $ | 1,047.70 | | | | 1.01% | | | $ | 5.21 | |
| | | | |
Hypothetical | | $ | 1,000.00 | | | $ | 1,020.11 | | | | 1.01% | | | $ | 5.14 | |
| Salient Adaptive US Equity Fund | | | | | | | | | | | | |
| Investor Class | | | | | | | | | | | | | | | | |
Actual | | $ | 1,000.00 | | | $ | 1,157.10 | | | | 1.25% | | | $ | 6.80 | |
| | | | |
Hypothetical | | $ | 1,000.00 | | | $ | 1,018.90 | | | | 1.25% | | | $ | 6.36 | |
| Institutional Class | | | | | | | | | | | | | | | | |
Actual | | $ | 1,000.00 | | | $ | 1,159.80 | | | | 0.80% | | | $ | 4.36 | |
| | | | |
Hypothetical | | $ | 1,000.00 | | | $ | 1,021.17 | | | | 0.80% | | | $ | 4.08 | |
| Salient EM Infrastructure Fund | | | | | | | | | | | | |
| Investor Class | | | | | | | | | | | | | | | | |
Actual | | $ | 1,000.00 | | | $ | 1,063.90 | | | | 1.55% | | | $ | 8.06 | |
| | | | |
Hypothetical | | $ | 1,000.00 | | | $ | 1,017.39 | | | | 1.55% | | | $ | 7.88 | |
| Institutional Class | | | | | | | | | | | | | | | | |
Actual | | $ | 1,000.00 | | | $ | 1,065.10 | | | | 1.20% | | | $ | 6.25 | |
| | | | |
Hypothetical | | $ | 1,000.00 | | | $ | 1,019.16 | | | | 1.20% | | | $ | 6.11 | |
| Class A | | | | | | | | | | | | | | | | |
Actual | | $ | 1,000.00 | | | $ | 1,063.00 | | | | 1.60% | | | $ | 8.32 | |
| | | | |
Hypothetical | | $ | 1,000.00 | | | $ | 1,017.14 | | | | 1.60% | | | $ | 8.13 | |
| Class C | | | | | | | | | | | | | | | | |
Actual | | $ | 1,000.00 | | | $ | 1,060.30 | | | | 2.15% | | | $ | 11.17 | |
| | | | |
Hypothetical | | $ | 1,000.00 | | | $ | 1,014.37 | | | | 2.15% | | | $ | 10.92 | |
| Salient International Dividend Signal Fund | | | | | | | | | | | | |
| Investor Class | | | | | | | | | | | | | | | | |
Actual | | $ | 1,000.00 | | | $ | 1,098.60 | | | | 1.47% | | | $ | 7.78 | |
| | | | |
Hypothetical | | $ | 1,000.00 | | | $ | 1,017.80 | | | | 1.47% | | | $ | 7.48 | |
| Institutional Class | | | | | | | | | | | | | | | | |
Actual | | $ | 1,000.00 | | | $ | 1,102.30 | | | | 1.18% | | | $ | 6.25 | |
| | | | |
Hypothetical | | $ | 1,000.00 | | | $ | 1,019.26 | | | | 1.18% | | | $ | 6.01 | |
| Class A | | | | | | | | | | | | | | | | |
Actual | | $ | 1,000.00 | | | $ | 1,097.90 | | | | 1.69% | | | $ | 8.94 | |
| | | | |
Hypothetical | | $ | 1,000.00 | | | $ | 1,016.69 | | | | 1.69% | | | $ | 8.59 | |
38
Disclosure of Fund Expenses (Unaudited)
For the Six Months Ended December 31, 2017
| | | | | | | | | | | | | | | | |
Salient International Dividend Signal Fund (continued) | | Beginning
Account Value
07/01/17 | | | Ending
Account Value
12/31/17 | | | Expense
Ratios(a) | | | Expenses Paid
During Period(b)
07/01/17-12/31/17 | |
| Class C | | | | | | | | | | | | | | | | |
Actual | | $ | 1,000.00 | | | $ | 1,095.60 | | | | 2.14% | | | $ | 11.30 | |
| | | | |
Hypothetical | | $ | 1,000.00 | | | $ | 1,014.42 | | | | 2.14% | | | $ | 10.87 | |
| Salient International Small Cap Fund | | | | | | | | | | | | |
| Investor Class | | | | | | | | | | | | | | | | |
Actual | | $ | 1,000.00 | | | $ | 1,140.10 | | | | 1.58% | | | $ | 8.52 | |
| | | | |
Hypothetical | | $ | 1,000.00 | | | $ | 1,017.24 | | | | 1.58% | | | $ | 8.03 | |
| Institutional Class | | | | | | | | | | | | | | | | |
Actual | | $ | 1,000.00 | | | $ | 1,143.00 | | | | 1.23% | | | $ | 6.64 | |
| | | | |
Hypothetical | | $ | 1,000.00 | | | $ | 1,019.00 | | | | 1.23% | | | $ | 6.26 | |
| Salient Tactical Growth Fund | | | | | | | | | | | | |
| Investor Class | | | | | | | | | | | | | | | | |
Actual | | $ | 1,000.00 | | | $ | 1,060.70 | | | | 1.84% | | | $ | 9.56 | |
| | | | |
Hypothetical | | $ | 1,000.00 | | | $ | 1,015.93 | | | | 1.84% | | | $ | 9.35 | |
| Institutional Class | | | | | | | | | | | | | | | | |
Actual | | $ | 1,000.00 | | | $ | 1,062.30 | | | | 1.49% | | | $ | 7.75 | |
| | | | |
Hypothetical | | $ | 1,000.00 | | | $ | 1,017.69 | | | | 1.49% | | | $ | 7.58 | |
| Class A | | | | | | | | | | | | | | | | |
Actual | | $ | 1,000.00 | | | $ | 1,059.60 | | | | 1.99% | | | $ | 10.33 | |
| | | | |
Hypothetical | | $ | 1,000.00 | | | $ | 1,015.17 | | | | 1.99% | | | $ | 10.11 | |
| Class C | | | | | | | | | | | | | | | | |
Actual | | $ | 1,000.00 | | | $ | 1,057.20 | | | | 2.44% | | | $ | 12.65 | |
| | | | |
Hypothetical | | $ | 1,000.00 | | | $ | 1,012.91 | | | | 2.44% | | | $ | 12.38 | |
| Salient Tactical Muni & Credit Fund | | | | | | | | | | | | |
| Investor Class | | | | | | | | | | | | | | | | |
Actual | | $ | 1,000.00 | | | $ | 1,036.10 | | | | 1.63% | | | $ | 8.37 | |
| | | | |
Hypothetical | | $ | 1,000.00 | | | $ | 1,016.99 | | | | 1.63% | | | $ | 8.29 | |
| Institutional Class | | | | | | | | | | | | | | | | |
Actual | | $ | 1,000.00 | | | $ | 1,037.10 | | | | 1.27% | | | $ | 6.52 | |
| | | | |
Hypothetical | | $ | 1,000.00 | | | $ | 1,018.80 | | | | 1.27% | | | $ | 6.46 | |
| Class A | | | | | | | | | | | | | | | | |
Actual | | $ | 1,000.00 | | | $ | 1,034.30 | | | | 1.76% | | | $ | 9.02 | |
| | | | |
Hypothetical | | $ | 1,000.00 | | | $ | 1,016.33 | | | | 1.76% | | | $ | 8.94 | |
| Class C | | | | | | | | | | | | | | | | |
Actual | | $ | 1,000.00 | | | $ | 1,033.10 | | | | 2.23% | | | $ | 11.43 | |
| | | | |
Hypothetical | | $ | 1,000.00 | | | $ | 1,013.96 | | | | 2.23% | | | $ | 11.32 | |
39
Disclosure of Fund Expenses (Unaudited)
For the Six Months Ended December 31, 2017
| | | | | | | | | | | | | | | | |
Salient US Dividend Signal Fund | | Beginning
Account Value
07/01/17 | | | Ending
Account Value
12/31/17 | | | Expense
Ratios(a) | | | Expenses Paid
During Period(b)
07/01/17-12/31/17 | |
| Investor Class | | | | | | | | | | | | | | | | |
Actual | | $ | 1,000.00 | | | $ | 1,100.40 | | | | 1.34% | | | $ | 7.09 | |
| | | | |
Hypothetical | | $ | 1,000.00 | | | $ | 1,018.45 | | | | 1.34% | | | $ | 6.82 | |
| Institutional Class | | | | | | | | | | | | | | | | |
Actual | | $ | 1,000.00 | | | $ | 1,102.10 | | | | 0.99% | | | $ | 5.25 | |
| | | | |
Hypothetical | | $ | 1,000.00 | | | $ | 1,020.21 | | | | 0.99% | | | $ | 5.04 | |
| Class A | | | | | | | | | | | | | | | | |
Actual | | $ | 1,000.00 | | | $ | 1,099.60 | | | | 1.49% | | | $ | 7.89 | |
| | | | |
Hypothetical | | $ | 1,000.00 | | | $ | 1,017.69 | | | | 1.49% | | | $ | 7.58 | |
(a) Annualized, based on the Fund’s most recent fiscal half year expenses.
(b) Expenses are equal to the Fund’s annualized expense ratio multiplied by the average account values over the period, multiplied by the number of days in the most recent fiscal half year (184), then divided by 365.
40
Schedule of Investments (See Note 11)
Salient Adaptive Balanced Fund
December 31, 2017
| | | | | | | | | | | | |
| Shares | | | | | Allocation | | | Value
(See Note 2) | |
| |
| | Affiliated Investment Companies: 75.04% | | | | | |
| | | |
| | 840,125 | | | Salient Adaptive Growth Fund — Class I(a) | | | 22.33 | % | | $ | 6,074,104 | |
| | | |
| | 137,234 | | | Salient Adaptive US Equity Fund — Institutional Class | | | 19.67 | % | | | 5,350,741 | |
| | | |
| | 584,843 | | | Salient International Dividend Signal Fund — Institutional Class | | | 15.22 | % | | | 4,140,692 | |
| | | |
| | 45,824 | | | Salient International Real Estate Fund — Institutional Class(a) | | | 2.47 | % | | | 672,696 | |
| | | |
| | 28,558 | | | Salient Select Income Fund — Institutional Class(a) | | | 2.33 | % | | | 631,984 | |
| | | |
| | 117,817 | | | Salient Tactical Muni & Credit Fund — Institutional Class | | | 3.40 | % | | | 923,685 | |
| | | |
| | 307,202 | | | Salient Trend Fund — Class I(a) | | | 9.62 | % | | | 2,617,359 | |
| | | |
| | | | Total Affiliated Investment Companies
(Cost $18,799,401) | | | | | | | 20,411,261 | |
| | |
| | Exchange-Traded Funds: 19.89% | | | | | | | | |
| | | |
| | 20,358 | | | iShares® 7-10 Year Treasury Bond ETF | | | 7.90 | % | | | 2,149,194 | |
| | | |
| | 17,553 | | | iShares® Core MSCI Emerging Markets ETF | | | 3.67 | % | | | 998,766 | |
| | | |
| | 26,490 | | | iShares® Emerging Markets High Yield Bond ETF | | | 4.87 | % | | | 1,323,970 | |
| | | |
| | 10,758 | | | iShares® iBoxx $ High Yield Corporate Bond ETF | | | 3.45 | % | | | 938,743 | |
| | | |
| | | | Total Exchange-Traded Funds
(Cost $5,381,753) | | | | | | | 5,410,673 | |
| | | |
| | | | Total Investments: 94.93%
(Cost $24,181,154) | | | | | | | 25,821,934 | |
| | |
| | | | Net Other Assets and Liabilities: 5.07% | | | | 1,379,465 | |
| | | |
| | | | Net Assets: 100.00% | | | | | | $ | 27,201,399 | |
Percentages are stated as a percent of net assets.
(a) Salient Adaptive Growth Fund, Salient International Real Estate Fund, Salient Select Income Fund and Salient Trend Fund’s December 31, 2017 Annual Report may be obtained at www.salientpartners.com.
Investment Abbreviations:
ETF — Exchange-Traded Fund
MSCI — Morgan Stanley Capital International
| | | | |
| See accompanying Notes to Financial Statements. | | 41 | | |
Schedule of Investments (See Note 11)
Salient Adaptive Income Fund
December 31, 2017
| | | | | | | | | | | | |
| Shares | | | | | Allocation | | | Value
(See Note 2) | |
| |
| | Affiliated Investment Companies: 49.54% | | | | | |
| | | |
| | 263,675 | | | Salient International Dividend Signal Fund — Institutional Class | | | 15.15 | % | | $ | 1,866,817 | |
| | | |
| | 85,310 | | | Salient International Real Estate Fund — Institutional Class(a) | | | 10.17 | % | | | 1,252,348 | |
| | | |
| | 55,631 | | | Salient Select Income Fund — Institutional Class(a) | | | 9.99 | % | | | 1,231,104 | |
| | | |
| | 223,669 | | | Salient Tactical Muni & Credit Fund — Institutional Class | | | 14.23 | % | | | 1,753,568 | |
| | | |
| | | | Total Affiliated Investment Companies
(Cost $5,796,586) | | | | | | | 6,103,837 | |
| | |
| | Exchange-Traded Funds: 49.87% | | | | | | | | |
| | | |
| | 31,337 | | | iShares® Core MSCI Emerging Markets ETF | | | 14.47 | % | | | 1,783,075 | |
| | | |
| | 50,797 | | | iShares® Emerging Markets High Yield Bond ETF | | | 20.61 | % | | | 2,538,834 | |
| | | |
| | 20,879 | | | iShares® iBoxx $ High Yield Corporate Bond ETF | | | 14.79 | % | | | 1,821,902 | |
| | | |
| | | | Total Exchange-Traded Funds
(Cost $6,103,637) | | | | | | | 6,143,811 | |
| | | |
| | | | Total Investments: 99.41%
(Cost $11,900,223) | | | | | | | 12,247,648 | |
| | |
| | | | Net Other Assets and Liabilities: 0.59% | | | | 72,635 | |
| | |
| | | | Net Assets: 100.00% | | | $ | 12,320,283 | |
Percentages are stated as a percent of net assets.
(a) Salient International Real Estate Fund and Salient Select Income Fund’s December 31, 2017 Annual Report may be obtained at www.salientpartners.com.
Investment Abbreviations:
ETF — Exchange-Traded Fund
MSCI — Morgan Stanley Capital International
| | | | |
| See accompanying Notes to Financial Statements. | | 42 | | |
Schedule of Investments (See Note 11)
Salient Adaptive US Equity Fund
December 31, 2017
| | | | | | | | |
| | | Shares | | | Value
(See Note 2) | |
| |
| Exchange-Traded Funds: 90.70% | | | | | |
| | |
Consumer Discretionary Select Sector SPDR® Fund | | | 26,600 | | | $ | 2,625,154 | |
| | |
Financial Select Sector SPDR® Fund | | | 25,293 | | | | 705,927 | |
| | |
Health Care Select Sector SPDR® Fund | | | 35,426 | | | | 2,929,022 | |
| | |
Materials Select Sector SPDR® Fund | | | 40,559 | | | | 2,455,036 | |
| | |
Utilities Select Sector SPDR® Fund | | | 42,382 | | | | 2,232,684 | |
| | |
Vanguard Industrials ETF | | | 6,710 | | | | 955,303 | |
| | |
Vanguard Information Technology ETF | | | 23,910 | | | | 3,938,694 | |
| | |
Total Exchange-Traded Funds
(Cost $14,529,794) | | | | | | | 15,841,820 | |
| | |
Total Investments: 90.70%
(Cost $14,529,794) | | | | | | | 15,841,820 | |
| | |
| Net Other Assets and Liabilities: 9.30% | | | | | | | 1,624,566 | (a) |
| | |
| Net Assets: 100.00% | | | | | | $ | 17,466,386 | |
Percentages are stated as a percent of net assets.
(a) Includes cash which is being held as collateral for futures contracts.
Futures Contracts Purchased
| | | | | | | | | | | | | | | | |
| Description | | Contracts | | | Expiration
Date | | | Notional
Value | | | Value and Unrealized
Appreciation/(Depreciation) | |
E-Mini S&P 500® Futures | | | 113 | | | | March 2018 | | | $ | 15,119,400 | | | $ | 27,352 | |
| Total Futures Contracts | | | | | | | | | | $ | 15,119,400 | | | $ | 27,352 | |
Investment Abbreviations:
ETF — Exchange-Traded Fund
S&P — Standard & Poor’s
SPDR — Standard & Poor’s Depository Receipt
| | | | |
| See accompanying Notes to Financial Statements. | | 43 | | |
Schedule of Investments (See Note 11)
Salient EM Infrastructure Fund
December 31, 2017
| | | | | | | | |
| | | Shares | | | Value
(See Note 2) | |
| |
| Common Stocks: 93.24% | | | | | |
| Brazil: 14.51% | | | | | | | | |
| | |
CCR SA | | | 262,500 | | | $ | 1,278,432 | |
| | |
Cia de Saneamento do Parana | | | 72,660 | | | | 1,310,886 | |
| | |
Cosan SA Industria e Comercio | | | 30,656 | | | | 383,581 | |
| | |
Ecorodovias Infraestrutura e Logistica SA | | | 192,000 | | | | 713,973 | |
| | |
Ultrapar Participacoes SA, Sponsored ADR | | | 25,500 | | | | 579,615 | |
| | |
| | | | | | | 4,266,487 | |
| | | | | | | | |
| Chile: 4.46% | | | | | | | | |
| | |
Aguas Andinas SA, Class A | | | 900,900 | | | | 596,403 | |
| | |
Enel Americas SA | | | 3,212,600 | | | | 715,344 | |
| | |
| | | | | | | 1,311,747 | |
| | | | | | | | |
| China: 29.11% | | | | | | | | |
| | |
China Communications Services Corp., Ltd., Class H | | | 1,009,500 | | | | 677,062 | |
| | |
China Machinery Engineering Corp., Class H | | | 868,040 | | | | 563,298 | |
| | |
ENN Energy Holdings, Ltd. | | | 196,104 | | | | 1,399,335 | |
| | |
Jiangsu Expressway Co., Ltd., Class H | | | 581,039 | | | | 884,999 | |
| | |
Qingdao Port International Co., Ltd., Class H | | | 1,126,160 | | | | 755,304 | |
| | |
Shenzhen International Holdings, Ltd. | | | 475,000 | | | | 904,664 | |
| | |
SITC International Holdings Co., Ltd. | | | 1,607,723 | | | | 1,588,616 | |
| | |
Yuexiu Transport Infrastructure, Ltd. | | | 1,785,198 | | | | 1,311,562 | |
| | |
Zhejiang Expressway Co., Ltd., Class H | | | 432,000 | | | | 474,971 | |
| | |
| | | | | | | 8,559,811 | |
| | | | | | | | |
| Hong Kong: 7.35% | | | | | | | | |
| | |
COSCO SHIPPING Ports, Ltd. | | | 355,595 | | | | 370,030 | |
| | |
Guangdong Investment, Ltd. | | | 646,744 | | | | 865,874 | |
| | |
HKBN, Ltd. | | | 732,384 | | | | 926,160 | |
| | |
| | | | | | | 2,162,064 | |
| | | | | | | | |
| Indonesia: 1.15% | | | | | | | | |
| | |
Jasa Marga Persero Tbk PT | | | 718,900 | | | | 339,116 | |
| | | | | | | | |
| Malaysia: 3.26% | | | | | | | | |
| | |
Tenaga Nasional Bhd | | | 253,821 | | | | 957,081 | |
| | | | | | | | |
| Mexico: 10.86% | | | | | | | | |
| | |
Grupo Aeroportuario del Centro Norte SAB de CV | | | 244,900 | | | | 1,269,308 | |
| | | | | | | | |
| | | Shares | | | Value
(See Note 2) | |
| | |
| | | | | | | | |
| | | |
PLA Administradora Industrial S de RL de CV | | | 630,233 | | | $ | 955,486 | |
| | |
Promotora y Operadora de Infraestructura SAB de CV | | | 97,950 | | | | 967,768 | |
| | |
| | | | | | | 3,192,562 | |
| | | | | | | | |
| Norway: 1.35% | | | | | | | | |
| | |
Hoegh LNG Holdings, Ltd. | | | 50,200 | | | | 397,413 | |
| | | | | | | | |
| Philippines: 2.83% | | | | | | | | |
| | |
Manila Electric Co. | | | 126,600 | | | | 833,349 | |
| | | | | | | | |
| Russia: 2.26% | | | | | | | | |
| | |
LUKOIL PJSC, Sponsored ADR | | | 11,518 | | | | 664,013 | |
| | | | | | | | |
| Singapore: 1.20% | | | | | | | | |
| | |
Singapore Technologies Engineering Ltd. | | | 145,000 | | | | 353,434 | |
| | | | | | | | |
| South Korea: 1.54% | | | | | | | | |
| | |
Korea Electric Power Corp., Sponsored ADR(a) | | | 25,500 | | | | 451,605 | |
| | | | | | | | |
| Thailand: 5.50% | | | | | | | | |
| | |
BTS Rail Mass Transit Growth Infrastructure Fund | | | 1,941,000 | | | | 696,830 | |
| | |
TTW PCL | | | 2,376,400 | | | | 918,768 | |
| | |
| | | | | | | 1,615,598 | |
| | | | | | | | |
| Turkey: 4.50% | | | | | | | | |
| | |
Aygaz AS | | | 140,000 | | | | 593,537 | |
| | |
TAV Havalimanlari Holding AS | | | 122,900 | | | | 728,224 | |
| | |
| | | | | | | 1,321,761 | |
| | | | | | | | |
| Vietnam: 3.36% | | | | | | | | |
| | |
PetroVietnam Gas JSC | | | 92,420 | | | | 396,394 | |
| | |
PetroVietnam Nhon Trach 2 Power JSC | | | 400,440 | | | | 590,723 | |
| | |
| | | | | | | 987,117 | |
| | |
Total Common Stocks
(Cost $23,995,383) | | | | | | | 27,413,158 | |
| | | | | | | | |
| | | | |
| See accompanying Notes to Financial Statements. | | 44 | | |
Schedule of Investments (See Note 11)
Salient EM Infrastructure Fund
December 31, 2017
| | | | | | | | |
| | | Shares | | | Value
(See Note 2) | |
| |
| Limited Partnerships: 0.65% | | | | | |
| Bermuda: 0.65% | | | | | | | | |
| | |
Hoegh LNG Partners LP | | | 10,200 | | | $ | 190,230 | |
| | |
Total Limited Partnerships
(Cost $176,531) | | | | | | | 190,230 | |
| |
| Participation Notes: 2.70% | | | | | |
| India: 1.44% | | | | | | | | |
| | |
Coal India, Ltd., (Participation Notes issued by Macquarie Bank, Ltd.), expiring 01/31/19 | | | 103,000 | | | | 424,329 | |
| | | | | | | | |
| Pakistan: 1.26% | | | | | | | | |
| | |
HUB Power Co., Ltd, Sponsored GDR (Participation Notes issued by Macquarie Bank, Ltd.), expiring 03/29/19 | | | 450,000 | | | | 371,092 | |
| | |
Total Participation Notes
(Cost $914,999) | | | | | | | 795,421 | |
| | |
Total Investments: 96.59%
(Cost $25,086,913) | | | | | | | 28,398,809 | |
| | |
| Net Other Assets and Liabilities: 3.41% | | | | | | | 1,001,880 | |
| | |
| Net Assets: 100.00% | | | | | | $ | 29,400,689 | |
Percentages are stated as a percent of net assets.
(a) Non-income producing security.
Investment Abbreviations:
ADR — American Depositary Receipt
GDR — Global Depositary Receipt
| | | | |
| See accompanying Notes to Financial Statements. | | 45 | | |
Schedule of Investments (See Note 11)
Salient International Dividend Signal Fund
December 31, 2017
| | | | | | | | |
| | | Shares | | | Value
(See Note 2) | |
| |
| Common Stocks: 95.84% | | | | | |
| Australia: 1.31% | | | | | | | | |
| | |
Sonic Healthcare, Ltd. | | | 56,821 | | | $ | 1,013,489 | |
| | | | | | | | |
| Brazil: 0.70% | | | | | | | | |
| | |
Cia de Saneamento do Parana(a) | | | 30,000 | | | | 541,241 | |
| | | | | | | | |
| Canada: 1.15% | | | | | | | | |
| | |
Shaw Communications, Inc., Class B | | | 38,800 | | | | 885,804 | |
| | | | | | | | |
| China: 5.49% | | | | | | | | |
| | |
China Gas Holdings, Ltd. | | | 308,000 | | | | 851,520 | |
| | |
China Machinery Engineering Corp., Class H | | | 1,096,400 | | | | 711,488 | |
| | |
Sinopharm Group Co., Ltd., Class H | | | 171,352 | | | | 741,304 | |
| | |
SITC International Holdings Co., Ltd. | | | 1,964,800 | | | | 1,941,450 | |
| | |
| | | | | | | 4,245,762 | |
| | | | | | | | |
| France: 10.12% | | | | | | | | |
| | |
AXA SA(b) | | | 38,028 | | | | 1,128,607 | |
| | |
Danone SA(b) | | | 17,880 | | | | 1,500,660 | |
| | |
LVMH Moet Hennessy Louis Vuitton SE(b) | | | 6,285 | | | | 1,850,577 | |
| | |
Orpea(b) | | | 6,224 | | | | 734,092 | |
| | |
Schneider Electric SE(b) | | | 16,100 | | | | 1,368,845 | |
| | |
Unibail-Rodamco SE | | | 4,931 | | | | 1,242,457 | |
| | |
| | | | | | | 7,825,238 | |
| | | | | | | | |
| Georgia: 1.19% | | | | | | | | |
| | |
BGEO Group Plc(b) | | | 19,100 | | | | 917,275 | |
| | | | | | | | |
| Germany: 2.71% | | | | | | | | |
| | |
RIB Software SE(b) | | | 70,398 | | | | 2,096,473 | |
| | | | | | | | |
| Hong Kong: 2.87% | | | | | | | | |
| | |
Guangdong Investment, Ltd. | | | 1,181,400 | | | | 1,581,682 | |
| | |
Sun Hung Kai Properties, Ltd. | | | 38,000 | | | | 634,237 | |
| | |
| | | | | | | 2,215,919 | |
| | | | | | | | |
| India: 1.64% | | | | | | | | |
| | |
Infosys, Ltd., Sponsored ADR(b) | | | 78,400 | | | | 1,271,648 | |
| | | | | | | | |
| Indonesia: 3.16% | | | | | | | | |
| | |
Astra Graphia Tbk PT | | | 4,587,907 | | | | 442,982 | |
| | |
Bank Mandiri Persero Tbk PT | | | 2,090,300 | | | | 1,232,534 | |
| | |
Kalbe Farma Tbk PT | | | 6,200,807 | | | | 772,387 | |
| | |
| | | | | | | 2,447,903 | |
| | | | | | | | |
| | | Shares | | | Value
(See Note 2) | |
| | |
| | | | | | | | |
| Japan: 11.03% | | | | | | | | |
| | |
Disco Corp. | | | 7,660 | | | $ | 1,704,337 | |
| | |
Kuraray Co., Ltd.(b) | | | 69,900 | | | | 1,318,903 | |
| | |
Santen Pharmaceutical Co., Ltd.(b) | | | 85,300 | | | | 1,340,726 | |
| | |
Tokio Marine Holdings, Inc. | | | 24,300 | | | | 1,108,731 | |
| | |
United Arrows, Ltd. | | | 32,021 | | | | 1,300,165 | |
| | |
Zenkoku Hosho Co., Ltd.(b) | | | 40,958 | | | | 1,761,185 | |
| | |
| | | | | | | 8,534,047 | |
| | | | | | | | |
| Malaysia: 2.15% | | | | | | | | |
| | |
Globetronics Technology BHD | | | 1,022,030 | | | | 1,666,765 | |
| | | | | | | | |
| Mexico: 0.64% | | | | | | | | |
| | |
PLA Administradora Industrial S de RL de CV | | | 327,757 | | | | 496,907 | |
| | | | | | | | |
| Netherlands: 5.45% | | | | | | | | |
| | |
IMCD Group NV(b) | | | 21,000 | | | | 1,321,072 | |
| | |
Koninklijke Ahold Delhaize NV | | | 64,484 | | | | 1,418,600 | |
| | |
Koninklijke Vopak NV | | | 33,602 | | | | 1,474,407 | |
| | |
| | | | | | | 4,214,079 | |
| | | | | | | | |
| Norway: 2.22% | | | | | | | | |
| | |
Marine Harvest ASA(b) | | | 101,420 | | | | 1,716,973 | |
| | | | | | | | |
| Philippines: 3.78% | | | | | | | | |
| | |
CEMEX Holdings Philippines, Inc.(a) | | | 4,843,000 | | | | 473,434 | |
| | |
D&L Industries, Inc. | | | 7,181,952 | | | | 1,591,194 | |
| | |
Globe Telecom, Inc. | | | 17,550 | | | | 667,969 | |
| | |
Xurpas, Inc. | | | 1,710,400 | | | | 190,844 | |
| | |
| | | | | | | 2,923,441 | |
| | | | | | | | |
| Russia: 2.28% | | | | | | | | |
| | |
LUKOIL PJSC, Sponsored ADR(b) | | | 30,594 | | | | 1,763,744 | |
| | | | | | | | |
| Singapore: 2.08% | | | | | | | | |
| | |
China Yuchai International, Ltd.(b) | | | 66,881 | | | | 1,605,144 | |
| | | | | | | | |
| Sri Lanka: 3.04% | | | | | | | | |
| | |
Commercial Bank of Ceylon Plc | | | 1,323,138 | | | | 905,078 | |
| | |
Hatton National Bank Plc | | | 606,438 | | | | 770,394 | |
| | |
Piramal Glass Ceylon Plc | | | 17,918,874 | | | | 677,065 | |
| | |
| | | | | | | 2,352,537 | |
| | | | |
| See accompanying Notes to Financial Statements. | | 46 | | |
Schedule of Investments (See Note 11)
Salient International Dividend Signal Fund
December 31, 2017
| | | | | | | | |
| | | Shares | | | Value
(See Note 2) | |
| | |
| | | | | | | | |
| Sweden: 1.89% | | | | | | | | |
| | |
Investor AB, Class B(b) | | | 31,984 | | | $ | 1,458,621 | |
| | | | | | | | |
| Switzerland: 7.61% | | | | | | | | |
| | |
Givaudan SA | | | 634 | | | | 1,465,204 | |
| | |
Partners Group Holding AG | | | 2,942 | | | | 2,016,785 | |
| | |
Roche Holding AG, Sponsored ADR(b) | | | 29,980 | | | | 946,768 | |
| | |
UBS Group AG | | | 79,076 | | | | 1,455,820 | |
| | |
| | | | | | | 5,884,577 | |
| | | | | | | | |
| Taiwan: 2.73% | | | | | | | | |
| | |
Taiwan Semiconductor Manufacturing Co., Ltd., Sponsored ADR(b) | | | 36,480 | | | | 1,446,432 | |
| | |
Wah Lee Industrial Corp. | | | 355,700 | | | | 666,971 | |
| | |
| | | | | | | 2,113,403 | |
| | | | | | | | |
| Thailand: 0.97% | | | | | | | | |
| | |
TTW PCL | | | 1,945,043 | | | | 751,996 | |
| | | | | | | | |
| Turkey: 1.47% | | | | | | | | |
| | |
TAV Havalimanlari Holding AS | | | 191,650 | | | | 1,135,591 | |
| | | | | | | | |
| United Kingdom: 12.25% | | | | | | | | |
| | |
Booker Group Plc(b) | | | 645,000 | | | | 1,994,240 | |
| | |
BT Group Plc | | | 219,500 | | | | 805,205 | |
| | |
Derwent London Plc | | | 32,889 | | | | 1,384,551 | |
| | |
GlaxoSmithKline Plc | | | 67,863 | | | | 1,211,744 | |
| | |
Inchcape Plc(b) | | | 124,100 | | | | 1,311,108 | |
| | |
Prudential Plc | | | 65,398 | | | | 1,682,503 | |
| | |
WPP Plc, Sponsored ADR(b) | | | 12,000 | | | | 1,086,720 | |
| | |
| | | | | | | 9,476,071 | |
| | | | | | | | |
| United States: 3.62% | | | | | | | | |
| | |
Samsonite International SA | | | 471,900 | | | | 2,168,378 | |
| | |
Schlumberger, Ltd. | | | 9,360 | | | | 630,770 | |
| | |
| | | | | | | 2,799,148 | |
| | | | | | | | |
| Vietnam: 2.29% | | | | | | | | |
| | |
PetroVietnam Nhon Trach 2 Power JSC | | | 605,410 | | | | 893,093 | |
| | |
Vietnam Dairy Products JSC | | | 95,460 | | | | 876,875 | |
| | |
| | | | | | | 1,769,968 | |
| | |
Total Common Stocks
(Cost $54,636,098) | | | | | | | 74,123,764 | |
| | | | | | | | |
| | | Shares | | | Value
(See Note 2) | |
| |
| Participation Notes: 3.20% | | | | | |
| Bangladesh: 0.73% | | | | | | | | |
| | |
Grameenphone, Ltd., (Participation Notes issued by Deutsche Bank AG, London), expiring 07/08/21 | | | 100,400 | | | $ | 568,300 | |
| | | | | | | | |
| India: 1.73% | | | | | | | | |
| | |
Coal India, Ltd., (Participation Notes issued by Macquarie Bank, Ltd.), expiring 01/31/19 | | | 325,000 | | | | 1,338,902 | |
| | | | | | | | |
| Pakistan: 0.74% | | | | | | | | |
| | |
Habib Bank, Ltd. (Participation Notes issued by Macquarie Bank, Ltd.), expiring 03/29/19 | | | 375,500 | | | | 568,575 | |
| | |
Total Participation Notes
(Cost $3,059,117) | | | | | | | 2,475,777 | |
| |
| Preferred Stocks: 3.42% | | | | | |
| Brazil: 1.37% | | | | | | | | |
| | |
Cia de Saneamento do Parana | | | 300,000 | | | | 1,060,866 | |
| | | | | | | | |
| Germany: 2.05% | | | | | | | | |
| | |
Sixt SE(b) | | | 24,979 | | | | 1,586,069 | |
| | |
Total Preferred Stocks
(Cost $1,696,586) | | | | | | | 2,646,935 | |
| | | | | | | | | | | | |
| | | |
| | | Currency | | | Principal
Amount | | | Value
(See Note 2) | |
| |
| Collateralized Mortgage Obligations: 1.37% | | | | | |
| United States: 1.37% | | | | | | | | | |
| | | |
FHLMC, REMICS | | | | | | | | | | | | |
| | | |
2.500%, 04/15/28(c) | | | USD | | | | 4,427,904 | | | | 351,291 | |
| | | |
3.000%, 06/15/26(c) | | | USD | | | | 1,178,961 | | | | 80,707 | |
| | | |
3.000%, 06/15/27(c) | | | USD | | | | 1,148,219 | | | | 101,152 | |
| | | |
3.000%, 09/15/31(c) | | | USD | | | | 865,940 | | | | 96,042 | |
| | | |
3.500%, 04/15/30(c) | | | USD | | | | 456,629 | | | | 24,312 | |
| | | |
4.000%, 12/15/23(c) | | | USD | | | | 86,247 | | | | 657 | |
| | | |
5.000%, 02/15/24(c) | | | USD | | | | 53,103 | | | | 1,764 | |
| | | |
1M US L + 7.20%, 09/15/26(c)(d) | | | USD | | | | 241,700 | | | | 32,980 | |
| | | |
FNMA, REMICS | | | | | | | | | | | | |
| | | |
3.000%, 09/25/27(c) | | | USD | | | | 173,291 | | | | 15,472 | |
| | | |
4.500%, 12/25/20(c) | | | USD | | | | 46,395 | | | | 1,093 | |
| | | |
5.000%, 03/25/23(c) | | | USD | | | | 2,827 | | | | 30 | |
| | | |
5.000%, 03/25/24(c) | | | USD | | | | 5,879 | | | | 199 | |
| | | | |
| See accompanying Notes to Financial Statements. | | 47 | | |
Schedule of Investments (See Note 11)
Salient International Dividend Signal Fund
December 31, 2017
| | | | | | | | | | | | |
| | | |
| | | Currency | | | Principal
Amount | | | Value
(See Note 2) | |
| | | |
| | | | | | | | | | | | |
| United States (continued): 1.37% | | | | | | | | | |
| | | |
1M US L + 6.48%, 04/25/42(c)(d) | | | USD | | | | 1,098,054 | | | $ | 183,355 | |
| | | |
1M US L + 6.68%, 07/25/41(c)(d) | | | USD | | | | 185,881 | | | | 32,789 | |
| | | |
1M US L + 7.80%, 04/25/32(c)(d) | | | USD | | | | 260,290 | | | | 43,807 | |
| | | |
GNMA, REMICS | | | | | | | | | | | | |
| | | |
1M US L + 6.60%, 09/16/33(c)(d) | | | USD | | | | 538,010 | | | | 94,076 | |
| | | |
| | | | | | | | | | | 1,059,726 | |
| |
Total Collateralized Mortgage Obligations
(Cost $2,841,293) | | | | 1,059,726 | |
| |
| Corporate Bonds: 1.82% | | | | | |
| United States: 1.82% | | | | | | | | | |
| | | |
Citigroup, Inc., Sr. Unsec. Medium-Term Notes 4*
(USISDA30-USISDA02-0.250%), 09/29/34(d) | | | USD | | | | 1,000,000 | | | | 670,540 | |
| | | |
Morgan Stanley, Sr. Unsec. Medium-Term Notes 5*
(USISDA30-USISDA02), 08/29/34(d) | | | USD | | | | 984,000 | | | | 738,000 | |
| | | |
| | | | | | | | | | | 1,408,540 | |
| | | |
Total Corporate Bonds
(Cost $1,933,223) | | | | | | | | | | | 1,408,540 | |
| |
| Government Bonds: 0.36% | | | | | |
| Egypt: 0.36% | | | | | | | | | |
| | | |
Egypt Treasury Bond 16.750%, 09/06/19 | | | EGP | | | | 5,000,000 | | | | 278,459 | |
| | | |
Total Government Bonds
(Cost $266,915) | | | | | | | | | | | 278,459 | |
| | | |
Total Investments: 106.01%
(Cost $64,433,232) | | | | | | | | | | | 81,993,201 | |
| |
| Net Other Assets and Liabilities: (6.01)% | | | | (4,648,581 | )(e) |
| | | |
| Net Assets: 100.00% | | | | | | | | | | $ | 77,344,620 | |
Percentages are stated as a percent of net assets.
Libor Rates:
1M US L — 1 Month LIBOR as of December 31, 2017 was 1.560%
USISDA02 — 2-Year ICE Swap Rate as of December 31, 2017 was 2.077%
USISDA30 — 30-Year ICE Swap Rate as of December 31, 2017 was 2.543%
(a) Non-income producing security.
(b) Security, or portion of security, is being held as collateral for the line(s) of credit. At period end, the aggregate market value of those securities was $28,913,149, representing 37.38% of net assets.
(c) Interest only security.
(d) Variable rate investment. Interest rates reset periodically. The reference rate and spread are indicated in the description above, along with the reference rate in effect at December 31, 2017.
(e) Includes cash which is being held as collateral for potential futures contracts.
Investment Abbreviations:
ADR — American Depositary Receipt
FHLMC — Federal Home Loan Mortgage Corporation
FNMA — Federal National Mortgage Association
GNMA — Government National Mortgage Association
LIBOR — London Interbank Offered Rate
REMICS — Real Estate Mortgage Investment Conduits
Sr. — Senior
Unsec. — Unsecured
Currency Abbreviations:
EGP — Egyptian Pound
USD — U.S. Dollar
| | | | |
| See accompanying Notes to Financial Statements. | | 48 | | |
Schedule of Investments (See Note 11)
Salient International Small Cap Fund
December 31, 2017
| | | | | | | | |
| | | Shares | | | Value
(See Note 2) | |
| |
| Common Stocks: 98.11% | | | | | |
| Australia: 5.73% | | | | | | | | |
| | |
carsales.com, Ltd. | | | 74,534 | | | $ | 842,668 | |
| | |
Domino’s Pizza Enterprises, Ltd. | | | 30,754 | | | | 1,120,605 | |
| | |
Link Administration Holdings, Ltd. | | | 357,461 | | | | 2,353,992 | |
| | |
OZ Minerals, Ltd. | | | 120,853 | | | | 863,748 | |
| | |
REA Group, Ltd. | | | 28,870 | | | | 1,726,605 | |
| | |
| | | | | | | 6,907,618 | |
| | | | | | | | |
| Belgium: 3.21% | | | | | | | | |
| | |
Bekaert SA | | | 12,648 | | | | 553,079 | |
| | |
D’Ieteren SA NV | | | 22,268 | | | | 1,002,870 | |
| | |
KBC Ancora | | | 21,540 | | | | 1,356,593 | |
| | |
Kinepolis Group NV | | | 14,272 | | | | 953,137 | |
| | |
| | | | | | | 3,865,679 | |
| | | | | | | | |
| Finland: 1.89% | | | | | | | | |
| | |
Huhtamaki Oyj | | | 22,443 | | | | 942,489 | |
| | |
Valmet Oyj | | | 67,380 | | | | 1,329,107 | |
| | |
| | | | | | | 2,271,596 | |
| | | | | | | | |
| France: 9.34% | | | | | | | | |
| | |
Cie Plastic Omnium SA | | | 34,530 | | | | 1,570,022 | |
| | |
Fnac Darty SA(a) | | | 13,928 | | | | 1,682,850 | |
| | |
Lectra | | | 27,438 | | | | 827,976 | |
| | |
Maisons du Monde SA | | | 32,815 | | | | 1,486,335 | |
| | |
SOITEC(a) | | | 9,503 | | | | 677,860 | |
| | |
Teleperformance | | | 13,811 | | | | 1,979,422 | |
| | |
Trigano SA | | | 10,166 | | | | 1,796,719 | |
| | |
Worldline SA(a) | | | 25,370 | | | | 1,238,003 | |
| | |
| | | | | | | 11,259,187 | |
| | | | | | | | |
| Germany: 6.11% | | | | | | | | |
| | |
AIXTRON SE(a) | | | 30,922 | | | | 429,639 | |
| | |
Aumann AG(a) | | | 4,202 | | | | 322,270 | |
| | |
Ceconomy AG | | | 87,642 | | | | 1,325,508 | |
| | |
Duerr AG | | | 7,697 | | | | 984,016 | |
| | |
HUGO BOSS AG | | | 8,950 | | | | 761,801 | |
| | |
Hypoport AG(a) | | | 2,400 | | | | 418,556 | |
| | |
Jenoptik AG | | | 29,335 | | | | 969,518 | |
| | | | | | | | |
| | | Shares | | | Value
(See Note 2) | |
| | |
| | | | | | | | |
| | | |
LEG Immobilien AG | | | 9,974 | | | $ | 1,140,365 | |
| | |
Scout24 AG | | | 24,815 | | | | 1,013,815 | |
| | |
| | | | | | | 7,365,488 | |
| | | | | | | | |
| Hong Kong: 1.96% | | | | | | | | |
| | |
HKBN, Ltd. | | | 859,500 | | | | 1,086,909 | |
| | |
Samsonite International SA | | | 276,900 | | | | 1,272,354 | |
| | |
| | | | | | | 2,359,263 | |
| | | | | | | | |
| Ireland: 2.53% | | | | | | | | |
| | |
Dalata Hotel Group Plc(a) | | | 253,155 | | | | 1,915,133 | |
| | |
Smurfit Kappa Group Plc | | | 33,532 | | | | 1,134,179 | |
| | |
| | | | | | | 3,049,312 | |
| | | | | | | | |
| Italy: 4.63% | | | | | | | | |
| | |
Brembo SpA | | | 55,668 | | | | 846,271 | |
| | |
Cerved Information Solutions SpA | | | 69,263 | | | | 880,916 | |
| | |
Credito Emiliano SpA | | | 149,938 | | | | 1,272,815 | |
| | |
Datalogic SpA | | | 47,361 | | | | 1,751,381 | |
| | |
Fila SpA | | | 34,846 | | | | 822,821 | |
| | |
| | | | | | | 5,574,204 | |
| | | | | | | | |
| Japan: 32.12% | | | | | | | | |
| | |
77 Bank, Ltd. | | | 53,500 | | | | 1,351,329 | |
| | |
Aeon Delight Co., Ltd. | | | 28,900 | | | | 1,082,387 | |
| | |
Alps Electric Co., Ltd. | | | 53,800 | | | | 1,537,484 | |
| | |
Anicom Holdings, Inc. | | | 30,800 | | | | 993,637 | |
| | |
Bank of Kyoto, Ltd. | | | 15,800 | | | | 823,128 | |
| | |
cocokara fine, Inc. | | | 15,200 | | | | 982,081 | |
| | |
D.A. Consortium Holdings, Inc. | | | 55,000 | | | | 1,087,553 | |
| | |
DeNA Co., Ltd. | | | 35,100 | | | | 723,650 | |
| | |
Dip Corp. | | | 44,400 | | | | 1,147,484 | |
| | |
Don Quijote Holdings Co., Ltd. | | | 41,200 | | | | 2,153,699 | |
| | |
Dowa Holdings Co., Ltd. | | | 37,100 | | | | 1,514,622 | |
| | |
Glory, Ltd. | | | 36,900 | | | | 1,393,472 | |
| | |
Hoshizaki Corp. | | | 10,707 | | | | 949,305 | |
| | |
Investors Cloud Co., Ltd. | | | 62,000 | | | | 921,127 | |
| | |
Japan Hotel REIT Investment Corp. | | | 1,602 | | | | 1,074,872 | |
| | | | |
| See accompanying Notes to Financial Statements. | | 49 | | |
Schedule of Investments (See Note 11)
Salient International Small Cap Fund
December 31, 2017
| | | | | | | | |
| | | Shares | | | Value
(See Note 2) | |
| | |
| | | | | | | | |
| Japan (continued): 32.12% | | | | | | | | |
| | |
JTEKT Corp. | | | 62,400 | | | $ | 1,072,167 | |
| | |
Kanamoto Co., Ltd. | | | 39,600 | | | | 1,228,329 | |
| | |
Kenedix Retail REIT Corp. | | | 450 | | | | 930,552 | |
| | |
Kinden Corp. | | | 127,600 | | | | 2,081,463 | |
| | |
Maxell Holdings, Ltd. | | | 42,000 | | | | 897,218 | |
| | |
MINEBEA MITSUMI, Inc. | | | 51,500 | | | | 1,080,049 | |
| | |
Nabtesco Corp. | | | 23,900 | | | | 916,335 | |
| | |
Otsuka Corp. | | | 21,200 | | | | 1,625,631 | |
| | |
Persol Holdings Co., Ltd. | | | 74,800 | | | | 1,874,730 | |
| | |
Pola Orbis Holdings, Inc. | | | 27,700 | | | | 972,296 | |
| | |
SBI Holdings, Inc. | | | 34,200 | | | | 715,112 | |
| | |
Sodick Co., Ltd. | | | 70,100 | | | | 912,062 | |
| | |
Sumco Corp. | | | 44,300 | | | | 1,135,464 | |
| | |
Sundrug Co., Ltd. | | | 30,400 | | | | 1,413,765 | |
| | |
Tokuyama Corp. | | | 18,600 | | | | 605,831 | |
| | |
Tokyo Steel Manufacturing Co., Ltd. | | | 90,200 | | | | 810,139 | |
| | |
Tokyo Tatemono Co., Ltd. | | | 75,100 | | | | 1,014,442 | |
| | |
Toshiba Plant Systems & Services Corp. | | | 58,500 | | | | 1,091,342 | |
| | |
YAMADA Consulting Group Co., Ltd. | | | 24,600 | | | | 595,160 | |
| | |
| | | | | | | 38,707,917 | |
| | | | | | | | |
| Netherlands: 3.09% | | | | | | | | |
| | |
BE Semiconductor Industries NV | | | 13,566 | | | | 1,137,938 | |
| | |
Gemalto NV | | | 16,605 | | | | 986,214 | |
| | |
TKH Group NV | | | 25,214 | | | | 1,601,293 | |
| | |
| | | | | | | 3,725,445 | |
| | | | | | | | |
| Singapore: 0.92% | | | | | | | | |
| | |
Keppel DC REIT | | | 1,040,707 | | | | 1,112,723 | |
| | | | | | | | |
| Spain: 0.98% | | | | | | | | |
| | |
NH Hotel Group SA | | | 164,454 | | | | 1,183,921 | |
| | | | | | | | |
| Sweden: 4.30% | | | | | | | | |
| | |
Concentric AB | | | 55,687 | | | | 1,025,068 | |
| | |
Coor Service Management Holding AB | | | 146,990 | | | | 1,119,927 | |
| | |
Hemfosa Fastigheter AB | | | 82,585 | | | | 1,106,422 | |
| | | | | | | | |
| | | Shares | | | Value
(See Note 2) | |
| | |
| | | | | | | | |
| | | |
Husqvarna AB | | | 127,740 | | | $ | 1,216,186 | |
| | |
Tele2 AB, Class B(a) | | | 58,003 | | | | 712,743 | |
| | |
| | | | | | | 5,180,346 | |
| | | | | | | | |
| Switzerland: 6.03% | | | | | | | | |
| | |
BKW AG | | | 20,800 | | | | 1,236,964 | |
| | |
Bobst Group SA | | | 8,076 | | | | 1,074,093 | |
| | |
Clariant AG | | | 49,539 | | | | 1,385,333 | |
| | |
Helvetia Holding AG | | | 1,941 | | | | 1,092,553 | |
| | |
Komax Holding AG | | | 3,214 | | | | 1,053,798 | |
| | |
Sunrise Communications Group AG | | | 15,559 | | | | 1,421,059 | |
| | |
| | | | | | | 7,263,800 | |
| | | | | | | | |
| United Kingdom: 15.27% | | | | | | | | |
| | |
Arrow Global Group Plc | | | 248,148 | | | | 1,329,260 | |
| | |
BBA Aviation Plc | | | 291,562 | | | | 1,376,603 | |
| | |
Card Factory Plc | | | 275,683 | | | | 1,098,402 | |
| | |
Coats Group Plc | | | 1,206,170 | | | | 1,451,818 | |
| | |
Essentra Plc | | | 125,667 | | | | 898,400 | |
| | |
IG Group Holdings Plc | | | 80,649 | | | | 781,274 | |
| | |
Informa Plc | | | 153,666 | | | | 1,497,950 | |
| | |
Jardine Lloyd Thompson Group Plc | | | 79,579 | | | | 1,494,541 | |
| | |
Melrose Industries Plc | | | 481,050 | | | | 1,378,218 | |
| | |
Moneysupermarket.com Group Plc | | | 259,006 | | | | 1,245,621 | |
| | |
On the Beach Group Plc | | | 196,658 | | | | 1,247,934 | |
| | |
Polypipe Group Plc | | | 249,029 | | | | 1,322,044 | |
| | |
Secure Trust Bank Plc | | | 33,913 | | | | 822,804 | |
| | |
Spirax-Sarco Engineering Plc | | | 15,371 | | | | 1,166,328 | |
| | |
Synthomer Plc | | | 125,768 | | | | 834,426 | |
| | |
Vedanta Resources Plc | | | 42,143 | | | | 457,756 | |
| | |
| | | | | | | 18,403,379 | |
| | |
Total Common Stocks
(Cost $82,827,227) | | | | | | | 118,229,878 | |
| | |
Total Investments: 98.11%
(Cost $82,827,227) | | | | | | | 118,229,878 | |
| | |
| Net Other Assets and Liabilities: 1.89% | | | | | | | 2,279,812 | |
| | |
| Net Assets: 100.00% | | | | | | $ | 120,509,690 | |
| | | | |
| See accompanying Notes to Financial Statements. | | 50 | | |
Schedule of Investments (See Note 11)
Salient International Small Cap Fund
December 31, 2017
Percentages are stated as a percent of net assets.
(a) Non-income producing security.
Investment Abbreviations:
REIT — Real Estate Investment Trust
| | | | |
| See accompanying Notes to Financial Statements. | | 51 | | |
Schedule of Investments (See Note 11)
Salient Tactical Growth Fund
December 31, 2017
| | | | | | | | |
| | | Shares | | | Value
(See Note 2) | |
| |
| Exchange-Traded Funds: 77.83% | | | | | |
| | | |
iShares® MSCI EAFE ETF | | | 282,963 | | | $ | 19,895,129 | |
| | |
iShares® MSCI Emerging Markets ETF | | | 427,753 | | | | 20,155,721 | |
| | |
iShares® Russell 2000® ETF | | | 270,441 | | | | 41,231,435 | |
| | |
PowerShares® QQQ Trust, Series 1 | | | 261,175 | | | | 40,680,618 | |
| | |
SPDR® Dow Jones Industrial Average ETF Trust | | | 175,439 | | | | 43,400,100 | |
| | |
SPDR® S&P 500® ETF Trust(a) | | | 462,357 | | | | 123,384,589 | |
| | |
VanEck Vectors Gold Miners ETF | | | 858,076 | | | | 19,941,686 | |
| | |
Total Exchange-Traded Funds
(Cost $278,217,877) | | | | | | | 308,689,278 | |
| | |
Total Investments: 77.83%
(Cost $278,217,877) | | | | | | | 308,689,278 | |
| | |
| Net Other Assets and Liabilities: 22.17% | | | | | | | 87,947,386 | |
| | |
| Net Assets: 100.00% | | | | | | $ | 396,636,664 | |
Percentages are stated as a percent of net assets.
(a) The SPDR® S&P 500® ETF Trust Annual Report, along with the report of the independent registered public accounting firm, is included in the Security’s Form N-CSR available at “www.sec.gov”. As of December 31, 2017, the percentage of the Fund’s net assets invested in the SPDR® S&P 500® ETF Trust was 31.11%.
Investment Abbreviations:
ETF — Exchange-Traded Fund
EAFE — Europe, Australasia and Far East
MSCI — Morgan Stanley Capital International
S&P — Standard & Poor’s
SPDR — Standard & Poor’s Depository Receipts
| | | | |
| See accompanying Notes to Financial Statements. | | 52 | | |
Schedule of Investments (See Note 11)
Salient Tactical Muni & Credit Fund
December 31, 2017
| | | | | | | | |
| | | Principal
Amount | | | Value
(See Note 2) | |
| |
| Corporate Bonds: 2.36% | | | | | |
| Consumer Non-cyclical: 2.03% | | | | | | | | |
| | |
Hackensack Meridian Health, Inc., Sr. Unsec. Notes
4.500%, 07/01/57 | | | $1,500,000 | | | $ | 1,677,603 | |
| | | | | | | | |
| Financials: 0.33% | | | | | | | | |
| | |
Illinois Receivables Trust II, Sec. Notes 8.250%, 07/01/18(a)(b)(c) | | | 264,528 | | | | 266,922 | |
| | |
Total Corporate Bonds
(Cost $1,859,856) | | | | | | | 1,944,525 | |
| |
| Municipal Bonds: 89.64% | | | | | |
| Alabama: 3.10% | | | | | | | | |
| | |
County of Jefferson, Alabama Sewer Convertible Revenue Warrants (Capital Appreciation), Sub-Lien,
Series F 0.000%, 10/01/50(d) | | | 1,500,000 | | | | 1,255,215 | |
| | |
The Lower Alabama Gas District Revenue Bonds,
Series A 5.000%, 09/01/46 | | | 1,000,000 | | | | 1,306,840 | |
| | |
| | | | | | | 2,562,055 | |
| | | | | | | | |
| Arizona: 1.13% | | | | | | | | |
| | |
Salt Verde, Arizona, Financial Corp., Senior Gas Revenue Bonds
5.000%, 12/01/37 | | | 745,000 | | | | 933,753 | |
| | | | | | | | |
| California: 8.08% | | | | | | | | |
| | |
California State Health Facilities Financing Authority Revenue Bonds,
Series B 5.000%, 11/15/46 | | | 1,500,000 | | | | 1,765,200 | |
| | |
California State School Financing Authority Revenue Bonds (Launchpad Development Co.),
Series A 5.000%, 06/01/46(b) | | | 500,000 | | | | 520,705 | |
| | |
California Statewide Communities Development Authority Revenue Bonds (Front Porch Communities & Services),
Series A 5.000%, 04/01/29 | | | 170,000 | | | | 203,947 | |
| | |
M-S-R Energy Authority Revenue Bonds,
Series B 6.500%, 11/01/39 | | | 1,000,000 | | | | 1,468,940 | |
| | |
Stockton Public Financing Authority Revenue Bonds (Delta Water Supply Project),
Series A 6.250%, 10/01/40 | | | 2,250,000 | | | | 2,712,150 | |
| | |
| | | | | | | 6,670,942 | |
| | | | | | | | |
| | | Principal
Amount | | | Value
(See Note 2) | |
| |
| | | | | |
| Colorado: 1.17% | | | | | | | | |
| | |
City & County of Denver, Colorado Airport System Revenue Bonds (Denver International Airport),
Series B 1M US L * 0.7 + 0.860%, 11/15/31(e) | | | $965,000 | | | $ | 968,030 | |
| | | | | | | | |
| Florida: 1.90% | | | | | | | | |
| | |
Florida Development Finance Corp. Surface Transportation Facility Revenue Bonds (Brightline Passenger Rail Project)
5.625%, 01/01/47(b) | | | 1,500,000 | | | | 1,564,590 | |
| | | | | | | | |
| Georgia: 1.97% | | | | | | | | |
| | |
Atlanta, Georgia Development Authority Senior Health Georgia Proton Treatment Center Revenue Bonds,
Series A1 6.750%, 01/01/35 | | | 500,000 | | | | 519,125 | |
| | |
Savannah College of Art & Design Projects Revenue Bonds (Private Colleges & Universities Authority)
5.000%, 04/01/33 | | | 1,000,000 | | | | 1,107,670 | |
| | |
| | | | | | | 1,626,795 | |
| | | | | | | | |
| Illinois: 12.55% | | | | | | | | |
| | |
City of Chicago, Illinois Board of Education Refunding Dedicated General Obligation Bonds,
Series G 5.000%, 12/01/34 | | | 1,000,000 | | | | 1,033,930 | |
| | |
City of Chicago, Illinois General Obligation Bonds,
Series 2002B 5.500%, 01/01/34 | | | 1,500,000 | | | | 1,634,190 | |
| | |
City of Chicago, Illinois General Obligation Bonds,
Series A 6.000%, 01/01/38 | | | 1,000,000 | | | | 1,158,030 | |
| | |
State of Illinois Finance Authority Revenue Bonds (Better Housing Foundation Icarus Portfolio Project),
Series A 5.000%, 12/01/37 | | | 500,000 | | | | 538,020 | |
| | |
State of Illinois Finance Authority Revenue Bonds (Presence Health Network),
Series C 4.000%, 02/15/36 | | | 1,000,000 | | | | 1,046,670 | |
| | |
5.000%, 02/15/29 | | | 1,500,000 | | | | 1,741,575 | |
| | | | |
| See accompanying Notes to Financial Statements. | | 53 | | |
Schedule of Investments (See Note 11)
Salient Tactical Muni & Credit Fund
December 31, 2017
| | | | | | | | |
| | | Principal
Amount | | | Value
(See Note 2) | |
| |
| | | | | |
| Illinois (continued): 12.55% | | | | | | | | |
| | |
State of Illinois General Obligation Bonds, Series A 5.000%, 04/01/35 | | | $1,000,000 | | | $ | 1,046,350 | |
| | |
5.000%, 12/01/38 | | | 1,000,000 | | | | 1,071,820 | |
| | |
State of Illinois General Obligation Bonds, Series D 5.000%, 11/01/24 | | | 1,000,000 | | | | 1,086,550 | |
| | |
| | | | | | | 10,357,135 | |
| | | | | | | | |
| Iowa: 4.51% | | | | | | | | |
| | |
Iowa Tobacco Settlement Authority, Asset-Backed Revenue Bonds,
Series A 6.500%, 06/01/23 | | | 3,660,000 | | | | 3,721,012 | |
| | | | | | | | |
| Kentucky: 2.76% | | | | | | | | |
| | |
Kentucky Economic Development Finance Authority Hospital Revenue Bonds
5.000%, 08/15/31 | | | 1,000,000 | | | | 1,151,530 | |
| | |
5.000%, 08/15/46 | | | 1,000,000 | | | | 1,122,420 | |
| | |
| | | | | | | 2,273,950 | |
| | | | | | | | |
| Louisiana: 0.99% | | | | | | | | |
| | |
Louisiana Public Facilities Authority Revenue Bonds (Provident Group-Flagship Properties)
5.000%, 07/01/57 | | | 725,000 | | | | 820,338 | |
| | | | | | | | |
| Maine: 1.44% | | | | | | | | |
| | |
Maine Health & Higher Educational Facilities Authority Revenue Bonds,
Series A 5.000%, 07/01/46 | | | 1,100,000 | | | | 1,184,304 | |
| | | | | | | | |
| Maryland: 0.60% | | | | | | | | |
| | |
State of Maryland Economic Development Corp., Revenue Bonds (CNX Marine Terminals, Inc.)
5.750%, 09/01/25 | | | 470,000 | | | | 496,254 | |
| | | | | | | | |
| Massachusetts: 1.38% | | | | | | | | |
| | |
Massachusetts Development Finance Agency Revenue Bonds (Emerson College),
Series A 5.000%, 01/01/47 | | | 1,000,000 | | | | 1,142,240 | |
| | | | | | | | |
| Michigan: 1.27% | | | | | | | | |
| | |
State of Michigan Finance Authority Revenue Bonds,
Series F1 4.500%, 10/01/29 | | | 1,000,000 | | | | 1,045,490 | |
| | | | | | | | |
| | | Principal
Amount | | | Value
(See Note 2) | |
| |
| | | | | |
| Nebraska: 1.56% | | | | | | | | |
| | |
Central Plains, Nebraska Energy Project Refunding Revenue Bonds (Project No.3),
Series A 5.000%, 09/01/42 | | | $1,000,000 | | | $ | 1,289,270 | |
| | | | | | | | |
| New Jersey: 8.14% | | | | | | | | |
| | |
Atlantic City New Jersey Refunding Tax Appeal General Obligation Bonds,
Series B 4.000%, 03/01/42 | | | 250,000 | | | | 262,318 | |
| | |
New Jersey Economic Development Authority Revenue Bonds,
Series D-1 0.000%, 02/15/22(f) | | | 1,000,000 | | | | 879,220 | |
| | |
New Jersey Economic Development Authority Revenue Bonds,
Series DDD 5.000%, 06/15/34 | | | 500,000 | | | | 552,270 | |
| | |
New Jersey Tobacco Settlement Financing Corp., Revenue Bonds,
Series 1A 4.625%, 06/01/26 | | | 4,000,000 | | | | 4,012,840 | |
| | |
New Jersey Turnpike Authority Revenue Bonds,
Series B 1M US L * 0.7 +
0.700%, 01/01/24(e) | | | 1,000,000 | | | | 1,006,190 | |
| | |
| | | | | | | 6,712,838 | |
| | | | | | | | |
| New York: 4.19% | | | | | | | | |
| | |
County of Nassau, New York Refunding General Obligation Bonds,
Series C 5.000%, 10/01/27 | | | 1,500,000 | | | | 1,823,925 | |
| | |
New York Liberty Development Corp., Refunding Revenue Bonds (World Trade Center Project), Class 1-3
5.000%, 11/15/44(b) | | | 1,500,000 | | | | 1,634,310 | |
| | |
| | | | | | | 3,458,235 | |
| | | | | | | | |
| Ohio: 10.89% | | | | | | | | |
| | |
Buckeye, Ohio Tobacco Settlement Financing Authority Revenue Bonds (Asset-Backed Sr. Turbo),
Series A-2 5.125%, 06/01/24 | | | 5,000,000 | | | | 4,770,200 | |
| | |
6.500%, 06/01/47 | | | 2,790,000 | | | | 2,790,056 | |
| | |
County of Franklin, Ohio Revenue Bonds (Trinity Health Credit Group),
Series A 5.000%, 12/01/47 | | | 1,000,000 | | | | 1,163,820 | |
| | | | |
| See accompanying Notes to Financial Statements. | | 54 | | |
Schedule of Investments (See Note 11)
Salient Tactical Muni & Credit Fund
December 31, 2017
| | | | | | | | |
| | | Principal
Amount | | | Value
(See Note 2) | |
| | |
| | | | | | | | |
| Ohio (continued): 10.89% | | | | | | | | |
| | |
State of Ohio Pollution Control Revenue Bonds (Ohio Water Development Authority),
Series C 4.000%, 06/01/33 | | | $600,000 | | | $ | 265,476 | |
| | |
| | | | | | | 8,989,552 | |
| | | | | | | | |
| Oregon: 0.60% | | | | | | | | |
| | |
County of Clackamas, Oregon Hospital Facility Authority Revenue Bonds (Senior Living Willamette View Project),
Series B 3.000%, 11/15/22 | | | 500,000 | | | | 498,640 | |
| | | | | | | | |
| Pennsylvania: 2.02% | | | | | | | | |
| | |
Allentown Neighborhood Improvement Zone Development Authority Tax Revenue Bonds
5.000%, 05/01/27(b) | | | 1,000,000 | | | | 1,146,730 | |
| | |
Blythe Township, Pennsylvania Solid Waste Authority Revenue Bonds
7.750%, 12/01/37 | | | 500,000 | | | | 516,340 | |
| | |
| | | | | | | 1,663,070 | |
| | | | | | | | |
| Puerto Rico: 1.31% | | | | | | | | |
| | |
Puerto Rico Electric Power Authority Revenue Refunding Bonds,
Series UU 3M US L * 0.67 +
0.520%, 07/01/29(e) | | | 625,000 | | | | 522,656 | |
| | |
Puerto Rico Highway & Transportation Authority Revenue Bonds,
Series L 5.250%, 07/01/41 | | | 500,000 | | | | 554,335 | |
| | |
| | | | | | | 1,076,991 | |
| | | | | | | | |
| Rhode Island: 1.31% | | | | | | | | |
| | |
Rhode Island Tobacco Settlement Financing Corp., Revenue Bonds,
Series A 5.000%, 06/01/40 | | | 1,000,000 | | | | 1,078,180 | |
| | | | | | | | |
| Texas: 11.42% | | | | | | | | |
| | |
City of Irving, Texas Hospital Authority Revenue Bonds (Baylor Scott & White Medical Center),
Series B MUNIPSA * 1 +
1.100%, 10/15/44(e) | | | 1,000,000 | | | | 999,990 | |
| | | | | | | | |
| | | Principal
Amount | | | Value
(See Note 2) | |
| | |
| | | | | | | | |
| | | |
New Hope Cultural Education Facilities Finance Corp. Revenue Bonds (Longhorn Village Project)
5.000%, 01/01/30 | | | $630,000 | | | $ | 684,199 | |
| | |
North Texas Tollway Authority Revenue Bonds,
Series B 5.000%, 01/01/45 | | | 1,000,000 | | | | 1,141,600 | |
| | |
Port Beaumont Navigation District Dock & Wharf Facilities Revenue Bonds (Jefferson Energy Co.)
7.250%, 02/01/36(b) | | | 3,000,000 | | | | 3,075,390 | |
| | |
State of Texas, General Obligation Bonds 5.500%, 08/01/30 | | | 2,000,000 | | | | 2,474,540 | |
| | |
Texas State Public Finance Authority, Taxable Revenue Bonds (Texas Windstorm Insurance Association)
8.250%, 07/01/24 | | | 1,000,000 | | | | 1,043,560 | |
| | |
| | | | | | | 9,419,279 | |
| | | | | | | | |
| Virgin Islands: 0.19% | | | | | | | | |
| | |
Virgin Islands Public Finance Authority Revenue Refunding Bonds (Matching Fund Loan), Sr. Lien,
Series B 5.000%, 10/01/24 | | | 250,000 | | | | 156,875 | |
| | | | | | | | |
| Virginia: 1.36% | | | | | | | | |
| | |
Virginia Small Business Financing Authority Revenue Bonds (Transform 66 P3 Project), Sr. Lien
5.000%, 12/31/56 | | | 1,000,000 | | | | 1,120,250 | |
| | | | | | | | |
| Washington: 2.76% | | | | | | | | |
| | |
Port of Seattle, Washington Revenue Bonds, Series A 5.000%, 04/01/40 | | | 1,000,000 | | | | 1,154,240 | |
| | |
Washington State Health Care Facilities Authority Revenue Bonds (Fred Hutchinson Cancer Research Center), Series A 5.000%, 01/01/47 | | | 1,000,000 | | | | 1,124,880 | |
| | |
| | | | | | | 2,279,120 | |
| | | | |
| See accompanying Notes to Financial Statements. | | 55 | | |
Schedule of Investments (See Note 11)
Salient Tactical Muni & Credit Fund
December 31, 2017
| | | | | | | | |
| | | Principal
Amount | | | Value
(See Note 2) | |
| | |
| | | | | | | | |
| West Virginia: 1.04% | | | | | | | | |
| | |
West Virginia Economic Development Authority Refunding Revenue Bonds (Morgantown Energy Assistance Project) 2.875%, 12/15/26 | | | $865,000 | | | $ | 855,675 | |
| | |
Total Municipal Bonds
(Cost $69,822,750) | | | | | | | 73,964,863 | |
| | |
| | | Par Value | | | | |
| |
| Short-Term Securities: 5.32% | | | | | |
| | | |
FHLB, Discount Notes
1.260%, 02/07/18(g) | | | 200,000 | | | | 199,739 | |
| | |
1.290%, 02/23/18(g) | | | 1,300,000 | | | | 1,297,567 | |
| | |
1.295%, 03/12/18(g) | | | 2,900,000 | | | | 2,892,553 | |
| | |
Total Short-Term Securities
(Cost $4,389,970) | | | | | | | 4,389,859 | |
| | |
Total Investments: 97.32%
(Cost $76,072,576) | | | | | | | 80,299,247 | |
| | |
| Net Other Assets and Liabilities: 2.68% | | | | | | | 2,212,446 | (h) |
| | |
| Net Assets: 100.00% | | | | | | $ | 82,511,693 | |
Percentages are stated as a percent of net assets.
Libor Rates:
1M US L — 1 Month LIBOR as of December 31, 2017 was 1.564%
3M US L — 3 Month LIBOR as of December 31, 2017 was 1.694%
MUNIPSA — SIFMA Municipal Swap Index Yield as of December 31, 2017 was 1.710%
(a) Security determined to be illiquid under the procedures approved by the Fund’s Board of Trustees.
(b) Securities exempt from registration under Rule 144A of the Securities Act of 1933. These securities may be sold in the ordinary course of business in transactions exempt from registration, normally to qualified institutional buyers. These securities have been deemed liquid under guidelines approved by the Fund’s Board of Trustees, unless otherwise noted below. At period end, the aggregate value of those securities was $8,208,647, representing 9.95% of net assets.
(c) Fair valued using significant unobservable inputs as determined in good faith in accordance with procedures established by the Board of Trustees. Total aggregate fair value of securities is $266,922, or 0.32% of the Fund’s net assets.
(d) Represents a step-up bond. Rate disclosed is as of December 31, 2017.
(e) Variable rate investment. Interest rates reset periodically. The reference rate and spread are indicated in the description above, along with the reference rate in effect at December 31, 2017.
(f) Represents a zero coupon bond.
(g) Rate shown represents the bond equivalent yield to maturity at date of purchase.
(h) Includes cash which is being held as collateral for futures contracts.
Futures Contracts Sold
| | | | | | | | | | | | | | | | |
| Description | | Contracts | | | Expiration
Date | | | Notional
Value | | | Value and
Unrealized
Appreciation/
(Depreciation) | |
10-Year U.S. Treasury Notes Futures | | | 96 | | | | March 2018 | | | $ | 11,908,500 | | | $ | 25,370 | |
U.S. Treasury Long Bond Futures | | | 25 | | | | March 2018 | | | | 3,825,000 | | | | 16,740 | |
| Total Futures Contracts | | | | | | | | | | $ | 15,733,500 | | | $ | 42,110 | |
Securities determined to be illiquid under the procedures approved by the Fund’s Board of Trustees are as follows:
| | | | | | | | | | | | | | |
| Date(s) of Purchase | | Security | | Cost | | | Value | | | % of Net
Assets | |
| 4/26/2017 | | Illinois Receivables Trust II, Sec. Notes
8.250%, 07/01/18(a)(b)(c) | | $ | 264,528 | | | $ | 266,922 | | | | 0.32% | |
| | | | $ | 264,528 | | | $ | 266,922 | | | | 0.32% | |
| | | | |
| See accompanying Notes to Financial Statements. | | 56 | | |
Schedule of Investments (See Note 11)
Salient Tactical Muni & Credit Fund
December 31, 2017
Investment Abbreviations:
FHLB — Federal Home Loan Bank
LIBOR — London Interbank Offered Rate
Sec. — Secured
Sr. — Senior
Unsec. — Unsecured
| | | | |
| See accompanying Notes to Financial Statements. | | 57 | | |
Schedule of Investments (See Note 11)
Salient US Dividend Signal Fund
December 31, 2017
| | | | | | | | |
| | | Shares | | | Value
(See Note 2) | |
| |
| Common Stocks: 94.38% | | | | | |
| Consumer Discretionary: 14.44% | | | | | | | | |
| | |
Comcast Corp., Class A | | | 5,200 | | | $ | 208,260 | |
| | |
Home Depot, Inc. | | | 1,400 | | | | 265,342 | |
| | |
Interpublic Group of Companies, Inc. | | | 7,200 | | | | 145,152 | |
| | |
McDonald’s Corp. | | | 600 | | | | 103,272 | |
| | |
Pool Corp. | | | 1,000 | | | | 129,650 | |
| | |
Starbucks Corp. | | | 900 | | | | 51,687 | |
| | |
Walt Disney Co. | | | 1,000 | | | | 107,510 | |
| | |
| | | | | | | 1,010,873 | |
| | | | | | | | |
| Consumer Staples: 6.79% | | | | | | | | |
| | |
Costco Wholesale Corp. | | | 500 | | | | 93,060 | |
| | |
Nestle SA, Sponsored ADR | | | 1,200 | | | | 103,164 | |
| | |
Procter & Gamble Co. | | | 1,100 | | | | 101,068 | |
| | |
Wal-Mart Stores, Inc. | | | 1,800 | | | | 177,750 | |
| | |
| | | | | | | 475,042 | |
| | | | | | | | |
| Energy: 3.58% | | | | | | | | |
| | |
Chevron Corp. | | | 300 | | | | 37,557 | |
| | |
Schlumberger, Ltd. | | | 600 | | | | 40,434 | |
| | |
Suncor Energy, Inc. | | | 4,700 | | | | 172,584 | |
| | |
| | | | | | | 250,575 | |
| | | | | | | | |
| Financials: 17.59% | | | | | | | | |
| | |
BlackRock, Inc. | | | 500 | | | | 256,855 | |
| | |
CenterState Banks, Corp. | | | 4,500 | | | | 115,785 | |
| | |
CME Group, Inc., Class A | | | 600 | | | | 87,630 | |
| | |
First American Financial Corp., Class A | | | 1,000 | | | | 56,040 | |
| | |
JPMorgan Chase & Co. | | | 2,000 | | | | 213,880 | |
| | |
Prologis, Inc. | | | 900 | | | | 58,059 | |
| | |
Sterling Bancorp | | | 6,400 | | | | 157,440 | |
| | |
U.S. Bancorp | | | 3,800 | | | | 203,604 | |
| | |
Virtu Financial, Inc., Class A | | | 4,500 | | | | 82,350 | |
| | |
| | | | | | | 1,231,643 | |
| | | | | | | | |
| Healthcare: 15.14% | | | | | | | | |
| | |
Amgen, Inc. | | | 1,400 | | | | 243,460 | |
| | |
Becton Dickinson and Co. | | | 900 | | | | 192,654 | |
| | | | | | | | |
| | | Shares | | | Value
(See Note 2) | |
| | |
| | | | | | | | |
| | | |
Cardinal Health, Inc. | | | 1,500 | | | $ | 91,905 | |
| | |
Cooper Companies, Inc. | | | 500 | | | | 108,940 | |
| | |
Johnson & Johnson | | | 1,900 | | | | 265,468 | |
| | |
Roche Holding AG, Sponsored ADR | | | 5,000 | | | | 157,900 | |
| | |
| | | | | | | 1,060,327 | |
| | | | | | | | |
| Industrials: 12.22% | | | | | | | | |
| | |
Acuity Brands, Inc. | | | 400 | | | | 70,400 | |
| | |
Eaton Corp. Plc | | | 800 | | | | 63,208 | |
| | |
General Dynamics Corp. | | | 900 | | | | 183,105 | |
| | |
John Bean Technologies Corp. | | | 1,050 | | | | 116,340 | |
| | |
Owens Corning | | | 2,100 | | | | 193,074 | |
| | |
United Technologies Corp. | | | 1,800 | | | | 229,626 | |
| | |
| | | | | | | 855,753 | |
| | | | | | | | |
| Information Technology: 20.31% | | | | | | | | |
| | |
Accenture Plc, Class A | | | 1,000 | | | | 153,090 | |
| | |
Apple, Inc. | | | 1,033 | | | | 174,814 | |
| | |
Broadridge Financial Solutions, Inc. | | | 1,900 | | | | 172,102 | |
| | |
Cisco Systems, Inc. | | | 2,800 | | | | 107,240 | |
| | |
DST Systems, Inc. | | | 2,600 | | | | 161,382 | |
| | |
KLA-Tencor Corp. | | | 900 | | | | 94,563 | |
| | |
Littelfuse, Inc. | | | 400 | | | | 79,128 | |
| | |
Microsoft Corp. | | | 2,800 | | | | 239,512 | |
| | |
Texas Instruments, Inc. | | | 2,300 | | | | 240,212 | |
| | |
| | | | | | | 1,422,043 | |
| | | | | | | | |
| Materials: 2.50% | | | | | | | | |
| | |
Eastman Chemical Co. | | | 1,301 | | | | 120,525 | |
| | |
Neenah Paper, Inc. | | | 600 | | | | 54,390 | |
| | |
| | | | | | | 174,915 | |
| | | | | | | | |
| Real Estate: 1.81% | | | | | | | | |
| | |
HFF, Inc., Class A | | | 2,600 | | | | 126,464 | |
| | |
Total Common Stocks
(Cost $5,381,158) | | | | | | | 6,607,635 | |
| | | | |
| See accompanying Notes to Financial Statements. | | 58 | | |
Schedule of Investments (See Note 11)
Salient US Dividend Signal Fund
December 31, 2017
| | | | | | | | |
| | | Shares | | | Value
(See Note 2) | |
| |
| Limited Partnerships: 1.28% | | | | | |
| Financials: 1.28% | | | | | | | | |
| | |
Blackstone Group LP | | | 2,800 | | | $ | 89,656 | |
| | |
Total Limited Partnerships
(Cost $91,829) | | | | | | | 89,656 | |
| | |
Total Investments: 95.66%
(Cost $5,472,987) | | | | | | | 6,697,291 | |
| | |
| Net Other Assets and Liabilities: 4.34% | | | | | | | 303,843 | |
| | |
| Net Assets: 100.00% | | | | | | $ | 7,001,134 | |
Percentages are stated as a percent of net assets.
Investment Abbreviations:
ADR — American Depositary Receipt
| | | | |
| See accompanying Notes to Financial Statements. | | 59 | | |
Statements of Assets and Liabilities
December 31, 2017
| | | | | | | | | | | | |
| | | Salient
Adaptive
Balanced
Fund | | | Salient
Adaptive
Income
Fund | | | Salient
Adaptive
US Equity
Fund | |
Assets: | | | | | | | | | | | | |
Investments in affiliates, at value | | $ | 20,411,261 | | | $ | 6,103,837 | | | $ | — | |
Investments, at value | | | 5,410,673 | | | | 6,143,811 | | | | 15,841,820 | |
Cash | | | 1,398,864 | | | | 302,489 | | | | 1,231,277 | |
Deposit with broker for futures contracts | | | — | | | | — | | | | 508,500 | |
Receivable for shares sold | | | 1,152 | | | | 57,427 | | | | — | |
Receivable due from advisor | | | 9,013 | | | | 13,572 | | | | — | |
Other assets | | | 9,443 | | | | 11,852 | | | | 7,100 | |
| | | | | | | | | | | | |
Total Assets | | | 27,240,406 | | | | 12,632,988 | | | | 17,588,697 | |
| | | | | | | | | | | | |
Liabilities: | | | | | | | | | | | | |
Variation margin payable for futures contracts | | | — | | | | — | | | | 54,805 | |
Payable for shares redeemed | | | 1,125 | | | | 289,595 | | | | 38,282 | |
Payable to advisor | | | — | | | | — | | | | 803 | |
Payable for distribution and service fees | | | 15,012 | | | | 5,912 | | | | 1,898 | |
Payable to trustees | | | — | | | | — | | | | 89 | |
Payable for compliance fees | | | 717 | | | | 264 | | | | 380 | |
Payable for legal and audit fees | | | 13,188 | | | | 12,473 | | | | 20,114 | |
Accrued expenses and other liabilities | | | 8,965 | | | | 4,461 | | | | 5,940 | |
| | | | | | | | | | | | |
Total Liabilities | | | 39,007 | | | | 312,705 | | | | 122,311 | |
| | | | | | | | | | | | |
Net Assets | | $ | 27,201,399 | | | $ | 12,320,283 | | | $ | 17,466,386 | |
| | | | | | | | | | | | |
Net Assets Consist of: | | | | | | | | | | | | |
Paid-in capital | | $ | 46,628,451 | | | $ | 16,582,617 | | | $ | 14,369,566 | |
Accumulated net investment income | | | 77,025 | | | | — | | | | 24,199 | |
Accumulated net realized gain/(loss) | | | (21,144,857 | ) | | | (4,609,759 | ) | | | 1,733,243 | |
Net unrealized appreciation | | | 1,640,780 | | | | 347,425 | | | | 1,339,378 | |
| | | | | | | | | | | | |
Total Net Assets | | $ | 27,201,399 | | | $ | 12,320,283 | | | $ | 17,466,386 | |
| | | | | | | | | | | | |
| | | |
Investments in Affiliates, At Cost | | $ | 18,799,401 | | | $ | 5,796,586 | | | $ | — | |
Investments, At Cost | | $ | 5,381,753 | | | $ | 6,103,637 | | | $ | 14,529,794 | |
Pricing of Shares | | | | | | | | | | | | |
Investor Class: | | | | | | | | | | | | |
Net Assets | | $ | 3,466,251 | | | $ | 1,329,021 | | | $ | 1,883,844 | |
Shares of beneficial interest outstanding | | | 264,020 | | | | 96,091 | | | | 53,819 | |
Net Asset Value, offering and redemption price per share | | | $13.13 | | | | $13.83 | | | | $35.00 | |
Institutional Class: | | | | | | | | | | | | |
Net Assets | | $ | 5,175,679 | | | $ | 3,680,501 | | | $ | 15,582,542 | |
Shares of beneficial interest outstanding | | | 394,437 | | | | 265,227 | | | | 399,628 | |
Net Asset Value, offering and redemption price per share | | | $13.12 | | | | $13.88 | | | | $38.99 | |
Class A: | | | | | | | | | | | | |
Net Assets | | $ | 10,096,053 | | | $ | 3,142,862 | | | | — | |
Shares of beneficial interest outstanding | | | 769,604 | | | | 226,821 | | | | — | |
Net Asset Value, offering and redemption price per share | | | $13.12 | | | | $13.86 | | | | — | |
Maximum offering price per share | | | $13.92 | (a) | | | $14.40 | (b) | | | — | |
| | | | |
| See accompanying Notes to Financial Statements. | | 60 | | |
Statements of Assets and Liabilities
December 31, 2017
| | | | | | | | | | | | |
| | | Salient
Adaptive
Balanced
Fund
(continued) | | | Salient
Adaptive
Income
Fund
(continued) | | | Salient
Adaptive
US Equity
Fund
(continued) | |
Class C: | | | | | | | | | | | | |
Net Assets | | $ | 8,463,416 | | | $ | 4,167,899 | | | | — | |
Shares of beneficial interest outstanding | | | 651,330 | | | | 303,294 | | | | — | |
Net Asset Value, offering and redemption price per share | | | $12.99 | | | | $13.74 | | | | — | |
(a) Maximum offering price per share (NAV/0.9425, based on maximum sales charge of 5.75% of the offering price)
(b) Maximum offering price per share (NAV/0.9625, based on maximum sales charge of 3.75% of the offering price)
| | | | |
| See accompanying Notes to Financial Statements. | | 61 | | |
Statements of Assets and Liabilities
December 31, 2017
| | | | | | | | | | | | |
| | | Salient EM
Infrastructure
Fund | | | Salient
International
Dividend
Signal
Fund | | | Salient
International
Small Cap
Fund | |
Assets: | | | | | | | | | | | | |
Investments, at value | | $ | 28,398,809 | | | $ | 81,993,201 | | | $ | 118,229,878 | |
Cash | | | 369,387 | | | | 1,317,921 | | | | 1,956,258 | |
Foreign currency, at value (Cost $572,611, $765,477 and $—, respectively) | | | 572,795 | | | | 771,682 | | | | — | |
Deposit with broker for futures contracts | | | — | | | | 301,677 | | | | — | |
Receivable for investments sold | | | — | | | | — | | | | 272,654 | |
Receivable for shares sold | | | 2,678 | | | | 24,506 | | | | 59,962 | |
Interest and dividends receivable | | | 111,280 | | | | 415,807 | | | | 289,397 | |
Other assets | | | 13,967 | | | | 15,589 | | | | 14,333 | |
| | | | | | | | | | | | |
Total Assets | | | 29,468,916 | | | | 84,840,383 | | | | 120,822,482 | |
| | | | | | | | | | | | |
Liabilities: | | | | | | | | | | | | |
Payable on loan (See Note 2(j)) | | | — | | | | 7,353,712 | | | | — | |
Payable for interest and commitment fees due on loan (See Note 2(j)) | | | — | | | | 15,736 | | | | — | |
Payable to custodian due to overdraft (Cost $—, $— and $33,294, respectively) | | | — | | | | — | | | | 33,294 | |
Payable for investments purchased | | | — | | | | — | | | | 73,200 | |
Payable for shares redeemed | | | 7,572 | | | | 5,549 | | | | 36,291 | |
Payable to advisor | | | 5,176 | | | | 35,368 | | | | 75,689 | |
Payable for distribution and service fees | | | 8,490 | | | | 16,885 | | | | 17,816 | |
Payable to trustees | | | 142 | | | | 494 | | | | 566 | |
Payable for compliance fees | | | 601 | | | | 2,112 | | | | 2,447 | |
Payable for legal and audit fees | | | 22,772 | | | | 28,491 | | | | 29,093 | |
Accrued expenses and other liabilities | | | 23,474 | | | | 37,416 | | | | 44,396 | |
| | | | | | | | | | | | |
Total Liabilities | | | 68,227 | | | | 7,495,763 | | | | 312,792 | |
| | | | | | | | | | | | |
Net Assets | | $ | 29,400,689 | | | $ | 77,344,620 | | | $ | 120,509,690 | |
| | | | | | | | | | | | |
Net Assets Consist of: | | | | | | | | | | | | |
Paid-in capital | | $ | 55,660,743 | | | $ | 124,873,666 | | | $ | 88,252,910 | |
Accumulated net investment income/(loss) | | | 30,975 | | | | (981,819 | ) | | | (2,444,741 | ) |
Accumulated net realized loss | | | (29,603,820 | ) | | | (64,130,683 | ) | | | (710,341 | ) |
Net unrealized appreciation | | | 3,312,791 | | | | 17,583,456 | | | | 35,411,862 | |
| | | | | | | | | | | | |
Total Net Assets | | $ | 29,400,689 | | | $ | 77,344,620 | | | $ | 120,509,690 | |
| | | | | | | | | | | | |
| | | |
Investments, At Cost | | $ | 25,086,913 | | | $ | 64,433,232 | | | $ | 82,827,227 | |
Pricing of Shares | | | | | | | | | | | | |
Investor Class: | | | | | | | | | | | | |
Net Assets | | $ | 1,353,040 | | | $ | 4,549,472 | | | $ | 43,701,885 | |
Shares of beneficial interest outstanding | | | 58,632 | | | | 514,564 | | | | 2,009,845 | |
Net Asset Value, offering and redemption price per share | | | $23.08 | | | | $8.84 | | | | $21.74 | |
Institutional Class: | | | | | | | | | | | | |
Net Assets | | $ | 13,318,005 | | | $ | 54,973,501 | | | $ | 76,807,805 | |
Shares of beneficial interest outstanding | | | 578,163 | | | | 7,767,810 | | | | 3,539,893 | |
Net Asset Value, offering and redemption price per share | | | $23.04 | | | | $7.08 | | | | $21.70 | |
| | | | |
| See accompanying Notes to Financial Statements. | | 62 | | |
Statements of Assets and Liabilities
December 31, 2017
| | | | | | | | | | | | |
| | | Salient EM
Infrastructure
Fund
(continued) | | | Salient
International
Dividend
Signal
Fund
(continued) | | | Salient
International
Small Cap
Fund
(continued) | |
Class A: | | | | | | | | | | | | |
Net Assets | | $ | 10,608,736 | | | $ | 5,450,759 | | | | — | |
Shares of beneficial interest outstanding | | | 462,452 | | | | 616,638 | | | | — | |
Net Asset Value, offering and redemption price per share | | | $22.94 | | | | $8.84 | | | | — | |
Maximum offering price per share (NAV/0.9425, based on maximum sales charge of 5.75% of the offering price) | | | $24.34 | | | | $9.38 | | | | — | |
Class C: | | | | | | | | | | | | |
Net Assets | | $ | 4,120,908 | | | $ | 12,370,888 | | | | — | |
Shares of beneficial interest outstanding | | | 180,587 | | | | 1,402,610 | | | | — | |
Net Asset Value, offering and redemption price per share | | | $22.82 | | | | $8.82 | | | | — | |
| | | | |
| See accompanying Notes to Financial Statements. | | 63 | | |
Statements of Assets and Liabilities
December 31, 2017
| | | | | | | | | | | | |
| | | Salient
Tactical
Growth
Fund | | | Salient
Tactical
Muni & Credit
Fund | | | Salient
US Dividend
Signal
Fund | |
Assets: | | | | | | | | | | | | |
Investments, at value | | $ | 308,689,278 | | | $ | 80,299,247 | | | $ | 6,697,291 | |
Cash | | | 107,483,723 | | | | 1,313,881 | | | | 228,609 | |
Deposit with broker for futures contracts | | | — | | | | 250,071 | | | | — | |
Receivable for shares sold | | | 554,426 | | | | 10,747 | | | | 76,281 | |
Receivable due from advisor | | | — | | | | — | | | | 5,489 | |
Interest and dividends receivable | | | 723,151 | | | | 826,698 | | | | 9,102 | |
Other assets | | | 26,196 | | | | 11,283 | | | | 11,684 | |
| | | | | | | | | | | | |
Total Assets | | | 417,476,774 | | | | 82,711,927 | | | | 7,028,456 | |
| | | | | | | | | | | | |
Liabilities: | | | | | | | | | | | | |
Variation margin payable for futures contracts | | | — | | | | 26,531 | | | | — | |
Payable for investments purchased | | | 19,977,554 | | | | — | | | | — | |
Payable for shares redeemed | | | 292,843 | | | | 54,048 | | | | — | |
Payable to advisor | | | 383,942 | | | | 51,274 | | | | — | |
Payable for distribution and service fees | | | 65,205 | | | | 20,905 | | | | 1,680 | |
Payable to trustees | | | 1,918 | | | | 383 | | | | 33 | |
Payable for compliance fees | | | 8,177 | | | | 1,630 | | | | 144 | |
Payable for legal and audit fees | | | 38,960 | | | | 25,813 | | | | 19,550 | |
Accrued expenses and other liabilities | | | 71,511 | | | | 19,650 | | | | 5,915 | |
| | | | | | | | | | | | |
Total Liabilities | | | 20,840,110 | | | | 200,234 | | | | 27,322 | |
| | | | | | | | | | | | |
Net Assets | | $ | 396,636,664 | | | $ | 82,511,693 | | | $ | 7,001,134 | |
| | | | | | | | | | | | |
Net Assets Consist of: | | | | | | | | | | | | |
Paid-in capital | | $ | 364,883,980 | | | $ | 168,242,638 | | | $ | 8,695,375 | |
Accumulated net investment income | | | — | | | | 33,492 | | | | 13,524 | |
Accumulated net realized gain/(loss) | | | 1,281,283 | | | | (90,033,218 | ) | | | (2,932,006 | ) |
Net unrealized appreciation | | | 30,471,401 | | | | 4,268,781 | | | | 1,224,241 | |
| | | | | | | | | | | | |
Total Net Assets | | $ | 396,636,664 | | | $ | 82,511,693 | | | $ | 7,001,134 | |
| | | | | | | | | | | | |
| | | |
Investments, At Cost | | $ | 278,217,877 | | | $ | 76,072,576 | | | $ | 5,472,987 | |
Pricing of Shares | | | | | | | | | | | | |
Investor Class: | | | | | | | | | | | | |
Net Assets | | $ | 9,211,574 | | | $ | 17,033,360 | | | $ | 1,654,342 | |
Shares of beneficial interest outstanding | | | 346,852 | | | | 2,149,390 | | | | 50,074 | |
Net Asset Value, offering and redemption price per share | | | $26.56 | | | | $7.92 | | | | $33.04 | |
Institutional Class: | | | | | | | | | | | | |
Net Assets | | $ | 311,992,673 | | | $ | 45,635,436 | | | $ | 3,297,802 | |
Shares of beneficial interest outstanding | | | 11,382,681 | | | | 5,817,530 | | | | 99,516 | |
Net Asset Value, offering and redemption price per share | | | $27.41 | | | | $7.84 | | | | $33.14 | |
Class A: | | | | | | | | | | | | |
Net Assets | | $ | 38,753,200 | | | $ | 8,019,567 | | | $ | 2,048,990 | |
Shares of beneficial interest outstanding | | | 1,482,028 | | | | 1,017,891 | | | | 62,180 | |
Net Asset Value, offering and redemption price per share | | | $26.15 | | | | $7.88 | | | | $32.95 | |
Maximum offering price per share (NAV/0.9425, based on maximum sales charge of 5.75% of the offering price) | | | $27.75 | | | | $8.36 | | | | $34.96 | |
| | | | |
| See accompanying Notes to Financial Statements. | | 64 | | |
Statements of Assets and Liabilities
December 31, 2017
| | | | | | | | | | | | |
| | | Salient
Tactical
Growth
Fund
(continued) | | | Salient
Tactical
Muni & Credit
Fund
(continued) | | | Salient
US Dividend
Signal
Fund
(continued) | |
Class C: | | | | | | | | | | | | |
Net Assets | | $ | 36,679,217 | | | $ | 11,823,330 | | | | — | |
Shares of beneficial interest outstanding | | | 1,465,013 | | | | 1,491,874 | | | | — | |
Net Asset Value, offering and redemption price per share | | | $25.04 | | | | $7.93 | | | | — | |
| | | | |
| See accompanying Notes to Financial Statements. | | 65 | | |
Statements of Operations
For the Year Ended December 31, 2017
| | | | | | | | | | | | |
| | | Salient
Adaptive
Balanced
Fund | | | Salient
Adaptive
Income
Fund | | | Salient
Adaptive
US Equity
Fund | |
Investment Income: | | | | | | | | | | | | |
Interest | | $ | 11,064 | | | $ | 2,918 | | | $ | 6,324 | |
Dividends | | | 231,273 | | | | 265,875 | | | | 257,042 | |
Dividends from affiliated investments | | | 1,481,912 | | | | 315,020 | | | | — | |
| | | | | | | | | | | | |
Total Investment Income | | | 1,724,249 | | | | 583,813 | | | | 263,366 | |
| | | | | | | | | | | | |
Expenses: | | | | | | | | | | | | |
Investment advisory fee | | | 34,663 | | | | 12,555 | | | | 88,966 | |
Administration fees and expenses | | | 18,255 | | | | 10,333 | | | | 19,378 | |
Custodian fee | | | 3,398 | | | | 2,451 | | | | 2,630 | |
Legal and audit fees | | | 32,540 | | | | 28,611 | | | | 41,638 | |
Transfer agent fees and expenses | | | 27,246 | | | | 9,743 | | | | 11,700 | |
Trustees’ fees and expenses | | | — | | | | — | | | | 4,545 | |
Registration/filing fees | | | 53,883 | | | | 53,012 | | | | 29,432 | |
Reports to shareholders and printing fees | | | 14,278 | | | | 9,436 | | | | 5,012 | |
Distribution and service fees | | | | | | | | | | | | |
Investor Class | | | 18,417 | | | | 8,201 | | | | 9,009 | |
Institutional Class | | | — | | | | — | | | | 8,524 | |
Class A | | | 35,824 | | | | 7,648 | | | | — | |
Class C | | | 89,065 | | | | 44,262 | | | | — | |
Compliance fees | | | 9,904 | | | | 3,527 | | | | 5,039 | |
Other | | | 11,313 | | | | 5,595 | | | | 4,443 | |
| | | | | | | | | | | | |
Total expenses before waivers | | | 348,786 | | | | 195,374 | | | | 230,316 | |
Less fees waived/reimbursed by investment advisor (See Note 4) | | | (94,668 | ) | | | (134,029 | ) | | | (79,204 | ) |
| | | | | | | | | | | | |
Total Expenses | | | 254,118 | | | | 61,345 | | | | 151,112 | |
| | | | | | | | | | | | |
Net Investment Income: | | | 1,470,131 | | | | 522,468 | | | | 112,254 | |
| | | | | | | | | | | | |
Net realized loss on affiliated investments | | | (547,189 | ) | | | (161,936 | ) | | | — | |
Net realized gain on investments and foreign currency translations | | | 102,668 | | | | 177,978 | | | | 1,819,434 | |
Net realized gain on futures contracts | | | — | | | | — | | | | 1,375,488 | |
Capital gain distributions from affiliated investment companies | | | 421,210 | | | | 124,714 | | | | — | |
Net change in unrealized appreciation/depreciation on affiliated investments | | | 2,984,795 | | | | 397,825 | | | | — | |
Net change in unrealized appreciation/depreciation on investments | | | 28,920 | | | | 40,174 | | | | 644,308 | |
Net change in unrealized appreciation/depreciation on futures contracts | | | — | | | | — | | | | (37,061 | ) |
| | | | | | | | | | | | |
Net Realized and Unrealized Gain on Affiliated Investments, Investments, Futures Contracts and Foreign Currency Translations | | | 2,990,404 | | | | 578,755 | | | | 3,802,169 | |
| | | | | | | | | | | | |
Net Increase in Net Assets Resulting From Operations | | $ | 4,460,535 | | | $ | 1,101,223 | | | $ | 3,914,423 | |
| | | | | | | | | | | | |
| | | | |
| See accompanying Notes to Financial Statements. | | 66 | | |
Statements of Operations
For the Year Ended December 31, 2017
| | | | | | | | | | | | |
| | | Salient EM
Infrastructure
Fund | | | Salient
International
Dividend
Signal
Fund | | | Salient
International
Small Cap
Fund | |
Investment Income: | | | | | | | | | | | | |
Interest | | $ | 11,117 | | | $ | 352,489 | | | $ | 22,058 | |
Dividends | | | 2,229,943 | | | | 6,795,225 | | | | 2,707,592 | |
Foreign taxes withheld | | | (115,024 | ) | | | (339,088 | ) | | | (222,719 | ) |
| | | | | | | | | | | | |
Total Investment Income | | | 2,126,036 | | | | 6,808,626 | | | | 2,506,931 | |
| | | | | | | | | | | | |
Expenses: | | | | | | | | | | | | |
Investment advisory fee | | | 271,247 | | | | 889,273 | | | | 1,199,095 | |
Administration fees and expenses | | | 46,173 | | | | 119,411 | | | | 142,562 | |
Custodian fee | | | 21,611 | | | | 43,756 | | | | 30,084 | |
Legal and audit fees | | | 48,203 | | | | 76,302 | | | | 80,995 | |
Transfer agent fees and expenses | | | 32,799 | | | | 60,686 | | | | 75,706 | |
Trustees’ fees and expenses | | | 7,560 | | | | 29,245 | | | | 30,980 | |
Registration/filing fees | | | 69,065 | | | | 65,995 | | | | 46,777 | |
Reports to shareholders and printing fees | | | 12,312 | | | | 10,129 | | | | 31,643 | |
Distribution and service fees | | | | | | | | | | | | |
Investor Class | | | 5,744 | | | | 32,837 | | | | 145,011 | |
Institutional Class | | | 6,566 | | | | 37,453 | | | | 41,604 | |
Class A | | | 48,093 | | | | 26,301 | | | | — | |
Class B | | | 319 | | | | — | | | | — | |
Class C | | | 43,780 | | | | 108,646 | | | | — | |
Advisor Class | | | 468 | | | | 5,796 | | | | 449 | |
Compliance fees | | | 8,837 | | | | 29,557 | | | | 33,819 | |
Interest and commitment fees on loan | | | — | | | | 204,413 | | | | — | |
Other | | | 16,788 | | | | 46,736 | | | | 33,232 | |
| | | | | | | | | | | | |
Total expenses before waivers | | | 639,565 | | | | 1,786,536 | | | | 1,891,957 | |
Less fees waived/reimbursed by investment advisor (See Note 4) | | | (187,947 | ) | | | (393,400 | ) | | | (254,328 | ) |
| | | | | | | | | | | | |
Total Expenses | | | 451,618 | | | | 1,393,136 | | | | 1,637,629 | |
| | | | | | | | | | | | |
Net Investment Income: | | | 1,674,418 | | | | 5,415,490 | | | | 869,302 | |
| | | | | | | | | | | | |
Net realized gain/(loss) on investments and foreign currency translations | | | (943,550 | ) | | | 3,939,538 | | | | 18,540,937 | |
Net realized gain on futures contracts | | | — | | | | 1,381,413 | | | | — | |
Net realized gain/(loss) on foreign currency | | | (8,445 | ) | | | 55,615 | | | | (19,371 | ) |
Net change in unrealized appreciation/depreciation on investments | | | 3,712,102 | | | | 12,173,121 | | | | 15,791,475 | |
Net change in unrealized appreciation/depreciation on futures contracts | | | — | | | | (42,026 | ) | | | — | |
Net change in unrealized appreciation/depreciation on foreign currency transactions | | | 2,862 | | | | 39,490 | | | | 17,798 | |
| | | | | | | | | | | | |
Net Realized and Unrealized Gain on Investments, Futures Contracts and Foreign Currency Translations | | | 2,762,969 | | | | 17,547,151 | | | | 34,330,839 | |
| | | | | | | | | | | | |
Net Increase in Net Assets Resulting From Operations | | $ | 4,437,387 | | | $ | 22,962,641 | | | $ | 35,200,141 | |
| | | | | | | | | | | | |
| | | | |
| See accompanying Notes to Financial Statements. | | 67 | | |
Statements of Operations
For the Year Ended December 31, 2017
| | | | | | | | | | | | |
| | | Salient
Tactical
Growth
Fund | | | Salient
Tactical
Muni & Credit
Fund | | | Salient
US Dividend
Signal
Fund | |
Investment Income: | | | | | | | | | | | | |
Interest | | $ | 1,590,884 | | | $ | 3,556,920 | | | $ | 2,757 | |
Dividends | | | 4,760,612 | | | | — | | | | 242,520 | |
Foreign taxes withheld | | | — | | | | — | | | | (4,347 | ) |
| | | | | | | | | | | | |
Total Investment Income | | | 6,351,496 | | | | 3,556,920 | | | | 240,930 | |
| | | | | | | | | | | | |
Expenses: | | | | | | | | | | | | |
Investment advisory fee | | | 4,367,537 | | | | 759,668 | | | | 45,310 | |
Administration fees and expenses | | | 303,996 | | | | 76,354 | | | | 12,438 | |
Custodian fee | | | 9,087 | | | | 4,557 | | | | 3,363 | |
Legal and audit fees | | | 148,858 | | | | 69,504 | | | | 38,168 | |
Transfer agent fees and expenses | | | 301,249 | | | | 53,570 | | | | 5,391 | |
Trustees’ fees and expenses | | | 96,665 | | | | 20,241 | | | | 1,335 | |
Registration/filing fees | | | 77,810 | | | | 70,199 | | | | 40,874 | |
Reports to shareholders and printing fees | | | 75,886 | | | | 14,828 | | | | 3,566 | |
Distribution and service fees | | | | | | | | | | | | |
Investor Class | | | 41,532 | | | | 86,670 | | | | 6,673 | |
Institutional Class | | | 119,090 | | | | 15,949 | | | | 843 | |
Class A | | | 202,844 | | | | 29,002 | | | | 12,709 | |
Class C | | | 387,719 | | | | 104,788 | | | | — | |
Advisor Class | | | 55,216 | | | | 6,588 | | | | — | |
Compliance fees | | | 106,980 | | | | 21,280 | | | | 1,618 | |
Other | | | 65,976 | | | | 17,456 | | | | 3,573 | |
| | | | | | | | | | | | |
Total expenses before waivers | | | 6,360,445 | | | | 1,350,654 | | | | 175,861 | |
Less fees waived/reimbursed by investment advisor (See Note 4) | | | — | | | | (116,826 | ) | | | (102,285 | ) |
| | | | | | | | | | | | |
Total Expenses | | | 6,360,445 | | | | 1,233,828 | | | | 73,576 | |
| | | | | | | | | | | | |
Net Investment Income/(Loss): | | | (8,949 | ) | | | 2,323,092 | | | | 167,354 | |
| | | | | | | | | | | | |
Net realized gain on investments and foreign currency translations | | | 15,822,724 | | | | 1,298,212 | | | | 6,975 | |
Net realized loss on futures contracts | | | — | | | | (74,145 | ) | | | — | |
Net realized gain on swap contracts | | | — | | | | 129,566 | | | | — | |
Net realized loss on foreign currency | | | — | | | | — | | | | (20 | ) |
Net change in unrealized appreciation/depreciation on investments | | | 23,283,402 | | | | 2,870,409 | | | | 935,002 | |
Net change in unrealized appreciation/depreciation on futures contracts | | | — | | | | (43,108 | ) | | | — | |
Net change in unrealized appreciation/depreciation on swap contracts | | | — | | | | (125,961 | ) | | | — | |
Net change in unrealized appreciation/depreciation on foreign currency transactions | | | — | | | | — | | | | 497 | |
| | | | | | | | | | | | |
Net Realized and Unrealized Gain on Investments, Futures Contracts, Swap Contracts and Foreign Currency Translations | | | 39,106,126 | | | | 4,054,973 | | | | 942,454 | |
| | | | | | | | | | | | |
Net Increase in Net Assets Resulting From Operations | | $ | 39,097,177 | | | $ | 6,378,065 | | | $ | 1,109,808 | |
| | | | | | | | | | | | |
| | | | |
| See accompanying Notes to Financial Statements. | | 68 | | |
Statements of Changes in Net Assets
| | | | | | | | | | | | | | | | |
| | | Salient Adaptive Balanced Fund | | | Salient Adaptive Income Fund | |
| | | Year Ended
December 31, 2017 | | | Year Ended
December 31, 2016(a) | | | Year Ended
December 31, 2017 | | | Year Ended
December 31, 2016(b) | |
Operations: | | | | | | | | | |
Net investment income | | $ | 1,470,131 | | | $ | 949,380 | | | $ | 522,468 | | | $ | 530,810 | |
Net realized gain/(loss) | | | (444,521 | ) | | | (1,792,382 | ) | | | 16,042 | | | | (876,072 | ) |
Capital gain distributions from affiliated investment companies | | | 421,210 | | | | 993,980 | | | | 124,714 | | | | 302,099 | |
Net change in unrealized appreciation/depreciation | | | 3,013,715 | | | | 754,974 | | | | 437,999 | | | | 1,137,825 | |
| | | | | | | | | | | | | | | | |
Net increase in net assets resulting from operations | | | 4,460,535 | | | | 905,952 | | | | 1,101,223 | | | | 1,094,662 | |
| | | | | | | | | | | | | | | | |
Distributions to Shareholders: | | | | | | | | | | | | | | | | |
From net investment income | | | | | | | | | | | | | | | | |
Investor Class | | | (175,375 | ) | | | (192,079 | ) | | | (67,624 | ) | | | (67,756 | ) |
Institutional Class | | | (384,324 | ) | | | (654,285 | ) | | | (159,032 | ) | | | (144,704 | ) |
Class A | | | (520,551 | ) | | | (570,686 | ) | | | (133,131 | ) | | | (146,350 | ) |
Class C | | | (388,692 | ) | | | (430,767 | ) | | | (162,681 | ) | | | (184,962 | ) |
From return of capital | | | | | | | | | | | | | | | | |
Investor Class | | | — | | | | — | | | | (3,088 | ) | | | (5,961 | ) |
Institutional Class | | | — | | | | — | | | | (7,263 | ) | | | (12,731 | ) |
Class A | | | — | | | | — | | | | (6,080 | ) | | | (12,876 | ) |
Class C | | | — | | | | — | | | | (7,429 | ) | | | (16,272 | ) |
| | | | | | | | | | | | | | | | |
Total distributions | | | (1,468,942 | ) | | | (1,847,817 | ) | | | (546,328 | ) | | | (591,612 | ) |
| | | | | | | | | | | | | | | | |
Share Transactions: | | | | | | | | | |
Investor Class | | | | | | | | | |
Proceeds from sale of shares | | | 478,608 | | | | 250,568 | | | | 120,263 | | | | 112,481 | |
Issued to shareholders in reinvestment of distributions | | | 174,588 | | | | 190,407 | | | | 70,404 | | | | 73,167 | |
Cost of shares redeemed | | | (1,335,984 | ) | | | (1,266,457 | ) | | | (585,271 | ) | | | (868,334 | ) |
Acquisition (See Note 12) | | | — | | | | 3,110,479 | | | | — | | | | 856,783 | |
| | | | | | | | | | | | | | | | |
Net increase/(decrease) from share transactions | | | (682,788 | ) | | | 2,284,997 | | | | (394,604 | ) | | | 174,097 | |
| | | | | | | | | | | | | | | | |
Institutional Class | | | | | | | | | |
Proceeds from sale of shares | | | 132,678 | | | | 196,554 | | | | 955,072 | | | | 985,492 | |
Issued to shareholders in reinvestment of distributions | | | 367,983 | | | | 639,068 | | | | 143,408 | | | | 147,405 | |
Cost of shares redeemed | | | (8,442,273 | ) | | | (1,376,478 | ) | | | (1,103,786 | ) | | | (1,496,865 | ) |
Acquisition (See Note 12) | | | — | | | | 3,491,170 | | | | — | | | | 896,271 | |
| | | | | | | | | | | | | | | | |
Net increase/(decrease) from share transactions | | | (7,941,612 | ) | | | 2,950,314 | | | | (5,306 | ) | | | 532,303 | |
| | | | | | | | | | | | | | | | |
Class A | | | | | | | | | |
Proceeds from sale of shares | | | 408,092 | | | | 339,335 | | | | 581,136 | | | | 202,336 | |
Issued to shareholders in reinvestment of distributions | | | 516,436 | | | | 568,063 | | | | 124,913 | | | | 134,280 | |
Cost of shares redeemed | | | (2,786,022 | ) | | | (2,812,806 | ) | | | (1,142,291 | ) | | | (1,303,180 | ) |
Acquisition (See Note 12) | | | — | | | | 7,866,680 | | | | — | | | | 2,631,121 | |
| | | | | | | | | | | | | | | | |
Net increase/(decrease) from share transactions | | | (1,861,494 | ) | | | 5,961,272 | | | | (436,242 | ) | | | 1,664,557 | |
| | | | | | | | | | | | | | | | |
Class C | | | | | | | | | |
Proceeds from sale of shares | | | 174,162 | | | | 403,195 | | | | 476,910 | | | | 852,957 | |
Issued to shareholders in reinvestment of distributions | | | 387,989 | | | | 424,296 | | | | 154,546 | | | | 178,352 | |
Cost of shares redeemed | | | (2,289,560 | ) | | | (2,957,536 | ) | | | (1,174,215 | ) | | | (3,166,439 | ) |
Acquisition (See Note 12) | | | — | | | | 6,548,027 | | | | — | | | | 2,446,073 | |
| | | | | | | | | | | | | | | | |
Net increase/(decrease) from share transactions | | | (1,727,409 | ) | | | 4,417,982 | | | | (542,759 | ) | | | 310,943 | |
| | | | | | | | | | | | | | | | |
Net increase/(decrease) in net assets | | $ | (9,221,710 | ) | | $ | 14,672,700 | | | $ | (824,016 | ) | | $ | 3,184,950 | |
| | | | | | | | | | | | | | | | |
| | | | |
| See accompanying Notes to Financial Statements. | | 69 | | |
Statements of Changes in Net Assets
| | | | | | | | | | | | | | | | |
| | | Salient Adaptive Balanced Fund (continued) | | | Salient Adaptive Income Fund (continued) | |
| | | Year Ended
December 31, 2017 | | | Year Ended
December 31, 2016(a) | | | Year Ended
December 31, 2017 | | | Year Ended
December 31, 2016(b) | |
Net Assets: | | | | | | | | | |
Beginning of period | | | 36,423,109 | | | | 21,750,409 | | | | 13,144,299 | | | | 9,959,349 | |
| | | | | | | | | | | | | | | | |
End of period (including accumulated net investment income of $77,025, $75,836, $— and $—, respectively) | | $ | 27,201,399 | | | $ | 36,423,109 | | | $ | 12,320,283 | | | $ | 13,144,299 | |
| | | | | | | | | | | | | | | | |
Changes in Shares Outstanding: | | | | | | | | | | | | | | | | |
Investor Class | | | | | | | | | | | | | | | | |
Sold | | | 37,476 | | | | 20,056 | | | | 8,830 | | | | 8,612 | |
Distributions reinvested | | | 13,407 | | | | 15,586 | | | | 5,162 | | | | 5,655 | |
Redeemed | | | (104,155 | ) | | | (101,070 | ) | | | (42,661 | ) | | | (67,400 | ) |
Acquisition (See Note 12) | | | — | | | | 257,936 | | | | — | | | | 68,592 | |
| | | | | | | | | | | | | | | | |
Net increase/(decrease) in shares outstanding | | | (53,272 | ) | | | 192,508 | | | | (28,669 | ) | | | 15,459 | |
| | | | | | | | | | | | | | | | |
Institutional Class | | | | | | | | | | | | | | | | |
Sold | | | 10,442 | | | | 15,802 | | | | 69,629 | | | | 74,908 | |
Distributions reinvested | | | 28,487 | | | | 52,181 | | | | 10,481 | | | | 11,370 | |
Redeemed | | | (635,020 | ) | | | (108,283 | ) | | | (81,009 | ) | | | (114,982 | ) |
Acquisition (See Note 12) | | | — | | | | 289,546 | | | | — | | | | 71,612 | |
| | | | | | | | | | | | | | | | |
Net increase/(decrease) in shares outstanding | | | (596,091 | ) | | | 249,246 | | | | (899 | ) | | | 42,908 | |
| | | | | | | | | | | | | | | | |
Class A | | | | | | | | | | | | | | | | |
Sold | | | 32,229 | | | | 26,845 | | | | 42,168 | | | | 15,226 | |
Distributions reinvested | | | 39,693 | | | | 46,454 | | | | 9,142 | | | | 10,372 | |
Redeemed | | | (221,250 | ) | | | (224,071 | ) | | | (83,968 | ) | | | (100,214 | ) |
Acquisition (See Note 12) | | | — | | | | 652,772 | | | | — | | | | 210,414 | |
| | | | | | | | | | | | | | | | |
Net increase/(decrease) in shares outstanding | | | (149,328 | ) | | | 502,000 | | | | (32,658 | ) | | | 135,798 | |
| | | | | | | | | | | | | | | | |
Class C | | | | | | | | | | | | | | | | |
Sold | | | 13,796 | | | | 32,128 | | | | 35,268 | | | | 63,279 | |
Distributions reinvested | | | 30,033 | | | | 35,171 | | | | 11,403 | | | | 13,851 | |
Redeemed | | | (181,498 | ) | | | (237,146 | ) | | | (86,543 | ) | | | (244,983 | ) |
Acquisition (See Note 12) | | | — | | | | 548,282 | | | | — | | | | 196,718 | |
| | | | | | | | | | | | | | | | |
Net increase/(decrease) in shares outstanding | | | (137,669 | ) | | | 378,435 | | | | (39,872 | ) | | | 28,865 | |
| | | | | | | | | | | | | | | | |
(a) Prior to May 1, 2016, Salient Adaptive Balanced Fund was known as Forward Growth Allocation Fund.
(b) Prior to May 1, 2016, Salient Adaptive Income Fund was known as Forward Income Builder Fund.
| | | | |
| See accompanying Notes to Financial Statements. | | 70 | | |
Statements of Changes in Net Assets
| | | | | | | | | | | | | | | | |
| | | Salient Adaptive US Equity Fund | | | Salient EM Infrastructure Fund | |
| | | Year Ended
December 31, 2017(a) | | | Year Ended
December 31, 2016(b) | | | Year Ended
December 31, 2017(c) | | | Year Ended
December 31, 2016(d) | |
Operations: | |
Net investment income | | $ | 112,254 | | | $ | 285,391 | | | $ | 1,674,418 | | | $ | 851,363 | |
Net realized gain/(loss) | | | 3,194,922 | | | | 1,751,339 | | | | (951,995 | ) | | | (2,557,882 | ) |
Net change in unrealized appreciation/depreciation | | | 607,247 | | | | (381,703 | ) | | | 3,714,964 | | | | 1,299,493 | |
| | | | | | | | | | | | | | | | |
Net increase/(decrease) in net assets resulting from operations | | | 3,914,423 | | | | 1,655,027 | | | | 4,437,387 | | | | (407,026 | ) |
| | | | | | | | | | | | | | | | |
Distributions to Shareholders: | | | | | | | | | | | | | | | | |
From net investment income | | | | | | | | | | | | | | | | |
Investor Class | | | (7,755 | ) | | | (18,207 | ) | | | (74,642 | ) | | | (23,179 | ) |
Institutional Class | | | (117,243 | ) | | | (136,960 | ) | | | (842,005 | ) | | | (195,579 | ) |
Class A | | | — | | | | — | | | | (609,189 | ) | | | (243,191 | ) |
Class B | | | — | | | | — | | | | (829 | ) | | | (5,004 | ) |
Class C | | | — | | | | — | | | | (217,555 | ) | | | (84,425 | ) |
Advisor | | | — | | | | — | | | | (23,333 | ) | | | (17,565 | ) |
Class Z | | | — | | | | (94,833 | ) | | | — | | | | — | |
From net realized gains on investments | | | | | | | | | | | | | | | | |
Investor Class | | | (217,451 | ) | | | (127,377 | ) | | | — | | | | — | |
Institutional Class | | | (1,608,679 | ) | | | (684,938 | ) | | | — | | | | — | |
Class Z | | | — | | | | (474,264 | ) | | | — | | | | — | |
| | | | | | | | | | | | | | | | |
Total distributions | | | (1,951,128 | ) | | | (1,536,579 | ) | | | (1,767,553 | ) | | | (568,943 | ) |
| | | | | | | | | | | | | | | | |
Share Transactions: | |
Investor Class | |
Proceeds from sale of shares | | | 313,567 | | | | 765,852 | | | | 819,557 | | | | 5,858,445 | |
Issued to shareholders in reinvestment of distributions | | | 222,477 | | | | 144,836 | | | | 74,569 | | | | 23,159 | |
Cost of shares redeemed | | | (513,785 | ) | | | (1,262,575 | ) | | | (2,463,042 | ) | | | (21,009,035 | ) |
| | | | | | | | | | | | | | | | |
Net increase/(decrease) from share transactions | | | 22,259 | | | | (351,887 | ) | | | (1,568,916 | ) | | | (15,127,431 | ) |
| | | | | | | | | | | | | | | | |
Institutional Class | |
Proceeds from sale of shares | | | 6,993,090 | | | | 668,302 | | | | 18,834,138 | | | | 6,712,207 | |
Issued to shareholders in reinvestment of distributions | | | 1,688,931 | | | | 765,856 | | | | 366,612 | | | | 167,502 | |
Cost of shares redeemed | | | (4,408,644 | ) | | | (2,623,125 | ) | | | (13,888,350 | ) | | | (11,277,897 | ) |
| | | | | | | | | | | | | | | | |
Net increase/(decrease) from share transactions | | | 4,273,377 | | | | (1,188,967 | ) | | | 5,312,400 | | | | (4,398,188 | ) |
| | | | | | | | | | | | | | | | |
Class A | |
Proceeds from sale of shares | | | — | | | | — | | | | 3,811,645 | | | | 1,188,968 | |
Issued to shareholders in reinvestment of distributions | | | — | | | | — | | | | 573,703 | | | | 221,645 | |
Cost of shares redeemed | | | — | | | | — | | | | (3,148,480 | ) | | | (5,852,500 | ) |
| | | | | | | | | | | | | | | | |
Net increase/(decrease) from share transactions | | | — | | | | — | | | | 1,236,868 | | | | (4,441,887 | ) |
| | | | | | | | | | | | | | | | |
Class B | |
Issued to shareholders in reinvestment of distributions | | | — | | | | — | | | | 829 | | | | 4,793 | |
Cost of shares redeemed | | | — | | | | — | | | | (212,650 | ) | | | (332,297 | ) |
| | | | | | | | | | | | | | | | |
Net decrease from share transactions | | | — | | | | — | | | | (211,821 | ) | | | (327,504 | ) |
| | | | | | | | | | | | | | | | |
Class C | |
Proceeds from sale of shares | | | — | | | | — | | | | 440,889 | | | | 446,461 | |
Issued to shareholders in reinvestment of distributions | | | — | | | | — | | | | 199,042 | | | | 78,036 | |
Cost of shares redeemed | | | — | | | | — | | | | (1,319,336 | ) | | | (1,093,766 | ) |
| | | | | | | | | | | | | | | | |
Net decrease from share transactions | | | — | | | | — | | | | (679,405 | ) | | | (569,269 | ) |
| | | | | | | | | | | | | | | | |
| | | | |
| See accompanying Notes to Financial Statements. | | 71 | | |
Statements of Changes in Net Assets
| | | | | | | | | | | | | | | | |
| | | Salient Adaptive US Equity Fund (continued) | | | Salient EM Infrastructure Fund (continued) | |
| | | Year Ended
December 31, 2017(a) | | | Year Ended
December 31, 2016(b) | | | Year Ended
December 31, 2017(c) | | | Year Ended
December 31, 2016(d) | |
Advisor | |
Proceeds from sale of shares | | | — | | | | — | | | | 139,255 | | | | 1,793,706 | |
Issued to shareholders in reinvestment of distributions | | | — | | | | — | | | | 1,620 | | | | 3,817 | |
Cost of shares redeemed | | | — | | | | — | | | | (2,156,657 | ) | | | (115,467 | ) |
| | | | | | | | | | | | | | | | |
Net increase/(decrease) from share transactions | | | — | | | | — | | | | (2,015,782 | ) | | | 1,682,056 | |
| | | | | | | | | | | | | | | | |
Class Z | |
Proceeds from sale of shares | | | 356,898 | | | | 4,751,008 | | | | — | | | | — | |
Issued to shareholders in reinvestment of distributions | | | — | | | | 569,097 | | | | — | | | | — | |
Cost of shares redeemed | | | (6,984,391 | ) | | | (7,759,131 | ) | | | — | | | | — | |
| | | | | | | | | | | | | | | | |
Net decrease from share transactions | | | (6,627,493 | ) | | | (2,439,026 | ) | | | — | | | | — | |
| | | | | | | | | | | | | | | | |
Net increase/(decrease) in net assets | | $ | (368,562 | ) | | $ | (3,861,432 | ) | | $ | 4,743,178 | | | $ | (24,158,192 | ) |
| | | | | | | | | | | | | | | | |
Net Assets: | |
Beginning of period | | | 17,834,948 | | | | 21,696,380 | | | | 24,657,511 | | | | 48,815,703 | |
| | | | | | | | | | | | | | | | |
End of period (including accumulated net investment income of $24,199, $58,283, $30,975 and $28,910, respectively) | | $ | 17,466,386 | | | $ | 17,834,948 | | | $ | 29,400,689 | | | $ | 24,657,511 | |
| | | | | | | | | | | | | | | | |
Changes in Shares Outstanding: | | | | | | | | | | | | | | | | |
Investor Class | | | | | | | | | | | | | | | | |
Sold | | | 9,280 | | | | 22,140 | | | | 37,459 | | | | 272,510 | |
Distributions reinvested | | | 6,416 | | | | 4,491 | | | | 3,301 | | | | 1,110 | |
Redeemed | | | (14,887 | ) | | | (37,834 | ) | | | (112,634 | ) | | | (1,031,261 | ) |
| | | | | | | | | | | | | | | | |
Net increase/(decrease) in shares outstanding | | | 809 | | | | (11,203 | ) | | | (71,874 | ) | | | (757,641 | ) |
| | | | | | | | | | | | | | | | |
Institutional Class | | | | | | | | | | | | | | | | |
Sold | �� | | 189,276 | | | | 18,203 | | | | 828,608 | | | | 322,280 | |
Distributions reinvested | | | 43,577 | | | | 21,549 | | | | 16,268 | | | | 7,986 | |
Redeemed | | | (110,798 | ) | | | (73,389 | ) | | | (609,258 | ) | | | (546,428 | ) |
| | | | | | | | | | | | | | | | |
Net increase/(decrease) in shares outstanding | | | 122,055 | | | | (33,637 | ) | | | 235,618 | | | | (216,162 | ) |
| | | | | | | | | | | | | | | | |
Class A | | | | | | | | | | | | | | | | |
Sold | | | — | | | | — | | | | 171,114 | | | | 54,831 | |
Distributions reinvested | | | — | | | | — | | | | 25,564 | | | | 10,620 | |
Redeemed | | | — | | | | — | | | | (139,277 | ) | | | (268,154 | ) |
| | | | | | | | | | | | | | | | |
Net increase/(decrease) in shares outstanding | | | — | | | | — | | | | 57,401 | | | | (202,703 | ) |
| | | | | | | | | | | | | | | | |
Class B | | | | | | | | | | | | | | | | |
Distributions reinvested | | | — | | | | — | | | | 37 | | | | 231 | |
Redeemed | | | — | | | | — | | | | (9,806 | ) | | | (15,449 | ) |
| | | | | | | | | | | | | | | | |
Net decrease in shares outstanding | | | — | | | | — | | | | (9,769 | ) | | | (15,218 | ) |
| | | | | | | | | | | | | | | | |
Class C | | | | | | | | | | | | | | | | |
Sold | | | — | | | | — | | | | 19,730 | | | | 21,558 | |
Distributions reinvested | | | — | | | | — | | | | 8,915 | | | | 3,763 | |
Redeemed | | | — | | | | — | | | | (58,704 | ) | | | (51,825 | ) |
| | | | | | | | | | | | | | | | |
Net decrease in shares outstanding | | | — | | | | — | | | | (30,059 | ) | | | (26,504 | ) |
| | | | | | | | | | | | | | | | |
| | | | |
| See accompanying Notes to Financial Statements. | | 72 | | |
Statements of Changes in Net Assets
| | | | | | | | | | | | | | | | |
| | | Salient Adaptive US Equity Fund (continued) | | | Salient EM Infrastructure Fund (continued) | |
| | | Year Ended
December 31, 2017(a) | | | Year Ended
December 31, 2016(b) | | | Year Ended
December 31, 2017(c) | | | Year Ended
December 31, 2016(d) | |
Advisor | | | | | | | | | | | | | | | | |
Sold | | | — | | | | — | | | | 6,280 | | | | 83,783 | |
Distributions reinvested | | | — | | | | — | | | | 71 | | | | 182 | |
Redeemed | | | — | | | | — | | | | (94,362 | ) | | | (5,320 | ) |
| | | | | | | | | | | | | | | | |
Net increase/(decrease) in shares outstanding | | | — | | | | — | | | | (88,011 | ) | | | 78,645 | |
| | | | | | | | | | | | | | | | |
Class Z | | | | | | | | | | | | | | | | |
Sold | | | 9,940 | | | | 134,740 | | | | — | | | | — | |
Distributions reinvested | | | — | | | | 15,894 | | | | — | | | | — | |
Redeemed | | | (188,782 | ) | | | (221,502 | ) | | | — | | | | — | |
| | | | | | | | | | | | | | | | |
Net decrease in shares outstanding | | | (178,842 | ) | | | (70,868 | ) | | | — | | | | — | |
| | | | | | | | | | | | | | | | |
(a) Effective April 28, 2017, Class Z shares of Salient Adaptive US Equity Fund were terminated and exchanged into Institutional Class shares.
(b) Prior to May 1, 2016, Salient Adaptive US Equity Fund was known as Forward Total MarketPlus Fund.
(c) Effective March 29, 2017, Advisor Class shares of Salient EM Infrastructure Fund were terminated and exchanged into Institutional Class shares. Effective April 28, 2017, Class B shares of Salient EM Infrastructure Fund were terminated and exchanged into Class A shares.
(d) Prior to May 1, 2016, Salient EM Infrastructure Fund was known as Forward Global Infrastructure Fund.
| | | | |
| See accompanying Notes to Financial Statements. | | 73 | | |
Statements of Changes in Net Assets
| | | | | | | | | | | | | | | | |
| | | Salient International Dividend Signal Fund | | | Salient International Small Cap Fund | |
| | | Year Ended
December 31, 2017(a) | | | Year Ended
December 31, 2016(b) | | | Year Ended
December 31, 2017(c) | | | Year Ended
December 31, 2016(d) | |
Operations: | | | | | | | | | |
Net investment income | | $ | 5,415,490 | | | $ | 9,893,721 | | | $ | 869,302 | | | $ | 3,006,178 | |
Net realized gain/(loss) | | | 5,376,566 | | | | (19,332,677 | ) | | | 18,521,566 | | | | 3,619,987 | |
Capital gain distributions from affiliated investment companies | | | — | | | | 33,657 | | | | — | | | | — | |
Net change in unrealized appreciation/depreciation | | | 12,170,585 | | | | 3,950,369 | | | | 15,809,273 | | | | (10,259,888 | ) |
| | | | | | | | | | | | | | | | |
Net increase/(decrease) in net assets resulting from operations | | | 22,962,641 | | | | (5,454,930 | ) | | | 35,200,141 | | | | (3,633,723 | ) |
| | | | | | | | | | | | | | | | |
Distributions to Shareholders: | | | | | | | | | | | | | | | | |
From net investment income | | | | | | | | | | | | | | | | |
Investor Class | | | (272,945 | ) | | | (2,300,123 | ) | | | (918,997 | ) | | | (918,569 | ) |
Institutional Class | | | (4,565,500 | ) | | | (5,201,452 | ) | | | (1,878,645 | ) | | | (3,909,088 | ) |
Class A | | | (257,557 | ) | | | (203,615 | ) | | | — | | | | — | |
Class C | | | (543,391 | ) | | | (451,117 | ) | | | — | | | | — | |
Advisor Class | | | (310,328 | ) | | | (1,953,332 | ) | | | — | | | | (97,323 | ) |
| | | | | | | | | | | | | | | | |
Total distributions | | | (5,949,721 | ) | | | (10,109,639 | ) | | | (2,797,642 | ) | | | (4,924,980 | ) |
| | | | | | | | | | | | | | | | |
Share Transactions: | | | | | | | | | |
Investor Class | | | | | | | | | |
Proceeds from sale of shares | | | 550,686 | | | | 69,394,787 | | | | 29,966,956 | | | | 6,732,609 | |
Issued to shareholders in reinvestment of distributions | | | 265,564 | | | | 2,289,905 | | | | 914,599 | | | | 914,028 | |
Cost of shares redeemed | | | (36,744,857 | ) | | | (89,929,964 | ) | | | (19,962,093 | ) | | | (17,348,202 | ) |
| | | | | | | | | | | | | | | | |
Net increase/(decrease) from share transactions | | | (35,928,607 | ) | | | (18,245,272 | ) | | | 10,919,462 | | | | (9,701,565 | ) |
| | | | | | | | | | | | | | | | |
Institutional Class | | | | | | | | | |
Proceeds from sale of shares | | | 40,834,042 | | | | 43,814,088 | | | | 18,532,119 | | | | 29,585,853 | |
Issued to shareholders in reinvestment of distributions | | | 4,015,707 | | | | 4,262,793 | | | | 1,503,820 | | | | 3,347,432 | |
Cost of shares redeemed | | | (68,314,834 | ) | | | (82,047,337 | ) | | | (61,326,471 | ) | | | (82,519,439 | ) |
| | | | | | | | | | | | | | | | |
Net decrease from share transactions | | | (23,465,085 | ) | | | (33,970,456 | ) | | | (41,290,532 | ) | | | (49,586,154 | ) |
| | | | | | | | | | | | | | | | |
Class A | | | | | | | | | |
Proceeds from sale of shares | | | 1,777,436 | | | | 2,023,852 | | | | — | | | | — | |
Issued to shareholders in reinvestment of distributions | | | 253,661 | | | | 200,725 | | | | — | | | | — | |
Cost of shares redeemed | | | (1,451,376 | ) | | | (2,095,463 | ) | | | — | | | | — | |
| | | | | | | | | | | | | | | | |
Net increase from share transactions | | | 579,721 | | | | 129,114 | | | | — | | | | — | |
| | | | | | | | | | | | | | | | |
Class C | | | | | | | | | |
Proceeds from sale of shares | | | 3,235,241 | | | | 2,212,989 | | | | — | | | | — | |
Issued to shareholders in reinvestment of distributions | | | 507,261 | | | | 413,945 | | | | — | | | | — | |
Cost of shares redeemed | | | (2,159,843 | ) | | | (4,179,955 | ) | | | — | | | | — | |
| | | | | | | | | | | | | | | | |
Net increase/(decrease) from share transactions | | | 1,582,659 | | | | (1,553,021 | ) | | | — | | | | — | |
| | | | | | | | | | | | | | | | |
Advisor Class | | | | | | | | | |
Proceeds from sale of shares | | | 2,848,545 | | | | 9,945,287 | | | | 105,257 | | | | 408,075 | |
Issued to shareholders in reinvestment of distributions | | | 307,433 | | | | 1,934,036 | | | | — | | | | 94,778 | |
Cost of shares redeemed | | | (27,427,103 | ) | | | (19,238,461 | ) | | | (2,655,293 | ) | | | (723,508 | ) |
| | | | | | | | | | | | | | | | |
Net decrease from share transactions | | | (24,271,125 | ) | | | (7,359,138 | ) | | | (2,550,036 | ) | | | (220,655 | ) |
| | | | | | | | | | | | | | | | |
Net decrease in net assets | | $ | (64,489,517 | ) | | $ | (76,563,342 | ) | | $ | (518,607 | ) | | $ | (68,067,077 | ) |
| | | | | | | | | | | | | | | | |
| | | | |
| See accompanying Notes to Financial Statements. | | 74 | | |
Statements of Changes in Net Assets
| | | | | | | | | | | | | | | | |
| | | Salient International Dividend Signal Fund (continued) | | | Salient International Small Cap Fund (continued) | |
| | | Year Ended
December 31, 2017(a) | | | Year Ended
December 31, 2016(b) | | | Year Ended
December 31, 2017(c) | | | Year Ended
December 31, 2016(d) | |
Net Assets: | | | | | | | | | |
Beginning of period | | | 141,834,137 | | | | 218,397,479 | | | | 121,028,297 | | | | 189,095,374 | |
| | | | | | | | | | | | | | | | |
End of period (including accumulated net investment loss of $(981,819), $(1,499,400), $(2,444,741) and $(2,157,622), respectively) | | $ | 77,344,620 | | | $ | 141,834,137 | | | $ | 120,509,690 | | | $ | 121,028,297 | |
| | | | | | | | | | | | | | | | |
Changes in Shares Outstanding: | | | | | | | | | | | | | | | | |
Investor Class | | | | | | | | | | | | | | | | |
Sold | | | 67,764 | | | | 9,141,859 | | | | 1,491,032 | | | | 399,413 | |
Distributions reinvested | | | 31,584 | | | | 307,265 | | | | 42,559 | | | | 55,598 | |
Redeemed | | | (4,750,985 | ) | | | (11,983,420 | ) | | | (986,503 | ) | | | (1,010,334 | ) |
| | | | | | | | | | | | | | | | |
Net increase/(decrease) in shares outstanding | | | (4,651,637 | ) | | | (2,534,296 | ) | | | 547,088 | | | | (555,323 | ) |
| | | | | | | | | | | | | | | | |
Institutional Class | | | | | | | | | | | | | | | | |
Sold | | | 6,235,035 | | | | 7,079,065 | | | | 1,023,308 | | | | 1,741,855 | |
Distributions reinvested | | | 592,257 | | | | 701,280 | | | | 70,141 | | | | 204,112 | |
Redeemed | | | (10,093,732 | ) | | | (13,531,163 | ) | | | (3,276,955 | ) | | | (4,773,076 | ) |
| | | | | | | | | | | | | | | | |
Net decrease in shares outstanding | | | (3,266,440 | ) | | | (5,750,818 | ) | | | (2,183,506 | ) | | | (2,827,109 | ) |
| | | | | | | | | | | | | | | | |
Class A | | | | | | | | | | | | | | | | |
Sold | | | 215,288 | | | | 266,549 | | | | — | | | | — | |
Distributions reinvested | | | 29,986 | | | | 26,965 | | | | — | | | | — | |
Redeemed | | | (176,322 | ) | | | (275,087 | ) | | | — | | | | — | |
| | | | | | | | | | | | | | | | |
Net increase in shares outstanding | | | 68,952 | | | | 18,427 | | | | — | | | | — | |
| | | | | | | | | | | | | | | | |
Class C | | | | | | | | | | | | | | | | |
Sold | | | 395,391 | | | | 293,629 | | | | — | | | | — | |
Distributions reinvested | | | 60,045 | | | | 55,777 | | | | — | | | | — | |
Redeemed | | | (263,067 | ) | | | (554,257 | ) | | | — | | | | — | |
| | | | | | | | | | | | | | | | |
Net increase/(decrease) in shares outstanding | | | 192,369 | | | | (204,851 | ) | | | — | | | | — | |
| | | | | | | | | | | | | | | | |
Advisor Class | | | | | | | | | | | | | | | | |
Sold | | | 456,232 | | | | 1,601,540 | | | | 6,139 | | | | 23,961 | |
Distributions reinvested | | | 47,812 | | | | 318,504 | | | | — | | | | 5,772 | |
Redeemed | | | (4,273,621 | ) | | | (3,126,274 | ) | | | (152,132 | ) | | | (41,837 | ) |
| | | | | | | | | | | | | | | | |
Net decrease in shares outstanding | | | (3,769,577 | ) | | | (1,206,230 | ) | | | (145,993 | ) | | | (12,104 | ) |
| | | | | | | | | | | | | | | | |
(a) Effective March 29, 2017, Advisor Class shares of Salient International Dividend Signal Fund were terminated and exchanged into Institutional Class shares.
(b) Prior to May 1, 2016, Salient International Dividend Signal Fund was known as Forward International Dividend Fund.
(c) Effective March 29, 2017, Advisor Class shares of Salient International Small Cap Fund were terminated and exchanged into Institutional Class shares.
(d) Prior to May 1, 2016, Salient International Small Cap Fund was known as Forward International Small Companies Fund.
| | | | |
| See accompanying Notes to Financial Statements. | | 75 | | |
Statements of Changes in Net Assets
| | | | | | | | | | | | | | | | |
| | | Salient Tactical Growth Fund | | | Salient Tactical Muni & Credit Fund | |
| | | Year Ended
December 31, 2017(a) | | | Year Ended
December 31, 2016(b) | | | Year Ended
December 31, 2017(c) | | | Year Ended
December 31, 2016(d) | |
Operations: | | | | | | | | | |
Net investment income/(loss) | | $ | (8,949 | ) | | $ | (2,454,464 | ) | | $ | 2,323,092 | | | $ | 2,924,347 | |
Net realized gain | | | 15,822,724 | | | | 21,283,452 | | | | 1,353,633 | | | | 1,781,934 | |
Net change in unrealized appreciation/depreciation | | | 23,283,402 | | | | (7,633,721 | ) | | | 2,701,340 | | | | (1,324,318 | ) |
| | | | | | | | | | | | | | | | |
Net increase in net assets resulting from operations | | | 39,097,177 | | | | 11,195,267 | | | | 6,378,065 | | | | 3,381,963 | |
| | | | | | | | | | | | | | | | |
Distributions to Shareholders: | | | | | | | | | | | | | | | | |
From net investment income | | | | | | | | | | | | | | | | |
Investor Class | | | — | | | | — | | | | (580,439 | ) | | | (1,416,306 | ) |
Institutional Class | | | — | | | | — | | | | (1,119,439 | ) | | | (469,466 | ) |
Class A | | | — | | | | — | | | | (153,080 | ) | | | (91,730 | ) |
Class C | | | — | | | | — | | | | (256,211 | ) | | | (252,251 | ) |
Advisor Class | | | — | | | | — | | | | (207,328 | ) | | | (701,060 | ) |
From net realized gains on investments | | | | | | | | | | | | | | | | |
Investor Class | | | (585,902 | ) | | | (39,032 | ) | | | — | | | | — | |
Institutional Class | | | (19,444,295 | ) | | | (72,094 | ) | | | — | | | | — | |
Class A | | | (2,486,375 | ) | | | (112,081 | ) | | | — | | | | — | |
Class C | | | (2,504,525 | ) | | | (124,669 | ) | | | — | | | | — | |
Advisor Class | | | — | | | | (724,394 | ) | | | — | | | | — | |
| | | | | | | | | | | | | | | | |
Total distributions | | | (25,021,097 | ) | | | (1,072,270 | ) | | | (2,316,497 | ) | | | (2,930,813 | ) |
| | | | | | | | | | | | | | | | |
Share Transactions: | | | | | | | | | |
Investor Class | | | | | | | | | |
Proceeds from sale of shares | | | 2,168,003 | | | | 4,309,971 | | | | 4,138,015 | | | | 87,028,917 | |
Issued to shareholders in reinvestment of distributions | | | 574,001 | | | | 38,470 | | | | 576,941 | | | | 1,411,501 | |
Cost of shares redeemed | | | (6,900,441 | ) | | | (108,632,050 | ) | | | (32,314,430 | ) | | | (113,088,840 | ) |
| | | | | | | | | | | | | | | | |
Net decrease from share transactions | | | (4,158,437 | ) | | | (104,283,609 | ) | | | (27,599,474 | ) | | | (24,648,422 | ) |
| | | | | | | | | | | | | | | | |
Institutional Class | | | | | | | | | |
Proceeds from sale of shares | | | 338,310,717 | | | | 3,997,814 | | | | 47,462,419 | | | | 25,086,179 | |
Issued to shareholders in reinvestment of distributions | | | 19,349,128 | | | | 72,021 | | | | 484,246 | | | | 323,342 | |
Cost of shares redeemed | | | (72,745,479 | ) | | | (13,369,877 | ) | | | (10,586,324 | ) | | | (42,769,550 | ) |
| | | | | | | | | | | | | | | | |
Net increase/(decrease) from share transactions | | | 284,914,366 | | | | (9,300,042 | ) | | | 37,360,341 | | | | (17,360,029 | ) |
| | | | | | | | | | | | | | | | |
Class A | | | | | | | | | |
Proceeds from sale of shares | | | 7,462,476 | | | | 12,368,257 | | | | 3,575,417 | | | | 2,664,860 | |
Issued to shareholders in reinvestment of distributions | | | 2,464,561 | | | | 109,981 | | | | 116,434 | | | | 79,986 | |
Cost of shares redeemed | | | (9,673,806 | ) | | | (15,313,911 | ) | | | (440,444 | ) | | | (4,089,519 | ) |
| | | | | | | | | | | | | | | | |
Net increase/(decrease) from share transactions | | | 253,231 | | | | (2,835,673 | ) | | | 3,251,407 | | | | (1,344,673 | ) |
| | | | | | | | | | | | | | | | |
Class C | | | | | | | | | |
Proceeds from sale of shares | | | 2,257,219 | | | | 5,331,399 | | | | 3,467,958 | | | | 9,519,269 | |
Issued to shareholders in reinvestment of distributions | | | 2,308,508 | | | | 111,784 | | | | 218,401 | | | | 218,729 | |
Cost of shares redeemed | | | (10,971,114 | ) | | | (20,328,608 | ) | | | (4,265,779 | ) | | | (3,572,007 | ) |
| | | | | | | | | | | | | | | | |
Net increase/(decrease) from share transactions | | | (6,405,387 | ) | | | (14,885,425 | ) | | | (579,420 | ) | | | 6,165,991 | |
| | | | | | | | | | | | | | | | |
Advisor Class | | | | | | | | | |
Proceeds from sale of shares | | | 15,852,972 | | | | 61,334,138 | | | | 2,927,897 | | | | 31,101,455 | |
Issued to shareholders in reinvestment of distributions | | | — | | | | 714,123 | | | | 14,834 | | | | 199,970 | |
Cost of shares redeemed | | | (286,208,133 | ) | | | (139,895,950 | ) | | | (32,690,811 | ) | | | (10,121,517 | ) |
| | | | | | | | | | | | | | | | |
Net increase/(decrease) from share transactions | | | (270,355,161 | ) | | | (77,847,689 | ) | | | (29,748,080 | ) | | | 21,179,908 | |
| | | | | | | | | | | | | | | | |
Net increase/(decrease) in net assets | | $ | 18,324,692 | | | $ | (199,029,441 | ) | | $ | (13,253,658 | ) | | $ | (15,556,075 | ) |
| | | | | | | | | | | | | | | | |
| | | | |
| See accompanying Notes to Financial Statements. | | 76 | | |
Statements of Changes in Net Assets
| | | | | | | | | | | | | | | | |
| | | Salient Tactical Growth Fund (continued) | | | Salient Tactical Muni & Credit Fund (continued) | |
| | | Year Ended
December 31, 2017(a) | | | Year Ended
December 31, 2016(b) | | | Year Ended
December 31, 2017(c) | | | Year Ended
December 31, 2016(d) | |
Net Assets: | | | | | | | | | |
Beginning of period | | | 378,311,972 | | | | 577,341,413 | | | | 95,765,351 | | | | 111,321,426 | |
| | | | | | | | | | | | | | | | |
End of period (including accumulated net investment income of $—, $—, $33,492 and $26,670, respectively) | | $ | 396,636,664 | | | $ | 378,311,972 | | | $ | 82,511,693 | | | $ | 95,765,351 | |
| | | | | | | | | | | | | | | | |
Changes in Shares Outstanding: | | | | | | | | | | | | | | | | |
Investor Class | | | | | | | | | | | | | | | | |
Sold | | | 82,270 | | | | 175,788 | | | | 532,684 | | | | 11,294,426 | |
Distributions reinvested | | | 21,883 | | | | 1,477 | | | | 74,215 | | | | 180,838 | |
Redeemed | | | (260,387 | ) | | | (4,397,010 | ) | | | (4,208,088 | ) | | | (14,521,517 | ) |
| | | | | | | | | | | | | | | | |
Net decrease in shares outstanding | | | (156,234 | ) | | | (4,219,745 | ) | | | (3,601,189 | ) | | | (3,046,253 | ) |
| | | | | | | | | | | | | | | | |
Institutional Class | | | | | | | | | | | | | | | | |
Sold | | | 12,408,350 | | | | 156,354 | | | | 6,204,938 | | | | 3,269,051 | |
Distributions reinvested | | | 715,045 | | | | 2,693 | | | | 62,618 | | | | 41,794 | |
Redeemed | | | (2,640,679 | ) | | | (526,256 | ) | | | (1,377,027 | ) | | | (5,512,612 | ) |
| | | | | | | | | | | | | | | | |
Net increase/(decrease) in shares outstanding | | | 10,482,716 | | | | (367,209 | ) | | | 4,890,529 | | | | (2,201,767 | ) |
| | | | | | | | | | | | | | | | |
Class A | | | | | | | | | | | | | | | | |
Sold | | | 282,907 | | | | 510,237 | | | | 457,952 | | | | 339,476 | |
Distributions reinvested | | | 95,415 | | | | 4,276 | | | | 15,038 | | | | 10,272 | |
Redeemed | | | (369,306 | ) | | | (622,674 | ) | | | (57,217 | ) | | | (534,483 | ) |
| | | | | | | | | | | | | | | | |
Net increase/(decrease) in shares outstanding | | | 9,016 | | | | (108,161 | ) | | | 415,773 | | | | (184,735 | ) |
| | | | | | | | | | | | | | | | |
Class C | | | | | | | | | | | | | | | | |
Sold | | | 88,680 | | | | 228,467 | | | | 440,933 | | | | 1,235,514 | |
Distributions reinvested | | | 93,311 | | | | 4,506 | | | | 28,044 | | | | 27,900 | |
Redeemed | | | (432,676 | ) | | | (861,599 | ) | | | (549,577 | ) | | | (459,557 | ) |
| | | | | | | | | | | | | | | | |
Net increase/(decrease) in shares outstanding | | | (250,685 | ) | | | (628,626 | ) | | | (80,600 | ) | | | 803,857 | |
| | | | | | | | | | | | | | | | |
Advisor Class | | | | | | | | | | | | | | | | |
Sold | | | 592,901 | | | | 2,439,761 | | | | 386,692 | | | | 4,048,973 | |
Distributions reinvested | | | — | | | | 26,736 | | | | 1,957 | | | | 25,788 | |
Redeemed | | | (10,559,865 | ) | | | (5,529,252 | ) | | | (4,308,617 | ) | | | (1,316,254 | ) |
| | | | | | | | | | | | | | | | |
Net increase/(decrease) in shares outstanding | | | (9,966,964 | ) | | | (3,062,755 | ) | | | (3,919,968 | ) | | | 2,758,507 | |
| | | | | | | | | | | | | | | | |
(a) Effective March 29, 2017, Advisor Class shares of Salient Tactical Growth Fund were terminated and exchanged into Institutional Class shares.
(b) Prior to May 1, 2016, Salient Tactical Growth Fund was known as Forward Tactical Growth Fund.
(c) Effective March 29, 2017, Advisor Class shares of Salient Tactical Muni & Credit Fund were terminated and exchanged into Institutional Class shares.
(d) Prior to June 1, 2016, Salient Tactical Muni & Credit Fund was known as Salient Tactical Muni Strategy Fund. Prior to May 1, 2016, Salient Tactical Muni & Credit Fund was known as Forward Credit Analysis Long/Short Fund.
| | | | |
| See accompanying Notes to Financial Statements. | | 77 | | |
Statements of Changes in Net Assets
| | | | | | | | |
| | | Salient US Dividend Signal Fund | |
| | | Year Ended
December 31, 2017 | | | Year Ended
December 31, 2016(a) | |
Operations: | |
Net investment income | | $ | 167,354 | | | $ | 25,487 | |
Net realized gain/(loss) | | | 6,955 | | | | (745,218 | ) |
Net change in unrealized appreciation/depreciation | | | 935,499 | | | | 937,565 | |
| | | | | | | | |
Net increase in net assets resulting from operations | | | 1,109,808 | | | | 217,834 | |
| | | | | | | | |
Distributions to Shareholders: | | | | | | | | |
From net investment income | | | | | | | | |
Investor Class | | | (40,143 | ) | | | (6,019 | ) |
Institutional Class | | | (63,028 | ) | | | (10,896 | ) |
Class A | | | (49,426 | ) | | | (10,704 | ) |
| | | | | | | | |
Total distributions | | | (152,597 | ) | | | (27,619 | ) |
| | | | | | | | |
Share Transactions: | |
Investor Class | |
Proceeds from sale of shares | | | 854,736 | | | | 333,935 | |
Issued to shareholders in reinvestment of distributions | | | 40,143 | | | | 6,019 | |
Cost of shares redeemed | | | (735,231 | ) | | | (26,695 | ) |
| | | | | | | | |
Net increase from share transactions | | | 159,648 | | | | 313,259 | |
| | | | | | | | |
Institutional Class | |
Proceeds from sale of shares | | | 2,468,554 | | | | 472,697 | |
Issued to shareholders in reinvestment of distributions | | | 63,027 | | | | 9,458 | |
Cost of shares redeemed | | | (530,624 | ) | | | (4,102,265 | ) |
| | | | | | | | |
Net increase/(decrease) from share transactions | | | 2,000,957 | | | | (3,620,110 | ) |
| | | | | | | | |
Class A | |
Proceeds from sale of shares | | | 1,168,958 | | | | 283,952 | |
Issued to shareholders in reinvestment of distributions | | | 38,940 | | | | 8,113 | |
Cost of shares redeemed | | | (1,086,811 | ) | | | (3,562,797 | ) |
| | | | | | | | |
Net increase/(decrease) from share transactions | | | 121,087 | | | | (3,270,732 | ) |
| | | | | | | | |
Net increase/(decrease) in net assets | | $ | 3,238,903 | | | $ | (6,387,368 | ) |
| | | | | | | | |
Net Assets: | |
Beginning of period | | | 3,762,231 | | | | 10,149,599 | |
| | | | | | | | |
End of period (including accumulated net investment income of $13,524 and $—, respectively) | | $ | 7,001,134 | | | $ | 3,762,231 | |
| | | | | | | | |
Changes in Shares Outstanding: | |
Investor Class | |
Sold | | | 29,030 | | | | 12,689 | |
Distributions reinvested | | | 1,259 | | | | 224 | |
Redeemed | | | (23,966 | ) | | | (1,156 | ) |
| | | | | | | | |
Net increase in shares outstanding | | | 6,323 | | | | 11,757 | |
| | | | | | | | |
Institutional Class | |
Sold | | | 79,542 | | | | 18,643 | |
Distributions reinvested | | | 1,947 | | | | 358 | |
Redeemed | | | (17,562 | ) | | | (181,320 | ) |
| | | | | | | | |
Net increase/(decrease) in shares outstanding | | | 63,927 | | | | (162,319 | ) |
| | | | | | | | |
| | | | |
| See accompanying Notes to Financial Statements. | | 78 | | |
Statements of Changes in Net Assets
| | | | | | | | |
| | | Salient US Dividend Signal Fund (continued) | |
| | | Year Ended
December 31, 2017 | | | Year Ended
December 31, 2016(a) | |
Class A | |
Sold | | | 39,293 | | | | 11,257 | |
Distributions reinvested | | | 1,224 | | | | 307 | |
Redeemed | | | (34,006 | ) | | | (151,045 | ) |
| | | | | | | | |
Net increase/(decrease) in shares outstanding | | | 6,511 | | | | (139,481 | ) |
| | | | | | | | |
(a) Prior to May 1, 2016, Salient US Dividend Signal Fund was known as Forward Dynamic Income Fund.
| | | | |
| See accompanying Notes to Financial Statements. | | 79 | | |
Financial Highlights
For a share outstanding throughout the periods presented.
Salient Adaptive Balanced Fund(a)
| | | | | | | | | | | | | | | | | | | | |
| | | Investor Class | |
| | | Year Ended
December 31,
2017 | | | Year Ended
December 31,
2016 | | | Year Ended
December 31,
2015(b) | | | Year Ended
December 31,
2014 | | | Year Ended
December 31,
2013 | |
Net Asset Value, Beginning of Period | | $ | 12.11 | | | $ | 12.88 | | | $ | 14.33 | | | $ | 14.91 | | | $ | 14.09 | |
Income/(Loss) from Operations: | | | | | | | | | | | | | | | | | | | | |
Net investment income(c) | | | 0.66 | | | | 0.32 | | | | 0.29 | | | | 0.63 | | | | 0.42 | |
Net realized and unrealized gain/(loss) on investments | | | 1.03 | | | | (0.48 | ) | | | (1.40 | ) | | | (0.58 | ) | | | 0.83 | |
| | | | | | | | | | | | | | | | | | | | |
Total from Investment Operations | | | 1.69 | | | | (0.16 | ) | | | (1.11 | ) | | | 0.05 | | | | 1.25 | |
| | | | | | | | | | | | | | | | | | | | |
Less Distributions: | | | | | | | | | | | | | | | | | | | | |
From investment income | | | (0.67 | ) | | | (0.61 | ) | | | (0.34 | ) | | | (0.63 | ) | | | (0.43 | ) |
| | | | | | | | | | | | | | | | | | | | |
Total Distributions | | | (0.67 | ) | | | (0.61 | ) | | | (0.34 | ) | | | (0.63 | ) | | | (0.43 | ) |
| | | | | | | | | | | | | | | | | | | | |
Net Increase/(Decrease) in Net Asset Value | | | 1.02 | | | | (0.77 | ) | | | (1.45 | ) | | | (0.58 | ) | | | 0.82 | |
| | | | | | | | | | | | | | | | | | | | |
Net Asset Value, End of Period | | $ | 13.13 | | | $ | 12.11 | | | $ | 12.88 | | | $ | 14.33 | | | $ | 14.91 | |
| | | | | | | | | | | | | | | | | | | | |
Total Return | | | 14.07 | % | | | (1.23 | )% | | | (7.90 | )% | | | 0.29 | % | | | 8.98 | % |
Ratios/Supplemental Data: | | | | | | | | | | | | | | | | | | | | |
Net assets, End of Period (in 000s) | | $ | 3,466 | | | $ | 3,843 | | | $ | 1,607 | | | $ | 2,827 | | | $ | 3,323 | |
Ratios to Average Net Assets: | | | | | | | | | | | | | | | | | | | | |
Net investment income including expense paid directly by the advisor | | | 5.17 | % | | | 2.54 | % | | | 2.07 | % | | | 4.18 | % | | | 2.82 | % |
Operating expenses including expense paid directly by the advisor(d) | | | 0.82 | % | | | 0.83 | %(e) | | | 1.01 | % | | | 0.82 | % | | | 0.79 | % |
Net investment income excluding expense paid directly by the advisor | | | 4.89 | % | | | 2.09 | % | | | 1.97 | % | | | 4.08 | % | | | 2.72 | % |
Operating expenses excluding expense paid directly by the advisor(d) | | | 1.10 | % | | | 1.28 | % | | | 1.11 | % | | | 0.92 | % | | | 0.89 | % |
Portfolio Turnover Rate | | | 61 | % | | | 100 | % | | | 52 | % | | | 62 | % | | | 83 | % |
(a) Prior to May 1, 2016, Salient Adaptive Balanced Fund was known as Forward Growth Allocation Fund.
(b) The information for the fiscal year ended December 31, 2015 has been audited by KPMG LLP, independent registered public accounting firm. The information for prior periods has been audited by the predecessor independent registered public accounting firm.
(c) Per share amounts are based upon average shares outstanding.
(d) Excludes expenses of the affiliated funds in which the Fund invests.
(e) Effective January 22, 2016, the Advisor agreed to limit expenses to 0.82%.
| | | | |
| See accompanying Notes to Financial Statements. | | 80 | | |
Financial Highlights
For a share outstanding throughout the periods presented.
Salient Adaptive Balanced Fund(a)
| | | | | | | | | | | | | | | | | | | | |
| | | Institutional Class | |
| | | Year Ended
December 31,
2017 | | | Year Ended
December 31,
2016 | | | Year Ended
December 31,
2015(b) | | | Year Ended
December 31,
2014 | | | Year Ended
December 31,
2013 | |
Net Asset Value, Beginning of Period | | $ | 12.11 | | | $ | 12.87 | | | $ | 14.33 | | | $ | 14.91 | | | $ | 14.09 | |
Income/(Loss) from Operations: | | | | | | | | | | | | | | | | | | | | |
Net investment income(c) | | | 0.34 | | | | 0.38 | | | | 0.40 | | | | 0.64 | | | | 0.56 | |
Net realized and unrealized gain/(loss) on investments | | | 1.41 | | | | (0.47 | ) | | | (1.45 | ) | | | (0.51 | ) | | | 0.77 | |
| | | | | | | | | | | | | | | | | | | | |
Total from Investment Operations | | | 1.75 | | | | (0.09 | ) | | | (1.05 | ) | | | 0.13 | | | | 1.33 | |
| | | | | | | | | | | | | | | | | | | | |
Less Distributions: | | | | | | | | | | | | | | | | | | | | |
From investment income | | | (0.74 | ) | | | (0.67 | ) | | | (0.41 | ) | | | (0.71 | ) | | | (0.51 | ) |
| | | | | | | | | | | | | | | | | | | | |
Total Distributions | | | (0.74 | ) | | | (0.67 | ) | | | (0.41 | ) | | | (0.71 | ) | | | (0.51 | ) |
| | | | | | | | | | | | | | | | | | | | |
Net Increase/(Decrease) in Net Asset Value | | | 1.01 | | | | (0.76 | ) | | | (1.46 | ) | | | (0.58 | ) | | | 0.82 | |
| | | | | | | | | | | | | | | | | | | | |
Net Asset Value, End of Period | | $ | 13.12 | | | $ | 12.11 | | | $ | 12.87 | | | $ | 14.33 | | | $ | 14.91 | |
| | | | | | | | | | | | | | | | | | | | |
Total Return | | | 14.61 | % | | | (0.68 | )% | | | (7.45 | )% | | | 0.80 | % | | | 9.54 | % |
Ratios/Supplemental Data: | | | | | | | | | | | | | | | | | | | | |
Net assets, End of Period (in 000s) | | $ | 5,176 | | | $ | 11,994 | | | $ | 9,541 | | | $ | 11,170 | | | $ | 18,203 | |
Ratios to Average Net Assets: | | | | | | | | | | | | | | | | | | | | |
Net investment income including expense paid directly by the advisor | | | 2.66 | % | | | 2.98 | % | | | 2.83 | % | | | 4.21 | % | | | 3.78 | % |
Operating expenses including expense paid directly by the advisor(d) | | | 0.32 | % | | | 0.34 | %(e) | | | 0.53 | % | | | 0.32 | % | | | 0.28 | % |
Net investment income excluding expense paid directly by the advisor | | | 2.39 | % | | | 2.53 | % | | | 2.73 | % | | | 4.11 | % | | | 3.68 | % |
Operating expenses excluding expense paid directly by the advisor(d) | | | 0.59 | % | | | 0.79 | % | | | 0.63 | % | | | 0.42 | % | | | 0.38 | % |
Portfolio Turnover Rate | | | 61 | % | | | 100 | % | | | 52 | % | | | 62 | % | | | 83 | % |
(a) Prior to May 1, 2016, Salient Adaptive Balanced Fund was known as Forward Growth Allocation Fund.
(b) The information for the fiscal year ended December 31, 2015 has been audited by KPMG LLP, independent registered public accounting firm. The information for prior periods has been audited by the predecessor independent registered public accounting firm.
(c) Per share amounts are based upon average shares outstanding.
(d) Excludes expenses of the affiliated funds in which the Fund invests.
(e) Effective January 22, 2016, the Advisor agreed to limit expenses to 0.32%.
| | | | |
| See accompanying Notes to Financial Statements. | | 81 | | |
Financial Highlights
For a share outstanding throughout the periods presented.
Salient Adaptive Balanced Fund(a)
| | | | | | | | | | | | | | | | | | | | |
| | | Class A | |
| | | Year Ended
December 31,
2017 | | | Year Ended
December 31,
2016 | | | Year Ended
December 31,
2015(b) | | | Year Ended
December 31,
2014 | | | Year Ended
December 31,
2013 | |
Net Asset Value, Beginning of Period | | $ | 12.10 | | | $ | 12.87 | | | $ | 14.32 | | | $ | 14.90 | | | $ | 14.08 | |
Income/(Loss) from Operations: | | | | | | | | | | | | | | | | | | | | |
Net investment income(c) | | | 0.69 | | | | 0.32 | | | | 0.31 | | | | 0.65 | | | | 0.46 | |
Net realized and unrealized gain/(loss) on investments | | | 1.02 | | | | (0.46 | ) | | | (1.40 | ) | | | (0.57 | ) | | | 0.81 | |
| | | | | | | | | | | | | | | | | | | | |
Total from Investment Operations | | | 1.71 | | | | (0.14 | ) | | | (1.09 | ) | | | 0.08 | | | | 1.27 | |
| | | | | | | | | | | | | | | | | | | | |
Less Distributions: | | | | | | | | | | | | | | | | | | | | |
From investment income | | | (0.69 | ) | | | (0.63 | ) | | | (0.36 | ) | | | (0.66 | ) | | | (0.45 | ) |
| | | | | | | | | | | | | | | | | | | | |
Total Distributions | | | (0.69 | ) | | | (0.63 | ) | | | (0.36 | ) | | | (0.66 | ) | | | (0.45 | ) |
| | | | | | | | | | | | | | | | | | | | |
Net Increase/(Decrease) in Net Asset Value | | | 1.02 | | | | (0.77 | ) | | | (1.45 | ) | | | (0.58 | ) | | | 0.82 | |
| | | | | | | | | | | | | | | | | | | | |
Net Asset Value, End of Period | | $ | 13.12 | | | $ | 12.10 | | | $ | 12.87 | | | $ | 14.32 | | | $ | 14.90 | |
| | | | | | | | | | | | | | | | | | | | |
Total Return(d) | | | 14.26 | % | | | (1.10 | )% | | | (7.73 | )% | | | 0.44 | % | | | 9.15 | % |
Ratios/Supplemental Data: | | | | | | | | | | | | | | | | | | | | |
Net assets, End of Period (in 000s) | | $ | 10,096 | | | $ | 11,123 | | | $ | 5,365 | | | $ | 7,933 | | | $ | 10,058 | |
Ratios to Average Net Assets: | | | | | | | | | | | | | | | | | | | | |
Net investment income including expense paid directly by the advisor | | | 5.43 | % | | | 2.56 | % | | | 2.18 | % | | | 4.28 | % | | | 3.12 | % |
Operating expenses including expense paid directly by the advisor(e) | | | 0.67 | % | | | 0.68 | %(f) | | | 0.86 | % | | | 0.67 | % | | | 0.64 | % |
Net investment income excluding expense paid directly by the advisor | | | 5.15 | % | | | 2.10 | % | | | 2.08 | % | | | 4.18 | % | | | 3.02 | % |
Operating expenses excluding expense paid directly by the advisor(e) | | | 0.95 | % | | | 1.14 | % | | | 0.96 | % | | | 0.77 | % | | | 0.74 | % |
Portfolio Turnover Rate | | | 61 | % | | | 100 | % | | | 52 | % | | | 62 | % | | | 83 | % |
(a) Prior to May 1, 2016, Salient Adaptive Balanced Fund was known as Forward Growth Allocation Fund.
(b) The information for the fiscal year ended December 31, 2015 has been audited by KPMG LLP, independent registered public accounting firm. The information for prior periods has been audited by the predecessor independent registered public accounting firm.
(c) Per share amounts are based upon average shares outstanding.
(d) Total return does not reflect the effect of sales charges.
(e) Excludes expenses of the affiliated funds in which the Fund invests.
(f) Effective January 22, 2016, the Advisor agreed to limit expenses to 0.67%.
| | | | |
| See accompanying Notes to Financial Statements. | | 82 | | |
Financial Highlights
For a share outstanding throughout the periods presented.
Salient Adaptive Balanced Fund(a)
| | | | | | | | | | | | | | | | | | | | |
| | | Class C | |
| | | Year Ended
December 31,
2017 | | | Year Ended
December 31,
2016 | | | Year Ended
December 31,
2015(b) | | | Year Ended
December 31,
2014 | | | Year Ended
December 31,
2013 | |
Net Asset Value, Beginning of Period | | $ | 11.99 | | | $ | 12.76 | | | $ | 14.20 | | | $ | 14.78 | | | $ | 13.96 | |
Income/(Loss) from Operations: | | | | | | | | | | | | | | | | | | | | |
Net investment income(c) | | | 0.58 | | | | 0.21 | | | | 0.22 | | | | 0.53 | | | | 0.34 | |
Net realized and unrealized gain/(loss) on investments | | | 1.03 | | | | (0.43 | ) | | | (1.39 | ) | | | (0.56 | ) | | | 0.84 | |
| | | | | | | | | | | | | | | | | | | | |
Total from Investment Operations | | | 1.61 | | | | (0.22 | ) | | | (1.17 | ) | | | (0.03 | ) | | | 1.18 | |
| | | | | | | | | | | | | | | | | | | | |
Less Distributions: | | | | | | | | | | | | | | | | | | | | |
From investment income | | | (0.61 | ) | | | (0.55 | ) | | | (0.27 | ) | | | (0.55 | ) | | | (0.36 | ) |
| | | | | | | | | | | | | | | | | | | | |
Total Distributions | | | (0.61 | ) | | | (0.55 | ) | | | (0.27 | ) | | | (0.55 | ) | | | (0.36 | ) |
| | | | | | | | | | | | | | | | | | | | |
Net Increase/(Decrease) in Net Asset Value | | | 1.00 | | | | (0.77 | ) | | | (1.44 | ) | | | (0.58 | ) | | | 0.82 | |
| | | | | | | | | | | | | | | | | | | | |
Net Asset Value, End of Period | | $ | 12.99 | | | $ | 11.99 | | | $ | 12.76 | | | $ | 14.20 | | | $ | 14.78 | |
| | | | | | | | | | | | | | | | | | | | |
Total Return(d) | | | 13.46 | % | | | (1.73 | )% | | | (8.36 | )% | | | (0.23 | )% | | | 8.49 | % |
Ratios/Supplemental Data: | | | | | | | | | | | | | | | | | | | | |
Net assets, End of Period (in 000s) | | $ | 8,463 | | | $ | 9,463 | | | $ | 5,238 | | | $ | 7,576 | | | $ | 10,881 | |
Ratios to Average Net Assets: | | | | | | | | | | | | | | | | | | | | |
Net investment income including expense paid directly by the advisor | | | 4.60 | % | | | 1.71 | % | | | 1.56 | % | | | 3.53 | % | | | 2.30 | % |
Operating expenses including expense paid directly by the advisor(e) | | | 1.32 | % | | | 1.33 | %(f) | | | 1.51 | % | | | 1.32 | % | | | 1.29 | % |
Net investment income excluding expense paid directly by the advisor | | | 4.32 | % | | | 1.25 | % | | | 1.46 | % | | | 3.43 | % | | | 2.20 | % |
Operating expenses excluding expense paid directly by the advisor(e) | | | 1.60 | % | | | 1.79 | % | | | 1.61 | % | | | 1.42 | % | | | 1.39 | % |
Portfolio Turnover Rate | | | 61 | % | | | 100 | % | | | 52 | % | | | 62 | % | | | 83 | % |
(a) Prior to May 1, 2016, Salient Adaptive Balanced Fund was known as Forward Growth Allocation Fund.
(b) The information for the fiscal year ended December 31, 2015 has been audited by KPMG LLP, independent registered public accounting firm. The information for prior periods has been audited by the predecessor independent registered public accounting firm.
(c) Per share amounts are based upon average shares outstanding.
(d) Total return does not reflect the effect of sales charges.
(e) Excludes expenses of the affiliated funds in which the Fund invests.
(f) Effective January 22, 2016, the Advisor agreed to limit expenses to 1.32%.
| | | | |
| See accompanying Notes to Financial Statements. | | 83 | | |
Financial Highlights
For a share outstanding throughout the periods presented.
Salient Adaptive Income Fund(a)
| | | | | | | | | | | | | | | | | | | | |
| | | Investor Class | |
| | | Year Ended
December 31,
2017 | | | Year Ended
December 31,
2016 | | | Year Ended
December 31,
2015(b) | | | Year Ended
December 31,
2014 | | | Year Ended
December 31,
2013 | |
Net Asset Value, Beginning of Period | | $ | 13.24 | | | $ | 12.94 | | | $ | 14.60 | | | $ | 15.34 | | | $ | 15.33 | |
Income/(Loss) from Operations: | | | | | | | | | | | | | | | | | | | | |
Net investment income(c) | | | 0.56 | | | | 0.47 | | | | 0.56 | | | | 0.77 | | | | 0.70 | |
Net realized and unrealized gain/(loss) on investments | | | 0.63 | | | | 0.34 | | | | (1.66 | ) | | | (0.10 | ) | | | 0.03 | |
| | | | | | | | | | | | | | | | | | | | |
Total from Investment Operations | | | 1.19 | | | | 0.81 | | | | (1.10 | ) | | | 0.67 | | | | 0.73 | |
| | | | | | | | | | | | | | | | | | | | |
Less Distributions: | | | | | | | | | | | | | | | | | | | | |
From investment income | | | (0.57 | ) | | | (0.47 | ) | | | (0.56 | ) | | | (0.76 | ) | | | (0.67 | ) |
From capital gains | | | — | | | | — | | | | — | | | | (0.65 | ) | | | (0.05 | ) |
From return of capital | | | (0.03 | ) | | | (0.04 | ) | | | — | | | | — | | | | — | |
| | | | | | | | | | | | | | | | | | | | |
Total Distributions | | | (0.60 | ) | | | (0.51 | ) | | | (0.56 | ) | | | (1.41 | ) | | | (0.72 | ) |
| | | | | | | | | | | | | | | | | | | | |
Net Increase/(Decrease) in Net Asset Value | | | 0.59 | | | | 0.30 | | | | (1.66 | ) | | | (0.74 | ) | | | 0.01 | |
| | | | | | | | | | | | | | | | | | | | |
Net Asset Value, End of Period | | $ | 13.83 | | | $ | 13.24 | | | $ | 12.94 | | | $ | 14.60 | | | $ | 15.34 | |
| | | | | | | | | | | | | | | | | | | | |
Total Return | | | 9.13 | % | | | 6.39 | % | | | (7.76 | )% | | | 4.34 | % | | | 4.80 | % |
Ratios/Supplemental Data: | | | | | | | | | | | | | | | | | | | | |
Net assets, End of Period (in 000s) | | $ | 1,329 | | | $ | 1,652 | | | $ | 1,414 | | | $ | 2,326 | | | $ | 1,867 | |
Ratios to Average Net Assets: | | | | | | | | | | | | | | | | | | | | |
Net investment income including expense paid directly by the advisor | | | 4.09 | % | | | 3.62 | % | | | 3.94 | % | | | 4.94 | % | | | 4.50 | % |
Operating expenses including expense paid directly by the advisor(d) | | | 0.51 | % | | | 0.86 | %(e) | | | 0.89 | % | | | 0.96 | %(f) | | | 0.99 | %(g) |
Net investment income excluding expense paid directly by the advisor | | | 3.02 | % | | | 2.70 | % | | | 3.44 | % | | | 4.72 | % | | | 4.43 | % |
Operating expenses excluding expense paid directly by the advisor(d) | | | 1.58 | % | | | 1.78 | % | | | 1.39 | % | | | 1.18 | % | | | 1.06 | % |
Portfolio Turnover Rate | | | 140 | % | | | 127 | % | | | 212 | % | | | 191 | % | | | 95 | % |
(a) Prior to May 1, 2016, Salient Adaptive Income Fund was known as Forward Income Builder Fund.
(b) The information for the fiscal year ended December 31, 2015 has been audited by KPMG LLP, independent registered public accounting firm. The information for prior periods has been audited by the predecessor independent registered public accounting firm.
(c) Per share amounts are based upon average shares outstanding.
(d) Excludes expenses of the affiliated funds in which the Fund invests.
(e) Effective December 1, 2016, the annual expense limitation rate changed from 0.89% to 0.51%.
(f) Effective October 1, 2014, the annual expense limitation rate changed from 0.99% to 0.89%.
(g) Effective May 1, 2013, the Advisor agreed to limit expenses at 0.99%.
| | | | |
| See accompanying Notes to Financial Statements. | | 84 | | |
Financial Highlights
For a share outstanding throughout the periods presented.
Salient Adaptive Income Fund(a)
| | | | | | | | | | | | | | | | | | | | |
| | | Institutional Class | |
| | | Year Ended
December 31,
2017 | | | Year Ended
December 31,
2016 | | | Year Ended
December 31,
2015(b) | | | Year Ended
December 31,
2014 | | | Year Ended
December 31,
2013 | |
Net Asset Value, Beginning of Period | | $ | 13.28 | | | $ | 12.96 | | | $ | 14.62 | | | $ | 15.36 | | | $ | 15.35 | |
Income/(Loss) from Operations: | | | | | | | | | | | | | | | | | | | | |
Net investment income(c) | | | 0.65 | | | | 0.55 | | | | 0.64 | | | | 0.73 | | | | 0.72 | |
Net realized and unrealized gain/(loss) on investments | | | 0.61 | | | | 0.32 | | | | (1.67 | ) | | | 0.01 | | | | 0.08 | |
| | | | | | | | | | | | | | | | | | | | |
Total from Investment Operations | | | 1.26 | | | | 0.87 | | | | (1.03 | ) | | | 0.74 | | | | 0.80 | |
| | | | | | | | | | | | | | | | | | | | |
Less Distributions: | | | | | | | | | | | | | | | | | | | | |
From investment income | | | (0.63 | ) | | | (0.51 | ) | | | (0.63 | ) | | | (0.83 | ) | | | (0.74 | ) |
From capital gains | | | — | | | | — | | | | — | | | | (0.65 | ) | | | (0.05 | ) |
From return of capital | | | (0.03 | ) | | | (0.04 | ) | | | — | | | | — | | | | — | |
| | | | | | | | | | | | | | | | | | | | |
Total Distributions | | | (0.66 | ) | | | (0.55 | ) | | | (0.63 | ) | | | (1.48 | ) | | | (0.79 | ) |
| | | | | | | | | | | | | | | | | | | | |
Net Increase/(Decrease) in Net Asset Value | | | 0.60 | | | | 0.32 | | | | (1.66 | ) | | | (0.74 | ) | | | 0.01 | |
| | | | | | | | | | | | | | | | | | | | |
Net Asset Value, End of Period | | $ | 13.88 | | | $ | 13.28 | | | $ | 12.96 | | | $ | 14.62 | | | $ | 15.36 | |
| | | | | | | | | | | | | | | | | | | | |
Total Return | | | 9.70 | % | | | 6.92 | % | | | (7.27 | )% | | | 4.83 | % | | | 5.34 | % |
Ratios/Supplemental Data: | | | | | | | | | | | | | | | | | | | | |
Net assets, End of Period (in 000s) | | $ | 3,681 | | | $ | 3,534 | | | $ | 2,893 | | | $ | 4,376 | | | $ | 8,568 | |
Ratios to Average Net Assets: | | | | | | | | | | | | | | | | | | | | |
Net investment income including expense paid directly by the advisor | | | 4.76 | % | | | 4.23 | % | | | 4.51 | % | | | 4.63 | % | | | 4.62 | % |
Operating expenses including expense paid directly by the advisor(d) | | | 0.01 | % | | | 0.36 | %(e) | | | 0.39 | % | | | 0.47 | %(f) | | | 0.49 | %(g) |
Net investment income excluding expense paid directly by the advisor | | | 3.69 | % | | | 3.31 | % | | | 4.00 | % | | | 4.44 | % | | | 4.55 | % |
Operating expenses excluding expense paid directly by the advisor(d) | | | 1.08 | % | | | 1.28 | % | | | 0.90 | % | | | 0.66 | % | | | 0.56 | % |
Portfolio Turnover Rate | | | 140 | % | | | 127 | % | | | 212 | % | | | 191 | % | | | 95 | % |
(a) Prior to May 1, 2016, Salient Adaptive Income Fund was known as Forward Income Builder Fund.
(b) The information for the fiscal year ended December 31, 2015 has been audited by KPMG LLP, independent registered public accounting firm. The information for prior periods has been audited by the predecessor independent registered public accounting firm.
(c) Per share amounts are based upon average shares outstanding.
(d) Excludes expenses of the affiliated funds in which the Fund invests.
(e) Effective December 1, 2016, the annual expense limitation rate changed from 0.39% to 0.01%.
(f) Effective October 1, 2014, the annual expense limitation rate changed from 0.49% to 0.39%.
(g) Effective May 1, 2013, the Advisor agreed to limit expenses at 0.49%.
| | | | |
| See accompanying Notes to Financial Statements. | | 85 | | |
Financial Highlights
For a share outstanding throughout the periods presented.
Salient Adaptive Income Fund(a)
| | | | | | | | | | | | | | | | | | | | |
| | | Class A | |
| | | Year Ended
December 31,
2017 | | | Year Ended
December 31,
2016 | | | Year Ended
December 31,
2015(b) | | | Year Ended
December 31,
2014 | | | Year Ended
December 31,
2013 | |
Net Asset Value, Beginning of Period | | $ | 13.26 | | | $ | 12.95 | | | $ | 14.61 | | | $ | 15.35 | | | $ | 15.34 | |
Income/(Loss) from Operations: | | | | | | | | | | | | | | | | | | | | |
Net investment income(c) | | | 0.60 | | | | 0.53 | | | | 0.63 | | | | 0.82 | | | | 0.84 | |
Net realized and unrealized gain/(loss) on investments | | | 0.63 | | | | 0.31 | | | | (1.70 | ) | | | (0.11 | ) | | | (0.07 | ) |
| | | | | | | | | | | | | | | | | | | | |
Total from Investment Operations | | | 1.23 | | | | 0.84 | | | | (1.07 | ) | | | 0.71 | | | | 0.77 | |
| | | | | | | | | | | | | | | | | | | | |
Less Distributions: | | | | | | | | | | | | | | | | | | | | |
From investment income | | | (0.60 | ) | | | (0.49 | ) | | | (0.59 | ) | | | (0.80 | ) | | | (0.71 | ) |
From capital gains | | | — | | | | — | | | | — | | | | (0.65 | ) | | | (0.05 | ) |
From return of capital | | | (0.03 | ) | | | (0.04 | ) | | | — | | | | — | | | | — | |
| | | | | | | | | | | | | | | | | | | | |
Total Distributions | | | (0.63 | ) | | | (0.53 | ) | | | (0.59 | ) | | | (1.45 | ) | | | (0.76 | ) |
| | | | | | | | | | | | | | | | | | | | |
Net Increase/(Decrease) in Net Asset Value | | | 0.60 | | | | 0.31 | | | | (1.66 | ) | | | (0.74 | ) | | | 0.01 | |
| | | | | | | | | | | | | | | | | | | | |
Net Asset Value, End of Period | | $ | 13.86 | | | $ | 13.26 | | | $ | 12.95 | | | $ | 14.61 | | | $ | 15.35 | |
| | | | | | | | | | | | | | | | | | | | |
Total Return(d) | | | 9.38 | % | | | 6.73 | % | | | (7.52 | )% | | | 4.58 | % | | | 5.10 | % |
Ratios/Supplemental Data: | | | | | | | | | | | | | | | | | | | | |
Net assets, End of Period (in 000s) | | $ | 3,143 | | | $ | 3,441 | | | $ | 1,602 | | | $ | 1,958 | | | $ | 2,817 | |
Ratios to Average Net Assets: | | | | | | | | | | | | | | | | | | | | |
Net investment income including expense paid directly by the advisor | | | 4.41 | % | | | 4.06 | % | | | 4.44 | % | | | 5.26 | % | | | 5.42 | % |
Operating expenses including expense paid directly by the advisor(e) | | | 0.26 | % | | | 0.61 | %(f) | | | 0.64 | % | | | 0.71 | %(g) | | | 0.74 | %(h) |
Net investment income excluding expense paid directly by the advisor | | | 3.34 | % | | | 3.14 | % | | | 3.91 | % | | | 5.04 | % | | | 5.35 | % |
Operating expenses excluding expense paid directly by the advisor(e) | | | 1.33 | % | | | 1.53 | % | | | 1.17 | % | | | 0.93 | % | | | 0.81 | % |
Portfolio Turnover Rate | | | 140 | % | | | 127 | % | | | 212 | % | | | 191 | % | | | 95 | % |
(a) Prior to May 1, 2016, Salient Adaptive Income Fund was known as Forward Income Builder Fund.
(b) The information for the fiscal year ended December 31, 2015 has been audited by KPMG LLP, independent registered public accounting firm. The information for prior periods has been audited by the predecessor independent registered public accounting firm.
(c) Per share amounts are based upon average shares outstanding.
(d) Total return does not reflect the effect of sales charges.
(e) Excludes expenses of the affiliated funds in which the Fund invests.
(f) Effective December 1, 2016, the annual expense limitation rate changed from 0.64% to 0.26%.
(g) Effective October 1, 2014, the annual expense limitation rate changed from 0.74% to 0.64%.
(h) Effective May 1, 2013, the Advisor agreed to limit expenses at 0.74%.
| | | | |
| See accompanying Notes to Financial Statements. | | 86 | | |
Financial Highlights
For a share outstanding throughout the periods presented.
Salient Adaptive Income Fund(a)
| | | | | | | | | | | | | | | | | | | | |
| | | Class C | |
| | | Year Ended
December 31,
2017 | | | Year Ended
December 31,
2016 | | | Year Ended
December 31,
2015(b) | | | Year Ended
December 31,
2014 | | | Year Ended
December 31,
2013 | |
Net Asset Value, Beginning of Period | | $ | 13.16 | | | $ | 12.89 | | | $ | 14.54 | | | $ | 15.29 | | | $ | 15.30 | |
Income/(Loss) from Operations: | | | | | | | | | | | | | | | | | | | | |
Net investment income(c) | | | 0.48 | | | | 0.40 | | | | 0.46 | | | | 0.71 | | | | 0.62 | |
Net realized and unrealized gain/(loss) on investments | | | 0.64 | | | | 0.33 | | | | (1.62 | ) | | | (0.11 | ) | | | 0.02 | |
| | | | | | | | | | | | | | | | | | | | |
Total from Investment Operations | | | 1.12 | | | | 0.73 | | | | (1.16 | ) | | | 0.60 | | | | 0.64 | |
| | | | | | | | | | | | | | | | | | | | |
Less Distributions: | | | | | | | | | | | | | | | | | | | | |
From investment income | | | (0.51 | ) | | | (0.42 | ) | | | (0.49 | ) | | | (0.70 | ) | | | (0.60 | ) |
From capital gains | | | — | | | | — | | | | — | | | | (0.65 | ) | | | (0.05 | ) |
From return of capital | | | (0.03 | ) | | | (0.04 | ) | | | — | | | | — | | | | — | |
| | | | | | | | | | | | | | | | | | | | |
Total Distributions | | | (0.54 | ) | | | (0.46 | ) | | | (0.49 | ) | | | (1.35 | ) | | | (0.65 | ) |
| | | | | | | | | | | | | | | | | | | | |
Net Increase/(Decrease) in Net Asset Value | | | 0.58 | | | | 0.27 | | | | (1.65 | ) | | | (0.75 | ) | | | (0.01 | ) |
| | | | | | | | | | | | | | | | | | | | |
Net Asset Value, End of Period | | $ | 13.74 | | | $ | 13.16 | | | $ | 12.89 | | | $ | 14.54 | | | $ | 15.29 | |
| | | | | | | | | | | | | | | | | | | | |
Total Return(d) | | | 8.52 | % | | | 5.88 | % | | | (8.18 | )% | | | 3.86 | % | | | 4.28 | % |
Ratios/Supplemental Data: | | | | | | | | | | | | | | | | | | | | |
Net assets, End of Period (in 000s) | | $ | 4,168 | | | $ | 4,517 | | | $ | 4,050 | | | $ | 7,768 | | | $ | 6,971 | |
Ratios to Average Net Assets: | | | | | | | | | | | | | | | | | | | | |
Net investment income including expense paid directly by the advisor | | | 3.55 | % | | | 3.06 | % | | | 3.24 | % | | | 4.54 | % | | | 4.04 | % |
Operating expenses including expense paid directly by the advisor(e) | | | 1.01 | % | | | 1.36 | %(f) | | | 1.39 | % | | | 1.46 | %(g) | | | 1.48 | %(h) |
Net investment income excluding expense paid directly by the advisor | | | 2.48 | % | | | 2.14 | % | | | 2.75 | % | | | 4.32 | % | | | 3.96 | % |
Operating expenses excluding expense paid directly by the advisor(e) | | | 2.08 | % | | | 2.28 | % | | | 1.88 | % | | | 1.68 | % | | | 1.56 | % |
Portfolio Turnover Rate | | | 140 | % | | | 127 | % | | | 212 | % | | | 191 | % | | | 95 | % |
(a) Prior to May 1, 2016, Salient Adaptive Income Fund was known as Forward Income Builder Fund.
(b) The information for the fiscal year ended December 31, 2015 has been audited by KPMG LLP, independent registered public accounting firm. The information for prior periods has been audited by the predecessor independent registered public accounting firm.
(c) Per share amounts are based upon average shares outstanding.
(d) Total return does not reflect the effect of sales charges.
(e) Excludes expenses of the affiliated funds in which the Fund invests.
(f) Effective December 1, 2016, the annual expense limitation rate changed from 1.39% to 1.01%.
(g) Effective October 1, 2014, the annual expense limitation rate changed from 1.49% to 1.39%.
(h) Effective May 1, 2013, the Advisor agreed to limit expenses at 1.49%.
| | | | |
| See accompanying Notes to Financial Statements. | | 87 | | |
Financial Highlights
For a share outstanding throughout the periods presented.
Salient Adaptive US Equity Fund(a)
| | | | | | | | | | | | | | | | | | | | |
| | | Investor Class | |
| | | Year Ended
December 31,
2017 | | | Year Ended
December 31,
2016 | | | Year Ended
December 31,
2015(b) | | | Year Ended
December 31,
2014 | | | Year Ended
December 31,
2013 | |
Net Asset Value, Beginning of Period | | $ | 32.07 | | | $ | 32.02 | | | $ | 37.07 | | | $ | 34.98 | | | $ | 26.74 | |
Income/(Loss) from Operations: | | | | | | | | | | | | | | | | | | | | |
Net investment income/(loss)(c) | | | 0.09 | | | | 0.35 | | | | (0.08 | )(d) | | | (0.16 | ) | | | (0.13 | ) |
Net realized and unrealized gain/(loss) on investments | | | 7.53 | | | | 2.65 | | | | (0.30 | ) | | | 4.04 | | | | 8.37 | |
| | | | | | | | | | | | | | | | | | | | |
Total from Investment Operations | | | 7.62 | | | | 3.00 | | | | (0.38 | ) | | | 3.88 | | | | 8.24 | |
| | | | | | | | | | | | | | | | | | | | |
Less Distributions: | | | | | | | | | | | | | | | | | | | | |
From investment income | | | (0.14 | ) | | | (0.35 | ) | | | — | | | | — | | | | — | |
From capital gains | | | (4.55 | ) | | | (2.60 | ) | | | (4.67 | ) | | | (1.79 | ) | | | — | |
| | | | | | | | | | | | | | | | | | | | |
Total Distributions | | | (4.69 | ) | | | (2.95 | ) | | | (4.67 | ) | | | (1.79 | ) | | | — | |
| | | | | | | | | | | | | | | | | | | | |
Net Increase/(Decrease) in Net Asset Value | | | 2.93 | | | | 0.05 | | | | (5.05 | ) | | | 2.09 | | | | 8.24 | |
| | | | | | | | | | | | | | | | | | | | |
Net Asset Value, End of Period | | $ | 35.00 | | | $ | 32.07 | | | $ | 32.02 | | | $ | 37.07 | | | $ | 34.98 | |
| | | | | | | | | | | | | | | | | | | | |
Total Return | | | 23.97 | % | | | 9.41 | % | | | (1.24 | )% | | | 11.14 | % | | | 30.88 | % |
Ratios/Supplemental Data: | | | | | | | | | | | | | | | | | | | | |
Net assets, End of Period (in 000s) | | $ | 1,884 | | | $ | 1,700 | | | $ | 2,056 | | | $ | 1,976 | | | $ | 1,828 | |
Ratios to Average Net Assets: | | | | | | | | | | | | | | | | | | | | |
Net investment income/(loss) | | | 0.26 | % | | | 1.07 | % | | | (0.22 | )% | | | (0.45 | )% | | | (0.43 | )% |
Operating expenses including reimbursement/waiver | | | 1.25 | % | | | 1.25 | % | | | 1.25 | % | | | 1.25 | % | | | 1.25 | % |
Operating expenses excluding reimbursement/waiver | | | 1.69 | % | | | 1.72 | % | | | 1.60 | % | | | 1.50 | % | | | 1.42 | % |
Portfolio Turnover Rate | | | 196 | % | | | 359 | % | | | 42 | % | | | 53 | % | | | 218 | % |
(a) Prior to May 1, 2016, Salient Adaptive US Equity Fund was known as Forward Total MarketPlus Fund. Prior to May 1, 2013, Forward Total MarketPlus Fund was known as Forward Extended MarketPlus Fund.
(b) The information for the fiscal year ended December 31, 2015 has been audited by KPMG LLP, independent registered public accounting firm. The information for prior periods has been audited by the predecessor independent registered public accounting firm.
(c) Per share amounts are based upon average shares outstanding.
(d) The amount shown for a share outstanding throughout the period may not correlate with the Statement of Operations for the period due to the timing of sales and redemptions of Fund shares in relation to income earned and/or fluctuating market value of the investments of the Fund.
| | | | |
| See accompanying Notes to Financial Statements. | | 88 | | |
Financial Highlights
For a share outstanding throughout the periods presented.
Salient Adaptive US Equity Fund(a)
| | | | | | | | | | | | | | | | | | | | |
| | | Institutional Class | |
| | | Year Ended
December 31,
2017 | | | Year Ended
December 31,
2016 | | | Year Ended
December 31,
2015(b) | | | Year Ended
December 31,
2014 | | | Year Ended
December 31,
2013 | |
Net Asset Value, Beginning of Period | | $ | 35.26 | | | $ | 34.92 | | | $ | 39.91 | | | $ | 37.39 | | | $ | 28.47 | |
Income/(Loss) from Operations: | | | | | | | | | | | | | | | | | | | | |
Net investment income/(loss)(c) | | | 0.28 | | | | 0.57 | | | | 0.05 | | | | (0.04 | ) | | | (0.04 | ) |
Net realized and unrealized gain/(loss) on investments | | | 8.29 | | | | 2.86 | | | | (0.33 | ) | | | 4.35 | | | | 8.96 | |
| | | | | | | | | | | | | | | | | | | | |
Total from Investment Operations | | | 8.57 | | | | 3.43 | | | | (0.28 | ) | | | 4.31 | | | | 8.92 | |
| | | | | | | | | | | | | | | | | | | | |
Less Distributions: | | | | | | | | | | | | | | | | | | | | |
From investment income | | | (0.29 | ) | | | (0.49 | ) | | | (0.04 | ) | | | — | | | | — | |
From capital gains | | | (4.55 | ) | | | (2.60 | ) | | | (4.67 | ) | | | (1.79 | ) | | | — | |
| | | | | | | | | | | | | | | | | | | | |
Total Distributions | | | (4.84 | ) | | | (3.09 | ) | | | (4.71 | ) | | | (1.79 | ) | | | — | |
| | | | | | | | | | | | | | | | | | | | |
Net Increase/(Decrease) in Net Asset Value | | | 3.73 | | | | 0.34 | | | | (4.99 | ) | | | 2.52 | | | | 8.92 | |
| | | | | | | | | | | | | | | | | | | | |
Net Asset Value, End of Period | | $ | 38.99 | | | $ | 35.26 | | | $ | 34.92 | | | $ | 39.91 | | | $ | 37.39 | |
| | | | | | | | | | | | | | | | | | | | |
Total Return | | | 24.50 | % | | | 9.87 | % | | | (0.89 | )% | | | 11.55 | % | | | 31.33 | % |
Ratios/Supplemental Data: | | | | | | | | | | | | | | | | | | | | |
Net assets, End of Period (in 000s) | | $ | 15,583 | | | $ | 9,787 | | | $ | 10,868 | | | $ | 15,122 | | | $ | 21,636 | |
Ratios to Average Net Assets: | | | | | | | | | | | | | | | | | | | | |
Net investment income/(loss) | | | 0.74 | % | | | 1.57 | % | | | 0.13 | % | | | (0.09 | )% | | | (0.11 | )% |
Operating expenses including reimbursement/waiver | | | 0.81 | %(d) | | | 0.85 | % | | | 0.85 | % | | | 0.85 | % | | | 0.85 | % |
Operating expenses excluding reimbursement/waiver | | | 1.25 | % | | | 1.32 | % | | | 1.19 | % | | | 1.09 | % | | | 1.02 | % |
Portfolio Turnover Rate | | | 196 | % | | | 359 | % | | | 42 | % | | | 53 | % | | | 218 | % |
(a) Prior to May 1, 2016, Salient Adaptive US Equity Fund was known as Forward Total MarketPlus Fund. Prior to May 1, 2013, Forward Total MarketPlus Fund was known as Forward Extended MarketPlus Fund.
(b) The information for the fiscal year ended December 31, 2015 has been audited by KPMG LLP, independent registered public accounting firm. The information for prior periods has been audited by the predecessor independent registered public accounting firm.
(c) Per share amounts are based upon average shares outstanding.
(d) Effective May 1, 2017, the annual expense limitation rate changed from 0.85% to 0.80%.
| | | | |
| See accompanying Notes to Financial Statements. | | 89 | | |
Financial Highlights
For a share outstanding throughout the periods presented.
Salient EM Infrastructure Fund(a)
| | | | | | | | | | | | | | | | | | | | |
| | | Investor Class | |
| | | Year Ended
December 31,
2017 | | | Year Ended
December 31,
2016 | | | Year Ended
December 31,
2015(b) | | | Year Ended
December 31,
2014 | | | Year Ended
December 31,
2013 | |
Net Asset Value, Beginning of Period | | $ | 20.90 | | | $ | 20.91 | | | $ | 22.85 | | | $ | 23.17 | | | $ | 21.02 | |
Income/(Loss) from Operations: | | | | | | | | | | | | | | | | | | | | |
Net investment income(c) | | | 1.22 | | | | 0.53 | | | | 0.55 | | | | 0.24 | | | | 0.35 | |
Net realized and unrealized gain/(loss) on investments | | | 2.26 | | | | (0.28 | ) | | | (2.06 | ) | | | (0.25 | ) | | | 2.00 | |
| | | | | | | | | | | | | | | | | | | | |
Total from Investment Operations | | | 3.48 | | | | 0.25 | | | | (1.51 | ) | | | (0.01 | ) | | | 2.35 | |
| | | | | | | | | | | | | | | | | | | | |
Less Distributions: | | | | | | | | | | | | | | | | | | | | |
From investment income | | | (1.30 | ) | | | (0.26 | ) | | | (0.43 | ) | | | (0.31 | ) | | | (0.20 | ) |
| | | | | | | | | | | | | | | | | | | | |
Total Distributions | | | (1.30 | ) | | | (0.26 | ) | | | (0.43 | ) | | | (0.31 | ) | | | (0.20 | ) |
| | | | | | | | | | | | | | | | | | | | |
Net Increase/(Decrease) in Net Asset Value | | | 2.18 | | | | (0.01 | ) | | | (1.94 | ) | | | (0.32 | ) | | | 2.15 | |
| | | | | | | | | | | | | | | | | | | | |
Net Asset Value, End of Period | | $ | 23.08 | | | $ | 20.90 | | | $ | 20.91 | | | $ | 22.85 | | | $ | 23.17 | |
| | | | | | | | | | | | | | | | | | | | |
Total Return | | | 16.92 | % | | | 1.20 | % | | | (6.60 | )% | | | (0.17 | )% | | | 11.31 | % |
Ratios/Supplemental Data: | | | | | | | | | | | | | | | | | | | | |
Net assets, End of Period (in 000s) | | $ | 1,353 | | | $ | 2,727 | | | $ | 18,572 | | | $ | 31,054 | | | $ | 11,217 | |
Ratios to Average Net Assets: | | | | | | | | | | | | | | | | | | | | |
Net investment income including reimbursement/waiver | | | 5.41 | % | | | 2.53 | % | | | 2.41 | % | | | 1.01 | % | | | 1.62 | % |
Operating expenses including reimbursement/waiver | | | 1.55 | % | | | 2.14 | %(d) | | | n/a | | | | n/a | | | | n/a | |
Operating expenses excluding reimbursement/waiver | | | 2.22 | % | | | 2.18 | % | | | 1.87 | % | | | 1.70 | % | | | 1.67 | % |
Portfolio Turnover Rate | | | 98 | % | | | 105 | % | | | 107 | % | | | 135 | % | | | 101 | % |
(a) Prior to May 1, 2016, Salient EM Infrastructure Fund was known as Forward Global Infrastructure Fund.
(b) The information for the fiscal year ended December 31, 2015 has been audited by KPMG LLP, independent registered public accounting firm. The information for prior periods has been audited by the predecessor independent registered public accounting firm.
(c) Per share amounts are based upon average shares outstanding.
(d) Effective December 1, 2016, the Advisor agreed to limit expenses to 1.55%.
| | | | |
| See accompanying Notes to Financial Statements. | | 90 | | |
Financial Highlights
For a share outstanding throughout the periods presented.
Salient EM Infrastructure Fund(a)
| | | | | | | | | | | | | | | | | | | | |
| | | Institutional Class | |
| | | Year Ended
December 31,
2017 | | | Year Ended
December 31,
2016 | | | Year Ended
December 31,
2015(b) | | | Year Ended
December 31,
2014 | | | Year Ended
December 31,
2013 | |
Net Asset Value, Beginning of Period | | $ | 20.83 | | | $ | 21.09 | | | $ | 23.03 | | | $ | 23.32 | | | $ | 21.10 | |
Income/(Loss) from Operations: | | | | | | | | | | | | | | | | | | | | |
Net investment income(c) | | | 1.31 | | | | 0.70 | | | | 0.58 | | | | 0.31 | | | | 0.40 | |
Net realized and unrealized gain/(loss) on investments | | | 2.26 | | | | (0.38 | ) | | | (2.01 | ) | | | (0.24 | ) | | | 2.04 | |
| | | | | | | | | | | | | | | | | | | | |
Total from Investment Operations | | | 3.57 | | | | 0.32 | | | | (1.43 | ) | | | 0.07 | | | | 2.44 | |
| | | | | | | | | | | | | | | | | | | | |
Less Distributions: | | | | | | | | | | | | | | | | | | | | |
From investment income | | | (1.36 | ) | | | (0.58 | ) | | | (0.51 | ) | | | (0.36 | ) | | | (0.22 | ) |
| | | | | | | | | | | | | | | | | | | | |
Total Distributions | | | (1.36 | ) | | | (0.58 | ) | | | (0.51 | ) | | | (0.36 | ) | | | (0.22 | ) |
| | | | | | | | | | | | | | | | | | | | |
Net Increase/(Decrease) in Net Asset Value | | | 2.21 | | | | (0.26 | ) | | | (1.94 | ) | | | (0.29 | ) | | | 2.22 | |
| | | | | | | | | | | | | | | | | | | | |
Net Asset Value, End of Period | | $ | 23.04 | | | $ | 20.83 | | | $ | 21.09 | | | $ | 23.03 | | | $ | 23.32 | |
| | | | | | | | | | | | | | | | | | | | |
Total Return | | | 17.38 | % | | | 1.53 | % | | | (6.22 | )% | | | 0.17 | % | | | 11.69 | % |
Ratios/Supplemental Data: | | | | | | | | | | | | | | | | | | | | |
Net assets, End of Period (in 000s) | | $ | 13,318 | | | $ | 7,136 | | | $ | 11,783 | | | $ | 40,774 | | | $ | 39,347 | |
Ratios to Average Net Assets: | | | | | | | | | | | | | | | | | | | | |
Net investment income including reimbursement/waiver | | | 5.73 | % | | | 3.27 | % | | | 2.52 | % | | | 1.30 | % | | | 1.86 | % |
Operating expenses including reimbursement/waiver | | | 1.20 | % | | | 1.87 | %(d) | | | n/a | | | | n/a | | | | n/a | |
Operating expenses excluding reimbursement/waiver | | | 1.79 | % | | | 1.93 | % | | | 1.52 | % | | | 1.35 | % | | | 1.30 | % |
Portfolio Turnover Rate | | | 98 | % | | | 105 | % | | | 107 | % | | | 135 | % | | | 101 | % |
(a) Prior to May 1, 2016, Salient EM Infrastructure Fund was known as Forward Global Infrastructure Fund.
(b) The information for the fiscal year ended December 31, 2015 has been audited by KPMG LLP, independent registered public accounting firm. The information for prior periods has been audited by the predecessor independent registered public accounting firm.
(c) Per share amounts are based upon average shares outstanding.
(d) Effective December 1, 2016, the Advisor agreed to limit expenses to 1.20%.
| | | | |
| See accompanying Notes to Financial Statements. | | 91 | | |
Financial Highlights
For a share outstanding throughout the periods presented.
Salient EM Infrastructure Fund(a)
| | | | | | | | | | | | | | | | | | | | |
| | | Class A | |
| | | Year Ended
December 31,
2017 | | | Year Ended
December 31,
2016 | | | Year Ended
December 31,
2015(b) | | | Year Ended
December 31,
2014 | | | Year Ended
December 31,
2013 | |
Net Asset Value, Beginning of Period | | $ | 20.77 | | | $ | 21.02 | | | $ | 22.98 | | | $ | 23.29 | | | $ | 21.12 | |
Income/(Loss) from Operations: | | | | | | | | | | | | | | | | | | | | |
Net investment income(c) | | | 1.27 | | | | 0.65 | | | | 0.51 | | | | 0.21 | | | | 0.24 | |
Net realized and unrealized gain/(loss) on investments | | | 2.18 | | | | (0.41 | ) | | | (2.05 | ) | | | (0.24 | ) | | | 2.11 | |
| | | | | | | | | | | | | | | | | | | | |
Total from Investment Operations | | | 3.45 | | | | 0.24 | | | | (1.54 | ) | | | (0.03 | ) | | | 2.35 | |
| | | | | | | | | | �� | | | | | | | | | | |
Less Distributions: | | | | | | | | | | | | | | | | | | | | |
From investment income | | | (1.28 | ) | | | (0.49 | ) | | | (0.42 | ) | | | (0.28 | ) | | | (0.18 | ) |
| | | | | | | | | | | | | | | | | | | | |
Total Distributions | | | (1.28 | ) | | | (0.49 | ) | | | (0.42 | ) | | | (0.28 | ) | | | (0.18 | ) |
| | | | | | | | | | | | | | | | | | | | |
Net Increase/(Decrease) in Net Asset Value | | | 2.17 | | | | (0.25 | ) | | | (1.96 | ) | | | (0.31 | ) | | | 2.17 | |
| | | | | | | | | | | | | | | | | | | | |
Net Asset Value, End of Period | | $ | 22.94 | | | $ | 20.77 | | | $ | 21.02 | | | $ | 22.98 | | | $ | 23.29 | |
| | | | | | | | | | | | | | | | | | | | |
Total Return(d) | | | 16.92 | % | | | 1.11 | % | | | (6.75 | )% | | | (0.19 | )% | | | 11.26 | % |
Ratios/Supplemental Data: | | | | | | | | | | | | | | | | | | | | |
Net assets, End of Period (in 000s) | | $ | 10,609 | | | $ | 8,411 | | | $ | 12,775 | | | $ | 17,427 | | | $ | 22,524 | |
Ratios to Average Net Assets: | | | | | | | | | | | | | | | | | | | | |
Net investment income including reimbursement/waiver | | | 5.63 | % | | | 3.06 | % | | | 2.23 | % | | | 0.89 | % | | | 1.10 | % |
Operating expenses including reimbursement/waiver | | | 1.60 | % | | | 2.28 | %(e) | | | n/a | | | | n/a | | | | n/a | |
Operating expenses excluding reimbursement/waiver | | | 2.24 | % | | | 2.34 | % | | | 1.93 | % | | | 1.75 | % | | | 1.74 | % |
Portfolio Turnover Rate | | | 98 | % | | | 105 | % | | | 107 | % | | | 135 | % | | | 101 | % |
(a) Prior to May 1, 2016, Salient EM Infrastructure Fund was known as Forward Global Infrastructure Fund.
(b) The information for the fiscal year ended December 31, 2015 has been audited by KPMG LLP, independent registered public accounting firm. The information for prior periods has been audited by the predecessor independent registered public accounting firm.
(c) Per share amounts are based upon average shares outstanding.
(d) Total return does not reflect the effect of sales charges.
(e) Effective December 1, 2016, the Advisor agreed to limit expenses to 1.60%.
| | | | |
| See accompanying Notes to Financial Statements. | | 92 | | |
Financial Highlights
For a share outstanding throughout the periods presented.
Salient EM Infrastructure Fund(a)
| | | | | | | | | | | | | | | | | | | | |
| | | Class C | |
| | | Year Ended
December 31,
2017 | | | Year Ended
December 31,
2016 | | | Year Ended
December 31,
2015(b) | | | Year Ended
December 31,
2014 | | | Year Ended
December 31,
2013 | |
Net Asset Value, Beginning of Period | | $ | 20.66 | | | $ | 20.94 | | | $ | 22.92 | | | $ | 23.25 | | | $ | 21.14 | |
Income/(Loss) from Operations: | | | | | | | | | | | | | | | | | | | | |
Net investment income(c) | | | 1.13 | | | | 0.53 | | | | 0.38 | | | | 0.08 | | | | 0.11 | |
Net realized and unrealized gain/(loss) on investments | | | 2.18 | | | | (0.41 | ) | | �� | (2.05 | ) | | | (0.23 | ) | | | 2.11 | |
| | | | | | | | | | | | | | | | | | | | |
Total from Investment Operations | | | 3.31 | | | | 0.12 | | | | (1.67 | ) | | | (0.15 | ) | | | 2.22 | |
| | | | | | | | | | | | | | | | | | | | |
Less Distributions: | | | | | | | | | | | | | | | | | | | | |
From investment income | | | (1.15 | ) | | | (0.40 | ) | | | (0.31 | ) | | | (0.18 | ) | | | (0.11 | ) |
| | | | | | | | | | | | | | | | | | | | |
Total Distributions | | | (1.15 | ) | | | (0.40 | ) | | | (0.31 | ) | | | (0.18 | ) | | | (0.11 | ) |
| | | | | | | | | | | | | | | | | | | | |
Net Increase/(Decrease) in Net Asset Value | | | 2.16 | | | | (0.28 | ) | | | (1.98 | ) | | | (0.33 | ) | | | 2.11 | |
| | | | | | | | | | | | | | | | | | | | |
Net Asset Value, End of Period | | $ | 22.82 | | | $ | 20.66 | | | $ | 20.94 | | | $ | 22.92 | | | $ | 23.25 | |
| | | | | | | | | | | | | | | | | | | | |
Total Return(d) | | | 16.26 | % | | | 0.57 | % | | | (7.24 | )% | | | (0.75 | )% | | | 10.60 | % |
Ratios/Supplemental Data: | | | | | | | | | | | | | | | | | | | | |
Net assets, End of Period (in 000s) | | $ | 4,121 | | | $ | 4,353 | | | $ | 4,966 | | | $ | 6,459 | | | $ | 7,350 | |
Ratios to Average Net Assets: | | | | | | | | | | | | | | | | | | | | |
Net investment income including reimbursement/waiver | | | 5.02 | % | | | 2.48 | % | | | 1.66 | % | | | 0.35 | % | | | 0.51 | % |
Operating expenses including reimbursement/waiver | | | 2.15 | % | | | 2.83 | %(e) | | | n/a | | | | n/a | | | | n/a | |
Operating expenses excluding reimbursement/waiver | | | 2.80 | % | | | 2.90 | % | | | 2.48 | % | | | 2.30 | % | | | 2.32 | % |
Portfolio Turnover Rate | | | 98 | % | | | 105 | % | | | 107 | % | | | 135 | % | | | 101 | % |
(a) Prior to May 1, 2016, Salient EM Infrastructure Fund was known as Forward Global Infrastructure Fund.
(b) The information for the fiscal year ended December 31, 2015 has been audited by KPMG LLP, independent registered public accounting firm. The information for prior periods has been audited by the predecessor independent registered public accounting firm.
(c) Per share amounts are based upon average shares outstanding.
(d) Total return does not reflect the effect of sales charges.
(e) Effective December 1, 2016, the Advisor agreed to limit expenses to 2.15%.
| | | | |
| See accompanying Notes to Financial Statements. | | 93 | | |
Financial Highlights
For a share outstanding throughout the periods presented.
Salient International Dividend Signal Fund(a)
| | | | | | | | | | | | | | | | | | | | |
| | | Investor Class | |
| | | Year Ended
December 31,
2017 | | | Year Ended
December 31,
2016 | | | Year Ended
December 31,
2015(b) | | | Year Ended
December 31,
2014 | | | Year Ended
December 31,
2013 | |
Net Asset Value, Beginning of Period | | $ | 7.49 | | | $ | 7.94 | | | $ | 8.78 | | | $ | 9.76 | | | $ | 9.12 | |
Income/(Loss) from Operations: | | | | | | | | | | | | | | | | | | | | |
Net investment income(c) | | | 0.34 | | | | 0.39 | | | | 0.43 | | | | 0.50 | | | | 0.49 | |
Net realized and unrealized gain/(loss) on investments | | | 1.46 | | | | (0.46 | ) | | | (0.93 | ) | | | (0.96 | ) | | | 0.59 | |
| | | | | | | | | | | | | | | | | | | | |
Total from Investment Operations | | | 1.80 | | | | (0.07 | ) | | | (0.50 | ) | | | (0.46 | ) | | | 1.08 | |
| | | | | | | | | | | | | | | | | | | | |
Less Distributions: | | | | | | | | | | | | | | | | | | | | |
From investment income | | | (0.45 | ) | | | (0.38 | ) | | | (0.34 | ) | | | (0.52 | ) | | | (0.44 | ) |
| | | | | | | | | | | | | | | | | | | | |
Total Distributions | | | (0.45 | ) | | | (0.38 | ) | | | (0.34 | ) | | | (0.52 | ) | | | (0.44 | ) |
| | | | | | | | | | | | | | | | | | | | |
Net Increase/(Decrease) in Net Asset Value | | | 1.35 | | | | (0.45 | ) | | | (0.84 | ) | | | (0.98 | ) | | | 0.64 | |
| | | | | | | | | | | | | | | | | | | | |
Net Asset Value, End of Period | | $ | 8.84 | | | $ | 7.49 | | | $ | 7.94 | | | $ | 8.78 | | | $ | 9.76 | |
| | | | | | | | | | | | | | | | | | | | |
Total Return | | | 24.48 | % | | | (0.79 | )% | | | (6.03 | )% | | | (4.96 | )% | | | 12.14 | % |
Ratios/Supplemental Data: | | | | | | | | | | | | | | | | | | | | |
Net assets, End of Period (in 000s) | | $ | 4,549 | | | $ | 38,716 | | | $ | 61,163 | | | $ | 140,810 | | | $ | 110,117 | |
Ratios to Average Net Assets (excluding interest expense): | | | | | | | | | | | | | | | | | | | | |
Net investment income including reimbursement/waiver | | | 4.36 | % | | | 5.29 | % | | | 5.03 | % | | | 5.35 | % | | | 5.22 | % |
Operating expenses including reimbursement/waiver | | | 1.34 | % | | | 1.34 | % | | | 1.34 | % | | | 1.34 | % | | | 1.34 | % |
Operating expenses excluding reimbursement/waiver | | | 1.74 | % | | | 1.60 | % | | | 1.49 | % | | | 1.45 | % | | | 1.46 | % |
Ratios to Average Net Assets (including interest expense): | | | | | | | | | | | | | | | | | | | | |
Net investment income including reimbursement/waiver | | | 4.16 | % | | | 5.15 | % | | | 4.90 | % | | | 5.26 | % | | | 5.11 | % |
Operating expenses including reimbursement/waiver | | | 1.54 | % | | | 1.48 | % | | | 1.47 | % | | | 1.43 | % | | | 1.45 | % |
Operating expenses excluding reimbursement/waiver | | | 1.94 | % | | | 1.74 | % | | | 1.62 | % | | | 1.54 | % | | | 1.57 | % |
Portfolio Turnover Rate | | | 51 | % | | | 90 | % | | | 134 | % | | | 95 | % | | | 115 | % |
(a) Prior to May 1, 2016, Salient International Dividend Signal Fund was known as Forward International Dividend Fund.
(b) The information for the fiscal year ended December 31, 2015 has been audited by KPMG LLP, independent registered public accounting firm. The information for prior periods has been audited by the predecessor independent registered public accounting firm.
(c) Per share amounts are based upon average shares outstanding.
| | | | |
| See accompanying Notes to Financial Statements. | | 94 | | |
Financial Highlights
For a share outstanding throughout the periods presented.
Salient International Dividend Signal Fund(a)
| | | | | | | | | | | | | | | | | | | | |
| | | Institutional Class | |
| | | Year Ended
December 31,
2017 | | | Year Ended
December 31,
2016 | | | Year Ended
December 31,
2015(b) | | | Year Ended
December 31,
2014 | | | Year Ended
December 31,
2013 | |
Net Asset Value, Beginning of Period | | $ | 6.08 | | | $ | 6.52 | | | $ | 7.27 | | | $ | 8.17 | | | $ | 7.70 | |
Income/(Loss) from Operations: | | | | | | | | | | | | | | | | | | | | |
Net investment income(c) | | | 0.37 | | | | 0.36 | | | | 0.38 | | | | 0.45 | | | | 0.42 | |
Net realized and unrealized gain/(loss) on investments | | | 1.11 | | | | (0.40 | ) | | | (0.76 | ) | | | (0.80 | ) | | | 0.52 | |
| | | | | | | | | | | | | | | | | | | | |
Total from Investment Operations | | | 1.48 | | | | (0.04 | ) | | | (0.38 | ) | | | (0.35 | ) | | | 0.94 | |
| | | | | | | | | | | | | | | | | | | | |
Less Distributions: | | | | | | | | | | | | | | | | | | | | |
From investment income | | | (0.48 | ) | | | (0.40 | ) | | | (0.37 | ) | | | (0.55 | ) | | | (0.47 | ) |
| | | | | | | | | | | | | | | | | | | | |
Total Distributions | | | (0.48 | ) | | | (0.40 | ) | | | (0.37 | ) | | | (0.55 | ) | | | (0.47 | ) |
| | | | | | | | | | | | | | | | | | | | |
Net Increase/(Decrease) in Net Asset Value | | | 1.00 | | | | (0.44 | ) | | | (0.75 | ) | | | (0.90 | ) | | | 0.47 | |
| | | | | | | | | | | | | | | | | | | | |
Net Asset Value, End of Period | | $ | 7.08 | | | $ | 6.08 | | | $ | 6.52 | | | $ | 7.27 | | | $ | 8.17 | |
| | | | | | | | | | | | | | | | | | | | |
Total Return | | | 24.90 | % | | | (0.40 | )% | | | (5.65 | )% | | | (4.56 | )% | | | 12.46 | % |
Ratios/Supplemental Data: | | | | | | | | | | | | | | | | | | | | |
Net assets, End of Period (in 000s) | | $ | 54,974 | | | $ | 67,056 | | | $ | 109,390 | | | $ | 84,982 | | | $ | 92,617 | |
Ratios to Average Net Assets (excluding interest expense): | | | | | | | | | | | | | | | | | | | | |
Net investment income including reimbursement/waiver | | | 5.69 | % | | | 5.86 | % | | | 5.41 | % | | | 5.73 | % | | | 5.41 | % |
Operating expenses including reimbursement/waiver | | | 0.99 | % | | | 0.99 | % | | | 0.99 | % | | | 0.99 | % | | | 0.99 | % |
Operating expenses excluding reimbursement/waiver | | | 1.36 | % | | | 1.25 | % | | | 1.14 | % | | | 1.10 | % | | | 1.11 | % |
Ratios to Average Net Assets (including interest expense): | | | | | | | | | | | | | | | | | | | | |
Net investment income including reimbursement/waiver | | | 5.49 | % | | | 5.72 | % | | | 5.28 | % | | | 5.64 | % | | | 5.30 | % |
Operating expenses including reimbursement/waiver | | | 1.19 | % | | | 1.13 | % | | | 1.12 | % | | | 1.08 | % | | | 1.10 | % |
Operating expenses excluding reimbursement/waiver | | | 1.56 | % | | | 1.39 | % | | | 1.27 | % | | | 1.19 | % | | | 1.22 | % |
Portfolio Turnover Rate | | | 51 | % | | | 90 | % | | | 134 | % | | | 95 | % | | | 115 | % |
(a) Prior to May 1, 2016, Salient International Dividend Signal Fund was known as Forward International Dividend Fund.
(b) The information for the fiscal year ended December 31, 2015 has been audited by KPMG LLP, independent registered public accounting firm. The information for prior periods has been audited by the predecessor independent registered public accounting firm.
(c) Per share amounts are based upon average shares outstanding.
| | | | |
| See accompanying Notes to Financial Statements. | | 95 | | |
Financial Highlights
For a share outstanding throughout the periods presented.
Salient International Dividend Signal Fund(a)
| | | | | | | | | | | | | | | | | | | | |
| | | Class A(b) | |
| | | Year Ended
December 31,
2017 | | | Year Ended
December 31,
2016 | | | Year Ended
December 31,
2015(c) | | | Year Ended
December 31,
2014 | | | Period Ended
December 31,
2013 | |
Net Asset Value, Beginning of Period | | $ | 7.49 | | | $ | 7.94 | | | $ | 8.78 | | | $ | 9.76 | | | $ | 9.95 | |
Income/(Loss) from Operations: | | | | | | | | | | | | | | | | | | | | |
Net investment income(d) | | | 0.40 | | | | 0.39 | | | | 0.43 | | | | 0.48 | | | | 0.32 | |
Net realized and unrealized gain/(loss) on investments | | | 1.39 | | | | (0.47 | ) | | | (0.94 | ) | | | (0.95 | ) | | | (0.19 | ) |
| | | | | | | | | | | | | | | | | | | | |
Total from Investment Operations | | | 1.79 | | | | (0.08 | ) | | | (0.51 | ) | | | (0.47 | ) | | | 0.13 | |
| | | | | | | | | | | | | | | | | | | | |
Less Distributions: | | | | | | | | | | | | | | | | | | | | |
From investment income | | | (0.44 | ) | | | (0.37 | ) | | | (0.33 | ) | | | (0.51 | ) | | | (0.32 | ) |
| | | | | | | | | | | | | | | | | | | | |
Total Distributions | | | (0.44 | ) | | | (0.37 | ) | | | (0.33 | ) | | | (0.51 | ) | | | (0.32 | ) |
| | | | | | | | | | | | | | | | | | | | |
Net Increase/(Decrease) in Net Asset Value | | | 1.35 | | | | (0.45 | ) | | | (0.84 | ) | | | (0.98 | ) | | | (0.19 | ) |
| | | | | | | | | | | | | | | | | | | | |
Net Asset Value, End of Period | | $ | 8.84 | | | $ | 7.49 | | | $ | 7.94 | | | $ | 8.78 | | | $ | 9.76 | |
| | | | | | | | | | | | | | | | | | | | |
Total Return(e) | | | 24.32 | % | | | (0.90 | )% | | | (6.16 | )% | | | (5.09 | )% | | | 1.45 | %(f) |
Ratios/Supplemental Data: | | | | | | | | | | | | | | | | | | | | |
Net assets, End of Period (in 000s) | | $ | 5,451 | | | $ | 4,104 | | | $ | 4,204 | | | $ | 4,046 | | | $ | 2,699 | |
Ratios to Average Net Assets (excluding interest expense): | | | | | | | | | | | | | | | | | | | | |
Net investment income including reimbursement/waiver | | | 5.04 | % | | | 5.24 | % | | | 5.08 | % | | | 5.16 | % | | | 5.16 | %(g) |
Operating expenses including reimbursement/waiver | | | 1.49 | % | | | 1.49 | % | | | 1.49 | % | | | 1.49 | % | | | 1.49 | %(g) |
Operating expenses excluding reimbursement/waiver | | | 1.86 | % | | | 1.75 | % | | | 1.64 | % | | | 1.60 | % | | | 1.61 | %(g) |
Ratios to Average Net Assets (including interest expense): | | | | | | | | | | | | | | | | | | | | |
Net investment income including reimbursement/waiver | | | 4.84 | % | | | 5.10 | % | | | 4.95 | % | | | 5.07 | % | | | 5.05 | %(g) |
Operating expenses including reimbursement/waiver | | | 1.69 | % | | | 1.63 | % | | | 1.62 | % | | | 1.58 | % | | | 1.60 | %(g) |
Operating expenses excluding reimbursement/waiver | | | 2.06 | % | | | 1.89 | % | | | 1.77 | % | | | 1.69 | % | | | 1.72 | %(g) |
Portfolio Turnover Rate | | | 51 | % | | | 90 | % | | | 134 | % | | | 95 | % | | | 115 | %(h) |
(a) Prior to May 1, 2016, Salient International Dividend Signal Fund was known as Forward International Dividend Fund.
(b) The Fund began offering Class A shares on May 1, 2013.
(c) The information for the fiscal year ended December 31, 2015 has been audited by KPMG LLP, independent registered public accounting firm. The information for prior periods has been audited by the predecessor independent registered public accounting firm.
(d) Per share amounts are based upon average shares outstanding.
(e) Total return does not reflect the effect of sales charges.
(f) Not Annualized.
(g) Annualized.
(h) Portfolio turnover rate is calculated at the Fund level and represents the year ended December 31, 2013.
| | | | |
| See accompanying Notes to Financial Statements. | | 96 | | |
Financial Highlights
For a share outstanding throughout the periods presented.
Salient International Dividend Signal Fund(a)
| | | | | | | | | | | | | | | | | | | | |
| | | Class C | |
| | | Year Ended
December 31,
2017 | | | Year Ended
December 31,
2016 | | | Year Ended
December 31,
2015(b) | | | Year Ended
December 31,
2014 | | | Year Ended
December 31,
2013 | |
Net Asset Value, Beginning of Period | | $ | 7.48 | | | $ | 7.92 | | | $ | 8.76 | | | $ | 9.74 | | | $ | 9.11 | |
Income/(Loss) from Operations: | | | | | | | | | | | | | | | | | | | | |
Net investment income(c) | | | 0.37 | | | | 0.25 | | | | 0.38 | | | | 0.44 | | | | 0.45 | |
Net realized and unrealized gain/(loss) on investments | | | 1.38 | | | | (0.36 | ) | | | (0.93 | ) | | | (0.95 | ) | | | 0.57 | |
| | | | | | | | | | | | | | | | | | | | |
Total from Investment Operations | | | 1.75 | | | | (0.11 | ) | | | (0.55 | ) | | | (0.51 | ) | | | 1.02 | |
| | | | | | | | | | | | | | | | | | | | |
Less Distributions: | | | | | | | | | | | | | | | | | | | | |
From investment income | | | (0.41 | ) | | | (0.33 | ) | | | (0.29 | ) | | | (0.47 | ) | | | (0.39 | ) |
| | | | | | | | | | | | | | | | | | | | |
Total Distributions | | | (0.41 | ) | | | (0.33 | ) | | | (0.29 | ) | | | (0.47 | ) | | | (0.39 | ) |
| | | | | | | | | | | | | | | | | | | | |
Net Increase/(Decrease) in Net Asset Value | | | 1.34 | | | | (0.44 | ) | | | (0.84 | ) | | | (0.98 | ) | | | 0.63 | |
| | | | | | | | | | | | | | | | | | | | |
Net Asset Value, End of Period | | $ | 8.82 | | | $ | 7.48 | | | $ | 7.92 | | | $ | 8.76 | | | $ | 9.74 | |
| | | | | | | | | | | | | | | | | | | | |
Total Return(d) | | | 23.68 | % | | | (1.39 | )% | | | (6.45 | )% | | | (5.52 | )% | | | 11.45 | % |
Ratios/Supplemental Data: | | | | | | | | | | | | | | | | | | | | |
Net assets, End of Period (in 000s) | | $ | 12,371 | | | $ | 9,051 | | | $ | 11,215 | | | $ | 10,293 | | | $ | 7,629 | |
Ratios to Average Net Assets (excluding interest expense): | | | | | | | | | | | | | | | | | | | | |
Net investment income including reimbursement/waiver | | | 4.60 | % | | | 3.42 | % | | | 4.48 | % | | | 4.74 | % | | | 4.84 | % |
Operating expenses including reimbursement/waiver | | | 1.94 | % | | | 1.94 | % | | | 1.94 | % | | | 1.94 | % | | | 1.94 | % |
Operating expenses excluding reimbursement/waiver | | | 2.31 | % | | | 2.21 | % | | | 2.09 | % | | | 2.05 | % | | | 2.07 | % |
Ratios to Average Net Assets (including interest expense): | | | | | | | | | | | | | | | | | | | | |
Net investment income including reimbursement/waiver | | | 4.40 | % | | | 3.28 | % | | | 4.35 | % | | | 4.65 | % | | | 4.73 | % |
Operating expenses including reimbursement/waiver | | | 2.14 | % | | | 2.08 | % | | | 2.07 | % | | | 2.03 | % | | | 2.05 | % |
Operating expenses excluding reimbursement/waiver | | | 2.51 | % | | | 2.35 | % | | | 2.22 | % | | | 2.14 | % | | | 2.17 | % |
Portfolio Turnover Rate | | | 51 | % | | | 90 | % | | | 134 | % | | | 95 | % | | | 115 | % |
(a) Prior to May 1, 2016, Salient International Dividend Signal Fund was known as Forward International Dividend Fund.
(b) The information for the fiscal year ended December 31, 2015 has been audited by KPMG LLP, independent registered public accounting firm. The information for prior periods has been audited by the predecessor independent registered public accounting firm.
(c) Per share amounts are based upon average shares outstanding.
(d) Total return does not reflect the effect of sales charges.
| | | | |
| See accompanying Notes to Financial Statements. | | 97 | | |
Financial Highlights
For a share outstanding throughout the periods presented.
Salient International Small Cap Fund(a)
| | | | | | | | | | | | | | | | | | | | |
| | | Investor Class | |
| | | Year Ended
December 31,
2017 | | | Year Ended
December 31,
2016 | | | Year Ended
December 31,
2015(b) | | | Year Ended
December 31,
2014 | | | Year Ended
December 31,
2013 | |
Net Asset Value, Beginning of Period | | $ | 16.54 | | | $ | 17.65 | | | $ | 15.86 | | | $ | 17.39 | | | $ | 13.85 | |
Income/(Loss) from Operations: | | | | | | | | | | | | | | | | | | | | |
Net investment income(c) | | | 0.06 | | | | 0.28 | | | | 0.10 | | | | 0.10 | | | | 0.07 | |
Net realized and unrealized gain/(loss) on investments | | | 5.60 | | | | (0.77 | ) | | | 1.82 | | | | (1.58 | ) | | | 3.80 | |
| | | | | | | | | | | | | | | | | | | | |
Total from Investment Operations | | | 5.66 | | | | (0.49 | ) | | | 1.92 | | | | (1.48 | ) | | | 3.87 | |
| | | | | | | | | | | | | | | | | | | | |
Less Distributions: | | | | | | | | | | | | | | | | | | | | |
From investment income | | | (0.46 | ) | | | (0.62 | ) | | | (0.13 | ) | | | (0.05 | ) | | | (0.33 | ) |
| | | | | | | | | | | | | | | | | | | | |
Total Distributions | | | (0.46 | ) | | | (0.62 | ) | | | (0.13 | ) | | | (0.05 | ) | | | (0.33 | ) |
| | | | | | | | | | | | | | | | | | | | |
Net Increase/(Decrease) in Net Asset Value | | | 5.20 | | | | (1.11 | ) | | | 1.79 | | | | (1.53 | ) | | | 3.54 | |
| | | | | | | | | | | | | | | | | | | | |
Net Asset Value, End of Period | | $ | 21.74 | | | $ | 16.54 | | | $ | 17.65 | | | $ | 15.86 | | | $ | 17.39 | |
| | | | | | | | | | | | | | | | | | | | |
Total Return | | | 34.28 | % | | | (2.74 | )% | | | 12.10 | % | | | (8.51 | )% | | | 27.95 | % |
Ratios/Supplemental Data: | | | | | | | | | | | | | | | | | | | | |
Net assets, End of Period (in 000s) | | $ | 43,702 | | | $ | 24,191 | | | $ | 35,617 | | | $ | 26,760 | | | $ | 38,523 | |
Ratios to Average Net Assets: | | | | | | | | | | | | | | | | | | | | |
Net Investment income including reimbursement/waiver | | | 0.31 | % | | | 1.64 | % | | | 0.57 | % | | | 0.57 | % | | | 0.42 | % |
Operating expenses including reimbursement/waiver | | | 1.60 | %(d) | | | 1.64 | % | | | 1.64 | % | | | 1.65 | %(e) | | | 1.69 | % |
Operating expenses excluding reimbursement/waiver | | | 1.82 | % | | | 1.77 | % | | | 1.68 | % | | | 1.67 | % | | | n/a | |
Portfolio Turnover Rate | | | 69 | % | | | 63 | % | | | 70 | % | | | 65 | % | | | 86 | % |
(a) Prior to May 1, 2016, Salient International Small Cap Fund was known as Forward International Small Companies Fund.
(b) The information for the fiscal year ended December 31, 2015 has been audited by KPMG LLP, independent registered public accounting firm. The information for prior periods has been audited by the predecessor independent registered public accounting firm.
(c) Per share amounts are based upon average shares outstanding.
(d) Effective September 1, 2017, the annual expense limitation rate changed from 1.64% to 1.55%.
(e) Effective May 1, 2014, the Advisor agreed to limit expenses at 1.64%.
| | | | |
| See accompanying Notes to Financial Statements. | | 98 | | |
Financial Highlights
For a share outstanding throughout the periods presented.
Salient International Small Cap Fund(a)
| | | | | | | | | | | | | | | | | | | | |
| | | Institutional Class | |
| | | Year Ended
December 31,
2017 | | | Year Ended
December 31,
2016 | | | Year Ended
December 31,
2015(b) | | | Year Ended
December 31,
2014 | | | Year Ended
December 31,
2013 | |
Net Asset Value, Beginning of Period | | $ | 16.50 | | | $ | 17.62 | | | $ | 15.83 | | | $ | 17.38 | | | $ | 13.84 | |
Income/(Loss) from Operations: | | | | | | | | | | | | | | | | | | | | |
Net investment income(c) | | | 0.17 | | | | 0.35 | | | | 0.15 | | | | 0.15 | | | | 0.12 | |
Net realized and unrealized gain/(loss) on investments | | | 5.57 | | | | (0.77 | ) | | | 1.82 | | | | (1.58 | ) | | | 3.81 | |
| | | | | | | | | | | | | | | | | | | | |
Total from Investment Operations | | | 5.74 | | | | (0.42 | ) | | | 1.97 | | | | (1.43 | ) | | | 3.93 | |
| | | | | | | | | | | | | | | | | | | | |
Less Distributions: | | | | | | | | | | | | | | | | | | | | |
From investment income | | | (0.54 | ) | | | (0.70 | ) | | | (0.18 | ) | | | (0.12 | ) | | | (0.39 | ) |
| | | | | | | | | | | | | | | | | | | | |
Total Distributions | | | (0.54 | ) | | | (0.70 | ) | | | (0.18 | ) | | | (0.12 | ) | | | (0.39 | ) |
| | | | | | | | | | | | | | | | | | | | |
Net Increase/(Decrease) in Net Asset Value | | | 5.20 | | | | (1.12 | ) | | | 1.79 | | | | (1.55 | ) | | | 3.54 | |
| | | | | | | | | | | | | | | | | | | | |
Net Asset Value, End of Period | | $ | 21.70 | | | $ | 16.50 | | | $ | 17.62 | | | $ | 15.83 | | | $ | 17.38 | |
| | | | | | | | | | | | | | | | | | | | |
Total Return | | | 34.80 | % | | | (2.38 | )% | | | 12.41 | % | | | (8.17 | )% | | | 28.42 | % |
Ratios/Supplemental Data: | | | | | | | | | | | | | | | | | | | | |
Net assets, End of Period (in 000s) | | $ | 76,808 | | | $ | 94,426 | | | $ | 150,690 | | | $ | 134,290 | | | $ | 166,601 | |
Ratios to Average Net Assets: | | | | | | | | | | | | | | | | | | | | |
Net Investment income including reimbursement/waiver | | | 0.92 | % | | | 2.03 | % | | | 0.87 | % | | | 0.89 | % | | | 0.78 | % |
Operating expenses including reimbursement/waiver | | | 1.26 | %(d) | | | 1.29 | % | | | 1.29 | % | | | 1.30 | %(e) | | | 1.34 | % |
Operating expenses excluding reimbursement/waiver | | | 1.47 | % | | | 1.41 | % | | | 1.33 | % | | | 1.32 | % | | | n/a | |
Portfolio Turnover Rate | | | 69 | % | | | 63 | % | | | 70 | % | | | 65 | % | | | 86 | % |
(a) Prior to May 1, 2016, Salient International Small Cap Fund was known as Forward International Small Companies Fund.
(b) The information for the fiscal year ended December 31, 2015 has been audited by KPMG LLP, independent registered public accounting firm. The information for prior periods has been audited by the predecessor independent registered public accounting firm.
(c) Per share amounts are based upon average shares outstanding.
(d) Effective September 1, 2017, the annual expense limitation rate changed from 1.29% to 1.20%.
(e) Effective May 1, 2014, the Advisor agreed to limit expenses at 1.29%.
| | | | |
| See accompanying Notes to Financial Statements. | | 99 | | |
Financial Highlights
For a share outstanding throughout the periods presented.
Salient Tactical Growth Fund(a)
| | | | | | | | | | | | | | | | | | | | |
| | | Investor Class | |
| | | Year Ended
December 31,
2017 | | | Year Ended
December 31,
2016 | | | Year Ended
December 31,
2015(b) | | | Year Ended
December 31,
2014 | | | Year Ended
December 31,
2013 | |
Net Asset Value, Beginning of Period | | $ | 25.68 | | | $ | 24.94 | | | $ | 25.55 | | | $ | 26.17 | | | $ | 25.06 | |
Income/(Loss) from Operations: | | | | | | | | | | | | | | | | | | | | |
Net investment loss(c) | | | (0.07 | ) | | | (0.20 | ) | | | (0.18 | ) | | | (0.30 | ) | | | (0.40 | ) |
Net realized and unrealized gain/(loss) on investments | | | 2.75 | | | | 1.01 | | | | (0.30 | ) | | | 0.81 | | | | 4.20 | |
| | | | | | | | | | | | | | | | | | | | |
Total from Investment Operations | | | 2.68 | | | | 0.81 | | | | (0.48 | ) | | | 0.51 | | | | 3.80 | |
| | | | | | | | | | | | | | | | | | | | |
Less Distributions: | | | | | | | | | | | | | | | | | | | | |
From capital gains | | | (1.80 | ) | | | (0.07 | ) | | | (0.13 | ) | | | (1.13 | ) | | | (2.69 | ) |
| | | | | | | | | | | | | | | | | | | | |
Total Distributions | | | (1.80 | ) | | | (0.07 | ) | | | (0.13 | ) | | | (1.13 | ) | | | (2.69 | ) |
| | | | | | | | | | | | | | | | | | | | |
Net Increase/(Decrease) in Net Asset Value | | | 0.88 | | | | 0.74 | | | | (0.61 | ) | | | (0.62 | ) | | | 1.11 | |
| | | | | | | | | | | | | | | | | | | | |
Net Asset Value, End of Period | | $ | 26.56 | | | $ | 25.68 | | | $ | 24.94 | | | $ | 25.55 | | | $ | 26.17 | |
| | | | | | | | | | | | | | | | | | | | |
Total Return | | | 10.57 | % | | | 3.21 | % | | | (1.89 | )% | | | 1.98 | % | | | 15.31 | % |
Ratios/Supplemental Data: | | | | | | | | | | | | | | | | | | | | |
Net assets, End of Period (in 000s) | | $ | 9,212 | | | $ | 12,917 | | | $ | 117,790 | | | $ | 138,946 | | | $ | 164,319 | |
Ratios to Average Net Assets (excluding short sales expense): | | | | | | | | | | | | | | | | | | | | |
Net investment loss | | | (0.26 | )% | | | (0.80 | )% | | | (0.72 | )% | | | (1.17 | )% | | | (1.48 | )% |
Operating expenses | | | 1.87 | % | | | 1.83 | % | | | 1.76 | % | | | 1.74 | % | | | 1.74 | % |
Ratios to Average net Assets (including short sales expense): | | | | | | | | | | | | | | | | | | | | |
Net investment loss | | | n/a | | | | (0.81 | )% | | | n/a | | | | n/a | | | | n/a | |
Operating expenses | | | n/a | | | | 1.84 | % | | | n/a | | | | n/a | | | | n/a | |
Portfolio Turnover Rate | | | 138 | % | | | 837 | % | | | 349 | % | | | 607 | % | | | 1,797 | % |
(a) Prior to May 1, 2016, Salient Tactical Growth Fund was known as Forward Tactical Growth Fund.
(b) The information for the fiscal year ended December 31, 2015 has been audited by KPMG LLP, independent registered public accounting firm. The information for prior periods has been audited by the predecessor independent registered public accounting firm.
(c) Per share amounts are based upon average shares outstanding.
| | | | |
| See accompanying Notes to Financial Statements. | | 100 | | |
Financial Highlights
For a share outstanding throughout the periods presented.
Salient Tactical Growth Fund(a)
| | | | | | | | | | | | | | | | | | | | |
| | | Institutional Class | |
| | | Year Ended December 31,
2017 | | | Year Ended
December 31,
2016 | | | Year Ended
December 31,
2015(b) | | | Year Ended
December 31,
2014 | | | Year Ended
December 31,
2013 | |
Net Asset Value, Beginning of Period | | $ | 26.36 | | | $ | 25.51 | | | $ | 26.04 | | | $ | 26.56 | | | $ | 25.34 | |
Income/(Loss) from Operations: | | | | | | | | | | | | | | | | | | | | |
Net investment income/(loss)(c) | | | 0.10 | (d) | | | (0.07 | ) | | | (0.10 | ) | | | (0.22 | ) | | | (0.31 | ) |
Net realized and unrealized gain/(loss) on investments | | | 2.75 | | | | 0.99 | | | | (0.30 | ) | | | 0.83 | | | | 4.26 | |
| | | | | | | | | | | | | | | | | | | | |
Total from Investment Operations | | | 2.85 | | | | 0.92 | | | | (0.40 | ) | | | 0.61 | | | | 3.95 | |
| | | | | | | | | | | | | | | | | | | | |
Less Distributions: | | | | | | | | | | | | | | | | | | | | |
From capital gains | | | (1.80 | ) | | | (0.07 | ) | | | (0.13 | ) | | | (1.13 | ) | | | (2.73 | ) |
| | | | | | | | | | | | | | | | | | | | |
Total Distributions | | | (1.80 | ) | | | (0.07 | ) | | | (0.13 | ) | | | (1.13 | ) | | | (2.73 | ) |
| | | | | | | | | | | | | | | | | | | | |
Net Increase/(Decrease) in Net Asset Value | | | 1.05 | | | | 0.85 | | | | (0.53 | ) | | | (0.52 | ) | | | 1.22 | |
| | | | | | | | | | | | | | | | | | | | |
Net Asset Value, End of Period | | $ | 27.41 | | | $ | 26.36 | | | $ | 25.51 | | | $ | 26.04 | | | $ | 26.56 | |
| | | | | | | | | | | | | | | | | | | | |
Total Return | | | 10.91 | % | | | 3.61 | % | | | (1.54 | )% | | | 2.33 | % | | | 15.74 | % |
Ratios/Supplemental Data: | | | | | | | | | | | | | | | | | | | | |
Net assets, End of Period (in 000s) | | $ | 311,993 | | | $ | 23,721 | | | $ | 32,330 | | | $ | 53,957 | | | $ | 62,760 | |
Ratios to Average Net Assets (excluding short sales expense): | | | | | | | | | | | | | | | | | | | | |
Net investment income/(loss) | | | 0.37 | % | | | (0.27 | )% | | | (0.40 | )% | | | (0.82 | )% | | | (1.13 | )% |
Operating expenses | | | 1.51 | % | | | 1.48 | % | | | 1.41 | % | | | 1.39 | % | | | 1.39 | % |
Ratios to Average net Assets (including short sales expense): | | | | | | | | | | | | | | | | | | | | |
Net investment income/(loss) | | | n/a | | | | (0.28 | )% | | | n/a | | | | n/a | | | | n/a | |
Operating expenses | | | n/a | | | | 1.49 | % | | | n/a | | | | n/a | | | | n/a | |
Portfolio Turnover Rate | | | 138 | % | | | 837 | % | | | 349 | % | | | 607 | % | | | 1,797 | % |
(a) Prior to May 1, 2016, Salient Tactical Growth Fund was known as Forward Tactical Growth Fund.
(b) The information for the fiscal year ended December 31, 2015 has been audited by KPMG LLP, independent registered public accounting firm. The information for prior periods has been audited by the predecessor independent registered public accounting firm.
(c) Per share amounts are based upon average shares outstanding.
(d) The amount shown for a share outstanding throughout the period may not correlate with the Statement of Operations for the period due to the timing of sales and redemptions of Fund shares in relation to income earned and/or fluctuating market value of the investments of the Fund.
| | | | |
| See accompanying Notes to Financial Statements. | | 101 | | |
Financial Highlights
For a share outstanding throughout the periods presented.
Salient Tactical Growth Fund(a)
| | | | | | | | | | | | | | | | | | | | |
| | | Class A | |
| | | Year Ended
December 31,
2017 | | | Year Ended
December 31,
2016 | | | Year Ended
December 31,
2015(b) | | | Year Ended
December 31,
2014 | | | Year Ended
December 31,
2013 | |
Net Asset Value, Beginning of Period | | $ | 25.34 | | | $ | 24.66 | | | $ | 25.30 | | | $ | 25.96 | | | $ | 24.92 | |
Income/(Loss) from Operations: | | | | | | | | | | | | | | | | | | | | |
Net investment loss(c) | | | (0.09 | ) | | | (0.18 | ) | | | (0.22 | ) | | | (0.35 | ) | | | (0.43 | ) |
Net realized and unrealized gain/(loss) on investments | | | 2.70 | | | | 0.93 | | | | (0.29 | ) | | | 0.82 | | | | 4.16 | |
| | | | | | | | | | | | | | | | | | | | |
Total from Investment Operations | | | 2.61 | | | | 0.75 | | | | (0.51 | ) | | | 0.47 | | | | 3.73 | |
| | | | | | | | | | | | | | | | | | | | |
Less Distributions: | | | | | | | | | | | | | | | | | | | | |
From capital gains | | | (1.80 | ) | | | (0.07 | ) | | | (0.13 | ) | | | (1.13 | ) | | | (2.69 | ) |
| | | | | | | | | | | | | | | | | | | | |
Total Distributions | | | (1.80 | ) | | | (0.07 | ) | | | (0.13 | ) | | | (1.13 | ) | | | (2.69 | ) |
| | | | | | | | | | | | | | | | | | | | |
Net Increase/(Decrease) in Net Asset Value | | | 0.81 | | | | 0.68 | | | | (0.64 | ) | | | (0.66 | ) | | | 1.04 | |
| | | | | | | | | | | | | | | | | | | | |
Net Asset Value, End of Period | | $ | 26.15 | | | $ | 25.34 | | | $ | 24.66 | | | $ | 25.30 | | | $ | 25.96 | |
| | | | | | | | | | | | | | | | | | | | |
Total Return(d) | | | 10.39 | % | | | 3.04 | % | | | (2.02 | )% | | | 1.84 | % | | | 15.11 | % |
Ratios/Supplemental Data: | | | | | | | | | | | | | | | | | | | | |
Net assets, End of Period (in 000s) | | $ | 38,753 | | | $ | 37,332 | | | $ | 38,989 | | | $ | 59,769 | | | $ | 109,402 | |
Ratios to Average Net Assets (excluding short sales expense): | | | | | | | | | | | | | | | | | | | | |
Net investment loss | | | (0.34 | )% | | | (0.72 | )% | | | (0.89 | )% | | | (1.38 | )% | | | (1.63 | )% |
Operating expenses | | | 2.01 | % | | | 1.98 | % | | | 1.91 | % | | | 1.88 | % | | | 1.89 | % |
Ratios to Average net Assets (including short sales expense): | | | | | | | | | | | | | | | | | | | | |
Net investment loss | | | n/a | | | | (0.73 | )% | | | n/a | | | | n/a | | | | n/a | |
Operating expenses | | | n/a | | | | 1.99 | % | | | n/a | | | | n/a | | | | n/a | |
Portfolio Turnover Rate | | | 138 | % | | | 837 | % | | | 349 | % | | | 607 | % | | | 1,797 | % |
(a) Prior to May 1, 2016, Salient Tactical Growth Fund was known as Forward Tactical Growth Fund.
(b) The information for the fiscal year ended December 31, 2015 has been audited by KPMG LLP, independent registered public accounting firm. The information for prior periods has been audited by the predecessor independent registered public accounting firm.
(c) Per share amounts are based upon average shares outstanding.
(d) Total return does not reflect the effect of sales charges.
| | | | |
| See accompanying Notes to Financial Statements. | | 102 | | |
Financial Highlights
For a share outstanding throughout the periods presented.
Salient Tactical Growth Fund(a)
| | | | | | | | | | | | | | | | | | | | |
| | | Class C | |
| | | Year Ended
December 31,
2017 | | | Year Ended
December 31,
2016 | | | Year Ended
December 31,
2015(b) | | | Year Ended
December 31,
2014 | | | Year Ended
December 31,
2013 | |
Net Asset Value, Beginning of Period | | $ | 24.45 | | | $ | 23.90 | | | $ | 24.63 | | | $ | 25.42 | | | $ | 24.55 | |
Income/(Loss) from Operations: | | | | | | | | | | | | | | | | | | | | |
Net investment loss(c) | | | (0.21 | ) | | | (0.29 | ) | | | (0.33 | ) | | | (0.44 | ) | | | (0.54 | ) |
Net realized and unrealized gain/(loss) on investments | | | 2.60 | | | | 0.91 | | | | (0.27 | ) | | | 0.78 | | | | 4.10 | |
| | | | | | | | | | | | | | | | | | | | |
Total from Investment Operations | | | 2.39 | | | | 0.62 | | | | (0.60 | ) | | | 0.34 | | | | 3.56 | |
| | | | | | | | | | | | | | | | | | | | |
Less Distributions: | | | | | | | | | | | | | | | | | | | | |
From capital gains | | | (1.80 | ) | | | (0.07 | ) | | | (0.13 | ) | | | (1.13 | ) | | | (2.69 | ) |
| | | | | | | | | | | | | | | | | | | | |
Total Distributions | | | (1.80 | ) | | | (0.07 | ) | | | (0.13 | ) | | | (1.13 | ) | | | (2.69 | ) |
| | | | | | | | | | | | | | | | | | | | |
Net Increase/(Decrease) in Net Asset Value | | | 0.59 | | | | 0.55 | | | | (0.73 | ) | | | (0.79 | ) | | | 0.87 | |
| | | | | | | | | | | | | | | | | | | | |
Net Asset Value, End of Period | | $ | 25.04 | | | $ | 24.45 | | | $ | 23.90 | | | $ | 24.63 | | | $ | 25.42 | |
| | | | | | | | | | | | | | | | | | | | |
Total Return(d) | | | 9.92 | % | | | 2.55 | % | | | (2.44 | )% | | | 1.36 | % | | | 14.65 | % |
Ratios/Supplemental Data: | | | | | | | | | | | | | | | | | | | | |
Net assets, End of Period (in 000s) | | $ | 36,679 | | | $ | 41,943 | | | $ | 56,018 | | | $ | 85,792 | | | $ | 96,193 | |
Ratios to Average Net Assets (excluding short sales expense): | | | | | | | | | | | | | | | | | | | | |
Net investment loss | | | (0.82 | )% | | | (1.21 | )% | | | (1.34 | )% | | | (1.76 | )% | | | (2.09 | )% |
Operating expenses | | | 2.46 | % | | | 2.43 | % | | | 2.36 | % | | | 2.34 | % | | | 2.34 | % |
Ratios to Average net Assets (including short sales expense): | | | | | | | | | | | | | | | | | | | | |
Net investment loss | | | n/a | | | | (1.22 | )% | | | n/a | | | | n/a | | | | n/a | |
Operating expenses | | | n/a | | | | 2.44 | % | | | n/a | | | | n/a | | | | n/a | |
Portfolio Turnover Rate | | | 138 | % | | | 837 | % | | | 349 | % | | | 607 | % | | | 1,797 | % |
(a) Prior to May 1, 2016, Salient Tactical Growth Fund was known as Forward Tactical Growth Fund.
(b) The information for the fiscal year ended December 31, 2015 has been audited by KPMG LLP, independent registered public accounting firm. The information for prior periods has been audited by the predecessor independent registered public accounting firm.
(c) Per share amounts are based upon average shares outstanding.
(d) Total return does not reflect the effect of sales charges.
| | | | |
| See accompanying Notes to Financial Statements. | | 103 | | |
Financial Highlights
For a share outstanding throughout the periods presented.
Salient Tactical Muni & Credit Fund(a)
| | | | | | | | | | | | | | | | | | | | |
| | | Investor Class | |
| | | Year Ended
December 31,
2017 | | | Year Ended
December 31,
2016 | | | Year Ended
December 31,
2015(b) | | | Year Ended
December 31,
2014 | | | Year Ended
December 31,
2013 | |
Net Asset Value, Beginning of Period | | $ | 7.52 | | | $ | 7.62 | | | $ | 7.50 | | | $ | 7.07 | | | $ | 8.93 | |
Income/(Loss) from Operations: | | | | | | | | | | | | | | | | | | | | |
Net investment income(c) | | | 0.23 | | | | 0.19 | | | | 0.20 | | | | 0.18 | | | | 0.30 | |
Net realized and unrealized gain/(loss) on investments | | | 0.40 | | | | (0.10 | )(d) | | | 0.12 | | | | 0.45 | | | | (1.56 | ) |
| | | | | | | | | | | | | | | | | | | | |
Total from Investment Operations | | | 0.63 | | | | 0.09 | | | | 0.32 | | | | 0.63 | | | | (1.26 | ) |
| | | | | | | | | | | | | | | | | | | | |
| Less Distributions: | | | | | | | | | | | | | | | | | | | | |
From investment income | | | (0.23 | ) | | | (0.19 | ) | | | (0.20 | ) | | | (0.20 | ) | | | (0.41 | ) |
From capital gains | | | — | | | | — | | | | — | | | | — | | | | (0.19 | ) |
| | | | | | | | | | | | | | | | | | | | |
Total Distributions | | | (0.23 | ) | | | (0.19 | ) | | | (0.20 | ) | | | (0.20 | ) | | | (0.60 | ) |
| | | | | | | | | | | | | | | | | | | | |
Net Increase/(Decrease) in Net Asset Value | | | 0.40 | | | | (0.10 | ) | | | 0.12 | | | | 0.43 | | | | (1.86 | ) |
| | | | | | | | | | | | | | | | | | | | |
Net Asset Value, End of Period | | $ | 7.92 | | | $ | 7.52 | | | $ | 7.62 | | | $ | 7.50 | | | $ | 7.07 | |
| | | | | | | | | | | | | | | | | | | | |
Total Return | | | 8.66 | % | | | 1.08 | % | | | 4.39 | % | | | 8.97 | % | | | (14.42 | )% |
Ratios/Supplemental Data: | | | | | | | | | | | | | | | | | | | | |
Net assets, End of Period (in 000s) | | $ | 17,033 | | | $ | 43,266 | | | $ | 67,046 | | | $ | 58,907 | | | $ | 55,719 | |
Ratios to Average Net Assets (excluding interest expense): | | | | | | | | | | | | | | | | | | | | |
Net investment income including reimbursement/waiver | | | 2.99 | % | | | 2.39 | % | | | 2.63 | % | | | 2.50 | % | | | 4.05 | % |
Operating expenses including reimbursement/waiver | | | 1.73 | %(e) | | | 1.79 | % | | | 1.76 | % | | | 1.79 | % | | | 1.97 | %(f) |
Operating expenses excluding reimbursement/waiver | | | 1.87 | % | | | 1.80 | % | | | 1.76 | % | | | 1.80 | % | | | 2.08 | % |
Ratios to Average Net Assets (including interest expense): | | | | | | | | | | | | | | | | | | | | |
Net investment income including reimbursement/waiver | | | 2.99 | % | | | 2.39 | % | | | 2.63 | % | | | 2.50 | % | | | 3.45 | % |
Operating expenses including reimbursement/waiver | | | 1.73 | %(e) | | | 1.79 | % | | | 1.76 | % | | | 1.79 | % | | | 2.57 | %(f) |
Operating expenses excluding reimbursement/waiver | | | 1.87 | % | | | 1.80 | % | | | 1.76 | % | | | 1.80 | % | | | 2.68 | % |
Portfolio Turnover Rate | | | 217 | % | | | 276 | % | | | 160 | % | | | 168 | % | | | 125 | % |
(a) Prior to June 1, 2016, Salient Tactical Muni & Credit Fund was known as Salient Tactical Muni Strategy Fund. Prior to May 1, 2016, Salient Tactical Muni Strategy Fund was known as Forward Credit Analysis Long/Short Fund.
(b) The information for the fiscal year ended December 31, 2015 has been audited by KPMG LLP, independent registered public accounting firm. The information for prior periods has been audited by the predecessor independent registered public accounting firm.
(c) Per share amounts are based upon average shares outstanding.
(d) The amount shown for a share outstanding throughout the period may not correlate with the Statement of Operations for the period due to the timing of sales and redemptions of Fund shares in relation to income earned and/or fluctuating market value of the investments of the Fund.
(e) Effective September 1, 2017, the annual expense limitation rate changed from 1.79% to 1.55%.
(f) Effective October 1, 2013, the annual expense limitation rate changed from 1.99% to 1.79%.
| | | | |
| See accompanying Notes to Financial Statements. | | 104 | | |
Financial Highlights
For a share outstanding throughout the periods presented.
Salient Tactical Muni & Credit Fund(a)
| | | | | | | | | | | | | | | | | | | | |
| | | Institutional Class | |
| | | Year Ended
December 31,
2017 | | | Year Ended
December 31,
2016 | | | Year Ended
December 31,
2015(b) | | | Year Ended
December 31,
2014 | | | Year Ended
December 31,
2013 | |
Net Asset Value, Beginning of Period | | $ | 7.46 | | | $ | 7.56 | | | $ | 7.44 | | | $ | 7.01 | | | $ | 8.88 | |
Income/(Loss) from Operations: | | | | | | | | | | | | | | | | | | | | |
Net investment income(c) | | | 0.26 | | | | 0.22 | | | | 0.22 | | | | 0.22 | | | | 0.32 | |
Net realized and unrealized gain/(loss) on investments | | | 0.38 | | | | (0.10 | )(d) | | | 0.13 | | | | 0.44 | | | | (1.56 | ) |
| | | | | | | | | | | | | | | | | | | | |
Total from Investment Operations | | | 0.64 | | | | 0.12 | | | | 0.35 | | | | 0.66 | | | | (1.24 | ) |
| | | | | | | | | | | | | | | | | | | | |
| Less Distributions: | | | | | | | | | | | | | | | | | | | | |
From investment income | | | (0.26 | ) | | | (0.22 | ) | | | (0.23 | ) | | | (0.23 | ) | | | (0.44 | ) |
From capital gains | | | — | | | | — | | | | — | | | | — | | | | (0.19 | ) |
| | | | | | | | | | | | | | | | | | | | |
Total Distributions | | | (0.26 | ) | | | (0.22 | ) | | | (0.23 | ) | | | (0.23 | ) | | | (0.63 | ) |
| | | | | | | | | | | | | | | | | | | | |
Net Increase/(Decrease) in Net Asset Value | | | 0.38 | | | | (0.10 | ) | | | 0.12 | | | | 0.43 | | | | (1.87 | ) |
| | | | | | | | | | | | | | | | | | | | |
Net Asset Value, End of Period | | $ | 7.84 | | | $ | 7.46 | | | $ | 7.56 | | | $ | 7.44 | | | $ | 7.01 | |
| | | | | | | | | | | | | | | | | | | | |
Total Return | | | 8.87 | % | | | 1.45 | % | | | 4.80 | % | | | 9.47 | % | | | (14.20 | )% |
Ratios/Supplemental Data: | | | | | | | | | | | | | | | | | | | | |
Net assets, End of Period (in 000s) | | $ | 45,635 | | | $ | 6,913 | | | $ | 23,653 | | | $ | 19,366 | | | $ | 43,298 | |
Ratios to Average Net Assets (excluding interest expense): | | | | | | | | | | | | | | | | | | | | |
Net investment income including reimbursement/waiver | | | 3.31 | % | | | 2.79 | % | | | 2.97 | % | | | 2.97 | % | | | 4.41 | % |
Operating expenses including reimbursement/waiver | | | 1.33 | %(e) | | | 1.44 | % | | | 1.41 | % | | | 1.44 | % | | | 1.61 | %(f) |
Operating expenses excluding reimbursement/waiver | | | 1.49 | % | | | 1.44 | % | | | 1.41 | % | | | 1.50 | % | | | 1.74 | % |
Ratios to Average Net Assets (including interest expense): | | | | | | | | | | | | | | | | | | | | |
Net investment income including reimbursement/waiver | | | 3.31 | % | | | 2.79 | % | | | 2.97 | % | | | 2.97 | % | | | 3.81 | % |
Operating expenses including reimbursement/waiver | | | 1.33 | %(e) | | | 1.44 | % | | | 1.41 | % | | | 1.44 | % | | | 2.21 | %(f) |
Operating expenses excluding reimbursement/waiver | | | 1.49 | % | | | 1.44 | % | | | 1.41 | % | | | 1.50 | % | | | 2.34 | % |
Portfolio Turnover Rate | | | 217 | % | | | 276 | % | | | 160 | % | | | 168 | % | | | 125 | % |
(a) Prior to June 1, 2016, Salient Tactical Muni & Credit Fund was known as Salient Tactical Muni Strategy Fund. Prior to May 1, 2016, Salient Tactical Muni Strategy Fund was known as Forward Credit Analysis Long/Short Fund.
(b) The information for the fiscal year ended December 31, 2015 has been audited by KPMG LLP, independent registered public accounting firm. The information for prior periods has been audited by the predecessor independent registered public accounting firm.
(c) Per share amounts are based upon average shares outstanding.
(d) The amount shown for a share outstanding throughout the period may not correlate with the Statement of Operations for the period due to the timing of sales and redemptions of Fund shares in relation to income earned and/or fluctuating market value of the investments of the Fund.
(e) Effective September 1, 2017, the annual expense limitation rate changed from 1.44% to 1.20%.
(f) Effective October 1, 2013, the annual expense limitation rate changed from 1.64% to 1.44%.
| | | | |
| See accompanying Notes to Financial Statements. | | 105 | | |
Financial Highlights
For a share outstanding throughout the periods presented.
Salient Tactical Muni & Credit Fund(a)
| | | | | | | | | | | | | | | | | | | | |
| | | Class A | |
| | | Year Ended
December 31,
2017 | | | Year Ended
December 31,
2016 | | | Year Ended
December 31,
2015(b) | | | Year Ended
December 31,
2014 | | | Year Ended
December 31,
2013 | |
Net Asset Value, Beginning of Period | | $ | 7.48 | | | $ | 7.59 | | | $ | 7.47 | | | $ | 7.04 | | | $ | 8.90 | |
Income/(Loss) from Operations: | | | | | | | | | | | | | | | | | | | | |
Net investment income(c) | | | 0.22 | | | | 0.16 | | | | 0.19 | | | | 0.17 | | | | 0.28 | |
Net realized and unrealized gain/(loss) on investments | | | 0.41 | | | | (0.09 | )(d) | | | 0.13 | | | | 0.45 | | | | (1.56 | ) |
| | | | | | | | | | | | | | | | | | | | |
Total from Investment Operations | | | 0.63 | | | | 0.07 | | | | 0.32 | | | | 0.62 | | | | (1.28 | ) |
| | | | | | | | | | | | | | | | | | | | |
| Less Distributions: | | | | | | | | | | | | | | | | | | | | |
From investment income | | | (0.23 | ) | | | (0.18 | ) | | | (0.20 | ) | | | (0.19 | ) | | | (0.39 | ) |
From capital gains | | | — | | | | — | | | | — | | | | — | | | | (0.19 | ) |
| | | | | | | | | | | | | | | | | | | | |
Total Distributions | | | (0.23 | ) | | | (0.18 | ) | | | (0.20 | ) | | | (0.19 | ) | | | (0.58 | ) |
| | | | | | | | | | | | | | | | | | | | |
Net Increase/(Decrease) in Net Asset Value | | | 0.40 | | | | (0.11 | ) | | | 0.12 | | | | 0.43 | | | | (1.86 | ) |
| | | | | | | | | | | | | | | | | | | | |
Net Asset Value, End of Period | | $ | 7.88 | | | $ | 7.48 | | | $ | 7.59 | | | $ | 7.47 | | | $ | 7.04 | |
| | | | | | | | | | | | | | | | | | | | |
Total Return(e) | | | 8.31 | % | | | 0.98 | % | | | 4.30 | % | | | 8.85 | % | | | (14.60 | )% |
Ratios/Supplemental Data: | | | | | | | | | | | | | | | | | | | | |
Net assets, End of Period (in 000s) | | $ | 8,020 | | | $ | 4,506 | | | $ | 5,969 | | | $ | 4,228 | | | $ | 4,576 | |
Ratios to Average Net Assets (excluding interest expense): | | | | | | | | | | | | | | | | | | | | |
Net investment income including reimbursement/waiver | | | 2.82 | % | | | 2.12 | % | | | 2.53 | % | | | 2.35 | % | | | 3.93 | % |
Operating expenses including reimbursement/waiver | | | 1.84 | %(f) | | | 1.94 | % | | | 1.91 | % | | | 1.94 | % | | | 2.11 | %(g) |
Operating expenses excluding reimbursement/waiver | | | 2.00 | % | | | 1.97 | % | | | 1.91 | % | | | 1.96 | % | | | 2.24 | % |
Ratios to Average Net Assets (including interest expense): | | | | | | | | | | | | | | | | | | | | |
Net investment income including reimbursement/waiver | | | 2.82 | % | | | 2.12 | % | | | 2.53 | % | | | 2.35 | % | | | 3.33 | % |
Operating expenses including reimbursement/waiver | | | 1.84 | %(f) | | | 1.94 | % | | | 1.91 | % | | | 1.94 | % | | | 2.71 | %(g) |
Operating expenses excluding reimbursement/waiver | | | 2.00 | % | | | 1.97 | % | | | 1.91 | % | | | 1.96 | % | | | 2.84 | % |
Portfolio Turnover Rate | | | 217 | % | | | 276 | % | | | 160 | % | | | 168 | % | | | 125 | % |
(a) Prior to June 1, 2016, Salient Tactical Muni & Credit Fund was known as Salient Tactical Muni Strategy Fund. Prior to May 1, 2016, Salient Tactical Muni Strategy Fund was known as Forward Credit Analysis Long/Short Fund.
(b) The information for the fiscal year ended December 31, 2015 has been audited by KPMG LLP, independent registered public accounting firm. The information for prior periods has been audited by the predecessor independent registered public accounting firm.
(c) Per share amounts are based upon average shares outstanding.
(d) The amount shown for a share outstanding throughout the period may not correlate with the Statement of Operations for the period due to the timing of sales and redemptions of Fund shares in relation to income earned and/or fluctuating market value of the investments of the Fund.
(e) Total return does not reflect the effect of sales charges.
(f) Effective September 1, 2017, the annual expense limitation rate changed from 1.94% to 1.70%.
(g) Effective October 1, 2013, the annual expense limitation rate changed from 2.14% to 1.94%.
| | | | |
| See accompanying Notes to Financial Statements. | | 106 | | |
Financial Highlights
For a share outstanding throughout the periods presented.
Salient Tactical Muni & Credit Fund(a)
| | | | | | | | | | | | | | | | | | | | |
| | | Class C | |
| | | Year Ended
December 31,
2017 | | | Year Ended
December 31,
2016 | | | Year Ended
December 31,
2015(b) | | | Year Ended
December 31,
2014 | | | Year Ended
December 31,
2013 | |
Net Asset Value, Beginning of Period | | $ | 7.53 | | | $ | 7.63 | | | $ | 7.51 | | | $ | 7.07 | | | $ | 8.93 | |
Income/(Loss) from Operations: | | | | | | | | | | | | | | | | | | | | |
Net investment income(c) | | | 0.19 | | | | 0.14 | | | | 0.15 | | | | 0.14 | | | | 0.24 | |
Net realized and unrealized gain/(loss) on investments | | | 0.40 | | | | (0.09 | )(d) | | | 0.12 | | | | 0.45 | | | | (1.56 | ) |
| | | | | | | | | | | | | | | | | | | | |
Total from Investment Operations | | | 0.59 | | | | 0.05 | | | | 0.27 | | | | 0.59 | | | | (1.32 | ) |
| | | | | | | | | | | | | | | | | | | | |
| Less Distributions: | | | | | | | | | | | | | | | | | | | | |
From investment income | | | (0.19 | ) | | | (0.15 | ) | | | (0.15 | ) | | | (0.15 | ) | | | (0.35 | ) |
From capital gains | | | — | | | | — | | | | — | | | | — | | | | (0.19 | ) |
| | | | | | | | | | | | | | | | | | | | |
Total Distributions | | | (0.19 | ) | | | (0.15 | ) | | | (0.15 | ) | | | (0.15 | ) | | | (0.54 | ) |
| | | | | | | | | | | | | | | | | | | | |
Net Increase/(Decrease) in Net Asset Value | | | 0.40 | | | | (0.10 | ) | | | 0.12 | | | | 0.44 | | | | (1.86 | ) |
| | | | | | | | | | | | | | | | | | | | |
Net Asset Value, End of Period | | $ | 7.93 | | | $ | 7.53 | | | $ | 7.63 | | | $ | 7.51 | | | $ | 7.07 | |
| | | | | | | | | | | | | | | | | | | | |
Total Return(e) | | | 7.90 | % | | | 0.55 | % | | | 3.68 | % | | | 8.46 | % | | | (14.98 | )% |
Ratios/Supplemental Data: | | | | | | | | | | | | | | | | | | | | |
Net assets, End of Period (in 000s) | | $ | 11,823 | | | $ | 11,839 | | | $ | 5,868 | | | $ | 9,466 | | | $ | 10,744 | |
Ratios to Average Net Assets (excluding interest expense): | | | | | | | | | | | | | | | | | | | | |
Net investment income including reimbursement/waiver | | | 2.39 | % | | | 1.75 | % | | | 2.03 | % | | | 1.89 | % | | | 3.48 | % |
Operating expenses including reimbursement/waiver | | | 2.31 | %(f) | | | 2.39 | % | | | 2.36 | % | | | 2.39 | % | | | 2.56 | %(g) |
Operating expenses excluding reimbursement/waiver | | | 2.46 | % | | | 2.41 | % | | | 2.36 | % | | | 2.41 | % | | | 2.69 | % |
Ratios to Average Net Assets (including interest expense): | | | | | | | | | | | | | | | | | | | | |
Net investment income including reimbursement/waiver | | | 2.39 | % | | | 1.75 | % | | | 2.03 | % | | | 1.89 | % | | | 2.88 | % |
Operating expenses including reimbursement/waiver | | | 2.31 | %(f) | | | 2.39 | % | | | 2.36 | % | | | 2.39 | % | | | 3.16 | %(g) |
Operating expenses excluding reimbursement/waiver | | | 2.46 | % | | | 2.41 | % | | | 2.36 | % | | | 2.41 | % | | | 3.29 | % |
Portfolio Turnover Rate | | | 217 | % | | | 276 | % | | | 160 | % | | | 168 | % | | | 125 | % |
(a) Prior to June 1, 2016, Salient Tactical Muni & Credit Fund was known as Salient Tactical Muni Strategy Fund. Prior to May 1, 2016, Salient Tactical Muni Strategy Fund was known as Forward Credit Analysis Long/Short Fund.
(b) The information for the fiscal year ended December 31, 2015 has been audited by KPMG LLP, independent registered public accounting firm. The information for prior periods has been audited by the predecessor independent registered public accounting firm.
(c) Per share amounts are based upon average shares outstanding.
(d) The amount shown for a share outstanding throughout the period may not correlate with the Statement of Operations for the period due to the timing of sales and redemptions of Fund shares in relation to income earned and/or fluctuating market value of the investments of the Fund.
(e) Total return does not reflect the effect of sales charges.
(f) Effective September 1, 2017, the annual expense limitation rate changed from 2.39% to 2.15%.
(g) Effective October 1, 2013, the annual expense limitation rate changed from 2.59% to 2.39%.
| | | | |
| See accompanying Notes to Financial Statements. | | 107 | | |
Financial Highlights
For a share outstanding throughout the periods presented.
Salient US Dividend Signal Fund(a)
| | | | | | | | | | | | |
| | | Investor Class(b) | |
| | | Year Ended
December 31,
2017 | | | Year Ended
December 31,
2016 | | | Year Ended
December 31,
2015 | |
Net Asset Value, Beginning of Period | | $ | 27.89 | | | $ | 23.88 | | | $ | 26.56 | |
Income/(Loss) from Operations: | | | | | | | | | | | | |
Net investment income(c) | | | 0.80 | | | | 0.14 | | | | 1.36 | |
Net realized and unrealized gain/(loss) on investments | | | 5.11 | | | | 4.03 | | | | (2.57 | ) |
| | | | | | | | | | | | |
Total from Investment Operations | | | 5.91 | | | | 4.17 | | | | (1.21 | ) |
| | | | | | | | | | | | |
Less Distributions: | | | | | | | | | | | | |
From investment income | | | (0.76 | ) | | | (0.16 | ) | | | (1.35 | ) |
From return of capital | | | — | | | | — | | | | (0.12 | ) |
| | | | | | | | | | | | |
Total Distributions | | | (0.76 | ) | | | (0.16 | ) | | | (1.47 | ) |
| | | | | | | | | | | | |
Net Increase/(Decrease) in Net Asset Value | | | 5.15 | | | | 4.01 | | | | (2.68 | ) |
| | | | | | | | | | | | |
Net Asset Value, End of Period | | $ | 33.04 | | | $ | 27.89 | | | $ | 23.88 | |
| | | | | | | | | | | | |
Total Return | | | 21.36 | % | | | 17.44 | % | | | (4.82 | )% |
Ratios/Supplemental Data: | | | | | | | | | | | | |
Net assets, End of Period (in 000s) | | $ | 1,654 | | | $ | 1,220 | | | $ | 764 | |
Ratios to Average Net Assets: | | | | | | | | | | | | |
Net investment income including reimbursement/waiver | | | 2.61 | % | | | 0.57 | % | | | 5.30 | % |
Operating expenses including reimbursement/waiver | | | 1.34 | % | | | 1.34 | % | | | 1.34 | % |
Operating expenses excluding reimbursement/waiver | | | 3.17 | % | | | 4.59 | % | | | 2.28 | % |
Portfolio Turnover Rate | | | 52 | % | | | 30 | % | | | 653 | % |
(a) Prior to May 1, 2016, Salient US Dividend Signal Fund was known as Forward Dynamic Income Fund.
(b) The Fund began offering Investor Class shares on January 2, 2015.
(c) Per share amounts are based upon average shares outstanding.
| | | | |
| See accompanying Notes to Financial Statements. | | 108 | | |
Financial Highlights
For a share outstanding throughout the periods presented.
Salient US Dividend Signal Fund(a)
| | | | | | | | | | | | | | | | | | | | |
| | | Institutional Class(b) | |
| | | Year Ended
December 31,
2017 | | | Year Ended
December 31,
2016 | | | Year Ended
December 31,
2015(c) | | | Year Ended
December 31,
2014 | | | Period Ended
December 31,
2013 | |
Net Asset Value, Beginning of Period | | $ | 27.92 | | | $ | 23.90 | | | $ | 26.56 | | | $ | 24.93 | | | $ | 25.00 | |
Income/(Loss) from Operations: | | | | | | | | | | | | | | | | | | | | |
Net investment income(d) | | | 1.14 | | | | 0.21 | | | | 1.63 | | | | 2.45 | | | | 0.77 | |
Net realized and unrealized gain/(loss) on investments | | | 4.90 | | | | 4.05 | | | | (2.75 | ) | | | 1.57 | | | | 0.03 | |
| | | | | | | | | | | | | | | | | | | | |
Total from Investment Operations | | | 6.04 | | | | 4.26 | | | | (1.12 | ) | | | 4.02 | | | | 0.80 | |
| | | | | | | | | | | | | | | | | | | | |
Less Distributions: | | | | | | | | | | | | | | | | | | | | |
From investment income | | | (0.82 | ) | | | (0.24 | ) | | | (1.41 | ) | | | (2.15 | ) | | | (0.82 | ) |
From capital gains | | | — | | | | — | | | | — | | | | (0.24 | ) | | | (0.01 | ) |
From return of capital | | | — | | | | — | | | | (0.13 | ) | | | — | | | | (0.04 | ) |
| | | | | | | | | | | | | | | | | | | | |
Total Distributions | | | (0.82 | ) | | | (0.24 | ) | | | (1.54 | ) | | | (2.39 | ) | | | (0.87 | ) |
| | | | | | | | | | | | | | | | | | | | |
Net Increase/(Decrease) in Net Asset Value | | | 5.22 | | | | 4.02 | | | | (2.66 | ) | | | 1.63 | | | | (0.07 | ) |
| | | | | | | | | | | | | | | | | | | | |
Net Asset Value, End of Period | | $ | 33.14 | | | $ | 27.92 | | | $ | 23.90 | | | $ | 26.56 | | | $ | 24.93 | |
| | | | | | | | | | | | | | | | | | | | |
Total Return | | | 21.75 | % | | | 17.89 | % | | | (4.45 | )% | | | 16.75 | % | | | 3.25 | %(e) |
Ratios/Supplemental Data: | | | | | | | | | | | | | | | | | | | | |
Net assets, End of Period (in 000s) | | $ | 3,298 | | | $ | 994 | | | $ | 4,730 | | | $ | 30,165 | | | $ | 2,987 | |
Ratios to Average Net Assets: | | | | | | | | | | | | | | | | | | | | |
Net investment income including reimbursement/waiver | | | 3.68 | % | | | 0.83 | % | | | 6.26 | % | | | 9.40 | % | | | 7.43 | %(f) |
Operating expenses including reimbursement/waiver | | | 0.99 | % | | | 0.99 | % | | | 0.99 | % | | | 1.20 | %(g) | | | 1.29 | %(f) |
Operating expenses excluding reimbursement/waiver | | | 2.76 | % | | | 3.74 | % | | | 1.38 | % | | | 1.96 | % | | | 5.67 | %(f) |
Portfolio Turnover Rate | | | 52 | % | | | 30 | % | | | 653 | % | | | 739 | % | | | 755 | %(e) |
(a) Prior to May 1, 2016, Salient US Dividend Signal Fund was known as Forward Dynamic Income Fund.
(b) The Fund began offering Institutional Class shares on August 1, 2013.
(c) The information for the fiscal year ended December 31, 2015 has been audited by KPMG LLP, independent registered public accounting firm. The information for prior periods has been audited by the predecessor independent registered public accounting firm.
(d) Per share amounts are based upon average shares outstanding.
(e) Not Annualized.
(f) Annualized.
(g) Effective December 1, 2014, the annual expense limitation rate changed from 1.29% to 0.99%.
| | | | |
| See accompanying Notes to Financial Statements. | | 109 | | |
Financial Highlights
For a share outstanding throughout the periods presented.
Salient US Dividend Signal Fund(a)
| | | | | | | | | | | | | | | | | | | | |
| | | Class A(b) | |
| | | Year Ended
December 31,
2017 | | | Year Ended
December 31,
2016 | | | Year Ended
December 31,
2015(c) | | | Year Ended
December 31,
2014 | | | Period Ended
December 31,
2013 | |
Net Asset Value, Beginning of Period | | $ | 27.82 | | | $ | 23.85 | | | $ | 26.53 | | | $ | 24.91 | | | $ | 25.00 | |
Income/(Loss) from Operations: | | | | | | | | | | | | | | | | | | | | |
Net investment income(d) | | | 0.81 | | | | 0.10 | | | | 1.38 | | | | 2.92 | | | | 0.68 | |
Net realized and unrealized gain/(loss) on investments | | | 5.04 | | | | 4.03 | | | | (2.63 | ) | | | 0.97 | | | | 0.07 | |
| | | | | | | | | | | | | | | | | | | | |
Total from Investment Operations | | | 5.85 | | | | 4.13 | | | | (1.25 | ) | | | 3.89 | | | | 0.75 | |
| | | | | | | | | | | | | | | | | | | | |
Less Distributions: | | | | | | | | | | | | | | | | | | | | |
From investment income | | | (0.72 | ) | | | (0.16 | ) | | | (1.31 | ) | | | (2.03 | ) | | | (0.79 | ) |
From capital gains | | | — | | | | — | | | | — | | | | (0.24 | ) | | | (0.01 | ) |
From return of capital | | | — | | | | — | | | | (0.12 | ) | | | — | | | | (0.04 | ) |
| | | | | | | | | | | | | | | | | | | | |
Total Distributions | | | (0.72 | ) | | | (0.16 | ) | | | (1.43 | ) | | | (2.27 | ) | | | (0.84 | ) |
| | | | | | | | | | | | | | | | | | | | |
Net Increase/(Decrease) in Net Asset Value | | | 5.13 | | | | 3.97 | | | | (2.68 | ) | | | 1.62 | | | | (0.09 | ) |
| | | | | | | | | | | | | | | | | | | | |
Net Asset Value, End of Period | | $ | 32.95 | | | $ | 27.82 | | | $ | 23.85 | | | $ | 26.53 | | | $ | 24.91 | |
| | | | | | | | | | | | | | | | | | | | |
Total Return(e) | | | 21.13 | % | | | 17.31 | % | | | (4.92 | )% | | | 16.19 | % | | | 3.05 | %(f) |
Ratios/Supplemental Data: | | | | | | | | | | | | | | | | | | | | |
Net assets, End of Period (in 000s) | | $ | 2,049 | | | $ | 1,549 | | | $ | 4,655 | | | $ | 8,485 | | | $ | 224 | |
Ratios to Average Net Assets: | | | | | | | | | | | | | | | | | | | | |
Net investment income including reimbursement/waiver | | | 2.66 | % | | | 0.39 | % | | | 5.34 | % | | | 11.50 | % | | | 6.58 | %(g) |
Operating expenses including reimbursement/waiver | | | 1.49 | % | | | 1.49 | % | | | 1.49 | % | | | 1.67 | %(h) | | | 1.79 | %(g) |
Operating expenses excluding reimbursement/waiver | | | 3.29 | % | | | 4.30 | % | | | 2.15 | % | | | 2.35 | % | | | 6.10 | %(g) |
Portfolio Turnover Rate | | | 52 | % | | | 30 | % | | | 653 | % | | | 739 | % | | | 755 | %(f) |
(a) Prior to May 1, 2016, Salient US Dividend Signal Fund was known as Forward Dynamic Income Fund.
(b) The Fund began offering Class A shares on August 1, 2013.
(c) The information for the fiscal year ended December 31, 2015 has been audited by KPMG LLP, independent registered public accounting firm. The information for prior periods has been audited by the predecessor independent registered public accounting firm.
(d) Per share amounts are based upon average shares outstanding.
(e) Total return does not reflect the effect of sales charges.
(f) Not Annualized.
(g) Annualized.
(h) Effective December 1, 2014, the annual expense limitation rate changed from 1.79% to 1.49%.
| | | | |
| See accompanying Notes to Financial Statements. | | 110 | | |
Notes to Financial Statements
December 31, 2017
1. ORGANIZATION
Forward Funds (the “Trust”), a Delaware statutory trust, is an open-end management investment company registered under the Investment Company Act of 1940, as amended (the “1940 Act”). As of December 31, 2017, the Trust has 14 registered funds. This annual report describes 9 series of the Trust (each a “Fund” and collectively, the “Funds”) under the brand name Salient. The accompanying financial statements and financial highlights relate to Salient Adaptive Balanced Fund (“Adaptive Balanced Fund”), Salient Adaptive Income Fund (“Adaptive Income Fund” ), (Adaptive Balanced Fund and Adaptive Income Fund are collectively referred to herein as the “Allocation Funds”), Salient Adaptive US Equity Fund (“Adaptive US Equity Fund”), Salient EM Infrastructure Fund (“EM Infrastructure Fund”), Salient International Dividend Signal Fund (“International Dividend Signal Fund”), Salient International Small Cap Fund (“International Small Cap Fund”), Salient Tactical Growth Fund (“Tactical Growth Fund”), Salient Tactical Muni & Credit Fund (“Tactical Muni & Credit Fund’), and Salient US Dividend Signal Fund (“US Dividend Signal Fund”).
The Funds are distributed by Forward Securities, LLC. The Investment Advisor of the Funds is Forward Management, LLC d/b/a Salient, (the “Advisor” or “Salient Management”).
Adaptive Balanced Fund is a “fund of funds” that seeks high potential capital appreciation and is a risk-targeted portfolio that invests in a combination of other Funds in the Trust and certain of the related investment companies managed by subsidiaries of Salient Partners, L.P. (together, the “Underlying Funds”), exchange-traded funds (“ETFs”), exchange-traded notes (“ETNs”), futures and other derivatives in order to gain exposure to global equity markets, global interest rate markets, global credit markets, and global commodity markets. Adaptive Income Fund is a “fund of funds” that seeks high current income and some stability of principal and is a risk-targeted portfolio that invests in Underlying Funds, ETFs, ETNs, futures and other derivatives in order to gain exposure to a range of income-producing global equity markets, global interest rate markets, and global credit markets. Adaptive US Equity Fund seeks capital growth and invests primarily in equity securities or ETFs traded principally on an exchange in the United States. EM Infrastructure Fund seeks total return through capital appreciation and current income through investing primarily in infrastructure-related securities issued by companies involved in the construction, development, financing or operation of infrastructure assets in emerging markets. International Dividend Signal Fund seeks to achieve high total return (capital appreciation and income) and invests primarily in the
equity securities of dividend paying companies located outside of the United States. International Small Cap Fund seeks to achieve long-term growth of capital and invests primarily in equity securities of companies with small market capitalizations located outside the United States. Tactical Growth Fund seeks to produce above-average, risk adjusted returns, in any market environment, while exhibiting less downside volatility than the S&P 500 Index and invests primarily in a portfolio of ETFs and futures on securities indices providing exposure to securities market indices, industries or sectors within U.S. and overseas equity markets. Tactical Muni & Credit Fund seeks to maximize total return (capital appreciation and income) by investing primarily in tax-exempt municipal bonds, other types of tax-exempt fixed income securities, and derivatives that provide similar exposure. US Dividend Signal Fund seeks total return, with dividend and interest income being an important component of that return, while exhibiting less downside volatility than the Russell 3000 Index by investing primarily in the equity securities of dividend paying companies domiciled in the United States.
Information presented in the accompanying Funds’ financial statements pertains to the Investor Class, Institutional Class, Class A, and Class C shares offered by the Funds.
At a meeting held on January 17, 2017, the Board of Trustees of the Trust (the “Board of Trustees”) approved, on behalf of EM Infrastructure Fund, International Dividend Signal Fund, International Small Cap Fund, Tactical Growth Fund and Tactical Muni & Credit Fund the termination of Advisor shares as share classes of the Funds. On March 29, 2017, outstanding Advisor Class shares of each Fund were exchanged at relative net asset value for Institutional Class shares of the same Fund having the same value.
At a meeting held on January 17, 2017, the Board of Trustees approved, on behalf of the Adaptive US Equity Fund and EM Infrastructure Fund the termination of Class Z shares and Class B shares as share classes of the Funds. On April 28, 2017, outstanding Class Z shares of Adaptive US Equity Fund were exchanged at relative net asset value for Institutional Class shares of the same Fund having the same value and outstanding Class B shares of EM Infrastructure Fund were exchanged at relative net asset value for Class A shares of the same Fund having the same value.
All classes of shares have identical rights to earnings, assets and voting privileges, except for class specific expenses and exclusive rights to vote on matters affecting only individual classes.
Notes to Financial Statements
December 31, 2017
Certain Funds invest a high percentage of their assets in specific sectors of the market. As a result, the economic and regulatory developments in a particular sector of the market, positive or negative, can have a greater impact on the relevant Fund’s net asset value and may cause its shares to fluctuate more than if the Fund did not concentrate its investments in a particular sector. The Allocation Funds are “funds of funds” that primarily invest in a combination of other Underlying Funds and ETFs to gain exposure to a particular portion of the market rather than purchasing securities directly. Investments in the Underlying Funds and ETFs expose the Allocation Funds to all of the risks of the Underlying Funds and ETFs and, in general, indirectly subject the Allocation Funds to a pro rata portion of the Underlying Funds’ and ETFs’ fees and expenses. Tactical Muni & Credit Fund is classified as a non-diversified fund under the 1940 Act. All other Funds are classified as diversified under the 1940 Act.
2. SIGNIFICANT ACCOUNTING POLICIES
(a) BASIS OF ACCOUNTING
The accounting and reporting policies of the Funds conform with U.S. generally accepted accounting principles (“U.S. GAAP”). The financial statements have been prepared in conformity with U.S. GAAP, which requires management to make estimates and assumptions relating to the reported amounts of assets and liabilities, and the disclosure of contingent assets and liabilities at the date of the financial statements and the reported amounts of income and expenses during the reporting period. Actual results may differ from those estimates and such differences may be significant. Each Fund is an investment company and follows the investment company accounting and reporting guidance under Financial Accounting Standards Board (“FASB”) Accounting Standards Codification (“ASC”) Topic 946, “Financial Services-Investment Companies”.
(b) PORTFOLIO VALUATION
Portfolio securities or contracts that are listed or traded on a national securities exchange, contract market or over-the-counter market and that are freely transferable are valued at the last sale price or a market’s official closing price on the valuation day. If there have been no sales that day, such securities or contracts are valued at the mean of the closing bid and ask prices. If no bid or ask prices are quoted before closing, such securities or contracts are valued either at the last available sale price or at fair value in accordance with procedures established by, and under the general supervision of, the Board of Trustees.
Debt securities that have an original maturity of more than 365 days or that are credit impaired are valued on the basis of the average of the latest bid and ask prices. Debt securities that have an original maturity of less than 365 days and that are not credit impaired are valued as follows: (a) maturity of 61 to 365 days, on the basis of the average of the latest bid and ask prices; and (b) maturity of 60 days or less, at amortized cost.
The Funds’ independent pricing vendors (approved by the Board of Trustees) use multiple valuation techniques to determine fair value. In instances where sufficient market activity exists, the pricing vendors may utilize a market-based approach through which quotes from market makers are used to determine value. In instances where sufficient market activity may not exist or is limited, the pricing vendors may also utilize proprietary valuation models which may consider market characteristics such as benchmark yield curves, option-adjusted spreads, credit spreads, estimated default rates, coupon rates, anticipated timing of principal repayments, underlying collateral, and other unique security features in order to estimate the relevant cash flows, which are then discounted to calculate the value.
In the event valuation information is not available from the Funds’ independent pricing vendors for a security held by a Fund, such security may be valued by alternate pricing methods, including the use of quotations obtained from dealers that make markets in such securities, or otherwise determined based on the fair value of such securities. To the extent that such securities do not trade on a valuation day and the last bid and ask prices are not available, the securities may be valued using matrix pricing or similar valuation methods from the Funds’ independent pricing vendors. Bonds that do not trade regularly and lower-rated bonds tend to be less liquid, and their values may be determined based on alternate or fair valuation methods (approved by the Board of Trustees) more frequently than portfolio holdings that are more frequently traded or that have relatively higher credit ratings.
If the Funds’ independent pricing vendors do not provide valuation information for swap contracts or structured notes held by a Fund, such swap contracts and structured notes may be valued by Salient Management, based on information from the structuring firm or issuer.
Futures, options on futures, and swap contracts that are listed or traded on a national securities exchange, commodities exchange, contract market or over-the-counter market and that are freely transferable are valued at their closing settlement price on the exchange on which they are primarily traded or based upon the current settlement price for a like
Notes to Financial Statements
December 31, 2017
instrument on the day on which the instrument is being valued. Over-the-counter futures, options on futures, and swap contracts for which market quotations are readily available are valued based on quotes received from independent pricing vendors or one or more dealers that make markets in such securities. If quotes are not available from an independent pricing vendor or dealers, over-the-counter futures, options on futures and swap contracts are valued using fair valuation methodologies.
Options on securities and options on indices are valued using the mean of the closing bid and ask prices of the securities or commodities exchange on which they are traded. If a mean price is not available, value shall be determined based on fair valuation methodologies. Certain investments including options may trade in the over-the-counter market and generally are valued based on the mean of the closing bid and ask prices obtained from an approved pricing service or Salient Management may determine value based on quotes from dealers that make markets in such securities.
Bank loans are primarily valued by using a composite loan price from an independent pricing vendor (approved by the Board of Trustees). The methodology used by the Funds’ independent pricing vendor for composite loan prices is to value loans at the mean of the bid and ask prices from one or more brokers or dealers.
Portfolio securities that are traded on foreign securities exchanges are generally valued at the last reported sale or closing price of such securities on their respective exchanges, except when an occurrence subsequent to the time a value was so established is likely to have changed such value. In such an event, the fair value of those securities is determined in good faith through consideration of other factors in accordance with procedures established by, and under the general supervision of, the Board of Trustees. Certain Funds will use a fair valuation model provided by independent pricing vendors, which is intended to reflect fair value when a security’s value is believed to have been materially affected by a valuation event that has occurred between the close of the exchange or market on which the security is traded and the close of the normal trading day of the NYSE, normally 4:00 p.m. Eastern Time. The Funds’ procedures set forth certain triggers that instruct when to use the fair valuation model. The value assigned to a security by the fair valuation model is a determination of fair value made under the Funds’ valuation procedures and under the supervision of the Board of Trustees. In such a case, a Fund’s value for a security may be different from the last sales price (or the latest closing price) and there is no guarantee that a fair valued security will be sold at the price at which a Fund is valuing the security.
Forward currency contracts have a market value determined by the prevailing daily foreign currency exchange rates and current foreign currency exchange forward rates. The foreign currency exchange forward rates are calculated using an automated system that estimates rates on the basis of the current day foreign currency exchange rates and forward foreign currency exchange rates supplied by a pricing vendor. Foreign currency exchange rates and foreign currency exchange forward rates may generally be obtained at the close of the NYSE, normally 4:00 p.m. Eastern Time.
Redeemable securities issued by open-end registered investment companies, including the Underlying Funds, are valued at the investment company’s applicable net asset value, with the exception of exchange-traded products which are priced as equity securities.
All other securities and other assets are carried at their fair value as determined in good faith using methodologies approved by the Board of Trustees. The valuation methodologies include: analysis of recent public transactions in securities or assets of the same class or that are highly similar; analysis of recent private transactions in securities or assets of the same class or that are highly similar; analysis of information that provides a reasonable basis for valuation, such as appraisals, analysts’ reports, and valuation models; and cost, if other valuation methods are not available.
(c) SECURITIES TRANSACTIONS AND INVESTMENT INCOME
For financial statement purposes, securities transactions are accounted for on a trade date basis. Accordingly, differences between the net asset values for financial statement purposes and for executing shareholder transactions may arise. Realized gains or losses on sales of securities are determined by the identified cost method. Interest income, adjusted for accretion of discounts and amortization of premiums, is recorded on the accrual basis. Dividend income is recorded on the ex-dividend date, except that certain dividends from foreign securities where the ex-dividend date may have passed are recorded as soon as a Fund is informed of such dividends in the exercise of reasonable diligence. If applicable, any foreign capital gains taxes are accrued, net of unrealized gains, and are payable upon the sale of such investments.
(d) FOREIGN CURRENCY TRANSLATION
The books and records of the Funds are maintained in U.S. dollars. Investment valuations and other assets and liabilities initially expressed in foreign currencies are converted each business day into U.S. dollars based upon current exchange rates. Prevailing foreign exchange rates
Notes to Financial Statements
December 31, 2017
may generally be obtained at the close of the NYSE, normally 4:00 p.m. Eastern Time. The portion of realized and unrealized gains or losses on investments due to fluctuations in foreign currency exchange rates is not separately disclosed.
(e) MASTER LIMITED PARTNERSHIPS (“MLPs”)
Entities commonly referred to as MLPs are generally organized under state law as limited partnerships or limited liability companies. Certain Funds may invest in MLPs receiving partnership taxation treatment under the Internal Revenue Code of 1986, as amended (the “Code”), and whose interests or “units” are traded on securities exchanges like shares of corporate stock. To be treated as a partnership for U.S. federal income tax purposes, an MLP whose units are traded on a securities exchange must receive at least 90% of its income from qualifying sources such as interest, dividends, real property rents, gains on dispositions of real property, income and gains from mineral or natural resources activities, income and gains from the transportation or storage of certain fuels, and, in certain circumstances, income and gains from commodities or futures, forwards and options on commodities. Mineral or natural resources activities include exploration, development, production, processing, mining, refining, marketing and transportation (including pipelines) of oil and gas, minerals, geothermal energy, fertilizer, timber or industrial source carbon dioxide. An MLP consists of a general partner and limited partners (or in the case of MLPs organized as limited liability companies, a managing member and members).
The general partner or managing member typically controls the operations and management of the MLP and has an ownership stake in the partnership or limited liability company. The limited partners or members, through their ownership of limited partner or member interests, provide capital to the entity, are intended to have no role in the operation and management of the entity and receive cash distributions. Investments in MLPs consist only of limited partner or member interest ownership. The MLPs themselves generally do not pay U.S. federal income taxes. Thus, unlike investors in corporate securities, direct MLP investors are generally not subject to double taxation (i.e., corporate level tax and tax on corporate dividends). Currently, most MLPs operate in the energy and/or natural resources sector.
(f) SHORT SALES
Certain Funds may sell securities short. Short sales are transactions in which a Fund sells a security that it does not own in anticipation of a decline in the value of that security. To complete such a transaction, a
Fund must borrow the security to deliver to the buyer. The Fund is then obligated to replace the security borrowed by purchasing it in the open market at some later date. The Fund bears the risk of a loss if the market price of the security increases between the date of the short sale and the date on which the Fund replaces the borrowed security. The Fund will realize a gain if the security declines in value between those dates. There can be no assurance that securities necessary to cover a short position will be available for purchase. All short sales must be fully collateralized. The Fund maintains collateral consisting of cash, U.S. government securities or other liquid assets in an amount at least equal to the value of their respective short positions. The Fund is liable for any dividends or interest payable on securities while those securities are in a short position. The Fund typically intends to hold securities sold short for the short term; therefore, they are excluded from the purchases and sales of investments in Note 9 and the Fund’s Portfolio Turnover Calculation in the Financial Highlights. As of December 31, 2017, the Funds held no securities sold short.
(g) DERIVATIVE INSTRUMENTS AND HEDGING ACTIVITIES
The following discloses the Funds’ use of derivative instruments and hedging activities.
The Funds’ investment objectives not only permit the Funds to purchase investment securities but also allow certain Funds to enter into various types of derivative contracts, including, but not limited to, futures contracts, swap contracts, forward currency contracts, and purchased and written options. In doing so, the Funds will employ strategies in differing combinations to permit them to increase, decrease, or change the level or types of exposure to market factors. Central to those strategies are features inherent to derivatives that make them more attractive for this purpose than equity or debt securities: they require little or no initial cash investment, they can focus exposure on only certain selected risk factors, and they may not require the ultimate receipt or delivery of the underlying security (or securities) to the contract. This may allow the Funds to pursue their objectives more quickly and efficiently than if they were to make direct purchases or sales of securities capable of affecting a similar response to market factors.
Market Risk Factors: In pursuit of their investment objectives, certain Funds may use derivatives that increase or decrease a Fund’s exposure to the following market risk factors:
Credit Risk: Credit risk is the risk an issuer will be unable to make principal and interest payments when due, or will default on its obligations.
Notes to Financial Statements
December 31, 2017
Commodity Risk: Exposure to the commodities markets may subject the Funds to greater volatility than investments in traditional securities. Prices of various commodities may also be affected by factors, such as drought, floods, weather, livestock disease, embargoes, tariffs and international economic, political and regulatory developments. The prices of commodities can also fluctuate widely due to supply and demand disruptions in major producing or consuming regions.
Equity Risk: Equity risk relates to the change in value of equity securities as they relate to increases or decreases in the general market.
Foreign Exchange Rate Risk: Foreign exchange rate risk relates to the change in the U.S. dollar value of a security held that is denominated in a foreign currency. The value of a foreign currency denominated security will decrease as the dollar appreciates against the currency, while the value of the foreign currency denominated security will increase as the dollar depreciates against the currency.
Interest Rate Risk: Interest rate risk refers to the fluctuations in value of fixed-income securities resulting from the inverse relationship between price and yield. For example, an increase in general interest rates will tend to reduce the market value of already issued fixed income investments, and a decline in general interest rates will tend to increase the value of such investments. In addition, debt securities with longer maturities, which tend to have higher yields, are subject to potentially greater fluctuations in value from changes in interest rates than obligations with shorter maturities.
Risk of Investing in Derivatives: The Funds’ use of derivatives can result in losses due to unanticipated changes in the market risk factors and the overall market. In instances where the Funds are using derivatives to decrease or hedge exposures to market risk factors for securities held by the Funds, there are also risks that those derivatives may not perform as expected, resulting in losses for the combined or hedged positions.
Derivatives may have little or no initial cash investment relative to their market value exposure and therefore can produce significant gains or losses in excess of their cost. This use of embedded leverage allows the Funds to increase their market value exposure relative to their net assets and can substantially increase the volatility of the Funds’ performance.
Additional associated risks from investing in derivatives also exist and potentially could have significant effects on the valuation of the derivative and the Funds. Typically, the associated risks are not the risks that the Funds are attempting to increase or decrease exposure to, per their investment objectives, but are the additional risks from investing in derivatives.
Examples of these associated risks are liquidity risk, which is the risk that the Funds will not be able to settle the derivative in the open market in a timely manner, and counterparty credit risk, which is the risk that the counterparty will not fulfill its obligation to the Funds. Associated risks can be different for each type of derivative and are discussed by each derivative type in the notes that follow.
Futures: Adaptive US Equity Fund, International Dividend Signal Fund and Tactical Muni & Credit Fund invested in futures contracts in accordance with their investment objectives during the year ended December 31, 2017. Each Fund does so for a variety of reasons, including for cash management, hedging or non-hedging purposes in an attempt to achieve investment returns consistent with the Fund’s investment objective. A futures contract provides for the future sale by one party and purchase by another party of a specified quantity of the security or other financial instrument at a specified price and time. A futures contract on an index is an agreement pursuant to which two parties agree to take or make delivery of an amount of cash equal to the difference between the value of the index at the close of the last trading day of the contract and the price at which the index contract was originally written. Futures transactions may result in losses in excess of the amount invested in the futures contract. There can be no guarantee that there will be a correlation between price movements in the hedging vehicle and in the portfolio securities being hedged. An incorrect correlation could result in a loss on both the hedged securities in a Fund and the hedging vehicle so that the portfolio return might have been greater had hedging not been attempted. There can be no assurance that a liquid market will exist at a time when a Fund seeks to close out a futures contract or a futures option position. Lack of a liquid market for any reason may prevent a Fund from liquidating an unfavorable position, and the Fund would remain obligated to meet margin requirements until the position is closed. In addition, a Fund could be exposed to risk if the counterparties to the contracts are unable to meet the terms of their contracts. With exchange-traded futures, there is minimal counterparty credit risk to the Funds since futures are exchange-traded and the exchange’s clearinghouse, as counterparty to all exchange-traded futures, guarantees the futures against default.
Notes to Financial Statements
December 31, 2017
When a purchase or sale of a futures contract is made by a Fund, the Fund is required to deposit with its custodian (or broker, if legally permitted) a specified amount of liquid assets (“initial margin”). The margin required for a futures contract is set by the exchange on which the contract is traded and may be modified during the term of the contract. The initial margin is in the nature of a performance bond or good faith deposit on the futures contract that is returned to a Fund upon termination of the contract, assuming all contractual obligations have been satisfied. Each day a Fund may pay or receive cash, called “variation margin,” equal to the daily change in value of the futures contract. Such payments or receipts are recorded for financial statement purposes as unrealized gains or losses by a Fund. Variation margin does not represent a borrowing or loan by a Fund but is instead a settlement between a Fund and the broker of the amount one would owe the other if the futures contract expired. When the contract is closed, a Fund records a realized gain or loss equal to the difference between the value of the contract at the time it was opened and the value at the time it was closed.
Option Writing/Purchasing: Certain Funds may write or purchase option contracts to adjust the risk and return of their overall investment positions. When a Fund writes or purchases an option, an amount equal to the premium received or paid by the Fund is recorded as a liability or an asset and is subsequently adjusted to the current market value of the option written or purchased. Premiums received or paid from writing or purchasing options that expire unexercised are treated by the Fund on the expiration date as realized gains or losses. The difference between the premium and the amount paid or received on affecting a closing purchase or sale transaction, including brokerage commissions, is also treated as a realized gain or loss. If an option is exercised, the premium paid or received is added to the cost of the purchase, or proceeds from the sale, in determining whether the Fund has realized a gain or loss on investment transactions. Risks from entering into option transactions arise from the potential inability of counterparties to meet the terms of the contracts, the potential inability to enter into closing transactions because of an illiquid secondary market and unexpected movements in security values. The Funds held no purchased or written options during the year ended December 31, 2017.
Swaps: Certain Funds may enter into interest rate, index, equity, currency exchange rate, total return and credit default swap agreements, as well as purchase and sell options to enter into such swap agreements, for hedging and non-hedging purposes. These transactions would be entered into in an attempt to obtain a particular return when it is considered desirable to do so, possibly at a lower cost to a Fund than
if the Fund had invested directly in the asset that yielded the desired return. Swap agreements may be executed in a multilateral or other trade facility program, such as a registered exchange (“centrally cleared swaps”) or may be privately negotiated in the over-the-counter market. The duration of a swap agreement typically ranges from a few weeks to more than one year. In a standard swap transaction, two parties agree to exchange the returns (or differentials in rates of return) earned or realized on particular predetermined investments or instruments, which may be adjusted for an interest factor. The gross returns to be exchanged or “swapped” between the parties are generally calculated with respect to a “notional amount” (i.e., the return on or increase in value of a particular dollar amount invested at a particular interest rate, in a particular foreign currency, or in a “basket” of securities representing a particular index). In a centrally cleared swap, immediately following execution of the swap agreement, the swap agreement is novated to a central counterparty (the “CCP”) and the Fund’s counterparty on the swap agreement becomes the CCP.
Forms of swap agreements include interest rate caps, under which, in return for a premium, one party agrees to make payments to the other to the extent that interest rates exceed a specified rate, or “cap”; interest rate floors, under which, in return for a premium, one party agrees to make payments to the other to the extent that interest rates fall below a specified level, or “floor”; and interest rate collars, under which a party sells a cap and purchases a floor, or vice versa, in an attempt to protect itself against interest rate movements exceeding given minimum or maximum levels.
Credit default swaps are a type of swap agreement in which the protection “buyer” is generally obligated to pay the protection “seller” an upfront and/ or a periodic stream of payments over the term of the contract provided that no credit event, such as a default, on a reference obligation has occurred. The credit default swap agreement may have as reference obligations one or more securities that are not currently held by a Fund. If a credit event occurs, the seller generally must pay the buyer the “par value” (full notional value) of the swap in exchange for an equal face amount of deliverable obligations of the reference entity described in the swap, or the seller may be required to deliver the related net cash amount if the swap is cash settled. A Fund may be either the buyer or seller in the transaction. If a Fund is a buyer and no credit event occurs, the Fund may recover nothing if the swap is held through its termination date. However, if a credit event occurs, the buyer generally may elect to receive the full notional value of the swap in exchange for an equal face amount of deliverable obligations of the reference entity whose value may have significantly decreased. As a
Notes to Financial Statements
December 31, 2017
seller, a Fund generally receives an upfront payment and/or a fixed rate of income throughout the term of the swap provided that there is no credit event. As the seller, a Fund would effectively add leverage to its portfolio because, in addition to its total net assets, the Fund would be subject to investment exposure on the notional amount of the swap. Credit default swap agreements involve greater risks than if a Fund had invested in the reference obligation directly since, in addition to general market risks, credit default swaps are subject to illiquidity risk, counterparty risk and credit risk. A Fund will enter into credit default swap agreements only with counterparties that meet certain standards of creditworthiness or that are centrally cleared.
Total return swap agreements are contracts in which one party agrees to make periodic payments based on the change in market value of underlying assets, which may include a specified security, basket of securities, defined portfolios of bonds, loans and mortgages, or securities indexes during the specified period in return for periodic payments based on a fixed or variable interest rate or the total return from other underlying assets or indices. Total return swap agreements may be used to obtain exposure to a security or market index without owning or taking physical custody of such security or component securities of a market index. Total return swap agreements may effectively add leverage to a Fund’s portfolio because, in addition to its total net assets, the Fund would be subject to investment exposure on the notional amount of the swap. Total return swaps are a mechanism for the user to accept the economic benefits of asset ownership without utilizing the balance sheet. The other leg of the swap, usually the London Interbank Offered Rate (LIBOR), is spread to reflect the non-balance sheet nature of the product. Total return swaps can be designed with any underlying asset agreed upon between two parties. Typically no notional amounts are exchanged with total return swaps. Total return swap agreements entail the risk that a party will default on its payment obligations to a Fund there under. Swap agreements also entail the risk that a Fund will not be able to meet its obligation to the counterparty. Generally, a Fund will enter into total return swaps on a net basis (i.e., the two payment streams are netted out with the Fund receiving or paying, as the case may be, only the net amount of the two payments).
Most swap agreements entered into by a Fund calculate the obligations of the parties to the agreement on a “net basis.” Consequently, a Fund’s current obligations (or rights) under a swap agreement will generally be equal only to the net present value of amounts to be paid or received under the agreement based on the relative values of the positions held by each party to the agreement (the “net amount”). A Fund’s current
obligations under a swap agreement will be accrued daily (offset against amounts owed to the Fund), and any accrued but unpaid net amounts owed to a swap counterparty will be covered in accordance with applicable regulatory requirements to limit any potential leveraging of a Fund’s portfolio. Any net amount accrued but not yet paid to a Fund by the counterparty under a swap agreement (i.e., the Fund’s current rights under the swap agreement) is recorded as unrealized appreciation until the amount is paid to the Fund. The Fund’s maximum risk of loss from counterparty credit risk is generally limited to the net payment to be received by the Fund and/or the termination value at the end of the contract. Obligations under swap agreements so covered will not be construed to be “senior securities” for purposes of the Funds’ investment restriction concerning senior securities.
Whether a Fund’s use of swap agreements will be successful in furthering its investment objective will depend on Salient Management’s ability to correctly predict whether certain types of investments are likely to produce greater returns than other investments. Swap agreements that cannot be terminated or sold within seven days may be considered to be illiquid investments. Moreover, a Fund bears the risk of loss of the amount expected to be received under a swap agreement in the event of the default or bankruptcy of a swap agreement counterparty. Although centrally cleared swaps typically present less counterparty risk than non-centrally cleared swaps, a Fund that has entered into centrally cleared swaps is subject to the risk of the failure of the CCP. A Fund will enter into swap agreements only with counterparties that meet certain standards for creditworthiness (generally, such counterparties would have to be eligible counterparties under the terms of the Fund’s repurchase agreement guidelines) or that are centrally cleared. Certain restrictions imposed on the Funds by the Code may limit a Fund’s ability to use swap agreements. It is possible that developments in the swap market, including additional government regulation, could adversely affect a Fund’s ability to terminate existing swap agreements or to realize amounts to be received under such agreements.
International Swaps and Derivatives Association, Inc. Master Agreements (“ISDA Master Agreements”) govern over-the-counter financial derivative transactions entered into by a Fund and those counterparties The ISDA Master Agreements maintain provisions for general obligations, representations, agreements, collateral and events of default or termination. Events of termination include conditions that may entitle counterparties to elect to terminate early and cause settlement of all outstanding transactions under the applicable ISDA Master Agreement. Any election to terminate early could be material to the financial statements.
Notes to Financial Statements
December 31, 2017
During the year ended December 31, 2017, Tactical Muni & Credit Fund invested in swap agreements consistent with the Funds’ investment strategies to gain exposure to certain markets or indices. No Funds held swap agreements at December 31, 2017.
The values in the following tables exclude the effects of cash collateral received or posted pursuant to these derivative contracts, and therefore are not necessarily representative of the Funds’ net exposure. Cash held as collateral is in a segregated account with the Funds’ custodian and is reflected in the Statement of Assets and Liabilities.
Balance Sheet – Fair Value of Derivative Instruments as of December 31, 2017:
| | | | | | | | | | | | |
Derivatives not Accounted
for as Hedging Instruments | | Asset Derivatives
Balance Sheet Location | | Fair
Value | | | Liabilities Derivatives
Balance Sheet Location | | Fair
Value | |
| Adaptive US Equity Fund | | | | | | | | | | | | |
Equity Contracts (Futures Contracts) | | Variation margin receivable for futures contracts | | $ | 27,352 | (a) | | | | $ | — | |
| | | | | | | | | | | | |
Total | | | | $ | 27,352 | | | | | $ | — | |
| | | | | | | | | | | | |
| Tactical Muni & Credit Fund | | | | | | | | | | | | |
Fixed Income Contracts (Futures Contracts) | | Variation margin receivable for futures contracts | | $ | 42,110 | (a) | | | | $ | — | |
| | | | | | | | | | | | |
Total | | | | $ | 42,110 | | | | | $ | — | |
| | | | | | | | | | | | |
(a) Includes the cumulative appreciation/depreciation of futures contracts as reported in the Schedules of Investments. Only the current day’s net variation margin is reported within the Statements of Assets and Liabilities.
The gains/(losses) in the following table are included in “Net realized gain/(loss)” or “Net change in unrealized gain/(loss)” on the Statement of Operations.
The Effect of Derivative Instruments on the Statement of Operations for the year ended December 31, 2017:
| | | | | | | | | | |
Derivatives not Accounted
for as Hedging Instruments | | Location of Gain/(Loss) on
Derivatives Recognized in Income | | Realized
Gain/(Loss)
on Derivatives
Recognized
in Income | | | Change in
Unrealized
Gain/(Loss)
on Derivatives
Recognized
in Income | |
| Adaptive US Equity Fund | | | | | | | | | | |
Equity Contracts (Futures Contracts) | | Net realized gain on futures contracts/Net change in unrealized appreciation/depreciation on futures contracts | | $ | 1,375,488 | | | $ | (37,061 | ) |
| | | | | | | | | | |
Total | | | | $ | 1,375,488 | | | $ | (37,061 | ) |
| | | | | | | | | | |
| International Dividend Signal Fund | | | | | | | | | | |
Equity Contracts (Futures Contracts) | | Net realized gain on futures contracts/Net change in unrealized appreciation/depreciation on futures contracts | | $ | 1,381,413 | | | $ | (42,026 | ) |
| | | | | | | | | | |
Total | | | | $ | 1,381,413 | | | $ | (42,026 | ) |
| | | | | | | | | | |
| International Small Cap Fund | | | | | | | | | | |
Equity Contracts (Rights) | | Net realized loss on investments/ Net change in unrealized appreciation/depreciation on investments | | $ | — | | | $ | (49,739 | ) |
| | | | | | | | | | |
Total | | | | $ | — | | | $ | (49,739 | ) |
| | | | | | | | | | |
Notes to Financial Statements
December 31, 2017
| | | | | | | | | | |
Derivatives not Accounted
for as Hedging Instruments | | Location of Gain/(Loss) on
Derivatives Recognized in Income | | Realized
Gain/(Loss)
on Derivatives
Recognized
in Income | | | Change in
Unrealized
Gain/(Loss)
on Derivatives
Recognized
in Income | |
| Tactical Muni & Credit Fund | | | | | | | | | | |
Fixed Income Contracts (Futures Contracts) | | Net realized loss on futures contracts/Net change in unrealized appreciation/depreciation on futures contracts | | $ | (74,145 | ) | | $ | (43,108 | ) |
Fixed Income Contracts (Interest Rate Swaps) | | Net realized gain on swap contracts/ Net change in unrealized appreciation/depreciation on swap contracts | | $ | 129,566 | | | $ | (125,961 | ) |
| | | | | | | | | | |
Total | | | | $ | 55,421 | | | $ | (169,069 | ) |
| | | | | | | | | | |
The following is a summary of the average month-end notional value of futures contracts, swap agreements and rights purchased and sold by the Funds for the year ended December 31, 2017, as well as the notional amount of futures contracts, swap agreements and rights outstanding as of December 31, 2017. Average values reflected as zero indicate no month-end holdings in derivatives during the year:
| | | | | | | | |
| | | Average
Month-End
Notional
Value | | | Notional Value
Outstanding at
December 31,
2017 | |
| Adaptive US Equity Fund | | | | | | | | |
Futures Contracts Purchased | | $ | 7,586,399 | | | $ | 15,119,400 | |
| International Dividend Signal Fund | | | | | | | | |
Futures Contracts Purchased | | $ | 4,185,972 | | | | — | |
| International Small Cap Fund | | | | | | | | |
Rights | | $ | 77,483 | | | | — | |
| Tactical Muni & Credit Fund | | | | | | | | |
Futures Contracts Sold | | $ | 9,359,393 | | | $ | 15,733,500 | |
Interest rate swap agreements | | | 155,843 | | | | — | |
Certain derivative contracts are executed under either standardize netting agreements or, for exchange-traded derivatives, the relevant contracts for a particular exchange that contain enforceable netting provisions. A derivative netting arrangement creates an enforceable right of setoff that becomes effective, and affects the realization of settlement on individual assets, liabilities and collateral amounts, only following a specified event of default or early termination. Default events may include the failure to make payments or deliver securities timely, material adverse changes in financial condition or insolvency, the breach of minimum regulatory capital requirements, or loss of license, charter or other legal authorization necessary to perform under the contract. There were no derivative financial instruments that are subject to enforceable netting arrangements or other similar agreements as of December 31, 2017.
Warrants: Certain Funds may invest in warrants. A Fund may purchase warrants issued by domestic and foreign companies to purchase newly created equity securities consisting of common and preferred stock. Warrants are securities that give the holder the right, but not the obligation, to purchase equity issues of the company issuing the warrants, or a related company, at a fixed price either on a certain date or during a set period. The equity security underlying a warrant is authorized at the time the warrant is issued or is issued together with the warrant. Investing in warrants can provide a greater potential for profit or loss than an equivalent investment in the underlying security and, thus, can be a speculative investment. At the time of issue, the cost of a warrant is substantially less than the cost of the underlying security itself, and price movements in the underlying security are generally magnified in the price movements of the warrant.
The leveraging effect enables the investor to gain exposure to the underlying security with a relatively low capital investment. This leveraging increases an investor’s risk, as a complete loss of the amount invested in the warrant may result in the event of a decline in the value of the underlying security. In addition, the price of a warrant tends to be more volatile than, and may not correlate exactly to, the price of the underlying security. If the market price of the underlying security is below the exercise price of the warrant on its expiration date, the warrant will generally expire without value. The value of a warrant may decline because of a decline in the value of the underlying security, the passage of time, changes in interest rates or in the dividend or other policies of the company whose equity underlies the warrant, a change in the perception as to the future price of the underlying security, or any combination thereof. Warrants generally pay no dividends and confer no voting or other rights other than to purchase the underlying security. No Funds held warrants as of December 31, 2017.
Notes to Financial Statements
December 31, 2017
(h) CASH MANAGEMENT TRANSACTIONS
The Funds may hold cash balances in bank demand deposit accounts with the Funds’ custodian, Citibank, N.A. (“Citibank”). Such amounts are readily accessible to purchase investments or pay Fund expenses. The Funds consider liquid assets deposited in a bank demand deposit account to be cash equivalents. Cash and cash equivalents are valued at cost plus any accrued interest. The Funds may maintain demand deposit accounts that have an aggregate value in excess of Federal Deposit Insurance Corporation (“FDIC”) insurance limits. As a result, the Funds may be exposed to credit risk in the event of insolvency or other failure of Citibank to meet its obligations.
(i) COMMODITY FUTURES TRADING COMMISSION REGULATION
Adaptive Balanced Fund and Adaptive US Equity Fund are each subject to regulation as a commodity pool under the Commodity Exchange Act pursuant to rules enacted by the Commodity Futures Trading Commission (the “CFTC”). The Advisor has registered with the CFTC as a Commodity Pool Operator and is a member of the National Futures Association. As a result, additional CFTC mandated disclosure, reporting and recordkeeping obligations are in effect with respect to this Fund. Compliance with the CFTC’s ongoing regulatory compliance requirements could increase each of these Fund’s expenses, adversely affecting its total return.
(j) LEVERAGE
International Dividend Signal Fund and US Dividend Signal Fund may purchase securities with borrowed money, including bank overdrafts (a form of leverage). The Funds may borrow amounts up to one-third of the value of its assets after giving effect to such borrowing. Leverage exaggerates the effect on the net asset value of any increase or decrease in the market value of the Funds’ portfolio securities. These borrowings will be subject to interest costs, which may or may not be recovered by appreciation of the securities purchased. In certain cases, interest costs may exceed the return received on the securities purchased.
International Dividend Signal Fund and US Dividend Signal Fund maintain separate lines of credit with BNP Paribas (acting through its New York Branch). The Funds are charged interest of 1.20% above the one-month LIBOR for borrowing under these agreements.
International Dividend Signal Fund also maintains a separate line of credit with Société Générale. For borrowings under this agreement, the Fund is charged interest of 0.95% above the one-month LIBOR. Additionally, if the borrowed amount by a Fund is below 80% of the Fund’s
facility limit, the Fund is charged a commitment fee of 0.35% per annum on the amount between the facility limit and borrowed amount.
US Dividend Signal Fund did not borrow under its line of credit agreement during the year ended December 31, 2017. International Dividend Signal Fund has pledged a portion of its investment securities as the collateral for its lines of credit. As of December 31, 2017, the value of the investment securities pledged as collateral and the borrowed amounts on the lines of credit by International Dividend Signal Fund were $28,913,149 and $7,353,712, respectively. The average interest rate charged and the average outstanding loan payable for the year ended December 31, 2017 by International Dividend Signal Find was 2.080% and $7,336,038, respectively.
(k) DISTRIBUTIONS TO SHAREHOLDERS
Dividends from net investment income, if any, are declared and paid annually for Adaptive US Equity Fund, International Small Cap Fund and Tactical Growth Fund; quarterly for Adaptive Balanced Fund, EM Infrastructure Fund, International Dividend Signal Fund, Tactical Muni & Credit Fund and US Dividend Signal Fund; and monthly for Adaptive Income Fund. For all Funds, net realized capital gains, if any, are normally distributed annually in December, and a spillover capital gain distribution, if any, is distributed in the year after which a Fund elects to treat the distribution as paid for Federal income tax purposes. There is no guarantee that the Funds will continue paying dividends.
Income and capital gain distributions are determined in accordance with Federal income tax regulations, which may differ from GAAP. Therefore, the source of the Funds’ distributions may be shown in the accompanying financial statements as either from or in excess of net investment income or net realized gain or from paid-in-capital depending upon the type of book/ tax differences that may exist.
Based on information provided by the Real Estate Investment Trusts (“REITs”), the Funds recharacterize distributions received from REIT investments into the following categories: ordinary income, long-term capital gains, and return of capital. If information is not available on a timely basis from the REITs, the recharacterization will be estimated based on available information that may include the previous year’s allocation. If new or additional information becomes available from the REITs at a later date, a recharacterization will be made in the following annual financial reporting period. There is no guarantee that the REITs held by the Funds will continue to pay dividends. The Funds record as dividend income the amount recharacterized as ordinary income and as realized gain the amount recharacterized as long-term capital gain in
Notes to Financial Statements
December 31, 2017
the Statement of Operations, and the amount recharacterized as a return of capital as a reduction to the cost of investments in the Statement of Assets and Liabilities and in the Schedule of Investments. These recharacterizations are reflected in the accompanying financial statements.
Distributions received from a Funds’ investments in MLPs generally are comprised of income, capital gains and return of capital. A Fund records investment income and return of capital based on estimates made at the time such distributions are received. Such estimates are based on historical information available from each MLP and other industry sources. These estimates may subsequently be revised based on information received from MLPs after their tax reporting periods are concluded.
(l) FEDERAL INCOME TAXES
The Trust treats each Fund as a separate entity for Federal income tax purposes. Each Fund intends to continue to qualify each year as a “regulated investment company” under Subchapter M of the Code. By so qualifying, each Fund will not be subject to Federal income taxes to the extent that it distributes substantially all of its taxable or tax-exempt income, if any, for its tax year ending December 31. In addition, by distributing in each calendar year substantially all of its net investment income, capital gains and certain other amounts, if any, each Fund will not be subject to a Federal excise tax. Therefore, no provision is made by the Funds for Federal income or excise taxes. Withholding taxes on foreign dividends are paid (a portion of which may be reclaimable) or provided for in accordance with the applicable country’s tax rules and rates and are disclosed in the Statement of Operations. Distributions paid to shareholders are based on net investment income and net realized gains determined on a tax basis, which may differ from net investment income and net realized gains for financial reporting purposes. These differences are due primarily to differing treatment for items such as non-U.S. currency gains and losses, short-term capital gains and losses, capital losses related to wash sales, unrealized appreciation of certain investments in non-U.S. securities, and income on certain investments. The fiscal year in which amounts are distributed may differ from the year in which the net investment income and net realized gains are recorded by the Funds for financial reporting purposes. The Funds may also designate a portion of the amount paid to redeeming shareholders as a distribution for tax purposes.
As of and during the year ended December 31, 2017, and for all open tax years, the Funds did not have a liability for any unrecognized tax benefits in the accompanying financial statements. The Funds recognize
the interest and penalties, if any, related to the unrecognized tax benefits as income tax expense in the Statement of Operations. During the period, the Funds did not incur any interest or penalties. The Funds file U.S. federal, state, and local tax returns as required. The Fund’s tax returns are subject to examination by the relevant tax authorities until expiration of the applicable statute of limitations, which is generally three years after the filing of the tax return for federal purposes and four years for most state returns. Salient Management does not believe there are any uncertain tax positions that require recognition of a tax liability.
(m) ALLOCATIONS
Expenses that are specific to a Fund or class of shares of a Fund are charged directly to that Fund or share class. Expenses that are common to all Funds generally are allocated among the Funds in proportion to their average daily net assets. For Funds offering multiple share classes, all of the realized and unrealized gains and losses and net investment income, other than class specific expenses, are allocated daily to each class in proportion to its average daily net assets. Fees provided under the distribution (Rule 12b-1 of the 1940 Act) and/or shareholder services plans for a particular class of a Fund are charged to the operations of such class.
(n) REFLOW TRANSACTIONS
Certain Funds may participate in ReFlow, a program designed to provide an alternative liquidity source for mutual funds experiencing redemptions of their shares. In order to pay cash to shareholders who redeem their shares on a given day, a mutual fund typically must hold cash in its portfolio, liquidate portfolio securities, or borrow money, all of which impose certain costs on the fund. ReFlow provides participating mutual funds with another source of cash by standing ready to purchase shares from a fund equal to the amount of the fund’s net redemptions on a given day. ReFlow then generally redeems those shares when the fund experiences net sales. In return for this service, the fund will pay a fee to ReFlow at a rate determined by a daily auction with other participating mutual funds. The costs to a Fund for participating in ReFlow are generally expected to be influenced by and comparable to the cost of other sources of liquidity, such as the Fund’s short-term lending arrangements or the costs of selling portfolio securities to meet redemptions. ReFlow is prohibited from acquiring more than 3% of the outstanding voting securities of any Fund. The Board of Trustees has adopted certain procedures to govern the Funds’ participation in ReFlow. ReFlow fees that were incurred by the Funds during the year ended December 31, 2017 are recorded in the Statement of Operations, if applicable.
Notes to Financial Statements
December 31, 2017
3. FAIR VALUE MEASUREMENTS
A three-tier hierarchy has been established to classify fair value measurements for disclosure purposes. Inputs refer broadly to the assumptions that market participants would use in pricing the asset or liability, including assumptions about risk. Inputs may be observable or unobservable. Observable inputs are inputs that reflect the assumptions market participants would use in pricing the asset or liability that are developed based on market data obtained from sources independent of the reporting entity. Unobservable inputs are inputs that reflect the reporting entity’s own assumptions about the assumptions market participants would use in pricing the asset or liability that are developed based on the best information available.
Various inputs are used in determining the value of each Fund’s investments as of the reporting period end. The designated input levels are not necessarily an indication of the risk or liquidity associated with these investments. These inputs are categorized in the following hierarchy under applicable financial accounting standards:
Level 1—Unadjusted quoted prices in active markets for identical, unrestricted assets or liabilities that a Fund has the ability to access at the measurement date. Investments in any underlying open-ended investment companies are valued at their net asset value daily and classified as Level 1.
Level 2—Quoted prices in markets which are not active, quoted prices for similar assets or liabilities in active markets or inputs other than quoted prices that are observable (either directly or indirectly) for substantially the full term of the asset or liability. The Board of Trustees has approved independent pricing vendors that calculate fair valuations of international equity securities based on a number of factors that appear to correlate to the movements in the U.S. markets.
Level 3—Significant unobservable prices or inputs (including the Fund’s own assumptions in determining the fair value of investments) where there is little or no market activity for the asset or liability at the measurement date.
The following tables summarize the Fund’s investments and derivative financial instruments categorized in the disclosure hierarchy as of December 31, 2017:
| | | | | | | | | | | | | | | | |
| Investments in Securities | | Level 1 | | | Level 2 | | | Level 3 | | | Total | |
| Adaptive Balanced Fund | | | | | | | | | | | | | | | | |
Affiliated Investment Companies | | $ | 20,411,261 | | | $ | — | | | $ | — | | | $ | 20,411,261 | |
Exchange-Traded Funds | | | 5,410,673 | | | | — | | | | — | | | | 5,410,673 | |
| | | | | | | | | | | | | | | | |
Total | | $ | 25,821,934 | | | $ | — | | | $ | — | | | $ | 25,821,934 | |
| | | | | | | | | | | | | | | | |
| | | | | | | | | | | | | | | | |
| Adaptive Income Fund | | | | | | | | | | | | | | | | |
Affiliated Investment Companies | | $ | 6,103,837 | | | $ | — | | | $ | — | | | $ | 6,103,837 | |
Exchange-Traded Funds | | | 6,143,811 | | | | — | | | | — | | | | 6,143,811 | |
| | | | | | | | | | | | | | | | |
Total | | $ | 12,247,648 | | | $ | — | | | $ | — | | | $ | 12,247,648 | |
| | | | | | | | | | | | | | | | |
| | | | | | | | | | | | | | | | |
| Adaptive US Equity Fund | | | | | | | | | | | | | | | | |
Exchange-Traded Funds | | $ | 15,841,820 | | | $ | — | | | $ | — | | | $ | 15,841,820 | |
| | | | | | | | | | | | | | | | |
Total | | $ | 15,841,820 | | | $ | — | | | $ | — | | | $ | 15,841,820 | |
| | | | | | | | | | | | | | | | |
| | | | | | | | | | | | | | | | |
| EM Infrastructure Fund | | | | | | | | | | | | | | | | |
Common Stocks(a) | | $ | 27,413,158 | | | $ | — | | | $ | — | | | $ | 27,413,158 | |
Limited Partnerships(a) | | | 190,230 | | | | — | | | | — | | | | 190,230 | |
Participation Notes(a) | | | — | | | | 795,421 | | | | — | | | | 795,421 | |
| | | | | | | | | | | | | | | | |
Total | | $ | 27,603,388 | | | $ | 795,421 | | | $ | — | | | $ | 28,398,809 | |
| | | | | | | | | | | | | | | | |
| | | | | | | | | | | | | | | | |
Notes to Financial Statements
December 31, 2017
| | | | | | | | | | | | | | | | |
| Investments in Securities | | Level 1 | | | Level 2 | | | Level 3 | | | Total | |
| International Dividend Signal Fund | | | | | | | | | | | | | | | | |
Common Stocks(a) | | $ | 74,123,764 | | | $ | — | | | $ | — | | | $ | 74,123,764 | |
Participation Notes(a) | | | — | | | | 2,475,777 | | | | — | | | | 2,475,777 | |
Preferred Stocks(a) | | | 2,646,935 | | | | — | | | | — | | | | 2,646,935 | |
Collateralized Mortgage Obligations(a) | | | — | | | | 1,059,726 | | | | — | | | | 1,059,726 | |
Corporate Bonds | | | — | | | | 1,408,540 | | | | — | | | | 1,408,540 | |
Government Bonds | | | — | | | | 278,459 | | | | — | | | | 278,459 | |
| | | | | | | | | | | | | | | | |
Total | | $ | 76,770,699 | | | $ | 5,222,502 | | | $ | — | | | $ | 81,993,201 | |
| | | | | | | | | | | | | | | | |
| | | | | | | | | | | | | | | | |
| International Small Cap Fund | | | | | | | | | | | | | | | | |
Common Stocks(a) | | $ | 118,229,878 | | | $ | — | | | $ | — | | | $ | 118,229,878 | |
| | | | | | | | | | | | | | | | |
Total | | $ | 118,229,878 | | | $ | — | | | $ | — | | | $ | 118,229,878 | |
| | | | | | | | | | | | | | | | |
| | | | | | | | | | | | | | | | |
| Tactical Growth Fund | |
Exchange-Traded Funds | | $ | 308,689,278 | | | $ | — | | | $ | — | | | $ | 308,689,278 | |
| | | | | | | | | | | | | | | | |
Total | | $ | 308,689,278 | | | $ | — | | | $ | — | | | $ | 308,689,278 | |
| | | | | | | | | | | | | | | | |
| | | | | | | | | | | | | | | | |
| Tactical Muni & Credit Fund | | | | | | | | | | | | | | | | |
Corporate Bonds | | | | | | | | | | | | | | | | |
Consumer Non-cyclical | | $ | — | | | $ | 1,677,603 | | | $ | — | | | $ | 1,677,603 | |
Financial | | | — | | | | — | | | | 266,922 | (b) | | | 266,922 | |
Municipal Bonds(a) | | | — | | | | 73,964,863 | | | | — | | | | 73,964,863 | |
Short-Term Securities | | | — | | | | 4,389,859 | | | | — | | | | 4,389,859 | |
| | | | | | | | | | | | | | | | |
Total | | $ | — | | | $ | 80,032,325 | | | $ | 266,922 | | | $ | 80,299,247 | |
| | | | | | | | | | | | | | | | |
| | | | | | | | | | | | | | | | |
| US Dividend Signal Fund | | | | | | | | | | | | | | | | |
Common Stocks(a) | | $ | 6,607,635 | | | $ | — | | | $ | — | | | $ | 6,607,635 | |
Limited Partnerships(a) | | | 89,656 | | | | — | | | | — | | | | 89,656 | |
| | | | | | | | | | | | | | | | |
Total | | $ | 6,697,291 | | | $ | — | | | $ | — | | | $ | 6,697,291 | |
| | | | | | | | | | | | | | | | |
(a) For detailed descriptions of sector, industry, country or state, see the accompanying Schedule of Investments.
(b) Security is valued based on the original transaction price, adjusted daily based on a treasury bond issue of similar duration, selected to serve as a proxy for the price movement of the security.
| | | | | | | | | | | | | | | | |
| Other Financial Instruments(a) | | Level 1 | | | Level 2 | | | Level 3 | | | Total | |
| Adaptive US Equity Fund | | | | | | | | | | | | | | | | |
| Assets | |
Futures Contracts | | $ | 27,352 | | | | — | | | | — | | | $ | 27,352 | |
| | | | | | | | | | | | | | | | |
Total | | $ | 27,352 | | | | — | | | | — | | | $ | 27,352 | |
| | | | | | | | | | | | | | | | |
| | | | | | | | | | | | | | | | |
| Tactical Muni & Credit Fund | | | | | | | | | | | | | | | | |
| Assets | |
Futures Contracts | | $ | 42,110 | | | | — | | | | — | | | $ | 42,110 | |
| | | | | | | | | | | | | | | | |
Total | | $ | 42,110 | | | | — | | | | — | | | $ | 42,110 | |
| | | | | | | | | | | | | | | | |
(a) Other financial instruments are derivative instruments reflected in the schedules to the Schedule of Investments, such as futures contracts.
Notes to Financial Statements
December 31, 2017
The Funds recognize transfers between levels as of the beginning of the annual period in which the transfer occurred. For the year ended December 31, 2017, there were no transfers between Level 1 and Level 2 securities.
The following is a reconciliation of the investments in which significant unobservable inputs (Level 3) were used in determining fair value:
| | | | |
| Tactical Muni & Credit Fund | | Corporate Bonds | |
Balance as of December 31, 2016 | | $ | 1,985,274 | |
Accrued discount/premium | | | — | |
Realized Gain/(Loss) | | | — | |
Change in Unrealized Appreciation/(Depreciation) | | | 17,120 | |
Purchases | | | 2,000,000 | |
Sales Proceeds | | | (3,735,472 | ) |
Transfer into Level 3 | | | — | |
Transfer out of Level 3 | | | — | |
| | | | |
Balance as of December 31, 2017 | | $ | 266,922 | |
| �� | | | |
Net change in unrealized appreciation/(depreciation) attributable to Level 3 investments held at December 31, 2017 | | $ | 2,394 | |
| | | | |
For the year ended December 31, 2017, no other Funds, except above, had transfers between the fair value levels designated in the preceding table and unobservable inputs (Level 3) used in determining fair value. Therefore, a reconciliation of assets in which significant unobservable inputs (Level 3) were used in determining fair value is not applicable.
4. INVESTMENT MANAGEMENT SERVICES
The Trust has entered into an investment management agreement with Salient Management, pursuant to which Salient Management provides investment management services to the Funds and is entitled to receive a fee calculated daily and payable monthly at the following annual rates, as of December 31, 2017, based on each Fund’s average daily net assets:
| | |
| Fund | | Investment Advisory Fees |
Adaptive Balanced Fund | | 0.10%(a) |
| |
Adaptive Income Fund | | 0.10% |
| |
Adaptive US Equity Fund | | 0.50% |
| |
EM Infrastructure Fund | | 0.90% |
| |
International Dividend Signal Fund | | 0.85% up to and including $250 million |
| | 0.75% over $250 million up to and including $1 billion |
| | 0.65% over $1 billion |
| |
International Small Cap Fund | | 1.00% up to and including $500 million |
| | 0.975% over $500 million up to and including $1 billion |
| | 0.95% over $1 billion |
| |
Tactical Growth Fund | | 1.15% up to and including $1 billion |
| | 1.05% over $1 billion |
| |
Tactical Muni & Credit Fund | | 1.00% |
| |
US Dividend Signal Fund | | 0.80% |
(a) Salient Management has contractually agreed to waive its investment management fee until April 30, 2018. The waivers for the investment management fees totaled $34,663 and are reflected in the Statement of Operations.
Notes to Financial Statements
December 31, 2017
The Trust has obtained an exemptive order from the U.S. Securities and Exchange Commission (“SEC”) that allows the Allocation Funds to enter into a special servicing agreement with the Underlying Funds under which the Underlying Funds will pay the expenses of the Allocation Funds (other than the Allocation Funds’ direct management fees, distribution and service fees, and administrative services fees) to the extent that the Underlying Funds derive additional financial and other benefits as a result of investments from the Allocation Funds. None of the expenses incurred by the Allocation Funds for the year ended December 31, 2017 were paid by the Underlying Funds.
The Trust and Salient Management have entered into investment sub-advisory agreements with Pictet Asset Management Limited (“PAM Ltd”) for the International Small Cap Fund; Broadmark Asset Management, LLC for the Tactical Growth Fund and Pacific Investment Management Company LLC (“PIMCO”) for the Tactical Muni & Credit Fund (each a “Sub-Advisor” and collectively, the “Sub- Advisors”). Pursuant to these agreements, the Sub-Advisors provide investment sub-advisory services to the Funds and are entitled to receive a fee from Salient Management calculated daily and payable monthly at the following annual rates, as of December 31, 2017, based on each Fund’s average daily net assets:
| | |
| Fund | | Sub-Advisory Fee |
International Small Cap Fund | | 0.60% up to and including $250 million |
| | 0.575% over $250 million up to and including $500 million |
| | 0.55% over $500 million up to and including $1 billion |
| | 0.525% over $1 billion |
| |
Tactical Growth Fund | | 0.60% up to and including $1 billion |
| | 0.55% over $1 billion |
| |
Tactical Muni & Credit Fund | | 0.50% |
Expense Limitations: Salient Management has entered into Expense Limitation Agreements with certain Funds, which limit the total expenses (exclusive of brokerage costs, interest, taxes, dividends, acquired fund fees and expenses and extraordinary expenses) of certain classes of certain Funds, through a specified date. In addition, Salient Management may voluntarily reimburse additional expenses of certain classes of certain Funds. Following are the annual expense limitation rates and expiration dates for the Funds with an Expense Limitation Agreement:
| | | | | | | | | | | | | | | | | | | | |
| Fund | | Investor
Class | | | Institutional
Class | | | Class A | | | Class C | | | End Date | |
Adaptive Balanced Fund | | | 0.82 | % | | | 0.32 | % | | | 0.67 | % | | | 1.32 | % | | | April 30, 2018 | |
Adaptive Income Fund | | | 0.51 | % | | | 0.01 | % | | | 0.26 | % | | | 1.01 | % | | | April 30, 2018 | |
Adaptive US Equity Fund(a) | | | 1.25 | % | | | 0.80 | % | | | N/A | | | | N/A | | | | April 30, 2018 | |
EM Infrastructure Fund | | | 1.55 | % | | | 1.20 | % | | | 1.60 | % | | | 2.15 | % | | | April 30, 2018 | |
International Dividend Signal Fund | | | 1.34 | % | | | 0.99 | % | | | 1.49 | % | | | 1.94 | % | | | April 30, 2018 | |
International Small Cap Fund(b) | | | 1.55 | % | | | 1.20 | % | | | N/A | | | | N/A | | | | April 30, 2019 | |
Tactical Muni & Credit Fund(c) | | | 1.55 | % | | | 1.20 | % | | | 1.70 | % | | | 2.15 | % | | | April 30, 2019 | |
US Dividend Signal Fund | | | 1.34 | % | | | 0.99 | % | | | 1.49 | % | | | N/A | | | | April 30, 2018 | |
(a) From January 1, 2017 to April 30, 2017, the annual expense limitation rate for Adaptive US Equity Fund’s Institutional Class shares was 0.85%.
(b) From January 1, 2017 to August 31, 2017, the annual expense limitation rate for International Small Cap Fund’s Investor Class and Institutional Class shares were 1.64% and 1.29%, respectively.
(c) From January 1, 2017 to August 31, 2017, the annual expense limitation rate for Tactical Muni & Credit Fund’s Investor Class, Institutional Class, Class A, and Class C shares were 1.79%, 1.44%,1.94%, and 2.39%, respectively.
Pursuant to the Expense Limitation Agreements, each Fund will reimburse Salient Management for any fee waivers and expense reimbursements made by Salient Management, provided that any such reimbursements made by a Fund to Salient Management will not cause the Fund’s expense limitation to exceed the expense limitation in existence at the time the expenses were incurred or at the time of the reimbursement, whichever is lower, and the reimbursement is made within three years following the year in which the expenses were incurred.
Notes to Financial Statements
December 31, 2017
For the year ended December 31, 2017, the fee waivers and/or reimbursements were as follows:
| | | | | | | | | | | | |
| Fund | | Fees Waived/
Reimbursed
by Advisor | | | Recoupment of
Past Waived
Fees by Advisor | | | Total | |
| Adaptive Balanced Fund | | | | | | | | | | | | |
Investor Class | | $ | 6,501 | | | $ | — | | | $ | 6,501 | |
Institutional Class | | | 19,605 | | | | — | | | | 19,605 | |
Class A | | | 18,168 | | | | — | | | | 18,168 | |
Class C | | | 15,731 | | | | — | | | | 15,731 | |
| Adaptive Income Fund | | | | | | | | | | | | |
Investor Class | | | 17,470 | | | | — | | | | 17,470 | |
Institutional Class | | | 36,697 | | | | — | | | | 36,697 | |
Class A | | | 32,735 | | | | — | | | | 32,735 | |
Class C | | | 47,127 | | | | — | | | | 47,127 | |
| Adaptive US Equity Fund | | | | | | | | | | | | |
Investor Class | | | 8,010 | | | | — | | | | 8,010 | |
Institutional Class | | | 60,832 | | | | — | | | | 60,832 | |
Class Z(a) | | | 10,362 | | | | — | | | | 10,362 | |
| EM Infrastructure Fund | | | | | | | | | | | | |
Investor Class | | | 9,470 | | | | — | | | | 9,470 | |
Institutional Class | | | 77,863 | | | | — | | | | 77,863 | |
Class A | | | 68,112 | | | | — | | | | 68,112 | |
Class B(a) | | | 266 | | | | — | | | | 266 | |
Class C | | | 28,257 | | | | — | | | | 28,257 | |
Advisor Class(b) | | | 3,979 | | | | — | | | | 3,979 | |
| International Dividend Signal Fund | | | | | | | | | | | | |
Investor Class | | | 31,212 | | | | — | | | | 31,212 | |
Institutional Class | | | 277,621 | | | | — | | | | 277,621 | |
Class A | | | 17,915 | | | | — | | | | 17,915 | |
Class C | | | 40,462 | | | | — | | | | 40,462 | |
Advisor Class(b) | | | 26,190 | | | | — | | | | 26,190 | |
| International Small Cap Fund | | | | | | | | | | | | |
Investor Class | | | 79,142 | | | | — | | | | 79,142 | |
Institutional Class | | | 174,461 | | | | — | | | | 174,461 | |
Advisor Class(b) | | | 725 | | | | — | | | | 725 | |
| Tactical Muni & Credit Fund | | | | | | | | | | | | |
Investor Class | | | 31,601 | | | | — | | | | 31,601 | |
Institutional Class | | | 52,411 | | | | — | | | | 52,411 | |
Class A | | | 8,669 | | | | — | | | | 8,669 | |
Class C | | | 15,775 | | | | — | | | | 15,775 | |
Advisor Class(b) | | | 8,370 | | | | — | | | | 8,370 | |
| US Dividend Signal Fund | | | | | | | | | | | | |
Investor Class | | | 30,661 | | | | — | | | | 30,661 | |
Institutional Class | | | 30,030 | | | | — | | | | 30,030 | |
Class A | | | 41,594 | | | | — | | | | 41,594 | |
(a) Effective April 28, 2017, Class B shares were terminated and exchanged into Class A shares and Class Z shares were terminated and exchanged into Institutional Class shares.
(b) Effective March 29, 2017, Advisor Class shares were terminated and exchanged into Institutional Class shares.
Notes to Financial Statements
December 31, 2017
As of December 31, 2017, the balances of recoupable expenses for each Fund were waived in the following years:
| | | | | | | | | | | | | | | | |
| Fund | | 2015 | | | 2016 | | | 2017 | | | Total | |
| Adaptive Balanced Fund | | | | | | | | | | | | | | | | |
Investor Class | | | N/A | | | $ | 14,228 | | | $ | 6,501 | | | $ | 20,729 | |
Institutional Class | | | N/A | | | | 43,982 | | | | 19,605 | | | | 63,587 | |
Class A | | | N/A | | | | 41,997 | | | | 18,168 | | | | 60,165 | |
Class C | | | N/A | | | | 36,969 | | | | 15,731 | | | | 52,700 | |
| Adaptive Income Fund | | | | | | | | | | | | | | | | |
Investor Class | | $ | 9,680 | | | | 16,848 | | | | 17,470 | | | | 43,998 | |
Institutional Class | | | 19,736 | | | | 33,379 | | | | 36,697 | | | | 89,812 | |
Class A | | | 9,463 | | | | 33,825 | | | | 32,735 | | | | 76,023 | |
Class C | | | 31,813 | | | | 48,798 | | | | 47,127 | | | | 127,738 | |
| Adaptive US Equity Fund | | | | | | | | | | | | | | | | |
Investor Class | | | 6,905 | | | | 8,988 | | | | 8,010 | | | | 23,903 | |
Institutional Class | | | 45,647 | | | | 48,815 | | | | 60,832 | | | | 155,294 | |
| EM Infrastructure Fund | | | | | | | | | | | | | | | | |
Investor Class | | | N/A | | | | 1,908 | | | | 9,470 | | | | 11,378 | |
Institutional Class | | | N/A | | | | 5,342 | | | | 77,863 | | | | 83,205 | |
Class A | | | N/A | | | | 6,465 | | | | 68,112 | | | | 74,577 | |
Class C | | | N/A | | | | 3,317 | | | | 28,257 | | | | 31,574 | |
| International Dividend Signal Fund | | | | | | | | | | | | | | | | |
Investor Class | | | 147,383 | | | | 130,344 | | | | 31,212 | | | | 308,939 | |
Institutional Class | | | 155,318 | | | | 221,607 | | | | 277,621 | | | | 654,546 | |
Class A | | | 6,637 | | | | 11,287 | | | | 17,915 | | | | 35,839 | |
Class C | | | 16,868 | | | | 27,986 | | | | 40,462 | | | | 85,316 | |
| International Small Cap Fund | | | | | | | | | | | | | | | | |
Investor Class | | | 14,293 | | | | 39,195 | | | | 79,142 | | | | 132,630 | |
Institutional Class | | | 63,879 | | | | 147,123 | | | | 174,461 | | | | 385,463 | |
| Tactical Muni & Credit Fund | | | | | | | | | | | | | | | | |
Investor Class | | | — | | | | 6,514 | | | | 31,601 | | | | 38,115 | |
Institutional Class | | | — | | | | — | | | | 52,411 | | | | 52,411 | |
Class A | | | — | | | | 1,418 | | | | 8,669 | | | | 10,087 | |
Class C | | | — | | | | 3,074 | | | | 15,775 | | | | 18,849 | |
| US Dividend Signal Fund | | | | | | | | | | | | | | | | |
Investor Class | | | 9,449 | | | | 29,002 | | | | 30,661 | | | | 69,112 | |
Institutional Class | | | 109,425 | | | | 39,472 | | | | 30,030 | | | | 178,927 | |
Class A | | | 58,731 | | | | 61,513 | | | | 41,594 | | | | 161,838 | |
Notes to Financial Statements
December 31, 2017
5. DISTRIBUTION AND SHAREHOLDER SERVICES PLANS
The Funds have adopted Distribution Plans (the “Distribution Plans”) pursuant to Rule 12b-1 of the 1940 Act that allow each of the Funds to pay for the sale and distribution of its shares at an annual rate of up to the following amounts based on each Fund’s daily average net assets:
| | | | | | | | | | | | |
| Fund | | Investor
Class | | | Class A | | | Class C | |
Adaptive Balanced Fund | | | 0.25 | % | | | 0.35 | % | | | 0.75 | % |
Adaptive Income Fund | | | 0.25 | % | | | 0.35 | %(a) | | | 0.75 | % |
Adaptive US Equity Fund | | | 0.25 | % | | | N/A | | | | N/A | |
EM Infrastructure Fund | | | 0.25 | % | | | 0.35 | %(a) | | | 0.75 | % |
International Dividend Signal Fund | | | 0.25 | % | | | 0.35 | % | | | 0.75 | % |
International Small Cap Fund | | | 0.25 | % | | | N/A | | | | N/A | |
Tactical Growth Fund | | | 0.25 | % | | | 0.35 | % | | | 0.75 | % |
Tactical Muni & Credit Fund | | | 0.25 | % | | | 0.35 | % | | | 0.75 | % |
US Dividend Signal Fund | | | 0.25 | % | | | 0.35 | % | | | N/A | |
(a) The Fund is currently authorized to pay 0.25% with respect to Class A shares.
The Funds have adopted a Shareholder Services Plan (the “Shareholder Services Plan”) with respect to certain Funds. Under the Shareholder Services Plan, a Fund is authorized to pay third party service providers for non-distribution related services to shareholders. Payments under the Shareholder Services Plan are calculated daily and paid monthly and are not to exceed the following annual rates:
| | | | | | | | | | | | | | | | |
| Fund | | Investor
Class | | | Institutional
Class | | | Class A | | | Class C | |
Adaptive Balanced Fund | | | 0.25 | % | | | None | | | | N/A | | | | 0.25 | % |
Adaptive Income Fund | | | 0.25 | % | | | None | | | | N/A | | | | 0.25 | % |
Adaptive US Equity Fund | | | 0.25 | % | | | 0.05 | %(a) | | | N/A | | | | N/A | |
EM Infrastructure Fund | | | 0.15 | % | | | 0.05 | % | | | 0.20 | % | | | 0.25 | % |
International Dividend Signal Fund | | | 0.15 | % | | | 0.05 | % | | | 0.20 | % | | | 0.25 | % |
International Small Cap Fund | | | 0.15 | % | | | 0.05 | % | | | N/A | | | | N/A | |
Tactical Growth Fund | | | 0.15 | % | | | 0.05 | % | | | 0.20 | % | | | 0.25 | % |
Tactical Muni & Credit Fund | | | 0.15 | % | | | 0.05 | % | | | 0.20 | % | | | 0.25 | % |
US Dividend Signal Fund | | | 0.15 | % | | | 0.05 | % | | | 0.20 | % | | | N/A | |
(a) From January 1, 2017 to April 30, 2017, the shareholder service fee rate for Adaptive US Equity Fund’s Institutional Class shares was 0.10%.
The expenses of the Distribution Plans and the Shareholder Services Plan are reflected as distribution and service fees in the Statement of Operations.
6. SERVICE PROVIDERS
ALPS Fund Services, Inc. (“AFS”) serves as the Funds’ administrator, transfer agent and dividend paying agent.
Citibank, N.A. serves as the Funds’ custodian.
Forward Securities, LLC, a wholly owned subsidiary of Salient Management, (the “Distributor”) serves as the Funds’ distributor. The Distributor acts as an agent for the Funds and the distributor of their shares.
7. TRUSTEE AND OFFICER FEES
Each Fund’s operations are managed under the direction and oversight of the Board of Trustees. The Board of Trustees appoints officers of the Trust who are responsible for the Funds’ day-to-day business decisions based on policies set by the Board of Trustees. The officers serve at the pleasure of the Board of Trustees.
Notes to Financial Statements
December 31, 2017
The Funds do not pay any compensation directly to the officers or trustees who are also trustees, officers or employees of Salient Management or its affiliates, except as noted below. As of December 31, 2017, there were ten Trustees, eight of whom are not “interested persons” of the Trust within the meaning of that term under the 1940 Act (each, an “Independent Trustee”). The Trustees of the Trust may also serve as trustees of other registered investment companies managed by the Advisor and its affiliates, including Salient MF Trust (together with the Trust, the “Trusts”). Each Fund within the Trusts pays Independent Trustees an allocated portion of the retainer of $60,000 per year. Each Fund within the Trusts pays Independent Trustees an allocated portion of the amounts of: $6,250 for attendance in person at a regular meeting and $2,500 for attendance by telephone at a regular meeting; $3,750 for attendance in person or by video conference at a special meeting that is not held in conjunction with a regular meeting and $1,500 for attendance by telephone at a special meeting that is not held in conjunction with a regular meeting; and $1,500 per day for participation in Trust-related meetings not held in conjunction with a meeting. The Chairman of the Board of Trustees, the Chairman of the Audit Committee, the Chairman of the Nominating Committee and the Chairman of the Compliance Committee receive a special retainer fee in the amount of $25,000, $12,500, $7,500 and $7,500, respectively per year. In addition, each member of the Audit Committee, Nominating Committee and Compliance Committee receive $1,000, respectively per year. In the interest of retaining Independent Trustees of the highest quality, the Board intends to periodically review such compensation and may modify it as the Board deems appropriate. The interested Trustees receive no compensation from the Funds. In addition, Independent Trustees receive reimbursements for reasonable out-of-pocket expenses incurred for their services as a Trustee, including for the transportation and other expenses that they incur in attending meetings.
The Chief Compliance Officer of the Funds (“CCO”) is an employee of, and is compensated by, Salient Management. The Funds have agreed to pay the Advisor approximately $443,000 per year as (i) an allocated portion of the compensation of an officer or employee of the Advisor to serve as CCO for the Funds (plus the cost of reasonable expenses related to the performance of the CCO’s duties, including travel expenses), and (ii) an allocation of the expenses of other officers or employees of the Advisor who serve in other compliance capacities for the Funds. The Board approves annually an allocation of such costs among such personnel, and each Fund bears its pro rata share of such expense. Other affiliated funds and registered investment companies managed by the Advisor pay additional compensation for the same purposes.
8. INDEMNIFICATIONS
Under the Trust’s organizational documents, its officers and Trustees are indemnified against certain liability arising out of the performance of their duties with respect to the Funds. In addition, in the normal course of business, the Trust, on behalf of the Funds, enters into contracts with vendors and others that provide general indemnification. Each Fund’s maximum exposure under these arrangements is unknown, as this would involve future claims that may be made against the Trust and/or the Funds. Based on experience, however, the Funds expect the risk of loss to be remote.
9. PURCHASES AND SALES OF INVESTMENTS
Investment transactions for the year ended December 31, 2017, excluding U.S. Government Obligations, short-term investments and short sales, were as follows:
| | | | | | | | |
| Fund | | Cost of
Investments
Purchased | | | Proceeds From
Investments
Sold | |
Adaptive Balanced Fund | | $ | 20,271,632 | | | $ | 28,162,432 | |
Adaptive Income Fund | | | 17,241,343 | | | | 18,303,803 | |
Adaptive US Equity Fund | | | 32,657,256 | | | | 36,290,779 | |
EM Infrastructure Fund | | | 30,012,322 | | | | 27,440,144 | |
International Dividend Signal Fund | | | 52,583,737 | | | | 119,974,693 | |
International Small Cap Fund | | | 81,145,494 | | | | 116,146,704 | |
Tactical Growth Fund | | | 331,167,501 | | | | 296,005,241 | |
Tactical Muni & Credit Fund | | | 69,566,256 | | | | 90,277,989 | |
US Dividend Signal Fund | | | 4,938,046 | | | | 2,775,025 | |
Notes to Financial Statements
December 31, 2017
Investment transactions in U.S. Government Obligations for the year ended December 31, 2017 were as follows:
| | | | | | | | |
| Fund | | Cost of
Investments
Purchased | | | Proceeds From
Investments
Sold | |
Tactical Muni & Credit Fund | | $ | 84,911,907 | | | $ | 85,765,043 | |
10. TAX BASIS INFORMATION
Reclassifications: At December 31, 2017, permanent differences in book and tax accounting were reclassified. These differences had no effect on net assets and were primarily attributed to differences in the treatment of foreign currency, treatment of net operating losses, expiration of capital loss carryforwards, treatment of passive foreign investment companies and differences in the book to tax treatment of certain investments. These reclassifications were as follows:
| | | | | | | | | | | | |
| Fund | | Increase/
(Decrease)
Paid-in Capital | | | Increase/(Decrease)
Accumulated Net
Investment
Income/(Loss) | | | Increase/(Decrease)
Accumulated Net
Realized
Gain/(Loss) | |
Adaptive US Equity Fund | | $ | 1 | | | $ | (21,340 | ) | | $ | 21,339 | |
EM Infrastructure Fund | | | (30,182,436 | ) | | | 95,200 | | | | 30,087,236 | |
International Dividend Signal Fund | | | (2,200,979 | ) | | | 1,051,812 | | | | 1,149,167 | |
International Small Cap Fund | | | (164,487,515 | ) | | | 1,641,221 | | | | 162,846,294 | |
Tactical Growth Fund | | | — | | | | 8,949 | | | | (8,949 | ) |
Tactical Muni & Credit Fund | | | — | | | | 227 | | | | (227 | ) |
US Dividend Signal Fund | | | 1,316 | | | | (1,233 | ) | | | (83 | ) |
Tax Basis of Investments: Differences in book and tax accounting for cost basis of investments are primarily attributable to deferral of losses on wash sales and realization of unrealized gains/(losses) on investments in passive foreign investment companies for tax purposes. The following information is provided on a tax basis as of December 31, 2017 and includes investments and futures contracts, and excludes foreign currency:
| | | | | | | | | | | | | | | | |
| Fund | | Cost of
Investments | | | Gross
Unrealized
Appreciation | | | Gross
Unrealized
Depreciation | | | Net Unrealized
Appreciation/
(Depreciation) | |
Adaptive Balanced Fund | | $ | 24,755,506 | | | $ | 1,551,617 | | | $ | (485,189 | ) | | $ | 1,066,428 | |
Adaptive Income Fund | | | 12,080,552 | | | | 181,749 | | | | (14,653 | ) | | | 167,096 | |
Adaptive US Equity Fund | | | 14,533,440 | | | | 1,458,302 | | | | (149,922 | ) | | | 1,308,380 | |
EM Infrastructure Fund | | | 25,441,749 | | | | 3,715,651 | | | | (758,591 | ) | | | 2,957,060 | |
International Dividend Signal Fund | | | 66,550,617 | | | | 20,333,394 | | | | (4,890,810 | ) | | | 15,442,584 | |
International Small Cap Fund | | | 86,157,226 | | | | 32,951,768 | | | | (879,116 | ) | | | 32,072,652 | |
Tactical Growth Fund | | | 278,217,877 | | | | 30,507,269 | | | | (35,868 | ) | | | 30,471,401 | |
Tactical Muni & Credit Fund | | | 76,072,610 | | | | 4,281,761 | | | | (55,124 | ) | | | 4,226,637 | |
US Dividend Signal Fund | | | 5,472,987 | | | | 1,295,840 | | | | (71,536 | ) | | | 1,224,304 | |
Capital Losses: Under the Regulated Investment Company Modernization Act of 2010 (the “Act”), capital losses incurred after December 31, 2010 may now be carried forward indefinitely, but must retain the character of the original loss. However, such losses must be utilized prior to the pre-enactment capital loss, which increases the likelihood that the pre-enactment capital losses will expire unused. Under the pre-enactment law,
Notes to Financial Statements
December 31, 2017
capital losses could be carried forward for eight years and carried forward as short-term capital losses irrespective of the character of the original loss. As of December 31, 2017, the following Funds had available for Federal income tax purposes unused capital losses that may be used to offset future realized capital gains as follows:
| | | | | | | | | | | | | | | | |
| Fund | | Expiring in
2018(a) | | | Short-Term(b) | | | Long-Term(b) | | | Total | |
Adaptive Balanced Fund(c) | | $ | — | | | $ | 3,431,104 | | | $ | 17,139,401 | | | $ | 20,570,505 | |
Adaptive Income Fund(c) | | | — | | | | 1,630,871 | | | | 2,798,559 | | | | 4,429,430 | |
EM Infrastructure Fund | | | 24,061,967 | | | | 1,781,915 | | | | 3,105,119 | | | | 28,949,001 | |
International Dividend Signal Fund | | | — | | | | 47,374,518 | | | | 15,580,231 | | | | 62,954,749 | |
Tactical Muni & Credit Fund | | | — | | | | 64,235,446 | | | | 25,755,628 | | | | 89,991,074 | |
US Dividend Signal Fund | | | — | | | | 2,218,210 | | | | 669,652 | | | | 2,887,862 | |
(a) Capital losses incurred prior to December 31, 2010 under pre-enactment law.
(b) Capital losses incurred after December 31, 2010 under the Act and not subject to expiration.
(c) Subject to limitations under §382 of the Code.
Capital loss carryovers used during the year ended December 31, 2017 were:
| | | | |
| Fund | | Amount | |
Adaptive Balanced Fund | | $ | (71,006 | ) |
Adaptive Income Fund | | | (143,930 | ) |
International Dividend Signal Fund | | | (6,363,651 | ) |
International Small Cap Fund | | | (14,789,695 | ) |
Tactical Muni & Credit Fund | | | (1,264,001 | ) |
US Dividend Signal Fund | | | (50,902 | ) |
The Funds elect to defer to the period ending December 31, 2018 capital losses and late year ordinary losses recognized during the period November 1, 2017 to December 31, 2017 in the amount of:
| | | | | | | | |
| Fund | | Capital
Losses
Total | | | Ordinary
Losses
Total | |
EM Infrastructure Fund | | $ | 365,160 | | | $ | — | |
International Dividend Signal Fund | | | 891,728 | | | | — | |
US Dividend Signal Fund | | | 44,144 | | | | — | |
Tax Basis of Distributable Earning: At December 31, 2017 the following components of accumulated earnings on a tax basis were as follows:
| | | | | | | | | | | | | | | | | | | | |
| | | Accumulated
Capital
Gains/(Losses) | | | Undistributed
Ordinary
Income | | | Net Unrealized
Appreciation/
(Depreciation) | | | Other
Cumulative
Effect of Timing
Differences | | | Total | |
Adaptive Balanced Fund | | $ | (20,570,505 | ) | | $ | 77,025 | | | $ | 1,066,428 | | | $ | — | | | $ | (19,427,052 | ) |
Adaptive Income Fund | | | (4,429,430 | ) | | | — | | | | 167,096 | | | | — | | | | (4,262,334 | ) |
Adaptive US Equity Fund | | | 1,086,378 | | | | 702,062 | | | | 1,308,380 | | | | — | | | | 3,096,820 | |
EM Infrastructure Fund | | | (29,314,161 | ) | | | 96,152 | | | | 2,957,955 | | | | — | | | | (26,260,054 | ) |
International Dividend Signal Fund | | | (63,846,477 | ) | | | 851,360 | | | | 15,466,071 | | | | — | | | | (47,529,046 | ) |
International Small Cap Fund | | | — | | | | 174,917 | | | | 32,081,863 | | | | — | | | | 32,256,780 | |
Tactical Growth Fund | | | — | | | | 1,281,283 | | | | 30,471,401 | | | | — | | | | 31,752,684 | |
Tactical Muni & Credit Fund | | | (89,991,074 | ) | | | 33,492 | | | | 4,226,637 | | | | — | | | | (85,730,945 | ) |
US Dividend Signal Fund | | | (2,932,006 | ) | | | 13,083 | | | | 1,224,241 | | | | 441 | | | | (1,694,241 | ) |
Notes to Financial Statements
December 31, 2017
Tax Character of Distributions to Shareholders: Income and long-term capital gain distributions are determined in accordance with Federal income tax regulations, which may differ from GAAP.
The tax character of distributions paid for the year ended December 31, 2017 were as follows:
| | | | | | | | | | | | |
| Fund | | Ordinary
Income Total | | | Long-Term
Capital Gain Total | | | Return of
Capital Total | |
Adaptive Balanced Fund | | $ | 1,468,942 | | | $ | — | | | $ | — | |
Adaptive Income Fund | | | 522,468 | | | | — | | | | 23,860 | |
Adaptive US Equity Fund | | | 1,238,830 | | | | 712,298 | | | | — | |
EM Infrastructure Fund | | | 1,767,553 | | | | — | | | | — | |
International Dividend Signal Fund | | | 5,949,721 | | | | — | | | | — | |
International Small Cap Fund | | | 2,797,642 | | | | — | | | | — | |
Tactical Growth Fund | | | 22,999,969 | | | | 2,021,128 | | | | — | |
Tactical Muni & Credit Fund | | | 2,316,497 | | | | — | | | | — | |
US Dividend Signal Fund | | | 152,597 | | | | — | | | | — | |
The tax character of distributions paid for the year ended December 31, 2016 were as follows:
| | | | | | | | | | | | |
| Fund | | Ordinary
Income Total | | | Long-Term
Capital Gain Total | | | Return Of
Capital Total | |
Adaptive Balanced Fund | | $ | 1,847,817 | | | $ | — | | | $ | — | |
Adaptive Income Fund | | | 543,772 | | | | — | | | | 47,840 | |
Adaptive US Equity Fund | | | 1,487,924 | | | | 48,655 | | | | — | |
EM Infrastructure Fund | | | 568,943 | | | | — | | | | — | |
International Dividend Signal Fund | | | 10,109,639 | | | | — | | | | — | |
International Small Cap Fund | | | 4,924,980 | | | | — | | | | — | |
Tactical Growth Fund | | | — | | | | 1,072,270 | | | | — | |
Tactical Muni & Credit Fund | | | 2,930,813 | | | | — | | | | — | |
US Dividend Signal Fund | | | 27,619 | | | | — | | | | — | |
The Funds may own shares in certain foreign investment entities referred to under U.S. tax law, as “passive foreign investment companies” (PFICs). The Funds may elect to mark-to-market annually the shares of each PFIC and may be required to include in distributable income to shareholders any such mark-to-market gains.
11. SCHEDULE OF INVESTMENTS
The investment categories used in this report may differ from the industry classification categories used for determining compliance with industry concentration restrictions and requirements applicable to each of the Funds.
12. FUND REORGANIZATIONS
Adaptive Balanced Fund Acquisition of Forward Growth & Income Allocation Fund and Forward Multi-Strategy Fund: At the September 22 – 23, 2015 meeting of the Board of Trustees, the Trustees, including all of the Independent Trustees, approved a form of Agreement and Plan of Reorganization (“Reorganization Agreement”) that provided for the reorganization of Forward Growth & Income Allocation Fund and Forward Multi-Strategy Fund (together, the “Acquired Funds”) into Adaptive Balanced Fund (the “Reorganization”). The Reorganization did not require shareholder approval and occurred as of the close of business on January 22, 2016 (the “Reorganization Date”). The purpose of the Reorganization was to combine three funds with similar investment objectives and strategies. On the Reorganization Date, the assets and liabilities of the Acquired Funds were transferred to Adaptive Balanced Fund in exchange for shares of Adaptive Balanced Fund. Pursuant to the Reorganization Agreement, each shareholder of Investor Class, Institutional Class, Class A and Class C shares of the Acquired Funds became the owner of the number of
Notes to Financial Statements
December 31, 2017
corresponding full and fractional shares of Adaptive Balanced Fund, having an equal aggregate net asset value. On the Reorganization date, Adaptive Balanced Fund and the Acquired Funds reported the following financial information:
| | | | | | | | | | | | | | |
| Acquiring Fund | | Shares
Outstanding
of Acquiring
Fund | | Net
Assets of
Acquiring
Fund | | Acquired Fund | | Acquired
Fund
Shares
Exchanged | | | Net Assets
of
Acquired
Fund
Exchanged | |
Adaptive Balanced Fund | | 1,689,628 | | $20,323,522 | | Forward Growth & Income Allocation Fund | | | 1,234,716 | | | $ | 16,154,808 | |
| | | | | | Forward Multi-Strategy Fund | | | 388,654 | | | | 4,861,548 | |
The investment portfolio value and unrealized appreciation/(depreciation) as of January 22, 2016 for each of the Acquired Funds were as follows:
| | | | | | | | |
| Acquired Fund | | Portfolio
Value | | | Unrealized
Appreciation /
(Depreciation)
of Acquired
Fund | |
Forward Growth & Income Allocation Fund | | $ | 16,048,459 | | | $ | (191,693 | ) |
Forward Multi-Strategy Fund | | | 4,857,514 | | | | (410,554 | ) |
Immediately following the Reorganization the net assets of the combined Adaptive Balanced Fund were $41,339,878.
The Reorganization qualified as a tax-free reorganization for federal income tax purposes. Adaptive Balanced Fund acquired the following unused capital loss carryforwards for potential utilization, subject to certain tax limitations:
| | | | | | | | | | | | |
| Fund | | Short-Term | | | Long-Term | | | Total | |
Forward Growth & Income Allocation Fund | | $ | 807,281 | | | $ | 4,898,141 | | | $ | 5,705,422 | |
Forward Multi-Strategy Fund | | | 997,742 | | | | 3,194,752 | | | | 4,192,494 | |
Assuming the Reorganization had been completed on January 1, 2016, the beginning of the annual reporting period for Adaptive Balanced Fund, Adaptive Balanced Fund’s pro forma results of operations for the year ended December 31, 2016 are as follows:
| | | | |
Net Investment Income | | $ | 2,916,661 | |
Net Realized and Unrealized Loss on Investments | | | (2,974,568 | ) |
| | | | |
Net Decrease in Net Assets Resulting from Operations | | $ | (57,907 | ) |
| | | | |
Because the combined investment portfolios have been managed as a single integrated portfolio since the closing of the Reorganization, it is not practicable to separate the amounts of revenue and earnings of the Acquired Funds that have been included in Adaptive Balanced Fund’s Statement of Operations since January 22, 2016.
Adaptive Income Fund Acquisition of Forward Balanced Allocation Fund: At the September 22 – 23, 2015 meeting of the Board of Trustees, the Trustees, including all of the Independent Trustees, approved a form of Agreement and Plan of Reorganization (“Reorganization Agreement”) that provided for the reorganization of Forward Balanced Allocation Fund (the “Acquired Fund”) into Adaptive Income Fund (the “Reorganization”). The Reorganization did not require shareholder approval and occurred as of the close of business on January 22, 2016 (the “Reorganization Date”). The purpose of the Reorganization was to combine two funds with similar investment objectives and strategies. On the Reorganization Date, the assets and liabilities of the Acquired Fund were transferred to Adaptive Income Fund in exchange for shares of Adaptive Income Fund. Pursuant to the Reorganization Agreement, each shareholders of Investor Class, Institutional Class, Class A and Class C shares of the Acquired Fund became the
Notes to Financial Statements
December 31, 2017
owner of the number of corresponding full and fractional shares of the Adaptive Income Fund, having an equal aggregate net asset value. On the Reorganization date, Adaptive Income Fund and the Acquired Fund reported the following financial information:
| | | | | | | | | | | | | | | | | | |
| Acquiring Fund | | Shares
Outstanding
of Acquiring
Fund | | | Net
Assets of
Acquiring
Fund | | | Acquired Fund | | Acquired
Fund
Shares
Exchanged | | | Net Assets
of
Acquired
Fund
Exchanged | |
Adaptive Income Fund | | | 735,622 | | | $ | 9,178,646 | | | Forward Balanced Allocation Fund | | | 521,983 | | | $ | 6,830,248 | |
The investment portfolio value and unrealized appreciation/(depreciation) as of January 22, 2016 for the Acquired Fund was as follows:
| | | | | | | | |
| Acquired Fund | | Portfolio
Value | | | Unrealized
Appreciation/
(Depreciation)
of Acquired
Fund | |
Forward Balanced Allocation Fund | | $ | 6,696,699 | | | $ | (248,030 | ) |
Immediately following the Reorganization the net assets of the combined Adaptive Income Fund were $16,008,894.
The Reorganization qualified as a tax-free reorganization for federal income tax purposes. Adaptive Income Fund acquired the following unused capital loss carryforwards for potential utilization, subject to certain tax limitations:
| | | | | | | | | | | | |
| Fund | | Short-Term | | | Long-Term | | | Total | |
Forward Balanced Allocation Fund | | $ | 718,755 | | | $ | 1,965,410 | | | $ | 2,684,165 | |
Assuming the Reorganization had been completed on January 1, 2016, the beginning of the annual reporting period for Adaptive Income Fund, Adaptive Income Fund’s pro forma results of operations for the year ended December 31, 2016 are as follows:
| | | | |
Net Investment Income | | $ | 873,874 | |
Net Realized and Unrealized Loss on Investments | | | (99,186 | ) |
| | | | |
Net Decrease in Net Assets Resulting from Operations | | $ | 774,688 | |
| | | | |
Because the combined investment portfolios have been managed as a single integrated portfolio since the closing of the Reorganization, it is not practicable to separate the amounts of revenue and earnings of the Acquired Fund that have been included in Adaptive Income Fund’s Statement of Operations since January 22, 2016.
Notes to Financial Statements
December 31, 2017
13. AFFILIATED COMPANIES
As defined by the 1940 Act, an affiliated company is one in which a Fund owns 5% or more of the outstanding voting securities or a company that is under common ownership or control.
Each Allocation Fund may invest in certain securities that are considered affiliated companies as they share the same Board of Trustees and/or are managed by subsidiaries of Salient Partners, L.P. and are “related companies” for purposes of applicable fund-of-fund rules. The purchases, sales, dividend income, realized capital gains, change in unrealized appreciation/depreciation, shares and value of investment by each fund in affiliated companies for the year ended December 31, 2017 were as follows:
| | | | | | | | | | | | | | | | | | | | | | | | | | | | | | | | |
Adaptive Balanced Fund | | | | | | | | | | | | | | | | | | | | | | | | | | | | | | | | |
| Security Name | | Beginning
Shares | | | Gross
Purchases | | | Gross
Sales | | | Ending
Shares | | | Value
12/31/2017 | | | Dividend
Income | | | Change in
Unrealized
Appreciation /
Depreciation | | | Realized
Gain/(Loss)(a) | |
| Investments in affiliates held as of December 31, 2017 | | | | | | | | | | | | | | | | | | | | | |
Salient Funds—Class I shares | | | | | | | | | | | | | | | | | | | | | | | | | | | | | | | | |
Salient Adaptive Growth Fund(c) | | | 1,263,423 | | | | 109,107 | | | | (532,405 | ) | | | 840,125 | | | $ | 6,074,104 | | | $ | 599,168 | | | $ | 758,332 | | | $ | 9,277 | |
Salient Trend Fund(c) | | | 424,280 | | | | 86,353 | | | | (203,431 | ) | | | 307,202 | | | | 2,617,359 | | | | 60,135 | | | | 819,017 | | | | (680,462 | ) |
Salient Funds—Institutional Class shares | | | | | | | | | | | | | | | | | | | | | | | | | | | | | | | | |
Salient Adaptive US Equity Fund | | | — | | | | 199,095 | | | | (61,861 | ) | | | 137,234 | | | | 5,350,741 | | | | 362,650 | | | | 1,173,360 | | | | 705,777 | |
Salient International Dividend Signal Fund | | | 797,912 | | | | 235,975 | | | | (449,043 | ) | | | 584,843 | | | | 4,140,692 | | | | 335,157 | | | | 935,913 | | | | (108,729 | ) |
Salient International Real Estate Fund(c) | | | — | | | | 85,662 | | | | (39,838 | ) | | | 45,824 | | | | 672,696 | | | | 35,160 | | | | 16,226 | | | | 9,816 | |
Salient Select Income Fund(c) | | | 85,341 | | | | 35,483 | | | | (92,266 | ) | | | 28,558 | | | | 631,984 | | | | 48,256 | | | | (51,905 | ) | | | 55,550 | |
Salient Tactical Muni & Credit Fund | | | 61,331 | | | | 144,340 | | | | (87,854 | ) | | | 117,817 | | | | 923,685 | | | | 28,656 | | | | 21,727 | | | | 6,172 | |
| | | | | | | | | | | | | | | | | | | | | | | | | | | | | | | | |
| | | | | | | | | | | | | | | | | | $ | 20,411,261 | | | $ | 1,469,182 | | | $ | 3,672,670 | | | $ | (2,599 | ) |
| | | | | | | | | | | | | | | | | | | | | | | | | | | | | | | | |
| Investments in affiliates no longer held as of December 31, 2017 | | | | | | | | | | | | | | | | | |
Salient Funds—Class Z shares | | | | | | | | | | | | | | | | | | | | | | | | | | | | | | | | |
Salient Adaptive US Equity Fund | | | 178,842 | | | | 9,940 | | | | (188,782 | ) | | | — | | | $ | — | | | $ | — | | | $ | (851,553 | ) | | $ | (576 | ) |
Salient High Yield Fund(b) | | | 228,458 | | | | 12,484 | | | | (240,942 | ) | | | — | | | | — | | | | 9,741 | | | | (35,688 | ) | | | 44,447 | |
Salient Funds—Institutional Class shares | | | | | | | | | | | | | | | | | | | | | | | | | | | | | | | | |
Salient EM Corporate Debt Fund(b) | | | 289,379 | | | | 17,652 | | | | (307,031 | ) | | | — | | | | — | | | | — | | | | 47,474 | | | | (11,811 | ) |
Salient EM Dividend Signal Fund(b) | | | 22,713 | | | | 5,242 | | | | (27,956 | ) | | | — | | | | — | | | | — | | | | (1,590 | ) | | | 14,684 | |
Salient Real Estate Fund(c) | | | 78,765 | | | | 48,301 | | | | (127,066 | ) | | | — | | | | — | | | | 2,989 | | | | 153,482 | | | | (170,124 | ) |
| | | | | | | | | | | | | | | | | | | | | | | | | | | | | | | | |
| | | | | | | | | | | | | | | | | | $ | — | | | $ | 12,730 | | | $ | (687,875 | ) | | $ | (123,380 | ) |
| | | | | | | | | | | | | | | | | | | | | | | | | | | | | | | | |
Total | | | | | | | | | | | | | | | | | | | | | | $ | 1,481,912 | | | $ | 2,984,795 | | | $ | (125,979 | ) |
| | | | | | | | | | | | | | | | | | | | | | | | | | | | | | | | |
Notes to Financial Statements
December 31, 2017
| | | | | | | | | | | | | | | | | | | | | | | | | | | | | | | | |
Adaptive Income Fund | | | | | | | | | | | | | | | | | | | | | | | | | | | | | | | | |
| Security Name | | Beginning
Shares | | | Gross
Purchases | | | Gross
Sales | | | Ending
Shares | | | Value
12/31/2017 | | | Dividend
Income | | | Change in
Unrealized
Appreciation /
Depreciation | | | Realized
Gain/(Loss)(a) | |
| Investments in affiliates held as of December 31, 2017 | | | | | | | | | | | | | | | | | |
Salient Funds—Institutional Class shares | | | | | | | | | | | | | | | | | | | | | | | | | | | | | | | | |
Salient International Dividend Signal Fund | | | 173,719 | | | | 304,044 | | | | (214,088 | ) | | | 263,675 | | | $ | 1,866,817 | | | $ | 114,788 | | | $ | 205,498 | | | $ | 40,054 | |
Salient International Real Estate Fund(c) | | | — | | | | 88,474 | | | | (3,164 | ) | | | 85,310 | | | | 1,252,348 | | | | 64,209 | | | | 26,126 | | | | 221 | |
Salient Select Income Fund(c) | | | 135,100 | | | | 46,556 | | | | (126,025 | ) | | | 55,631 | | | | 1,231,104 | | | | 73,581 | | | | (158,512 | ) | | | 160,382 | |
Salient Tactical Muni & Credit Fund | | | 100,833 | | | | 193,616 | | | | (70,779 | ) | | | 223,669 | | | | 1,753,568 | | | | 43,941 | | | | 36,837 | | | | 3,813 | |
| | | | | | | | | | | | | | | | | | | | | | | | | | | | | | | | |
| | | | | | | | | | | | | | | | | | $ | 6,103,837 | | | $ | 296,519 | | | $ | 109,949 | | | $ | 204,470 | |
| | | | | | | | | | | | | | | | | | | | | | | | | | | | | | | | |
| Investments in affiliates no longer held as of December 31, 2017 | | | | | | | | | | | | | | | | | |
| Salient Funds—Class Z shares | | | | | | | | | | | | | | | | | |
Salient High Yield Fund(b) | | | 344,923 | | | | 4,916 | | | | (349,840 | ) | | | — | | | $ | — | | | $ | 14,135 | | | $ | (162,145 | ) | | $ | 176,042 | |
Salient Funds—Institutional Class shares | | | | | | | | | | | | | | | | | | | | | | | | | | | | | | | | |
Salient EM Corporate Debt Fund(b) | | | 433,871 | | | | 7,822 | | | | (441,693 | ) | | | — | | | | — | | | | — | | | | 282,715 | | | | (258,125 | ) |
Salient EM Dividend Signal Fund(b) | | | 31,104 | | | | 16,988 | | | | (48,091 | ) | | | — | | | | — | | | | — | | | | (2,177 | ) | | | 24,292 | |
Salient Real Estate Fund(c) | | | 117,928 | | | | 34,756 | | | | (152,684 | ) | | | — | | | | — | | | | 4,366 | | | | 169,483 | | | | (183,901 | ) |
| | | | | | | | | | | | | | | | | | | | | | | | | | | | | | | | |
| | | | | | | | | | | | | | | | | | $ | — | | | $ | 18,501 | | | $ | 287,876 | | | $ | (241,692 | ) |
| | | | | | | | | | | | | | | | | | | | | | | | | | | | | | | | |
Total | | | | | | | | | | | | | | | | | | | | | | $ | 315,020 | | | $ | 397,825 | | | $ | (37,222 | ) |
| | | | | | | | | | | | | | | | | | | | | | | | | | | | | | | | |
(a) Includes net realized gain/(loss) on affiliated investments and capital gain distributions received from the affiliated underlying funds.
(b) Effective close of business on February 28, 2017, Salient EM Corporate Debt Fund, Salient EM Dividend Signal Fund and Salient High Yield Fund were liquidated per the terms of the Board-approved plan of liquidation.
(c) Salient Adaptive Growth Fund, Salient International Real Estate Fund, Salient Real Estate Fund, Salient Select Income Fund and Salient Trend Fund’s December 31, 2017 Annual Report may be obtained at www.salientpartners.com.
14. SEC REGULATIONS
On October 13, 2016, the SEC amended Regulation S-X to require standardized, enhanced disclosure about derivatives in investment company financial statements, as well as other amendments. Effective August 1, 2017, the Fund adopted disclosure requirement changes for Regulation S-X and these changes are reflected throughout this report. The Funds’ adoption of those amendments, effective with the financial statements prepared as of December 31, 2017, had no effect on the Funds’ net assets or results of operations.
15. NEW ACCOUNTING PRONOUNCEMENTS
In March 2017, the Financial Accounting Standards Board (“FASB”) issued Accounting Standards Update “Premium Amortization on Purchased Callable Debt Securities” which amends the amortization period for a callable debt security held at a premium from the maturity date to the earliest call date. The guidance is effective for annual periods beginning after December 15, 2018, and interim periods within those annual periods. At this time, management is evaluating the implications of these changes on the funds.
Notes to Financial Statements
December 31, 2017
16. SUBSEQUENT EVENTS
The Funds have evaluated the need for disclosures and/or adjustments resulting from subsequent events through the date the financial statements were issued. Based on this evaluation, no adjustments were required to the financial statements as of December 31, 2017.
The Funds file a complete schedule of portfolio holdings with the U.S. Securities and Exchange Commission (“SEC”) for the first and third quarters of each fiscal year on Form N-Q. The Funds’ Form N-Q was filed for the quarter ended September 30, 2017. The Funds’ Form N-Q is available on the SEC’s website at www.sec.gov and may also be reviewed and copied at the SEC’s Public Reference Room in Washington, DC. Information on the operation of the Public Reference Room may be obtained by calling 1-800-SEC-0330. A description of the Funds’ proxy voting policies and procedures and how the Funds voted proxies relating to portfolio securities during the most recent 12-month period ended June 30, 2017 are available (i) without charge, upon request, by calling 1-800-999-6809 and (ii) on the SEC’s website at www.sec.gov.
Report of Independent Registered Public Accounting Firm
To the Shareholders and Board of Trustees of Forward Funds:
Opinion on the Financial Statements
We have audited the accompanying statements of assets and liabilities of Salient Adaptive Balanced Fund, Salient Adaptive Income Fund, Salient Adaptive US Equity Fund, Salient EM Infrastructure Fund, Salient International Dividend Signal Fund, Salient International Small Cap Fund, Salient Tactical Growth Fund, Salient Tactical Muni & Credit Fund, and Salient US Dividend Signal Fund (collectively, the “Funds”), including the schedules of investments, as of December 31, 2017, the related statements of operations for the year then ended, the statements of changes in net assets for each of the years in the two-year period then ended, and the related notes (collectively, the “financial statements”) and the financial highlights for each of the years in the three-year period then ended. In our opinion, the financial statements and financial highlights present fairly, in all material respects, the financial position of the Funds as of December 31, 2017, the results of their operations for the year then ended, the changes in their net assets for each of the years in the two-year period then ended, and the financial highlights for each of the years in the three-year period then ended, in conformity with U.S. generally accepted accounting principles. The accompanying financial highlights for each of the years or periods in the two year period ended December 31, 2014 were audited by other auditors, whose report thereon dated February 24, 2015, expressed an unqualified opinion on those financial highlights.
Basis for Opinion
These financial statements and financial highlights are the responsibility of the Funds’ management. Our responsibility is to express an opinion on these financial statements and financial highlights based on our audits. We are a public accounting firm registered with the Public Company Accounting Oversight Board (United States) (“PCAOB”) and are required to be independent with respect to the Funds in accordance with the U.S. federal securities laws and the applicable rules and regulations of the Securities and Exchange Commission and the PCAOB.
We conducted our audits in accordance with the standards of the PCAOB. Those standards require that we plan and perform the audit to obtain reasonable assurance about whether the financial statements and financial highlights are free of material misstatement, whether due to error or fraud. Our audits included performing procedures to assess the risks of material misstatement of the financial statements and financial highlights, whether due to error or fraud, and performing procedures that respond to those risks. Such procedures included examining, on a test basis, evidence regarding the amounts and disclosures in the financial statements and financial highlights. Such procedures also included confirmation of securities owned as of December 31, 2017, by correspondence with the custodian, brokers and transfer agents, or by other appropriate auditing procedures. Our audits also included evaluating the accounting principles used and significant estimates made by management, as well as evaluating the overall presentation of the financial statements and financial highlights. We believe that our audits provide a reasonable basis for our opinion.
/s/ KPMG LLP
We have served as the auditor of one or more Salient investment companies since 2003.
Columbus, Ohio
February 26, 2018
138
Tax Information (Unaudited)
December 31, 2017
Pursuant to Section 852(b)(3) of the Internal Revenue Code the following Funds designate the amounts listed below as long-term capital gain dividends:
| | | | |
Adaptive US Equity Fund | | $ | 712,298 | |
Tactical Growth Fund | | | 2,021,128 | |
The following Funds designate the percentages listed below of the income dividends distributed between January 1, 2017 and December 31, 2017, as qualified dividend income (QDI) as defined in Section 1(h)(11) of the Internal Revenue Code:
| | | | |
Adaptive Balanced Fund | | | 9.99 | % |
Adaptive Income Fund | | | 13.06 | % |
Adaptive US Equity Fund | | | 17.63 | % |
EM Infrastructure Fund | | | 28.91 | % |
International Dividend Signal Fund | | | 37.84 | % |
International Small Cap Fund | | | 72.96 | % |
Tactical Growth Fund | | | 17.91 | % |
US Dividend Signal Fund | | | 69.23 | % |
The following Funds designate the percentages listed below of the income dividends distributed between January 1, 2017 and December 31, 2017, as qualifying for the corporate dividends received deduction (DRD) as defined in Section 854(b)(2) of the Internal Revenue Code:
| | | | |
Adaptive Balanced Fund | | | 0.22 | % |
Adaptive Income Fund | | | 0.05 | % |
Adaptive US Equity Fund | | | 9.13 | % |
Tactical Growth Fund | | | 13.49 | % |
US Dividend Signal Fund | | | 58.57 | % |
Pursuant to Section 853(c) of the Internal Revenue Code, the following Funds designate the amounts listed below as foreign taxes paid and foreign source income earned between January 1, 2017 and December 31, 2017, respectively.
| | | | | | | | |
| | | Foreign
Taxes
Paid | | | Foreign
Source
Income | |
EM Infrastructure Fund | | $ | 72,031 | | | $ | 1,686,399 | |
International Dividend Signal Fund | | | 214,000 | | | | 4,735,011 | |
International Small Cap Fund | | | 178,640 | | | | 2,691,367 | |
During the year ended December 31, 2017, 68.32% of the dividend paid by the Tactical Muni & Credit Fund from net investment income should be treated as tax-exempt dividends.
139
Tax Information (Unaudited)
December 31, 2017
Section 19 Notices
The amounts and sources of distributions reported are only estimates and are not being provided for tax reporting purposes. The actual amounts and sources for tax reporting purposes will depend upon the Fund’s investment experience during the year and may be subject to changes based on the tax regulations. The Fund will send you a Form 1099-DIV each calendar year that will tell you how to report these distributions for Federal income tax purposes.
| | | | | | | | | | | | | | | | | | | | | | | | | | | | | | | | |
| | | Per Share | | | Percentage | |
| | | Net
Investment
Income | | | Net
Realized
Capital
Gains | | | Return of
Capital | | | Total Per Share | | | Net Investment
Income | | | Net
Realized
Capital
Gains | | | Return of
Capital | | | Total Per Share | |
| Adaptive Income Fund | | | | | | | | | | | | | | | | | | | | | | | | | | | | | | | | |
Institutional Class | | $ | 0.635192 | | | | — | | | $ | 0.029008 | | | $ | 0.664200 | | | | 95.63 | % | | | — | | | | 4.37 | % | | | 100.00 | % |
Investor Class | | $ | 0.573978 | | | | — | | | $ | 0.026212 | | | $ | 0.600190 | | | | 95.63 | % | | | — | | | | 4.37 | % | | | 100.00 | % |
Class A | | $ | 0.605125 | | | | — | | | $ | 0.027635 | | | $ | 0.632760 | | | | 95.63 | % | | | — | | | | 4.37 | % | | | 100.00 | % |
Class C | | $ | 0.513052 | | | | — | | | $ | 0.023428 | | | $ | 0.536480 | | | | 95.63 | % | | | — | | | | 4.37 | % | | | 100.00 | % |
140
Additional Company Information (Unaudited)
MANAGEMENT OF THE FUNDS
Board of Trustees and Officers
Each Fund’s operations are managed under the direction and oversight of the Board of Trustees (the “Board”). The Board appoints officers of the Trust (“Salient FF Trust”) who are responsible for the Funds’ day-to-day business decisions based on policies set by the Board. The officers serve at the pleasure of the Board.
As of December 31, 2017, there were ten Trustees, eight of whom are not “interested persons” of the Trust within the meaning of that term under the 1940 Act (each, an “Independent Trustee”). The Trustees and officers of the Trust also may be directors or officers of some or all of the other registered investment companies, including the Salient MF Trust (together, with the Salient FF Trust, the “Trusts”), managed by Salient and its affiliates (hereafter, Salient and Forward Management, both jointly and individually, are referred to as the “Advisor”). Each Trustee holds office for an indefinite term until his/her successor is duly elected and qualified or until he/she dies, retires, resigns, is removed or becomes disqualified. The table below shows, for each Trustee and executive officer, his/her full name, and year of birth, the position held with the Trusts, the length of time served in that position, his/her principal occupation during the last five years, and other directorships held by such Trustee. The address of each Trustee and officer is c/o Salient MF Trust, 4265 San Felipe, Suite 800, Houston, Texas 77027 or c/o Forward Funds, 345 California Street, Suite 1600, San Francisco, California 94104. The Trust’s Statement of Additional Information includes additional information about the Trustees and is available at www.salientpartners.com or upon request, without charge, by calling 800-999-6809.
Interested Trustees*
| | | | | | | | | | |
Name and
Year of Birth | | Position(s)
with the Trusts | | | | Principal Occupation(s) During the Past 5 Years | | Number of
Portfolios in Fund
Complex
Overseen by
Trustee(1) | | Other
Directorships
During
Past 5 Years** |
John A. Blaisdell* Year of Birth: 1960 | | Salient MF Trust Trustee, President and Principal Executive Officer (since 2012); Chairman of the Board (2012 to 2015) Salient FF Trust Trustee, President and Principal Executive Officer (since 2015) | | | | Managing Director of Salient (since 2002). | | 19 | | The Salient Private Access Funds (investment companies) (four funds) (since 2004); The Endowment PMF Funds (investment companies) (three funds) (since 2014); Salient Midstream & MLP Fund (investment company) (since 2012). |
| | | | | |
Jeremy L. Radcliffe*
Year of Birth: 1974 | | Salient MF Trust Trustee, Secretary (since 2012) Salient FF Trust Trustee, Secretary (since 2015) | | | | President, Forward Securities, LLC (since 2015); Managing Director of Salient (since 2002); Secretary, Salient Midstream & MLP Fund (since 2012). | | 19 | | None. |
141
Additional Company Information (Unaudited)
Independent Trustees***
| | | | | | | | | | |
Name and
Year of Birth | | Position(s)
with the Trusts | | | | Principal Occupation(s) During the Past 5 Years | | Number of
Portfolios in Fund
Complex
Overseen by
Trustee(1) | | Other
Directorships
During
Past 5 Years** |
Julie Allecta Year of Birth: 1946 | | Salient MF Trust Trustee (since 2015); Audit Committee Chairperson (since 2016) Salient FF Trust Trustee, Audit Committee Chairperson (since 2012) | | | | Retired Partner, Paul Hastings, Janofsky & Walker LLP (1999 to 2009); Member of Executive Committee and Governing Council, Independent Directors Council (since 2014); Director, WildCare Bay Area (2007-2017); Parliamentarian and Director, American Society of Botanical Artists, Northern California Chapter (2014 to 2015). | | 18 | | Trustee, Litman Gregory Funds Trust (since 2013). |
| | | | | |
Karin B. Bonding, CFA Year of Birth: 1939 | | Salient MF Trust Trustee (since 2012) Salient FF Trust Trustee (since 2015) | | | | Lecturer, University of Virginia (1996 to 2015); President of Capital Markets Institute, Inc. (retired) (fee-only financial planner and investment advisor) (1996 to 2016). | | 19 | | The Salient Private Access Funds (investment companies) (four funds) (since 2010); The Endowment PMF Funds (investment companies) (three funds) (since 2010); Brandes Investment Trust (investment companies) (four funds) (2006 to 2012); Credit Suisse Alternative Capital Funds (investment companies) (six funds) (2005 to 2010); Salient Midstream & MLP Fund (investment company) (since 2012). |
142
Additional Company Information (Unaudited)
| | | | | | | | | | |
Name and
Year of Birth | | Position(s)
with the Trusts | | | | Principal Occupation(s) During the Past 5 Years | | Number of
Portfolios in Fund
Complex
Overseen by
Trustee(1) | | Other
Directorships
During
Past 5 Years** |
Jonathan P. Carroll Year of Birth: 1961 | | Salient MF Trust Trustee (since 2012) Salient FF Trust Trustee (since 2015) | | | | President, Lazarus Capital LLC (Investment company) (since 2006); President, Lazarus Energy Holdings, LLC (Investment holding company) (since 2006); President and CEO of Blue Dolphin Energy Company (since 2012); private investor (since 1988). | | 19 | | The Salient Private Access Funds (investment companies) (four funds) (since 2004); The Endowment PMF Funds (investment companies) (three funds) (since 2014); LRR Energy, L.P. (LRE) (energy company) (2014 to 2015); Blue Dolphin Energy Company (BDCO) (energy company) (since 2014); Salient Midstream & MLP Fund (investment company) (since 2012). |
| | | | | |
A. John Gambs Year of Birth: 1945 | | Salient MF Trust Trustee (since 2015) Salient FF Trust Trustee (since 2012) | | | | Director and Compensation Committee Chair, NMI Holdings, Inc. (2011 to 2012); Trustee and Audit Committee Chair, Barclays Global Investors Funds (2006 to 2010); Trustee and Audit Committee Chair, Master Investment Portfolio (2006 to 2010); Advisory Board Member, Fairview Capital Management (since 2009); Director, San Francisco Classical Voice (2011 to 2016); Member, Board of Governors San Francisco Symphony (since 2001); Director, The New Century Chamber Orchestra (since 2010); Executive Vice President and Chief Financial Officer, The Charles Schwab Corporation (1988 to 1996); President and Director, Gambs Family Foundation (1997 to 2010). | | 18 | | None. |
143
Additional Company Information (Unaudited)
| | | | | | | | | | |
Name and
Year of Birth | | Position(s)
with the Trusts | | | | Principal Occupation(s) During the Past 5 Years | | Number of
Portfolios in Fund
Complex
Overseen by
Trustee(1) | | Other
Directorships
During
Past 5 Years** |
Dr. Bernard A. Harris, Jr. Year of Birth: 1956 | | Salient MF Trust Trustee (since 2012) Salient FF Trust Trustee (since 2015) | | | | Chief Executive Officer and Managing Partner, Vesalius Ventures, Inc. (venture investing) (since 2002); President of The Harris Foundation (non-profit) (since 1998); clinical scientist, flight surgeon and astronaut for NASA (1986 to 1996). | | 19 | | The Salient Private Access Funds (investment companies) (four funds) (since 2009); Barings Funds (previously Babson Funds) (eleven funds) (since 2011); Monebo Technologies Inc. (since 2009); The National Math and Science Initiative (since 2008); Communities in Schools (since 2007); American Telemedicine Association (2007 to 2014); U.S. Physical Therapy, Inc. (since 2005); Houston Technology Center (2004 to 2016); The Harris Foundation, Inc. (since 1998); Salient Midstream & MLP Fund (investment company) (since 2012). |
| | | | | |
Cecilia H. Herbert Year of Birth: 1949 | | Salient MF Trust Trustee (since 2015), Nominating Committee Chairperson (since 2016) Salient FF Trust Trustee (since 2009), Nominating Committee Chairperson (since 2010) | | | | Trustee, Stanford HealthCare (since 2016); Trustee, WNET, the public media company of New York (since 2011); Member, Archdiocese Finance Committee, the advisory council to the San Francisco Catholic Archdiocese (since 1994); Director (2000 to 2013) and President (2007 to 2010) of the Board, Catholic Charities CYO; Trustee, The Thacher School (2002 to 2011); Managing Director and head of San Francisco Office, J.P. Morgan/Morgan Guaranty Trust Company, a commercial and investment banking institution (1973 to 1976 and 1978 to 1991). | | 18 | | Director (since 2005) and Chair (since 2016), iShares Inc.; Trustee (since 2005) and Chair (since 2016), iShares Trust; Trustee, Pacific Select Funds (2004 to 2005); Trustee, The Montgomery Funds (1992 to 2003). |
144
Additional Company Information (Unaudited)
| | | | | | | | | | |
Name and
Year of Birth | | Position(s)
with the Trusts | | | | Principal Occupation(s) During the Past 5 Years | | Number of
Portfolios in Fund
Complex
Overseen by
Trustee(1) | | Other
Directorships
During
Past 5 Years** |
Haig G. Mardikian Year of Birth: 1947 | | Salient MF Trust Trustee and Chairman of the Board (since 2015) Salient FF Trust Trustee (since 1998), Chairman of the Board (since 2005) | | | | Owner of Haig G. Mardikian Enterprises, a real estate investment business (since 1971); General Partner of M&B Development, a real estate investment business (since 1983); General Partner of George M. Mardikian Enterprises, a real estate investment business (1983 to 2002); President and Director of Adiuvana-Invest, Inc., a real estate investment business (since 1989); President of the William Saroyan Foundation (since 1992); Managing Director of the United Broadcasting Company, radio broadcasting (1983 to 2001); Trustee of the International House of UC Berkeley (2001 to 2007); Director of the Downtown Association of San Francisco (1982 to 2006); Director of the Market Street Association (1982 to 2006); Trustee of Trinity College (1998 to 2007); Trustee of the Herbert Hoover Presidential Library (since 1997); Trustee of the Herbert Hoover Foundation (since 2002); Trustee of the Advisor California Civil Liberties Public Education Fund (1997 to 2006); Director of The Walnut Management Co., a privately held family investment company (since 2008); President of the Foundation of City College (2006 to 2010); Director of Near East Foundation (since 2007). | | 18 | | Chairman and Director of SIFE Trust Fund (1978 to 2001). |
| | | | | |
Scott E. Schwinger Year of Birth: 1965 | | Salient MF Trust Trustee (since 2012) Salient FF Trust Trustee (since 2015) | | | | President, The McNair Group (management), (since 2006); Senior Vice President and Chief Financial Officer, the Houston Texans (professional football team) (1999). | | 19 | | The Salient Private Access Funds (investment companies) (four funds) (since 2004); The Endowment PMF Funds (investment companies) (three funds) (since 2014); Houston Technology Center (2013-2017); The Make-A-Wish Foundation (since 2008); Nine Energy Services (since 2017); Salient Midstream & MLP Fund (investment company) (since 2012). |
| * | This person’s status as an “interested” Trustee arises from his affiliation with the Advisor. |
| ** | This column includes only directorships of companies required to report to the SEC under the Securities Exchange Act of 1934 (i.e., public companies) or other investment companies registered under the 1940 Act. |
| *** | Richard C. Johnson served as an Independent Trustee of both the Salient MF Trust and the Salient FF Trust during the fiscal year ended December 31, 2017. Mr. Johnson served as an Independent Trustee of the Salient MF Trust since 2012, and of the Salient FF Trust since 2015, through his retirement effective December 31, 2017. |
145
Additional Company Information (Unaudited)
| (1) | The Fund Complex for the purposes of this table consists of 18 open-end funds in the Salient MF Trust and the Salient FF Trust (each, a “Trust”), with the series of each Trust being advised by either the Advisor or an affiliate of the Advisor; and 1 public closed-end fund advised by either the Advisor or an affiliate of the Advisor. |
Officers of the Funds Who Are Not Trustees
| | | | |
| Name and Year of Birth | | Position(s) with the Trusts | | Principal Occupation(s) During Past 5 Years |
Paul A. Bachtold Year of Birth: 1973 | | Salient MF Trust Chief Compliance Officer (since 2012) Salient FF Trust Chief Compliance Officer (since 2016) | | Chief Compliance Officer and Secretary, Forward Securities (since 2016); Chief Compliance Officer, Forward Management, LLC (since 2015); Chief Compliance Officer, The Salient Private Access Funds (four funds) (since 2010); Chief Compliance Officer, The Endowment PMF Funds (three funds) (since 2014); Chief Compliance Officer, Salient (since 2010); Chief Compliance Officer, Salient Midstream & MLP Fund (since 2012); Consultant, Chicago Investment Group (compliance consulting) (2009 to 2010); US Compliance Manager, Barclays Global Investors (2005 to 2008). |
| | |
Barbara H. Tolle Year of Birth: 1949 | | Salient MF Trust Treasurer and Principal Financial Officer (since 2017) Salient FF Trust Treasurer and Principal Financial Officer (since 2006) | | Treasurer and Principal Financial Officer, Salient MF Trust (since 2017); Treasurer and Principal Financial Officer, Salient Midstream & MLP Fund (since 2017); Treasurer and Principal Financial Officer, Forward Funds (since 2006); Treasurer, The Salient Private Access Funds (four funds) (since 2017); Treasurer, The Endowment PMF Funds (three funds) (since 2017); Vice President, Director of Fund Accounting and Operations, Forward Management, LLC (since 2006); Vice President and Director, Fund Accounting and Administration, PFPC Inc. (1998 to 2006). |
| | |
John E. Price Year of Birth: 1967 | | Salient MF Trust Vice President (since 2017) Salient FF Trust Vice President (since 2017) | | Managing Director, Chief Financial Officer and Treasurer, Salient Capital Advisors, LLC (since 2011); Partner, Salient Partners, L.P. (since 2003); Chief Financial Officer and Treasurer, Salient Partners, L.P. (since 2005); Chief Financial Officer and Treasurer, Salient Trust Co., LTA (since 2005); Chief Financial Officer and Treasurer, Forward Management, LLC (since 2015); Chief Financial Officer and Treasurer, Salient Advisors, L.P. (since 2006); Chief Financial Officer and Treasurer, Endowment Advisers, L.P. (since 2004); Interim Principal Financial Officer, The Salient Private Access Funds (four funds) (since 2017); Interim Principal Financial Officer, The Endowment PMF Funds (three funds) (since 2017); Vice President, Salient Midstream & MLP Fund (since 2017). |
| | |
Kristen Bayazitoglu Year of Birth: 1981 | | Salient MF Trust Vice President (since 2017) Salient FF Trust Vice President (since 2017) | | Chief Operating Officer of Asset Management, Salient Partners, L.P. (since 2017); Vice President, The Salient Private Access Funds (four funds) (since 2017); Vice President, The Endowment PMF Funds (three funds) (since 2017); Vice President of Operations, Salient Partners, L.P. (March 2012 – June 2017); Vice President, Salient Midstream & MLP Fund (since 2017). |
| | |
Steve Leonhardt Year of Birth: 1959 | | Salient MF Trust Vice President (since 2017) Salient FF Trust Vice President (since 2017) | | Vice President of Salient (since 2017); Vice President, The Salient Private Access Funds (four funds) (since 2017); Vice President, The Endowment PMF Funds (three funds) (since 2017); Vice President, Salient Midstream & MLP Fund (since 2017); Controller of Stifel Financial Corp. (2015-2017), self-employed (2013-2015), Vice President of Charles Schwab Investment Management (2009-2013). |
146
Additional Company Information (Unaudited)
| | | | |
| Name and Year of Birth | | Position(s) with the Trusts | | Principal Occupation(s) During Past 5 Years |
Kathryn A. Burns Year of Birth: 1976 | | Salient FF Trust Assistant Treasurer (since 2014) | | Vice President and Fund Controller, ALPS Fund Services, Inc. (since 2013); Vice President and Chief Compliance Officer, Old Mutual Capital (2010 to 2012); Vice President and Regulatory Reporting Manager, Old Mutual Capital (2006 to 2012); Manager, PricewaterhouseCoopers LLP (2004 to 2006). |
147
Board Consideration of the Investment Management Agreement and Sub-Advisory Agreements (Unaudited)
At an in-person meeting of the Board held on October 17, 2017, the Board, including the Trustees who are not “interested persons” as that term is defined in the Investment Company Act of 1940, as amended (the “Independent Trustees”), considered and approved the continuation of the Investment Management Agreement between Forward Funds (the “Trust”), on behalf of its series Salient Adaptive Balanced Fund, Salient Adaptive Income Fund, Salient Adaptive US Equity Fund, Salient EM Infrastructure Fund, Salient International Dividend Signal Fund, Salient International Small Cap Fund, Salient Tactical Growth Fund, Salient Tactical Muni & Credit Fund, and Salient US Dividend Signal Fund (each a “Fund,” and together, the “Funds”), and Forward Management, LLC d/b/a Salient (“Forward Management,” “Salient Management” or the “Advisor”) (the “Advisory Agreement”); the investment sub-advisory agreement among the Trust, Forward Management and Broadmark Asset Management, LLC (“Broadmark ” or a “Sub-Advisor”); the investment sub-advisory agreement among the Trust, Forward Management and Pictet Asset Management Limited (“Pictet” or a “Sub-Advisor”); and the investment sub-advisory agreement among Forward Funds, Forward Management and Pacific Investment Management Company LLC (“PIMCO” or a “Sub-Advisor,” and together with Broadmark and Pictet, the “Sub-Advisors”) (each, a “Sub-Advisory Agreement” and together, the “Sub-Advisory Agreements”).
In preparation for review of the Advisory Agreement and Sub-Advisory Agreements, the Board requested that the Advisor and each of the Sub-Advisors provide detailed information that the Board determined to be reasonably necessary to evaluate the Advisory Agreement and Sub-Advisory Agreements. The Independent Trustees held a telephonic meeting of the Board on October 6, 2017 (the “Pre-15(c) Meeting”) to review and discuss the response materials of the Advisor and Sub-Advisors in support of the consideration of the Advisory Agreement and Sub-Advisory Agreements. The Independent Trustees also met in-person in executive session, without the presence of Advisor or Sub-Advisor personnel, prior to the October 17, 2017 meeting to review and discuss aspects of the response materials. At the request of the Independent Trustees, the Advisor made a presentation and responded to questions from the Independent Trustees at both the Pre-15(c) Meeting and the October 17, 2017 meeting. The Board, including the Independent Trustees, also took into consideration information furnished for the Board’s review and consideration throughout the year at regular Board meetings. The Independent Trustees were assisted at all times by independent counsel.
The Independent Trustees reported that the Advisor’s presentations at the Pre-15(c) Meeting and the October 17, 2017 meeting, as well as the extensive discussions among themselves and with counsel regarding their review of the response materials, left them satisfied that the Advisor and Sub-Advisors had provided responses to the requests for information adequate to allow for an informed decision regarding renewal of the Advisory Agreement and Sub-Advisory Agreements. The Independent Trustees reported their conclusion that the continuation of the Advisory Agreement and Sub-Advisory Agreements should enable the Funds to obtain high quality services at a cost that is appropriate, reasonable, and in the interests of investors. They stated that prudent exercise of judgment warranted the approval of the Advisory Agreement and Sub-Advisory Agreements. It also was noted that the Board’s decision to approve the continuation of the Advisory Agreement and Sub-Advisory Agreements was not based on any single factor, but rather was based on a comprehensive consideration of all the information provided to the Board. Upon consideration of these and other factors, the Board also determined:
The nature, extent and quality of the advisory services to be provided. With respect to the Advisory Agreement and Sub-Advisory Agreements, as applicable, the Board considered: the background and experience of key investment personnel and the Advisor’s and Sub-Advisors’ ability to retain them; the Advisor’s and Sub-Advisors’ focus on analysis of complex asset categories; the Advisor’s and Sub-Advisors’ disciplined investment approach and commitment to investment principles; the Advisor’s and Sub-Advisors’ significant investment in and commitment to personnel; the Advisor’s and Sub-Advisors’ significant compliance efforts and risk and general oversight; and the Advisor’s oversight of and interaction with service providers. The Board determined that the Advisor and Sub-Advisors had, when necessary, taken steps to address any underperformance. The Board concluded that the nature, extent and quality of the management and advisory service to be provided are appropriate and thus support a decision to approve the Advisory Agreement and Sub-Advisory Agreements.
The investment performance of the Funds. The Board evaluated the historical performance of the Funds, and comparative information provided regarding the Funds’ investment performance and information on the performance of other investment funds and various indices. The Board also considered the various performance reports received throughout the year, showing variability of returns over the course of the year. The Board noted that, as a general matter, the Funds had periods
of both underperformance and outperformance. On the basis of the Board’s assessment, the Board concluded that the Advisor and Sub-Advisors were capable of generating a level of long-term investment performance that is consistent with shareholder expectations in light of the various Funds’ investment objectives, policies and strategies. Specifically, the Board noted that:
| | • | | the Adaptive Balanced Fund underperformed its index as of the calendar year-to-date through June 30, 2017 and for the period since the Fund’s inception through June 30, 2017; and underperformed the median and average performance of its peer group as of the calendar year-to-date through June 30, 2017 and for the period since the Fund’s inception through June 30, 2017; |
| | • | | the Adaptive Income Fund underperformed its index as of the calendar year-to-date through June 30, 2017 and for the period since the Fund’s inception through June 30, 2017; and underperformed the median and average performance of its peer group as of the calendar year-to-date through June 30, 2017 and for the period since the Fund’s inception through June 30, 2017; |
| | • | | the Adaptive US Equity Fund underperformed its index as of the calendar year-to-date through June 30, 2017, but outperformed its index for the period since the Fund’s inception through June 30, 2017; and outperformed the median performance of its peer group as of the calendar year-to-date through June 30, 2017 and for the period since the Fund’s inception through June 30, 2017, but underperformed the average performance of its peer group as of the calendar year-to-date through June 30, 2017 and for the period since inception through June 30, 2017; |
| | • | | the EM Infrastructure Fund underperformed its index as of the calendar year-to-date through June 30, 2017 and for the period since the Fund’s inception through June 30, 2017; and underperformed the median and average performance of its peer group as of the calendar year-to-date through June 30, 2017 and for the period since the Fund’s inception through June 30, 2017; |
| | • | | the International Dividend Signal Fund underperformed its index as of the calendar year-to-date through June 30, 2017 and for the period since the Fund’s inception through June 30, 2017; and underperformed the median |
| | | performance of its peer group as of the calendar year-to-date through June 30, 2017 and the average and median performance of its peer group for the period since the Fund’s inception through June 30, 2017, but outperformed the average performance of its peer group as of the calendar year-to-date through June 30, 2017; |
| | • | | the International Small Cap Fund outperformed its index as of the calendar year-to-date through June 30, 2017 and for the period since the Fund’s inception through June 30, 2017; and outperformed the median and average performance of its peer group as of the calendar year-to-date through June 30, 2017, but underperformed the median and average performance of its peer group for the period since the Fund’s inception through June 30, 2017; |
| | • | | the Tactical Growth Fund underperformed its index as of the calendar year-to-date through June 30, 2017 and for the period since the Fund’s inception through June 30, 2017; and underperformed the median and average performance of its peer group as of the calendar year-to-date through June 30, 2017 and for the period since the Fund’s inception through June 30, 2017; |
| | • | | the Tactical Muni & Credit Fund outperformed its index as of the calendar year-to-date through June 30, 2017 and for the period since the Fund’s inception through June 30, 2017; and outperformed the median and average performance of its peer group as of the calendar year-to-date through June 30, 2017 and for the period since the Fund’s inception through June 30, 2017; and |
| | • | | the US Dividend Signal Fund outperformed its index as of the calendar year-to-date through June 30, 2017, but underperformed its index for the period since the Fund’s inception through June 30, 2017; and outperformed the median and average performance of its peer group as of the calendar year-to-date through June 30, 2017 and for the period since the Fund’s inception through June 30, 2017. |
The cost of advisory service to be provided and profits to be realized by the Advisor and Sub-Advisors. In analyzing the cost of services and profitability of the Advisor, the Board considered the revenues and expenses of the Advisor and each Fund’s size. The Board took into account the significant investment by and cost to the Advisor regarding investment management infrastructure to support the Funds and other
support for investors. In addition, the Board recognized the subjective nature of determining profitability. Further, the Independent Trustees recognized the difficulties in making comparisons as the profitability of other advisers generally is not publicly available and the profitability information that is available for certain advisers or management firms may not be representative of the industry and may be affected by, among other things, the adviser’s particular business mix, capital costs, types of funds managed and expense allocations. On the basis of the Board’s review of the fees charged by the Advisor for investment advisory and related services (including to its other clients, if applicable), the specialized nature of the Funds’ investment programs, the Advisor’s financial information, and the costs associated with managing the Funds, the Board concluded that the level of investment management fees and the Advisor’s profitability are reasonable in light of the services provided and the management fees and overall expense ratios of comparable funds and other clients of the Advisor.
With respect to the fees paid to the Sub-Advisors, the Board considered information regarding the sub-advisory fees charged by the Sub-Advisors to their other clients (if applicable). The Board considered the operating results and financial condition of each Sub-Advisor based on the financial information each Sub-Advisor had provided. The Trustees noted that it was difficult to accurately determine or evaluate the profitability of a particular Sub-Advisory Agreement because each of the Sub-Advisors managed assets other than those of the Funds or has multiple business lines and, further, that any such assessment would involve assumptions regarding each Sub-Advisor’s allocation policies, capital structure, cost of capital, business mix, and other factors. Based on the prior information provided and the nature of the negotiation underlying each Sub-Advisory Agreement, the Board concluded that it was reasonable to infer that each Sub-Advisor’s profitability with respect to the relevant Funds was not excessive and that the sub-advisory fees received by each Sub-Advisor out of the management fee for each Fund were reasonable in light of the services provided to each Fund.
The extent to which economies of scale would be realized as the Funds grow and whether fee levels reflect these economies of scale. While noting that the management fees will not decrease as the level of the Funds’ assets increase, the Board noted the Advisor’s expense limitation agreements in place and that the Advisor and not the Funds pay the sub-advisory fees, and concluded that each Fund’s management fee and sub-advisory fee (as applicable) is reasonable under the current circumstances. The Board noted that it will have the opportunity to periodically re-examine whether the Funds have
achieved economies of scale, as well as the appropriateness of management fees and sub-advisory fees payable to the Advisor and Sub-Advisors, respectively.
Benefits (such as soft dollars) to the Advisor and Sub-Advisors from their relationships with the Funds. The Board concluded that other benefits derived by the Advisor and Sub-Advisors from their relationship with the Funds, to the extent such benefits are identifiable or determinable, are reasonable and fair, result from the provision of appropriate services to the Funds and investors therein, and are consistent with industry practice and the best interests of the Funds and their shareholders. In this regard, the Board noted that it has received regular reports from Salient Management and the Sub-Advisors regarding their soft dollar policies and usage. The Board discussed the potential for other fall-out benefits to the Advisor and Sub-Advisors, including reputational benefits and the potential for growth of the Advisor’s and Sub-Advisors’ separate account business or other business lines through association with the Funds, and concluded that such benefits are reasonable and typical of those potentially enjoyed by managers of publicly offered mutual funds.
Other considerations. The Board determined that the Advisor and Sub-Advisors have made a substantial commitment both to the recruitment and retention of high quality personnel, monitoring and investment decision-making and provision of service, as well as the financial, compliance and operational resources reasonably necessary to manage the Funds in a professional manner that is consistent with the best interests of the Funds and their shareholders, and noted the significant financial, reputational, enterprise and litigation and regulatory risk undertaken by the Advisor and Sub-Advisors as managers of publicly offered mutual funds.
Privacy Policy (Unaudited)
Salient Funds appreciates the privacy concerns and expectations of our customers. We are committed to maintaining a high level of privacy and confidentiality when it comes to your personal information and we use that information only where permitted by law. We recognize that, as our customer, you not only entrust us with your money but with your personal information. Your trust is important to us and you can be sure we will continue our tradition of protecting your personal information. We provide this privacy notice to you so that you may understand our policy with regard to the collection and disclosure of nonpublic personal information (“Information”) pertaining to you.
We collect the following categories of information about you:
| | • | | Information we receive from you on applications or other forms; and |
| | • | | Information about your transactions with us, our affiliates, or others. |
We do not disclose any Information about you or any current or former customer to anyone, except as permitted by law. We may disclose Information about you and any former customer to our affiliates and to nonaffiliated third parties, as permitted by law. We do not disclose personal information that we collect about you to non- affiliated companies except to enable them to provide marketing services on our behalf, to perform joint marketing agreements with other financial institutions, or in other limited circumstances permitted by law. For example, some instances where we may disclose Information about you to third parties include: for servicing and processing transactions, to protect against fraud, for institutional risk control, to respond to judicial process or to perform services on our behalf. When we share personal information about you with these companies, we require them to limit their use of the personal information to the particular purpose for which it was shared and we do not allow them to share your personal information with others except to fulfill that limited purpose. In addition, these companies are required to adhere to our privacy standards with respect to any personal information that we provide them.
Protecting the Security and Confidentiality of Your Information
We restrict access to Information about you to those employees who need to know that Information to provide products or services to you. We maintain physical, electronic, and procedural safeguards to ensure the confidentiality of your Information. Our privacy policies apply only to those individual investors who have a direct customer relationship with us. If you are an individual shareholder of record of any of the Funds, we consider you to be a customer of Salient Funds. Shareholders purchasing or owning shares of any of the Funds through their bank, broker, or other financial institution should consult that financial institution’s privacy policies. If you own shares or receive investment services through a relationship with a third-party broker, bank, investment advisor or other financial service provider, that third- party’s privacy policies will apply to you and ours will not.
151
Investment Advisor
Forward Management, LLC
Investment Sub-Advisors
Broadmark Asset Management, LLC
Pacific Investment Management Company LLC
Pictet Asset Management Limited
Administrator
ALPS Fund Services, Inc.
Custodian
Citibank, N.A.
Distributor
Forward Securities, LLC
Independent Registered Public Accounting Firm
KPMG LLP
Legal Counsel
K&L Gates LLP
Transfer Agent
ALPS Fund Services, Inc.

P.O. Box 1345
Denver, CO 80201
800-999-6809
www.salientfunds.com
Salient Adaptive Balanced Fund
Salient Adaptive Income Fund
Salient Adaptive US Equity Fund
Salient EM Infrastructure Fund
Salient International Dividend Signal Fund
Salient International Real Estate Fund
Salient International Small Cap Fund
Salient Real Estate Fund
Salient Select Income Fund
Salient Select Opportunity Fund
Salient Tactical Growth Fund
Salient Tactical Muni & Credit Fund
Salient Tactical Real Estate Fund
Salient US Dividend Signal Fund


| | | | |
| Printed on paper containing recycled content using soy-based inks. | | | FSD002847 030119 | |
Item 2. Code of Ethics.
(a) The registrant, as of the end of the period covered by the report, has adopted a code of ethics that applies to the registrant’s principal executive officer, principal financial officer, principal accounting officer or controller or any persons performing similar functions on behalf of the registrant. The registrant’s Code of Ethics for principal executive and principal financial officers is filed hereto under Item 12(a)(1) on this Form N-CSR.
(b) During the period covered by the report, with respect to the registrant’s code of ethics that applies to its principal executive officer, principal financial officer, principal accounting officer or controller, or persons performing similar functions; there have been no amendments to, nor any waivers granted from, a provision that relates to any element of the code of ethics definition enumerated in paragraph (b) of this Item 2.
Item 3. Audit Committee Financial Expert.
(a)(1) The registrant’s board of directors has determined that the registrant has at least one audit committee financial expert serving on its audit committee.
(a)(2) The registrant’s audit committee financial expert is A. John Gambs. Mr. Gambs is “independent” for purposes of this Item 3 of Form N-CSR.
Item 4. Principal Accountant Fees and Services.
Audit Fees
| | (a) | The aggregate fees billed in each of the last two fiscal years for professional services rendered by the principal accountant for the audit of the Funds’ annual financial statements or services that are normally provided by the accountant in connection with statutory and regulatory filings or engagements on behalf of the Funds were $434,000 for the fiscal year ended December 31, 2017 and $517,500 for the fiscal year ended December 31, 2016. |
Audit-Related Fees
| | (b) | The aggregate fees billed in each of the last two fiscal years for assurance and related services by the principal accountant that are reasonably related to the performance of |
| | the audit of the Funds’ financial statements and are not reported under paragraph (a) of this Item on behalf of the Funds were $25,500 for the fiscal year ended December 31, 2017 and $20,000 for the fiscal year ended December 31, 2016. These services consisted of annual independent pricing fees and review of the Funds’ registration statement. |
Tax Fees
| | (c) | The aggregate fees billed to the registrant for professional services rendered by the principal accountant for tax compliance, tax advice and tax planning on behalf of the Funds was $113,682 for the fiscal year ended December 31, 2017 and $149,850 for the fiscal year ended December 31, 2016. These services consisted of professional services related to tax compliance and tax planning, including review of federal and state income tax returns, reviews of excise tax distribution requirements and review of excise tax returns. |
All Other Fees
| | (d) | The aggregate fees billed in each of the last two fiscal years for products and services provided by the principal accountant on behalf of the Funds, other than the services reported in paragraphs (a) through (c) of this Item, were NONE for the fiscal year ended December 31, 2017 and NONE for the fiscal year ended December 31, 2016. |
| | (e)(1) | The registrant’s Audit Committee charter requires that the Audit Committee pre-approve all auditing services and non-audit services to be performed for the registrant by its Auditor. The registrant’s Audit Committee has established policies and procedures (“Procedures”) for pre-approval of all audit and permissible non-audit services provided by its independent accountant (“Auditor”). Under the Procedures, the Audit Committee must approve the engagement of the Auditor to certify the Funds’ financial statements for each fiscal year. In approving this engagement, the Audit Committee shall obtain, review and consider sufficient information concerning the Auditor to enable the Audit Committee to make a reasonable evaluation of the Auditor’s qualifications and independence. The Audit Committee shall also consider the Auditor’s proposed fees for the engagement, in light of the scope and nature of the audit services that the Funds will receive. The Audit Committee will report to the registrant’s Board of Trustees regarding its approval of the engagement and the proposed fees for the engagement, and the basis for such approval. |
Additionally, the Audit Committee may pre-approve certain types of non-audit services to the Funds and their service affiliates that are not a prohibited service, as described in the Procedures. The Audit Committee may set limits on fees and other conditions on such services, as it believes to be appropriate. On an annual basis, management of the Funds, in consultation with the Auditor, shall provide to the Audit Committee for its consideration: (i) a list of those types of non-audit services, if any, that the Funds may request from the Auditor during the fiscal year; and (ii) a list of those types of non-audit services directly impacting the Funds’ operations and financial reporting that service affiliates may request from the Auditor during the fiscal year. In addition, the Procedures permit the Audit Committee to pre-approve non-audit services to the Funds and to its service affiliates on a project-by-project basis.
| | (e)(2) | The percentage of services described in each of paragraphs (b) through (d) of this Item that were approved by the Audit Committee pursuant to paragraph (c)(7)(i)(C) of Rule 2-01 of Regulation S-X are as follows: |
| | (f) | The percentage of hours expended on the principal accountant’s engagement to audit the registrant’s financial statements for the most recent fiscal year that were attributed to work performed by persons other than the principal accountant’s full-time, permanent employees was zero percent (0%). |
| | (g) | The aggregate non-audit fees billed by the Funds’ accountant for services rendered to the registrant, and rendered to the Funds’ investment adviser (not including any sub-adviser whose role is primarily portfolio management and is subcontracted with or overseen by another investment adviser), and any entity controlling, controlled by, or under common control with the investment adviser that provides ongoing services to the registrant for each of the last two fiscal years on behalf of the Funds were NONE for the fiscal year ended December 31, 2017 and NONE for the fiscal year ended December 31, 2016. |
| | (h) | The registrant’s Audit Committee of the Board of Trustees has considered whether the provision of non-audit services that were rendered to the registrant’s investment adviser (not including any sub-adviser whose role is primarily portfolio management and is subcontracted with or overseen by another investment adviser), and any entity controlling, controlled by, or under common control with the investment adviser that provides ongoing services to the registrant that were not pre-approved pursuant to paragraph (c)(7)(ii) of Rule 2-01 of Regulation S-X is compatible with maintaining the principal accountant’s independence. |
Item 5. Audit Committee of Listed Registrants.
Not applicable.
Item 6. Investments.
| | (a) | The registrant’s Schedules of Investments in securities of unaffiliated issuers as of the close of the reporting period are included as part of the Reports to Stockholders filed under Item 1 of Form N-CSR. |
Item 7. Disclosure of Proxy Voting Policies and Procedures for Closed-End Management Investment Companies.
Not applicable.
Item 8. Portfolio Managers of Closed-End Management Investment Companies.
Not applicable.
Item 9. Purchases of Equity Securities by Closed-End Management Investment Company and Affiliated Purchasers.
Not applicable.
Item 10. Submission of Matters to a Vote of Security Holders.
No material changes to the procedures by which the shareholders may recommend nominees to the registrant’s Board of Trustees have been implemented after the registrant’s last provided disclosure in response to the requirements of Item 407(c)(2)(iv) of Regulation S-K (17 CFR 229.407) (as required by Item 22(b)(15) of Schedule 14A (17 CFR 240.14a-101)), or this Item.
Item 11. Controls and Procedures.
| | (a) | The registrant’s principal executive officer and principal financial officer have concluded, based on their evaluation of the registrant’s disclosure controls and procedures as conducted within 90 days of the filing date of this report, that these disclosure controls and procedures are adequately designed and are operating effectively to ensure that information required to be disclosed by the registrant on Form N-CSR is (i) accumulated and communicated to the investment company’s management, including its certifying officers, to allow timely decisions regarding required disclosure; and (ii) recorded, processed, summarized and reported within the time periods specified in the Securities and Exchange Commission’s rules and forms. |
| | (b) | There were no changes in the registrant’s internal control over financial reporting (as defined in Rule 30a-3(d) under the Act (17 CFR 270.30a-3(d)) that occurred during the period covered by this report that have materially affected, or are reasonably likely to materially affect, the registrant’s internal control over financial reporting. |
Item 12. Disclosure of Securities Lending Activities for Closed-End Management Investment Companies.
Not applicable.
Item 13. Exhibits.
| | (a)(1) | Code of ethics that is subject to Item 2 is attached hereto. |
| | (a)(2) | Certifications pursuant to Rule 30a-2(a) under the Act (17 CFR 30a-2(a)) are attached hereto. |
| | (b) | Certifications pursuant to Rule 30a-2(b) under the Act (17 CFR 30a-2(b)) and Section 1350 of Chapter 63 of Title 18 of the United States Code (18 U.S.C. 1350) are attached hereto. |
SIGNATURES
Pursuant to the requirements of the Securities Exchange Act of 1934 and the Investment Company Act of 1940, the registrant has duly caused this report to be signed on its behalf by the undersigned, thereunto duly authorized.
| | |
Forward Funds |
By: | | /s/ John A. Blaisdell |
| | John A. Blaisdell Principal Executive Officer |
| |
Date: | | March 9, 2018 |
Pursuant to the requirements of the Securities Exchange Act of 1934 and the Investment Company Act of 1940, this report has been signed below by the following persons on behalf of the registrant and in the capacities and on the dates indicated.
| | |
By: | | /s/ John A. Blaisdell |
| | John A. Blaisdell Principal Executive Officer |
| |
Date: | | March 9, 2018 |
| |
By: | | /s/ Barbara H. Tolle |
| | Barbara H. Tolle Principal Financial Officer |
| |
Date: | | March 9, 2018 |