UNITED STATES
SECURITIES AND EXCHANGE COMMISSION
Washington, D.C. 20549
FORM N-CSR
CERTIFIED SHAREHOLDER REPORT OF REGISTERED
MANAGEMENT INVESTMENT COMPANIES
Investment Company Act file number: 811-06722
Forward Funds
(Exact name of registrant as specified in charter)
244 California St., Suite 200
San Francisco, CA 94111
(Address of principal executive offices) (Zip code)
| | |
Gregory A. Reid, Principal Executive Officer Forward Funds 244 California St., Suite 200 San Francisco, CA 94111 | | With a Copy To: George J. Zornada K&L Gates LLP State Street Financial Center One Lincoln St. Boston, MA 02111-2950 (617) 261-3231 |
| (Name and address of agent for service) | | |
Registrant’s telephone number, including area code: (800) 999-6809
Date of fiscal year end: December 31
Date of reporting period: December 31, 2020
Form N-CSR is to be used by management investment companies to file reports with the Commission, not later than 10 days after the transmission to stockholders of any report that is required to be transmitted to stockholders under Rule 30e-1 under the Investment Company Act of 1940 (17 CFR 270.30e-1). The Commission may use the information provided on Form N-CSR in its regulatory, disclosure review, inspection, and policymaking roles.
A registrant is required to disclose the information specified by Form N-CSR, and the Commission will make this information public. A registrant is not required to respond to the collection of information contained in Form N-CSR unless the Form displays a currently valid Office of Management and Budget (“OMB”) control number. Please direct comments concerning the accuracy of the information collection burden estimate and any suggestions for reducing the burden to the Secretary, Securities and Exchange Commission, 100 F Street, NE, Washington, DC 20549. The OMB has reviewed this collection of information under the clearance requirements of 44 U.S.C. § 3507.
| Item 1. | Reports to Stockholders. |
(a) The following is a copy of the report transmitted to shareholders of the Salient Global Real Estate Fund, Salient Select Income Fund and Salient Tactical Growth Fund (collectively, the “Funds”), each a series of the registrant, pursuant to Rule 30e-1 under the Investment Company Act of 1940, as amended (the “Act”) (17 CFR 270.30e-1).
Table of Contents
The series of funds under the Forward Funds Trust (“Salient Funds”) are distributed by:
Forward Securities, LLC
San Francisco, California
The report has been prepared for the general information of the Funds’ shareholders. It is not authorized for distribution to prospective investors unless accompanied or preceded by a current Funds’ Prospectus, which contains more complete information about Funds’ investment policies, management fees and expenses, experience of the management teams and other information. Investors are reminded to read the Prospectus before investing or sending money.
Shareholder Update | December 31, 2020
| | |
A MESSAGE FROM: | | William Enszer |
| | Chief Executive Officer |
Dear Shareholder:
We enter 2021 with gratitude for the trust that you, the shareholders of the Salient Funds, have placed in us. It is our aim to build strategies that enable you to act as good stewards of wealth, and it is our hope that you have found value in your partnership with us over the past year. Thank you.
To say that 2020 was unique would be an understatement. We started the year optimistically, but this optimism did not last long as the global economy experienced an unprecedented shutdown to try and curb the spread of the coronavirus. By mid-March, Salient had successfully transitioned the majority of our staff to a work-from-home format, which continues to this day. We implemented new collaboration tools, introduced weekly all-staff calls and streamlined our reporting structure. These efforts ensured that we could continue to be effective stewards of the capital entrusted to us.
The past year has been profitable for many investors, including those in most financial markets in which the Salient Funds invest. It has also been a year of further disconnects between those markets and the economies, businesses and political systems that underlie them. We have been on what seems like a political roller coaster with close elections and subsequent political turbulence in our Capitol. Economies worldwide basically shut down for parts of the year due to the pandemic and many businesses folded as a result. In response to these issues, both foreign and domestic central banks have kept interest rates at zero and governments around the world have implemented substantial stimulus programs in an effort to bridge the slack in the economy.
We believe we are well-positioned to take advantage of new opportunities created in the wake of COVID-19 while managing the risk associated with the gap between financial markets and what we observe in the “real” economy. We enter the new year hopeful on the back of approved COVID-19 vaccines. We wish you a healthy and prosperous 2021.
Sincerely,

William Enszer
Chief Executive Officer
Salient Partners, L.P.
RISKS
There are risks involved with investing, including loss of principal. Past performance does not guarantee future results, share prices will fluctuate and you may have a gain or loss when you redeem shares.
COVID-19 is an infectious disease caused by a new strain of coronavirus. The virus was first identified in late 2019 in Wuhan, the capital of China’s Hubei province, and has since spread globally, resulting in the ongoing 2019–2021 coronavirus pandemic.
Salient is the trade name for Salient Partners, L.P., which together with its subsidiaries provides asset management and advisory services. This information is being provided solely for educational purposes and is not an offer to sell or solicitation of an offer to buy an interest in any investment fund. Any such offer or solicitation may only be made by means of a confidential private offering memorandum or prospectus relating to a particular fund and only in a manner consistent with federal and applicable state securities laws.
1
The Salient Funds offered under the Forward Funds Trust are distributed by Forward Securities, LLC.
Not FDIC Insured | No Bank Guarantee | May Lose Value
©2021 Salient. All rights reserved.
The discussions concerning the Funds included in this shareholder report may contain certain forward-looking statements about the factors that may affect performance of the Funds in the future, including the portfolio managers’ outlook regarding economic, financial, market, petroleum, political and other factors relevant to investment performance in the U.S. and abroad. These statements are based on the portfolio managers’ expectations concerning certain future events and their expected impact on the Funds and are current only through the date on the cover of this report. Forward-looking statements are inherently uncertain and are not intended to predict the future performance of the Funds. Actual events may cause adjustments in the portfolio managers’ strategies from those currently expected to be employed, and the outlook of the portfolio managers is subject to change.
2
Fund Commentary and Performance (Unaudited)
Salient Global Real Estate Fund
As of December 31, 2020
For the year ended December 31, 2020, Salient Global Real Estate Fund’s Class A shares (without sales load) returned -10.36%, underperforming the Fund’s benchmark, the FTSE EPRA/NAREIT Developed Index, which returned -9.04%.
2020 was a very challenging year for real estate, both for the Fund and the various global property markets in which it invests. Following rather sanguine markets over the first seven weeks of 2020, global property markets shifted dramatically at the end of February with the onset of the global coronavirus pandemic. Investors rapidly shifted to a risk-off posture, sending both equity and bond markets around the world reeling. Correspondingly, global real estate markets experienced historic volatility and significant negative performance. By March 23, 2020, the global real estate market, as measured by the FTSE EPRA/NAREIT Developed Index, had declined -40.67% for the year. Following the immediate rollout of large monetary and fiscal stimulus programs around the world, as well as later positive news related to the development of COVID-19 vaccines, the broader property markets began a sustained rally for the remainder of the year, erasing much of the pandemic-related declines. As a result, global real estate investment trust (REIT) equities ended the year down -9.04%
Most property sector returns ended the year in negative territory with the notable exceptions of the data center, self-storage and industrial REIT property sectors. By region, Germany produced the best performance in 2020, generating a total return of 24.60%, followed by Finland with 11.30% and Sweden with 8.30%, as represented by the subindices of the FTSE EPRA/NAREIT Developed Index. Aided by a dovish U.S. Federal Reserve monetary policy, North America, which constitutes slightly more than 50% of the global real estate market, ended 2020 with a loss of -10.82% while Asia Pacific, which constitutes approximately 25% of the global real estate market, posted a similar return of -10.77%.
During 2020, the Fund’s investments in the retail and office REIT sectors as well as investments in Asia detracted the most from the Fund’s performance. The Fund’s holdings in retail assets, both domestic and foreign, were hit hard in 2020 as COVID-19 imperiled the operating environment for brick-and-mortar retail stores. During the height of the pandemic, many tenants requested rent reduction or forgiveness and several retailers sought bankruptcy protection, which negatively impacted the Fund’s retail REIT investments.
The fallout from Hong Kong’s anti-government political protests aimed at China, coupled with the devastating effects of COVID-19, hindered the Fund’s Asian investments during the year. Despite the setback in 2020, we continue to believe that the Fund’s core Asian investments, which are generally large, blue-chip diversified real estate companies based in major global cities, will continue to take advantage of long-term demographic, migration and leasing demand trends.
The Fund’s investments in office REITs also detracted from the Fund’s performance in 2020. Similar to many other property types, office assets were heavily impacted by the pandemic, as many businesses switched to remote working formats, which substantially limited the demand for new office leases. We anticipate that the Fund’s office investments will rebound once COVID-19 vaccines have been widely distributed.
On the upside, the Fund benefited from its investments in Germany, Canada and the healthcare sector during 2020. The Fund’s German apartment holdings performed very strongly, bolstered by their relatively defensive and predictable cash flows. In addition to strong stock price performance, the Fund also benefited from the strengthening of the euro, as it appreciated against the U.S. dollar from a low of $1.06 in late March to $1.22 at the end of December.
The Fund’s Canadian industrial investments remained strong performers in 2020 and generated attractive current income. While Canada remains a smaller exposure in both the Fund and its benchmark, we continue to believe that the defensive nature of these Canadian industrial property assets offer investors strong fundamentals and the ability to participate in the long-term trend of e-commerce replacing brick-and-mortar retail sales.
The healthcare sector also contributed to performance, as the Fund’s two U.S. healthcare holdings also generated strong returns throughout the pandemic, largely due to the more defensive net lease structure most healthcare property owners employ. Both of the Fund’s healthcare investments remain well-positioned to drive rent and occupancy growth going forward.
Despite the tremendous volatility experienced during 2020, we remain optimistic that the global economy as well as real estate operating fundamentals will continue to recover with the broad rollout of several COVID-19 vaccines. Across most property types and most geographies, we have witnessed encouraging signs of recovery for occupancy, tenant renewals, re-leasing spreads and operating margins from the depths of the public health crisis. Importantly, financing for real estate (whether public or private) remains extremely deep, resulting in the real estate sector exhibiting generally sound credit metrics. Given this recovery backdrop, we believe that in 2021 real estate companies will offer investors the potential continuation of the strong performance generated in the second half of 2020.
3
Salient Global Real Estate Fund
Weightings by Country as a Percentage of Net Assets
as of December 31, 2020
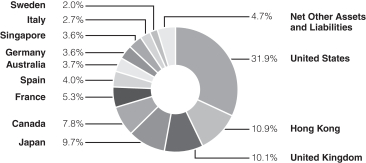
These allocations may not reflect the current or future position of the portfolio.
Hypothetical Growth of $10,000 Investment in the Fund
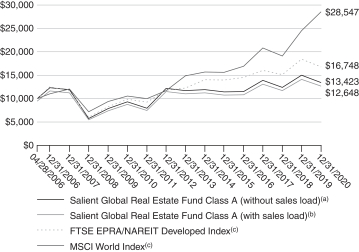
The chart above shows how a hypothetical investment of $10,000 in the Fund at its inception would have performed versus an investment in the Fund’s benchmark index. The values indicate what $10,000 would have grown to over the time period indicated. The hypothetical example does not represent the returns of any particular investment.
4
Salient Global Real Estate Fund(d)
| | | | | | | | | | | | | | | | | | | | | | | | | |
| | | 1 Year | | 5 Year | | 10 Year | | Since
Inception | | Inception
Date |
| Average Annual Total Return for the period ended December 31, 2020 | | | | | | | | | | | | | | | | | | | | | |
Investor Class | | | | -10.34% | | | | | 3.42% | | | | | N/A | | | | | 2.98% | | | | | 05/02/11 | |
| | | | | |
Institutional Class | | | | -9.98% | | | | | 3.76% | | | | | 4.18% | | | | | 2.37% | | | | | 04/28/06 | |
| | | | | |
Class A (with sales load)(b) | | | | -15.49% | | | | | 2.14% | | | | | 3.16% | | | | | 1.61% | | | | | 04/28/06 | |
| | | | | |
Class A (without sales load)(a) | | | | -10.36% | | | | | 3.36% | | | | | 3.78% | | | | | 2.03% | | | | | 04/28/06 | |
| | | | | |
Class C (with CDSC)(e) | | | | -11.69% | | | | | 2.75% | | | | | 3.16% | | | | | 1.37% | | | | | 04/28/06 | |
| | | | | |
Class C (without CDSC)(f) | | | | -10.81% | | | | | 2.75% | | | | | 3.16% | | | | | 1.37% | | | | | 04/28/06 | |
(a) Excludes sales charge.
(b) Includes the effect of the maximum 5.75% sales charge.
(c) The index figures do not reflect any deduction for fees, expenses or taxes. It is not possible to invest directly in an index.
(d) Prior to August 14, 2018, Salient Global Real Estate Fund was known as Salient International Real Estate Fund. Prior to May 1, 2016, Salient International Real Estate Fund was known as Forward International Real Estate Fund.
(e) Includes the 1.00% contingent deferred sales charge.
(f) Excludes the 1.00% contingent deferred sales charge.
The performance quoted represents past performance, does not guarantee future results and current performance may be lower or higher than the data quoted. The investment return and principal value of an investment will fluctuate so that shares, when redeemed, may be worth more or less than their original cost. Performance data current to the most recent month-end may be obtained at www.salientfunds.com. Investment performance may reflect fee waivers in effect. In the absence of fee waivers, total return would be lower. Total return is based on NAV, assuming reinvestment of all distributions. Performance does not reflect the deduction of taxes that a shareholder would pay on fund distributions or the redemption of fund shares.
5
Fund Commentary and Performance (Unaudited)
Salient Select Income Fund
As of December 31, 2020
For the year ended December 31, 2020, Salient Select Income Fund’s Class A shares (without sales load) returned -3.17%, underperforming the Fund’s benchmark, the ICE BofAML Fixed Rate Preferred Securities Index, which returned 6.95%.
Following rather sanguine markets over the first seven weeks of 2020, the market environment for the Fund changed dramatically at the end of February 2020 with the onset of the global coronavirus pandemic. Investors rapidly shifted to a risk-off posture, sending both equity and bond markets reeling. Correspondingly, both real estate investment trust (REIT) common and preferred equity markets experienced historic volatility and significant negative performance during the year. By March 23, 2020, the REIT preferred equity market, as measured by the Wells Fargo Hybrid and Preferred Securities REIT Index, had declined -37.12%, and the REIT common equity market, as measured by the FTSE NAREIT Equity REITs Index, fell -40.69%. Following large and rapid monetary and fiscal stimulus from the U.S. government, as well as later positive news related to the development of COVID-19 vaccines, the broader markets began a sustained rally for the remainder of the year, erasing much of the pandemic-related declines. REIT common equities ended the year down -8.00% and REIT preferred stocks finished the year with a positive return of 2.82%. Most property sectors finished the year in negative territory, with the notable exceptions of data center, self-storage and industrial REITs.
During 2020, the commercial mortgage, hotel and shopping center sectors detracted from the Fund’s return. The Fund held an individual equity investment within the commercial mortgage sector that generated substantial negative performance for the Fund. During the height of the pandemic in mid-March, the company received a margin call given certain impairments across its securitized mortgage portfolio, which resulted in the company recording significant permanent losses on its balance sheet.
Several of the Fund’s preferred and common equity investments within the hotel REIT sector also detracted from the Fund’s return during the year. The impact of COVID-19 put tremendous stress on the hospitality industry, as travel dramatically decreased for several months of the year. As a result of this difficult operating environment, the Fund’s hotel investments suffered significant negative price performance.
The Fund also held several preferred equity investments within the shopping center sector that detracted from the Fund’s return in 2020. The pandemic dramatically slowed foot traffic at most retail properties across the country and as a result these companies faced higher vacancy rates and increased rent delinquencies.
On the upside, the diversified, data center and industrial REIT sectors contributed to the Fund’s performance for the reporting period. Several of the Fund’s preferred equity investments within the diversified sector performed very well during the year. These positions benefited from being part of broad, diverse real estate portfolios that improved as the economy stabilized in the second half of the year.
Within the data center sector, the Fund held several preferred equity investments that performed strongly in 2020. In the wake of pandemic-related business closures, online demand surged, boosting the resilience of data centers. As one of the most defensive sectors, data centers generated strong positive performance with far less volatility than other real estate property sectors.
The Fund also held several preferred equity investments within the industrials sector that contributed to the Fund’s performance in 2020. These positions performed solidly throughout the year, benefiting from the continued trend of brick-and-mortar retail sales shifting to e-commerce.
Despite the dramatic volatility experienced in 2020 due to the COVID-19 pandemic, we maintain a positive outlook for real estate investment as we head into 2021. While the most acute pandemic-related challenges remain for the retail, office and lodging sectors, most other property sectors have witnessed encouraging signs of recovery for occupancy, tenant renewals, re-leasing spreads and operating margins from the depths of the public health crisis. REIT balance sheets remain sound with high coverage ratios and limited near-term maturities, and new building supply generally has ticked down in most markets. Importantly, real estate transaction volumes in both the public and private market are robust while capital markets both domestically and abroad remain accommodative to real estate investment. With this recovery thesis in place, we are optimistic about the current investing landscape. We intend to continue to express our value orientation and benchmark-agnostic style of investing across the capital stack, which we’ve done consistently since the Fund’s inception in 2001.
6
Salient Select Income Fund
Weightings by Sector as a Percentage of Net Assets
as of December 31, 2020
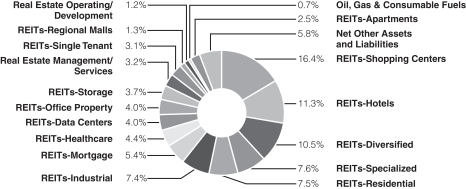
These allocations may not reflect the current or future position of the portfolio.
Hypothetical Growth of $10,000 Investment in the Fund
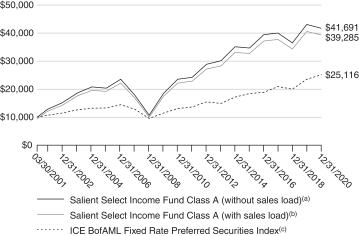
The chart above shows how a hypothetical investment of $10,000 in the Fund at its inception would have performed versus an investment in the Fund’s benchmark index. The values indicate what $10,000 would have grown to over the time period indicated. The hypothetical example does not represent the returns of any particular investment.
7
Salient Select Income Fund(d)
| | | | | | | | | | | | | | | | | | | | | | | | | |
| | | 1 Year | | 5 Year | | 10 Year | | Since
Inception | | Inception
Date |
| Average Annual Total Return for the period ended December 31, 2020 | | | | | | | | | | | | | | | | | | | | | |
Investor Class | | | | -3.09% | | | | | 3.80% | | | | | N/A | | | | | 6.53% | | | | | 10/26/11 | |
| | | | | |
Institutional Class | | | | -2.75% | | | | | 4.16% | | | | | 6.32% | | | | | 5.15% | | | | | 04/28/06 | |
| | | | | |
Class A (with sales load)(b) | | | | -8.73% | | | | | 2.53% | | | | | 5.30% | | | | | 7.17% | | | | | 03/30/01 | |
| | | | | |
Class A (without sales load)(a) | | | | -3.17% | | | | | 3.75% | | | | | 5.92% | | | | | 7.49% | | | | | 03/30/01 | |
| | | | | |
Class C (with CDSC)(e) | | | | -4.61% | | | | | 3.14% | | | | | 5.28% | | | | | 6.76% | | | | | 03/30/01 | |
| | | | | |
Class C (without CDSC)(f) | | | | -3.69% | | | | | 3.14% | | | | | 5.28% | | | | | 6.76% | | | | | 03/30/01 | |
(a) Excludes sales charge.
(b) Includes the effect of the maximum 5.75% sales charge.
(c) The index figures do not reflect any deduction for fees, expenses or taxes. It is not possible to invest directly in an index.
(d) Prior to May 1, 2016, Salient Select Income Fund was known as Forward Select Income Fund.
(e) Includes the 1.00% contingent deferred sales charge.
(f) Excludes the 1.00% contingent deferred sales charge.
The performance quoted represents past performance, does not guarantee future results and current performance may be lower or higher than the data quoted. The investment return and principal value of an investment will fluctuate so that shares, when redeemed, may be worth more or less than their original cost. Performance data current to the most recent month-end may be obtained at www.salientfunds.com. Investment performance may reflect fee waivers in effect. In the absence of fee waivers, total return would be lower. Total return is based on NAV, assuming reinvestment of all distributions. Performance does not reflect the deduction of taxes that a shareholder would pay on fund distributions or the redemption of fund shares.
8
Fund Commentary and Performance (Unaudited)
Salient Tactical Growth Fund
As of December 31, 2020
For the year ended December 31, 2020, Salient Tactical Growth Fund’s Institutional Class shares returned 8.40%, outperforming the Fund’s benchmark, the HFRX Equity Hedge Index, which returned 4.60%.
The stock market environment in 2020 was one of unprecedented volatility as the result of the global coronavirus pandemic. The S&P 500 Index rose to a new high in the first six weeks of the year. However, as it became evident that the virus was rapidly spreading throughout the United States, the S&P 500 experienced one of its steepest drops ever, falling nearly -34% in the next six weeks. U.S. gross domestic product (GDP) declined at an annualized rate of -31.4% during the second quarter, the largest such decline in U.S. history.
The stock market reached a low point in March and then turned strongly upward. While experiencing several steep and quick setbacks along the way, the major stock market averages rose steadily into the end of the year. Most major stock market indices set new all-time highs. The catalyst for the rapid recovery included Congress’s passage of a massive government stimulus program and the U.S. Federal Reserve’s (Fed’s) accommodative zero interest rate policy. These factors produced one of the strongest economic rebounds in U.S. history with GDP increasing at an annual rate of 33.4% in the third quarter of 2020.
The coronavirus continued to spread throughout the year and infections accelerated into year-end. At the end of 2020, there were 20 million coronavirus cases in the United States and over 350,000 deaths. The first vaccine was successfully developed in record time, however, and it was quickly authorized for use by the U.S. Food and Drug Administration. Distribution of the vaccine had begun by the end of the year, which was an encouraging development for investors. Investors were also relieved that Congress passed another stimulus program in December 2020.
During the year, equity valuations rose to levels not seen since the dot-com bubble of 2000 and the financial crisis of 2008. However, with interest rates so low, stocks remained attractive relative to the low yield on bonds. Almost two-thirds of all stocks in the S&P 500 had a higher yield than the 10-year U.S. Treasury Note at year-end. The Fed indicated that it would keep interest rates low into 2023, providing a positive monetary and credit environment.
Stock market momentum, as measured by the Fund’s volume and breadth measures, remained positive. While technology and communication services stocks led the way up in the first six months of the recovery, small cap stocks and other previously lagging sectors of the market joined in the rally in the second half of 2020. By year-end, small cap stocks and several other previously lagging indices registered all-time highs.
The investment team’s concerns at year-end were that absolute equity valuations were elevated and could be adversely affected if interest rates were to rise. In addition, investor sentiment had climbed to very optimistic levels, which is negative from a contrary point of view. The investment team believes that some correction is therefore likely in early 2021 prior to a resumption of the uptrend.
The Fund employed derivative instruments during the year primarily to cushion the portfolio from market corrections. Futures contracts were used to help offset risk due to elevated market volatility and uncertainty concerning the coronavirus and its impact on the economy and stock prices. Hedging can detract from performance, however, and as a result, the use of futures to hedge long positions detracted -0.89% from the Fund’s return for the year.
The Fund’s investment strategy strives to capture a portion of the market’s growth while aiming to preserve capital during market corrections. The tactical investment approach has had its greatest success in volatile markets that involved market corrections of 10% or more. For instance, in early 2020, the strategy largely sidestepped the steep February–March stock market decline. The Fund declined only -0.41% for the first quarter of 2020 versus a loss of -13.33% for the HFRX Equity Hedge Index and a loss of -19.60% for the S&P 500 for that same time period. During these volatile periods, the Fund’s flexible and responsive risk management process can be a powerful tool toward the goal of producing positive risk-adjusted returns.
As the Fund’s investment team looks ahead to 2021, there are several factors within its “Four Pillar Process” that the team will be watching:
1. Valuation: Equity valuations are high by any absolute measure. Any significant rise in interest rates in 2021 would be a potentially negative factor for equity valuations.
2. Monetary factors and credit conditions: The Fed continues to maintain an accommodative low interest rate policy. Intermediate- to long-term interest rates declined in 2020, which provided a positive environment for the capital markets. Credit spreads also remained narrow, indicating no immediate dislocations in the economy or the credit markets. Any significant increase in interest rates accompanied by a widening of credit spreads would be a negative for the markets in 2021.
9
Fund Commentary and Performance (Unaudited)
Salient Tactical Growth Fund
As of December 31, 2020
3. Sentiment: Investor sentiment has risen to high levels of optimism. This is negative from a contrary point of view and suggests that a stock market pullback may be necessary in early 2021 to recycle investor sentiment back to more normal levels.
4. Momentum: The severity of the stock market’s decline for the first quarter of 2020 set the stage for the market’s subsequent strength for the remainder of the year. Salient Tactical Growth Fund’s volume and breadth momentum models turned positive in late March and early April and remained so into the end of the year. Upside volume remained strong while downside volume abated. The rising relative strength of some of the lagging sectors during the second half of the year contributed to the market’s improved breadth, which was also a positive.
At the end of 2020, however, the market’s strong rise had become extended and both volume and breadth momentum measures showed an overbought condition. Some type of normal pullback would be expected in early 2021 to bring these indicators back into more neutral territory. Nonetheless, the Fund’s momentum models continue to point to potential further gains after a normal market correction.
10
Salient Tactical Growth Fund
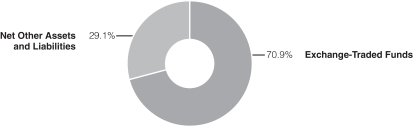
Asset Allocation as a Percentage of Net Assets
as of December 31, 2020
Hypothetical Growth of $100,000 Investment in the Fund
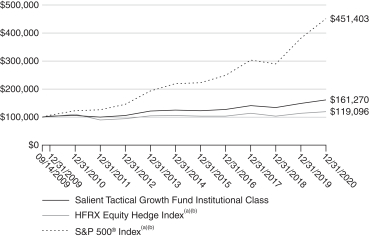
The chart above shows how a hypothetical investment of $100,000 in the Fund at its inception would have performed versus an investment in the Fund’s benchmark index. The values indicate what $100,000 would have grown to over the time period indicated. The hypothetical example does not represent the returns of any particular investment.
11
Salient Tactical Growth Fund(c)
| | | | | | | | | | | | | | | | | | | | | | | | | |
| | | 1 Year | | 5 Year | | 10 Year | | Since
Inception | | Inception
Date |
| Average Annual Total Return for the period ended December 31, 2020 | | | | | | | | | | | | | | | | | | | | | | | | | |
Investor Class | | | | 7.99% | | | | | 5.24% | | | | | 3.98% | | | | | 3.97% | | | | | 09/14/09 | |
| | | | | |
Institutional Class | | | | 8.40% | | | | | 5.60% | | | | | 4.34% | | | | | 4.32% | | | | | 09/14/09 | |
| | | | | |
Class A (with sales load)(d) | | | | 1.75% | | | | | 3.89% | | | | | 3.23% | | | | | 2.99% | | | | | 03/12/10 | |
| | | | | |
Class A (without sales load)(e) | | | | 7.95% | | | | | 5.12% | | | | | 3.85% | | | | | 3.55% | | | | | 03/12/10 | |
| | | | | |
Class C (with CDSC)(f) | | | | 6.33% | | | | | 4.55% | | | | | 3.33% | | | | | 3.32% | | | | | 09/14/09 | |
| | | | | |
Class C (without CDSC)(g) | | | | 7.33% | | | | | 4.55% | | | | | 3.33% | | | | | 3.32% | | | | | 09/14/09 | |
(a) The index figures do not reflect any deduction for fees, expenses or taxes. It is not possible to invest directly in an index.
(b) Effective January 1, 2019, the HFRX Equity Hedge Index replaced the S&P 500 Index as the Fund’s primary benchmark index.
(c) Prior to May 1, 2016, Salient Tactical Growth Fund was known as Forward Tactical Growth Fund.
(d) Includes the effect of the maximum 5.75% sales charge.
(e) Excludes sales charge.
(f) Includes the 1.00% contingent deferred sales charge.
(g) Excludes the 1.00% contingent deferred sales charge.
The performance quoted represents past performance, does not guarantee future results and current performance may be lower or higher than the data quoted. The investment return and principal value of an investment will fluctuate so that shares, when redeemed, may be worth more or less than their original cost. Performance data current to the most recent month-end may be obtained at www.salientfunds.com. Investment performance may reflect fee waivers in effect. In the absence of fee waivers, total return would be lower. Total return is based on NAV, assuming reinvestment of all distributions. Performance does not reflect the deduction of taxes that a shareholder would pay on fund distributions or the redemption of fund shares.
12
Investment Disclosures
Fund Risk Disclosures
There are risks involved with investing, including loss of principal. Past performance does not guarantee future results, share prices will fluctuate and you may have a gain or loss when you redeem shares.
Asset allocation does not assure profit or protect against risk.
Diversification does not assure profit or protect against risk.
This document does not constitute an offering of any security, product, service or fund, including the Funds, for which an offer can be made only by the Funds’ prospectuses.
No fund is a complete investment program and you may lose money investing in a fund. The Funds may engage in other investment practices that may involve additional risks and you should review the Funds’ prospectuses for a complete description.
Salient Global Real Estate Fund
Borrowing for investment purposes creates leverage, which can increase the risk and volatility of a fund.
Concentration in a particular industry will involve a greater degree of risk than a more diversified portfolio.
Debt securities are subject to interest rate risk. If interest rates increase, the value of debt securities generally declines. Debt securities with longer durations tend to be more sensitive to changes in interest rates and more volatile than securities with shorter durations.
Derivative instruments involve risks different from those associated with investing directly in securities and may cause, among other things, increased volatility and transaction costs or a fund to lose more than the amount invested.
Equity securities are subject to the financial and operational risks faced by individual companies, the risk that stock markets, sectors and industries may experience periods of turbulence and instability and the general risk that domestic and global economies may go through periods of decline and cyclical change.
Investing in exchange-traded funds (ETFs) will subject a fund to substantially the same risks as those associated with the direct ownership of the securities or other property held by the ETFs.
Foreign securities, especially emerging or frontier markets, will involve additional risks including exchange rate fluctuations, social and political instability, less liquidity, greater volatility and less regulation.
Manager risk is the risk that a fund’s portfolio managers may make poor investment decisions, which would negatively affect a fund’s investment performance.
Market events in the U.S. and global financial markets may result in unusually high market volatility, which could negatively impact a fund’s performance and cause a fund to experience illiquidity, shareholder redemptions or other potentially adverse effects.
Mortgage- and asset-backed securities are debt instruments that are secured by interests in pools of mortgage loans or other financial instruments. Mortgage-backed securities are subject to, among other things, prepayment and extension risks.
Overseas stock exchange transactions may pose increased risk and result in delays in obtaining accurate information on the value of securities.
Investing in the real estate industry or in real estate-related securities involves the risks associated with direct ownership of real estate which include, among other things, changes in economic conditions (e.g., interest rates), the macro real estate development market, government intervention (e.g., property taxes) or environmental disasters. These risks may also affect the value of equities that service the real estate sector.
13
Investment Disclosures, continued
Salient Global Real Estate Fund (continued)
Investing in smaller companies generally will present greater investment risks, including greater price volatility, greater sensitivity to changing economic conditions and less liquidity than investing in larger, more mature companies.
Salient Select Income Fund
Borrowing for investment purposes creates leverage, which can increase the risk and volatility of a fund.
Concentration in a particular industry will involve a greater degree of risk than a more diversified portfolio.
Debt securities are subject to interest rate risk. If interest rates increase, the value of debt securities generally declines. Debt securities with longer durations tend to be more sensitive to changes in interest rates and more volatile than securities with shorter durations.
Derivative instruments involve risks different from those associated with investing directly in securities and may cause, among other things, increased volatility and transaction costs or a fund to lose more than the amount invested.
Equity securities are subject to the financial and operational risks faced by individual companies, the risk that stock markets, sectors and industries may experience periods of turbulence and instability and the general risk that domestic and global economies may go through periods of decline and cyclical change.
Investing in exchange-traded funds (ETFs) will subject a fund to substantially the same risks as those associated with the direct ownership of the securities or other property held by the ETFs.
Liquidity refers to how easy it is to buy and sell shares of a security without affecting its price. Investing in securities that are less actively traded or over time experience decreased trading volume may restrict a fund’s ability to take advantage of other market opportunities or to dispose of securities.
Investing in lower-rated (“high yield”) debt securities involves special risks in addition to those associated with investments in higher-rated debt securities, including a high degree of credit risk.
Mortgage- and asset-backed securities are debt instruments that are secured by interests in pools of mortgage loans or other financial instruments. Mortgage-backed securities are subject to, among other things, prepayment and extension risks.
Investing in the real estate industry or in real estate-related securities involves the risks associated with direct ownership of real estate which include, among other things, changes in economic conditions (e.g., interest rates), the macro real estate development market, government intervention (e.g., property taxes) or environmental disasters. These risks may also affect the value of equities that service the real estate sector.
Short selling involves additional investment risks and transaction costs, and creates leverage, which can increase the risk and volatility of a fund.
Investing in smaller companies generally will present greater investment risks, including greater price volatility, greater sensitivity to changing economic conditions and less liquidity than investing in larger, more mature companies.
Salient Tactical Growth Fund
Borrowing for investment purposes creates leverage, which can increase the risk and volatility of a fund.
Debt securities are subject to interest rate risk. If interest rates increase, the value of debt securities generally declines. Debt securities with longer durations tend to be more sensitive to changes in interest rates and more volatile than securities with shorter durations.
Derivative instruments involve risks different from those associated with investing directly in securities and may cause, among other things, increased volatility and transaction costs or a fund to lose more than the amount invested.
14
Investment Disclosures, continued
Salient Tactical Growth Fund (continued)
Investing in exchange-traded funds (ETFs) will subject a fund to substantially the same risks as those associated with the direct ownership of the securities or other property held by the ETFs.
Foreign securities, especially emerging or frontier markets, will involve additional risks including exchange rate fluctuations, social and political instability, less liquidity, greater volatility and less regulation.
Manager risk is the risk that a fund’s portfolio managers may make poor investment decisions, which would negatively affect a fund’s investment performance.
Market events in the U.S. and global financial markets may result in unusually high market volatility, which could negatively impact a fund’s performance and cause a fund to experience illiquidity, shareholder redemptions or other potentially adverse effects.
Market risk is the risk that the markets on which a fund’s investments trade will lose value in response to company, market or economic news.
Relying on proprietary or third-party quantitative models and information and data supplied by third-party vendors that later prove to be inaccurate or incorrect exposes a fund to additional investment risks.
Short selling involves additional investment risks and transaction costs, and creates leverage, which can increase the risk and volatility of a fund.
Investing in smaller companies generally will present greater investment risks, including greater price volatility, greater sensitivity to changing economic conditions and less liquidity than investing in larger, more mature companies.
Alternative strategies typically are subject to increased risk and loss of principal. Consequently, investments such as mutual funds that focus on alternative strategies are not suitable for all investors.
Fund Benchmark Definitions
FTSE EPRA/NAREIT Developed Index is designed to track the performance of listed real estate companies and REITs worldwide.
HFRX Equity Hedge Index is comprised of private funds with strategies that maintain both long and short positions primarily in equity securities and equity derivatives.
ICE BofAML Fixed Rate Preferred Securities Index is a capitalization-weighted index of preferred stock issues that is generally representative of the market for preferred securities.
One cannot invest directly in an index.
ICE Data Indices, LLC (“ICE DATA”) is used with permission. ICE DATA, its affiliates and their respective third-party suppliers disclaim any and all warranties and representations, express and/or implied, including any warranties of merchantability or fitness for a particular purpose or use, including the indices, index data and any data included in, related to, or derived therefrom. Neither ICE DATA, its affiliates nor their respective third-party providers shall be subject to any damages or liability with respect to the adequacy, accuracy, timeliness or completeness of the indices or the index data or any component thereof, and the indices and index data and all components thereof are provided on an “as is” basis and your use is at your own risk. ICE DATA, its affiliates and their respective third-party suppliers do not sponsor, endorse, or recommend Salient, or any of its products or services.
Definition of Terms
10-year U.S. Treasury Note is a debt obligation issued by the U.S. Treasury that has a term of 10 years.
Breadth is a technique used in technical analysis that attempts to gauge the direction of the overall market by analyzing the number of companies advancing relative to the number declining.
15
Investment Disclosures, continued
Cash flow is a revenue or expense stream that changes a cash account over a given period.
Coverage ratio is a metric intended to measure a company’s ability to service its debt and meet its financial obligations, such as interest payments or dividends.
Credit spread is the spread between Treasury securities and non-Treasury securities that are identical in all respects except for quality rating.
Derivative is a security whose price is dependent upon or derived from one or more underlying assets.
Federal Reserve (Fed) is the central bank of the United States that is responsible for regulating the U.S. monetary and financial systems.
FTSE NAREIT Equity REITs Index is representative of the tax-qualified REITs listed on the New York Stock Exchange, the American Stock Exchange and the NASDAQ National Market, excluding timber and infrastructure REITs.
Futures are financial contracts that obligate the buyer to purchase an asset (or the seller to sell an asset), such as a physical commodity or a financial instrument, at a predetermined future date and price.
Gross domestic product (GDP) is the monetary value of all the finished goods and services produced in a country in a given year. GDP is one way of measuring the size of a country’s economy.
Hedging is an investment strategy intended to reduce the risk of adverse price movements in an asset. Normally, a hedge consists of taking an offsetting or opposite position in a related security.
A margin call occurs when the value of an investor’s margin account, which contains securities bought with borrowed money, falls below the broker’s required amount. When a margin call occurs, the investor must choose to either deposit more money in the account or sell some of the assets held in the account.
Momentum is the rate of acceleration of a security’s price or volume.
Monetary policy refers to the actions of a central bank, currency board or other regulatory committee that determine the size and rate of growth of the money supply, including a change in interest rates or the amount of money banks need to keep in bank reserves.
MSCI World Index is a free float-adjusted market capitalization index designed to measure equity market performance in the global developed markets.
Net lease refers to a contractual agreement where a lessee pays a portion or all of the taxes, insurance fees and maintenance costs for a commercial real estate property in addition to rent.
Operating margin measures how much profit a company earns on sales after paying for operating expenses.
Real estate investment trust (REIT) is a security that sells like a stock on the major exchanges and invests in real estate directly, either through properties or mortgages.
Re-leasing spreads measure the change in rent per square foot between new and expiring leases.
S&P 500 Index is an unmanaged index of 500 common stocks chosen to reflect the industries in the U.S. economy.
Valuation is the process of determining the value of an asset or company based on earnings and the market value of assets.
Volatility is a statistical measure of the dispersion of returns for a given security or market index.
Volume is the number of shares or contracts traded in a security or an entire market during a given period of time.
16
Investment Disclosures, continued
Wells Fargo Hybrid and Preferred Securities REIT Index is a modified market capitalization-weighted index that tracks the performance of preferred securities issued in the U.S. market by real estate investment trusts.
Yield is the interest or dividends received from a security and is usually expressed annually as a percentage based on the investment’s cost or on the U.S. government’s debt obligations.
17
Disclosure of Fund Expenses (Unaudited)
For the Six Months Ended December 31, 2020
As a shareholder of the Forward Funds, you incur two types of costs: (1) transaction costs, including applicable sales charges (loads); and (2) ongoing costs, including management fees, distribution and service (12b-1) fees, shareholder services fees and other Fund expenses. This example is intended to help you understand your ongoing costs (in dollars) of investing in the Funds and to compare these costs with the ongoing costs of investing in other mutual funds. The example is based on an investment of $1,000 invested at the beginning of the (six-month) period and held for the entire period July 1, 2020 through December 31, 2020.
Actual Expenses
The first line for each share class of each Fund in the table provides information about actual account values and actual expenses. You may use this information, together with the amount you invested, to estimate the expenses that you paid over the period. Simply divide your account value by $1,000 (for example, an $8,600 account value divided by $1,000 = 8.6), then multiply the result by the number in the applicable line under the heading entitled “Expenses Paid During Period” to estimate the expenses you paid on your account during this period.
Hypothetical Example For Comparison Purposes
The second line for each share class of each Fund in the table below provides information about hypothetical account values and hypothetical expenses based on the Fund’s actual expense ratio and an assumed rate of return of 5% per year before expenses, which is not the Fund’s actual return. The hypothetical account values and expenses may not be used to estimate the actual ending account balance or expenses you paid for the period. You may use this information to compare the ongoing costs of investing in the Funds and other funds. To do so, compare this 5% hypothetical example with the 5% hypothetical examples that appear in the shareholder reports of other funds.
Please note that the expenses shown in the table below are meant to highlight your ongoing costs only and do not reflect any transactional costs, such as sales charges (loads), redemption fees or exchange fees. Therefore, the second line for each share class of each Fund within the table is useful in comparing ongoing costs only, and will not help you determine the relative total costs of owning different funds. If these transactional costs were included, your costs would have been higher.
| | | | | | | | | | | | | | | | | | | | |
| Salient Global Real Estate Fund | | Beginning
Account Value
07/01/20 | | Ending
Account Value
12/31/20 | | Expense
Ratios(a) | | Expenses Paid
During Period(b)
07/01/20-12/31/20 |
| Investor Class | |
Actual | | | $ | 1,000.00 | | | | $ | 1,186.40 | | | | | 1.50% | | | | $ | 8.24 | |
| | | | |
Hypothetical | | | $ | 1,000.00 | | | | $ | 1,017.60 | | | | | 1.50% | | | | $ | 7.61 | |
| Institutional Class | |
Actual | | | $ | 1,000.00 | | | | $ | 1,188.40 | | | | | 1.15% | | | | $ | 6.33 | |
| | | | |
Hypothetical | | | $ | 1,000.00 | | | | $ | 1,019.36 | | | | | 1.15% | | | | $ | 5.84 | |
| Class A | |
Actual | | | $ | 1,000.00 | | | | $ | 1,186.90 | | | | | 1.55% | | | | $ | 8.52 | |
| | | | |
Hypothetical | | | $ | 1,000.00 | | | | $ | 1,017.34 | | | | | 1.55% | | | | $ | 7.86 | |
| Class C | |
Actual | | | $ | 1,000.00 | | | | $ | 1,183.30 | | | | | 2.10% | | | | $ | 11.52 | |
| | | | |
Hypothetical | | | $ | 1,000.00 | | | | $ | 1,014.58 | | | | | 2.10% | | | | $ | 10.63 | |
| Salient Select Income Fund | | | | | | | | |
| Investor Class | |
Actual | | | $ | 1,000.00 | | | | $ | 1,180.70 | | | | | 1.50% | | | | $ | 8.22 | |
| | | | |
Hypothetical | | | $ | 1,000.00 | | | | $ | 1,017.60 | | | | | 1.50% | | | | $ | 7.61 | |
18
Disclosure of Fund Expenses (Unaudited)
For the Six Months Ended December 31, 2020
| | | | | | | | | | | | | | | | | | | | |
| Salient Select Income Fund (continued) | | Beginning
Account Value
07/01/20 | | Ending
Account Value
12/31/20 | | Expense
Ratios(a) | | Expenses Paid
During Period(b)
07/01/20-12/31/20 |
| Institutional Class | |
Actual | | | $ | 1,000.00 | | | | $ | 1,182.60 | | | | | 1.15% | | | | $ | 6.31 | |
| | | | |
Hypothetical | | | $ | 1,000.00 | | | | $ | 1,019.36 | | | | | 1.15% | | | | $ | 5.84 | |
| Class A | |
Actual | | | $ | 1,000.00 | | | | $ | 1,180.20 | | | | | 1.55% | | | | $ | 8.49 | |
| | | | |
Hypothetical | | | $ | 1,000.00 | | | | $ | 1,017.34 | | | | | 1.55% | | | | $ | 7.86 | |
| Class C | |
Actual | | | $ | 1,000.00 | | | | $ | 1,177.20 | | | | | 2.10% | | | | $ | 11.49 | |
| | | | |
Hypothetical | | | $ | 1,000.00 | | | | $ | 1,014.58 | | | | | 2.10% | | | | $ | 10.63 | |
| Salient Tactical Growth Fund | | | | | | |
| Investor Class | |
Actual | | | $ | 1,000.00 | | | | $ | 1,067.50 | | | | | 1.83% | | | | $ | 9.51 | |
| | | | |
Hypothetical | | | $ | 1,000.00 | | | | $ | 1,015.94 | | | | | 1.83% | | | | $ | 9.27 | |
| Institutional Class | |
Actual | | | $ | 1,000.00 | | | | $ | 1,069.20 | | | | | 1.48% | | | | $ | 7.70 | |
| | | | |
Hypothetical | | | $ | 1,000.00 | | | | $ | 1,017.70 | | | | | 1.48% | | | | $ | 7.51 | |
| Class A | |
Actual | | | $ | 1,000.00 | | | | $ | 1,066.90 | | | | | 1.89% | | | | $ | 9.82 | |
| | | | |
Hypothetical | | | $ | 1,000.00 | | | | $ | 1,015.63 | | | | | 1.89% | | | | $ | 9.58 | |
| Class C | |
Actual | | | $ | 1,000.00 | | | | $ | 1,064.00 | | | | | 2.43% | | | | $ | 12.61 | |
| | | | |
Hypothetical | | | $ | 1,000.00 | | | | $ | 1,012.92 | | | | | 2.43% | | | | $ | 12.30 | |
(a) Annualized, based on the Fund’s most recent fiscal half year expenses.
(b) Expenses are equal to the Fund’s annualized expense ratio multiplied by the average account values over the period, multiplied by the number of days in the most recent fiscal half year (182), then divided by 366.
19
Schedule of Investments (See Note 11)
Salient Global Real Estate Fund
December 31, 2020
| | | | | | | | | | |
| | | Shares | | Value
(See Note 2) |
|
| Common Stocks: 92.9% | |
| Australia: 3.7% | |
| | |
GPT Group | | | | 190,000 | | | | $ | 659,163 | |
| | |
Scentre Group | | | | 154,000 | | | | | 330,059 | |
| | |
| | | | | | | | | 989,222 | |
| | | | | | | | | | |
| Canada: 5.4% | |
| | |
Granite Real Estate Investment Trust | | | | 11,300 | | | | | 691,547 | |
| | |
Summit Industrial Income REIT | | | | 71,400 | | | | | 765,661 | |
| | |
| | | | | | | | | 1,457,208 | |
| | | | | | | | | | |
| France: 5.3% | |
| | |
Gecina SA | | | | 4,800 | | | | | 740,609 | |
| | |
Unibail-Rodamco-Westfield | | | | 8,800 | | | | | 692,114 | |
| | |
| | | | | | | | | 1,432,723 | |
| | | | | | | | | | |
| Germany: 3.6% | |
| | |
ADLER Group SA — 144A(a)(b) | | | | 10,000 | | | | | 354,276 | |
| | |
Vonovia SE | | | | 8,500 | | | | | 620,546 | |
| | |
| | | | | | | | | 974,822 | |
| | | | | | | | | | |
| Hong Kong: 10.9% | |
| | |
Henderson Land Development Co., Ltd. | | | | 127,628 | | | | | 498,004 | |
| | |
Hongkong Land Holdings, Ltd. | | | | 118,700 | | | | | 490,231 | |
| | |
Link REIT | | | | 83,000 | | | | | 755,864 | |
| | |
Sun Hung Kai Properties, Ltd. | | | | 60,000 | | | | | 773,949 | |
| | |
Swire Properties, Ltd. | | | | 150,200 | | | | | 436,895 | |
| | |
| | | | | | | | | 2,954,943 | |
| | | | | | | | | | |
| Italy: 2.7% | |
| | |
COIMA RES SpA — 144A(b) | | | | 89,300 | | | | | 715,648 | |
| | | | | | | | | | |
| Japan: 9.7% | |
| | |
Mitsubishi Estate Co., Ltd. | | | | 35,600 | | | | | 571,296 | |
| | |
Mitsui Fudosan Co., Ltd. | | | | 35,000 | | | | | 731,659 | |
| | |
Sumitomo Realty & Development Co., Ltd. | | | | 21,000 | | | | | 646,952 | |
| | |
Tokyo Tatemono Co., Ltd. | | | | 49,500 | | | | | 678,345 | |
| | |
| | | | | | | | | 2,628,252 | |
| | | | | | | | | | |
| Singapore: 3.6% | |
| | |
CapitaLand, Ltd. | | | | 393,000 | | | | | 975,363 | |
| | | | | | | | | | |
| | | Shares | | Value
(See Note 2) |
|
| | |
| Spain: 4.0% | |
| | |
Inmobiliaria Colonial SA | | | | 46,000 | | | | $ | 450,969 | |
| | |
Merlin Properties Socimi SA | | | | 65,000 | | | | | 617,785 | |
| | |
| | | | | | | | | 1,068,754 | |
| | | | | | | | | | |
| Sweden: 2.0% | |
| | |
Fabege AB | | | | 15,400 | | | | | 242,111 | |
| | |
Hufvudstaden AB, Class A | | | | 18,300 | | | | | 302,939 | |
| | |
| | | | | | | | | 545,050 | |
| | | | | | | | | | |
| United Kingdom: 10.1% | |
| | |
Capital & Counties Properties Plc | | | | 410,000 | | | | | 812,981 | |
| | |
Derwent London Plc | | | | 17,800 | | | | | 753,614 | |
| | |
Great Portland Estates Plc | | | | 83,141 | | | | | 759,486 | |
| | |
Segro Plc | | | | 30,000 | | | | | 388,754 | |
| | |
| | | | | | | | | 2,714,835 | |
| | | | | | | | | | |
| United States: 31.9% | |
| | |
Acadia Realty Trust | | | | 33,300 | | | | | 472,527 | |
| | |
Alexandria Real Estate Equities, Inc. | | | | 4,500 | | | | | 801,990 | |
| | |
American Assets Trust, Inc. | | | | 10,000 | | | | | 288,800 | |
| | |
AvalonBay Communities, Inc. | | | | 4,100 | | | | | 657,763 | |
| | |
Boston Properties, Inc. | | | | 6,500 | | | | | 614,445 | |
| | |
Chatham Lodging Trust | | | | 75,000 | | | | | 810,000 | |
| | |
Clipper Realty, Inc. | | | | 59,185 | | | | | 417,254 | |
| | |
Equinix, Inc. | | | | 840 | | | | | 599,911 | |
| | |
Farmland Partners, Inc. | | | | 90,000 | | | | | 783,000 | |
| | |
Federal Realty Investment Trust | | | | 7,200 | | | | | 612,864 | |
| | |
Mack-Cali Realty Corp. | | | | 40,000 | | | | | 498,400 | |
| | |
Retail Opportunity Investments Corp. | | | | 42,000 | | | | | 562,380 | |
| | |
Sabra Health Care REIT, Inc. | | | | 33,600 | | | | | 583,632 | |
| | |
SL Green Realty Corp. | | | | 10,600 | | | | | 631,548 | |
| | |
Ventas, Inc. | | | | 5,700 | | | | | 279,528 | |
| | |
| | | | | | | | | 8,614,042 | |
| | |
Total Common Stocks
(Cost $26,070,796) | | | | | | | | | 25,070,862 | |
| | | | |
See accompanying Notes to Financial Statements. | | 20 | | |
Schedule of Investments (See Note 11)
Salient Global Real Estate Fund
December 31, 2020
| | | | | | | | | | |
| | | Shares | | Value
(See Note 2) |
| | |
| Limited Partnerships: 2.4% | | | | | | | | | | |
| Canada: 2.4% | |
| | |
Brookfield Property Partners LP(c) | | | | 45,000 | | | | $ | 651,150 | |
| | |
Total Limited Partnerships
(Cost $548,525) | | | | | | | | | 651,150 | |
| | |
Total Investments: 95.3%
(Cost $26,619,321) | | | | | | | | | 25,722,012 | |
| | |
| Net Other Assets and Liabilities: 4.7% | | | | | | | | | 1,262,129 | |
| | |
| Net Assets: 100.0% | | | | | | | | $ | 26,984,141 | |
All percentages disclosed are calculated by dividing the indicated amounts by net assets.
(a) Non-income producing security.
(b) Securities exempt from registration under Rule 144A of the Securities Act of 1933. These securities may be sold in the ordinary course of business in transactions exempt from registration, normally to qualified institutional buyers. At period end, the aggregate value of those securities was $1,069,924, representing 4.0% of net assets.
(c) The Security is considered a non-income producing security as the dividends received during the last 12 months are treated as return of capital per the Generally Accepted Accounting Principles.
Investment Abbreviations:
REIT — Real Estate Investment Trust
| | | | |
See accompanying Notes to Financial Statements. | | 21 | | |
Schedule of Investments (See Note 11)
Salient Select Income Fund
December 31, 2020
| | | | | | | | | | |
| | | Shares | | Value
(See Note 2) |
|
| Common Stocks: 15.5% | |
| REITs-Apartments: 2.1% | |
| | |
Clipper Realty, Inc.(a) | | | | 950,000 | | | | $ | 6,697,500 | |
| | | | | | | | | | |
| REITs-Diversified: 1.0% | |
| | |
W.P. Carey & Co., Inc. | | | | 45,000 | | | | | 3,176,100 | |
| | | | | | | | | | |
| REITs-Healthcare: 2.0% | |
| | |
Sabra Health Care REIT, Inc. | | | | 375,000 | | | | | 6,513,750 | |
| | | | | | | | | | |
| REITs-Hotels: 2.4% | |
| | |
Chatham Lodging Trust | | | | 726,300 | | | | | 7,844,040 | |
| | | | | | | | | | |
| REITs-Industrial: 2.0% | |
| | |
STAG Industrial, Inc. | | | | 210,000 | | | | | 6,577,200 | |
| | | | | | | | | | |
| REITs-Office Property: 3.9% | |
| | |
Boston Properties, Inc. | | | | 45,000 | | | | | 4,253,850 | |
| | |
IQHQ, Inc. — 144A(b)(c)(d)(g) | | | | 350,000 | | | | | 5,824,000 | |
| | |
Mack-Cali Realty Corp. | | | | 207,480 | | | | | 2,585,201 | |
| | |
| | | | | | | | | 12,663,051 | |
| | | | | | | | | | |
| REITs-Single Tenant: 2.1% | |
| | |
NETSTREIT Corp.(e) | | | | 350,000 | | | | | 6,821,500 | |
| | |
Total Common Stocks
(Cost $37,269,673) | | | | | | | | | 50,293,141 | |
| | |
| Convertible Preferred Stocks: 18.6% | | | | | | | | | | |
| REITs-Data Centers: 2.8% | |
| | |
QTS Realty Trust, Inc.
Series B, 6.500% | | | | 63,500 | | | | | 9,010,650 | |
| | | | | | | | | | |
| REITs-Diversified: 4.2% | |
| | |
Lexington Realty Trust
Series C, 6.500% | | | | 230,991 | | | | | 13,725,139 | |
| | | | | | | | | | |
| REITs-Hotels: 3.9% | |
| | |
RLJ Lodging Trust
Series A, 1.950% | | | | 500,000 | | | | | 12,700,000 | |
| | | | | | | | | | |
| REITs-Shopping Centers: 3.8% | |
| | |
RPT Realty
Series D, 7.250% | | | | 245,290 | | | | | 12,225,253 | |
| | | | | | | | | | |
| | | Shares | | Value
(See Note 2) |
|
| | |
| REITs-Specialized: 3.9% | |
| | |
EPR Properties
Series C, 5.750% | | | | 148,700 | | | | $ | 3,420,100 | |
| | |
Series E, 9.000% | | | | 290,000 | | | | | 9,186,040 | |
| | |
| | | | | | | | | 12,606,140 | |
| | |
Total Convertible Preferred Stocks
(Cost $44,995,885) | | | | | | | | | 60,267,182 | |
| | |
| Limited Partnerships: 1.2% | | | | | | | | | | |
| Real Estate Operating/Development: 1.2% | |
| | |
Brookfield Property Partners LP(f) | | | | 275,000 | | | | | 3,979,250 | |
| | |
Total Limited Partnerships
(Cost $3,675,028) | | | | | | | | | 3,979,250 | |
| | |
| Preferred Stocks: 55.7% | | | | | | | | | | |
| Oil, Gas & Consumable Fuels: 0.7% | |
| | |
TravelCenters of America, Inc.
8.250% | | | | 90,000 | | | | | 2,401,200 | |
| | | | | | | | | | |
| REITs-Apartments: 0.4% | | | | | | | | | | |
| | |
Centerspace
6.625% | | | | 47,388 | | | | | 1,232,088 | |
| | | | | | | | | | |
| REITs-Data Centers: 1.2% | |
| | |
Digital Realty Trust, Inc.
5.200% | | | | 146,500 | | | | | 3,999,450 | |
| | | | | | | | | | |
| REITs-Diversified: 5.3% | |
| | |
Armada Hoffler Properties, Inc.
Series A, 6.750% | | | | 150,677 | | | | | 3,926,643 | |
| | |
Colony Capital, Inc.
Series H, 7.125% | | | | 250,000 | | | | | 5,940,000 | |
| | |
Series I, 7.150% | | | | 114,300 | | | | | 2,697,480 | |
| | |
Vornado Realty Trust
Series K, 5.700% | | | | 22,866 | | | | | 575,308 | |
| | |
Series M, 5.250% | | | | 150,000 | | | | | 3,954,000 | |
| | |
| | | | | | | | | 17,093,431 | |
| | | | | | | | | | |
| REITs-Healthcare: 2.4% | |
| | |
Global Medical REIT, Inc.
Series A, 7.500% | | | | 285,000 | | | | | 7,660,800 | |
| | | | | | | | | | |
| REITs-Hotels: 5.0% | |
| | |
Hersha Hospitality Trust
Series C, 6.875%(b) | | | | 260,000 | | | | | 5,057,000 | |
| | |
Series E, 6.500%(b) | | | | 205,000 | | | | | 3,871,425 | |
| | | | |
See accompanying Notes to Financial Statements. | | 22 | | |
Schedule of Investments (See Note 11)
Salient Select Income Fund
December 31, 2020
| | | | | | | | | | |
| | | Shares | | Value
(See Note 2) |
| | |
| | | | | | | | | | |
| REITs-Hotels: 5.0% (continued) | | | | | | | | | | |
| | |
Pebblebrook Hotel Trust
Series D, 6.375%(e) | | | | 100,000 | | | | $ | 2,465,000 | |
| | |
Summit Hotel Properties, Inc.
Series E, 6.250% | | | | 212,000 | | | | | 4,776,360 | |
| | |
| | | | | | | | | 16,169,785 | |
| | | | | | | | | | |
| REITs-Industrial: 5.4% | |
| | |
Monmouth Real Estate Investment Corp.
Series C, 6.125% | | | | 400,000 | | | | | 10,040,000 | |
| | |
Plymouth Industrial REIT, Inc.
Series A, 7.500% | | | | 100,000 | | | | | 2,610,000 | |
| | |
Rexford Industrial Realty, Inc.
Series A, 5.875% | | | | 56,379 | | | | | 1,432,027 | |
| | |
Series B, 5.875% | | | | 44,613 | | | | | 1,170,645 | |
| | |
Series C, 5.625% | | | | 80,000 | | | | | 2,155,200 | |
| | |
| | | | | | | | | 17,407,872 | |
| | | | | | | | | | |
| REITs-Mortgage: 5.4% | |
| | |
iStar Financial, Inc.
Series D, 8.000% | | | | 24,300 | | | | | 625,239 | |
| | |
Series G, 7.650% | | | | 400,000 | | | | | 10,061,040 | |
| | |
Series I, 7.500% | | | | 275,200 | | | | | 6,888,256 | |
| | |
| | | | | | | | | 17,574,535 | |
| | | | | | | | | | |
| REITs-Office Property: 0.1% | |
| | |
Boston Properties, Inc.
Series B, 5.250% | | | | 11,492 | | | | | 298,217 | |
| | | | | | | | | | |
| REITs-Regional Malls: 1.3% | |
| | |
Taubman Centers, Inc.
Series K, 6.250%(d) | | | | 794 | | | | | 19,943 | |
| | |
Washington Prime Group, Inc.
Series I, 6.875% | | | | 295,000 | | | | | 4,132,950 | |
| | |
| | | | | | | | | 4,152,893 | |
| | | | | | | | | | |
| REITs-Residential: 7.5% | |
| | |
American Homes 4 Rent
Series D, 6.500% | | | | 154,141 | | | | | 3,905,933 | |
| | |
Series G, 5.875% | | | | 229,200 | | | | | 5,952,324 | |
| | |
Series H, 6.250% | | | | 71,000 | | | | | 1,894,280 | |
| | | | | | | | | | |
| | | Shares | | Value
(See Note 2) |
| |
| | | | | | |
| | | |
UMH Properties, Inc.
Series C, 6.750% | | | | 496,899 | | | | | 12,675,893 | |
| | |
| | | | | | | | | 24,428,430 | |
| | | | | | | | | | |
| REITs-Shopping Centers: 12.6% | |
| | |
Cedar Realty Trust, Inc.
Series C, 6.500% | | | | 199,000 | | | | | 4,258,600 | |
| | |
Kimco Realty Corp.
Series L, 5.125% | | | | 187,500 | | | | | 4,925,625 | |
| | |
Saul Centers, Inc.
Series D, 6.125% | | | | 375,000 | | | | | 9,093,750 | |
| | |
Series E, 6.000% | | | | 125,000 | | | | | 2,945,000 | |
| | |
Urstadt Biddle Properties, Inc.
Series H, 6.250% | | | | 345,500 | | | | | 8,644,410 | |
| | |
Series K, 5.875% | | | | 187,469 | | | | | 4,664,229 | |
| | |
VEREIT, Inc.
Series F, 6.700% | | | | 244,533 | | | | | 6,150,005 | |
| | |
| | | | | | | | | 40,681,619 | |
| | | | | | | | | | |
| REITs-Single Tenant: 1.0% | |
| | |
Spirit Realty Capital, Inc.
Series A, 6.000% | | | | 120,000 | | | | | 3,231,600 | |
| | | | | | | | | | |
| REITs-Specialized: 3.7% | |
| | |
Farmland Partners, Inc.
Series B, 6.000% | | | | 475,000 | | | | | 12,155,250 | |
| | | | | | | | | | |
| REITs-Storage: 3.7% | |
| | |
National Storage Affiliates Trust
Series A, 6.000% | | | | 450,000 | | | | | 11,875,500 | |
| | |
Total Preferred Stocks
(Cost $174,950,586) | | | | | | | | | 180,362,670 | |
| | | | |
See accompanying Notes to Financial Statements. | | 23 | | |
Schedule of Investments (See Note 11)
Salient Select Income Fund
December 31, 2020
| | | | | | | | | | |
| | | Principal
Amount | | Value
(See Note 2) |
|
| Convertible Corporate Bonds: 3.2% | |
| Real Estate Management/Services: 3.2% | |
| | |
CTO Realty Growth, Inc. — 144A
3.875%, 04/15/25(c)(d) | | | | $10,780,000 | | | | $ | 10,358,499 | |
| | |
Total Convertible Corporate Bonds
(Cost $10,780,000) | | | | | | | | | 10,358,499 | |
| | |
Total Investments: 94.2%
(Cost $271,671,172) | | | | | | | | | 305,260,742 | |
| | |
| Net Other Assets and Liabilities: 5.8% | | | | | | | | | 18,806,366 | |
| | |
| Net Assets: 100.0% | | | | | | | | $ | 324,067,108 | |
All percentages disclosed are calculated by dividing the indicated amounts by net assets.
(a) Affiliated company. See Note 12 in the Notes to Financial Statements for further information.
(b) Non-income producing security.
(c) Securities exempt from registration under Rule 144A of the Securities Act of 1933. These securities may be sold in the ordinary course of business in transactions exempt from registration, normally to qualified institutional buyers. At period end, the aggregate value of those securities was $16,182,498, representing 5.0% of net assets.
(d) IQHQ, Inc, CTO Realty Growth, Inc and Taubman Centers, Inc. are restricted securities exempt from the Securities Act of 1933. These securities may be resold in transactions exempt from registration, normally to qualified institutional buyers. See Note 2(n) in the Notes to Financial Statements for further information.
(e) Security, or portion of security, is being held as collateral in a segregated account for possible future use for the line(s) of credit. At period end, the aggregate market value of those securities was $466,797, representing 0.14% of net assets.
(f) The Security is considered a non-income producing security as the dividends received during the last 12 months are treated as return of capital per the Generally Accepted Accounting Principles.
(g) This investment is classified as a Level 3 asset and such classification was a result of the unavailability of other significant observable inputs. At period end, the aggregate value of the security was $5,824,000, representing 1.80% of net assets. See Note 3 in the Notes Financial Statements for further information.
Investment Abbreviations:
REIT — Real Estate Investment Trust
| | | | |
See accompanying Notes to Financial Statements. | | 24 | | |
Schedule of Investments (See Note 11)
Salient Tactical Growth Fund
December 31, 2020
| | | | | | | | | | |
| | | Shares | | Value
(See Note 2) |
|
| Exchange-Traded Funds: 70.9% | |
| | | |
Consumer Discretionary Select Sector SPDR® Fund | | | | 95,469 | | | | $ | 15,349,506 | |
| | |
Health Care Select Sector SPDR® Fund | | | | 127,798 | | | | | 14,497,405 | |
| | |
Industrial Select Sector SPDR® Fund | | | | 101,738 | | | | | 9,008,900 | |
| | |
Invesco QQQ Trust Series 1™, Series 1 | | | | 51,056 | | | | | 16,018,309 | |
| | |
iShares® Russell 2000 Value ETF | | | | 73,705 | | | | | 9,710,634 | |
| | |
Materials Select Sector SPDR® Trust Fund | | | | 123,449 | | | | | 8,936,473 | |
| | |
SPDR S&P 500® ETF Trust | | | | 358,502 | | | | | 134,036,728 | |
| | |
Total Exchange-Traded Funds
(Cost $177,494,635) | | | | | | | | | 207,557,955 | |
| | |
Total Investments: 70.9%
(Cost $177,494,635) | | | | | | | | | 207,557,955 | |
| | |
| Net Other Assets and Liabilities: 29.1% | | | | | | | | | 85,366,886 | |
| | |
| Net Assets: 100.0% | | | | | | | | $ | 292,924,841 | |
All percentages disclosed are calculated by dividing the indicated amounts by net assets.
Investment Abbreviations:
ETF — Exchange-Traded Fund
S&P — Standard & Poor’s
SPDR — Standard & Poor’s Depository Receipts
| | | | |
See accompanying Notes to Financial Statements. | | 25 | | |
Statements of Assets and Liabilities
December 31, 2020
| | | | | |
| | | Salient
Global Real
Estate Fund |
Assets: | | | | | |
Investments, at value | | | $ | 25,722,012 | |
Cash | | | | 1,358,582 | |
Interest and dividends receivable | | | | 91,200 | |
Other assets | | | | 9,264 | |
| | | | | |
Total Assets | | | | 27,181,058 | |
| | | | | |
Liabilities: | | | | | |
Payable for shares redeemed | | | | 133,945 | |
Payable to advisor | | | | 3,620 | |
Payable for distribution and service fees | | | | 10,413 | |
Payable for compliance fees | | | | 254 | |
Payable to ReFlow (See Note 2(m)) | | | | 522 | |
Payable for legal and audit fees | | | | 27,017 | |
Accrued expenses and other liabilities | | | | 21,146 | |
| | | | | |
Total Liabilities | | | | 196,917 | |
| | | | | |
Net Assets | | | $ | 26,984,141 | |
| | | | | |
Net Assets Consist of: | | | | | |
Paid-in capital | | | $ | 50,531,596 | |
Total distributable earnings | | | | (23,547,455 | ) |
| | | | | |
Total Net Assets | | | $ | 26,984,141 | |
| | | | | |
| |
Investments, At Cost | | | $ | 26,619,321 | |
Pricing of Shares | | | | | |
Investor Class: | | | | | |
Net Assets | | | $ | 698,646 | |
Shares of beneficial interest outstanding | | | | 53,853 | |
Net Asset Value, offering and redemption price per share | | | $ | 12.97 | |
Institutional Class: | | | | | |
Net Assets | | | $ | 3,359,516 | |
Shares of beneficial interest outstanding | | | | 261,247 | |
Net Asset Value, offering and redemption price per share | | | $ | 12.86 | |
Class A: | | | | | |
Net Assets | | | $ | 20,341,382 | |
Shares of beneficial interest outstanding | | | | 1,574,704 | |
Net Asset Value, offering and redemption price per share | | | $ | 12.92 | |
Maximum offering price per share (NAV/0.9425, based on maximum sales charge of 5.75% of the offering price) | | | $ | 13.71 | |
Class C: | | | | | |
Net Assets | | | $ | 2,584,597 | |
Shares of beneficial interest outstanding | | | | 200,712 | |
Net Asset Value, offering and redemption price per share | | | $ | 12.88 | |
| | | | |
See accompanying Notes to Financial Statements. | | 26 | | |
Statements of Assets and Liabilities
December 31, 2020
| | | | | | | | | | |
| | | Salient Select
Income Fund | | Salient
Tactical
Growth Fund |
Assets: | | | | | | | | | | |
Investments in affiliates, at value | | | $ | 6,697,500 | | | | $ | — | |
Investments, at value | | | | 298,563,242 | | | | | 207,557,955 | |
Cash | | | | 17,520,255 | | | | | 85,281,399 | |
Receivable for investments sold | | | | 231,615 | | | | | — | |
Receivable for shares sold | | | | 158,246 | | | | | 275,265 | |
Interest and dividends receivable | | | | 1,701,872 | | | | | 566,457 | |
Other assets | | | | 18,331 | | | | | 29,800 | |
| | | | | | | | | | |
Total Assets | | | | 324,891,061 | | | | | 293,710,876 | |
| | | | | | | | | | |
Liabilities: | | | | | | | | | | |
Payable for interest and commitment fees due on loan (See Note 2(i)) | | | | 430 | | | | | — | |
Payable for shares redeemed | | | | 394,458 | | | | | 388,178 | |
Payable to advisor | | | | 225,557 | | | | | 282,442 | |
Payable for distribution and service fees | | | | 83,780 | | | | | 30,333 | |
Payable for compliance fees | | | | 2,588 | | | | | 2,158 | |
Payable for legal and audit fees | | | | 33,210 | | | | | 32,070 | |
Accrued expenses and other liabilities | | | | 83,930 | | | | | 50,854 | |
| | | | | | | | | | |
Total Liabilities | | | | 823,953 | | | | | 786,035 | |
| | | | | | | | | | |
Net Assets | | | $ | 324,067,108 | | | | $ | 292,924,841 | |
| | | | | | | | | | |
Net Assets Consist of: | �� | | | | | | | | | |
Paid-in capital | | | $ | 314,877,957 | | | | $ | 262,692,039 | |
Total distributable earnings | | | | 9,189,151 | | | | | 30,232,802 | |
| | | | | | | | | | |
Total Net Assets | | | $ | 324,067,108 | | | | $ | 292,924,841 | |
| | | | | | | | | | |
Investment in Affiliates, At Cost | | | $ | 11,548,688 | | | | $ | — | |
| | |
Investments, At Cost | | | | 260,122,484 | | | | | 177,494,635 | |
Pricing of Shares | | | | | | | | | | |
Investor Class: | | | | | | | | | | |
Net Assets | | | $ | 9,169,873 | | | | $ | 8,049,718 | |
Shares of beneficial interest outstanding | | | | 466,201 | | | | | 298,675 | |
Net Asset Value, offering and redemption price per share | | | $ | 19.67 | | | | $ | 26.95 | |
Institutional Class: | | | | | | | | | | |
Net Assets | | | $ | 160,525,509 | | | | $ | 255,095,229 | |
Shares of beneficial interest outstanding | | | | 8,156,783 | | | | | 9,124,116 | |
Net Asset Value, offering and redemption price per share | | | $ | 19.68 | | | | $ | 27.96 | |
Class A: | | | | | | | | | | |
Net Assets | | | $ | 125,193,577 | | | | $ | 17,949,443 | |
Shares of beneficial interest outstanding | | | | 6,340,608 | | | | | 679,881 | |
Net Asset Value, offering and redemption price per share | | | $ | 19.74 | | | | $ | 26.40 | |
Maximum offering price per share (NAV/0.9425, based on maximum sales charge of 5.75% of the offering price) | | | $ | 20.95 | | | | $ | 28.01 | |
Class C: | | | | | | | | | | |
Net Assets | | | $ | 29,178,149 | | | | $ | 11,830,451 | |
Shares of beneficial interest outstanding | | | | 1,525,129 | | | | | 478,493 | |
Net Asset Value, offering and redemption price per share | | | $ | 19.13 | | | | $ | 24.72 | |
| | | | |
See accompanying Notes to Financial Statements. | | 27 | | |
Statements of Operations
For the Year Ended December 31, 2020
| | | | | |
| | | Salient
Global Real
Estate Fund |
Investment Income: | |
Interest | | | $ | 6,980 | |
Dividends | | | | 761,221 | |
Foreign taxes withheld | | | | (40,417 | ) |
| | | | | |
Total Investment Income | | | | 727,784 | |
| | | | | |
Expenses: | | | | | |
Investment advisory fee | | | | 285,214 | |
Administration fees and expenses | | | | 61,810 | |
Custodian fee | | | | 5,120 | |
Legal and audit fees | | | | 55,966 | |
Transfer agent fees and expenses | | | | 35,471 | |
Trustees’ fees and expenses | | | | 9,153 | |
Registration/filing fees | | | | 52,591 | |
Reports to shareholders and printing fees | | | | 11,021 | |
Distribution and service fees | | | | | |
Investor Class | | | | 2,966 | |
Institutional Class | | | | 2,271 | |
Class A | | | | 91,303 | |
Class C | | | | 29,476 | |
Compliance fees | | | | 7,386 | |
ReFlow fees (See Note 2(m)) | | | | 221 | |
Other | | | | 40,871 | |
| | | | | |
Total expenses before waivers | | | | 690,840 | |
Less fees waived/reimbursed by investment advisor (See Note 4) | | | | (251,578 | ) |
| | | | | |
Total Expenses | | | | 439,262 | |
| | | | | |
Net Investment Income: | | | | 288,522 | |
| | | | | |
Net realized loss on investments and foreign currency translations | | | | (319,364 | ) |
Net realized loss on foreign currency | | | | (4,229 | ) |
Net change in unrealized appreciation/depreciation on investments and foreign currency translations | | | | (5,009,469 | ) |
Net change in unrealized appreciation/depreciation on foreign currency transactions | | | | 1,282 | |
| | | | | |
Net Realized and Unrealized Loss on Investments, Futures Contracts and Foreign Currency Translations | | | | (5,331,780 | ) |
| | | | | |
Net Decrease in Net Assets Resulting From Operations | | | $ | (5,043,258 | ) |
| | | | | |
| | | | |
See accompanying Notes to Financial Statements. | | 28 | | |
Statements of Operations
For the Year Ended December 31, 2020
| | | | | | | | | | |
| | | Salient Select
Income Fund | | Salient Tactical
Growth Fund |
Investment Income: | |
Interest | | | $ | 618,313 | | | | $ | 336,873 | |
Dividends | | | | 12,863,376 | | | | | 2,328,326 | |
Foreign taxes withheld | | | | (2,981 | ) | | | | — | |
| | | | | | | | | | |
Total Investment Income | | | | 13,478,708 | | | | | 2,665,199 | |
| | | | | | | | | | |
Expenses: | | | | | | | | | | |
Investment advisory fee | | | | 3,507,642 | | | | | 3,468,307 | |
Administration fees and expenses | | | | 295,020 | | | | | 238,413 | |
Custodian fee | | | | 8,648 | | | | | 4,767 | |
Legal and audit fees | | | | 163,597 | | | | | 141,083 | |
Transfer agent fees and expenses | | | | 194,051 | | | | | 86,742 | |
Trustees’ fees and expenses | | | | 112,248 | | | | | 91,957 | |
Registration/filing fees | | | | 82,067 | | | | | 77,479 | |
Reports to shareholders and printing fees | | | | 95,626 | | | | | 34,933 | |
Distribution and service fees | | | | | | | | | | |
Investor Class | | | | 40,157 | | | | | 42,823 | |
Institutional Class | | | | 89,868 | | | | | 130,056 | |
Class A | | | | 562,961 | | | | | 76,197 | |
Class C | | | | 358,869 | | | | | 138,407 | |
Compliance fees | | | | 90,606 | | | | | 78,959 | |
Interest and commitment fees on loan | | | | 168,918 | | | | | — | |
Other | | | | 75,014 | | | | | 53,840 | |
| | | | | | | | | | |
Total expenses before waivers | | | | 5,845,292 | | | | | 4,663,963 | |
Less fees waived/reimbursed by investment advisor (See Note 4) | | | | (938,950 | ) | | | | — | |
| | | | | | | | | | |
Total Expenses | | | | 4,906,342 | | | | | 4,663,963 | |
| | | | | | | | | | |
Net Investment Income/(Loss): | | | | 8,572,366 | | | | | (1,998,764 | ) |
| | | | | | | | | | |
Net realized gain/(loss) on investments and foreign currency translations | | | | (23,711,669 | ) | | | | 16,869,099 | |
Net realized loss on futures contracts | | | | — | | | | | (2,635,634 | ) |
Net change in unrealized appreciation/depreciation on affiliated investments | | | | (3,011,500 | ) | | | | — | |
Net change in unrealized appreciation/depreciation on investments and foreign currency translations | | | | (14,120,989 | ) | | | | 12,862,902 | |
| | | | | | | | | | |
Net Realized and Unrealized Gain/(Loss) on Investments, Futures Contracts and Foreign Currency Translations | | | | (40,844,158 | ) | | | | 27,096,367 | |
| | | | | | | | | | |
Net Increase/(Decrease) in Net Assets Resulting From Operations | | | $ | (32,271,792 | ) | | | $ | 25,097,603 | |
| | | | | | | | | | |
| | | | |
See accompanying Notes to Financial Statements. | | 29 | | |
Statements of Changes in Net Assets
| | | | | | | | | | |
| | | Salient Global Real Estate Fund |
| | | Year Ended
December 31, 2020 | | Year Ended
December 31, 2019 |
Operations: | |
Net investment income | | | $ | 288,522 | | | | $ | 478,216 | |
Net realized gain/(loss) | | | | (323,593 | ) | | | | 1,874,297 | |
Net change in unrealized appreciation/depreciation | | | | (5,008,187 | ) | | | | 5,684,009 | |
| | | | | | | | | | |
Net increase/(decrease) in net assets resulting from operations | | | | (5,043,258 | ) | | | | 8,036,522 | |
| | | | | | | | | | |
Distributions to Shareholders: | | | | | | | | | | |
From distributable earnings | | | | | | | | | | |
Investor Class | | | | (10,454 | ) | | | | (25,442 | ) |
Institutional Class | | | | (86,665 | ) | | | | (190,707 | ) |
Class A | | | | (300,832 | ) | | | | (536,060 | ) |
Class C | | | | (27,378 | ) | | | | (77,653 | ) |
| | | | | | | | | | |
Total distributions | | | | (425,329 | ) | | | | (829,862 | ) |
| | | | | | | | | | |
Share Transactions: | | | | | | | | | | |
Investor Class | | | | | | | | | | |
Proceeds from sale of shares | | | | 88,569 | | | | | 149,236 | |
Issued to shareholders in reinvestment of distributions | | | | 10,161 | | | | | 24,690 | |
Cost of shares redeemed | | | | (424,891 | ) | | | | (428,688 | ) |
| | | | | | | | | | |
Net decrease from share transactions | | | | (326,161 | ) | | | | (254,762 | ) |
| | | | | | | | | | |
Institutional Class | | | | | | | | | | |
Proceeds from sale of shares | | | | 663,486 | | | | | 939,481 | |
Issued to shareholders in reinvestment of distributions | | | | 83,700 | | | | | 182,560 | |
Cost of shares redeemed | | | | (3,124,781 | ) | | | | (4,430,968 | ) |
| | | | | | | | | | |
Net decrease from share transactions | | | | (2,377,595 | ) | | | | (3,308,927 | ) |
| | | | | | | | | | |
Class A | | | | | | | | | | |
Proceeds from sale of shares | | | | 924,857 | | | | | 8,022,341 | |
Issued to shareholders in reinvestment of distributions | | | | 275,694 | | | | | 492,050 | |
Cost of shares redeemed | | | | (4,142,084 | ) | | | | (4,707,884 | ) |
| | | | | | | | | | |
Net increase/(decrease) from share transactions | | | | (2,941,533 | ) | | | | 3,806,507 | |
| | | | | | | | | | |
Class C | | | | | | | | | | |
Proceeds from sale of shares | | | | 141,277 | | | | | 94,148 | |
Issued to shareholders in reinvestment of distributions | | | | 26,080 | | | | | 73,834 | |
Cost of shares redeemed | | | | (1,493,315 | ) | | | | (9,257,936 | ) |
| | | | | | | | | | |
Net decrease from share transactions | | | | (1,325,958 | ) | | | | (9,089,954 | ) |
| | | | | | | | | | |
Net decrease in net assets | | | $ | (12,439,834 | ) | | | $ | (1,640,476 | ) |
| | | | | | | | | | |
Net Assets: | | | | | | | | | | |
Beginning of period | | | | 39,423,975 | | | | | 41,064,451 | |
| | | | | | | | | | |
End of period | | | $ | 26,984,141 | | | | $ | 39,423,975 | |
| | | | | | | | | | |
| | | | |
See accompanying Notes to Financial Statements. | | 30 | | |
Statements of Changes in Net Assets
| | | | | | | | | | |
| | | Salient Global Real Estate Fund (continued) |
| | | Year Ended
December 31, 2020 | | Year Ended
December 31, 2019 |
Changes in Shares Outstanding: | | | | | | | | | | |
Investor Class | | | | | | | | | | |
Sold | | | | 7,707 | | | | | 10,530 | |
Distributions reinvested | | | | 954 | | | | | 1,720 | |
Redeemed | | | | (33,564 | ) | | | | (29,985 | ) |
| | | | | | | | | | |
Net decrease in shares outstanding | | | | (24,903 | ) | | | | (17,735 | ) |
| | | | | | | | | | |
Institutional Class | | | | | | | | | | |
Sold | | | | 53,329 | | | | | 69,014 | |
Distributions reinvested | | | | 7,908 | | | | | 12,839 | |
Redeemed | | | | (265,433 | ) | | | | (313,824 | ) |
| | | | | | | | | | |
Net decrease in shares outstanding | | | | (204,196 | ) | | | | (231,971 | ) |
| | | | | | | | | | |
Class A | | | | | | | | | | |
Sold | | | | 78,032 | | | | | 568,217 | |
Distributions reinvested | | | | 26,036 | | | | | 34,392 | |
Redeemed | | | | (362,959 | ) | | | | (334,738 | ) |
| | | | | | | | | | |
Net increase/(decrease) in shares outstanding | | | | (258,891 | ) | | | | 267,871 | |
| | | | | | | | | | |
Class C | | | | | | | | | | |
Sold | | | | 12,047 | | | | | 6,771 | |
Distributions reinvested | | | | 2,525 | | | | | 5,177 | |
Redeemed | | | | (129,994 | ) | | | | (661,207 | ) |
| | | | | | | | | | |
Net decrease in shares outstanding | | | | (115,422 | ) | | | | (649,259 | ) |
| | | | | | | | | | |
| | | | |
See accompanying Notes to Financial Statements. | | 31 | | |
Statements of Changes in Net Assets
| | | | | | | | | | | | | | | | | | | | |
| | | Salient Select Income Fund | | Salient Tactical Growth Fund |
| | | Year Ended
December 31, 2020 | | Year Ended
December 31, 2019 | | Year Ended
December 31, 2020 | | Year Ended
December 31, 2019 |
Operations: | |
Net investment income/(loss) | | | $ | 8,572,366 | | | | $ | 11,305,572 | | | | $ | (1,998,764 | ) | | | $ | 1,551,752 | |
Net realized gain/(loss) | | | | (23,711,669 | ) | | | | 16,285,307 | | | | | 14,233,465 | | | | | 24,103,364 | |
Net change in unrealized appreciation/depreciation | | | | (17,132,489 | ) | | | | 50,873,801 | | | | | 12,862,902 | | | | | 4,866,048 | |
| | | | | | | | | | | | | | | | | | | | |
Net increase/(decrease) in net assets resulting from operations | | | | (32,271,792 | ) | | | | 78,464,680 | | | | | 25,097,603 | | | | | 30,521,164 | |
| | | | | | | | | | | | | | | | | | | | |
Distributions to Shareholders: | | | | | | | | | | | | | | | | | | | | |
From distributable earnings | | | | | | | | | | | | | | | | | | | | |
Investor Class | | | | (219,984 | ) | | | | (367,678 | ) | | | | (312,925 | ) | | | | (255,981 | ) |
Institutional Class | | | | (4,314,601 | ) | | | | (5,423,368 | ) | | | | (9,590,307 | ) | | | | (11,862,618 | ) |
Class A | | | | (2,840,413 | ) | | | | (3,558,534 | ) | | | | (695,529 | ) | | | | (821,694 | ) |
Class C | | | | (716,657 | ) | | | | (1,343,436 | ) | | | | (507,206 | ) | | | | (791,698 | ) |
From return of capital | | | | | | | | | | | | | | | | | | | | |
Investor Class | | | | (250,988 | ) | | | | (474,153 | ) | | | | — | | | | | — | |
Institutional Class | | | | (4,922,624 | ) | | | | (6,993,897 | ) | | | | — | | | | | — | |
Class A | | | | (3,240,679 | ) | | | | (4,589,031 | ) | | | | — | | | | | — | |
Class C | | | | (817,653 | ) | | | | (1,732,484 | ) | | | | — | | | | | — | |
| | | | | | | | | | | | | | | | | | | | |
Total distributions | | | | (17,323,599 | ) | | | | (24,482,581 | ) | | | | (11,105,967 | ) | | | | (13,731,991 | ) |
| | | | | | | | | | | | | | | | | | | | |
Share Transactions: | |
Investor Class | |
Proceeds from sale of shares | | | | 1,773,520 | | | | | 3,955,725 | | | | | 23,910,493 | | | | | 912,002 | |
Issued to shareholders in reinvestment of distributions | | | | 463,400 | | | | | 828,353 | | | | | 296,022 | | | | | 248,474 | |
Cost of shares redeemed | | | | (6,782,155 | ) | | | | (6,308,962 | ) | | | | (22,319,974 | ) | | | | (2,860,263 | ) |
| | | | | | | | | | | | | | | | | | | | |
Net increase/(decrease) from share transactions | | | | (4,545,235 | ) | | | | (1,524,884 | ) | | | | 1,886,541 | | | | | (1,699,787 | ) |
| | | | | | | | | | | | | | | | | | | | |
Institutional Class | |
Proceeds from sale of shares | | | | 75,885,597 | | | | | 77,830,597 | | | | | 104,941,285 | | | | | 34,008,478 | |
Issued to shareholders in reinvestment of distributions | | | | 8,471,677 | | | | | 11,083,095 | | | | | 9,471,466 | | | | | 11,745,265 | |
Cost of shares redeemed | | | | (129,488,008 | ) | | | | (79,761,795 | ) | | | | (121,548,920 | ) | | | | (85,914,594 | ) |
| | | | | | | | | | | | | | | | | | | | |
Net increase/(decrease) from share transactions | | | | (45,130,734 | ) | | | | 9,151,897 | | | | | (7,136,169 | ) | | | | (40,160,851 | ) |
| | | | | | | | | | | | | | | | | | | | |
Class A | |
Proceeds from sale of shares | | | | 13,319,832 | | | | | 77,647,877 | | | | | 6,152,698 | | | | | 11,172,645 | |
Issued to shareholders in reinvestment of distributions | | | | 4,739,212 | | | | | 6,457,414 | | | | | 684,621 | | | | | 799,330 | |
Cost of shares redeemed | | | | (38,156,169 | ) | | | | (61,899,069 | ) | | | | (6,792,881 | ) | | | | (6,955,275 | ) |
| | | | | | | | | | | | | | | | | | | | |
Net increase/(decrease) from share transactions | | | | (20,097,125 | ) | | | | 22,206,222 | | | | | 44,438 | | | | | 5,016,700 | |
| | | | | | | | | | | | | | | | | | | | |
Class C | |
Proceeds from sale of shares | | | | 942,773 | | | | | 2,770,807 | | | | | 2,347,135 | | | | | 1,187,922 | |
Issued to shareholders in reinvestment of distributions | | | | 1,381,742 | | | | | 2,670,725 | | | | | 447,748 | | | | | 706,918 | |
Cost of shares redeemed | | | | (18,901,465 | ) | | | | (66,628,508 | ) | | | | (7,860,812 | ) | | | | (14,560,149 | ) |
| | | | | | | | | | | | | | | | | | | | |
Net decrease from share transactions | | | | (16,576,950 | ) | | | | (61,186,976 | ) | | | | (5,065,929 | ) | | | | (12,665,309 | ) |
| | | | | | | | | | | | | | | | | | | | |
Net increase/(decrease) in net assets | | | $ | (135,945,435 | ) | | | $ | 22,628,358 | | | | $ | 3,720,517 | | | | $ | (32,720,074 | ) |
| | | | | | | | | | | | | | | | | | | | |
Net Assets: | |
Beginning of period | | | | 460,012,543 | | | | | 437,384,185 | | | | | 289,204,324 | | | | | 321,924,398 | |
| | | | | | | | | | | | | | | | | | | | |
End of period | | | $ | 324,067,108 | | | | $ | 460,012,543 | | | | $ | 292,924,841 | | | | $ | 289,204,324 | |
| | | | | | | | | | | | | | | | | | | | |
| | | | |
See accompanying Notes to Financial Statements. | | 32 | | |
Statements of Changes in Net Assets
| | | | | | | | | | | | | | | | | | | | |
| | | Salient Select Income Fund (continued) | | Salient Tactical Growth Fund (continued) |
| | | Year Ended
December 31, 2020 | | Year Ended
December 31, 2019 | | Year Ended
December 31, 2020 | | Year Ended
December 31, 2019 |
Changes in Shares Outstanding: | | | | | | | | | | | | | | | | | | | | |
Investor Class | | | | | | | | | | | | | | | | | | | | |
Sold | | | | 94,556 | | | | | 189,451 | | | | | 926,084 | | | | | 36,390 | |
Distributions reinvested | | | | 27,183 | | | | | 39,182 | | | | | 11,150 | | | | | 9,843 | |
Redeemed | | | | (394,554 | ) | | | | (299,446 | ) | | | | (841,805 | ) | | | | (111,861 | ) |
| | | | | | | | | | | | | | | | | | | | |
Net increase/(decrease) in shares outstanding | | | | (272,815 | ) | | | | (70,813 | ) | | | | 95,429 | | | | | (65,628 | ) |
| | | | | | | | | | | | | | | | | | | | |
Institutional Class | | | | | | | | | | | | | | | | | | | | |
Sold | | | | 4,150,223 | | | | | 3,701,272 | | | | | 3,857,596 | | | | | 1,288,378 | |
Distributions reinvested | | | | 493,555 | | | | | 523,554 | | | | | 343,568 | | | | | 447,347 | |
Redeemed | | | | (7,351,145 | ) | | | | (3,782,087 | ) | | | | (4,406,169 | ) | | | | (3,246,953 | ) |
| | | | | | | | | | | | | | | | | | | | |
Net increase/(decrease) in shares outstanding | | | | (2,707,367 | ) | | | | 442,739 | | | | | (205,005 | ) | | | | (1,511,228 | ) |
| | | | | | | | | | | | | | | | | | | | |
Class A | | | | | | | | | | | | | | | | | | | | |
Sold | | | | 731,443 | | | | | 3,666,510 | | | | | 236,806 | | | | | 439,855 | |
Distributions reinvested | | | | 274,748 | | | | | 304,169 | | | | | 26,321 | | | | | 32,199 | |
Redeemed | | | | (2,127,866 | ) | | | | (2,912,754 | ) | | | | (261,861 | ) | | | | (276,883 | ) |
| | | | | | | | | | | | | | | | | | | | |
Net increase/(decrease) in shares outstanding | | | | (1,121,675 | ) | | | | 1,057,925 | | | | | 1,266 | | | | | 195,171 | |
| | | | | | | | | | | | | | | | | | | | |
Class C | | | | | | | | | | | | | | | | | | | | |
Sold | | | | 57,330 | | | | | 134,266 | | | | | 95,378 | | | | | 49,076 | |
Distributions reinvested | | | | 83,166 | | | | | 129,962 | | | | | 18,380 | | | | | 30,262 | |
Redeemed | | | | (1,073,411 | ) | | | | (3,232,508 | ) | | | | (322,134 | ) | | | | (605,536 | ) |
| | | | | | | | | | | | | | | | | | | | |
Net decrease in shares outstanding | | | | (932,915 | ) | | | | (2,968,280 | ) | | | | (208,376 | ) | | | | (526,198 | ) |
| | | | | | | | | | | | | | | | | | | | |
| | | | |
See accompanying Notes to Financial Statements. | | 33 | | |
Financial Highlights
For a share outstanding throughout the periods presented.
Salient Global Real Estate Fund(a)
| | | | | | | | | | | | | | | | | | | | | | | | | |
| | | Investor Class |
| | | Year Ended
December 31,
2020 | | Year Ended
December 31,
2019 | | Year Ended
December 31,
2018 | | Year Ended
December 31,
2017 | | Year Ended
December 31,
2016 |
Net Asset Value, Beginning of Period | | | $ | 14.71 | | | | $ | 12.43 | | | | $ | 14.81 | | | | $ | 13.04 | | | | $ | 13.60 | |
Income/(Loss) from Operations: | | | | | | | | | | | | | | | | | | | | | | | | | |
Net investment income(b) | | | | 0.11 | | | | | 0.17 | | | | | 0.24 | | | | | 0.07 | | | | | 0.02 | |
Net realized and unrealized gain/(loss) on investments | | | | (1.67 | ) | | | | 2.42 | | | | | (1.74 | ) | | | | 2.67 | | | | | 0.07 | |
| | | | | | | | | | | | | | | | | | | | | | | | | |
Total from Investment Operations | | | | (1.56 | ) | | | | 2.59 | | | | | (1.50 | ) | | | | 2.74 | | | | | 0.09 | |
| | | | | | | | | | | | | | | | | | | | | | | | | |
Less Distributions: | | | | | | | | | | | | | | | | | | | | | | | | | |
From investment income | | | | (0.18 | ) | | | | (0.31 | ) | | | | (0.76 | ) | | | | (0.97 | ) | | | | (0.65 | ) |
From return of capital | | | | — | | | | | — | | | | | (0.12 | ) | | | | — | | | | | — | |
| | | | | | | | | | | | | | | | | | | | | | | | | |
Total Distributions | | | | (0.18 | ) | | | | (0.31 | ) | | | | (0.88 | ) | | | | (0.97 | ) | | | | (0.65 | ) |
| | | | | | | | | | | | | | | | | | | | | | | | | |
Net Increase/(Decrease) in Net Asset Value | | | | (1.74 | ) | | | | 2.28 | | | | | (2.38 | ) | | | | 1.77 | | | | | (0.56 | ) |
| | | | | | | | | | | | | | | | | | | | | | | | | |
Net Asset Value, End of Period | | | $ | 12.97 | | | | $ | 14.71 | | | | $ | 12.43 | | | | $ | 14.81 | | | | $ | 13.04 | |
| | | | | | | | | | | | | | | | | | | | | | | | | |
Total Return | | | | (10.34 | )% | | | | 20.87 | % | | | | (10.78 | )% | | | | 21.44 | % | | | | 0.74 | % |
Ratios/Supplemental Data: | | | | | | | | | | | | | | | | | | | | | | | | | |
Net assets, End of Period (in 000s) | | | $ | 699 | | | | $ | 1,159 | | | | $ | 1,199 | | | | $ | 555 | | | | $ | 607 | |
Ratios to Average Net Assets (excluding short sales expense): | | | | | | | | | | | | | | | | | | | | | | | | | |
Net investment income including reimbursement/waiver | | | | 0.95 | % | | | | 1.22 | % | | | | 1.71 | % | | | | 0.52 | % | | | | 0.17 | % |
Operating expenses including reimbursement/waiver | | | | 1.50 | % | | | | 1.50 | % | | | | 1.89 | %(c) | | | | n/a | | | | | n/a | |
Operating expenses excluding reimbursement/waiver | | | | 2.39 | % | | | | 2.07 | % | | | | 2.96 | % | | | | 2.39 | % | | | | 2.12 | % |
Portfolio Turnover Rate(d) | | | | 29 | % | | | | 21 | % | | | | 101 | % | | | | 41 | % | | | | 80 | % |
(a) Prior to August 14, 2018, Salient Global Real Estate Fund was known as Salient International Real Estate Fund. Prior to May 1, 2016, Salient International Real Estate Fund was known as Forward International Real Estate Fund.
(b) Per share amounts are based upon average shares outstanding.
(c) Effective August 21, 2018, the Advisor agreed to limit expenses to 1.50%.
(d) Portfolio turnover rate is calculated on the basis of the Fund as a whole without distinguishing between the classes of shares issued.
| | | | |
See accompanying Notes to Financial Statements. | | 34 | | |
Financial Highlights
For a share outstanding throughout the periods presented.
Salient Global Real Estate Fund(a)
| | | | | | | | | | | | | | | | | | | | | | | | | |
| | | Institutional Class |
| | | Year Ended
December 31,
2020 | | Year Ended
December 31,
2019 | | Year Ended
December 31,
2018 | | Year Ended
December 31,
2017 | | Year Ended
December 31,
2016 |
Net Asset Value, Beginning of Period | | | $ | 14.59 | | | | $ | 12.33 | | | | $ | 14.68 | | | | $ | 12.93 | | | | $ | 13.51 | |
Income/(Loss) from Operations: | | | | | | | | | | | | | | | | | | | | | | | | | |
Net investment income(b) | | | | 0.16 | | | | | 0.22 | | | | | 0.28 | | | | | 0.12 | | | | | 0.10 | |
Net realized and unrealized gain/(loss) on investments | | | | (1.66 | ) | | | | 2.40 | | | | | (1.72 | ) | | | | 2.64 | | | | | 0.04 | |
| | | | | | | | | | | | | | | | | | | | | | | | | |
Total from Investment Operations | | | | (1.50 | ) | | | | 2.62 | | | | | (1.44 | ) | | | | 2.76 | | | | | 0.14 | |
| | | | | | | | | | | | | | | | | | | | | | | | | |
Less Distributions: | | | | | | | | | | | | | | | | | | | | | | | | | |
From investment income | | | | (0.23 | ) | | | | (0.36 | ) | | | | (0.79 | ) | | | | (1.01 | ) | | | | (0.72 | ) |
From return of capital | | | | — | | | | | — | | | | | (0.12 | ) | | | | — | | | | | — | |
| | | | | | | | | | | | | | | | | | | | | | | | | |
Total Distributions | | | | (0.23 | ) | | | | (0.36 | ) | | | | (0.91 | ) | | | | (1.01 | ) | | | | (0.72 | ) |
| | | | | | | | | | | | | | | | | | | | | | | | | |
Net Increase/(Decrease) in Net Asset Value | | | | (1.73 | ) | | | | 2.26 | | | | | (2.35 | ) | | | | 1.75 | | | | | (0.58 | ) |
| | | | | | | | | | | | | | | | | | | | | | | | | |
Net Asset Value, End of Period | | | $ | 12.86 | | | | $ | 14.59 | | | | $ | 12.33 | | | | $ | 14.68 | | | | $ | 12.93 | |
| | | | | | | | | | | | | | | | | | | | | | | | | |
Total Return | | | | (9.98 | )% | | | | 21.31 | % | | | | (10.51 | )% | | | | 21.88 | % | | | | 0.98 | % |
Ratios/Supplemental Data: | | | | | | | | | | | | | | | | | | | | | | | | | |
Net assets, End of Period (in 000s) | | | $ | 3,360 | | | | $ | 6,793 | | | | $ | 8,600 | | | | $ | 6,655 | | | | $ | 4,481 | |
Ratios to Average Net Assets (excluding short sales expense): | | | | | | | | | | | | | | | | | | | | | | | | | |
Net investment income including reimbursement/waiver | | | | 1.38 | % | | | | 1.54 | % | | | | 2.01 | % | | | | 0.89 | % | | | | 0.74 | % |
Operating expenses including reimbursement/waiver | | | | 1.15 | % | | | | 1.15 | % | | | | 1.65 | %(c) | | | | n/a | | | | | n/a | |
Operating expenses excluding reimbursement/waiver | | | | 2.03 | % | | | | 1.71 | % | | | | 2.57 | % | | | | 2.03 | % | | | | 1.90 | % |
Portfolio Turnover Rate(d) | | | | 29 | % | | | | 21 | % | | | | 101 | % | | | | 41 | % | | | | 80 | % |
(a) Prior to August 14, 2018, Salient Global Real Estate Fund was known as Salient International Real Estate Fund. Prior to May 1, 2016, Salient International Real Estate Fund was known as Forward International Real Estate Fund.
(b) Per share amounts are based upon average shares outstanding.
(c) Effective August 21, 2018, the Advisor agreed to limit expenses to 1.15%.
(d) Portfolio turnover rate is calculated on the basis of the Fund as a whole without distinguishing between the classes of shares issued.
| | | | |
See accompanying Notes to Financial Statements. | | 35 | | |
Financial Highlights
For a share outstanding throughout the periods presented.
Salient Global Real Estate Fund(a)
| | | | | | | | | | | | | | | | | | | | | | | | | |
| | | Class A |
| | | Year Ended
December 31,
2020 | | Year Ended
December 31,
2019 | | Year Ended
December 31,
2018 | | Year Ended
December 31,
2017 | | Year Ended
December 31,
2016 |
Net Asset Value, Beginning of Period | | | $ | 14.65 | | | | $ | 12.38 | | | | $ | 14.75 | | | | $ | 12.99 | | | | $ | 13.59 | |
Income/(Loss) from Operations: | | | | | | | | | | | | | | | | | | | | | | | | | |
Net investment income(b) | | | | 0.12 | | | | | 0.17 | | | | | 0.23 | | | | | 0.07 | | | | | 0.04 | |
Net realized and unrealized gain/(loss) on investments | | | | (1.68 | ) | | | | 2.40 | | | | | (1.73 | ) | | | | 2.65 | | | | | 0.03 | |
| | | | | | | | | | | | | | | | | | | | | | | | | |
Total from Investment Operations | | | | (1.56 | ) | | | | 2.57 | | | | | (1.50 | ) | | | | 2.72 | | | | | 0.07 | |
| | | | | | | | | | | | | | | | | | | | | | | | | |
Less Distributions: | | | | | | | | | | | | | | | | | | | | | | | | | |
From investment income | | | | (0.17 | ) | | | | (0.30 | ) | | | | (0.76 | ) | | | | (0.96 | ) | | | | (0.67 | ) |
From return of capital | | | | — | | | | | — | | | | | (0.11 | ) | | | | — | | | | | — | |
| | | | | | | | | | | | | | | | | | | | | | | | | |
Total Distributions | | | | (0.17 | ) | | | | (0.30 | ) | | | | (0.87 | ) | | | | (0.96 | ) | | | | (0.67 | ) |
| | | | | | | | | | | | | | | | | | | | | | | | | |
Net Increase/(Decrease) in Net Asset Value | | | | (1.73 | ) | | | | 2.27 | | | | | (2.37 | ) | | | | 1.76 | | | | | (0.60 | ) |
| | | | | | | | | | | | | | | | | | | | | | | | | |
Net Asset Value, End of Period | | | $ | 12.92 | | | | $ | 14.65 | | | | $ | 12.38 | | | | $ | 14.75 | | | | $ | 12.99 | |
| | | | | | | | | | | | | | | | | | | | | | | | | |
Total Return(c) | | | | (10.36 | )% | | | | 20.82 | % | | | | (10.74 | )% | | | | 21.30 | % | | | | 0.60 | % |
Ratios/Supplemental Data: | | | | | | | | | | | | | | | | | | | | | | | | | |
Net assets, End of Period (in 000s) | | | $ | 20,341 | | | | $ | 26,859 | | | | $ | 19,377 | | | | $ | 8,426 | | | | $ | 9,384 | |
Ratios to Average Net Assets (excluding short sales expense): | | | | | | | | | | | | | | | | | | | | | | | | | |
Net investment income including reimbursement/waiver | | | | 1.02 | % | | | | 1.21 | % | | | | 1.66 | % | | | | 0.49 | % | | | | 0.33 | % |
Operating expenses including reimbursement/waiver | | | | 1.55 | % | | | | 1.55 | % | | | | 1.87 | %(d) | | | | n/a | | | | | n/a | |
Operating expenses excluding reimbursement/waiver | | | | 2.43 | % | | | | 2.11 | % | | | | 3.04 | % | | | | 2.44 | % | | | | 2.35 | % |
Portfolio Turnover Rate(e) | | | | 29 | % | | | | 21 | % | | | | 101 | % | | | | 41 | % | | | | 80 | % |
(a) Prior to August 14, 2018, Salient Global Real Estate Fund was known as Salient International Real Estate Fund. Prior to May 1, 2016, Salient International Real Estate Fund was known as Forward International Real Estate Fund.
(b) Per share amounts are based upon average shares outstanding.
(c) Total return does not reflect the effect of sales charges.
(d) Effective August 21, 2018, the Advisor agreed to limit expenses to 1.55%.
(e) Portfolio turnover rate is calculated on the basis of the Fund as a whole without distinguishing between the classes of shares issued.
| | | | |
See accompanying Notes to Financial Statements. | | 36 | | |
Financial Highlights
For a share outstanding throughout the periods presented.
Salient Global Real Estate Fund(a)
| | | | | | | | | | | | | | | | | | | | | | | | | |
| | | Class C |
| | | Year Ended
December 31,
2020 | | Year Ended
December 31,
2019 | | Year Ended
December 31,
2018 | | Year Ended
December 31,
2017 | | Year Ended
December 31,
2016 |
Net Asset Value, Beginning of Period | | | $ | 14.59 | | | | $ | 12.31 | | | | $ | 14.73 | | | | $ | 13.00 | | | | $ | 13.62 | |
Income/(Loss) from Operations: | | | | | | | | | | | | | | | | | | | | | | | | | |
Net investment income/(loss)(b) | | | | 0.05 | | | | | 0.07 | | | | | 0.13 | | | | | (0.01 | )(c) | | | | (0.03 | )(c) |
Net realized and unrealized gain/(loss) on investments | | | | (1.65 | ) | | | | 2.41 | | | | | (1.73 | ) | | | | 2.64 | | | | | 0.03 | |
| | | | | | | | | | | | | | | | | | | | | | | | | |
Total from Investment Operations | | | | (1.60 | ) | | | | 2.48 | | | | | (1.60 | ) | | | | 2.63 | | | | | 0.00 | |
| | | | | | | | | | | | | | | | | | | | | | | | | |
Less Distributions: | | | | | | | | | | | | | | | | | | | | | | | | | |
From investment income | | | | (0.11 | ) | | | | (0.20 | ) | | | | (0.71 | ) | | | | (0.90 | ) | | | | (0.62 | ) |
From return of capital | | | | — | | | | | — | | | | | (0.11 | ) | | | | — | | | | | — | |
| | | | | | | | | | | | | | | | | | | | | | | | | |
Total Distributions | | | | (0.11 | ) | | | | (0.20 | ) | | | | (0.82 | ) | | | | (0.90 | ) | | | | (0.62 | ) |
| | | | | | | | | | | | | | | | | | | | | | | | | |
Net Increase/(Decrease) in Net Asset Value | | | | (1.71 | ) | | | | 2.28 | | | | | (2.42 | ) | | | | 1.73 | | | | | (0.62 | ) |
| | | | | | | | | | | | | | | | | | | | | | | | | |
Net Asset Value, End of Period | | | $ | 12.88 | | | | $ | 14.59 | | | | $ | 12.31 | | | | $ | 14.73 | | | | $ | 13.00 | |
| | | | | | | | | | | | | | | | | | | | | | | | | |
Total Return(d) | | | | (10.81 | )% | | | | 20.19 | % | | | | (11.51 | )% | | | | 20.73 | % | | | | (0.02 | )% |
Ratios/Supplemental Data: | | | | | | | | | | | | | | | | | | | | | | | | | |
Net assets, End of Period (in 000s) | | | $ | 2,585 | | | | $ | 4,614 | | | | $ | 11,888 | | | | $ | 6,155 | | | | $ | 6,465 | |
Ratios to Average Net Assets (excluding short sales expense): | | | | | | | | | | | | | | | | | | | | | | | | | |
Net investment income/(loss) including reimbursement/waiver | | | | 0.41 | % | | | | 0.51 | % | | | | 0.96 | % | | | | (0.05 | )% | | | | (0.22 | )% |
Operating expenses including reimbursement/waiver | | | | 2.10 | % | | | | 2.10 | % | | | | 2.51 | %(e) | | | | n/a | | | | | n/a | |
Operating expenses excluding reimbursement/waiver | | | | 2.98 | % | | | | 2.67 | % | | | | 3.64 | % | | | | 2.99 | % | | | | 2.90 | % |
Portfolio Turnover Rate(f) | | | | 29 | % | | | | 21 | % | | | | 101 | % | | | | 41 | % | | | | 80 | % |
(a) Prior to August 14, 2018, Salient Global Real Estate Fund was known as Salient International Real Estate Fund. Prior to May 1, 2016, Salient International Real Estate Fund was known as Forward International Real Estate Fund.
(b) Per share amounts are based upon average shares outstanding.
(c) The amount shown for a share outstanding throughout the period may not correlate with the Statement of Operations for the period due to the timing of sales and redemptions of Fund shares in relation to income earned and/or fluctuating market value of the investments of the Fund.
(d) Total return does not reflect the effect of sales charges.
(e) Effective August 21, 2018, the Advisor agreed to limit expenses to 2.10%.
(f) Portfolio turnover rate is calculated on the basis of the Fund as a whole without distinguishing between the classes of shares issued.
| | | | |
See accompanying Notes to Financial Statements. | | 37 | | |
Financial Highlights
For a share outstanding throughout the periods presented.
Salient Select Income Fund(a)
| | | | | | | | | | | | | | | | | | | | | | | | | |
| | | Investor Class |
| | | Year Ended
December 31,
2020 | | Year Ended
December 31,
2019 | | Year Ended
December 31,
2018 | | Year Ended
December 31,
2017 | | Year Ended
December 31,
2016 |
Net Asset Value, Beginning of Period | | | $ | 21.40 | | | | $ | 19.06 | | | | $ | 22.10 | | | | $ | 23.79 | | | | $ | 22.34 | |
Income/(Loss) from Operations: | | | | | | | | | | | | | | | | | | | | | | | | | |
Net investment income(b) | | | | 0.41 | | | | | 0.49 | | | | | 0.58 | | | | | 0.55 | | | | | 0.52 | |
Net realized and unrealized gain/(loss) on investments | | | | (1.22 | ) | | | | 2.94 | | | | | (2.47 | ) | | | | (0.21 | ) | | | | 2.47 | |
| | | | | | | | | | | | | | | | | | | | | | | | | |
Total from Investment Operations | | | | (0.81 | ) | | | | 3.43 | | | | | (1.89 | ) | | | | 0.34 | | | | | 2.99 | |
| | | | | | | | | | | | | | | | | | | | | | | | | |
Less Distributions: | | | | | | | | | | | | | | | | | | | | | | | | | |
From investment income | | | | (0.43 | ) | | | | (0.48 | ) | | | | (0.65 | ) | | | | (0.63 | ) | | | | (0.53 | ) |
From capital gains | | | | — | | | | | — | | | | | (0.49 | ) | | | | (1.40 | ) | | | | (1.01 | ) |
From return of capital | | | | (0.49 | ) | | | | (0.61 | ) | | | | (0.01 | ) | | | | — | | | | | — | |
| | | | | | | | | | | | | | | | | | | | | | | | | |
Total Distributions | | | | (0.92 | ) | | | | (1.09 | ) | | | | (1.15 | ) | | | | (2.03 | ) | | | | (1.54 | ) |
| | | | | | | | | | | | | | | | | | | | | | | | | |
Net Increase/(Decrease) in Net Asset Value | | | | (1.73 | ) | | | | 2.34 | | | | | (3.04 | ) | | | | (1.69 | ) | | | | 1.45 | |
| | | | | | | | | | | | | | | | | | | | | | | | | |
Net Asset Value, End of Period | | | $ | 19.67 | | | | $ | 21.40 | | | | $ | 19.06 | | | | $ | 22.10 | | | | $ | 23.79 | |
| | | | | | | | | | | | | | | | | | | | | | | | | |
Total Return | | | | (3.09 | )% | | | | 18.18 | % | | | | (8.74 | )% | | | | 1.44 | % | | | | 13.66 | % |
Ratios/Supplemental Data: | | | | | | | | | | | | | | | | | | | | | | | | | |
Net assets, End of Period (in 000s) | | | $ | 9,170 | | | | $ | 15,815 | | | | $ | 15,432 | | | | $ | 28,030 | | | | $ | 82,206 | |
Ratios to Average Net Assets (including interest and dividends on short sales expense): | | | | | | | | | | | | | | | | | | | | | | | | | |
Net investment income | | | | 2.25 | % | | | | 2.33 | % | | | | 2.77 | % | | | | 2.34 | % | | | | 2.24 | % |
Operating expenses including reimbursement/waiver | | | | 1.50 | % | | | | 1.46 | % | | | | 1.79 | %(c) | | | | n/a | | | | | n/a | |
Operating expenses excluding reimbursement/waiver | | | | 1.78 | % | | | | 1.71 | % | | | | 1.91 | % | | | | 2.12 | % | | | | 2.30 | % |
Ratios to Average Net Assets (excluding interest and dividends on short sales expense): | | | | | | | | | | | | | | | | | | | | | | | | | |
Net investment income | | | | 2.30 | % | | | | 2.37 | % | | | | 3.00 | % | | | | 2.73 | % | | | | 2.84 | % |
Operating expenses including reimbursement/waiver | | | | 1.45 | % | | | | 1.42 | % | | | | 1.56 | %(c) | | | | n/a | | | | | n/a | |
Operating expenses excluding reimbursement/waiver | | | | 1.73 | % | | | | 1.67 | % | | | | 1.68 | % | | | | 1.73 | % | | | | 1.70 | % |
Portfolio Turnover Rate(d) | | | | 55 | % | | | | 49 | % | | | | 24 | % | | | | 45 | % | | | | 46 | % |
(a) Prior to May 1, 2016, Salient Select Income Fund was known as Forward Select Income Fund.
(b) Per share amounts are based upon average shares outstanding.
(c) Effective July 1, 2018, the Advisor agreed to limit expenses to 1.50%.
(d) Portfolio turnover rate is calculated on the basis of the Fund as a whole without distinguishing between the classes of shares issued.
| | | | |
See accompanying Notes to Financial Statements. | | 38 | | |
Financial Highlights
For a share outstanding throughout the periods presented.
Salient Select Income Fund(a)
| | | | | | | | | | | | | | | | | | | | | | | | | |
| | | Institutional Class |
| | | Year Ended
December 31,
2020 | | Year Ended
December 31,
2019 | | Year Ended
December 31,
2018 | | Year Ended
December 31,
2017 | | Year Ended
December 31,
2016 |
Net Asset Value, Beginning of Period | | | $ | 21.42 | | | | $ | 19.07 | | | | $ | 22.13 | | | | $ | 23.82 | | | | $ | 22.36 | |
Income/(Loss) from Operations: | | | | | | | | | | | | | | | | | | | | | | | | | |
Net investment income(b) | | | | 0.49 | | | | | 0.57 | | | | | 0.66 | | | | | 0.71 | | | | | 0.62 | |
Net realized and unrealized gain/(loss) on investments | | | | (1.24 | ) | | | | 2.95 | | | | | (2.50 | ) | | | | (0.27 | ) | | | | 2.46 | |
| | | | | | | | | | | | | | | | | | | | | | | | | |
Total from Investment Operations | | | | (0.75 | ) | | | | 3.52 | | | | | (1.84 | ) | | | | 0.44 | | | | | 3.08 | |
| | | | | | | | | | | | | | | | | | | | | | | | | |
Less Distributions: | | | | | | | | | | | | | | | | | | | | | | | | | |
From investment income | | | | (0.46 | ) | | | | (0.51 | ) | | | | (0.70 | ) | | | | (0.70 | ) | | | | (0.59 | ) |
From capital gains | | | | — | | | | | — | | | | | (0.51 | ) | | | | (1.43 | ) | | | | (1.03 | ) |
From return of capital | | | | (0.53 | ) | | | | (0.66 | ) | | | | (0.01 | ) | | | | — | | | | | — | |
| | | | | | | | | | | | | | | | | | | | | | | | | |
Total Distributions | | | | (0.99 | ) | | | | (1.17 | ) | | | | (1.22 | ) | | | | (2.13 | ) | | | | (1.62 | ) |
| | | | | | | | | | | | | | | | | | | | | | | | | |
Net Increase/(Decrease) in Net Asset Value | | | | (1.74 | ) | | | | 2.35 | | | | | (3.06 | ) | | | | (1.69 | ) | | | | 1.46 | |
| | | | | | | | | | | | | | | | | | | | | | | | | |
Net Asset Value, End of Period | | | $ | 19.68 | | | | $ | 21.42 | | | | $ | 19.07 | | | | $ | 22.13 | | | | $ | 23.82 | |
| | | | | | | | | | | | | | | | | | | | | | | | | |
Total Return | | | | (2.75 | )% | | | | 18.64 | % | | | | (8.52 | )% | | | | 1.84 | % | | | | 14.09 | % |
Ratios/Supplemental Data: | | | | | | | | | | | | | | | | | | | | | | | | | |
Net assets, End of Period (in 000s) | | | $ | 160,526 | | | | $ | 232,707 | | | | $ | 198,762 | | | | $ | 358,846 | | | | $ | 358,059 | |
Ratios to Average Net Assets (including interest and dividends on short sales expense): | | | | | | | | | | | | | | | | | | | | | | | | | |
Net investment income | | | | 2.68 | % | | | | 2.72 | % | | | | 3.14 | % | | | | 3.02 | % | | | | 2.64 | % |
Operating expenses including reimbursement/waiver | | | | 1.15 | % | | | | 1.10 | % | | | | 1.48 | %(c) | | | | n/a | | | | | n/a | |
Operating expenses excluding reimbursement/waiver | | | | 1.42 | % | | | | 1.35 | % | | | | 1.60 | % | | | | 1.76 | % | | | | 1.95 | % |
Ratios to Average Net Assets (excluding interest and dividends on short sales expense): | | | | | | | | | | | | | | | | | | | | | | | | | |
Net investment income | | | | 2.73 | % | | | | 2.76 | % | | | | 3.37 | % | | | | 3.41 | % | | | | 3.24 | % |
Operating expenses including reimbursement/waiver | | | | 1.10 | % | | | | 1.06 | % | | | | 1.25 | %(c) | | | | n/a | | | | | n/a | |
Operating expenses excluding reimbursement/waiver | | | | 1.37 | % | | | | 1.31 | % | | | | 1.37 | % | | | | 1.37 | % | | | | 1.35 | % |
Portfolio Turnover Rate(d) | | | | 55 | % | | | | 49 | % | | | | 24 | % | | | | 45 | % | | | | 46 | % |
(a) Prior to May 1, 2016, Salient Select Income Fund was known as Forward Select Income Fund.
(b) Per share amounts are based upon average shares outstanding.
(c) Effective July 1, 2018, the Advisor agreed to limit expenses to 1.15%.
(d) Portfolio turnover rate is calculated on the basis of the Fund as a whole without distinguishing between the classes of shares issued.
| | | | |
See accompanying Notes to Financial Statements. | | 39 | | |
Financial Highlights
For a share outstanding throughout the periods presented.
Salient Select Income Fund(a)
| | | | | | | | | | | | | | | | | | | | | | | | | |
| | | Class A |
| | | Year Ended
December 31,
2020 | | Year Ended
December 31,
2019 | | Year Ended
December 31,
2018 | | Year Ended
December 31,
2017 | | Year Ended
December 31,
2016 |
Net Asset Value, Beginning of Period | | | $ | 21.48 | | | | $ | 19.13 | | | | $ | 22.18 | | | | $ | 23.87 | | | | $ | 22.41 | |
Income/(Loss) from Operations: | | | | | | | | | | | | | | | | | | | | | | | | | |
Net investment income(b) | | | | 0.43 | | | | | 0.49 | | | | | 0.56 | | | | | 0.60 | | | | | 0.52 | |
Net realized and unrealized gain/(loss) on investments | | | | (1.26 | ) | | | | 2.94 | | | | | (2.46 | ) | | | | (0.26 | ) | | | | 2.47 | |
| | | | | | | | | | | | | | | | | | | | | | | | | |
Total from Investment Operations | | | | (0.83 | ) | | | | 3.43 | | | | | (1.90 | ) | | | | 0.34 | | | | | 2.99 | |
| | | | | | | | | | | | | | | | | | | | | | | | | |
Less Distributions: | | | | | | | | | | | | | | | | | | | | | | | | | |
From investment income | | | | (0.43 | ) | | | | (0.47 | ) | | | | (0.66 | ) | | | | (0.63 | ) | | | | (0.52 | ) |
From capital gains | | | | — | | | | | — | | | | | (0.48 | ) | | | | (1.40 | ) | | | | (1.01 | ) |
From return of capital | | | | (0.48 | ) | | | | (0.61 | ) | | | | (0.01 | ) | | | | — | | | | | — | |
| | | | | | | | | | | | | | | | | | | | | | | | | |
Total Distributions | | | | (0.91 | ) | | | | (1.08 | ) | | | | (1.15 | ) | | | | (2.03 | ) | | | | (1.53 | ) |
| | | | | | | | | | | | | | | | | | | | | | | | | |
Net Increase/(Decrease) in Net Asset Value | | | | (1.74 | ) | | | | 2.35 | | | | | (3.05 | ) | | | | (1.69 | ) | | | | 1.46 | |
| | | | | | | | | | | | | | | | | | | | | | | | | |
Net Asset Value, End of Period | | | $ | 19.74 | | | | $ | 21.48 | | | | $ | 19.13 | | | | $ | 22.18 | | | | $ | 23.87 | |
| | | | | | | | | | | | | | | | | | | | | | | | | |
Total Return(c) | | | | (3.17 | )% | | | | 18.12 | % | | | | (8.78 | )% | | | | 1.46 | % | | | | 13.56 | % |
Ratios/Supplemental Data: | | | | | | | | | | | | | | | | | | | | | | | | | |
Net assets, End of Period (in 000s) | | | $ | 125,194 | | | | $ | 160,277 | | | | $ | 122,484 | | | | $ | 265,122 | | | | $ | 414,748 | |
Ratios to Average Net Assets (including interest and dividends on short sales expense): | | | | | | | | | | | | | | | | | | | | | | | | | |
Net investment income | | | | 2.33 | % | | | | 2.33 | % | | | | 2.68 | % | | | | 2.51 | % | | | | 2.23 | % |
Operating expenses including reimbursement/waiver | | | | 1.55 | % | | | | 1.50 | % | | | | 1.83 | %(d) | | | | n/a | | | | | n/a | |
Operating expenses excluding reimbursement/waiver | | | | 1.82 | % | | | | 1.75 | % | | | | 1.95 | % | | | | 2.17 | % | | | | 2.35 | % |
Ratios to Average Net Assets (excluding interest and dividends on short sales expense): | | | | | | | | | | | | | | | | | | | | | | | | | |
Net investment income | | | | 2.38 | % | | | | 2.37 | % | | | | 2.91 | % | | | | 2.90 | % | | | | 2.83 | % |
Operating expenses including reimbursement/waiver | | | | 1.50 | % | | | | 1.46 | % | | | | 1.60 | %(d) | | | | n/a | | | | | n/a | |
Operating expenses excluding reimbursement/waiver | | | | 1.77 | % | | | | 1.71 | % | | | | 1.72 | % | | | | 1.78 | % | | | | 1.75 | % |
Portfolio Turnover Rate(e) | | | | 55 | % | | | | 49 | % | | | | 24 | % | | | | 45 | % | | | | 46 | % |
(a) Prior to May 1, 2016, Salient Select Income Fund was known as Forward Select Income Fund.
(b) Per share amounts are based upon average shares outstanding.
(c) Total return does not reflect the effect of sales charges.
(d) Effective July 1, 2018, the Advisor agreed to limit expenses to 1.55%.
(e) Portfolio turnover rate is calculated on the basis of the Fund as a whole without distinguishing between the classes of shares issued.
| | | | |
See accompanying Notes to Financial Statements. | | 40 | | |
Financial Highlights
For a share outstanding throughout the periods presented.
Salient Select Income Fund(a)
| | | | | | | | | | | | | | | | | | | | | | | | | |
| | | Class C |
| | | Year Ended
December 31,
2020 | | Year Ended
December 31,
2019 | | Year Ended
December 31,
2018 | | Year Ended
December 31,
2017 | | Year Ended
December 31,
2016 |
Net Asset Value, Beginning of Period | | | $ | 20.84 | | | | $ | 18.56 | | | | $ | 21.55 | | | | $ | 23.25 | | | | $ | 21.87 | |
Income/(Loss) from Operations: | | | | | | | | | | | | | | | | | | | | | | | | | |
Net investment income(b) | | | | 0.30 | | | | | 0.31 | | | | | 0.41 | | | | | 0.47 | | | | | 0.38 | |
Net realized and unrealized gain/(loss) on investments | | | | (1.20 | ) | | | | 2.91 | | | | | (2.42 | ) | | | | (0.27 | ) | | | | 2.40 | |
| | | | | | | | | | | | | | | | | | | | | | | | | |
Total from Investment Operations | | | | (0.90 | ) | | | | 3.22 | | | | | (2.01 | ) | | | | 0.20 | | | | | 2.78 | |
| | | | | | | | | | | | | | | | | | | | | | | | | |
Less Distributions: | | | | | | | | | | | | | | | | | | | | | | | | | |
From investment income | | | | (0.38 | ) | | | | (0.41 | ) | | | | (0.52 | ) | | | | (0.54 | ) | | | | (0.43 | ) |
From capital gains | | | | — | | | | | — | | | | | (0.45 | ) | | | | (1.36 | ) | | | | (0.97 | ) |
From return of capital | | | | (0.43 | ) | | | | (0.53 | ) | | | | (0.01 | ) | | | | — | | | | | — | |
| | | | | | | | | | | | | | | | | | | | | | | | | |
Total Distributions | | | | (0.81 | ) | | | | (0.94 | ) | | | | (0.98 | ) | | | | (1.90 | ) | | | | (1.40 | ) |
| | | | | | | | | | | | | | | | | | | | | | | | | |
Net Increase/(Decrease) in Net Asset Value | | | | (1.71 | ) | | | | 2.28 | | | | | (2.99 | ) | | | | (1.70 | ) | | | | 1.38 | |
| | | | | | | | | | | | | | | | | | | | | | | | | |
Net Asset Value, End of Period | | | $ | 19.13 | | | | $ | 20.84 | | | | $ | 18.56 | | | | $ | 21.55 | | | | $ | 23.25 | |
| | | | | | | | | | | | | | | | | | | | | | | | | |
Total Return(c) | | | | (3.69 | )% | | | | 17.51 | % | | | | (9.51 | )% | | | | 0.87 | % | | | | 12.96 | % |
Ratios/Supplemental Data: | | | | | | | | | | | | | | | | | | | | | | | | | |
Net assets, End of Period (in 000s) | | | $ | 29,178 | | | | $ | 51,214 | | | | $ | 100,706 | | | | $ | 166,857 | | | | $ | 207,758 | |
Ratios to Average Net Assets (including interest and dividends on short sales expense): | | | | | | | | | | | | | | | | | | | | | | | | | |
Net investment income | | | | 1.70 | % | | | | 1.54 | % | | | | 2.00 | % | | | | 2.03 | % | | | | 1.68 | % |
Operating expenses including reimbursement/waiver | | | | 2.10 | % | | | | 2.07 | % | | | | 2.46 | %(d) | | | | n/a | | | | | n/a | |
Operating expenses excluding reimbursement/waiver | | | | 2.37 | % | | | | 2.32 | % | | | | 2.58 | % | | | | 2.72 | % | | | | 2.90 | % |
Ratios to Average Net Assets (excluding interest and dividends on short sales expense): | | | | | | | | | | | | | | | | | | | | | | | | | |
Net investment income | | | | 1.75 | % | | | | 1.58 | % | | | | 2.23 | % | | | | 2.42 | % | | | | 2.28 | % |
Operating expenses including reimbursement/waiver | | | | 2.05 | % | | | | 2.03 | % | | | | 2.23 | %(d) | | | | n/a | | | | | n/a | |
Operating expenses excluding reimbursement/waiver | | | | 2.32 | % | | | | 2.28 | % | | | | 2.35 | % | | | | 2.33 | % | | | | 2.30 | % |
Portfolio Turnover Rate(e) | | | | 55 | % | | | | 49 | % | | | | 24 | % | | | | 45 | % | | | | 46 | % |
(a) Prior to May 1, 2016, Salient Select Income Fund was known as Forward Select Income Fund.
(b) Per share amounts are based upon average shares outstanding.
(c) Total return does not reflect the effect of sales charges.
(d) Effective July 1, 2018, the Advisor agreed to limit expenses to 2.10%.
(e) Portfolio turnover rate is calculated on the basis of the Fund as a whole without distinguishing between the classes of shares issued.
| | | | |
See accompanying Notes to Financial Statements. | | 41 | | |
Financial Highlights
For a share outstanding throughout the periods presented.
Salient Tactical Growth Fund(a)
| | | | | | | | | | | | | | | | | | | | | | | | | |
| | | Investor Class |
| | | Year Ended
December 31,
2020 | | Year Ended
December 31,
2019 | | Year Ended
December 31,
2018 | | Year Ended
December 31,
2017 | | Year Ended
December 31,
2016 |
Net Asset Value, Beginning of Period | | | $ | 25.95 | | | | $ | 24.63 | | | | $ | 26.56 | | | | $ | 25.68 | | | | $ | 24.94 | |
Income/(Loss) from Operations: | | | | | | | | | | | | | | | | | | | | | | | | | |
Net investment income/(loss)(b) | | | | (0.24 | ) | | | | 0.06 | | | | | 0.05 | | | | | (0.07 | ) | | | | (0.20 | ) |
Net realized and unrealized gain/(loss) on investments | | | | 2.30 | | | | | 2.45 | | | | | (1.39 | ) | | | | 2.75 | | | | | 1.01 | |
| | | | | | | | | | | | | | | | | | | | | | | | | |
Total from Investment Operations | | | | 2.06 | | | | | 2.51 | | | | | (1.34 | ) | | | | 2.68 | | | | | 0.81 | |
| | | | | | | | | | | | | | | | | | | | | | | | | |
Less Distributions: | | | | | | | | | | | | | | | | | | | | | | | | | |
From investment income | | | | — | | | | | (0.02 | ) | | | | (0.02 | ) | | | | — | | | | | — | |
From capital gains | | | | (1.06 | ) | | | | (1.17 | ) | | | | (0.57 | ) | | | | (1.80 | ) | | | | (0.07 | ) |
| | | | | | | | | | | | | | | | | | | | | | | | | |
Total Distributions | | | | (1.06 | ) | | | | (1.19 | ) | | | | (0.59 | ) | | | | (1.80 | ) | | | | (0.07 | ) |
| | | | | | | | | | | | | | | | | | | | | | | | | |
Net Increase/(Decrease) in Net Asset Value | | | | 1.00 | | | | | 1.32 | | | | | (1.93 | ) | | | | 0.88 | | | | | 0.74 | |
| | | | | | | | | | | | | | | | | | | | | | | | | |
Net Asset Value, End of Period | | | $ | 26.95 | | | | $ | 25.95 | | | | $ | 24.63 | | | | $ | 26.56 | | | | $ | 25.68 | |
| | | | | | | | | | | | | | | | | | | | | | | | | |
Total Return | | | | 7.99 | % | | | | 10.35 | % | | | | (5.07 | )% | | | | 10.57 | % | | | | 3.21 | % |
Ratios/Supplemental Data: | | | | | | | | | | | | | | | | | | | | | | | | | |
Net assets, End of Period (in 000s) | | | $ | 8,050 | | | | $ | 5,273 | | | | $ | 6,623 | | | | $ | 9,212 | | | | $ | 12,917 | |
Ratios to Average Net Assets (including short sales expense): | | | | | | | | | | | | | | | | | | | | | | | | | |
Net investment loss | | | | n/a | | | | | n/a | | | | | n/a | | | | | n/a | | | | | (0.80 | )% |
Operating expenses | | | | n/a | | | | | n/a | | | | | n/a | | | | | n/a | | | | | 1.84 | % |
Ratios to Average Net Assets (excluding short sales expense): | | | | | | | | | | | | | | | | | | | | | | | | | |
Net investment income/(loss) | | | | (0.92 | )% | | | | 0.25 | % | | | | 0.21 | % | | | | (0.26 | )% | | | | (0.80 | )% |
Operating expenses | | | | 1.81 | % | | | | 1.79 | % | | | | 1.78 | % | | | | 1.87 | % | | | | 1.83 | % |
Portfolio Turnover Rate(c) | | | | 626 | % | | | | 435 | % | | | | 531 | % | | | | 138 | % | | | | 837 | % |
(a) Prior to May 1, 2016, Salient Tactical Growth Fund was known as Forward Tactical Growth Fund.
(b) Per share amounts are based upon average shares outstanding.
(c) Portfolio turnover rate is calculated on the basis of the Fund as a whole without distinguishing between the classes of shares issued.
| | | | |
See accompanying Notes to Financial Statements. | | 42 | | |
Financial Highlights
For a share outstanding throughout the periods presented.
Salient Tactical Growth Fund(a)
| | | | | | | | | | | | | | | | | | | | |
| | | Institutional Class | |
| | | Year Ended
December 31,
2020 | | | Year Ended
December 31,
2019 | | | Year Ended
December 31,
2018 | | | Year Ended
December 31,
2017 | | | Year Ended
December 31,
2016 | |
Net Asset Value, Beginning of Period | | $ | 26.81 | | | $ | 25.43 | | | $ | 27.41 | | | $ | 26.36 | | | $ | 25.51 | |
Income/(Loss) from Operations: | | | | | | | | | | | | | | | | | | | | |
Net investment income/(loss)(b) | | | (0.16 | ) | | | 0.16 | | | | 0.14 | | | | 0.10 | (c) | | | (0.07 | ) |
Net realized and unrealized gain/(loss) on investments | | | 2.40 | | | | 2.53 | | | | (1.44 | ) | | | 2.75 | | | | 0.99 | |
| | | | | | | | | | | | | | | | | | | | |
Total from Investment Operations | | | 2.24 | | | | 2.69 | | | | (1.30 | ) | | | 2.85 | | | | 0.92 | |
| | | | | | | | | | | | | | | | | | | | |
Less Distributions: | | | | | | | | | | | | | | | | | | | | |
From investment income | | | (0.03 | ) | | | (0.14 | ) | | | (0.11 | ) | | | — | | | | — | |
From capital gains | | | (1.06 | ) | | | (1.17 | ) | | | (0.57 | ) | | | (1.80 | ) | | | (0.07 | ) |
| | | | | | | | | | | | | | | | | | | | |
Total Distributions | | | (1.09 | ) | | | (1.31 | ) | | | (0.68 | ) | | | (1.80 | ) | | | (0.07 | ) |
| | | | | | | | | | | | | | | | | | | | |
Net Increase/(Decrease) in Net Asset Value | | | 1.15 | | | | 1.38 | | | | (1.98 | ) | | | 1.05 | | | | 0.85 | |
| | | | | | | | | | | | | | | | | | | | |
Net Asset Value, End of Period | | $ | 27.96 | | | $ | 26.81 | | | $ | 25.43 | | | $ | 27.41 | | | $ | 26.36 | |
| | | | | | | | | | | | | | | | | | | | |
Total Return | | | 8.40 | % | | | 10.69 | % | | | (4.76 | )% | | | 10.91 | % | | | 3.61 | % |
Ratios/Supplemental Data: | | | | | | | | | | | | | | | | | | | | |
Net assets, End of Period (in 000s) | | $ | 255,095 | | | $ | 250,153 | | | $ | 275,669 | | | $ | 311,993 | | | $ | 23,721 | |
Ratios to Average Net Assets (including short sales expense): | | | | | | | | | | | | | | | | | | | | |
Net investment loss | | | n/a | | | | n/a | | | | n/a | | | | n/a | | | | (0.28 | )% |
Operating expenses | | | n/a | | | | n/a | | | | n/a | | | | n/a | | | | 1.49 | % |
Ratios to Average Net Assets (excluding short sales expense): | | | | | | | | | | | | | | | | | | | | |
Net investment income/(loss) | | | (0.58 | )% | | | 0.62 | % | | | 0.53 | % | | | 0.37 | % | | | (0.27 | )% |
Operating expenses | | | 1.47 | % | | | 1.43 | % | | | 1.47 | % | | | 1.51 | % | | | 1.48 | % |
Portfolio Turnover Rate(d) | | | 626 | % | | | 435 | % | | | 531 | % | | | 138 | % | | | 837 | % |
(a) Prior to May 1, 2016, Salient Tactical Growth Fund was known as Forward Tactical Growth Fund.
(b) Per share amounts are based upon average shares outstanding.
(c) The amount shown for a share outstanding throughout the period may not correlate with the Statement of Operations for the period due to the timing of sales and redemptions of Fund shares in relation to income earned and/or fluctuating market value of the investments of the Fund.
(d) Portfolio turnover rate is calculated on the basis of the Fund as a whole without distinguishing between the classes of shares issued.
| | | | |
See accompanying Notes to Financial Statements. | | 43 | | |
Financial Highlights
For a share outstanding throughout the periods presented.
Salient Tactical Growth Fund(a)
| | | | | | | | | | | | | | | | | | | | |
| | | Class A | |
| | | Year Ended
December 31,
2020 | | | Year Ended
December 31,
2019 | | | Year Ended
December 31,
2018 | | | Year Ended
December 31,
2017 | | | Year Ended
December 31,
2016 | |
Net Asset Value, Beginning of Period | | $ | 25.45 | | | $ | 24.24 | | | $ | 26.15 | | | $ | 25.34 | | | $ | 24.66 | |
Income/(Loss) from Operations: | | | | | | | | | | | | | | | | | | | | |
Net investment income/(loss)(b) | | | (0.26 | ) | | | 0.05 | | | | (0.07 | )(c) | | | (0.09 | ) | | | (0.18 | ) |
Net realized and unrealized gain/(loss) on investments | | | 2.27 | | | | 2.39 | | | | (1.27 | ) | | | 2.70 | | | | 0.93 | |
| | | | | | | | | | | | | | | | | | | | |
Total from Investment Operations | | | 2.01 | | | | 2.44 | | | | (1.34 | ) | | | 2.61 | | | | 0.75 | |
| | | | | | | | | | | | | | | | | | | | |
Less Distributions: | | | | | | | | | | | | | | | | | | | | |
From investment income | | | — | | | | (0.06 | ) | | | — | | | | — | | | | — | |
From capital gains | | | (1.06 | ) | | | (1.17 | ) | | | (0.57 | ) | | | (1.80 | ) | | | (0.07 | ) |
| | | | | | | | | | | | | | | | | | | | |
Total Distributions | | | (1.06 | ) | | | (1.23 | ) | | | (0.57 | ) | | | (1.80 | ) | | | (0.07 | ) |
| | | | | | | | | | | | | | | | | | | | |
Net Increase/(Decrease) in Net Asset Value | | | 0.95 | | | | 1.21 | | | | (1.91 | ) | | | 0.81 | | | | 0.68 | |
| | | | | | | | | | | | | | | | | | | | |
Net Asset Value, End of Period | | $ | 26.40 | | | $ | 25.45 | | | $ | 24.24 | | | $ | 26.15 | | | $ | 25.34 | |
| | | | | | | | | | | | | | | | | | | | |
Total Return(d) | | | 7.95 | % | | | 10.20 | % | | | (5.13 | )% | | | 10.39 | % | | | 3.04 | % |
Ratios/Supplemental Data: | | | | | | | | | | | | | | | | | | | | |
Net assets, End of Period (in 000s) | | $ | 17,949 | | | $ | 17,273 | | | $ | 11,718 | | | $ | 38,753 | | | $ | 37,332 | |
Ratios to Average Net Assets (including short sales expense): | | | | | | | | | | | | | | | | | | | | |
Net investment loss | | | n/a | | | | n/a | | | | n/a | | | | n/a | | | | (0.72 | )% |
Operating expenses | | | n/a | | | | n/a | | | | n/a | | | | n/a | | | | 1.99 | % |
Ratios to Average Net Assets (excluding short sales expense): | | | | | | | | | | | | | | | | | | | | |
Net investment income/(loss) | | | (0.99 | )% | | | 0.21 | % | | | (0.28 | )% | | | (0.34 | )% | | | (0.72 | )% |
Operating expenses | | | 1.88 | % | | | 1.85 | % | | | 1.92 | % | | | 2.01 | % | | | 1.98 | % |
Portfolio Turnover Rate(e) | | | 626 | % | | | 435 | % | | | 531 | % | | | 138 | % | | | 837 | % |
(a) Prior to May 1, 2016, Salient Tactical Growth Fund was known as Forward Tactical Growth Fund.
(b) Per share amounts are based upon average shares outstanding.
(c) The amount shown for a share outstanding throughout the period may not correlate with the Statement of Operations for the period due to the timing of sales and redemptions of Fund shares in relation to income earned and/or fluctuating market value of the investments of the Fund.
(d) Total return does not reflect the effect of sales charges.
(e) Portfolio turnover rate is calculated on the basis of the Fund as a whole without distinguishing between the classes of shares issued.
| | | | |
See accompanying Notes to Financial Statements. | | 44 | | |
Financial Highlights
For a share outstanding throughout the periods presented.
Salient Tactical Growth Fund(a)
| | | | | | | | | | | | | | | | | | | | | | | | | |
| | | Class C |
| | | Year Ended
December 31,
2020 | | Year Ended
December 31,
2019 | | Year Ended
December 31,
2018 | | Year Ended
December 31,
2017 | | Year Ended
December 31,
2016 |
Net Asset Value, Beginning of Period | | | $ | 24.03 | | | | $ | 23.01 | | | | $ | 25.04 | | | | $ | 24.45 | | | | $ | 23.90 | |
Income/(Loss) from Operations: | | | | | | | | | | | | | | | | | | | | | | | | | |
Net investment loss(b) | | | | (0.39 | ) | | | | (0.09 | )(c) | | | | (0.16 | )(c) | | | | (0.21 | ) | | | | (0.29 | ) |
Net realized and unrealized gain/(loss) on investments | | | | 2.14 | | | | | 2.28 | | | | | (1.30 | ) | | | | 2.60 | | | | | 0.91 | |
| | | | | | | | | | | | | | | | | | | | | | | | | |
Total from Investment Operations | | | | 1.75 | | | | | 2.19 | | | | | (1.46 | ) | | | | 2.39 | | | | | 0.62 | |
| | | | | | | | | | | | | | | | | | | | | | | | | |
Less Distributions: | | | | | | | | | | | | | | | | | | | | | | | | | |
From capital gains | | | | (1.06 | ) | | | | (1.17 | ) | | | | (0.57 | ) | | | | (1.80 | ) | | | | (0.07 | ) |
| | | | | | | | | | | | | | | | | | | | | | | | | |
Total Distributions | | | | (1.06 | ) | | | | (1.17 | ) | | | | (0.57 | ) | | | | (1.80 | ) | | | | (0.07 | ) |
| | | | | | | | | | | | | | | | | | | | | | | | | |
Net Increase/(Decrease) in Net Asset Value | | | | 0.69 | | | | | 1.02 | | | | | (2.03 | ) | | | | 0.59 | | | | | 0.55 | |
| | | | | | | | | | | | | | | | | | | | | | | | | |
Net Asset Value, End of Period | | | $ | 24.72 | | | | $ | 24.03 | | | | $ | 23.01 | | | | $ | 25.04 | | | | $ | 24.45 | |
| | | | | | | | | | | | | | | | | | | | | | | | | |
Total Return(d) | | | | 7.33 | % | | | | 9.67 | % | | | | (5.84 | )% | | | | 9.92 | % | | | | 2.55 | % |
Ratios/Supplemental Data: | | | | | | | | | | | | | | | | | | | | | | | | | |
Net assets, End of Period (in 000s) | | | $ | 11,830 | | | | $ | 16,505 | | | | $ | 27,915 | | | | $ | 36,679 | | | | $ | 41,943 | |
Ratios to Average Net Assets (including short sales expense): | | | | | | | | | | | | | | | | | | | | | | | | | |
Net investment loss | | | | n/a | | | | | n/a | | | | | n/a | | | | | n/a | | | | | (1.22 | )% |
Operating expenses | | | | n/a | | | | | n/a | | | | | n/a | | | | | n/a | | | | | 2.44 | % |
Ratios to Average Net Assets (excluding short sales expense): | | | | | | | | | | | | | | | | | | | | | | | | | |
Net investment loss | | | | (1.60 | )% | | | | (0.36 | )% | | | | (0.64 | )% | | | | (0.82 | )% | | | | (1.21 | )% |
Operating expenses | | | | 2.42 | % | | | | 2.40 | % | | | | 2.45 | % | | | | 2.46 | % | | | | 2.43 | % |
Portfolio Turnover Rate(e) | | | | 626 | % | | | | 435 | % | | | | 531 | % | | | | 138 | % | | | | 837 | % |
(a) Prior to May 1, 2016, Salient Tactical Growth Fund was known as Forward Tactical Growth Fund.
(b) Per share amounts are based upon average shares outstanding.
(c) The amount shown for a share outstanding throughout the period may not correlate with the Statement of Operations for the period due to the timing of sales and redemptions of Fund shares in relation to income earned and/or fluctuating market value of the investments of the Fund.
(d) Total return does not reflect the effect of sales charges.
(e) Portfolio turnover rate is calculated on the basis of the Fund as a whole without distinguishing between the classes of shares issued.
| | | | |
See accompanying Notes to Financial Statements. | | 45 | | |
Notes to Financial Statements
December 31, 2020
1. ORGANIZATION
Forward Funds (the “Trust”), a Delaware statutory trust, is an open-end management investment company registered under the Investment Company Act of 1940, as amended (the “1940 Act”). The Trust was organized on August 26, 1992, and reorganized effective April 7, 2005 as a Delaware statutory trust. As of December 31, 2020, the Trust is comprised of three registered funds under the brand name Salient. The accompanying financial statements are presented for the following funds (individually a “Fund” and collectively the “Funds”):
| | | | | | | | | | |
| Fund | | Short Name | | Commencement of Operations |
| | |
Salient Global Real Estate Fund | | Global Real Estate Fund | | April 28, 2006 |
| | |
Salient Select Income Fund | | Select Income Fund | | March 30, 2001 |
| | |
Salient Tactical Growth Fund | | Tactical Growth Fund | | September 14, 2009 |
The Funds are distributed by Forward Securities, LLC.
The Investment Advisor to the Funds is Forward Management, LLC d/b/a Salient, (the “Advisor” or “Salient Management”). The Advisor is a Delaware limited liability company that is registered as an investment advisor under the Advisers Act of 1940, as amended. Broadmark Asset Management LLC (the “Sub-Advisor”) serves as the subadvisor to Tactical Growth Fund. The Sub-Advisor is an affiliate of the Advisor.
The Funds are classified as diversified under the 1940 Act. The Funds are authorized to issue an unlimited number of shares of beneficial interest (“Shares”) with no par value. The Funds offer Class A, Class C, Institutional Class and Investor Class shares. All classes of shares have identical rights to earnings, assets and voting privileges, except for class specific expenses, sales charges, distribution, and exclusive rights to vote on matters affecting only individual classes. Class A Shares have a maximum sales charge of 5.75% as a percentage of the offering price on investments of less than $1 million (no sales charge for investments of $1 million or more). Class A Shares and Class C Shares are subject to a maximum contingent deferred sales charge of 1.00% if redeemed less than one year after purchase. Class C Shares are offered without any front-end sales charge. No sales charges are assessed with respect to Investor Class Shares and Institutional Class Shares of the Funds.
Global Real Estate Fund’s investment objective is to seek total return from both capital appreciation and current income through investing primarily in common stocks and other equity securities issued by U.S. and non-U.S. real estate companies, including real estate investment trusts (“REITs”) and similar REIT-like entities in at least three different countries. Select Income Fund’s investment objective is to seek high current income and potential for modest long-term growth of capital through investing primarily in income-producing securities of companies in the real estate industry, such as REITs, master limited partnerships
and other real estate firms. Tactical Growth Fund’s investment objective is to produce above average, risk adjusted returns, in any market environment, while exhibiting less downside volatility than the S&P 500 Index and invests primarily in a portfolio of exchange-traded funds and futures on securities indices providing exposure to securities market indices, industries or sectors within U.S. and overseas equity markets.
Information presented in the accompanying Funds’ financial statements pertains to the Investor Class, Institutional Class, Class A, and Class C shares offered by the Funds.
All classes of shares have identical rights to earnings, assets and voting privileges, except for class specific expenses and exclusive rights to vote on matters affecting only individual classes.
Global Real Estate Fund and Select Income Fund may invest a substantial portion of assets in the securities of issuers engaged in the real estate industry, including REITs. As a result, the Funds may be more affected by economic and regulatory developments in this industry than would a fund not concentrating its investments in a particular sector or industry. Global Real Estate Fund, Select Income Fund and Tactical Growth Fund are each classified as a diversified fund under the 1940 Act.
Certain Funds invest a high percentage of their assets in specific sectors of the market. As a result, the economic and regulatory developments in a particular sector of the market, positive or negative, can have a greater impact on the relevant Fund’s net asset value and may cause its shares to fluctuate more than if the Fund did not concentrate its investments in a particular sector.
2. SIGNIFICANT ACCOUNTING POLICIES
(a) BASIS OF ACCOUNTING
The accounting and reporting policies of the Funds conform with U.S. generally accepted accounting principles (“U.S. GAAP”). The financial
Notes to Financial Statements
December 31, 2020
statements have been prepared in conformity with U.S. GAAP, which requires management to make estimates and assumptions relating to the reported amounts of assets and liabilities, and the disclosure of contingent assets and liabilities at the date of the financial statements and the reported amounts of income and expenses during the reporting period. Actual results may differ from those estimates and such differences may be significant. Each Fund is an investment company and follows the investment company accounting and reporting guidance under Financial Accounting Standards Board (“FASB”) Accounting Standards Codification (“ASC”) Topic 946, “Financial Services Investment Companies”.
(b) PORTFOLIO VALUATION
Portfolio securities or contracts that are listed or traded on a national securities exchange, contract market or over-the-counter market and that are freely transferable are valued at the last sale price or market’s official closing price on the valuation day. If there have been no sales that day, such securities or contracts are valued at the mean of the closing bid and ask prices. If no bid or ask prices are quoted before closing, such securities or contracts are valued either at the last available sale price or at fair value in accordance with procedures established by, and under the general supervision of, the Board of Trustees. The Fund’s valuation policies are discussed in further detail in Note 3.
Debt securities that have an original maturity of more than 365 days or that are credit impaired are valued on the basis of the average of the latest bid and ask prices. Debt securities that have an original maturity of less than 365 days and that are not credit impaired are valued as follows: (a) maturity of 61 to 365 days, on the basis of the average of the latest bid and ask prices; and (b) maturity of 60 days or less, at amortized cost.
The Funds’ independent pricing vendors (approved by the Board of Trustees) use multiple valuation techniques to determine fair value. In instances where sufficient market activity exists, the pricing vendor may utilize a market-based approach through which quotes from market makers are used to determine value. In instances where sufficient market activity may not exist or is limited, the pricing vendors may also utilize proprietary valuation models which may consider market characteristics such as benchmark yield curves, option-adjusted spreads, credit spreads, estimated default rates, coupon rates, anticipated timing of principal repayments, underlying collateral, and other unique security features in order to estimate the relevant cash flows, which are then discounted to calculate the value.
In the event valuation information is not available from the Funds’ independent pricing vendors for a security held by a Fund, such security may be valued by alternate pricing methods, including the use of quotations obtained from dealers that make markets in such securities, or otherwise determined based on the fair value of such securities. To the extent that such securities do not trade on a valuation day and the last bid and ask prices are not available, the securities may be valued using matrix pricing or similar valuation methods from the Funds’ independent pricing vendors. Bonds that do not trade regularly and lower-rated bonds tend to be less liquid, and their values may be determined based on alternate or fair valuation methods (approved by the Board of Trustees) more frequently than portfolio holdings that are more frequently traded or that have relatively higher credit ratings.
If the Funds’ independent pricing vendors do not provide valuation information for swap contracts or structured notes held by a Fund, such swap contracts and structured notes may be valued by Salient Management, based on information from the structuring firm or issuer.
Futures, options on futures, and swap contracts that are listed or traded on a national securities exchange, commodities exchange, contract market or over-the-counter market and that are freely transferable are valued at their closing settlement price on the exchange on which they are primarily traded or based upon the current settlement price for a like instrument on the day on which the instrument is being valued. Over the counter futures, options on futures, and swap contracts for which market quotations are readily available are valued based on quotes received from independent pricing vendors or one or more dealers that make markets in such securities. If quotes are not available from an independent pricing vendor or dealers, over-the-counter futures, options on futures and swap contracts are valued using fair valuation methodologies.
Options on securities and options on indices are valued using the mean of the closing bid and ask prices of the securities or commodities exchange on which they are traded. If a mean price is not available, value shall be determined based on fair valuation methodologies. Certain investments including options may trade in the over-the-counter market and generally are valued based on the mean of the closing bid and ask prices obtained from an approved pricing service or value may be determined based on quotes from dealers that make markets in such securities.
Portfolio securities that are traded on foreign securities exchanges are generally valued at the last reported sale or closing price of such secu-
Notes to Financial Statements
December 31, 2020
rities on their respective exchanges, except when an occurrence subsequent to the time a value was so established is likely to have changed such value. In such an event, the fair value of those securities is determined in good faith through consideration of other factors in accordance with procedures established by, and under the general supervision of, the Board of Trustees. Certain Funds will use a fair valuation model provided by independent pricing vendors, which is intended to reflect fair value when a security’s value is believed to have been materially affected by a valuation event that has occurred between the close of the exchange or market on which the security is traded and the close of the normal trading day of the NYSE, normally 4:00 p.m. Eastern Time. The Funds’ procedures set forth certain triggers that instruct when to use the fair valuation model. The value assigned to a security by the fair valuation model is a determination of fair value made under the Funds’ valuation procedures and under the supervision of the Board of Trustees. In such a case, a Fund’s value for a security may be different from the last sales price (or the latest closing price) and there is no guarantee that a fair valued security will be sold at the price at which a Fund is valuing the security.
Forward currency contracts have a market value determined by the prevailing daily foreign currency exchange rates and current foreign currency exchange forward rates. The foreign currency exchange forward rates are calculated using an automated system that estimates rates on the basis of the current day foreign currency exchange rates and forward foreign currency exchange rates supplied by a pricing vendor. Foreign currency exchange rates and foreign currency exchange forward rates may generally be obtained at the close of the NYSE, normally 4:00 p.m. Eastern Time.
Redeemable securities issued by open-end registered investment companies are valued at the investment company’s net asset value, with the exception of exchange-traded products which are priced as equity securities.
All other securities and other assets are carried at their fair value as determined in good faith using methodologies approved by the Board of Trustees. The valuation methodologies include: analysis of recent public transactions in securities or assets of the same class or that are highly similar; analysis of recent private transactions in securities or assets of the same class or that are highly similar; analysis of information that provides a reasonable basis for valuation, such as appraisals, analysts’ reports, and valuation models; and cost, if other valuation methods are not available.
(c) SECURITIES TRANSACTIONS AND INVESTMENT INCOME
For financial statement purposes, security transactions are accounted for on a trade date basis. Accordingly, differences between the net asset values for financial statement purposes and for executing shareholder transactions may arise. Realized gains and losses on sales of securities are determined by the specific identification cost method. Interest income, adjusted for accretion of discounts and amortization of premiums, is recognized on the accrual basis. Dividend income is recorded on the ex-dividend date, except that certain dividends from foreign securities where the ex-dividend date may have passed are recorded as soon as a Fund is informed of such dividends in the exercise of reasonable diligence. If applicable, any foreign capital gains taxes are accrued, net of unrealized gains, and are payable upon the sale of such investments.
Based on information provided by the REITs, the Funds recharacterize distributions received from REIT investments into the following categories: ordinary income, long-term capital gains, and return of capital. If information is not available on a timely basis from the REITs, the recharacterization will be estimated based on available information that may include the previous year’s allocation. If new or additional information becomes available from the REITs at a later date, a recharacterization will be made in the following annual financial reporting period. There is no guarantee that the REITs held by the Funds will continue to pay dividends. The Funds record as dividend income the amount recharacterized as ordinary income and as realized gain the amount recharacterized as long-term capital gain in the Statement of Operations, and the amount recharacterized as a return of capital as a reduction to the cost of investments in the Statement of Assets and Liabilities and in the Schedule of Investments. These recharacterizations are reflected in the accompanying financial statements.
Distributions received from a Funds’ investments in MLPs generally are comprised of income, capital gains and return of capital. A Fund records investment income, capital gains, and return of capital based on estimates made at the time such distributions are received. Such estimates are based on historical information available from each MLP and other industry sources. These estimates may subsequently be revised based on information received from MLPs after their tax reporting periods are concluded.
(d) FOREIGN CURRENCY TRANSLATION
The books and records of the Funds are maintained in U.S. dollars. Investment valuations and other assets and liabilities initially expressed
Notes to Financial Statements
December 31, 2020
in foreign currencies are converted each business day into U.S. dollars based upon current exchange rates. Prevailing foreign exchange rates may generally be obtained at the close of the NYSE, normally 4:00 p.m. Eastern Time. The portion of realized and unrealized gains or losses on investments due to fluctuations in foreign currency exchange rates is not separately disclosed.
(e) MASTER LIMITED PARTNERSHIPS (“MLPs”)
Entities commonly referred to as MLPs are generally organized under state law as limited partnerships or limited liability companies. Certain Funds may invest in MLPs receiving partnership taxation treatment under the Internal Revenue Code of 1986, as amended (the “Code”), and whose interests or “units” are traded on securities exchanges like shares of corporate stock. To be treated as a partnership for U.S. federal income tax purposes, an MLP whose units are traded on a securities exchange must receive at least 90% of its income from qualifying sources such as interest, dividends, real property rents, gains on dispositions of real property, income and gains from mineral or natural resources activities, income and gains from the transportation or storage of certain fuels, and, in certain circumstances, income and gains from commodities or futures, forwards and options on commodities. Mineral or natural resources activities include exploration, development, production, processing, mining, refining, marketing and transportation (including pipelines) of oil and gas, minerals, geothermal energy, fertilizer, timber or industrial source carbon dioxide. An MLP consists of a general partner and limited partners (or in the case of MLPs organized as limited liability companies, a managing member and members).
The general partner or managing member typically controls the operations and management of the MLP and has an ownership stake in the partnership or limited liability company. The limited partners or members, through their ownership of limited partner or member interests, provide capital to the entity, are intended to have no role in the operation and management of the entity and receive cash distributions. Investments in MLPs consist only of limited partner or member interest ownership. The MLPs themselves generally do not pay U.S. federal income taxes. Thus, unlike investors in corporate securities, direct MLP investors are generally not subject to double taxation (i.e., corporate level tax and tax on corporate dividends). Currently, most MLPs operate in the energy and/or natural resources sector.
(f) SHORT SALES
Certain Funds may sell securities short. Short sales are transactions in which a Fund sells a security that it does not own in anticipation of a decline in the value of that security. To complete such a transaction, a Fund must borrow the security to deliver to the buyer. The Fund is then obligated to replace the security borrowed by purchasing it in the open market at some later date. The Fund bears the risk of a loss if the market price of the security increases between the date of the short sale and the date on which the Fund replaces the borrowed security. The Fund will realize a gain if the security declines in value between those dates. There can be no assurance that securities necessary to cover a short position will be available for purchase. All short sales must be fully collateralized. The Fund maintains collateral consisting of cash, U.S. government securities or other liquid assets in an amount at least equal to the value of their respective short positions. The Fund is liable for any dividends or interest payable on securities while those securities are in a short position. The Fund typically intends to hold securities sold short for the short term; therefore, they are excluded from the purchases and sales of investments in Note 9 and the Fund’s Portfolio Turnover Calculation in the Financial Highlights. None of the Funds held securities sold short as of December 31, 2020.
(g) DERIVATIVE INSTRUMENTS AND HEDGING ACTIVITIES
The following discloses the Funds’ use of derivative instruments and hedging activities.
The Funds’ investment objectives not only permit the Funds to purchase investment securities but also allow certain Funds to enter into various types of derivative contracts, including, but not limited to, futures contracts, forward currency contracts, and purchased and written option contracts. In doing so, the Funds will employ strategies in differing combinations to permit them to increase, decrease, or change the level or types of exposure to market factors. Central to those strategies are features inherent to derivatives that make them more attractive for this purpose than equity or debt securities: they require little or no initial cash investment, they can focus exposure on only certain selected risk factors, and they may not require the ultimate receipt or delivery of the underlying security (or securities) to the contract. This may allow the Funds to pursue their objectives more quickly and efficiently than if they were to make direct purchases or sales of securities capable of affecting a similar response to market factors.
Notes to Financial Statements
December 31, 2020
Market Risk Factors: In pursuit of their investment objectives, certain Funds may use derivatives that increase or decrease a Fund’s exposure to the following market risk factors:
Credit Risk: Credit risk is the risk an issuer will be unable to make principal and interest payments when due, or will default on its obligations.
Equity Risk: Equity risk relates to the change in value of equity securities as they relate to increases or decreases in the general market.
Foreign Exchange Rate Risk: Foreign exchange rate risk relates to the change in the U.S. dollar value of a security held that is denominated in a foreign currency. The value of a foreign currency denominated security will decrease as the dollar appreciates against the currency, while the value of the foreign currency denominated security will increase as the dollar depreciates against the currency.
Interest Rate Risk: Interest rate risk refers to the fluctuations in value of fixed-income securities resulting from the inverse relationship between price and yield. For example, an increase in general interest rates will tend to reduce the market value of already issued fixed income investments, and a decline in general interest rates will tend to increase the value of such investments. In addition, debt securities with longer maturities, which tend to have higher yields, are subject to potentially greater fluctuations in value from changes in interest rates than obligations with shorter maturities.
Risk of Investing in Derivatives: The Funds’ use of derivatives can result in losses due to unanticipated changes in the market risk factors and the overall market. In instances where the Funds are using derivatives to decrease or hedge exposures to market risk factors for securities held by the Funds, there are also risks that those derivatives may not perform as expected, resulting in losses for the combined or hedged positions.
Derivatives may have little or no initial cash investment relative to their market value exposure and therefore can produce significant gains or losses in excess of their cost. This use of embedded leverage allows the Funds to increase their market value exposure relative to their net assets and can substantially increase the volatility of the Funds’ performance.
Additional associated risks from investing in derivatives also exist and potentially could have significant effects on the valuation of the derivative and the Funds. Typically, the associated risks are not the risks that the Funds are attempting to increase or decrease exposure to, per their investment objectives, but are the additional risks from investing in derivatives.
Examples of these associated risks are liquidity risk, which is the risk that the Funds will not be able to settle the derivative in the open market in a timely manner, and counterparty credit risk, which is the risk that the counterparty will not fulfill its obligation to the Funds. Associated risks can be different for each type of derivative and are discussed by each derivative type in the notes that follow.
Futures: Certain Funds may invest in futures contracts in accordance with their investment objectives. Each Fund does so for a variety of reasons, including for cash management, hedging or non-hedging purposes in an attempt to achieve investment returns consistent with the Fund’s investment objective. A futures contract provides for the future sale by one party and purchase by another party of a specified quantity of the security or other financial instrument at a specified price and time. A futures contract on an index is an agreement pursuant to which two parties agree to take or make delivery of an amount of cash equal to the difference between the value of the index at the close of the last trading day of the contract and the price at which the index contract was originally written. Futures transactions may result in losses in excess of the amount invested in the futures contract. There can be no guarantee that there will be a correlation between price movements in the hedging vehicle and in the portfolio securities being hedged. An incorrect correlation could result in a loss on both the hedged securities in a Fund and the hedging vehicle so that the portfolio return might have been greater had hedging not been attempted. There can be no assurance that a liquid market will exist at a time when a Fund seeks to close out a futures contract or a futures option position. Lack of a liquid market for any reason may prevent a Fund from liquidating an unfavorable position, and the Fund would remain obligated to meet margin requirements until the position is closed. In addition, a Fund could be exposed to risk if the counterparties to the contracts are unable to meet the terms of their contracts. Counterparty risk in the Funds exchange-traded futures contracts is minimized because the counterparty in each trade is the exchange’s clearinghouse, which assures performance of the contract.
Notes to Financial Statements
December 31, 2020
When a purchase or sale of a futures contract is made by a Fund, the Fund is required to deposit with its custodian (or broker, if legally permitted) a specified amount of liquid assets (“initial margin”). The margin required for a futures contract is set by the exchange on which the contract is traded and may be modified during the term of the con- tract. The initial margin is in the nature of a performance bond or good faith deposit on the futures contract that is returned to a Fund upon termination of the contract, assuming all contractual obligations have been satisfied. Each day a Fund may pay or receive cash, called “variation margin,” equal to the daily change in value of the futures contract. Such payments or receipts are recorded for financial statement purposes as unrealized gains or losses by a Fund. Variation margin does not represent a borrowing or loan by a Fund but is instead a settlement between a Fund and the broker of the amount one would owe the other if the futures contract expired. When the contract is closed, a Fund records a realized gain or loss equal to the difference between the value of the contract at the time it was opened and the value at the time it was closed. None of the Funds held futures contracts as of December 31, 2020.
Option Writing/Purchasing: Certain Funds may write or purchase option contracts to adjust the risk and return of their overall investment positions. When a Fund writes or purchases an option, an amount equal to the premium received or paid by the Fund is recorded as a liability or an asset and is subsequently adjusted to the current market value of the option written or purchased. Premiums received or paid from writing or purchasing options that expire unexercised are treated by the Fund on the expiration date as realized gains or losses. The difference between the premium and the amount paid or received on affecting a closing purchase or sale transaction, including brokerage commissions, is also treated as a realized gain or loss. If an option is exercised, the premium paid or received is added to the cost of the purchase, or proceeds from the sale, in determining whether the Fund has realized a gain or loss on investment transactions. Risks from entering into option transactions arise from the potential inability of counterparties to meet the terms of the contracts, the potential inability to enter into closing transactions because of an illiquid secondary market and unexpected movements in security values. None of the Funds held purchased options contracts during the year ended December 31, 2020.
Certain derivative contracts are executed under either standardized netting agreements or, for exchange-traded derivatives, the relevant contracts for a particular exchange that contain enforceable netting
provisions. A derivative netting arrangement creates an enforceable right of set-off that becomes effective and affects the realization of settlement on individual assets, liabilities and collateral amounts, only following a specified event of default or early termination. Default events may include the failure to make payments or deliver securities timely, material adverse changes in financial condition or insolvency, the breach of minimum regulatory capital requirements, or loss of license, charter or other legal authorization necessary to perform under the contract. There were no derivative financial instruments that are subject to enforceable netting arrangements or other similar agreements as of December 31, 2020.
Warrants: Certain Funds may invest in warrants. A Fund may purchase warrants issued by domestic and foreign companies to purchase newly created equity securities consisting of common and preferred stock. Warrants are securities that give the holder the right, but not the obligation, to purchase equity issues of the company issuing the warrants, or a related company, at a fixed price either on a certain date or during a set period. The equity security underlying a warrant is authorized at the time the warrant is issued or is issued together with the warrant. Investing in warrants can provide a greater potential for profit or loss than an equivalent investment in the underlying security and, thus, can be a speculative investment. At the time of issue, the cost of a warrant is substantially less than the cost of the underlying security itself, and price movements in the underlying security are generally magnified in the price movements of the warrant. The leveraging effect enables the investor to gain exposure to the underlying security with a relatively low capital investment.
This leveraging increases an investor’s risk, as a complete loss of the amount invested in the warrant may result in the event of a decline in the value of the underlying security. In addition, the price of a warrant tends to be more volatile than, and may not correlate exactly to, the price of the underlying security. If the market price of the underlying security is below the exercise price of the warrant on its expiration date, the warrant will generally expire without value. The value of a warrant may decline because of a decline in the value of the underlying security, the passage of time, changes in interest rates or in the dividend or other policies of the company whose equity underlies the warrant, a change in the perception as to the future price of the underlying security, or any combination thereof. Warrants generally pay no dividends and confer no voting or other rights other than to purchase the underlying security. As of December 31, 2020, none of the Funds held warrants.
Notes to Financial Statements
December 31, 2020
The following is a summary of the effect of derivative instruments on the Statements of Operations for the year ended December 31, 2020:
| | | | | |
| | | Realized Gain (Loss) on Derivatives Recognized as a Result from Operations |
| Fund | | Net Realized
Gains (Losses)
from Futures Contracts |
| Equity Risk Exposure: | | | | | |
Salient Tactical Growth Fund | | | $ | (2,635,634 | ) |
During September 2020, Tactical Growth Fund opened and closed futures contracts with a total notional of $214.9 million, and had no open contracts at December 31, 2020. Global Real Estate and Select Income did not enter into any futures contracts for the year ending December 31, 2020.
Certain derivative contracts are executed under either standardized netting agreements or, for exchange-traded derivatives, the relevant contracts for a particular exchange that contain enforceable netting provisions. A derivative netting arrangement creates an enforceable right of set-off that becomes effective and affects the realization of settlement on individual assets, liabilities and collateral amounts, only following a specified event of default or early termination. Default events may include the failure to make payments or deliver securities timely, material adverse changes in financial condition or insolvency, the breach of minimum regulatory capital requirements, or loss of license, charter or other legal authorization necessary to perform under the contract. There were no derivative financial instruments that are subject to enforceable netting arrangements or other similar agreements as of December 31, 2020.
(h) CASH MANAGEMENT TRANSACTIONS
The Funds may hold cash balances in bank demand deposit accounts with the Funds’ custodian, Citibank, N.A. (“Citibank”). Such amounts are readily accessible to purchase investments or pay Fund expenses. The Funds consider liquid assets deposited in a bank demand deposit account to be cash equivalents. Cash and cash equivalents are valued at cost plus any accrued interest. The Funds may maintain demand deposit accounts that have an aggregate value in excess of Federal Deposit Insurance Corporation (“FDIC”) insurance limits. As a result, the Funds may be exposed to credit risk in the event of insolvency or other failure of Citibank to meet its obligations.
(i) LEVERAGE
Select Income Fund may purchase securities with borrowed money, including bank overdrafts (a form of leverage). The Fund may borrow amounts up to one-third of the value of its assets after giving effect to
such borrowing. Leverage exaggerates the effect on the net asset value of any increase or decrease in the market value of the Fund portfolio securities. These borrowings will be subject to interest costs, which may or may not be recovered by appreciation of the securities purchased. In certain cases, interest costs may exceed the return received on the securities purchased.
Select Income Fund maintains an open-ended line of credit up to a limit of $40,000,000 with Société Générale which expires May 1, 2021. For borrowings under this agreement, the Fund is charged interest of 1.20% above the one-month LIBOR. Additionally, if the borrowed amount by the Fund is below 80% of the Fund’s facility limit, the Fund is charged a commitment fee of 0.40% per annum on the amount between the facility limit and borrowed amount. Prior to May 1, 2020, Select Income Fund maintained a separate line of credit up to a limit of $50,000,000 with Société Générale which expired May 1, 2020. For borrowings under this agreement, the Fund would be charged interest of 1.05% above the one-month LIBOR. Additionally, if the borrowed amount by the Fund was below 80% of the Fund’s facility limit, the Fund would be charged a commitment fee of 0.35% per annum on the amount between the facility limit and borrowed amount. As of December 31, 2020 the borrowed amount on the line of credit was $0 for the Fund; however, based on the lender agreement, a portion of the securities in the Fund are being segregated as collateral in a segregated account for possible future use for the line of credit based on the commitment fee and terms of the line of credit. As of December 31, 2020, the aggregate market value of the securities held as collateral was $466,797, representing 0.14% of net assets.
On July 27, 2017, the head of the United Kingdom’s Financial Conduct Authority announced a desire to phase out the use of LIBOR by the end of 2021. Due to this announcement, there remains uncertainty regarding the future utilization of LIBOR and the nature of any replacement rate. As such, the potential effect of a transition away from LIBOR on the Fund, the line of credit or the financial instruments in which the Fund invests cannot yet be determined, but may result in, among other things, increased volatility or illiquidity in markets for instruments based on LIBOR and changes in the value of such instruments.
Notes to Financial Statements
December 31, 2020
(j) DISTRIBUTIONS TO SHAREHOLDERS
Dividends from net investment income, if any, are declared and paid quarterly for Select Income Fund and Global Real Estate Fund and annually for Tactical Growth Fund. For all Funds, net realized capital gains, if any, are normally distributed annually in December, and a spillover capital gain distribution, if any, is distributed in the year after which a Fund elects to treat the distribution as paid for Federal income tax purposes. There is no guarantee that the Funds will continue paying dividends. The amount of distributions is determined in accordance with Federal income tax regulations, which may differ from GAAP.
(k) FEDERAL INCOME TAXES
The Trust treats each Fund as a separate entity for Federal income tax purposes. Each Fund intends to continue to qualify each year as a “regulated investment company” under Subchapter M of the Code. By so qualifying, each Fund will not be subject to Federal income taxes to the extent that it distributes substantially all of its taxable or tax-exempt income, if any, for its tax year ending December 31. In addition, by distributing in each calendar year substantially all of its net investment income, capital gains and certain other amounts, if any, each Fund will not be subject to a Federal excise tax. Therefore, no provision is made by the Funds for Federal income or excise taxes. Withholding taxes on foreign dividends are paid (a portion of which may be reclaimable) or provided for in accordance with the applicable country’s tax rules and rates and are disclosed in the Statement of Operations. Distributions paid to shareholders are based on net investment income and net realized gains determined on a tax basis, which may differ from net investment income and net realized gains for financial reporting purposes. These differences are due primarily to differing treatment for items such as non-U.S. currency gains and losses, short-term capital gains and losses, capital losses related to wash sales, unrealized appreciation of certain investments in non-U.S. securities, and income on certain investments. The fiscal year in which amounts are distributed may differ from the year in which the net investment income and net realized gains are recorded by the Funds for financial reporting purposes. The Funds may also designate a portion of the amount paid to redeeming shareholders as a distribution for tax purposes.
As of and during the year ended December 31, 2020, and for all open tax years, the Funds did not have a liability for any unrecognized tax benefits in the accompanying financial statements. The Funds recognize the interest and penalties, if any, related to the unrecognized tax benefits as income tax expense in the Statement of Operations. During the period, the Funds did not incur any interest or penalties. The Funds
file U.S. federal, state, and local tax returns as required. Each Fund’s tax returns are subject to examination by the relevant tax authorities until expiration of the applicable statute of limitations, which is generally three years after the filing of the tax return for federal purposes and four years for most state returns. Salient Management does not believe there are any uncertain tax positions that require recognition of a tax liability.
(l) ALLOCATIONS
Expenses that are specific to a Fund or class of shares of a Fund are charged directly to that Fund or share class. Expenses that are common to all Funds generally are allocated among the Funds in proportion to their average daily net assets. For Funds offering multiple share classes, all of the realized and unrealized gains and losses and net investment income, other than class specific expenses, are allocated daily to each class in proportion to its average daily net assets. Fees provided under the distribution (Rule 12b-1 of the 1940 Act) and/ or shareholder services plans for a particular class of a Fund are charged to the operations of such class.
(m) REFLOW TRANSACTIONS
Certain Funds may participate in ReFlow, a program designed to provide an alternative liquidity source for mutual funds experiencing redemptions of their shares. In order to pay cash to shareholders who redeem their shares on a given day, a mutual fund typically must hold cash in its portfolio, liquidate portfolio securities, or borrow money, all of which impose certain costs on the fund. ReFlow provides participating mutual funds with another source of cash by standing ready to purchase shares from a fund equal to the amount of each fund’s net redemptions on a given day. ReFlow then generally redeems those shares when the fund experiences net sales. In return for this service, the fund will pay a fee to ReFlow at a rate determined by a daily auction with other participating mutual funds. The costs to a Fund for participating in ReFlow are generally expected to be influenced by and comparable to the cost of other sources of liquidity, such as each Fund’s short-term lending arrangements or the costs of selling portfolio securities to meet redemptions. ReFlow is prohibited from acquiring more than 2.95% of the total net assets of any Fund. The Board of Trustees has adopted certain procedures to govern the Funds’ participation in ReFlow. ReFlow fees that were incurred by the Funds during the year ended December 31, 2020 are recorded in the Statement of Operations, if applicable.
Notes to Financial Statements
December 31, 2020
(n) RESTRICTED SECURITIES
The Fund may purchase restricted securities or securities which are deemed to be not readily marketable. A restricted security is a security which has been purchased through a private offering and cannot be resold to the general public without prior registration under the Securities Act of 1933 (the “1933 Act”) or pursuant to the resale limitations provided by Rule 144 under the 1933 Act, or an exemption from the registration requirements of the 1933 Act. Certain restricted securities may be resold in transactions exempt from registration, normally to qualified institutional buyers.
The restricted securities held at December 31, 2020 are identified below and are also presented in each Fund’s Schedule of Investments.
Select Income Fund
| | | | | | | | | | | | | | | | | | | | | | | | | |
| Security | | % of Net
Assets | | Acquisition
Date | | Shares/
Principal
Amount | | Cost | | Fair Value |
CTO Realty Growth, Inc. | | | | 3.2 | % | | | | 01/29/2020 | | | | | 10,780,000 | | | | $ | 10,780,000 | | | | $ | 10,358,499 | |
IQHQ, Inc. | | | | 1.8 | % | | | | 10/25/2019 | | | | | 350,000 | | | | | 5,250,000 | | | | | 5,824,000 | |
Taubman Centers, Inc. | | | | 0.0 | %(a) | | | | 02/28/2020 | | | | | 794 | | | | | 12,206 | | | | | 19,943 | |
| | | | | | | | | | | | | | | | | | | | | | | | | |
Total Restricted Securities | | | | 5.0 | % | | | | | | | | | | | | | $ | 16,042,206 | | | | $ | 16,202,442 | |
| | | | | | | | | | | | | | | | | | | | | | | | | |
(a) Represents less than 0.05%.
3. FAIR VALUE MEASUREMENTS
A three-tier hierarchy has been established to classify fair value measurements for disclosure purposes. Inputs refer broadly to the assumptions that market participants would use in pricing the asset or liability, including assumptions about risk. Inputs may be observable or unobservable. Observable inputs are inputs that reflect the assumptions market participants would use in pricing the asset or liability that are developed based on market data obtained from sources independent of the reporting entity. Unobservable inputs are inputs that reflect the reporting entity’s own assumptions about the assumptions market participants would use in pricing the asset or liability that are developed based on the best information available.
Various inputs are used in determining the value of each Fund’s investments as of the reporting period end. The designated input levels are not necessarily an indication of the risk or liquidity associated with these investments. These inputs are categorized in the following hierarchy under applicable financial accounting standards:
Level 1—Unadjusted quoted prices in active markets for identical, unrestricted assets or liabilities that a Fund has the ability to access at the
measurement date. Investments in any underlying open-ended investment companies are valued at their net asset value daily and classified as Level 1.
Level 2—Quoted prices in markets which are not active, quoted prices for similar assets or liabilities in active markets or inputs other than quoted prices that are observable (either directly or indirectly) for substantially the full term of the asset or liability. The Board of Trustees has approved independent pricing vendors that calculate fair valuations of international equity securities based on a number of factors that appear to correlate to the movements in the U.S. markets. The Funds’ procedures set forth certain triggers that instruct when to use the fair valuation model. In such a case, a Fund’s value for a security may be different from the last sales price (or the last closing price) and there is no guarantee that a fair valued security will be sold at the same price at which a Fund is valuing the security.
Level 3—Significant unobservable prices or inputs (including the Fund’s own assumptions in determining the fair value of investments) where there is little or no market activity for the asset or liability at the measurement date.
Notes to Financial Statements
December 31, 2020
The following tables summarize each Fund’s investments and derivative financial instruments categorized in the disclosure hierarchy as of December 31, 2020:
| | | | | | | | | | | | | | | | | | | | |
| Investments in Securities | | Level 1 | | Level 2 | | Level 3 | | Total |
| Global Real Estate Fund | |
Common Stocks(a) | | | $ | 25,070,862 | | | | $ | — | | | | $ | — | | | | $ | 25,070,862 | |
Limited Partnerships(a) | | | | 651,150 | | | | | — | | | | | — | | | | | 651,150 | |
| | | | | | | | | | | | | | | | | | | | |
Total | | | $ | 25,722,012 | | | | $ | — | | | | $ | — | | | | $ | 25,722,012 | |
| | | | | | | | | | | | | | | | | | | | |
| | | | | | | | | | | | | | | | | | | | |
| Select Income Fund | |
Common Stocks(a) | | | $ | 44,469,141 | | | | $ | — | | | | $ | 5,824,000 | (b) | | | $ | 50,293,141 | |
Limited Partnerships(a) | | | | 3,979,250 | | | | | — | | | | | — | | | | | 3,979,250 | |
Preferred Stocks(a) | | | | 180,342,727 | | | | | 19,943 | | | | | — | | | | | 180,362,670 | |
Convertible Corporate Bonds(a) | | | | — | | | | | 10,358,499 | | | | | — | | | | | 10,358,499 | |
Convertible Preferred Stocks(a) | | | | 60,267,182 | | | | | — | | | | | — | | | | | 60,267,182 | |
| | | | | | | | | | | | | | | | | | | | |
Total | | | $ | 289,058,300 | | | | $ | 10,378,442 | | | | $ | 5,824,000 | | | | $ | 305,260,742 | |
| | | | | | | | | | | | | | | | | | | | |
| | | | | | | | | | | | | | | | | | | | |
| Tactical Growth Fund | |
Exchange-Traded Funds | | | $ | 207,557,955 | | | | $ | — | | | | $ | — | | | | $ | 207,557,955 | |
| | | | | | | | | | | | | | | | | | | | |
Total | | | $ | 207,557,955 | | | | $ | — | | | | $ | — | | | | $ | 207,557,955 | |
| | | | | | | | | | | | | | | | | | | | |
(a) For detailed descriptions of sector, industry, or country, see the accompanying Schedule of Investments.
(b) The above Level 3 investment is valued using an unadjusted single source broker quote which is based on unobservable inputs. As a result, there were no unobservable inputs that have been internally developed by the Fund in determining the fair value of investments as of December 31, 2020. Due to the inherent uncertainty of determining the fair value of investments that do not have observable inputs, the fair value of the Fund’s investments may fluctuate from period to period.
The following is a reconciliation of Level 3 investments based on the inputs used to determine fair value:
| | | | | |
| Select Income Fund | | Common Stocks |
Balance as of December 31, 2019 | | | $ | 12,162,500 | |
Change in Unrealized Appreciation/Depreciation | | | | 483,000 | |
Purchases | | | | — | |
Sales Proceeds | | | | — | |
Realized Gain/(Loss) | | | | — | |
Transfer into or out of Level 3 | | | | (6,821,500 | )(a) |
| | | | | |
Balance as of December 31, 2020 | | | $ | 5,824,000 | |
| | | | | |
Net change in unrealized appreciation/(depreciation) included in the Statements of Operations attributable to Level 3 investments held at December 31, 2020 | | | $ | 574,000 | |
(a) As of December 31, 2020, NETSTREIT Corp. transferred out of Level 3 and into Level 1 due to the availability unadjusted quoted prices in an active market.
As of December 31, 2020, none of the Funds had transfers between the fair value levels designated in the preceding table and unobservable inputs (Level 3) used in determining fair value.
Notes to Financial Statements
December 31, 2020
4. INVESTMENT MANAGEMENT SERVICES
The Trust has entered into an investment management agreement with Salient Management, pursuant to which Salient Management provides investment management services to the Funds and is entitled to receive a fee calculated daily and payable monthly at the following annual rates, as of December 31, 2020, based on each Fund’s average daily net assets:
| | |
| Fund | | Advisory Fee |
Global Real Estate Fund | | 1.00%(a) |
| |
Select Income Fund | | 1.00%(b) |
| |
Tactical Growth Fund | | 1.15% up to and including $1 billion |
| | 1.05% over $1 billion |
(a) Salient Management is contractually obligated to waive 0.25% of the Fund’s management fee so that until April 30, 2021 the Fund’s management fee will be 0.75%. The waivers for the investment management fees totaled $71,303 and are reflected in the Statement of Operations.
(b) Salient Management is contractually obligated to waive 0.25% of the Fund’s management fee so that until April 30, 2021 the Fund’s management fee will be 0.75%. The waivers for the investment management fees totaled $876,911 and are reflected in the Statement of Operations.
The Trust and Salient Management have entered into an investment sub-advisory agreement with Broadmark Asset Management LLC for the Tactical Growth Fund (the “Sub-Advisor”). Pursuant to the agreement, the Sub-Advisor provides investment sub-advisory services to the Tactical Growth Fund and is entitled to receive a fee from Salient Management calculated daily and payable monthly at the following annual rate, as of December 31, 2020, based on the Tactical Growth Fund’s average daily net assets:
| | |
| Fund | | Sub-Advisory Fee |
Tactical Growth Fund | | 0.60% up to and including $1 billion |
| | 0.55% over $1 billion |
Expense Limitations: Salient Management has entered into an Expense Limitation Agreement with Global Real Estate Fund and Select Income Fund which limits the total expenses (exclusive of brokerage costs, interest, taxes, dividends, acquired fund fees and expenses, and extraordinary expenses) of certain classes of each Fund, through a specified date. In addition, Salient Management may voluntarily reimburse additional expenses of certain classes of each Fund. The following are the annual expense limitation rates and expiration dates for each Fund:
| | | | | | | | | | | | | | | | | | | | | | | | | |
| Fund | | Investor
Class | | Institutional
Class | | Class A | | Class C | | End Date |
Global Real Estate Fund | | | | 1.50 | % | | | | 1.15 | % | | | | 1.55 | % | | | | 2.10 | % | | | | April 30, 2021 | |
Select Income Fund | | | | 1.50 | % | | | | 1.15 | % | | | | 1.55 | % | | | | 2.10 | % | | | | April 30, 2021 | |
Pursuant to the Expense Limitation Agreement, the Funds will reimburse Salient Management for any fee waivers and expense reimbursements made by Salient Management, provided that any such reimbursements made by the Funds to Salient Management will not cause the Funds’ expense limitation to exceed the expense limitation in existence at the time the expenses were incurred or at the time of the reimbursement, which-ever is lower, and the reimbursement is made within three years following the year in which the expenses were incurred.
Notes to Financial Statements
December 31, 2020
For the year ended December 31, 2020, the fee waivers and/or reimbursements were as follows:
| | | | | | | | | | | | | | | |
| Fund | | Fees Waived/
Reimbursed
By Advisor | | Recoupment Of
Past Waived
Fees By Advisor | | Total |
| Global Real Estate Fund | | | | | | | | | | | | | | | |
Investor Class | | | $ | 6,585 | | | | $ | — | | | | $ | 6,585 | |
Institutional Class | | | | 39,671 | | | | | — | | | | | 39,671 | |
Class A | | | | 179,304 | | | | | — | | | | | 179,304 | |
Class C | | | | 26,018 | | | | | — | | | | | 26,018 | |
| Select Income Fund | | | | | | | | | | | | | | | |
Investor Class | | | | 27,732 | | | | | — | | | | | 27,732 | |
Institutional Class | | | | 479,389 | | | | | — | | | | | 479,389 | |
Class A | | | | 334,338 | | | | | — | | | | | 334,338 | |
Class C | | | | 97,491 | | | | | — | | | | | 97,491 | |
As of December 31, 2020, the balances of recoupable expenses for each Fund were waived in the following years:
| | | | | | | | | | | | | | | | | | | | |
| Fund | | 2018 | | 2019 | | 2020 | | Total |
| Global Real Estate Fund | | | | | | | | | | | | | | | | | | | | |
Investor Class | | | $ | 8,482 | | | | $ | 3,957 | | | | $ | 4,732 | | | | $ | 17,171 | |
Institutional Class | | | | 61,737 | | | | | 25,651 | | | | | 28,331 | | | | | 115,719 | |
Class A | | | | 128,050 | | | | | 75,609 | | | | | 128,558 | | | | | 332,217 | |
Class C | | | | 81,653 | | | | | 24,540 | | | | | 18,654 | | | | | 124,847 | |
| Select Income Fund | | | | | | | | | | | | | | | | | | | | |
Investor Class | | | | — | | | | | — | | | | | 2,663 | | | | | 2,663 | |
Institutional Class | | | | — | | | | | — | | | | | 30,121 | | | | | 30,121 | |
Class A | | | | — | | | | | — | | | | | 21,422 | | | | | 21,422 | |
Class C | | | | — | | | | | — | | | | | 7,833 | | | | | 7,833 | |
5. DISTRIBUTION AND SHAREHOLDER SERVICES PLANS
The Funds have adopted Distribution Plans (the “Distribution Plans”) pursuant to Rule 12b-1 of the 1940 Act that allow each of the Funds to pay for the sale and distribution of its shares at an annual rate of up to the following amounts based on each Fund’s daily average net assets:
| | | | | | | | | | | | | | | |
| Fund | | Investor Class | | Class A | | Class C |
Global Real Estate Fund | | | | 0.25 | % | | | | 0.25 | % | | | | 0.75 | % |
Select Income Fund | | | | 0.25 | % | | | | 0.25 | % | | | | 0.75 | % |
Tactical Growth Fund | | | | 0.25 | % | | | | 0.25 | % | | | | 0.75 | % |
The Funds have adopted a Shareholder Services Plan (the “Shareholder Services Plan”) with respect to certain Funds. Under the Shareholder Services Plan, a Fund is authorized to pay third party service providers for non-distribution related services to shareholders. Payments under the Shareholder Services Plan are calculated daily and paid monthly and are not to exceed the following annual rates (Shareholder services fees may be temporarily suspended by the Fund, in which case, the fees may not accrue to the full amounts payable.):
| | | | | | | | | | | | | | | | | | | | |
| Fund | | Investor
Class | | Institutional
Class | | Class A | | Class C |
Global Real Estate Fund | | | | 0.15 | % | | | | 0.05 | % | | | | 0.20 | % | | | | 0.25 | % |
Select Income Fund | | | | 0.15 | % | | | | 0.05 | % | | | | 0.20 | % | | | | 0.25 | % |
Tactical Growth Fund | | | | 0.15 | % | | | | 0.05 | % | | | | 0.20 | % | | | | 0.25 | % |
The expenses of the Distribution Plans and the Shareholder Services Plan are reflected as distribution and service fees in the Statement of Operations.
Notes to Financial Statements
December 31, 2020
6. SERVICE PROVIDERS
ALPS Fund Services, Inc. (“AFS”) serves as the Funds’ administrator, transfer agent and dividend paying agent. Citibank, N.A. serves as the Funds’ custodian.
Forward Securities, LLC, a wholly owned subsidiary of Salient Management, (the “Distributor”) serves as the Funds’ distributor. The Distributor acts as an agent for the Funds and the distributor of their shares.
7. TRUSTEE AND OFFICER FEES
Each Fund’s operations are managed under the direction and oversight of the Board of Trustees. The Board of Trustees appoints Officers of the Trust who are responsible for the Funds’ day-to-day business decisions based on policies set by the Board of Trustees. The Officers serve at the pleasure of the Board of Trustees.
The Funds do not pay any compensation directly to the Officers or Trustees who are also trustees, Officers or employees of Salient Management or its affiliates, except as noted below. As of December 31, 2020, there were six Trustees, five of whom are not “interested persons” of the Trust within the meaning of that term under the 1940 Act (each, an “Independent Trustee”). The Trustees of the Trust may also serve as Trustees of other registered investment companies managed by the Advisor and its affiliates, including Salient MF Trust and Salient Midstream & MLP Fund (together with the Trust, the “Trusts”). Each Fund within the Trusts pays Independent Trustees an allocated portion of the retainer of $50,000 per year. Each Fund within the Trusts pays Independent Trustees an allocated portion of the amounts of: $6,250 for attendance in person at a regular meeting and $1,500 for attendance by telephone at a regular meeting; $1,500 for attendance in person or by video conference at a special meeting that is not held in conjunction with
a regular meeting and $1,500 for attendance by telephone at a special meeting that is not held in conjunction with a regular meeting; and $1,500 per day for participation in Trust-related meetings not held in conjunction with a meeting. The Chairman of the Board of Trustees, the Chairman of the Audit Committee, the Chairman of the Nominating Committee, and the Chairman of the Compliance Committee receive a special retainer fee in the amount of $16,000, $6,000, $5,000, and $5,000, respectively per year. In addition, each member of the Audit Committee, Nominating Committee and Compliance Committee receives $1,000, respectively per year. In the interest of retaining Independent Trustees of the highest quality, the Board intends to periodically review such compensation and may modify it as the Board deems appropriate. The interested Trustees receive no compensation from the Funds. In addition, Independent Trustees receive reimbursements for reasonable out-of-pocket expenses incurred for their services as a Trustee, including for the transportation and other expenses that they incur in attending meetings.
The Chief Compliance Officer of the Funds (“CCO”) is an employee of, and is compensated by, the Advisor. As of January 1, 2020, the Funds have agreed to pay the Advisor approximately $176,000 per year as (i) an allocated portion of the compensation of an officer or employee of the Advisor to serve as CCO for the Funds (plus the cost of reasonable expenses related to the performance of the CCO’s duties, including travel expenses), and (ii) an allocation of the expenses of other officers or employees of the Advisor who serve in other compliance capacities for the Funds. The Board approves annually an allocation of such costs among such personnel, and each Fund bears its pro rata share of such expense. Other affiliated funds and registered investment companies managed by the Advisor pay additional compensation for the same purposes.
8. INDEMNIFICATIONS
Under the Trust’s organizational documents, its Officers and Trustees are indemnified against certain liability arising out of the performance of their duties with respect to the Funds. In addition, in the normal course of business, the Trust, on behalf of the Funds, enters into contracts with vendors and others that provide general indemnification. Each Fund’s maximum exposure under these arrangements is unknown, as this would involve future claims that may be made against the Trust and/or the Funds. Based on experience, however, the Funds expect the risk of loss to be remote.
Notes to Financial Statements
December 31, 2020
9. PURCHASES AND SALES OF INVESTMENTS
Investment transactions for the year ended December 31, 2020, excluding U.S. Government Obligations, short-term investments and short sales, if any, were as follows:
| | | | | | | | | | |
| Fund | | Cost of
Investments
Purchased | | Proceeds From
Investments
Sold |
Global Real Estate Fund | | | $ | 7,921,245 | | | | $ | 14,531,403 | |
Select Income Fund | | | | 181,293,830 | | | | | 262,564,096 | |
Tactical Growth Fund | | | | 983,279,822 | | | | | 1,033,847,577 | |
10. TAX BASIS INFORMATION
Reclassifications: At December 31, 2020, permanent differences in book and tax accounting were reclassified. These differences had no effect on net assets and were primarily attributed to differences in the treatment of expiration of capital loss carryovers, distributions in connection with Fund Share redemptions, and merger tax adjustments. These reclassifications were as follows:
| | | | | | | | | | |
| Fund | | Increase/ (Decrease) Paid-In-Capital | | Increase/(Decrease) Total Distributable Earnings |
Global Real Estate Fund | | | $ | (1 | ) | | | $ | 1 | |
Select Income Fund | | | | 513,094 | | | | | (513,094 | ) |
Tactical Growth Fund | | | | 1,223,470 | | | | | (1,223,470 | ) |
Tax Basis of Investments: Differences in book and tax accounting for cost basis of investments are primarily attributable to the deferral of losses on wash sales and mark-to-market adjustments for certain investments. The following information is provided on a tax basis as of December 31, 2020 and includes investments and excludes foreign currency:
| | | | | | | | | | | | | | | | | | | | |
| Fund | | Cost of
Investments | | Gross Unrealized Appreciation | | Gross
Unrealized
Depreciation | | Net Unrealized
Appreciation/
(Depreciation) |
Global Real Estate Fund | | | $ | 27,571,404 | | | | $ | 2,664,585 | | | | $ | (4,512,438 | ) | | | $ | (1,847,853 | ) |
Select Income Fund | | | | 271,916,130 | | | | | 51,975,610 | | | | | (18,630,997 | ) | | | | 33,344,613 | |
Tactical Growth Fund | | | | 177,494,635 | | | | | 30,063,320 | | | | | — | | | | | 30,063,320 | |
Capital Losses: Under the Regulated Investment Company Modernization Act of 2010 (the “Act”), capital losses incurred after December 31, 2010 may now be carried forward indefinitely, but must retain the character of the original loss. As of December 31, 2020, the following Funds had available for Federal income tax purposes unused capital losses that may be used to offset future realized capital gains as follows:
| | | | | | | | | | | | | | | |
| Fund | | Short-Term | | Long-Term | | Total |
Global Real Estate Fund | | | $ | 13,865,991 | (a) | | | $ | 7,349,237 | | | | $ | 21,215,228 | |
Select Income Fund | | | | — | | | | | 22,423,294 | | | | | 22,423,294 | |
(a) Subject to limitations under §382 of the Code.
Capital loss carryovers used during the year ended December 31, 2020 were:
| | | | | |
| Fund | | Amount |
Global Real Estate Fund | | | $ | 59,114 | |
Capital losses arising in the post-October period of the current fiscal year may be deferred to the next fiscal year if the fund elects to defer the recognition of these losses. When this election is made, any losses recognized during the period are treated as having occurred on the first day of the next
Notes to Financial Statements
December 31, 2020
fiscal year separate from and in addition to the application of normal capital loss carryovers as described above. The Funds elect to defer to the period ending December 31, 2021 capital losses and late year ordinary losses recognized during the period November 1, 2020 to December 31, 2020 in the amount of:
| | | | | | | | | | |
| Fund | | Capital
Losses
Total | | Ordinary
Losses
Total |
Global Real Estate Fund | | | $ | 609,961 | | | | $ | — | |
Select Income Fund | | | | 1,732,168 | | | | | — | |
Tax Basis of Distributable Earnings: At December 31, 2020 the following components of accumulated earnings on a tax basis were as follows:
| | | | | | | | | | | | | | | | | | | | |
| Fund | | Accumulated Capital Gains/(Losses) | | Undistributed
Ordinary
Income | | Net Unrealized Appreciation/ Depreciation | | Other
Cumulative Effect of
Timing Differences |
Global Real Estate Fund | | | $ | (21,825,189 | ) | | | $ | 125,587 | | | | $ | (1,847,853 | ) | | | $ | — | |
Select Income Fund | | | | (24,155,462 | ) | | | | — | | | | | 33,344,613 | | | | | — | |
Tactical Growth Fund | | | | — | | | | | 169,482 | | | | | 30,063,320 | | | | | — | |
Tax Character of Distributions to Shareholders: Income and long-term capital gain distributions are determined in accordance with Federal income tax regulations, which may differ from GAAP. The Funds may also designate a portion of the amounts paid to redeeming shareholders as a distribution for tax purposes.
The tax character of distributions paid for the year ended December 31, 2020 were as follows:
| | | | | | | | | | | | | | | |
| Fund | | Ordinary Income Total | | Long-Term
Capital Total | | Return of
Capital Total |
Global Real Estate Fund | | | $ | 425,328 | | | | $ | — | | | | | — | |
Select Income Fund | | | | 8,091,655 | | | | | — | | | | | 9,231,944 | |
Tactical Growth Fund | | | | 11,105,967 | | | | | — | | | | | — | |
The tax character of distributions paid for the year ended December 31, 2019 were as follows:
| | | | | | | | | | | | | | | |
| Fund | | Ordinary Income Total | | Long-Term
Capital Total | | Return of
Capital Total |
Global Real Estate Fund | | | $ | 829,862 | | | | $ | — | | | | $ | — | |
Select Income Fund | | | | 10,693,016 | | | | | — | | | | | 13,789,565 | |
Tactical Growth Fund* | | | | 9,982,211 | | | | | 6,325,202 | | | | | — | |
* By utilizing equalization, the distribution amounts above include $2,575,422 of earnings and profits distributed to shareholders on redemptions for the Tactical Growth Fund.
The Funds may own shares in certain foreign investment entities referred to under U.S. tax law, as “passive foreign investment companies” (PFICs). The Funds may elect to mark-to-market annually the shares of each PFIC and may be required to include in distributable income to shareholders any such mark-to market gains.
11. SCHEDULE OF INVESTMENTS
The investment categories used in this report may differ from the industry classification categories used for determining compliance with industry concentration restrictions and requirements applicable to each of the Funds.
Notes to Financial Statements
December 31, 2020
12. AFFILIATED COMPANIES
As defined by the 1940 Act, an affiliated company is one in which a Fund owns 5% or more of the outstanding voting securities or a company that is under common ownership or control. During the year ended December 31, 2020, Select Income Fund owned 5% or more of the outstanding voting securities of the securities identified in the table below.
| | | | | | | | | | | | | | | | | | | | | | | | | | | | | | | | | | | | | | | | |
| Security Name | | Beginning
Value at
12/31/19 | | Purchases | | Sales | | Ending
Value at 12/31/20 | | Shares Held
as of 12/31/20 | | Distributions
Received(a) | | Change in
Unrealized
Appreciation/
Depreciation | | Realized
Gain/
(Loss) |
Common Stocks | | | | | | | | | | | | | | | | | | | | | | | | | | | | | | | | | | | | | | | | |
Clipper Realty, Inc. | | | $ | 10,070,000 | | | | | — | | | | | — | | | | $ | 6,697,500 | | | | | 950,000 | | | | $ | 361,000 | | | | $ | (3,011,500 | ) | | | $ | — | |
| | | | | | | | | | | | | | | | | | | | | | | | | | | | | | | | | | | | | | | | |
| | | | | | | | | | | | | | | | | | | | | | | | 950,000 | | | | $ | 361,000 | | | | $ | (3,011,500 | ) | | | $ | — | |
| | | | | | | | | | | | | | | | | | | | | | | | | | | | | | | | | | | | | | | | |
(a) The amount of distributions received during the current year have been deemed return of capital.
13. PANDEMICS AND ASSOCIATED ECONOMIC DISRUPTION
An outbreak of respiratory disease caused by a novel coronavirus was first detected in China in late 2019 and subsequently spread internationally. This coronavirus has resulted in closing borders, enhanced health screenings, healthcare service preparation and delivery, quarantines, cancellations, disruptions to supply chains and customer activity, as well as general anxiety and economic uncertainty. It is not known how long any negative impacts, or any future impacts of other significant events such as a substantial economic downturn, will last. Health crises caused by outbreaks of disease, such as the coronavirus outbreak, may exacerbate other pre-existing political, social and economic risks. This outbreak, and other epidemics and pandemics that may arise in the future, could negatively affect the global economy, as well as the economies of individual countries, individual companies and the market in general in significant and unforeseen
ways. For example, a widespread health crisis such as a global pandemic could cause substantial market volatility, exchange trading suspensions and closures, impact the Funds ability to complete repurchase requests, and affect Fund performance. Any such impact could adversely affect the Funds performance, the performance of the securities in which the Funds invests, lines of credit available to the Funds and may lead to losses on your investment in the Funds. In addition, the increasing interconnectedness of markets around the world may result in many markets being affected by events or conditions in a single country or region or events affecting a single or small number of issuers.
14. SUBSEQUENT EVENTS
The Funds have evaluated the need for disclosures and/or adjustments resulting from subsequent events through the date the financial statements were issued. Based on this evaluation, no adjustments were required to the financial statements as of December 31, 2020.
Report of Independent Registered Public Accounting Firm
To the Shareholders and Board of Trustees Forward Funds:
Opinion on the Financial Statements
We have audited the accompanying statements of assets and liabilities of Salient Global Real Estate Fund, Salient Select Income Fund, and Salient Tactical Growth Fund (collectively, the Funds), including the schedules of investments, as of December 31, 2020, the related statements of operations for the year then ended, the statements of changes in net assets for each of the years in the two-year period then ended, and the related notes (collectively, the financial statements) and the financial highlights for each of the years in the five-year period then ended. In our opinion, the financial statements and financial highlights present fairly, in all material respects, the financial position of the Funds as of December 31, 2020, the results of their operations for the year then ended, the changes in their net assets for each of the years in the two-year period then ended, and the financial highlights for each of the years in the five-year period then ended, in conformity with U.S. generally accepted accounting principles.
Basis for Opinion
These financial statements and financial highlights are the responsibility of the Funds’ management. Our responsibility is to express an opinion on these financial statements and financial highlights based on our audits. We are a public accounting firm registered with the Public Company Accounting Oversight Board (United States) (PCAOB) and are required to be independent with respect to the Funds in accordance with the U.S. federal securities laws and the applicable rules and regulations of the Securities and Exchange Commission and the PCAOB.
We conducted our audits in accordance with the standards of the PCAOB. Those standards require that we plan and perform the audit to obtain reasonable assurance about whether the financial statements and financial highlights are free of material misstatement, whether due to error or fraud. Our audits included performing procedures to assess the risks of material misstatement of the financial statements and financial highlights, whether due to error or fraud, and performing procedures that respond to those risks. Such procedures included examining, on a test basis, evidence regarding the amounts and disclosures in the financial statements and financial highlights. Such procedures also included confirmation of securities owned as of December 31, 2020, by correspondence with custodians and brokers or by other appropriate audit procedures. Our audits also included evaluating the accounting principles used and significant estimates made by management, as well as evaluating the overall presentation of the financial statements and financial highlights. We believe that our audits provide a reasonable basis for our opinion.
/s/ KPMG LLP
We have served as the auditor of one or more Salient investment companies since 2003.
Columbus, Ohio
February 26, 2021
62
Tax Information (Unaudited)
December 31, 2020
Pursuant to Section 852(b)(3) of the Internal Revenue Code the following Funds designate the amounts listed below as long-term capital gain dividends:
| | | | | |
Select Income Fund | | | $ | 0 | |
Global Real Estate Fund | | | $ | 0 | |
Tactical Growth Fund | | | $ | 0 | |
The following Funds designate the percentages listed below of the income dividends distributed between January 1, 2020, and December 31, 2020, as qualified dividend income (QDI) as defined in Section 1(h)(11) of the Internal Revenue Code:
| | | | | |
Select Income Fund | | | | 20.67 | % |
Global Real Estate Fund | | | | 45.02 | % |
Tactical Growth Fund | | | | 13.13 | % |
The following Funds designate the percentages listed below of the income dividends distributed between January 1, 2020, and December 31, 2020, as qualifying for the corporate dividends received deduction (DRD) as defined in Section 854(b)(2) of the Internal Revenue Code:
| | | | | |
Select Income Fund | | | | 17.06 | % |
Global Real Estate Fund | | | | 0.00 | % |
Tactical Growth Fund | | | | 16.69 | % |
63
Supplemental Information (Unaudited)
December 31, 2020
MANAGEMENT OF THE FUNDS
Board of Trustees and Officers
Each Fund’s operations are managed under the direction and oversight of the Board of Trustees (the “Board”). The Board appoints officers of the Trust (“Salient FF Trust”) who are responsible for the Funds’ day-to-day business decisions based on policies set by the Board. The officers serve at the pleasure of the Board.
As of December 31, 2020, there were six Trustees, five of whom are not “interested persons” of the Trust within the meaning of that term under the 1940 Act (each, an “Independent Trustee”). The Trustees and officers of the Trust also may be directors or officers of some or all of the other registered investment companies, including the Salient MF Trust (together, with the Salient FF Trust, the “Trusts”), managed by Salient and its affiliates (hereafter, Salient and Forward Management, both jointly and individually, are referred to as the “Advisor”). Each Trustee holds office for an indefinite term until his/her successor is duly elected and qualified or until he/she dies, retires, resigns, is removed or becomes disqualified. The table below shows, for each Trustee and executive officer, his/her full name, and year of birth, the position held with the Trusts, the length of time served in that position, his/her principal occupation during the last five years, and other directorships held by such Trustee. The address of each Trustee and officer is c/o Salient MF Trust, 4265 San Felipe, 8th Floor, Houston, Texas 77027 or c/o Forward Funds, 244 California Street, Suite 200, San Francisco, California 94111. The Trusts’ Statement of Additional Information includes additional information about the Trustees and is available at www.salientpartners.com or upon request, without charge, by calling 800-999-6809.
Interested Trustees*
| | | | | | | | |
Name and
Year of Birth | | Position(s) Held | | Principal Occupation(s) During the Past 5 Years | | Number of
Portfolios in Fund
Complex
Overseen by
Trustee(1) | | Other
Directorships
During Past 5 Years** |
Gregory A. Reid* Year of Birth: 1965 | | Salient MF Trust Trustee and Principal Executive Officer (since 2020) Salient FF Trust Trustee and Principal Executive Officer (since 2020) | | President and Chief Executive Officer, Salient Midstream & MLP Fund (since inception); President, MLP Complex, Salient (since 2011). | | 6 | | Salient Midstream & MLP Fund (investment company) (2012-2018, and since 2020). |
Independent Trustees
| | | | | | | | |
Name and
Year of Birth | | Position(s)
Held | | Principal Occupation(s) During the Past 5 Years | | Number of
Portfolios in Fund
Complex
Overseen by
Trustee(1) | | Other
Directorships
During
Past 5 Years** |
Julie Allecta Year of Birth: 1946 | | Salient MF Trust Trustee (since 2015) Salient FF Trust Trustee (since 2012) | | Retired Partner, Paul Hastings, Janofsky & Walker LLP (1999-2009); Trustee, Litman Gregory Masters Funds Trust (since 2013); Member of Executive Committee and Governing Council, Independent Directors Council (since 2014); Director, WildCare Bay Area (2007-2017). | | 6 | | Litman Gregory Funds Trust (since 2013); Salient Midstream & MLP Fund (investment company) (since 2018). |
64
Supplemental Information, continued (Unaudited)
December 31, 2020
| | | | | | | | |
Name and
Year of Birth | | Position(s)
Held | | Principal Occupation(s) During the Past 5 Years | | Number of
Portfolios in Fund
Complex
Overseen by
Trustee(1) | | Other
Directorships
During
Past 5 Years** |
Jonathan P. Carroll Year of Birth: 1961 | | Salient MF Trust Trustee (since 2012) Salient FF Trust Trustee (since 2015) | | President, Lazarus Capital LLC (since 2006); President, Lazarus Energy Holdings, LLC (since 2006); President and CEO, Blue Dolphin Energy Company (since 2012); President and Director, Starlight Relativity Acquisition Company, LLC (since 2019); President and Director, The San Antonio Refinery LLC (since 2019); President and Director, Lazarus San Antonio Refinery LLC (since 2019); private investor (since 1988). | | 6 | | Salient Private Access Funds (investment companies) (four funds) (since 2004); Endowment PMF Funds (investment companies) (three funds) (since 2014); LRR Energy, L.P. (LRE) (energy company) (2014-2015); Blue Dolphin Energy Company (BDCO) (energy company) (since 2014); Starlight Relativity Acquisition Company, LLC (Investment Company) (since 2019); The San Antonio Refinery LLC (energy company) (since 2019); Lazarus San Antonio Refinery LLC (energy company) (since 2019); Salient Midstream & MLP Fund (investment company) (since 2012). |
| | | | |
A. John Gambs Year of Birth: 1945 | | Salient MF Trust Trustee (since 2015); Audit Committee Chairperson (since 2018) Salient FF Trust Trustee (since 2012); Audit Committee Chairperson (since 2018) | | Director and Compensation Committee Chair, NMI Holdings, Inc. (2011-2012); Trustee and Audit Committee Chair, Barclays Global Investors Funds (2006-2010); Trustee and Audit Committee Chair, Master Investment Portfolio (2006-2010); Advisory Board Member, Fairview Capital Management (since 2009); Director, San Francisco Classical Voice (2011-2016); Member, Board of Governors San Francisco Symphony (since 2001) and Vice President (2018-2020); Director, The New Century Chamber Orchestra (since 2010); Executive Vice President and Chief Financial Officer, The Charles Schwab Corporation (1988-1996); President and Director, Gambs Family Foundation (1997-2010). | | 6 | | Salient Midstream & MLP Fund (investment company) (since 2018). |
65
Supplemental Information, continued (Unaudited)
December 31, 2020
| | | | | | | | |
Name and
Year of Birth | | Position(s)
Held | | Principal Occupation(s) During the Past 5 Years | | Number of
Portfolios in Fund
Complex
Overseen by
Trustee(1) | | Other
Directorships
During
Past 5 Years** |
Dr. Bernard A. Harris, Jr. Year of Birth: 1956 | | Salient MF Trust Trustee (since 2012) Salient FF Trust Trustee (since 2015) | | Chief Executive Officer and Managing Partner, Vesalius Ventures, Inc. (venture investing) (since 2002); CEO, National Math and Science Initiative (non-profit) (since 2018); President and Founder, The Harris Foundation (non-profit) (since 1998); clinical scientist, flight surgeon and astronaut for NASA (1986-1996). | | 6 | | Salient Private Access Funds (investment companies) (four funds) (since 2009); Babson Funds (eleven funds) (since 2011); Monebo Technologies Inc. (since 2009); The National Math and Science Initiative (since 2008); Communities in Schools (since 2007); American Telemedicine Association (2007-2014); U.S. Physical Therapy, Inc. (since 2005); Houston Technology Center (2004-2016); The Harris Foundation, Inc. (since 1998); Salient Midstream & MLP Fund (investment company) (since 2012). |
| | | | |
Haig G. Mardikian Year of Birth: 1947 | | Salient MF Trust Trustee and Chairman of the Board (since 2015) Salient FF Trust Trustee (since 1998), Chairman of the Board (since 2005) | | Owner of Haig G. Mardikian Enterprises, a real estate investment business (since 1971); General Partner of M&B Development, a real estate investment business (since 1983); General Partner of George M. Mardikian Enterprises, a real estate investment business (1983-2002); President and Director of Adiuvana-Invest, Inc., a real estate investment business (since 1989); President of the William Saroyan Foundation (since 1992); Managing Director of the United Broadcasting Company, radio broadcasting (1983-2001); Trustee of the International House of UC Berkeley (2001-2007); Director of the Downtown Association of San Francisco (1982-2006); Director of the Market Street Association (1982-2006); Trustee of Trinity College (1998-2007); Trustee of the Herbert Hoover Presidential Library (since 1997); Trustee of the Herbert Hoover Foundation (since 2002); Trustee of the Advisor California Civil Liberties Public Education Fund (1997-2006); Director of The Walnut Management Co., a privately held family investment company (since 2008); President of the Foundation of City College (2006-2010); Director of Near East Foundation (since 2007). | | 6 | | Chairman and Director of SIFE Trust Fund (1978-2001); Salient Midstream & MLP Fund (investment company) (since 2018). |
| * | This person’s status as an “interested” Trustee arises from his affiliation with the Advisor. |
Supplemental Information, continued (Unaudited)
December 31, 2020
| ** | This column includes only directorships of companies required to report to the SEC under the Securities Exchange Act of 1934 (i.e., public companies) or other investment companies registered under the 1940 Act. |
| (1) | The Fund Complex for the purposes of this table consists of five (5) open-end funds in the Salient MF Trust and the Forward Funds (each, a “Trust”), with the series of each Trust being advised by either the Advisor or an affiliate of the Advisor; and one (1) public closed-end fund advised by either the Advisor or an affiliate of the Advisor. |
Officers of the Funds Who Are Not Trustees
| | | | |
| Name and Year of Birth | | Position(s) with the Trusts | | Principal Occupation(s) During Past 5 Years |
Thomas Dusenberry Year of Birth: 1977 | | Salient MF Trust Treasurer and Principal Financial Officer (since 2020) Salient FF Trust Treasurer and Principal Financial Officer (since 2020) | | Treasurer and Principal Financial Officer (since 2020), Assistant Treasurer (April 2019-December 2019), Salient MF Trust; Treasurer and Principal Financial Officer (since 2020), Assistant Treasurer (April 2019-December 2019), Salient Midstream and MLP Fund; Treasurer and Principal Financial Officer (since 2020), Assistant Treasurer (April 2019-December 2019), Forward Funds; Principal Financial Officer (since 2018) and Treasurer (since 2020), Salient Private Access Funds (four funds); Principal Financial Officer (since 2018) and Treasurer (since 2020), Endowment PMF Funds (three funds); Director of Fund Operations, Salient (2016-2019); Senior Vice President of Fund Accounting and Administration, Salient (since 2020); Vice President of Fund Accounting and Administration, Citi Fund Services Ohio, Inc. (2001-2016). |
| | |
Paul A. Bachtold Year of Birth: 1973 | | Salient MF Trust Chief Compliance Officer (since 2012) Salient FF Trust Chief Compliance Officer (since 2016) | | Chief Compliance Officer and Secretary, Forward Securities (since 2016); Chief Compliance Officer, Forward Funds (since 2016); Chief Compliance Officer, Forward Management, LLC (since 2015); Chief Compliance Officer, Salient Private Access Funds (since 2010); Chief Compliance Officer, Endowment PMF Funds (since 2014); Chief Compliance Officer, Salient (since 2010); Chief Compliance Officer, Salient Midstream & MLP Fund (since 2012); Chief Compliance Officer, Salient MF Trust (since 2012). |
| | |
Kristen Bayazitoglu Year of Birth: 1981 | | Salient MF Trust Secretary (Since 2018) Salient FF Trust Secretary (Since 2018) | | Secretary, Forward Funds (since 2018); Secretary, Salient MF Trust (since 2018); Secretary, Salient Midstream & MLP Fund (since 2018); Vice President, Forward Funds (2017-2018); Vice President, Salient MF Trust (2017-2018); Vice President, Salient Midstream & MLP Fund (2017-2018); Chief Operating Officer, Salient Partners, L.P. (since 2017); Vice President, Salient Private Access Funds (since 2017); Vice President, Endowment PMF Funds (since 2017); Vice President of Operations, Salient Partners, L.P. (March 2012–June 2017). |
67
Supplemental Information, continued (Unaudited)
December 31, 2020
N-PORT Filings
The Funds file its complete schedule of portfolio holdings with the SEC for the first and third quarters of each fiscal year as an exhibit to its reports on Form N-PORT. The Funds’ Form N-PORT reports are available on the SEC’s web site at http://www.sec.gov.
Forward-Looking Statements
This report contains “forward-looking statements” within the meaning of the 1933 Act and the Securities Exchange Act of 1934. By their nature, all forward-looking statements involve risks and uncertainties, and actual results could differ materially from those contemplated by the forward-looking statements. Several factors that could materially affect the Fund’s actual results are the performance of the portfolio of investments held by it, the conditions in the U.S. and international financial, petroleum and other markets, the price at which shares of the Fund will trade in the public markets and other factors discussed in filings with the SEC.
Proxy Voting Policies
Each Fund is required to file Form N-PX, with its complete proxy voting record for the twelve months ended June 30, no later than August 31 of each year. A description of the policies and procedures that the Funds use to determine how to vote proxies relating to portfolio securities and information regarding how the Funds voted proxies for the period ended June 30 each year is available (i) without charge, upon request by calling 1-866-667-9228 for the Salient MF Trust or 1-800-999-6809 for the Forward Funds Trust; and (ii) on the SEC’s website at http://www.sec.gov.
Statement of Additional Information
The Statement of Additional Information (“SAI”) includes additional information about the Fund’s Trustees and is available upon request without charge by calling 1-866-667-9228 for the Salient MF Trust or 1-800-999-6809 for the Forward Funds Trust or by visiting the SEC website at http://www.sec.gov.
68
Board Consideration of the Investment Management Agreement (Unaudited)
At a meeting of the Board held on October 27, 2020, the Board, including the Trustees who are not “interested persons” as that term is defined in the Investment Company Act of 1940, as amended (the “Independent Trustees”), considered and approved the continuation of the Investment Management Agreement between Forward Funds (the “Trust”), on behalf of its series Salient Global Real Estate Fund, Salient Select Income Fund, and Salient Tactical Growth Fund (each a “Fund,” and together, the “Funds”), and Forward Management, LLC d/b/a Salient (“Forward Management,” “Salient Management” or the “Advisor”) (the “Advisory Agreement”); the investment sub-advisory agreement among the Trust, Forward Management and Broadmark Asset Management, LLC (“Broadmark “ or the “Sub-Advisor”) (the “Sub-Advisory Agreement”).
In preparation for review of the Advisory Agreement and Sub-Advisory Agreement, the Board requested that the Advisor and the Sub-Advisor provide detailed information that the Board determined to be reasonably necessary to evaluate the Advisory Agreement and Sub-Advisory Agreement. The Independent Trustees held a meeting of the Board on October 2, 2020 (the “Pre-15(c) Meeting”) to review and discuss the response materials of the Advisor and Sub-Advisor in support of the consideration of the Advisory Agreement and Sub-Advisory Agreement. The Independent Trustees also met in executive session, without the presence of Advisor or Sub-Advisor personnel, prior to the October 27, 2020 meeting to review and discuss aspects of the response materials. At the request of the Independent Trustees, the Advisor made a presentation and responded to questions from the Independent Trustees at both the Pre-15(c) Meeting and the October 27, 2020 meeting. The Board, including the Independent Trustees, also took into consideration information furnished for the Board’s review and consideration throughout the year at regular Board meetings. The Independent Trustees were assisted at all times by independent counsel.
The Independent Trustees reported that they had previously met with counsel in executive session without the presence of Advisor personnel. The Independent Trustees reported that the Advisor’s presentations at the Pre-15(c) Meeting and the October 27, 2020 meeting, as well as the extensive discussions among themselves and with counsel including during the Pre-15(c) Meeting and executive session, regarding their review of the response materials, left them satisfied that the Advisor and Sub-Advisor had provided responses to the requests for information adequate to allow for an informed decision regarding renewal of the Advisory Agreement and Sub-Advisory Agreement. The Independent
Trustees reported their conclusion that the continuation of the Advisory Agreement and Sub-Advisory Agreement should enable the Funds to obtain high quality services at a cost that is appropriate, reasonable, and in the interests of investors. They stated that prudent exercise of judgment warranted the approval of the Advisory Agreement and Sub-Advisory Agreement. It also was noted that the Board’s decision to approve the continuation of the Advisory Agreement and Sub-Advisory Agreement was not based on any single factor, but rather was based on a comprehensive consideration of all the information provided to the Board. Upon consideration of these and other factors, the Board also determined:
The nature, extent and quality of the advisory services to be provided. With respect to the Advisory Agreement and Sub-Advisory Agreement, as applicable, the Board considered: the background and experience of key investment personnel and the Advisor’s and Sub-Advisor’s ability to retain them; the Advisor’s and Sub-Advisor’s focus on analysis of complex asset categories; the Advisor’s and Sub-Advisor’s disciplined investment approach and commitment to investment principles; the Advisor’s and Sub-Advisor’s significant investment in and commitment to personnel; the Advisor’s and Sub-Advisor’s significant compliance efforts and risk and general oversight; and the Advisor’s oversight of and interaction with service providers. The Board determined that the Advisor and Sub-Advisor had, when necessary, taken steps to address any underperformance. The Board concluded that the nature, extent and quality of the management and advisory service to be provided are appropriate and thus support a decision to approve the Advisory Agreement and Sub-Advisory Agreement.
The investment performance of the Funds. The Board evaluated the historical performance of the Funds, and comparative information provided regarding the Funds’ investment performance and information on the performance of other investment funds and various indices. The Board also considered the various performance reports received throughout the year, showing variability of returns over the course of the year. The Board noted that, as a general matter, the Funds had periods of both underperformance and outperformance. On the basis of the Board’s assessment, the Board concluded that the Advisor and Sub-Advisor were capable of generating a level of long-term investment performance that is consistent with shareholder expectations in light of the various Funds’ investment objectives, policies and strategies. Specifically, the Board noted that:
| | • | | the Global Real Estate Fund underperformed its index as of the calendar year-to-date through June 30, 2020 and for the |
69
Board Consideration of the Investment Management Agreement, continued (Unaudited)
| | | period since the Fund’s inception through June 30, 2020; and underperformed the median and the average performance of its peer group as of the calendar year-to-date through June 30, 2020, and for the period since the Fund’s inception through June 30, 2020; |
| | • | | the Select Income Fund underperformed its index as of the calendar year-to-date through June 30, 2020, but outperformed its index for the period since the Fund’s inception through June 30, 2020; and underperformed the median and average performance of its peer group as of the calendar year-to-date through June 30, 2020 and for the period since the Fund’s inception through June 30, 2020; and |
| | • | | the Tactical Growth Fund outperformed its index as of the calendar year-to-date through June 30, 2020 and for the period since the Fund’s inception through June 30, 2020; and outperformed the median and average performance of its peer group as of the calendar year-to-date through June 30, 2020, but underperformed the median and average performance of its peer group for the period since the Fund’s inception through June 30, 2020; |
The cost of advisory service to be provided and profits to be realized by the Advisor and Sub-Advisor. In analyzing the cost of services and profitability of the Advisor, the Board considered the revenues and expenses of the Advisor and each Fund’s size. The Board took into account the significant investment by and cost to the Advisor regarding investment management infrastructure to support the Funds and other support for investors. In addition, the Board recognized the subjective nature of determining profitability. Further, the Independent Trustees recognized the difficulties in making comparisons as the profitability of other advisers generally is not publicly available and the profitability information that is available for certain advisers or management firms may not be representative of the industry and may be affected by, among other things, the adviser’s particular business mix, capital costs, types of funds managed and expense allocations. On the basis of the Board’s review of the fees charged by the Advisor for investment advisory and related services (including to its other clients, if applicable), the specialized nature of the Funds’ investment programs, the Advisor’s financial information, and the costs associated with managing the Funds, the Board concluded that the level of investment management fees and the Advisor’s profitability are reasonable in light of the services
provided and the management fees and overall expense ratios of comparable funds and other clients of the Advisor.
With respect to the fees paid to the Sub-Advisor, the Board considered information regarding the sub-advisory fees charged by the Sub-Advisor to its other clients. The Board considered the operating results and financial condition of the Sub-Advisor based on the financial information the Sub-Advisor had provided. The Trustees noted that it was difficult to accurately determine or evaluate the profitability of the Sub-Advisory Agreement because the Sub-Advisor managed assets other than those of the Funds or has multiple business lines and, further, that any such assessment would involve assumptions regarding the Sub-Advisor’s allocation policies, capital structure, cost of capital, business mix, and other factors. Based on the prior information provided and the nature of the negotiation underlying the Sub-Advisory Agreement, the Board concluded that it was reasonable to infer that the Sub-Advisor’s profitability with respect to the relevant Funds was not excessive and that the sub-advisory fees received by the Sub-Advisor out of the management fee for each Fund were reasonable in light of the services provided to each Fund.
The extent to which economies of scale would be realized as the Funds grow and whether fee levels reflect these economies of scale. While noting that the management fees will not decrease as the level of the Funds’ assets increase, the Board noted the Advisor’s expense limitation agreements in place and that the Advisor and not the Funds pay the sub-advisory fees, and concluded that each Fund’s management fee and sub-advisory fee (as applicable) is reasonable under the current circumstances. The Board noted that it will have the opportunity to periodically re-examine whether the Funds have achieved economies of scale, as well as the appropriateness of management fees and sub-advisory fees payable to the Advisor and Sub-Advisor, respectively.
Benefits (such as soft dollars) to the Advisor and Sub-Advisor from their relationships with the Funds. The Board concluded that other benefits derived by the Advisor and Sub-Advisor from their relationship with the Funds, to the extent such benefits are identifiable or determinable, are reasonable and fair, result from the provision of appropriate services to the Funds and investors therein, and are consistent with industry practice and the best interests of the Funds and their shareholders. In this regard, the Board noted that it has received regular reports from Salient Management and the Sub-Advisor regarding their soft dollar policies and usage. The Board discussed the
70
Board Consideration of the Investment Management Agreement, continued (Unaudited)
potential for other fall-out benefits to the Advisor and Sub-Advisor, including reputational benefits and the potential for growth of the Advisor’s and Sub-Advisor’s separate account business or other business lines through association with the Funds, and concluded that such benefits are reasonable and typical of those potentially enjoyed by managers of publicly offered mutual funds.
Other considerations. The Board determined that the Advisor and Sub-Advisor have made a substantial commitment both to the recruitment and retention of high quality personnel, monitoring and investment decision-making and provision of service, as well as the financial, compliance and operational resources reasonably necessary to manage the
Funds in a professional manner that is consistent with the best interests of the Funds and their shareholders, and noted the significant financial, reputational, enterprise and litigation and regulatory risk undertaken by the Advisor and Sub-Advisor as managers of publicly offered mutual funds.
In light of the continuing COVID-19 pandemic, the meetings of the Board referred to above were held electronically by means of video, based on continuing relief provided by the staff of the Securities and Exchange Commission from the otherwise applicable in-person meeting requirements.
71
Privacy Policy (Unaudited)
Salient Funds appreciates the privacy concerns and expectations of our customers. We are committed to maintaining a high level of privacy and confidentiality when it comes to your personal information and we use that information only where permitted by law. We recognize that, as our customer, you not only entrust us with your money but with your personal information. Your trust is important to us and you can be sure we will continue our tradition of protecting your personal information. We provide this privacy notice to you so that you may understand our policy with regard to the collection and disclosure of nonpublic personal information (“Information”) pertaining to you.
We collect the following categories of information about you:
| | • | | Information we receive from you on applications or other forms; and |
| | • | | Information about your transactions with us, our affiliates, or others. |
We do not disclose any Information about you or any current or former customer to anyone, except as permitted by law. We may disclose Information about you and any former customer to our affiliates and to nonaffiliated third parties, as permitted by law. We do not disclose personal information that we collect about you to nonaffiliated companies except to enable them to provide marketing services on our behalf, to perform joint marketing agreements with other financial institutions, or in other limited circumstances permitted by law. For example, some instances where we may disclose Information about you to third parties include: for servicing and processing transactions, to protect against fraud, for institutional risk control, to respond to judicial process or to perform services on our behalf. When we share personal information about you with these companies, we require them to limit their use of the personal information to the particular purpose for which it was shared and we do not allow them to share your personal information with others except to fulfill that limited purpose. In addition, these companies are required to adhere to our privacy standards with respect to any personal information that we provide them.
Protecting the Security and Confidentiality of Your Information
We restrict access to Information about you to those persons who need to know that Information to provide products or services to you. We maintain physical, electronic, and procedural safeguards to ensure the confidentiality of your Information. Our privacy policies apply only to those individual investors who have a direct customer relationship with us. If you are an individual shareholder of record of any of the Funds, we consider you to be a customer of Salient Funds. Shareholders purchasing or owning shares of any of the Funds through their bank, broker, or other financial institution should consult that financial institution’s privacy policies. If you own shares or receive investment services through a relationship with a third-party broker, bank, investment advisor or other financial service provider, that third-party’s privacy policies will apply to you and ours will not.
How to Manage Your Information
You may contact us at any time to manage the information we have about you.
You may request from us information about the categories of information we have collected about you, the categories of sources from which your information was collected, the business or commercial purpose for collecting your information, the categories of third parties with whom we share your information, and the specific pieces of information we have about you. You may email us at privacy@salientpartners.com with “Request for Information” in the subject line and in the body of your message to request this information.
You may also request that we delete any information about you that we collected from you. You may email us at privacy@salientpartners.com with “Request to Delete Information” in the subject line and in the body of your message. There are circumstances where we may not be able to fulfil your request and we will let you know if one of those situations arises.
We reserve the right to verify your identity before we process any request relating to your information.
72
Investment Advisor
Forward Management, LLC
Investment Sub-Advisors
Broadmark Asset Management LLC
Administrator
ALPS Fund Services, Inc.
Custodian
Citibank, N.A.
Distributor
Forward Securities, LLC
Independent Registered Public Accounting Firm
KPMG LLP
Legal Counsel
K&L Gates LLP
Transfer Agent
ALPS Fund Services, Inc.

P.O. Box 1345
Denver, CO 80201
800-999-6809
www.salientfunds.com
Salient Global Real Estate Fund
Salient Select Income Fund
Salient Tactical Growth Fund
(b) Not applicable
(a) The registrant, as of the end of the period covered by the report, has adopted a code of ethics that applies to the registrant’s principal executive officer, principal financial officer, principal accounting officer or controller or any persons performing similar functions on behalf of the registrant. The registrant’s Code of Ethics for principal executive and principal financial officers is filed hereto under Item 13(a)(1) on this Form N-CSR.
(b) During the period covered by the report, with respect to the registrant’s code of ethics that applies to its principal executive officer, principal financial officer, principal accounting officer or controller, or persons performing similar functions; there have been no amendments to, nor any waivers granted from, a provision that relates to any element of the code of ethics definition enumerated in paragraph (b) of this Item 2.
| Item 3. | Audit Committee Financial Expert. |
(a)(1) The registrant’s board of directors has determined that the registrant has at least one audit committee financial expert serving on its audit committee.
(a)(2) The registrant’s audit committee financial expert is A. John Gambs. Mr. Gambs is “independent” for purposes of this Item 3 of Form N-CSR.
| Item 4. | Principal Accountant Fees and Services. |
Audit Fees
| | (a) | The aggregate fees billed in each of the last two fiscal years for professional services rendered by the principal accountant for the audit of the Funds’ annual financial statements or services that are normally provided by the accountant in connection with statutory and regulatory filings or engagements on behalf of the Funds were $106,500 for the fiscal year ended December 31, 2020 and $106,500 for the fiscal year ended December 31, 2019. |
Audit-Related Fees
| | (b) | The aggregate fees billed in each of the last two fiscal years for assurance and related services by the principal accountant that are reasonably related to the performance of the audit of the Funds’ financial statements and are not reported under paragraph (a) of this Item on behalf of the Funds were $4,700 for the fiscal year ended December 31, 2020 and $4,700 for the fiscal year ended December 31, 2019. These services consisted of review of the Funds’ registration statement. |
Tax Fees
| | (c) | The aggregate fees billed to the registrant for professional services rendered by the principal accountant for tax compliance, tax advice and tax planning on behalf of the Funds was $22,319 for the fiscal year ended December 31, 2020 and $30,692 for the fiscal year ended December 31, 2019. These services consisted of professional services related to tax compliance and tax planning, including review of federal and state income tax returns, reviews of excise tax distribution requirements and review of excise tax returns. |
All Other Fees
| | (d) | The aggregate fees billed in each of the last two fiscal years for products and services provided by the principal accountant on behalf of the Funds, other than the services reported in paragraphs (a) through (c) of this Item, were NONE for the fiscal year ended December 31, 2020 and NONE for the fiscal year ended December 31, 2019. |
| | (e)(1) | The registrant’s Audit Committee charter requires that the Audit Committee pre-approve all auditing services and non-audit services to be performed for the registrant by its Auditor. The registrant’s Audit Committee has established policies and procedures (“Procedures”) for pre-approval of all audit and permissible non-audit services provided by its independent accountant (“Auditor”). Under the Procedures, the Audit Committee must approve the engagement of the Auditor to certify the Funds’ financial statements for each fiscal year. In approving this engagement, the Audit Committee shall obtain, review and consider sufficient information concerning the Auditor to enable the Audit Committee to make a reasonable evaluation of the Auditor’s qualifications and independence. The Audit Committee shall also consider the Auditor’s proposed fees for the engagement, in light of the scope and nature of the audit services that the Funds will receive. The Audit Committee will report to the registrant’s Board of Trustees regarding its approval of the engagement and the proposed fees for the engagement, and the basis for such approval. |
Additionally, the Audit Committee may pre-approve certain types of non-audit services to the Funds and their service affiliates that are not a prohibited service, as described in the Procedures. The Audit Committee may set limits on fees and other conditions on such services, as it believes to be appropriate. On an annual basis, management of the Funds, in consultation with the Auditor, shall provide to the Audit Committee for its consideration: (i) a list of those types of non-audit services, if any, that the Funds may request from the Auditor during the fiscal year; and (ii) a list of those types of non-audit services directly impacting the Funds’ operations and financial reporting that service affiliates may request from the Auditor during the fiscal year. In addition, the Procedures permit the Audit Committee to pre-approve non-audit services to the Funds and to its service affiliates on a project-by-project basis.
| | (e)(2) | No services described in paragraphs (b) through (d) of this Item 4 were approved by the Registrant’s audit committee pursuant to paragraph (c)(7)(i)(C) of Rule 2-01 of Regulation S-X. |
| | (f) | The percentage of hours expended on the principal accountant’s engagement to audit the registrant’s financial statements for the most recent fiscal year that were attributed to work performed by persons other than the principal accountant’s full-time, permanent employees was zero percent (0%). |
| | (g) | The aggregate non-audit fees billed by the Funds’ accountant for services rendered to the registrant, and rendered to the Funds’ investment adviser (not including any sub-adviser whose role is primarily portfolio management and is subcontracted with or overseen by another investment adviser), and any entity controlling, controlled by, or under common control with the investment adviser that provides ongoing services to the registrant for each of the last two fiscal years on behalf of the Funds were NONE for the fiscal year ended December 31, 2020 and NONE for the fiscal year ended December 31, 2019. |
| | (h) | The registrant’s Audit Committee of the Board of Trustees has considered whether the provision of non-audit services that were rendered to the registrant’s investment adviser (not including any sub-adviser whose role is primarily portfolio management and is subcontracted with or overseen by another investment adviser), and any entity controlling, controlled by, or under common control with the investment adviser that provides ongoing services to the registrant that were not pre-approved pursuant to paragraph (c)(7)(ii) of Rule 2-01 of Regulation S-X is compatible with maintaining the principal accountant’s independence. |
| Item 5. | Audit Committee of Listed Registrants. |
Not applicable.
| | (a) | The registrant’s Schedules of Investments in securities of unaffiliated issuers as of the close of the reporting period are included as part of the Reports to Stockholders filed under Item 1 of Form N-CSR. |
| Item 7. | Disclosure of Proxy Voting Policies and Procedures for Closed-End Management Investment Companies. |
Not applicable.
| Item 8. | Portfolio Managers of Closed-End Management Investment Companies. |
Not applicable.
| Item 9. | Purchases of Equity Securities by Closed-End Management Investment Company and Affiliated Purchasers. |
Not applicable.
| Item 10. | Submission of Matters to a Vote of Security Holders. |
No material changes to the procedures by which the shareholders may recommend nominees to the registrant’s Board of Trustees have been implemented after the registrant’s last provided disclosure in response to the requirements of Item 407(c)(2)(iv) of Regulation S-K (17 CFR 229.407) (as required by Item 22(b)(15) of Schedule 14A (17 CFR 240.14a-101)), or this Item.
| Item 11. | Controls and Procedures. |
| | (a) | The registrant’s principal executive officer and principal financial officer have concluded, based on their evaluation of the registrant’s disclosure controls and procedures as conducted within 90 days of the filing date of this report, that these |
| | disclosure controls and procedures are adequately designed and are operating effectively to ensure that information required to be disclosed by the registrant on Form N-CSR is (i) accumulated and communicated to the investment company’s management, including its certifying officers, to allow timely decisions regarding required disclosure; and (ii) recorded, processed, summarized and reported within the time periods specified in the Securities and Exchange Commission’s rules and forms. |
| | (b) | There were no changes in the registrant’s internal control over financial reporting (as defined in Rule 30a-3(d) under the Act (17 CFR 270.30a-3(d)) that occurred during the period covered by this report that have materially affected, or are reasonably likely to materially affect, the registrant’s internal control over financial reporting. |
| Item 12. | Disclosure of Securities Lending Activities for Closed-End Management Investment Companies. |
Not applicable.
SIGNATURES
Pursuant to the requirements of the Securities Exchange Act of 1934 and the Investment Company Act of 1940, the registrant has duly caused this report to be signed on its behalf by the undersigned, thereunto duly authorized.
| | |
| Forward Funds |
| |
| By: | | /s/ Gregory A. Reid |
| | Gregory A. Reid |
| | Principal Executive Officer |
| |
| Date: | | March 5, 2021 |
Pursuant to the requirements of the Securities Exchange Act of 1934 and the Investment Company Act of 1940, this report has been signed below by the following persons on behalf of the registrant and in the capacities and on the dates indicated.
| | |
| By: | | /s/ Gregory A. Reid |
| | Gregory A. Reid |
| | Principal Executive Officer |
| |
| Date: | | March 5, 2021 |
| | |
| By: | | /s/ Thomas Dusenberry |
| | Thomas Dusenberry |
| | Principal Financial Officer |
| |
| Date: | | March 5, 2021 |