Exhibit 2
Management’s Responsibility for Financial Reporting
The accompanying consolidated financial statements have been prepared by management in accordance with Canadian generally accepted principles. Financial statements are not precise since they include certain amounts based on estimates and judgments. When alternative methods exist, management has chosen those it deems most appropriate in the circumstances in order to ensure that the consolidated financial statements are presented fairly, in all material respects, in accordance with generally accepted accounting principles. The financial information presented elsewhere in the annual report is consistent with that in the consolidated financial statements.
Falconbridge maintains adequate systems of internal accounting and administrative controls, consistent with reasonable cost. Such systems are designed to provide reasonable assurance that the financial information is relevant and reliable, and that Falconbridge’s assets are appropriately accounted for and adequately safeguarded.
The Board of Directors of the Company is responsible for ensuring that management fulfills its responsibilities for financial reporting, and is ultimately responsible for reviewing and approving the consolidated financial statements and the accompanying management’s discussion and analysis. The Board carries out this responsibility principally through its Audit Committee.
The Audit Committee is appointed by the Board, and all of its members are non-management directors. The Audit Committee meets periodically with management and the external auditors to discuss internal controls, auditing matters and financial reporting issues, and to satisfy itself that each party is properly discharging its responsibilities. The Audit Committee also reviews the consolidated financial statements, management’s discussion and analysis, the external auditors’ report, and examines the fees and expenses for audit services, and considers the engagement or reappointment of the external auditors. The Audit Committee reports its findings to the Board for its consideration when approving the consolidated financial statements for issuance to the shareholders. Ernst & Young, the external auditors, have full and free access to the Audit Committee.

| 
|
Derek Pannell | Steven Douglas |
President and Chief Executive Officer | Executive Vice-President and Chief Financial Officer |
| |
February 22, 2006 | |
64
Auditors’ Report
To the Shareholders of Falconbridge Limited
We have audited the consolidated balance sheets of Falconbridge Limited (formerly Noranda Inc.) as at December 31, 2005 and 2004 and the consolidated statements of income and retained earnings (deficit) and cash flows for the years then ended. These financial statements are the responsibility of the Company’s management. Our responsibility is to express an opinion on these financial statements based on our audits.
We conducted our audits in accordance with Canadian generally accepted auditing standards. Those standards require that we plan and perform an audit to obtain reasonable assurance whether the financial statements are free of material misstatement. An audit includes examining, on a test basis, evidence supporting the amounts and disclosures in the financial statements. An audit also includes assessing the accounting principles used and significant estimates made by management, as well as evaluating the overall financial statement presentation.
In our opinion, these consolidated financial statements present fairly, in all material respects, the financial position of the Company as at December 31, 2005 and 2004 and the results of its operations and its cash flows for the years then ended in accordance with Canadian generally accepted accounting principles.

Chartered Accountants
Toronto, Canada
February 7, 2006
(except as to Note 23 which is as of March 16, 2006)
65
Consolidated Balance Sheets
Falconbridge Limited (Incorporated under the laws of Ontario) (formerly Noranda Inc.)
(US$ millions) | | | | | | | |
As at December 31 | | Notes | | 2005 | | 2004 | |
| | | | | | Restated – Note 2 | |
ASSETS | | | | | | | |
Current assets | | | | | | | |
Cash and cash equivalents | | | | $ | 886 | | $ | 884 | |
Accounts receivable | | 19 | | 1,007 | | 948 | |
Metals and other inventories | | | | 1,708 | | 1,436 | |
| | | | 3,601 | | 3,268 | |
Operating capital assets | | 7 | | 6,803 | | 4,870 | |
Development projects | | 8 | | 1,707 | | 1,166 | |
Investments and other assets | | 9 | | 307 | | 324 | |
| | | | $ | 12,418 | | $ | 9,628 | |
| | | | | | | |
LIABILITIES AND SHAREHOLDERS’ EQUITY | | | | | | | |
Current liabilities | | | | | | | |
Accounts and taxes payable | | 16 and 19 | | $ | 1,691 | | $ | 1,265 | |
Debt due within one year | | 10 | | 353 | | 570 | |
| | | | 2,044 | | 1,835 | |
Long-term debt | | 10, 11 and 12 | | 3,474 | | 2,858 | |
Future income taxes | | 16 | | 1,156 | | 304 | |
Asset retirement obligation, pension and other provisions | | 13 | | 659 | | 595 | |
| | | | | | | |
Stockholders’ interests | | | | | | | |
Interests of other shareholders | | 14 | | 54 | | 1,197 | |
Shareholders’ equity | | 11 and 15 | | 5,031 | | 2,839 | |
| | | | $ | 12,418 | | $ | 9,628 | |
Commitments and contingencies (notes 17 and 18)
(See accompanying notes)
On behalf of the Board:

| 
|
Derek Pannell, Director | André Bérard, Director |
66
Consolidated Statements of Income and Retained Earnings (Deficit)
Falconbridge Limited (Incorporated under the laws of Ontario) (formerly Noranda Inc.)
(US$ millions, except per share amounts) | | | | | | | |
Years ended December 31 | | Notes | | 2005 | | 2004 | |
| | | | | | Restated – Note 2 | |
Revenues | | | | $ | 8,148 | | $ | 6,764 | |
Operating expenses | | | | | | | |
Mining, processing and refining costs | | | | 2,538 | | 1,976 | |
Purchased raw materials | | | | 3,235 | | 2,904 | |
Depreciation, amortization and accretion | | | | 555 | | 493 | |
| | | | 6,328 | | 5,373 | |
Income generated by operating assets | | | | 1,820 | | 1,391 | |
| | | | | | | |
Interest expense, net | | 10 | | 152 | | 120 | |
Corporate and general administration | | | | 80 | | 66 | |
Research, development and exploration | | | | 59 | | 47 | |
Minority interest in earnings of subsidiaries | | | | 155 | | 297 | |
Income before undernoted | | | | 1,374 | | 861 | |
Gain, net of restructuring costs and other | | 4 | | (17 | ) | (84 | ) |
Tax expense | | 16 | | 511 | | 351 | |
Net income from continuing operations | | | | $ | 880 | | $ | 594 | |
Loss on discontinued operations, net of tax | | 5 | | 8 | | 73 | |
Net income | | | | $ | 872 | | $ | 521 | |
Dividends on preferred shares | | | | 17 | | 13 | |
Net income attributable to common shares – basic | | | | 855 | | 508 | |
Net income per common share – basic | | | | | | | |
Continuing operations | | | | $ | 2.54 | | $ | 1.96 | |
Discontinued operations | | | | (0.02 | ) | (0.25 | ) |
Net income per common share – basic | | | | $ | 2.52 | | $ | 1.71 | |
Net income per common share – diluted | | | | | | | |
Continuing operations | | | | $ | 2.52 | | $ | 1.94 | |
Discontinued operations | | | | (0.02 | ) | (0.24 | ) |
Net income per common share – diluted | | | | $ | 2.50 | | $ | 1.70 | |
Basic weighted average number of shares | | | | 339,756,276 | | 296,245,753 | |
Diluted weighted average number of shares | | | | 346,173,501 | | 303,458,182 | |
| | | | | | | |
Retained earnings (deficit) | | | | | | | |
Balance, as previously reported | | | | $ | 288 | | $ | (130 | ) |
Change in accounting policy | | 2 | | (57 | ) | (38 | ) |
Balance, after accounting policy change | | | | 231 | | (168 | ) |
Income | | | | 872 | | 521 | |
Dividends | | | | | | | |
Common | | | | (133 | ) | (110 | ) |
Preferred | | | | (17 | ) | (12 | ) |
Cost of shares repurchased in excess of their stated value | | 12 | | (799 | ) | — | |
Balance, end of year | | 15 | | $ | 154 | | $ | 231 | |
(See accompanying notes)
67
Consolidated Statements of Cash Flows
Falconbridge Limited (Incorporated under the laws of Ontario) (formerly Noranda Inc.)
(US$ millions) | | | | | | | |
Years ended December 31 | | Notes | | 2005 | | 2004 | |
| | | | | | Restated – Note 2 | |
Cash realized from (used for): | | | | | | | |
Operations | | | | | | | |
Net income | | | | $ | 872 | | $ | 521 | |
Charges (credits) not affecting cash: | | | | | | | |
Depreciation and amortization | | | | 548 | | 484 | |
Future taxes | | | | 141 | | 212 | |
Minority interest | | | | 155 | | 297 | |
Foreign exchange, restructuring and other | | | | (66 | ) | (53 | ) |
| | | | 1,650 | | 1,461 | |
| | | | | | | |
Net change in accounts receivable, inventories and payables | | | | (15 | ) | (277 | ) |
Cash from operations | | | | 1,635 | | 1,184 | |
Investment activities | | | | | | | |
Capital investments | | | | (737 | ) | (666 | ) |
Investments and advances | | | | (27 | ) | 105 | |
Proceeds on dispositions | | 4 and 5 | | 93 | | 6 | |
Cash used in investment activities | | | | (671 | ) | (555 | ) |
Financing activities | | | | | | | |
Long-term debt, including current portion | | | | | | | |
Issued | | | | 551 | | 344 | |
Repaid | | | | (1,394 | ) | (470 | ) |
Issue of shares – common | | 15 | | 49 | | 23 | |
Loan repayment under share purchase plan | | 15 | | 3 | | — | |
Dividends paid | | | | (150 | ) | (122 | ) |
Issue of shares – minority shareholders, net | | | | 18 | | 15 | |
Dividends paid to minority shareholders | | | | (39 | ) | (36 | ) |
| | | | (962 | ) | (246 | ) |
Increase in cash and cash equivalents | | | | 2 | | 383 | |
Cash and cash equivalents, beginning of year | | | | 884 | | 501 | |
Cash and cash equivalents, end of year | | | | $ | 886 | | $ | 884 | |
(See accompanying notes)
68
Notes to Consolidated Financial Statements
December 31, 2005 (US$ millions except as otherwise indicated)
1. ACCOUNTING POLICIES
BASIS OF PRESENTATION OF THE CONSOLIDATED FINANCIAL STATEMENTS
The accompanying consolidated financial statements have been prepared in accordance with Canadian generally accepted accounting principles (“Canadian GAAP”) which are in conformity, in all material respects, with United States generally accepted accounting principles (“U.S. GAAP”), except as described in Note 22. The consolidated financial statements include the accounts of Falconbridge Limited (formerly Noranda Inc.) and all of its subsidiaries and joint ventures (together, “Falconbridge” or “the Company”). Long-term investments in companies in which Falconbridge has significant influence are accounted for on the basis of cost plus equity in undistributed earnings since the dates of investment. The interests of the Company and Novicourt Inc. (“Novicourt”) in their joint ventures are proportionately consolidated.
REPORTING CURRENCY AND TRANSLATION OF FOREIGN CURRENCIES
The United States dollar (“U.S. dollar”) is adopted as the functional currency of Falconbridge’s non-U.S. wholly-owned operations which reflects significant operational exposure to the U.S. dollar and predominantly the U.S. dollar-based asset and investment base of the Company.
The assets and liabilities of Falconbridge’s self-sustaining operations having a functional currency other than the U.S. dollar are translated into U.S. dollars using the exchange rate in effect at the period end and revenues and expenses are translated at the average rate during the period. Cumulative exchange gains and losses on translation of the Company’s net equity investment in these operations are deferred as a separate component of shareholders’ equity. Gains or losses on foreign currency loans and transactions that are designated as hedges of a net investment in self-sustaining foreign operations are reported in shareholders’ equity in the same manner as translation adjustments.
Foreign currency balances and the financial statements of integrated foreign operations are translated into U.S. dollars using the temporal method. Under the temporal method, foreign-denominated monetary assets and liabilities are translated at the exchange rates prevailing at the year end, and revenue and expenses (other than depreciation and amortization) at average rates of exchange during the year. Non-monetary assets and liabilities are translated at historical exchange rates and depreciation and amortization are translated at the same exchange rates as the assets to which they relate. Exchange gains and losses arising on the translation of the accounts are included in the consolidated statement of income.
CASH AND CASH EQUIVALENTS
Cash and cash equivalents include cash on account, demand deposits and short-term investments with original maturities of three months or less and are stated at cost, which approximates market value. Cash and cash equivalents of $886 (2004 – $884) include $34 of restricted cash (2004 – $35) as reserves related to the senior debt of Compañía Minera Antamina S.A. (“Antamina”).
VALUATION OF INVENTORIES
Mining and metallurgical product inventories are valued at the lower of net realizable value and average cost where costs are comprised of direct costs and an allocation of production overheads and depreciation of production-related assets. Nickel, aluminum and fabricated product inventories are valued at the lower of cost (determined on a first-in, first-out basis, comprised of direct costs and an allocation of production overheads and depreciation of production-related assets) and net realizable value. Inventories of operating supplies and raw materials are valued at the lower of average direct acquisition cost and replacement value.
69
REVENUE RECOGNITION
Revenues from the sale of base metals, aluminum and fabricated products and from by-product materials are recorded at the time of sale, when the rights and obligations of ownership pass to the buyer.
Under the terms of concentrate sales contracts with third parties, final prices for metals in the concentrate are set based on the prevailing spot metal prices on a specified future date based on the date that the concentrate is delivered. The Company records revenues under these contracts based on the forward prices at the time of the sale and the revenues are adjusted at each subsequent balance sheet date to the then current forward prices. Price changes for shipments which at year end are awaiting final pricing could have a material effect on future revenues. As at December 31, 2005, there was $403 in revenues that was awaiting final pricing.
FINANCIAL INSTRUMENTS AND HEDGING ACTIVITIES
Falconbridge enters into interest rate swap agreements to alter the interest characteristics of a portion of its outstanding debt from a fixed to a floating-rate basis. These agreements involve the receipt of fixed-rate amounts in exchange for floating-rate interest payments over the life of the agreement without an exchange of the underlying principal amount. Falconbridge also enters into interest rate swap agreements that involve the payment of fixed-rate amounts in exchange for the receipt of floating-rate interest over the life of the agreement. The differential paid or received on the interest rate swap agreements that qualify for hedge accounting is reflected as an addition to a reduction from interest on the statements of earnings. For those contracts that do not qualify for hedge accounting, or for those which Falconbridge does not seek hedge accounting, the net interest received/paid on those positions is shown as a component of gain, net of restructuring costs and other, together with the change in fair value of those contracts during the period.
Falconbridge uses forward foreign exchange and option contracts to hedge the effect of exchange rate changes on identifiable foreign currency exposures and futures, and forward and option contracts to hedge the effect of price changes on a portion of the commodities it sells. Gains and losses on these contracts are reported as a component of the related transactions. Gains and losses on early termination of hedging contracts are deferred until the hedged items are recognized in earnings. From time to time, Falconbridge enters into futures and forward contracts for the purchase or sale of commodities and currencies not related to production, or not designated as hedges. These contracts are carried at estimated fair values and gains or losses arising from the changes in the market values of these contracts are recognized in the earnings of the period in which the changes occur.
Falconbridge also uses cross-currency swap agreements which are used to hedge the interest rate risk and foreign currency exposures related to its non-U.S. dollar-denominated debt. Gains or losses on these contracts are accounted for in the same manner as the interest rate swap agreements and forward exchange contracts discussed above.
Financial instruments designated as hedges are tested for effectiveness on a quarterly basis. Gains and losses on those contracts that are proven to be effective are reported as a component of the related transaction. Falconbridge uses the critical terms method and regression analysis to assess the hedge effectiveness of interest rate swaps, and uses match-terms and the dollar-offset approach to assess the hedge effectiveness of its foreign exchange contracts.
Falconbridge formally documents all relationships between hedging instruments and hedged items, as well as its risk management objective and strategy for undertaking various hedge transactions. This process includes linking all derivatives to specific firm commitments or forecasted transactions.
Falconbridge does not consider the credit risk associated with its financial instruments to be significant. Interest rate swaps, foreign currency contracts and commodity hedge contracts are maintained with high-quality counterparties, and Falconbridge does not anticipate that anycounterparty will fail to meet its obligations.
DEPRECIATION AND AMORTIZATION
Depreciation of property, plant and equipment is based on the estimated service lives of the assets (4 to 40 years), calculated primarily on a straight-line basis for metallurgical operations and on a unit-of-production basis for mining operations. Resources properties are depleted and pre-production and mine development expenditures are amortized over a unit-of-production method. Depreciation and amortization under the unit-of-production method is measured as the net book
70
value of the related asset multiplied by the ratio of tonnes milled during the period over proven and probable reserves at start of the period. Construction in progress will be depreciated once the project is substantially completed.
ASSET RETIREMENT OBLIGATIONS
Asset retirement obligations are recognized when incurred and recorded as liabilities at fair value. The amount of the liability is subject to re-measurement at each reporting period. The liability is accreted over time through periodic charges to earnings. In addition, the asset retirement cost is capitalized as part of the asset’s carrying value and amortized over the estimated life of the mine. The key assumptions on which the fair value of the asset retirement obligations is based includes the estimated future cash flows, the timing of those cash flows and the credit-adjusted risk-free rate or rates on which the estimated cash flows have been discounted.
The asset retirement obligation and closure costs may change materially based on future changes in operations, costs of reclamation and closure activities, regulatory requirements and the outcome of legal proceedings.
PRE-PRODUCTION COSTS
Pre-production costs related to major projects are deferred until the facilities achieve commercial production or are deemed to be uneconomic. These deferred costs are amortized on a unit-of-production method over the estimated useful life of the project or are written off when the project is determined to be uneconomic.
ASSET VALUATION
The Company assesses long-lived assets, such as operating capital assets, for recoverability whenever indicators of impairment exist. When the carrying value of a long-lived asset is greater than its net recoverable value as determined on an undiscounted basis, an impairment loss is recognized to the extent that its fair value, measured as the discounted cash flows over the life of the asset when quoted market prices are not readily available, is below the asset’s carrying value.
EXPLORATION
Mining exploration expenditures are charged against current earnings unless they relate to properties that have been subjected to sufficient pre-feasibility work that indicates future mine production is reasonably certain. Gains on the sale of mining exploration properties or recoveries of costs previously written off are credited against exploration expense.
INCOME AND PRODUCTION TAXES
Current taxes are recognized for the estimated income and mining taxes payable for the current year.
Future tax assets and liabilities are recognized for temporary differences between the tax and accounting bases of assets and liabilities as well as for the benefit of losses available to be carried forward to future years for tax purposes that are more likely than not to be realized. Future taxes are measured using the tax rates and laws that will be in effect when the differences are expected to reverse or the losses to be realized.
INTEREST
Interest incurred is charged to earnings, except for interest that can be identified with a major capital expenditure program. Under the policy, interest is capitalized as it arises from indebtedness incurred to finance major projects, either directly or indirectly, until the project achieves commercial production.
EMPLOYEE FUTURE BENEFIT PLANS
The cost of retirement benefits and certain post-employment benefits are recognized as the benefits are earned by the employees. Falconbridge uses the accrued benefit method pro-rated on length of service and management’s best estimate assumptions to value its pensions and other retirement benefits. Assets are valued at fair value for the purpose of calculating the expected return on plan assets. Past service costs from plan amendments are amortized on a straight-line basis over the term of the collective agreements being ratified. The excess of the net actuarial gain
71
(loss) over 10% of the greater of the benefit obligation and the fair value of plan assets is amortized over the expected average remaining service life of active employees.
Under its defined contribution retirement savings program, Falconbridge makes payments based on employee earnings and partially matches employee contributions, to a defined maximum.Employees may receive profit sharing credits based on earnings.
When a defined benefit plan gives rise to an accrued benefit asset, Falconbridge recognizes a valuation allowance for the excess of the adjusted benefit asset over the expected future benefit to be realized from the plan asset. Changes in the allowance are included in the determination of pension expense.
STOCK-BASED COMPENSATION PLANS
The Company has stock-based compensation plans. The Company accounts for stock options using the fair value method. Under this method, compensation expense for stock options granted since January 1, 2002 is measured at fair value at the grant date using the Black-Scholes valuation model and recognized over the vesting period of the options granted.
The Company also has an employee share savings plan through which employees can purchase shares of the Company at market prices. For each dollar employees contribute to the plan, the Company contributes a prescribed percentage, which is expensed as employee compensation. For the Company’s deferred unit plans, a liability is recorded to the extent that the Company’s common share price exceeds the notional purchase price of the units. Notional dividends on the units arerecorded as a direct charge to retained earnings.
EARNINGS PER SHARE
Earnings per share is determined by dividing net earnings, after deducting preferred share dividends by the weighted average number of common shares outstanding during the year, excluding shares securing employee share purchase loans.
Diluted earnings per share assumes that outstanding dilutive stock options are exercised at the beginning of the period (or at the time of issuance, if later) and the proceeds are used to purchase common stock at the average market price during the period, and that dilutive convertible debentures are converted into common shares at the beginning of the period.
USE OF ESTIMATES
The preparation of financial statements in conformity with generally accepted accounting principles requires management to make estimates and assumptions. These estimates affect the reported amounts of assets and liabilities and the disclosure of contingent assets and liabilities at the date of the financial statements and the reported amounts of revenues and expenses during the reported period. Actual results could differ from those estimates.
COMPARATIVE CONSOLIDATED FINANCIAL STATEMENTS
The comparative consolidated financial statements have been reclassified from statements previously presented to conform to the presentation of the 2005 consolidated financial statements.
2. CHANGES IN ACCOUNTING POLICIES
(a) Convertible Debentures
The principal amount of Falconbridge’s outstanding convertible debentures of Cdn$131 million (Note 11) due on April 30, 2007 was previously classified as an equity instrument due to the Company’s ability to settle principal payment by issuance of its shares. In accordance with the amended standard under CICA 3860 – Financial Instruments – Presentation and Disclosure, the convertible debenture is a compound financial instrument that contains both a liability element and an equity element and therefore should be bifurcated into separate liability and equity elements. Falconbridge’s obligation to make scheduled interest payments in cash and Falconbridge’s option to redeem the debentures in a variable number of common shares of the Company constitutes a financial liability. The holder’s option to convert the liability into equity of the Company is an equity instrument.
72
The carrying value of the liability element which represents the present value of the Company’s obligations to make future interest payments in cash and to settle the redemption value of the debentures in a variable number of shares is presented as a long-term debt on the consolidated balance sheet. The stated interest payments and accretion expense from adjusting the time value of the principal of the debentures over time using the effective interest method of amortization are recorded as interest expense on the consolidated statement of earnings. The equity component represents the fair value of the holder’s conversion option established at the issuance of the debentures and is presented as a component of shareholders’ equity. Upon conversion, when the Company settles the obligations in the common shares of the Company, the carrying amount of the equity element and the carrying amount of the liability are transferred to share capital.
The cumulative impact of the adoption of the standard on January 1, 2004 was to decrease retained earnings by $33, increase the liability component of convertible debentures by $82, decrease equity by $41 and decrease the cumulative translation adjustment by $8. The adoption of this standard resulted in a decrease by $14 to the previously reported earnings for the year ended December 31, 2004 and a decrease by $44 to the previously reported retained earning as at December 31, 2004. Further disclosure regarding the convertible debentures is presented in Note 11.
(b) Preferred Shares Series H
The Company has Cdn$150 million (Note 12) of Cumulative Preferred Shares, Series H, which provide the holders with an entitlement to convert the shares to the Company’s common shares after a specified date and were previously reported as equity instruments in accordance with their legal form. The new accounting recommendations under CICA 3860, on presentation of financial instruments, provide that the preferred shares are reclassified as liabilities because their conversion feature represents a fixed obligation to the Company. The dividends paid are reported as interest expense in the consolidated statement of earnings.
The cumulative impact of the adoption of the standard on January 1, 2004 was to decrease retained earnings by $5, increase liabilities by $113, decrease equity by $99 and decrease cumulative translation adjustment by $9. Adoption of the new standard reduced previously reported earnings by $16 for the year ended December 31, 2004 and resulted in a decrease by $13 to the previously reported retained earnings as at December 31, 2004. Further disclosure regarding the liabilities for the Preferred Shares, Series H, is presented in Note 12.
(c) Variable Interest Entities (“VIEs”)
As of January 1, 2005, the Company adopted the recommendations of AcG-15 requiring Falconbridge to identify variable interest entities, in which it has significant variable interest, to determine whether Falconbridge is the primary beneficiary of such entities and, if so, consolidate them. VIEs include entities where the equity invested is considered insufficient to finance the entity’s activities without additional subordinated financial support from other parties. The recommendations require the Company to consolidate VIEs if the investment it holds in these entities and/or the relationship it has with them result in it being exposed to a majority of their expected losses, being able to benefit from a majority of their expected residual returns, or both.
The adoption of the recommendations resulted in the Company consolidating a customer securitization vehicle, which was operated as a trust and purchased trade accounts receivable from the Company. The application of the recommendations had no impact on the Company’s financial statements on January 1, 2004. The cumulative impact of the consolidation of the vehicle on January 1, 2005 was to increase current assets by $17 and increase current liabilities by $17 with no impact on opening retained earnings. In 2005, the receivable purchase agreement between the Company and the trust was terminated and the trust is no longer a VIE of the Company.
3. BUSINESS COMBINATION
On June 30, 2005, the Company completed the two-step acquisition of 41.5% of all the issued and outstanding common shares of the former Falconbridge that it did not previously own, pursuant to the offer to purchase dated March 9, 2005. The acquisition was completed by way of an amalgamation (the “Amalgamation”) of Noranda Inc. and the former Falconbridge Limited (the “former Falconbridge”) and the newly amalgamated company continued under the name Falconbridge Limited. The acquisition was done on a share-exchange basis with one common share
73
of the former Falconbridge exchanged for 1.77 common shares of the Company. The former Falconbridge was a producer of nickel, copper, cobalt and platinum with mining and metallurgical operations mainly in Canada and South America.
The first step of the acquisition was completed on May 5, 2005 when the Company successfully acquired 32.3% of all the issued and outstanding common shares of the former Falconbridge, increasing its ownership to 90.8% of the outstanding former Falconbridge common shares. On June 30, 2005, the Company completed the second step of the acquisition of the remaining 9.2% of the former Falconbridge common shares and assumed 100% of the preferred share and stock option obligations of the former Falconbridge. The results of operations of the former Falconbridge from January 1, 2005 to May 4, 2005 have been included in the Company’s consolidated statement of earnings at 58.5% and from May 5, 2005 to June 30, 2005 at 90.8%. Beginning July 1, 2005, 100% of the results from operations have been included in the Company’s consolidated statement of earnings.
The acquisition has been accounted for using the purchase method, whereby the purchase consideration was allocated to the estimated fair values of the assets acquired and liabilities assumed on the date of acquisition. The Company has not yet finalized the allocation of the purchase price related to this acquisition and it will be refined as information relating to the valuation of operating capital assets and development projects is finalized. The preliminary fair values of the assets and liabilities of the former Falconbridge and the preliminary allocation of the purchase consideration are as follows:
(US$ millions, except share price and number of shares) | | 2005 | |
Calculation of preliminary allocation of purchase price | | | |
Common shares of the Company issued to the former Falconbridge shareholders | | 132,840,681 | |
The average closing market price of the Company’s shares over the six trading days from March 4 through March 11, 2005 (the purchase offer announcement was March 9, 2005) | | $ | 19.07 | |
Fair value of the Company’s common stock issued | | $ | 2,534 | |
Fair value of vested options assumed by the Company | | 6 | |
Direct acquisition costs incurred by the Company | | 22 | |
Total purchase price | | $ | 2,562 | |
| | | |
Preliminary fair value of assets acquired by the Company | | | |
Cash and cash equivalents | | $ | 353 | |
Accounts receivable | | 178 | |
Metals and other inventories | | 308 | |
Operating capital assets | | 3,154 | |
Development projects | | 565 | |
Investments and other assets | | 45 | |
| | | |
Preliminary fair value of liabilities assumed by the Company | | | |
Accounts and taxes payable | | (177 | ) |
Debt due within one year | | (106 | ) |
Long-term debt | | (480 | ) |
Future income taxes | | (876 | ) |
Asset retirement obligation, pension and other provisions | | (257 | ) |
Interests of other shareholders | | (15 | ) |
Preferred shares assumed by the Company | | (130 | ) |
Net assets purchased | | $ | 2,562 | |
74
4. GAIN NET OF RESTRUCTURING COSTS AND OTHER
| | 2005 | | 2004 | |
| | | | | |
Gain on sale of investment and other | | $ | (19 | ) | $ | (7 | ) |
Restructuring costs | | 2 | | 3 | |
Gain on settlement of alumina contract (Note 6) | | — | | (80 | ) |
| | $ | (17 | ) | $ | (84 | ) |
5. DISCONTINUED OPERATIONS
In June 2005, Falconbridge disposed of a subsidiary that manufactures and distributes aluminum wheels. The subsidiary was sold for proceeds of $40.5, amounting to a net gain on sale of $1. Included in discontinued operations, net of tax is a loss of $9 (2004 – $40) from operations prior to the sale. In 2004, Falconbridge recorded an impairment loss of $50 related to the subsidiary determined using a discounted cash flow analysis. The impact from discontinued operations on the consolidated balance sheets and consolidated statements of cash flows has not been separately disclosed, as it is not considered material.
6. JOINT VENTURES
Falconbridge’s share of the assets, liabilities and equity, revenues and expenses and cash flows of its major joint ventures for the years ended December 31, 2005 and 2004 are as follows:
| | | | | | | | | | | | 2005 | |
| | Antamina | | Collahuasi | | Gramercy | | Magnesium | | Louvicourt | | Total | |
Balance Sheets | | | | | | | | | | | | | |
Current assets | | $ | 341 | | $ | 413 | | $ | 53 | | $ | 13 | | $ | 3 | | $ | 823 | |
Capital assets and other | | 608 | | 981 | | 139 | | 280 | | — | | 2,008 | |
| | $ | 949 | | $ | 1,394 | | $ | 192 | | $ | 293 | | $ | 3 | | $ | 2,831 | |
Current liabilities | | $ | 165 | | $ | 146 | | $ | 35 | | $ | 1 | | $ | 1 | | $ | 348 | |
Long-term debt and other | | 267 | | 636 | | 52 | | 24 | | 3 | | 982 | |
Falconbridge’s investment | | 517 | | 612 | | 105 | | 268 | | (1 | ) | 1,501 | |
| | $ | 949 | | $ | 1,394 | | $ | 192 | | $ | 293 | | $ | 3 | | $ | 2,831 | |
Statements of Earnings (Loss) | | | | | | | | | | | | | |
Sales and other revenues | | $ | 623 | | $ | 682 | | $ | 225 | | $ | — | | $ | 29 | | $ | 1,559 | |
Operating expenses | | 188 | | 256 | | 211 | | — | | 11 | | 666 | |
Income generated by operating assets | | $ | 435 | | $ | 426 | | $ | 14 | | $ | — | | $ | 18 | | $ | 893 | |
Expenses | | $ | 138 | | $ | 126 | | $ | 6 | | $ | 5 | | $ | — | | $ | 275 | |
Minority interest | | — | | 38 | | — | | — | | 7 | | 45 | |
Falconbridge’s share of earnings (loss) | | $ | 297 | | $ | 262 | | $ | 8 | | $ | (5 | ) | $ | 11 | | $ | 573 | |
Statements of Cash Flows | | | | | | | | | | | | | |
Cash realized from (used for): | | | | | | | | | | | | | |
Operations | | $ | 417 | | $ | 387 | | $ | 7 | | $ | (9 | ) | $ | 34 | | $ | 836 | |
Investment activities | | (22 | ) | (30 | ) | (12 | ) | — | | 2 | | (62 | ) |
Financing activities | | (153 | ) | (94 | ) | — | | (1 | ) | — | | (248 | ) |
75
| | | | | | | | | | | | 2004 | |
| | Antamina | | Collahuasi | | Gramercy | | Magnesium | | Louvicourt | | Total | |
Balance Sheets | | | | | | | | | | | | | |
Current assets | | $ | 223 | | $ | 392 | | $ | 38 | | $ | 12 | | $ | 18 | | $ | 683 | |
Capital assets and other | | 630 | | 955 | | 133 | | 272 | | 4 | | 1,994 | |
| | $ | 853 | | $ | 1,347 | | $ | 171 | | $ | 284 | | $ | 22 | | $ | 2,677 | |
Current liabilities | | $ | 73 | | $ | 179 | | $ | 18 | | $ | — | | $ | 2 | | $ | 272 | |
Long-term debt and other | | 346 | | 628 | | 56 | | 27 | | 5 | | 1,062 | |
Minority interest in subsidiaries | | — | | 222 | | — | | — | | 6 | | 228 | |
Falconbridge’s investment | | 434 | | 318 | | 97 | | 257 | | 9 | | 1,115 | |
| | $ | 853 | | $ | 1,347 | | $ | 171 | | $ | 284 | | $ | 22 | | $ | 2,677 | |
Statements of Earnings (Loss) | | | | | | | | | | | | | |
Sales and other revenues | | $ | 351 | | $ | 575 | | $ | 39 | | $ | — | | $ | 47 | | $ | 1,012 | |
Operating expenses | | 137 | | 205 | | 38 | | — | | 23 | | 403 | |
Income generated by operating assets | | $ | 214 | | $ | 370 | | $ | 1 | | $ | — | | $ | 24 | | $ | 609 | |
Expenses | | $ | 84 | | $ | 114 | | $ | — | | $ | 5 | | $ | — | | $ | 203 | |
Minority interest | | — | | 105 | | — | | — | | 9 | | 114 | |
Falconbridge’s share of earnings (loss) | | $ | 130 | | $ | 151 | | $ | 1 | | $ | (5 | ) | $ | 15 | | $ | 292 | |
Statements of Cash Flows | | | | | | | | | | | | | |
Cash realized from (used for): | | | | | | | | | | | | | |
Operations | | $ | 196 | | $ | 272 | | $ | 13 | | $ | (3 | ) | $ | 27 | | $ | 505 | |
Investment activities | | (15 | ) | (20 | ) | (5 | ) | — | | — | | (40 | ) |
Financing activities | | (69 | ) | (66 | ) | — | | (1 | ) | — | | (136 | ) |
Falconbridge holds a 33.75% interest in Antamina, a copper/zinc mine in Peru.
Falconbridge holds a 44% interest in Compañía Minera Doña Inés de Collahuasi S.C.M. (“Collahuasi”), a corporation which owns the mining and water rights and other assets relating to the Collahuasi mine, and which secured financing, conducts the operations and markets the products of the property.
In October 2004, the Company assumed a 50% interest in Kaiser Aluminum’s Gramercy alumina plant in Gramercy, Louisiana and Kaiser Aluminum’s related bauxite assets in Jamaica, in exchange for the settlement of an alumina supply contract and $11.5. The Company recorded a gain of $80 on the settlement of the contract (Note 4). The total consideration of $91.5, comprised of cash and the gain on the settlement of the contract, was allocated as $11.5 to working capital, $129 to capital assets and $49 to future income taxes.
Falconbridge owns an 80% joint-venture interest in the Magnesium project, a facility for the extraction of magnesium from mining residues in Danville, Quebec. As a result of depressed global magnesium prices, the Company temporarily shut down its Magnesium operation in April 2003.
Through its 62.1%-owned subsidiary, Novicourt, the Company holds a 45% joint-venture interest in the Louvicourt copper/zinc mine in northwestern Quebec which closed in 2005.
7. OPERATING CAPITAL ASSETS
| | Mines, mining plants and | | | | | | | | | | | | | | | | | |
| | ancillary mining assets | | Smelters | | Refineries | | Other | | | | | |
| | | | Accumulated | | | | Accumulated | | | | Accumulated | | | | Accumulated | | Deferred | | | |
| | | | depreciation | | | | depreciation | | | | depreciation | | | | depreciation | | preproduction | | | |
| | | | and | | | | and | | | | and | | | | and | | development and | | Net | |
As at December 31, 2005 | | Cost | | amortization | | Cost | | amortization | | Cost | | amortization | | Cost | | amortization | | exploration, net | | book value | |
Copper | | $ | 2,021 | | $ | 810 | | $ | 999 | | $ | 651 | | $ | 686 | | $ | 395 | | $ | 1,852 | | $ | 344 | | $ | 448 | | $ | 3,806 | |
Nickel | | 1,210 | | 737 | | 265 | | 166 | | 400 | | 249 | | 1,165 | | 107 | | 333 | | 2,114 | |
Zinc | | 433 | | 357 | | 198 | | 145 | | — | | — | | 3 | | 1 | | 8 | | 139 | |
Aluminum | | 10 | | — | | 745 | | 490 | | 6 | | — | | 623 | | 184 | | 1 | | 711 | |
Other | | 246 | | 223 | | — | | — | | — | | — | | 49 | | 45 | | 6 | | 33 | |
Total | | $ | 3,920 | | $ | 2,127 | | $ | 2,207 | | $ | 1,452 | | $ | 1,092 | | $ | 644 | | $ | 3,692 | | $ | 681 | | $ | 796 | | $ | 6,803 | |
76
| | Mines, mining plants and | | | | | | | | | | | | | | | | | |
| | ancillary mining assets | | Smelters | | Refineries | | Other | | | | | |
| | | | Accumulated | | | | Accumulated | | | | Accumulated | | | | Accumulated | | Deferred | | | |
| | | | depreciation | | | | depreciation | | | | depreciation | | | | depreciation | | preproduction | | | |
| | | | and | | | | and | | | | and | | | | and | | development and | | Net | |
As at December 31, 2004 | | Cost | | amortization | | Cost | | amortization | | Cost | | amortization | | Cost | | amortization | | exploration, net | | book value | |
Copper | | $ | 2,224 | | $ | 849 | | $ | 984 | | $ | 477 | | $ | 670 | | $ | 380 | | $ | 612 | | $ | 282 | | $ | 388 | | $ | 2,890 | |
Nickel | | 1,233 | | 745 | | 256 | | 157 | | 385 | | 234 | | 153 | | 92 | | 279 | | 1,078 | |
Zinc | | 434 | | 349 | | 195 | | 138 | | — | | — | | 3 | | 1 | | 14 | | 158 | |
Aluminum | | 4 | | — | | 738 | | 478 | | 2 | | — | | 600 | | 164 | | — | | 702 | |
Other | | 347 | | 319 | | — | | — | | — | | — | | 129 | | 119 | | 4 | | 42 | |
Total | | $ | 4,242 | | $ | 2,262 | | $ | 2,173 | | $ | 1,250 | | $ | 1,057 | | $ | 614 | | $ | 1,497 | | $ | 658 | | $ | 685 | | $ | 4,870 | |
In 2005, approximately $1,966 was allocated to the operating assets as preliminary fair market value increments from the purchase accounting pertaining to the acquisition of 41.5% of all the issued and outstanding common shares of the former Falconbridge that it did not previously own (Note 3). The preliminary fair market value increments are allocated to different business units as other operating capital assets, based on the preliminary allocation of the purchase cost for the acquisition.
8. DEVELOPMENT PROJECTS
Development projects consist of brownfield and greenfield projects that are in the pre-production stage. Major projects in the category are as follows:
As at December 31 | | 2005 | | 2004 | |
Kidd Creek – deep expansion | | $ | 518 | | $ | 404 | |
Koniambo – New Caledonia | | 276 | | 180 | |
Nickel Rim South | | 173 | | 101 | |
Magnesium | | 280 | | 272 | |
Other development projects | | 205 | | 209 | |
Preliminary allocation of fair market value increments (Note 3) | | 255 | | — | |
| | $ | 1,707 | | $ | 1,166 | |
The increase in carrying value attributed to the magnesium operations in 2005 is a result of the appreciation of the Canadian dollar compared to the U.S. dollar during 2005.
9. INVESTMENTS AND OTHER ASSETS
As at December 31 | | 2005 | | 2004 | |
Equity accounted investment – Noranda Income Fund | | $ | 40 | | $ | 43 | |
Cost accounted investments | | 39 | | 33 | |
Derivative financial instruments (Note 17) | | 102 | | 120 | |
Antamina net proceeds interest | | 21 | | 23 | |
Debenture discount and issue expenses, net | | 20 | | 18 | |
Supplies inventory | | 19 | | 25 | |
Deposits and other assets | | 66 | | 62 | |
| | $ | 307 | | $ | 324 | |
As at December 31, 2005, the fair market value of the cost accounted investments was $53 (2004 – $46).
77
10. DEBT
| | Principal repayment schedule as at December 31, 2005 | |
| | Interest | | Total | | | | | | | | | | | | 2011 | | After | | Total | |
| | rates(1) | | 2005 | | 2006 | | 2007 | | 2008 | | 2009 | | 2010 | | to 2014 | | 2014 | | 2004 | |
Debt of the Company and its wholly-owned subsidiaries: | | | | | | | | | | | | | | | | | | | | | |
Senior debentures (a) | | 6.22 | % | $ | 2,342 | | $ | 250 | | $ | — | | $ | 150 | | $ | — | | $ | — | | $ | 850 | | $ | 1,092 | | $ | 2,245 | |
Other loans and capital leases (b) | | 4.93 | % | 74 | | 16 | | 20 | | 24 | | 1 | | 6 | | 7 | | — | | 361 | |
Convertible debentures (Note 11) | | 5.00 | % | 105 | | — | | 105 | | — | | — | | — | | — | | — | | 112 | |
Preferred share liabilities (Note 12) | | 6.25 | % | 876 | | — | | — | | 126 | | — | | 300 | | 300 | | 150 | | 122 | |
| | 6.14 | % | 3,397 | | 266 | | 125 | | 300 | | 1 | | 306 | | 1,157 | | 1,242 | | 2,840 | |
Debt of joint ventures (c) | | 6.30 | % | 430 | | 87 | | 87 | | 87 | | 87 | | 40 | | 42 | | — | | 588 | |
Total | | 6.17 | % | $ | 3,827 | | $ | 353 | | $ | 212 | | $ | 387 | | $ | 88 | | $ | 346 | | $ | 1,199 | | $ | 1,242 | | $ | 3,428 | |
Debt due within one year | | | | $ | 353 | | | | | | | | | | | | | | | | $ | 570 | |
Long-term debt | | | | $ | 3,474 | | | | | | | | | | | | | | | | $ | 2,858 | |
(1) Weighted average interest rates after swap contracts, as at December 31, 2005
(a) Senior debentures of $2,342 (2004 – $2,245) are direct unsecured obligations of the Company.
On June 8, 2005, Falconbridge issued $250 of 12-year notes and $250 of 30-year notes under the Company’s base shelf prospectus. The 12-year notes, which are unsecured, bear interest at the rate of 5.5% per annum and mature on June 15, 2017. The 30-year notes, which are also unsecured, bear interest at the rate of 6.2% per annum and mature on June 15, 2035. Both series of notes are redeemable in whole or in part at any time at a redemption price equal to 100% of their principal amount plus a make-whole premium.
(b) Other loans and capital leases include borrowings under demand lines and unsecured committed bank lines of credit that are structured to provide the Company with the right to borrow at floating rates and repay these amounts over the next five years. At December 31, 2005, Falconbridge had utilized $nil (2004 – $246) from its total committed lines of $780 (2004 – $1,112).
The Company has an uncommitted letter of credit facility of $20 and Cdn$85 million (2004 – $21). Letters of credit of $46 (2004 – $17) were outstanding under this facility at December 31, 2005.
(c) Debt of joint ventures includes $188, Falconbridge’s 33.75% share of the $557 of borrowings under Antamina’s original $1,320 senior credit facilities. These facilities, provided by a consortium of international banks and national import/export credit agencies, have maturity dates ranging from less than one year to five years. With the exception of $228, all of these facilities are insured for political risks or are otherwise guaranteed for political risks by multilateral, national or private sector institutions. Falconbridge’s guarantee of Antamina’s debt was removed during 2003 as the completion tests were met.
(d) After taking into account current interest rates and credit spreads, the fair value of the Company’s debt, excluding the debt of joint ventures, at December 31, 2005 was greater than book value by $129 (2004 – $206).
(e) Interest rate swap agreements of $1,250 (2004 – $1,050) have been entered into by the Company, whereby fixed rates of interest are received and floating rates are paid for terms up to 9.5 years. In addition, interest rate swap agreements of $250 (2004 – $550) have been entered into by the Company, whereby fixed rates of interest are paid and floating rates are received for a period up to 6.5 years. As at December 31, 2005, the estimated aggregate fair value of the interest rate swap agreements of the Company had a mark-to-market gain of $7 (2004 – $41).
The Company has entered into several cross-currency interest rate swap transactions whereby rates of interest on debentures in the amount of $111 (2004 – $111) are swapped to floating rates of interest and $25 (2004 – $25) are swapped to fixed rates of interest for terms of three years. At December 31, 2005, the mark-to-market value of these positions was a gain of $47 (2004 – $45).
78
Interest, net | | 2005 | | 2004 | |
Interest on long-term debt | | $ | 234 | | $ | 164 | |
Interest on short-term debt | | 17 | | 16 | |
Interest income | | (46 | ) | (24 | ) |
| | 205 | | 156 | |
Capitalized interest | | (53 | ) | (36 | ) |
| | $ | 152 | | $ | 120 | |
11. CONVERTIBLE DEBENTURES
The Cdn$131 million (2004 – Cdn$150 million) adjustable rate convertible subordinated debentures Series 1, due April 30, 2007, bear interest at a rate which is the greater of 5%, and of 1% plus the percentage that two times the common share dividend paid in the previous six months is of the conversion price. The debentures are convertible at the holder’s option into common shares of the Company at a conversion price of Cdn$27.55 per common share, on or before the last business day prior to the maturity date of the debentures, or the last business day prior to redemption. The Company has the option of redeeming the debentures, and upon maturity they are redeemable, at the Company’s option, for common shares of the Company.
The Company’s convertible debentures contain both debt and equity components (Note 2). At December 31, 2005, the liability component amounted to $105 (2004 – $112) (Note 10). The equity component representing the fair value of the holders’ option to convert the debentures into the common shares of the Company was classified as a component of shareholders’ equity and amounted to $37 at December 31, 2005 (2004 – $42) (Note 15).
During 2005, debentures with face value of Cdn$19 million were converted to the common shares of Falconbridge by the holders (Note 15). Upon conversion, the carrying value of the related liability and the fair value of the holders’ option for the converted debentures were reclassified from liability and shareholders’ equity respectively to share capital.
12. PREFERRED SHARES LIABILITIES
| | 2005 | | 2004 | |
Junior Preference Shares, Series 1 | | $ | 300 | | $ | — | |
Junior Preference Shares, Series 2 | | 300 | | — | |
Junior Preference Shares, Series 3 | | 150 | | — | |
Preference Shares, Series H | | 126 | | 122 | |
| | $ | 876 | | $ | 122 | |
JUNIOR PREFERENCE SHARES
On May 4, 2005, 63.4 million common shares of the Company were repurchased in exchange for 50 million of three series of junior preference shares with a fair value of $1,250. These preference shares are accounted for as liabilities since Falconbridge has to redeem these shares by a specific date in the future and this mandatory redeemable feature represents a fixed obligation to Falconbridge. These preference shares were measured at their fair value, being the closing quoted market price on their first trading day of May 5, 2005. These preference shares rank junior to all other preferred shares of Falconbridge with respect to priority in the payment of dividends and the distribution of assets of Falconbridge in the event of any liquidation, dissolution or winding-up of Falconbridge.
On August 11, 2005, the Company redeemed a total of $500 of 20 million outstanding junior preference shares. The Company redeemed 8 million Junior Preference Shares, Series 1, 8 million Junior Preference Shares, Series 2, and 4 million Junior Preference Shares, Series 3. Each junior preference share was redeemed at a price of $25.25 plus accrued and unpaid dividends for the period from July 1, 2005 to August 10, 2005. Included in interest expense on the consolidated statement of income and retained earnings was $5 million paid as premium on early redemption of the preference shares. The details of each series of the junior preference shares are as follows:
79
(a) Junior Preference Shares Series 1
As at December 31, 2005, the Company had 11,999,899 of Junior Preference Shares Series 1 outstanding. The holders of Junior Preference Shares Series 1 are entitled to receive dividends in the amount of $1.50 per share, per annum, payable quarterly.
The Junior Preference Shares Series 1 are redeemable by the Company at any time, on or before June 28, 2008 at $25.25 per share, and thereafter at $25.00 per share, and must be redeemed by the Company on May 6, 2010 at $25.00 per share. On its Final Redemption Date, the Junior Preference Shares Series 1 are convertible, in whole or in part, at the option of the Company, into that number of freely tradable common shares determined by dividing the aggregate of $25.00, by the greater of $2.00 and 90% of the U.S. dollar equivalents of the volume weighted average trading price of the common shares on the Toronto Stock Exchange (“TSX”) for a period of 20 consecutive trading days ending on the fourth trading day prior to the date specified for conversion.
(b) Junior Preference Shares Series 2
As at December 31, 2005, the Company had 11,999,899 of Junior Preference Shares Series 2 outstanding. The holders of Junior Preference Shares Series 2 are entitled to receive dividends in the amount of $1.5625 per share, per annum, payable quarterly. From June 30, 2010 until June 30, 2012, holders of Junior Preference Shares Series 2 will be entitled to receive fixed preferential cumulative dividends at a rate per annum equal to the greater of (i) 6.25%; and (ii) a rate equal to the seven-year U.S. treasury bond yield at the commencement of such subsequent fixed-rate period plus 2.05%.
The Junior Preference Shares Series 2 are redeemable by the Company at any time, on or before June 30, 2010 at $25.25 per share, and thereafter until June 29, 2012 at $25.00 per share, and must be redeemed by the Company on June 30, 2012 at $25.00 per share. On its Final Redemption Date, the Junior Preference Shares Series 2 are convertible, in whole or in part, at the option of the Company, into that number of freely tradable common shares determined by dividing the aggregate of $25.00, by the greater of $2.00 and 90% of the U.S. dollar equivalents of the volume weighted average trading price of the common shares on the Toronto Stock Exchange (“TSX”) for a period of 20 consecutive trading days ending on the fourth trading day prior to the date specified for conversion.
(c) Junior Preference Shares Series 3
As at December 31, 2005, the Company had 5,999,903 of Junior Preference Shares Series 3 outstanding. The holders of Junior Preference Shares Series 3 are entitled to receive dividends in the amount of $1.625 per share, per annum, payable quarterly. From June 30, 2010 until June 30, 2012 and for each succeeding two-year subsequent fixed-rate period until June 30, 2015, holders of Junior Preference Shares Series 3 will be entitled to receive fixed preferential cumulative dividends at a rate per annum equal to the greater of (i) 6.5%; and (ii) a rate equal to the ten-year U.S. treasury bond yield at the commencement of such subsequent fixed-rate period plus 2.35%. Dividends may be paid in cash or in a number of common shares determined by dividing the declared dividend amount by 95% of the U.S. dollar equivalent of the volume weighted average trading price of the common shares on the TSX for a period of 20 consecutive trading days ending on the fourth trading day prior to the date specified for payment of the dividend.
The Junior Preference Shares Series 3 are redeemable by the Company at any time, on or before June 30, 2013 at $25.25 per share, and thereafter until June 29, 2015 at $25.00 per share, and must be redeemed by the Company on June 30, 2015 at $25.00 per share. On its Final Redemption Date, the Junior Preference Shares Series 3 are convertible, in whole or in part, at the option of the Company, into that number of freely tradable common shares determined by dividing the aggregate of $25.00, by the greater of $2.00 and 90% of the U.S. dollar equivalents of the volume weighted average trading price of the common shares on the Toronto Stock Exchange (“TSX”) for a period of 20 consecutive trading days ending on the fourth trading day prior to the date specified for conversion.
PREFERRED SHARES SERIES H
At December 31, 2005, there were 6,000,000 (2004 – 6,000,000) Series H Preferred Shares outstanding. These preferred shares are presented as liabilities since their conversion feature represents a fixed obligation to Falconbridge (Note 2). Holders of the Series H Preferred Shares are entitled to fixed cumulative preferential cash dividends, if, as and when declared by the Company’s
80
Board of Directors, at a rate of Cdn$1.625 per share per annum, payable quarterly, in equal installments of Cdn$0.40625 per share, on the last day of March, June, September and December of each year.
On and after March 31, 2008, the Company may, at its option (i) redeem the outstanding Series H Preferred Shares in whole at any time or in part from time to time, by the payment of Cdn$25.00 per share, together with all accrued and unpaid dividends up to but excluding the date fixed for redemption; or (ii) subject, if required, to stock exchange approvals, convert the outstanding Series H Preferred Shares into Falconbridge common shares. The number of common shares into which each Series H Preferred Share may be so converted will be determined by dividing the redemption price per Series H Preferred Share, together with all accrued and unpaid dividends up to but excluding the date fixed for conversion, by the greater of Cdn$2.00 and 95% of the current market price of Falconbridge common shares at such time.
On or after June 30, 2008, each Series H Preferred Share will be convertible at the option of the holder on the last day of March, June, September and December in each year into that number of Falconbridge common shares determined by dividing Cdn$25.00, together with all accrued and unpaid dividends up to but excluding the date fixed for conversion, by the greater of Cdn$2.00 and 95% of the current market price of Falconbridge common shares at such time. If a holder of Series H Preferred Shares elects to convert any of those shares into Falconbridge common shares, the Company may, on not less than 20 days notice prior to the conversion date, elect to redeem those Series H Preferred Shares for Cdn$25.00 per share, together with all accrued and unpaid dividends up to but excluding the date fixed for conversion or arrange for the sale of those shares to substitute purchasers at such price.
13. ASSET RETIREMENT OBLIGATION, PENSION AND OTHER PROVISIONS
As at December 31 | | 2005 | | 2004 | |
Asset retirement obligation (a) | | $ | 424 | | $ | 436 | |
Employee future benefits costs (assets) liability (Note 20) | | 102 | | (12 | ) |
Other provisions | | 133 | | 171 | |
| | $ | 659 | | $ | 595 | |
(a) The business conducted by Falconbridge has been, and may in the future be, affected by changes in environmental legislation and other requirements including those related to asset retirement obligations and progressive site restoration costs. As Falconbridge operates in many countries, both the likelihood of changes in legislation and its impact upon Falconbridge are not predictable. Falconbridge’s policy is to meet and, if possible, surpass standards set by relevant legislation, through the application of innovative and technically proven economical measures in advance of prescribed deadlines. Falconbridge incurs substantial removal and site restoration costs on an ongoing basis, which, it believes, will mitigate future removal and site restoration costs. A long-term obligation, equal to the fair value of the legal obligation for asset retirement is recorded based on an annual assessment of projected asset retirement and progressive reclamation costs. The key assumptions on which the fair value of the asset retirement obligations are based include the estimated future cash flows, the timing of those cash flows, and the credit-adjusted risk-free rate or rates at which the estimated cash flows have been discounted.
Falconbridge uses discount rates ranging from 5.0% to 8.0%. As of December 31, 2005, undiscounted cash outflows approximating $1,542 million are expected to occur over a period exceeding 50 years. In view of the uncertainties concerning future asset retirement and progressive reclamation costs, the ultimate costs to Falconbridge could differ materially from the amounts estimated. The estimate for the future liability is subject to change based on amendments to applicable laws and legislation, the nature of ongoing operations and technological innovations. Future changes, if any, due to their nature and unpredictability, could have a significant impact and would be reflected prospectively, as a change in an accounting estimate.
81
The following table explains the change in the asset retirement obligations:
Year ended December 31 | | 2005 | | 2004 | |
Asset retirement obligation, beginning of period | | $ | (436 | ) | $ | (412 | ) |
Liabilities incurred | | — | | (5 | ) |
Liabilities settled | | 62 | | 36 | |
Gain on settlement of liabilities | | 2 | | 5 | |
Accretion expense | | (37 | ) | (24 | ) |
Revision in estimated cash flows | | (4 | ) | (9 | ) |
Foreign exchange | | (11 | ) | (27 | ) |
Asset retirement obligation, end of period | | $ | (424 | ) | $ | (436 | ) |
14. INTERESTS OF OTHER SHAREHOLDERS
As at December 31 | | 2005 | | 2004 | |
Preferred shares of subsidiaries | | $ | — | | $ | 130 | |
Common equity interests | | 54 | | 1,067 | |
| | $ | 54 | | $ | 1,197 | |
On June 30, 2005, the Company completed the acquisition of 41.5% of all the issued and outstanding common shares of the former Falconbridge that it did not previously own (Note 3). The preferred shares of the former Falconbridge were assumed by the Company upon acquisition.
15. SHAREHOLDERS’ EQUITY
CAPITAL STOCK
Authorized:
Preferred shares, an unlimited number
Common shares, an unlimited number
Participating shares, an unlimited number
| | 2005 | | 2004 | |
Issued: | | | | | |
Preferred Shares, Series F | | $ | 59 | | $ | 59 | |
Preferred Shares, Series G | | 137 | | 137 | |
Preferred Shares, Series 1 (Note 3) | | 1 | | — | |
Preferred Shares, Series 2 (Note 3) | | 78 | | — | |
Preferred Shares, Series 3 (Note 3) | | 51 | | — | |
Equity element of convertible debentures (Notes 2 and 11) | | 37 | | 42 | |
Common shares | | 4,264 | | 2,107 | |
Stock option valuation | | 10 | | 3 | |
| | 4,637 | | 2,348 | |
Retained earnings | | 154 | | 231 | |
Currency translation adjustment | | 240 | | 263 | |
| | 5,031 | | 2,842 | |
Share purchase plan | | — | | (3 | ) |
| | $ | 5,031 | | $ | 2,839 | |
82
PREFERRED SHARES SERIES F
The Company had 3,246,057 (2004 – 3,246,057) Cumulative, Redeemable Preferred Shares, Series F (the “Series F Preferred Shares”) outstanding at December 31, 2005.
Prior to November 1, 2001, holders of Series F Preferred Shares received a quarterly fixed dividend at a rate of 5.8% per annum. On November 1, 2001, the Series F Preferred Shares commenced paying a monthly floating dividend based on a dividend rate that fluctuates over time between 50% and 100% of Prime for each month. The dividend rate is adjusted upwards or downwards on a monthly basis by an Adjustment Factor whenever the Calculated Trading Price, being the market price of the Series F Preferred Shares, is Cdn$24.875 or less or Cdn$25.125 or more, respectively. The Adjustment Factor for a month is based on the Calculated Trading Price of the Series F Preferred Shares for the preceding month. The maximum Adjustment Factor for any month is ±4.00%. The annual floating dividend rate for any month is Prime multiplied by the Designated Percentage for such month (the Adjustment Factor for such month plus the Designated Percentage for the preceding month).
Holders of Series F Preferred Shares had the right to convert their shares, effective on November 1, 2001, on a one-for-one basis into Cumulative, Redeemable Preferred Shares, Series G (the “Series G Preferred Shares”). Of the 12,000,000 outstanding Series F Preferred Shares, 8,753,943 were converted into Series G Preferred Shares. Holders will again have the right to convert their shares, on a one-for-one basis into Series G Preferred Shares on November 1, 2006, and every five years thereafter. On November 1, 2001, the Series F Preferred Shares became redeemable, at the option of the Company, at Cdn$25.50 per share plus unpaid and accrued dividends.
PREFERRED SHARES SERIES G
The Company had 8,753,943 (2004 – 8,753,943) Series G Preferred Shares outstanding at December 31, 2005. These Series G Preferred Shares were issued as a result of the conversion of the same number of Series F Preferred Shares into Series G Preferred Shares on November 1, 2001.
For each of the five years commencing November 1, 2001, holders of Series G Preferred Shares will receive, as and when declared by the Board of Directors, a quarterly fixed dividend at a rate of 6.10% per annum. On November 1, 2006, the Series G Preferred Shares will be redeemable, at the option of the Company, at Cdn$25.00 per share plus unpaid and accrued dividends. Subject to certain conditions, holders of Series G Preferred Shares will have the right to convert their shares into Series F Preferred Shares on a one-for-one basis on November 1, 2006 and on November 1 of every fifth year thereafter.
PREFERRED SHARES SERIES 1
On March 7, 1997, the Company issued 8,000,000 Units, at a price of Cdn$10.00 per Unit, with each Unit consisting of one Cumulative Preferred Share Series 1 (the “Preferred Share Series 1”) and one Cumulative Preferred Share Series 2 Purchase Warrant (the “Warrant”). Since September 1, 1998, the quarterly cash dividend on Preferred Share Series 1 has been Cdn$0.02 per share. The holders of the Units had the right to acquire on certain dates, for each Unit held, one Cumulative Preferred Share Series 2 (the “Preferred Share Series 2”) of the Company by the combined effect of tendering for conversion one Preferred Share Series 1 and the exercise of one Warrant together with the cash payment of Cdn$15.00 per Warrant. A total of 7,910,165 warrants have been converted into Preferred Share Series 2. The remaining unexercised warrants cannot be exercised.
PREFERRED SHARES SERIES 2
Until March 1, 2004, holders of the Preferred Share Series 2 were entitled to fixed cumulative preferential cash dividends, as and when declared by the Board of Directors, which accrued from the date of issue and were payable quarterly in the amount of Cdn$0.3672 per share or Cdn$1.4688 per share per annum. From March 1, 2004, the Preferred Share Series 2 are entitled to floating adjustable cumulative preferential cash dividends as and when declared by the Board of Directors.
Holders of Preferred Share Series 2 had the right to convert their shares into Cumulative Preferred Share Series 3 (the “Preferred Share Series 3”) of the Company, subject to certain conditions, on March 1, 2004, and will continue to have the right every five years thereafter. On March 1, 2004, the Company had the right to redeem for cash the Preferred Share Series 2, in
83
whole but not in part, at the Company’s option, at Cdn$25.00 per share plus accrued and unpaid dividends. Subsequent to March 1, 2004, the Company has the right to redeem at any time for cash the Preferred Share Series 2, in whole but not in part, at the Company’s option, at Cdn$25.50 per share plus accrued and unpaid dividends. Effective March 1, 2004, the Preferred Share Series 2 shares pay a monthly adjustable floating dividend based on a percentage of the Canadian prime rate. A total of 3,122,882 units have been converted into Preferred Share Series 3.
PREFERRED SHARES SERIES 3
Holders of Preferred Share Series 3 are entitled to fixed cumulative preferential cash dividends, as and when declared by the Board of Directors, which accrue from March 1, 2004. The dividends are payable quarterly on the first day of March, June, September, and December in the amount of Cdn$0.2863 per share or Cdn$1.1452 per share per annum until March 1, 2009. The Preferred Share Series 3 are not redeemable prior to March 1, 2009. The Preferred Share Series 3 will be redeemable on March 1, 2009 and on March 1 every fifth year thereafter, in whole but not in part, at the Company’s option, at Cdn$25.00 per share, together with accrued and unpaid dividends up to but excluding the date of redemption. Holders of Preferred Share Series 3, upon giving notice, will have the right to convert on March 1, 2009, and on March 1 in every fifth year thereafter, their shares into an equal number of Preferred Share Series 2, subject to the automatic conversion provisions.
NON-VOTING PARTICIPATING SHARES
The authorized and unissued non-voting participating shares participate ratably with the holders of common shares in dividends and distributions of the assets of the Company.
SUMMARY OF COMMON SHARE TRANSACTIONS
| | Shares (000) | | Amount | |
Common shares, December 31, 2003 | | 295,228 | | $ | 2,084 | |
Issued under dividend re-investment | | 38 | | 1 | |
Issued on exercise of stock options | | 1,704 | | 22 | |
Common shares, December 31, 2004 | | 296,970 | | $ | 2,107 | |
| | | | | |
Issued upon Amalgamation | | 132,841 | | $ | 2,534 | |
Repurchased by issuance of junior preferred shares (Note 12) | | (63,377 | ) | (451 | ) |
Issued on exercise of stock options | | 3,486 | | 52 | |
Issued upon conversion of debentures (Note 11) | | 703 | | 21 | |
Issued under dividend re-investment | | 65 | | 1 | |
Common shares, December 31, 2005 | | 370,688 | | $ | 4,264 | |
EARNINGS PER SHARE
Earnings per share is determined by dividing net income, after deducting preferred share dividends of $17 (2004 – $13), by the weighted average number of common shares outstanding of 339,756,276 (2004 – 296,245,753) during the year, excluding shares securing employee share purchase loans.
Diluted earnings per share assumes that outstanding dilutive stock options are exercised at the beginning of the period (or at the time of issuance, if later) and the proceeds are used to purchase common stock at the average market price during the period, and that dilutive convertible debentures are converted into common shares at the beginning of the period.
Diluted earnings per share is determined by dividing net income attributable to common shares, after adding the dilutive effect of convertible debentures of $8 (2004 – $7), by the diluted weighted average number of shares of 346,173,501 (2004 – 303,458,182).
SHARE PURCHASE PLAN
In 1998, 2001 and 2002, loans were issued to executives of the Company for the purchase of common shares under the share purchase plan. The loans were repayable on demand, mature in ten years, and were secured by a pledge of 331,950 common shares at December 31, 2004. Loans receivable at December 31, 2004 of $3 were recorded as a reduction of shareholders’
84
equity. The loans were repaid in full in 2005 and the repayment was accounted for as a corresponding increase in shareholders’ equity.
STOCK OPTIONS
The Company has a stock option plan through which options may be granted to directors, officers and employees for the purchase of common shares. Options were granted at prices equal to the five-day average price prior to the grant. Stock options generally have a 10-year term and contain vesting provisions of 20% on the first anniversary following the date of the grant, and a further 20% on each of the four subsequent anniversary dates. Stock options granted from January 1, 2000 to February 28, 2002 have a 10-year term and the same vesting provisions; however, they also contain an accelerated vesting feature specifying that on the first day that the market price of the common shares is 20% greater than the exercise price of the option, the final tranche of certain unvested options outstanding on that date will immediately vest and be exercisable.
During 2005, three stock option series totaling 1,301,197 options at a weighted average price of Cdn$23.32 were granted. The compensation expense associated with these stock options series was calculated using the Black-Scholes valuation model assuming the following weighted average parameters; 10-year expected life, 25% volatility, expected dividend of 2.41% annually and an interest rate of 4.00%. The stock option value is charged against net income over its vesting period.
On June 30, 2005, the Company assumed the stock option obligations of the former Falconbridge upon acquisition of the former Falconbridge (Note 3). The stock options retained their original attributes with the exception that the number of stock options increased by a ratio of 1.77 and the exercise prices decreased by a ratio of 1.77 to reflect the acquisition price of one common share of the former Falconbridge exchanged for 1.77 common shares of the Company. The fair value of the unvested stock options as at June 30, 2005 amounted to $17. The value of the stock options was calculated using the Black Scholes valuation model, using the following weighted average assumptions: a seven-year expected life, 26% volatility, an expected dividend of 2.34% and an interest rate of 3.58%. The value is being charged against net income over the vesting periods of the stock options.
Corporate and general administration expenses in 2005 include compensation costs of $6 (2004 – $4) relating to outstanding options granted since January 1, 2002.
A summary of the status of the stock option plan and changes during the years is presented below:
| | 2005 | | 2004 | |
| | | | Weighted | | | | Weighted | |
| | | | average exercise | | | | average exercise | |
| | Options (000) | | price ($Cdn) | | Options (000) | | price ($Cdn) | |
Outstanding, beginning of year | | 7,416 | | $ | 16.75 | | 9,584 | | $ | 16.35 | |
Options assumed upon Amalgamation (Note 3) | | 3,049 | | 12.91 | | — | | — | |
Granted | | 1,301 | | 23.32 | | 882 | | 20.42 | |
Exercised | | (3,486 | ) | 16.23 | | (1,704 | ) | 16.24 | |
Cancelled | | (738 | ) | 15.77 | | (1,346 | ) | 16.64 | |
Outstanding, end of year | | 7,542 | | $ | 17.37 | | 7,416 | | $ | 16.75 | |
The following table summarizes information about stock options outstanding at December 31, 2005:
| | | | Options outstanding | | Options exercisable | |
| | | | | | Weighted | | | | Weighted | |
| | Number (000) | | Weighted average | | average | | Number (000) | | average | |
| | outstanding at | | remaining | | exercise price | | exercisable at | | exercise price | |
Range of exercise prices ($Cdn) | | December 31, 2005 | | contractual life (years) | | ($Cdn) | | December 31, 2005 | | ($Cdn) | |
$8.85 to $12.85 | | 1,227 | | 6.7 | | $ | 9.46 | | 253 | | $ | 9.56 | |
$13.82 to $15.00 | | 723 | | 7.0 | | 13.87 | | 158 | | 14.05 | |
$15.05 to $19.16 | | 2,860 | | 5.7 | | 16.38 | | 1, 981 | | 12.46 | |
$19.29 to $26.91 | | 2,732 | | 8.7 | | 22.87 | | 161 | | 21.42 | |
| | 7,542 | | 7.1 | | $ | 17.37 | | 2,553 | | $ | 12.84 | |
85
DIRECTOR DEFERRED STOCK UNIT PLAN
Under the Deferred Stock Unit (DSU) Plan for the Company’s non-employee directors, each eligible director may elect to be paid annual retainer fees and/or meeting attendance fees in DSUs rather than in cash. A DSU is a notional unit, equivalent in value to a common share.
Deferred stock units are credited with “dividend equivalents” when dividends are paid on the common shares of the Company, and such dividend equivalents are converted into additional units based on the fair market value of common shares on the date credited.
Payment of DSUs is not made until such time as the director leaves the Board, and may be in cash or in common shares of the Company purchased on the open market.
As of December 31, 2005 the total DSUs held by participating directors was 105,336 (2004 – 61,351), the accrual in respect of which is nominal at December 31, 2005 and 2004.
MANAGEMENT DEFERRED SHARE UNIT PLAN (MDSUP)
Management deferred share units (“Units”) may be granted each year at the discretion of the Board to senior executives in lieu of all or part of their annual cash bonus awards. The annual bonus awards would be converted to Units based on a rate set on the award date. The portion ofthe annual bonus award elected to be received in Units by the executive may, at the discretion of the Human Resources Committee, be increased by a factor of up to two times for purposes of calculating the number of Units to be allocated under the MDSUP.
An executive who holds Units will receive additional Units as dividends are paid on the common shares of the Company, on the same basis as if the dividends were reinvested pursuant to the Company’s dividend reinvestment plan. The Units will vest over a five-year period and participants will only be allowed to redeem the Units upon cessation of employment.
The cash value of the Units when redeemed will be equivalent to the market value of an equivalent number of Falconbridge common shares at the time of cessation of employment with the Company.
As of December 31, 2005, a total of 93,866 Units were held by executives of the Company (2004 – 44,274), the accrual in respect of which is nominal at December 31, 2005 and 2004.
DIVIDEND REINVESTMENT PLAN
Canadian resident shareholders may elect to reinvest their cash dividends from common shares to purchase additional shares. During 2005, 64,642 (2004 – 37,910) common shares were issued under the dividend reinvestment plan. The dividend reinvestment plan was indefinitely suspended on October 20, 2005 according to the terms of the Inco Limited and Falconbridge support agreement related to the Inco offer to purchase Falconbridge common shares.
16. INCOME AND PRODUCTION TAXES
The provision for income and production taxes differs from the amount that would have resulted by applying statutory income tax rates to earnings as described below:
| | 2005 | | 2004 | |
Income before the following: | | | | | |
Income and production taxes and minority interest | | $ | 1,546 | | $ | 1,242 | |
Provision based on combined federal and composite provincial tax rate of 33.2% (2004 – 37.6%) | | $ | 513 | | $ | 467 | |
Increase (decrease) in taxes resulting from: | | | | | |
Resource and depletion allowances | | (32 | ) | (26 | ) |
Royalties and mineral taxes | | 22 | | 22 | |
Rate differences from foreign and manufacturing activities | | (76 | ) | (116 | ) |
Non-taxable items | | (7 | ) | (57 | ) |
Capital taxes | | 25 | | 7 | |
Foreign exchange adjustments | | 46 | | 51 | |
Non-recurring and other | | 20 | | 3 | |
Income and production taxes | | $ | 511 | | $ | 351 | |
86
Consolidated income and production taxes are as follows:
| | 2005 | | 2004 | |
Current: | | | | | |
Federal and provincial income taxes | | $ | 13 | | $ | 25 | |
Provincial mining taxes | | 12 | | 5 | |
Foreign taxes | | 269 | | 75 | |
| | $ | 294 | | $ | 105 | |
Future: | | | | | |
Federal and provincial income taxes | | $ | 24 | | $ | 32 | |
Provincial mining taxes | | 12 | | 18 | |
Foreign taxes | | 181 | | 196 | |
| | $ | 217 | | $ | 246 | |
The components of the future tax asset and future tax liability at December 31, 2005 and 2004 are as follows:
| | 2005 | | 2004 | |
| | Legal entities | | Legal entities | | Legal entities | | Legal entities | |
| | where assets | | where liabilities | | where assets | | where liabilities | |
| | exceed liabilities | | exceed assets | | exceed liabilities | | exceed assets | |
Future tax assets: | | | | | | | | | |
Property plant and equipment | | $ | — | | $ | — | | $ | 15 | | $ | — | |
Pensions | | 14 | | — | | — | | — | |
Post-retirement benefits | | 98 | | — | | — | | 69 | |
Asset retirement obligation | | 18 | | 13 | | 50 | | 51 | |
Exploration | | 66 | | — | | 30 | | 15 | |
Inventory valuations | | 3 | | — | | — | | 10 | |
Non-capital losses | | 67 | | 87 | | 74 | | 95 | |
Research and development | | 119 | | — | | 86 | | 21 | |
Other | | 68 | | 29 | | 167 | | 39 | |
| | $ | 453 | | $ | 129 | | $ | 422 | | $ | 300 | |
Future tax liabilities: | | | | | | | | | |
Property plant and equipment | | $ | (26 | ) | $ | (1,068 | ) | $ | — | | $ | (473 | ) |
Development and pre-production | | (187 | ) | (269 | ) | (5 | ) | (210 | ) |
Foreign exchange | | (78 | ) | (2 | ) | (27 | ) | (33 | ) |
Pensions | | — | | (22 | ) | (6 | ) | (28 | ) |
Asset retirement obligation | | — | | — | | — | | — | |
Exploration | | — | | — | | — | | — | |
Other | | (36 | ) | (50 | ) | (92 | ) | (152 | ) |
| | $ | (327 | ) | $ | (1,411 | ) | $ | (130 | ) | $ | (896 | ) |
Net future tax asset (liability) | | $ | 126 | | $ | (1,282 | ) | $ | 292 | | $ | (596 | ) |
As of December 31, 2005, the company had the following net operating loss carry-forwards which are scheduled to expire in the following years:
Year of Expiry | | Net Operating Losses | |
2006-2015 | | $ | 82 | |
2016-2025 | | 243 | |
Indefinitely | | 299 | |
| | $ | 624 | |
87
17. FINANCIAL INSTRUMENTS
Falconbridge uses various strategies to manage its market risk, including the use of derivative contracts to limit, offset or reduce the Company’s market exposure. Derivative instruments are used to manage well-defined commodity price, foreign exchange and interest rate risks arising from Falconbridge’s primary business activities. The fair values of Falconbridge’s derivative instruments, as summarized later in this note, are based on quoted market prices for similar instruments and on market closing prices at year end.
(a) Fixed Forward Price Hedges
Some customers request a fixed-sales price instead of the COMEX or London Metal Exchange (“LME”) average price in the month of shipment. Falconbridge enters into futures contracts that will allow it to receive the COMEX or LME average price in the month of shipment while customers pay the agreed upon fixed price. Falconbridge accomplishes this by settling the futures contracts during the month of shipment, which generally results in the realization of the COMEX or LME average price.
At December 31, 2005, the mark-to-market value of these positions was a gain of $6 (2004 – gain of $8).
(b) Commodity Hedges
Falconbridge purchases metal in concentrate or scrap to be processed eventually into refined metal for sale to customers. The raw material feed is purchased from third parties at prices that are often different from the eventual sale price to metal customers, largely due to price changes that may occur while processing. To mitigate the price risk resulting from the difference between the timing of purchases and sales, Falconbridge hedges such transactions. The hedge transactions involve the purchase or sale of over-the-counter or LME or COMEX exchange-traded contracts. In the month that the refined metal is sold, the corresponding commodity hedge position is liquidated at the COMEX or LME average price for the month of sale.
As at December 31, 2005 the mark-to-market value of these positions was a loss of $7 (2004 – loss of $1).
(c) Hedges of Foreign-denominated Expenditures
Since Falconbridge’s functional and reporting currency is the U.S. dollar, Falconbridge hedges its Canadian dollar costs using foreign currency exchange contracts. When the Canadian dollar strengthens significantly against the U.S. dollar, the increase in value of future Canadian dollar costs is partially offset by gains in the value of the forward currency contracts designated as hedges. Conversely, when the Canadian dollar weakens, the decrease in the value of future Canadian dollar costs is partially offset by losses in the value of the forward currency contracts.
At December 31, 2005, Falconbridge had forward currency exchange contracts to purchase Cdn$12 million maturing over the next one and half years at an average exchange rate of Cdn$1.52. The mark-to-market value of these positions at December 31, 2005 was a gain of $1.
In addition, Falconbridge maintains a program to hedge its Norwegian kroner and Chilean peso expenditures. At December 31, 2005, Falconbridge entered into short-term forward foreign exchange contracts to hedge its Norwegian and Chilean commitments, whereby it would purchase notional amounts with a U.S. dollar equivalent of $19 (2004 – $9). At December 31, 2005, the mark-to-market value of these contracts was nominal (2004 – mark-to-market gain of $4).
Falconbridge’s operating costs to December 31, 2005 include realized exchange gains from the settlement of various cost hedge contracts of $63 (2004 – exchange gain of $77).
(d) Hedge of Net Investment in Foreign Operations
The Company uses forward foreign exchange contracts and foreign-denominated obligations to protect the value of its investments in its foreign subsidiaries.
At December 31, 2004, the Company had outstanding foreign exchange contracts to sell Cdn$77 million, maturing over the next seven years, designated as hedges against Canadian dollar net assets. In addition, a series of foreign exchange contracts to buy Cdn$40 million and sell Cdn$23 million are designated as hedges against foreign-denominated monetary assets of the Company. The Company had a series of short-term foreign exchange contracts to purchase a notional amount of Cdn$520 million as a hedge against foreign-denominated monetary assets and liabilities. As at December 31, 2004, the unrealized loss on these contracts was $75.
88
At December 31, 2005, the Company had outstanding foreign exchange contracts to sell Cdn$77 million, maturing over the next six years, designated as hedges against Canadian dollar net assets. In addition, a series of foreign exchange contracts to buy Cdn$516 million are designated as hedges against foreign-denominated monetary liabilities of the Company. As at December 31, 2005, the unrealized loss on these contracts was $88.
The Company has also entered into short-term forward foreign exchange contracts to sell £1 million (2004 – £3 million) and purchase U.S. dollars as a hedge against pounds sterling net assets. At December 31, 2005 and 2004, the fair value of these contracts approximated their carrying value.
Derivative financial instruments involve credit and market risk. Credit risk arises from the potential for a counter-party to default on its contractual obligations and is limited to those contracts where the Company would incur a loss in replacing the defaulted transaction. The Company minimizes credit risk through the selection, monitoring and diversification of counter-parties, use of the International Swaps and Derivatives Association (ISDA) documentation and master netting agreements, collateral and other credit mitigation techniques.
18. COMMITMENTS AND CONTINGENCIES
(a) As a result of the sale of the CEZ processing facility to the Noranda Income Fund in 2002, the Company entered into a 15-year supply and processing agreement with the Fund. The Company has committed to sell up to 550,000 tonnes of zinc concentrate annually to the refinery (its annual concentrate requirement to operate to its full current capacity) at market rates for the payable metal, less a fixed-treatment charge initially set at $0.352 per pound of “payable zinc metal”. Commencing January 1, 2004, the Processing Fee is the Processing Fee in the previous year adjusted annually (i) upward by 1% and (ii) upward or downward by 10% of the year-over-year percentage change in the average cost of electricity per megawatt hour for the Processing Facility. “Payable zinc metal” in respect of a quantity of concentrate will be equal to 96% of the assayed zinc metal content in the concentrate under the Supply and Processing Agreement.
The Company has also committed to manage the processing facility through operating and marketing agreements and will act as an agent for the sale of the facility’s zinc production for the duration of the supply agreement.
(b) On October 11, 2005, Inco Limited (“Inco”) announced a take-over bid for all outstanding common shares of the Company. The offer was comprised of part cash and part Inco shares. The completion of the take-over bid requires acceptance by 66.66% of all common shareholders of the Company on a fully-diluted basis and is subject to regulatory approvals. The Company would be required to provide for the payment of a fee of up to $320 to Inco in the event that the acquisition is not completed for certain reasons.
(c) On April 19, 2005, Falconbridge and Barrick Gold entered into a joint-venture agreement regarding the Kabanga nickel deposit and related concessions in Tanzania. Under the agreement, Falconbridge acquired a 50% indirect interest in the Kabanga Project for $15 and became the operator of the joint venture.
Over the next several years, Falconbridge will fund and conduct a $50 work plan that will include additional exploration, infill drilling, and technical work to update the resource model for Kabanga.
(d) On December 28, 2005, Falconbridge and its joint-venture partner, Société Minière du Sud Pacifique S.A. (“SMSP”) acquired a 49% and 51% interest, respectively, in the Koniambo Nickel project. Under the Bercy Accord, Falconbridge assumed responsibility for arranging financing of up to 100% of the project. During 2005, Falconbridge committed to providing at least $100 for equipment and services relating to the project.
(e) From time to time, Falconbridge is involved in litigation, investigations or proceedings relating to claims arising out of its operations in the ordinary course of business. In the opinion of Falconbridge’s management, these claims and lawsuits in the aggregate will not have a material adverse effect on the consolidated financial statements.
89
19. RELATED-PARTY TRANSACTIONS
(a) Falconbridge’s ownership interest in the Noranda Income Fund was 25% during the year. Included in revenues are $9 (2004 – $7) representing the Company’s share of income from the Fund accounted for under the equity method.
Falconbridge has entered into a Supply and Processing Agreement and a Management Service Agreement with the Fund which have contracted Falconbridge to provide concentrate and services to the Fund on a regular basis (see Note 18). Falconbridge has sold $210 (2004 – $127) of concentrate to the Fund at terms in accordance with the Supply & Processing Agreement. As of December 31, 2005, Falconbridge has trade receivables of $36 (2004 – $16) from the Fund due to the concentrate sold. Falconbridge has also provided $65 (2004 – $61) of administration, management and operating services to the Fund at their negotiated value. As of December 31, 2005, Falconbridge has a receivable of $8 (2004 – $11) from the Fund due to the services provided. In addition, Falconbridge has made purchases of $35 (2004 – $29) of zinc metals and by-products from the Fund at terms that reflect exchange amounts. Falconbridge has sold metals and operating supplies of $3 (2004 – $5) to the Fund at terms that reflect market rates. Included in accounts payable as at December 31, 2005 is $11 (2004 – $8) of amounts due to the Fund. Included in accounts receivable as at December 2005 is $nil (2004 – $1) of amounts due from the Fund.
(b) Falconbridge has undertaken a number of transactions with Antamina in which Falconbridge has a 33.75% ownership interest. Included in raw material costs are purchases of concentrate of $260 (2004 – $159) from Antamina that are recorded at agreed upon exchange amounts. As of December 31, 2005, Falconbridge has a payable of $65 (2004 – $42) to Antamina.
(c) Falconbridge has undertaken a number of transactions with Gramercy in which Falconbridge has a 50% interest. Included in raw material costs are purchases of alumina of $136 (2004 – $14) from Gramercy that are recorded at agreed upon exchange amounts. As of December 31, 2005, Falconbridge has a payable of $6 (2004 – $2) to Gramercy.
(d) Falconbridge has undertaken a number of transactions with Collahuasi in which Falconbridge has a 44% interest. Included in raw material costs are purchases of copper cathode of $109 (2004 – $79) from Collahuasi that are recorded at agreed upon exchange amounts. As of December 31, 2005, Falconbridge has a payable of $25 (2004 – $19) to Collahuasi.
(e) Included in accounts receivable are loans receivable from officers of the Company in the amount of $2 (2004 – $3), secured by collateral that has market values in excess of cost for both years.
(f) Brookfield Asset Management Inc. (formerly Brascan Corporation “Brascan”), which was a major shareholder of the Company prior to the acquisition of the former Falconbridge, sold its ownership in the Company in August, 2005. The transactions of the Company with Brascan and its subsidiaries prior to the sale of its ownership were as follows:
Noranda Aluminum Inc. (“Aluminum”), a wholly-owned subsidiary of Falconbridge, entered into a power supply contract with Brascan Energy Marketing Inc. (“BEMI”), a wholly-owned subsidiary of Brascan, on June 1, 2003. Under the arrangement, BEMI is obliged to provide Aluminum’s New Madrid primary aluminum smelter up to 490 MW/h of electricity annually for a two-year period commencing June 1, 2003 at rates with a variable component based on market prices. Aluminum has purchased $52 (2004 – $127) of electricity under this contract. Upon completion of the contract on June 1, 2005, the contract was not renewed.
The Company has sold certain trade receivables to a securitization trust which is owned by Brascan Financial Corporation for a total of $4 (2004 – $315) in cash, under an agreement that came into effect in November 2003. The arrangement was terminated in October 2005.
Brascan Financial Corporation, a subsidiary of Brascan, provided the Company with a committed credit facility in the principal amount of Cdn$25 million with an expiry date of January 31, 2006. The facility was cancelled after Brascan sold its ownership in the Company in August, 2005.
The above transactions have been recorded at their exchange amounts.
20. EMPLOYEE FUTURE BENEFIT PLANS
Falconbridge has a number of defined benefit plans providing pension, health, dental and life insurance benefits to substantially all employees after one or two years of continuous service. Pension benefits are calculated based upon length of service and either final average earnings or a specific amount per year of service. Hourly employees are generally members of negotiated plans.
90
Defined benefit plan assets consist primarily of cash, equity securities and fixed-income securities. The defined benefit plan holds less than 1% of its assets in common shares of Falconbridge and its related parties.
Falconbridge’s funding policy is to contribute amounts sufficient to meet minimum funding requirements as set forth by the regulations of the appropriate jurisdictions plus such additional amounts as Falconbridge may determine to be appropriate.
The obligation for benefits and the benefits expenses under these plans is determined through periodic actuarial reports that are based on the following weighted average assumptions:
| | Pension Benefit Plans | | Other Benefit Plans | |
| | 2005 | | 2004 | | 2005 | | 2004 | |
Assumptions used to calculate benefit obligations: | | | | | | | | | |
Discount rate | | 5.00 | % | 5.75 | % | 5.01 | % | 5.75 | % |
Rate of compensation increase | | 3.75 | % | 3.61 | % | 3.50 | % | 3.67 | % |
| | | | | | | | | |
Assumptions used to calculate benefit expense: | | | | | | | | | |
Discount rate | | 5.75 | % | 6.25 | % | 5.75 | % | 6.25 | % |
Expected long-term rate of return on plan assets | | 7.00 | % | 7.19 | % | n/a | % | n/a | |
Rate of compensation increase | | 3.50 | % | 3.72 | % | 3.50 | % | 3.67 | % |
The cost of pension and other post-retirement benefits earned by employees is actuarially determined using the projected benefit method pro-rated on service and management’s best estimate of expected plan investment performance, salary escalation, retirement ages of employees and health care costs. Plan obligations are discounted using rates that reflect the market yields, as of the measurement date on high-quality debt instruments with cash flows that match expected benefit payments.
The health care cost trend rate is assumed to be the following:
| | 2005 | | 2004 | |
Initial medical trend rate | | 7.94 | % | 8.44 | % |
Ultimate medical trend rate | | 4.51 | % | 4.50 | % |
Number of years to reach trend rate | | 8 | | 9 | |
Initial and ultimate dental trend rate | | 4.00 | % | 4.00 | % |
In 2005, Falconbridge ratified new collective agreements at four of its operations. The impact of these agreements on the employee future benefit costs is nominal.
The funded status of Falconbridge’s post-employment benefit plans and net accrued benefit asset (obligation) are as follows:
Pension Benefits
As at December 31 | | 2005 | | 2004 | |
| | Plans | | Plans | | | | Plans | | Plans | | | |
| | where assets | | where benefit | | | | where assets | | where benefit | | | |
| | exceed benefit | | obligations | | | | exceed benefit | | obligations | | | |
| | obligations | | exceed assets | | Net | | obligations | | exceed assets | | Net | |
Plan assets | | $ | 966 | | $ | 1,145 | | $ | 2,111 | | $ | 947 | | $ | 921 | | $ | 1,868 | |
Benefit obligations | | 877 | | 1,415 | | 2,292 | | 833 | | 1,202 | | 2,035 | |
Excess (deficit) of plan assets over benefit obligations | | 89 | | (270 | ) | (181 | ) | 114 | | (281 | ) | (167 | ) |
Net accrued asset | | | | | | $ | 228 | | | | | | $ | 289 | |
| | | | | | | | | | | | | | | | | | | |
91
Other Benefit Plans
As at December 31 | | 2005 | | 2004 | |
| | Plans | | Plans | | | | Plans | | Plans | | | |
| | where assets | | where benefit | | | | where assets | | where benefit | | | |
| | exceed benefit | | obligations | | | | exceed benefit | | obligations | | | |
| | obligations | | exceed assets | | Net | | obligations | | exceed assets | | Net | |
Plan assets | | $ | 31 | | $ | — | | $ | 31 | | $ | 30 | | $ | — | | $ | 30 | |
Benefit obligations | | 27 | | 412 | | 439 | | 24 | | 349 | | 373 | |
Excess (deficit) of plan assets over benefit obligations | | 4 | | (412 | ) | (408 | ) | 6 | | (349 | ) | (343 | ) |
Net accrued liability | | | | | | $ | (330 | ) | | | | | $ | (277 | ) |
| | | | | | | | | | | | | | | | | | | |
The measurement date used for financial reporting purposes of the plan assets and benefit obligations is December 31, 2005. For material plans, the most recent actuarial valuations filed for funding purposes were prepared as of December 31, 2004. Although actuarial valuations are generally required every three years, some international and U.S. Plans have valuations every year.
The change in the funded status of Falconbridge’s post-employment benefit plans was as follows:
| | Pension Benefit Plans | | Other Benefit Plans | |
| | 2005 | | 2004 | | 2005 | | 2004 | |
Change in benefit obligation | | | | | | | | | |
Obligation at beginning of year | | $ | 2,035 | | $ | 1,764 | | $ | 373 | | $ | 325 | |
Current service | | 29 | | 26 | | 10 | | 8 | |
Benefits paid | | (141 | ) | (123 | ) | (21 | ) | (19 | ) |
Interest cost on benefit obligation | | 117 | | 108 | | 21 | | 20 | |
Plan amendments/Transitional obligations | | — | | 4 | | 10 | | — | |
Actuarial losses | | 195 | | 127 | | 33 | | 14 | |
Transfer to other plans | | 4 | | — | | — | | — | |
Effect of exchange rate change | | 54 | | 128 | | 14 | | 25 | |
Increase (decrease) due to curtailment/settlement | | (1 | ) | 1 | | (1 | ) | — | |
Obligation at end of year | | $ | 2,292 | | $ | 2,035 | | $ | 439 | | $ | 373 | |
Change in plan assets | | | | | | | | | |
Fair value of assets at beginning of year | | $ | 1,868 | | $ | 1,603 | | $ | 30 | | $ | 25 | |
Employer and participant contributions | | 101 | | 107 | | 19 | | 20 | |
Benefits paid | | (141 | ) | (123 | ) | (21 | ) | (19 | ) |
Surplus paid out to employer | | (3 | ) | (2 | ) | — | | — | |
Return on plan assets | | 224 | | 167 | | 2 | | 1 | |
Transfer from other plans | | 9 | | — | | — | | — | |
Effect of exchange rate change | | 53 | | 116 | | 1 | | 3 | |
Fair value assets at end of year | | $ | 2,111 | | $ | 1,868 | | $ | 31 | | $ | 30 | |
Deficit status of plan at end of year | | $ | (181 | ) | $ | (167 | ) | $ | (408 | ) | $ | (343 | ) |
Unamortized: | | | | | | | | | |
Past service costs | | 10 | | 22 | | (2 | ) | (3 | ) |
Transitional asset/obligation | | — | | — | | 10 | | — | |
Net actuarial losses | | 399 | | 434 | | 70 | | 69 | |
Accrued benefit asset (liability), net of valuation allowance | | $ | 228 | | $ | 289 | | $ | (330 | ) | $ | (277 | ) |
92
Past service costs resulting from plan amendments are amortized over the remaining average service life of active employees. Past service costs from negotiated plan improvements are amortized over the term of the collective agreement.
For most plans, the net actuarial gain (loss) that exceeds 10% of the greater of the benefit obligation and the value of plan assets is amortized over the remaining service period of active employees.
Accrued post-retirement benefits asset (liability) is recorded in pension and other provisions. Falconbridge’s post-employment benefit expense included the following components:
| | Pension Benefit Plans | | Other Benefit Plans | |
| | 2005 | | 2004 | | 2005 | | 2004 | |
Current year expense | | | | | | | | | |
Current service | | $ | 29 | | $ | 26 | | $ | 10 | | $ | 8 | |
Interest cost on on benefit obligation | | 117 | | 108 | | 21 | | 20 | |
Expected return on plan assets | | (133 | ) | (114 | ) | (2 | ) | (1 | ) |
Amortization of: | | | | | | | | | |
Past service costs | | 9 | | 9 | | — | | — | |
Net actuarial losses | | 19 | | 17 | | 2 | | 3 | |
Valuation allowance | | — | | (5 | ) | — | | — | |
Defined benefit expense | | $ | 41 | | $ | 41 | | $ | 31 | | $ | 30 | |
Defined contribution expense | | 15 | | 12 | | — | | — | |
Total expense | | $ | 56 | | $ | 53 | | $ | 31 | | $ | 30 | |
| | Pension Benefit Plans | | Other Benefit Plans | |
| | 2005 | | 2004 | | 2005 | | 2004 | |
Reconciliation of defined benefit expense recognized with defined benefits expense incurred: | | | | | | | | | |
Total defined benefit expense recognized | | $ | 41 | | $ | 41 | | $ | 31 | | $ | 30 | |
Difference between: | | | | | | | | | |
Expected and actuarial return on plan assets | | (91 | ) | (53 | ) | — | | — | |
Actuarial losses (gains) amortized and arising | | 176 | | 111 | | 31 | | 12 | |
Past service costs amortized and arising | | (9 | ) | (5 | ) | — | | — | |
Transitional obligation amortized and arising | | — | | — | | 10 | | — | |
Change in valuation allowance | | — | | 5 | | — | | — | |
Total defined benefit expense incurred | | $ | 117 | | $ | 99 | | $ | 72 | | $ | 42 | |
In 2002 and 2003, Falconbridge offered certain groups of employees the opportunity to switch from the current defined benefit plan to a defined contribution plan. Pension assets of $22 were allocated from the defined benefit plan to the defined contribution plan. Regulatory approval was received and the asset transfer was completed in 2005.
| | 2005 | | 2004 | |
Effect of 1% increase in assumed health care cost trend rates | | | | | |
Total of service and interest cost components | | $ | 3 | | $ | 3 | |
Post-retirement benefit obligation | | 39 | | 40 | |
Effect of 1% decrease in assumed health care cost trend rates | | | | | |
Total of service and interest cost components | | (2 | ) | (2 | ) |
Post-retirement benefit obligation | | (31 | ) | (33 | ) |
| | | | | | | |
93
The expected rate of return on plan assets assumption is reviewed annually by management. The assumption is based on expected returns for the various asset classes, weighted by the portfolio allocation. Anticipated future long-term performance of individual asset categories is considered, reflecting expected future inflation and real yields on fixed income securities and equities.
| | Pension Benefit Plans | | Other Benefit Plans | |
| | 2005 | | 2004 | | 2005 | | 2004 | |
Actual asset allocation: | | | | | | | | | |
Equity securities | | 51 | % | 53 | % | — | | — | |
Debt securities | | 48 | % | 47 | % | 100 | % | 100 | % |
Other | | 1 | % | — | | — | | — | |
Total | | 100 | % | 100 | % | 100 | % | 100 | % |
| | | | | | | | | |
Target asset allocation: | | | | | | | | | |
Equity securities | | 54 | % | 56 | % | — | | — | |
Debt securities | | 46 | % | 44 | % | 100 | % | 100 | % |
Other | | — | | — | | — | | — | |
Total | | 100 | % | 100 | % | 100 | % | 100 | % |
CASH FLOWS
Falconbridge made cash contributions during the year of $116 to pension benefit plans and $19 to other benefit plans.
Our best estimate of the amounts we expect to contribute for the year ending December 31, 2006 is $104 for pension benefit plans and $23 for other benefit plans.
The projected benefit payments from the pension benefit plans and other benefit plans in the next 10 years are estimated as follows:
| | Pension Benefit Plans | | Other Benefit Plans | |
Benefit payment projections: | | | | | |
2006 | | $ | 140 | | $ | 24 | |
2007 | | $ | 139 | | $ | 26 | |
2008 | | $ | 139 | | $ | 28 | |
2009 | | $ | 140 | | $ | 29 | |
2010 | | $ | 141 | | $ | 31 | |
2011 to 2015 | | $ | 715 | | $ | 176 | |
94
21. SEGMENTED INFORMATION
Falconbridge has four operating segments: Copper, Nickel, Zinc and Aluminum. Inter-segment sales and purchases are made at market prices and trade terms. Operations and identifiable assets by operating and geographic segment are presented below:
(a) Operating Segments
Year ended December 31, 2005 | | Copper | | Nickel | | Zinc | | Aluminum | | Other | | Total | |
Revenues | | $ | 4,421 | | $ | 2,146 | | $ | 504 | | $ | 1,077 | | $ | — | | $ | 8,148 | |
Operating expenses | | | | | | | | | | | | | |
Mining, processing and refining costs | | 993 | | 810 | | 168 | | 583 | | (16 | ) | 2,538 | |
Purchased raw materials | | 2,082 | | 574 | | 243 | | 335 | | 1 | | 3,235 | |
Depreciation, amortization and accretion | | 260 | | 165 | | 33 | | 53 | | 44 | | 555 | |
| | 3,335 | | 1,549 | | 444 | | 971 | | 29 | | 6,328 | |
Income (loss) generated by operating assets | | $ | 1,086 | | $ | 597 | | $ | 60 | | $ | 106 | | $ | (29 | ) | $ | 1,820 | |
Interest expense, net | | | | | | | | | | | | (152 | ) |
Corporate and general administration | | | | | | | | | | | | (80 | ) |
Research, development and exploration | | | | | | | | | | | | (59 | ) |
Minority interest in earnings of subsidiaries | | | | | | | | | | | | (155 | ) |
Income before undernoted | | | | | | | | | | | | $ | 1,374 | |
Other income | | | | | | | | | | | | 17 | |
Tax expense | | | | | | | | | | | | (511 | ) |
Net income from continuing operations | | | | | | | | | | | | $ | 880 | |
Loss on discontinued operations, net of tax | | | | | | | | | | | | (8 | ) |
Net income | | | | | | | | | | | | $ | 872 | |
Total assets, excluding cash and cash equivalents | | $ | 6,087 | | $ | 3,316 | | $ | 385 | | $ | 1,044 | | $ | 700 | | $ | 11,532 | |
Capital investments | | $ | 258 | | $ | 367 | | $ | 21 | | $ | 56 | | $ | 35 | | $ | 737 | |
Year ended December 31, 2004 | | Copper | | Nickel | | Zinc | | Aluminum | | Other | | Total | |
Revenues | | $ | 3,592 | | $ | 1,824 | | $ | 415 | | $ | 935 | | $ | (2 | ) | $ | 6,764 | |
Operating expenses | | | | | | | | | | | | | |
Mining, processing and refining costs | | 803 | | 604 | | 158 | | 420 | | (9 | ) | 1,976 | |
Purchased raw materials | | 1,882 | | 447 | | 187 | | 388 | | — | | 2,904 | |
Depreciation, amortization and accretion | | 234 | | 136 | | 56 | | 38 | | 29 | | 493 | |
| | 2,919 | | 1,187 | | 401 | | 846 | | 20 | | 5,373 | |
Income (loss) generated by operating assets | | $ | 673 | | $ | 637 | | $ | 14 | | $ | 89 | | $ | (22 | ) | $ | 1,391 | |
Interest expense, net | | | | | | | | | | | | (120 | ) |
Corporate and general administration | | | | | | | | | | | | (66 | ) |
Research, development and exploration | | | | | | | | | | | | (47 | ) |
Minority interest in earnings of subsidiaries | | | | | | | | | | | | (297 | ) |
Income before undernoted | | | | | | | | | | | | $ | 861 | |
Other income | | | | | | | | | | | | 84 | |
Tax expense | | | | | | | | | | | | (351 | ) |
Net income from continuing operations | | | | | | | | | | | | $ | 594 | |
Loss on discontinued operations, net of tax | | | | | | | | | | | | (73 | ) |
Net income | | | | | | | | | | | | $ | 521 | |
Total assets, excluding cash and cash equivalents | | $ | 4,544 | | $ | 2,015 | | $ | 400 | | $ | 1,003 | | $ | 782 | | $ | 8,744 | |
Capital investments | | $ | 285 | | $ | 316 | | $ | 5 | | $ | 32 | | $ | 28 | | $ | 666 | |
95
(b) Geographic Segments
| | Revenues | | Capital assets | |
| | 2005 | | 2004 | | 2005 | | 2004 | |
| | | | | | | | | |
Canada | – Domestic | | $ | 1,282 | | $ | 1,107 | | $ | — | | $ | — | |
| – Export | | 2,267 | | 1,997 | | — | | — | |
Canada | | $ | 3,549 | | $ | 3,104 | | $ | 3,521 | | $ | 2,619 | |
United States | | 1,519 | | 1,345 | | 706 | | 706 | |
Chile | | 1,576 | | 1,308 | | 2,814 | | 1,529 | |
Peru | | 490 | | 270 | | 643 | | 669 | |
Other | | 1,014 | | 737 | | 826 | | 513 | |
Total | | $ | 8,148 | | $ | 6,764 | | $ | 8,510 | | $ | 6,036 | |
22. SIGNIFICANT DIFFERENCES FROM UNITED STATES ACCOUNTING PRINCIPLES
These consolidated financial statements have been prepared in accordance with Canadian generally accepted accounting principles (“Canadian GAAP”). Canadian GAAP varies in certain significant respects from the principles and practices generally accepted in the United States (“U.S. GAAP”).The effect of these principal differences on the Company’s financial statements is quantified below and described in the accompanying notes.
Years ended December 31 (US$ millions, except per share amounts) | | 2005 | | 2004 | |
| | | | Restated (b) | |
Net income – Canadian GAAP | | $ | 872 | | $ | 521 | |
Adjustment of certain financial instruments to market (c) | | 6 | | (11 | ) |
Start-up costs and exploration (d) | | (91 | ) | (94 | ) |
Amortization of start-up costs and exploration (d) | | 6 | | 7 | |
Pensions and post-employment benefits (f) | | 2 | | (2 | ) |
Stock options (e) | | (2 | ) | (1 | ) |
Interest expense (b) (l) | | 13 | | 11 | |
Purchase accounting (m) | | 9 | | — | |
Foreign exchange difference (n) | | (10 | ) | 11 | |
Tax effecting of adjustments | | 28 | | 26 | |
Net income – U.S. GAAP | | $ | 833 | | $ | 468 | |
Net income per share reported under U.S. GAAP ($ per share): | | | | | |
Basic earnings per share | | $ | 2.34 | | $ | 1.50 | |
Diluted earnings per share | | $ | 2.32 | | $ | 1.48 | |
Retained earnings (deficit) under U.S. GAAP: | | | | | |
Balance, beginning of year | | $ | 80 | | $ | (258 | ) |
Income | | 833 | | 468 | |
Dividends: | | | | | |
Common | | (133 | ) | (110 | ) |
Preferred | | (25 | ) | (20 | ) |
Other (Note 12) | | (809 | ) | — | |
Balance, end of year | | $ | (54 | ) | $ | 80 | |
96
STATEMENTS OF COMPREHENSIVE INCOME
Years ended December 31 | | 2005 | | 2004 | |
| | | | Restated (b) | |
Net income under U.S. GAAP | | $ | 833 | | $ | 468 | |
Other comprehensive income (loss): (a) | | | | | |
Foreign currency translation adjustments (g) (n) | | (2 | ) | 19 | |
Unrealized gains (loss) on long-term investments (h) | | 7 | | 1 | |
Derivative financial instruments: (c) | | | | | |
Net amount reclassified into earnings | | (60 | ) | (52 | ) |
Net changes associated with current period hedging | | — | | 27 | |
Minimum additional pension liability adjustment (i) | | 95 | | (19 | ) |
Tax effect of adjustments on comprehensive loss | | (11 | ) | 10 | |
Other comprehensive income (loss) – U.S. GAAP (a) | | $ | 29 | | $ | (14 | ) |
Comprehensive income under U.S. GAAP (a) | | $ | 862 | | $ | 454 | |
(a) Comprehensive income is measured in accordance with Statement of Financial Accounting Standards (“FAS”) No. 130, Reporting Comprehensive Income. This standard defines comprehensive income as all changes in equity other than those resulting from investments byowners and distributions to owners. Comprehensive income is comprised of net earnings and other comprehensive income where other comprehensive income (“OCI”) is the change in equity during the period that arises from transactions and other events that are related to non-owner sources. The concept of comprehensive income does not exist under Canadian GAAP.
(b) Effective January 1, 2005, Falconbridge retroactively adopted the amended standard CICA 3860 Financial Instruments – Presentation and Disclosure. Further disclosure regarding the convertible debentures is presented in Notes 2 (a) and 11.
Under U.S. GAAP, the entire amount of interest payments on the convertible debentures is accounted for as interest expense. Comparative figures for the year ended December 31, 2004 have been adjusted to reflect this change in accounting policy under Canadian GAAP.
(c) Under Canadian GAAP, certain financial instruments qualify as a hedge for accounting purposes and therefore gains and losses on these contracts are recognized in revenue at the time the anticipated cash flows are realized. U.S. GAAP, specifically under FAS No. 133 Accounting for Derivative Instruments and Hedging Activities and No. 138 Accounting for Certain Derivative Instruments and Hedging Activities (together, “FAS 133”), requires a company to recognize all of its derivative instruments, whether designated in hedging relationships or not, on the balance sheet at fair value. The accounting for changes in the fair value (i.e. gains or losses) of a derivative instrument depends on whether it has been designated and qualifies as part of a hedging relationship. For derivatives designated as fair value hedges, the effective portion of the change in the fair value of the derivative is offset by changes in the fair value of its hedged item. For cash flow hedges and hedges of the net investment in self-sustaining operations, the effective portion of the changes in the fair value of the derivative is accumulated in OCI and then is released from OCI and included in income when the hedged item affects earnings. All other derivatives are carried at fair value. FAS 133 establishes certain criteria to be met in order to designate a derivative instrument as a hedge and to deem a hedge as effective.
(i) Fair Value Hedges: Falconbridge has chosen to designate its fixed forward price hedges and certain interest rate swaps as fair value hedges. These hedging instruments were effective during 2005 and 2004.
(ii) Cash Flow Hedges: Falconbridge has chosen to designate its foreign currency-denominated expenditure hedges as cash flow hedges. No ineffectiveness to these hedging instruments was incurred during 2005 and 2004. At December 31, 2005, the Company does not expect to reclassify any amount of net losses (2004 – $55) on derivative instruments from accumulated OCI to earnings during the next 12 months according to contract settlement dates.
97
(iii) Hedges of Foreign Net Assets: During the year ended December 31, 2005, the Company recognized a net loss of $5 (2004 – $6), included in other comprehensive income, related to the forward foreign exchange contracts and foreign-denominated fixed-rate debt.
(iv) Other Hedges: For all other derivative instruments, Falconbridge has chosen not to designate them as hedging instruments.
(d) Under Canadian GAAP, Falconbridge capitalizes exploration costs when sufficient pre-feasibility work indicates that future mine production is reasonably certain and capitalizes costs incurred during the start-up phase of a project until commercial production commences. Under U.S. GAAP, exploration costs cannot be capitalized until the Company has objective reasonable assurance as to their recovery, generally upon receipt of a bankable feasibility study. Statement of Position 98-5 requires start-up costs to be expensed as incurred. As a result of the differences in the carrying amount of capital assets under Canadian and U.S. GAAP, there are differences in depreciation expense in subsequent periods. Further, a difference in depreciation expense arises due to the earlier commencement of depreciation under U.S. GAAP.
(e) Effective January 1, 2002, Falconbridge prospectively adopted FAS No. 123 Accounting for Stock-based Compensation whereby compensation expense for options granted or modified after January 1, 2002 is measured at fair value at the grant date or modification date using the Black- Scholes valuation model and recognized over the remaining vesting period of the options granted or modified.
Prior to June 30, 2002, Falconbridge’s stock option plan allowed for, at the option of the holder, the exercise of the employee’s vested option whereby the difference between the grant price and the market price is paid on exercise by the Company, with no increase in the capital stock issued. Under U.S. GAAP, such a feature requires the mark-to-market obligation to be recognized through the income statement of the Company.
On June 30, 2002, Falconbridge’s stock option plan was modified to remove the cash settlement feature. As a result, under U.S. GAAP additional compensation expense is being recognized over the remaining vesting period of these modified options to the extent that the fair value of the options outstanding on the modification date exceeded the previously recorded compensation expense of these options.
Under Canadian GAAP, there is no requirement to account for options that contain a cash settlement feature when the cash settlement feature is removed by June 30, 2002.
(f) Under Canadian GAAP, when a defined benefit plan gives rise to an accrued benefit asset, a company must recognize a valuation allowance for the excess of the adjusted benefit asset over the expected future benefit to be realized from the plan asset. U.S. GAAP does not provide for a valuation allowance against pension assets. As a result, a difference between U.S. and Canadian GAAP has been recorded for the effects of recognizing a pension valuation allowance and changes therein under Canadian GAAP. Further differences result from the different transition rules and timing of the adoption of the current U.S. and Canadian standards for post-employment costs.
(g) Under U.S. GAAP, foreign exchange gains and losses on translation of self-sustaining foreign operations are recorded in OCI. Under Canadian GAAP, such gains and losses are included as a separate component of shareholders’ equity referred to as cumulative translation adjustment.
(h) U.S. GAAP requires that certain long-term investments not held for trading be recorded at fair value, with unrealized holding gains and losses excluded from the determination of earnings and reported as a separate component of OCI.
(i) U.S. GAAP requires the recognition of an additional minimum pension liability in the amount of the excess of the Company’s unfunded accumulated benefits obligation over the recorded pension benefits liability. An offsetting intangible pension asset is recorded no greater than the unrecognized prior service costs, with any difference recorded as a reduction in accumulated OCI.
(j) U.S. GAAP requires investments in joint ventures to be accounted for under the equity method, while under Canadian GAAP, the accounts of joint ventures are proportionately consolidated. However, under rules promulgated by the Securities and Exchange Commission, a foreign registrant may, subject to the provision of additional information, continue to follow proportionate consolidation for the purposes of registration and other filings notwithstanding the departure from U.S. GAAP. A joint venture is qualified for the accommodation if it is an operating entity, the significant financial operating policies of which are, by contractual arrangement, jointly controlled by all parties having an equity interest in the entity. The joint ventures that the Company has
98
proportionately consolidated for the reporting periods are Antamina, Collahuasi, Magnesium, Louvicourt, and Gramercy. All of the Company’s joint ventures qualify for the accommodation as their significant financial operating policies are, by contractual arrangement, jointly controlled by all parties having an equity interest in the entity. Consequently, the consolidated balance sheets, statements of income, and cash flow statements have not been adjusted to restate the accounting for these joint ventures under U.S. GAAP.
If the Company was not granted the accommodation, the equity accounting method would be used to account for the investment in Antamina, Collahuasi, Louvicourt, Magnesium and Gramercy. Compared to proportionate consolidation, equity accounting would result in no impact to the net income reported in the U.S. GAAP income statement reconciliation. In terms of the U.S. GAAP balance sheet, each item on the balance sheet would be adjusted to exclude the Company’s share of these joint-ventures’ assets and liabilities. Included in investments and other assets would be the Company’s share of the joint-ventures’ net assets. The U.S. GAAP cash flow statement would need to be adjusted to correspond with the adjustments on the balance sheet.
Additional information concerning the Company’s interests in these five joint ventures is presented in Note 6, including the Company’s share of the assets, liabilities and equities, revenues, expenses and cash flows for the years ended December 31, 2005, and 2004.
(k) U.S. GAAP does not permit the subtotal of cash from operations before net changes in non-cash working capital.
(l) Under Canadian GAAP, capital stock redeemable at the option of the holder must be recognized as debt and the related dividend payments are recognized as interest expense. Under U.S. GAAP, only capital stock that is mandatorily redeemable for assets of the Company must be recognized as a debt. Since the Company does not have an unconditional obligation to redeem Preferred Shares Series H for assets of the Company (note 12), the Preferred Shares Series H have been classified as equity under U.S. GAAP and dividend payments on the Preferred Shares Series H have been recognized as a reduction in retained earnings.
Since Preferred Shares Series H is denominated in Canadian dollars, its redeemable value is determined by the foreign exchange rate at the end of the reporting period and is subject to changes at different reporting periods. Under U.S. GAAP, the change in its redeemable value from foreign exchange translation is amortized directly to the retained earnings over the period to the earliest redemption date. As the Preferred Shares Series H is considered a liability under Canadian GAAP, changes in value resulting from fluctuations in foreign exchange rates are recognized immediately into income.
(m) Under U.S. GAAP, the book values of the net assets acquired from the business combination as mentioned in Note 3 are different from their book values under Canadian GAAP. The difference in book values arose from the historical accounting differences between U.S. GAAP and Canadian GAAP for the acquired company prior to the business combination. While the preliminary fair values of the assets acquired and liabilities assumed from the business combination are the same under both U.S. GAAP and Canadian GAAP, the difference in their book values results in a difference in preliminary fair value increments allocated to the assets and liabilities under U.S. GAAP and Canadian GAAP. The difference in fair value increments under U.S. and Canadian GAAP creates a reduction of $4 in mining, processing and refining costs and a reduction of $5 in interest expense under U.S. GAAP after the business combination.
(n) Under Canadian GAAP, a gain or loss equivalent to a proportionate amount of the exchange gains and losses accumulated in the foreign cumulative translation adjustment is recognized into income when there has been a reduction in the net investment which results from a reduction inthe equity of a foreign operation as a result of certain capital transactions, such as dividend distributions. Under U.S. GAAP, no gain or loss would be recognized unless substantially all of the investment was liquidated.
99
The following summarizes the adjustments to the Company’s balance sheets and cash flow statements in order to conform to U.S. GAAP.
BALANCE SHEET
Years ended December 31 | | 2005 | | 2004 | |
| | | | | | Restated (b) | |
| | Canadian | | United States | | Canadian | | United States | |
| | GAAP | | GAAP | | GAAP | | GAAP | |
| | | | | | | | | |
Assets | | | | | | | | | |
Accounts receivable (c) (m) | | $ | 1,007 | | $ | 1,023 | | $ | 948 | | $ | 979 | |
Investments and other assets (c) (h) | | 307 | | 315 | | 324 | | 381 | |
Capital assets (d) (m) | | 8,510 | | 8,170 | | 6,036 | | 5,614 | |
| | | | | | | | | |
Liabilities | | | | | | | | | |
Accounts and taxes payable (c) (m) | | 1,691 | | 1,724 | | 1,265 | | 1,338 | |
Long-term debt (b) (c) (l) (m) | | 3,474 | | 3,359 | | 2,858 | | 2,743 | |
Deferred credits (c) (f) (m) | | 659 | | 753 | | 595 | | 791 | |
Future income tax liability (m) | | 1,156 | | 969 | | 304 | | 138 | |
Minority interest in subsidiaries | | 54 | | 51 | | 1,197 | | 1,028 | |
| | | | | | | | | |
Shareholders’ equity | | | | | | | | | |
Retained earnings (deficit) | | 154 | | (54 | ) | 231 | | 80 | |
Capital stock (e) (l) | | 4,600 | | 4,747 | | 2,306 | | 2,440 | |
Equity element of convertible debentures (b) | | 37 | | — | | 42 | | — | |
Currency translation adjustment (g) | | 240 | | — | | 263 | | — | |
Accumulated other comprehensive income | | — | | 198 | | — | | 169 | |
| | | | | | | | | | | | | |
CASH FLOW STATEMENT
Years ended December 31 | | 2005 | | 2004 | |
| | Canadian | | United States | | Canadian | | United States | |
| | GAAP | | GAAP | | GAAP | | GAAP | |
Operating activities | | $ | 1,635 | | $ | 1,552 | | $ | 1,184 | | $ | 1,089 | |
Investment activities | | (671 | ) | (580 | ) | (555 | ) | (460 | ) |
Financing activities | | (962 | ) | (970 | ) | (246 | ) | (246 | ) |
Cash and cash equivalents, beginning of year | | 884 | | 884 | | 501 | | 501 | |
Cash and cash equivalents, end of year | | 886 | | 886 | | 884 | | 884 | |
| | | | | | | | | | | | | |
IMPENDING ACCOUNTING CHANGES
Canadian GAAP
In January 2005, the CICA approved Handbook Sections 1530, Comprehensive Income, 3855, Financial Instruments – Recognition and Measurement 3865, Hedges, and 3251, Equity which will become effective for the Company beginning January 1, 2007. These standards will increase harmonization with U.S. and International accounting standards.
The standards require that all financial assets be classified as trading, available for sale, held to maturity, or loans and receivables. In addition, the standards require that all financial assets,including all derivatives, be measured at fair value with the exception of loans, receivables and investments intended to be held to maturity, which should be measured at amortized cost.
Changes in the fair value of trading securities will continue to be reported in earnings, while changes in the fair value of available-for-sale securities will be reported within other comprehensive income, until the financial asset is disposed of, or becomes impaired.
100
Similarly, the standards require that all financial liabilities be measured at fair value when they are held for trading or are derivatives. Other financial liabilities should be measured at cost.
The standards permit an entity to designate any financial instrument, on initial recognition, as one that it will measure at fair value with gains and losses recognized in net income in the period in which they arise.
Derivatives will be classified as trading, unless they are specifically designated within an effective hedge relationship. The standards permit three types of hedge relationships: fair value hedges, cash flow hedges, and hedges of net investments in
self-sustaining foreign operations. For fair value hedges, the effective portion of changes in the fair value derivative instruments is offset in earnings against the changes in fair value of derivative instruments is offset in earnings against the changes in fair value, attributed to the risk being hedged in the underlying asset, liability or firm commitment. For cash flow hedges, and hedges of net investments in self-sustaining foreign operations, the effective portion of changes in fair value of derivative instruments is offset through other comprehensive income, until the variability in cash flows being hedged is recognized in earnings in future accounting periods or upon de-recognition of the net investment. Where a derivative instrument is designated as a hedge and meets the criteria for hedge effectiveness, earnings offset is available, but only to the extent that the hedge is effective. Any ineffectiveness in a hedge relationship will be recognized in current earnings.
Other comprehensive income will be included on the consolidated balance sheets as a separate component of shareholders’ equity (net of tax), and will include net unrealized gains on available-for-sale securities, net unrealized gains on derivative instruments designated within an effective cash flow hedge, and unrealized foreign currency translation gains and losses and offsetting hedges on self-sustaining foreign operations. The Company is presently evaluating the impact of these new standards.
U.S. GAAP
In 2002, the Company adopted FAS 123 on a prospective basis. In December 2004, the FASB issued SFAS 123 (revised 2004), Share-Based Payment (SFAS 123-R), which replaces the existing SFAS 123, Accounting for Stock-Based Compensation and supersedes Accounting Principles Board (APB) 25, Accounting for Stock Issued to Employees. SFAS 123-R requires companies to measure and record compensation expense for stock options and other share-based payments based on the instrument’s fair value on the grant date. The cost of the award must be recognized in the consolidated statements of operations over the vesting period of the award.
In November 2004, the FASB issued SFAS 151, Inventory Costs – an Amendment of ARB No. 43, Chapter 4. This standard provides clarification that abnormal amounts of idle facility expense, freight handling costs, and spoilage should be recognized as current-period charges.
In March 2005, the FASB ratified the consensus in EITF 04-06 which concludes that a mining company’s costs incurred during production for the removal of overburden and waste material from a mine, in order that the underlying mineral deposit may be extracted (production-related stripping costs), should be considered variable production costs included in the costs of the inventory produced during the period that the stripping costs are incurred. EITF 04-06 does not address the accounting for stripping costs incurred during the pre-production phase of a mine. As is current general practice, those costs may continue to be accounted for as mine development expenditures subject to capitalization and amortization over the life of the mineral deposit benefited from the expenditure.
The above U.S. GAAP standards are effective for the Company beginning January 1, 2006. The Company is presently evaluating the impact of these new standards.
23. SUBSEQUENT EVENT
The Company announced on March 16, 2006 that it intends to redeem a total of 20,000,000, or $500, of its outstanding junior preference shares. The junior preference shares will be redeemed on April 16, 2006 from holders of record on March 22, 2006. The Company intends to utilize its internal cash resources to fund the redemption.
101
Management’s Discussion & Analysis
The following analysis and discussion of the Company’s activities take into account management’s knowledge of all material facts and events up to and including February 22, 2006. Unless otherwise noted, all amounts in this discussion are expressed in U.S. dollars. The 2004 financial results, as presented in this discussion, represent the consolidated results of “Noranda Inc.”, which was renamed “Falconbridge Limited” after the amalgamation of Noranda and the former Falconbridge on June 30, 2005. The 2005 financial results, and the balance of this discussion, represent the results and activities of Falconbridge Limited, the amalgamated company.
Additional information on Falconbridge, including Falconbridge’s Annual Information Form, is available on SEDAR at www.sedar.com.
CORPORATE OVERVIEW
Falconbridge Limited is a global integrated copper and nickel producer with investments in integrated zinc and aluminum assets. The Company employs approximately 14,500 people at its operations and offices in 18 countries and is listed on the Toronto Stock Exchange (FAL.LV) and the New York Stock Exchange (FAL).
Falconbridge’s goal is to deliver superior returns to shareholders by owning, developing and efficiently managing fully-integrated copper and nickel operations, and opportunistically investing in zinc, aluminum and other mining and metals processing activities. Falconbridge is focused on aggressively managing assets to maximize production, while minimizing invested capital.
CORPORATE DEVELOPMENTS
Merger of Noranda Inc. and Falconbridge Limited
In March 2005, as neither improved fundamentals for base metals nor improvements in Noranda Inc.’s operations were being reflected in the Company’s share price, Noranda announced an all-encompassing plan to combine Noranda and the former Falconbridge to create one of North America’s largest base-metals companies. This merger resolved the dual public ownership structure of Noranda and Falconbridge (Noranda held 59% of Falconbridge), and brought Noranda’s strategic alternatives review process to a close.
Prior to completing the merger, Noranda completed an issuer bid to exchange Noranda common shares for the new Noranda junior preferred shares on May 5, 2005. A total of 63,377,140 Noranda common shares were repurchased as a result of this offer and a total of 50,000,000 new Noranda junior preferred shares were issued as consideration.
On May 6, 2005, Noranda announced the results of its merger offer to former Falconbridge Limited minority common shareholders whereby it offered to exchange 1.77 Noranda common shares for each outstanding former Falconbridge common share that it did not own. Pursuant to the offer, 58,476,589 former Falconbridge common shares were tendered, representing 78% of the shares held by the minority shareholders, increasing Noranda’s ownership in former Falconbridge to 164,235,689, or 91% of the outstanding former Falconbridge common shares.
Noranda and former Falconbridge shareholders approved the amalgamation of the two companies on June 30, 2005. The amalgamated company chose to continue operating under the name Falconbridge Limited and effective July 6, 2005, began trading under a new stock symbol (TSX: FAL.LV and NYSE: FAL). The new Falconbridge, with a market capitalization of $10 billion, became a more widely held copper/nickel-focused mining and metals company with simplified governance, improved risk management, increased liquidity and greater financial strength and capacity.
Falconbridge Endorses Inco Offer
On October 11, 2005, Inco Limited announced an offer to acquire all outstanding common shares of Falconbridge. The offer was comprised of part cash and part Inco common shares, which when pro-rated subject to the maximum amounts offered would provide Cdn$7.50 and 0.524 Inco shares for each Falconbridge common share. Both Boards of Directors unanimously endorsed the acquisition offer and the Falconbridge Board recommended the Company’s shareholders tender their shares to the offer, which remains open for acceptance to June 30, 2006.
24
The combined organization, which would be known as Inco Limited, would be one of the world’s premier mining and metals companies. It would be the world’s largest producer of nickel and eighth-largest producer of copper, and would also operate integrated zinc and aluminum businesses. The new company would have one of the mining industry’s most attractive portfolios of low-cost, profitable growth projects. The new Inco would benefit from estimated annual synergies of approximately $350 million starting in late 2007.
Inco has obtained regulatory clearances from the Canadian Competition Bureau. It continues to proceed to meet all information and other requests from antitrust/competition authorities reviewing the pending acquisition and to work with the U.S. Department of Justice and competition authorities in Europe to obtain the remaining required regulatory clearances for the transaction.
Statements regarding the combination of Falconbridge and Inco are subject to various risks and assumptions. See “Forward-looking Information” on page 63.
KEY FACTORS AFFECTING OUR BUSINESS
Falconbridge’s business is international in scope and, in essence, is the production and marketing of base metal commodities and the by-products of those production processes and the treatment of custom feed materials. As a result, profitability and cash flows from operations are determined primarily by the price of the metals sold and the Company’s ability to produce at a low cost.
Prices and Markets
Historically, the Company has experienced and expects to continue to be subject to volatile commodity prices, which are influenced primarily by the world supply-demand balance for those commodity products and related processing services, and other related factors such as speculative activities by market participants, production activities by competitors, political and economic conditions, as well as production costs in major producing regions. The realized price for metals is also influenced by regional supply-demand factors, the availability and price of secondary or metal containing scrap materials, and other substitute commodity products. Falconbridge generally realizes prevailing market prices and does not hedge the price it realizes on the sale of its own production. A detailed analysis of relevant metal markets is discussed in “Metal Markets” on page 51.
Production Costs
The other primary determinant of profitability and cash flow from operations is the Company’s ability to produce at a low cost. Production costs are largely influenced by ore grades, mine planning, processing technology, energy and supply costs and the impact of exchange rate fluctuations on costs of operations.
Business Risks
The primary risks facing Falconbridge are:
• Fluctuating metal prices
• Mining and processing risks
• Environmental risks
• Labour relations
• Uncertainty of reserve and production estimates
• Exchange rate fluctuations
• Interest rate and counter-party risks
• Energy supply and prices
• Foreign operations
• Market access
• Production technology
• Legal proceedings
• Raw material procurement risks
The nature, implications and tools used to manage these risks are discussed in “Risk Factors” starting on page 58.
Capital
Falconbridge’s business is capital intensive with significant costs involved in exploration activities, and the development and maintenance of mining and metallurgical facilities. As such, securing low-cost capital is instrumental in profitability. Historically, Falconbridge has sourced capital from common and preferred equity markets, public debt markets and bank debt. A more detailed description of the Company’s use of interest rate and foreign currency management instruments is provided in “Financial Instruments and Other Instruments” on page 54.
25
SUPPLEMENTAL PERFORMANCE MEASURES
The Management Discussion and Analysis contains a number of measures that are not defined by generally accepted accounting principles (“GAAP”). The measures, as calculated by the Company, may not be comparable to similar measures presented by other issuers.
Income generated from operating assets is defined as follows: net income before interest expense, net; corporate and general administration; research, development and exploration; minority interest in earnings of subsidiaries; gain, net of restructuring costs and other; and tax expense. Since this measure captures the Company’s key revenues and operating expenses of assets currently in operation, income generated from operating assets is a key performance measurement that management uses to evaluate the performance of both individual assets and business units.
Net-debt-to-capitalization ratio is calculated as follows:
| | | | Dec. 31, | | Dec. 31, | |
($ millions) | | | | 2005 | | 2004 | |
Long-term debt | | | | $ | 3,474 | | $ | 2,858 | |
Debt due within one year | | | | 353 | | 570 | |
Cash and cash equivalents | | | | (886 | ) | (884 | ) |
Net debt | | (1) | | 2,941 | | 2,544 | |
Interests of other shareholders | | | | 54 | | 1,197 | |
Shareholders’ equity | | | | 5,031 | | 2,839 | |
Stockholders’ interests (equity) | | (2) | | 5,085 | | 4,036 | |
Total capitalization | | (3)=(1)+(2) | | 8,026 | | 6,580 | |
Net-debt-to-total-capitalization ratio | | (1)/(3) | | 36.7 | % | 38.7 | % |
| | | | | | | | | |
Management believes the presentation of this measure is relevant and useful for investors when assessing the Company’s liquidity and its ability for growth and investment. This measure should not be considered an alternative to liquidity as determined under generally accepted accounting principles.
Integrated cash cost or operating cash costs include all cash costs of operations and selling costs, net of processing credits and by-product credits, and are calculated as follows. Continuing costs incurred during shutdowns or strikes are excluded.
| | Copper (Integrated) | | Nickel (Mined) | | Zinc (Mined) | | Aluminum(1) (Integrated) | |
($ millions, except as noted) | | 2005 | | 2004 | | 2005 | | 2004 | | 2005 | | 2004 | | 2005 | | 2004 | |
| | | | | | | | | | | | | | | | | |
Mining, processing, and refining costs, as reported | | $ | 993 | | $ | 803 | | $ | 810 | | $ | 604 | | $ | 168 | | $ | 158 | | $ | 300 | | $ | 282 | |
Non-mining costs | | — | | — | | — | | — | | (47 | ) | (73 | ) | — | | — | |
By-product and processing credits | | (899 | ) | (613 | ) | (238 | ) | (206 | ) | (58 | ) | (68 | ) | (76 | ) | (76 | ) |
Processing fee on sale of concentrates | | 178 | | 125 | | — | | — | | 121 | | 127 | | — | | — | |
Purchases of raw materials | | — | | — | | — | | — | | — | | — | | 113 | | 103 | |
Other operating and non-cash costs | | 8 | | 36 | | 40 | | 117 | | 18 | | 72 | | 9 | | 12 | |
Cash costs – net | | 280 | | 351 | | 612 | | 515 | | 202 | | 216 | | 346 | | 321 | |
Volumes – 000s lbs.(2) | | 900,504 | | 921,900 | | 175,500 | | 176,030 | | 494,677 | | 684,530 | | 546,241 | | 548,900 | |
Cash cost per pound – $ | | 0.31 | | 0.38 | | 3.49 | | 2.93 | | 0.41 | | 0.32 | | 0.63 | | 0.58 | |
| | | | | | | | | | | | | | | | | | | | | | | | | |
(1). Represents Primary operations only: Aluminum segment cost of operations reported for 2005 totals $583 million (2004 – $420 million), which includes foil processing and other costs of $283 million (2004 – $138 million).
(2). Volumes as shown are based on production, except for Aluminum business, which represent shipments of primary aluminum.
26
Integrated cash costs are furnished to provide additional information about the cash generating capabilities of the Company’s business units and operations. Since this measure captures the key costs of operations and the impact of our processing credits and the prices of our by-products, it is a key performance measurement that management uses to evaluate our costs and operations. Integrated cash costs is not intended to be considered as an alternative to determining “mining, processing and refining costs” as determined under GAAP.
SELECTED ANNUAL INFORMATION
The analysis contained herein is based upon the financial position, results of operations and cash flows defined under Canadian Generally Accepted Accounting Principles. Unless otherwise noted, all amounts in this report are expressed in U.S. dollars.
($ millions, except per share data) | | 2005 | | 2004 | | 2003 | |
Results of operations | | | | | | | |
Revenues | | $ | 8,148 | | $ | 6,764 | | $ | 4,456 | |
Income generated by operating assets | | 1,820 | | 1,391 | | 409 | |
Net income from continuing operations | | 880 | | 594 | | 33 | |
Net income | | 872 | | 521 | | 2 | |
Net income (loss) per common share – basic | | | | | | | |
Continuing operations | | $ | 2.54 | | $ | 1.96 | | $ | 0.07 | |
Discontinued operations | | $ | (0.02 | ) | $ | (0.25 | ) | $ | (0.12 | ) |
Net income (loss) | | $ | 2.52 | | $ | 1.71 | | $ | (0.05 | ) |
Net income (loss) per common share – diluted | | | | | | | |
Continuing operations | | $ | 2.52 | | $ | 1.94 | | $ | 0.07 | |
Discontinued operations | | $ | (0.02 | ) | $ | (0.24 | ) | $ | (0.12 | ) |
Net income (loss) | | $ | 2.50 | | $ | 1.70 | | $ | (0.05 | ) |
| | | | | | | |
Cash flow | | | | | | | |
Cash flow from operating activities | | $ | 1,635 | | $ | 1,184 | | $ | 408 | |
Investment in growth projects | | 409 | | 432 | | 307 | |
Sustaining capital expenditures | | 328 | | 234 | | 182 | |
Dividends per common share | | Cdn$0.48 | | Cdn$0.48 | | Cdn$0.64 | |
| | | | | | | |
Financial position | | | | | | | |
Cash and short-term investments | | $ | 886 | | $ | 884 | | $ | 630 | |
Operating capital assets | | 6,803 | | 4,870 | | 4,765 | |
Development projects | | 1,707 | | 1,166 | | 973 | |
Total assets | | 12,418 | | 9,628 | | 8,351 | |
Long-term debt | | 3,474 | | 2,858 | | 2,975 | |
Shareholders’ equity | | 5,031 | | 2,839 | | 2,401 | |
Net-debt-to-capitalization ratio | | 37 | % | 39 | % | 47 | % |
Financial Impact of Merger of Noranda and Falconbridge
Prior to the merger of Noranda and Falconbridge, Noranda had consolidated the results of operations and the financial position of former Falconbridge in its financial statements reflecting its ownership of 58.5% of the common shares. On May 5, 2005, Noranda increased its ownership in Falconbridge to 90.8%, and to 100% on June 30, 2005 through the issuance of approximately $2.5 billion in common shares. Upon completion of the merger, the combined entity was renamed Falconbridge Limited.
27
The preliminary fair value of the 41.5% of the assets and liabilities acquired from former Falconbridge exceeds the book value of those assets by approximately $1.4 billion, which has been allocated to the assets and liabilities of the acquired assets at their respective preliminary fair values. The preliminary allocation of these values is as follows:
($ millions) | | | |
Preliminary fair value increment of assets acquired by the Company | | | |
Accounts receivable | | $ | 9 | |
Metals and other inventories | | 42 | |
Operating capital assets | | 1,966 | |
Development projects | | 255 | |
Investments and other assets | | (41 | ) |
| | | |
Preliminary fair value increment of liabilities assumed by the Company | | | |
Long-term debt | | 8 | |
Future income taxes | | (708 | ) |
Asset retirement obligation, pension and other provisions | | (114 | ) |
Net assets acquired | | $ | 1,417 | |
Book value of minority interest and other | | 1,117 | |
Acquisition value | | $ | 2,534 | |
FINANCIAL OVERVIEW
Falconbridge’s consolidated assets totaled $12.4 billion as at December 31, 2005 on a book-value basis compared with $9.6 billion at the end of 2004. The increase is primarily due to the acquisition of the common shares of the former Falconbridge Limited that the company did not already own, as discussed in Corporate Developments. Total revenues increased to $8.1 billion during 2005, an increase of $1.3 billion over the $6.8 billion in revenue generated in 2004, due to stronger metals prices and higher copper and nickel sales volumes. Falconbridge generated net income of $872 million, or $2.50 per share on a diluted basis, an increase of $351 million from the net income of $521 million, or $1.70 per share on a diluted basis in 2004. The improved results were mostly attributable to higher base metals prices, partially offset by the impact of a weaker U.S. dollar on operating costs at all Canadian and South American operations and increasing energy and supply costs throughout the operations.
Net income for 2005 includes a loss of $8 million, or $0.02 per basic share and $0.02 per diluted share from discontinued operations. This compares to a loss of $73 million, or $0.25 per basic share and $0.24 per diluted share from discontinued operations in 2004. Discontinued operations reflect the operating results of the Company’s custom wheel manufacturing operations prior to its disposal in June 2005 and the net gain recorded from its disposal.
At December 31, 2005, Falconbridge held cash and cash equivalents of $886 million. During 2005, Falconbridge’s consolidated net-debt-to-capitalization declined to 37% as cash generated from operations was utilized in part to reduce debt instruments issued to effect the reorganization of the Company. Cash resources, combined with undrawn credit facilities of over $1.6 billion, provide the Company with sufficient liquidity to pursue its development projects, new investment and development opportunities currently contemplated and repay near-term debt maturities.
28
OPERATING ASSETS
Of the $12.4 billion of assets, the book value of capital assets currently contributing to earnings totaled $6.8 billion, while projects under development which are not currently contributing to earnings totaled $1.7 billion. Combined, these assets represent 69% of the total asset base of the Company. Included in the $6.8 billion of operating assets is the $2 billion preliminary fair market value increment on the operating assets for the purchase accounting of acquisition of the former Falconbridge, as well as $77 million being transferred from projects under development to operating capital assets for the completion of the new Montcalm nickel/copper mine near Timmins, Ontario. The operating assets are distributed in the Company’s business segments as follows:
($ millions) | | 2005 | | 2004 | |
Operating capital assets | | | | | |
Copper | | $ | 3,807 | | $ | 2,890 | |
Nickel | | 2,114 | | 1,078 | |
Zinc | | 139 | | 158 | |
Aluminum | | 710 | | 702 | |
Other | | 33 | | 42 | |
Total | | $ | 6,803 | | $ | 4,870 | |
INTEGRATED OPERATIONS
As an integrated producer of metals, Falconbridge’s operations include mines and metallurgical facilities which provide the Company with maximum flexibility in both minimizing costs and maximizing operating performance by processing its own minerals. This integration also reduces the Company’s exposure to treatment-charge fluctuations and shipping-rate volatility.
When milling, smelting or refining capacity exceeds the Company’s own mine production, Falconbridge acquires third-party concentrates and secondary feeds to utilize this capacity and realize incremental treatment revenues. These treatment revenues provide incremental income to the Company and absorb fixed costs at metallurgical sites, with custom milling, smelting and refining operations being conducted throughout the Company as capacity allows. Operationsconducting custom feed processing of copper and nickel feeds are located in North and South America, and Norway. This integration allows Falconbridge to maintain what it believes to be someof the lowest cash cost operations in the industry. The flexibility of the processing facilities also enables the Company to treat complex ores, concentrates and secondary feeds. The Company also captures the sulphur content of the concentrates that it treats at its metallurgical sites and produces sulphuric acid as a marketable by-product. This by-product can provide incremental revenues that help reduce cash operating costs.
The price paid to suppliers of custom feeds varies with the prevailing price of the metals being treated and as such, Falconbridge’s exposure to increasing metals prices is primarily based upon its own mine production. Falconbridge’s continued focus on the identification and development of long-life, high-quality copper and nickel mining assets will continue to increase its leverage to copper and nickel while current metallurgical site infrastructure will minimize the investment required to bring new deposits into commercial production.
29
RESULTS OF OPERATIONS
($ millions, except per share information) | | | | | |
Years ended December 31 | | 2005 | | 2004 | |
Revenue | | $ | 8,148 | | $ | 6,764 | |
Operating expenses | | | | | |
Mining, processing and refining costs | | 2,538 | | 1,976 | |
Purchased raw materials | | 3,235 | | 2,904 | |
Depreciation, amortization and accretion | | 555 | | 493 | |
Total operating expenses | | 6,328 | | 5,373 | |
| | | | | |
Income generated by operating assets | | 1,820 | | 1,391 | |
Corporate costs(1) | | 291 | | 233 | |
Minority interest | | 155 | | 297 | |
Gain, net of restructuring costs and other | | (17 | ) | (84 | ) |
Taxes | | 511 | | 351 | |
Net income from continuing operations | | 880 | | 594 | |
Loss on discontinued operations, net of tax | | 8 | | 73 | |
Net income | | 872 | | 521 | |
Deduct | | | | | |
Preferred share dividends | | 17 | | 13 | |
Income available to common shareholders – basic | | 855 | | 508 | |
Impact of convertible debentures | | 9 | | 7 | |
Income available to common shareholders – diluted | | 864 | | 515 | |
Basic weighted average number of shares – 000s | | 339,756 | | 296,246 | |
Diluted weighted average number of shares – 000s | | 346,174 | | 303,458 | |
Net income per common share – basic | | | | | |
Continuing operations | | $ | 2.54 | | $ | 1.96 | |
Discontinued operations | | (0.02 | ) | (0.25 | ) |
Net income | | $ | 2.52 | | $ | 1.71 | |
Net income per common share – diluted | | | | | |
Continuing operations | | $ | 2.52 | | $ | 1.94 | |
Discontinued operations | | (0.02 | ) | (0.24 | ) |
Net income | | $ | 2.50 | | $ | 1.70 | |
(1). Corporate Costs include net interest, corporate and general administration, research and development and exploration costs.
Revenues
For 2005, total revenues increased to $8.1 billion from $6.8 billion for the year prior primarily due to the significant increase in realized metals prices. Copper reached a new historical high and zinc and aluminum also finished the year at multi-year highs. Average historical realized prices for copper, nickel, zinc and aluminum are as follows:
($ per pound) | | 2005 | | 2004 | | 2003 | |
Copper | | 1.71 | | 1.30 | | 0.82 | |
Nickel | | 6.85 | | 6.40 | | 4.40 | |
Zinc | | 0.70 | | 0.52 | | 0.43 | |
Aluminum | | 0.91 | | 0.84 | | 0.68 | |
Prices for by-product metals such as lead, molybdenum and precious metals, which are found and processed in conjunction with core metals, have also experienced similar price increases during these periods.
Sales volumes of refined copper, nickel and fabricated aluminum products were all higher in 2005 than 2004 levels. Due to the closure of the Bell Allard mine in October 2004, mined zinc sales volumes were lower in 2005. Bauxite and alumina sales to third parties increased as the Company recorded its first full year of joint ownership of the St. Ann and Gramercy operations since their acquisition in October 2004. The Company also recorded significantly higher molybdenum concentrate sales from the Antamina mine and produced its first molybdenum concentrate from the Collahuasi mine in the fourth quarter of 2005.
30
Operating Expenses
Operating expenses totaled $6.3 billion in 2005, 18% higher than $5.4 billion in the same period last year. Mining, processing and refining costs increased to $2.5 billion, a 28% increase from 2004 levels of $2.0 billion, largely due to the impact of a weaker U.S. dollar on operating costs at all Canadian and South American operations and increasing energy costs throughout the operations. Mining, processing and refining costs included $191 million of costs associated with the new operations at the new Montcalm mine and the acquired operations at St. Ann and Gramercy. The average value of the Canadian dollar increased 8% to US$0.83 versus US $0.77 during 2004. Upon completion of the acquisition of former Falconbridge minority shares, the carried value of inventory on hand was increased by $42 million to reflect its preliminary fair value, which is charged to income as the related inventory is sold. As a result, the increased cost reduces 2005 income by $42 million, lowering income in 2005 as a result of the acquisition.
The value of raw material purchases was $3,235 million, 11% higher than $2,904 million in 2004, due to higher metal prices and increased custom feed processing at the Nikkelverk nickel refinery and at all copper smelting and refining operations. Higher purchased raw material values are recovered at the time of sale of the metals contained in the materials treated.
Depreciation, amortization and accretion expense increased to $555 million from $493 million a year ago, with $21 million of the increase being attributable to the amortization of the preliminary fair value increment related to the purchase of the Falconbridge minority shareholders’ interest and the resulting increase in the book value of the mining and processing assets acquired. Depreciation, amortization and accretion expense also increased due to the addition of amortization expenses associated with the new operations at Montcalm and the acquired assets at St. Ann and Gramercy.
Income from Operating Assets and Net Income
Income generated by operating assets for 2005 was $1,820 million, 31% higher than $1,391 million in 2004. Income from operating assets increased 61% to $1,086 million in the copper business, decreased 6% to $597 million in the nickel business, increased to $60 million in the zinc business and increased 19% to $106 million in the aluminum business.
Interest expense increased to $152 million in 2005, an increase of 27% over $120 million in 2004, due mostly to the inclusion of dividends that were paid on the new junior preference shares that were issued in 2005, offset partially by lower average debt levels and interest rates below the levels of 2004. Interest expense included a one-time early redemption premium of $5 million paid to the holders at the time of the partial redemption of the junior preferred shares in August, 2005. Corporate and general administration costs as well as research and development costs increased from 2004 primarily due to strengthening of the Canadian dollar.
Minority interest in earnings of subsidiaries decreased to $155 million from $297 million, largely as a result of the elimination of the former Falconbridge minority share ownership since the completion of the merger on June 30, 2005.
In 2005, the Company also recorded a $17-million gain, net of restructuring costs and other, compared to $84 million in 2004. Included in the $84-million gain in 2004 was the $80-million gain on the settlement of an alumina supply contract upon acquisition of Gramercy alumina joint venture. Tax expenses recorded increased to $511 million from $351 million during 2005, due primarily to the increase in net income from continuing operations before taxes and minority interest to $1,546 million from $1,242 million.
Net income for the year ended December 31, 2005 was $872 million or $2.50 per common share on a diluted basis, compared with a net income of $521 million or $1.70 per common share on a diluted basis for 2004. The significant improvement in 2005 results is due to higher average realized prices for all four primary metals and strong operational performance from each business unit supported by improved by-product credits. Offsetting the impact of price increases and cost containment initiatives was the impact of rising energy costs and supply costs, combined with the further weakening of the U.S. dollar relative to both the Canadian dollar and Chilean peso, thereby increasing operating costs in those jurisdictions.
31
Copper Mine Life
(estimated years)

Note: Statements regarding estimated mine life are subject to risks and uncertainties. See “Forward-looking Information” on page 63.
Copper Mining, Processing and Refining Costs

Production
Production of refined copper and nickel increased substantially in 2005, as increased quantities of concentrates were processed, versus 2004 levels. Copper production benefited from increased anode production at the Altonorte smelter and the ramp-up of cathode production at the CCR refinery. Nickel production benefited from increased custom feed processing. Production of refined zinc was lower than 2004 levels mostly due to a month-long strike at the Kidd Creek metallurgical complex in October. Mined copper production was higher in 2005, at the Antamina, Kidd Creek, Lomas Bayas and Montcalm mines, but was offset by lower production at the Collahuasi mine and reduced production from the Louvicourt mine which closed in July 2005. Mined nickel production was stable in 2005 as the new Montcalm mine contributed its first full year of production offsetting lower production at Raglan and Sudbury mines, resulting from lower grades. Mined zinc production was lower due to the closure of the Bell Allard mine, which closed in October 2004. Primary aluminum production was slightly lower in 2005 than in 2004, due mostly to the impact of the fall hurricanes, while fabricated aluminum products sales were higher versus the year prior. Further information on production and sales volumes can be found on page 103/104 of this report.
COPPER BUSINESS UNIT
The Copper Business is a fully-integrated producer of copper metal and concentrate, molybdenum, precious metals and sulphuric acid. It is comprised mostly of long-life, low-cost mines located primarily in South America. They include Falconbridge’s interest in the Antamina copper and zinc mine in Peru, the Collahuasi and Lomas Bayas mines in Chile and the Kidd Creek mine in Ontario, Canada. In addition to these mines, the operations include the Altonorte copper smelter in Chile, as well as refining, smelting and recycling facilities in Canada and the United States. There are several potential brownfield and greenfield expansion opportunities which can further increase earnings from this business (see “Capital Expenditures, Capacity Enhancements and Projects Under Development” on page 44).
| | 2005 | | 2004 | |
Revenues ($ millions) | | 4,421 | | 3,592 | |
Mining, processing and refining costs ($ millions) | | 993 | | 803 | |
Purchased raw materials ($ millions) | | 2,082 | | 1,882 | |
Income generated by operating assets ($ millions) | | 1,086 | | 673 | |
Realized copper price ($ per pound) | | $ | 1.71 | | $ | 1.30 | |
Operating cash cost ($ per pound of copper) | | $ | 0.31 | | $ | 0.38 | |
Sales and throughput (000s tonnes)(1) | | | | | |
Copper in concentrates | | 267 | | 275 | |
Copper metal | | 627 | | 612 | |
Copper concentrate processed | | 1,899 | | 1,810 | |
Zinc in concentrates | | 83 | | 68 | |
Zinc metal | | 116 | | 120 | |
Sulphuric acid | | 811 | | 749 | |
(1). 100% basis except for Collahuasi (44%) and Antamina (33.75%).
Revenues: For the year, consolidated revenues for the Copper Business were $4,421 million, an increase of 23%, over the $3,592 million for the same period of 2004. Higher realized copper, zinc and molybdenum prices accounted for the increase in revenues. During 2005, the realized copper price averaged $1.71/lb., compared to $1.30/lb. in 2004. Sales volumes of refined copper and copper anodes increased 2% in 2005, as a result of increased production at CCR, Altonorte, Kidd Creek and Lomas Bayas. By-product revenues from molybdenum also increased from $19 million in 2004, to $138 million in 2005.
Costs: Total operating expenses were $3,335 million in 2005, versus $2,919 million in 2004. Mining, processing and refining costs totaled $993 million in 2005, versus $803 million in 2004. The increase was due to higher energy costs, supply costs, contractor costs, and the impact of the weaker U.S. dollar. Value of purchased raw materials increased to $2,082 million from $1,882 million, a 11% increase year over year due to higher metal prices and increased throughput at CCR and Altonorte. In 2005, the operating cash cost of producing a pound of copper was $0.31/lb. versus $0.38/lb. in 2004.
32
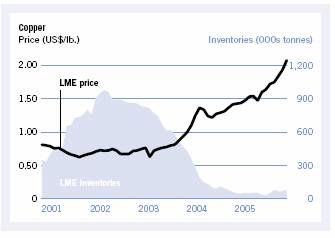
Income generated by operating assets: Copper Business income generated by operating assets was $1,086 million in 2005, compared to $673 million in the same period for 2004. The $413 million increase was mainly attributable to higher copper, zinc and molybdenum prices which more than offset lower mine production from Collahuasi and higher operating costs resulting from the impact of a weaker U.S. dollar and higher energy and supply costs.
Production: For 2005, mined copper production totaled 415,000 tonnes, compared to 430,000 tonnes during 2004. Higher production from Antamina, Kidd Creek and Lomas Bayas was more than offset by lower production from Collahuasi. At Antamina, higher recoveries more than offset a 3% reduction in ore milled. At Kidd Creek, higher mill throughput more than offset lower copper grades as the new Mine D expansion provided more stable feed for the mill. At Collahuasi, lower production was a result of lower head grades, material handling issues and temporary problems with one of the mill motors. Copper anode production from copper smelters increased from 534,000 tonnes in 2004 to 563,000 tonnes in 2005 due to increased production at Altonorte. During the fourth quarter, annual production at the Horne smelter was increased from the recent past operating rate of 140,000 tonnes per year to 170,000 tonnes per year.
Copper cathode production at CCR and Kidd Creek increased to 415,000 tonnes from 404,000 tonnes as increased production at CCR more than offset lower production at Kidd Creek, which was affected by a month-long strike in October. CCR refined cathode output benefited from the agreement reached with Inco Limited earlier in the year whereby CCR began the treatment of Inco’s Sudbury operations copper anode output. CCR is investing in expanding its capacity to treat anodes that are higher in nickel. This is expected to allow CCR to achieve its full capacity of 370,000 tonnes, compared to an average output of less than 300,000 tonnes in recent years. Total copper cathode production in 2005 was 505,000 tonnes, compared to 492,000 tonnes in the previous year as higher production from CCR, Collahuasi and Lomas Bayas more than offset lower production from Kidd Creek.
During the year, the Company also completed the modification of a former copper roaster at the Altonorte smelter and began the tolling of molybdenum concentrates. Construction of the $6 million project was completed on time and on budget. Tolling operations started at the end of June 2005 and reached the design capacity run-rate of 10,000 tonnes per year shortly thereafter.
By-product mined zinc in concentrate totaled 182,000 tonnes in 2005 versus 152,000 tonnes in 2004. Zinc concentrate volumes increased due to higher mill throughput and higher zinc grades at Kidd Creek. By-product refined zinc volumes in 2005 were 114,000 tonnes versus 122,000 tonnes in 2004, due to the labour disruption at Kidd Creek metallurgical facilities. Mined molybdenumproduction at Antamina was 2,300 tonnes, compared to 1,200 tonnes in 2004, mainly due to the increase in recoveries.
NICKEL BUSINESS UNIT
The Nickel Business is comprised of Integrated Nickel Operations (INO), which includes nickel mines and processing facilities in Sudbury, Timmins and northern Quebec, Canada, and a refinery in Kristiansand, Norway; and a ferronickel operation at Falcondo in the Dominican Republic. Mine concentrate is acquired from both the Company’s mining operations and through purchases of custom feeds. The business produces and sells ferronickel and refines and markets nickel, copper, cobalt and significant quantities of precious and platinum-group metals. Nickel exploration and new mine development is one of the core-growth focuses for the Company.
33
Nickel Mine Life
(estimated years)
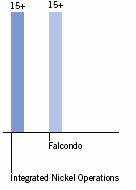
Note: Statements regarding estimated mine life are subject to risks and uncertainties. See “Forward-looking Information” on page 63.
Nickel Mining, Processing and Refining Costs
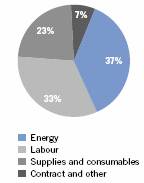

| | 2005 | | 2004 | |
Revenues ($ millions) | | 2,146 | | 1,824 | |
Mining, processing and refining costs ($ millions) | | 810 | | 604 | |
Purchased raw materials ($ millions) | | 574 | | 447 | |
Income generated by operating assets ($ millions) | | 597 | | 637 | |
Realized nickel price ($ per pound) | | $ | 6.85 | | $ | 6.40 | |
Realized ferronickel price ($ per pound) | | $ | 6.74 | | $ | 6.37 | |
Operating cash cost ($ per pound of nickel/ferronickel) | | $ | 3.49 | | $ | 2.93 | |
Operating cash cost ($ per pound of nickel) | | $ | 2.97 | | $ | 2.57 | |
Operating cash cost ($ per pound of ferronickel) | | $ | 4.40 | | $ | 3.50 | |
Sales (000s tonnes) | | | | | |
Nickel | | 85 | | 71 | |
Ferronickel | | 26 | | 29 | |
Cobalt | | 4 | | 4 | |
Revenues: For 2005, consolidated revenues for the nickel business were $2,146 million, an increase of 18%, over the $1,824 million recorded in 2004. At the INO, sales volumes of nickel and copper increased by 20% and 16%, respectively in 2005, as a result of increased production from the Montcalm mine, which achieved commercial production at the end of 2004 and due to increased volumes of custom feeds. Cobalt sales increased 5% from 2004 levels due to increases in production related to custom feeds. At Falcondo, sales volumes decreased 9% to 26,300 tonnesfrom 28,900 tonnes in 2004, reflecting destocking in the stainless steel market and the lower production level in 2005. Realized nickel prices of $6.85/lb. increased by 7%, compared with $6.40/lb. in 2004. The realized ferronickel price increased 6% in 2005, compared to 2004. Realized cobalt prices decreased by 33% versus 2004.
Costs: Total nickel operating expenses were $1,549 million in 2005 versus $1,187 million in 2004. Mining, processing and refining costs totaled $810 million in 2005, versus $604 million in 2004, an increase of $206 million reflecting a full year of operations at Sudbury (the 2004 results were impacted by a three-week labour strike), new production costs related to the Montcalm mine, increased oil purchase costs at Falcondo and the impact of the change in the value of the Canadian dollar on operating costs at the Canadian operations. The value of purchased raw materials increased from $447 million to $574 million due to higher metal prices and increased volumes.
The weighted average operating cash cost per pound of mined nickel for all of Falconbridge was $3.49 in 2005, compared with $2.93 in 2004. At INO, in 2005, the operating cash cost of producing a pound of nickel from INO mines was $2.97 prior to the inclusion of custom feed processing credits. This cost was $0.40/lb., or 16% higher than the 2004 cost due to the impact of the stronger Canadian dollar on operating costs at the Canadian operations, the impact of lower ore grades on mine production and higher energy costs which offset the impact of increases in by-product credits due to higher metal prices. At Falcondo, operating cash cost per pound of ferronickel was $4.40 in 2005, compared with $3.50 in 2004. The increase in costs was largely due to the significant increase in the oil price. Oil costs rose from $36.63 per barrel in 2004, to $49.09 in 2005. Purchased fuel oil costs accounted for 71% of total operating cash costs in 2005.
Income generated by operating assets: For 2005, nickel business income generated by operating assets was $597 million, compared with $637 million for 2004. The $40-million decrease was mainly due to the amortization of the preliminary fair value increment relating to the Noranda/Falconbridge merger, and higher unit costs, again caused in part by the strengthening of the Canadian dollar, which offset the impact of higher nickel and copper prices and increases in sales volumes.
Production: Refined nickel production totaled 113,600 tonnes in 2005, compared to 100,900 tonnes in 2004, setting a new record for production. During 2005, Sudbury mines nickel production was 19,700 tonnes, compared with 22,600 tonnes in 2004. The reduction in nickel production was attributable to a reduction in ore grade. For 2005, Raglan nickel-in-concentrate production was 22,200 tonnes, compared with 26,600 tonnes of
34
nickel in 2004. The decrease in production from 2004 levels was due to the impact of a lower nickel ore grade. In its first full year after achieving commercial production, the Montcalm mine produced 9,000 tonnes of nickel. In Sudbury, smelter production of nickel in matte, which established a new annual production record, was 63,100 tonnes in 2005, compared with 52,600 tonnes in 2004, as a result of the treatment of higher concentrate tonnages with lower feed grades. At Nikkelverk, 2005 refined nickel production of 84,900 tonnes was higher than the 71,400 tonnes produced in 2004, establishing a new annual production record. Nikkelverk cobalt production also set a new record at 5,000 tonnes. The Falcondo ferronickel operation produced 28,700 tonnes of nickel in ferronickel, compared to 29,500 tonnes in 2004.
ZINC BUSINESS UNIT
The Zinc Business includes the Brunswick mine and the Brunswick lead metallurgical operations (lead smelter and refinery), General Smelting (zinc and lead alloy foundry), and Falconbridge’s 25% interest in the Noranda Income Fund, which owns 100% of the Canadian Electrolytic Zinc refinery. The zinc business is an integrated operation that produces and sells zinc and lead concentrates and refines and markets zinc and lead metal and a significant amount of by-product silver and sulphuric acid.
| | 2005 | | 2004 | |
Revenues ($ millions) | | 504 | | 415 | |
Mining, processing and refining costs ($ millions) | | 168 | | 158 | |
Purchased raw materials ($ millions) | | 243 | | 187 | |
Income generated by operating assets ($ millions) | | 60 | | 14 | |
Realized zinc price ($ per pound) | | $ | 0.70 | | $ | 0.52 | |
Realized lead price ($ per pound) | | $ | 0.50 | | $ | 0.43 | |
Operating cash cost ($ per pound of zinc) | | $ | 0.41 | | $ | 0.32 | |
Sales (000s tonnes) | | | | | |
Zinc in concentrates | | 219 | | 293 | |
Lead metal | | 74 | | 83 | |
Revenues: For the year, revenues for the Zinc Business increased 21%, to $504 million from $415 million in 2004, as higher realized prices for zinc and lead more than offset lower production and sales volumes. Sales volumes of zinc in concentrate decreased in 2005, by 25% to 219,400 tonnes, compared to 292,500 tonnes in 2004, principally due to the closure of the Bell Allard mine in Quebec in October 2004. Lead metal sales volumes decreased in 2005, by 11% to 73,700 from 83,200 tonnes in 2004. The decrease in lead metal sales is primarily due to a decrease in lead metal production in 2005, versus 2004, due to lower tonnage processed at the Brunswick lead metallurgical operation.
Costs: Zinc Business operating expenses totaled $444 million in 2005, an increase from $401 million in 2004. Mining, processing and refining costs totaled $168 million in 2005, versus $158 million in 2004. The value of purchased raw materials increased from $187 million in 2004, to $243 million in 2005 primarily due to higher metal prices. In 2005, the operating cash cost of producing a pound of zinc increased 28% to $0.41, from $0.32 in 2004. The increase is mainly due to a stronger Canadian dollar, higher energy costs, higher consumable costs, and higher freight charges and also reflects the loss of production from the Bell Allard mine which closed in October 2004.
Income generated by operating assets: For 2005, the Zinc Business income generated by operating assets was $60 million, compared to $14 million in 2004. The $46-million increase was mainly relating to higher metal prices, which were partially offset by lower sales volumes and the negative effect of the stronger Canadian dollar on costs.
Zinc Mining, Processing and Refining Costs
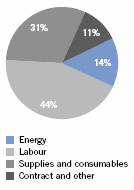
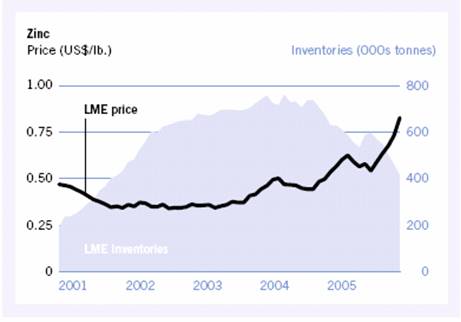
35
Aluminum Mining, Processing and Refining Costs

Production: During 2005, contained zinc in mine production was 265,600 tonnes, compared to 367,000 tonnes in 2004. The decrease in mine production in 2005 is attributable to the loss of production from the Bell Allard mine. Brunswick mine production was 265,600 tonnes of zinc in concentrate in 2005, compared with 268,100 tonnes of zinc in concentrate in 2004. The decrease in zinc production was attributable to ore-pass operating issues and a rock burst during the fourth quarter of 2005. During 2005, the Brunswick smelter consumed 189,700 tonnes of feed, compared to 205,500 tonnes of feed in 2004. Refined lead production totaled 76,100 tonnes in 2005 versus 83,800 tonnes in 2004, a decrease of 9% resulting from a reduction in tonnage of material processed.
The principal zinc and lead concentrate producing asset within the Zinc Business is the Brunswick mine. At planned operating rates, the Brunswick mine has an estimated life of four to five years. Detailed technical and economic studies of the additional mineral resources and other mining remnants located throughout the mine are continuing. If this evaluation is successful in converting remaining resources to reserves, the four-year mine life could be extended by an additional year of operation, subject to the risks and hazards associated with the mining business and the mine in its final stage of extraction. At current zinc and lead prices, the existing zinc business is expected to be a significant contributor of cash flow to the Company, providing a very high rate of return on the book value of these assets. Falconbridge’s strategy also has the potential to maintain approximately one billion pounds per year exposure to the zinc price via the potential development of its brownfield and greenfield projects, described under “Capital Expenditures, Capacity Enhancements and Projects Under Development”. (Note: Statements regarding estimated mine life and projections of future cash flows and rates of return are subject to risks and uncertainties. See “Forward-looking Information” on page 63.)
ALUMINUM BUSINESS UNIT
Falconbridge’s fully-integrated aluminum operations consist of a primary aluminum reduction facility in New Madrid, Missouri, and four modern aluminum rolling mills, capable of producing a variety of foil and sheet products to fulfill numerous applications. The primary and rolling operations are supported by the Company’s 50% interest in the St. Ann bauxite mine in Jamaica and the Gramercy alumina refinery in Gramercy, Louisiana. The St. Ann bauxite mine is the major source of raw material for the Gramercy alumina refinery and is also the main supplier of raw material for the primary aluminum smelter in New Madrid. During 2005, the New Madrid smelter accounted for approximately 10% of aluminum production in the U.S. and the foil operations supplied approximately 23% of North American demand for aluminum foil sheet. Falconbridge now has the benefit of being a fully-integrated aluminum producer and has full leverage to thecurrent strong aluminum prices.
| | 2005 | | 2004 | |
Revenues ($ millions) | | 1,077 | | 935 | |
Mining, processing and refining costs ($ millions) | | 583 | | 420 | |
Purchased raw materials ($ millions) | | 335 | | 388 | |
Income generated by operating assets ($ millions) | | 106 | | 89 | |
Realized aluminum price ($ per pound) | | $ | 0.91 | | $ | 0.84 | |
Average fabricating spread ($ per pound of foil) | | $ | 0.46 | | $ | 0.42 | |
Operating cash cost ($ per pound of aluminum) | | $ | 0.63 | | $ | 0.58 | |
Sales (000s tonnes) | | | | | |
Primary aluminum | | 248 | | 249 | |
Aluminum foil | | 178 | | 174 | |
Revenues: For the year, consolidated revenues for the Aluminum Business increased 15%, to $1,077 million from $935 million in 2004. Primary sales volumes were slightly lower than 2004, resulting from fewer average number of operating pots. Realized Mid-West prices in 2005increased by 8% to $0.91/lb., from $0.84/lb. in 2004. For the rolled products division, sales volumes were up by 2% for the year mainly due to improved production levels. Overall weightedfabrication spreads were up $0.04/lb., or 10% from 2004 levels, due entirely to strong demand and related price increases in heavy-gauge product lines.
36
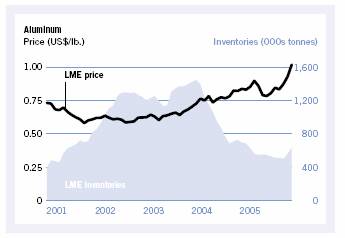
Costs: Total Aluminum Business operating expenses totaled $971 million in 2005, versus $846 million in 2004, primarily due to the inclusion of Falconbridge’s share of the newly acquired St. Ann bauxite mine and Gramercy alumina refinery operating costs, which are offset by the benefits of a fully-integrated aluminum business and certainty of long-term alumina supply. Mining, processing and refining costs totaled $583 million in 2005, versus $420 million in 2004, an increase of $163 million. Operating costs were negatively affected by the temporary production disruption at the Gramercy alumina refinery that resulted from the impact of hurricane Katrina and the resulting higher natural gas costs. Energy costs at the New Madrid smelter were negatively impacted by slightly higher electricity rates that came into effect under the new fifteen-year electricity supply contract, but these contract rates compare very favourably with electricity costs incurred by other U.S. aluminum producers. The value of purchased raw materials decreased to $335 million from $388 million in 2004, due to the fact that alumina purchases in 2004 were from third-parties prior to the fourth quarter acquisition of Gramercy Alumina. The primary aluminum smelter continues to benefit from the secure internal supply of alumina at very favourable cost compared to current spot-market prices.
For the year, the net operating cash cost at the primary division was $0.63/lb., compared with $0.58/lb. in 2004. Higher natural gas and electrical energy costs were the major contributors to the higher unit costs. For the rolled products division, conversion costs on average were down 6% from last year, due in part to a heavier-gauge product mix and improvements in manufacturing efficiencies at all plants offsetting the negative impact of higher natural gas prices.
Income generated by operating assets: For 2005, income generated by operating assets for the Aluminum Business was $106 million, compared with $89 million for 2004. The increase was mainly due to higher metal prices and fabrication margins, improved production levels at the rolled products divisions, and higher margins received on value-added product sales such as rod, billet and rolled aluminum products.
Production: For the year 2005, production of primary aluminum was 245,600 tonnes, compared to 247,500 tonnes in the same period in 2004. For the rolled products operations, shipments were 177,900 tonnes for the year, up 2% compared to 173,900 tonnes in 2004.
AVERAGE REALIZED PRICES
Average realized prices for the company’s main products during 2005 and 2004, as well as estimated current realized prices in 2006, are as follows:
($ per pound) | | Estimated Current Price(1) | | 2005 | | 2004 | |
Copper | | 2.24 | | 1.71 | | 1.30 | |
Nickel | | 6.67 | | 6.85 | | 6.40 | |
Ferronickel | | 6.29 | | 6.74 | | 6.37 | |
Zinc | | 1.02 | | 0.70 | | 0.52 | |
Aluminum | | 1.15 | | 0.91 | | 0.84 | |
Lead | | 0.65 | | 0.50 | | 0.43 | |
Cobalt | | 12.46 | | 14.97 | | 22.48 | |
Molybdenum | | 23.50 | | 31.09 | | 16.21 | |
(1). As at Feb. 16, 2006
37
SENSITIVITIES
The following table shows the annualized impact on Falconbridge’s net income from changes in metals prices and the U.S./Canadian dollar exchange rate.
| | Change in | | Impact on | | Impact on | |
($ millions) | | US$/lb. Price | | Net income | | Income per share | |
Copper | | $ | 0.05 | | $ | 37 | | $ | 0.10 | |
Nickel | | $ | 0.50 | | 63 | | 0.17 | |
Zinc | | $ | 0.05 | | 38 | | 0.10 | |
Aluminum | | $ | 0.05 | | 19 | | 0.05 | |
Lead | | $ | 0.05 | | 6 | | 0.02 | |
| | | | | | | |
Exchange rate Cdn$ = US$ | | $ | 0.01 | | 12 | | 0.03 | |
| | | | | | | | | | |
MINING OPERATIONS AND RECOVERIES
The following table details the results of milling operations and recoveries at the Company’s operating mines in 2005:
| | | | Copper | | Nickel | | Zinc | |
| | Ore treated | | Grade | | Recovery | | Grade | | Recovery | | Grade | | Recovery | |
| | (000s tonnes) | | (%) | | (%) | | (%) | | (%) | | (%) | | (%) | |
Copper Mines | | | | | | | | | | | | | | | |
Antamina | | 10,241 | | 1.35 | | 90.3 | | — | | — | | 0.92 | | 82.7 | |
Collahuasi(1) | | 20,495 | | 1.15 | | 81.6 | | — | | — | | — | | — | |
Kidd Creek | | 2,320 | | 2.02 | | 93.0 | | — | | — | | 6.19 | | 83.5 | |
Lomas Bayas – heap leach | | 13,286 | | 0.50 | | 76.8 | | — | | — | | — | | — | |
Lomas Bayas – ROM leach | | 22,432 | | 0.22 | | 24.6 | | — | | — | | — | | — | |
Louvicourt | | 369 | | 2.20 | | 95.0 | | — | | — | | 1.85 | | 85.6 | |
| | | | | | | | | | | | | | | |
Nickel Mines | | | | | | | | | | | | | | | |
Falcondo | | 3,920 | | — | | — | | 1.18 | | 75.3 | (2) | — | | — | |
Montcalm | | 750 | | 0.79 | | 85.6 | | 1.52 | | 82.1 | | — | | — | |
Raglan | | 934 | | 0.84 | | 80.4 | | 2.84 | | 86.4 | | — | | — | |
Sudbury | | 2,171 | | 1.26 | | 93.3 | | 1.16 | | 80.5 | | — | | — | |
| | | | | | | | | | | | | | | |
Zinc Mines | | | | | | | | | | | | | | | |
Brunswick | | 3,529 | | 0.35 | | 48.9 | | — | | — | | 8.59 | | 87.7 | |
(1). Collahuasi figures reflect a weighted average of sulphide and oxide ores.
(2). Falcondo upgrade circuit.
PRODUCTION FORECAST
| | | 2006 Forecast | | 2005 Actual | |
Production | | | (tonnes) | | (tonnes) | |
Copper | Mined | | 475,000 | | 462,000 | |
| Refined | | 635,000 | | 544,000 | |
Nickel | Mined | | 82,000 | | 80,000 | |
| Refined | | 115,000 | | 114,000 | |
Zinc | Mined | | 460,000 | | 454,000 | |
| Refined(1) | | 210,000 | | 182,000 | |
Aluminum | Primary | | 250,000 | | 246,000 | |
| Fabricated | | 195,000 | | 178,000 | |
(1). Includes 100% of Kidd Creek refinery production and 25% of the Noranda Income Fund CEZ refinery production
Statements regarding production forecasts are subject to various risks and assumptions.
See “Forward-looking Information” on page 63.
38
QUARTERLY EARNINGS
($ millions, except per share data) | | Q1 | | Q2 | | Q3 | | Q4 | | 2005 | | Q1 | | Q2 | | Q3 | | Q4 | | 2004 | |
Results of operations | | | | | | | | | | | | | | | | | | | | | |
Revenues | | $ | 1,920 | | $ | 2,057 | | $ | 2,006 | | $ | 2,165 | | $ | 8,148 | | $ | 1,603 | | $ | 1,632 | | $ | 1,662 | | $ | 1,867 | | $ | 6,764 | |
Mining, processing and refining costs | | 595 | | 643 | | 615 | | 685 | | 2,538 | | 435 | | 477 | | 517 | | 547 | | 1,976 | |
Purchased raw materials | | 748 | | 804 | | 816 | | 867 | | 3,235 | | 688 | | 744 | | 656 | | 816 | | 2,904 | |
Depreciation, amortization and accretion | | 118 | | 147 | | 140 | | 150 | | 555 | | 116 | | 124 | | 118 | | 135 | | 493 | |
Income generated by operating assets | | 459 | | 463 | | 435 | | 463 | | 1,820 | | 364 | | 287 | | 371 | | 369 | | 1,391 | |
Interest expense, net | | 28 | | 37 | | 51 | | 36 | | 152 | | 26 | | 36 | | 30 | | 28 | | 120 | |
Corporate and general administration | | 17 | | 19 | | 18 | | 26 | | 80 | | 13 | | 15 | | 17 | | 21 | | 66 | |
Research, development and exploration | | 11 | | 16 | | 16 | | 16 | | 59 | | 7 | | 12 | | 14 | | 14 | | 47 | |
Minority interest in earnings of subsidiaries | | 94 | | 55 | | 5 | | 1 | | 155 | | 79 | | 64 | | 76 | | 78 | | 297 | |
Income before undernoted | | 309 | | 336 | | 345 | | 384 | | 1,374 | | 239 | | 160 | | 234 | | 228 | | 861 | |
Gain, net of restructuring costs and other | | 1 | | 1 | | (5 | ) | (14 | ) | (17 | ) | (6 | ) | (11 | ) | 6 | | (73 | ) | (84 | ) |
Tax expense | | 124 | | 133 | | 136 | | 118 | | 511 | | 88 | | 58 | | 101 | | 104 | | 351 | |
Net income from continuing operations | | 184 | | 202 | | 214 | | 280 | | 880 | | 157 | | 113 | | 127 | | 197 | | 594 | |
Loss on discontinued operations, net of tax | | 8 | | — | | — | | — | | 8 | | 5 | | 5 | | 9 | | 54 | | 73 | |
Net income | | 176 | | 202 | | 214 | | 280 | | 872 | | 152 | | 108 | | 118 | | 143 | | 521 | |
Net income per common share from continuing operations: | | | | | | | | | | | | | | | | | | | | | |
Basic | | $ | 0.61 | | $ | 0.62 | | $ | 0.56 | | $ | 0.75 | | $ | 2.54 | | $ | 0.52 | | $ | 0.37 | | $ | 0.42 | | $ | 0.65 | | $ | 1.96 | |
Diluted | | $ | 0.60 | | $ | 0.61 | | $ | 0.56 | | $ | 0.74 | | $ | 2.52 | | $ | 0.51 | | $ | 0.37 | | $ | 0.41 | | $ | 0.64 | | $ | 1.94 | |
Net income per common share: | | | | | | | | | | | | | | | | | | | | | |
Basic | | $ | 0.58 | | $ | 0.62 | | $ | 0.57 | | $ | 0.75 | | $ | 2.52 | | $ | 0.50 | | $ | 0.35 | | $ | 0.39 | | $ | 0.47 | | $ | 1.71 | |
Diluted | | $ | 0.57 | | $ | 0.61 | | $ | 0.56 | | $ | 0.74 | | $ | 2.50 | | $ | 0.49 | | $ | 0.35 | | $ | 0.38 | | $ | 0.47 | | $ | 1.70 | |
FOURTH QUARTER 2005 RESULTS
Net income for the fourth quarter of 2005 was $280 million, or $0.74 per share on a diluted basis, compared to $143 million or $0.47 per share on a diluted basis for the same period in 2004. This increase was as a result of significantly higher metals prices realized in the fourth quarter of 2005 versus 2004 offset by the impact of a strong Canadian dollar. Realized copper prices increased to $1.99/lb. in the fourth quarter of 2005, compared with $1.43/lb. realized in the same period of 2004, while nickel prices realized in the fourth quarter of 2005 averaged $5.88/lb. versus $6.45/lb. realized in the fourth quarter of 2004. Zinc prices realized in the fourth quarter of 2005 averaged $0.80/lb. versus $0.56/lb. realized in the fourth quarter of 2004, while realized aluminum prices increased to $0.94/lb. in the fourth quarter of 2005, compared with $0.89/lb. realized in the same period of 2004.
COPPER BUSINESS UNIT
Revenues: For the fourth quarter of 2005, consolidated revenues of $1,276 million increased 28% from $997 million in the fourth quarter of 2004. The increase reflects higher average realized copper, zinc, molybdenum and precious metals prices. Total sales of copper during the quarter were 232,000 tonnes versus 243,000 tonnes in the same period in 2004. Increased sales of CCR cathodes, Antamina concentrates, Altonorte anodes and Horne concentrates were more than offset
39
by decreased sales of Collahuasi concentrates and Kidd Creek cathodes. Sales of by-product zinc metal from Kidd Creek were lower due to the one-month labour disruption at the Kidd Creek metallurgical operations. The realized copper price of $1.99/lb. increased by 39% in the quarter, compared to $1.43/lb. realized in the same period in 2004.
Costs: Total operating expenses increased to $917 million from $827 million in the fourth quarter of 2004. Mining, processing and refining costs increased to $246 million from $227 million in the same period last year as a result of the impact of a weaker U.S. dollar and higher energy and supply costs. Purchased raw materials increased to $600 million from $534 million in the fourth quarter of 2004, due to the rise in copper prices. The operating cash cost of producing a pound of copper in the fourth quarter of 2005 decreased to $0.35/lb., from $0.43/lb. in the fourth quarter of 2004.
Income Generated by Operating Assets: Income generated by operating assets for the Copper Business in the fourth quarter of 2005 increased to $359 million from $170 million a year ago, due to the impact of higher copper, zinc and molybdenum prices. Offsetting the stronger revenues were increased costs resulting from the impact of a weaker U.S. dollar on Canadian and South American operating costs, as well as higher energy and supply costs.
Production: During the fourth quarter of 2005, copper mine production from Canadian and South American operations totaled 108,800 tonnes, compared to 117,500 tonnes a year ago. Lower copper grades at Collahuasi more than offset higher production from Antamina and Kidd Creek. Refined copper production was 120,900 tonnes of copper cathode in the fourth quarter of 2005 versus 133,800 tonnes in the fourth quarter of 2004 as lower production from Kidd Creek more than offset increased production from CCR. Kidd Creek production of refined copper and zinc were impacted by a one-month strike during October 2005. By-product zinc-in-concentrate production decreased to 27,600 tonnes from 38,900 tonnes in the fourth quarter of 2004 due to lower zinc grades. Mined molybdenum in concentrate at Antamina increased to 800 tonnes from 600 tonnes due to improved recoveries.
NICKEL BUSINESS UNIT
Revenues: For the fourth quarter of 2005, consolidated revenues of $489 million decreased from $495 million in the fourth quarter of 2004. Sales volumes of refined nickel increased 4% to 20,500 tonnes from 19,800 tonnes in the fourth quarter of 2004. At Falcondo, ferronickel sales volumes increased by 2% to 8,300 tonnes from 8,100 tonnes in the fourth quarter of 2004. In the fourth quarter 2005, by-product copper sales volumes of 13,700 tonnes increased 9% from12,500 tonnes in the same period a year ago. Cobalt sales volumes decreased by 18% to 900 tonnes. Realized nickel prices of $5.88/lb. decreased by 9% in the quarter, compared with $6.45/lb. in the same period in 2004. Realized ferronickel prices of $5.93/lb. decreased by 8% in the quarter, compared with $6.42/lb. in the same period in 2004. Precious metals revenues increased by $5 million in the fourth quarter of 2005 compared to the same period in 2004.
Costs: Total operating expenses increased to $414 million from $327 million in the fourth quarter of 2004. Mining, processing and refining costs increased to $235 million from $174 million in the same period last year largely due to the exchange rate impact on operating costs at Canadian operations and increases in energy prices. In addition, 2005 mining, processing and refining costs include a full quarter of costs from the Montcalm nickel mine. The value of purchased raw materials increased to $131 million from $105 million in the fourth quarter of 2004 due to increased sales volumes. The operating cash cost per pound of mined nickel for all of Falconbridge (including INO and Falcondo) was $4.03 in the fourth quarter of 2005, compared with $3.05 for the same period in 2004. The operating cash cost of producing a pound of nickel from INO mines, was $3.52. The $1.06/lb., or 43%, increase from 2004 costs was the result of the impact of the stronger Canadian dollar on operating costs at Canadian operations, higher energy costs, the impact on costs and mine production of the mill conversion at Raglan, and lower ore grades, which offset the impact of increased by-product credits due to higher metal prices. At Falcondo, operating cash cost per pound of ferronickel was $4.80 in 2005, compared with $4.17 in 2004. The increase in costs was largely due to the increase in the oil price, as average oil costs rose from $42.34 per barrel in 2004 to $55.63 per barrel in 2005. Oil is the source of fuel for theelectricity plant operated on site. Fuel oil represented 73% of total operating costs at Falcondo during the fourth quarter of 2005.
40
Income generated by operating assets: Fourth quarter income generated by operating assets for the nickel business totaled $75 million, compared to $168 million in the fourth quarter of 2004. The $93 million decrease was mainly due to the impact of lower nickel and cobalt prices, higher depreciation and amortization charges, largely as a result of the amortization of the fair value increment relating to the Noranda/Falconbridge merger, and higher unit costs, caused in part by the stronger Canadian dollar.
Production: Total mined nickel production was 18,100 tonnes during the quarter versus 21,100 tonnes during the same period in 2004. Sudbury mines production was 3,900 tonnes of nickel and 4,200 tonnes of copper during the fourth quarter of 2005, compared with 5,700 tonnes of nickel and 6,800 tonnes of copper during the same period in 2004. The reduction in mine output relates primarily to lower ore grades and unplanned ore-pass repairs at the Thayer Lindsley mine.
At Raglan, nickel-in-concentrate production in the quarter was 4,600 tonnes and copper production was 1,200 tonnes, compared with 6,700 tonnes of nickel and 1,700 tonnes of copper in 2004. Mill output in the quarter was reduced due to the planned conversion of the mill and lower mine ore grades.
At Montcalm, nickel production in the quarter was 2,300 tonnes.
At the Sudbury smelter, nickel-in-matte production in the fourth quarter of 2005 decreased to 16,100 tonnes from 18,100 tonnes in the same period of 2004 as a result of the treatment of lower concentrate tonnages with lower feed grades. Total refined nickel production was 20,800 tonnes in the fourth quarter of 2005, compared to 20,500 tonnes in the same period in 2004.
In the fourth quarter of 2005, Falcondo produced 7,300 tonnes of nickel in ferronickel, a 2% increase from 7,200 tonnes in the fourth quarter of 2004.
ZINC BUSINESS UNIT
Revenues: Total zinc revenues increased to $155 million or 30% higher than $119 million recorded during the fourth quarter of 2004. In the fourth quarter of 2005, sales volumes of zinc in concentrates decreased 39% to 39,800 tonnes from 64,800 tonnes in the fourth quarter of 2004. Fourth quarter 2005 lead metal sales decreased to 19,500 tonnes from 23,100 tonnes in the same period a year ago, primarily as a result of lower tonnage processed at the Brunswick lead smelter. The average realized price per pound of zinc during the fourth quarter was $0.80/lb. versus $0.56/lb. in the same period last year. The average realized price per pound of lead during the fourth quarter was $0.54/lb. versus $0.46/lb. in the same period last year.
Costs: Total operating expenses increased to $131 million from $114 million in the fourth quarter of 2004. Mining, processing and refining costs decreased to $33 million from $45 million in the same period last year, while the value of purchased raw materials increased to $91 million from $60 million in the fourth quarter of 2004. The value of raw materials increased along with the rise in zinc and lead prices. The operating cash cost per pound of mined zinc increased to $0.48 in the fourth quarter of 2005 from $0.32 for the same period in 2004 due to higher costs and reduced mine production volumes.
Income generated by operating assets: The fourth quarter 2005 income generating from operating assets for the Zinc Business was $24 million, compared to $5 million for the fourth quarter of 2004. The $19-million increase was due to the impact of higher metal prices and decreased depreciation and amortization charges which were partially offset by the impact of lower sales volumes, and an unfavourable impact on costs due to the foreign exchange variance caused by the strengthening of the Canadian dollar.
Production: Contained zinc production was 59,400 tonnes in the fourth quarter of 2005, compared to 74,900 tonnes in the same period in 2004. The decrease was due to the closure of the Bell Allard mine in October, 2004 and also attributable to ore-pass operating issues and a rock burst at Brunswick mine.
The Brunswick lead smelter processed 57,100 tonnes of lead concentrates and secondaries during the fourth quarter of 2005, compared to 61,700 tonnes during the same period in 2004. Lead metal production was 23,900 tonnes in the fourth quarter of 2005, compared to 25,900 tonnes in the same period in 2004. The decreased feed consumption and lead metal output at the Brunswick smelter was due to process reliability issues, which are currently being addressed.
41
ALUMINUM BUSINESS UNIT
Revenues: Aluminum business revenues were $244 million, compared to $257 million recorded during the fourth quarter of 2004. Sales volumes of primary aluminum increased to 63,200 tonnes, compared to 61,700 in the fourth quarter of 2004. The fourth quarter rolled-products sales volumes increased by 3% to 43,200 tonnes, compared to 42,000 tonnes the same period a year ago primarily due to manufacturing throughput improvements. The realized mid-west primary aluminum price increased by 6% in the quarter to $0.94/lb., compared with $0.89/lb. in the same period in 2004.
Costs: Aluminum business operating expenses decreased to $223 million from $228 million in the fourth quarter of 2004. Mining, processing and refining costs increased to $162 million from $102 million in the same period last year. In addition, 2005 mining, processing and refining costs include a full quarter of costs from Gramercy and St. Ann aluminum operations. Operating costs were impacted by significantly higher natural gas costs at the Gramercy alumina refinery and increased electrical energy costs at the New Madrid smelter that came into effect under the new fifteen-year electricity supply contract. These rates compare very favourably with electricity costs incurred by other U.S. aluminum producers. The value of purchased raw materials decreased to $44 million in the fourth quarter from $116 million in the fourth quarter of 2004.
The operating cash cost per pound of primary aluminum metal production was $0.68/lb. in the fourth quarter of 2005, an increase from $0.57/lb. for the same period in 2004. Higher electrical energy and alumina costs were the major contributors to the higher unit costs. The cost per pound at the rolled products division was 6% lower in the fourth quarter of 2005, compared the same period in 2004.
Income generated by operating assets: Fourth quarter 2005 income generated by operating for the aluminum business was $21 million, compared with $29 million for the fourth quarter of 2004. The $8-million decrease was mainly due to higher power costs as well as higher natural gas costs. These costs increases were somewhat offset by the benefits of the increased aluminum price.
Production: In the fourth quarter of 2005, primary aluminum production was 62,300 tonnes, unchanged compared to the same period last year. For the rolled products operations, shipments were 43,200 tonnes, compared with 42,000 tonnes for the fourth quarter of 2004.
FINANCIAL POSITION AND LIQUIDITY
During 2005, the corporate initiatives undertaken to simplify the ownership structure of Falconbridge resulted in a significant repositioning of the Company to enhance liquidity and reduce the cost of capital.
On May 4, 2005, the Company completed a $1.25-billion issuer bid and acquired for cancellation 63.4 million common shares in exchange for the issue of $1.25 billion of junior preferred shares at a price of Cdn$19.72 per common share. The junior preferred shares were issued in these series as follows:
| | | | Mandatory | | | |
| | Principal Amount | | Redemption date | | Dividend rate | |
Series 1 | | $ | 500M | | June 30, 2008 | | 6.0 | % |
Series 2 | | $ | 500M | | June 30, 2010 | | 6.2 | % |
Series 3 | | $ | 250M | | June 30, 2013 | | 6.5 | % |
Total | | $ | 1,250M | | | | | |
The issuer bid represented an opportunity for the Company to acquire 63.4 million common shares at attractive price levels, and reduced the dilution of common shareholder interest when common shares were subsequently issued to acquire the remaining common shares outstanding of the former Falconbridge.
The junior preferred shares were issued at a time of relative uncertainty regarding the Company’s ability to complete the acquisition of the former Falconbridge and therefore have unrestricted access to the cash flow of the combined entity. As such, the junior preferred shares were issued with the Company retaining the right to redeem these shares at any time for 101% of fair value; were issued with an average term to maturity of seven years to provide an opportunity to refinance these instruments without placing undue strain on the liquidity of the Company and; the Company retained the right to repay the junior preferred shares at their maturity in common shares
42
of the Company at the then prevailing common share price. In the event of a change in control of the Company, these instruments are retractable at the option of the holder. These provisions provided the Company with maximum flexibility. As a result of the share attributes, the junior preferred shares were classified as debt instruments on the balance sheet and dividend payments on these instruments were classified as interest expense.
On June 30, 2005, the Company completed the acquisition of the minority interest in Falconbridge through the two-step transaction and the issuance of 132,840,641 common shares, representing a total acquisition price of $2.5 billion. The consolidation of the ownership and simplification of the capital structure of the combined entity created a financially stronger entity with opportunities to further reduce the weighted average cost of capital of the combined entity.
Following the successful completion of the merger of Noranda and the former Falconbridge, Falconbridge received affirmation of its ratings from its respective rating agencies in recognition of the combined entities continued strong cash flow, liquidity and the sustained strength of metal prices.
The completion of the merger also altered the credit risk profile of the combined entity, and the enhancement of the availability of other long-term sources of capital as a result of the investment grade ratings caused the Company to redeem $500 million of junior preferred shares for cash in August 2005, from available cash resources.
Falconbridge maintains long-term credit arrangements and relationships with a variety of financial institutions and investors in order to facilitate its ongoing access to domestic and international financial markets to meet its funding needs. Falconbridge’s future financial requirements related to debt maturities, operating costs, the projects currently under development and other capital investments will be funded primarily from a combination of existing cash balances, committed bank lines, operating cash flows, project financings and new long- and short-term borrowings.
Working capital*, excluding cash and cash equivalents, and debt due within a year, decreased to $1,024 million from $1,119 million at the end of 2004. During the year, Falconbridge continued to improve its balance sheet and operating capacity to support its strategic objective of maintaining an investment grade credit rating.
Cash and cash equivalents at December 31, 2005 totaled $886 million, compared to $884 million at December 31, 2004. In addition to its cash balances, Falconbridge’s liquidity and financial flexibility is augmented by revolving credit facilities. Committed lines of credit at December 31, 2005 totaled $780 million, none of which had been drawn upon. These bank lines are provided by various Canadian and international chartered banks and are scheduled to expire in August 2010.
Long-term debt, excluding the amount due in less than one year and junior preferred shares liabilities, amounted to $2,598 million at December 31, 2005, compared to $2,736 million a year earlier. In June 2005, the Company issued $250 million aggregate principal amount of 12-year notes and $250 million aggregate principal amount of 30-year notes. The 12-year notes, which are unsecured, bear interest at the rate of 5.5% per annum and mature on June 15, 2017. The 30-year notes, which are also unsecured, bear interest at the rate of 6.2% per annum and mature on June 15, 2035. Both series of notes are redeemable in whole, or in part, at any time, at a redemption price equal to 100% of their principal amount plus a make-whole premium. At December 31, 2005, Falconbridge’s consolidated net-debt-to-total-capitalization ratio was 36.7%, compared to 38.7% at December 31, 2004, following the repayment of in excess of $1 billion in debt during 2005.
Shareholders’ equity at the end of 2005 was $5 billion, an increase of $2.2 billion due to the issue of common shares to acquire the minority interest of Falconbridge, retained earnings in excess of dividends paid, offset by the reduction in common equity as a result of the substantial issuer bid completed in May 2005.
Falconbridge’s long-term public debt ratings at December 31 are noted below:
| | 2005 | | 2004 | |
Standard & Poor’s | | BBB | – | BBB | |
Moody’s | | Baa3 | | Baa3 | |
Dominion Bond Rating Services | | BBB | | BBB | |
Note: A security rating is not a recommendation to buy, sell or hold securities, and may be subject to revision or withdrawal at any time by a rating organization.
*Defined as current assets, less current liabilities on the consolidated balance sheets.
43
CASH FLOWS
Operating Activities
Cash generated from operations, before net changes in non-cash working capital, totaled $1,650 million in 2005, up from $1,461 million in 2004. The increase is primarily the result of the higher sales volumes, and higher metal prices despite the adverse impact of increasing energy and supply costs and foreign exchange movements on the mining, processing and refining costs. Higher accounts receivable and inventories resulting from higher metal prices were mostly offset by higher accounts and taxes payable as non-cash working capital increased by $15 million during the year.
Investment Activities
Capital investments totaled $737 million in 2005, compared to $666 million in 2004. Major capital expenditures during 2005 included the expansion and transfer of the mining operations at the Collahuasi copper mine, the Kidd Creek Mine D underground extension, the Montcalm nickel mine, the Nickel Rim South underground exploration project (initiated in early 2005) and $100 million for equipment and services relating to the Koniambo project. Capital investments for 2006 are budgeted to be $750 million. A more detailed discussion is provided on page 47. During 2006, proceeds from dispositions totaled $93 million mostly from the sale of the Company’s wholly-owned wheel manufacturer and from the sale of cost-accounted investments.
Financing Activities
In 2005, Falconbridge used $843 million to reduce its net debt outstanding (repaid $1,394 million of debt while issuing $551 million). This does not include the junior preferred share transaction as this did not involve the receipt of any cash by the Company. During 2005, Falconbridge’s common and preferred share dividend payments were $150 million, compared to $123 million in 2004. Total dividend obligations increased due to the increase in the total common share outstanding that resulted from the acquisition of the minority interest in former Falconbridge that the Company did not already own. The annual common share dividend was Cdn$0.48 per share in 2005, which remained unchanged from 2004.
Significant future obligations of Falconbridge and its partially-owned subsidiaries, excluding the employee future benefit obligations, are summarized as follows:
($ millions) | | Payments by year | |
Nature of obligation: | | 2006 | | 2007 | | 2008 | | 2009 | | 2010 | | Thereafter | | Total | |
Convertible debentures and other loans | | $ | 15 | | $ | 120 | | $ | 23 | | $ | — | | $ | 5 | | $ | — | | $ | 163 | |
Senior debentures | | 250 | | — | | 150 | | — | | — | | 1,943 | | 2,343 | |
Preferred share liabilities(1) | | — | | — | | 126 | | — | | 300 | | 450 | | 876 | |
| | 265 | | 120 | | 299 | | — | | 305 | | 2,393 | | 3,382 | |
Debt of joint ventures | | 87 | | 87 | | 87 | | 87 | | 40 | | 42 | | 430 | |
Capital leases | | 1 | | 5 | | 1 | | 1 | | 1 | | 7 | | 16 | |
Operating leases and purchase commitment | | 172 | | 18 | | 13 | | 9 | | 8 | | 21 | | 241 | |
Total | | 525 | | 230 | | 400 | | 97 | | 354 | | 2,463 | | 4,069 | |
| | | | | | | | | | | | | | | | | | | | | | |
(1) May be redeemed for common shares
CAPITAL EXPENDITURES, CAPACITY ENHANCEMENTS AND PROJECTS UNDER DEVELOPMENT
Falconbridge has invested significant capital in the expansion of its operating capacity with the addition of world-class, low-cost assets and the improvement of existing operations. The Company increased its copper and nickel ore reserves, enhanced its copper and nickel processing capacity, added new zinc projects, expanded its primary and fabricated production capacity and acquired bauxite mining and alumina refining assets to fully integrate its aluminum operations. These investments have substantially increased the Company’s baseline earnings and its leverage to metal prices. The following is a summary of these initiatives and their impact on Falconbridge.
Investments in development projects at the end of the year totaled $1,707 million, an increase of $541 million since December 31, 2004. Nickel and copper mining remains the focus of the Company’s growth program. As shown in the following table, Falconbridge has expansion projects in both these commodities that are currently under development.
44
PROJECTS UNDER DEVELOPMENT – CAPITAL SPENDING 2005
| | Falconbridge | | Book Value at | | Book Value at | |
| | Limited’s Interest | | Dec. 31, 2004 | | Dec. 31, 2005 | |
| | (%) | | ($ millions) | | ($ millions) | |
Copper | | | | | | | |
El Morro Feasibility | | 70.0 | | $ | 12 | | $ | 16 | |
Kidd Creek Mine | | | | | | | |
Extension | | 100.0 | | 404 | | 518 | |
| | | | | | | |
Nickel | | | | | | | |
Koniambo | | 49.0 | | 180 | | 276 | |
Nickel Rim South | | 100.0 | | 101 | | 173 | |
Kabanga | | 50.0 | | — | | 34 | |
Other | | | | 469 | | 690 | |
Total | | | | $ | 1,166 | | $ | 1,707 | |
PROJECTS UNDER DEVELOPMENT – 2005
Expectations with respect to development projects are subject to various risks and assumptions. See “Forward-looking Information” on page 63.
EL MORRO, REGION III, CHILE
Favourably situated close to two copper smelters, the deposit is a large copper porphyry with high gold co-product credits that would result in low net copper cash costs. It has inferred resources of 466 million tonnes grading 0.61% copper and 0.50 gram of gold per tonne. El Morro also features a high-grade resource core and a low pre-stripping ratio, as well as further exploration potential. In 2005, Falconbridge paid $10 million to earn a 70% interest in the El Morro property from Metallica Resources Inc. In 2006, Falconbridge expects to begin feasibility-level work, including a 30,000 metre drilling program for in-fill drilling and metallurgical test work.
EL PACHÓN, ARGENTINA
El Pachón is an attractive copper mine development project situated less than five kilometres from the Chilean border and the Las Pelambres copper mine. It features a high-grade core, unusually low strip ratio and favourable metallurgical recoveries which will substantially reduce mining and capital costs. The orebody has the potential to produce over 200,000 tonnes of copper in concentrate per year over a life of more than 20 years. During 2005, a conceptual study of the El Pachón project was completed. Two bulk samples were extracted from an existing exploration tunnel and processed, engineering studies were completed and environmental information was compiled to add to the environmental base line. In addition, important advances were realized on El Pachón’s specific protocol within the Mining Integration Treaty between Chile and Argentina. In 2006, work is expected to progress in road re-opening, field studies, engineering studies andenvironmental data collection.
KIDD CREEK, TIMMINS, CANADA
Kidd Creek mining operations are transitioning to the newly developed Mine D, which is improving operational stability and predictability, and should lead to improved financial performance. A new target schedule and budget were finalized and approved in mid-2005, becoming the project baseline. Production from block 2 began in the fourth quarter of 2005 and production from block 3 is now expected to begin in the third quarter of 2006. The capital investment is now expected to total Cdn$684 million. The capital expenditures associated with this project increased following the approval of a new target schedule and budget that became the project baseline in April 2005, as well as escalation associated with delineation drilling that will take place in 2006. At the end of 2005, overall project progress was 90% based on this new target schedule and budget.
45
KONIAMBO, NEW CALEDONIA
Good progress was made during 2005 in advancing Falconbridge’s objectives with respect to the Koniambo ferronickel project in the Northern Province of New Caledonia. Final agreements were put in place by and among Falconbridge, Société Minière du Sud Pacifique S.A. (SMSP), and other relevant parties to provide for the transfer of the Koniambo orebody in New Caledonia to Koniambo Nickel SAS, a company owned 49% by Falconbridge and 51% by SMSP. Falconbridge hadannounced in late December 2005 that it had met the relevant conditions of the Bercy Accord for this transfer to take place, including having placed firm orders for at least $100 million in total for equipment and services relating to the project.
It is currently planned that the Koniambo project will encompass the construction of a 60,000-tonne-per-year ferronickel processing plant and related development of the mine site and infrastructure. A detailed feasibility study was completed in December 2004. The feasibility study was subject to two independent reviews in 2005, by two international engineering firms and feedback from both reviews has been positive.
The capital cost of the project is estimated to be $2.2 billion in 2004 dollars excluding interest to be incurred during construction and initial working capital requirements. The capital cost of $2.2 billion includes the construction of a $600-million power station with an installed generating capacity of 390 MW. The remaining $1.6 billion relates to the metallurgical plant, minedevelopment, and other infrastructure such as the port and road facilities.
Detailed engineering for the project continues in 2006. Falconbridge expects to receive the necessary construction and operating permits in 2006, enabling the construction phase to commence in 2007. Based on these key milestones being met as currently planned, start-up of the project is expected to occur in 2009/2010.
Falconbridge has, subject to certain terms and conditions, agreed to arrange for or provide up to 100% of the financing required for the project. Given these financing arrangements, the project’s free cash flow would first be used to service and repay debt incurred to finance the construction of the project before any distributions would be available to the equity owners in the project.
Koniambo is one of the world’s largest and highest grade nickel laterite deposits. At a 2.0% nickel cut-off grade, the deposit contains measured plus indicated resources of 75.6 million tonnes at 2.47% nickel. These resources were converted to proven and probable mineral reserves of 62.5 million tonnes grading 2.4% nickel. In addition, the project has an inferred limonite resource estimated at 100 million tonnes at 1.6% nickel and 0.2% cobalt that could be developed at a later date.
In 1998, Falconbridge entered into a joint-venture agreement with Société Minière du Sud Pacifique S.A. (SMSP) and its controlling shareholder, Société de Financement et d’Investissement de la Province Nord, for the evaluation and development of the 60,000-tonne-per-year nickel in ferronickel mining and smelting complex.
When developed, Koniambo will be one of the largest nickel producers in the world with initial production of 60,000 tonnes per year. In addition, future expansion could take advantage of the large resource base, which has an estimated life in excess of 50 years.
NICKEL RIM SOUTH, SUDBURY, CANADA
In 2001, Falconbridge discovered Nickel Rim South – a high grade 13.4-million tonne resource grading 1.8% nickel, 3.3% copper and significant platinum, palladium and gold. A five-year underground definition and development program was initiated in 2004 at this deposit, located nine kilometres from Falconbridge’s Sudbury smelter, and progressed in 2005. Ventilation shaft sinking began in February, 2005 and was 1,092 metres at the end of 2005. Main shaft sinking began in April 2005 and was at 467 metres at the end of 2005. The mine plan was optimized in 2005 to include additional information from the ongoing drilling program. The capital cost of this project is $524 million, reflecting an increase of $100 million in foreign exchange and escalation variations. This project is expected to be completed in 2009, with production expected to begin in 2009.
KABANGA, TANZANIA
In April 2005, Falconbridge announced a joint-venture agreement with Barrick Gold Corporation on the Kabanga nickel deposit, located in northwestern Tanzania. Barrick’s current estimated inferred resource is 26.4 million tonnes grading 2.6% nickel. Under the terms of the agreement,
46
Falconbridge acquired a 50% indirect joint-venture interest in respect of the Kabanga Project for $15 million and will be the operator of the joint venture. Over the next several years, Falconbridge will fund and conduct a further $50-million work plan. Current work, including exploration and infill diamond drilling, metallurgical testing and engineering study work will lead to the completion of a scoping study in the first quarter of 2006.
CAPACITY ENHANCEMENTS – 2005
COLLAHUASI, CHILE
Construction of a $36-million molybdenum recovery circuit was completed in the fourth quarter of 2005, ahead of schedule and under budget. In 2006, production of molybdenum in concentrate is expected to be approximately 3,800 tonnes. Production will increase over time as a result of the increase in molybdenum grades at depth in the Rosario orebody.
LOMAS BAYAS, CHILE
The Fortuna de Cobre deposit, adjacent to the Lomas Bayas mine, could expand production or extend the mine life at Lomas Bayas by five years to 2020. A pre-feasibility study was initiated during the year and development of an exploration tunnel began in March 2005. Construction of the pilot plant was completed in August 2005. The metallurgical test program was initiated in the last quarter of 2005. Fortuna de Cobre is an attractive growth opportunity because of its low stripping ratio, proximity to existing infrastructure and favourable mineralogy and leaching kinetics. Falconbridge has the option to purchase Fortuna de Cobre by mid-2006.
RAGLAN, NUNAVIK TERRITORY, CANADA
The conversion of the mill from autogenous to semi-autogenous grinding was completed in October 2005. This conversion will increase the level of annual throughput to approximately one million tonnes of ore per year and increase the mill’s ability to process harder ore. This project was completed on schedule and on budget with total project investment of Cdn$33 million. The next phase will focus on utilizing increased mill capacity by expanding site infrastructure and ore production to allow for the mining, milling and processing of 1.3 million tonnes of ore annually, resulting in approximately 30,500 tonnes of annual contained nickel production. Phase II is expected to be completed in early 2008.
PLANNED CAPITAL INVESTMENTS – 2006
Capital investments for 2006 are expected to total $750 million as the development of the Nickel Rim South and Koniambo projects advance towards operating status. Sustaining capital expenditures average approximately $250 million annually. All of the currently projected capital investments can be funded from the current capital structure. Falconbridge’s capital investment projections and its major components are shown in the following table.
($ millions) | | | | Capital investments | |
Metal | | Growth project | | 2005 | | 2006F | |
Copper | | Copper development projects
(El Morro, El Pachón, Lomas Bayas) | | $ | 4 | | $ | 50 | |
| | Kidd Creek Mine Extension | | 114 | | 90 | |
| | | | | | | |
Nickel | | Koniambo | | 96 | | 180 | |
| | Nickel Rim South | | 74 | | 85 | |
| | Nickel development projects
(Kabanga, Raglan) | | 61 | | 30 | |
Sustaining capital and other | | | | 388 | | 315 | |
Total Capital Investments | | | | $ | 737 | | $ | 750 | |
F: Forecast
Statements regarding planned capital investments are subject to various risks and assumptions. See “Forward-looking Information” on page 63.
47
CAPACITY ENHANCEMENTS AND PROJECTS UNDER DEVELOPMENT – 2006
BROWNFIELD OPPORTUNITIES
Brownfield development sites represent expansions to existing operations which have a reduced risk profile due to their proximity to existing infrastructure and known geological composition. These developments also usually require less capital than new operating environments and remain a key focus for near-term investment, including:
Copper | | |
| | |
Collahuasi mine, Chile | | Debottlenecking project to increase nominal design capacity of the sulphide circuit is currently underway. |
| | |
| | Studying Phase 3 production capacity expansion. Expect to complete study on approach to be followed by end of 2006. |
| | |
Lomas Bayas mine, Chile | | Studying adjacent Fortuna de Cobre deposit to expand production or extend mine life by five years to 2020. |
| | |
Antamina mine, Peru | | Reviewing installation of pebble crusher circuit and other means of increasing overall throughput. |
| | |
CCR refinery, Quebec, Canada | | Refinery expansion to increase capacity to refine anodes that are higher in nickel. The expansion will allow the refinery to achieve full capacity of 370,000 tonnes of refined copper per year. |
| | |
Kidd Creek mine, Timmins, Canada | | Transitioning to newly developed Mine D, improving operational stability and predictability; provides access to additional 11.9 million tonnes of inferred reserves with 2.7% copper and 4.8% zinc. |
| | |
Nickel | | |
| | |
Nickel Rim South mine, Sudbury, Canada | | A five-year underground definition and development program was initiated in 2004 and is ongoing. It is a high-grade 13.4-million tonne resource grading 1.8% nickel, 3.3% copper and significant platinum, palladium and gold. |
| | |
Raglan mine, Nunavik Territory, Canada | | Focused on utilizing increased mill capacity by expanding site infrastructure and ore production to allow for the mining, milling and processing of 1.3 million tonnes of ore annually, resulting in approximately 30,500 tonnes of annual contained nickel production. Expected completion is early 2008. |
| | |
Fraser Morgan mine, Sudbury, Canada | | Exploration development has been extended and another phase of underground exploration drilling has been initiated in 2006. Fraser Morgan contains 4.9 million tonnes of measured and indicated resources plus 2.4 million tonnes of inferred resources. |
| | |
Onaping Depth deposit, Sudbury, Canada | | Contains 14.6 million tonnes of high-grade indicated resources and inferred resources of 1.2 million tonnes, which is located below the Craig Mine, and could be accessible using Craig Mine infrastructure by deepening the existing shaft. Continuing research on enabling technologies to mine safely at greater depths. |
| | |
Montcalm mine, Timmins, Canada | | Evaluating the possibility of increasing the annual mining rate from 875,000 tonnes to one million tonnes per year. |
| | |
Zinc | | |
| | |
Lennard Shelf mine, Australia | | The mining operations are presently under care and maintenance and the partners are conducting a long-term exploration program. The partners are continuing to apply a disciplined approach to bringing this operation back on line. Measured and indicated resources of 2.8 million tonnes grading 8.47% zinc and 1.96% lead. |
| | |
Perseverance deposit, Matagami, Canada | | Evaluating options and timing to develop this Matagami camp deposit. Measured and indicated resources of 5.12 million tonnes grading 15.82% zinc and 1.24% copper; could utilize existing mill and concentrator infrastructure. |
48
GREENFIELD OPPORTUNITIES
Greenfield opportunities, or those potential projects which are located in regions where Falconbridge does not currently operate, represent significant growth potential to Falconbridge. Projects currently being reviewed for development are as follows:
Copper | | |
| | |
El Pachón, Argentina | | A very large and promising deposit with measured and indicated resources of 724 million tonnes grading 0.65% copper; capable of producing over 200,000 tonnes per year for more than 20 years. |
| | |
El Morro, Chile | | A porphyry copper deposit with inferred resources of 466 million tonnes grading 0.61% copper and 0.50 grams per tonne gold. Feasibility work beginning in 2006. |
| | |
Nickel | | |
| | |
Koniambo,
New Caledonia | | Potential for a 60,000-tonnes per year operation; detailed engineering plans being advanced in 2006 with the start of construction expected in 2007. Proven and probable mineral reserves are 62.5 million tonnes grading 2.40% nickel. |
| | |
Kabanga, Tanzania | | This is a joint-venture agreement project with Barrick Gold Corporation on the Kabanga nickel deposit, located in northwestern Tanzania. The current estimated inferred resource is 26.4 million tonnes grading 2.6% nickel. Current work, including exploration and infill diamond drilling, metallurgical testing and engineering study work will lead to the completion of a scoping study in the first quarter of 2006. |
| | |
Zinc | | |
| | |
Lady Loretta, Australia | | Falconbridge owns a 75% joint-venture interest in the Lady Loretta deposit, located close to the Mt. Isa, Queensland camp. The orebody has measured and indicated resources of 11.6 million tonnes grading 16.1% zinc and 5.7% lead. Work undertaken to date indicates possible estimated production of more than 125,000 tonnes of zinc in concentrate and 40,000 tonnes of lead in concentrate over more than ten years. |
Expectations with respect to development projects are subject to various risks and assumptions. See “Forward-looking Information” on page 63.
RISK ASSESSMENT AND REDUCTION IN THE EVALUATION, SELECTION AND IMPLEMENTATION OF PROJECTS
Falconbridge’s preference for lower-risk brownfield expansion projects provides inherent risk reduction due to the Company’s knowledge of the environment in which the expansion project is to be undertaken and its ability to tap into existing human and physical resources. When Falconbridge chooses to invest and grow via the development of greenfield projects, away from existing infrastructure, risk assessment and reduction is the Company’s top priority.
Falconbridge has taken several steps to ensure the success of all its current and future capital projects including the following:
• Formation of highly experienced projects group with world-class project leaders dedicated to securing the investment performance of major capital projects;
• Implementation of Six Sigma-based Stage Gate process for project evaluation. This process is a disciplined system which addresses and quantifies key sources of project impact and risk in support of management decision making;
• Addition of parameters in the Stage Gate process that measure social, business and strategic elements;
• Recognition of investment returns as the primary measure of project success; and
• Assignment of accountability.
SIX SIGMA
Since significant deployment in 1999 and company-wide adoption in 2002, application of Six Sigma has contributed to improving performance at Falconbridge. Six Sigma is a process-centered, step-by-step analytical approach to reviewing operational performance and driving continuous improvement. During 2005, 154 Six Sigma projects were completed for total annualized benefit of $60 million at an average savings value of $390,000 per project.
49
EXPLORATION
The objectives of the exploration team are aligned with those of the copper, nickel and zinc business units and with the corporate strategy of focusing primarily on copper and nickel growth opportunities, worldwide. The company’s goal is to be the most valued and sought after partner in the mining and metals business. The Company’s approach is one of consistently being a fair and honest partner, complemented by strong technical skills and a solid track record with a “win-win” philosophy. Joint-venture arrangements are pursued with both junior and senior mining companies to increase the level of focused exploration activity thereby sharing cost and risk, and improvingthe likelihood of success. The exploration team is supported by an experienced mergers and acquisitions team and a strong project engineering team with a track record of building mines around the world.
As a Founding Patron of the Association of Professional Geoscientists of Ontario and a Founding Partner of the Prospector and Developers Association of Canada’s Environmental Excellence in Exploration initiative, the team of geoscientists is committed to being fully compliant with National Instrument 43-101 requirements and in consistently conducting safe and environmentally responsible global exploration.
The exploration team consists of 119 employees, including 92 geologists and geophysicists. For 2006, Falconbridge forecasts exploration expenditures of $49 million, compared to expenditures of $47 million in 2005. Exploration activity is primarily focused on Canada, Chile, Brazil, Mexico, Norway, Australia, Africa, Papua New Guinea, China and Mongolia.
EXPLORATION HIGHLIGHTS – 2005
COPPER
• In October 2005, Falconbridge announced a preliminary resource estimate for the Rosario Oeste zone at Collahuasi. The zone, located only 300 metres from the Rosario open pit, is estimated to contain an inferred resource of 248 million tonnes grading 1.54% copper at a 0.4% cut-off grade. The resource remains open to the north, south, and at depth, and theseearly stage results suggest that Rosario Oeste has the potential to expand the existing reserve base and extend the life of the current operation.
• The Frieda River project in Papua New Guinea contains a primary porphyry copper inferred mineral resource plus higher grade copper-gold mineralization in the Nena deposit. Recent drilling at the Nena deposit firmed up a measured and indicated mineral resource of 42.7 million tonnes of 3.09% copper and 0.59 grams of gold. Exploration of other high-grade targets are expected to be pursued in 2006.
NICKEL
• A new nickel laterite deposit has been discovered in Para State, Brazil. A mineral resource estimate will be completed in 2006. The thickness of mineralization intersected to dateranges from 2.0 to 93 metres and averages 15.3 metres with a nickel content ranging from 1.0 to 3.2%.
• The 2005 Raglan, Quebec program returned the best exploration results since the mine commenced production, with 2.5 million tonnes of new resources (mostly inferred resources) discovered, exceeding 2005 production of 934,000 tonnes.
• In Norway, a nickel joint-venture exploration program with Blackstone Ventures Inc. continues to produce promising results in four separate areas (as an example, 7.2 metres of 1.05% nickel, 0.46% copper at Vesle). The joint venture has been expanded to include five new prospective areas in South Norway. Geological/geophysical surveys and diamond drilling willcontinue in 2006.
ZINC
• New zinc mineralization has been discovered at the Pallas Green project in Ireland where the best intersection to date has been 9.2% zinc over 10.5 metres. Additional diamond drilling willbe required to determine the significance of this mineralization.
50
EXPLORATION OBJECTIVES – 2006
Expectations with respect to exploration objectives are subject to various risks and assumptions. See “Forward-looking Information” on page 63.
COPPER
• Chile – establish an indicated/measured mineral resource at the El Morro project in support of a feasibility study.
• Chile – establish an indicated mineral resource at the recently discovered Rosario Oeste zone at Collahuasi in support of a feasibility study.
• Papua New Guinea – explore the remaining targets for high-grade mineralization and implement metallurgical test work on the higher grade Nena mineral resource in support of a scoping study.
NICKEL
• Canada – establish an indicated mineral resource at Zone 5-8 in support of a feasibility study at Raglan, Quebec.
• Brazil – establish an indicated/inferred mineral resource at the Araguaia laterite discovery by the second quarter 2006 in support of a scoping study.
• Africa – define and expand the North Zone massive sulphides at Kabanga in Tanzania and test additional priority targets within a radius of five kilometres in support of a pre-feasibility study.
• Norway – continue geophysical surveys and diamond drilling to investigate encouraging mineralization at two joint-venture projects.
ZINC
• Ireland – assess the significance of recently discovered zinc mineralization at the Pallas Green project.
METALS MARKETS
Current global economic growth conditions and prospects remain above trend levels despite hurricanes and high oil prices. Global GDP is expected to grow by over 4% for both 2005 and 2006. Global growth for 2004 to 2006 inclusive, is shaping up to high average levels not experienced since the 1976 to 1978 period.
The resilience of the U.S. economy, a sustained recovery in Japan and a strong Chinese economy, showing no signs of waning, are all reasons to be positive on both global economic prospects and the expected increase in base metals demand.
On the supply side, capacity constraints, low inventory levels, higher energy costs, the likelihood of production disruptions and a shortage of mining materials and labour will continue to be market supportive. Despite the notion that high prices should spur investment activity, the supply response has been muted and there is little sign of an output surge or even large amounts of new capacity coming on stream.
Another positive factor, which cannot be underestimated, is that investment funds are viewing base metals favourably, and expect the market to be stronger for longer. For 2006, strong fundamentals underlying support for above-average base metals prices are forecast.
Expectations and outlooks with respect to metal market projections are subject to various risks and assumptions. See “Forward-looking Information” on page 63.
COPPER MARKET
The expected increase in global mine production in 2005 was hampered by a combination of plant equipment failures, labour disputes and natural disasters. Copper mine production continued to grow as high prices have encouraged all producers to maximize output. In 2005, global mine production is expected to be just over 15.3 million tonnes of contained copper. Mine output growth continues to be driven by restarts and ongoing brownfield expansions triggered in late 2004 and early 2005.
The recovery in mine-concentrate output has allowed smelters to rebuild their depleted concentrate stocks and increase operating rates. Despite a number of maintenance shutdowns and production disruptions, smelter production increased 6.8% in 2005. The area of most rapid growth in smelter capacity and output has been China and as its copper smelting and refining capacity
51
grows, its copper concentrate import requirements will also grow rapidly to fill the shortfall in domestic mine production growth.
On the metal side, 2005 marks the third consecutive year of a global refined copper market deficit. LME stocks increased by only 43,675 tonnes to 92,225 tonnes at the end of 2005 from 48,550 tonnes at year end 2004. Historically high copper prices and sustained low copper exchange inventories likely resulted in a significant de-stocking of refined metal inventories held by producers and consumers. A first-time auctioning of copper by the Chinese SRB in November and December (20,000 tonnes each), combined with deliveries made to exchange warehouses, failed to put significant downward pressure on the copper price. The copper price averaged $1.67/lb. in 2005, $0.37/lb. greater than the 2004 average of $1.30/lb. Robust fundamentals and favourable fund buying in 2005, propelled the copper price to a high of $2.11/lb. in December.
Looking at mine supply, despite the less-than-expected mine output growth in 2005, the concentrate market recovered from critically low levels as mine production expanded. For 2006, the concentrate market is forecast to be in surplus, as higher mine production is expected and smelter capacity should remain somewhat constrained. It is therefore expected that treatment and refining charges should remain above long-term benchmark averages. Declining ore grades, high-energy costs and equipment shortages should continue to act as constraints and put upward pressure on the cash costs.
In 2006, global refined copper production is forecast to be in surplus for the first time in three years. Global copper consumption growth is forecast to decline to 3.6% from 4.7% in 2005, mainly reflecting moderating growth in both China and the U.S. The forecast surplus of 419,000 tonnes of refined metal pales in comparison to the cumulative deficit of 1.4 million tonnes experienced over the past three years. This cumulative deficit contributed to the dramatic reduction in exchange inventories witnessed over those years. Until exchange inventories begin rebuilding and maintaining more normal levels, higher copper prices should continue to prevail.
NICKEL MARKET
The strong demand conditions experienced in the first half of 2005 quickly turned around in the third quarter as stainless steel mills initiated a period of heavy de-stocking for the balance of the year. Nickel prices averaged $7.20/lb. in the first half of the year, but with prolonged shutdowns and cutbacks at the stainless steel mills, nickel prices entered a temporary period of decline averaging $6.17/lb. during the second half. For the year, nickel prices averaged $6.69/lb., a 7% increase over the 2004 average. With nickel producers operating at close to capacity in the first half of the year, surging demand had to be met from LME inventories, which declined from 20,898 tonnes at the start of the year to a low of 4,926 tonnes by mid-May. The fall-off in demand from the stainless steel sector in the latter part of 2005, resulted in LME stocks creeping back up to end the year at 36,042 tonnes.
While demand for nickel was strong overall in the first half of the year, an imbalance developed in stainless steel supply/demand fundamentals by mid-year leading to rising stock levels, declining prices and reduced margins for the mills, precipitating numerous stainless steel production cuts. With the ramp-up of significant new Chinese stainless steel capacity, this curtailed the need for stainless steel imports from Western producers. The net effect was reduced primary nickel consumption and increased stainless steel scrap availability. Consequently, global stainless steel production estimates for 2005 were at the same level as 2004. In addition, the trend towards substitution out of nickel bearing stainless steel grades continued during 2005, as sustained high nickel prices have driven stainless steel mills to switch to greater production of non- or lower nickel bearing grades of stainless steel.
Other nickel consuming sectors are estimated to have grown by 6%, supported by strong high nickel alloy and battery demand. Robust demand is being seen from all end-use sectors across all geographical regions.
As a result of nickel producers pushing their utilization rates, increased production glitches and maintenance outages were experienced in 2005. World nickel production is forecast to have increased by only 1.2% over 2004 given that producers were running near full capacity leaving little room to raise output. Overall, a 15,000 tonne supply/demand surplus was forecast for 2005.
Based on technical analysis, the stainless steel market is anticipated to rebound sometime during the first half of 2006, in line with the accelerating momentum of the industrial production cycle. With a rebound in stainless steel production and continued healthy non-stainless demand, total nickel consumption is expected to grow by over 7% and total global nickel supply is forecast to increase by 6% with a projected balanced market for the year.
52
For the remainder of this decade, it is expected that the nickel market will continue to benefit from constrained supply, strong demand driven by Chinese stainless steel plant expansions, and limited major greenfield nickel projects coming on stream.
ZINC MARKET
LME zinc prices started 2005 at $0.55/lb., then fluctuated between $0.53/lb. and $0.65/lb. for most of the year before rising strongly in the fourth quarter to a high of $0.87/lb. on the final day of the year. The LME cash-settlement zinc price averaged $0.63/lb. in 2005, 31% higher than the average of $0.48/lb. in 2004. Prices gained strength on expectations that the ongoing supply/demand deficit may not be alleviated by new mine supply and available metal stocks.
Oversupply and historically low zinc prices at the start of the decade led to the depletion and closure of many mines, and even the demise of some companies. Meanwhile, demand for zinc metal increased, driven by growth in China and the developing world. The result has been not enough zinc mine concentrates to feed zinc smelters, and insufficient new metal to satisfy zinc consumption, in turn driving zinc prices higher. Since 2002, the recovery in global economic activity and industrial output has led to a resurgence in zinc demand, especially from the steel galvanizing sector. Leading all regions has been China, where zinc demand rose approximately 11% in 2005. Demand for zinc metal in the United States declined temporarily as high steel inventories were worked down.
While zinc smelting capacity has continued to expand, mainly in China, actual zinc metal production has only increased by approximately 2% worldwide in 2005, due to the extremely short supply of concentrates from mines. In China, the tight global zinc concentrates market, combined with accelerating domestic demand, resulted in China remaining a net importer of zinc metal for the second year in a row, a significant change from historically being a large zinc metal exporter. With global metal demand outweighing supply, metal steadily flowed out of LME warehouses for most of the year except for the delivery in June of just over 100,000 tonnes of previously unreported stocks. Overall, LME stocks dropped at an average of roughly 20,000 tonnes per month. For 2005, LME stocks plummeted a net 235,575 tonnes to close at 393,550 tonnes by the end of the year. The global refined zinc supply/demand balance is estimated to have been in deficit by 293,000 tonnes in 2005.
ALUMINUM MARKET
The LME cash-settlement aluminum price averaged $0.85/lb. in 2005, a 9% increase over the average of $0.78/lb. in 2004. However, the price was somewhat volatile throughout the year. The LME aluminum cash price opened the year 2005 at $0.83/lb. The low point of $0.76/lb. was reached in June. By the end of the year the price was at a sixteen-year high of $1.03/lb.
Aluminum’s supply-demand fundamentals were essentially balanced in 2005. LME warehouse inventories were 695,000 tonnes at the beginning of 2005. By year’s end this stockpile had decreased to 645,000 tonnes. This decline in LME stocks was offset by combined increases of 122,000 tonnes in NYMEX warehouse stocks and IAI inventories.
Both the Chinese and North American economies are expected to support strong demand again during 2006. Effective January 1, 2005, China began applying an export tax on aluminum, copper, and nickel exports. China is expected to double the tax on primary aluminum exports to 10% in early 2006, in a further move to cool domestic investment in the energy-intensive aluminum sector. Given that the country continues to be a significant exporter of aluminum, the export tax should help to slow the growth of Chinese aluminum production and exports – causing inefficient Chinese producers to close or consolidate. Additionally, Chinese smelters are in discussions to curtail aluminum production by 10% (600,000 to 700,000 tonnes) in 2006, in an effort to combat the escalating price of alumina. If they carry through with this plan, it should add upward pressure to the aluminum price.
There has been a dramatic shift in the cost base associated with the production of primary aluminum. While virtually all raw material and energy costs have risen significantly, the costcomponent increases impacting aluminum smelters the most are electrical power and alumina. Together, they account for over two-thirds of total production costs. Global spot-alumina prices increased almost 50% during 2005, from $400/tonne to almost $600/tonne. Power is much more of a localized issue. Smelters faced with renegotiating power contracts, most notably in the U.S. and Europe, have faced substantial cost increases or even lack of available supply. In some cases, the result is permanent closure of the smelters in question.
53
Operating rates of aluminum rolling mills in the U.S. have been above 90%, a historically high number, for the past two years and will likely continue above this rate through to 2010. The HVAC Fin Stock market in the U.S., Falconbridge’s largest flat-rolled aluminum product, is expected to grow by 5 to 10% in 2006, mainly due to increased U.S. government mandated improvements in efficiency ratings of residential air-conditioners.
OUTSTANDING SHARES
As at December 31, 2005, Falconbridge’s issued and outstanding shares and securities were as follows:
Name of new Falconbridge Security | | Trading Symbol | | Shares Outstanding | |
Common Shares(1) | | FAL.LV,FAL | | 370,688,138 | |
Preferred Shares, Series 1 | | N/A | | 89,835 | |
Preferred Shares, Series 2 | | FAL.PR.A | | 4,787,283 | |
Preferred Shares, Series 3 | | FAL.PR.B | | 3,122,882 | |
Preferred Shares, Series F | | FAL.PR.F | | 3,246,057 | |
Preferred Shares, Series G | | FAL.PR.G | | 8,753,943 | |
Preferred Shares, Series H | | FAL.PR.H | | 6,000,000 | |
Junior Preference Shares, Series 1(2) | | FAL.PR.X | | 11,999,899 | |
Junior Preference Shares, Series 2(2) | | FAL.PR.Y | | 11,999,899 | |
Junior Preference Shares, Series 3(2) | | FAL.PR.Z | | 5,999,903 | |
(1). Falconbridge common shares trade on the Toronto and New York Stock Exchanges under the symbols FAL.LV and FAL, respectively. Falconbridge common shares also trade in U.S. dollars on the Toronto Stock Exchange under the symbol FAL.LV.U.
(2). 8,000,000 junior preference shares, series (X), 8,000,000 junior preference shares, series (Y) and 4,000,000 junior preference shares, series (Z) were redeemed on August 11, 2005, as previously announced.
FINANCIAL INSTRUMENTS AND OTHER INSTRUMENTS
Falconbridge uses financial and other instruments in the following instances:
Foreign Currency Exposure
Falconbridge may use forward foreign exchange and option contracts to hedge the effect of exchange rate changes on identifiable foreign currency exposures. Falconbridge may hedge up to 50% of its current-year Canadian dollar operating cost for the next two years and 25% of the subsequent three years. No significant foreign exchange hedge contracts were in place at December 31, 2005.
Falconbridge may enter into futures and forward contracts for the purchase or sale of currencies not designated as hedges. These contracts would be carried at estimated fair values and gains or losses arising from the changes in the market values of these contracts would be recognized in the earnings of the period in which the changes occur.
Commodity Price Exposure
Generally, Falconbridge does not hedge the price it realizes on the sale of its own production and accepts realizations based on market prices prevailing around the time of delivery of metals to customers. Under certain circumstances, Falconbridge enters into futures and option contracts to hedge the effect of price changes on a portion of the raw materials it purchases on a custom processing or resale basis. Gains and losses on these contracts are reported as a component of the related transactions. Designated contracts, meeting the definition for hedge accounting under GAAP, are not recorded. Falconbridge may also enter into futures and forward contracts for the purchase or sale of commodities not designated as hedges. These contracts are carried at estimated fair values. Gains or losses arising from the changes in the market values of these contracts are recognized in the earnings of the period in which the changes occur.
Interest-rate Management
Falconbridge also enters into interest rate swap agreements, including foreign exchange cross-currency swaps, to modify the interest characteristics of its outstanding debt. The differential to be paid or received, for interest rate swaps for which Falconbridge receives hedge accounting, is accrued and recognized as an adjustment to interest expense related to the debt. A summary of these positions is tabled opposite:
54
Interest rate swaps (notional principal amount in $ millions) | | Total | |
Maturity (2006) | | $ | 325 | |
Maturity (2008)(1) | | 136 | |
Maturity (2011) | | 300 | |
Maturity (2012) | | 350 | |
Maturity (2015) | | 550 | |
Fair value(2) | | 54 | |
| | | | |
(1). Includes a cross-currency interest rate swap (with a notional amount of $111 million) designated as a hedge of a Canadian dollar debenture. The total fair value of this instrument at December 31, 2005 was $47 million of which $39 million related to the currency component of the swap and $8 million related to the interest component.
(2). Includes the fair value of $39 million related to the currency component of the cross currency interest rate swap discussed in Note 1 above.
OFF-BALANCE SHEET ARRANGEMENTS
Falconbridge does not have any unconsolidated affiliates. The Company does not enter into off-balance-sheet arrangements with special purpose entities in the normal course of business. Its only significant off-balance-sheet arrangements are the Canadian dollar expenditure hedges discussed under the “Financial Instruments and Other Instruments” section of this document.
TRANSACTIONS WITH RELATED PARTIES
Related-party transactions for the year ended of 2005 and the fourth quarter of 2005 are summarized as follows:
Year ended December 31, 2005
($ millions)
| | | | | | Product | | Service | | | | | |
Related Party | | Description | | Revenue | | Revenue | | Purchases | | Receivables | | Payables | |
Noranda Income Fund | | Processing & administration agreement | | $ | 210 | | $ | 65 | | $ | — | | $ | 44 | | $ | — | |
Noranda Income Fund | | Trading activity | | — | | 3 | | 35 | | — | | 11 | |
Antamina | | Trading activity | | — | | — | | 260 | | — | | 65 | |
Gramercy | | Trading activity | | — | | — | | 136 | | — | | 6 | |
Collahuasi | | Trading activity | | — | | — | | 109 | | — | | 25 | |
| | | | | | | | | | | | | | | | | | |
Quarter ended December 31, 2005
($ millions)
| | | | | | Product | | Service | | | | | |
Related Party | | Description | | Revenue | | Revenue | | Purchases | | Receivables | | Payables | |
Noranda Income Fund | | Processing & administration agreement | | $ | 79 | | $ | 15 | | $ | — | | $ | 44 | | $ | — | |
Noranda Income Fund | | Trading activity | | — | | 1 | | 11 | | — | | 11 | |
Antamina | | Trading activity | | — | | — | | 82 | | — | | 65 | |
Gramercy | | Trading activity | | — | | — | | 90 | | — | | 6 | |
Collahuasi | | Trading activity | | — | | — | | 40 | | — | | 25 | |
| | | | | | | | | | | | | | | | | | |
CRITICAL ACCOUNTING ESTIMATES
Management is required to make estimates in preparing its financial statements in conformity with generally accepted accounting principles. These estimates affect the reported amounts of assets and liabilities and the disclosure of contingent assets and liabilities at the date of the financial statements and the reported amounts of revenues and expenses during the reporting period. Changes to these estimates would result in material changes to these line items. The critical accounting estimates made by Falconbridge relate to the Company’s accounting for the following items:
• Property, plant and equipment
• The determination of mineral reserves
• Impairment assessments of long-lived assets
• Amortization of property, plant and equipment
55
• Employee future benefits
• Asset retirement obligations
• The determination of taxes
Property, Plant and Equipment
Included in operating capital assets of $6.8 billion at December 31, 2005, was primarily property, plant and equipment. As such, the estimates used in accounting for property, plant and equipment and the related depreciation and amortization charges are critical and have a material impact on the Company’s financial condition and earnings. Property, plant and equipment and related capitalized interest and development and pre-production expenditures are recorded at cost and are subject to impairment testing as discussed below.
Determination of Mineral Reserves
One of the most significant estimates which impacts the accounting for property, plant and equipment and the related depreciation and amortization, is the estimate of proven and probable mineral reserves. The process of estimating reserves is complex, requiring significant assumptions, estimates and decisions regarding economic (i.e. metal prices, production costs, and exchange rates), engineering, geophysical and geological data. A material revision to existing reserve estimates could occur because of changes to any of these inputs. Changes in reserves could result in impairment of the carrying amount of property, plant and equipment and a change in amortization expense.
Impairment Assessments of Long-lived Assets
We review and evaluate the Company’s long-lived assets for impairment when events or changes in circumstances indicate that the carrying amount may not be recoverable. Asset impairment is considered to exist if the total estimated future cash flows on an undiscounted basis are less than the carrying amount of the asset. An impairment loss is measured and recorded based on recoverable minerals, expected commodity prices (considering current and historical prices, price trends and related factors), production levels, capital and reclamation costs, and are all based on detailed life-of-mine plans. The term “recoverable minerals” refers to the estimated amount of metal that will be obtained from proven and probable ore/mineral reserves, after taking into account losses during ore processing and treatment. Significant management judgement is involved in estimating these factors, which include inherent risks and uncertainties. The assumptions Falconbridge uses are consistent with its internal planning. Management periodically evaluates and updates the estimates based on the conditions that influence these factors. The variability of these factors depends on a number of conditions, including uncertainty about future events, and thus accounting estimates may change from period to period. If other assumptions and estimates had been used in the current period, the asset balances could have been materially impacted. Ifmanagement uses different assumptions or if different conditions occur in future periods, future operating results could be materially impacted.
In estimating future cash flows, assets are grouped at the lowest levels for which there are identifiable cash flows that are largely independent of future cash flows from other asset groups, taking into consideration movements of intermediate products to ensure the utilization of available capacity across the Company’s operations. All assets at a particular operation are considered together for purposes of estimating future cash flows.
Amortization of Property, Plant and Equipment
Depreciation of property, plant and equipment is based on the estimated service lives of the assets (4-40 years), calculated primarily on a straight-line basis for metallurgical operations and on a units-of-production method for mining operations. Resource properties are depleted and preproduction and mine development expenditures are amortized on a units-of-production method. Units-of-production method is defined as tonnes milled during the period over proven and probable ore reserves at the start of the period. Construction in progress will be depreciated once the project is substantially completed.
The most critical estimates which impact the above accounting policy are the estimated quantities of proven and probable mineral reserves which are the underlying bases for the calculation for the units-of-production method. Changes in the quantity of reserves would result in changes in amortization expense in the periods subsequent to the revision.
56
Employee Future Benefits
Assets are valued at current market value. The expected return on plan assets, currently 7%, is based on current bond yields and expected long-term rate of return on equities. The long-term rate of return on assets assumption is reviewed on an annual basis.
Liabilities are determined as a present value of future anticipated cash flows using a discount rate based on corporate AA bond yields at the valuation date and an inflation expectation consistent with the corporate AA bond yield curve. Differences between the estimated future results and actual future results are amortized (to the extent that the cumulative experience gain orloss is in excess of the permitted 10% corridor under Canadian GAAP) over the expected average remaining service life of the active members (EARSL). This 10% corridor represents 10% of the greater of the post-retirement benefits obligations and the fair value of plan assets. The return on assets assumption and the discount rate, salary and inflation assumptions used to value the liabilities are reviewed annually and are determined based on a consistent framework from year to year. The most significant risk is that the assumption will prove to be either too high or too low in the long term. It is reasonable to assume that there will be a significant variation between the assumptions (which are set within the framework of a long-term commitment) and actualexperience in any one year, but are expected to produce an appropriate reflection of costs over the long term.
For post-employment benefits other than pensions, the discount rate is the same as for pensions. The inflation rate assumed for medical costs is based on the Company’s history of healthcare spending. The assumption for the ultimate health care trend rates relates to the overall economic trends.
We currently estimate that a 0.5% increase or decrease in the return on assets assumption would result in a corresponding $10-million increase or decrease in annual pension expense. Changes to the return on asset assumption would have no significant effect on fundingrequirements, as the Company’s contributions are primarily determined based on the applicable Canadian regulatory solvency funding requirements. Under this valuation methodology, liabilities for solvency valuation are based on market bond yields, and the excess of liabilities over assets must be amortized over a five-year period. We estimate that a 0.5% increase or decrease in the discount rate assumption would result in a corresponding $10-million increase or decrease in the pension expense.
Asset Retirement Obligations
As a result of the Company’s mining activities, we incur legal obligations associated with the retirement of tangible long-lived assets, from the acquisition, construction, development or normal operations of those assets, which an entity is required to settle as a result of an existing or enacted law or contract. CICA 3110, which was adopted January 1, 2004, requires that, when a legal obligation is incurred, we record the fair value of estimated asset retirement obligations and a corresponding deferred charge presented as an asset grouped with property plant and equipment. The liabilities are accreted to full value over time through a charge to earnings. The asset is depreciated over the useful life of the associated long-lived asset on a straight-line basis. The fair value of the obligation as of December 31, 2005 was $424 million.
The fair value of these obligations are determined by discounting the projected cash flows required to settle the legal obligations at the Company’s credit adjusted risk-free interest rate over the time periods over which the obligations were incurred. The future cash flows required to settle the obligations were determined by detailed engineering and environmental reviews assuming the most probable outcome based on present facts, circumstances and legislation.
Critical estimates and judgement were made by management in the determination of the fair value of the Company’s obligation. Cash outflows to settle these obligations will be incurred for periods exceeding 50 years. Due to the combined effect of the uncertainty associated with such extended time periods, the estimated discount and inflation factors, and potential changes to applicable legislation, the fair value of the Company’s asset retirement obligations could materially change from period to period.
Income and Mining Taxes
The provision or relief for income taxes is calculated based on the expected tax treatment of transactions recorded in the consolidated financial statements. The objectives of accounting for income and mining taxes are to recognize the amount of taxes payable or refundable for the current year and deferred tax liabilities and assets for the future tax consequences of events that
57
have been recognized in the consolidated financial statements or tax returns. In determining both the current and future components of income and mining taxes, we interpret tax legislation in a variety of jurisdictions as well as make assumptions about the expected timing of the reversal of future tax assets and liabilities. If the Company’s interpretation differs from those of tax authorities or if the timing of reversals is not as anticipated, the provision or relief for income and mining taxes could increase or decrease in future periods. In estimating deferred income and mining tax assets, a valuation allowance is determined to reduce the future income tax assets to the amount that is more likely than not to be realized.
RISK FACTORS
Take-over Bid
The Company is currently the subject of a take-over bid by Inco Limited. Upon successful completion of this transaction, there could be significant changes to the business, operations and management of the Company. Should the take-over not be completed, the Company expects to continue operating as it has in the past and the anticipated benefits from the combination of Inco and the Company, as previously discussed, would not occur.
Fluctuating Metal Prices
Falconbridge’s earnings are affected by fluctuations in the prices of the metals the Company produces. The prices are subject to volatile price movements over short periods of time. Falconbridge generally does not hedge prices of the metals the Company produces. Market prices can be affected by numerous factors beyond the Company’s control, including expectations for inflation, speculative activities, relative exchange rates to the U.S. dollar, production activities of competitors, global and regional demand and supply, political and economic conditions including availability of subsidies and tax incentives to competitors and production costs in major producing regions. The prices for copper, nickel, zinc, aluminum or other metals produced by Falconbridge,may decline significantly from current levels. A reduction in the prices of one or more of these metals could materially adversely affect the value and amount of the Company’s reserves and business, financial condition, liquidity and operating results.
Mining and Processing Risks
The business of mining and processing of metals is generally subject to a number of risks and hazards, including unusual or unexpected geological conditions, ground conditions, phenomena such as inclement weather conditions, floods and earthquakes and the handling of hazardous substances, emissions of contaminants and other liability exposures. Such risks and hazards could result in personal injury or death, damage to, or destruction of, mineral properties, processing or production facilities or the environment, monetary losses and possible legal liability. Falconbridge’s business, financial condition, liquidity and operating results could be materially adversely affected if any of these developments were to occur.
Although Falconbridge maintains insurance which Falconbridge believes is consistent with mining industry practice to the extent available to cover some of these risks and hazards, no assurance can be given that such insurance will continue to be available, or that it will be available at economically feasible premiums. Falconbridge’s property, business interruption and liability and other insurance may not provide sufficient coverage for losses related to these or other risks or hazards. In such event, Falconbridge’s business, financial condition, liquidity and results of operations could be materially adversely affected.
Environmental Risks
Environmental legislation affects nearly all aspects of the Company’s operations worldwide. This type of legislation requires Falconbridge to obtain operating licenses and imposes standards and controls on activities relating to mining, exploration, development, production, closure and the refining, distribution and marketing of copper, nickel, zinc and other metals products. Environmental assessments are required before initiating most new products or undertaking significant changes to existing operations. Compliance with environmental legislation can require significant expenditures, including expenditures for clean-up costs and damages arising out of contaminated properties. In addition to current requirements, Falconbridge expects that additional environmental regulations will likely be implemented to protect the environment and quality of life, given issues
58
of sustainable development and other similar requirements which governmental and supra-governmental organizations and other bodies have been pursuing. Some of the issues currently under review by environmental regulatory agencies include reducing or stabilizing various emissions, including sulphur dioxide and greenhouse gas emissions, mine reclamation and restoration, and water, air and soil quality and absolute liability for spills and exceedences.
Canada ratified the Kyoto Protocol to the United Nations Framework Convention on Climate Change in late 2002. The protocol entered into force in February 2005. Various levels of government in Canada are developing a number of policy measures in order to meet Canada’s emission reduction obligations under the protocol. While the impact of the protocol and measures cannot be quantified at this time, the likely effect will be to increase costs for fossil fuels, electricity and transportation, restrict industrial emission levels, impose added costs for emissions in excess of permitted levels and increase costs for monitoring, reporting and financial accounting. Compliance with these initiatives could have a material adverse effect on the Company’s business, financial condition, liquidity and operating results.
Further changes in environmental laws, new information on existing environmental conditions or other events, including legal proceedings brought based upon such conditions or an inability to obtain necessary permits, could have a material adverse effect on product demand, product quality and methods of production and distribution or could require increased financial reserves or compliance expenditures or otherwise have a material adverse effect on Falconbridge’s business, financial condition, liquidity and operating results.
Failure to comply with environmental legislation may result in the imposition of fines and penalties, liability for clean-up costs, damages and the loss of important permits. There can be no assurance that Falconbridge will at all times be in compliance with all environmental regulations or that steps required to bring the Company into compliance would not materially adversely affect Falconbridge’s business, financial condition, liquidity or operating results.
In view of the uncertainties concerning future removal and site restoration costs on Falconbridge’s properties, the ultimate costs for future removal and site restoration to Falconbridge could differ from the amounts estimated. The estimate for this future liability is subject to change based on amendments to applicable laws and legislation, the nature of ongoing operations and technological innovations. Future changes, if any, due to their nature and unpredictability, could have a significant impact and would be reflected prospectively as a change in an accounting estimate. In addition, regulatory authorities in various jurisdictions around the world may require Falconbridge to post financial security to secure in whole or in part future reclamation and restoration obligations in such jurisdictions. In some instances, Falconbridge has already provided this security. In other instances, such security may be required to be posted upon the occurrence of certain events including if Falconbridge ceases to maintain a minimum investment grade credit rating, if the regulatory authority ceases to accept alternative forms of comfort to secure the obligation or as a property nears the end of its operation. Although the posting of this security does not increase the future reclamation and restoration costs (other than costs associated with posting such security), a portion of Falconbridge’s credit may be required to back up these commitments, which could adversely affect Falconbridge’s liquidity.
Labour Relations
Collective agreements covering unionized employees at Norandal-Newport, St. Ann (production and maintenance employees), and Gramercy were all renewed in 2005. At the Kidd Metallurgical site, a collective agreement was signed with the CAW after a one-month strike in October 2005.
Eleven collective agreements will expire in 2006:
• General Smelting (Montreal) – January 31
• Brunswick mine (Bathurst) – February 28
• Brunswick smelter (Bathurst) – February 28
• Horne smelter (Rouyn) – March 1
• Bulk Handling Operation (Bathurst) – March 31
• Raglan mine (Rouyn) – April 30
• Lomas Bayas mine (Chile) – April 30
• Nikkelverk refinery (Norway) – May 31
• Antamina mine (Peru) – July 24
• Norandal – Salisbury rolling mill (Salisbury) – November 20
• Altonorte smelter (Chile) – December 12
59
Collective agreements covering unionized hourly employees at CEZ, CEZ (Effluent Treatment Operators), CCR, CCR (Security), Noranda Recycling – Roseville (two agreements), Noranda Recycling – San Jose, Sudbury Operations (Production & Maintenance), Sudbury Operations (Office, Clerical & Technical), Collahuasi, New Madrid, Norandal – Newport, Gramercy, St. Ann (Production & Maintenance) and Kidd Metallurgical division are currently in place and will expire between 2007 and 2008.
Uncertainty of Reserve Estimates and Production Estimates
Falconbridge’s reported mineral reserves as of December 31, 2005 are estimated quantities of proven and probable ore that under present and anticipated conditions can be legally and economically mined and processed by the extraction of their mineral content. Falconbridge determines the amount of mineral reserves in accordance with the requirements of the applicable Canadian securities regulatory authorities and established mining standards. Falconbridge does not use outside sources to verify its reserves. The volume and grade of reserves actually recovered and rates of production from Falconbridge’s present mineral reserves may be less than geological measurements of the reserves. Market price fluctuations in nickel, copper, other metals and exchange rates, and changes in operating and capital costs, may in the future render certain mineral reserves uneconomic to mine. In addition, short-term operating factors relating to the mineral reserves, such as the need for orderly development of ore bodies or the processing of new or different ore grades, may cause mineral reserves to be modified or Falconbridge’s operations to be unprofitable in any particular fiscal period.
No assurance can be given that the estimated amount of ore will be recovered or that it will be recovered at the prices assumed by Falconbridge in determining reserves. Mineral reserve estimates are based on limited sampling and, consequently, are uncertain because the samples may not be representative of the entire orebody. As more knowledge and understanding of the orebody are obtained, the reserve estimates may change significantly, either positively or negatively.
Falconbridge prepares estimates of future production for particular operations. These production estimates are based on, among other things, reserve estimates; assumptions regarding ground conditions and physical characteristics of ores, such as hardness and presence or absence of particular metallurgical characteristics; and estimated rates and costs of mining and processing. Falconbridge’s actual production may vary from estimates for a variety of reasons, including actual ore mined varying from estimates of grade, tonnage, dilution and metallurgical and other characteristics; short-term operating factors relating to the mineral reserves, such as the need for sequential development of ore bodies and the processing of new or different ore grades; risks and hazards associated with mining; natural phenomena, such as inclement weather conditions, floods,and earthquakes; and unexpected labour shortages or strikes. No assurance can be given that production estimates will be achieved. Failure to achieve production estimates could have a material adverse impact on Falconbridge’s future cash flows, earnings, results of operations and financial condition.
Exchange Rate Fluctuations
Fluctuations in currency exchange rates, principally the Canadian/U.S. dollar exchange rate and, to a lesser extent, Chilean peso, Peruvian sole, Norwegian kroner and euro exchange rates against the U.S. dollar, can significantly impact Falconbridge’s earnings and cash flows. These exchange rates have fluctuated substantially over time, including over the last five years. Most of Falconbridge’s revenues and debt are denominated in U.S. dollars, whereas a significant portion of operating costs at Falconbridge’s Canadian sites are incurred in Canadian dollars. Furthermore, a portion of Chilean operating costs are peso-denominated and Nikkelverk’s costs are incurred in Norwegian kroner. Falconbridge has been reporting its financial results in U.S. dollars since July 1, 2003. Fluctuations in exchange rates between the U.S. dollar and the Canadian dollar and between the U.S. dollar and other currencies may give rise to foreign currency exposure and gains and losses, either favourable or unfavourable, which may in the future materially impact Falconbridge’s financial results. Falconbridge, from time to time, may hedge a portion of its currency exposures and requirements to try to limit any adverse effect of exchange rate fluctuations with respect to Falconbridge’s Canadian dollar and other costs, but there can be no assurance that such hedges will eliminate the potential material adverse effect of such fluctuations.
Interest Rate and Counterparty Risk
Falconbridge’s exposure to changes in interest rates results from investing and borrowing activities undertaken to manage Falconbridge’s liquidity and capital requirements. Falconbridge has entered
60
into interest rate swap agreements to manage the interest rate risk associated with a portion of its fixed-rate debt. The interest rate swap changes exposure to interest risk by effectively converting a portion of fixed-rate debt to a floating rate. Falconbridge may elect in the future to enter into interest rate swaps to effectively convert floating-rate debt to fixed-rate debt or to enter into additional fixed-rate to floating-rate swaps. There can be no assurance that Falconbridge will not be materially adversely affected by interest rate changes in the future, notwithstanding its use of interest rate swaps.
In addition, Falconbridge’s interest rate swaps, metals hedging and foreign currency and energy risk management activities expose us to the risk of default by the counter-parties to such arrangements. Any such default could have a material adverse effect on Falconbridge’s business, financial condition and results of operations.
Energy Supply and Prices
Falconbridge’s operations and facilities are intensive users of natural gas, electricity and oil. The procurement dynamics of these energy types are becoming more connected as supply and demand conditions become more interdependent on a global basis. Uncontrollable factors such as strong demand from the Asia-Pacific region, political, regulatory and economic uncertainties, and the cost of emissions from fossil fuels, as well as problems related to local production and delivery conditions, continue to put upward pressure on prices. Falconbridge’s supply contracts are governed by standard energy risk management principles, which ensure that supply, price and credit risks are managed effectively.
The security of energy supply is of primary importance. Falconbridge’s business operations could be adversely affected, including loss of production and damage to its plants and equipment, if, even temporarily, the supply of energy to one or more of its facilities was interrupted. Additionally, prolonged loss of supply could materially adversely affect the Company’s business, financial condition, liquidity and results of operations. As a significant portion of Falconbridge’s costs relate to energy consumption, Falconbridge’s earnings are directly related to fluctuations in the cost of natural gas, electricity and oil. The current trend of increasing energy prices is expected to continue and as a result there is an increased focus within the operations on the management of energy use and the impact of rising energy costs on financial performance.
Foreign Operations
Some of Falconbridge’s activities and related assets are located in countries outside North America, some of which may be considered to be, or may become, politically or economically unstable.Exploration or development activities in such countries may require protracted negotiations with host governments, international organizations and other third parties, including non-governmental organizations, and are frequently subject to economic and political considerations, such as taxation, nationalization, inflation, currency fluctuations and governmental regulation and approval requirements, which could adversely affect the economics of projects. These projects and investments could be adversely affected by war, civil disturbances and activities of foreign governments which limit or disrupt markets, restrict the movement of funds or supplies or result in the restriction of contractual rights or the taking of property without fair compensation.
Falconbridge performs a thorough risk assessment on a country-by-country basis when considering foreign activities and attempts to conduct business and financial affairs so as to protect against political, legal, regulatory and economic risks applicable to operations in the various countries where the Company operates, but there can be no assurance that Falconbridge will be successful in so protecting the Company. These projects and investments could also be adversely affected by changes in Canadian laws and regulations relating to foreign trade, investment and taxation.
Market Access
Global and regional demand for metals is influenced by regulatory and voluntary initiatives to restrict or eliminate the use of certain metals in particular products or applications. Impacts of such measures can be global, creating non-tariff barriers to international trade and affecting product design and specifications on a global basis. Such measures could affect the balance between supply and demand and depress metal prices and treatment/refining charges. Metals with a limited number of major applications are most susceptible to changes in demand and price in response to such measures.
61
Production Technology
Falconbridge believes that the technology used to produce and process metals is significantly advanced and, in part due to high investment costs, subject only to slow technological change. However, there can be no assurance that more economical production or processing technology will be developed, nor that the economic conditions in which current technology is applied will remain the same.
Legal Proceedings
The nature of Falconbridge’s business subjects the Company to numerous regulatory investigations, claims, lawsuits and other proceedings in the ordinary course of the Company’s business. The results of these legal proceedings cannot be predicted with certainty. There can be no assurance that these matters will not have a material adverse effect on results of operations in any future period, and a substantial judgment could have a material adverse impact on Falconbridge’s business, financial condition, liquidity and results of operations.
Sulphuric Acid
Sulphur dioxide is a by-product from the smelting of copper, zinc, nickel and lead sulphide concentrates. Falconbridge captures sulphur dioxide to minimize acid rain emissions, and converts it into sulphuric acid. Due to increasingly strict environmental standards worldwide for sulphur dioxide emissions, involuntary production of sulphuric acid by smelters is growing. The balance of world acid production is largely based on elemental sulphur, whose supply is now a by-product of oil and gas production, and growing more rapidly than demand. Long term, these factors may make it more difficult to obtain satisfactory prices for sulphuric acid. However, Falconbridge’s production of sulphuric acid cannot be reduced in response to low prices, or dropping sales volumes, without a corresponding reduction in production of metals.
Raw Material Procurement Risks
Procurement of raw materials involves the risks typically connected with commercial transactions, which can include trade barriers, political instability and problems due to local production conditions. In addition, Falconbridge’s supply contracts provide that suppliers of concentrate may be released from their delivery obligations if certain “force majeure” events occur. Falconbridge’s business operations could be adversely affected, at least temporarily, if supplies of raw materials are interrupted as a result of the imposition of trade barriers or other events and if Falconbridge is unable, on short notice, to shift to alternative sources of supply. Falconbridge also processes copper scrap, the availability of which in past years has been subject to significant fluctuations. The availability of scrap, blister copper and other material the Company processes can be significantly affected by competing demand from industrializing nations along with unforeseen production and logistical disruptions.
EVALUATION OF DISCLOSURE CONTROLS AND PROCEDURES
As of December 31, 2005, an evaluation of the effectiveness of the issuer’s disclosure controls and procedures (as such term is defined under the rules adopted by the Canadian securities regulatory authorities and by the U.S. Securities Exchange Commission) was carried out by our management, under the supervision of, and with the participation of, our Chief Executive Officer (“CEO”) and Chief Financial Officer (“CFO”). Based upon that evaluation, the CEO and CFO concluded that as of such date our disclosure controls and procedures were effective such that information relating to us, including our consolidated subsidiaries, required to be disclosed by us in the reports we file or submit to such regulatory authorities (a) is recorded, processed,summarized and reported within the time periods specified under applicable securities laws and (b) is accumulated and communicated to our management, including our principal executive and principal financial officers, or persons performing similar functions, as appropriate, to allow timely decisions regarding disclosure.
62
FORWARD-LOOKING INFORMATION
Certain statements contained in this Management’s Discussion and Analysis are forward-looking statements (as defined in applicable securities legislation). Examples of such statements include, but are not limited to, statements concerning (i) our assessment of the outlook for metal markets in 2006, (ii) Inco’s offer to acquire all of the common shares of Falconbridge Limited and the benefits of such combination, (iii) our future financial requirements and funding of those requirements, (iv) our expectations with respect to our development projects, (v) our production forecast for 2006, (vi) our capital expenditure forecasts, and (vii) our dividend schedule. Inherent in forward-looking statements are risks and uncertainties well beyond our ability to predict or control. Actual results and developments are likely to differ, and may differ materially, from those expressed or implied by the forward-looking statements contained in this Management’s Discussion and Analysis. Such statements are based on a number of assumptions which may prove to be incorrect, including, but not limited to, assumptions about the timing, steps to be taken and completion of Inco’s offer to acquire all of our common shares, the ability to successfully compete against global metals and mining and exploration companies by creating through such a combination an enterprise of increased scale; strong demand for nickel, copper and other metals in emerging markets such as China; approximately $350 million per annum in pre-tax operating and other synergies and cost savings, and other benefits being realized based on the achievement of operational efficiencies from restructuring, integration and other initiatives relating to the combination of Falconbridge and Inco; the approvals or clearances required to be obtained by Inco and Falconbridge from regulatory and other agencies and bodies being obtained in a timely manner; divestitures required by regulatoryagencies being acceptable and completed in a timely manner; there being limited costs, difficulties or delays related to the integration of the Falconbridge’s operations with those of Inco; the timely completion of the steps required to be taken for the eventual combination of the two companies; business and economic conditions generally; exchange rates, energy and other anticipated and unanticipated costs and pension contributions and expenses; the supply and demand for, deliveries of, and the level and volatility of prices of, nickel, copper, aluminum, zinc and other primary metals products and other metal products Inco and Falconbridge produce; the timing of the receipt of remaining regulatory and governmental approvals for the development projects and other operations; the continued availability of financing on appropriate terms for development projects; Falconbridge’s costs of production and production and productivity levels, as well as those of its competitors; market competition; mining, processing, exploration and research and development activities; theaccuracy of ore/mineral reserve estimates; premiums realized over LME cash and other benchmark prices; tax benefits/charges; the resolution of environmental and other proceedings and the impact on the combined company of various environmental regulations and initiatives; assumptions concerning political and economic stability in countries or locations in which Falconbridge operates or otherwise and the ability to continue to pay quarterly cash dividends in such amounts as Falconbridge’s Board of Directors may determine in light of other uses for such funds and other factors.
Inherent in those statements are known and unknown risks, uncertainties and other factors well beyond the Company’s ability to control or predict. Some of these known risks and uncertainties are outlined in filings by Falconbridge with applicable securities regulatory authorities, including in Falconbridge’s annual information form. Readers are encouraged to consult such filings. While Falconbridge anticipates that subsequent events and developments may cause Falconbridge’s views to change, the Company specifically disclaims any obligation to update these forward-looking statements. These forward-looking statements should not be relied upon as representing the Company’s views as of any date subsequent to the date of this Management’s Discussion and Analysis. Although the Company has attempted to identify important factors that could cause actual actions, events or results to differ materially from those described in forward-looking statements, there may be other factors that cause actions, events or results not to be asanticipated, estimated or intended. There can be no assurance that forward-looking statements will prove to be accurate, as actual results and future events could differ materially from those anticipated in such statements. Accordingly, readers should not place undue reliance on forward-looking statements. These factors are not intended to represent a complete list of the factors thatcould affect Falconbridge and the combination of Inco and Falconbridge.
63